
© 2021 Vroom, All rights reserved. 1 A picture containing car and trees Third - Quarter 2021 Earnings November 2021
© 2021 Vroom, All rights reserved. 2 DISCLAIMER Forward Looking Statements This presentation contains forward - looking statements within the meaning of the Private Securities Litigation Reform Act of 1995 . All statements contained in this presentation that do not relate to matters of historical fact should be considered forward - looking statements, including without limitation, statements regarding our expectations regarding our business strategy and plans, including our ability to integrate and develop United Auto Credit Corporation into a captive finance operation, as well as our ability to scale our business, grow inventory, expand reconditioning capacity, invest in logistics and improve our end - to - end customer experience, and statements regarding our future results of operations and financial position, including our ability to improve our unit economics and our outlook for the fourth quarter and the year ended December 31 , 2021 . These statements are based on management’s current assumptions and are neither promises nor guarantees, but involve known and unknown risks, uncertainties and other important factors that may cause our actual results, performance or achievements to be materially different from any future results, performance or achievements expressed or implied by the forward - looking statements . For factors that could cause actual results to differ materially from the forward - looking statements in this presentation, please see the risks and uncertainties identified under the heading "Risk Factors" in our Annual Report on Form 10 - K for the year ended December 31 , 2020 , as updated by our Quarterly report on Form 10 - Q for the quarter ended September 30 , 2021 , each of which is available on our Investor Relations website at ir . vroom . com and on the SEC website at www . sec . gov . All forward - looking statements reflect our beliefs and assumptions only as of the date of this presentation . We undertake no obligation to update forward - looking statements to reflect future events or circumstances . Industry and Market Information To the extent this presentation includes information concerning the industry and the markets in which the Company operates, including general observations, expectations, market position, market opportunity and market size, such information is based on management's knowledge and experience in the markets in which we operate, including publicly available information from independent industry analysts and publications, as well as the Company’s own estimates. Our estimates are based on third - party sources, as well as internal research, which the Company believes to be reasonable, but which are inherently uncertain and imprecise. Accordingly, you are cautioned not to place undue reliance on such market and industry information. Financial Presentation and Use of Non - GAAP Financial Measures Certain monetary amounts, percentages and other figures included in this presentation have been subject to rounding adjustments. Certain other amounts that appear in this presentation may not sum due to rounding. This presentation contains certain supplemental financial measures that are not calculated pursuant to U.S. generally accepted accounting principles (“GAAP”). These non - GAAP measures are in addition to, and not a substitute or superior to, measures of financial performance prepared in accordance with GAAP. These non - GAAP financial measures have limitations as analytical tools in that they do not reflect all of the amounts associated with our results of operations as determined in accordance with U.S. GAAP. Because of these limitations, these non - GAAP financial measures should be considered along with other operating and financial performance measures presented in accordance with U.S. GAAP. We have reconciled all non - GAAP financial measures with the most directly comparable U.S. GAAP financial measures.
© 2021 Vroom, All rights reserved. 3 Introducing Bob krakowiak, Chief Financial officer BOB KRAKOWIAK Chief Financial Officer A person in a suit and tie Description automatically generated with medium confidence • Previously served as Chief Financial Officer of Stoneridge Corporation for five years • Held diverse roles in finance and investor relations at Visteon Corporation, Owens Corning, and Kmart Corporation • In his role as Chief Financial Officer, Bob oversees financial reporting, accounting, tax, treasury, risk management and financial planning and analysis, as well as leading investor relations Appointed new Chief Financial Officer on September 13, 2021
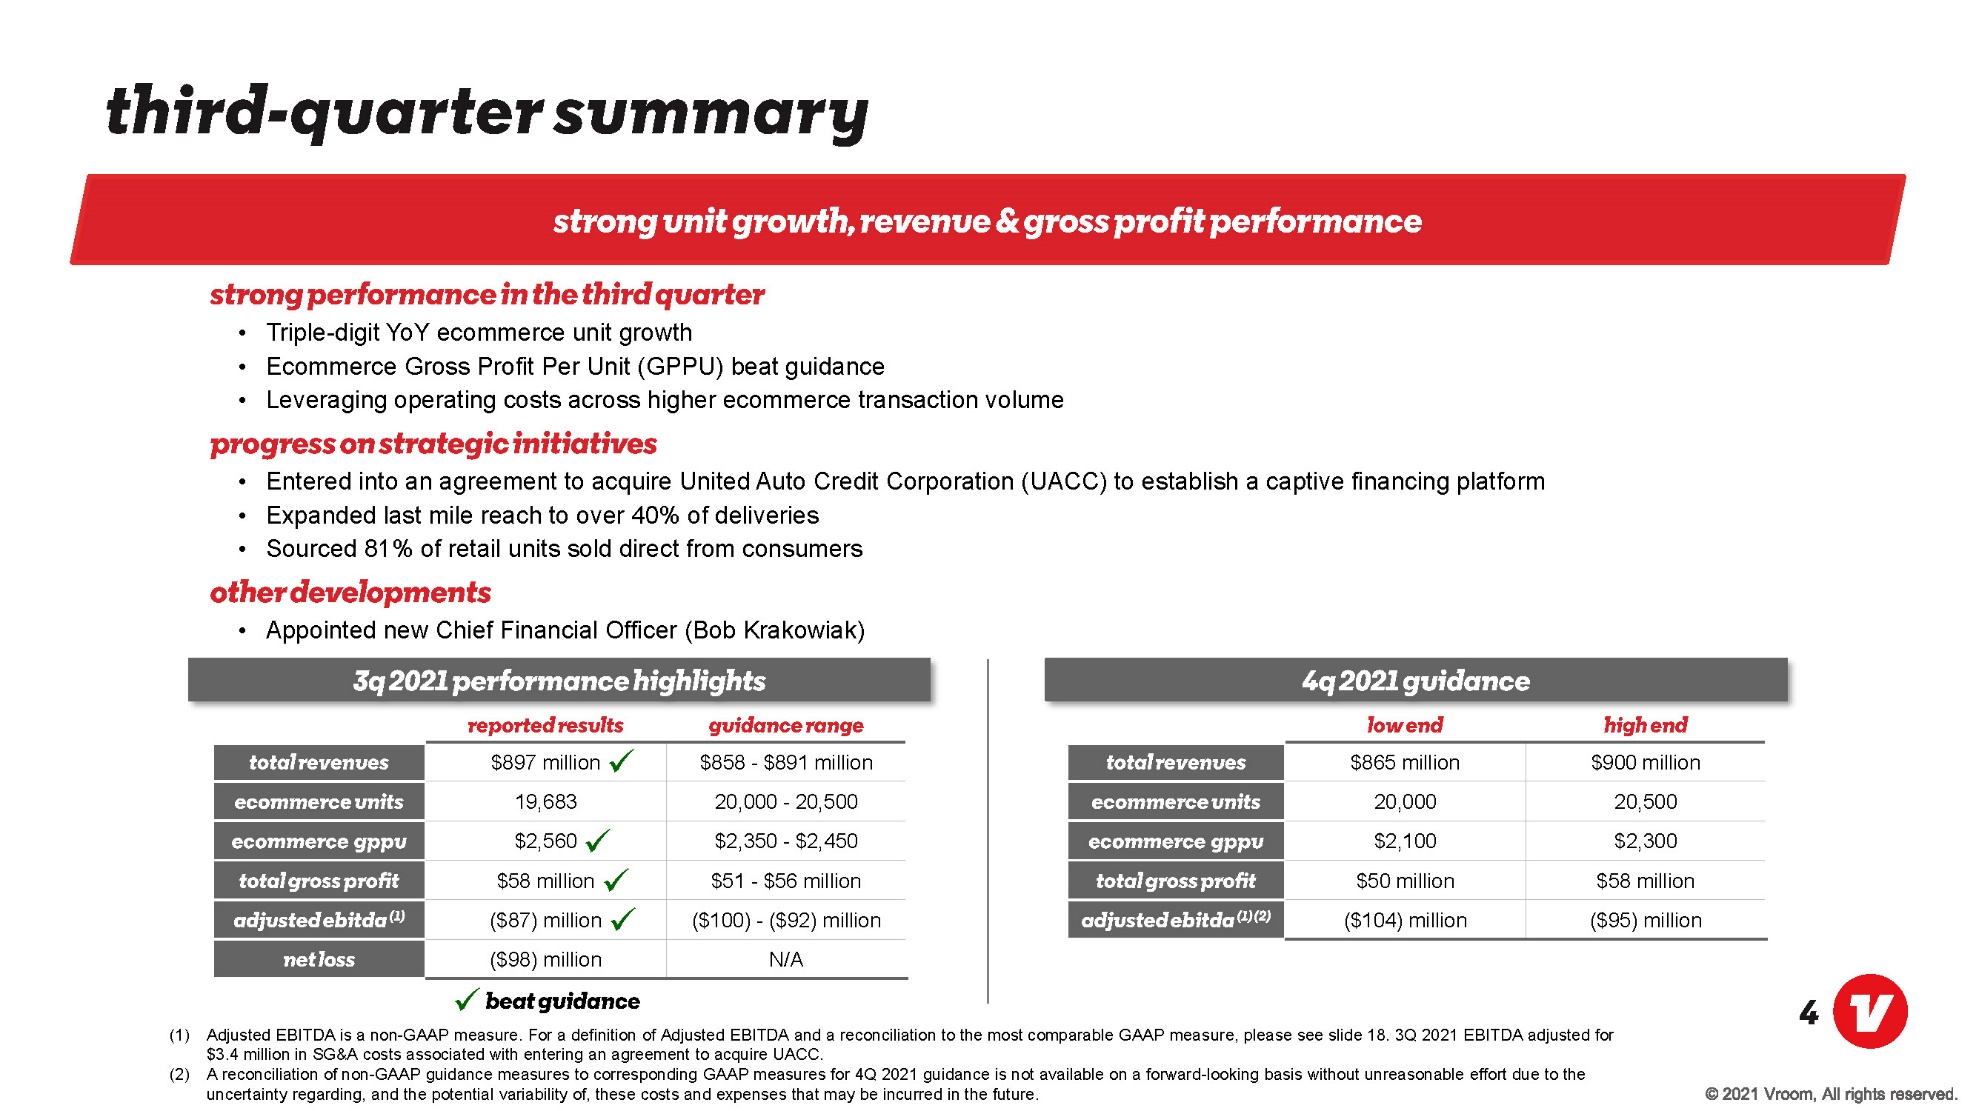
© 2021 Vroom, All rights reserved. 4 Strong performance in the third quarter • Triple - digit YoY ecommerce unit growth • Ecommerce Gross Profit Per Unit (GPPU) beat guidance • Leveraging operating costs across higher ecommerce transaction volume Progress on strategic initiatives • Entered into an agreement to acquire United Auto Credit Corporation (UACC) to establish a captive financing platform • Expanded last mile reach to over 40% of deliveries • Sourced 81% of retail units sold direct from consumers Other developments • Appointed new Chief Financial Officer (Bob Krakowiak) Third - quarter summary Strong unit growth, revenue & gross profit performance (1) Adjusted EBITDA is a non - GAAP measure. For a definition of Adjusted EBITDA and a reconciliation to the most comparable GAAP measure, please see slide 18. 3Q 2021 EBITDA adjusted for $3.4 million in SG&A costs associated with entering an agreement to acquire UACC. (2) A reconciliation of non - GAAP guidance measures to corresponding GAAP measures for 4Q 2021 guidance is not available on a forward - looking basis without unreasonable effort due to the uncertainty regarding, and the potential variability of, these costs and expenses that may be incurred in the future. . Beat Guidance Reported Results Guidance Range Total Revenues $897 million $858 - $891 million Ecommerce Units 19,683 20,000 - 20,500 Ecommerce GPPU $2,560 $2,350 - $2,450 Total Gross Profit $58 million $51 - $56 million Adjusted EBITDA (1) ($87) million ($100) - ($92) million Net loss ($98) million N/A Low End High End Total Revenues $865 million $900 million Ecommerce Units 20,000 20,500 Ecommerce GPPU $2,100 $2,300 Total Gross Profit $50 million $58 million Adjusted EBITDA (1) (2) ($104) million ($95) million . . . . 4 Q 2021 Guidance 3 Q 2021 Performance Highlights
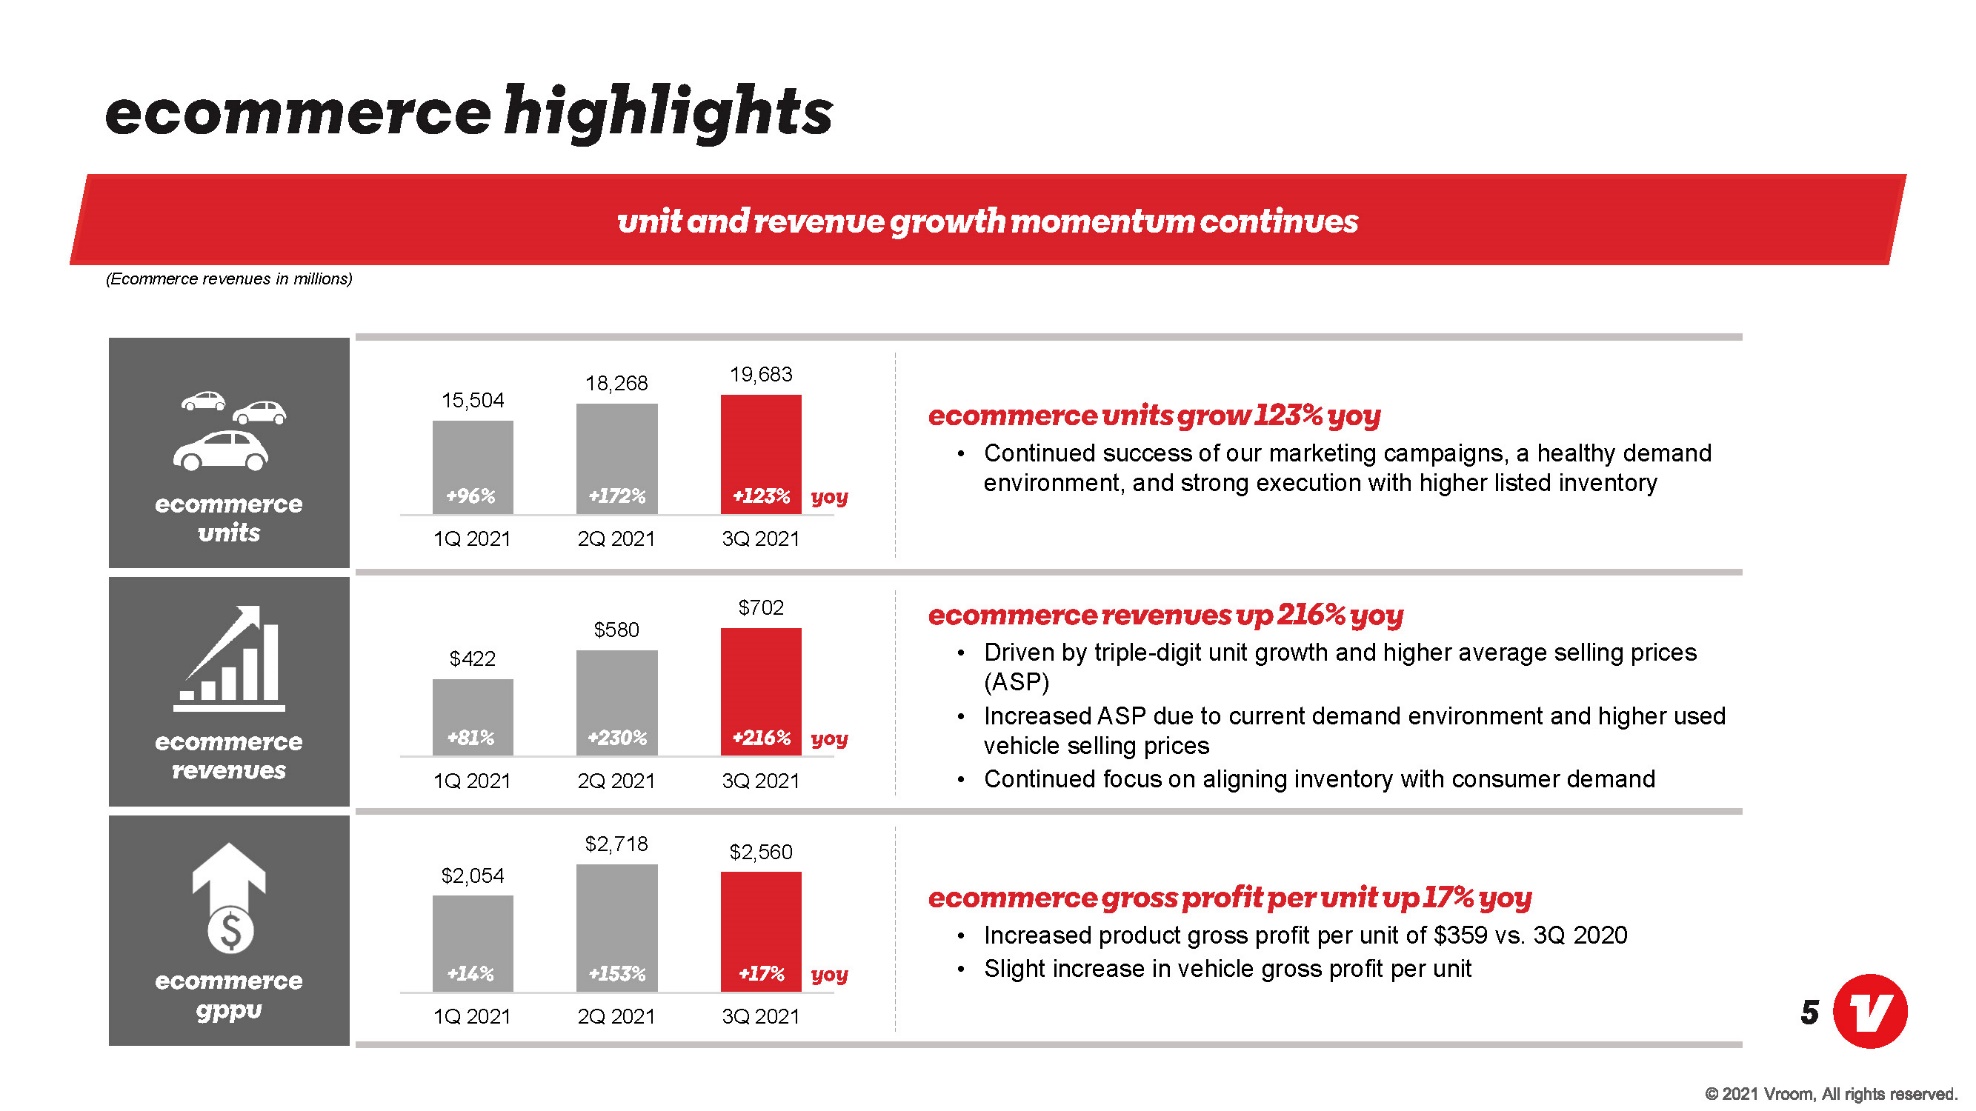
© 2021 Vroom, All rights reserved. 5 15,504 18,268 19,683 1Q 2021 2Q 2021 3Q 2021 Ecommerce highlights (Ecommerce revenues in millions) Ecommerce units ecommerce revenues up 216% YoY • Driven by triple - digit unit growth and higher average selling prices (ASP) • Increased ASP due to current demand environment and higher used vehicle selling prices • Continued focus on aligning inventory with consumer demand Ecommerce Gross Profit Per Unit up 17% YoY • Increased product gross profit per unit of $359 vs. 3Q 2020 • Slight increase in vehicle gross profit per unit Ecommerce Revenues Ecommerce GPPU +96% YoY +172% +123% $422 $580 $702 1Q 2021 2Q 2021 3Q 2021 +81% YoY +230% +216% $2,054 $2,718 $2,560 1Q 2021 2Q 2021 3Q 2021 +14% YoY +153% +17% ecommerce units grow 123% YoY • Continued success of our marketing campaigns, a healthy demand environment, and strong execution with higher listed inventory Unit and revenue growth momentum continues
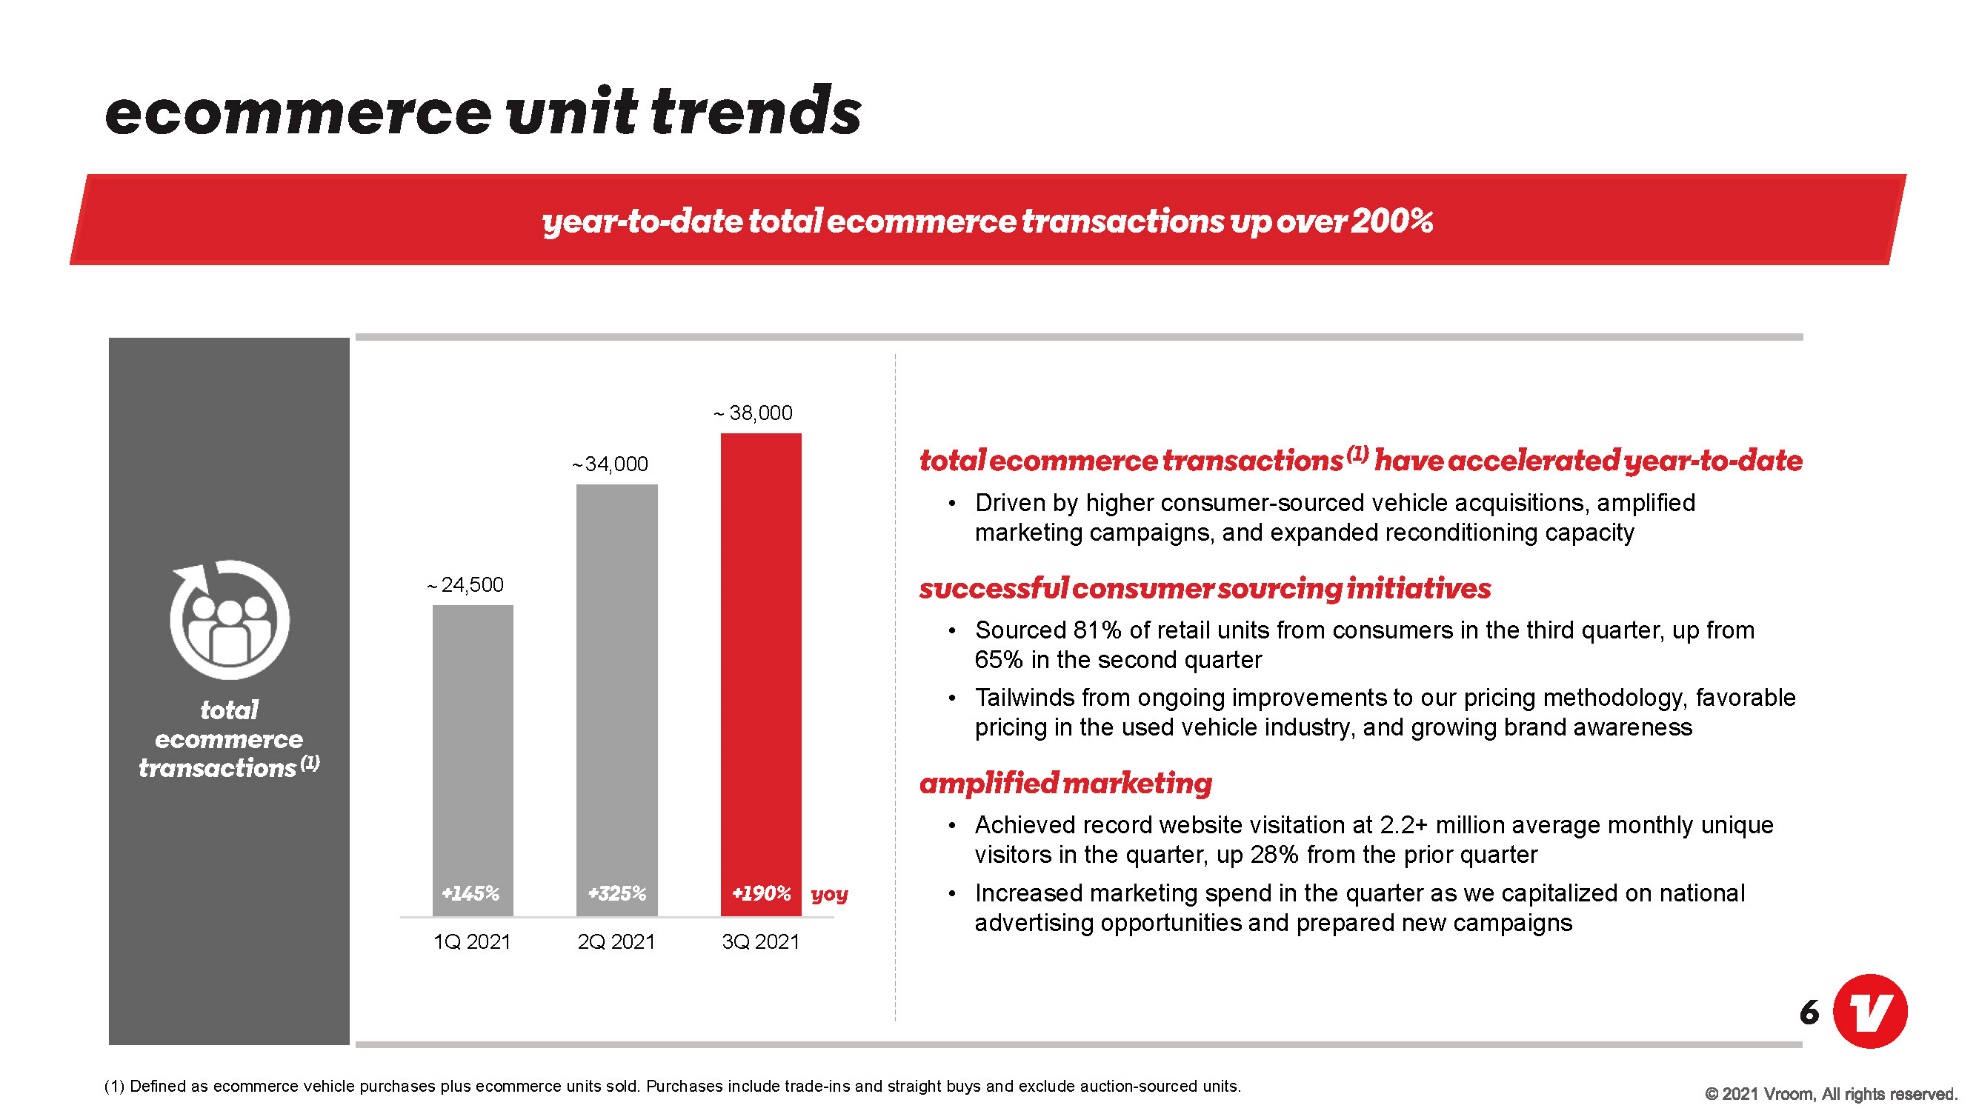
© 2021 Vroom, All rights reserved. 6 Ecommerce unit trends Year - to - date total ecommerce transactions up over 200% Total ecommerce transactions (1) Total ecommerce transactions (1) have accelerated year - to - date • Driven by higher consumer - sourced vehicle acquisitions, amplified marketing campaigns, and expanded reconditioning capacity Successful consumer sourcing initiatives • Sourced 81% of retail units from consumers in the third quarter, up from 65% in the second quarter • Tailwinds from ongoing improvements to our pricing methodology, favorable pricing in the used vehicle industry, and growing brand awareness Amplified marketing • Achieved record website visitation at 2.2+ million average monthly unique visitors in the quarter, up 28% from the prior quarter • Increased marketing spend in the quarter as we capitalized on national advertising opportunities and prepared new campaigns (1) Defined as ecommerce vehicle purchases plus ecommerce units sold. Purchases include trade - ins and straight buys and exclude auction - sourced units. 24,500 34,000 38,000 1Q 2021 2Q 2021 3Q 2021 +145% YoY +325% +190% ~ ~ ~
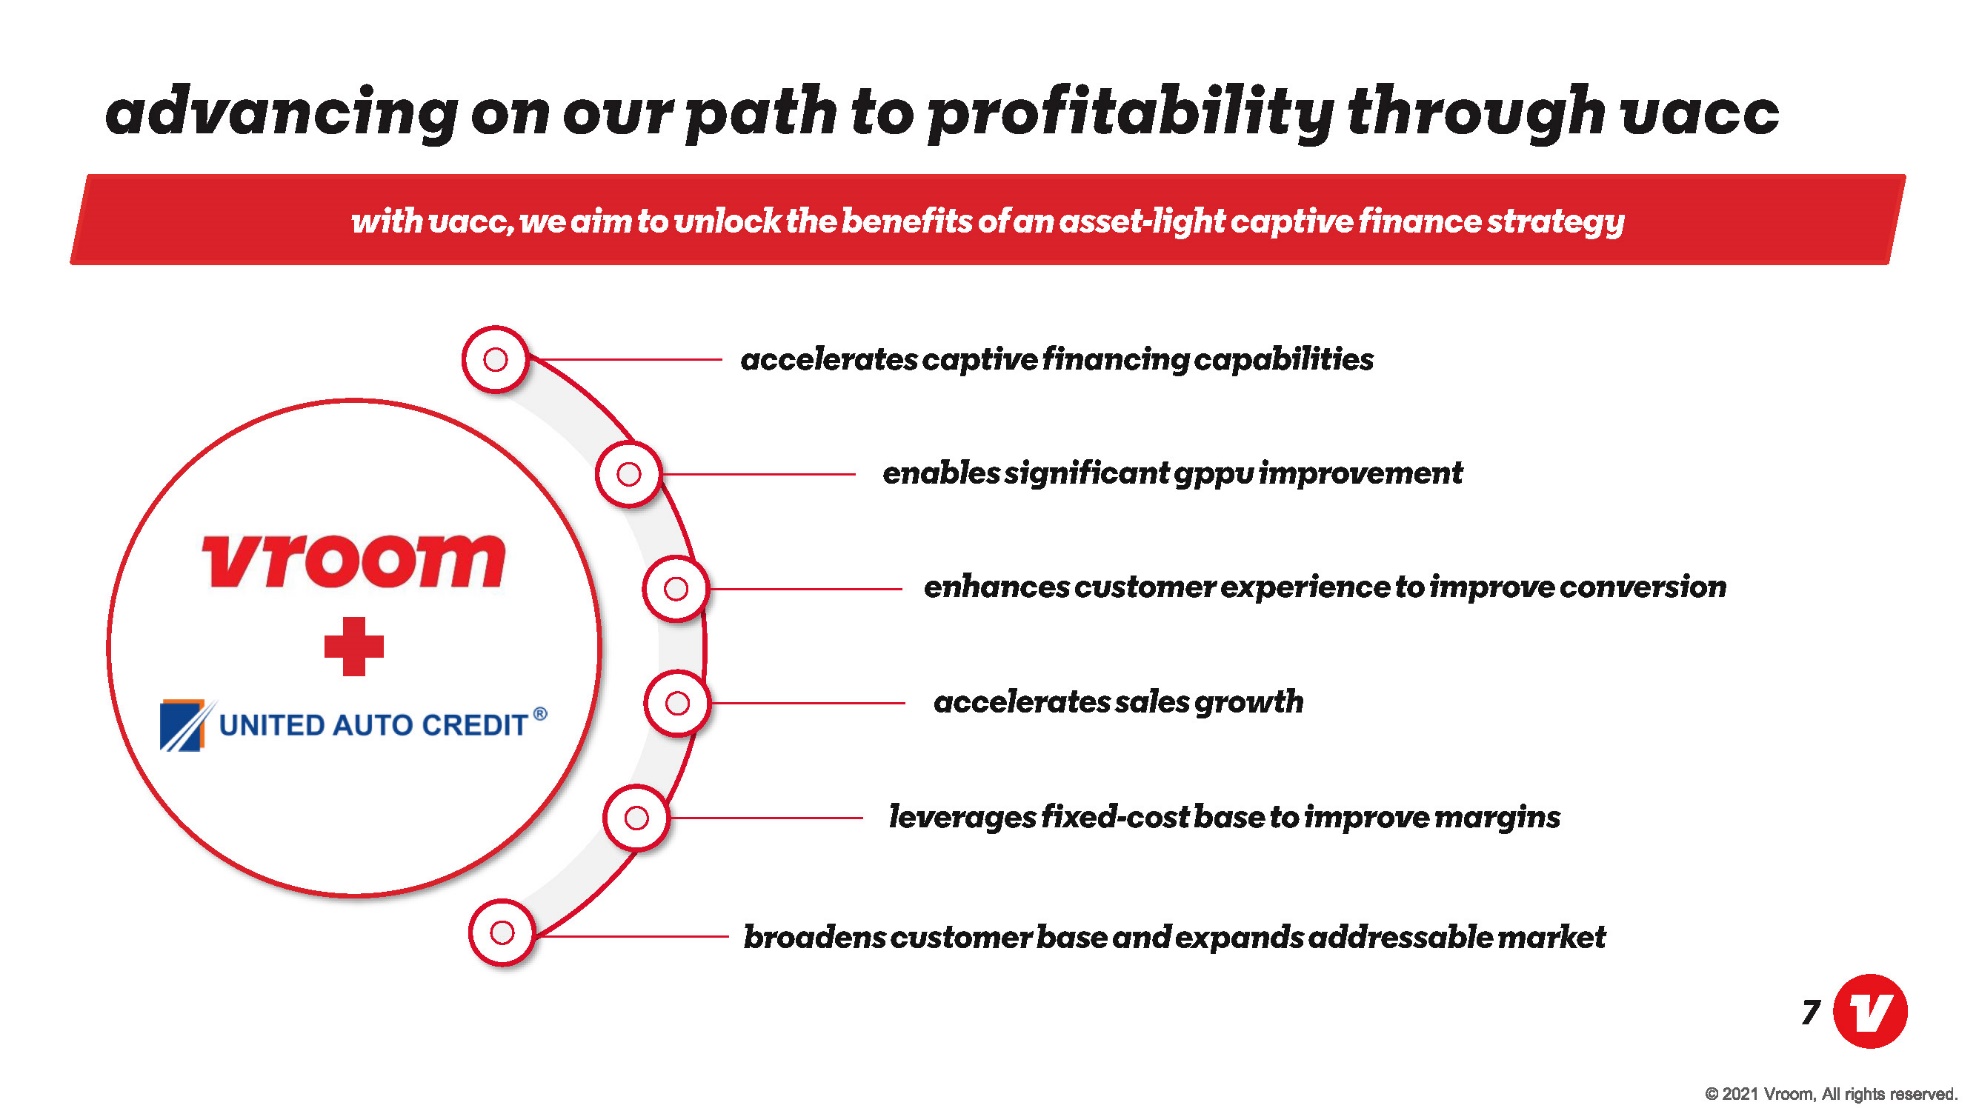
© 2021 Vroom, All rights reserved. 7 Vroom Reports Third Quarter 2020 Results - America Online News Broadens customer base and expands addressable market Accelerates sales growth enhances customer experience to improve conversion accelerates captive financing capabilities United auto credit-logo Advancing on our path to profitability through uacc Leverages fixed - cost base to improve margins Enables significant gppu improvement With Uacc, we aim to unlock the Benefits of an asset - light captive finance strategy
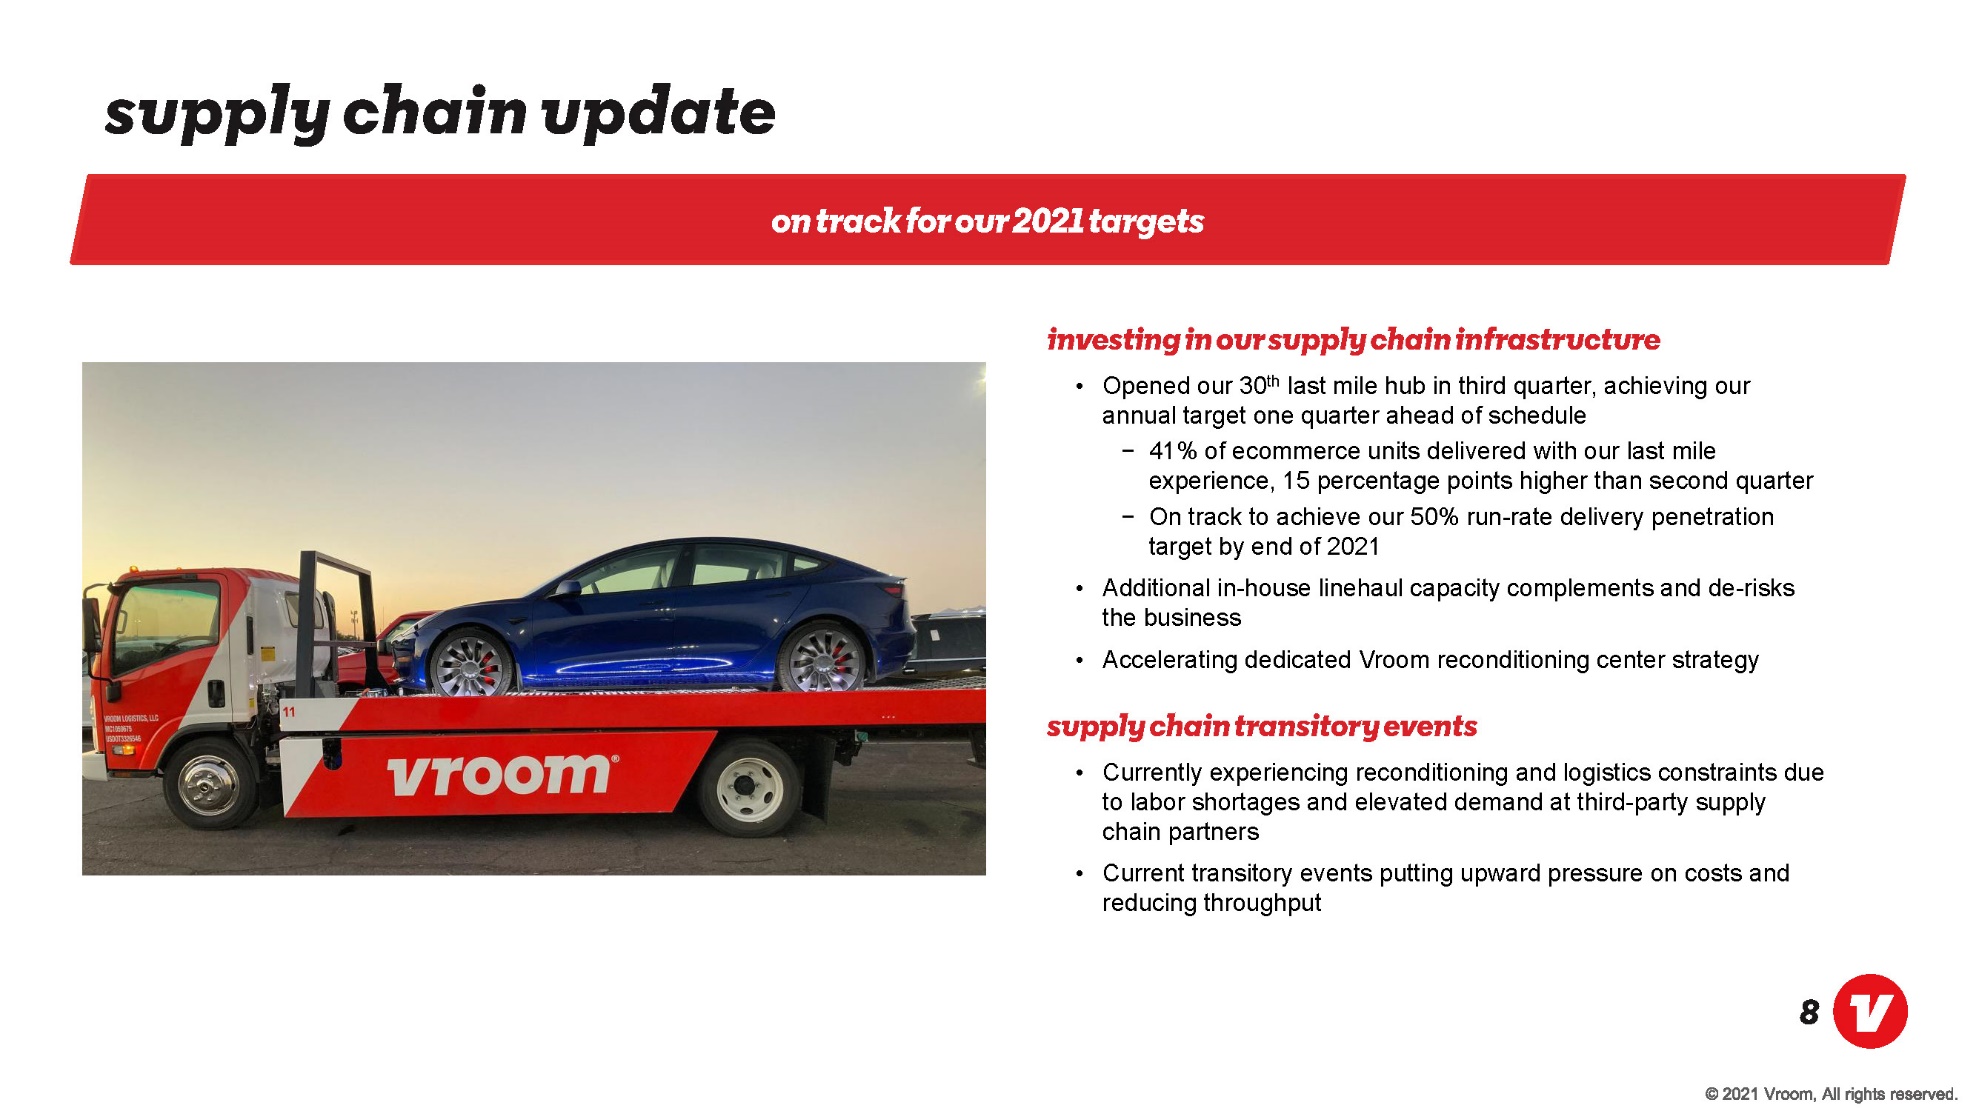
© 2021 Vroom, All rights reserved. 8 A car on a trailer Description automatically generated with medium confidence Supply chain update On track for our 2021 targets Investing in our supply chain infrastructure • Opened our 30 th last mile hub in third quarter, achieving our annual target one quarter ahead of schedule - 41% of ecommerce units delivered with our last mile experience, 15 percentage points higher than second quarter - On track to achieve our 50% run - rate delivery penetration target by end of 2021 • Additional in - house linehaul capacity complements and de - risks the business • Accelerating dedicated Vroom reconditioning center strategy supply chain transitory events • Currently experiencing reconditioning and logistics constraints due to labor shortages and elevated demand at third - party supply chain partners • Current transitory events putting upward pressure on costs and reducing throughput
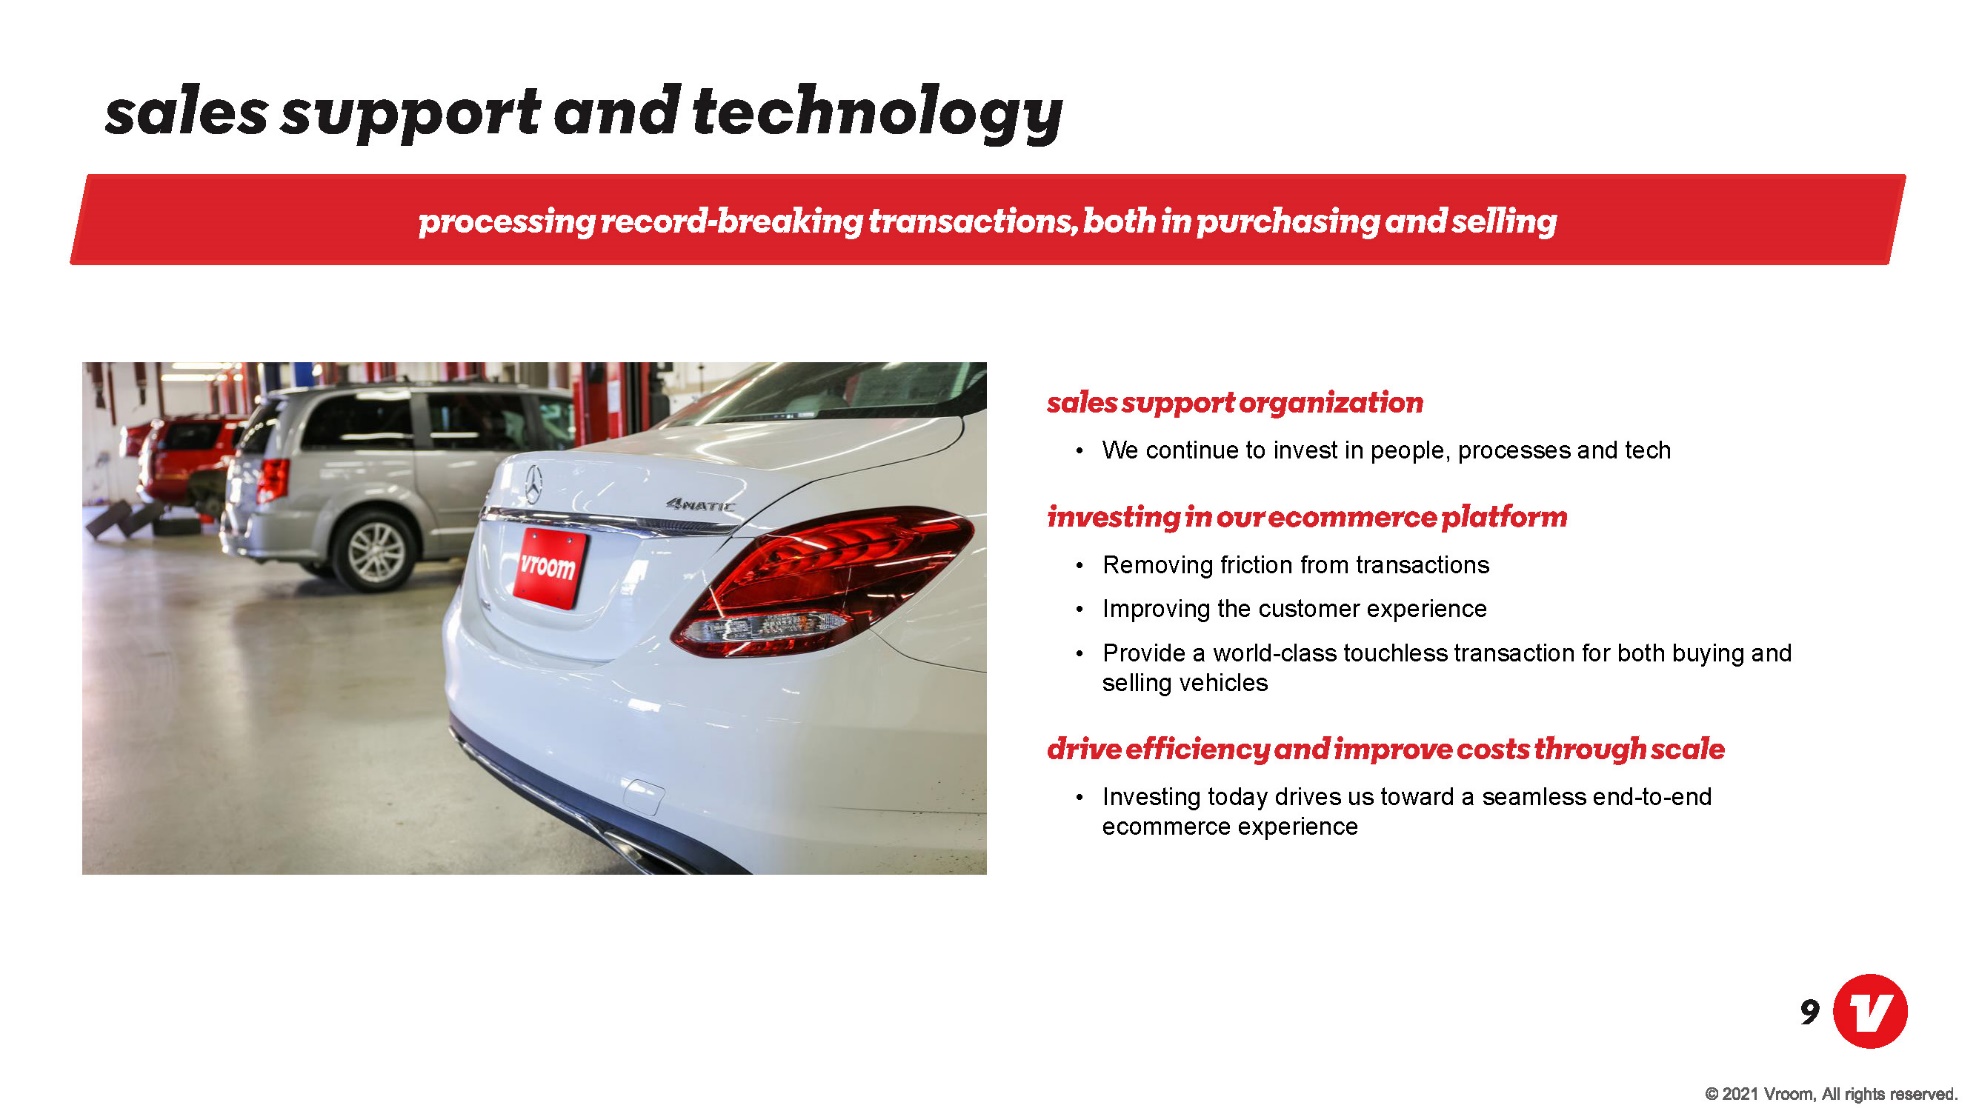
© 2021 Vroom, All rights reserved. 9 Sales support and technology Processing record - breaking transactions, both in purchasing and selling Sales support organization • We continue to invest in people, processes and tech Investing in our ecommerce platform • Removing friction from transactions • Improving the customer experience • Provide a world - class touchless transaction for both buying and selling vehicles Drive efficiency and improve costs through scale • Investing today drives us toward a seamless end - to - end ecommerce experience A picture containing text, car Description automatically generated
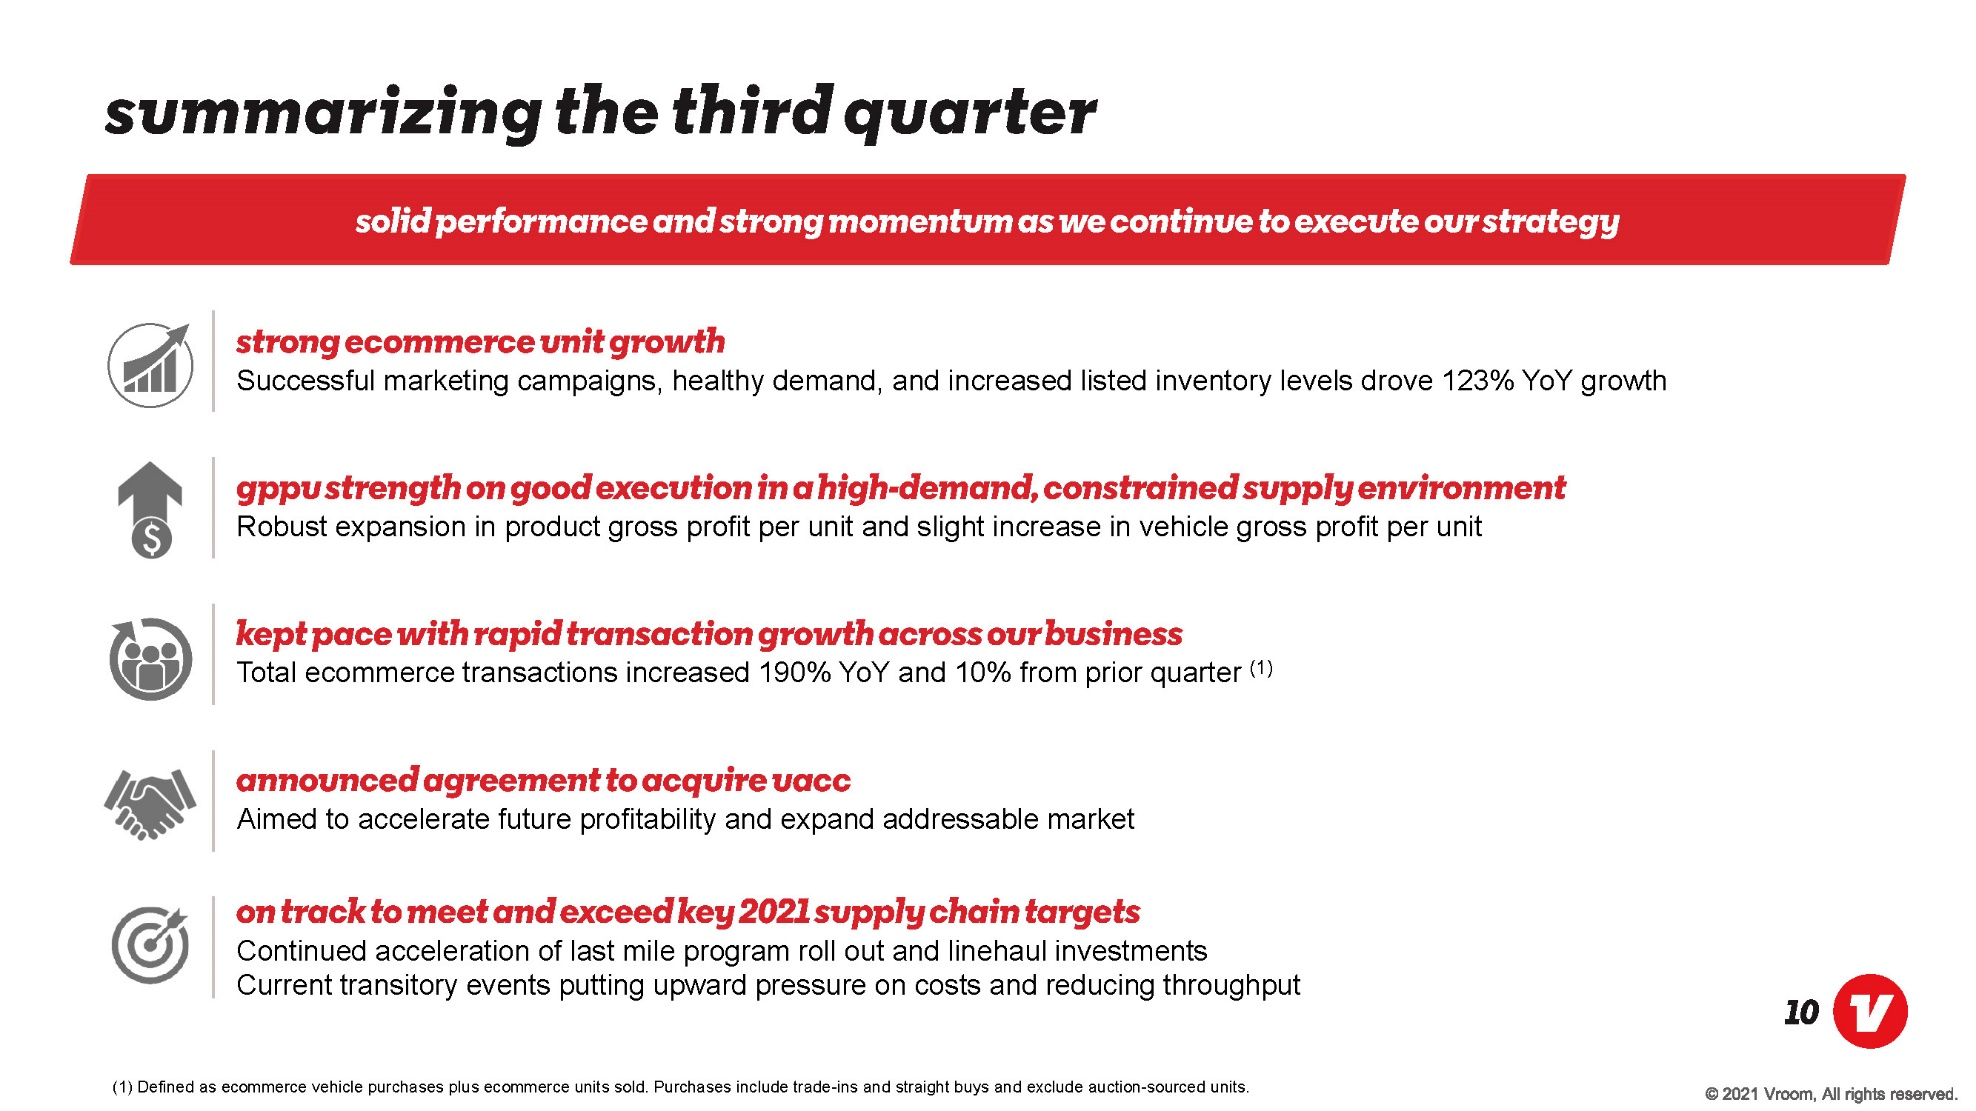
© 2021 Vroom, All rights reserved. 10 Summarizing the third quarter Solid performance and strong momentum as we continue to execute our strategy Strong ecommerce unit growth Successful marketing campaigns, healthy demand, and increased listed inventory levels drove 123% YoY growth On track to meet and exceed key 2021 supply chain targets Continued acceleration of last mile program roll out and linehaul investments Current transitory events putting upward pressure on costs and reducing throughput Announced agreement to acquire UACC Aimed to accelerate future profitability and expand addressable market GPPU strength on good execution in a high - demand, constrained supply environment Robust expansion in product gross profit per unit and slight increase in vehicle gross profit per unit Kept pace with rapid transaction growth across our business Total ecommerce transactions increased 190% YoY and 10% from prior quarter (1) (1) Defined as ecommerce vehicle purchases plus ecommerce units sold. Purchases include trade - ins and straight buys and exclude auction - sourced units.

© 2021 Vroom, All rights reserved. 11 Car and trees Third - Quarter 2021 Financial Update November 2021
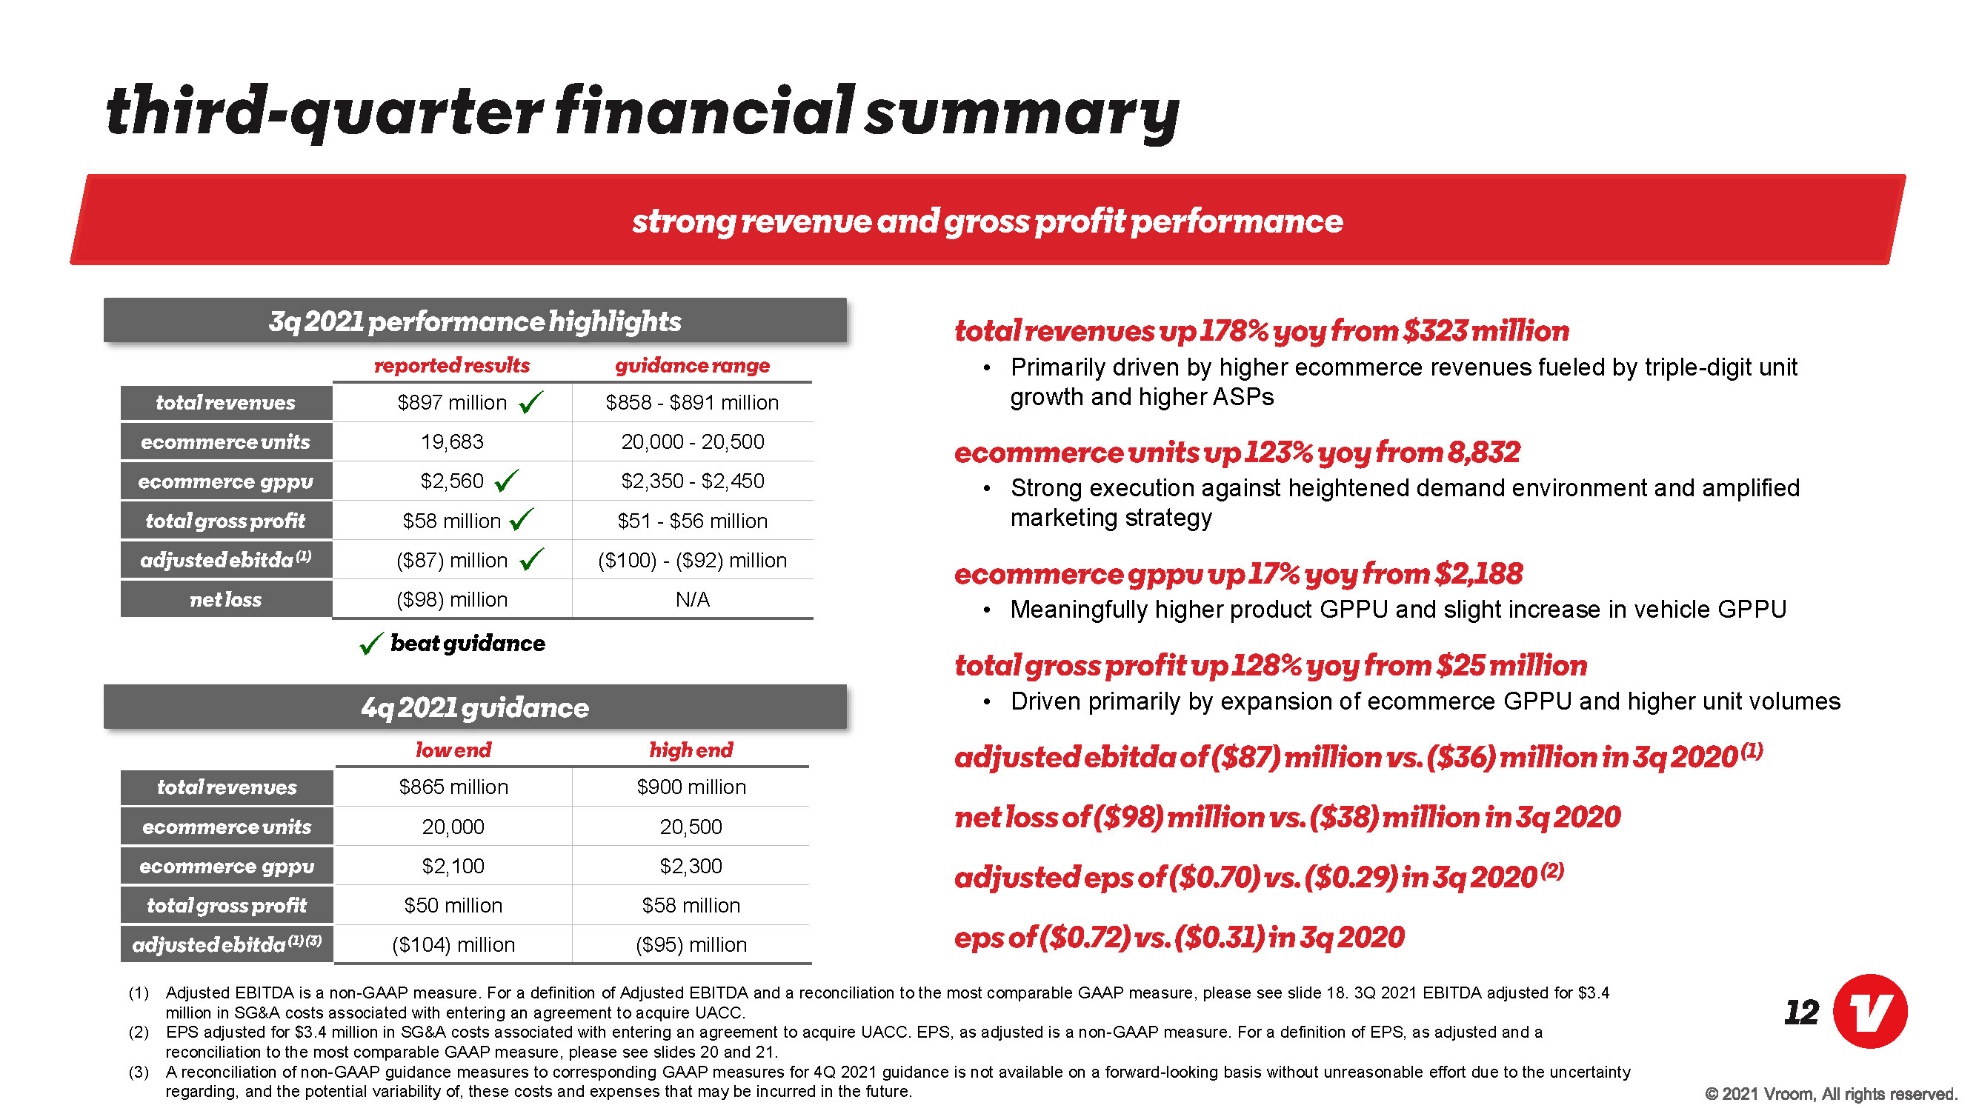
© 2021 Vroom, All rights reserved. 12 Low End High End Total Revenues $865 million $900 million Ecommerce Units 20,000 20,500 Ecommerce GPPU $2,100 $2,300 Total Gross Profit $50 million $58 million Adjusted EBITDA (1) (3) ($104) million ($95) million Third - quarter financial summary Strong revenue and gross profit performance Total revenues up 178% YoY from $323 million • Primarily driven by higher ecommerce revenues fueled by triple - digit unit growth and higher ASPs Ecommerce units up 123% YoY from 8,832 • Strong execution against heightened demand environment and amplified marketing strategy Ecommerce GPPU up 17% YoY from $2,188 • Meaningfully higher product GPPU and slight increase in vehicle GPPU Total gross profit up 128% YoY from $25 million • Driven primarily by expansion of ecommerce GPPU and higher unit volumes Adjusted EBITDA of ($87) million vs. ($36) million in 3Q 2020 (1) Net loss of ($98) million vs. ($38) million in 3Q 2020 Adjusted EPS of ($0.70) vs. ($0.29) in 3Q 2020 (2) Eps of ($0.72) vs. ($0.31) in 3Q 2020 (1) Adjusted EBITDA is a non - GAAP measure. For a definition of Adjusted EBITDA and a reconciliation to the most comparable GAAP measure, please see slide 18. 3Q 2021 EBITDA adjusted for $3.4 million in SG&A costs associated with entering an agreement to acquire UACC. (2) EPS adjusted for $3.4 million in SG&A costs associated with entering an agreement to acquire UACC. EPS, as adjusted is a non - GAA P measure. For a definition of EPS, as adjusted and a reconciliation to the most comparable GAAP measure, please see slides 20 and 21. (3) A reconciliation of non - GAAP guidance measures to corresponding GAAP measures for 4Q 2021 guidance is not available on a forward - looking basis without unreasonable effort due to the uncertainty regarding, and the potential variability of, these costs and expenses that may be incurred in the future. . Beat Guidance Reported Results Guidance Range Total Revenues $897 million $858 - $891 million Ecommerce Units 19,683 20,000 - 20,500 Ecommerce GPPU $2,560 $2,350 - $2,450 Total Gross Profit $58 million $51 - $56 million Adjusted EBITDA (1) ($87) million ($100) - ($92) million Net loss ($98) million N/A . . . . 3 Q 2021 Performance Highlights 4 Q 2021 Guidance
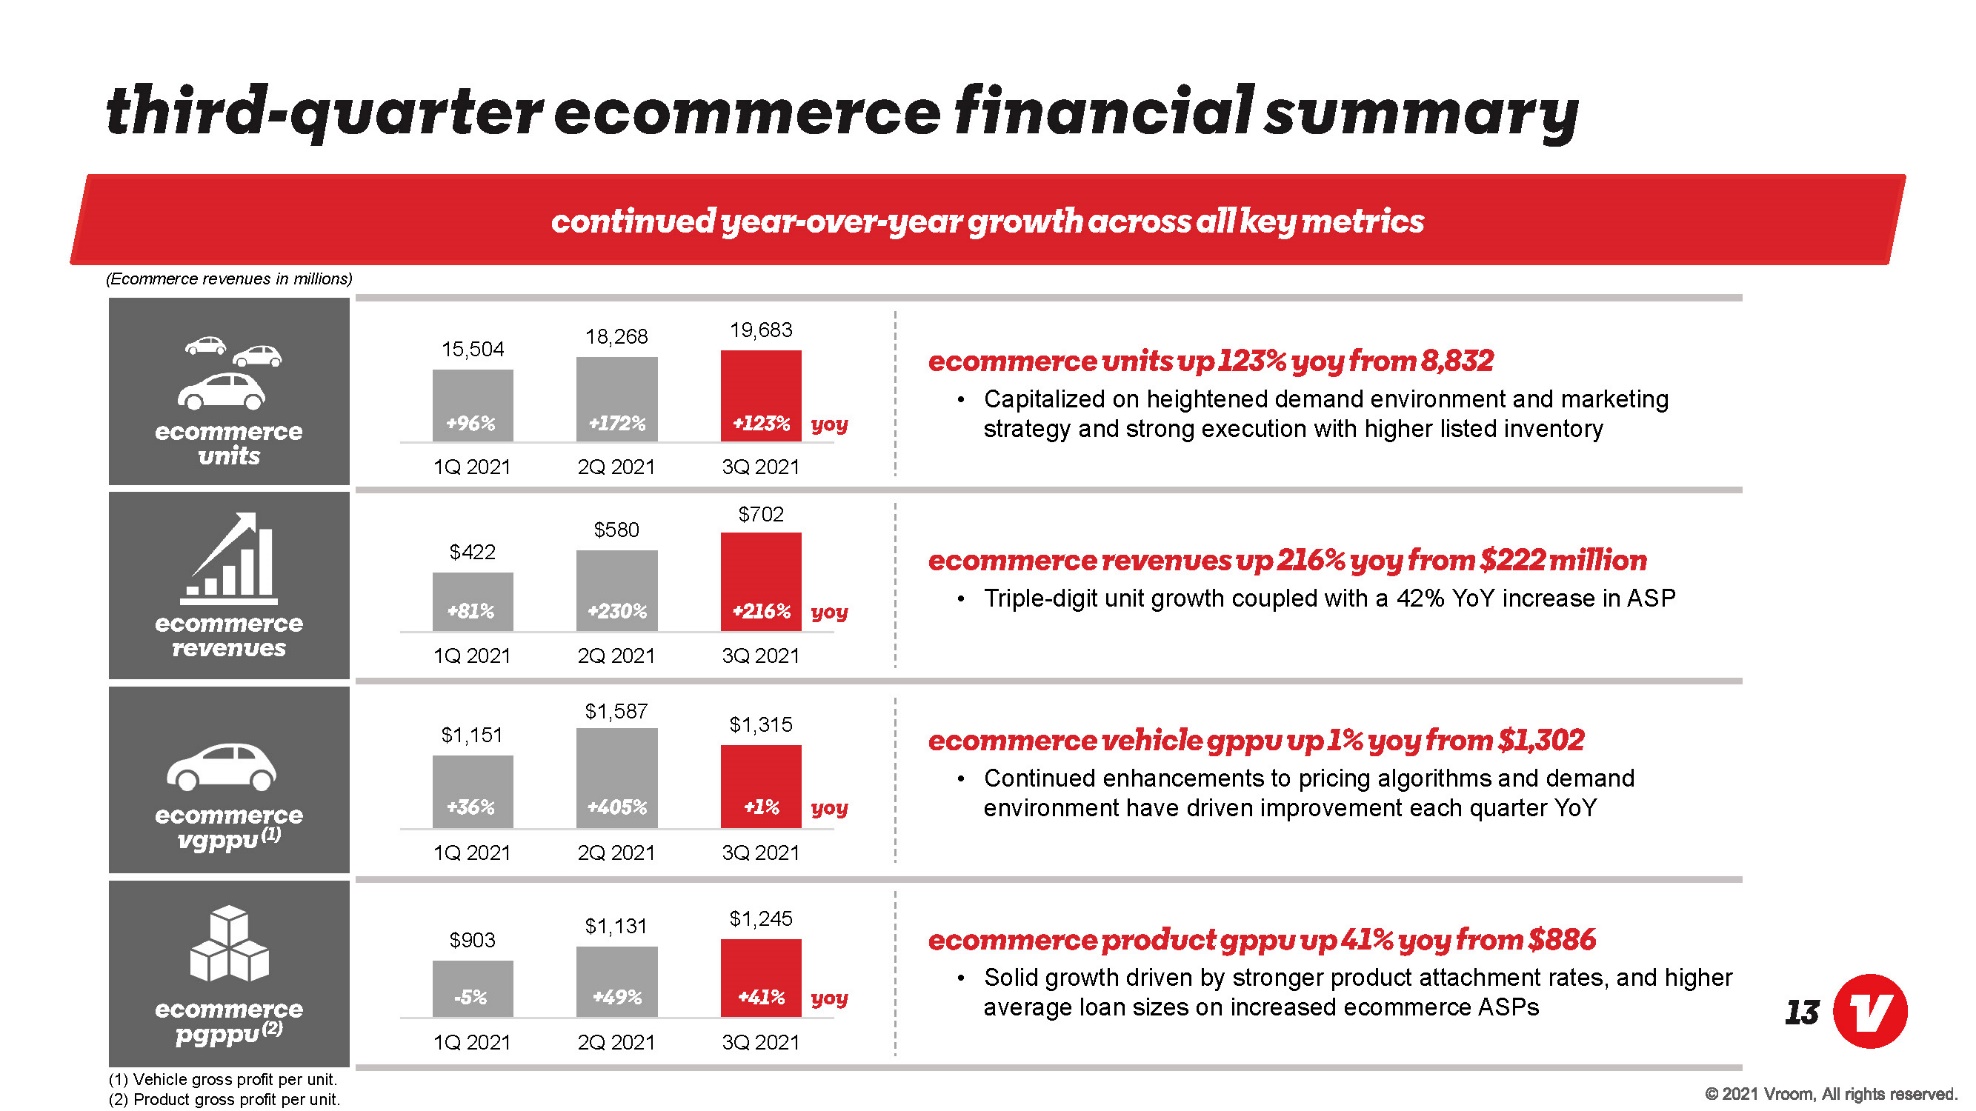
© 2021 Vroom, All rights reserved. 13 Third - quarter ecommerce financial summary Continued year - over - year growth across all key metrics 15,504 18,268 19,683 1Q 2021 2Q 2021 3Q 2021 (Ecommerce revenues in millions) Ecommerce revenues up 216% YoY from $222 million • Triple - digit unit growth coupled with a 42% YoY increase in ASP Ecommerce vehicle GPPU up 1% YoY from $1,302 • Continued enhancements to pricing algorithms and demand environment have driven improvement each quarter YoY +96% YoY +172% +123% $422 $580 $702 1Q 2021 2Q 2021 3Q 2021 +81% YoY +230% +216% $1,151 $1,587 $1,315 1Q 2021 2Q 2021 3Q 2021 +36% YoY +405% +1% Ecommerce units up 123% YoY from 8,832 • Capitalized on heightened demand environment and marketing strategy and strong execution with higher listed inventory Ecommerce product GPPU up 41% YoY from $886 • Solid growth driven by stronger product attachment rates, and higher average loan sizes on increased ecommerce ASPs $903 $1,131 $1,245 1Q 2021 2Q 2021 3Q 2021 - 5% YoY +49% +41% (1) Vehicle gross profit per unit. (2) Product gross profit per unit. Ecommerce units Ecommerce Revenues Ecommerce VGPPU (1) Ecommerce PGPPU (2)
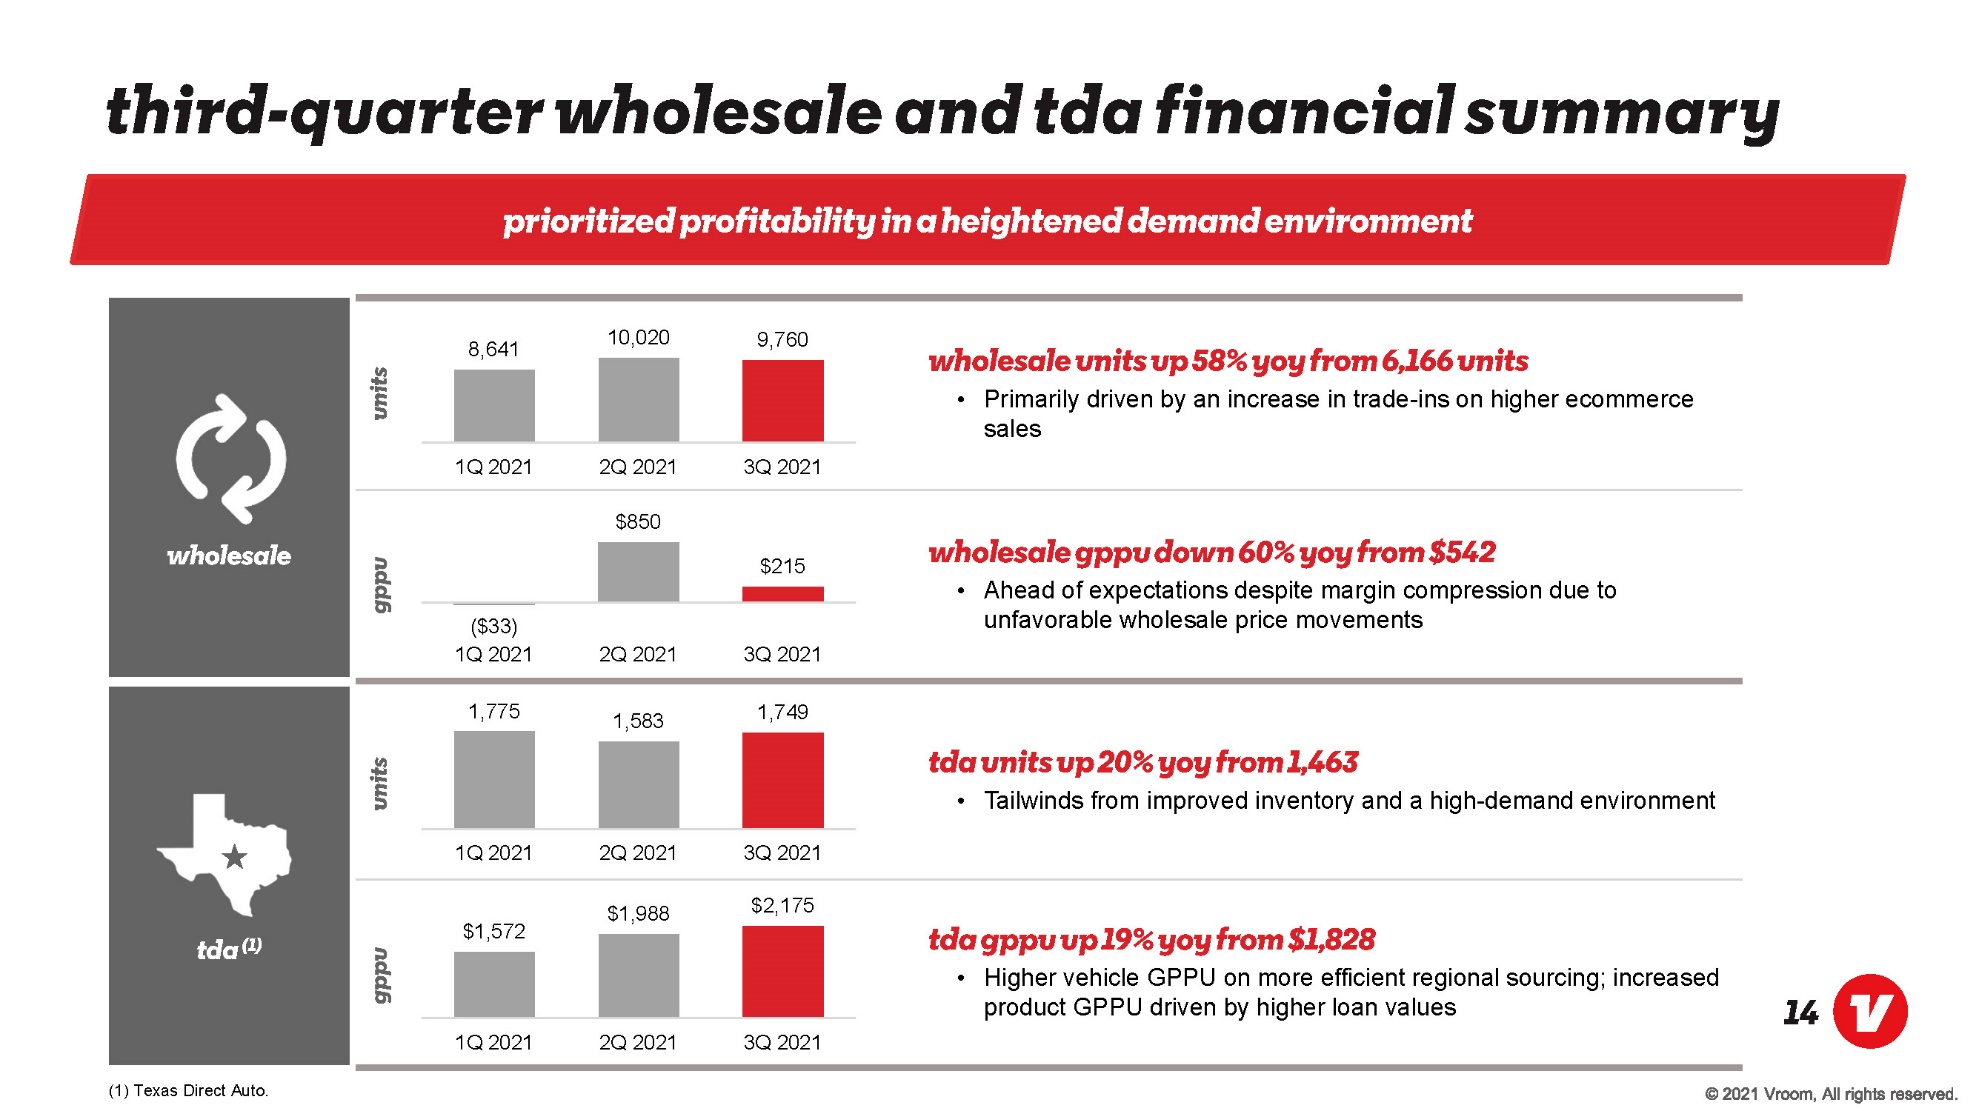
© 2021 Vroom, All rights reserved. 14 Third - quarter wholesale and TDA financial summary Prioritized profitability in a heightened demand environment 8,641 10,020 9,760 1Q 2021 2Q 2021 3Q 2021 Wholesale GPPU down 60% YoY from $542 • Ahead of expectations despite margin compression due to unfavorable wholesale price movements TDA units up 20% YoY from 1,463 • Tailwinds from improved inventory and a high - demand environment Wholesale ($33) $850 $215 1Q 2021 2Q 2021 3Q 2021 1,775 1,583 1,749 1Q 2021 2Q 2021 3Q 2021 Wholesale units up 58% YoY from 6,166 units • Primarily driven by an increase in trade - ins on higher ecommerce sales TDA GPPU up 19% YoY from $1,828 • Higher vehicle GPPU on more efficient regional sourcing; increased product GPPU driven by higher loan values $1,572 $1,988 $2,175 1Q 2021 2Q 2021 3Q 2021 TDA (1) units GPPU (1) Texas Direct Auto. units GPPU
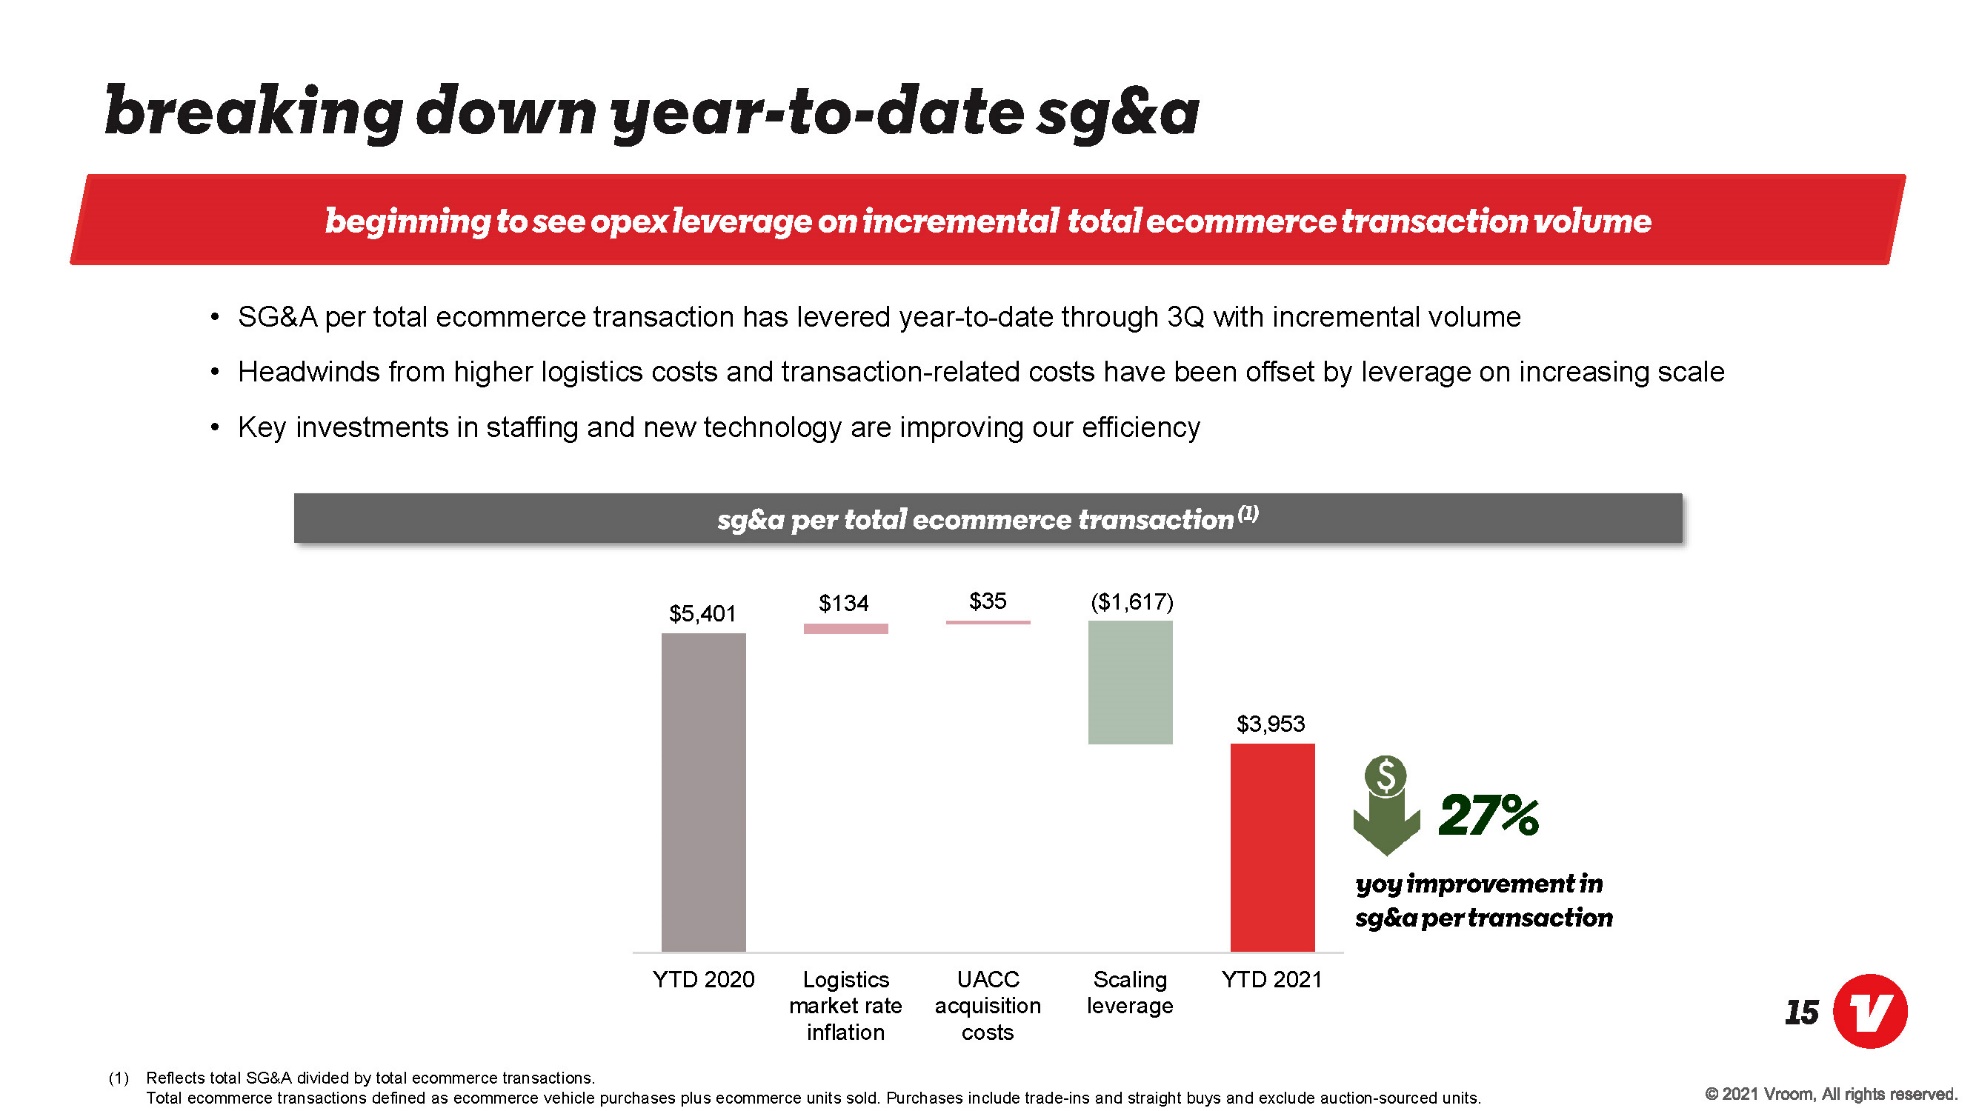
© 2021 Vroom, All rights reserved. 15 Breaking down year - to - date SG&A Beginning to see opex Leverage on incremental total ecommerce transaction volume • SG&A per total ecommerce transaction has levered year - to - date through 3Q with incremental volume • Headwinds from higher logistics costs and transaction - related costs have been offset by leverage on increasing scale • Key investments in staffing and new technology are improving our efficiency SG&A per total ecommerce Transaction ( 1 ) $5,401 $3,953 $134 $35 ($1,617) YTD 2020 Logistics market rate inflation UACC acquisition costs Scaling leverage YTD 2021 (1) Reflects total SG&A divided by total ecommerce transactions. Total ecommerce transactions defined as ecommerce vehicle purchases plus ecommerce units sold. Purchases include trade - ins and straight buys and exclude auction - sourced units. 27% YoY improvement in SG&A per transaction
© 2021 Vroom, All rights reserved. 16 Third - quarter financial summary Solid performance as we continue to execute our strategy A picture containing text, road, car, auto racing Description automatically generated Robust ecommerce transaction growth Driving our strategy forward 4Q Guidance Continues strong YoY growth Ongoing momentum on ecommerce GPPU Expenses scaling, yet levering on a per - transaction basis

© 2021 Vroom, All rights reserved. 17 picture containing trees and car Appendix November 2021
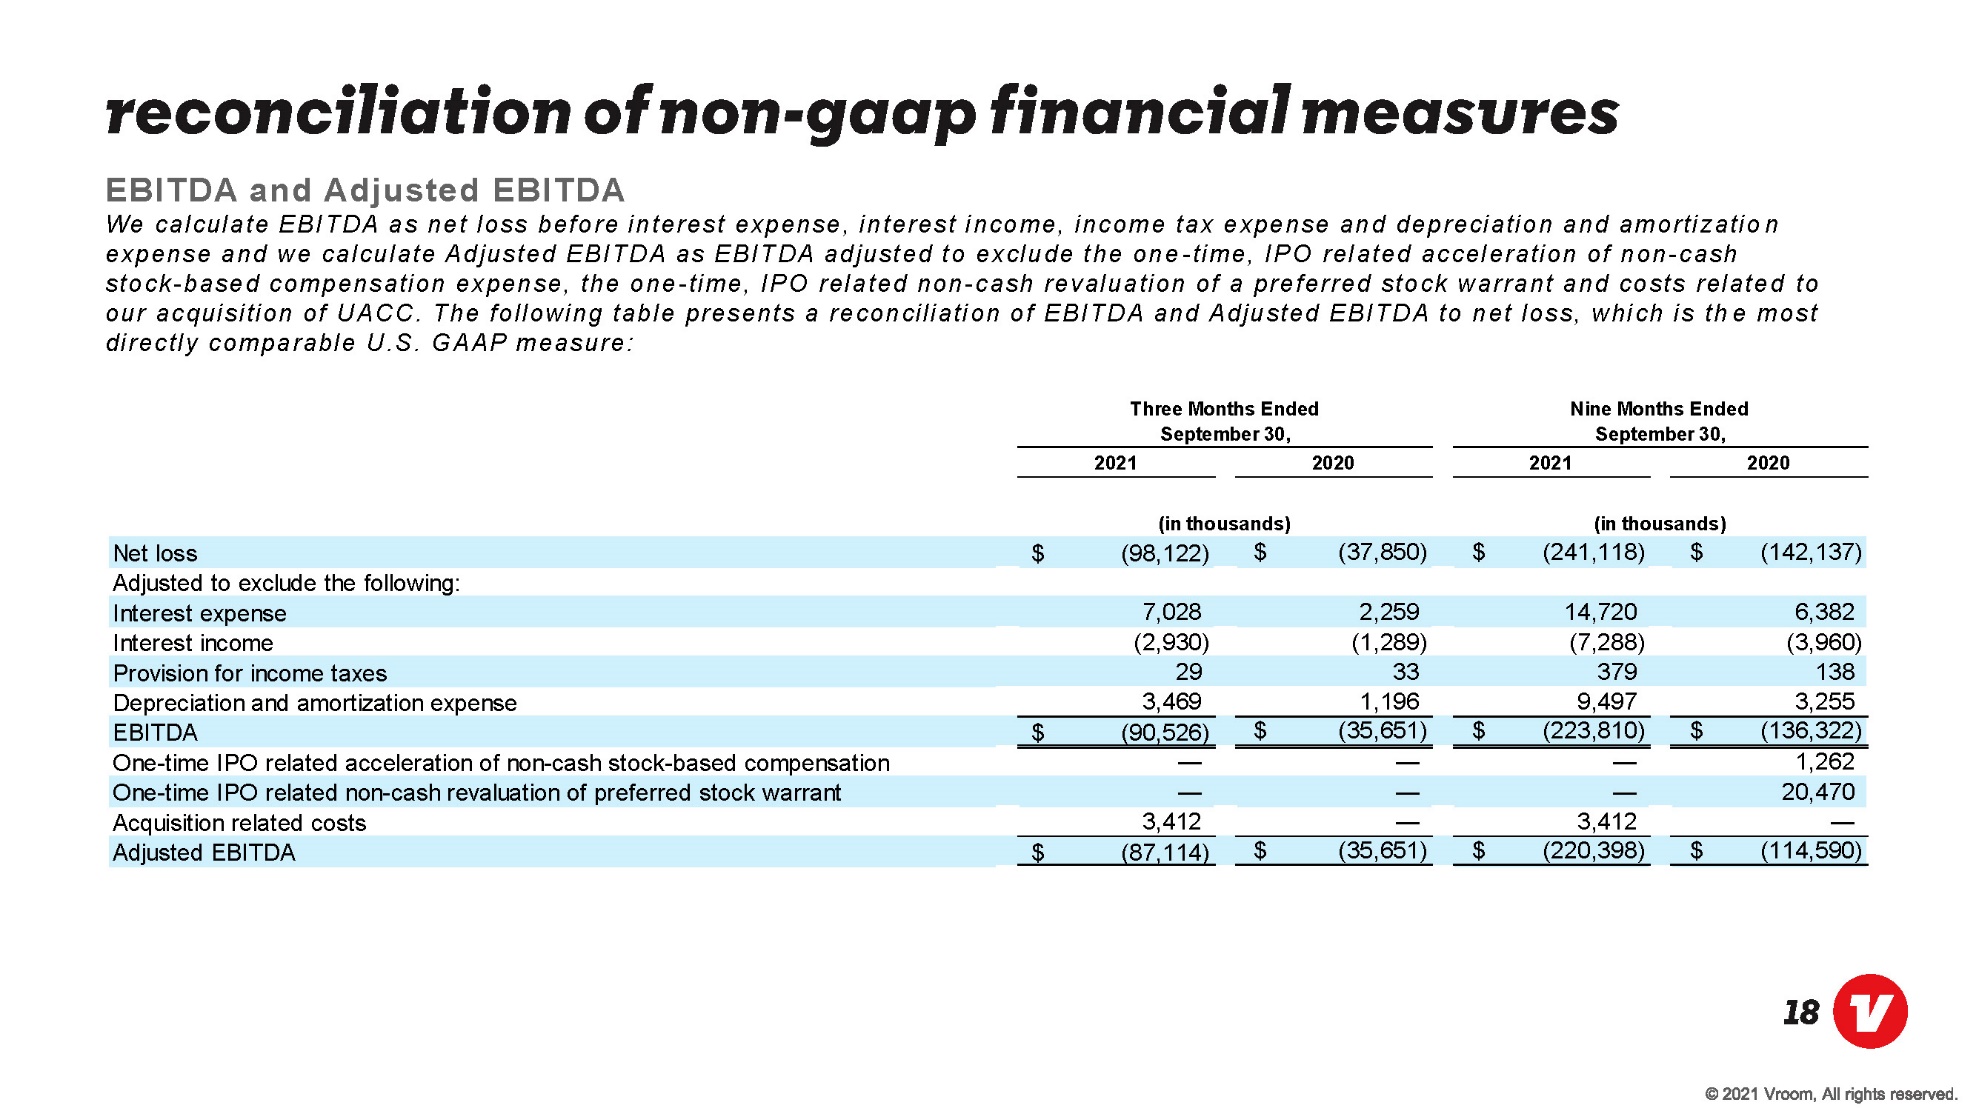
© 2021 Vroom, All rights reserved. 18 Reconciliation of Non - GAAP Financial measures 2021202020212020Net loss(98,122)$ (37,850)$ (241,118)$ (142,137)$ Adjusted to exclude the following: Interest expense7,028 2,259 14,720 6,382 Interest income(2,930) (1,289) (7,288) (3,960) Provision for income taxes29 33 379 138 Depreciation and amortization expense3,469 1,196 9,497 3,255 EBITDA(90,526)$ (35,651)$ (223,810)$ (136,322)$ One-time IPO related acceleration of non-cash stock-based compensation— — — 1,262 One-time IPO related non-cash revaluation of preferred stock warrant— — — 20,470 Acquisition related costs3,412 — 3,412 — Adjusted EBITDA(87,114)$ (35,651)$ (220,398)$ (114,590)$ Three Months Ended September 30, Nine Months Ended September 30, (in thousands)(in thousands) EBITDA and Adjusted EBITDA We calculate EBITDA as net loss before interest expense, interest income, income tax expense and depreciation and amortization expense and we calculate Adjusted EBITDA as EBITDA adjusted to exclude the one - time, IPO related acceleration of non - cash stock - based compensation expense, the one - time, IPO related non - cash revaluation of a preferred stock warrant and costs related to our acquisition of UACC. The following table presents a reconciliation of EBITDA and Adjusted EBITDA to net loss, which is the most directly comparable U.S. GAAP measure:
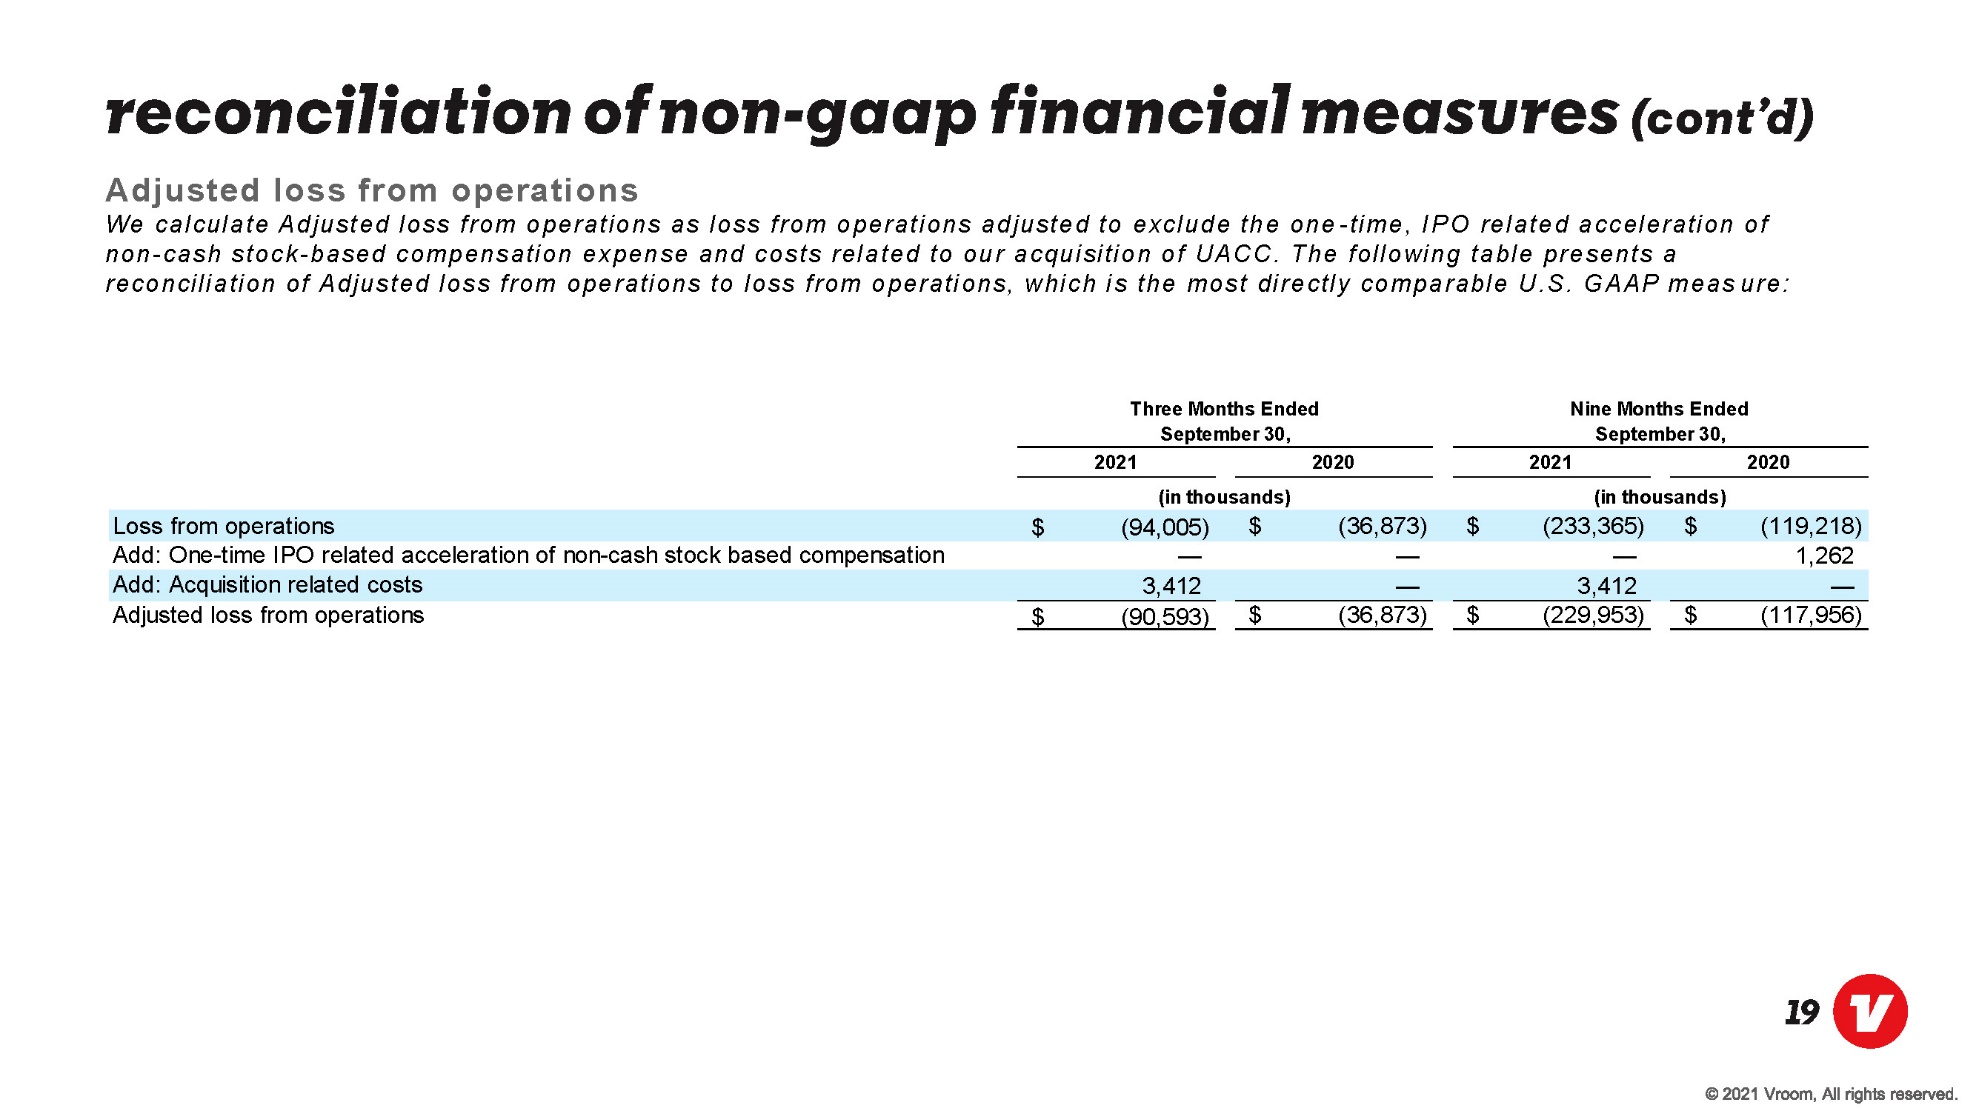
© 2021 Vroom, All rights reserved. 19 Reconciliation of Non - GAAP Financial measures (cont’d) 2021202020212020Loss from operations(94,005)$ (36,873)$ (233,365)$ (119,218)$ Add: One-time IPO related acceleration of non-cash stock based compensation— — — 1,262 Add: Acquisition related costs3,412 — 3,412 — Adjusted loss from operations(90,593)$ (36,873)$ (229,953)$ (117,956)$ Three Months Ended September 30, Nine Months Ended September 30, (in thousands)(in thousands) Adjusted loss from operations We calculate Adjusted loss from operations as loss from operations adjusted to exclude the one - time, IPO related acceleration of non - cash stock - based compensation expense and costs related to our acquisition of UACC. The following table presents a reconciliation of Adjusted loss from operations to loss from operations, which is the most directly comparable U.S. GAAP measure :
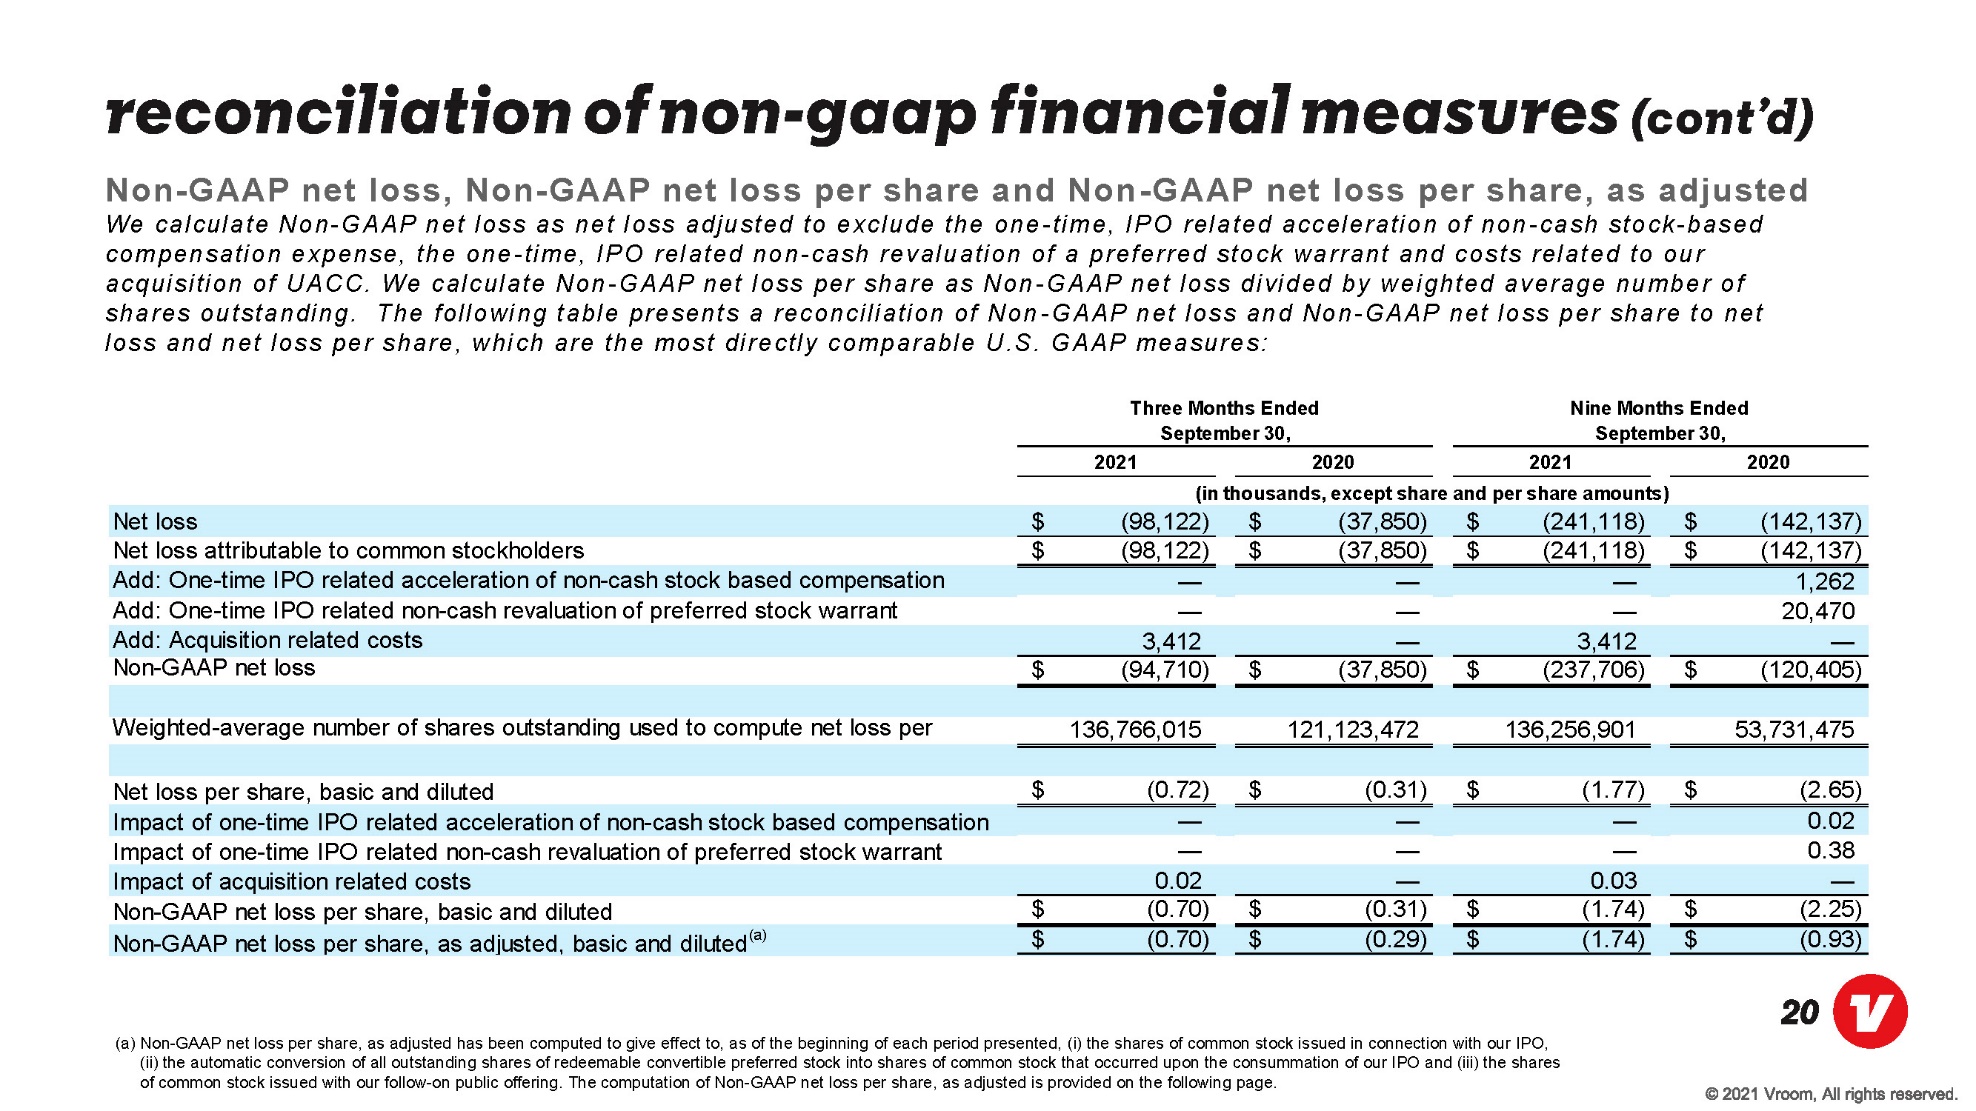
© 2021 Vroom, All rights reserved. 20 2021202020212020Net loss(98,122)$ (37,850)$ (241,118)$ (142,137)$ Net loss attributable to common stockholders(98,122)$ (37,850)$ (241,118)$ (142,137)$ Add: One-time IPO related acceleration of non-cash stock based compensation— — — 1,262 Add: One-time IPO related non-cash revaluation of preferred stock warrant— — — 20,470 Add: Acquisition related costs3,412 — 3,412 — Non-GAAP net loss(94,710)$ (37,850)$ (237,706)$ (120,405)$ Weighted-average number of shares outstanding used to compute net loss per 136,766,015 121,123,472 136,256,901 53,731,475 Net loss per share, basic and diluted(0.72)$ (0.31)$ (1.77)$ (2.65)$ Impact of one-time IPO related acceleration of non-cash stock based compensation— — — 0.02 Impact of one-time IPO related non-cash revaluation of preferred stock warrant— — — 0.38 Impact of acquisition related costs0.02 — 0.03 — Non-GAAP net loss per share, basic and diluted(0.70)$ (0.31)$ (1.74)$ (2.25)$ Non-GAAP net loss per share, as adjusted, basic and diluted(a)(0.70)$ (0.29)$ (1.74)$ (0.93)$ Three Months Ended September 30, Nine Months Ended September 30, (in thousands, except share and per share amounts) Reconciliation of Non - GAAP Financial measures (cont’d) (a) Non - GAAP net loss per share, as adjusted has been computed to give effect to, as of the beginning of each period presented, (i) the shares of common stock issued in connection with our IPO, (ii) the automatic conversion of all outstanding shares of redeemable convertible preferred stock into shares of common stock th at occurred upon the consummation of our IPO and (iii) the shares of common stock issued with our follow - on public offering. The computation of Non - GAAP net loss per share, as adjusted is provided on the following page. Non - GAAP net loss, Non - GAAP net loss per share and Non - GAAP net loss per share, as adjusted We calculate Non - GAAP net loss as net loss adjusted to exclude the one - time, IPO related acceleration of non - cash stock - based compensation expense, the one - time, IPO related non - cash revaluation of a preferred stock warrant and costs related to our acquisition of UACC. We calculate Non - GAAP net loss per share as Non - GAAP net loss divided by weighted average number of shares outstanding. The following table presents a reconciliation of Non - GAAP net loss and Non - GAAP net loss per share to net loss and net loss per share, which are the most directly comparable U.S. GAAP measures:
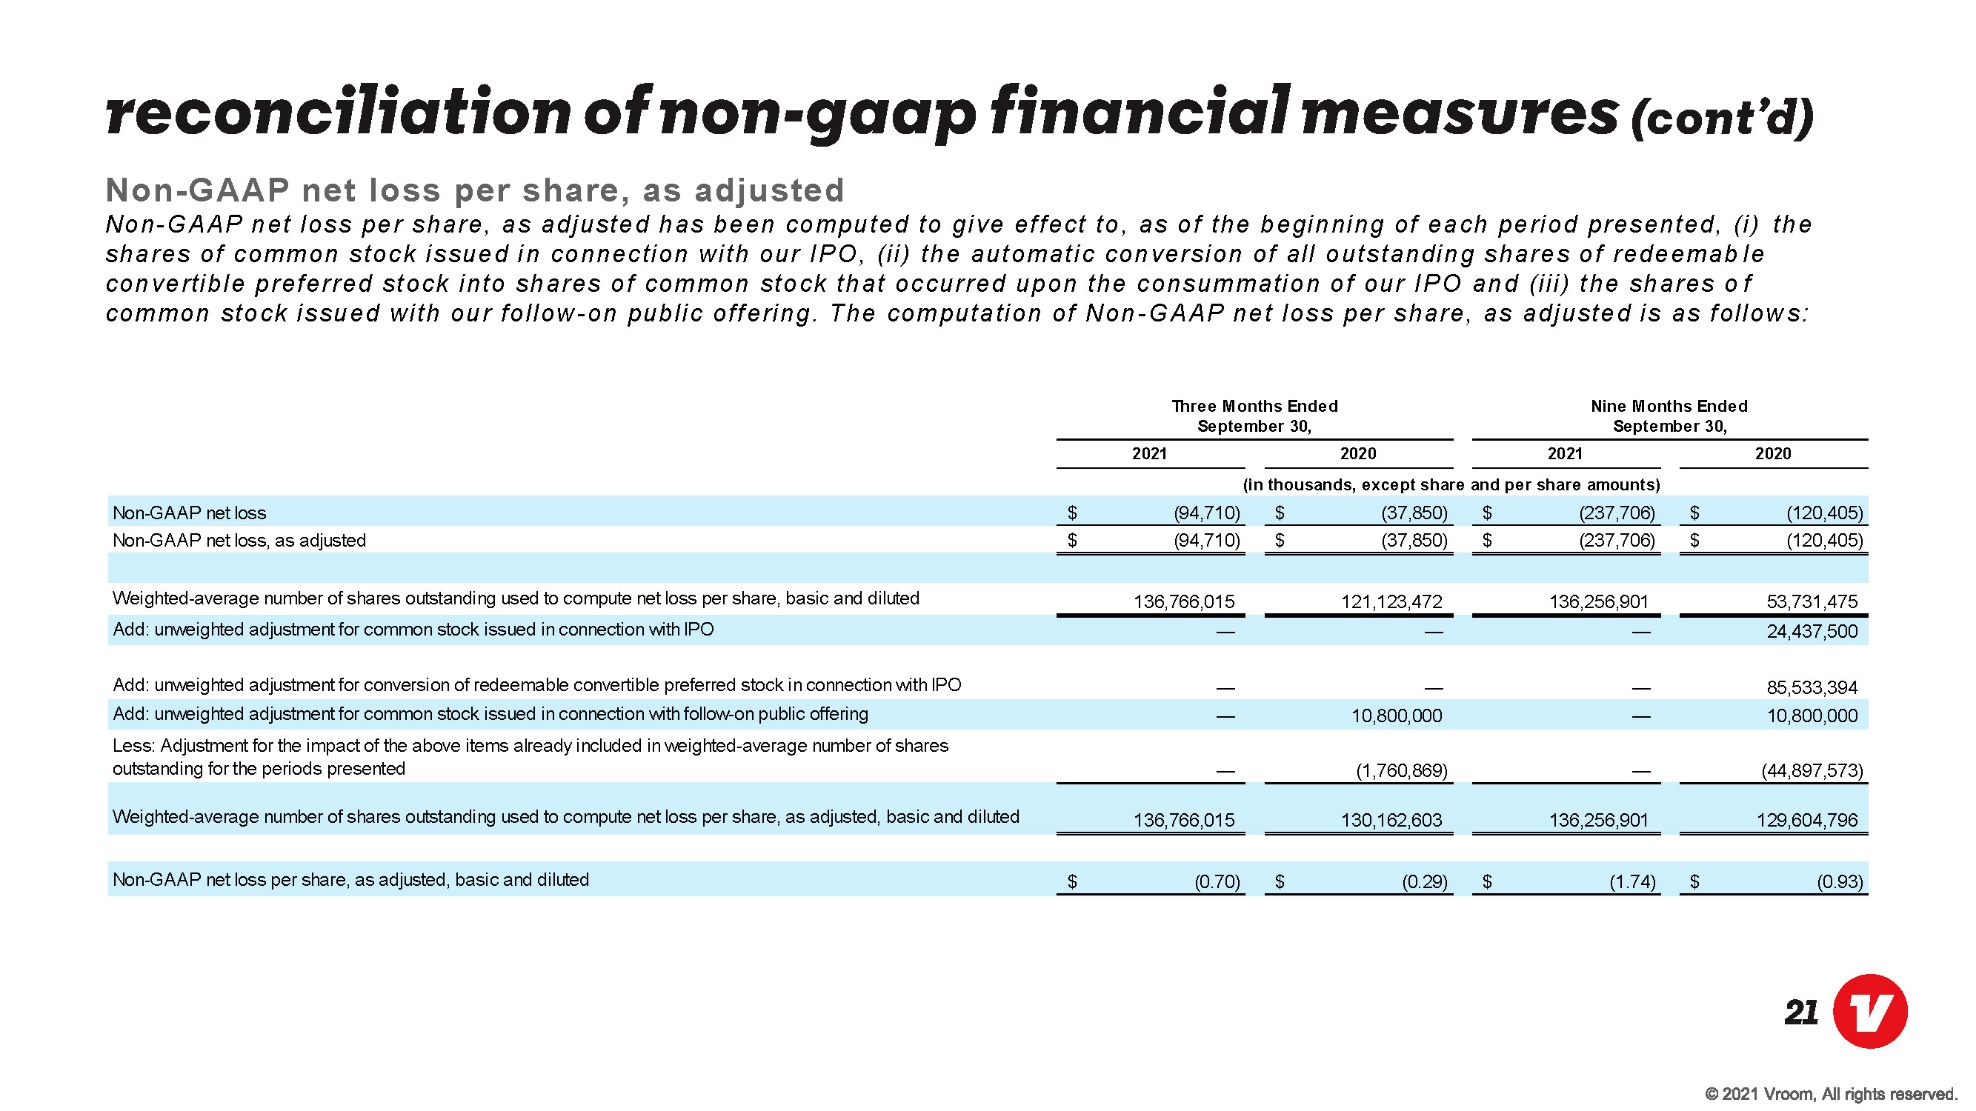
© 2021 Vroom, All rights reserved. 21 Reconciliation of Non - GAAP Financial measures (cont’d) 2021202020212020Non-GAAP net loss(94,710)$ (37,850)$ (237,706)$ (120,405)$ Non-GAAP net loss, as adjusted (94,710)$ (37,850)$ (237,706)$ (120,405)$ Weighted-average number of shares outstanding used to compute net loss per share, basic and diluted136,766,015 121,123,472 136,256,901 53,731,475 Add: unweighted adjustment for common stock issued in connection with IPO— — — 24,437,500 Add: unweighted adjustment for conversion of redeemable convertible preferred stock in connection with IPO— — — 85,533,394 Add: unweighted adjustment for common stock issued in connection with follow-on public offering— 10,800,000 — 10,800,000 Less: Adjustment for the impact of the above items already included in weighted-average number of shares outstanding for the periods presented— (1,760,869) — (44,897,573) Weighted-average number of shares outstanding used to compute net loss per share, as adjusted, basic and diluted136,766,015 130,162,603 136,256,901 129,604,796 Non-GAAP net loss per share, as adjusted, basic and diluted(0.70)$ (0.29)$ (1.74)$ (0.93)$ (in thousands, except share and per share amounts) Three Months Ended September 30, Nine Months Ended September 30, Non - GAAP net loss per share, as adjusted Non - GAAP net loss per share, as adjusted has been computed to give effect to, as of the beginning of each period presented, (i) the shares of common stock issued in connection with our IPO, (ii) the automatic conversion of all outstanding shares of redeemable convertible preferred stock into shares of common stock that occurred upon the consummation of our IPO and (iii) the shares o f common stock issued with our follow - on public offering. The computation of Non - GAAP net loss per share, as adjusted is as follows:

© 2021 Vroom, All rights reserved. 22 Thank you!