
Vroom Fourth-Quarter 2021 Earnings February 2022
Disclaimer Forward Looking Statements This presentation contains forward-looking statements within the meaning of the Private Securities Litigation Reform Act of 1995. All statements contained in this presentation that do not relate to matters of historical fact should be considered forward-looking statements, including without limitation, statements regarding our expectations regarding our business strategy and plans, including our ability to integrate and develop United Auto Credit Corporation into a captive finance operation, as well as our ability to scale our business, grow inventory, expand reconditioning capacity, invest in logistics and improve our end-to-end customer experience, and statements regarding our future results of operations and financial position, including our ability to improve our unit economics and our outlook for the first quarter of fiscal year 2022. These statements are based on management’s current assumptions and are neither promises nor guarantees, but involve known and unknown risks, uncertainties and other important factors that may cause our actual results, performance or achievements to be materially different from any future results, performance or achievements expressed or implied by the forward-looking statements. For factors that could cause actual results to differ materially from the forward-looking statements in this presentation, please see the risks and uncertainties identified under the heading "Risk Factors" in our Annual Report on Form 10-K for the year ended December 31, 2021, which is available on our Investor Relations website at ir.vroom.com and on the SEC website at www.sec.gov. All forward-looking statements reflect our beliefs and assumptions only as of the date of this presentation. We undertake no obligation to update forward-looking statements to reflect future events or circumstances. Industry and Market Information To the extent this presentation includes information concerning the industry and the markets in which the Company operates, including general observations, expectations, market position, market opportunity and market size, such information is based on management's knowledge and experience in the markets in which we operate, including publicly available information from independent industry analysts and publications, as well as the Company’s own estimates. Our estimates are based on third-party sources, as well as internal research, which the Company believes to be reasonable, but which are inherently uncertain and imprecise. Accordingly, you are cautioned not to place undue reliance on such market and industry information. Financial Presentation and Use of Non-GAAP Financial Measures Certain monetary amounts, percentages and other figures included in this presentation have been subject to rounding adjustments. Certain other amounts that appear in this presentation may not sum due to rounding. This presentation contains certain supplemental financial measures that are not calculated pursuant to U.S. generally accepted accounting principles (“GAAP”). These non-GAAP measures are in addition to, and not a substitute or superior to, measures of financial performance prepared in accordance with GAAP. These non-GAAP financial measures have limitations as analytical tools in that they do not reflect all of the amounts associated with our results of operations as determined in accordance with U.S. GAAP. Because of these limitations, these non-GAAP financial measures should be considered along with other operating and financial performance measures presented in accordance with U.S. GAAP. We have reconciled all non-GAAP financial measures with the most directly comparable U.S. GAAP financial measures.
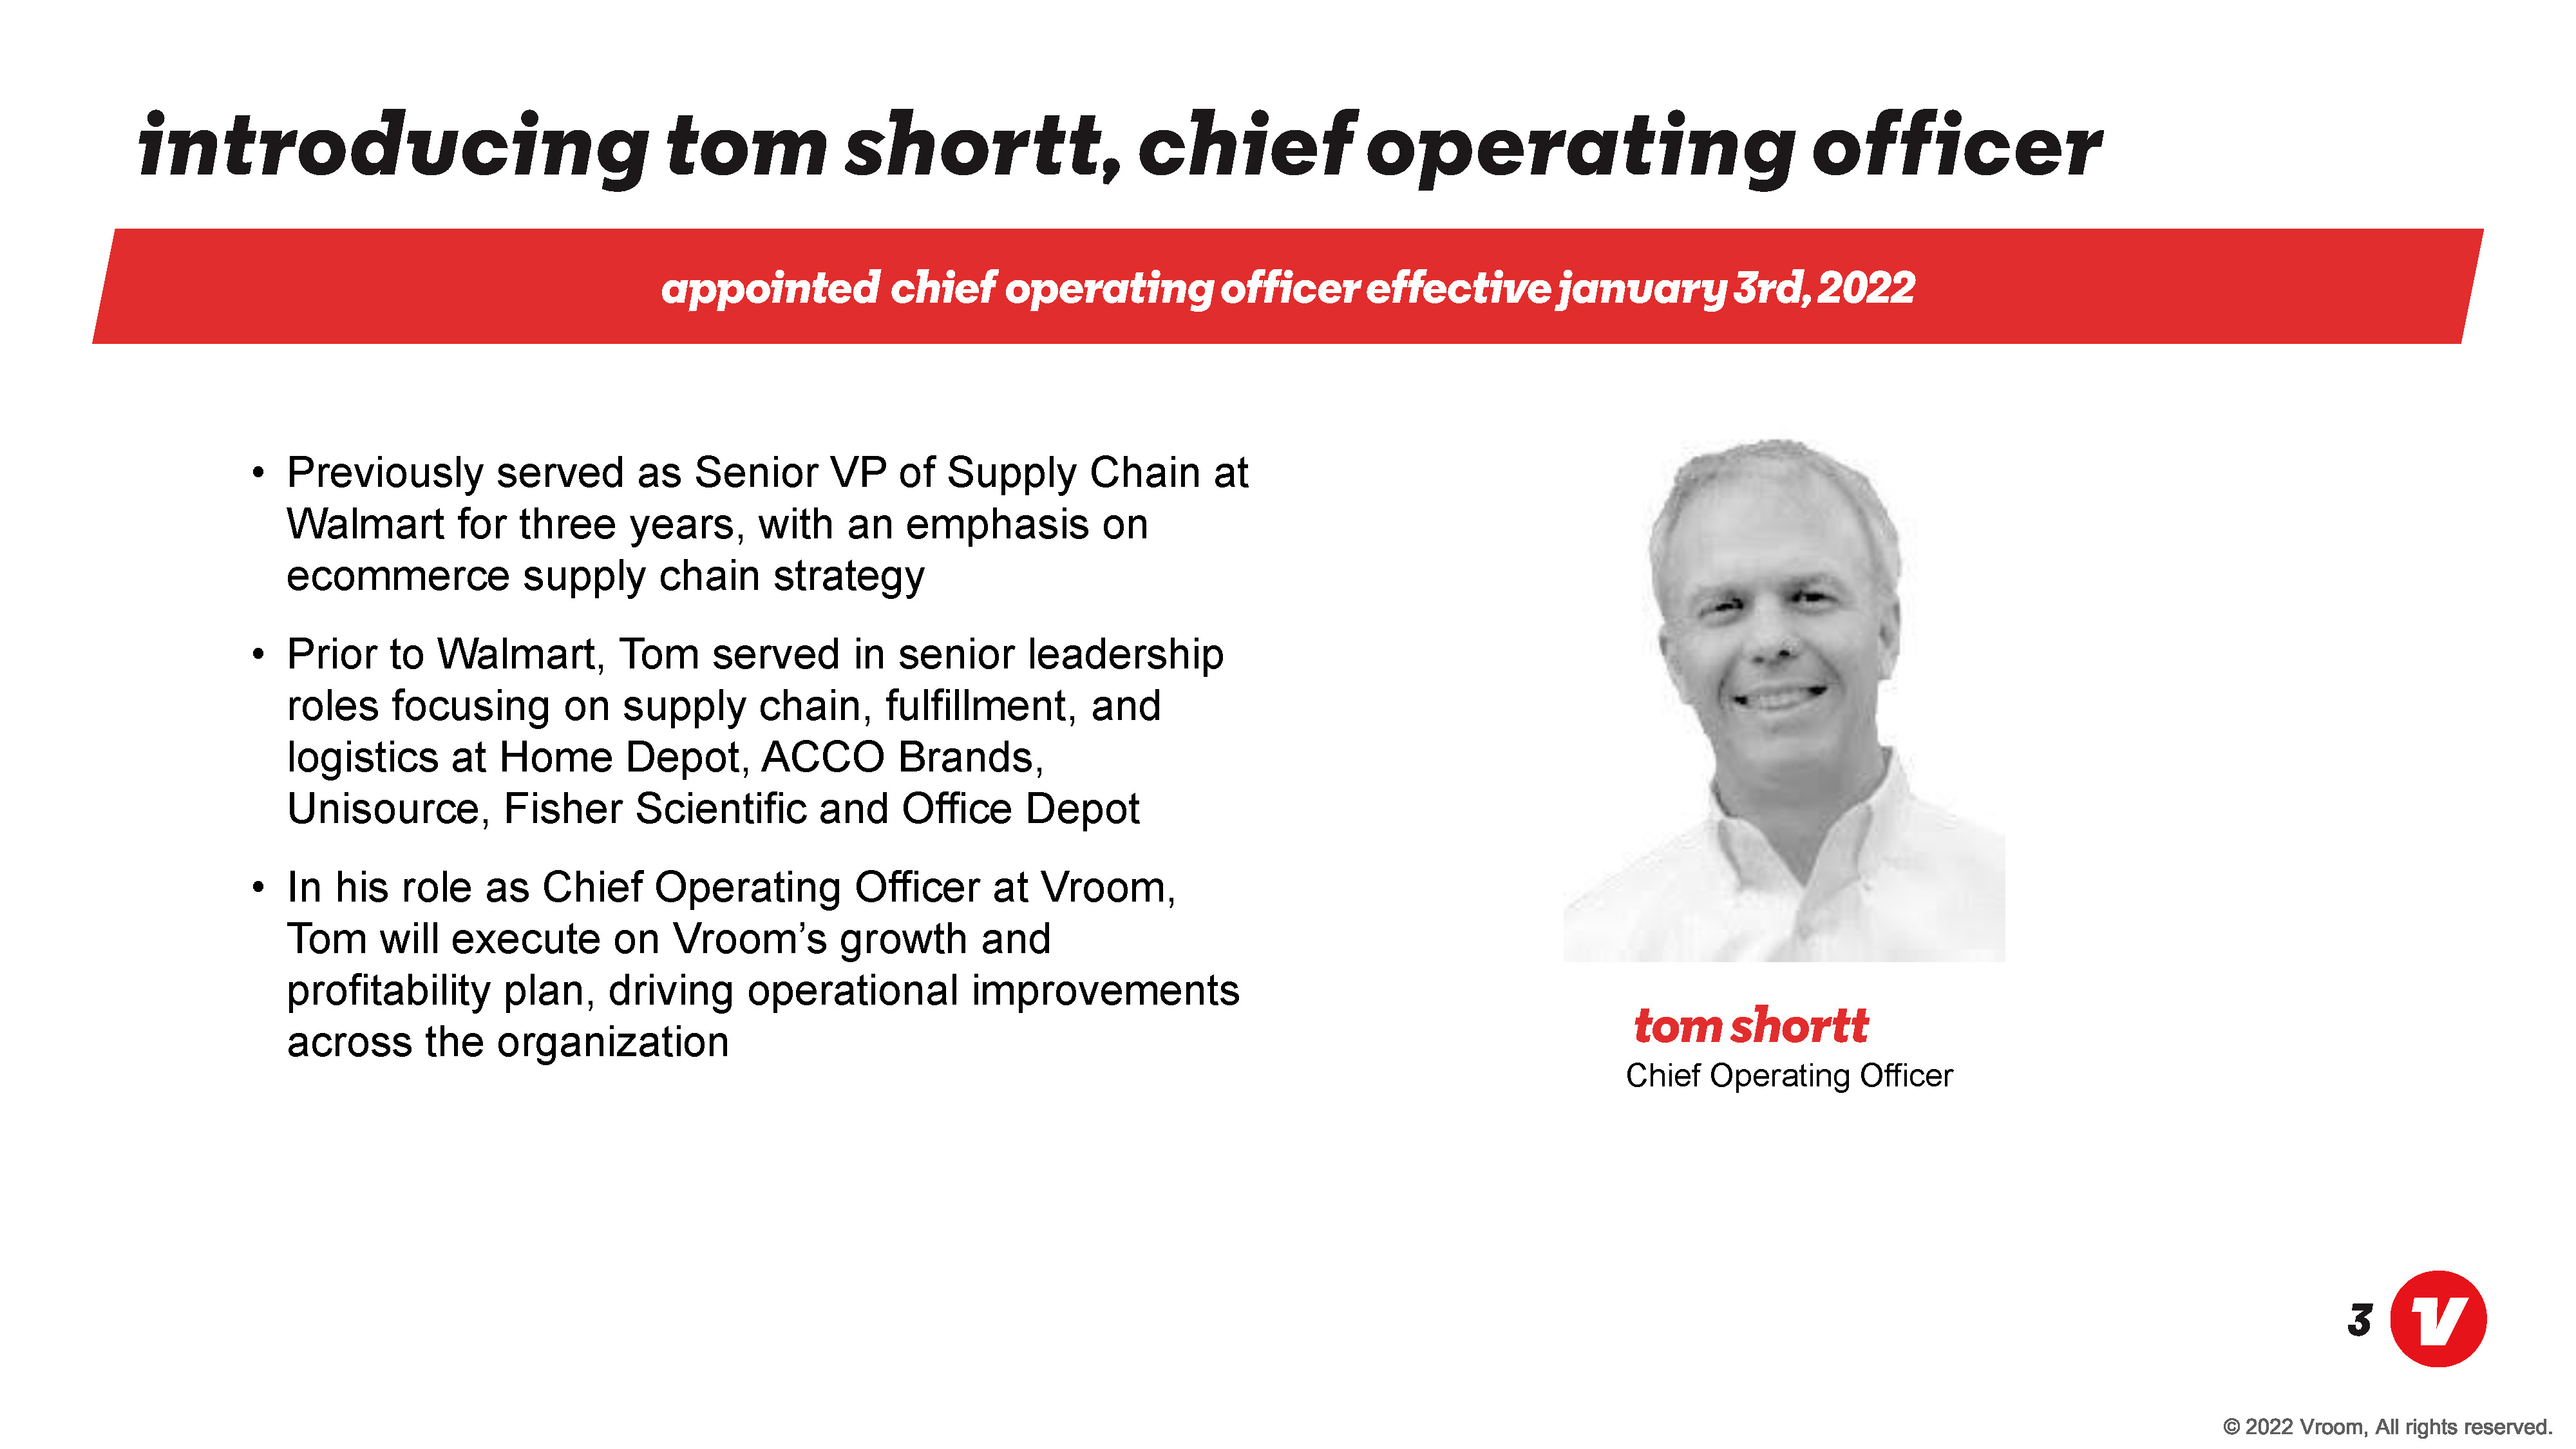
Introducing tom shortt, Chief operating officer Appointed Chief operating Officer effective January 3rd, 2022 Previously served as Senior VP of Supply Chain at Walmart for three years, with an emphasis on ecommerce supply chain strategy Prior to Walmart, Tom served in senior leadership roles focusing on supply chain, fulfillment, and logistics at Home Depot, ACCO Brands, Unisource, Fisher Scientific and Office Depot In his role as Chief Operating Officer at Vroom, Tom will execute on Vroom’s growth and profitability plan, driving operational improvements across the organization Tom short Chief Operating Officer
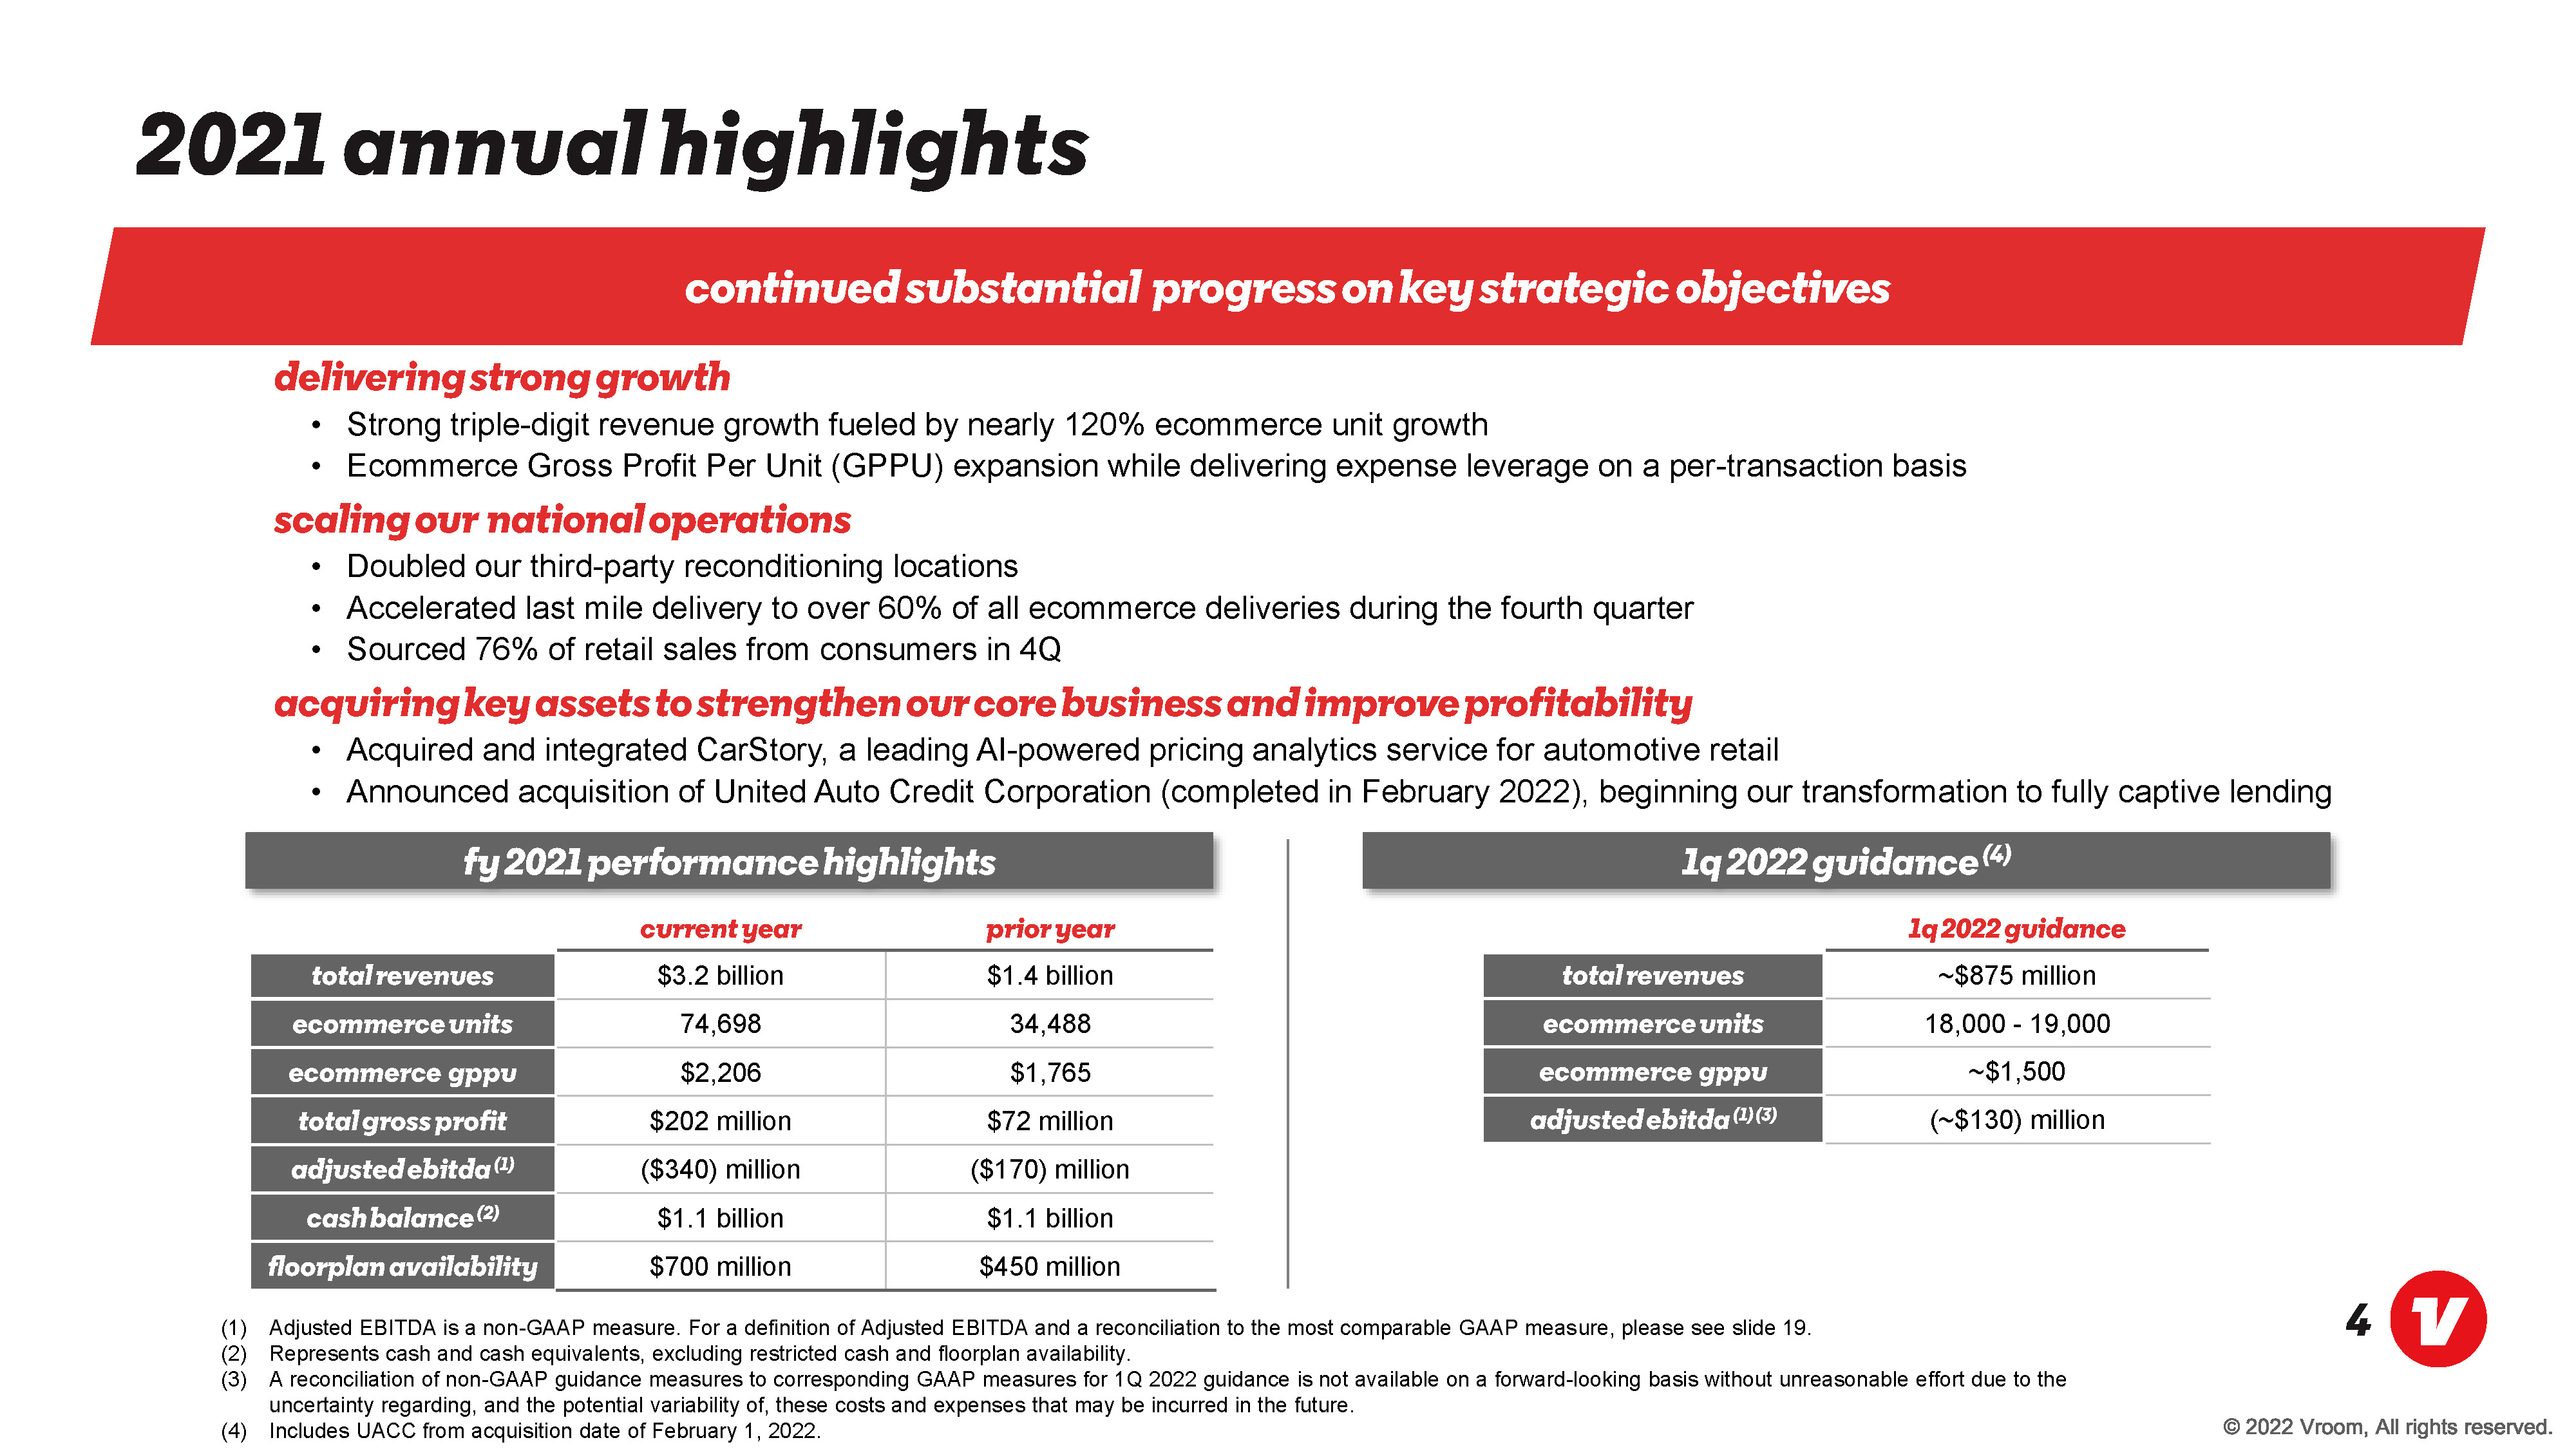
2021 annual highlights Continued substantial progress on key strategic objectives Delivering Strong growth Strong triple-digit revenue growth fueled by nearly 120% ecommerce unit growth Ecommerce Gross Profit Per Unit (GPPU) expansion while delivering expense leverage on a per-transaction basis Scaling our national operations Doubled our third-party reconditioning locations Accelerated last mile delivery to over 60% of all ecommerce deliveries during the fourth quarter Sourced 76% of retail sales from consumers in 4Q acquiring key assets to strengthen our core business and improve profitability Acquired and integrated CarStory, a leading AI-powered pricing analytics service for automotive retail Announced acquisition of United Auto Credit Corporation (completed in February 2022), beginning our transformation to fully captive lending FY 2021 Performance Highlights current year prior year total revenues ecommerce units ecommerce gppu total gross profit adjusted ebitda(1) cash balance(2) floorplan availability $3.2 billion $1.4 billion 74,698 34,488 $2,206 $1,765 $202 million $72 million ($340) million ($170) million $1.1 billion $1.1 billion $700 million $450 million 1q2022 guidance(4) 1q2022 guidance total revenues ecommerce units ecommerce gppu total gross profit adjusted ebitda(1)(3) ~$875 million 18,000 - 19,000 ~$1,500 (~$130) million (1) Adjusted EBITDA is a non-GAAP measure. For a definition of Adjusted EBITDA and a reconciliation to the most comparable GAAP measure, please see slide 19. (2) Represents cash and cash equivalents, excluding restricted cash and floorplan availability. (3) A reconciliation of non-GAAP guidance measures to corresponding GAAP measures for 1Q 2022 guidance is not available on a forward-looking basis without unreasonable effort due to the uncertainty regarding, and the potential variability of, these costs and expenses that may be incurred in the future. (4) Includes UACC from acquisition date of February 1, 2022.
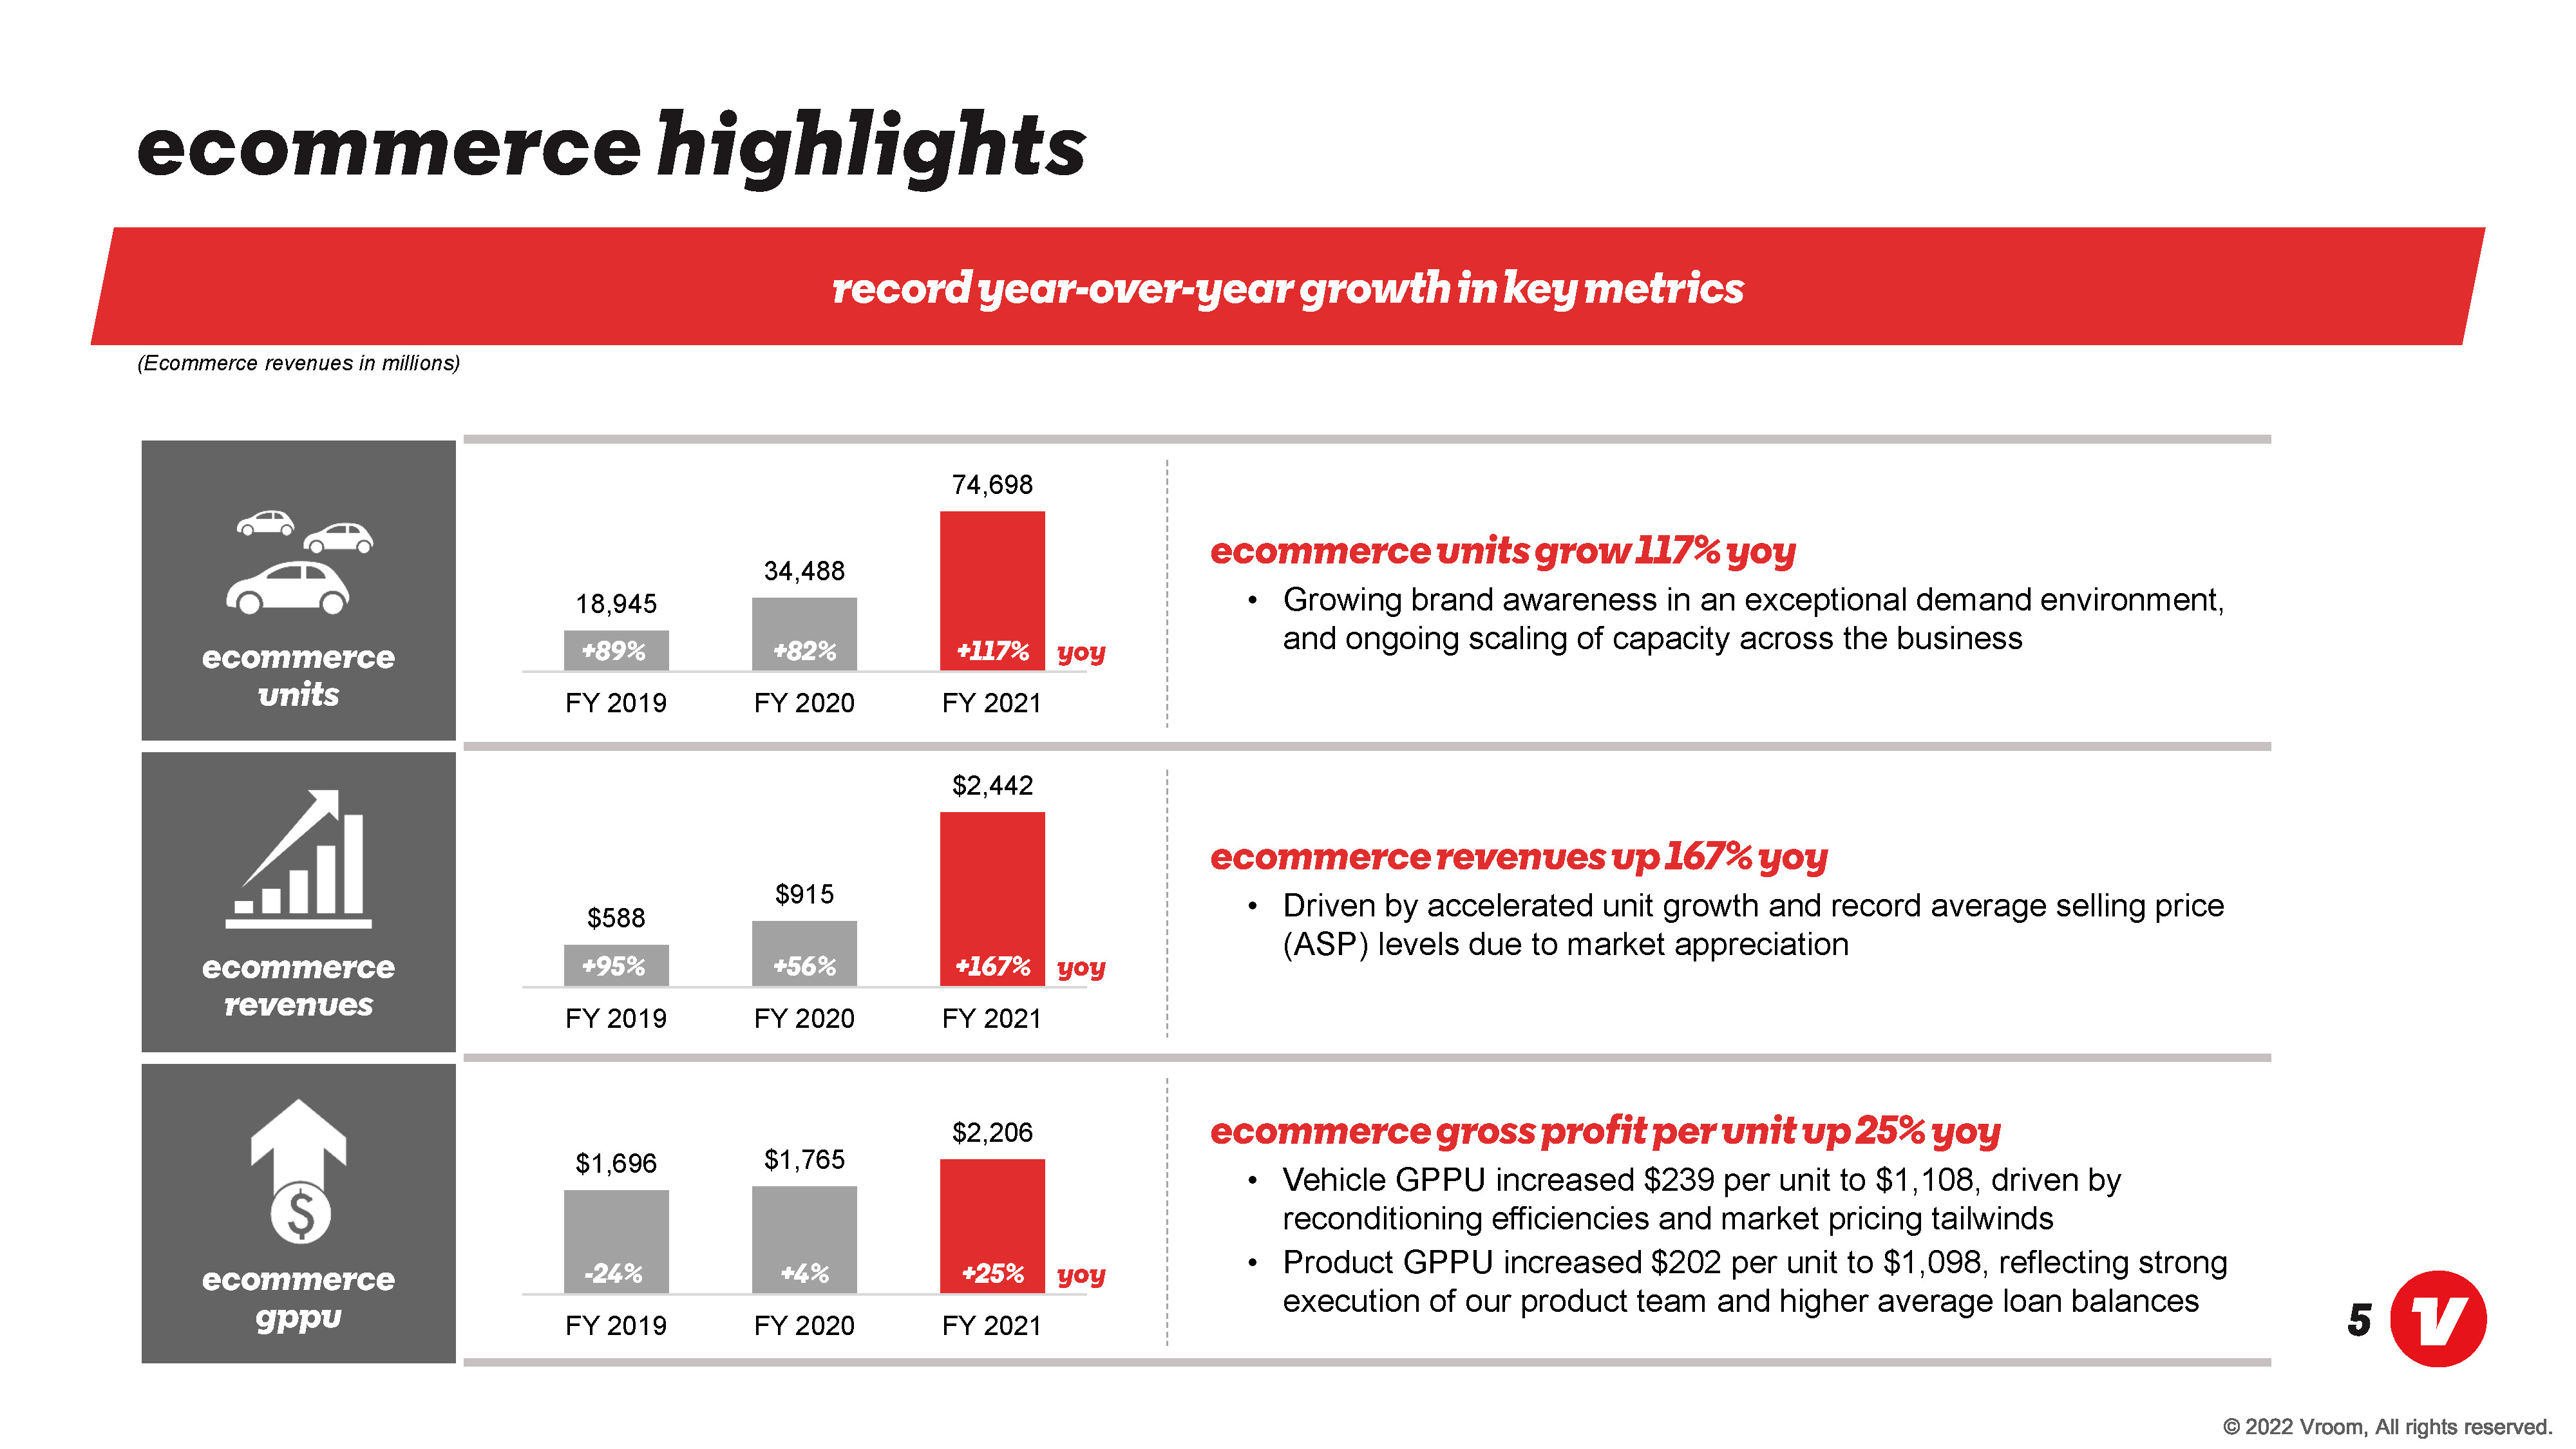
ecommerce highlights record year-over-year growth in key metrics (Ecommerce revenues in millions) ecommerce units ecommerce revenues ecommerce gppu 18,945 +89% FY 2019 34,488 +82% FY 2020 74,698 +117% FY 2021 yoy $588 +95% FY 2019 $915 +56% FY 2020 $2,442 +167% FY 2021 yoy $1,696 -24% FY 2019 $1,765 +4% FY 2020 $2,206 +25% FY 2021 yoy ecommerce units grow 117% yoy Growing brand awareness in an exceptional demand environment, and ongoing scaling of capacity across the business ecommerce revenues up 167% yoy Driven by accelerated unit growth and record average selling price (ASP) levels due to market appreciation ecommerce gross profit per units up 25% yoy Vehicle GPPU increased $239 per unit to $1,108, driven by reconditioning efficiencies and market pricing tailwinds Product GPPU increased $202 per unit to $1,098, reflecting strong execution of our product team and higher average loan balances
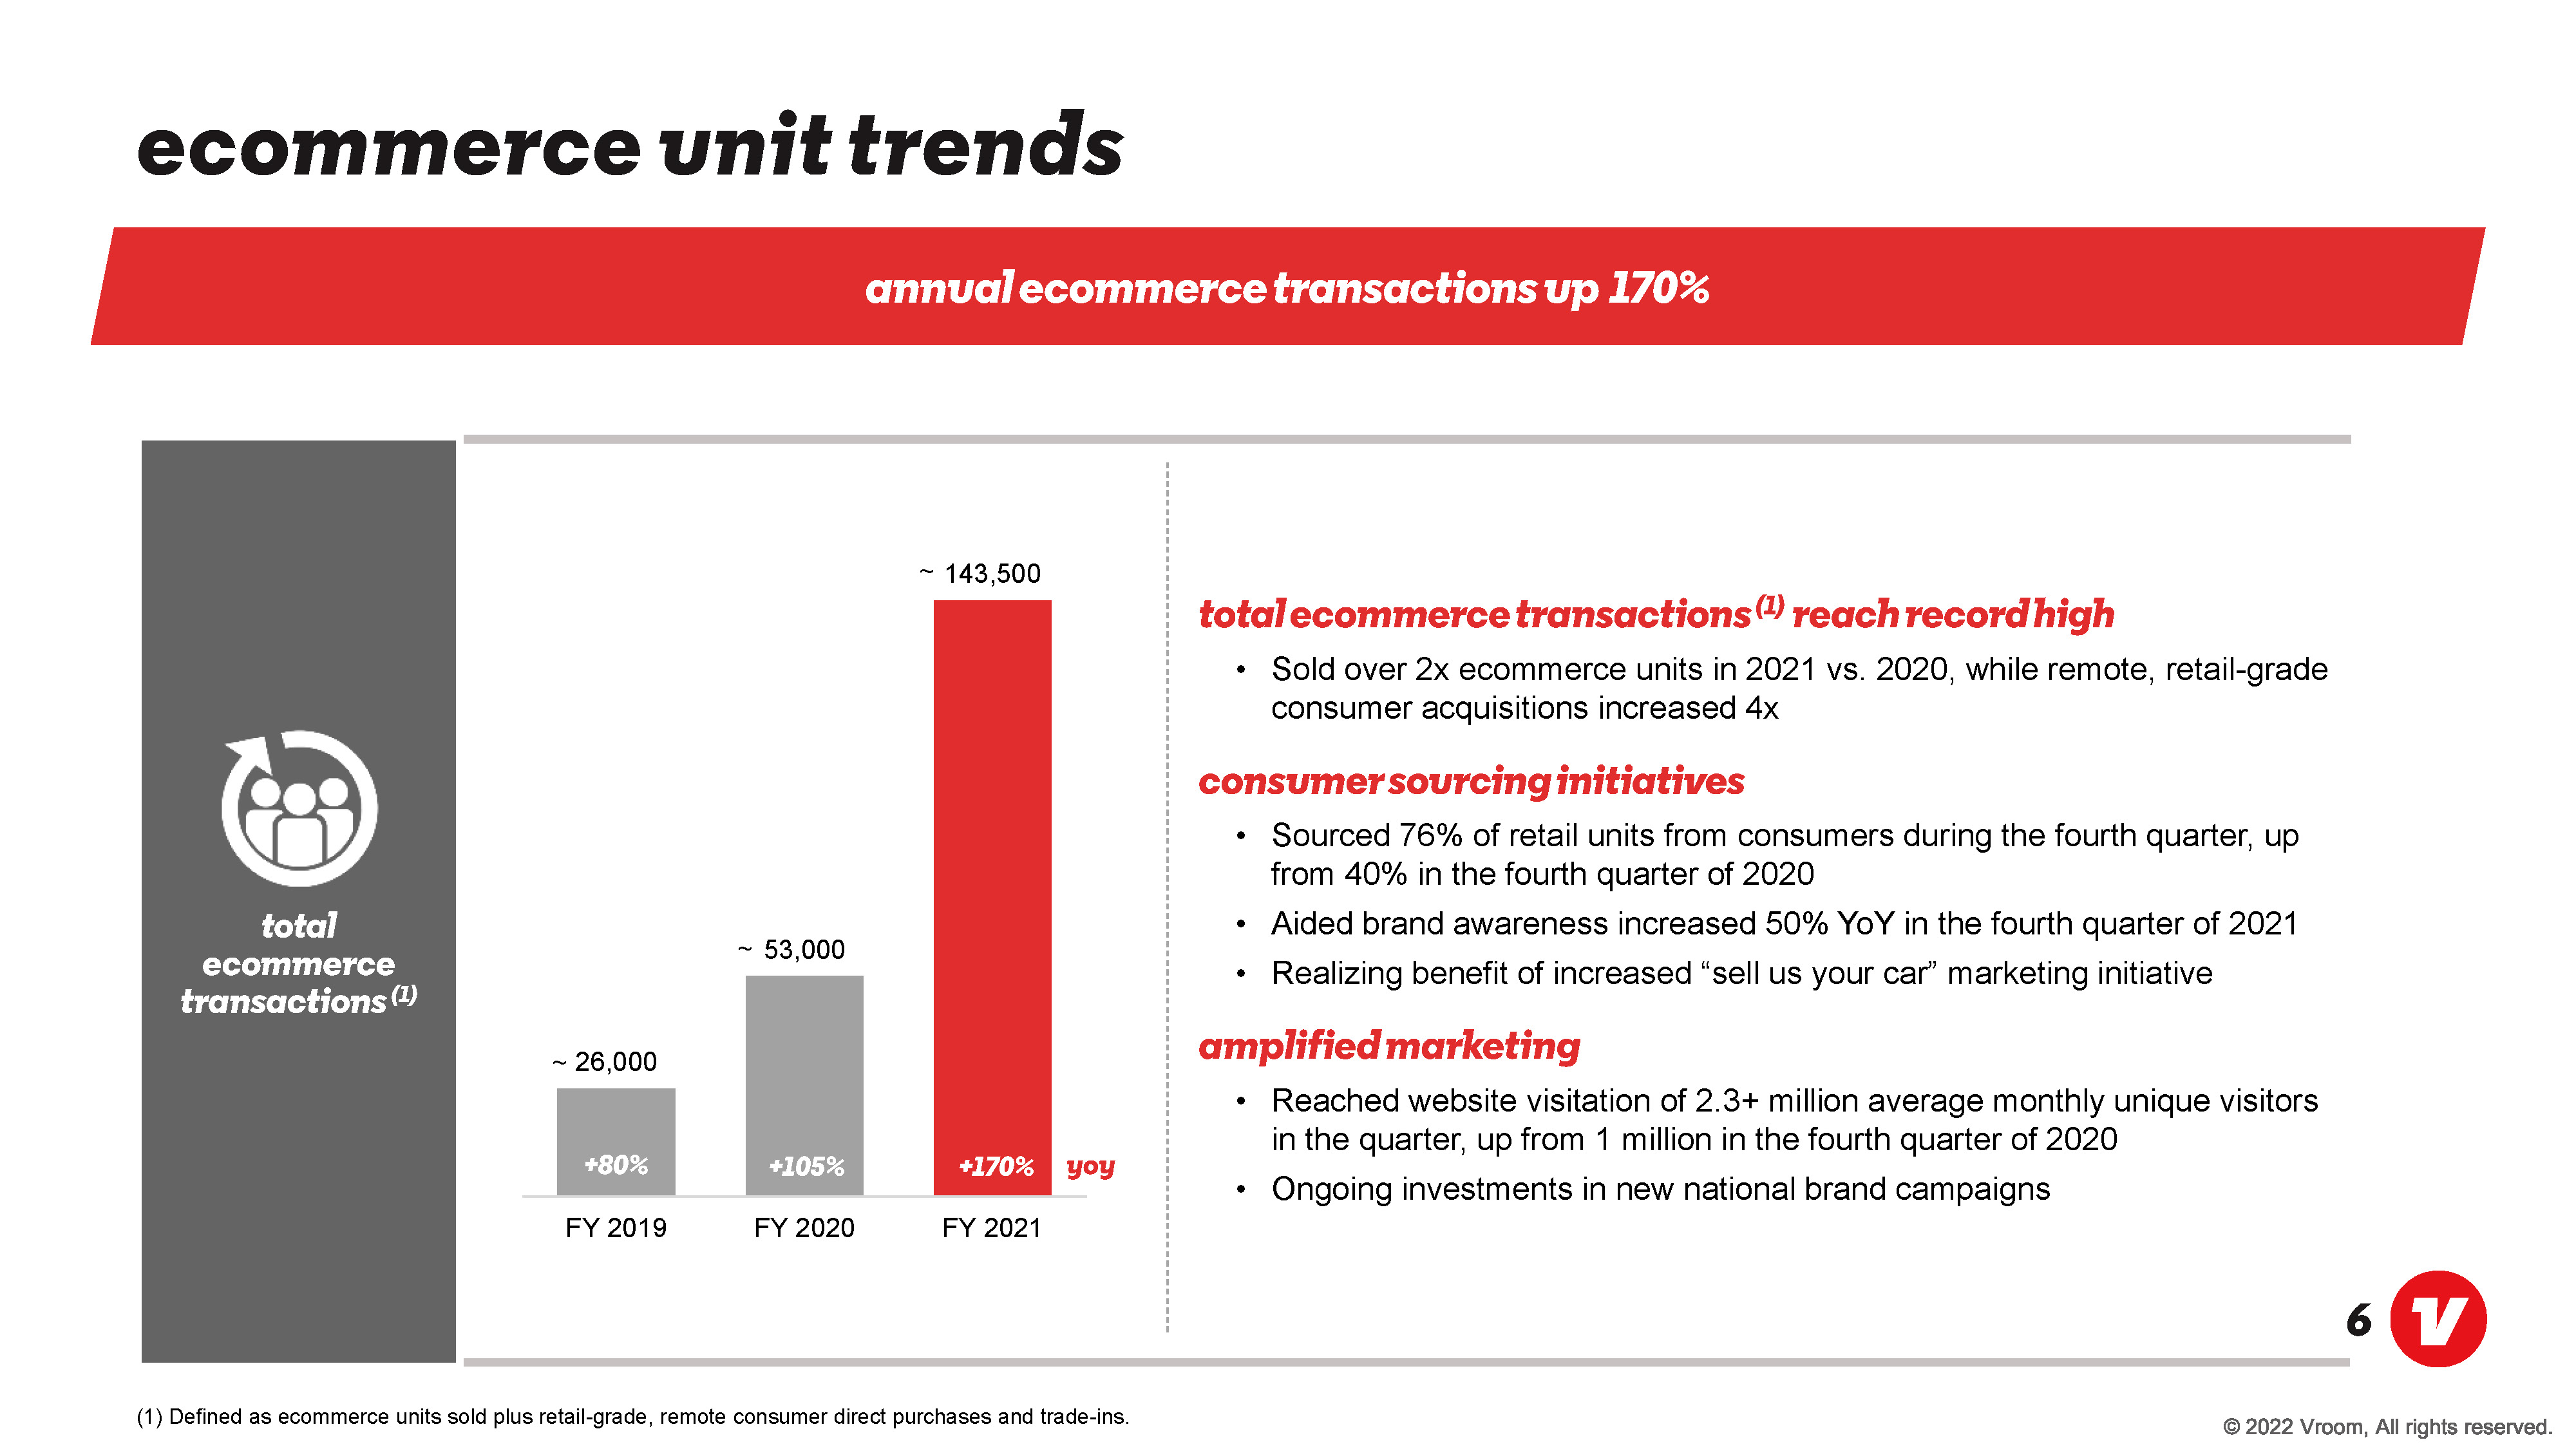
ecommerce unit trends annual ecommerce transactions up 170% total ecommerce transactions(1) ~ 26,000 +80% FY 2019 ~ 53,000 +105% FY 2020 ~ 143,500 +170% FY 2021 yoy total ecommerce transactions(1) reach record high Sold over 2x ecommerce units in 2021 vs. 2020, while remote, retail-grade consumer acquisitions increased 4x consumer sourcing initiatives Sourced 76% of retail units from consumers during the fourth quarter, up from 40% in the fourth quarter of 2020 Aided brand awareness increased 50% YoY in the fourth quarter of 2021 Realizing benefit of increased “sell us your car” marketing initiative amplified marketing Reached website visitation of 2.3+ million average monthly unique visitors in the quarter, up from 1 million in the fourth quarter of 2020 Ongoing investments in new national brand campaigns (1) Defined as ecommerce units sold plus retail-grade, remote consumer direct purchases and trade-ins.
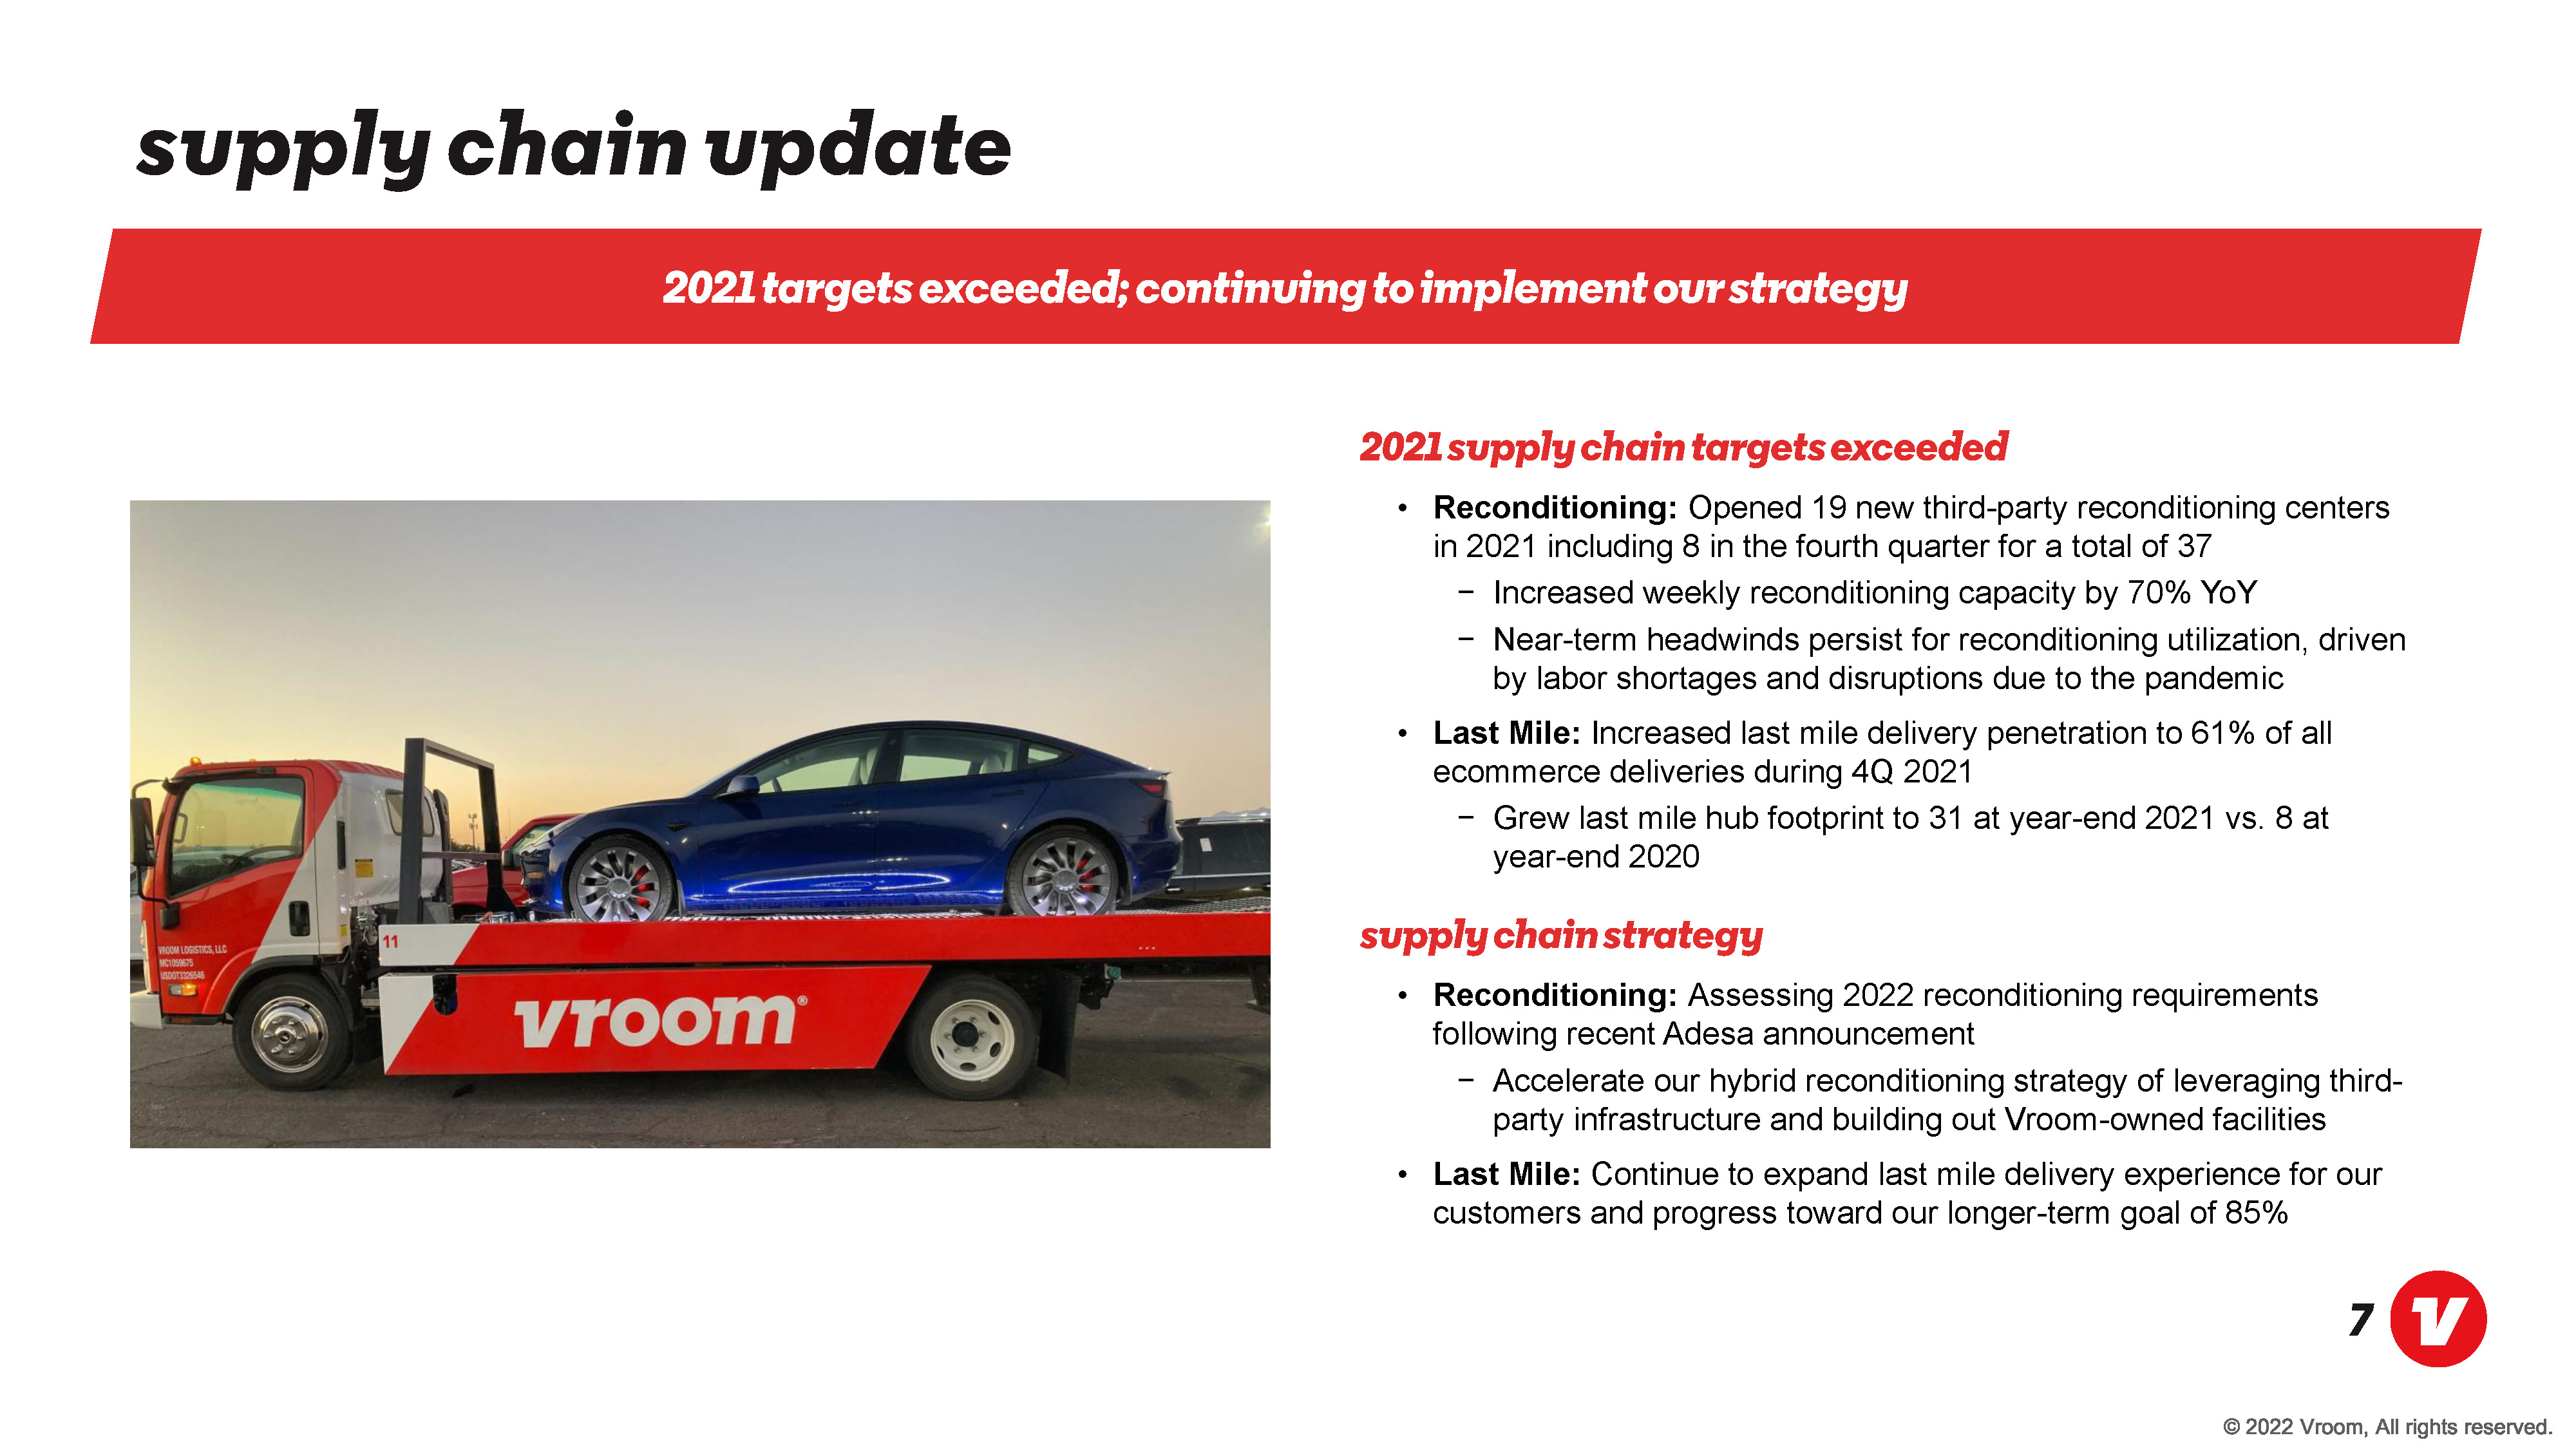
supply chain update 2021 targets exceeded; continuing to implement our strategy 2021 supply chain targets exceeded Reconditioning: Opened 19 new third-party reconditioning centers in 2021 including 8 in the fourth quarter for a total of 37 Increased weekly reconditioning capacity by 70% YoY Near-term headwinds persist for reconditioning utilization, driven by labor shortages and disruptions due to the pandemic Last Mile: Increased last mile delivery penetration to 61% of all ecommerce deliveries during 4Q 2021 Grew last mile hub footprint to 31 at year-end 2021 vs. 8 at year-end 2020 supply chain strategy Reconditioning: Assessing 2022 reconditioning requirements following recent Adesa announcement Accelerate our hybrid reconditioning strategy of leveraging thirdparty infrastructure and building out Vroom-owned facilities Last Mile: Continue to expand last mile delivery experience for our customers and progress toward our longer-term goal of 85%
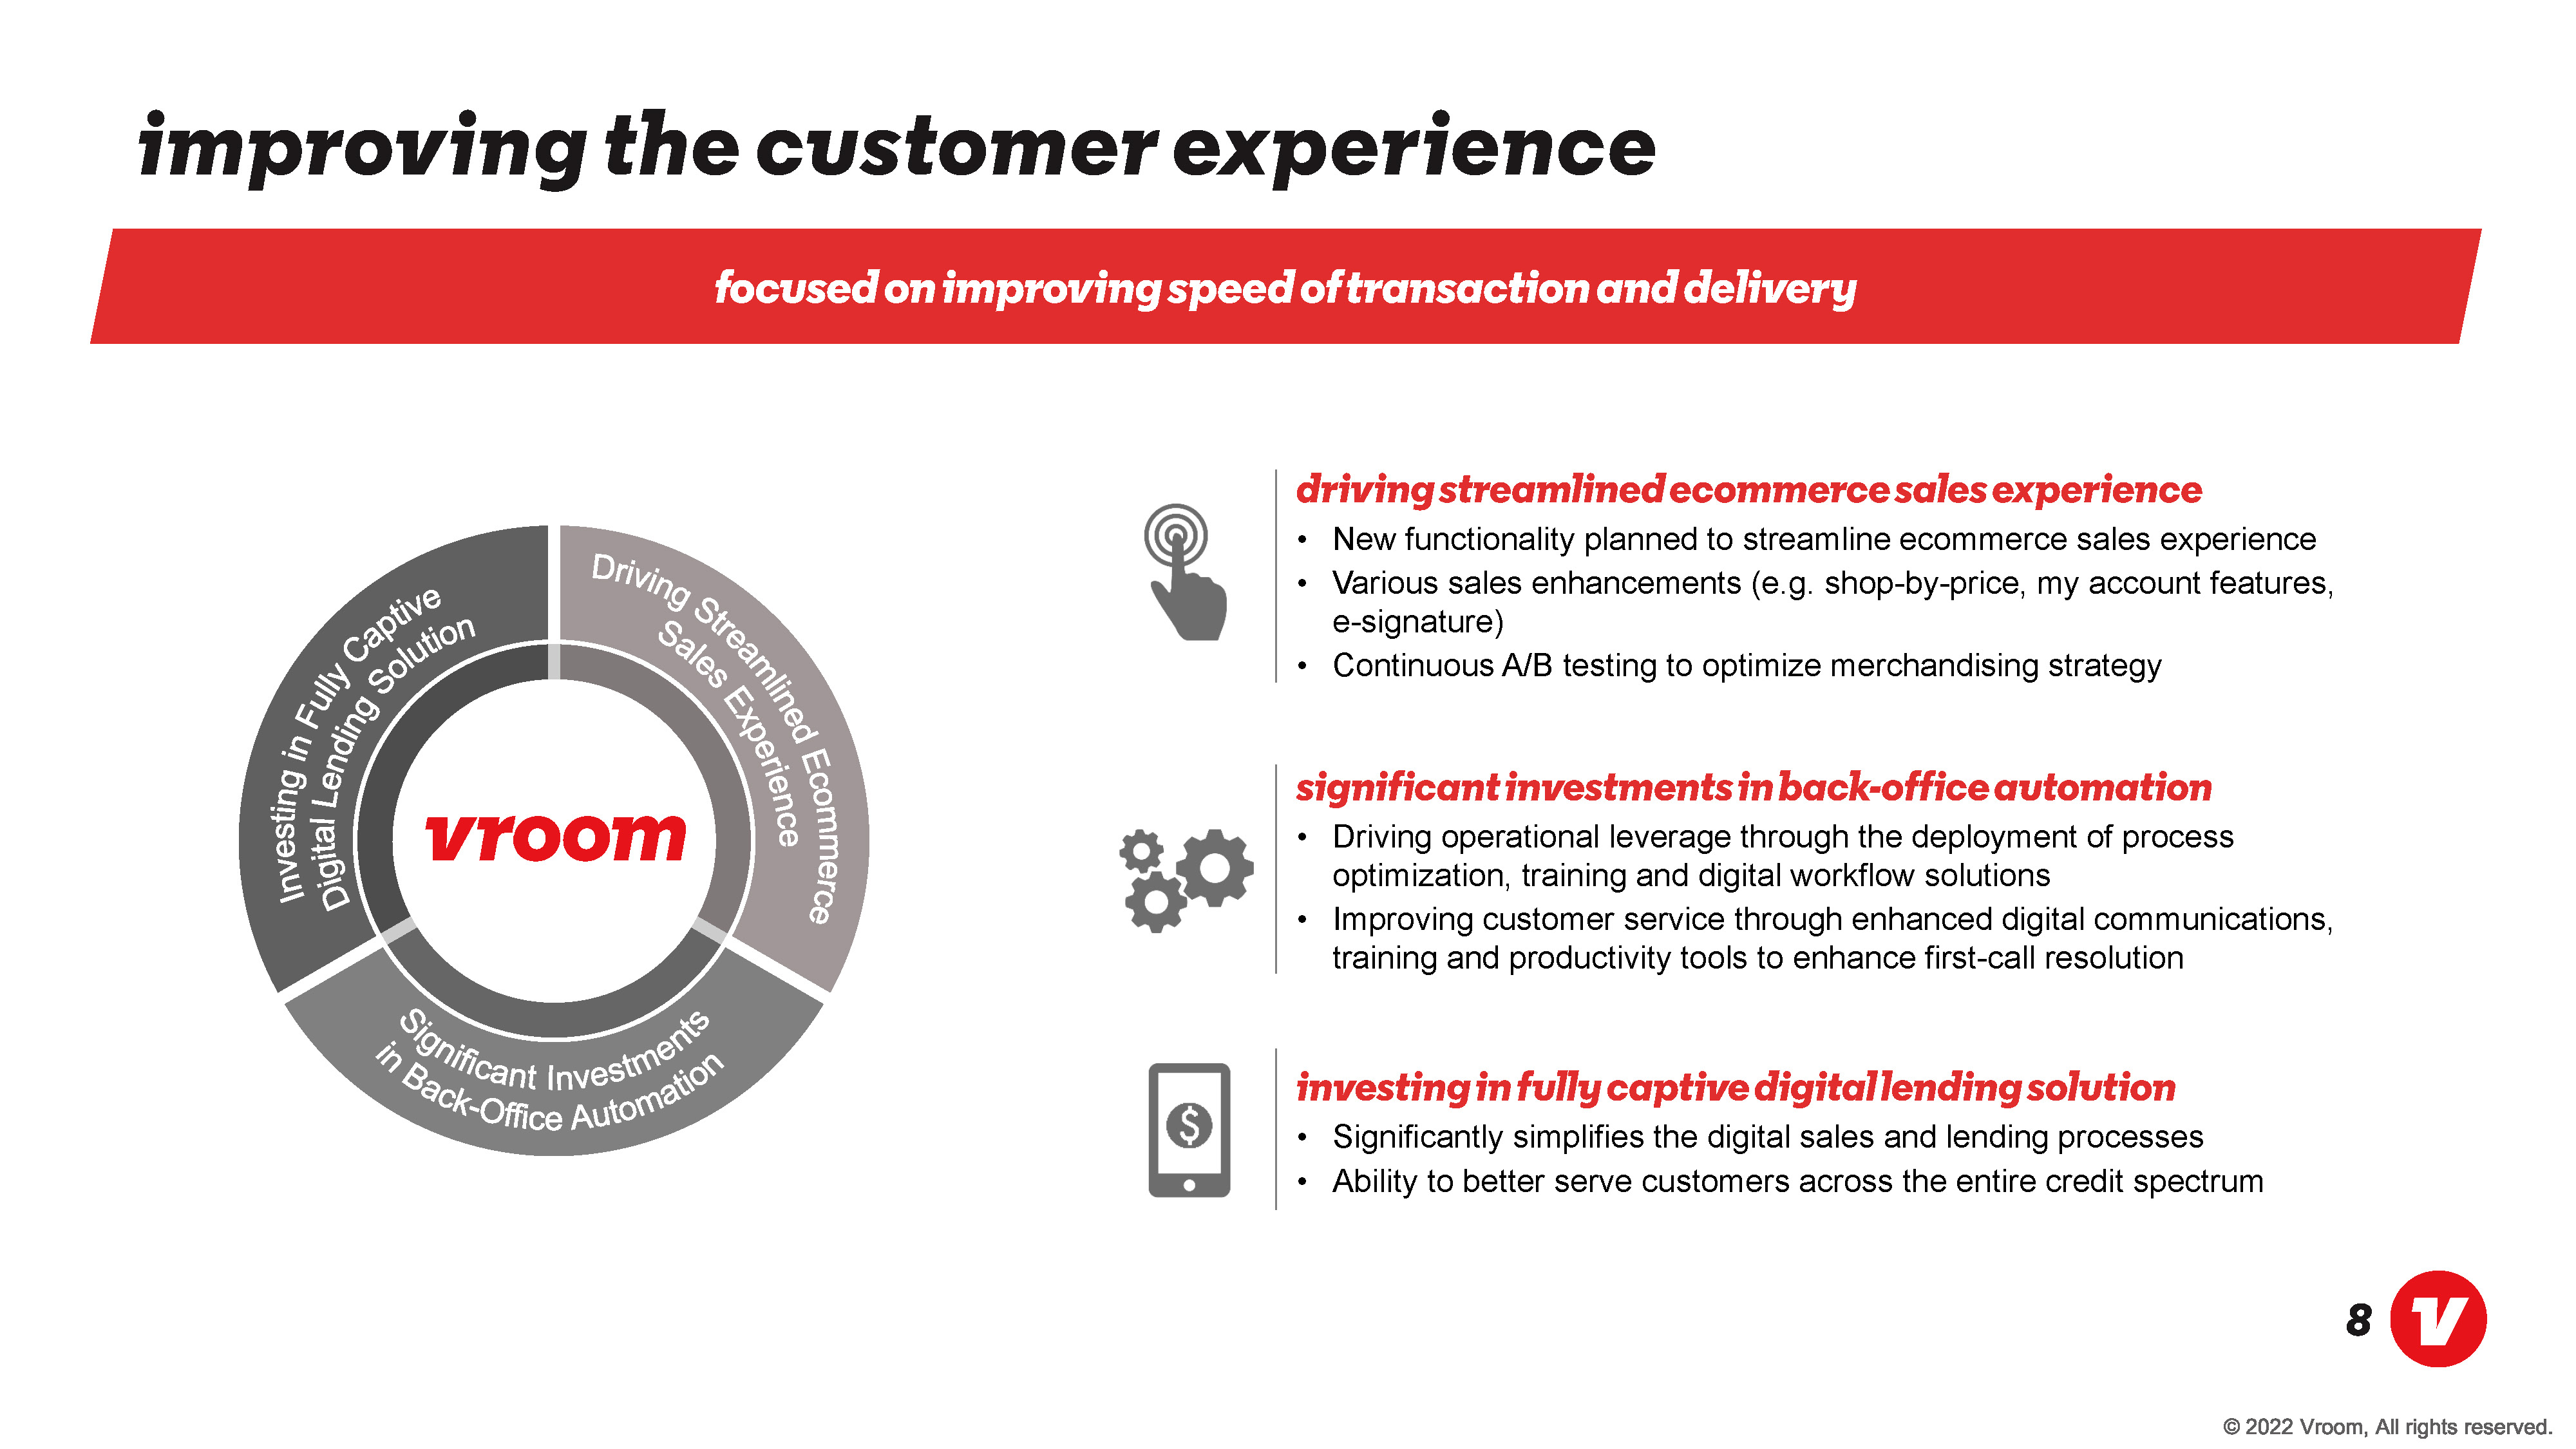
improving the customer experience focused on improving speed of transaction and delivery Driving Streamlined Ecommerce Sales Experience Significant Investments in Back-Office Automation Investing in Fully Captive Digital Lending Solution driving streamlined ecommerce sales experience New functionality planned to streamline ecommerce sales experience Various sales enhancements (e.g. shop-by-price, my account features, e-signature) Continuous A/B testing to optimize merchandising strategy significant investments in back-office automation Driving operational leverage through the deployment of process optimization, training and digital workflow solutions Improving customer service through enhanced digital communications, training and productivity tools to enhance first-call resolution investing in fully captive digital lending solution Significantly simplifies the digital sales and lending processes Ability to better serve customers across the entire credit spectrum
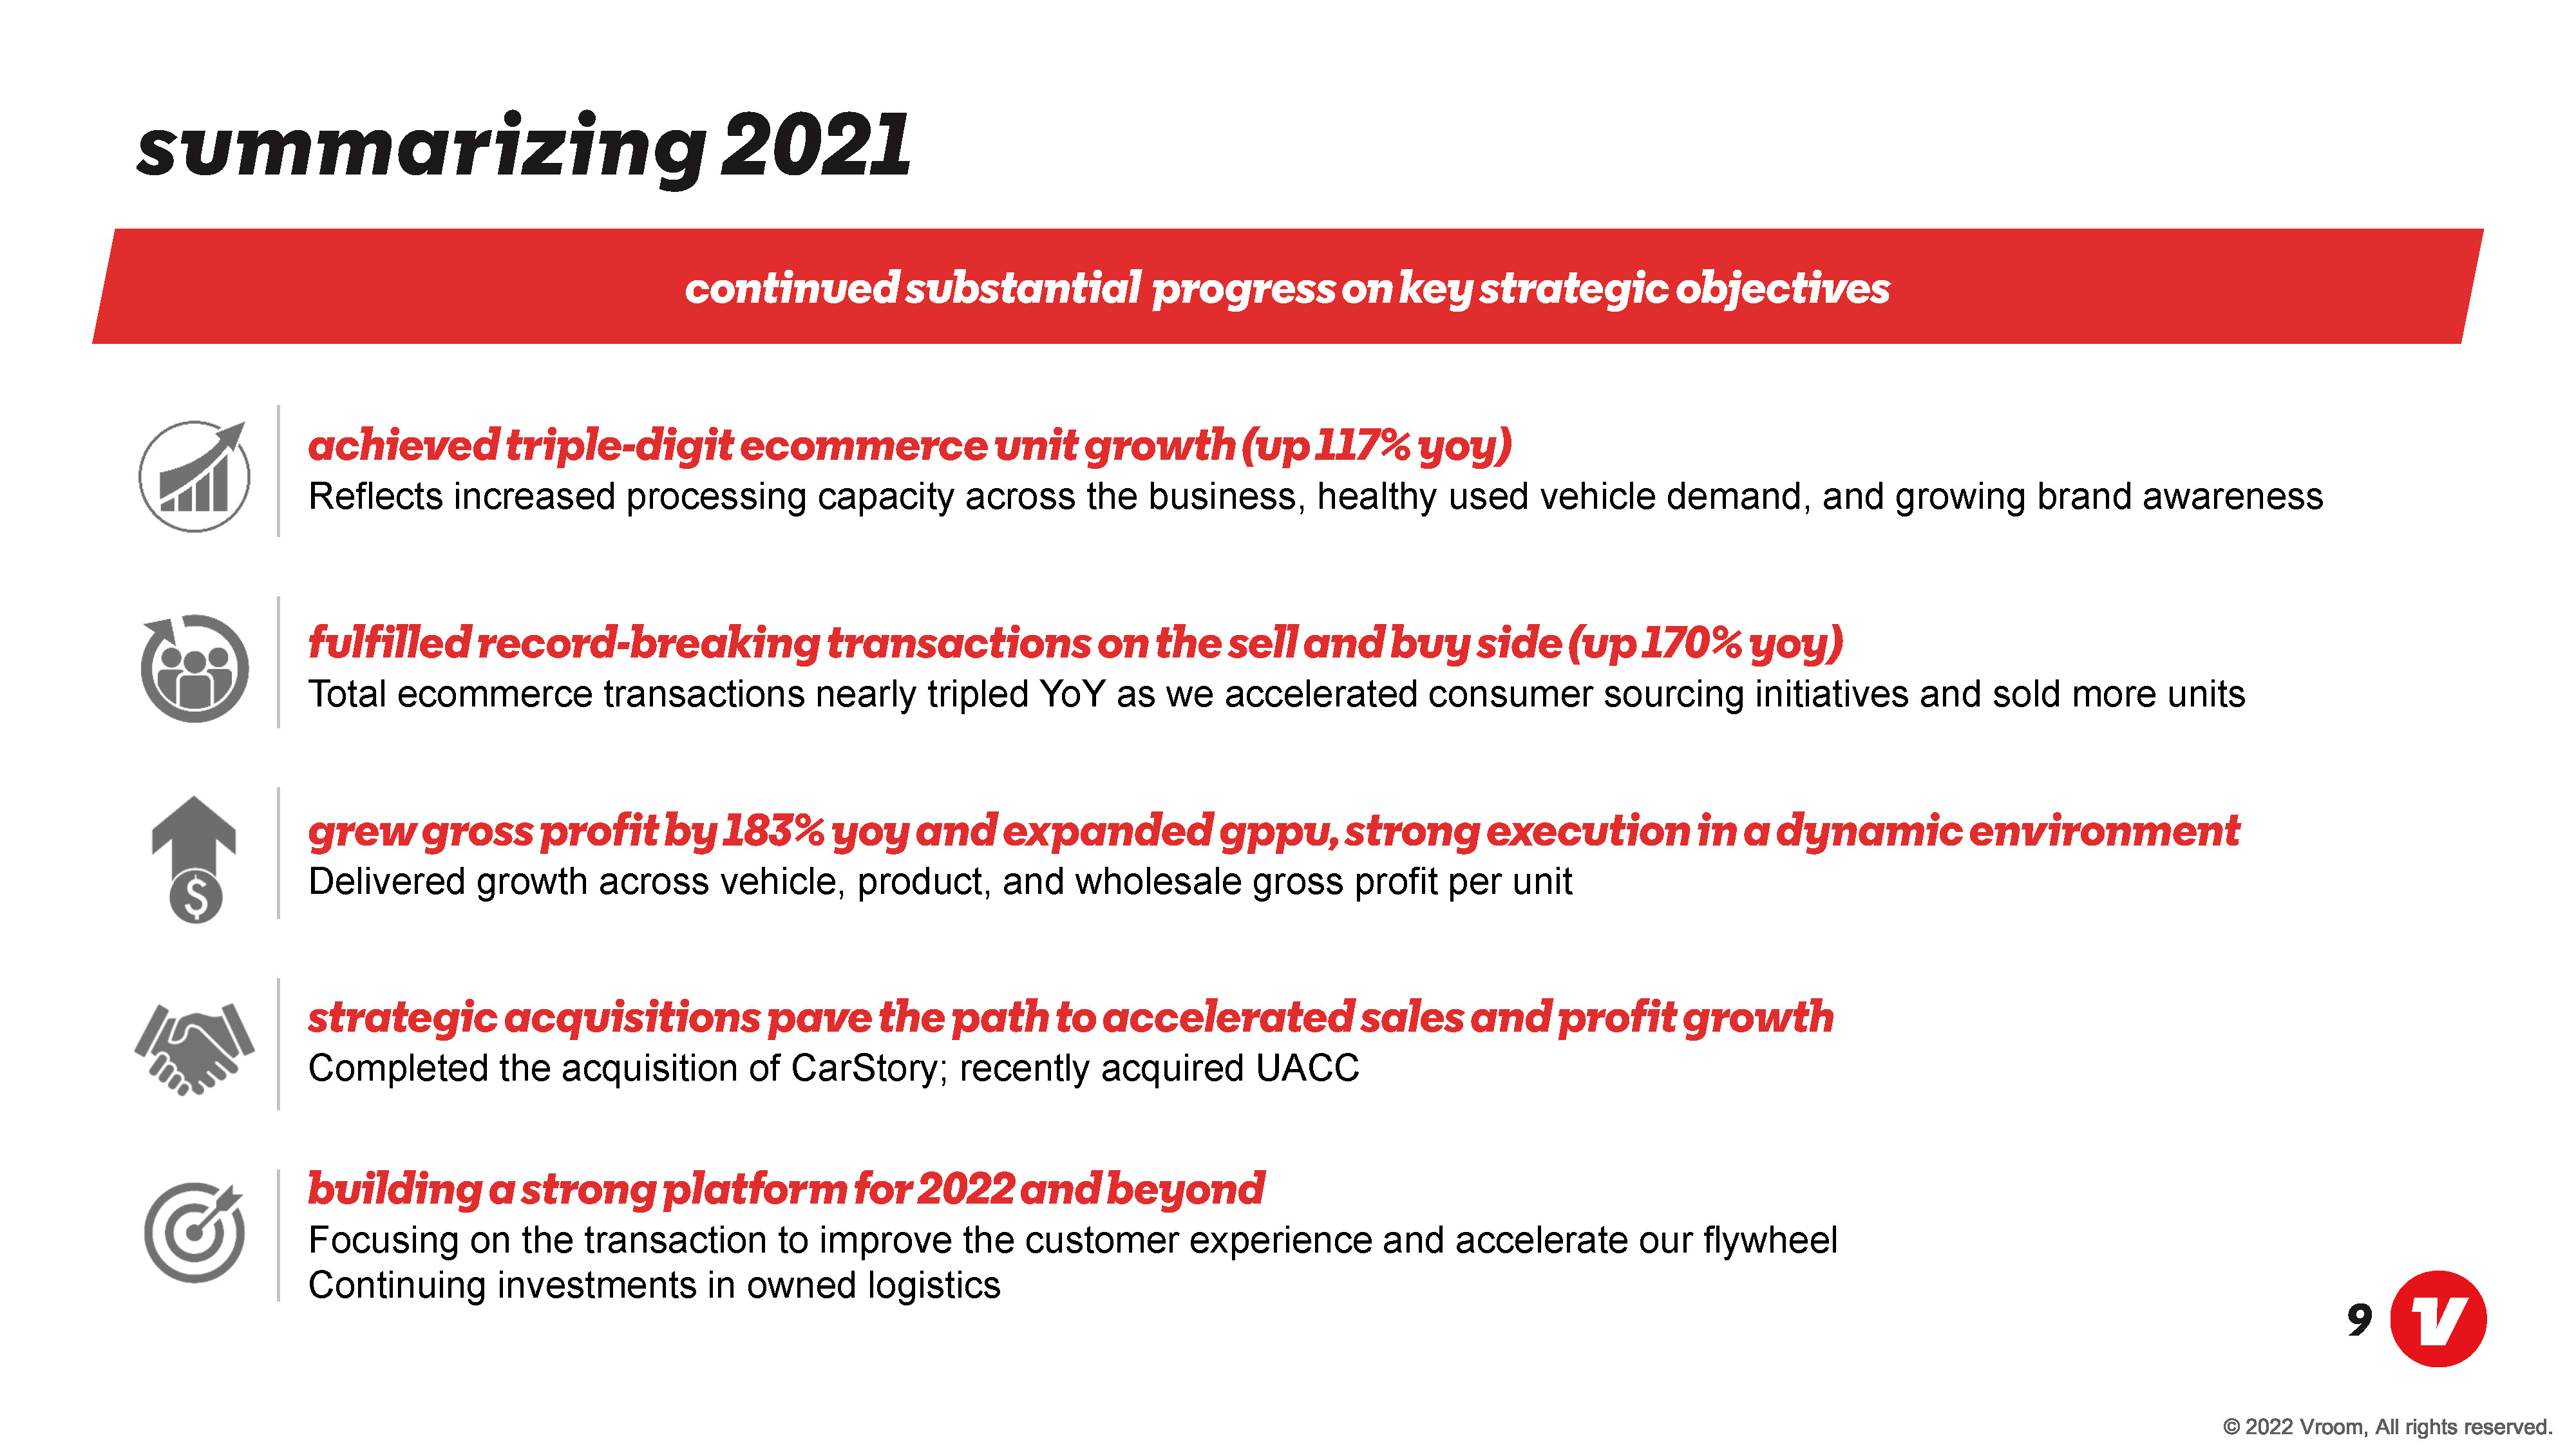
summarizing 2021 continued substantial progress on key strategic objectives achieved triple-digit ecommerce unit growth (up 117% yoy) Reflects increased processing capacity across the business, healthy used vehicle demand, and growing brand awareness fulfilled record-breaking transactions on the sell and buy side (up 170% yoy) Total ecommerce transactions nearly tripled YoY as we accelerated consumer sourcing initiatives and sold more units grew profit by 183% yoy and expended gppu, strong execution in a dynamic environment Delivered growth across vehicle, product, and wholesale gross profit per unit strategic acquisitions pave the path to accelerated sales and profit growth Completed the acquisition of CarStory; recently acquired UACC building a strong platform for 2022 and beyond Focusing on the transaction to improve the customer experience and accelerate our flywheel Continuing investments in owned logistics

Vroom Fourth-Quarter 2021 Financial Update February 2022
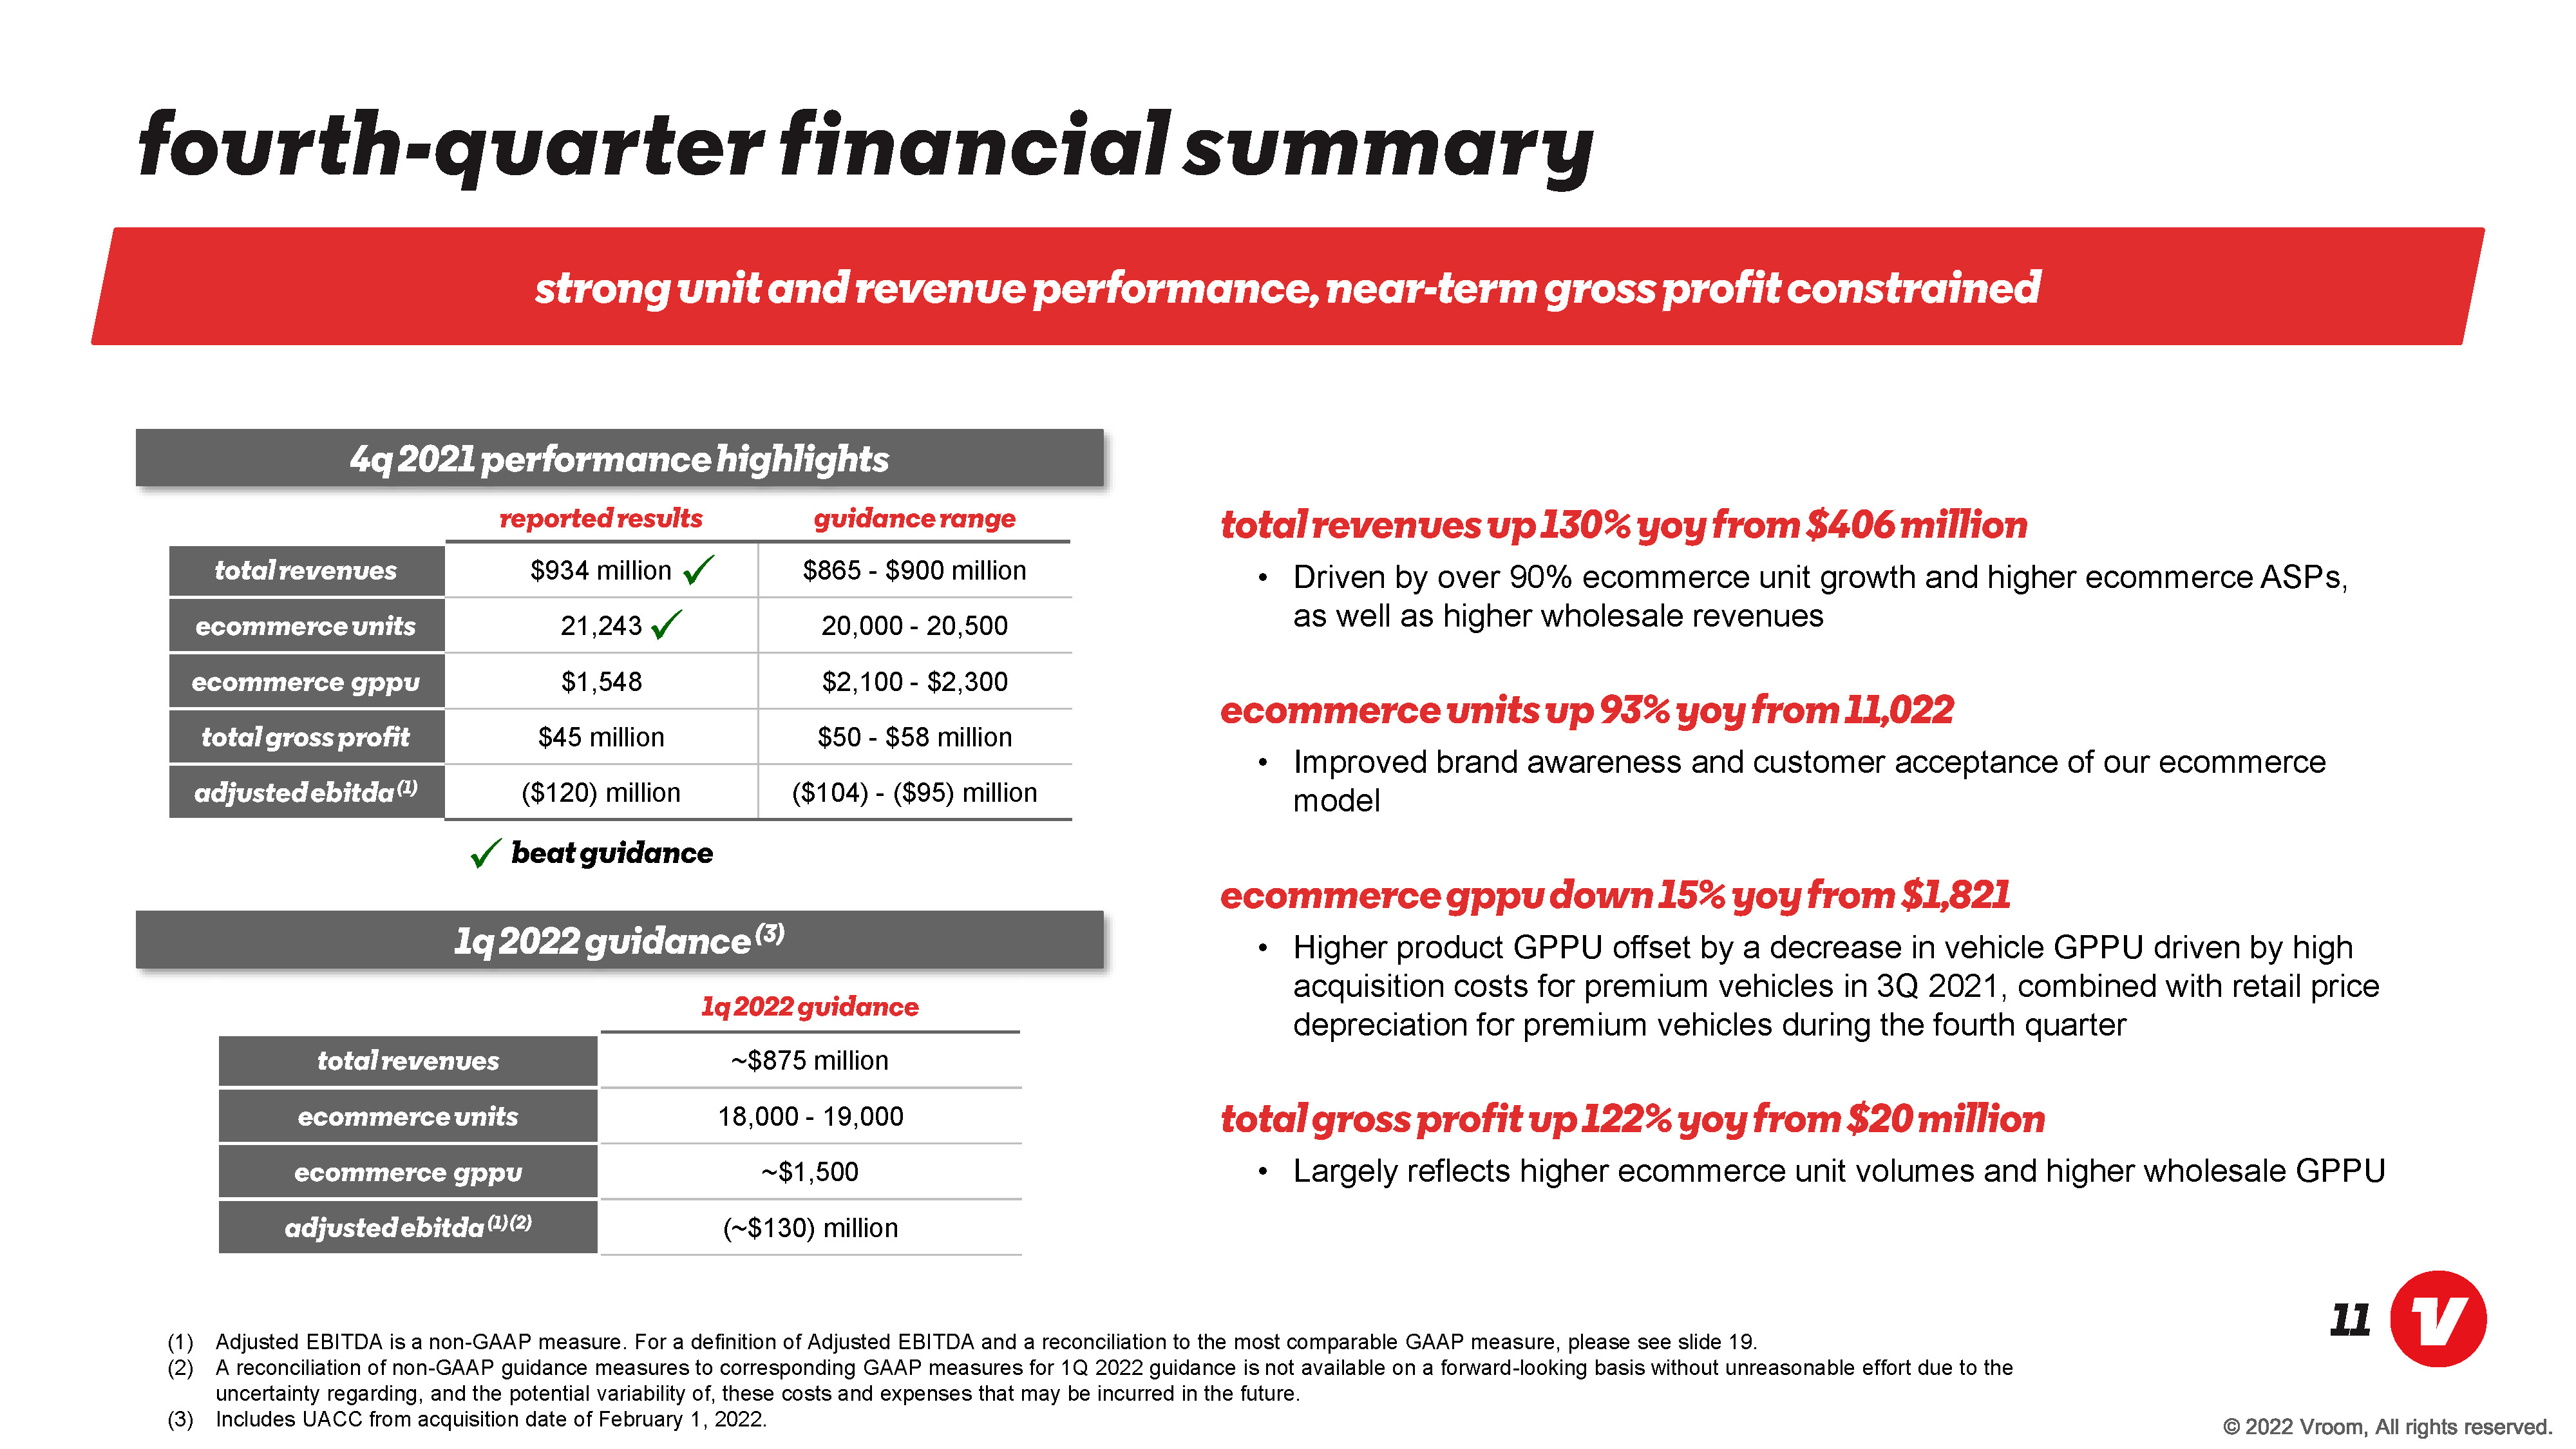
fourth quarter financial summary strong unit and revenue performance, near-term gross profit constrained 4q 2021 performance highlights total revenues ecommerce units ecommerce gppu total gross profit adjusted ebitda(1) reported results guidance range $934 million $865 - $900 million 21,243 20,000 - 20,500 $1,548 $2,100 - $2,300 $45 million $50 - $58 million ($120) million ($104) - ($95) million beat guidance 1q 2022 guidance(3) total revenues ecommerce units ecommerce gppu adjusted ebitda(1)(2) 1q 2022 guidance ~$875 million 18,000 - 19,000 ~$1,500 (~$130) million total revenues up 130% yoy from $406 million Driven by over 90% ecommerce unit growth and higher ecommerce ASPs, as well as higher wholesale revenues ecommerce units up 93% yoy from 11,022 ecommerce gppu down 15% yoy from $1821 Higher product GPPU offset by a decrease in vehicle GPPU driven by high acquisition costs for premium vehicles in 3Q 2021, combined with retail price depreciation for premium vehicles during the fourth quarter total gross profit up 122% yoy from $20 million Largely reflects higher ecommerce unit volumes and higher wholesale GPPU (1) Adjusted EBITDA is a non-GAAP measure. For a definition of Adjusted EBITDA and a reconciliation to the most comparable GAAP measure, please see slide 19. (2) A reconciliation of non-GAAP guidance measures to corresponding GAAP measures for 1Q 2022 guidance is not available on a forward-looking basis without unreasonable effort due to the uncertainty regarding, and the potential variability of, these costs and expenses that may be incurred in the future. (3) Includes UACC from acquisition date of February 1, 2022.
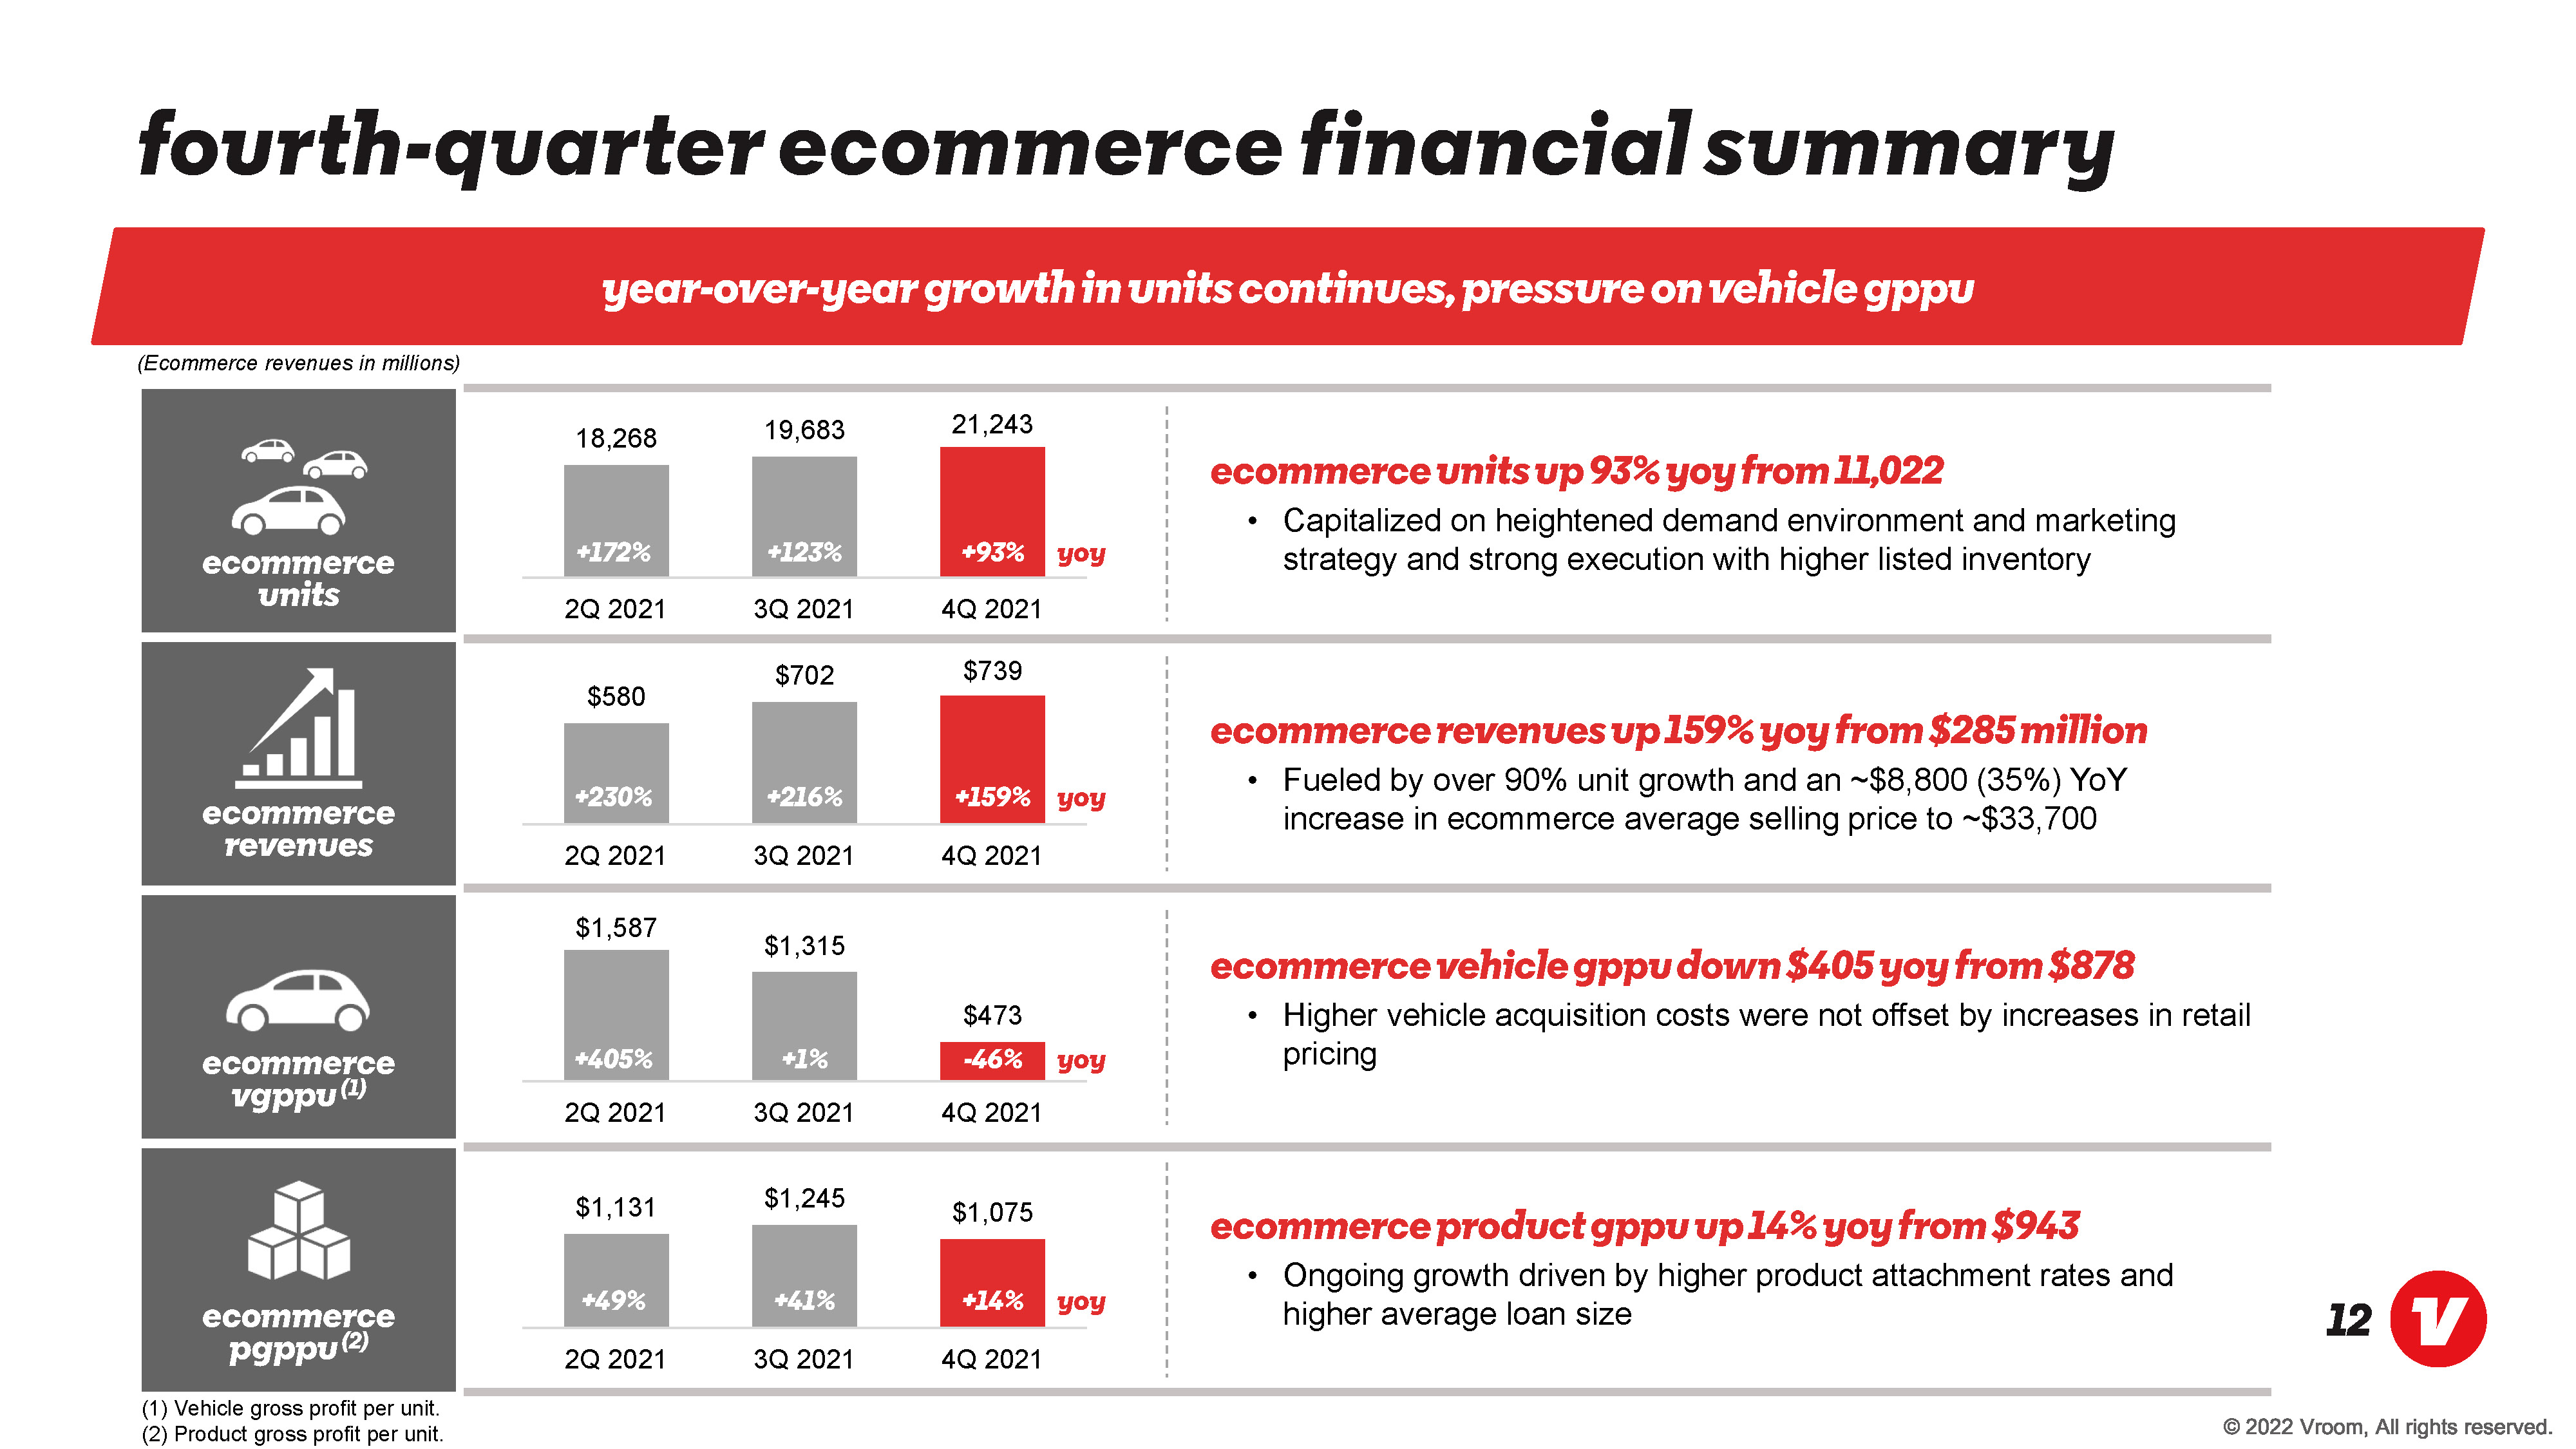
fourth quarter ecommerce financial summary year-over-year growth in units continues, pressure on vehicle gppu (Ecommerce revenues in millions) ecommerce units 18,268 +172% 2Q 2021 19,683 +123% 3Q 2021 21,243 + 93% 4Q 2021 yoy $580 +230% 2Q 2021 $702 +216% 3Q 2021 $739 +159% 4Q 2021 yoy $1,587 +405% 2Q 2021 $1,315 +1% 3Q 2021 $473 -46% 4Q 2021 yoy $1,131 +49% 2Q 2021 $1,245 +41% 3Q 2021 $1,075 +14% 4Q 2021 yoy ecommerce units up 93% yoy from 11,022 Capitalized on heightened demand environment and marketing strategy and strong execution with higher listed inventory ecommerce revenues up 159% yoy from $285 million Fueled by over 90% unit growth and an ~$8,800 (35%) YoY increase in ecommerce average selling price to ~$33,700 ecommerce vehicle gppu down $405 yoy from $878 Higher vehicle acquisition costs were not offset by increases in retail pricing Ongoing growth driven by higher product attachment rates and higher average loan size (1) Vehicle gross profit per unit. (2) Product gross profit per unit.
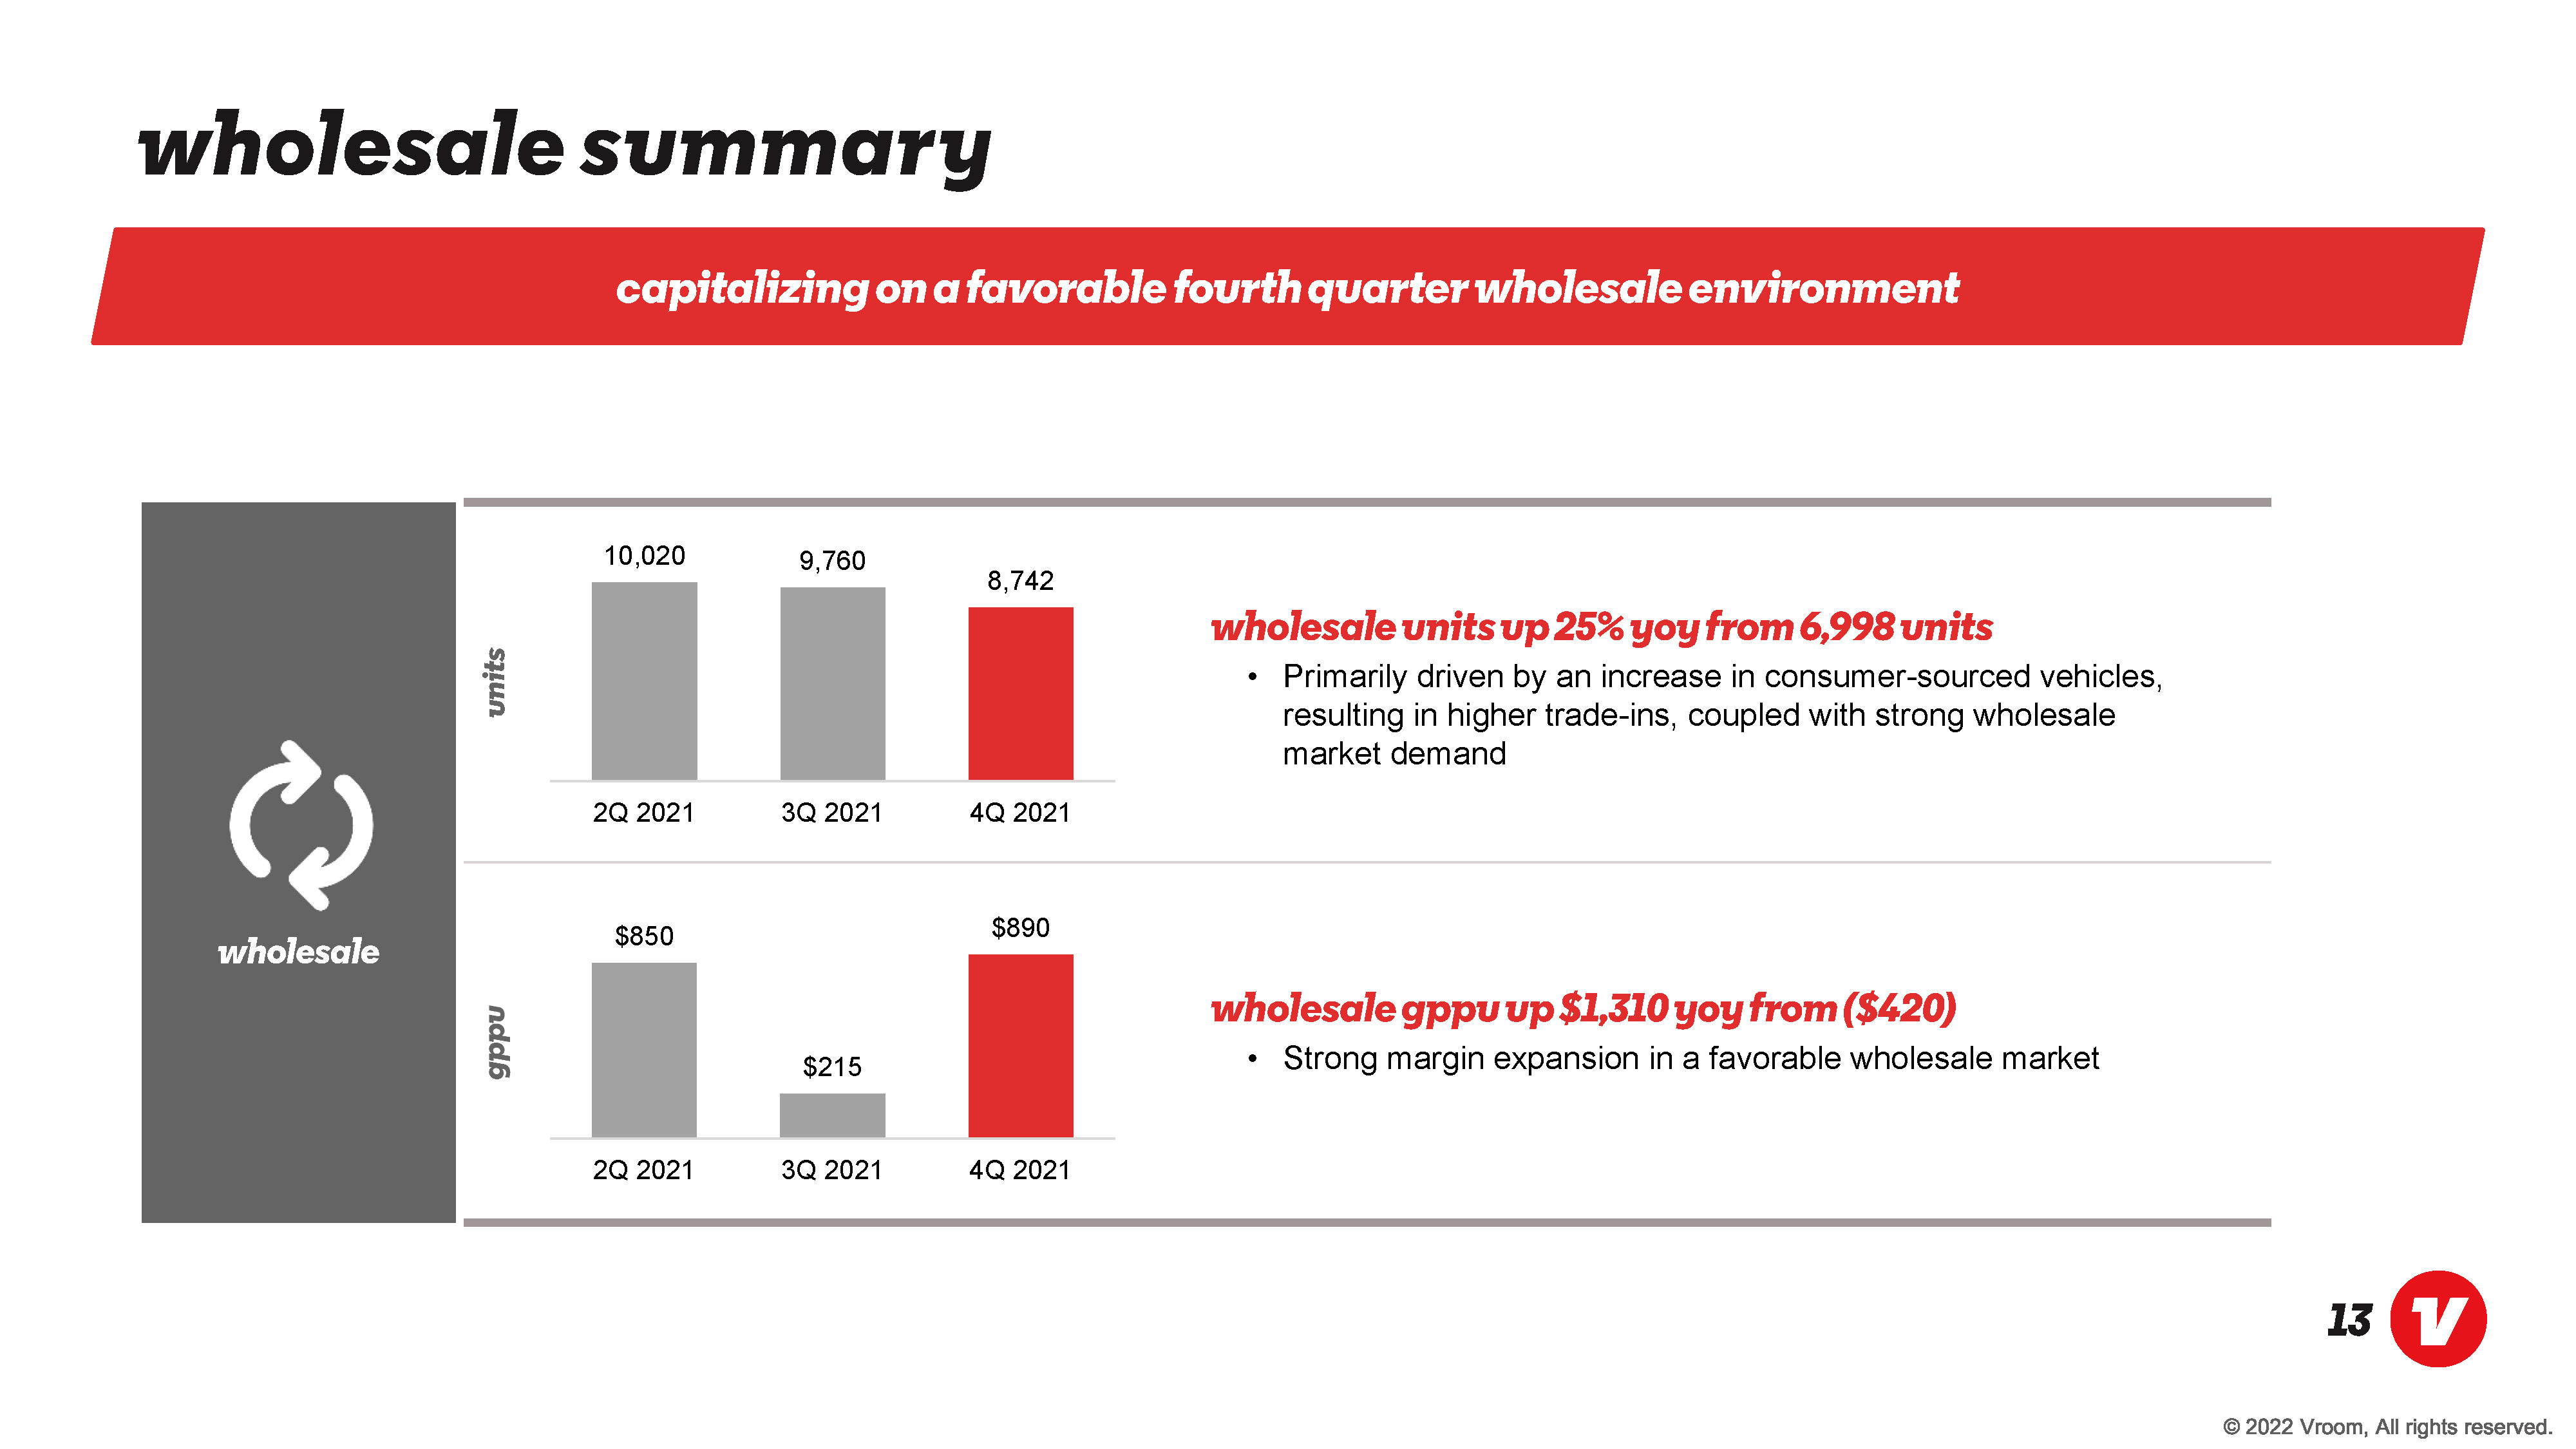
wholesale summary capitalizing on a favorable fourth quarter wholesale environment wholesale units 10,020 2Q 2021 9,760 3Q 2021 8,742 4Q 2021 wholesale units up by 25% yoy from 6,998 units Primarily driven by an increase in consumer-sourced vehicles, resulting in higher trade-ins, coupled with strong wholesale market demand gppu $850 2Q 2021 $215 3Q 2021 $890 4Q 2021 wholesale gppu up $1,310 yoy from ($420) Strong margin expansion in a favorable wholesale market
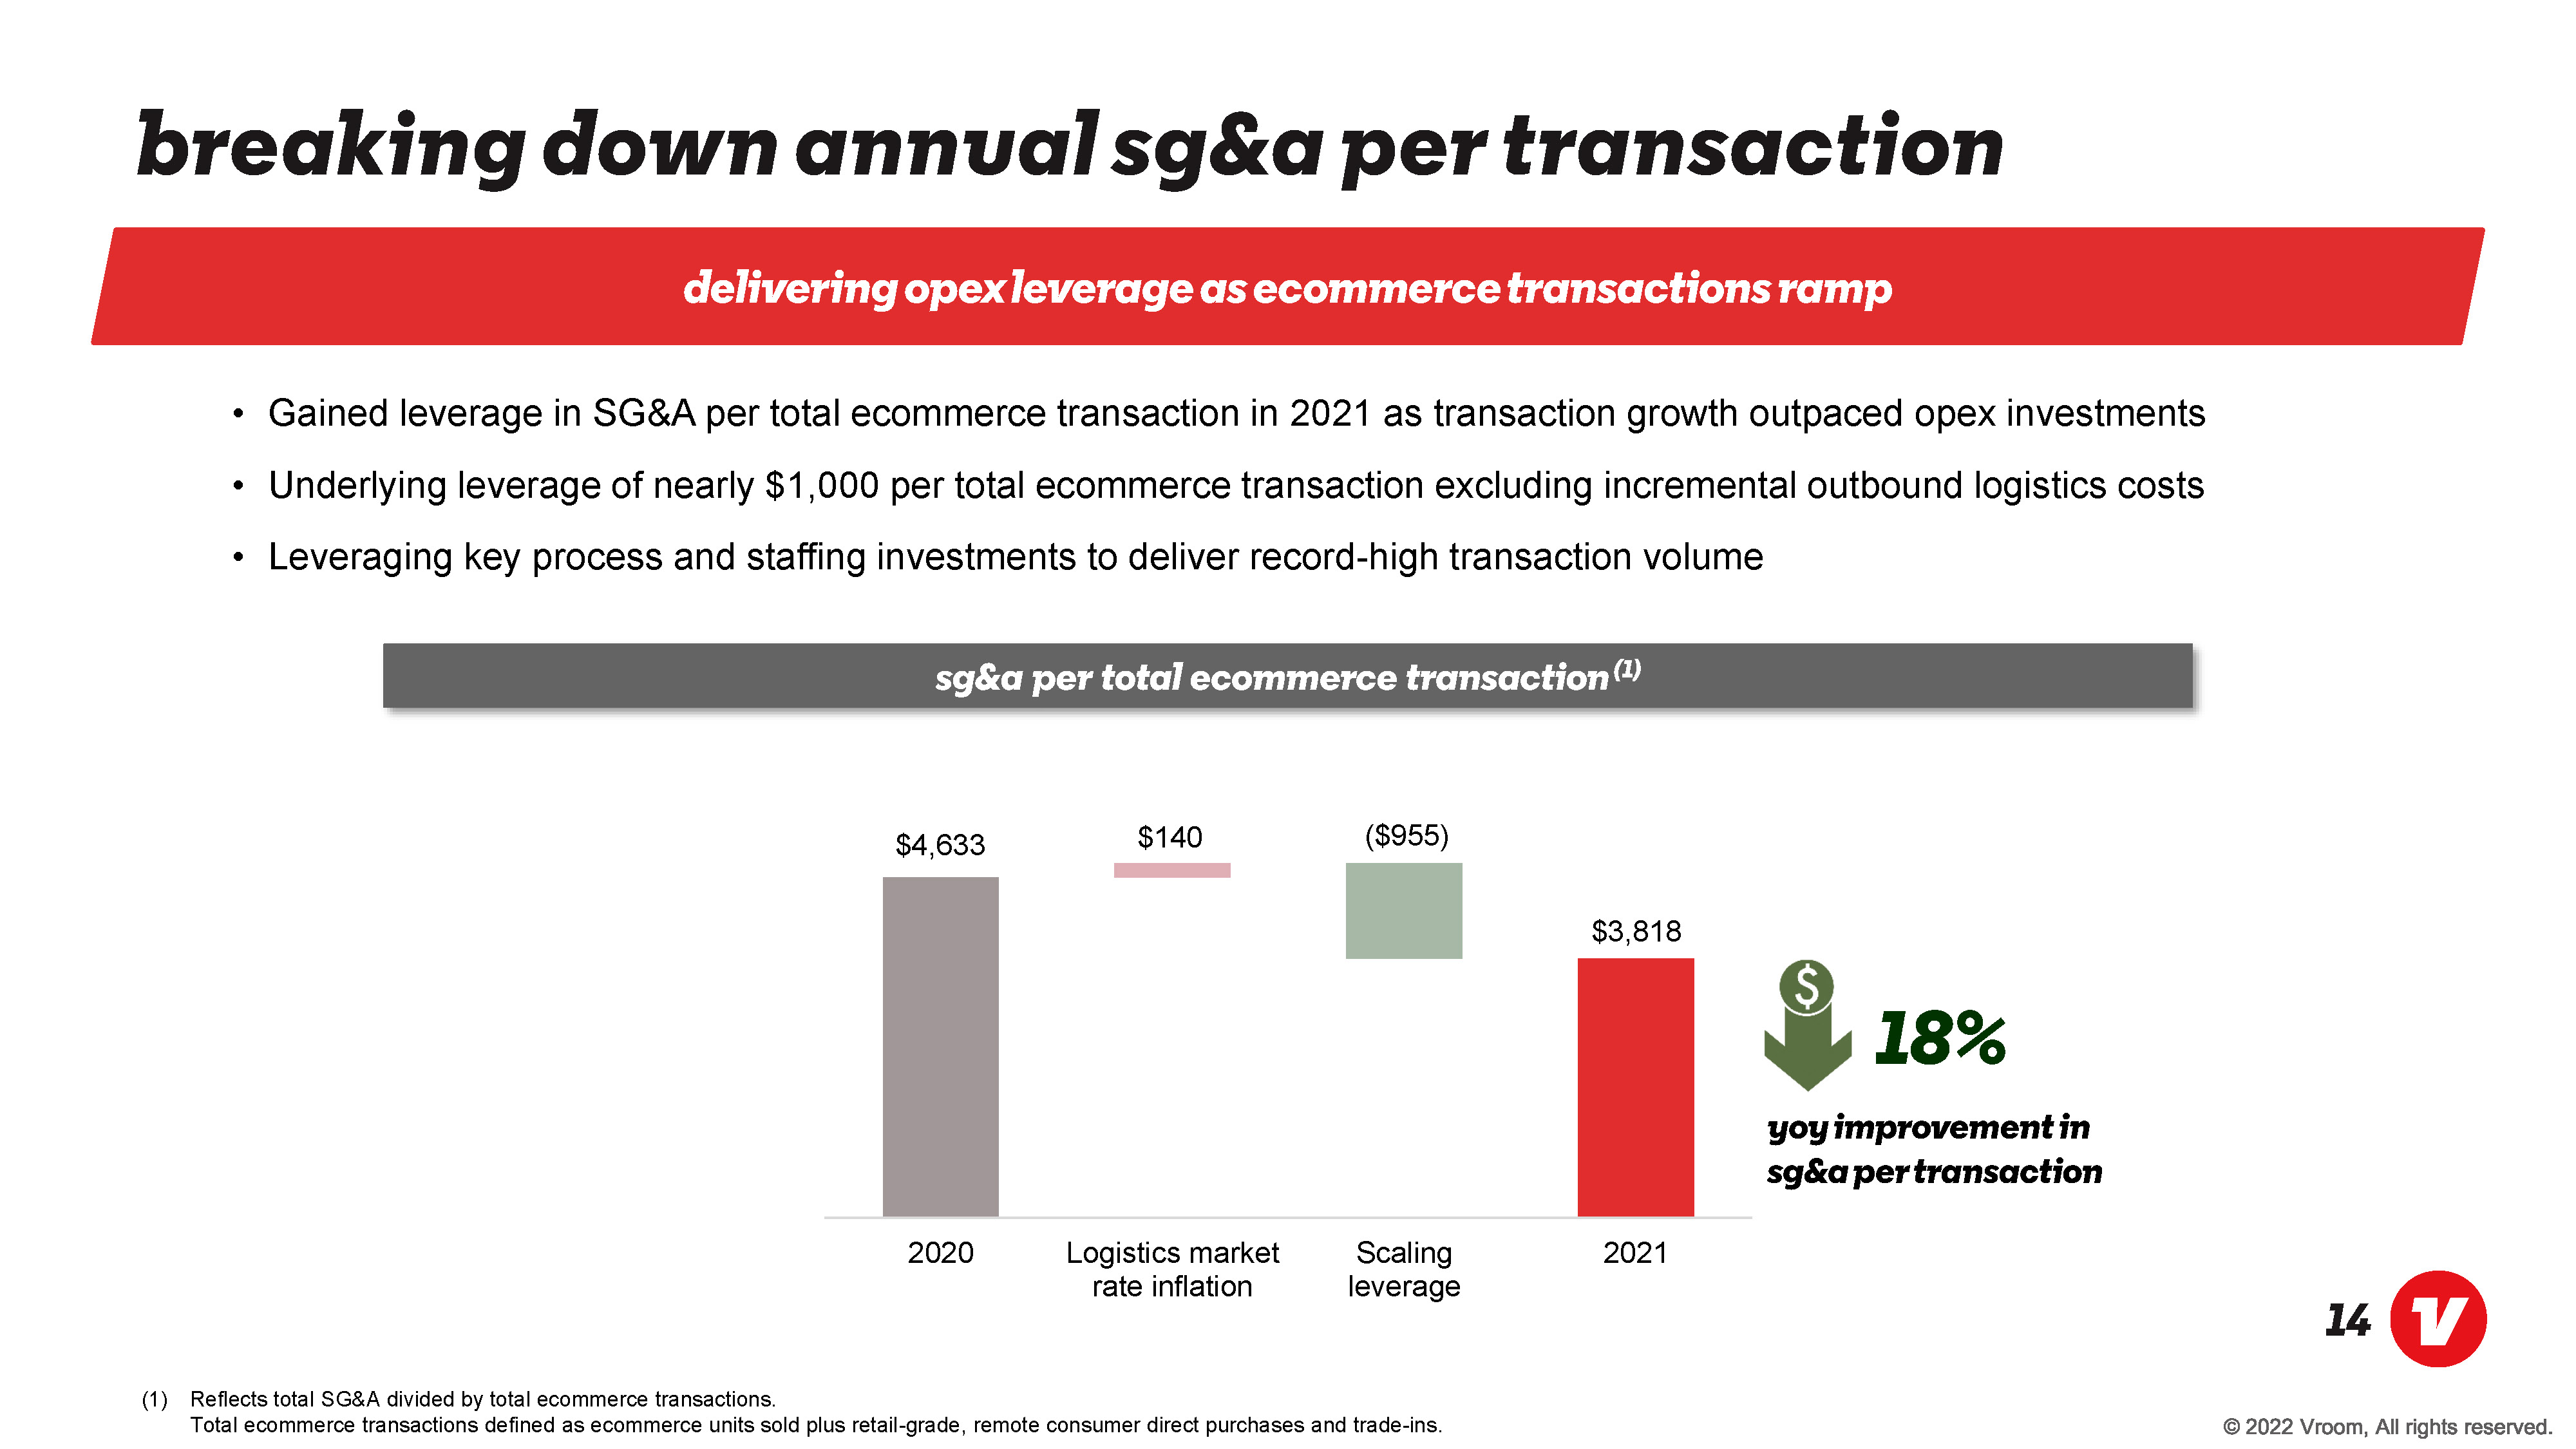
breaking down annual sg&a per transaction delivering opex leverage as ecommerce transactions ramp Gained leverage in SG&A per total ecommerce transaction in 2021 as transaction growth outpaced opex investments Underlying leverage of nearly $1,000 per total ecommerce transaction excluding incremental outbound logistics costs Leveraging key process and staffing investments to deliver record-high transaction volume sg&a per total ecommerce transaction(1) $4,633 202 $140 Logistics market rate inflation ($955) Scaling leverage $3,818 2021 18% yoy improvement in sg&a transaction (1) Reflects total SG&A divided by total ecommerce transactions. Total ecommerce transactions defined as ecommerce units sold plus retail-grade, remote consumer direct purchases and trade-ins.
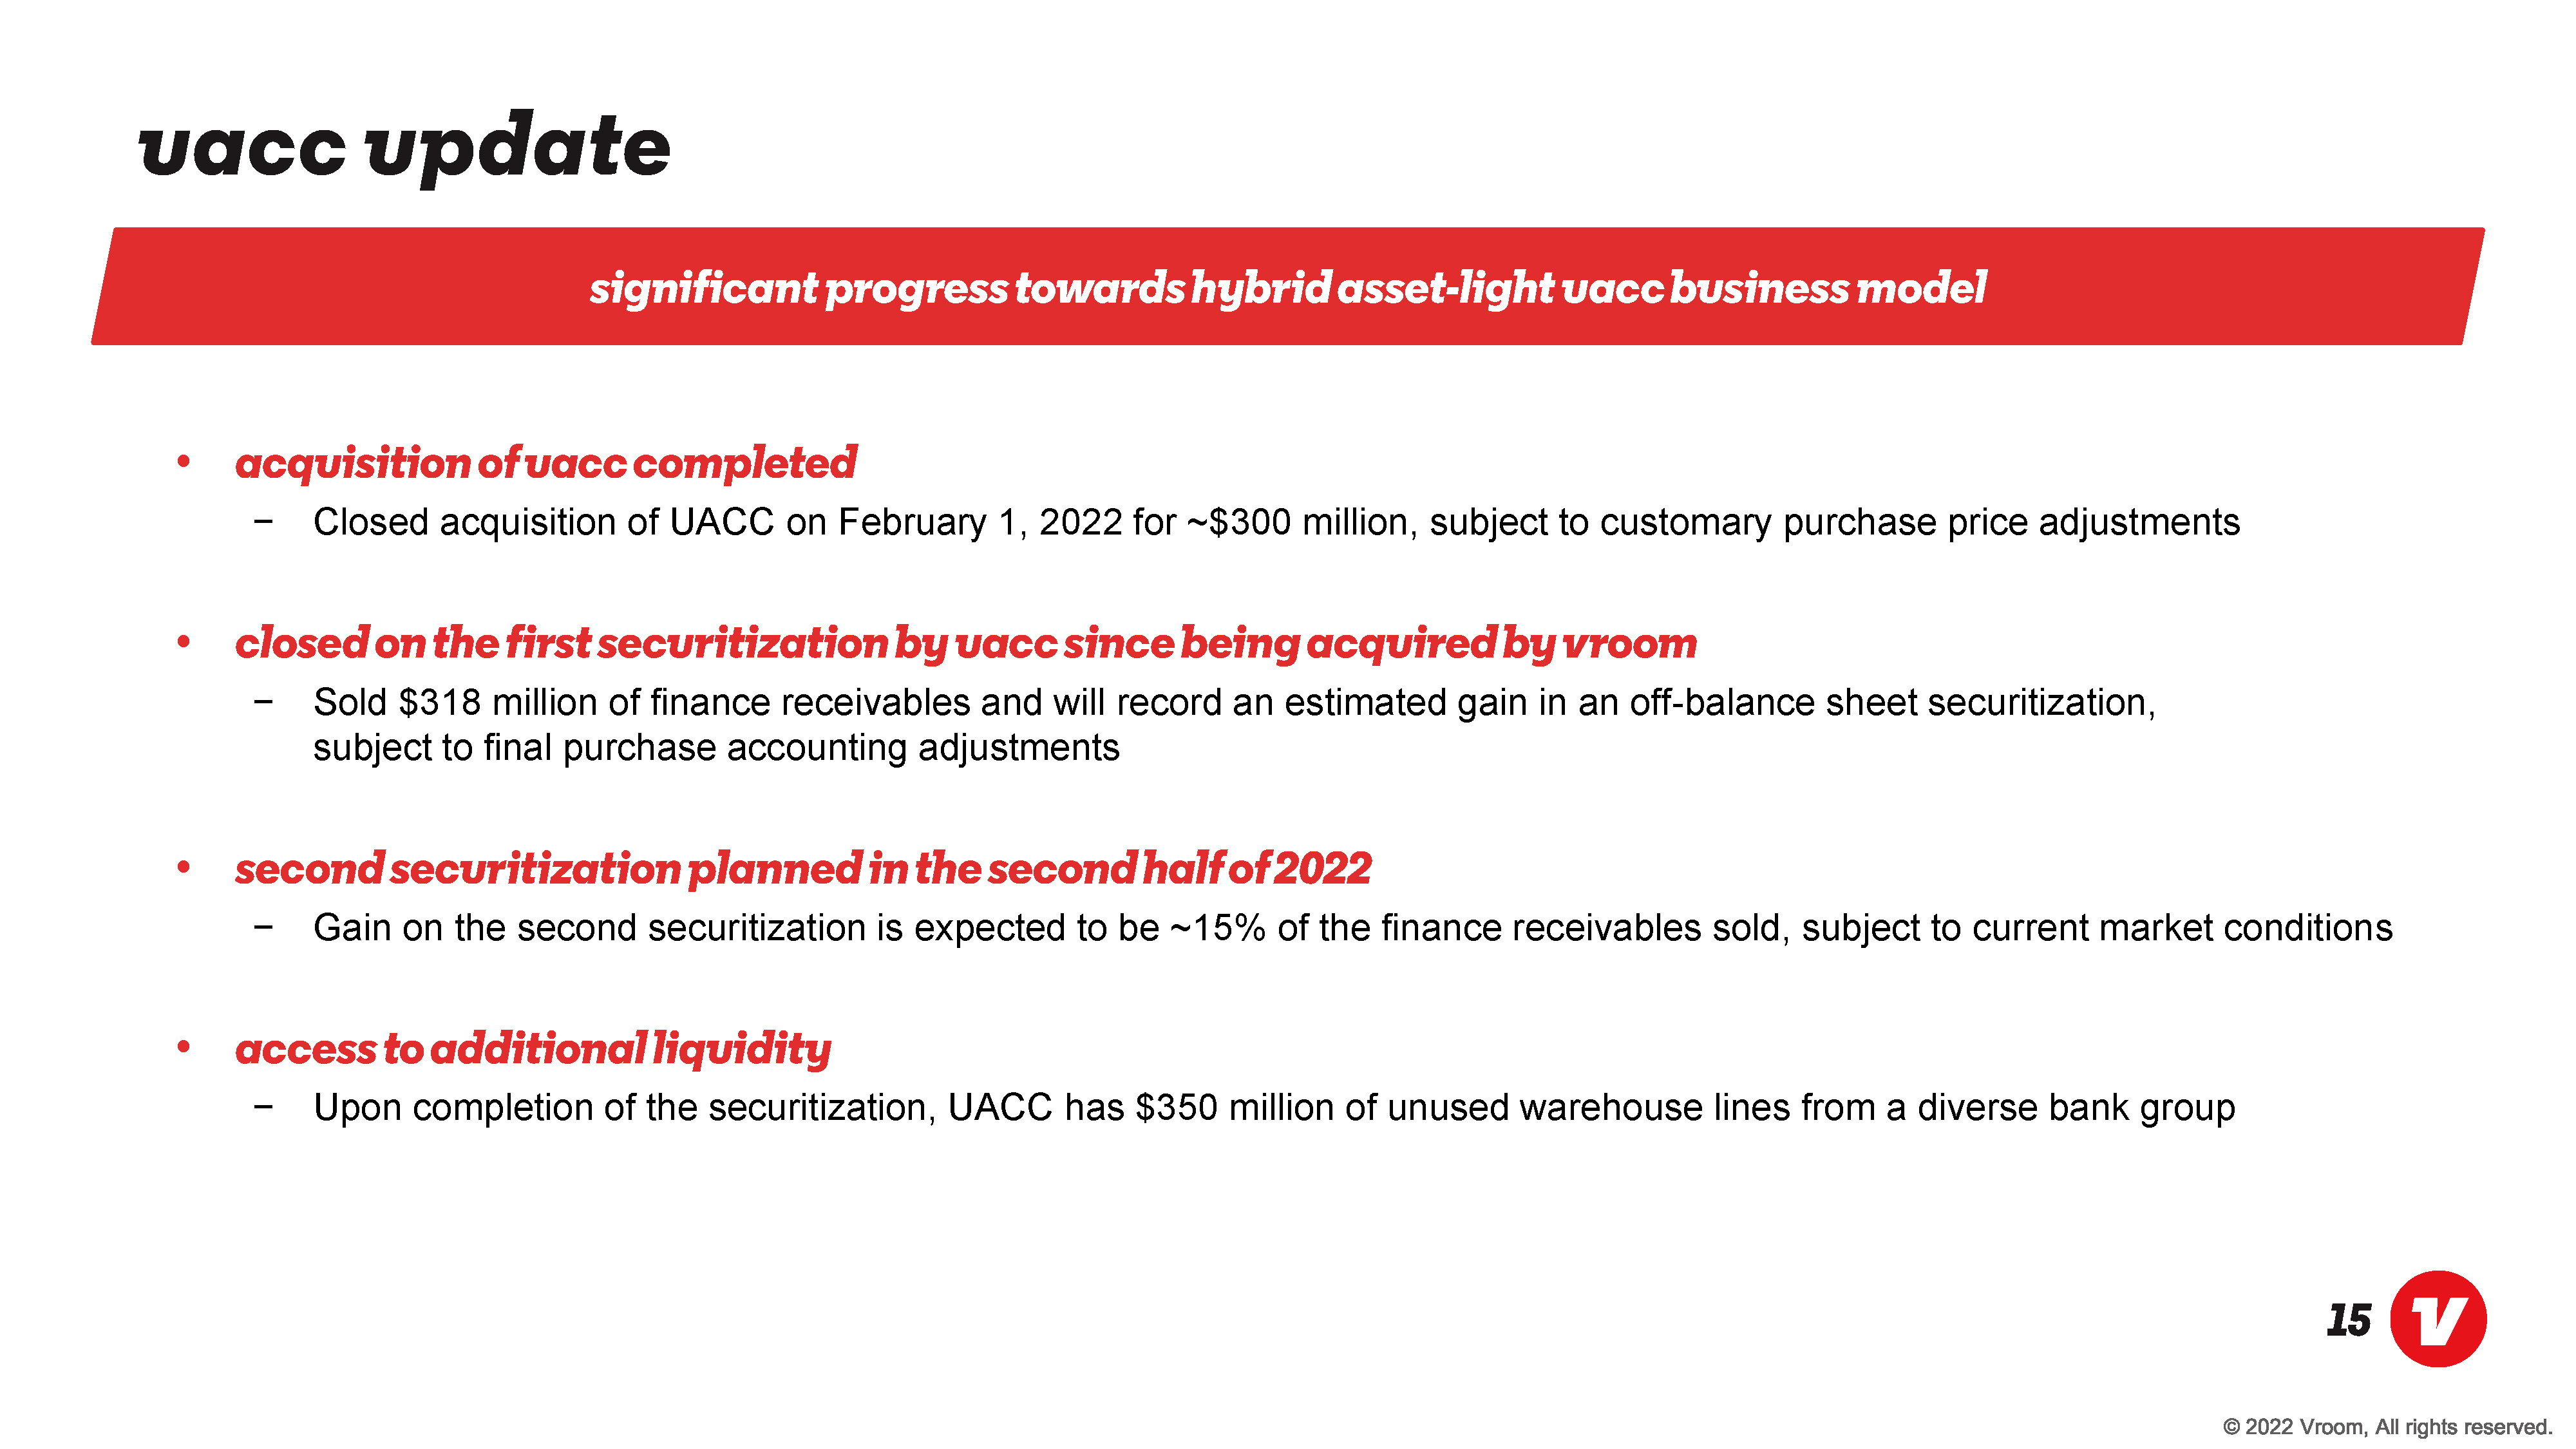
uacc update significant progress towards hybrid asset-light uacc business model acquisition of uacc completed Closed acquisition of UACC on February 1, 2022 for ~$300 million, subject to customary purchase price adjustments closed on the first securitization by uacc since acquired by vroom Sold $318 million of finance receivables and will record an estimated gain in an off-balance sheet securitization, subject to final purchase accounting adjustments second securitization planned in the second half of 2022 Gain on the second securitization is expected to be ~15% of the finance receivables sold, subject to current market conditions access to additional liquidity Upon completion of the securitization, UACC has $350 million of unused warehouse lines from a diverse bank group
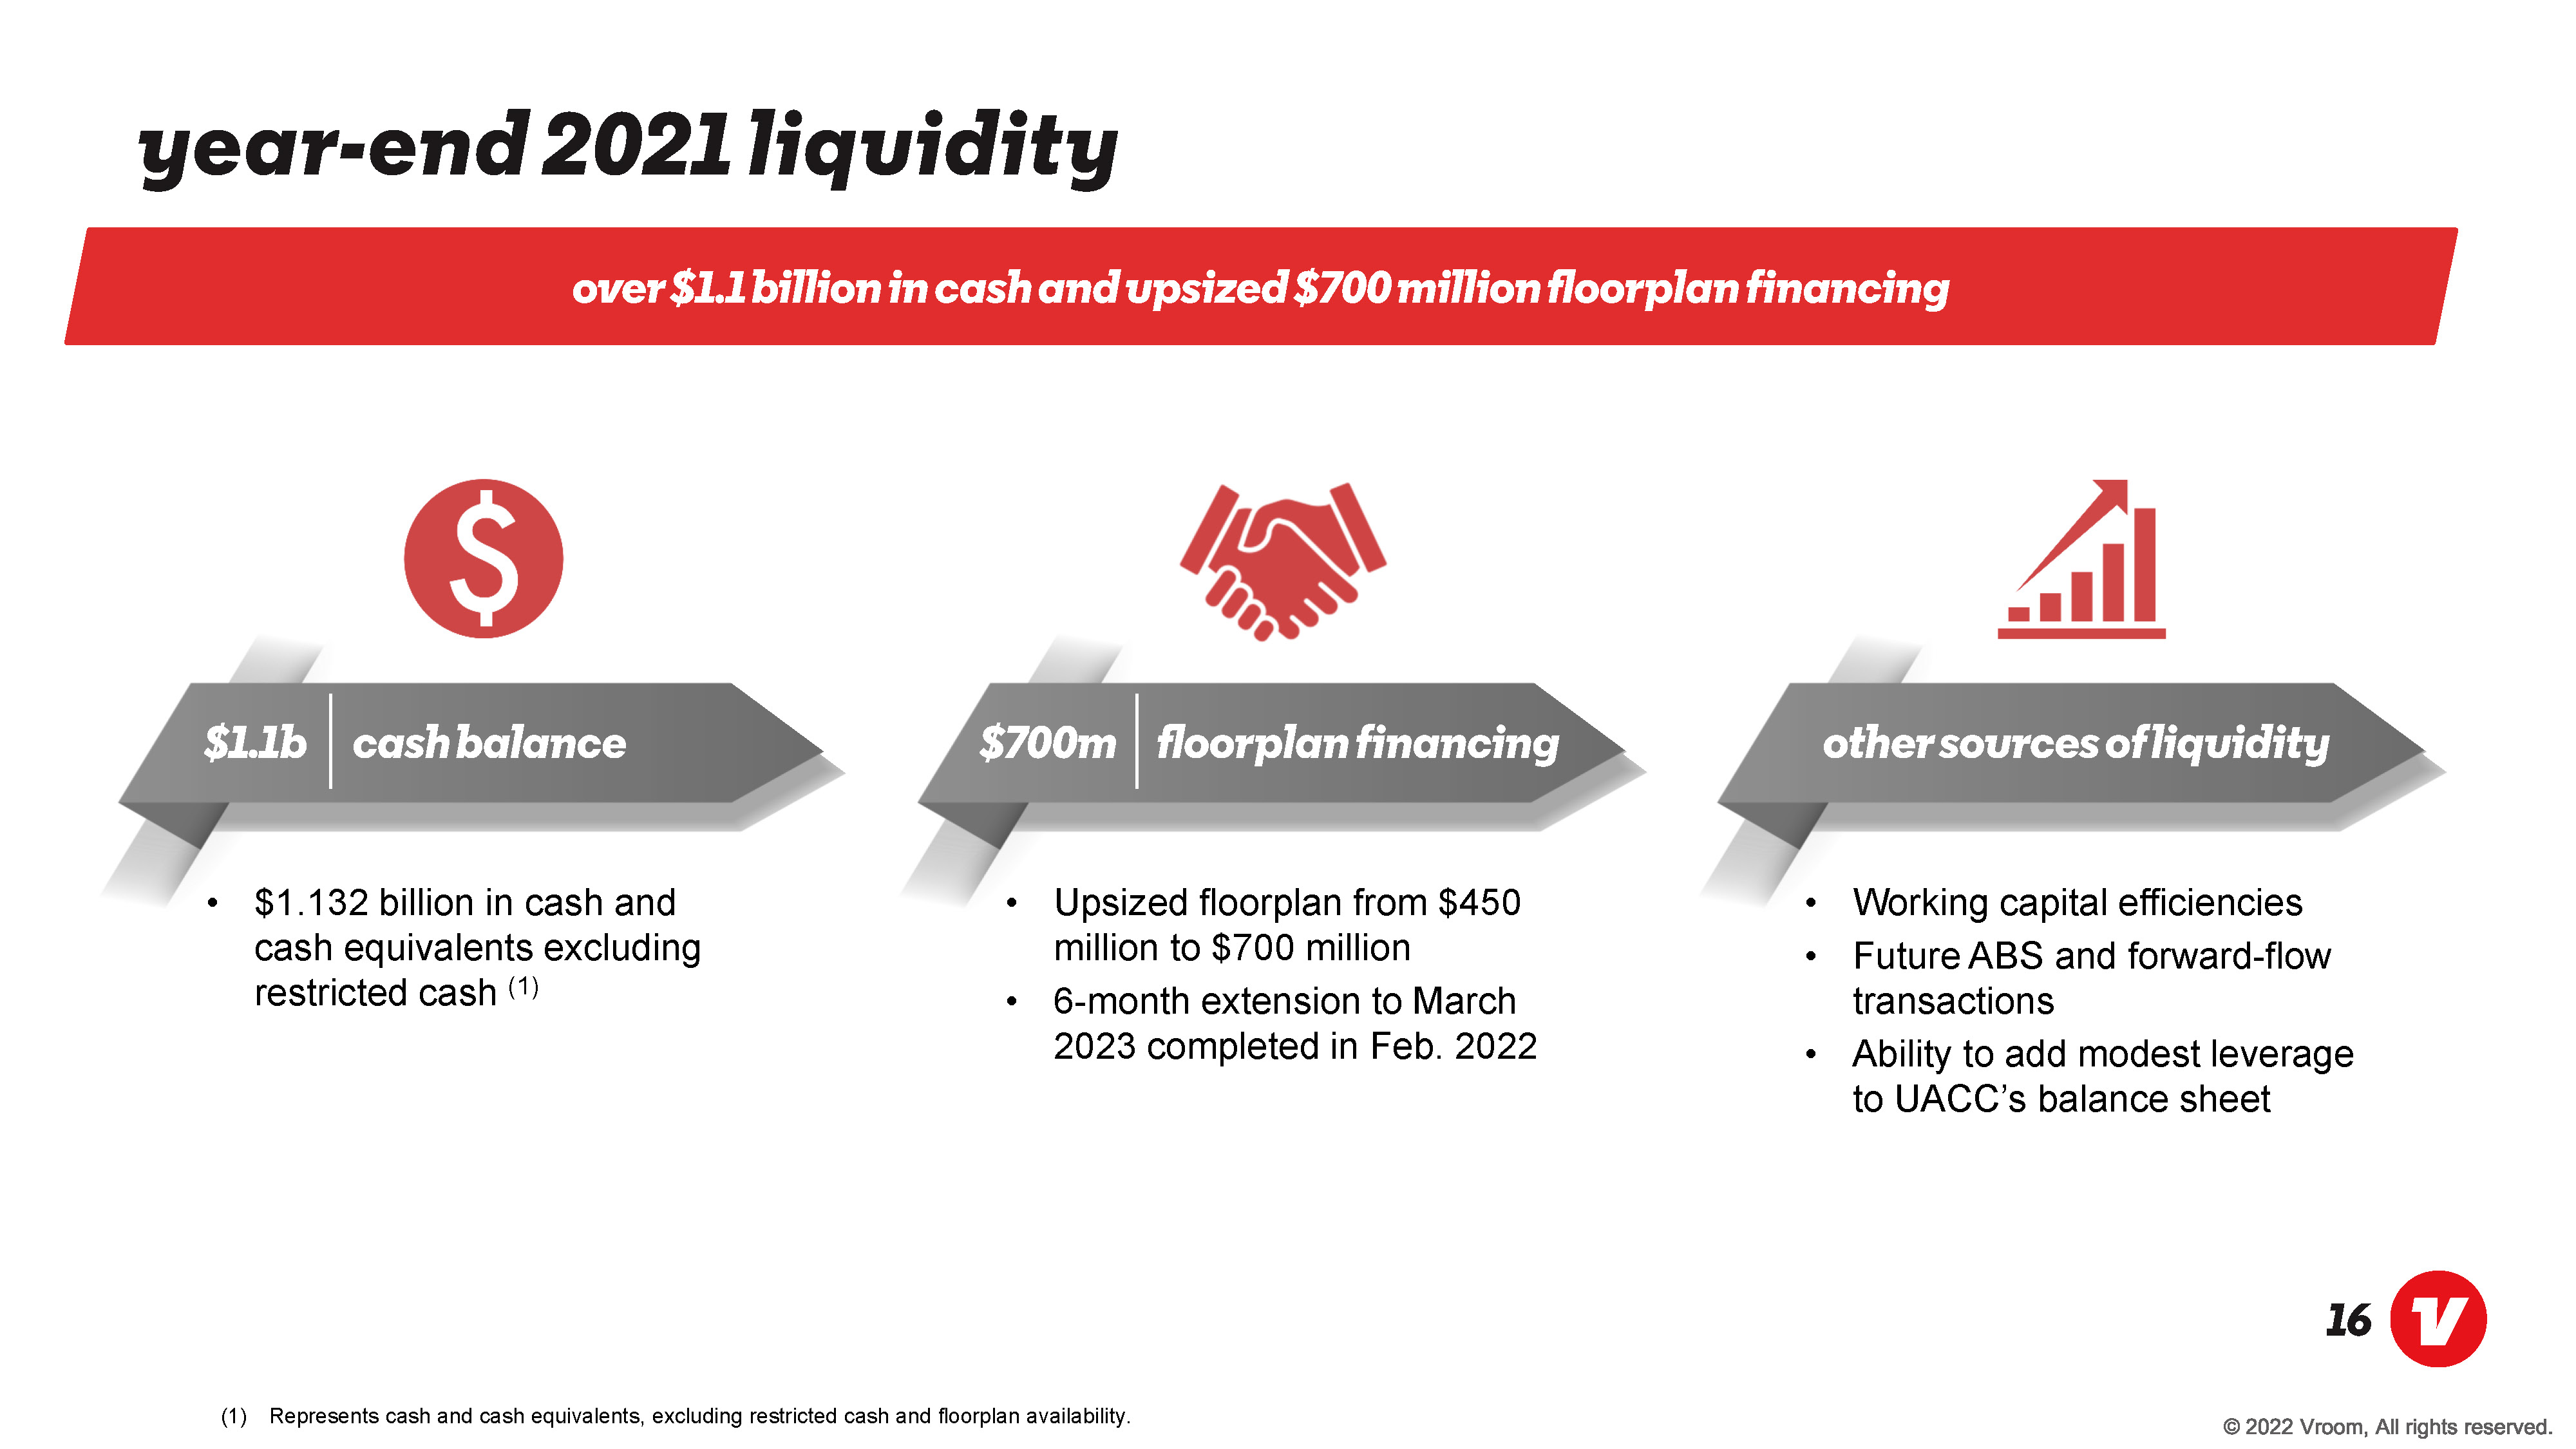
year-end 2021 liquidity over $1.1 billion in cash and upsized $700 million floor plan financing $1.1b cash balance $1.132 billion in cash and cash equivalents excluding restricted cash (1) $700m floorplan financing Upsized floorplan from $450 million to $700 million 6-month extension to March 2023 completed in Feb. 2022 other source of liquidity Working capital efficiencies Future ABS and forward-flow transactions Ability to add modest leverage to UACC’s balance sheet (1) Represents cash and cash equivalents, excluding restricted cash and floorplan availability.
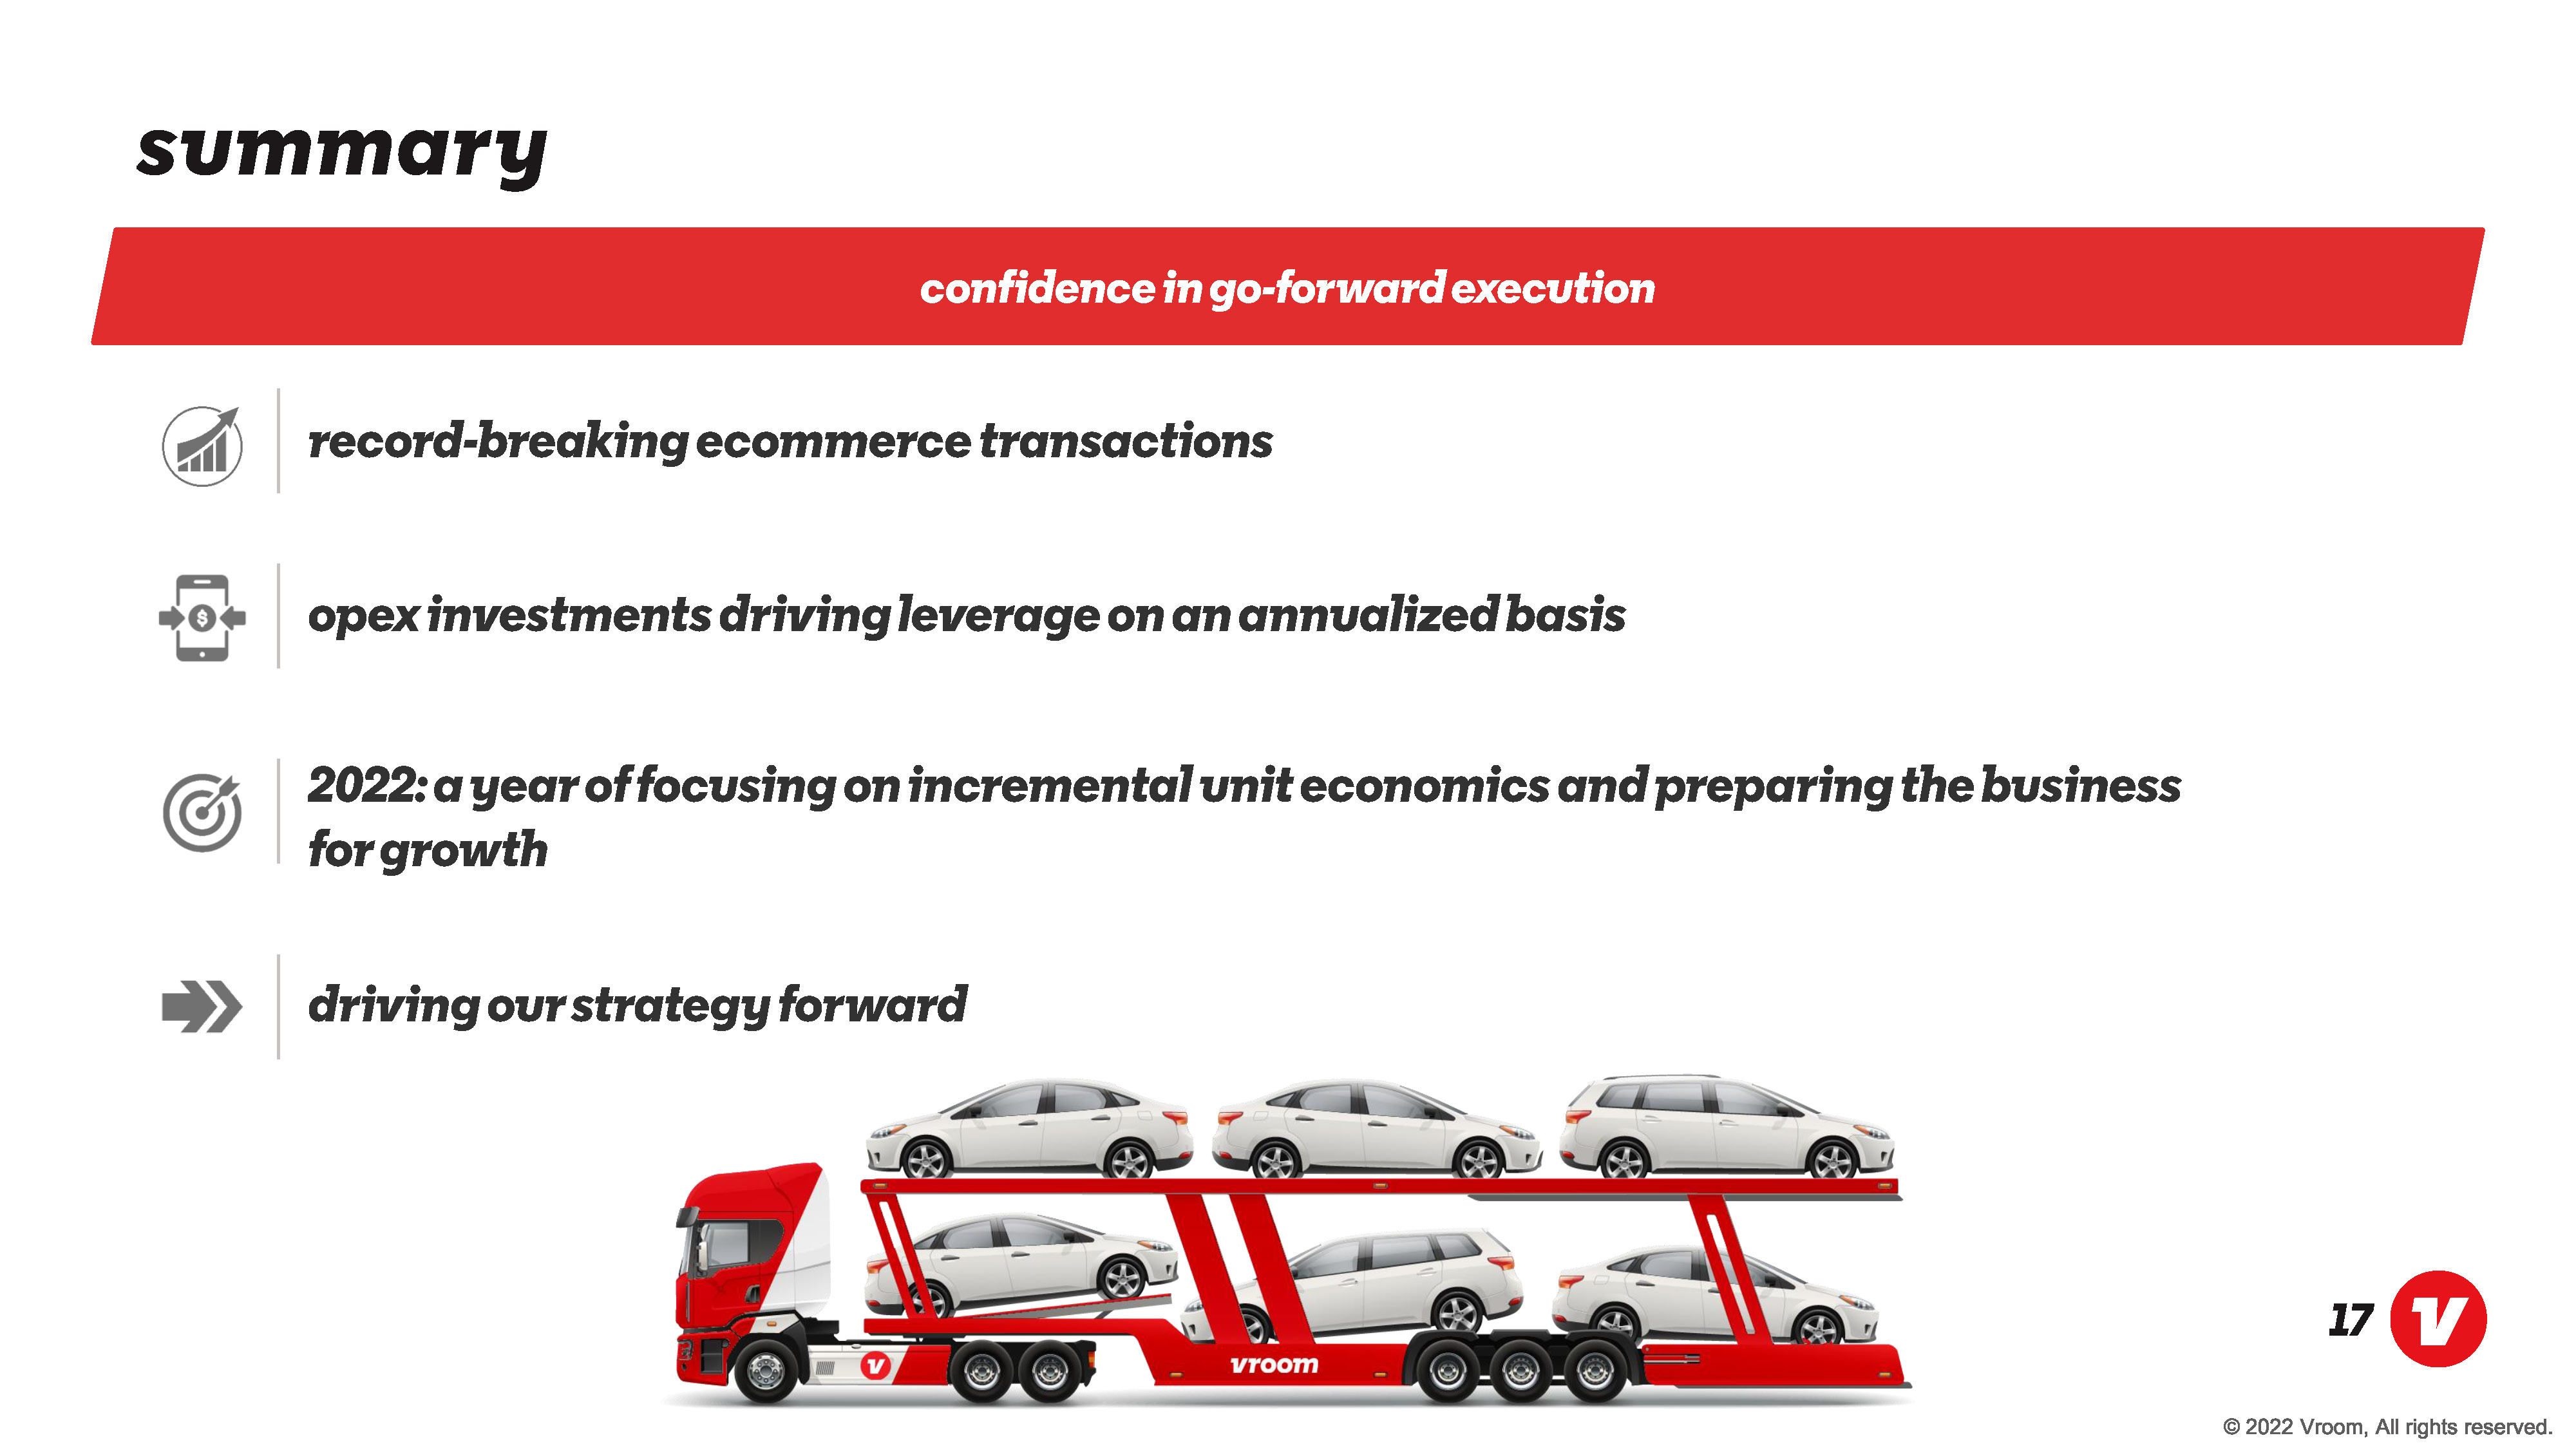
summary confidence in go-forward execution record-breaking ecommerce transactions opex investments driving leverage on an annualized basis 2022: a year of focusing on incremental unit economics and preparing the business for growth driving our strategy forward

vroom Appendix February 2022
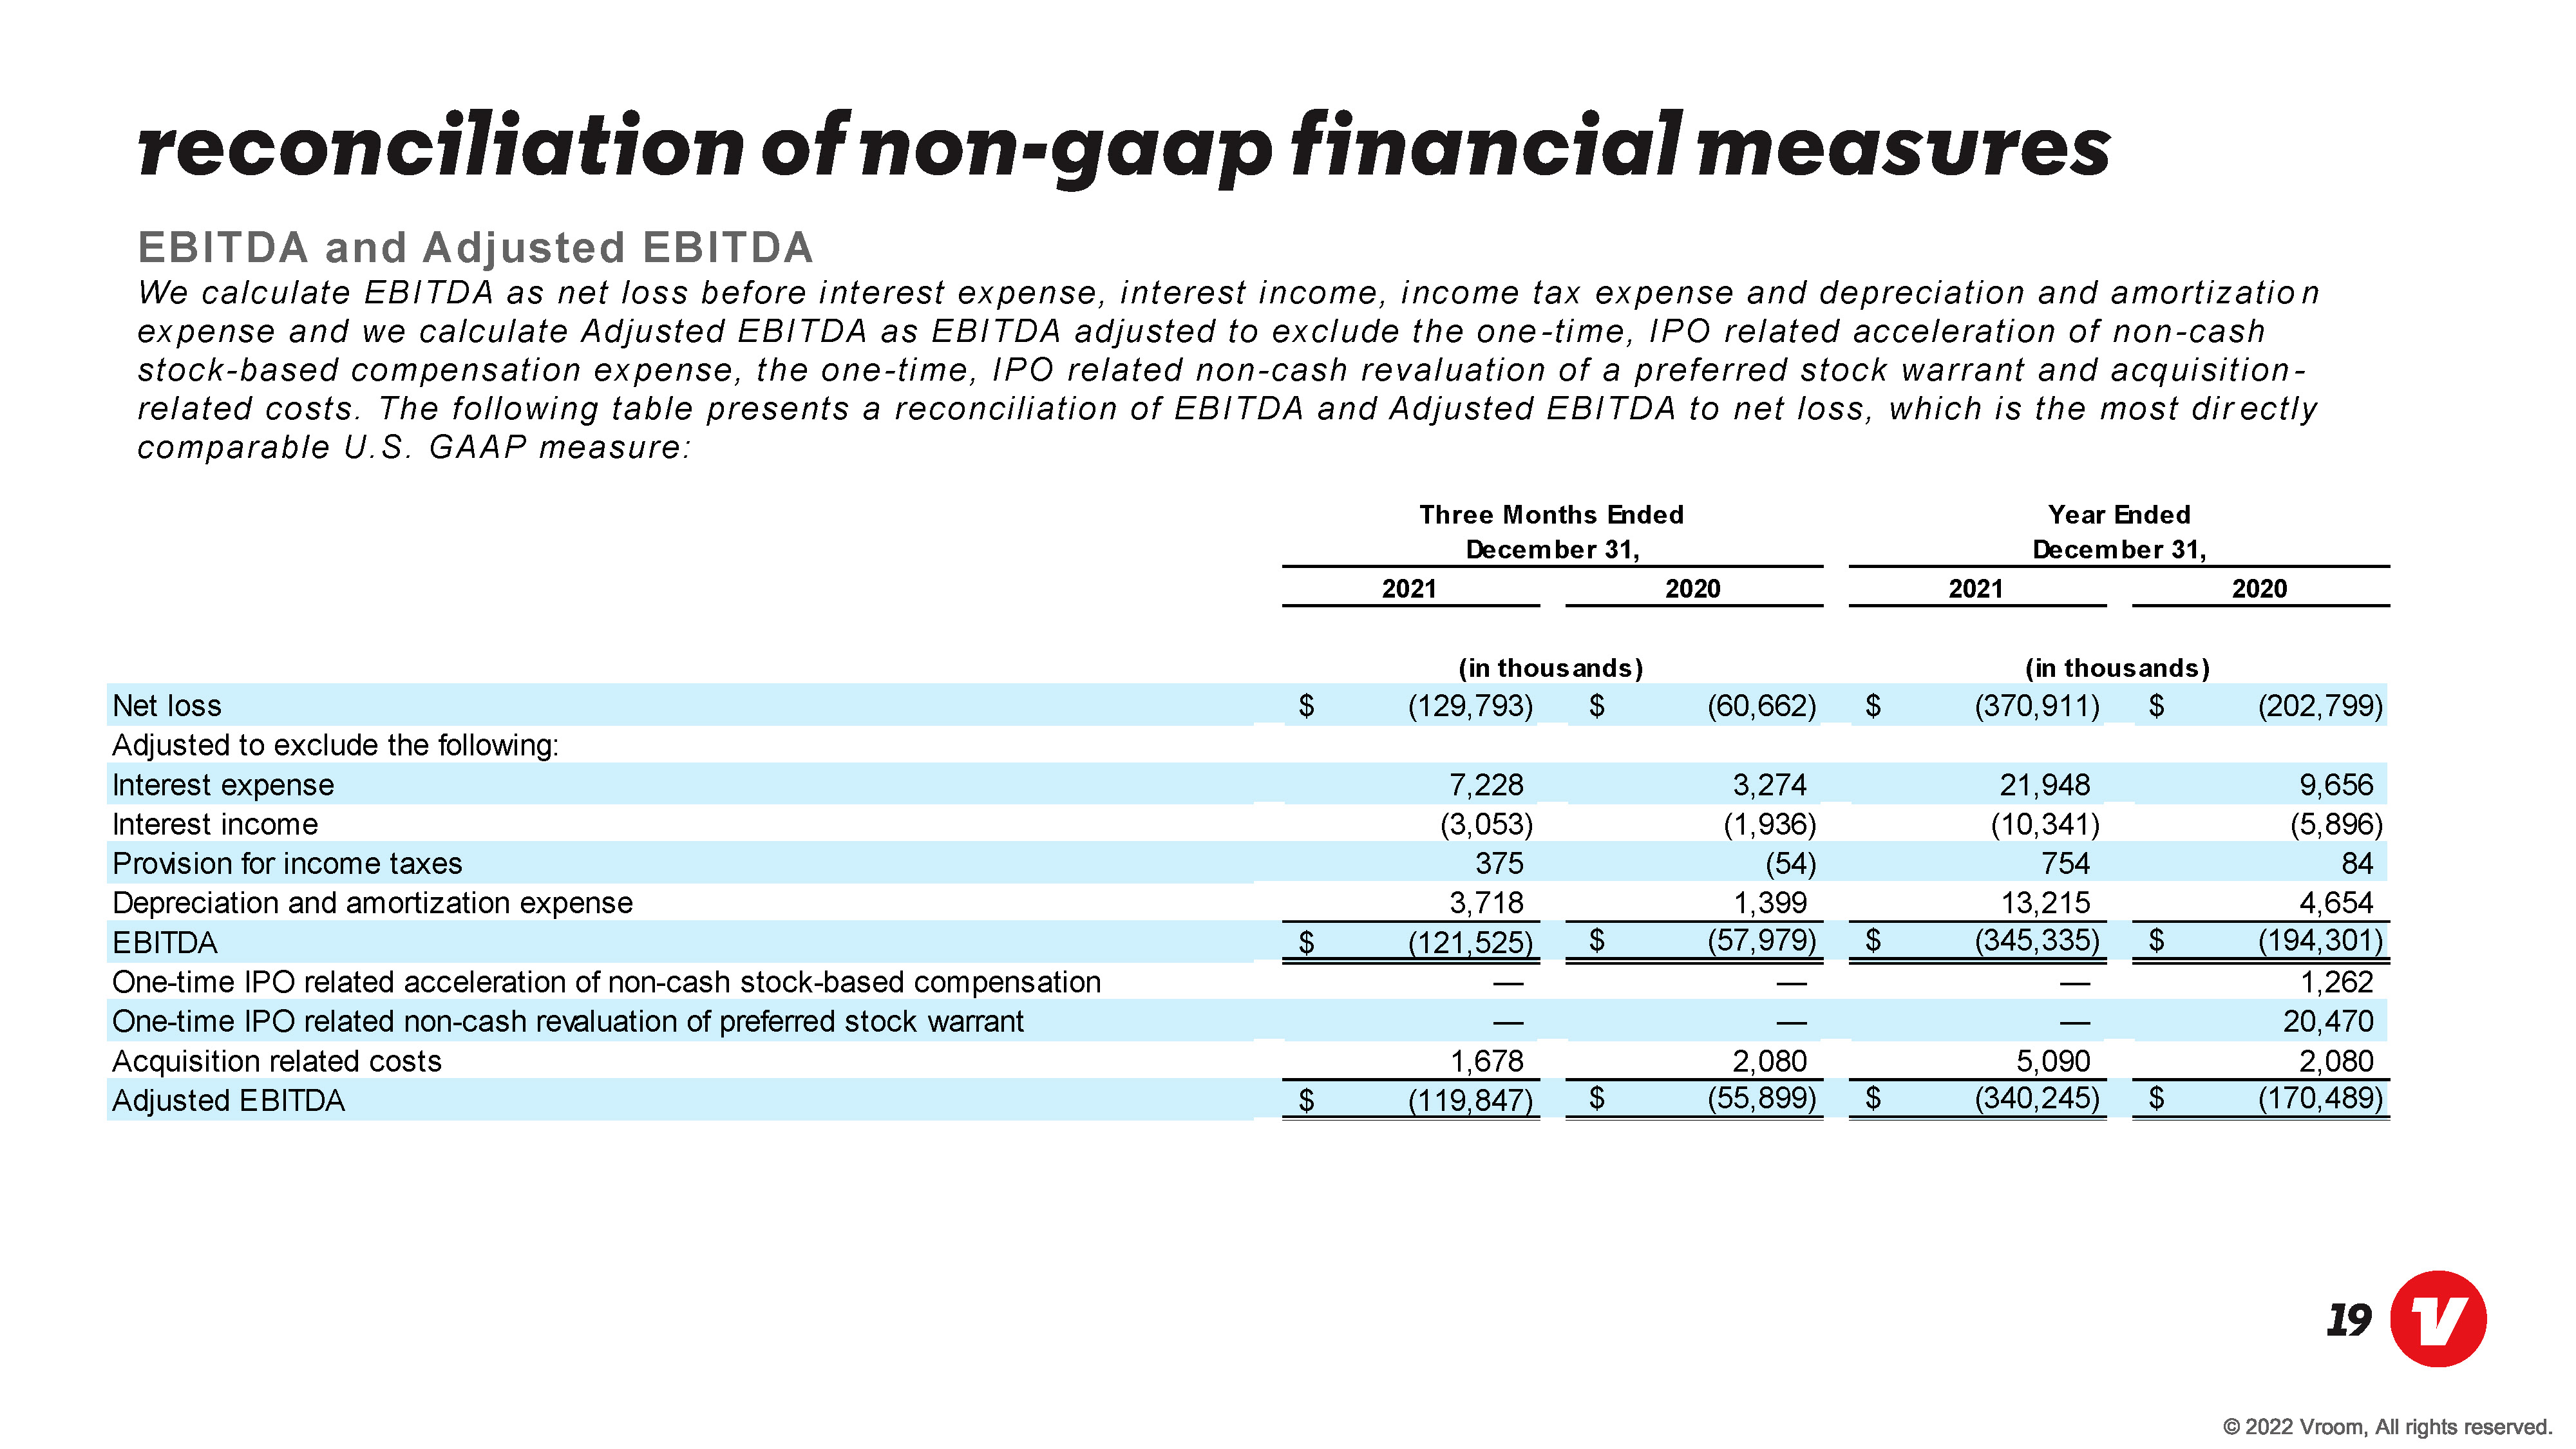
reconciliation of non-gaap financial measures EBITDA and Adjusted EBITDA We calculate EBITDA as net loss before interest expense, interest income, income tax expense and depreciation and amortization expense and we calculate Adjusted EBITDA as EBITDA adjusted to exclude the one - time, IPO related acceleration of non-cash stock-based compensation expense, the one- time, IPO related non-cash revaluation of a preferred stock war rant and acquisition - related costs. The following table presents a reconciliation of EBITDA and Adjusted EBITDA to net loss, which is the most directly comparable U.S. GAAP measure: Three Months Ended December 31, Year Ended December 31, 2021 2020 2021 2020 Net loss $ (129,793) $ (60,662) $ (370,911) $ (202,799) Adjusted to exclude the following: Interest expense 7,228 3,274 21,948 9,656 Interest income (3,053) (1,936) (10,341) (5,896) Provision for income taxes 375 (54) 754 84 Depreciation and amortization expense 3,718 1,399 13,215 4,654 EBITDA $ (121,525) $ (57,979) $ (345,335) $ (194,301) One-time IPO related acceleration of non-cash stock-based compensation 1,262 One-time IPO related non-cash revaluation of preferred stock warrant 20,470 Acquisition related costs 1,678 2,080 5,090 2,080 Adjusted EBITDA $ (119,847) $ (55,899) $ (340,245) $ (170,489)
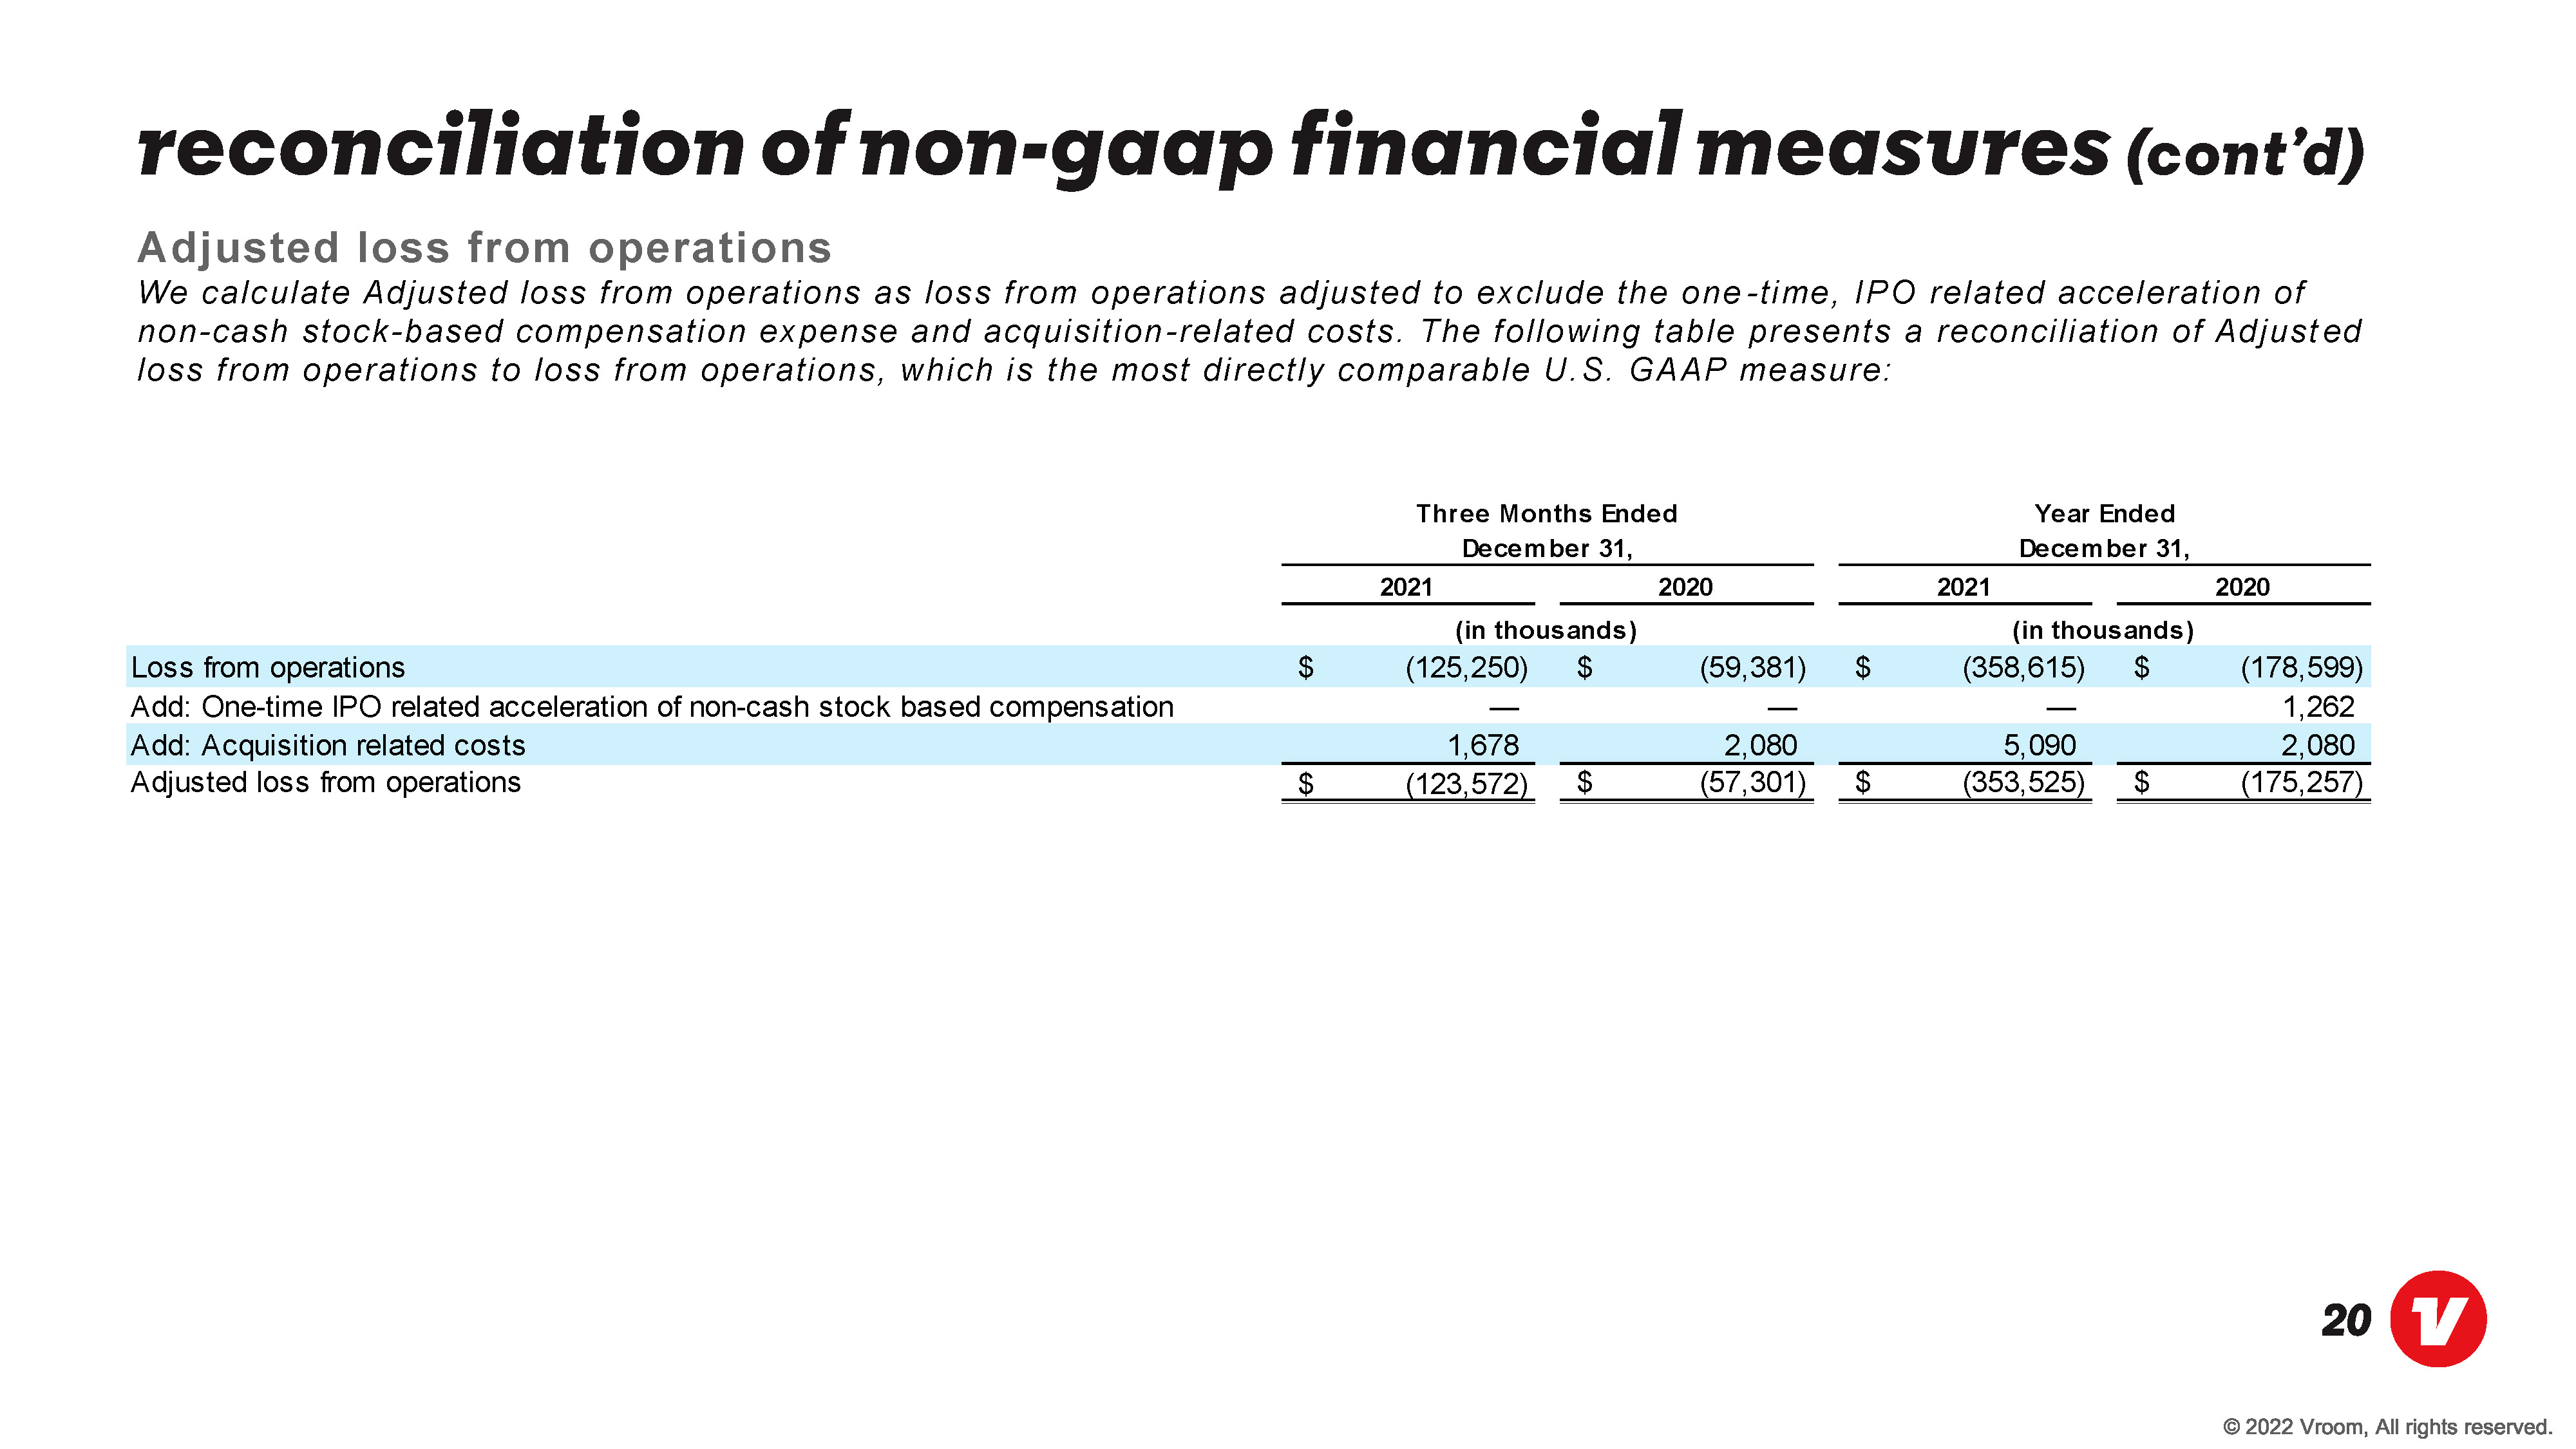
reconciliation of non-gaap financial measures (cont’d) Adjusted loss from operations We calculate Adjusted loss from operations as loss from operations adjusted to exclude the one - time, IPO related acceleration of non-cash stock-based compensation expense and acquisition-related costs. The following table presents a reconciliation of Adjusted loss from operations to loss from operations, which is the most directly comparable U.S. GAAP measure: 2021 2020 2021 2020 Loss from operations $ (125,250) $ (59,381) $ (358,615) $ (178,599) Add: One-time IPO related acceleration of non-cash stock based compensation 1,262 Add: Acquisition related costs 1,678 2,080 5,090 2,080 Adjusted loss from operations $ (123,572) $ (57,301) $ (353,525) $ (175,257) Three Months Ended December 31, Year Ended December 31, (in thousands) (in thousands)

reconciliation of non-gaap financial measures (cont’d) (a) Non-GAAP net loss per share, as adjusted has been computed to give effect to, as of the beginning of each period presented, (i) the shares of common stock issued in connection with our IPO, (ii) the automatic conversion of all outstanding shares of redeemable convertible preferred stock into shares of common stock that occurred upon the consummation of our IPO and (iii) the shares of common stock issued with our follow-on public offering. The computation of Non-GAAP net loss per share, as adjusted is provided on the following page. Non-GAAP net loss, Non-GAAP net loss per share and Non-GAAP net loss per share, as adjusted We calculate Non-GAAP net loss as net loss adjusted to exclude the one-time, IPO related acceleration of non-cash stock-based compensation expense, the one- time, IPO related non-cash revaluation of a preferred stock warrant and acquisition - related costs. We calculate Non-GAAP net loss per share as Non-GAAP net loss divided by weighted average number of shares outstanding. The following table presents a reconciliation of Non-GAAP net loss and Non-GAAP net loss per share to net loss and net loss per share, which are the most directly comparable U.S. GAAP measures: 2021 2020 2021 2020 Net loss $ (129,793) $ (60,662) $ (370,911) $ (202,799) Net loss attributable to common stockholders $ (129,793) $ (60,662) $ (370,911) $ (202,799) Add: One-time IPO related acceleration of non-cash stock based compensation 1,262 Add: One-time IPO related non-cash revaluation of preferred stock warrant 20,470 Add: Acquisition related costs 1,678 2,080 5,090 2,080 Non-GAAP net loss $ (128,115) $ (58,582) $ (365,821) $ (178,987) Weighted-average number of shares outstanding used to compute net loss per share, basic and diluted 136,948,461 132,187,850 136,429,791 73,345,569 Net loss per share, basic and diluted $ (0.95) $ (0.46) $ (2.72) $ (2.76) Impact of one-time IPO related acceleration of non-cash stock based compensation 0.02 Impact of one-time IPO related non-cash revaluation of preferred stock warrant 0.28 Impact of acquisition related costs 0.01 0.02 0.04 0.03 Non-GAAP net loss per share, basic and diluted $ (0.94) $ (0.44) $ (2.68) $ (2.43) Non-GAAP net loss per share, as adjusted, basic and diluted(a) $ (0.94) $ (0.44) $ (2.68) $ (1.37) Three Months Ended December 31, Year Ended December 31, (in thousands, except share and per share amounts) (in thousands, except share and per share amounts)
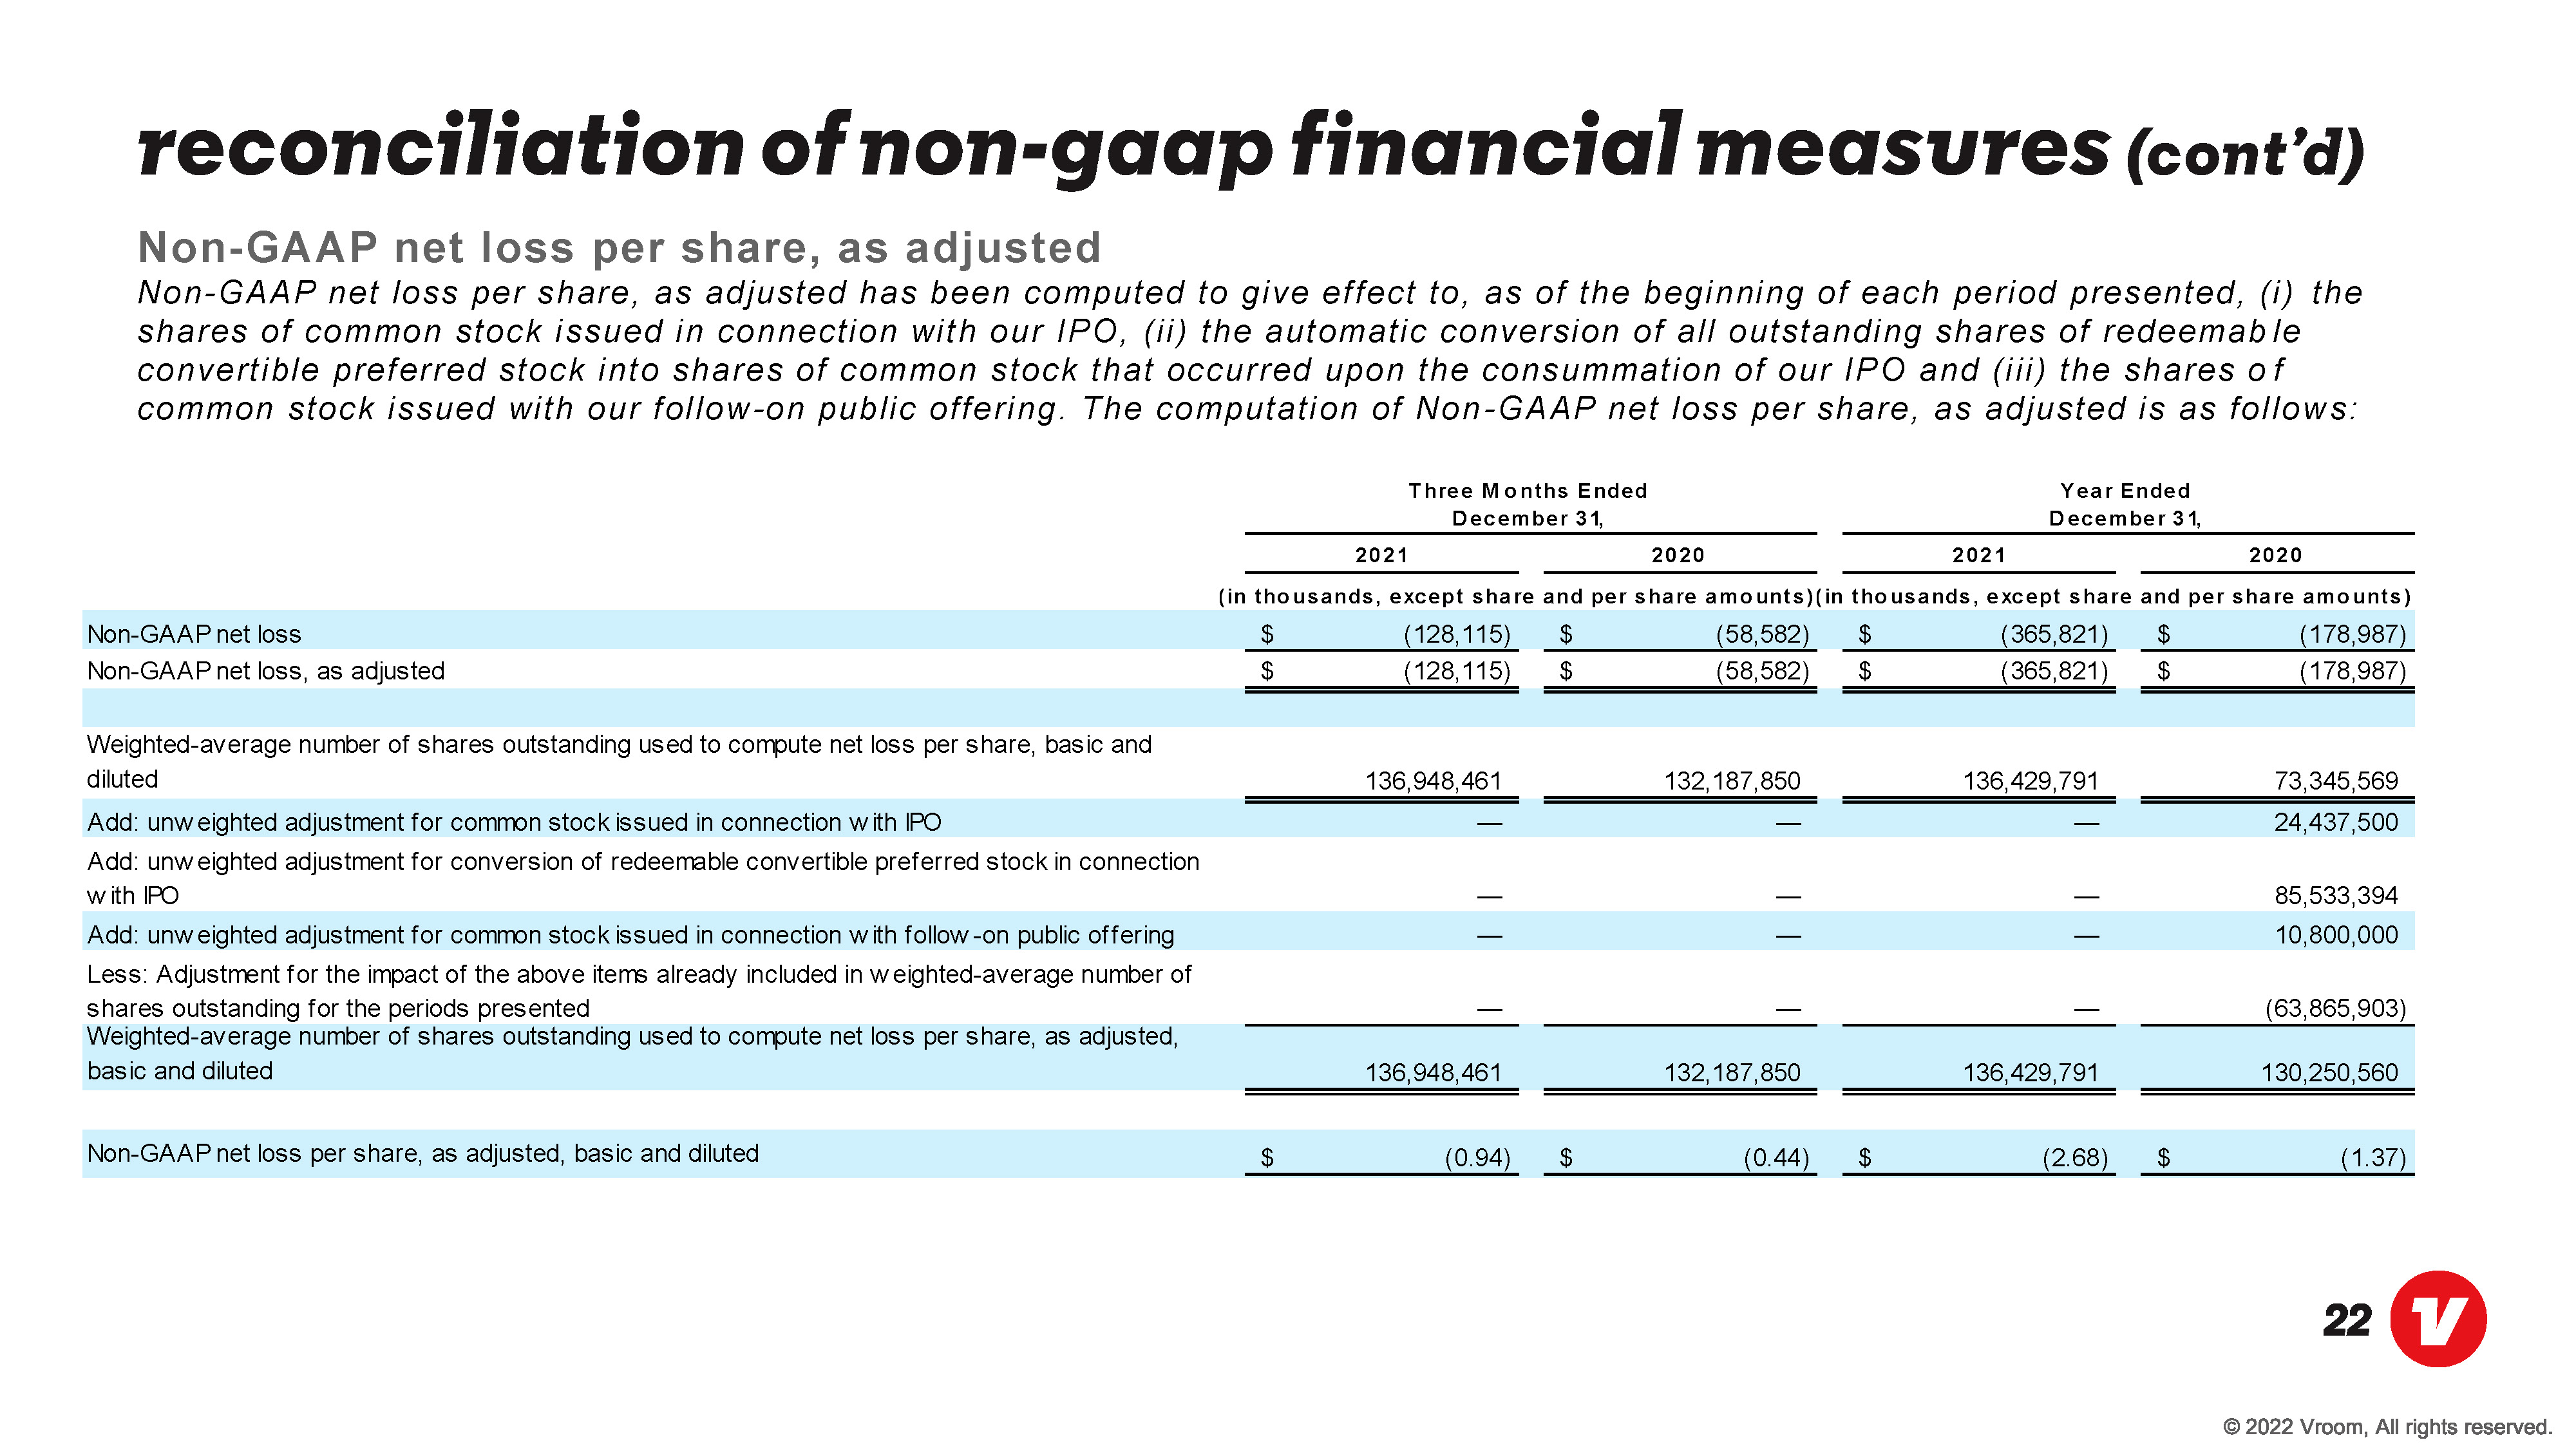
reconciliation of non-gaap financial measures (cont’d) Non-GAAP net loss per share, as adjusted Non-GAAP net loss per share, as adjusted has been computed to give effect to, as of the beginning of each period presented, (i) the shares of common stock issued in connect ion with our IPO, (ii) the automatic conversion of all outstanding shares of redeemable convertible preferred stock into shares of common stock that occurred upon the consummation of our IPO and (iii) the shares of common stock issued with our follow-on public offering. The computation of Non-GAAP net loss per share, as adjusted is as follows: 2021 2020 2021 2020 Non-GAAP net loss $ (128,115) $ (58,582) $ (365,821) $ (178,987) Non-GAAP net loss, as adjusted $ (128,115) $ (58,582) $ (365,821) $ (178,987) Weighted-average number of shares outstanding used to compute net loss per share, basic and diluted 136,948,461 132,187,850 136,429,791 73,345,569 Add: unweighted adjustment for common stock issued in connection with IPO 24,437,500 Add: unweighted adjustment for conversion of redeemable convertible preferred stock in connection with IPO 85,533,394 Add: unweighted adjustment for common stock issued in connection with follow -on public offering 10,800,000 Less: Adjustment for the impact of the above items already included in weighted-average number of shares outstanding for the periods presented (63,865,903) Weighted-average number of shares outstanding used to compute net loss per share, as adjusted, basic and diluted 136,948,461 132,187,850 136,429,791 130,250,560 Non-GAAP net loss per share, as adjusted, basic and diluted $ (0.94) $ (0.44) $ (2.68) $ (1.37) (in thousands, except share and per share amounts)(in thousands, except share and per share amounts) Three Months Ended December 31, Year Ended December 31,

thank you!