Exhibit 99.2

Vroom First Quarter 2022 Earnings May 2022
Disclaimer Forward Looking Statements This presentation contains forward-looking statements within the meaning of the Private Securities Litigation Reform Act of 1995. All statements contained in this presentation that do not relate to matters of historical fact should be considered forward-looking statements, including without limitation, statements regarding the expected timeline, our execution of and the expected benefits from our business realignment plan and cost-saving initiatives, our expectations regarding our business strategy and plans, including our ability to integrate and develop United Auto Credit Corporation into a captive finance operation, as well as our ability to scale our business, address operational challenges, expand reconditioning capacity, invest in logistics and improve our end-to-end customer experience, and statements regarding our future results of operations and financial position, including our ability to improve our unit economics, lower our operating expenses and our financial outlook including with respect to our liquidity, our profitability, changes to our leadership team, and our cash balances, for the fiscal year 2022. These statements are based on management’s current assumptions and are neither promises nor guarantees, but involve known and unknown risks, uncertainties and other important factors that may cause our actual results, performance or achievements to be materially different from any future results, performance or achievements expressed or implied by the forward-looking statements. For factors that could cause actual results to differ materially from the forward-looking statements in this presentation, please see the risks and uncertainties identified under the heading "Risk Factors" in our Annual Report on Form 10-K for the year ended December 31, 2021, as updated by our Quarterly report on Form 10-Q for the quarter ended March 31, 2022, each of which is available on our Investor Relations website at ir.vroom.com and on the SEC website at www.sec.gov. All forward-looking statements reflect our beliefs and assumptions only as of the date of this presentation. We undertake no obligation to update forward-looking statements to reflect future events or circumstances. Industry and Market Information To the extent this presentation includes information concerning the industry and the markets in which the Company operates, including general observations, expectations, market position, market opportunity and market size, such information is based on management's knowledge and experience in the markets in which we operate, including publicly available information from independent industry analysts and publications, as well as the Company’s own estimates. Our estimates are based on third-party sources, as well as internal research, which the Company believes to be reasonable, but which are inherently uncertain and imprecise. Accordingly, you are cautioned not to place undue reliance on such market and industry information. Financial Presentation and Use of Non-GAAP Financial Measures Certain monetary amounts, percentages and other figures included in this presentation have been subject to rounding adjustments. Certain other amounts that appear in this presentation may not sum due to rounding. This presentation contains certain supplemental financial measures that are not calculated pursuant to U.S. generally accepted accounting principles (“GAAP”). These non-GAAP measures are in addition to, and not a substitute or superior to, measures of financial performance prepared in accordance with GAAP. These non-GAAP financial measures have limitations as analytical tools in that they do not reflect all of the amounts associated with our results of operations as determined in accordance with U.S. GAAP. Because of these limitations, these non-GAAP financial measures should be considered along with other operating and financial performance measures presented in accordance with U.S. GAAP. We have reconciled all non-GAAP financial measures with the most directly comparable U.S. GAAP financial measures.
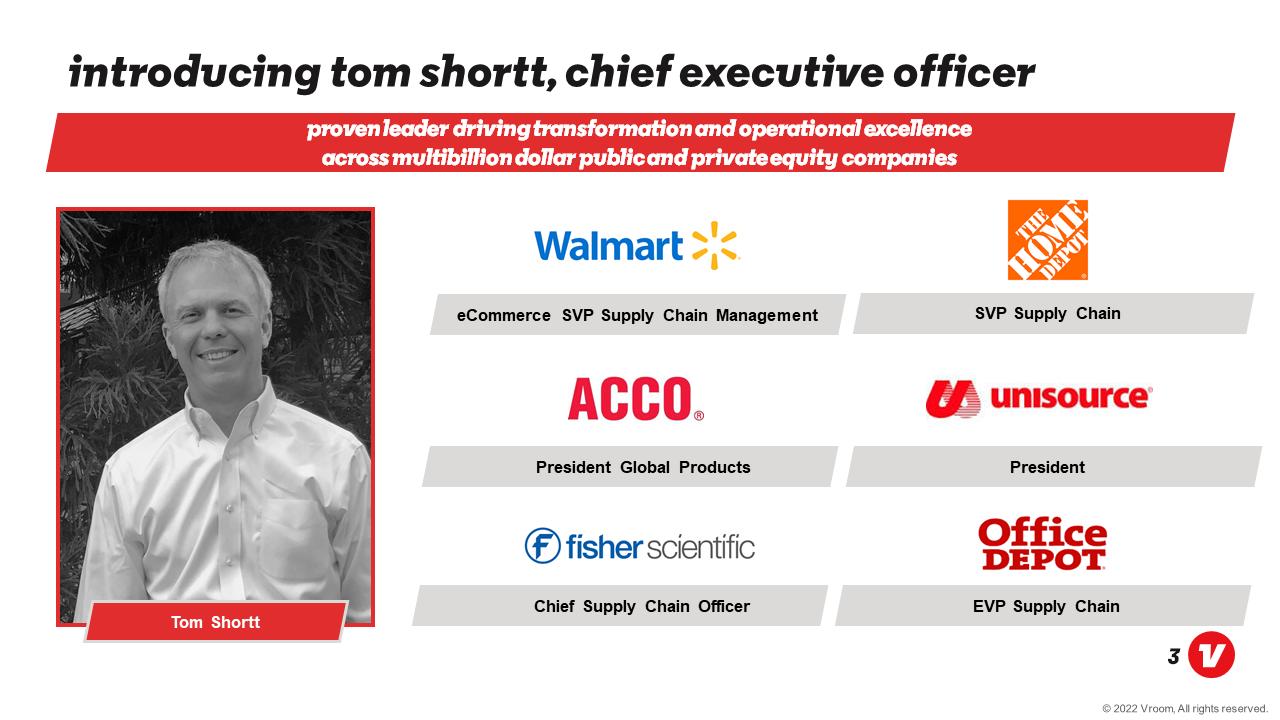
Introducing tom shortt, chief executive officer Proven leader driving transformation and operational excellence across multibillion dollar public and private equity companies Tom Shortt Walmart eCommerce SVP Supply Chain Management acco President Global Products F fisher scientific Chief Supply Chain Officer the home depot SVP Supply Chain Unisource President office depot EVP Supply Chain
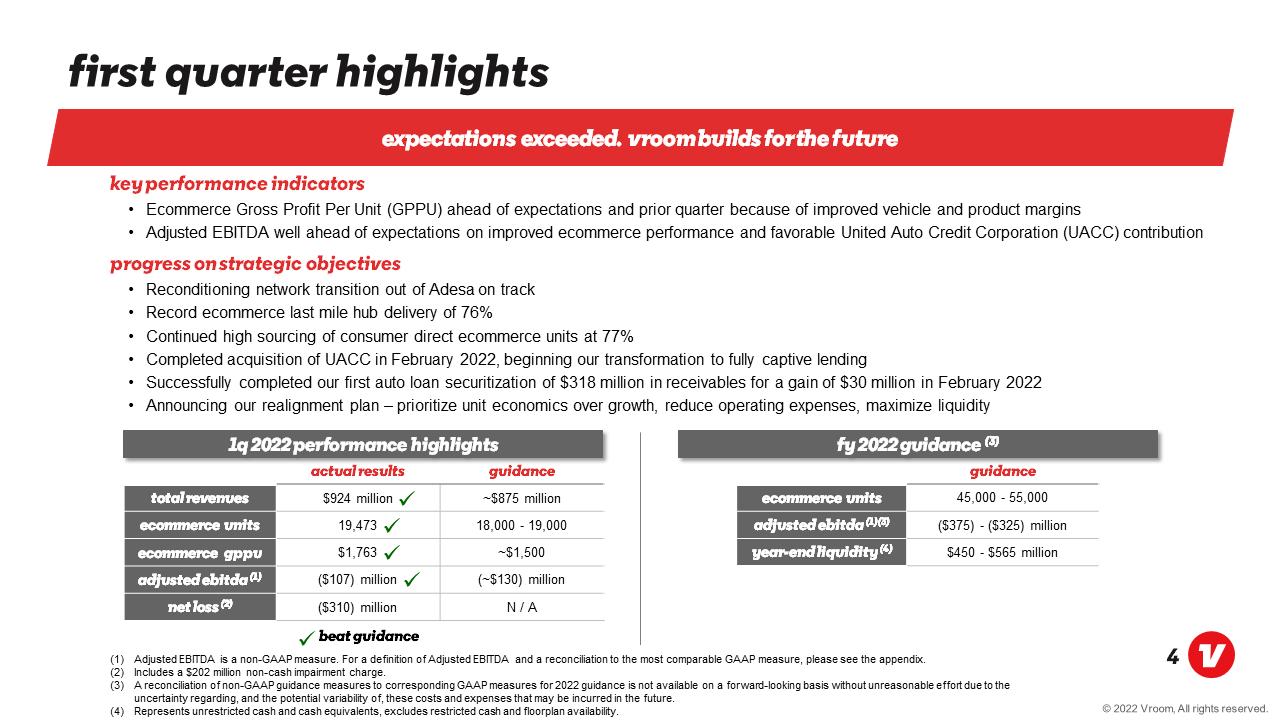
First quarter highlights Expectations exceeded. Vroom builds for the future key performance indicators Ecommerce Gross Profit Per Unit (GPPU) ahead of expectations and prior quarter because of improved vehicle and product margins Adjusted EBITDA well ahead of expectations on improved ecommerce performance and favorable United Auto Credit Corporation (UACC) contribution progress on strategic objectives Reconditioning network transition out of Adesa on track Record ecommerce last mile hub delivery of 76% Continued high sourcing of consumer direct ecommerce units at 77% Completed acquisition of UACC in February 2022, beginning our transformation to fully captive lending Successfully completed our first auto loan securitization of $318 million in receivables for a gain of $30 million in February 2022 Announcing our realignment plan – prioritize unit economics over growth, reduce operating expenses, maximize liquidity 1q 2022 Performance Highlights Total Revenues Ecommerce Units Ecommerce GPPU Adjusted EBITDA (1) Net loss (2) actual results $924 million 19,473 $1,763 ($107) million ($310) million guidance ~$875 million 18,000 - 19,000 ~$1,500 (~$130) million N / A fy 2022 Guidance (3) Ecommerce units Adjusted EBITDA (1) (3) Year-end liquidity (4) Guidance 45,000 - 55,000 ($375) - ($325) million $450 - $565 million Beat Guidance Adjusted EBITDA is a non-GAAP measure. For a definition of Adjusted EBITDA and a reconciliation to the most comparable GAAP measure, please see the appendix. Includes a $202 million non-cash impairment charge. A reconciliation of non-GAAP guidance measures to corresponding GAAP measures for 2022 guidance is not available on a forward-looking basis without unreasonable effort due to the uncertainty regarding, and the potential variability of, these costs and expenses that may be incurred in the future. Represents unrestricted cash and cash equivalents, excludes restricted cash and floorplan availability.
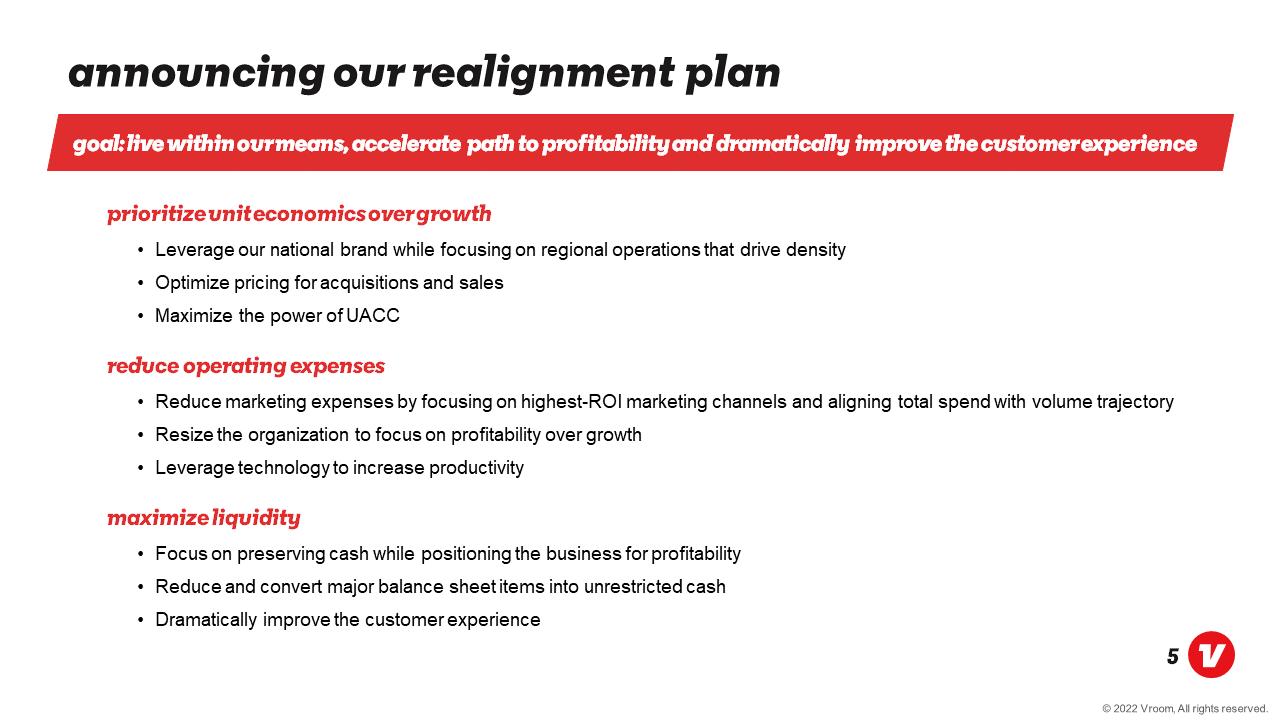
Announcing our realignment plan Goal: live within our means, accelerate path to profitability and dramatically improve the customer experience Prioritize unit economics over growth Leverage our national brand while focusing on regional operations that drive density Optimize pricing for acquisitions and sales Maximize the power of UACC Reduce operating expenses Reduce marketing expenses by focusing on highest-ROI marketing channels and aligning total spend with volume trajectory Resize the organization to focus on profitability over growth Leverage technology to increase productivity maximize liquidity Focus on preserving cash while positioning the business for profitability Reduce and convert major balance sheet items into unrestricted cash Dramatically improve the customer experience
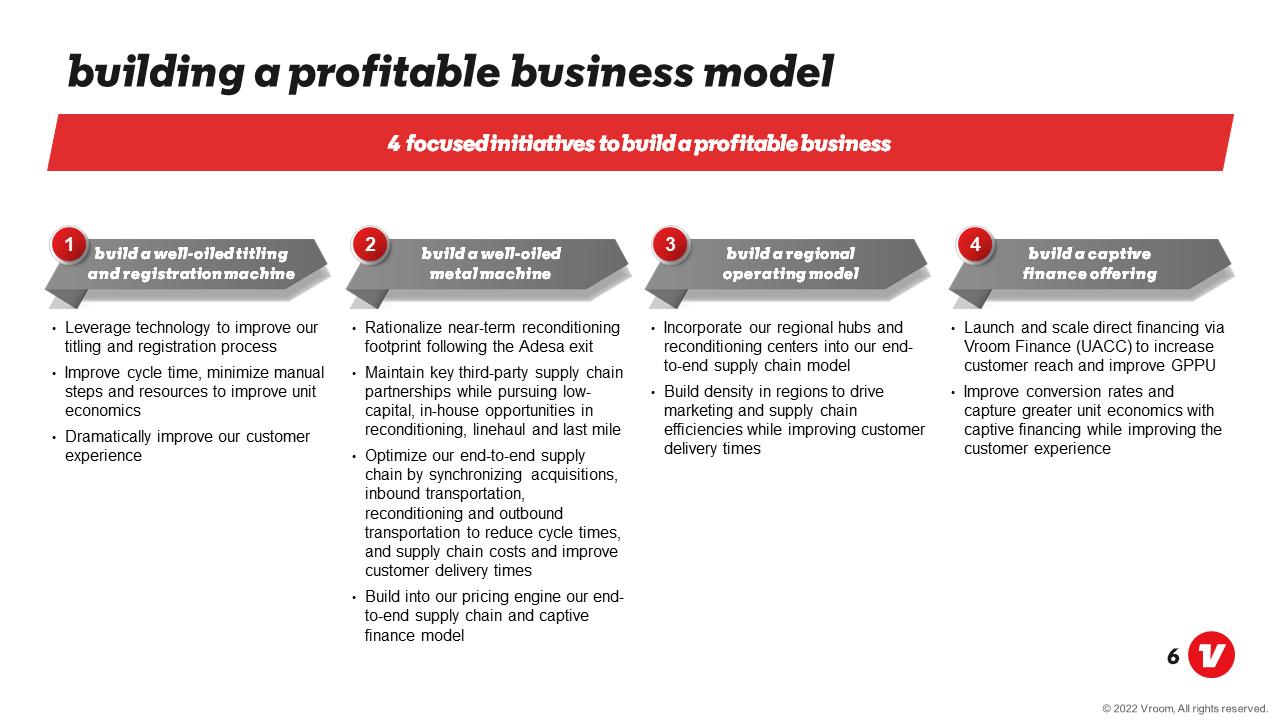
Building a profitable business model 4 focused initiatives to build a profitable business Build a well-oiled titling and registration machine Leverage technology to improve our titling and registration process Improve cycle time, minimize manual steps and resources to improve unit economics Dramatically improve our customer experience BUILD A WELL-OILED METAL MACHINE Rationalize near-term reconditioning footprint following the Adesa exit Maintain key third-party supply chain partnerships while pursuing low-capital, in-house opportunities in reconditioning, linehaul and last mile Optimize our end-to-end supply chain by synchronizing acquisitions, inbound transportation, reconditioning and outbound transportation to reduce cycle times, and supply chain costs and improve customer delivery times Build into our pricing engine our end-to-end supply chain and captive finance model Build a REGIONAL OPERATING MODEL Incorporate our regional hubs and reconditioning centers into our end-to-end supply chain model Build density in regions to drive marketing and supply chain efficiencies while improving customer delivery times BUILD A CAPTIVE FINANCE OFFERING Launch and scale direct financing via Vroom Finance (UACC) to increase customer reach and improve GPPU Improve conversion rates and capture greater unit economics with captive financing while improving the customer experience
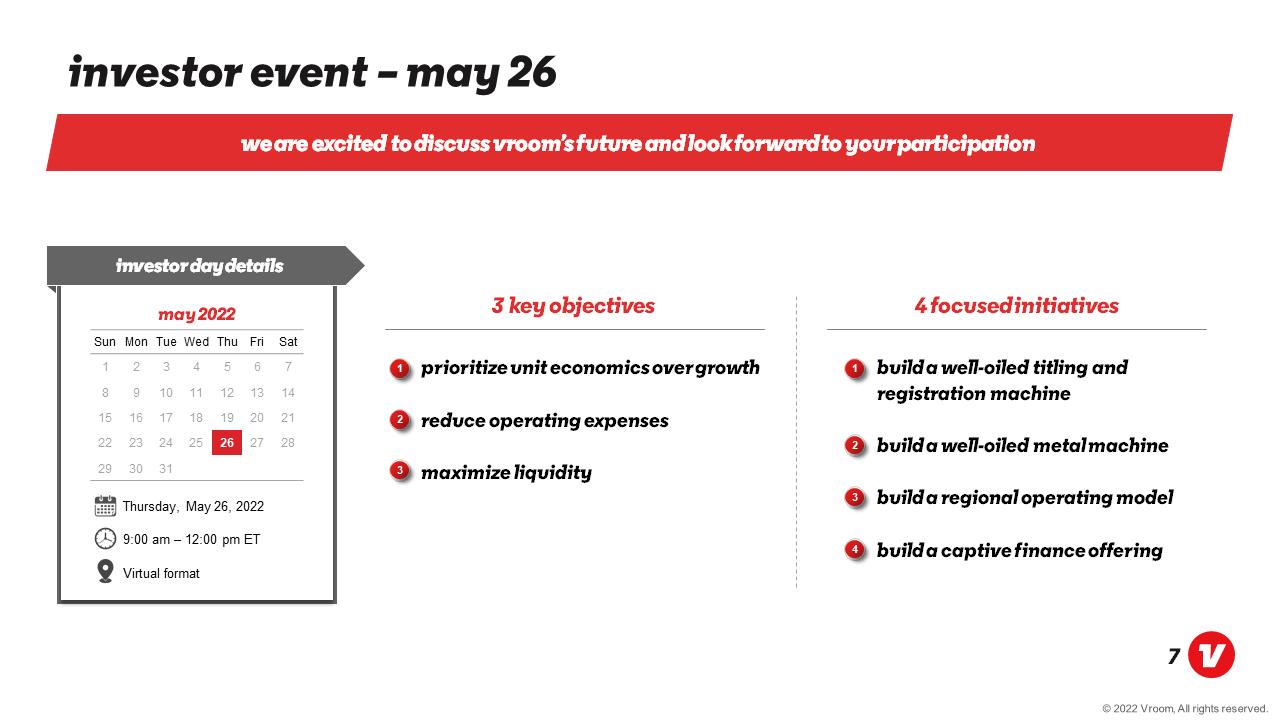
Investor event – May 26 We are excited to discuss Vroom’s future and look forward to your participation
Investor day details May 2022 Sun Mon Tue Wed Thu Fri Sat 1 2 3 4 5 6 7 8 9 10 11 12 13 14 15 16 17 18 19 20 21 22 23 24 25 26 27 28 29 30 31 Thursday, May 26, 2022 9:00 am – 12:00 pm ET Virtual format 3 key objectives Prioritize unit economics over growth Reduce operating expenses Maximize liquidity 4 focused initiatives Build a well-oiled titling and registration machine Build a well-oiled metal machine Build a regional operating model build a captive finance offering

Vroom First Quarter 2022 Financial Update May 2022
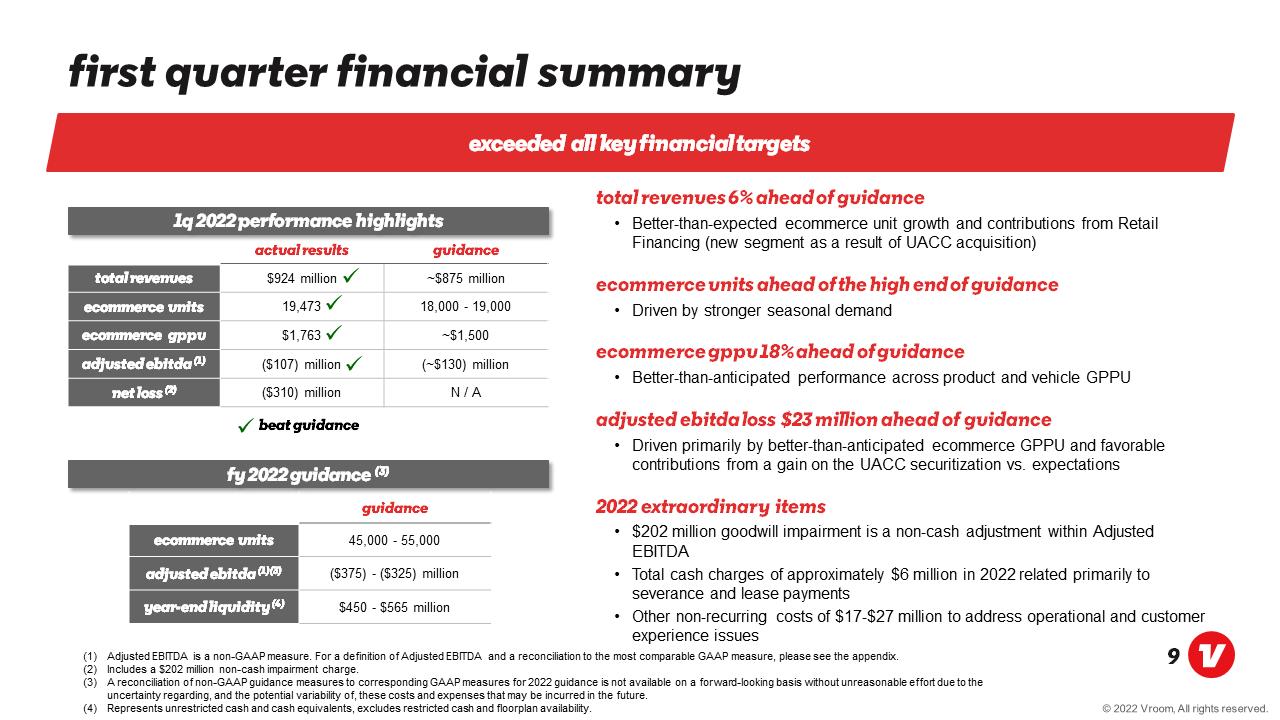
First quarter financial summary Exceeded all key financial targets 1Q 2022 Performance Highlights Total Revenues Ecommerce Units Ecommerce GPPU Adjusted EBITDA (1) Net loss (2) actual results $924 million 19,473 $1,763($107) million ($310) million guidance ~$875 million 18,000 - 19,000 ~$1,500 (~$130) million N / A Beat Guidance Fy 2022 Guidance (3) Ecommerce units Adjusted EBITDA (1) (3) Year-end liquidity (4) Guidance 45,000 - 55,000 ($375) - ($325) million $450 - $565 million Total revenues 6% ahead of guidance Better-than-expected ecommerce unit growth and contributions from Retail Financing (new segment as a result of UACC acquisition) Ecommerce units ahead of the high end of guidance Driven by stronger seasonal demand Ecommerce GPPU 18% ahead of guidance Better-than-anticipated performance across product and vehicle GPPU Adjusted ebitda loss $23 million ahead of guidance Driven primarily by better-than-anticipated ecommerce GPPU and favorable contributions from a gain on the UACC securitization vs. expectations 2022 extraordinary items $202 million goodwill impairment is a non-cash adjustment within Adjusted EBITDA Total cash charges of approximately $6 million in 2022 related primarily to severance and lease payments Other non-recurring costs of $17-$27 million to address operational and customer experience issues Adjusted EBITDA is a non-GAAP measure. For a definition of Adjusted EBITDA and a reconciliation to the most comparable GAAP measure, please see the appendix. Includes a $202 million non-cash impairment charge. A reconciliation of non-GAAP guidance measures to corresponding GAAP measures for 2022 guidance is not available on a forward-looking basis without unreasonable effort due to the uncertainty regarding, and the potential variability of, these costs and expenses that may be incurred in the future. Represents unrestricted cash and cash equivalents, excludes restricted cash and floorplan availability.
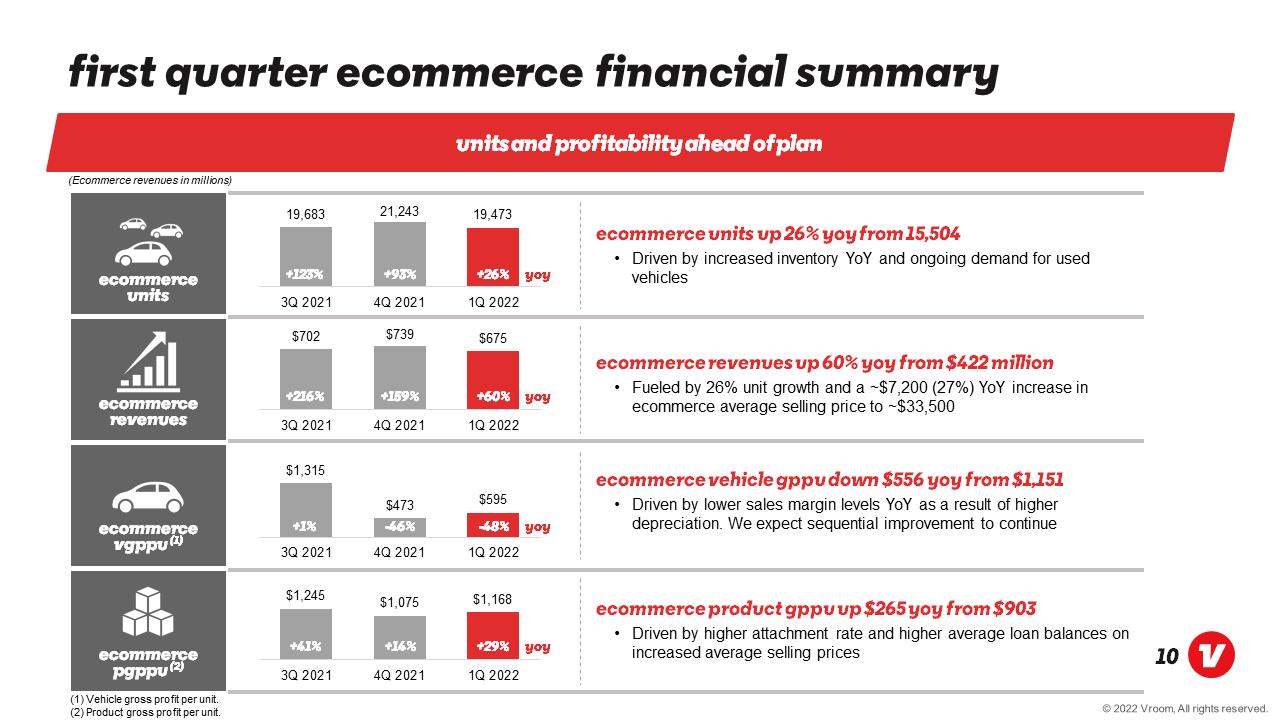
First quarter ecommerce financial summary Units and profitability ahead of plan (Ecommerce revenues in millions) Ecommerce units 19,683 +123% 3q2021 21,243 +93% 4q2021 19,473 +26% 1q2022 YoY Ecommerce Revenues $702 +216% 3q2021 $739 +159% 4q2021 $675 +60% 1q2022 YoY Ecommerce VGPPU (1) $1,315 +1% 3q2021 $473 -46% 4q2021 $595 -48% 1q2022 YoY Ecommerce PGPPU (2) $1,245 +41% 3q2021 $1,075 +14% 4q2021 $1,168 +29% 1q2022 Ecommerce units up 26% YoY from 15,504 Driven by increased inventory YoY and ongoing demand for used vehicles Ecommerce revenues up 60% YoY from $422 million Fueled by 26% unit growth and a ~$7,200 (27%) YoY increase in ecommerce average selling price to ~$33,500 Ecommerce vehicle GPPU down $556 YoY from $1,151 Driven by lower sales margin levels YoY as a result of higher depreciation. We expect sequential improvement to continue Ecommerce product GPPU up $265 YoY from $903 Driven by higher attachment rate and higher average loan balances on increased average selling prices
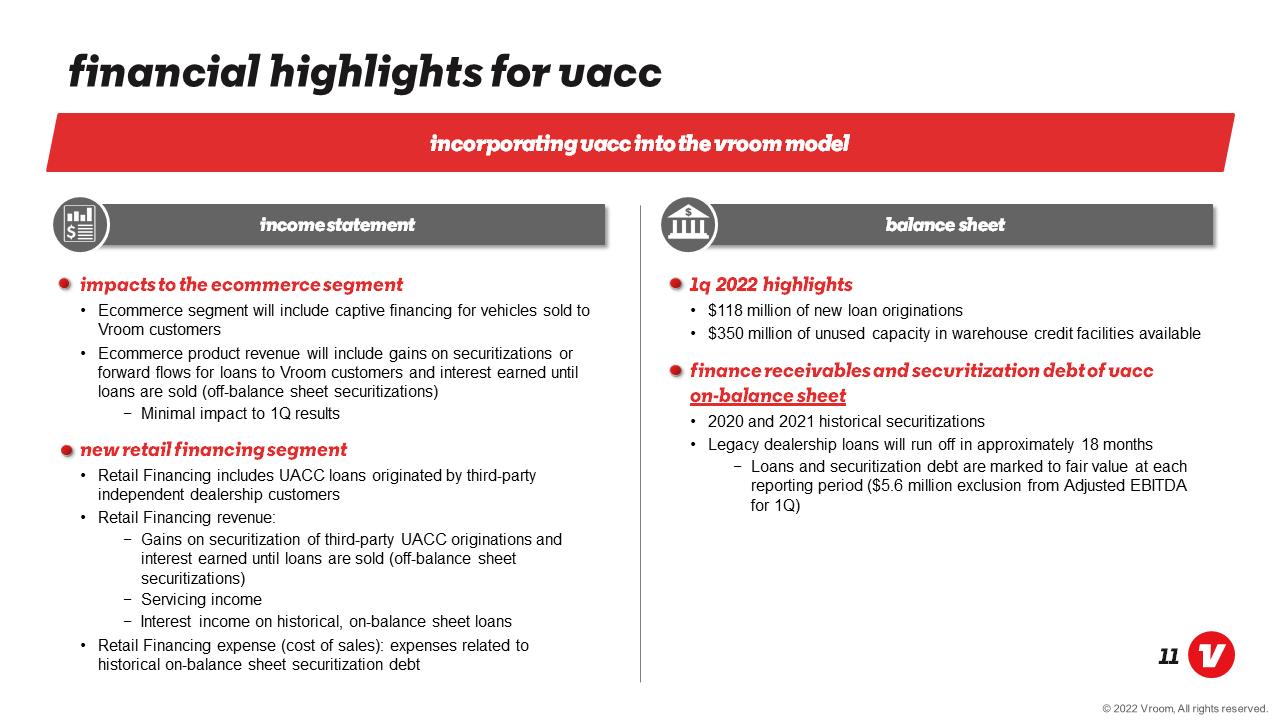
Financial highlights for uacc Incorporating uacc into the vroom model Income statement Impacts to the ecommerce segment Ecommerce segment will include captive financing for vehicles sold to Vroom customers Ecommerce product revenue will include gains on securitizations or forward flows for loans to Vroom customers and interest earned until loans are sold (off-balance sheet securitizations) Minimal impact to 1Q results New Retail financing segment Retail Financing includes UACC loans originated by third-party independent dealership customers Retail Financing revenue: Gains on securitization of third-party UACC originations and interest earned until loans are sold (off-balance sheet securitizations) Servicing income Interest income on historical, on-balance sheet loans Retail Financing expense (cost of sales): expenses related to historical on-balance sheet securitization debt Balance sheet 1q 2022 highlights $118 million of new loan originations $350 million of unused capacity in warehouse credit facilities available Finance receivables and securitization debt of uacc on-balance sheet 2020 and 2021 historical securitizations Legacy dealership loans will run off in approximately 18 months Loans and securitization debt are marked to fair value at each reporting period ($5.6 million exclusion from Adjusted EBITDA for 1Q)
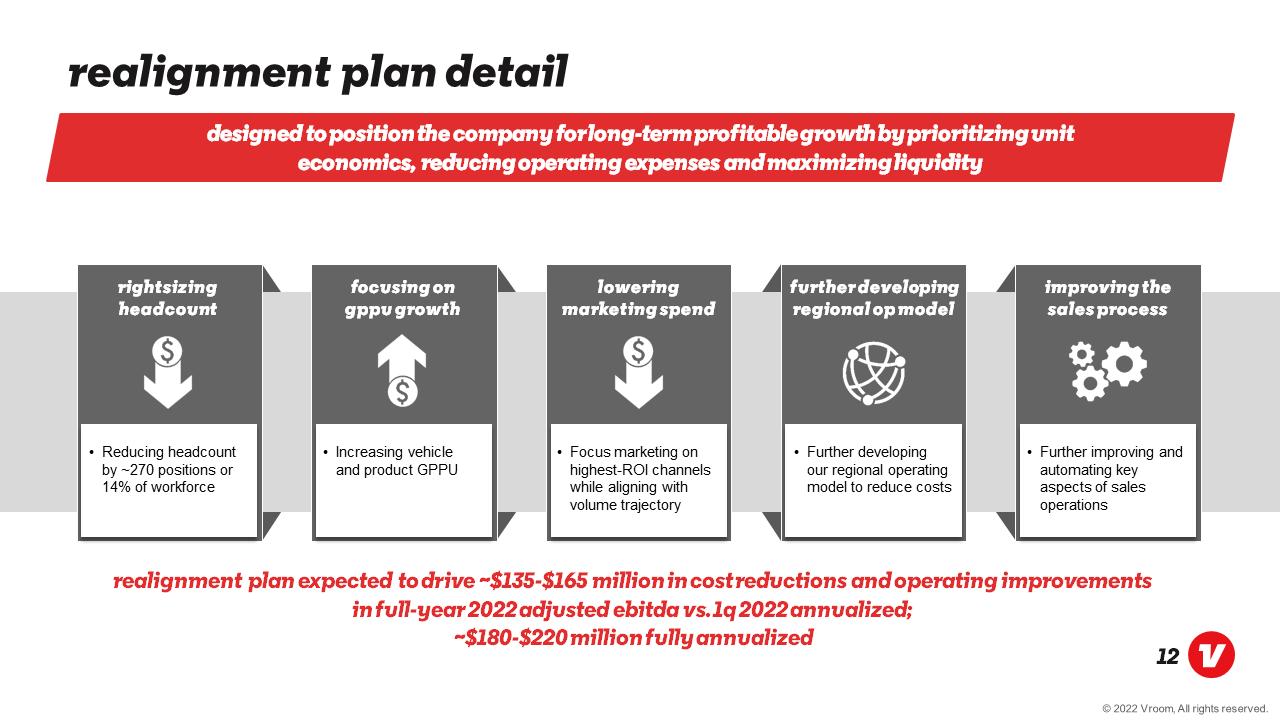
Realignment plan detail designed to position the Company for long-term profitable growth by prioritizing unit economics, reducing operating expenses and maximizing liquidity rightsizing Headcount Reducing headcount by ~270 positions or 14% of workforce Focusing on GPPU growth Increasing vehicle and product GPPU Lowering Marketing spend Focus marketing on highest-ROI channels while aligning with volume trajectory Further Developing regional op model Further developing our regional operating model to reduce costs Improving the sales process Further improving and automating key aspects of sales operations Realignment plan expected to drive ~$135-$165 million in cost reductions and operating improvements in full-year 2022 adjusted EBiTDA vs. 1q 2022 annualized; ~$180-$220 million fully annualized
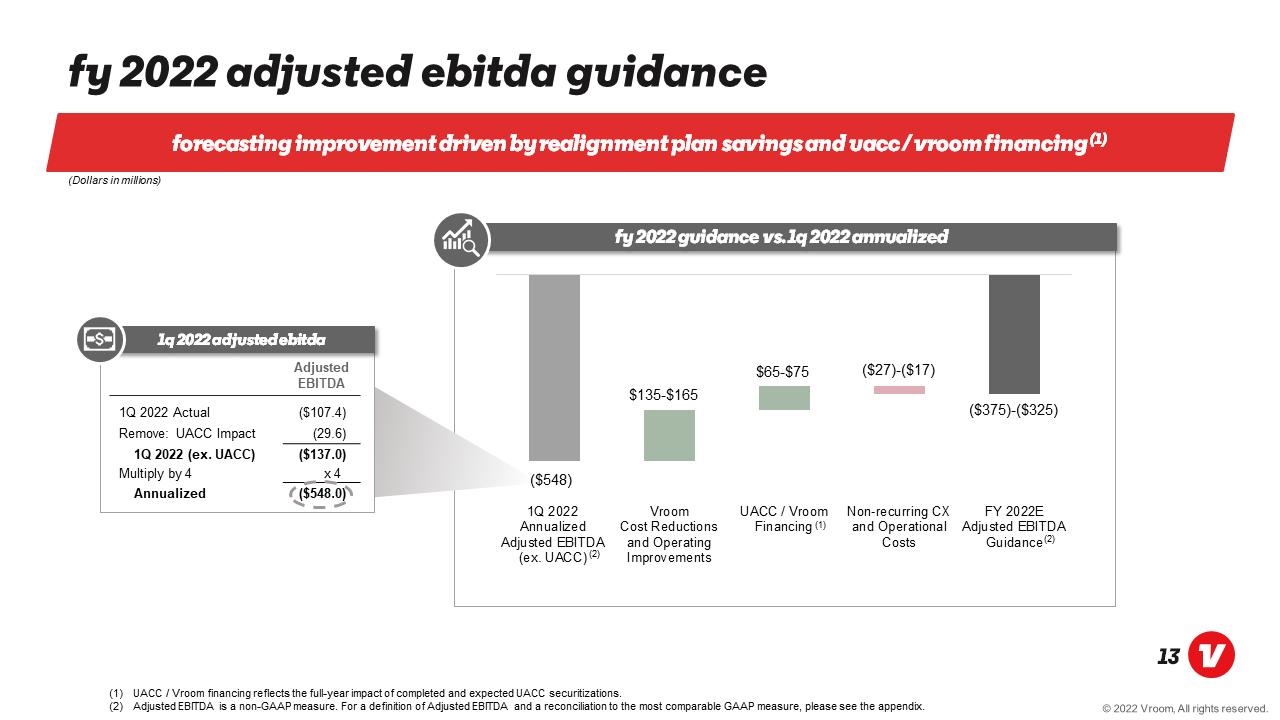
FY 2022 Adjusted Ebitda guidance Forecasting improvement driven by realignment plan savings and Uacc / vroom financing (1) (Dollars in millions) Adjusted EBITDA 1Q 2022 Actual ($107.4) Remove: UACC Impact (29.6) 1Q 2022 (ex. UACC) ($137.0) Multiply by 4 x 4 Annualized ($548.0) $135-$165 $65-$75 ($27)-($17) ($375)-($325) ($548) iq 2022 annualized adjusted ebitda (ex. Uacc)(2) vroom cost reductions and operating improvements uacc / vroom financing (1) non – recurring cx and operational costs fy 2022e adjusted ebitda guidance (2) (1) UACC / Vroom financing reflects the full-year impact of completed and expected UACC securitizations. (2) Adjusted EBITDA is a non-GAAP measure. For a definition of Adjusted EBITDA and a reconciliation to the most comparable GAAP measure, please see the appendix.
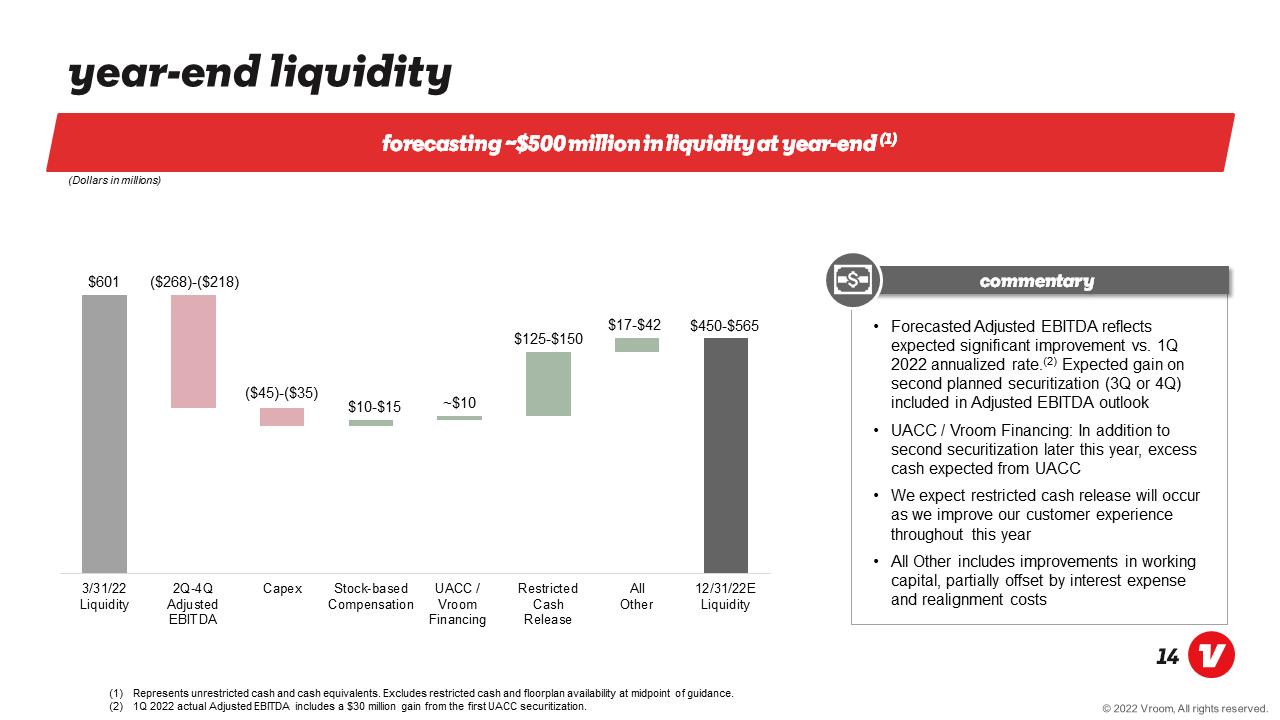
Year-end liquidity Forecasting ~$500 million in liquidity at year-end (1) (Dollars in millions) $601 ($268)-($218) ($45)-($35) $10-$15 ~$10 $125-$150 $17-$42 $450-$565 3/31/22 liquidity 2q-4q adjusted ebitda capex stock-based compensation uacc / vroom financing restricted cash release all other 12/31/22e liquidity Forecasted Adjusted EBITDA reflects expected significant improvement vs. 1Q 2022 annualized rate.(2) Expected gain on second planned securitization (3Q or 4Q) included in Adjusted EBITDA outlook UACC / Vroom Financing: In addition to second securitization later this year, excess cash expected from UACC We expect restricted cash release will occur as we improve our customer experience throughout this year All Other includes improvements in working capital, partially offset by interest expense and realignment costs (1) Represents unrestricted cash and cash equivalents. Excludes restricted cash and floorplan availability at midpoint of guidance. (2) 1Q 2022 actual Adjusted EBITDA includes a $30 million gain from the first UACC securitization.
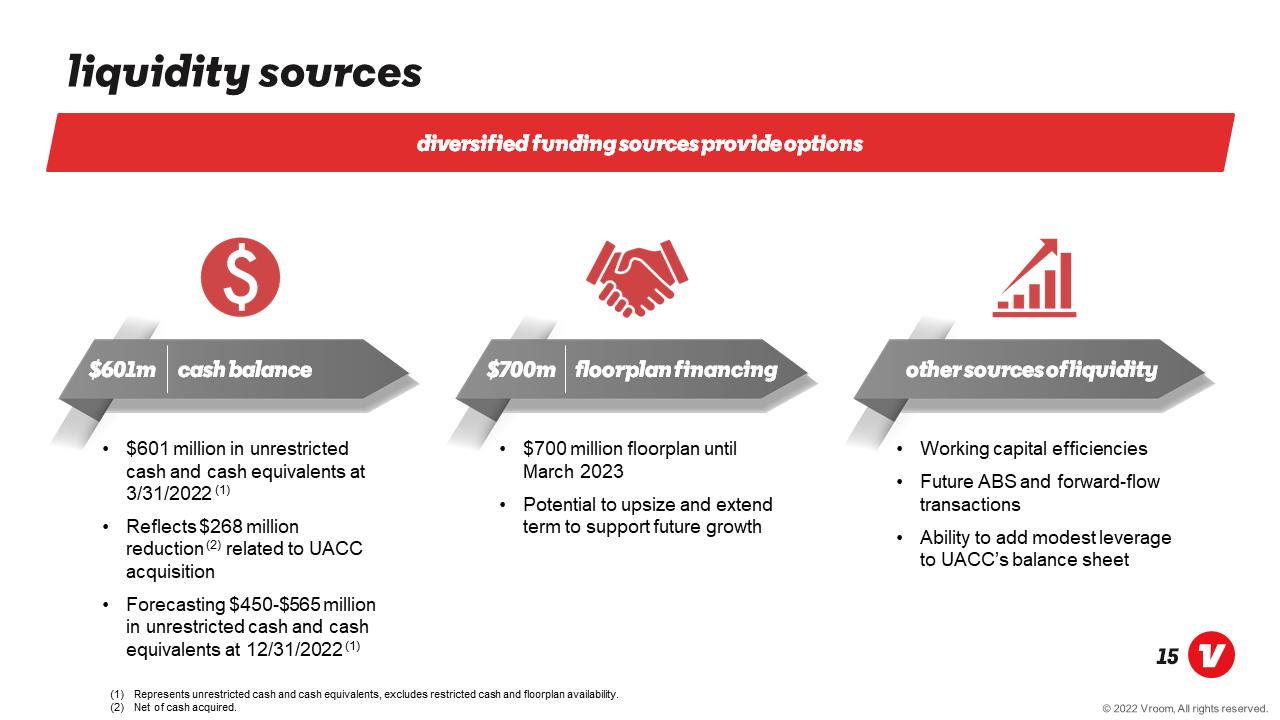
Liquidity sources Diversified funding sources provide options $601m Cash balance $601 million in unrestricted cash and cash equivalents at 3/31/2022 (1) Reflects $268 million reduction (2) related to UACC acquisition Forecasting $450-$565 million in unrestricted cash and cash equivalents at 12/31/2022 (1) $700M Floorplan financing $700 million floorplan until March 2023 Potential to upsize and extend term to support future growth Other sources of liquidity Working capital efficiencies Future ABS and forward-flow transactions Ability to add modest leverage to UACC’s balance sheet
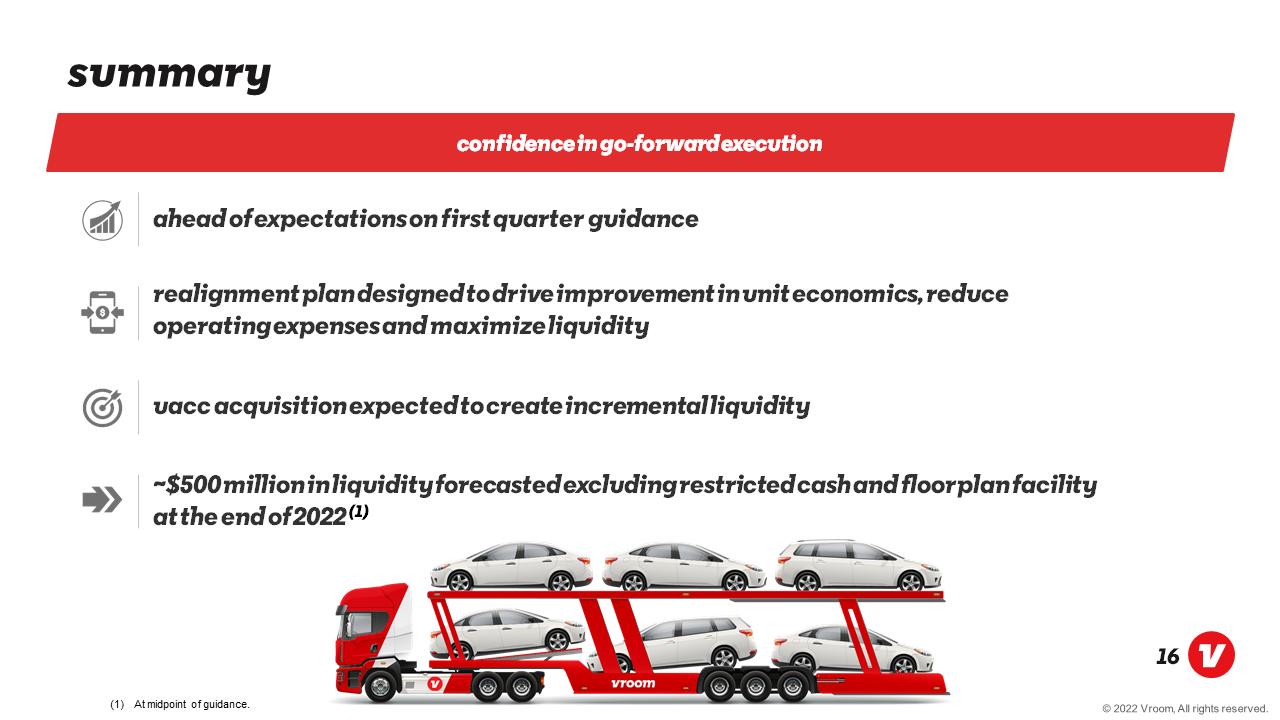
Summary confidence in go-forward execution Ahead of expectations on first quarter guidance Realignment plan designed to drive improvement in unit economics, reduce operating expenses and maximize liquidity Uacc acquisition expected to create incremental liquidity ~$500 million in liquidity forecasted excluding restricted cash and floorplan facility at the end of 2022 (1) At midpoint of guidance.

Appendix May 2022
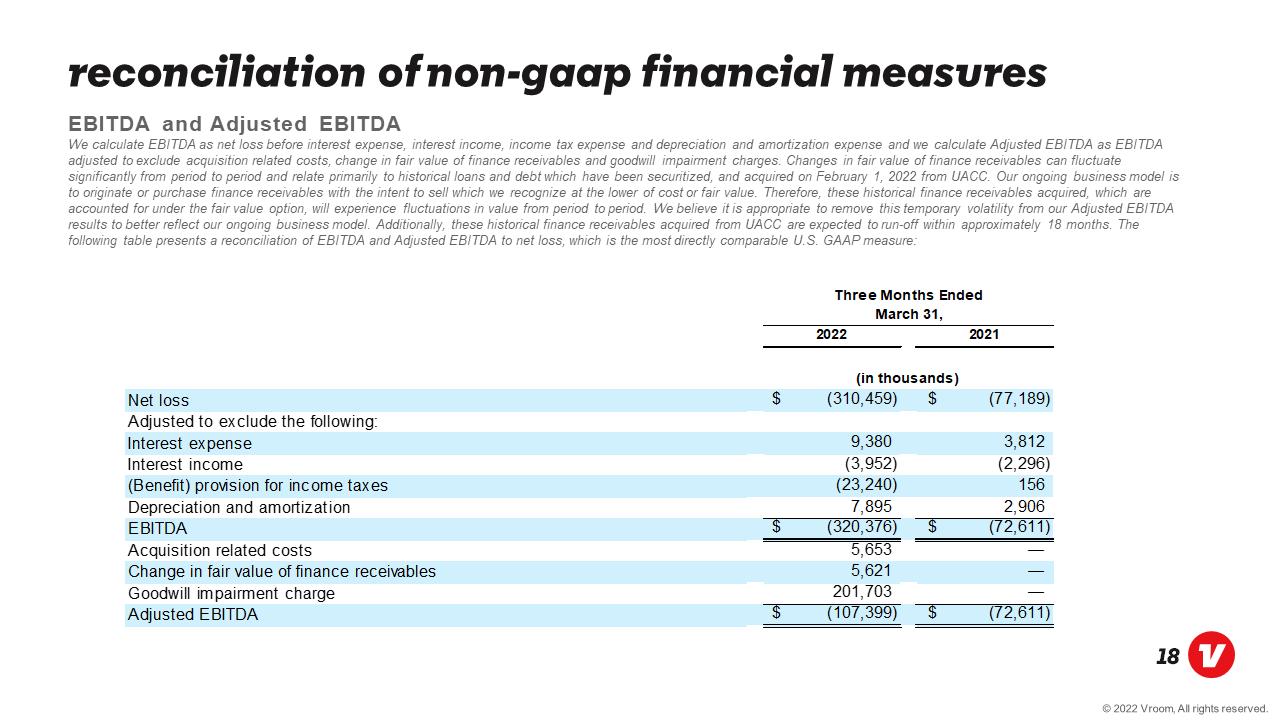
Reconciliation of Non-GAAP Financial measures EBITDA and Adjusted EBITDA We calculate EBITDA as net loss before interest expense, interest income, income tax expense and depreciation and amortization expense and we calculate Adjusted EBITDA as EBITDA adjusted to exclude acquisition related costs, change in fair value of finance receivables and goodwill impairment charges. Changes in fair value of finance receivables can fluctuate significantly from period to period and relate primarily to historical loans and debt which have been securitized, and acquired on February 1, 2022 from UACC. Our ongoing business model is to originate or purchase finance receivables with the intent to sell which we recognize at the lower of cost or fair value. Therefore, these historical finance receivables acquired, which are accounted for under the fair value option, will experience fluctuations in value from period to period. We believe it is appropriate to remove this temporary volatility from our Adjusted EBITDA results to better reflect our ongoing business model. Additionally, these historical finance receivables acquired from UACC are expected to run-off within approximately 18 months. The following table presents a reconciliation of EBITDA and Adjusted EBITDA to net loss, which is the most directly comparable U.S. GAAP measure:2022 2021 Net loss (310,459) $ (77,189) $ Adjusted to exclude the following: Interest expense 9,380 3,812 Interest income (3,952) (2,296) (Benefit) provision for income taxes (23,240) 156 Depreciation and amortization 7,895 2,906 EBITDA (320,376) $ (72,611) $ Acquisition related costs 5,653 — Change in fair value of finance receivables 5,621 — Goodwill impairment charge 201,703 — Adjusted EBITDA (107,399) $ (72,611) $ Three Months Ended March 31, (in thousands)
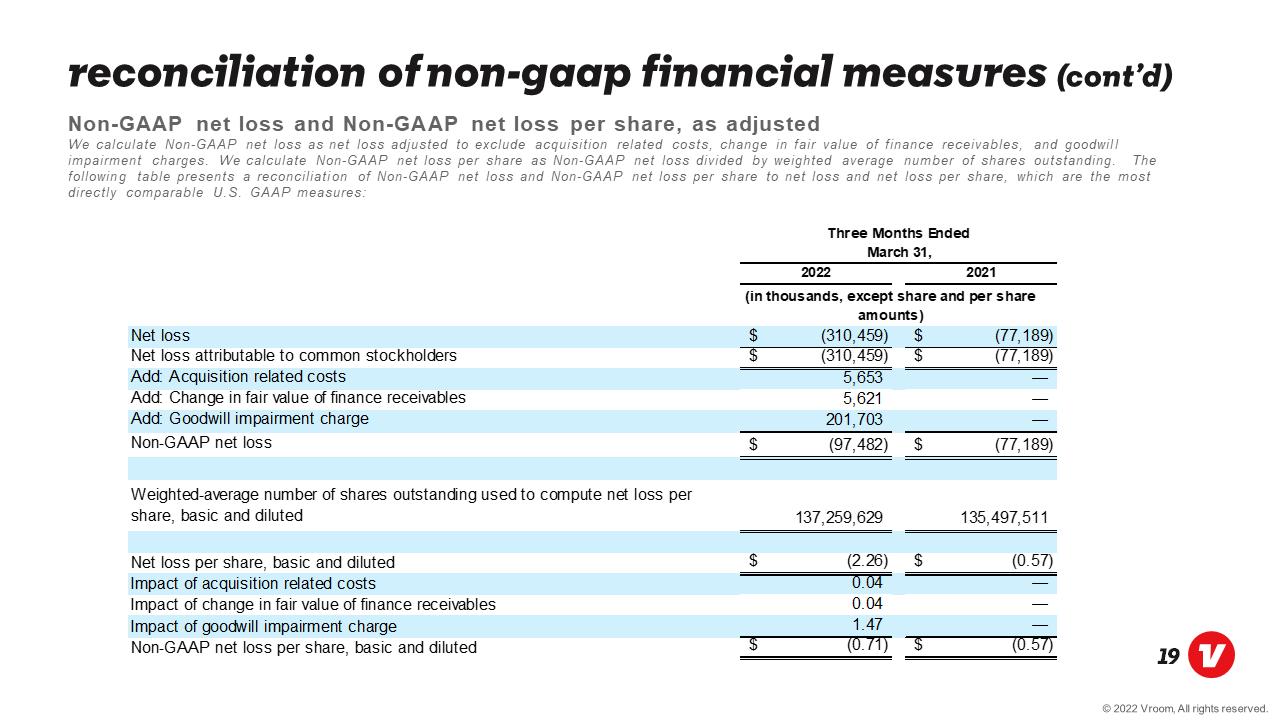
Reconciliation of Non-GAAP Financial measures (cont’d) Non-GAAP net loss and Non-GAAP net loss per share, as adjusted We calculate Non-GAAP net loss as net loss adjusted to exclude acquisition related costs, change in fair value of finance receivables, and goodwill impairment charges. We calculate Non-GAAP net loss per share as Non-GAAP net loss divided by weighted average number of shares outstanding. The following table presents a reconciliation of Non-GAAP net loss and Non-GAAP net loss per share to net loss and net loss per share, which are the most directly comparable U.S. GAAP measures: Net loss (310,459) $ (77,189) $ Net loss attributable to common stockholders (310,459) $ (77,189) $ Add: Acquisition related costs 5,653 — Add: Change in fair value of finance receivables 5,621 — Add: Goodwill impairment charge 201,703 — Non-GAAP net loss (97,482) $ (77,189) $ Weighted-average number of shares outstanding used to compute net loss per share, basic and diluted 137,259,629 135,497,511 Net loss per share, basic and diluted (2.26) $ (0.57) $ Impact of acquisition related costs 0.04 — Impact of change in fair value of finance receivables 0.04 — Impact of goodwill impairment charge 1.47 — Non-GAAP net loss per share, basic and diluted (0.71) $ (0.57) $ Three Months Ended March 31, (in thousands, except share and per share amounts) 2022 2021

Thank you!