Exhibit 99.2

vroom Third Quarter2022 Earnings November 2022
disclaimer Forward Looking Statements This presentation contains forward-looking statements within the meaning of the Private Securities Litigation Reform Act of 1995. All statements contained in this presentation that do not relate to matters of historical fact should be considered forward-looking statements, including without limitation, statements regarding the expected timeline, our execution of and the expected benefits from our business Realignment Plan and cost-saving initiatives, our expectations regarding our business strategy and plans, including our ongoing efforts to integrate and develop United Auto Credit Corporation into a captive finance operation, as well as our ability to scale our business, address operational challenges, expand reconditioning capacity, invest in logistics and improve our end-to-end customer experience, and statements regarding our future results of operations and financial position, including our ability to improve our unit economics, lower our operating expenses and our financial outlook including with respect to our liquidity, our profitability, and our cash balances, for the fiscal year 2022. These statements are based on management’s current assumptions and are neither promises nor guarantees, but involve known and unknown risks, uncertainties and other important factors that may cause our actual results, performance or achievements to be materially different from any future results, performance or achievements expressed or implied by the forward-looking statements. For factors that could cause actual results to differ materially from the forward-looking statements in this presentation, please see the risks and uncertainties identified under the heading "Risk Factors" in our Annual Report on Form 10-K for the year ended December 31, 2021, as updated by our Quarterly report on Form 10-Q for the quarter ended September 30, 2022, each of which is available on our Investor Relations website at ir.vroom.comand on the SEC website at www.sec.gov. All forward-looking statements reflect our beliefs and assumptions only as of the date of this presentation. We undertake no obligation to update forward-looking statements to reflect future events or circumstances.Industry and Market Information To the extent this presentation includes information concerning the industry and the markets in which the Company operates, including general observations, expectations, market position, market opportunity and market size, such information is based on management's knowledge and experience in the markets in which we operate, including publicly available information from independent industry analysts and publications, as well as the Company’s own estimates. Our estimates are based on third-party sources, as well as internal research, which the Company believes to be reasonable, but which are inherently uncertain and imprecise. Accordingly, you are cautioned not to place undue reliance on such market and industry information.Financial Presentation and Use of Non-GAAP Financial Measures Certain monetary amounts, percentages and other figures included in this presentation have been subject to rounding adjustments. Certain other amounts that appear in this presentation may not sum due to rounding.This presentation contains certain supplemental financial measures that are not calculated pursuant to U.S. generally accepted accounting principles (“GAAP”). These non-GAAP measures are in addition to, and not a substitute or superior to, measures of financial performance prepared in accordance with GAAP. These non-GAAP financial measures have limitations as analytical tools in that they do not reflect all of the amounts associated with our results of operations as determined in accordance with U.S. GAAP. Because of these limitations, these non-GAAP financial measures should be considered along with other operating and financial performance measures presented in accordance with U.S. GAAP. We have reconciled all non-GAAP financial measures with the most directly comparable U.S. GAAP financial measures in the Appendix to this presentation.
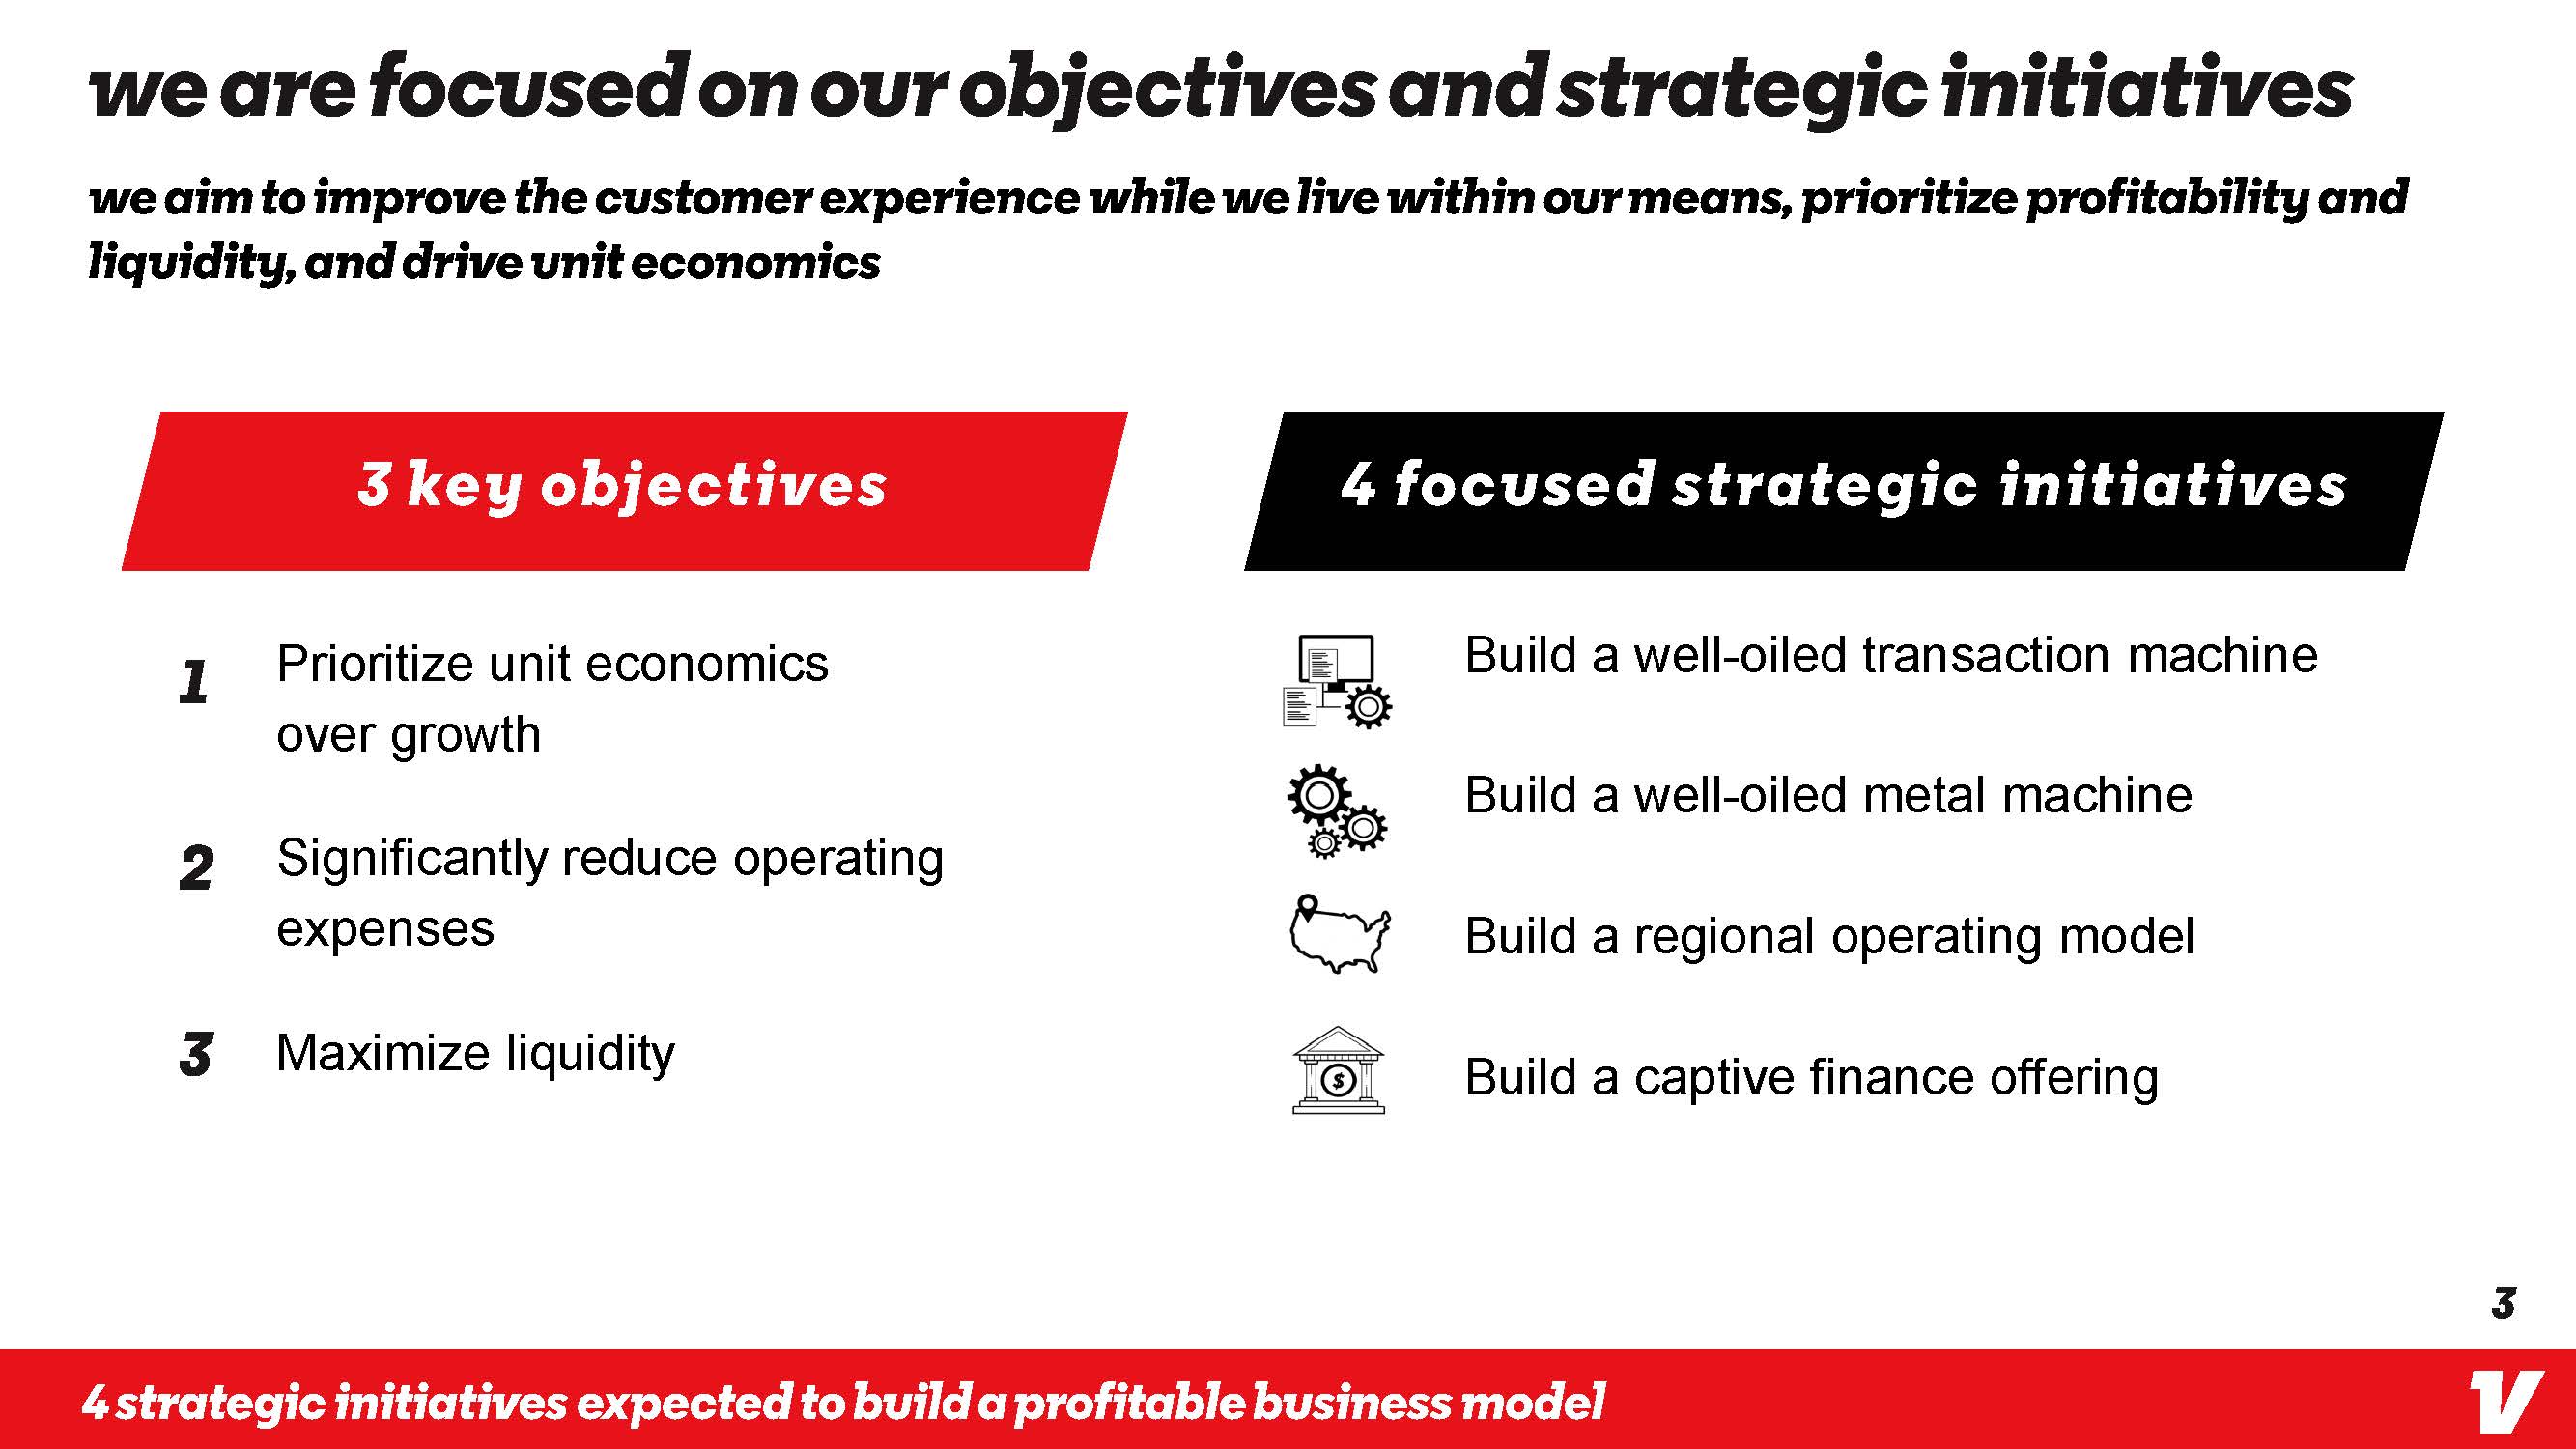
We are Focused on our objectives and Strategic initiatives We aim to improve the customer experience while we live within our means, prioritize profitability and liquidity, and drive unit economics 3 Key Objectives 4 Focused Strategic Initiatives 1 Prioritize unit economics over growth 2 Significantly reduce operating expenses 3 Maximize liquidity Build a well-oiled transaction machine Build a well-oiled metal machine Build a regional operating model Build a captive finance offering 3 4 Strategic initiatives expected to build a profitable business model 3
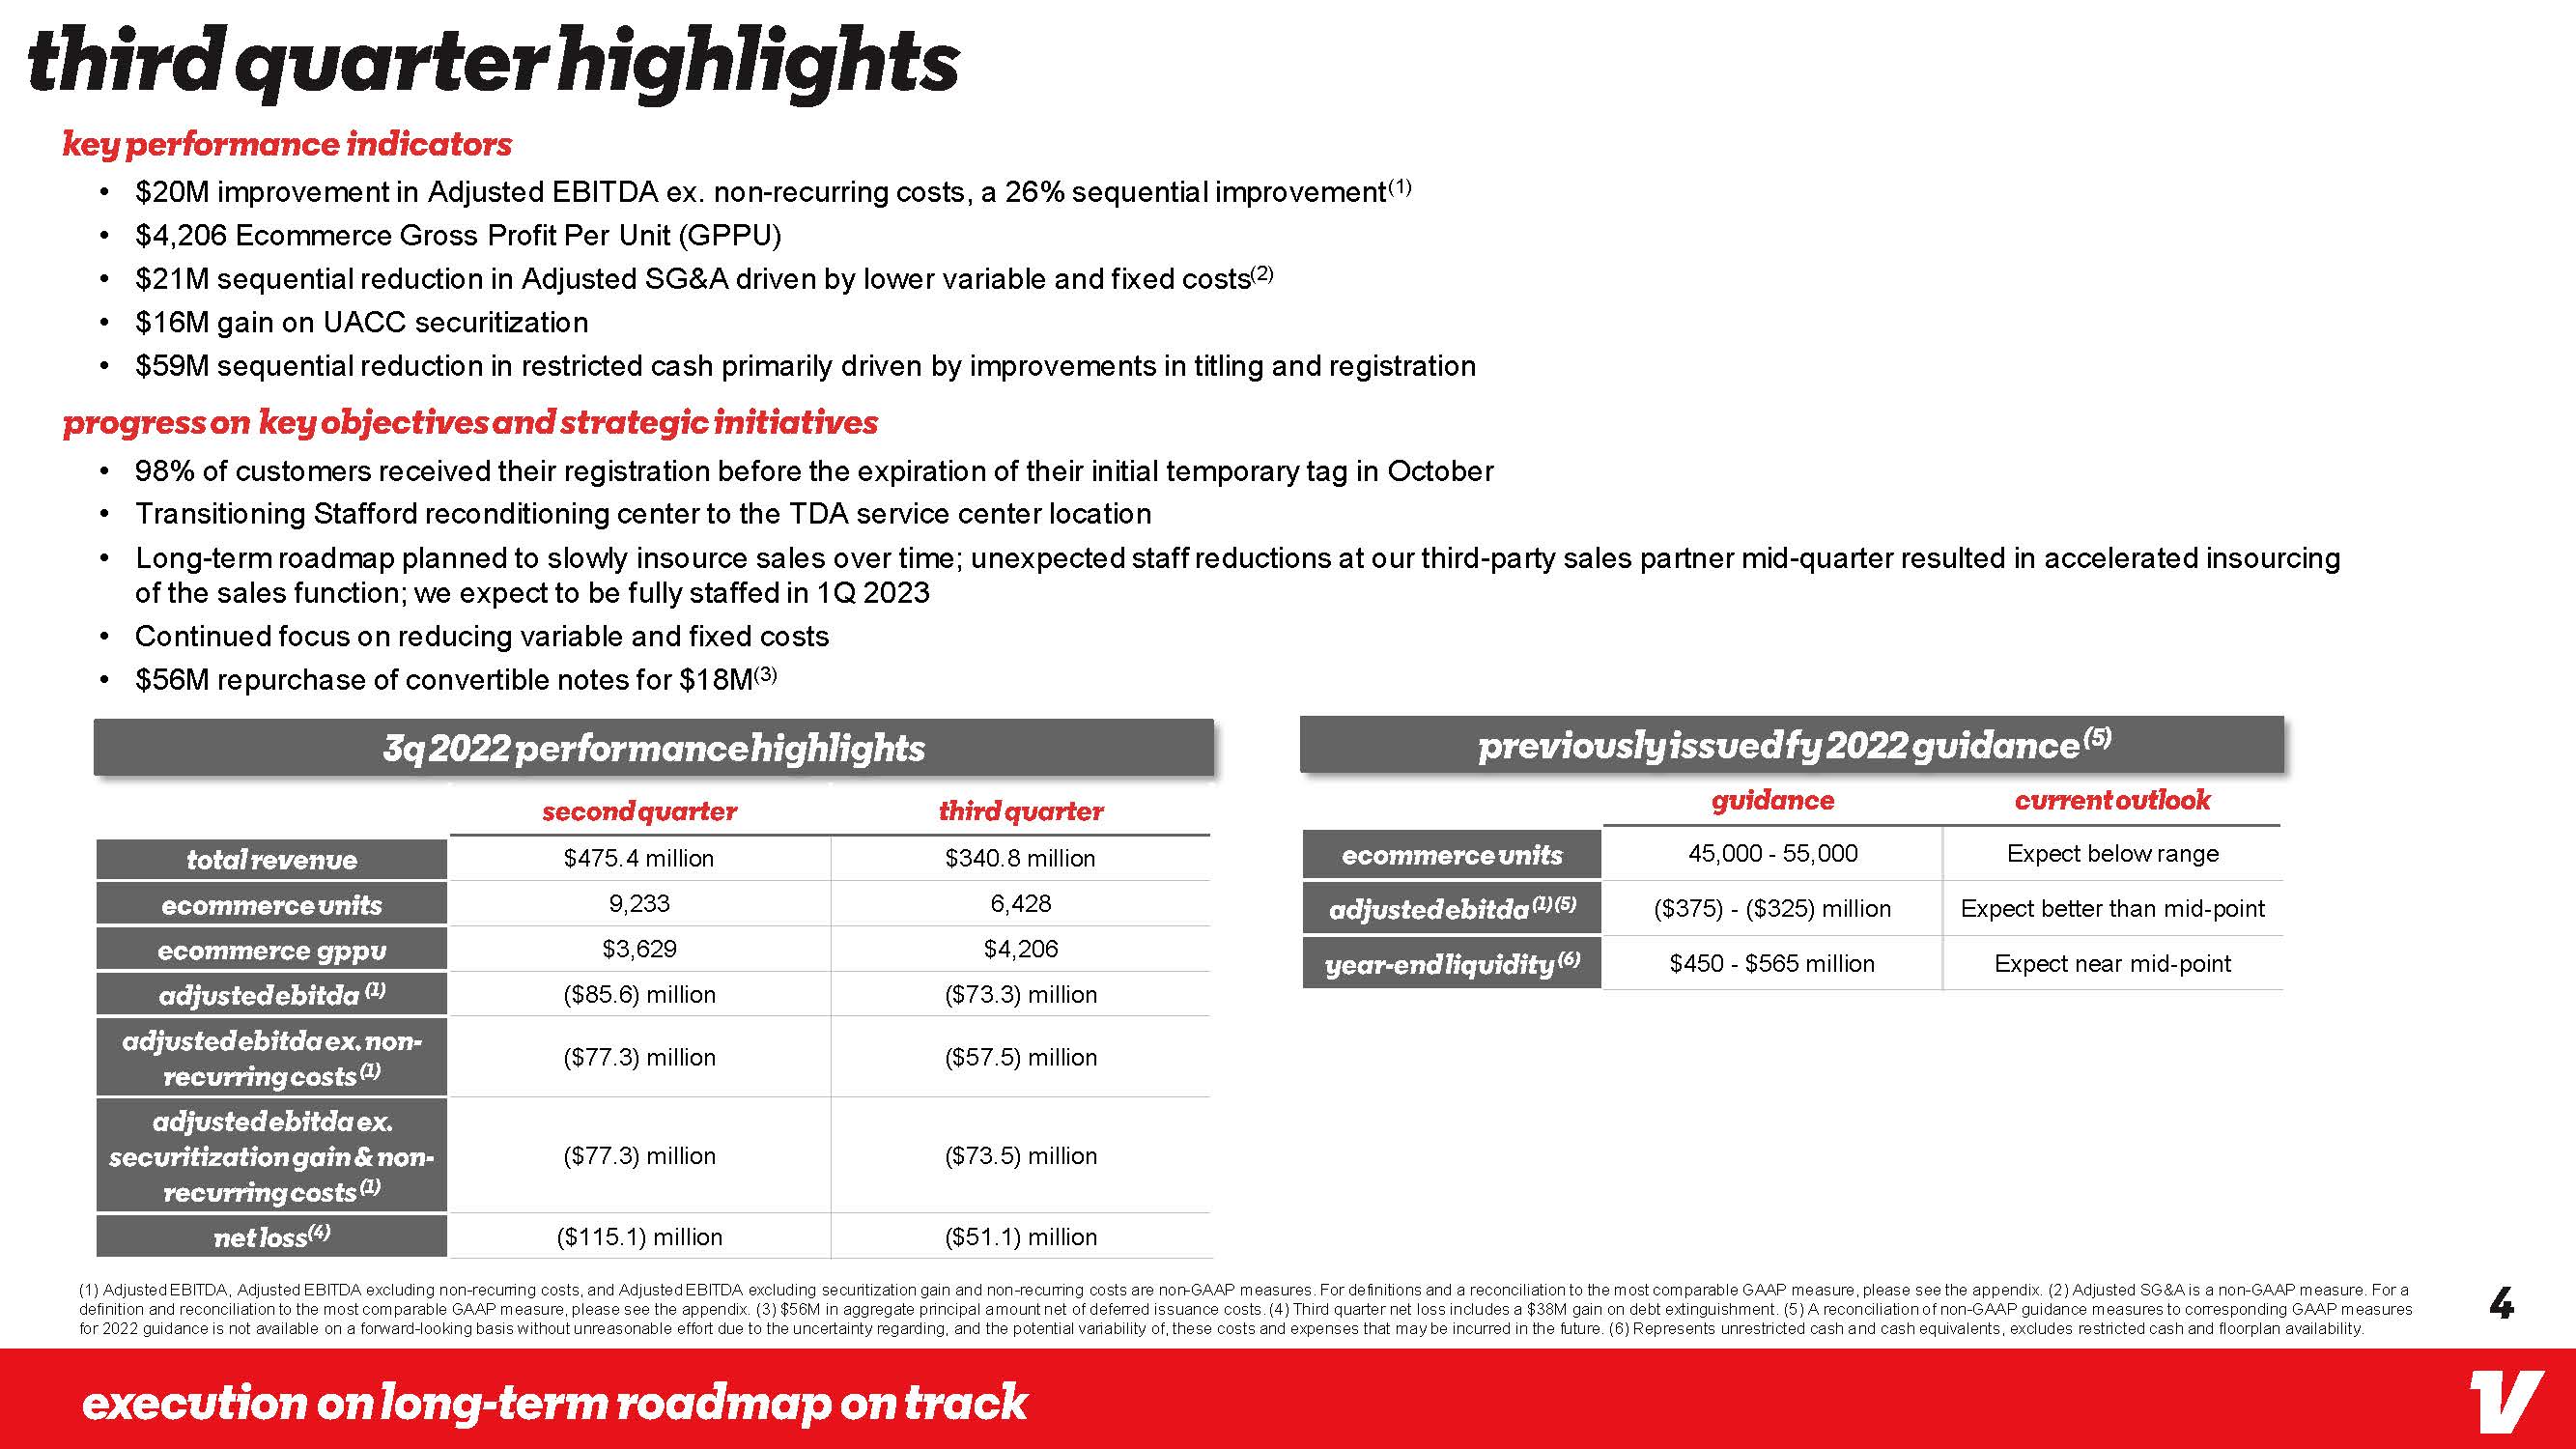
Third quarter highlights key performance indicators $20M improvement in Adjusted EBITDA ex. non-recurring costs, a 26% sequential improvement(1) $4,206 Ecommerce Gross Profit Per Unit (GPPU) $21M sequential reduction in Adjusted SG&A driven by lower variable and fixed costs(2) $16M gain on UACC securitization $59M sequential reduction in restricted cash primarily driven by improvements in titling and registration progress on key objectives and strategic initiatives 98% of customers received their registration before the expiration of their initial temporary tag in October Transitioning Stafford reconditioning center to the TDA service center location Long-term roadmap planned to slowly insource sales over time; unexpected staff reductions at our third-party sales partner mid-quarter resulted in accelerated insourcing of the sales function; we expect to be fully staffed in 1Q 2023 Continued focus on reducing variable and fixed costs $56M repurchase of convertible notes for $18M(3) 3q 2022 Performance Highlights previously issued fy 2022 Guidance (5) Second quarter Third quarter Guidance Current outlook Total Revenue $475.4 million $340.8 million Ecommerce units 45,000 - 55,000 Expect below range Ecommerce Units 9,233 6,428 Adjusted EBITDA (1) (5) ($375) - ($325) million Expect better than mid-point Ecommerce GPPU $3,629 $4,206 Year-end liquidity (6) $450 - $565 million Expect near mid-point Adjusted EBITDa (1) ($85.6) million ($73.3) million Adjusted EBITDa ex. Non-recurring costs (1) ($77.3) million ($57.5) million Adjusted EBITDa ex. Securitization gain & Non-recurring costs (1) ($77.3) million ($73.5) million Net loss(4) ($115.1) million ($51.1) million (1) Adjusted EBITDA, Adjusted EBITDA excluding non-recurring costs, and Adjusted EBITDA excluding securitization gain and non-recurring costs are non-GAAP measures. For definitions and a reconciliation to the most comparable GAAP measure, please see the appendix. (2) Adjusted SG&A is a non-GAAP measure. For a definition and reconciliation to the most comparable GAAP measure, please see the appendix. (3) $56M in aggregate principal amount net of deferred issuance costs. (4) Third quarter net loss includes a $38M gain on debt extinguishment. (5) A reconciliation of non-GAAP guidance measures to corresponding GAAP measures for 2022 guidance is not available on a forward-looking basis without unreasonable effort due to the uncertainty regarding, and the potential variability of, these costs and expenses that may be incurred in the future. (6) Represents unrestricted cash and cash equivalents, excludes restricted cash and floorplan availability. Execution on long-term roadmap on track 4
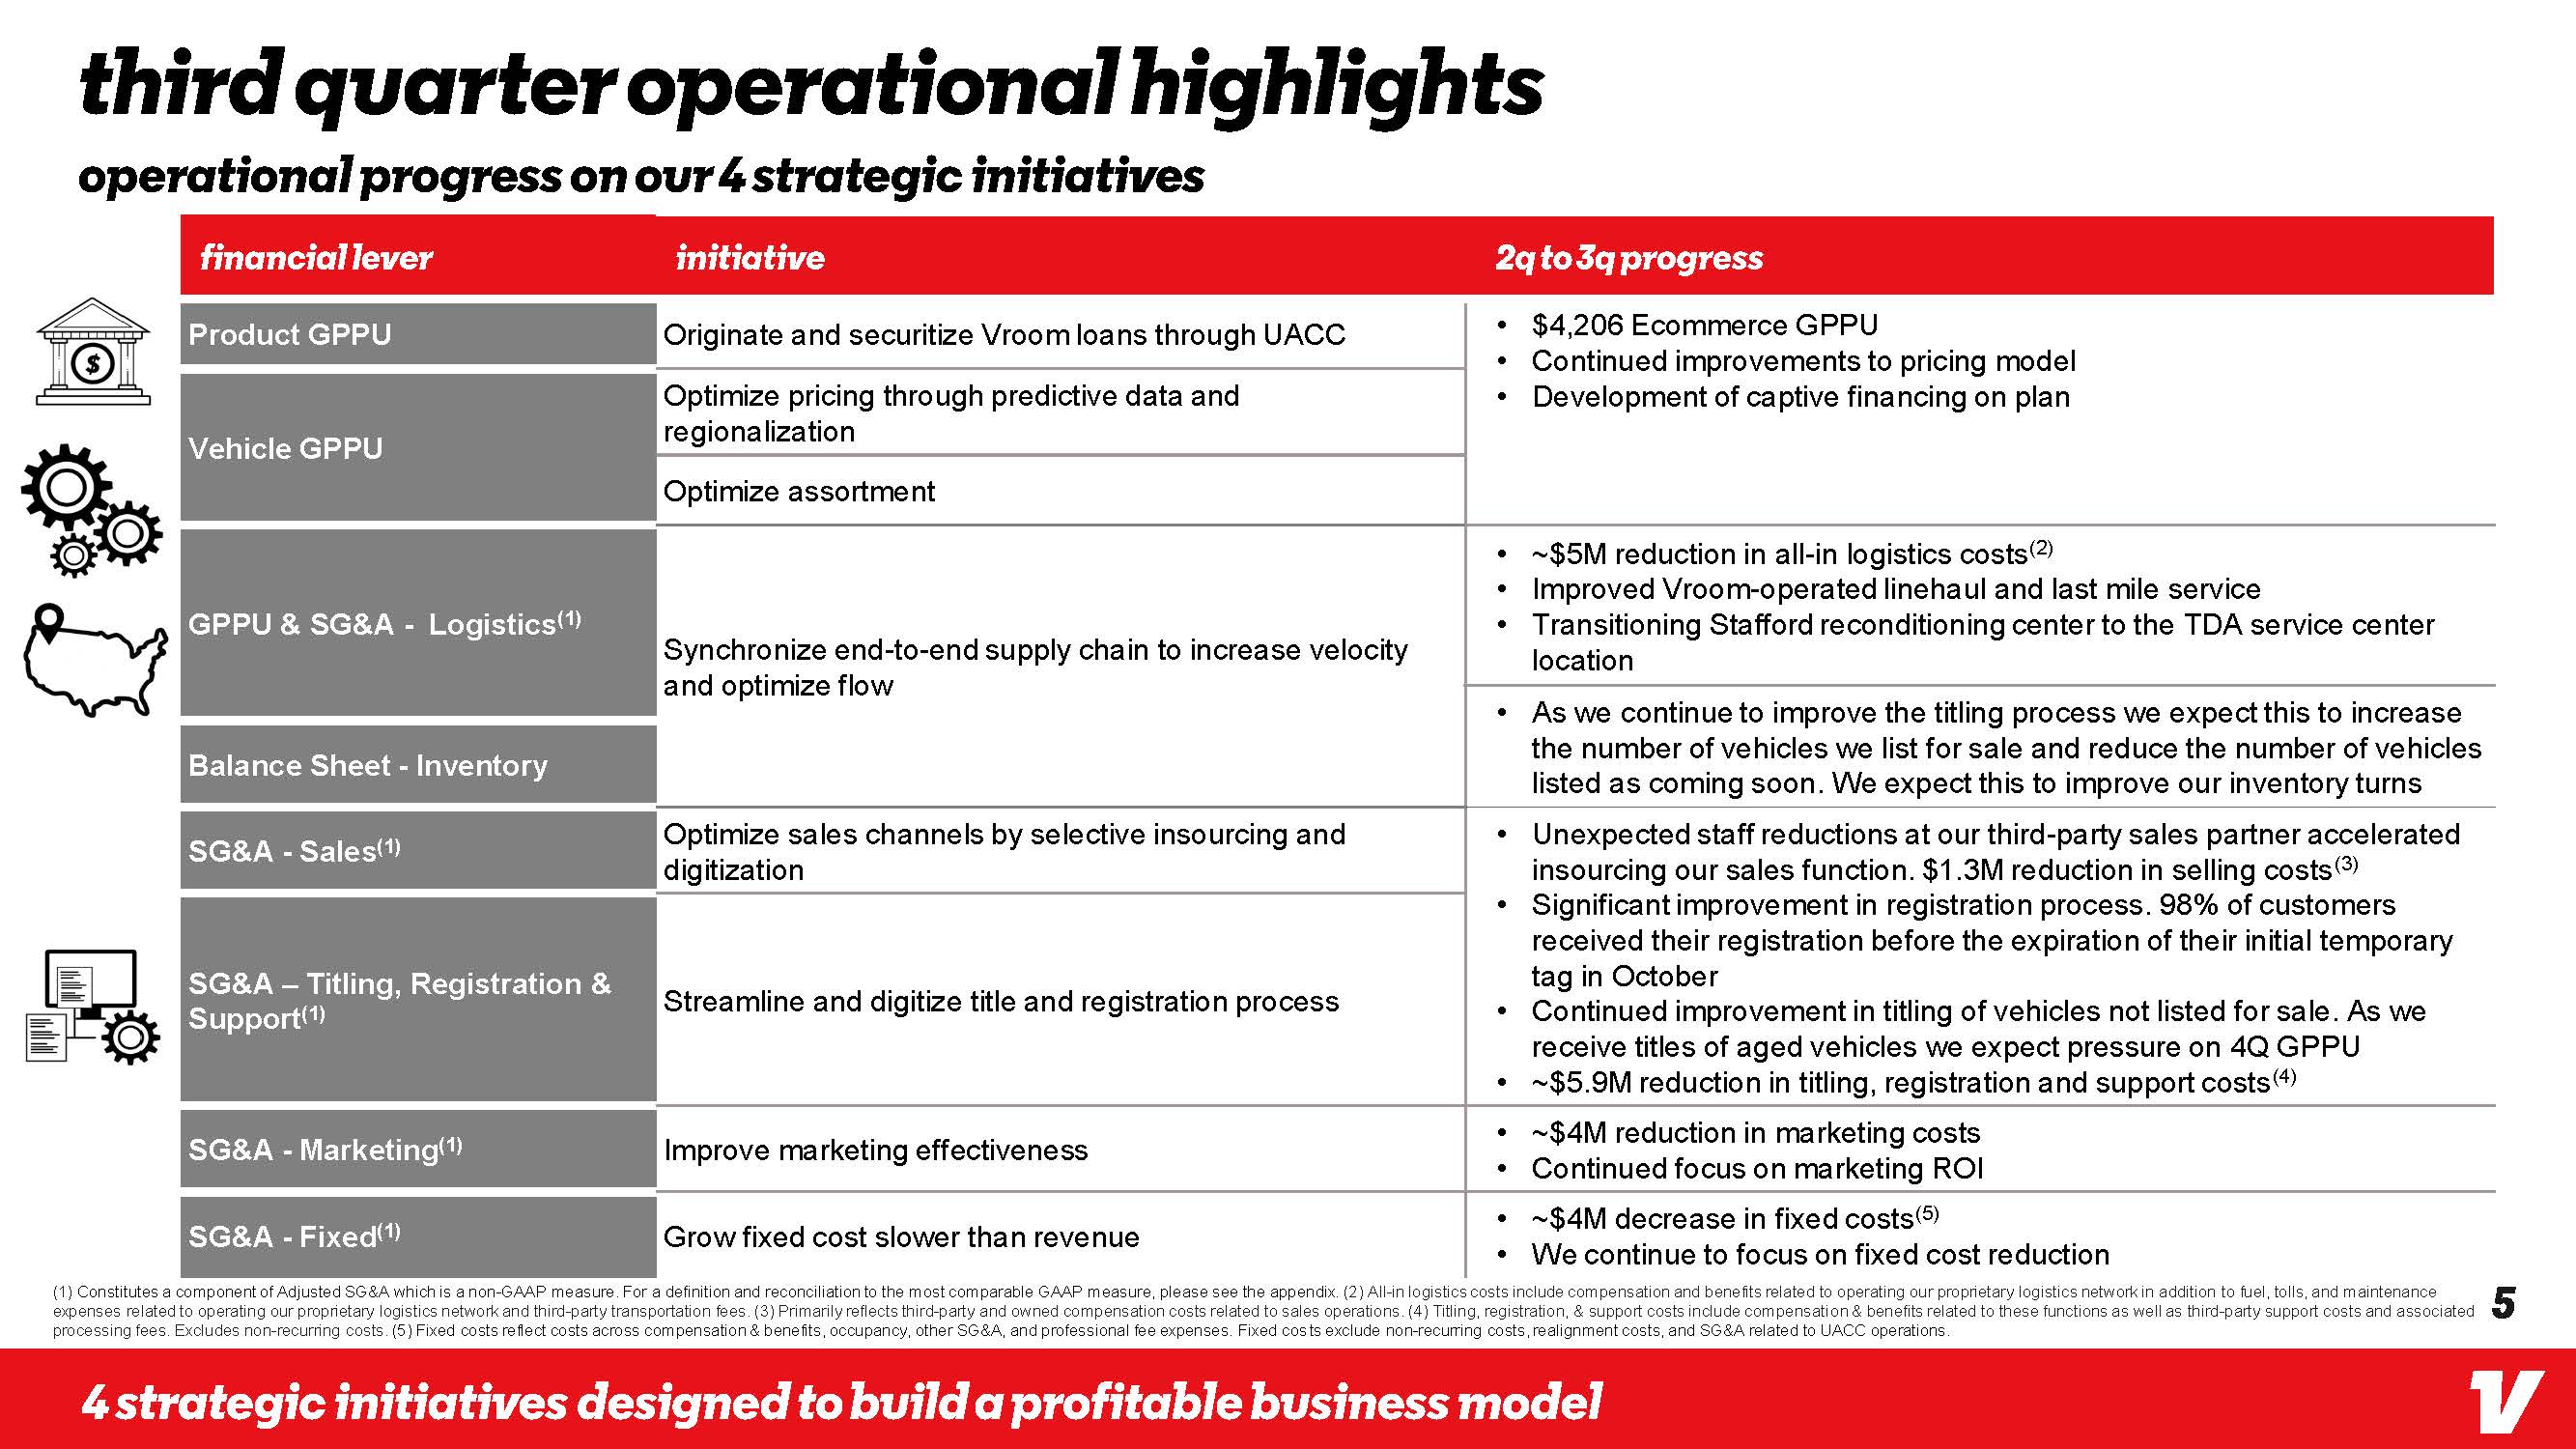
Third quarter Operational highlights Operational progress on our 4 strategic initiatives Financial Lever Initiative 2q to 3q progress Product GPPU Originate and securitize Vroom loans through UACC $4,206 Ecommerce GPPU Continued improvements to pricing model Development of captive financing on plan Vehicle GPPU Optimize pricing through predictive data and regionalization Optimize assortment GPPU & SG&A - Logistics(1) Synchronize end-to-end supply chain to increase velocity and optimize flow ~$5M reduction in all-in logistics costs(2) Improved Vroom-operated linehaul and last mile service Transitioning Stafford reconditioning center to the TDA service center location Balance Sheet – Inventory As we continue to improve the titling process we expect this to increase the number of vehicles we list for sale and reduce the number of vehicles listed as coming soon. We expect this to improve our inventory turns SG&A - Sales(1) Optimize sales channels by selective insourcing and digitization SG&A – Titling, Registration & Support(1) Streamline and digitize title and registration process Unexpected staff reductions at our third-party sales partner accelerated insourcing our sales function. $1.3M reduction in selling costs(3) Significant improvement in registration process. 98% of customers received their registration before the expiration of their initial temporary tag in October Continued improvement in titling of vehicles not listed for sale. As we receive titles of aged vehicles we expect pressure on 4Q GPPU ~$5.9M reduction in titling, registration and support costs(4) SG&A - Marketing(1) Improve marketing effectiveness ~$4M reduction in marketing costs Continued focus on marketing ROI SG&A - Fixed(1) Grow fixed cost slower than revenue ~$4M decrease in fixed costs(5) We continue to focus on fixed cost reduction (1) Constitutes a component of Adjusted SG&A which is a non-GAAP measure. For a definition and reconciliation to the most comparable GAAP measure, please see the appendix. (2) All-in logistics costs include compensation and benefits related to operating our proprietary logistics network in addition to fuel, tolls, and maintenance expenses related to operating our proprietary logistics network and third-party transportation fees. (3) Primarily reflects third-party and owned compensation costs related to sales operations. (4) Titling, registration, & support costs include compensation & benefits related to these functions as well as third-party support costs and associated processing fees. Excludes non-recurring costs. (5) Fixed costs reflect costs across compensation & benefits, occupancy, other SG&A, and professional fee expenses. Fixed costs exclude non-recurring costs, realignment costs, and SG&A related to UACC operations. 4 Strategic initiatives designed to build a profitable business model 5
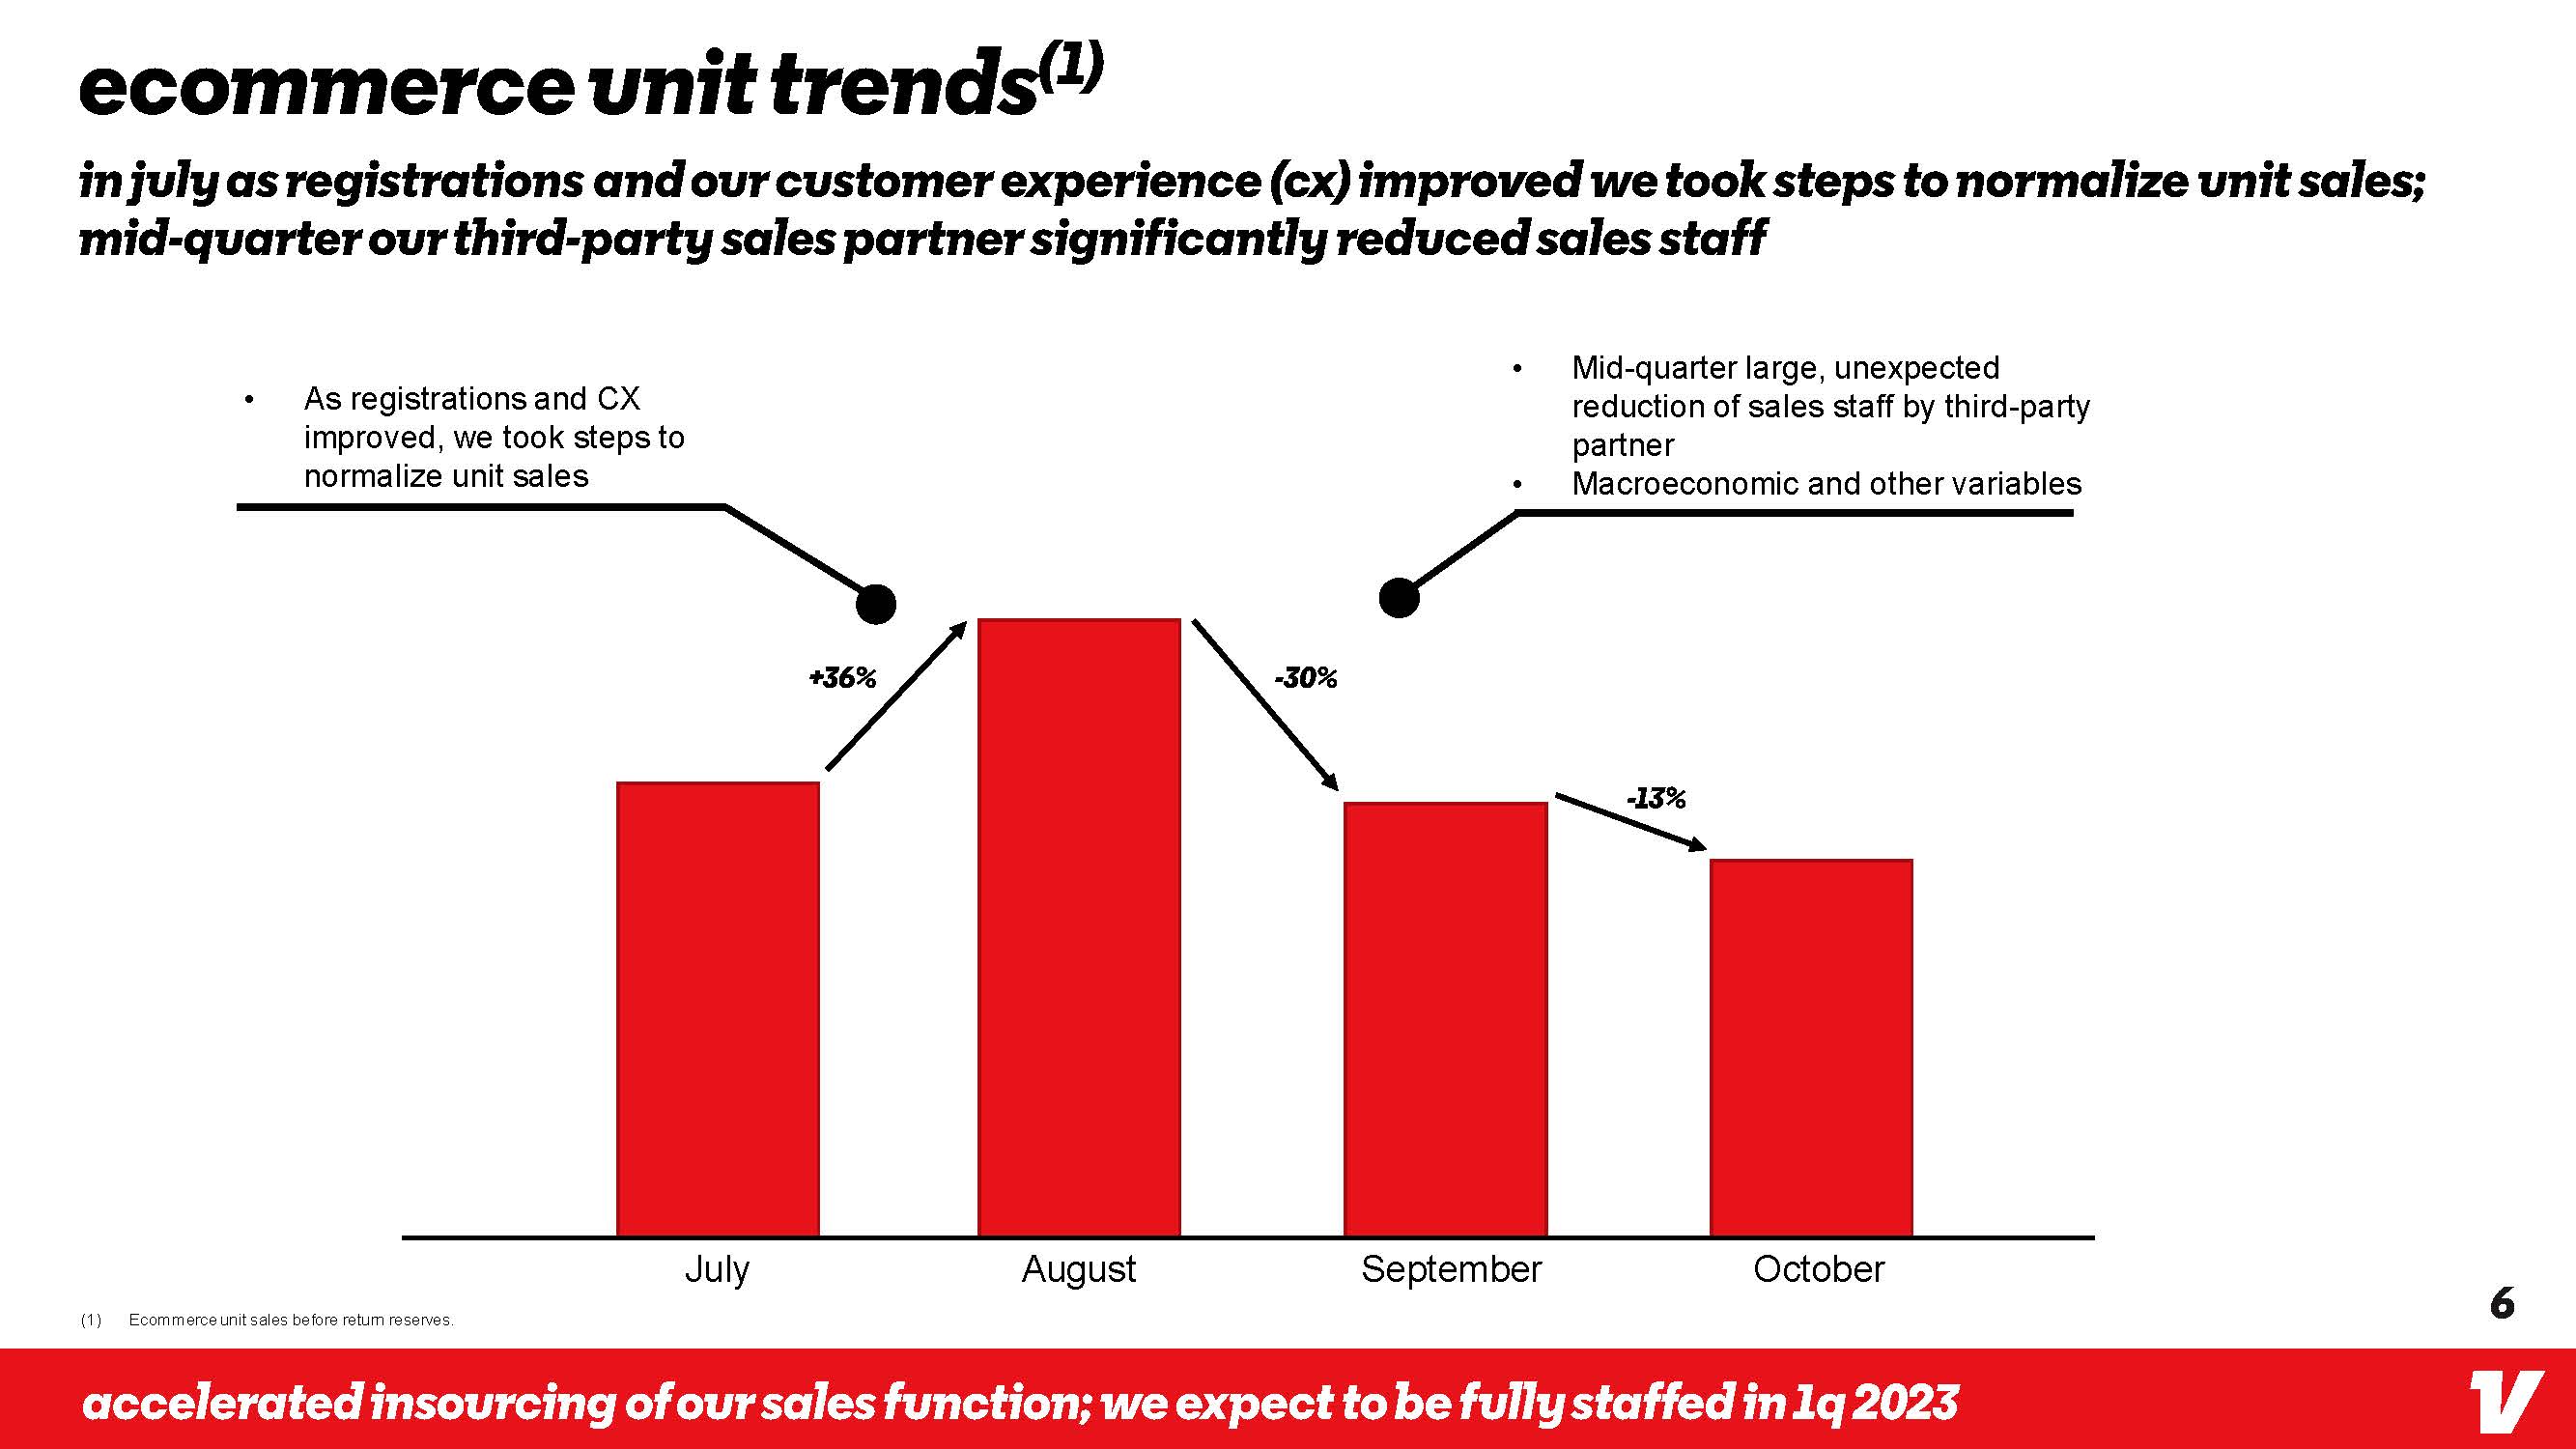
ecommerce unit trends(1) In July As registrations and our customer experience (CX) improved we took steps to normalize unit sales; mid-quarter our third-party sales partner significantly reduced sales staff As registrations and CX improved, we took steps to normalize unit sales Mid-quarter large, unexpected reduction of sales staff by third-party partner Macroeconomic and other variables +36% -30% -13% July August September October(1) Ecommerce unit sales before return reserves. accelerated insourcing of our sales function; we expect to be fully staffed in 1q 2023 6

Vroom Third Quarter 2022 Financial Update
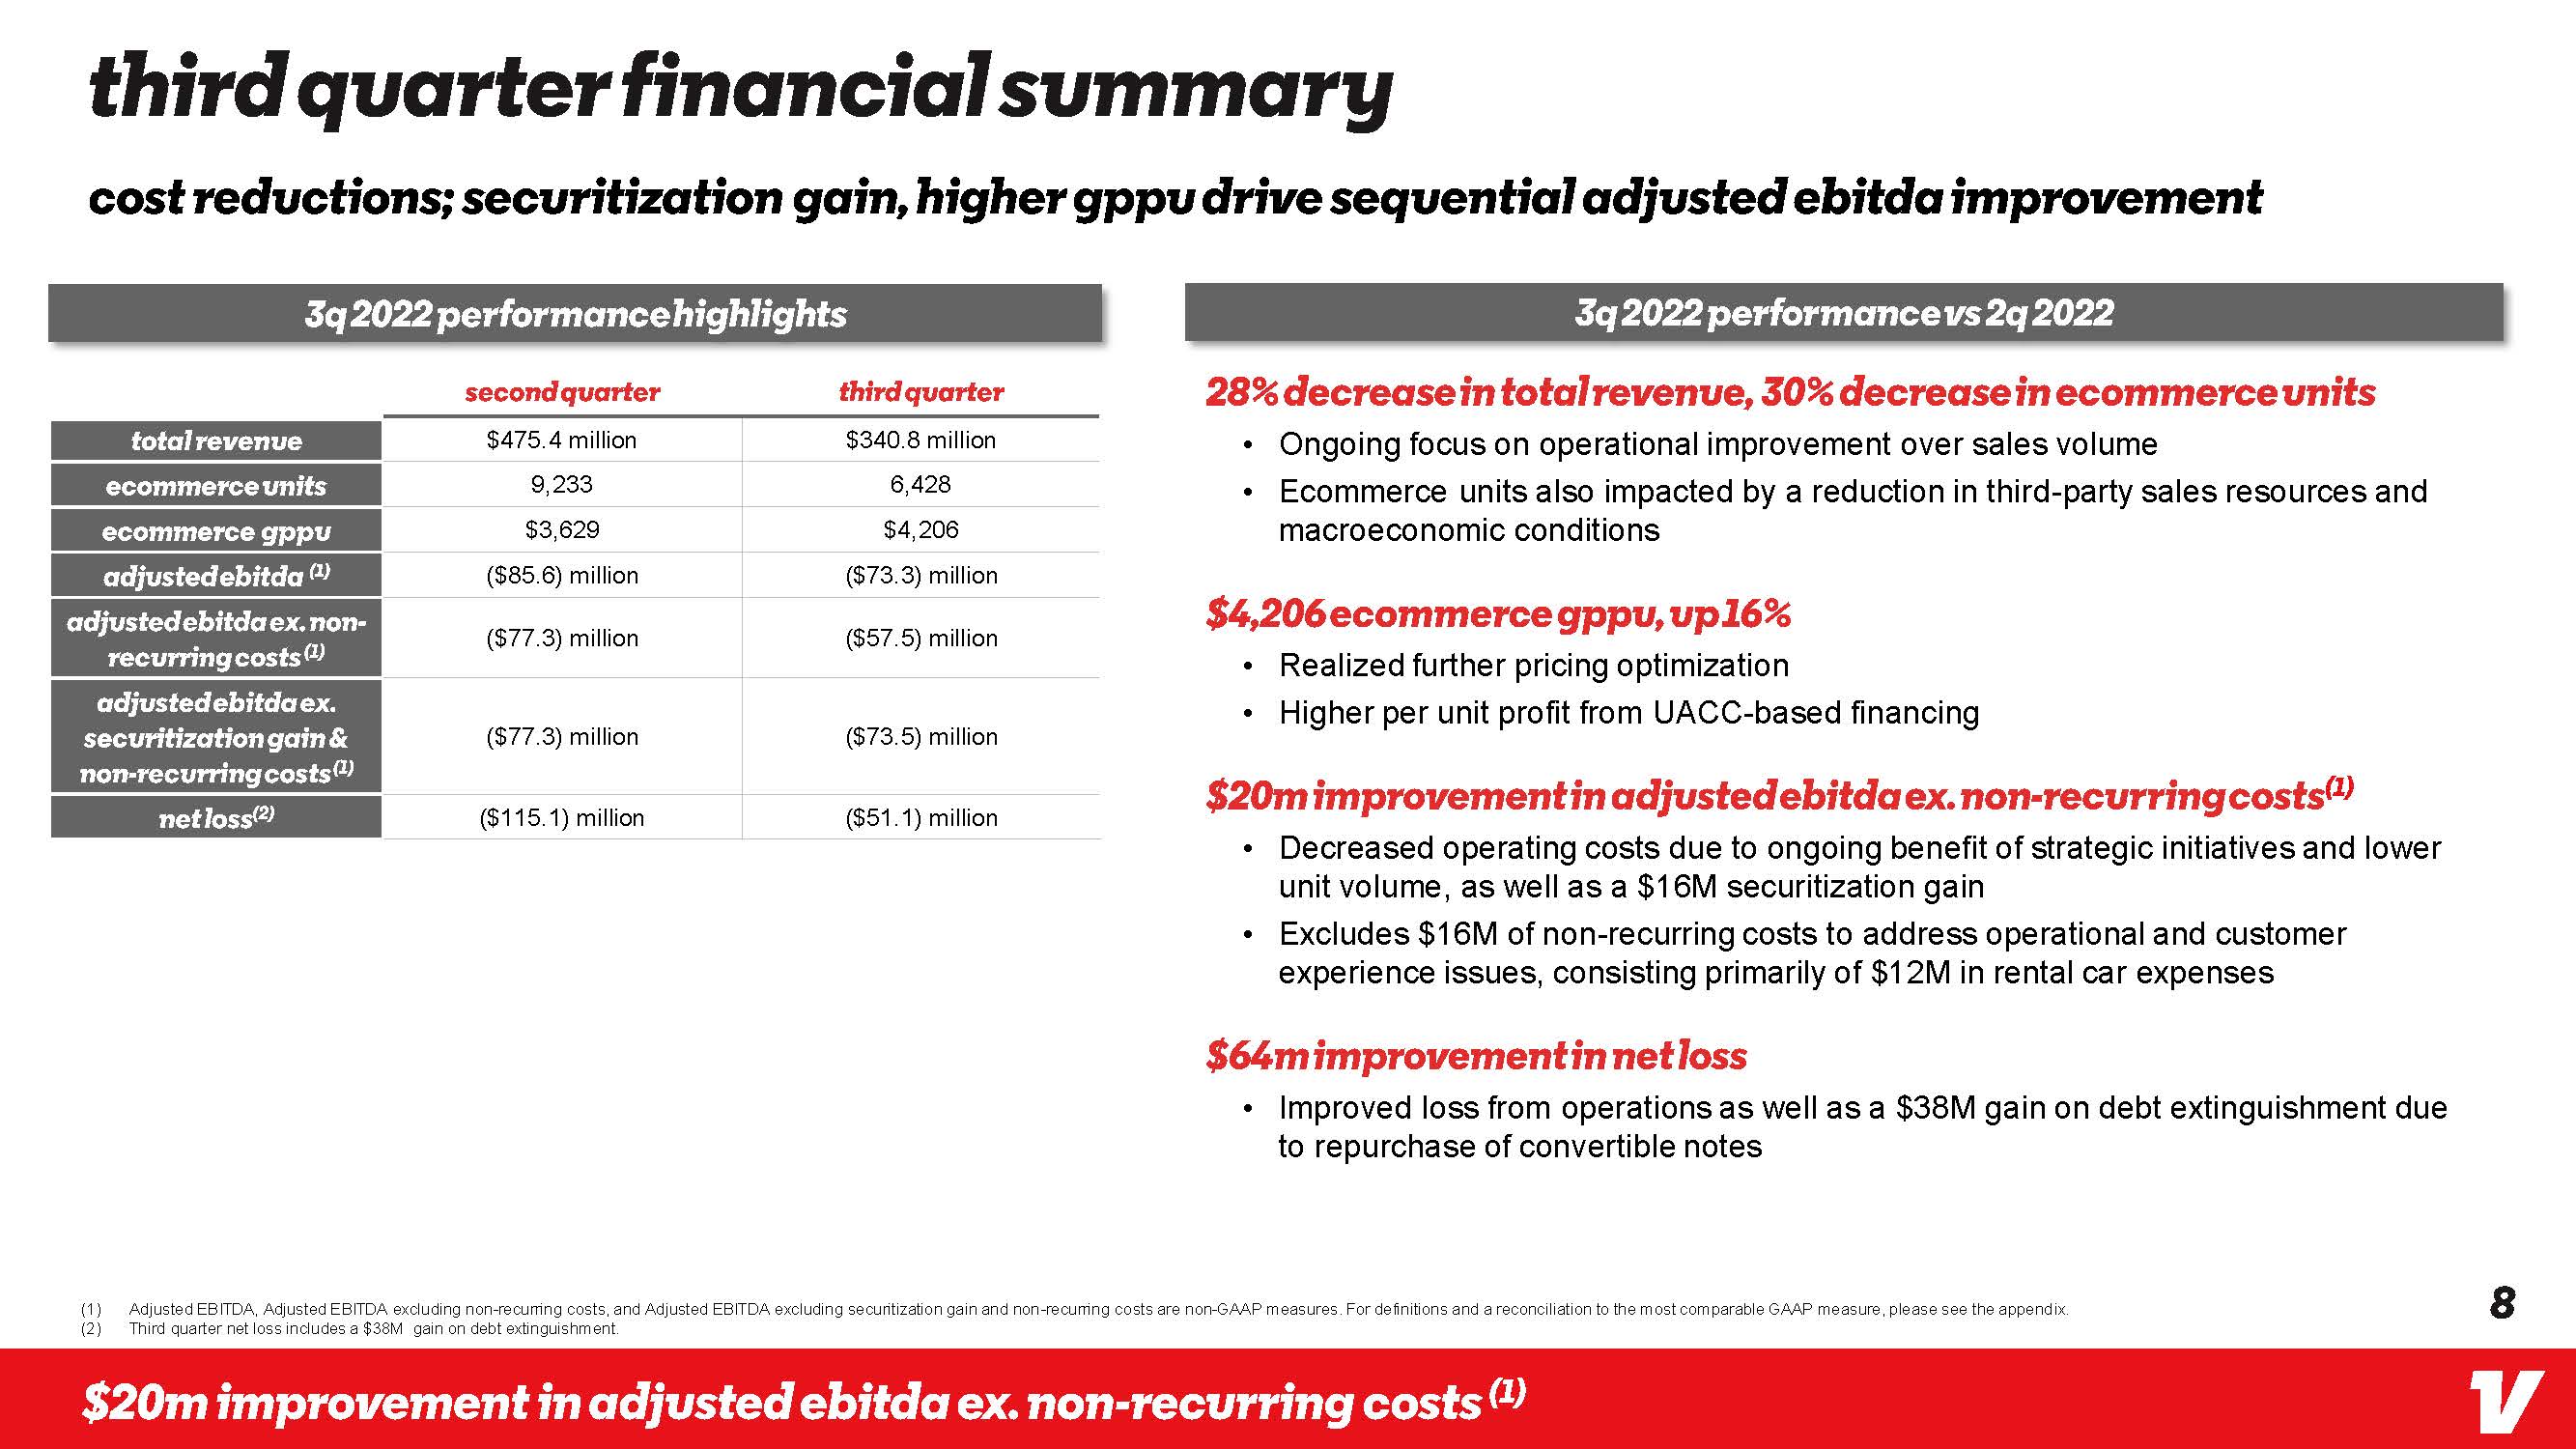
third quarter financial summary cost reductions; securitization gain, higher gppu drive sequential adjusted ebitda improvement 3q 2022 perfomance highlights 3q 2022 performance vs 2q 2022 second quarter third quarter Total Revenue $475.4 million $340.8 million Ecommerce Units 9,233 6,428 Ecommerce GPPU $3,629 $4,206 Adjusted EBITDa (1) ($85.6) million ($73.3) million Adjusted EBITDa ex. Non-recurring costs (1) ($77.3) million ($57.5) million Adjusted EBITDa ex. Securitization gain & Non-recurring costs (1) ($77.3) million ($73.5) million Net loss(2) ($115.1) million ($51.1) million 28% decrease in total revenue, 30% decrease in ecommerce units Ongoing focus on operational improvement over sales volume Ecommerce units also impacted by a reduction in third-party sales resources and macroeconomic conditions $4,206 ecommerce gppu, up 16% Realized further pricing optimization Higher per unit profit from UACC-based financing $20m improvement in adjusted ebitda ex. non-recurring costs(1) Decreased operating costs due to ongoing benefit of strategic initiatives and lower unit volume, as well as a $16M securitization gain Excludes $16M of non-recurring costs to address operational and customer experience issues, consisting primarily of $12M in rental car expenses $64m improvement in net loss Improved loss from operations as well as a $38M gain on debt extinguishment due to repurchase of convertible notes (1) Adjusted EBITDA, Adjusted EBITDA excluding non-recurring costs, and Adjusted EBITDA excluding securitization gain and non-recurring costs are non-GAAP measures. For definitions and a reconciliation to the most comparable GAAP measure, please see the appendix. (2) Third quarter net loss includes a $38M gain on debt extinguishment $20m improvement in adjusted ebitda ex. non-recurring costs (1) 8
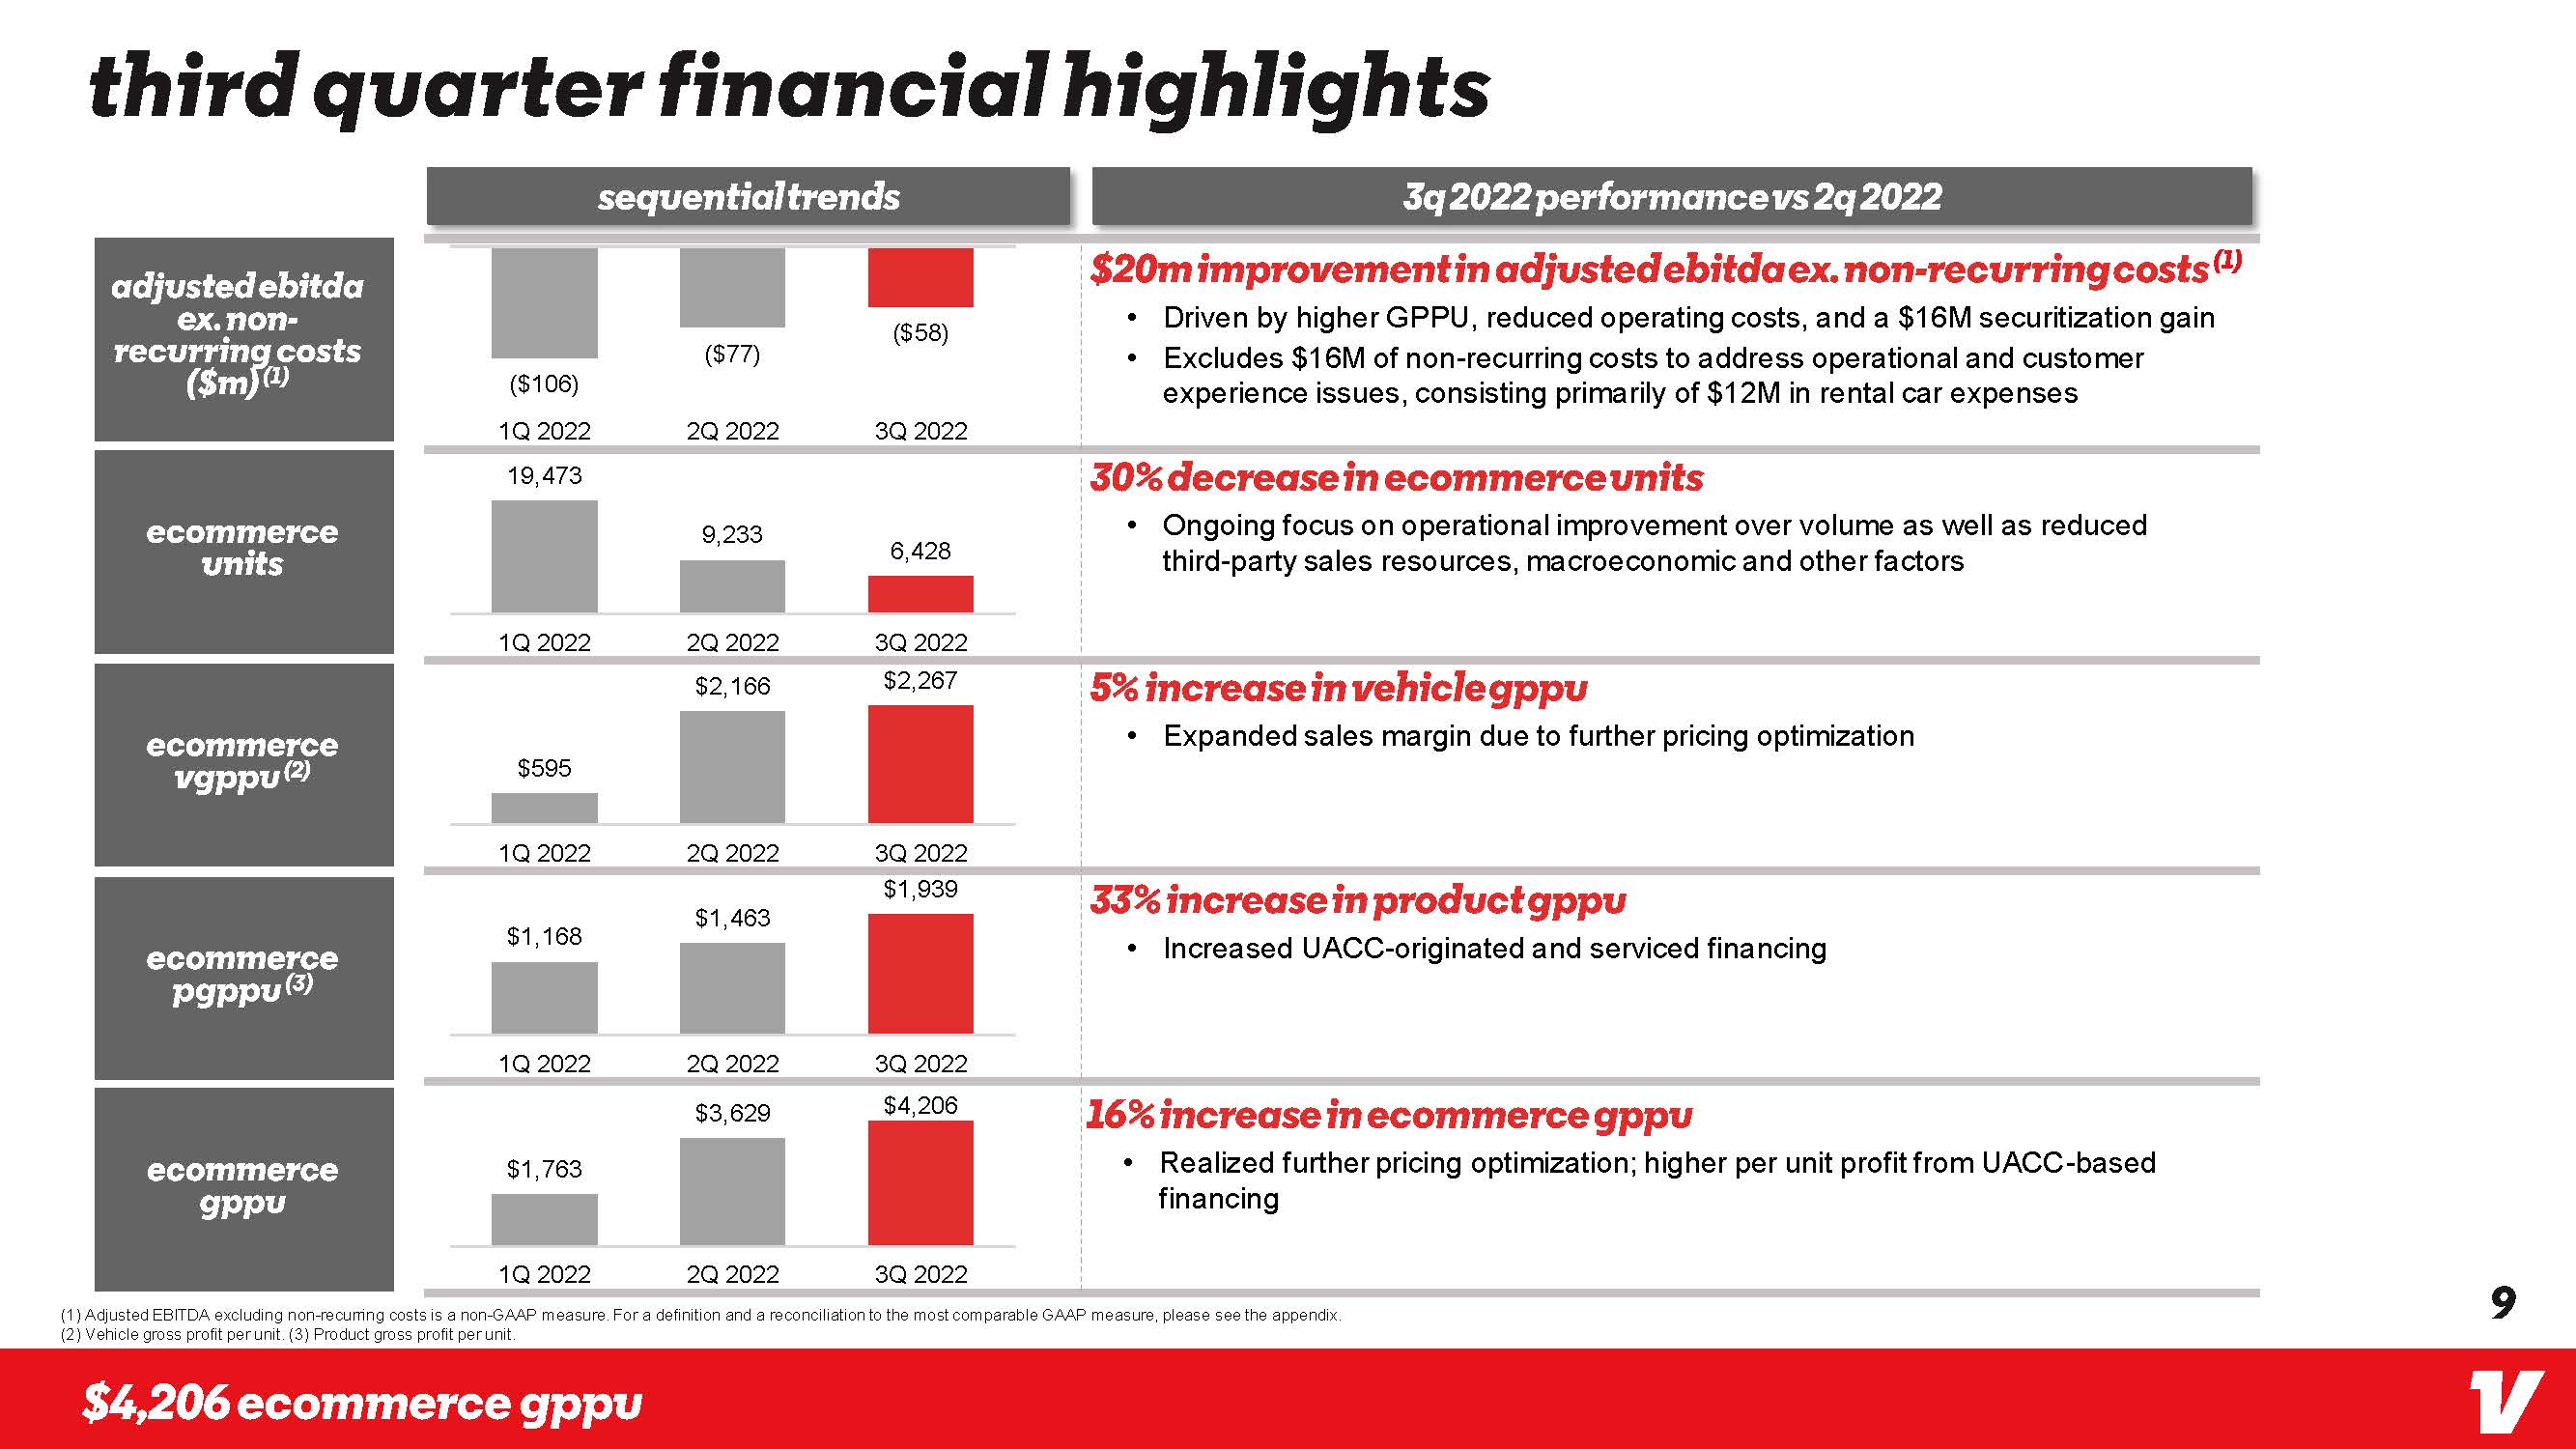
Third quarter financial highlights Sequential trends 3q 2022 Performance vs 2q 2022 Adjusted ebitda ex. Non-recurring costs ($m) (1) ($ 106) ($77) ($58) 1Q 2022 2Q 2022 3Q 2022 $20m improvement in adjusted ebitda ex. Non-recurring costs (1)Driven by higher GPPU, reduced operating costs, and a $16M securitization gain Excludes $16M of non-recurring costs to address operational and customer experience issues, consisting primarily of $12M in rental car expenses Ecommerce units 19,473 9,233 6,428 1Q 2022 2Q 2022 3Q 2022 30% decrease in ecommerce units Ongoing focus on operational improvement over volume as well as reduced third-party sales resources, macroeconomic and other factors Ecommerce VGPPU (2) $959 $2,166 $2,267 1Q 2022 2Q 2022 3Q 2022 5% increase in vehicle gppu Expanded sales margin due to further pricing optimization Ecommerce PGPPU (3) $1,168 $1,463 $1939 1Q 2022 2Q 2022 3Q 2022 33% increase in product gppuIncreased UACC-originated and serviced financing Ecommerce gppu $1,763 $3,629 $4,206 1Q 2022 2Q 2022 3Q 2022 16% increase in ecommerce gppu Realized further pricing optimization; higher per unit profit from UACC-based financing (1) Adjusted EBITDA excluding non-recurring costs is a non-GAAP measure. For a definition and a reconciliation to the most comparable GAAP measure, please see the appendix. (2) Vehicle gross profit per unit. (3) Product gross profit per unit. $4,206 ecommerce gppu
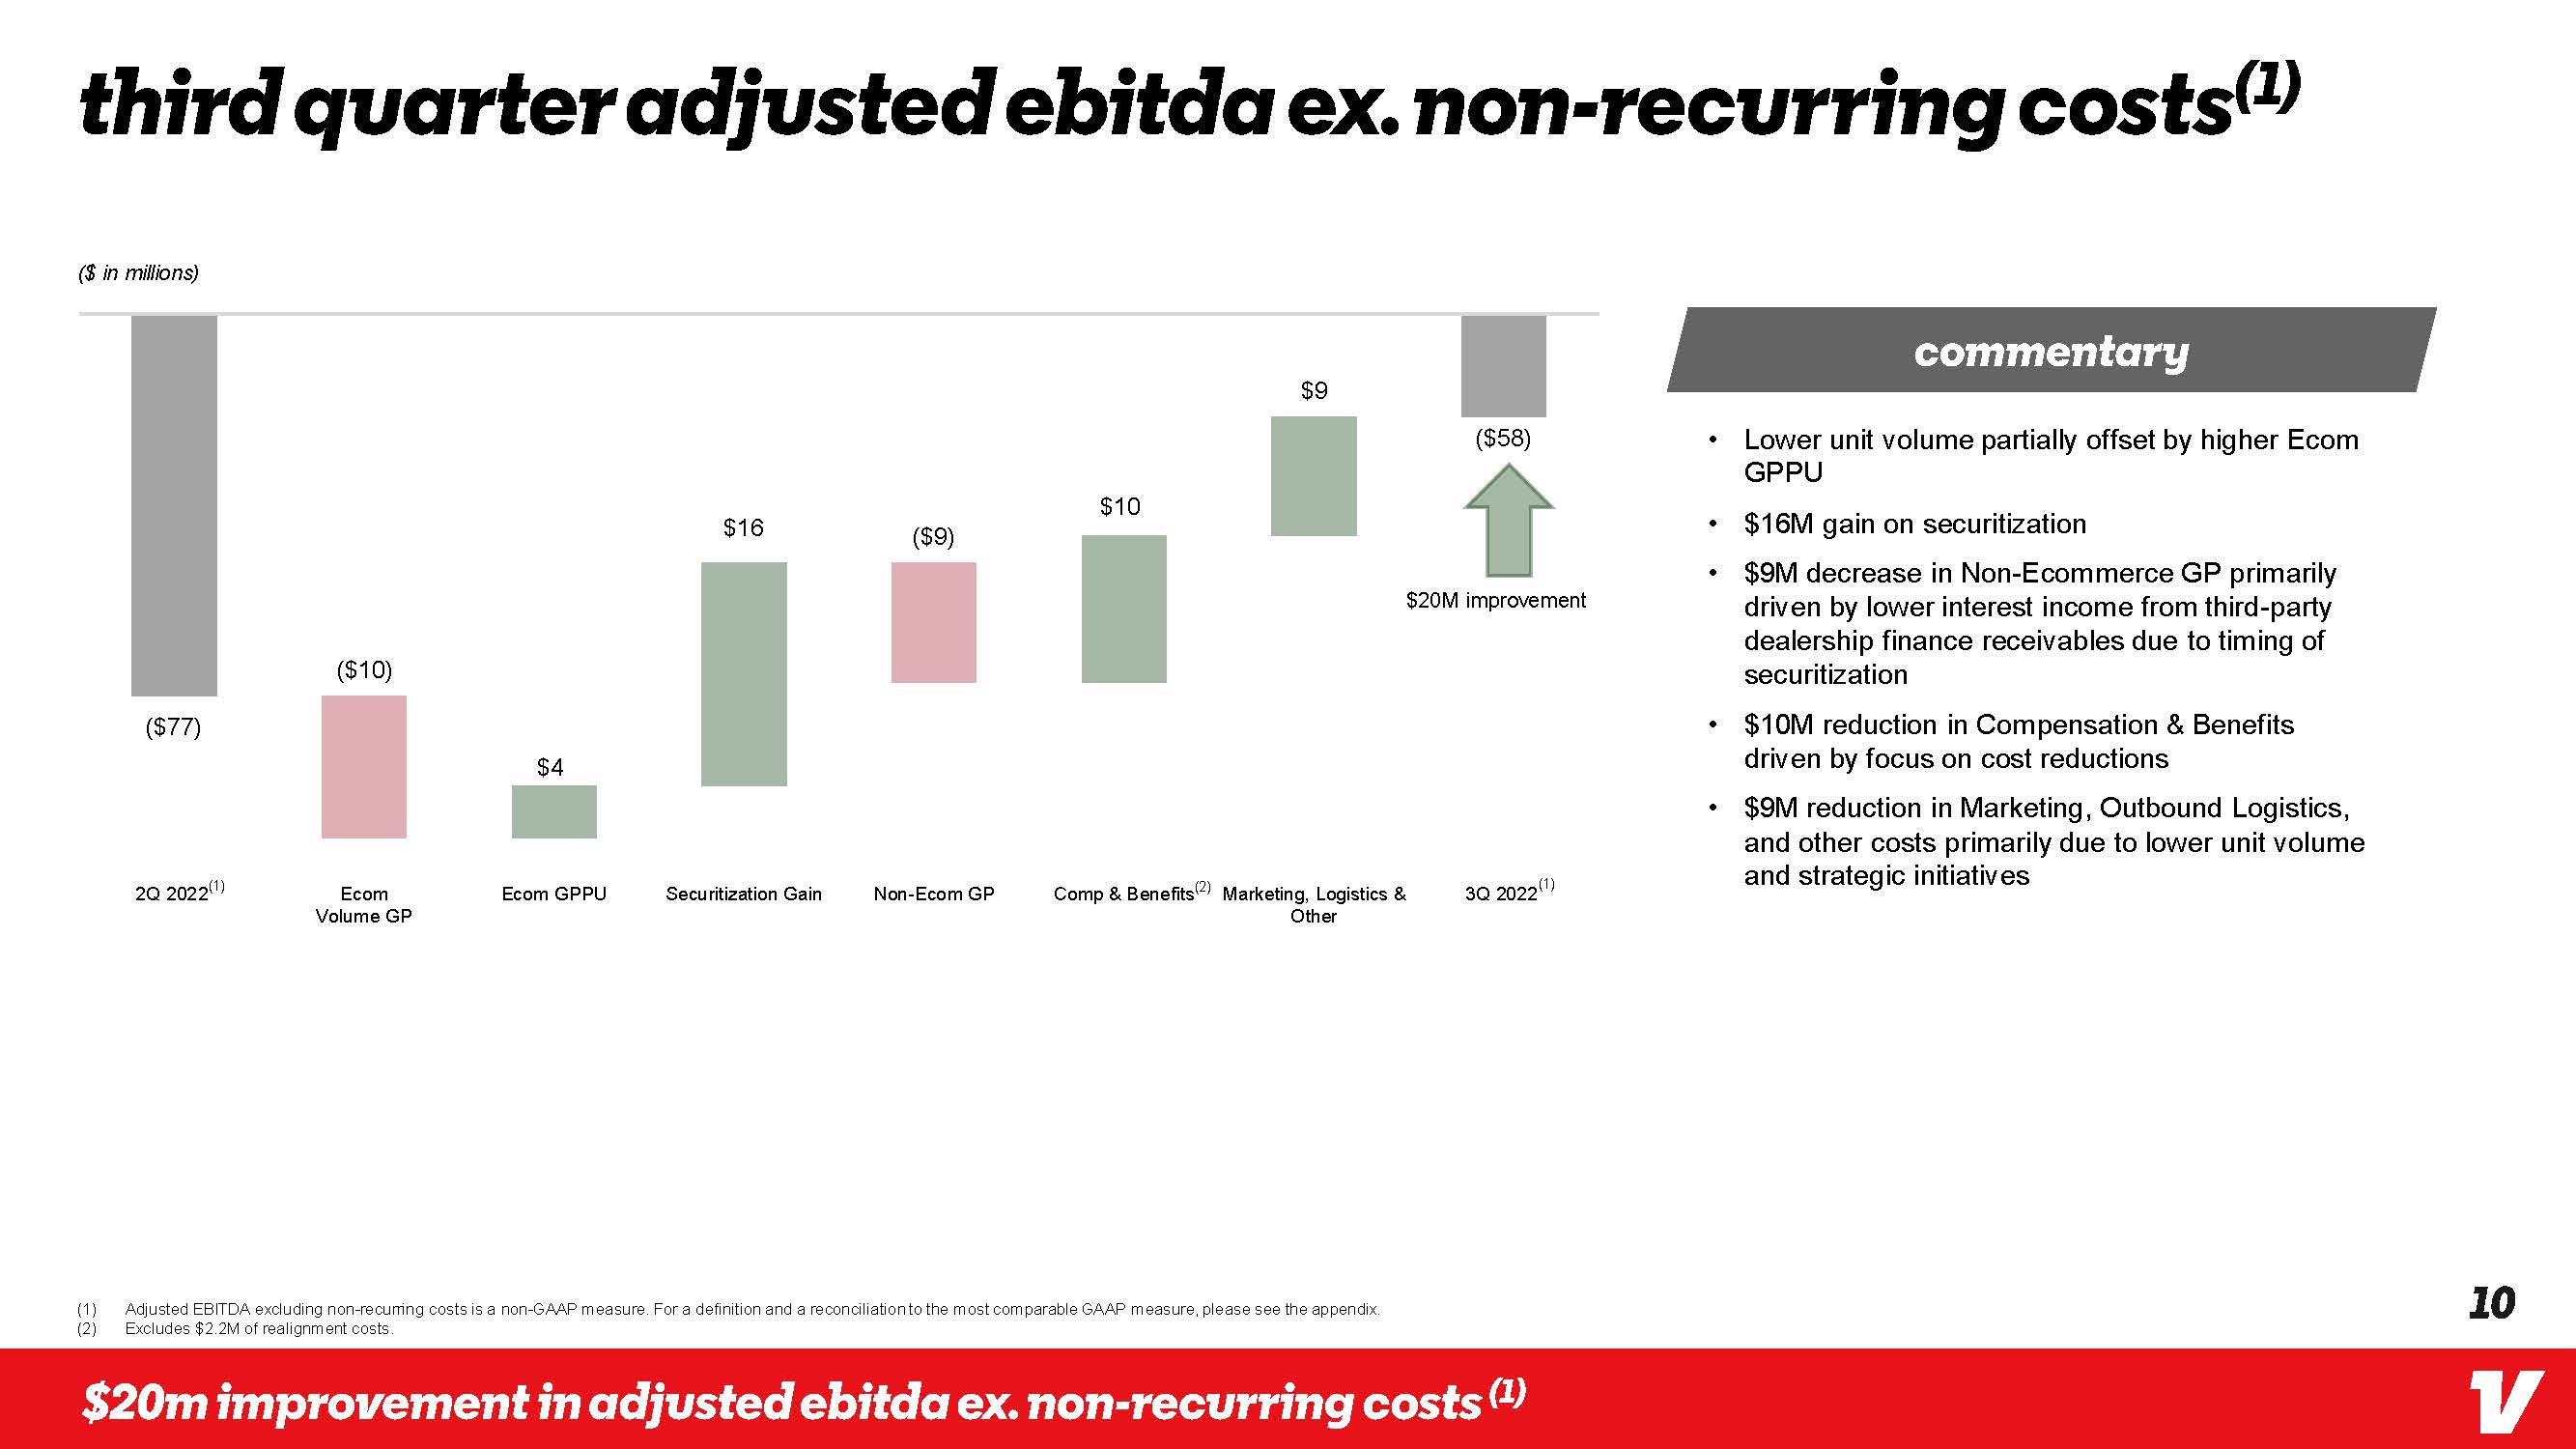
Third quarter adjusted ebitda ex. non-recurring costs(1) ($ in millions) $77 $10 $4 $16 $9 $10 $9 $58 2Q 2022 (1) EcomVolume GP Ecom GPPU Securitization Gain Non-Ecom GP Comp & Benefits (2) Marketing, Logistics &Other 3Q 2022 (1) (1) Adjusted EBITDA excluding non-recurring costs is a non-GAAP measure. For a definition and a reconciliation to the most comparable GAAP measure, please see the appendix. (2) Excludes $2.2M of realignment costs. $20m improvement in adjusted ebitda ex. non-recurring costs (1) Lower unit volume partially offset by higher Ecom GPPU $16M gain on securitization $9M decrease in Non-Ecommerce GP primarily driven by lower interest income from third-party dealership finance receivables due to timing of securitization $10M reduction in Compensation & Benefits driven by focus on cost reductions $9M reduction in Marketing, Outbound Logistics, and other costs primarily due to lower unit volume and strategic initiatives 10
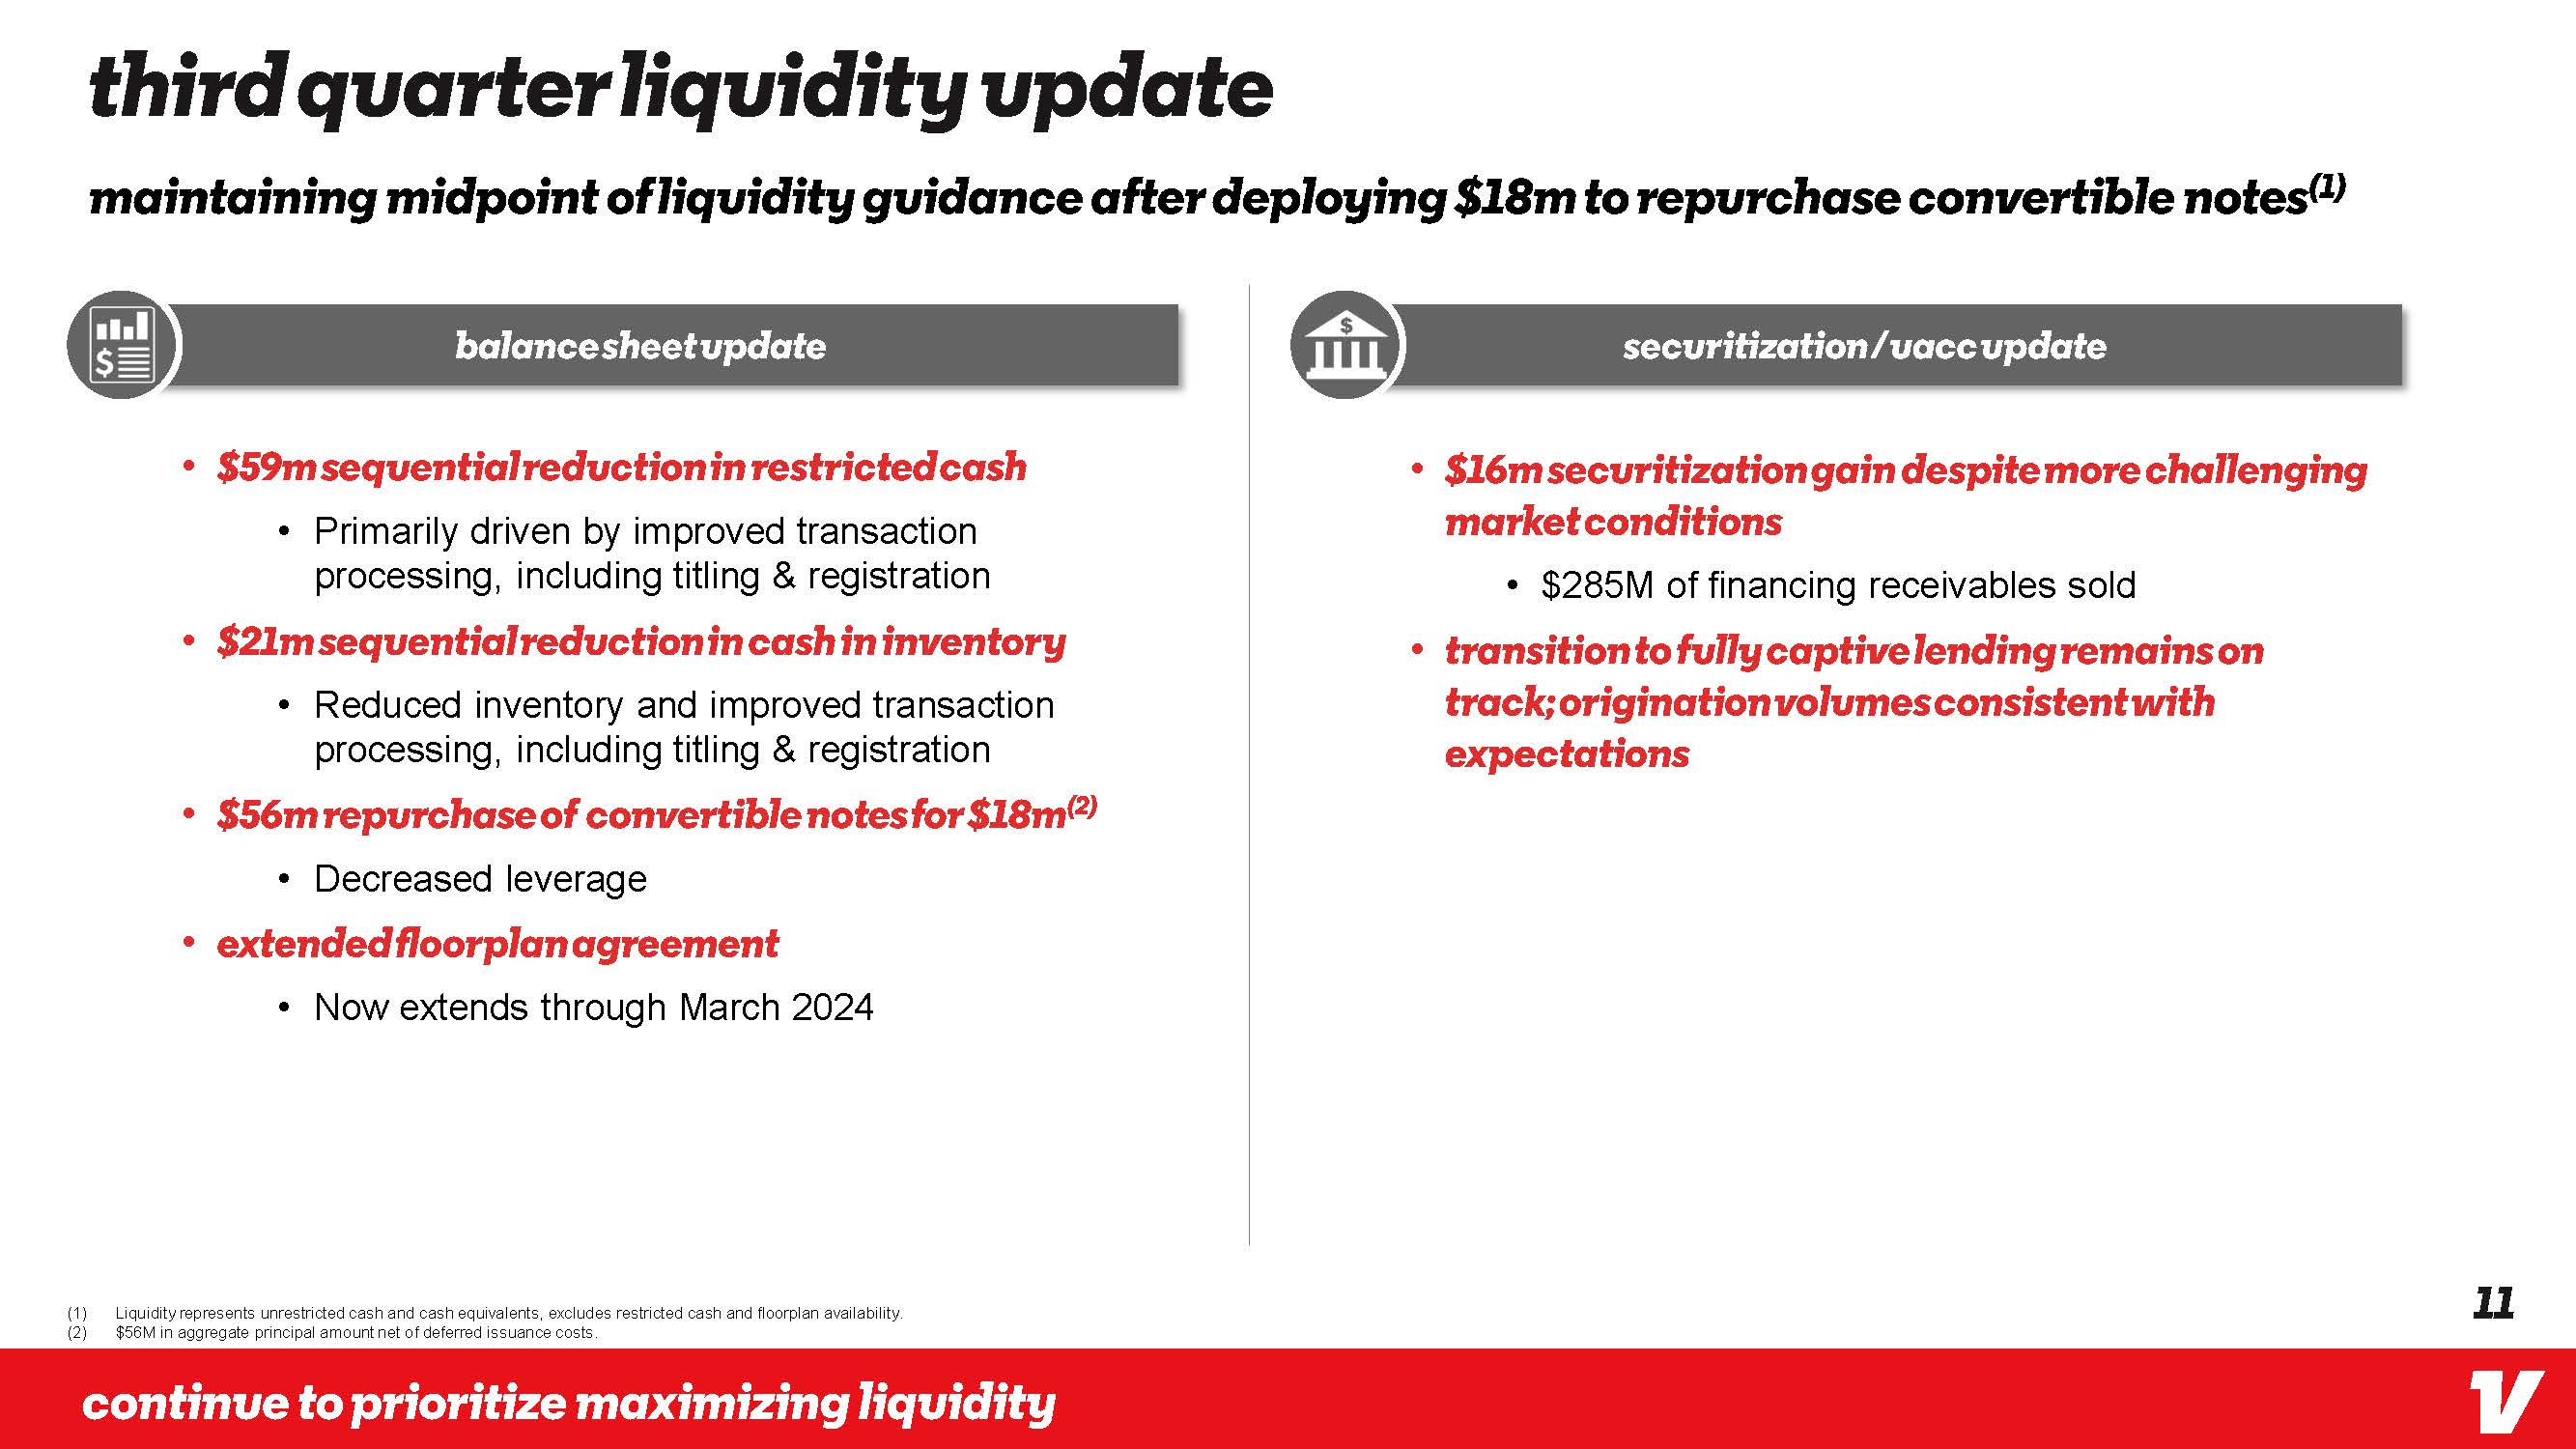
Third quarter liquidity update Maintaining midpoint of liquidity guidance after deploying $18m to repurchase convertible notes(1) balance sheet update securitization/ uacc update $59m sequential reduction in restricted cash Primarily driven by improved transaction processing, including titling & registration $21m sequential reduction in cash in inventory Reduced inventory and improved transaction processing, including titling & registration $56m repurchase of convertible notes for $18m(2) Decreased leverage Extended floorplan agreement Now extends through March 2024 $16m securitization gain Despite more challenging market conditions $285M of financing receivables sold Transition to fully captive lending remains on track; origination volumes consistent with expectations (1) Liquidity represents unrestricted cash and cash equivalents, excludes restricted cash and floorplan availability. (2) $56M in aggregate principal amount net of deferred issuance costs. Continue to Prioritize maximizing liquidity 11
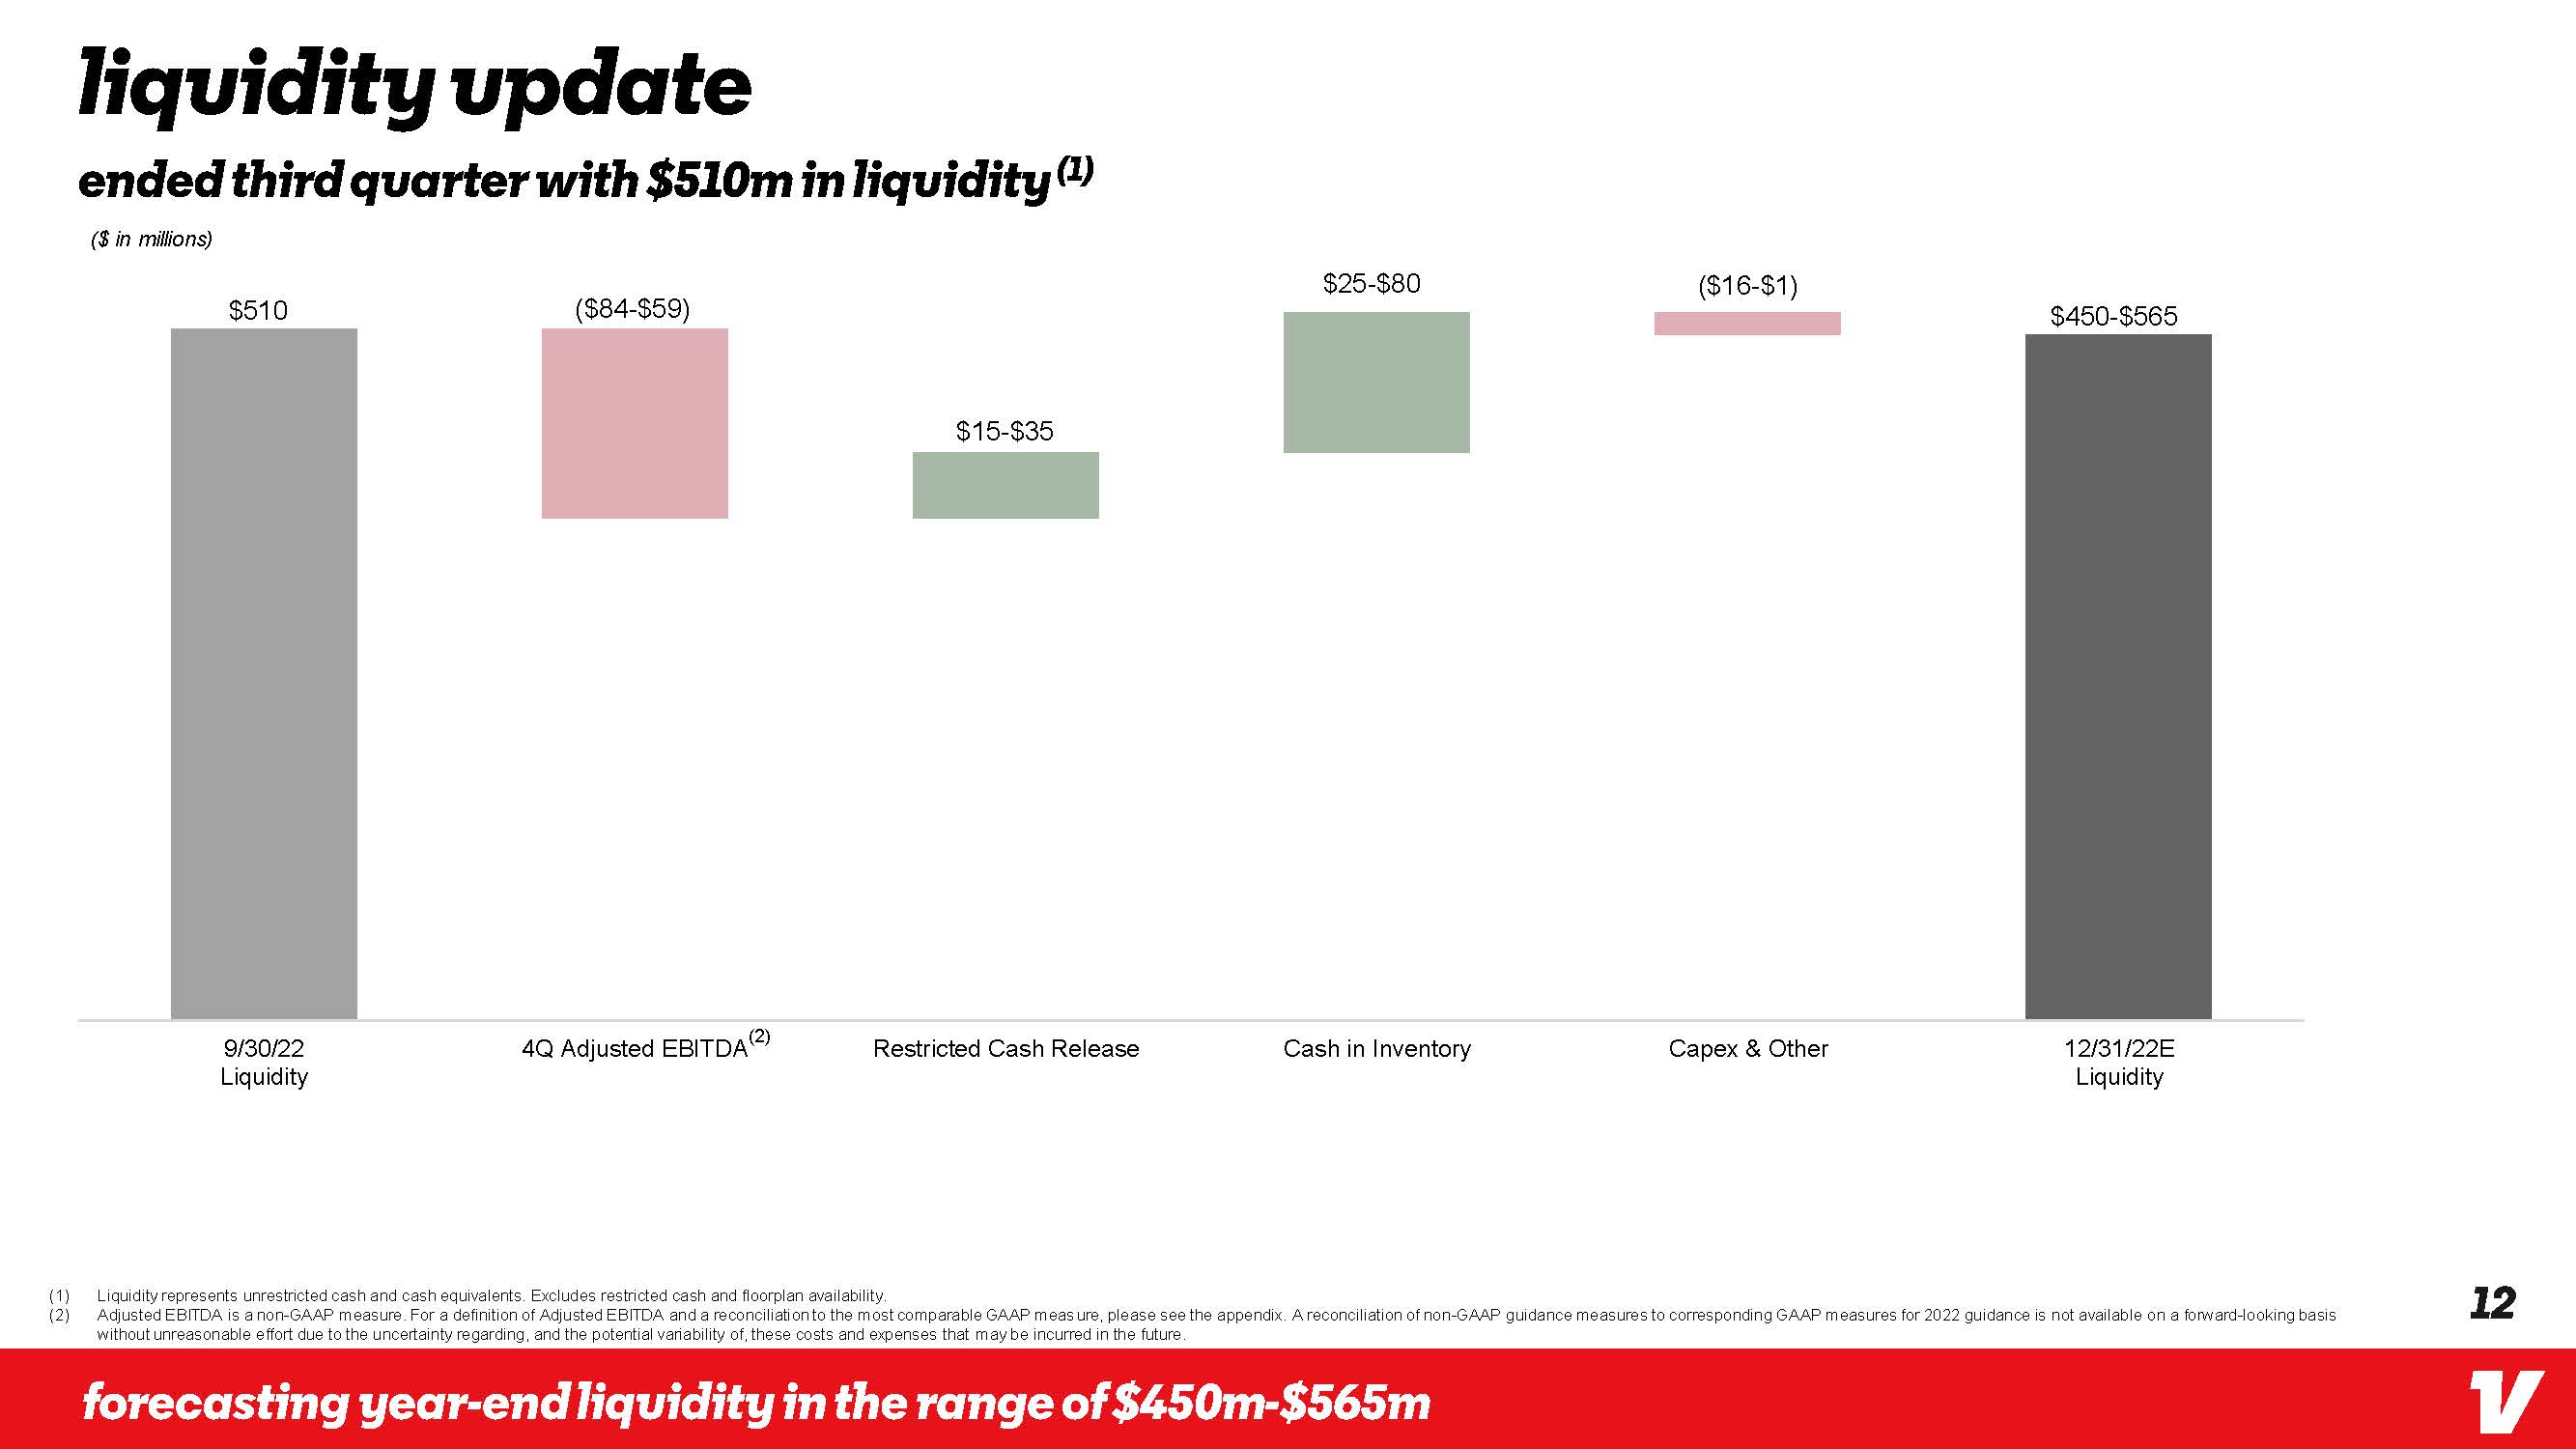
Liquidity update ended third quarter with $510m in liquidity (1) ($ in millions) $510 ($84-$59) $15-$35 $25-$80 ($16-$1) $450-$565 9/30/22 Liquidity 4Q Adjusted EBITDA (2) Restricted Cash Release Cash in Inventory Capex & Other 12/31/22E Liquidity (1) Liquidity represents unrestricted cash and cash equivalents. Excludes restricted cash and floorplan availability. (2) Adjusted EBITDA is a non-GAAP measure. For a definition of Adjusted EBITDA and a reconciliation to the most comparable GAAP measure, please see the appendix. A reconciliation of non-GAAP guidance measures to corresponding GAAP measures for 2022 guidance is not available on a forward-looking basis without unreasonable effort due to the uncertainty regarding, and the potential variability of, these costs and expenses that may be incurred in the future. Forecasting year-end liquidity in the range of $450M-$565M 12
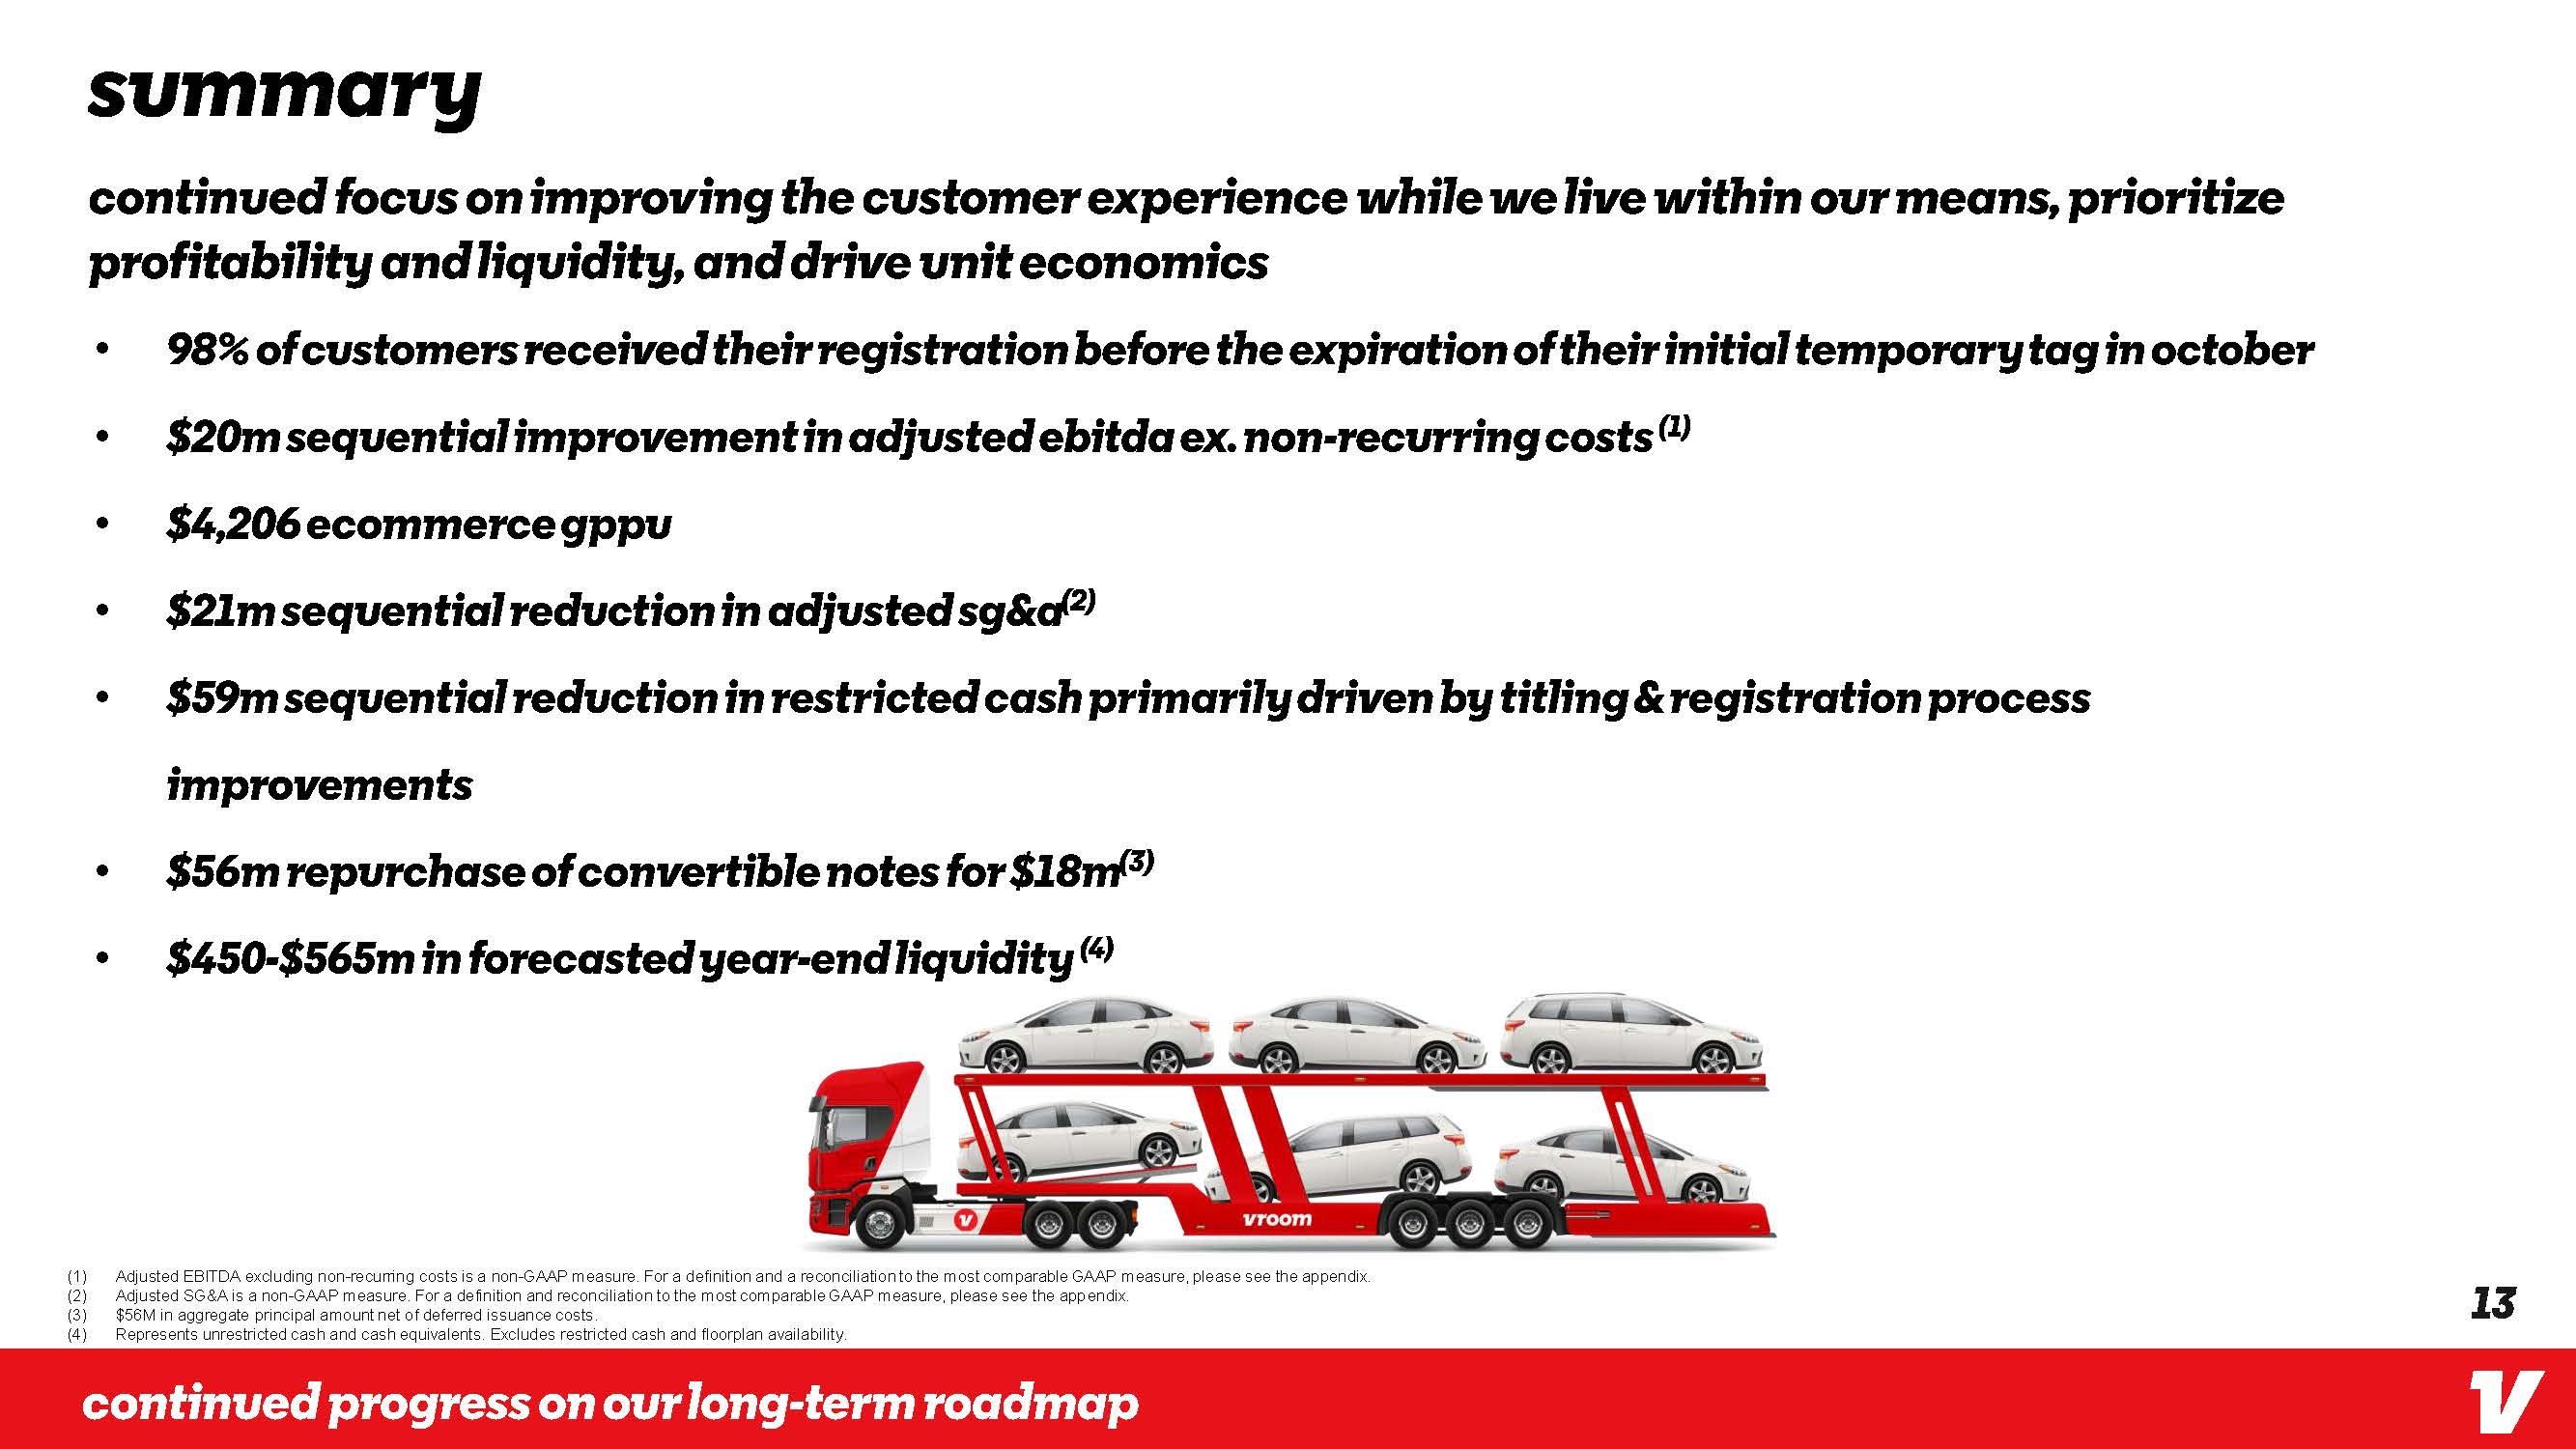
Summary Continued focus on improving the customer experience while we live within our means, prioritize profitability and liquidity, and drive unit economics 98% of customers received their registration before the expiration of their initial temporary tag in October $20m sequential improvement in Adjusted EBITDA ex. non-recurring costs (1) $4,206 ecommerce gppu $21m sequential reduction in adjusted SG&A(2)$59m sequential reduction in restricted cash primarily driven by titling & registration process improvements $56m repurchase of convertible notes for $18m(3) $450-$565m in forecasted year-end liquidity (4) (1) Adjusted EBITDA excluding non-recurring costs is a non-GAAP measure. For a definition and a reconciliation to the most comparable GAAP measure, please see the appendix. (2) Adjusted SG&A is a non-GAAP measure. For a definition and reconciliation to the most comparable GAAP measure, please see the appendix. (3) $56M in aggregate principal amount net of deferred issuance costs. (4) Represents unrestricted cash and cash equivalents. Excludes restricted cash and floorplan availability. Continued Progress on our long-term roadmap 13

Vroom Appendix
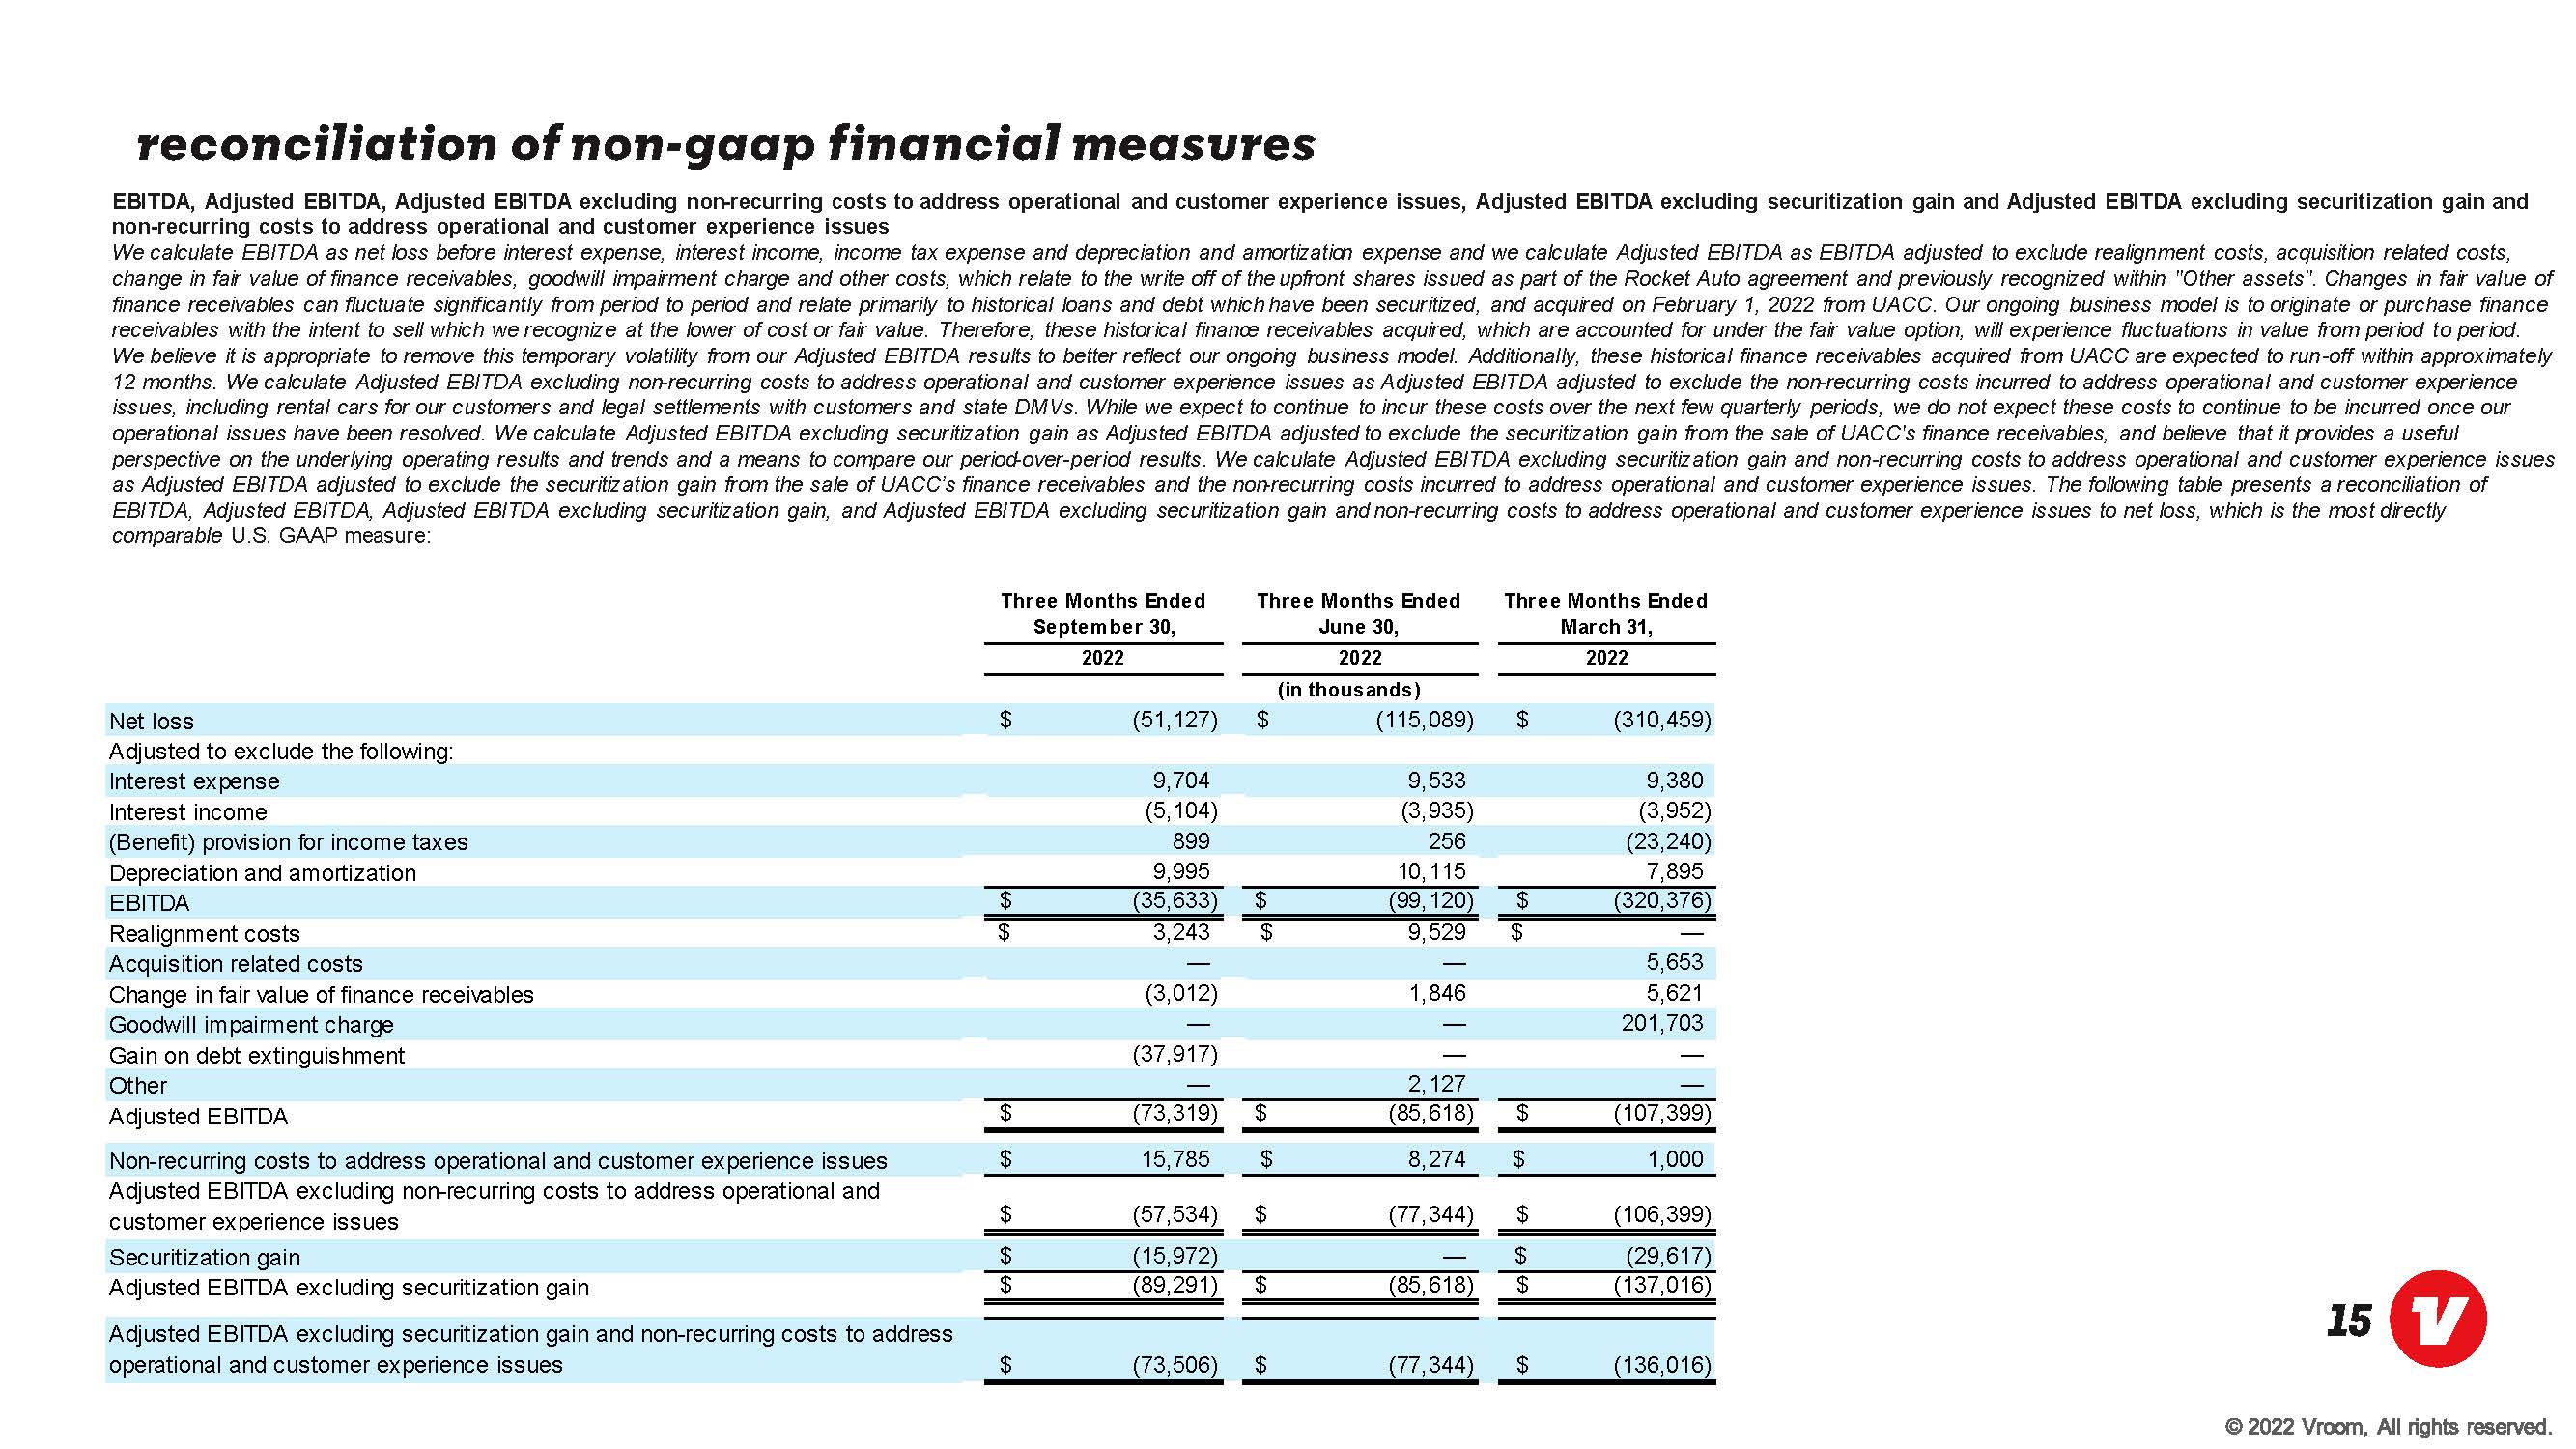
Reconciliation of Non-GAAP Financial measures EBITDA, Adjusted EBITDA, Adjusted EBITDA excluding non-recurring costs to address operational and customer experience issues, Adjusted EBITDA excluding securitization gain and Adjusted EBITDA excluding securitization gain and non-recurring costs to address operational and customer experience issues We calculate EBITDA as net loss before interest expense, interest income, income tax expense and depreciation and amortization expense and we calculate Adjusted EBITDA as EBITDA adjusted to exclude realignment costs, acquisition related costs, change in fair value of finance receivables, goodwill impairment charge and other costs, which relate to the write off of the upfront shares issued as part of the Rocket Auto agreement and previously recognized within "Other assets". Changes in fair value of finance receivables can fluctuate significantly from period to period and relate primarily to historical loans and debt which have been securitized, and acquired on February 1, 2022 from UACC. Our ongoing business model is to originate or purchase finance receivables with the intent to sell which we recognize at the lower of cost or fair value. Therefore, these historical finance receivables acquired, which are accounted for under the fair value option, will experience fluctuations in value from period to period. We believe it is appropriate to remove this temporary volatility from our Adjusted EBITDA results to better reflect our ongoing business model. Additionally, these historical finance receivables acquired from UACC are expected to run-off within approximately 12 months. We calculate Adjusted EBITDA excluding non-recurring costs to address operational and customer experience issues as Adjusted EBITDA adjusted to exclude the non-recurring costs incurred to address operational and customer experience issues, including rental cars for our customers and legal settlements with customers and state DMVs. While we expect to continue to incur these costs over the next few quarterly periods, we do not expect these costs to continue to be incurred once our operational issues have been resolved. We calculate Adjusted EBITDA excluding securitization gain as Adjusted EBITDA adjusted to exclude the securitization gain from the sale of UACC's finance receivables, and believe that it provides a useful perspective on the underlying operating results and trends and a means to compare our period-over-period results. We calculate Adjusted EBITDA excluding securitization gain and non-recurring costs to address operational and customer experience issues as Adjusted EBITDA adjusted to exclude the securitization gain from the sale of UACC’s finance receivables and the non-recurring costs incurred to address operational and customer experience issues. The following table presents a reconciliation of EBITDA, Adjusted EBITDA, Adjusted EBITDA excluding securitization gain, and Adjusted EBITDA excluding securitization gain and non-recurring costs to address operational and customer experience issues to net loss, which is the most directly comparable U.S. GAAP measure: Three Months Ended September 30, Three Months Ended June 30, Three Months Ended March 31, 2022 2022 2022 (in thousands) Net loss (51,127) $ (115,089) $ (310,459) $ Adjusted to exclude the following: Interest expense 9,704 9,533 9,380 Interest income (5,104) (3,935) (3,952) (Benefit) provision for income taxes 899 256 (23,240) Depreciation and amortization 9,995 10,115 7,895 EBITDA (35,633) $ (99,120) $ (320,376) $ Realignment costs 3,243 $ 9,529 $ $ Acquisition related costs 5,653 Change in fair value of finance receivables (3,012) 1,846 5,621 Goodwill impairment charge 201,703 Gain on debt extinguishment (37,917) Other 2,127 Adjusted EBITDA (73,319) $ (85,618) $ (107,399) $ Non-recurring costs to address operational and customer experience issues 15,785 $ 8,274 $ 1,000 $ Adjusted EBITDA excluding non-recurring costs to address operational and customer experience issues (57,534) $ (77,344) $ (106,399) $ Securitization gain (15,972) $ (29,617) $ Adjusted EBITDA excluding securitization gain (89,291) $ (85,618) $ (137,016) $ Adjusted EBITDA excluding securitization gain and non-recurring costs to address operational and customer experience issues (73,506) $ (77,344) $ (136,016) $ 15 © 2022 vroom all rights reserved 15
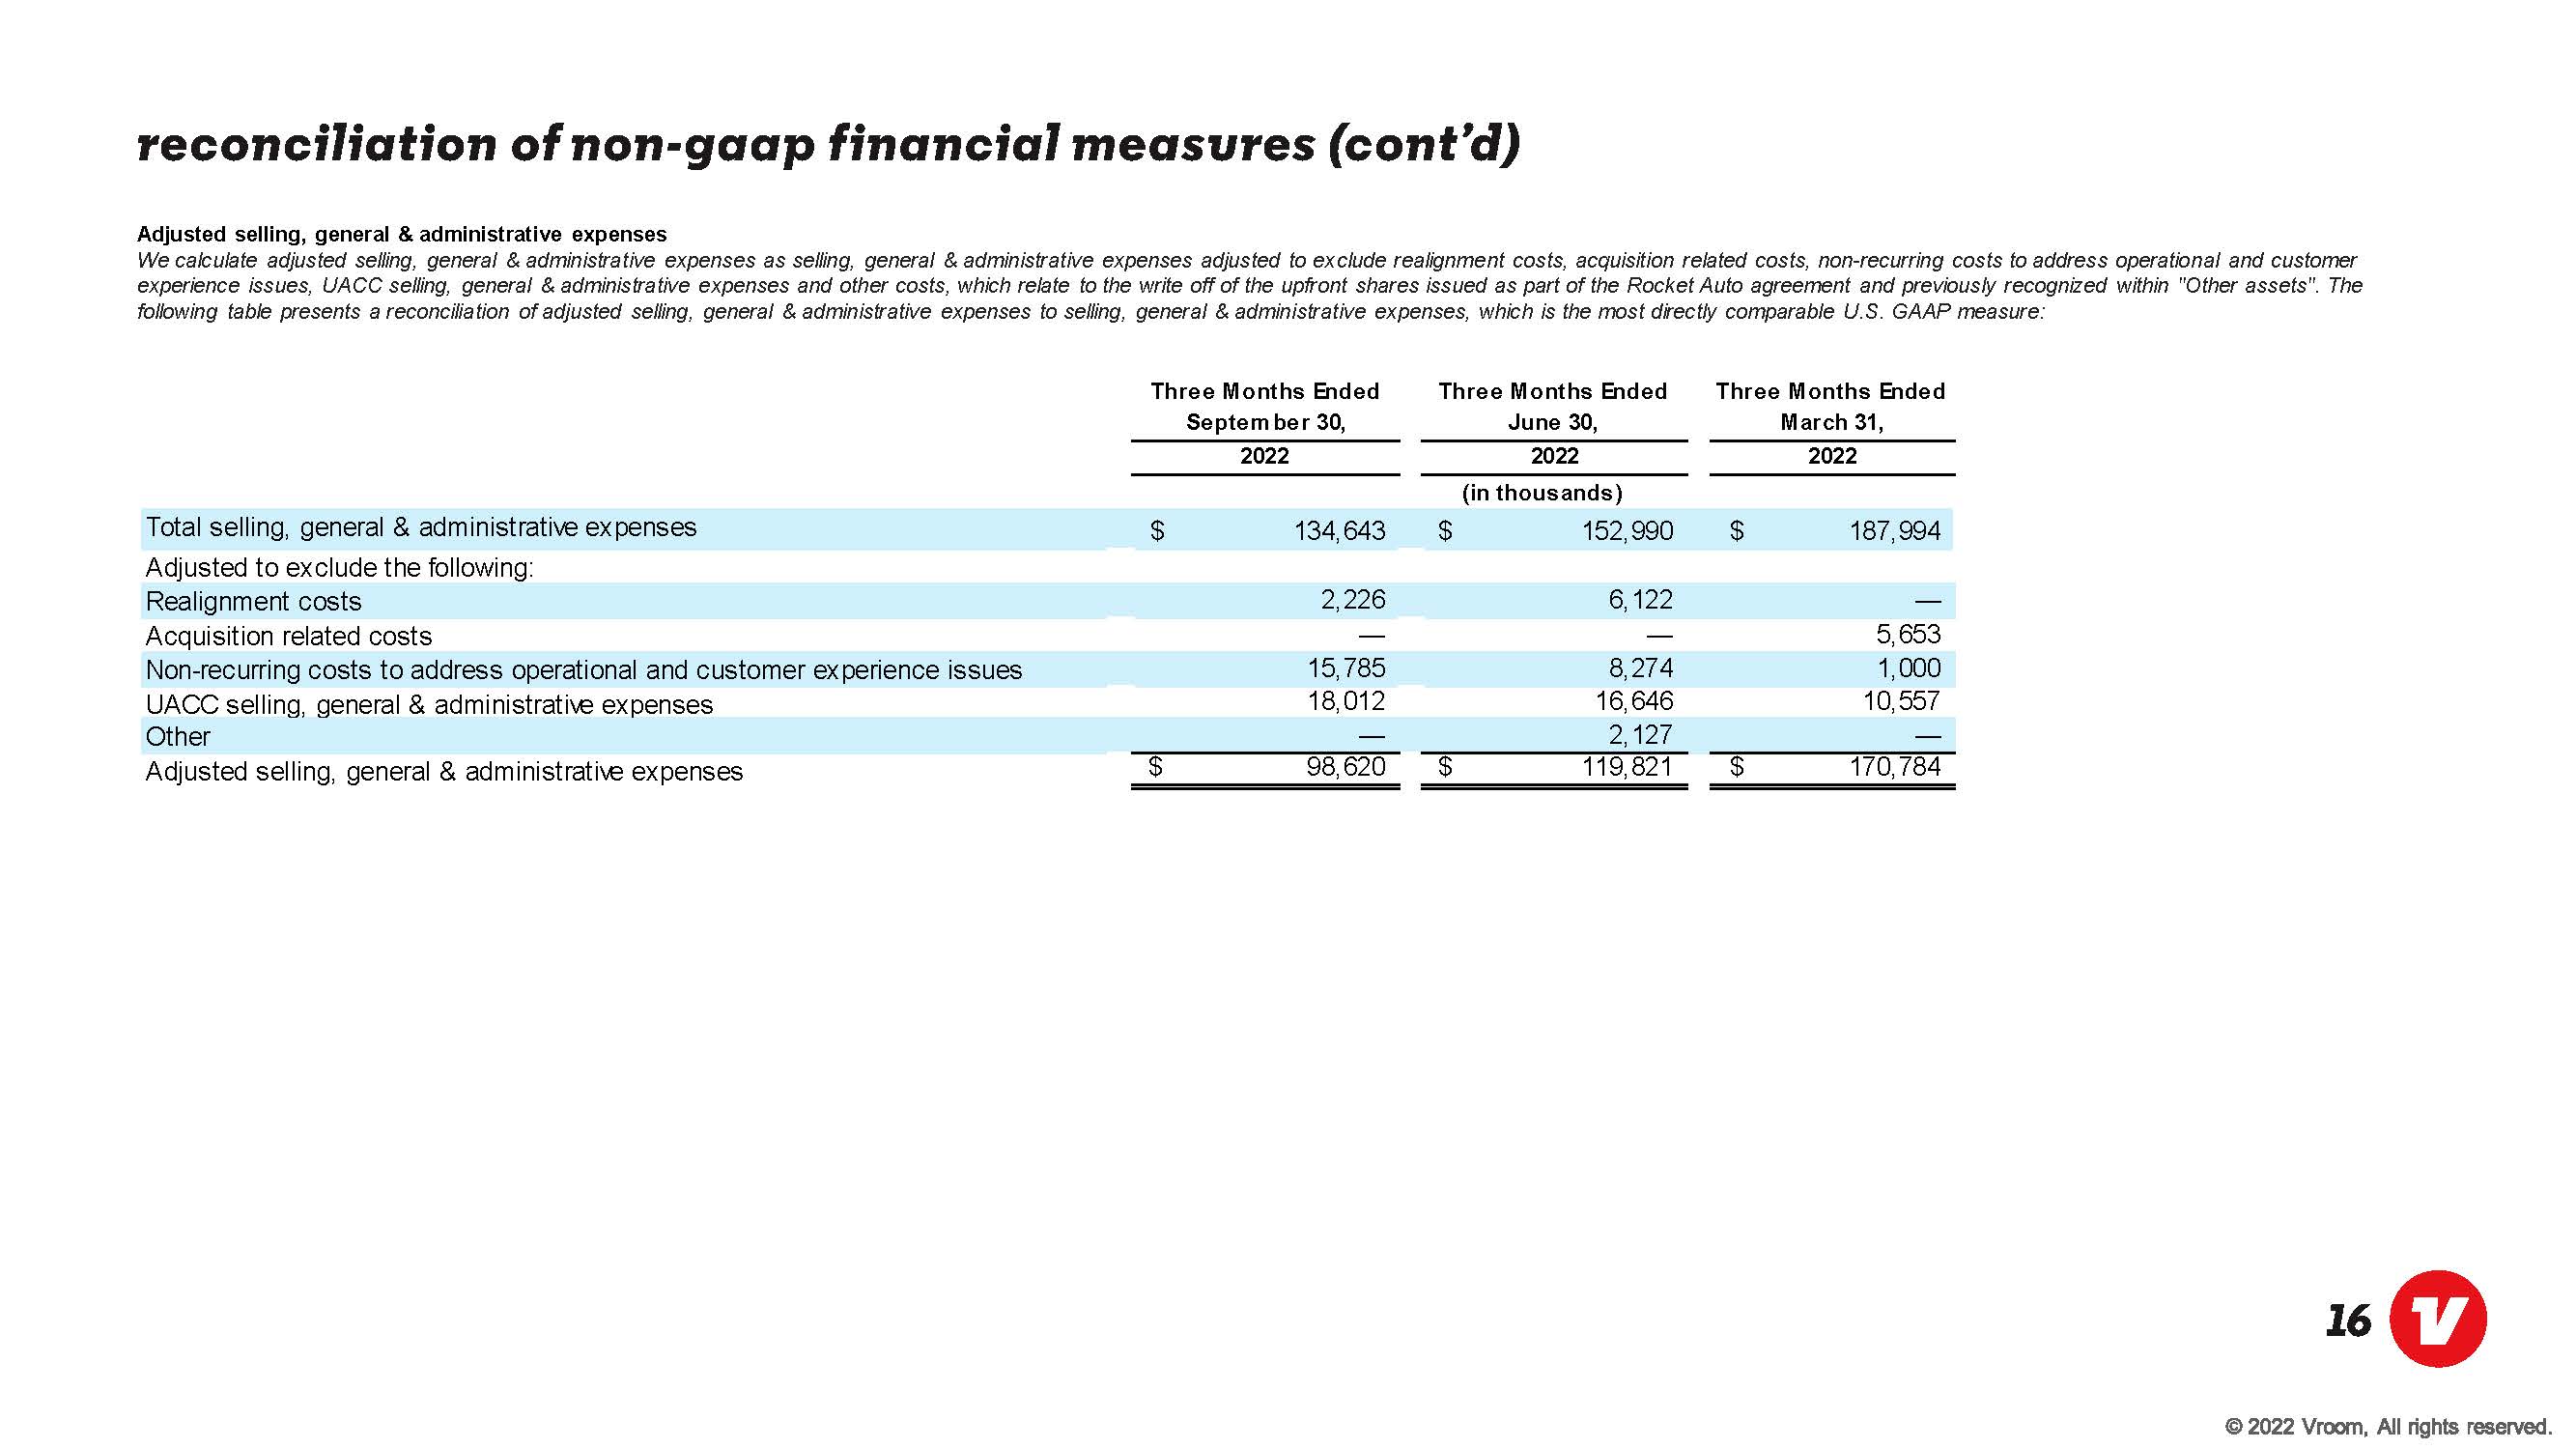
Reconciliation of Non-GAAP Financial measures (cont’d) Adjusted selling, general & administrative expenses We calculate adjusted selling, general & administrative expenses as selling, general & administrative expenses adjusted to exclude realignment costs, acquisition related costs, non-recurring costs to address operational and customer experience issues, UACC selling, general & administrative expenses and other costs, which relate to the write off of the upfront shares issued as part of the Rocket Auto agreement and previously recognized within "Other assets". The following table presents a reconciliation of adjusted selling, general & administrative expenses to selling, general & administrative expenses, which is the most directly comparable U.S. GAAP measure:
Three Months Ended September 30, Three Months Ended June 30, Three Months Ended March 31, 2022 2022 2022 (in thousands) Total selling, general & administrative expenses $ 134,643 $ 152,990 $ 187,994 Adjusted to exclude the following: Realignment costs 2,226 6,122 Acquisition related costs 5,653 Non-recurring costs to address operational and customer experience issues 15,785 8,274 1,000 UACC selling, general & administrative expenses 18,012 16,646 10,557 Other 2,127 Adjusted selling, general & administrative expenses $ 98,620 $ 119,821 $ 170,784 16 ©2022 vroom all rights reserved 16

Thank you 2022 ©vroom all rights reserved 17