September 25, 2013
VIA COURIER AND EDGAR
Re: | Brixmor Property Group Inc. | |
| Registration Statement on Form S-11 | ||
| File No. 333-190002 |
Sandra B. Hunter, Esq.
Division of Corporation Finance
Securities and Exchange Commission
100 F Street, N.E.
Washington, D.C. 20549
Dear Ms. Hunter:
On behalf of Brixmor Property Group Inc. ( “Brixmor”), please find attached selected pages from the above-referenced Registration Statement that have been revised to include information dependent upon the expected offering price. We anticipate including this information in a subsequent pre-effective amendment to the Registration Statement.
SECURITIESAND EXCHANGE COMMISSION | 2 | September 25, 2013 |
* * * * *
Please do not hesitate to call Michael V. Pappagallo, President and Chief Financial Officer of Brixmor, at 646-344-8700 with any questions or further comments you may have regarding accounting matters and Joshua Ford Bonnie at 212-455-3986 with any other questions or further comments you may have regarding this filing.
Very truly yours,
/s/ Simpson Thacher & Bartlett LLP
Simpson Thacher & Bartlett LLP
| cc: | Securities and Exchange Commission |
| Tom Kluck, Esq. |
| Jessica Barberich |
| William Demarest |
| Brixmor Property Group Inc. |
| Michael V. Pappagallo |
| Steven F. Siegel, Esq. |
| Skadden, Arps, Slate, Meagher & Flom LLP |
| David J. Goldschmidt, Esq. |
| Phyllis G. Korff, Esq. |
As filed with the Securities and Exchange Commission on September [—], 2013
Registration No. 333-190002
UNITED STATES
SECURITIES AND EXCHANGE COMMISSION
Washington, D.C. 20549
Amendment No. 3
to
FORM S-11
FOR REGISTRATION UNDER THE SECURITIES ACT OF 1933
OF SECURITIES OF CERTAIN REAL ESTATE COMPANIES
Brixmor Property Group Inc.
(Exact name of registrant as specified in governing instruments)
Brixmor Property Group Inc.
420 Lexington Avenue
New York, New York 10170
Tel: (212) 869-3000
(Address, including zip code, and telephone number,
including area code, of registrant’s principal executive offices)
Steven F. Siegel
Executive Vice President and General Counsel
Brixmor Property Group Inc.
420 Lexington Avenue
New York, New York 10170
Tel: (212) 869-3000
(Name, address, including zip code, and telephone number, including area code, of agent for service)
COPIES TO:
Joshua Ford Bonnie Simpson Thacher & Bartlett LLP 425 Lexington Avenue New York, New York 10017-3954 Telephone: (212) 455-2000 Facsimile: (212) 455-2502 | David J. Goldschmidt Phyllis G. Korff Skadden, Arps, Slate, Meagher & Flom LLP Four Times Square New York, New York 10036 Telephone: (212) 735-3000 Facsimile: (212) 735-2000 |
Approximate date of commencement of proposed sale to the public: As soon as is practicable after this Registration Statement becomes effective.
If any of the Securities being registered on this Form are to be offered on a delayed or continuous basis pursuant to Rule 415 under the Securities Act, check the following box. ¨
If this Form is filed to register additional securities for an offering pursuant to Rule 462(b) under the Securities Act, check the following box and list the Securities Act registration statement number of the earlier effective registration statement for the same offering. ¨
If this Form is a post-effective amendment filed pursuant to Rule 462(c) under the Securities Act, check the following box and list the Securities Act registration statement number of the earlier effective registration statement for the same offering. ¨
If this Form is a post-effective amendment filed pursuant to Rule 462(d) under the Securities Act, check the following box and list the Securities Act registration statement number of the earlier effective registration statement for the same offering. ¨
If delivery of the prospectus is expected to be made pursuant to Rule 434, check the following box. ¨
Indicate by check mark whether the registrant is a large accelerated filer, an accelerated filer, a non-accelerated filer, or a smaller reporting company. See the definitions of “large accelerated filer,” “accelerated filer” and “smaller reporting company” in Rule 12b-2 of the Exchange Act.
| Large accelerated filer | ¨ | Accelerated filer | ¨ | |||
| Non-accelerated filer | x (Do not check if a smaller reporting company) | Smaller reporting company | ¨ | |||
CALCULATION OF REGISTRATION FEE
| ||||||||
| Title of securities to be registered | Amount to be registered(1) | Proposed maximum aggregate offering price per share | Proposed maximum aggregate offering | Amount of registration fee | ||||
Common Stock, par value $0.01 per share | 57,500,000 | $16.00(2) | $920,000,000 | $125,488(3) | ||||
| ||||||||
| ||||||||
| (1) | Includes 7,500,000 shares subject to the underwriters’ option to purchase additional shares. |
| (2) | Estimated solely for the purposes of calculating the registration fee pursuant to Rule 457(a) of the Securities Act of 1933. |
| (3) | $13,640 previously paid. |
The registrant hereby amends this registration statement on such date or dates as may be necessary to delay its effective date until the registrant shall file a further amendment which specifically states that this registration statement shall thereafter become effective in accordance with Section 8(a) of the Securities Act of 1933 or until the registration statement shall become effective on such date as the Commission, acting pursuant to said Section 8(a), may determine.
The information in this preliminary prospectus is not complete and may be changed. These securities may not be sold until the registration statement filed with the Securities and Exchange Commission is effective. This preliminary prospectus is not an offer to sell nor does it seek an offer to buy these securities in any jurisdiction where the offer or sale thereof is not permitted.
Subject to Completion
Preliminary Prospectus dated September [—], 2013
PROSPECTUS

50,000,000 Shares
Brixmor Property Group Inc.
Common Stock
This is an initial public offering of shares of common stock of Brixmor Property Group Inc. We are offering all of the 50,000,000 shares of common stock to be sold in this offering.
It is currently estimated that the initial public offering price per share will be between $14.00 and $16.00 per share. Prior to this offering there has been no public market for the common stock. Brixmor Property Group Inc. has applied for listing of the common stock on the New York Stock Exchange, or NYSE, under the symbol “BRX”.
Upon the completion of this offering, we will be a Maryland corporation. We have elected to qualify as a real estate investment trust, or REIT, for U.S. federal income tax purposes. Shares of our common stock are subject to limitations on ownership and transfer that are primarily intended to assist us in maintaining our qualification as a REIT. Our charter will contain certain restrictions relating to the ownership and transfer of our common stock, including, subject to certain exceptions, a 9.8% limit, in value or by number of shares, whichever is more restrictive, on the ownership of outstanding shares of our common stock and a 9.8% limit, in value, on the ownership of shares of our outstanding stock. See “Description of Stock—Restrictions on Ownership and Transfer.”
After the completion of this offering, affiliates of The Blackstone Group L.P. will continue to own a majority of the voting power of shares eligible to vote in the election of our directors. As a result, we will be a “controlled company” within the meaning of the corporate governance standards of the NYSE. See “Management—Controlled Company Exception” and “Principal Stockholders.”
See “Risk Factors” beginning on page 25 to read about factors you should consider before buying shares of common stock.
Neither the Securities and Exchange Commission nor any other regulatory body has approved or disapproved of these securities or passed upon the accuracy of this prospectus. Any representation to the contrary is a criminal offense.
| Per Share | Total | |||||||
Initial public offering price | $ | $ | ||||||
Underwriting discount | $ | $ | ||||||
Proceeds, before expenses, to Brixmor Property Group Inc. | $ | $ | ||||||
Please see the section entitled “Underwriting” for a complete description of the compensation payable to the underwriters.
To the extent that the underwriters sell more than 50,000,000 shares of common stock, the underwriters have the option to purchase up to an additional 7,500,000 shares from us at the initial public offering price less the underwriting discount.
The underwriters expect to deliver the shares against payment in New York, New York on , 2013.
Joint Bookrunning Managers
| BofA Merrill Lynch | Citigroup | J.P. Morgan | Wells Fargo Securities | |||||
| Barclays | Deutsche Bank Securities | RBC Capital Markets | UBS Investment Bank | |||
Co-managers
| Baird | Evercore | KeyBanc Capital Markets | Mitsubishi UFJ Securities |
| PNC Capital Markets LLC | Sandler O’Neill + Partners, L.P. | Stifel | SunTrust Robinson Humphrey | |||
Prospectus dated , 2013.
The Offering
Common stock offered | 50,000,000 shares (plus up to an additional 7,500,000 shares at the option of the underwriters). |
Common stock outstanding after this offering | 288,583,716 shares. |
Common Stock outstanding after this offering assuming exchange of all Outstanding BPG Subsidiary Shares and all Outstanding OP Units | 386,167,284 shares. |
Use of proceeds | Brixmor Property Group Inc. will contribute the net proceeds of this offering to BPG Subsidiary in exchange for a number of BPG Subsidiary Shares that is equal to the number of shares of common stock that we issue to investors in this offering. BPG Subsidiary will contribute its receipts from this contribution to our Operating Partnership in exchange for a number of OP Units that is equal to the number of BPG Subsidiary Shares that BPG Subsidiary issues to Brixmor Property Group Inc. |
| Our Operating Partnership will primarily use the net proceeds from this offering to repay approximately $628.5 million of outstanding borrowings under the revolving portion of our Unsecured Credit Facility. We will also use approximately $74.0 million of net offering proceeds as described in note (G) under “Unaudited Pro Forma Financial Information.” |
| Affiliates of each of the representatives of the underwriters are lenders under our Unsecured Credit Facility, which we intend to repay in part with the net proceeds of this offering. |
Listing | We have applied to list our common stock on the NYSE under the symbol “BRX”. |
In this prospectus, unless otherwise indicated, the number of shares of common stock outstanding and the other information based thereon does not reflect:
| • | 76,798,997 shares issuable upon exchange of 76,798,997 Outstanding BPG Subsidiary Shares; |
| • | 20,784,571 shares issuable upon exchange of 20,784,571 Outstanding OP Units that will be issued in connection with our acquisition from our Sponsor of interests in certain properties as described in “Organizational Structure—IPO Property Transfers.” The precise number of OP Units to be issued in connection with our acquisition of the Acquired Properties will be determined at the time that the initial public offering price per share in this offering is determined. Based on an assumed initial public offering price of $15.00 per share (the midpoint of the estimated price range set forth on the cover page of this prospectus), we would issue 20,784,571 OP Units in connection with the IPO Property Transfers. A $1.00 increase in the assumed initial public offering price to $16.00 per share would increase the number of such OP Units we would issue to 20,856,851 (thereby increasing the Outstanding Brixmor Interests outstanding after this offering to 386,239,564), and a $1.00 decrease in the assumed initial public offering price to $14.00 per share would decrease the number of such OP Units we would issue to 20,701,965 (thereby decreasing the Outstanding Brixmor Interests outstanding after this offering to 386,084,678); |
15
| • | 7,500,000 shares issuable upon exercise of the underwriters’ option to purchase additional shares of our common stock from us; or |
| • | 20,000,000 shares of our common stock issuable pursuant to the 2013 Brixmor Property Group Inc. Omnibus Incentive Plan, or our “2013 Omnibus Incentive Plan”, including the grants of restricted stock or restricted stock units in an amount having a value of $100,000 based on the initial public offering price that we anticipate making to each of two of our independent directors as described in “Management—Director Compensation.” See “Management—2013 Omnibus Incentive Plan.” |
16
Summary Financial and Other Data
The summary consolidated financial and operating data set forth below as of December 31, 2012 and 2011 and for the year ended December 31, 2012, the period from June 28, 2011 through December 31, 2011, the period from January 1, 2011 through June 27, 2011 and the year ended December 31, 2010 has been derived from our audited consolidated financial statements included elsewhere in this prospectus. The summary condensed consolidated financial and operating data set forth below as of June 30, 2013 and for the six months ended June 30, 2013 has been derived from our unaudited condensed consolidated financial statements included elsewhere in this prospectus. Results for the six month period ended June 30, 2013 are not necessarily indicative of results that may be expected for the entire year. The summary consolidated financial and operating data set forth as of December 31, 2010 has been derived from our audited consolidated financial statements not included in this prospectus. The consolidated financial and operating data set forth as of December 31, 2009 and 2008 and for the years ended December 31, 2009 and 2008 has been derived from unaudited consolidated financial statements not included in this prospectus.
The unaudited summary consolidated pro forma financial data reflects our IPO Portfolio of 522 Properties, and gives pro forma effect to: (1) the IPO Property Transfers; (2) our acquisition of the interest we did not already hold in Arapahoe Crossings, L.P.; (3) borrowings under our Unsecured Credit Facility, including the use thereof; and (4) the estimated net proceeds, including the use thereof, expected to be received from this offering, as if they each occurred on January 1, 2012. The pro forma adjustments associated with the foregoing transactions assume that each transaction was completed as of January 1, 2012 for purposes of the unaudited pro forma condensed consolidated statements of operations information and as of June 30, 2013 for purposes of the unaudited pro forma condensed consolidated balance sheet information. The following unaudited summary consolidated pro forma statement of operations and balance sheet data is presented for illustrative purposes only and is not necessarily indicative of the operating results or financial position that would have occurred if the relevant transactions had been consummated on the date indicated, nor is it indicative of future operating results.
Because the information presented below is only a summary and does not provide all of the information contained in our historical consolidated financial statements, including the related notes, you should read it in conjunction with “Selected Financial Information,” “Management’s Discussion and Analysis of Financial Condition and Results of Operations,” “Unaudited Pro Forma Financial Information” and our historical consolidated financial statements, including the related notes, included elsewhere in this prospectus. The amounts in the tables are dollars in thousands.
17
The Successor period in the following table reflects our selected financial data for the periods following the acquisition of certain assets from Centro on June 28, 2011 (the “Acquisition”), and the Predecessor period in the following table reflects our selected financial data for the periods prior to the Acquisition.
| Successor | Predecessor | |||||||||||||||||||||||||||||||
| Pro Forma Six Months Ended June 30, 2013 | Pro Forma Year Ended December 31, 2012 | Six Months Ended June 30, | Year Ended December 31, 2012 | Period from June 28, 2011 through December 31, 2011 | Period from January 1, 2011 through June 27, 2011 | Year Ended December 31, 2010 | ||||||||||||||||||||||||||
| 2013 | 2012 | |||||||||||||||||||||||||||||||
| (in thousands) | ||||||||||||||||||||||||||||||||
| (unaudited) | (unaudited) | (unaudited) | (unaudited) | |||||||||||||||||||||||||||||
Revenue | ||||||||||||||||||||||||||||||||
Rental income | $464,464 | $917,932 | $443,772 | $435,336 | $879,766 | $443,537 | $426,815 | $871,508 | ||||||||||||||||||||||||
Expense reimbursements | 126,969 | 242,596 | 122,898 | 115,863 | 234,590 | 116,354 | 119,084 | 237,324 | ||||||||||||||||||||||||
Other revenue | 5,987 | 12,822 | 6,001 | 6,160 | 11,441 | 5,728 | 8,035 | 16,272 | ||||||||||||||||||||||||
|
|
|
|
|
|
|
|
|
|
|
|
|
|
|
| |||||||||||||||||
Total revenues | 597,420 | 1,173,350 | 572,671 | 557,359 | 1,125,797 | 565,619 | 553,934 | 1,125,104 | ||||||||||||||||||||||||
|
|
|
|
|
|
|
|
|
|
|
|
|
|
|
| |||||||||||||||||
Operating expenses | ||||||||||||||||||||||||||||||||
Operating costs | 62,059 | 128,975 | 60,971 | 61,669 | 124,673 | 62,217 | 67,436 | 126,535 | ||||||||||||||||||||||||
Real estate taxes | 87,433 | 164,734 | 86,541 | 81,516 | 162,900 | 80,944 | 79,795 | 165,372 | ||||||||||||||||||||||||
Depreciation and amortization | 239,838 | 527,592 | 226,505 | 260,455 | 504,583 | 293,924 | 174,554 | 391,170 | ||||||||||||||||||||||||
Impairment of real estate assets | 1,531 | — | 36,060 | — | — | — | — | 249,286 | ||||||||||||||||||||||||
Provision for doubtful accounts | 5,183 | 12,053 | 5,365 | 5,806 | 11,861 | 8,840 | 11,319 | 15,875 | ||||||||||||||||||||||||
Acquisition-related costs | — | 541 | — | — | 541 | 41,362 | 5,647 | 4,821 | ||||||||||||||||||||||||
General and administrative | 44,882 | 89,686 | 44,343 | 48,256 | 88,870 | 50,437 | 57,443 | 94,644 | ||||||||||||||||||||||||
|
|
|
|
|
|
|
|
|
|
|
|
|
|
|
| |||||||||||||||||
Total operating expenses | 440,926 | 923,581 | 459,785 | 457,702 | 893,428 | 537,724 | 396,194 | 1,047,703 | ||||||||||||||||||||||||
|
|
|
|
|
|
|
|
|
|
|
|
|
|
|
| |||||||||||||||||
Other income (expense) | ||||||||||||||||||||||||||||||||
Dividends and interest | 215 | 724 | 420 | 587 | 1,138 | 641 | 815 | 2,203 | ||||||||||||||||||||||||
Gain on bargain purchase | — | — | — | — | — | 328,826 | — | — | ||||||||||||||||||||||||
Interest expense | (153,489 | ) | (312,292 | ) | (190,262 | ) | (193,569 | ) | (386,380 | ) | (204,714 | ) | (191,922 | ) | (374,388 | ) | ||||||||||||||||
Gain on sale of real estate | 561 | 497 | 722 | 50 | 501 | — | — | (111 | ) | |||||||||||||||||||||||
Other | (2,119 | ) | (507 | ) | (2,123 | ) | 185 | (507 | ) | 2,113 | (3,728 | ) | 5,550 | |||||||||||||||||||
|
|
|
|
|
|
|
|
|
|
|
|
|
|
|
| |||||||||||||||||
Total other income (expense) | (154,832 | ) | (311,578 | ) |
| (191,243 | ) |
| (192,747 | ) |
| (385,248 | ) |
| 126,866 |
|
| (194,835 | ) |
| (366,746 | ) | ||||||||||
|
|
|
|
|
|
|
|
|
|
|
|
|
|
|
| |||||||||||||||||
Income (loss) before equity in income (loss) of unconsolidated joint ventures and income taxes | 1,662 | (61,809 | ) | (78,357 | ) | (93,090 | ) | (152,879 | ) | 154,761 | (37,095 | ) | (289,345 | ) | ||||||||||||||||||
Income tax benefit | — | — | — | — | — | — | — | 16,494 | ||||||||||||||||||||||||
Equity in income (loss) of unconsolidated joint ventures | 699 | 690 | 754 | 568 | 687 | (160 | ) | (381 | ) | (2,116 | ) | |||||||||||||||||||||
Impairment of investment in unconsolidated joint ventures | — | (314 | ) | — | — | (314 | ) | — | — | (1,734 | ) | |||||||||||||||||||||
|
|
|
|
|
|
|
|
|
|
|
|
|
|
|
| |||||||||||||||||
Income (loss) from continuing operations | 2,361 | (61,433) | (77,603 | ) | (92,522 | ) | (152,506 | ) | 154,601 | (37,476 | ) | (276,701 | ) | |||||||||||||||||||
|
|
|
|
|
|
|
|
|
|
|
|
|
|
|
| |||||||||||||||||
18
| Successor | Predecessor | |||||||||||||||||||||||||||||||
| Pro Forma Six Months Ended June 30, 2013 | Pro Forma Year Ended December 31, 2012 | Six Months Ended June 30, | Year Ended December 31, 2012 | Period from June 28, 2011 through December 31, 2011 | Period from January 1, 2011 through June 27, 2011 | Year Ended December 31, 2010 | ||||||||||||||||||||||||||
| 2013 | 2012 | |||||||||||||||||||||||||||||||
| (in thousands) | ||||||||||||||||||||||||||||||||
| (unaudited) | (unaudited) | (unaudited) | (unaudited) | |||||||||||||||||||||||||||||
Discontinued operations: | ||||||||||||||||||||||||||||||||
Income (loss) from discontinued operations | — | — | 192 | (365 | ) | 23 | (1,465 | ) | (1,007 | ) | 135 | |||||||||||||||||||||
Gain on disposition of properties | — | — | 2,631 | 1,229 | 5,369 | — | — | — | ||||||||||||||||||||||||
Impairment of real estate assets held for sale | — | — | (7,511 | ) | (2,911 | ) | (13,599 | ) | — | (8,608 | ) | (43,421 | ) | |||||||||||||||||||
|
|
|
|
|
|
|
|
|
|
|
|
|
|
|
| |||||||||||||||||
Loss from discontinued operations | — | — | (4,688 | ) | (2,047 | ) | (8,207 | ) | (1,465 | ) | (9,615 | ) | (43,286 | ) | ||||||||||||||||||
|
|
|
|
|
|
|
|
|
|
|
|
|
|
|
| |||||||||||||||||
Net income (loss) | 2,361 | (61,433 | ) | (82,291 | ) | (94,569 | ) | (160,713 | ) | 153,136 | (47,091 | ) | (319,987 | ) | ||||||||||||||||||
Net (income) loss attributable to non-controlling interests | (1,268 | ) | 14,217 | 19,531 | 22,535 | 38,146 | (37,785 | ) | (752 | ) | (1,400 | ) | ||||||||||||||||||||
|
|
|
|
|
|
|
|
|
|
|
|
|
|
|
| |||||||||||||||||
Net income (loss) attributable to Brixmor Property Group Inc. | 1,093 | (47,216 | ) | (62,760 | ) | (72,034 | ) | (122,567 | ) | 115,351 | (47,843 | ) | (321,387 | ) | ||||||||||||||||||
Preferred stock dividends | — | (296 | ) | — | — | (296 | ) | (137 | ) | — | — | |||||||||||||||||||||
|
|
|
|
|
|
|
|
|
|
|
|
|
|
|
| |||||||||||||||||
Net income (loss) attributable to common stockholders | $ | 1,093 | (47,512 | ) | $ | (62,760 | ) | $ | (72,034 | ) | $ | (122,863 | ) | $ | 115,214 | $ | (47,843 | ) | $(321,387 | ) | ||||||||||||
|
|
|
|
|
|
|
|
|
|
|
|
|
|
|
| |||||||||||||||||
Per common share: | ||||||||||||||||||||||||||||||||
Income (loss) from continuing operations: | ||||||||||||||||||||||||||||||||
Basic | $ | 0.00 | $ | (0.16 | ) | |||||||||||||||||||||||||||
|
|
|
| |||||||||||||||||||||||||||||
Diluted | $ | 0.00 | $ | (0.16 | ) | |||||||||||||||||||||||||||
|
|
|
| |||||||||||||||||||||||||||||
Net income: | ||||||||||||||||||||||||||||||||
Basic | $ | 0.00 | $ | (0.16 | ) | |||||||||||||||||||||||||||
|
|
|
| |||||||||||||||||||||||||||||
Diluted | $ | 0.00 | $ | (0.16 | ) | |||||||||||||||||||||||||||
|
|
|
| |||||||||||||||||||||||||||||
Weighted average shares: | ||||||||||||||||||||||||||||||||
Basic | 288,584 | 288,584 | ||||||||||||||||||||||||||||||
|
|
|
| |||||||||||||||||||||||||||||
Diluted | 386,167 | 386,167 | ||||||||||||||||||||||||||||||
|
|
|
| |||||||||||||||||||||||||||||
| Successor | Predecessor | |||||||||||||||||||||
| Pro Forma June 30, 2013 | June 30, 2013 | December 31, | December 31, 2010 | |||||||||||||||||||
| (in thousands) | 2012 | 2011 | ||||||||||||||||||||
| (unaudited) | (unaudited) | |||||||||||||||||||||
Selected Balance Sheet Data | ||||||||||||||||||||||
Real estate, net | $9,581,480 | $8,855,876 | $9,098,130 | $9,496,903 | $9,873,096 | |||||||||||||||||
Total assets | $10,135,099 | $9,449,961 | $9,603,729 | $10,032,266 | $10,711,209 | |||||||||||||||||
Debt obligations, net | $6,303,554 | $6,480,369 | $6,499,356 | $6,694,549 | $7,700,237 | |||||||||||||||||
Total liabilities | $7,135,284 | $7,258,482 | $7,305,908 | $7,553,277 | $8,731,832 | |||||||||||||||||
Total equity | $2,978,346 | $2,170,012 | $2,276,354 | $2,457,430 | $1,957,818 | |||||||||||||||||
19
| Successor | Predecessor | |||||||||||||||||||||||||||||||
| Pro Forma Six Months Ended June 30, 2013 | Pro Forma Year Ended December 31, 2012 | Six Months Ended June 30, | Year Ended December 31, 2012 | Period from June 28, 2011 through December 31, 2011 | Period from January 1, 2011 through June 27, 2011 | Year Ended December 31, 2010 | ||||||||||||||||||||||||||
| 2013 | 2012 | |||||||||||||||||||||||||||||||
| (in thousands) | ||||||||||||||||||||||||||||||||
Other Data | ||||||||||||||||||||||||||||||||
Funds from operations (1) | $ | 240,637 | $ | 463,056 | $ | 181,442 | $ | 169,612 | $ | 355,000 | $ | 449,742 | $ | 138,885 | $ | 380,637 | ||||||||||||||||
Funds from operations as adjusted (1) | $ | 241,607 | $ | 463,100 | $ | 183,791 | $ | 169,562 | $ | 355,040 | $ | 162,278 | $ | 144,532 | $ | 385,569 | ||||||||||||||||
Same property NOI (2) | $ | 406,012 | $ | 787,573 | $ | 387,542 | $ | 373,935 | $ | 756,401 | $ | 371,901 | $ | 357,388 | $ | 735,577 | ||||||||||||||||
EBITDA (3) | $ | 398,114 | $ | 782,792 | $ | 337,857 | $ | 368,325 | $ | 741,642 | $ | 662,014 | $ | 336,151 | $ | 476,813 | ||||||||||||||||
Adjusted EBITDA (3) | $ | 399,084 | $ | 783,126 | $ | 378,075 | $ | 370,053 | $ | 750,202 | $ | 374,580 | $ | 350,406 | $ | 779,489 | ||||||||||||||||
| (1) | Funds From Operations (“FFO”) is a supplemental non-GAAP measure utilized to evaluate the operating performance of real estate companies. The National Association of Real Estate Investment Trusts (“NAREIT”) defines FFO as net income/(loss) computed in accordance with GAAP, excluding (i) gains or losses from sales of operating real estate assets and (ii) extraordinary items, plus (iii) depreciation and amortization of operating properties, (iv) impairment of depreciable real estate and in substance real estate equity investments and (v) after adjustments for unconsolidated partnerships and joint ventures calculated to reflect funds from operations on the same basis. |
We present FFO as we consider it an important supplemental measure of our operating performance and we believe it is frequently used by securities analysts, investors and other interested parties in the evaluation of REITs, many of which present FFO when reporting results. Comparison of our presentation of FFO to similarly titled measures for other REITs may not necessarily be meaningful due to possible differences in the application of the NAREIT definition used by such REITs.
We also present FFO as adjusted as an additional supplemental measure as we believe it is more reflective of our core operating performance. We believe FFO as adjusted provides investors and analysts an additional measure in comparing our performance across reporting periods on a consistent basis by excluding items that we do not believe are indicative of our core operating performance. FFO as adjusted is generally calculated by us as FFO excluding certain transactional income and expenses and non-operating impairments and non-operating gains which management believes are not reflective of the results within our operating real estate portfolio.
FFO is a supplemental non-GAAP financial measure of real estate companies’ operating performances, which does not represent cash generated from operating activities in accordance with GAAP and therefore should not be considered an alternative for net income as a measure of liquidity. Our method of calculating FFO and FFO as adjusted may be different from methods used by other REITs and, accordingly, may not be comparable to such other REITs.
20
The following table provides a reconciliation of net income (loss) to FFO and FFO as adjusted for the periods presented (in thousands):
| Successor | Predecessor | |||||||||||||||||||||||||||||||||
| Pro Forma Six Months Ended June 30, 2013 | Pro Forma Year Ended December 31, 2012 | Six Months Ended June 30, | Year Ended December 31, 2012 | Period from June 28, 2011 through December 31, 2011 |
| Period from January 1, 2011 through June 27, 2011 | Year Ended December 31, 2010 | |||||||||||||||||||||||||||
| 2013 | 2012 | |||||||||||||||||||||||||||||||||
Net income (loss) | $ | 2,361 | $ | (61,433 | ) | $ | (82,291 | ) | $ | (94,569 | ) | $ | (160,713 | ) | $ | 153,136 | $ | (47,091 | ) | $ | (319,987 | ) | ||||||||||||
Gain on disposition of operating properties | — | — | (2,631 | ) | (1,229 | ) | (5,369 | ) | — | — | — | |||||||||||||||||||||||
(Gain) loss on disposition of unconsolidated joint venture operating properties | — | (24 | ) | — | 96 | (24 | ) | 30 | — | 3,303 | ||||||||||||||||||||||||
Depreciation and amortization—real estate related-continuing operations | 238,830 | 524,840 | 225,497 | 258,950 | 501,831 | 291,978 | 172,393 | 387,103 | ||||||||||||||||||||||||||
Depreciation and amortization—real estate related-discontinued operations | — | — | 878 | 3,580 | 5,851 | 4,775 | 4,819 | 13,390 | ||||||||||||||||||||||||||
Depreciation and amortization—unconsolidated joint ventures | 117 | 665 | 160 | 525 | 817 | 476 | 908 | 3,787 | ||||||||||||||||||||||||||
Impairment of operating properties | — | — | 40,500 | 2,911 | 13,599 | — | 8,608 | 292,707 | ||||||||||||||||||||||||||
Impairment of unconsolidated joint ventures | — | 314 | — | — | 314 | — | — | 1,734 | ||||||||||||||||||||||||||
Net loss attributable to non controlling interests not convertible into common stock | (671 | ) | (1,306 | ) | (671 | ) | (652 | ) | (1,306 | ) | (653 | ) | (752 | ) | (1,400 | ) | ||||||||||||||||||
|
|
|
|
|
|
|
|
|
|
|
|
|
|
|
| |||||||||||||||||||
FFO | 240,637 | 463,056 | 181,442 | 169,612 | 355,000 | 449,742 | 138,885 | 380,637 | ||||||||||||||||||||||||||
|
|
|
|
|
|
|
|
|
|
|
|
|
|
|
| |||||||||||||||||||
Gain from development/land sales | (561 | ) | (497 | ) | (722 | ) | (50 | ) | (501 | ) | — | — | 111 | |||||||||||||||||||||
Impairment of development/land parcels | 1,531 | — | 3,071 | — | — | — | — | — | ||||||||||||||||||||||||||
Acquisition-related costs | — | 541 | — | — | 541 | 41,362 | 5,647 | 4,821 | ||||||||||||||||||||||||||
Gain on bargain purchase | — | — | — | — | — | (328,826 | ) | — | — | |||||||||||||||||||||||||
|
|
|
|
|
|
|
|
|
|
|
|
|
|
|
| |||||||||||||||||||
Total adjustments | 970 | 44 | 2,349 | (50 | ) | 40 | (287,464 | ) | 5,647 | 4,932 | ||||||||||||||||||||||||
|
|
|
|
|
|
|
|
|
|
|
|
|
|
|
| |||||||||||||||||||
FFO as adjusted | $ | 241,607 | $ | 463,100 | $ | 183,791 | $ | 169,562 | $ | 355,040 | $ | 162,278 | $ | 144,532 | $ | 385,569 | ||||||||||||||||||
|
|
|
|
|
|
|
|
|
|
|
|
|
|
|
| |||||||||||||||||||
FFO per common share/unit—basic | $ | 0.62 | $ | 1.20 | ||||||||||||||||||||||||||||||
|
|
|
| |||||||||||||||||||||||||||||||
FFO per common share/unit—diluted | $ | 0.62 | $ | 1.20 | ||||||||||||||||||||||||||||||
|
|
|
| |||||||||||||||||||||||||||||||
FFO as adjusted per common share/unit—diluted | $ | 0.63 | $ | 1.20 | ||||||||||||||||||||||||||||||
|
|
|
| |||||||||||||||||||||||||||||||
Weighted-average shares/units outstanding—basic | 386,167 | 386,167 | ||||||||||||||||||||||||||||||||
|
|
|
| |||||||||||||||||||||||||||||||
Weighted-average shares/units outstanding— diluted | 386,167 | 386,167 | ||||||||||||||||||||||||||||||||
|
|
|
| |||||||||||||||||||||||||||||||
| (2) | Same property NOI, a non-GAAP measure, is often used by real estate companies as a supplemental measure of operating performance. Although same property NOI is not presented in accordance with GAAP, we believe it assists investors in understanding our business and operating results by providing useful supplemental data regarding the |
21
| underlying economics of our business operations. Management uses same property NOI to review our operating results for comparative purposes with respect to previous periods or forecasts, and also to evaluate future prospects. Our same property NOI is not intended to be a performance measure that should be regarded as an alternative to, or more meaningful than, our GAAP financial measures. Non-GAAP financial measures have limitations as they do not include all items of income and expense that affect our operations, and, accordingly, should always be considered as supplemental to our financial results presented in accordance with GAAP. |
We believe that same property NOI is helpful to investors as a measure of our operational performance because it includes only the net operating income of properties owned for the full period presented, which eliminates disparities in net income due to the acquisition or disposition of properties during the period presented, and, therefore, provides a more consistent metric for comparing the performance of our properties. Same property NOI should not be considered as an alternative to net income (determined in accordance with GAAP) as an indicator of our financial performance. In addition, our computation of same property NOI may differ from similarly titled measures reported by other companies and, therefore, may not be comparable to such other companies.
We calculate same property NOI as total property revenues (minimum rent, percentage rents, and recoveries from tenants and other income) less direct property operating expenses (operating and maintenance and real estate taxes) from the properties owned by us. Same property NOI excludes corporate level income (including transaction and other fees), lease termination income, straight-line rent, amortization of above-/below-market leases of the same property pool from the prior year reporting period to the current year reporting period. Same property NOI includes all properties in the IPO Portfolio that were owned as of the end of both the current and prior year reporting periods and for the entirety of both periods, excluding properties classified as discontinued operations.
22
The following table provides a reconciliation of net income (loss) attributable to Brixmor Property Group Inc. to same property NOI and same property NOI of our Same Property Portfolio for the periods presented (in thousands):
| Successor | Predecessor | |||||||||||||||||||||||||||||||||
| Pro Forma Six Months Ended June 30, 2013 | Pro Forma Year Ended December 31, 2012 | Six Months Ended June 30, | Year Ended December 31, 2012 | Period from June 28, 2011 through December 31, 2011 | Period from January 1, 2011 through June 27, 2011 | Year Ended December 31, 2010 | ||||||||||||||||||||||||||||
| 2013 | 2012 | |||||||||||||||||||||||||||||||||
Net income (loss) attributable to Brixmor Property Group Inc. | $ | 1,093 | $ | (47,216 | ) | $ | (62,760 | ) | $ | (72,034 | ) | $ | (122,567 | ) | $ | 115,351 | $ | (47,843 | ) | $ | (321,387 | ) | ||||||||||||
Adjustments: | ||||||||||||||||||||||||||||||||||
Revenue adjustments (a) | (37,651 | ) | (81,543 | ) | (33,923 | ) | (35,808 | ) | (72,779 | ) | (42,793 | ) | (41,960 | ) | (85,740 | ) | ||||||||||||||||||
Depreciation and amortization | 239,838 | 527,592 | 226,505 | 260,455 | 504,583 | 293,924 | 174,554 | 391,170 | ||||||||||||||||||||||||||
Impairment of real estate assets | 1,531 | — | 36,060 | — | — | — | — | 249,286 | ||||||||||||||||||||||||||
Acquisition-related costs | — | 541 | — | — | 541 | 41,362 | 5,647 | 4,821 | ||||||||||||||||||||||||||
General and administrative | 44,882 | 89,686 | 44,343 | 48,256 | 88,870 | 50,437 | 57,443 | 94,644 | ||||||||||||||||||||||||||
Other Expenses | 154,832 | 311,578 | 191,243 | 192,747 | 385,248 | (126,866 | ) | 194,835 | 366,746 | |||||||||||||||||||||||||
Equity in income (loss) of unconsolidated joint ventures | (699 | ) | (690 | ) | (754 | ) | (568 | ) | (687 | ) | 160 | 381 | 2,116 | |||||||||||||||||||||
Impairment of investment in unconsolidated joint ventures | — | 314 | — | — | 314 | — | — | 1,734 | ||||||||||||||||||||||||||
Income tax benefit | — | — | — | — | — | — | — | (16,494 | ) | |||||||||||||||||||||||||
Non-same property NOI | 394 | 574 | 394 | 290 | 574 | 120 | 2,644 | 1,305 | ||||||||||||||||||||||||||
Pro rata share of same property NOI of unconsolidated joint ventures | 524 | 954 | 1,277 | 1,085 | 2,243 | 956 | 1,320 | 2,690 | ||||||||||||||||||||||||||
Loss on discontinued operations | — | — | 4,688 | 2,047 | 8,207 | 1,465 | 9,615 | 43,286 | ||||||||||||||||||||||||||
Net (income) loss attributable to non-controlling interests | 1,268 | (14,217 | ) | (19,531 | ) | (22,535 | ) | (38,146 | ) | 37,785 | 752 | 1,400 | ||||||||||||||||||||||
|
|
|
|
|
|
|
|
|
|
|
|
|
|
|
| |||||||||||||||||||
Same property NOI | 406,012 | 787,573 | 387,542 | 373,935 | 756,401 | 371,901 | 357,388 | $ | 735,577 | |||||||||||||||||||||||||
|
| |||||||||||||||||||||||||||||||||
NOI attributable to Non-Core Properties | — | — | (9,575 | ) | (11,279 | ) | (22,030 | ) | (10,959 | ) | (10,568 | ) | ||||||||||||||||||||||
|
|
|
|
|
|
|
|
|
|
|
|
|
| |||||||||||||||||||||
Same Property NOI of Same Property Portfolio | 406,012 | 787,573 | $ | 377,967 | $ | 362,656 | $ | 734,371 | $ | 360,942 | $ | 346,820 | ||||||||||||||||||||||
|
|
|
|
|
|
|
|
|
|
|
|
|
| |||||||||||||||||||||
| (a) | Includes adjustments for lease settlement income, straight-line rent, amortization of above and below market leases and fee income from unconsolidated joint ventures. |
| (3) | EBITDA is calculated as the sum of net income (loss) before interest expense, income taxes, depreciation and amortization. Adjusted EBITDA represents EBITDA as adjusted for (i) acquisition-related costs, (ii) gain on bargain purchase, (iii) gain (loss) on sales of operating properties, (iv) impairment of real estate assets and related investments, (v) gain on disposition of operating properties, (vi) gain or loss from development/land sales, (vii) gain or loss on disposition of unconsolidated joint venture operating properties and (viii) impairments of operating properties, real estate held for sale and unconsolidated joint ventures. |
Given the nature of our business as a real estate owner and operator, we believe that the use of EBITDA and Adjusted EBITDA in various financial ratios is helpful to investors as a measure of its operational performance because EBITDA and Adjusted EBITDA exclude various items that do not relate to or are not indicative of its operating performance such as gains (losses) from sales of real estate and depreciation and amortization on real estate assets, and includes the results of operations of real estate properties that have been sold or classified as real estate held for sale at the end of the reporting period. Accordingly, we believe that the use of EBITDA and Adjusted EBITDA in various ratios provides a meaningful performance measure as it relates to its ability to meet various coverage tests for the stated period. EBITDA and Adjusted EBITDA should not be considered as alternatives to net income (determined in accordance with GAAP) as indicators of our financial performance and are not alternatives to cash flow from operating activities (determined in accordance with GAAP) as a measure of our liquidity. In addition, our computation of EBITDA and Adjusted EBITDA may differ in certain respects from the methodology utilized by other REITS to calculate EBITDA and Adjusted EBITDA and, therefore, may not be comparable to such other REITS. Investors are cautioned that items excluded from EBITDA and Adjusted EBITDA are significant components in understanding and addressing our financial performance.
23
The following table provides a reconciliation of EBITDA and Adjusted EBITDA to net income (loss) for the periods presented (in thousands):
| Successor | Predecessor | |||||||||||||||||||||||||||||||||
| Pro Forma Six Months Ended June 30, 2013 | Pro Forma Year Ended December 31, 2012 | Six Months Ended June 30, | Year Ended December 31, 2012 | Period from June 28, 2011 through December 31, 2011 | Period from January 1, 2011 through June 27, 2011 | Year Ended December 31, 2010 | ||||||||||||||||||||||||||||
| 2013 | 2012 | |||||||||||||||||||||||||||||||||
Net income (loss) | $ | 2,361 | $ | (61,433) | $ | (82,291 | ) | $ | (94,569 | ) | $ | (160,713 | ) | $ | 153,136 | $ | (47,091 | ) | $ | (319,987 | ) | |||||||||||||
Interest expense—continuing operations | 153,489 | 312,292 | 190,262 | 193,569 | 386,380 | 204,714 | 191,922 | 374,388 | ||||||||||||||||||||||||||
Interest expense—discontinued operations | — | — | (3 | ) | 666 | 963 | 723 | 449 | 3,681 | |||||||||||||||||||||||||
Interest expense—unconsolidated joint ventures | 413 | 1,504 | 450 | 880 | 1,589 | 852 | — | — | ||||||||||||||||||||||||||
Federal and state taxes | 1,896 | 2,172 | 1,896 | 3,219 | 2,172 | 3,414 | 10,590 | 10,384 | ||||||||||||||||||||||||||
Depreciation and amortization—continuing operations | 239,838 | 527,592 | 226,505 | 260,455 | 504,583 | 293,924 | 174,554 | 391,170 | ||||||||||||||||||||||||||
Depreciation and amortization—discontinued operations | — | — | 878 | 3,580 | 5,851 | 4,775 | 4,819 | 13,390 | ||||||||||||||||||||||||||
Depreciation and amortization—real estate joint ventures | 117 | 665 | 160 | 525 | 817 | 476 | 908 | 3,787 | ||||||||||||||||||||||||||
|
|
|
|
|
|
|
|
|
|
|
|
|
|
|
| |||||||||||||||||||
EBITDA | 398,114 | 782,792 | 337,857 | 368,325 | 741,642 | 662,014 | 336,151 | 476,813 | ||||||||||||||||||||||||||
|
|
|
|
|
|
|
|
|
|
|
|
|
|
|
| |||||||||||||||||||
Acquisition-related costs | — | 541 | — | — | 541 | 41,362 | 5,647 | 4,821 | ||||||||||||||||||||||||||
Gain on bargain purchase | — | — | — | — | — | (328,826 | ) | — | — | |||||||||||||||||||||||||
Gain on disposition of operating properties | — | — | (2,631 | ) | (1,229 | ) | (5,369 | ) | — | — | — | |||||||||||||||||||||||
Gain from development/land sales | (561 | ) | (497 | ) | (722 | ) | (50 | ) | (501 | ) | — | — | 111 | |||||||||||||||||||||
(Gain) loss on disposition of unconsolidated joint venture operating properties | — | (24 | ) | — | 96 | (24 | ) | 30 | — | 3,303 | ||||||||||||||||||||||||
Impairment of operating properties | 1,531 | — | 36,060 | — | — | — | — | 249,286 | ||||||||||||||||||||||||||
Impairment of real estate held for sale | — | — | 7,511 | 2,911 | 13,599 | — | 8,608 | 43,421 | ||||||||||||||||||||||||||
Impairment of investment in unconsolidated joint ventures | — | 314 | — | — | 314 | — | — | 1,734 | ||||||||||||||||||||||||||
|
|
|
|
|
|
|
|
|
|
|
|
|
|
|
| |||||||||||||||||||
Total adjustments | 970 | 334 | 40,218 | 1,728 | 8,560 | (287,434 | ) | 14,255 | 302,676 | |||||||||||||||||||||||||
|
|
|
|
|
|
|
|
|
|
|
|
|
|
|
| |||||||||||||||||||
Adjusted EBITDA | $ | 399,084 | $ | 783,126 | $ | 378,075 | $ | 370,053 | $ | 750,202 | $ | 374,580 | $ | 350,406 | $ | 779,489 | ||||||||||||||||||
|
|
|
|
|
|
|
|
|
|
|
|
|
|
|
| |||||||||||||||||||
24
IPO Property Transfers
In connection with this offering, we will acquire interests in 43 properties (the “Acquired Properties”) from our Sponsor in exchange for OP Units having a value equivalent to the value of these interests. The precise number of OP Units to be issued in connection with our acquisition of the Acquired Properties will be determined at the time that the initial public offering price per share in this offering is determined. More specifically, because we have determined that the Acquired Properties are of comparable quality to the Same Property Portfolio, we intend to utilize the capitalization rate for the IPO Portfolio implied by the initial price to the public in this offering to assign values to the properties comprising the Same Property Portfolio and the Acquired Properties and then, after taking in to account the differing levels of indebtedness related to these different asset pools, determine the relative equity value contributed by the owners of the Acquired Properties. This calculation will permit us to determine the appropriate percentage ownership of the Operating Partnership to be issued in exchange for the Acquired Properties. Because the Acquired Properties are somewhat more highly leveraged than the Same Property Portfolio, the proportion of the equity value contributed by the owners of the Acquired Properties is correlated to the initial public offering price and the overall value implied to the IPO Portfolio by that price. Based on an assumed initial public offering price of $15.00 per share (the midpoint of the estimated price range set forth on the cover page of this prospectus), we would issue 20,784,571 OP Units in exchange for interests in the Acquired Properties. A $1.00 increase in the assumed initial public offering price to $16.00 per share would increase the number of OP Units we would issue to 20,856,851 , and a $1.00 decrease in the assumed initial public offering price to $14.00 per share would decrease the number of OP Units we would issue to our Sponsor to 20,701,965. In connection with the acquisition of the Acquired Properties, we will repay approximately $74.1 million of indebtedness to our Sponsor attributable to certain of the Acquired Properties, approximately $66.6 million of which will be repaid with a portion of the net proceeds of this offering and approximately $7.5 million of which will be repaid approximately one year following this offering.
Also in connection with this offering, we will distribute to our pre-IPO owners interests (except to the extent that we dispose of any such interest prior to such distribution) in 45 properties that we have historically held in our portfolio (the “Non-Core Properties”). Certain of the Non-Core Properties are subject to transfer restrictions under the indentures governing unsecured notes issued by our subsidiary, Brixmor LLC, until January 15, 2014. Accordingly, we intend to effect the distribution of the Non-Core Properties to our pre-IPO owners in two steps. First, at the time of this offering we will issue to our pre-IPO owners a separate series of interest in our Operating Partnership that allocates to them all of the economic consequences of ownership of the Non-Core Properties. This separate series of interest in our Operating Partnership will be redeemable by us at our option at any time by transferring to the holders of such series the underlying Non-Core Properties. Second, following the expiration of the applicable transfer restrictions on January 15, 2014, we intend to transfer to our pre-IPO owners the Non-Core Properties in redemption of the separate series of interest in our Operating Partnership relating to these properties. We will not be required to redeem the separate series of interests after the transfer restrictions expire, nor do we have the option to redeem the separate series of interests with cash or any other form of consideration. However, we do not anticipate any circumstances in which we would not redeem the separate series of interests after the transfer restrictions expire, and because the economic consequences of ownership of the Non-Core Properties will be attributable to the holders of the separate series of interests, which will be reflected as a noncontrolling interest in Brixmor Property Group Inc.’s consolidated financial statements, the net income attributable to Brixmor Property Group Inc. would be unaffected by any decision not to redeem these interests. Following this offering and the IPO Property Transfers, we will continue to manage the Non-Core Properties for which we expect to receive customary management, leasing and other fees.
We refer to the above-described contributions and distributions as the “IPO Property Transfers.” For additional information, see “Unaudited Pro Forma Financial Information—IPO Property Transfers.”
44
Management Interests in Acquired Properties
Certain members of our management team, including our executive officers, purchased, or received as compensation for services such executives provided with respect to the Acquired Properties, interests in affiliated entities that presently own the Acquired Properties. Following the IPO Property Transfers, the interests of our management in these entities will be converted into OP Units in a manner intended to replicate the respective economic benefit provided by such units based upon the valuation derived from the initial public offering price relative to the specific assets of that affiliated entity that comprise the Acquired Properties. We will recognize additional compensation expense in respect of the conversion that will be included in general and administrative expense at the time we complete the IPO Property Transfers. The amount of the expense recognized will be the difference between the accumulated amounts previously recognized by us for the interests in the Acquired Properties and the fair value of the OP Units issued in the conversion.
The following table sets forth the type and number of such interests prior to the conversion and the number of OP Units into which such interests will be converted, in each case based on an assumed initial public offering price of $15.00 per share (the midpoint of the estimated price range set forth on the cover page of this prospectus).
| BRE Southeast Retail | BRE Throne | |||||||||||||||
| BRE Units(1) | Class A-2 Units(2) | Throne Units(3) | Class A-2 Units(4) | |||||||||||||
Management interests outstanding prior to conversion | 6,166,539 | 150,000 | 2,813,447 | 100,000 | ||||||||||||
Conversion ratio | 0.02456 | 0.10148 | 0.09203 | 0.17747 | ||||||||||||
OP Units to be issued | 151,446 | 15,222 | 258,910 | 17,747 | ||||||||||||
| (1) | Class B Units (“BRE Units”) in BRE Southeast Retail Holdings LLC (“BRE Southeast Retail”). The BRE Units are profits interests having economic characteristics similar to stock appreciation rights and representing the right to share in any increase in the equity value of BRE Southeast Retail that exceeds a specified threshold. |
| (2) | Class A-2 Units in BRE Southeast Retail. Class A-2 Units are equity interests that have economic characteristics that are similar to those of shares of common stock in a corporation. |
| (3) | Class B Units (the “Throne Units”) in BRE Throne Parent HoldCo LLC and BRE Throne REIT HoldCo LLC (collectively, “BRE Throne”). The Throne Units are profits interests having economic characteristics similar to stock appreciation rights and representing the right to share in any increase in the equity value of BRE Throne that exceeds a specified threshold. |
| (4) | Class A-2 Units in BRE Throne. Class A-2 Units are equity interests that have economic characteristics that are similar to those of shares of common stock in a corporation. |
See “Management—Compensation Discussion and Analysis—Compensation Elements—Long-Term Equity Compensation—Equity Awards in the Acquired Properties We Manage” and “Management—Compensation Discussion and Analysis—Compensation Elements—Long-Term Equity Compensation—Compensation Actions Taken During 2013—Equity Awards in the Acquired Properties We Manage.”
Our Organizational Structure
All of our assets are held, and our operations conducted, by our Operating Partnership. We own and control our Operating Partnership indirectly through our ownership in BPG Subsidiary. Brixmor OP GP LLC, a wholly-owned subsidiary of BPG Subsidiary, serves as the sole general partner of our Operating Partnership.
In addition to owning shares of our common stock, our Pre-IPO owners also own Outstanding BPG Subsidiary Shares and, following the IPO Property Transfers, Outstanding OP Units. We have entered into an exchange agreement with the holders of the Outstanding BPG Subsidiary Shares so that these holders may, from and after the first anniversary of the date of the closing of this offering (subject to the terms of the exchange
45
agreement), exchange their BPG Subsidiary Shares for shares of our common stock on a one-for-one basis subject to customary conversion rate adjustments for splits, share dividends and reclassifications, or, at our election, for cash. In addition, holders of Outstanding OP Units may, from and after the first anniversary of the date of the closing of this offering (subject to the terms of the partnership agreement of our Operating Partnership), redeem their OP Units for cash or, at our election, exchange their OP Units for shares of our common stock on a one-for-one basis subject to customary conversion rate adjustments for splits, unit distributions and reclassifications. Notwithstanding the foregoing, our Sponsor and Centerbridge are generally permitted to exchange BPG Subsidiary Shares and redeem their OP Units at any time.
We refer to shares of our common stock, the BPG Subsidiary Shares and the OP Units, collectively, as “Brixmor Interests.” We use the term “Outstanding BPG Subsidiary Shares” to refer to the BPG Subsidiary Shares held by persons other than Brixmor Property Group Inc. and the term “Outstanding OP Units” to refer to the OP Units not held by Brixmor Property Group Inc., BPG Subsidiary or its wholly-owned subsidiary. We use the term “Outstanding Brixmor Interests” to refer, collectively, to the outstanding shares of our common stock, the Outstanding BPG Subsidiary Shares and the Outstanding OP Units.
Brixmor Property Group Inc. owns a majority of the BPG Subsidiary Shares outstanding. Accordingly, through its power to elect all of BPG Subsidiary’s directors, Brixmor Property Group Inc. operates and controls all of the business and affairs of BPG Subsidiary and consolidates the financial results of BPG Subsidiary and its consolidated subsidiaries, including our Operating Partnership. The ownership interest of the minority stockholders of BPG Subsidiary is reflected as a non-controlling interest in Brixmor Property Group Inc.’s consolidated financial statements.
After the completion of this offering and the IPO Property Transfers, BPG Subsidiary will own a majority of the OP Units of our Operating Partnership outstanding, and its wholly-owned subsidiary, Brixmor OP GP LLC, will serve as the sole general partner of our Operating Partnership. Accordingly, BPG Subsidiary will operate and control all of the business and affairs of our Operating Partnership and consolidate the financial results of our Operating Partnership and its consolidated subsidiaries. The ownership interest of the holders of OP Units to be held by our pre-IPO owners will also be reflected as a non-controlling interest in Brixmor Property Group Inc.’s consolidated financial statements.
As of June 30, 2013, Brixmor Property Group Inc. had outstanding 125 shares of Series A Redeemable Preferred Stock (the “Existing Preferred Stock”) held by 125 holders, having a liquidation preference of $10,000 per share. We intend to redeem for cash all outstanding shares of our Existing Preferred Stock shortly before the completion of this offering.
As of June 30, 2013, BPG Subsidiary Inc. had outstanding 125 shares of Series A Redeemable Preferred Stock, par value $0.01 per share, held by 125 holders, having a liquidation preference of $10,000 per share. The outstanding preferred stock of BPG Subsidiary Inc. will remain outstanding after this offering.
46
The following diagram depicts our organizational structure and equity ownership immediately following this offering. This chart is provided for illustrative purposes only and does not show all of our legal entities or ownership percentages of such entities.
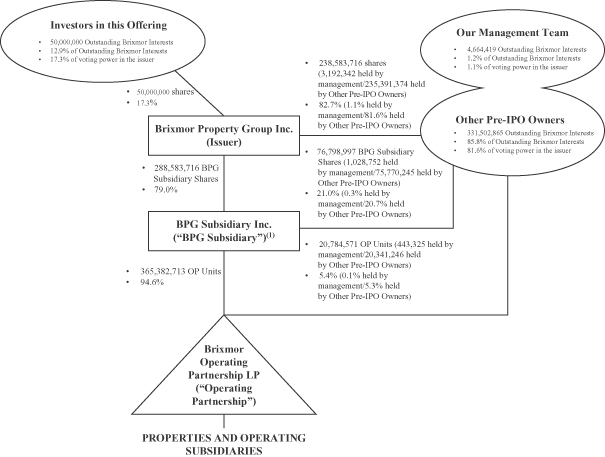
| (1) | BPG Subsidiary owns a portion of its interest in our Operating Partnership through Brixmor OP GP LLC, a wholly-owned subsidiary of BPG Subsidiary that serves as the sole general partner of our Operating Partnership. |
47
We estimate that the net proceeds we will receive from this offering, after deducting estimated underwriting discounts and estimated offering expenses payable by us, will be approximately $702.5 million, or approximately $809.4 million if the underwriters exercise in full their option to purchase additional shares from us, assuming an initial public offering price of $15.00 per share, which is the midpoint of the price range set forth on the cover page of this prospectus. A $1.00 increase (decrease) in the assumed initial public offering price of $15.00 per share would increase (decrease) net proceeds to us from this offering by approximately $47.5 million, assuming the number of shares offered by us as set forth on the cover page of this prospectus remains the same.
Brixmor Property Group Inc. will contribute the net proceeds of this offering to BPG Subsidiary in exchange for a number of BPG Subsidiary Shares that is equal to the number of shares that we issue to investors in this offering. BPG Subsidiary will in turn contribute this amount to our Operating Partnership in exchange for a number of OP Units that is equal to the number of BPG Subsidiary Shares that BPG Subsidiary so issues to Brixmor Property Group Inc.
Our Operating Partnership will primarily use the net proceeds from this offering to repay $628.5 million of outstanding borrowings under the revolving portion of the Unsecured Credit Facility, which will mature in 2017. Borrowings under the revolving facility currently bear interest at LIBOR plus 1.70%. The borrowings under the revolving credit facility to be repaid with proceeds from this offering will have been used to repay indebtedness of our Operating Partnership and its subsidiaries and for general corporate purposes. See “Description of Indebtedness.” Affiliates of each of the representatives of the underwriters are lenders under our Unsecured Credit Facility, which we intend to repay in part with the net proceeds of this offering. We will also use the net offering proceeds to repay $66.6 million of indebtedness to our Sponsor attributable to certain of the Acquired Properties, to pay approximately $2.0 million of transaction costs related to the IPO Property Transfers, which relate to, among other things, transfer taxes and loan consent fees, and to pay approximately $5.5 million of transfer fees due to lenders on several of our outstanding mortgage loans that are payable in connection with this offering.
48
We intend to continue to qualify as a REIT for U.S. federal income tax purposes. The Code generally requires that a REIT annually distribute at least 90% of its REIT taxable income, determined without regard to the deduction for dividends paid and excluding any net capital gain, and imposes tax on any taxable income retained by a REIT, including capital gains.
We intend to make a pro rata distribution with respect to the quarter during which this offering occurs, based on a distribution rate of $0.15 per share of our common stock for a full quarter. On an annualized basis, this would be $0.60 per share of our common stock, or an annualized distribution rate of approximately 4.0% based on the midpoint of the price range set forth on the cover of this prospectus. We estimate that this initial annual distribution rate will represent approximately 74.6% of estimated cash available for distribution for the 12 months ending June 30, 2014. We do not intend to reduce the annualized distribution per share of our common stock if the underwriters exercise their option to purchase additional shares. Our intended initial annual distribution rate has been established based on our estimate of cash available for distribution for the 12 months ending June 30, 2014, which we have calculated based on adjustments to our pro forma net income for the 12 months ended June 30, 2013. This estimate was based on our pro forma operating results and does not take into account our long-term business and growth strategies, nor does it take into account any unanticipated expenditures that we may have to make or any financings for such expenditures. In estimating our cash available for distribution for the 12 months ending June 30, 2014, we have made certain assumptions reflected in the table and footnotes below, including that there will be no terminations of existing leases in our portfolio after June 30, 2013 (other than scheduled lease expirations) or lease renewals or new leases (other than month-to-month leases) after June 30, 2013 unless a new or renewal lease has been entered into prior to the date of this prospectus.
Our estimate of cash available for distribution does not reflect the effect of any changes in our working capital after June 30, 2013, other than the amount of cash estimated to be used for tenant improvement and leasing commission costs related to leases that may be entered into prior to the date of this prospectus. It also does not reflect the amount of cash estimated to be used for investing activities for acquisition and other activities, other than estimated capital expenditures, or the amount of cash estimated to be used for financing activities, other than scheduled mortgage loan principal repayments on mortgage indebtedness that will be outstanding upon consummation of this offering. Although we have included all material investing and financing activities that we have commitments to undertake as of June 30, 2013, we may undertake other investing and/or financing activities in the future. Any such investing and/or financing activities may have a material effect on our estimate of cash available for distribution. Because we have made the assumptions set forth above in estimating cash available for distribution, we do not intend this estimate to be a projection or forecast of our actual results of operations or liquidity. Our estimate of cash available for distribution should not be considered as an alternative to cash flow from operating activities (computed in accordance with GAAP) or as an indicator of our liquidity or ability to pay dividends or make distributions. In addition, the methodology upon which we made the adjustments described below is not necessarily intended to be a basis for calculating cash available for distribution.
Notwithstanding the estimate set forth below, our future distributions will be at the sole discretion of our board of directors. When determining the amount of future distributions, we expect that our board of directors will consider, among other factors, (1) the amount of cash generated from our operating activities, (2) our expectations of future cash flows, (3) our determination of near-term cash needs for debt repayments, existing or future share repurchases, and selective acquisitions of new properties, (4) the timing of significant redevelopment and re-leasing activities and the establishment of additional cash reserves for anticipated tenant improvements and general property capital improvements, (5) our ability to continue to access additional sources of capital, (6) the amount required to be distributed to maintain our status as a REIT and to reduce any income and excise taxes that we otherwise would be required to pay, (7) any limitations on our distributions contained in our credit or other agreements, including, without limitation, in our Unsecured Credit Facility, and (8) the sufficiency of legally-available assets.
49
If our operations do not generate sufficient cash flow to allow us to satisfy the REIT distribution requirements, we may be required to fund distributions from working capital, borrow funds, sell assets or reduce such distributions. Our board of directors reviews the alternative funding sources available to us from time to time. Our actual results of operations will be affected by a number of factors, including the revenues we receive from our properties, our operating expenses, interest expense, the ability of our tenants to meet their obligations and unanticipated expenditures. For more information regarding risk factors that could materially adversely affect our actual results of operations, please see “Risk Factors.”
Because Brixmor Property Group Inc. is a holding company and has no material assets other than its ownership of the BPG Subsidiary Shares and no material operations other than those conducted by BPG Subsidiary, we will fund any distributions from legally-available assets authorized by our board of directors in three steps:
| • | first, our Operating Partnership will make distributions to those of its partners which are holders of OP Units, including BPG Subsidiary. If our Operating Partnership makes such distributions, then in addition to BPG Subsidiary and its wholly-owned subsidiary, the other partners of our Operating Partnership will also be entitled to receive equivalent distributions pro rata based on their partnership interests in our Operating Partnership; |
| • | second, BPG Subsidiary will distribute to Brixmor Property Group Inc. its share of such distributions. If BPG Subsidiary makes such distributions, then in addition to Brixmor Property Group Inc., the other stockholders of BPG Subsidiary will also be entitled to receive equivalent distributions pro rata based on their interests in BPG Subsidiary; and |
| • | third, Brixmor Property Group Inc. will distribute the amount authorized by its board of directors and declared by Brixmor Property Group Inc. to its common stockholders on a pro rata basis. |
We did not pay any dividends to the holders of our common stock or Outstanding BPG Subsidiary Shares during the period from June 28, 2011 to December 31, 2011. During 2012 and to date in 2013 we have paid an aggregate of $25.0 million and $37.5 million, respectively, of dividends to the holders of our common stock or Outstanding BPG Subsidiary Shares.
50
The following table describes Brixmor Property Group Inc.’s pro forma net income/(loss) from continuing operations for the 12 months ended December 31, 2012 and June 30, 2013, and the adjustments it has made thereto in order to estimate its initial cash available for distribution for the 12 months ending June 30, 2014 (amounts in thousands except share and per share data, square footage data and percentages). Pro forma net income/(loss) from continuing operations reflects adjustments for certain transactions, as described in “Unaudited Pro Forma Financial Information.” Other than such adjustments, these calculations do not assume any changes to Brixmor Property Group Inc.’s operations or any acquisitions or dispositions or other developments or occurrences which could affect operating results and cash flows, or changes in outstanding shares of our common stock. We cannot assure you that actual results will be the same as or comparable to the calculations below.
Pro forma net (income)/loss from continuing operations for the 12 months ended December 31, 2012 | $ | (61,433 | ) | |
Less: Pro forma net (income)/loss from continuing operations for the six months ended June 30, 2012 | 44,367 | |||
Add: Pro forma net (income)/loss from continuing operations for the six months ended June 30, 2013 | 2,361 | |||
|
| |||
Pro forma net (income)/loss from continuing operations for the 12 months ended June 30, 2013 | $ | (14,705 | ) | |
Add: Pro forma real estate depreciation and amortization | 495,926 | |||
Add: Pro forma impairment charges from continuing operations and unconsolidated joint ventures | 1,845 | |||
Less: Pro forma gain on sale of real estate | (1,012 | ) | ||
Add: Net increases in contractual rent income (1) | 48,413 | |||
Less: Net decreases in contractual rent income (2) | (41,946 | ) | ||
Less: Net effects of straight-line rent adjustments to tenant leases (3) | (17,356 | ) | ||
Less: Net effects of above- and below-market rent adjustments (4) | (54,982 | ) | ||
Add: Non-cash compensation expense (5) | 4,815 | |||
Less: Net effects of non-cash amortization of debt premium, debt discount and debt issuance costs | (11,459 | ) | ||
|
| |||
Estimated cash flow from operating activities for the 12 months ending June 30, 2014 | $ | 409,539 | ||
Estimated cash flows from investing activities | ||||
Less: Contractual obligations for tenant improvements costs and leasing commissions (6) | (45,914 | ) | ||
Less: Estimated annual provision for recurring property capital expenditures (7) | (17,329 | ) | ||
|
| |||
| Total estimated cash flows used in investing activities | (63,243 | ) | ||
| Estimated cash flow used in financing activities—scheduled mortgage loan principal repayments (8) | (34,301 | ) | ||
|
| |||
Estimated cash available for distribution for the 12 months ending June 30, 2014 | $ | 311,995 | ||
Less: Non-controlling interests’ (other) share of estimated cash available for distribution | (1,326 | ) | ||
|
| |||
Estimated cash available to our Operating Partnership for distribution for the 12 months ended June 30, 2014 | $ | 310,669 | ||
Share of estimated cash available to our Operating Partnership for distribution attributable to holders of Outstanding OP units | 5.38 | % | ||
Share of estimated cash available to our Operating Partnership for distribution attributable to holders of Outstanding BPG Subsidiary Shares | 19.89 | % | ||
Share of estimated cash available to our Operating Partnership for distribution attributable to Brixmor Property Group Inc. | 74.73 | % | ||
Total estimated initial annual distribution to our stockholders and to holders of Outstanding BPG Subsidiary Shares and Outstanding OP Units | $ | 231,700 | ||
Total estimated initial annual distribution to holders of Outstanding OP Units | $ | 12,471 | ||
Total estimated initial annual distribution to holders of Outstanding BPG Subsidiary Shares | $ | 46,079 | ||
Total estimated initial annual distribution to our stockholders | $ | 173,150 | ||
Estimated initial annual distributions per share of our common stock (9) | $ | 0.60 | ||
Payout ratio based on the company’s share of estimated cash available for distribution (10) | 74.6 | % | ||
51
| (1) | Represents the net increases in contractual rental income from (i) existing leases (ii) new leases that were not in effect for the entire 12 month period ended June 30, 2013 (iii) new leases that were signed prior to the date of this prospectus but that will go into effect during the 12 months ending June 30, 2014 and (iv) projected lease renewals based on the retention rate for our IPO Portfolio of 83% for the twelve months ended June 30, 2013. |
| (2) | Represents the net decrease in contractual rent from (i) lease expirations including leases that are not projected to be renewed and (ii) leases that expired during the twelve month period ended June 30, 2013. |
| (3) | Represents the conversion of estimated rental revenues for the 12 months ending June 30, 2014 from a straight-line accrual basis to a cash basis of revenue recognition. |
| (4) | Represents the elimination of non-cash adjustments for above-market and below-market leases for the 12 months ended June 30, 2013. |
| (5) | Represents the stock based compensation expense for long term awards granted in 2011 and 2013. |
| (6) | For purposes of calculating the distribution in the above table, we have assumed we will incur approximately $45.9 million of tenant improvements and leasing commissions costs for new and renewal leases related solely to tenant improvements and leasing commissions incurred or expected to be incurred in the 12 months ending June 30, 2014 that we are contractually obligated to provide pursuant to the terms of the leases. All tenant improvements and leasing costs will be funded entirely from cash flow from operations. Capital expenditures related to redevelopment projects of $69.4 million are expected to be funded under our Unsecured Credit Facility between July 1, 2013 and June 30, 2014. Our redevelopment projects are tenant-driven and are focused on renovating, re-tenanting and repositioning for existing and new tenants or properties. We may occasionally seek to acquire non-owned anchor spaces and land parcels at, or adjacent to, our shopping centers to facilitate redevelopment projects. |
| (7) | For purposes of calculating the distribution in the above table, we have assumed we will incur approximately $17.3 million of recurring capital expenditures, calculated based on a historical four year average of $0.20 PSF. Recurring capital expenditures are costs to maintain properties and their common areas including new roofs, paving of parking lots and other general upkeep items. |
| (8) | Represents scheduled payments of mortgage loan principal due during the 12 months ending June 30, 2014. Does not include $1,092.0 million of debt maturities during the 12 months ending June 30, 2014 based on the assumptions that we will be able to fund these amounts under our Unsecured Credit Facility. The $1,092.0 million of debt maturities includes unsecured notes of $104.6 million that have stated maturity dates of August 2026 to February 2028 and that have a one-time repurchase right that requires us to offer to repurchase the notes if tendered by holders (but does not require the holders to tender) for an amount equal to the principal amount plus accrued and unpaid interest on January 15, 2014. As of September 23, 2013, we have repaid $699.9 million of the outstanding debt maturities. The remaining $392.1 million will be repaid at maturity with borrowings under our Unsecured Credit Facility. |
| (9) | Based on a total of 288,583,716 shares of our common stock, 76,798,997 Outstanding BPG Subsidiary Shares and 20,784,571 Outstanding OP Units to be outstanding after this offering. |
| (10) | Calculated as estimated initial annual distribution per share divided by the Brixmor Property Group Inc.’s share of estimated cash available for distribution per share for the 12 months ending June 30, 2014. |
52
The following table sets forth our cash and cash equivalents and capitalization as of June 30, 2013:
| • | on an actual basis; and |
| • | on a pro forma basis giving effect to the transactions described in “Unaudited Pro Forma Financial Information,” including this offering (at an assumed initial public offering price of $15.00 per share, which is the midpoint of the price range set forth on the cover of this prospectus) and the intended application of the net proceeds therefrom as described in “Use of Proceeds.” |
You should read this table together with the other information contained in this prospectus, including “Our Organizational Structure,” “Use of Proceeds,” “Unaudited Pro Forma Financial Information,” “Management’s Discussion and Analysis of Financial Condition and Results of Operations” and the historical financial statements and related notes that appear elsewhere in this prospectus.
| (amounts in thousands, except shares and per share data) | June 30, 2013 | |||||||
| Actual | Pro forma | |||||||
Cash and cash equivalents | $ | 142,006 | $ | 136,192 | ||||
Restricted cash | 104,021 | 86,044 | ||||||
|
|
|
| |||||
Total cash | $ | 246,027 | $ | 222,236 | ||||
|
|
|
| |||||
Debt: | ||||||||
Mortgage and secured loans (1) | $ | 6,093,002 | $ | 4,161,575 | ||||
Unsecured Credit Facility (2) | — | 1,754,612 | ||||||
Brixmor LLC unsecured notes (3) | 387,367 | 387,367 | ||||||
|
|
|
| |||||
Total debt | 6,480,369 | 6,303,554 | ||||||
|
|
|
| |||||
Stockholders’ equity: | ||||||||
Common stock, par value $0.01 per share; 200,000 shares authorized, actual; 75,649 shares issued and outstanding, actual; 3,000,000,000 shares authorized, as adjusted; 288,937,358 shares issued and outstanding, as adjusted; | 1 | 2,886 | ||||||
Preferred stock, par value $0.01 per share; 1,000 shares authorized, actual; 300,000,000 shares authorized, as adjusted; 1,000 shares issued and outstanding, actual; no shares issued and outstanding, as adjusted; | — | |||||||
Additional paid in capital | 1,749,305 | 2,536,011 | ||||||
Accumulated other comprehensive loss | (49 | ) | (49 | ) | ||||
Distributions in excess of accumulated loss | (108,232 | ) | (314,167 | ) | ||||
|
|
|
| |||||
Total stockholders’ equity (4) | 1,641,025 | 2,224,681 | ||||||
Non-controlling interests | 528,987 | 753,665 | ||||||
|
|
|
| |||||
Total equity | 2,170,012 | 2,978,346 | ||||||
|
|
|
| |||||
Total capitalization (4) | $ | 8,650,381 | $ | 9,281,900 | ||||
|
|
|
| |||||
| (1) | Actual amount includes unamortized premium of $101.2 million. |
| (2) | On July 16, 2013, we entered into the Unsecured Credit Facility, which consists of a $1,250.0 million revolving credit facility, which will mature on July 31, 2017, with a one-year extension option and a $1,500.0 million term loan facility, which will mature on July 31, 2018. |
| (3) | Actual amount includes unamortized discount of $17.2 million. |
| (4) | To the extent we change the number of shares of common stock sold by us in this offering from the shares we expect to sell or we change the initial public offering price from the $15.00 per share assumed initial |
53
| public offering price, representing the midpoint of the price range set forth on the cover page of this prospectus, or any combination of these events occurs, the net proceeds to us from this offering and each of total stockholders’ equity and total capitalization may increase or decrease. A $1.00 increase (decrease) in the assumed initial public offering price per share of the common stock, assuming no change in the number of shares of common stock to be sold, would increase (decrease) the net proceeds that we receive in this offering and each of total stockholders’ equity and total capitalization by approximately $47.5 million. An increase (decrease) of 1,000,000 shares in the expected number of shares to be sold in the offering, assuming no change in the assumed initial offering price per share, would increase (decrease) our net proceeds from this offering and our total stockholders’ equity and total capitalization by approximately $14.25 million. If the underwriters’ option to purchase additional shares is exercised in full, the pro forma amount of each of cash, total cash, additional paid-in capital, total stockholders’ equity, total equity and total capitalization would increase by approximately $106.9 million, after deducting underwriting discounts and estimated operating expenses, and we would have 296,083,716 shares of our common stock issued and outstanding, as adjusted. |
54
If you invest in our shares, your interest will be diluted to the extent of the difference between the initial public offering price per share and the pro forma net tangible book value per share immediately after the completion of this offering.
Our pro forma net tangible book value as of June 30, 2013 was approximately $1.989 billion or $5.92 per share. Pro forma net tangible book value represents the amount of total tangible assets less total liabilities, after giving effect to the IPO Property Transfers, and pro forma net tangible book value per share represents pro forma net tangible book value divided by the number of shares outstanding, after giving effect to the IPO Property Transfers and the transactions described in “Unaudited Pro Forma Financial Information” and assuming that all of the Outstanding BPG Subsidiary Shares and the Outstanding OP Units are exchanged for newly-issued shares of our common stock on a one-for-one basis.
After giving effect to the IPO Property Transfers, including this offering (at an assumed initial public offering price of $15.00 per share) and the intended application of the net proceeds therefrom as described in “Use of Proceeds,” our pro forma net tangible book value as of June 30, 2013 would have been $2.689 billion, or $6.97 per share. This represents an immediate increase in the net tangible book value of $1.05 per share and an immediate dilution of $8.03 per share to new investors purchasing shares in this offering. The following table illustrates this dilution per share:
Assumed initial offering price per share | $ | 15.00 | ||||||
Pro forma net tangible book value per share as of June 30, 2013 | $ | 5.92 | ||||||
Increase in pro forma net tangible book value per share attributable to investors in this offering | 1.05 | |||||||
|
| |||||||
Pro forma net tangible book value per share after this offering | 6.97 | |||||||
|
| |||||||
Dilution in pro forma net tangible book value per share to investors in this offering | $ | 8.03 | ||||||
|
|
A $1.00 increase (decrease) in the assumed initial public offering price of $15.00 per share would increase (decrease) the amount of pro forma net tangible book value attributable to investors in this offering by $0.12 per share, and the dilution to investors in this offering by $0.88 per share, assuming that the number of shares offered by us, as set forth on the cover page of this prospectus, remains the same and no exercise of the underwriters’ option to purchase additional shares.
The following table summarizes, on the same pro forma basis as of June 30, 2013, the total number of shares purchased from us, the total cash consideration paid to us and the average price per share paid by our pre-IPO owners and by new investors purchasing shares in this offering, assuming that all of the Outstanding BPG Subsidiary Shares and the Outstanding OP Units are exchanged for newly-issued shares of our common stock on a one-for-one basis.
| Shares Purchased | Total Consideration | Average Price Per Share | ||||||||||||||||||
| Number | Percentage | Amount | Percentage | |||||||||||||||||
| ($ in thousands) | ||||||||||||||||||||
Pre-IPO owners | 336,167,284 | 87.05 | % | $ | 1,989,412 | 72.62 | % | $ | 5.92 | |||||||||||
Investors in this offering | 50,000,000 | 12.95 | % | $ | 750,000 | 27.38 | % | $ | 15.00 | |||||||||||
|
|
|
|
|
|
|
|
|
| |||||||||||
Total | 386,167,284 | 100.00 | % | $ | 2,739,412 | 100.00 | % | $ | 7.09 | |||||||||||
A $1.00 increase (decrease) in the assumed initial public offering price of $15.00 per share would increase (decrease) the total consideration paid by the investors in this offering by $50,000,000, and would increase (decrease) the percent of total consideration paid by the investors by approximately 1.30%, assuming that the number of shares offered by us, as set forth on the cover page of this prospectus, remains the same and no exercise of the underwriters’ option to purchase additional shares.
55
If the underwriters’ option to purchase additional shares is exercised in full, the following will occur:
| • | the number of shares purchased by investors in this offering will increase to 57,500,000 shares, or approximately 14.61% of the total number of shares outstanding; |
| • | the immediate dilution experienced by investors in this offering will be $7.90 per share and the pro forma net tangible book value per share will be $7.10 per share; and |
| • | a $1.00 increase (decrease) in the initial offering price of $15.00 per share would increase (decrease) the dilution experienced by investors in this offering by $0.14 per share. |
56
UNAUDITED PRO FORMA FINANCIAL INFORMATION
The following unaudited pro forma condensed consolidated financial statements reflect the pro forma financial condition and results of operations of Brixmor Property Group Inc. after giving effect to (i) the IPO Property Transfers (as described below), (ii) the acquisition of the interests we did not already hold in Arapahoe Crossings, L.P. (as described below), (iii) borrowings under the Unsecured Credit Facility, including use thereof, (as described below) and (iv) the estimated net proceeds, including use thereof, expected to be received from this offering. The pro forma adjustments associated with these transactions assume that each transaction was completed as of June 30, 2013 for purposes of the unaudited pro forma condensed consolidated balance sheet and as of January 1, 2012 for purposes of the unaudited pro forma condensed consolidated statements of operations.
Our pro forma condensed consolidated financial statements are presented for informational purposes only and are based on information and assumptions that we consider appropriate and reasonable. These pro forma condensed consolidated financial statements do not purport to (i) represent our financial position had this offering, and the other transactions described in these pro forma condensed consolidated financial statements, occurred on June 30, 2013, (ii) represent the results of our operations had this offering, and the other transactions described in these pro forma condensed consolidated financial statements, occurred on January 1, 2012 or (iii) project or forecast our financial position or results of operations as of any future date or for any future period, as applicable.
You should read the information below along with all other financial information and analysis presented in this prospectus, including the sections captioned “Risk Factors,” “Management’s Discussion and Analysis of Financial Condition and Results of Operations,” and our historical financial statements and related notes included elsewhere in this prospectus.
IPO Property Transfers
In connection with this offering, certain investment funds affiliated with our Sponsor will contribute their ownership interests in 43 properties (the “Acquired Properties”) to us, and we will distribute 45 properties that we have historically held in our portfolio (the “Non-Core Properties”) to our pre-IPO owners. We refer to our Sponsor, funds affiliated with Centerbridge and the members of our management who own shares of our common stock and shares of the common stock of our majority-owned subsidiary, BPG Subsidiary Inc., and who will receive units in Brixmor Operating Partnership LP as part of the IPO Property Transfers as our “pre-IPO owners.”
Our acquisition of the Acquired Properties will be accounted for as a business combination resulting in the consideration exchanged for the Acquired Properties being allocated to the acquired assets and assumed liabilities based on their fair values on the date of acquisition, including identifiable intangible assets and liabilities.
The distribution of our ownership interests in the Non-Core Properties to our pre-IPO owners is expected to be effected through the consummation of two separate transactions due to the existence of transfer restrictions governing certain of our unsecured notes that are in effect through January 15, 2014. The first transaction, which will occur at the time of this offering, will consist of our Operating Partnership issuing a special class of units to our pre-IPO owners thereby providing our pre-IPO owners with all economic rights and obligations associated with ownership of the Non-Core Properties. The second transaction, expected to be consummated following the expiration of the aforementioned transfer restrictions, will consist of our Operating Partnership redeeming the special class of units in exchange for the Non-Core Properties pursuant to certain redemption provisions providing us with the right to redeem such units at any time. The distribution of the Non-Core Properties will be accounted for at fair value with any resulting gain or loss recognized in earnings. Following this offering and the IPO Property Transfers, we will continue to manage the Non-Core Properties for which we will receive customary management, leasing and other fees from our Sponsor.
57
Acquisition of Arapahoe Crossings, L.P.
As of June 30, 2013, we owned a 30% ownership interest in Arapahoe Crossings, L.P. (“Arapahoe”), an unconsolidated real estate joint venture, which owns a single shopping center in the Denver, Colorado region having 466,363 sq. ft. of GLA. On May 15, 2013, we entered into an agreement with our joint venture partner to acquire the remaining 70% interest not owned by us in exchange for $20.0 million in cash, subject to a $41.9 million mortgage encumbering the asset. The transaction closed on July 31, 2013 and will be accounted for as a business combination with any resulting gain or loss associated with our previously held equity interest being recognized in earnings.
Unsecured Credit Facility
On July 16, 2013, we entered into a new $2,750.0 million Unsecured Credit Facility with a syndicate of lenders consisting of a $1,500.0 million term loan and a $1,250.0 million revolving credit facility. We expect to use the $1,500.0 million term loan and approximately $883.1 million of borrowings under the revolving credit facility to repay an equal amount of our existing indebtedness.
Offering Proceeds
We estimate that the gross proceeds to us from this offering will be approximately $750.0 million and that proceeds to us net of underwriting discounts and estimated offering expenses will be $702.5 million, or $809.4 million if the underwriters exercise their option to purchase additional shares in full (assuming shares are sold at $15.00 per share, which is the midpoint of the price range set forth on the cover page of this prospectus) after deducting underwriting discounts and other estimated expenses of this offering. Net proceeds of this offering will be used (i) to repay outstanding borrowings under the Unsecured Credit Facility, (ii) to repay indebtedness owed to our Sponsor that is attributable to certain of the Acquired Properties, (iii) to pay transaction costs associated with the IPO Property Transfers and (iv) to pay transfer fees associated with our outstanding mortgage loans.
58
Brixmor Property Group Inc. and Subsidiaries
Pro Forma Condensed Consolidated Balance Sheet
June 30, 2013
(Unaudited and in thousands)
| Acquisitions and Distributions | ||||||||||||||||||||||||||||||||||||||||||||
| Brixmor Property Group Inc. and Subsidiaries | Acquired Properties | Arapahoe Acquisition | Non-Core Properties Distribution | Other Pro Forma Adjustments & Eliminations | Pro Forma Before Offering | Proceeds from Offering | Use of Proceeds | Other Equity Adjustments | Pro Forma | |||||||||||||||||||||||||||||||||||
| (A) | (B) | (C) | (F) | (G) | (H) | |||||||||||||||||||||||||||||||||||||||
Assets | ||||||||||||||||||||||||||||||||||||||||||||
Real estate, net | $ | 8,855,876 | $ | 851,674 | $ | 70,706 | $ | (196,776 | ) | $ | — | $ | 9,581,480 | $ | — | $ | — | $ | — | $ | 9,581,480 | |||||||||||||||||||||||
Investments in and advances to unconsolidated real estate joint ventures | 16,446 | — | (7,397 | ) | (3,937 | ) | — | 5,112 | — | — | — | 5,112 | ||||||||||||||||||||||||||||||||
Cash and cash equivalents | 142,006 | 7,903 | (19,108 | ) | (473 | ) | 5,864 | (D | ) | 136,192 | 702,500 | (702,500 | ) | — | 136,192 | |||||||||||||||||||||||||||||
Restricted cash | 104,021 | 8,307 | 1,444 | (2,388 | ) | (25,340 | ) | (D | ) | 86,044 | — | — | — | 86,044 | ||||||||||||||||||||||||||||||
Marketable securities | 23,593 | — | — | — | — | 23,593 | — | — | — | 23,593 | ||||||||||||||||||||||||||||||||||
Receivables, net | 181,554 | 4,057 | 1,051 | (10,479 | ) | (385 | ) | (E | ) | 175,798 | — | — | — | 175,798 | ||||||||||||||||||||||||||||||
Deferred charges and prepaid expenses, net | 101,956 | 3,585 | 53 | (4,134 | ) | (4,060 | ) | (D | ) | 97,400 | — | 5,247 | — | 102,647 | ||||||||||||||||||||||||||||||
Other assets | 24,509 | 1,431 | 11 | (1,720 | ) | — | 24,231 | — | — | — | 24,231 | |||||||||||||||||||||||||||||||||
|
|
|
|
|
|
|
|
|
|
|
|
|
|
|
|
|
|
|
| |||||||||||||||||||||||||
Total assets | $ | 9,449,961 | $ | 876,957 | $ | 46,760 | $ | (219,907 | ) | $ | (23,921 | ) | $ | 10,129,850 | $ | 702,500 | $ | (697,253 | ) | $ | — | $ | 10,135,097 | |||||||||||||||||||||
|
|
|
|
|
|
|
|
|
|
|
|
|
|
|
|
|
|
|
| |||||||||||||||||||||||||
Liabilities | ||||||||||||||||||||||||||||||||||||||||||||
Debt obligations, net | $ | 6,480,369 | $ | 488,460 | $ | 41,924 | $ | (25,792 | ) | $ | 8,098 | (D) | $ | 6,993,059 | $ | — | $ | (689,505 | ) | $ | — | $ | 6,303,554 | |||||||||||||||||||||
Financing liabilities, net | 173,231 | — | — | — | — | 173,231 | — | — | — | 173,231 | ||||||||||||||||||||||||||||||||||
Accounts payable, accrued expenses and other liabilities | 604,882 | 76,728 | 3,662 | (9,207 | ) | (11,636 | ) | (D) | 664,044 | — | (5,545 | ) | — | 658,499 | ||||||||||||||||||||||||||||||
| (385 | ) | (E) | ||||||||||||||||||||||||||||||||||||||||||
|
|
|
|
|
|
|
|
|
|
|
|
|
|
|
|
|
|
|
| |||||||||||||||||||||||||
Total liabilities | $ | 7,258,482 | $ | 565,188 | $ | 45,586 | $ | (34,999 | ) | $ | (3,923 | ) | $ | 7,830,334 | $ | — | $ | (695,050 | ) | $ | — | $ | 7,135,284 | |||||||||||||||||||||
|
|
|
|
|
|
|
|
|
|
|
|
|
|
|
|
|
|
|
| |||||||||||||||||||||||||
Redeemable noncontrolling interests in partnership | 21,467 | — | — | — | — | 21,467 | — | — | — | 21,467 | ||||||||||||||||||||||||||||||||||
|
|
|
|
|
|
|
|
|
|
|
|
|
|
|
|
|
|
|
| |||||||||||||||||||||||||
Equity: | ||||||||||||||||||||||||||||||||||||||||||||
Preferred stock | $ | — | $ | — | $ | — | $ | — | $ | — | $ | — | $ | — | $ | — | $ | — | $ | — | ||||||||||||||||||||||||
Common stock | 1 | — | — | — | — | 1 | — | — | 2,885 | 2,886 | ||||||||||||||||||||||||||||||||||
Additional paid in capital | 1,749,305 | — | — | — | — | 1,749,305 | 705,500 | — | 84,206 | 2,536,011 | ||||||||||||||||||||||||||||||||||
Accumulated other comprehensive (loss) income | (49 | ) | — | — | — | — | (49 | ) | — | — | — | (49 | ) | |||||||||||||||||||||||||||||||
Distributions in excess of accumulated loss (income) | (108,232 | ) | — | 1,174 | (184,908 | ) | (19,998 | ) | (D | ) | (311,964 | ) | (2,203 | ) | — | (314,167 | ) | |||||||||||||||||||||||||||
|
|
|
|
|
|
|
|
|
|
|
|
|
|
|
|
|
|
|
| |||||||||||||||||||||||||
Total stockholders equity | 1,641,025 | — | 1,174 | (184,908 | ) | (19,998 | ) | 1,437,293 | 702,500 | (2,203 | ) | 87,091 | 2,224,681 | |||||||||||||||||||||||||||||||
Non controlling interests | 528,987 | 311,769 | — | — | — | 840,756 | — | — | (87,091 | ) | 753,665 | |||||||||||||||||||||||||||||||||
|
|
|
|
|
|
|
|
|
|
|
|
|
|
|
|
|
|
|
| |||||||||||||||||||||||||
Total equity | 2,170,012 | 311,769 | 1,174 | (184,908 | ) | (19,998 | ) | 2,278,049 | 702,500 | (2,203 | ) | — | 2,978,346 | |||||||||||||||||||||||||||||||
|
|
|
|
|
|
|
|
|
|
|
|
|
|
|
|
|
|
|
| |||||||||||||||||||||||||
Total liabilities and equity | $ | 9,449,961 | $ | 876,957 | $ | 46,760 | $ | (219,907 | ) | $ | (23,921 | ) | $ | 10,129,850 | $ | 702,500 | $ | (697,253 | ) | $ | — | $ | 10,135,097 | |||||||||||||||||||||
|
|
|
|
|
|
|
|
|
|
|
|
|
|
|
|
|
|
|
| |||||||||||||||||||||||||
59
Brixmor Property Group Inc. and Subsidiaries
Pro Forma Condensed Consolidated Statement of Operations
For the Six Months Ended June 30, 2013
(Unaudited and in thousands, except per share data)
| Brixmor Property Group Inc. and Subsidiaries | Acquired Properties | Arapahoe Acquisition | Non-Core Properties Distribution | Other Pro Forma Adjustments & Eliminations | Pro Forma | |||||||||||||||||||||||
| (AA) | (BB) | (CC) | ||||||||||||||||||||||||||
Revenue | ||||||||||||||||||||||||||||
Rental income | $ | 443,772 | $ | 30,887 | $ | 2,721 | $ | (12,916 | ) | $ | — | $ | 464,464 | |||||||||||||||
Expense reimbursements | 122,898 | 7,034 | 1,020 | (3,983 | ) | — | 126,969 | |||||||||||||||||||||
Other revenues | 6,001 | 109 | — | (241 | ) | 118 | (DD | ) | 5,987 | |||||||||||||||||||
|
|
|
|
|
|
|
|
|
|
|
| |||||||||||||||||
Total revenues | 572,671 | 38,030 | 3,741 | (17,140 | ) | 118 | 597,420 | |||||||||||||||||||||
|
|
|
|
|
|
|
|
|
|
|
| |||||||||||||||||
Operating expenses | ||||||||||||||||||||||||||||
Operating costs | 60,971 | 5,104 | 591 | (3,458 | ) | (1,149 | ) | (DD | ) | 62,059 | ||||||||||||||||||
Real estate taxes | 86,541 | 3,871 | 864 | (3,843 | ) | — | 87,433 | |||||||||||||||||||||
Depreciation and amortization | 226,505 | 18,148 | 1,291 | (6,106 | ) | — | 239,838 | |||||||||||||||||||||
Impairment of real estate assets | 36,060 | — | — | (34,529 | ) | — | 1,531 | |||||||||||||||||||||
Provision for doubtful accounts | 5,365 | 269 | 6 | (457 | ) | — | 5,183 | |||||||||||||||||||||
Acquisition related costs | — | — | — | — | — | — | ||||||||||||||||||||||
General and administrative | 44,343 | 452 | 97 | (10 | ) | — | 44,882 | |||||||||||||||||||||
|
|
|
|
|
|
|
|
|
|
|
| |||||||||||||||||
Total operating expenses | 459,785 | 27,844 | 2,849 | (48,403 | ) | (1,149 | ) | 440,926 | ||||||||||||||||||||
|
|
|
|
|
|
|
|
|
|
|
| |||||||||||||||||
Other income (expense) | ||||||||||||||||||||||||||||
Dividends and interest | 420 | 4 | 2 | (211 | ) | — | 215 | |||||||||||||||||||||
Interest expense | (190,262 | ) | (9,147 | ) | (1,054 | ) | 1,265 | 45,709 | (EE | ) | (153,489 | ) | ||||||||||||||||
Gain (loss) on sale of real estate | 722 | (161 | ) | — | — | — | 561 | |||||||||||||||||||||
Other | (2,123 | ) | — | — | 4 | — | (2,119 | ) | ||||||||||||||||||||
|
|
|
|
|
|
|
|
|
|
|
| |||||||||||||||||
Total other income (expense), net | (191,243 | ) | (9,304 | ) | (1,052 | ) | 1,058 | 45,709 | (154,832 | ) | ||||||||||||||||||
|
|
|
|
|
|
|
|
|
|
|
| |||||||||||||||||
(Loss) income before equity in earnings of unconsolidated subsidiaries | (78,357 | ) | 882 | (160 | ) | 32,321 | 46,976 | 1,662 | ||||||||||||||||||||
Equity in (loss) income of unconsolidated real estate joint ventures | 754 | — | — | (55 | ) | — | 699 | |||||||||||||||||||||
Impairment of investment in unconsolidated real estate joint ventures | — | — | — | — | — | — | ||||||||||||||||||||||
|
|
|
|
|
|
|
|
|
|
|
| |||||||||||||||||
(Loss) income from continuing operations | $ | (77,603 | ) | $ | 882 | $ | (160 | ) | $ | 32,266 | $ | 46,976 | $ | 2,361 | ||||||||||||||
|
|
|
|
|
|
|
|
|
|
|
| |||||||||||||||||
Income from continuing operations attributable tonon-controlling interests | $ | 1,268 | ||||||||||||||||||||||||||
|
| |||||||||||||||||||||||||||
Income from continuing operations attributable to common stockholders | $ | 1,093 | ||||||||||||||||||||||||||
|
| |||||||||||||||||||||||||||
Pro forma income from continuing operations per share basic | $ | 0.00 | ||||||||||||||||||||||||||
|
| |||||||||||||||||||||||||||
Pro forma income from continuing operations per share diluted | $ | 0.00 | ||||||||||||||||||||||||||
|
| |||||||||||||||||||||||||||
Pro forma weighted average shares basic | 288,584 | |||||||||||||||||||||||||||
|
| |||||||||||||||||||||||||||
Pro forma weighted average shares diluted | 386,167 | |||||||||||||||||||||||||||
|
| |||||||||||||||||||||||||||
60
Brixmor Property Group Inc. and Subsidiaries
Pro Forma Condensed Consolidated Statement of Operations
For the Year Ended December 31, 2012
(Unaudited and in thousands, except per share data)
| Brixmor Property Group Inc. and Subsidiaries | Acquired Properties | Arapahoe Acquisition | Non-Core Properties Distribution | Other Pro Forma Adjustments & Eliminations | Pro Forma | |||||||||||||||||||||||
| (AA) | (BB) | (CC) | ||||||||||||||||||||||||||
Revenue | ||||||||||||||||||||||||||||
Rental income | $ | 879,766 | $ | 61,309 | $ | 4,967 | $ | (28,110 | ) | $ | — | $ | 917,932 | |||||||||||||||
Expense reimbursements | 234,590 | 14,868 | 1,864 | (8,726 | ) | — | 242,596 | |||||||||||||||||||||
Other revenues | 11,441 | 566 | 32 | (213 | ) | 996 | (DD | ) | 12,822 | |||||||||||||||||||
|
|
|
|
|
|
|
|
|
|
|
| |||||||||||||||||
Total revenues | 1,125,797 | 76,743 | 6,863 | (37,049 | ) | 996 | 1,173,350 | |||||||||||||||||||||
|
|
|
|
|
|
|
|
|
|
|
| |||||||||||||||||
Operating expenses | ||||||||||||||||||||||||||||
Operating costs | 124,673 | 11,477 | 1,299 | (6,484 | ) | (1,990 | ) | (DD | ) | 128,975 | ||||||||||||||||||
Real estate taxes | 162,900 | 7,712 | 1,803 | (7,681 | ) | — | 164,734 | |||||||||||||||||||||
Depreciation and amortization | 504,583 | 36,298 | 2,581 | (15,870 | ) | — | 527,592 | |||||||||||||||||||||
Provision for doubtful accounts | 11,861 | 519 | (16 | ) | (311 | ) | — | 12,053 | ||||||||||||||||||||
Acquisition related costs | 541 | — | — | — | — | 541 | ||||||||||||||||||||||
General and administrative | 88,870 | 543 | 310 | (37 | ) | — | 89,686 | |||||||||||||||||||||
|
|
|
|
|
|
|
|
|
|
|
| |||||||||||||||||
Total operating expenses | 893,428 | 56,549 | 5,977 | (30,383 | ) | (1,990 | ) | 923,581 | ||||||||||||||||||||
|
|
|
|
|
|
|
|
|
|
|
| |||||||||||||||||
Other income (expenses) | ||||||||||||||||||||||||||||
Dividends and interest | 1,138 | 6 | 8 | (428 | ) | — | 724 | |||||||||||||||||||||
Interest expense | (386,380 | ) | (16,898 | ) | (2,311 | ) | 2,727 | 90,570 | (EE | ) | (312,292 | ) | ||||||||||||||||
Gain (loss) on sale of real estate | 501 | — | — | (4 | ) | — | 497 | |||||||||||||||||||||
Other | (507 | ) | — | — | — | — | (507 | ) | ||||||||||||||||||||
|
|
|
|
|
|
|
|
|
|
|
| |||||||||||||||||
Total other income (expense), net | (385,248 | ) | (16,892 | ) | (2,303 | ) | 2,295 | 90,570 | (311,578 | ) | ||||||||||||||||||
|
|
|
|
|
|
|
|
|
|
|
| |||||||||||||||||
(Loss) income before equity in earnings of unconsolidated subsidiaries | (152,879 | ) | 3,302 | (1,417 | ) | (4,371 | ) | 93,556 | (61,809 | ) | ||||||||||||||||||
Equity (loss) income of unconsolidated real estate joint ventures | 687 | — | — | 3 | — | 690 | ||||||||||||||||||||||
Impairment of investment in unconsolidated real estate joint ventures | (314 | ) | — | — | — | — | (314 | ) | ||||||||||||||||||||
|
|
|
|
|
|
|
|
|
|
|
| |||||||||||||||||
(Loss) income from continuing operations | $ | (152,506 | ) | $ | 3,302 | $ | (1,417 | ) | $ | (4,368 | ) | $ | 93,556 | $ | (61,433 | ) | ||||||||||||
|
|
|
|
|
|
|
|
|
|
|
| |||||||||||||||||
Loss from continuing operations attributable to non-controlling interests | $ | 14,217 | ||||||||||||||||||||||||||
|
| |||||||||||||||||||||||||||
Loss from continuing operations attributable to common stockholders | $ | (47,216 | ) | |||||||||||||||||||||||||
|
| |||||||||||||||||||||||||||
Pro forma loss from continuing operations per share basic | $ | (0.16 | ) | |||||||||||||||||||||||||
|
| |||||||||||||||||||||||||||
Pro forma loss from continuing operations per share diluted | $ | (0.16 | ) | |||||||||||||||||||||||||
|
| |||||||||||||||||||||||||||
Pro forma weighted average shares outstanding basic | 288,584 | |||||||||||||||||||||||||||
|
| |||||||||||||||||||||||||||
Pro forma weighted average shares outstanding diluted | 386,167 | |||||||||||||||||||||||||||
|
| |||||||||||||||||||||||||||
61
1. Adjustments to the Pro Forma Condensed Consolidated Balance Sheet
(A) Reflects the acquisition by us of 100% of the ownership interests in 43 properties from our pre-IPO owners in exchange for 20.3 million OP Units with a value of $304.7 million based on an assumed initial public offering price of $15.00 per share (which is the midpoint of the price range set forth on the cover page of this prospectus) and the assumption of $481.2 million of related indebtedness.
The allocation of consideration exchanged to the assets acquired and liabilities assumed is based on our preliminary estimates and is subject to change based on the final determination of the fair value attributable to the acquired assets and assumed liabilities at the time the acquisition is consummated. The estimated fair value of Real estate, net includes the following components (in thousands):
Land | $ | 208,246 | ||
Building and improvements | 507,923 | |||
Above-market leases | 26,789 | |||
In-place lease value | 108,716 | |||
|
| |||
Total | $ | 851,674 | ||
|
|
Accounts payable, accrued expenses and other liabilities includes $54.9 million to reflect the fair value attributed to below market leases.
These estimates were based on our preliminary analysis and comparable market transactions, which included a preliminary evaluation of the fair values ascribed to component assets relative to overall transaction value in comparable market transactions. Upon completion of the acquisition, the methodologies and significant inputs and assumptions used in deriving final estimates of fair value will vary based on the nature of the tangible or intangible asset. Our methodology for allocating the cost of the assets acquired and liabilities assumed is based upon estimating fair values. Fair values are determined based upon a consideration of all three generally accepted valuation approaches: (i) the income approach, (ii) the market approach and (iii) the cost approach.
We primarily relied upon the income approach to determine overall fair value of the real property assets acquired. The market approach was performed to corroborate the fair value derived under the income approach. The market approach was also relied upon to estimate the fair value of the land. Finally, we utilized the cost and the income approaches to estimate the fair value of building improvements for each of the Acquired Properties. The income approach methodology involved the lease-up of a vacant or “dark” building to the current occupancy as of the acquisition date of the acquired property while the cost approach detailed the replacement cost of the building with the application of appropriate physical, functional and external obsolescence/depreciation to arrive at a conclusion. We placed primary emphasis upon the income approach methodology with the cost approach as a secondary approach; however, both approaches generally reconciled to a similar value conclusion within a reasonable range. Estimates of fair value associated with identifiable intangible assets will likely be derived using generally accepted methodologies under the income approach. Significant inputs and assumptions associated with these approaches include estimates of future operating cash flows, as contemplated in deriving the acquisition consideration and discount and capitalization rates based on an evaluation of observable market data.
In connection with the acquisition, we expect to incur transaction costs of $2.0 million, which relate to, among other things, transfer taxes, title costs and advisor fees. These transactions costs will, for accounting purposes, be reflected as expenses except for those costs directly attributable to the issuance of the OP Units which will be accounted for as a reduction in the carrying value of the Non-controlling interest. Accordingly, for purposes of the pro forma condensed consolidated balance sheet, $2.0 million of transaction costs have been reflected as an addition to Distributions in excess of accumulated loss.
Debt obligations, net reflects the assumption of $485.5 million of debt with an estimated fair value of $481.2 million. No adjustments were made to the historical carrying value of Cash and cash equivalents;
62
Restricted cash; Receivables, net; and Other assets; as the estimated fair values of such items were preliminarily determined to approximate their historical carrying values. These preliminary determinations were based on their short term nature and/or the stated terms approximating current market terms.
The pro forma adjustments shown below for the Acquired Properties are based on our preliminary estimates and are subject to change based on the final determination of the fair value of assets and liabilities acquired.
| As of June 30, 2013 | ||||||||||||
| Acquired Properties Historical | Pro Forma Adjustments | Acquired Properties Pro Forma | ||||||||||
(in thousands; unaudited) | ||||||||||||
Assets | ||||||||||||
Real estate, net | $ | 599,424 | $ | 252,250 | (1) | $ | 851,674 | |||||
Investments in advances to unconsolidated real estate joint ventures | — | — | — | |||||||||
Cash and cash equivalents | 9,498 | (1,595 | ) | 7,903 | ||||||||
Restricted cash | 8,307 | — | 8,307 | |||||||||
Marketable securities | — | — | — | |||||||||
Receivables, net | 5,057 | (1,000 | )(2) | 4,057 | ||||||||
Deferred charges and prepaid expenses, net | 7,756 | (4,171 | )(3) | 3,585 | ||||||||
Other assets | 1,431 | — | 1,431 | |||||||||
|
|
|
|
|
| |||||||
Total assets | $ | 631,473 | $ | 245,484 | $ | 876,957 | ||||||
|
|
|
|
|
| |||||||
Liabilities | ||||||||||||
Debt obligations, net | $ | 448,381 | $ | 40,079 | (4) | $ | 488,460 | |||||
Financing liabilities, net | — | — | — | |||||||||
Accounts payable, accrued expenses and other liabilities | 49,713 | 27,015 | (5) | 76,728 | ||||||||
|
|
|
|
|
| |||||||
Total liabilities | $ | 498,094 | $ | 67,094 | $ | 565,188 | ||||||
|
|
|
|
|
| |||||||
Redeemable noncontrolling interests in partnership | — | — | — | |||||||||
Equity | ||||||||||||
Preferred Stock | — | — | — | |||||||||
Common Stock | — | — | — | |||||||||
Additional paid in capital | 76,845 | (76,845 | ) | — | ||||||||
Accumulated other comprehensive (loss) income | — | — | — | |||||||||
Distributions in excess of accumulated loss (income) | 56,534 | (56,534 | ) | — | ||||||||
|
|
|
|
|
| |||||||
Total stockholders equity | 133,379 | (133,379 | ) | — | ||||||||
Non controlling interests | — | 311,769 | 311,769 | |||||||||
|
|
|
|
|
| |||||||
Total equity | 133,379 | 178,390 | 311,769 | |||||||||
|
|
|
|
|
| |||||||
Total liabilities and equity | $ | 631,473 | $ | 245,484 | $ | 876,957 | ||||||
|
|
|
|
|
| |||||||
| (1) | Includes allocation of purchase price to tangible assets and intangible assets, including acquired in place leases and above-market leases. |
| (2) | Adjusts for removal of historical straight line rent receivable. |
| (3) | Adjusts for removal of historical deferred leasing commissions and debt issuance costs and the addition for new loan consent fees. |
| (4) | Adjusts assumed mortgages payable to their estimated fair value and reflects repayment of $19.1 million of debt. |
| (5) | Includes allocation of purchase price to intangible liabilities, including below market leases and removes management fees payable to Brixmor Property Group Inc. |
63
(B) Reflects the acquisition by us on July 31, 2013 of the 70% ownership interest in Arapahoe in exchange for $20.0 million cash and the assumption of $41.9 million of related indebtedness which was repaid following the close of the acquisition using borrowings under the Unsecured Credit Facility as discussed in Note (D) below. For purposes of the pro forma condensed consolidated balance sheet, the $20.0 million of cash consideration, which was paid by us, is reflected as a reduction of Arapahoe’s cash and cash equivalents balance and the $1.2 million gain resulting from remeasurement of our existing 30% equity interest is reflected as a reduction of Distributions in excess of accumulated loss (income).
The allocation of consideration exchanged to the assets acquired and liabilities assumed is based on our preliminary estimates of fair value and are subject to change based on the final determination of the fair value attributable to the acquired assets and assumed liabilities at the time the acquisition is consummated. The estimated fair value of real estate, net includes the following components (in thousands):
Land | $ | 13,677 | ||
Building and improvements | 50,274 | |||
Above-market leases | 1,457 | |||
In-place lease value | 5,298 | |||
|
| |||
Total | $ | 70,706 | ||
|
|
Accounts payable, accrued expenses and other liabilities includes $1.0 million to reflect the fair value attributed to below market leases.
See clause (A) for additional information in respect of the methodologies used to derive these preliminary estimates and those methodologies expected to be utilized in connection with deriving final estimates of fair value, including significant inputs and assumptions.
No adjustments were made to the historical carrying value of Cash and cash equivalents; Restricted cash; Receivables, net; Other assets; and Debt obligations, net as the estimated fair values of such items were preliminarily determined to approximate their historical carrying values. These preliminary determinations were based on their short term nature and/or the stated terms approximating current market terms.
(C) Reflects the distribution by us, at historical basis, of the ownership interests in the Non-Core Properties subsequent to our redemption of the special class of units issued to our Sponsor which we have determined is probable. The redemption and distribution to our Sponsor will be recorded at fair value of the net assets distributed on the date of redemption and distribution. Any resulting gain or loss on the net assets distributed will be allocated to the special class of units as net income (loss) attributable to non-controlling interests.
(D) Reflects the closing of our $2,750.0 million Unsecured Credit Facility on July 16, 2013, which consists of a $1,500.0 million term loan and a $1,250.0 million revolving credit facility. Prior to the closing of this offering, we expect to use the $1,500.0 million term loan and $883.1 million of borrowings under the revolving credit facility to repay an equivalent amount of our existing indebtedness, including $11.6 million of accrued interest, which is reflected as a reduction of Accounts payable, accrued expenses and other liabilities; and $1.3 million of fees associated with the repaid debt, which is reflected as an addition to Distribution in excess of accumulated loss (income).
We incurred $19.5 million of issuance costs related to the Unsecured Credit Facility consisting of $19.2 million of fees paid to the lenders in the Unsecured Credit Facility and $0.3 million of fees paid to third parties for legal and advisory services. These costs have been capitalized within the pro forma condensed consolidated balance sheet and offset by $23.5 million of accelerated amortization attributable to capitalized costs related to the repaid indebtedness resulting in a $4.1 million net decrease to deferred charges and prepaid expenses, net. Capitalized issuance costs associated with the Unsecured Credit Facility will be amortized as additional interest expense over the Unsecured Credit Facility’s term. The June 30, 2013 pro forma deferred charges and prepaid expenses, net balance includes $67.5 million of deferred leasing commissions and debt issuance costs, net.
64
In connection with repaying this indebtedness, we accelerated the amortization of the related premium resulting in a $4.9 million reduction to Distributions in excess of accumulated loss (income). In addition, we expect $25.3 million of restricted cash to be released to us by the lenders which is reflected as a decrease to Restricted cash and a corresponding increase to Cash and cash equivalents.
The $19.9 million addition to Distributions in excess of accumulated loss (income) is comprised of the $23.5 million in accelerated issuance cost amortization and the $1.3 million of fees associated with the repaid debt, net of the $4.9 million in accelerated premium amortization attributable to the repaid indebtedness.
(E) Reflects the elimination of accounts receivable of $0.4 million comprised of $0.2 million of management and other fees due from the Acquired Properties and $0.2 million of management and other fees due from Arapahoe.
(F) Reflects gross proceeds in this offering of $750.0 million, which will be reduced by $47.5 million, net of amounts paid to date, to reflect underwriting discounts, legal and other costs payable by us, resulting in net proceeds of $702.5 million. These costs will be charged against the gross offering proceeds upon completion of this offering.
(G) In connection with this offering, we anticipate using the net proceeds as follows: (i) to repay $628.5 million of outstanding borrowings under the revolving portion of the Unsecured Credit Facility, (ii) to repay $66.6 million of indebtedness to our Sponsor attributable to certain of the Acquired Properties; (iii) to pay $2.0 million of transaction costs related to the IPO Property Transfers, which relate to, among other things, transfer taxes and loan consent fees (These transaction costs will be reflected as expenses except for those costs directly attributable to the issuance of the OP Units which will be accounted for as a reduction in the carrying value of the Non-controlling interest. Accordingly, $2.0 million of the transaction costs have been reflected as an addition to Distributions in excess of accumulated loss.); and (iv) to pay $5.4 million of transfer fees due to lenders on several of our outstanding mortgage loans that are payable in connection with this offering. Of the $5.4 million of consent and/or transfer fees, $5.2 million will be capitalized as an addition to Deferred charges and prepaid expense, net and amortized into interest expense over the remaining term of the underlying mortgage loans, and the remaining $0.2 million will be expensed as it relates to certain Non-Core Property mortgages distributed to our Sponsor. A summary is as followings (in thousands):
| Repayment of Unsecured Credit Facility | $ | 628,476 | ||
Repayment of indebtedness attributable to Acquired Properties | 66,574 | |||
IPO Property Transfer transaction costs | 2,000 | |||
Loan transfer and consent fees | 5,450 | |||
|
| |||
| $ | 702,500 | |||
|
|
(H) To reflect the allocation of pro forma total equity as of June 30, 2013 based on the issuance of 50.0 million shares of common stock in the Company and 20.3 million OP Units in the Operating Partnership in the IPO.
2. Adjustments to the Pro Forma Condensed Consolidated Statement of Operations
(AA) Reflects the results of operations associated with the Acquired Properties as discussed in Note (A) above. The consideration allocated to (i) buildings and improvements will be depreciated over the estimated average remaining useful lives ranging from 4 to 40 years and (ii) above- and below-market leases andin-place lease value will be amortized over the weighted average lives of the related leases ranging from 3 to 9 years.
65
The pro forma adjustments shown below for the Acquired Properties are based on our preliminary estimates and are subject to change based on the final determination of the fair value of assets and liabilities acquired.
| For the Six Months Ended June 30, 2013 | For the Year Ended December 31, 2012 | |||||||||||||||||||||||||||||||
| Acquired Properties Historical | Pro Forma Adjustments | Pro Forma | Acquired Properties Historical | Pro Forma Adjustments | Pro Forma | |||||||||||||||||||||||||||
(Unaudited and in thousands) | ||||||||||||||||||||||||||||||||
Revenue | ||||||||||||||||||||||||||||||||
Rental income | $ | 27,513 | $ | 3,374 | (1) | $ | 30,887 | $ | 55,075 | $ | 6,234 | (1) | $ | 61,309 | ||||||||||||||||||
Expense reimbursements | 7,034 | — | 7,034 | 14,868 | — | 14,868 | ||||||||||||||||||||||||||
Other revenues | 109 | — | 109 | 566 | — | 566 | ||||||||||||||||||||||||||
|
|
|
|
|
|
|
|
|
|
|
| |||||||||||||||||||||
Total revenues | 34,656 | 3,374 | 38,030 | 70,509 | 6,234 | 76,743 | ||||||||||||||||||||||||||
|
|
|
|
|
|
|
|
|
|
|
| |||||||||||||||||||||
Operating expenses | ||||||||||||||||||||||||||||||||
Operating costs | 5,104 | — | 5,104 | 11,477 | — | 11,477 | ||||||||||||||||||||||||||
Real estate taxes | 3,871 | — | 3,871 | 7,712 | — | 7,712 | ||||||||||||||||||||||||||
Depreciation and amortization | 16,426 | 1,722 | (2) | 18,148 | 31,894 | 4,404 | (2) | 36,298 | ||||||||||||||||||||||||
Provision for doubtful accounts | 269 | — | 269 | 519 | — | 519 | ||||||||||||||||||||||||||
Acquisition related costs | — | — | — | 2,170 | (2,170 | ) | (3) | — | ||||||||||||||||||||||||
General and administrative | 452 | — | 452 | 543 | — | 543 | ||||||||||||||||||||||||||
|
|
|
|
|
|
|
|
|
|
|
| |||||||||||||||||||||
Total operating expenses | 26,122 | 1,722 | 27,844 | 54,315 | 2,234 | 56,549 | ||||||||||||||||||||||||||
|
|
|
|
|
|
|
|
|
|
|
| |||||||||||||||||||||
Other income (expenses) | ||||||||||||||||||||||||||||||||
Dividends and interest | 4 | — | 4 | 6 | — | 6 | ||||||||||||||||||||||||||
Interest expense | (8,771 | ) | (376 | ) | (4) | (9,147 | ) | (15,896 | ) | (1,002 | ) | (4) | (16,898 | ) | ||||||||||||||||||
Gain on sale of real estate | (161 | ) | — | (161 | ) | — | — | — | ||||||||||||||||||||||||
Other | — | — | — | — | — | — | ||||||||||||||||||||||||||
|
|
|
|
|
|
|
|
|
|
|
| |||||||||||||||||||||
Total other income (expense), net | (8,928 | ) | (376 | ) | (9,304 | ) | (15,890 | ) | (1,002 | ) | (16,892 | ) | ||||||||||||||||||||
|
|
|
|
|
|
|
|
|
|
|
| |||||||||||||||||||||
(Loss) income before equity in earnings of unconsolidated subsidiaries | (394 | ) | 1,276 | 882 | 304 | 2,998 | 3,302 | |||||||||||||||||||||||||
Equity (loss) income of unconsolidated real estate joint ventures | — | — | — | — | — | — | ||||||||||||||||||||||||||
Impairment of investment in unconsolidated real estate joint ventures | — | — | — | — | — | — | ||||||||||||||||||||||||||
|
|
|
|
|
|
|
|
|
|
|
| |||||||||||||||||||||
(Loss) income from continuing operations | $ | (394 | ) | $ | 1,276 | $ | 882 | $ | 304 | $ | 2,998 | $ | 3,302 | |||||||||||||||||||
|
|
|
|
|
|
|
|
|
|
|
| |||||||||||||||||||||
| (1) | Adjusts above/below market lease amortization and straight line rent. |
| (2) | Adjusts depreciation and amortization based on the allocation of the fair value to tangible and identified intangible assets acquired. |
| (3) | Removes acquisition related costs incurred by our Sponsor related to our Sponsor’s acquisition in 2012 of certain of the Contributed Properties. |
| (4) | Adjusts interest expense to reflect the following: (i) remove debt issuance costs for the acquired loans, (ii) assumption fees paid as part of the loan agreement are amortized and included as part of interest expense, and (iii) amortization of the fair value adjustment on assumed loans. |
(BB) Reflects the results of operations associated with Arapahoe as discussed in Note (B) above. The consideration allocated to (i) buildings and improvements will be depreciated over the estimated useful lives of the respective assets which range from 1 to 40 years and (ii) above- and below-market leases andin-place lease value will be amortized over the weighted average lives of the related leases ranging from 3 to 9 years.
66
The pro forma adjustments shown below are based on our preliminary estimates and are subject to change based on the final determination of the fair value of assets and liabilities acquired.
| For the Six Months Ended June 30, 2013 | For the Year Ended December 31, 2012 | |||||||||||||||||||||||||||||||
| Arapahoe Historical | Pro Forma Adjustments | Pro Forma | Arapahoe Historical | Pro Forma Adjustments | Pro Forma | |||||||||||||||||||||||||||
(Unaudited and in thousands) | ||||||||||||||||||||||||||||||||
Revenue | ||||||||||||||||||||||||||||||||
Rental income | $ | 2,818 | $ | (97 | ) | (1 | ) | $ | 2,721 | $ | 5,437 | $ | (470 | ) | (1 | ) | $ | 4,967 | ||||||||||||||
Expense reimbursements | 1,020 | — | 1,020 | 1,864 | — | 1,864 | ||||||||||||||||||||||||||
Other revenues | — | — | — | 32 | — | 32 | ||||||||||||||||||||||||||
|
|
|
|
|
|
|
|
|
|
|
| |||||||||||||||||||||
Total revenues | 3,838 | (97 | ) | 3,741 | 7,333 | (470 | ) | 6,863 | ||||||||||||||||||||||||
|
|
|
|
|
|
|
|
|
|
|
| |||||||||||||||||||||
Operating expenses | ||||||||||||||||||||||||||||||||
Operating costs | 591 | — | 591 | 1,299 | — | 1,299 | ||||||||||||||||||||||||||
Real estate taxes | 864 | — | 864 | 1,803 | — | 1,803 | ||||||||||||||||||||||||||
Depreciation and amortization | 770 | 521 | (2 | ) | 1,291 | 1,705 | 876 | (2 | ) | 2,581 | ||||||||||||||||||||||
Provision for doubtful accounts | 6 | — | 6 | (16 | ) | — | (16 | ) | ||||||||||||||||||||||||
Acquisition related costs | — | — | — | — | — | — | ||||||||||||||||||||||||||
General and administrative | 97 | — | 97 | 310 | — | 310 | ||||||||||||||||||||||||||
|
|
|
|
|
|
|
|
|
|
|
| |||||||||||||||||||||
Total operating expenses | 2,328 | 521 | 2,849 | 5,101 | 876 | 5,977 | ||||||||||||||||||||||||||
|
|
|
|
|
|
|
|
|
|
|
| |||||||||||||||||||||
Other income (expenses) | ||||||||||||||||||||||||||||||||
Dividends and interest | 2 | — | 2 | 8 | — | 8 | ||||||||||||||||||||||||||
Interest expense | (1,080 | ) | 26 | (3 | ) | (1,054 | ) | (2,364 | ) | 53 | (3 | ) | (2,311 | ) | ||||||||||||||||||
Gain (loss) on sale of real estate | — | — | — | — | — | — | ||||||||||||||||||||||||||
Other | — | — | — | — | — | — | ||||||||||||||||||||||||||
|
|
|
|
|
|
|
|
|
|
|
| |||||||||||||||||||||
Total other income (expense), net | (1,078 | ) | 26 | (1,052 | ) | (2,356 | ) | 53 | (2,303 | ) | ||||||||||||||||||||||
|
|
|
|
|
|
|
|
|
|
|
| |||||||||||||||||||||
(Loss) income before equity in earnings of unconsolidated subsidiaries | 432 | (592 | ) | (160 | ) | (124 | ) | (1,293 | ) | (1,417 | ) | |||||||||||||||||||||
Equity (loss) income of unconsolidated real estate joint ventures | — | — | — | — | — | — | ||||||||||||||||||||||||||
Impairment of investment in unconsolidated real estate joint ventures | — | — | — | — | — | — | ||||||||||||||||||||||||||
|
|
|
|
|
|
|
|
|
|
|
| |||||||||||||||||||||
(Loss) income from continuing operations | $ | 432 | $ | (592 | ) | $ | (160 | ) | $ | (124 | ) | $ | (1,293 | ) | $ | (1,417 | ) | |||||||||||||||
|
|
|
|
|
|
|
|
|
|
|
| |||||||||||||||||||||
| (1) | Adjusts above/below market lease amortization and straight line rent. |
| (2) | Adjusts depreciation and amortization based on the allocation of the fair value to tangible and identified intangible assets acquired. |
| (3) | Adjusts for the removal of amortization of debt issuance costs on acquired debt. There are no debt issuance costs associated with the acquired debt. |
(CC) Reflects the elimination of the results of operations associated with the Non-Core Properties as discussed in Note (C) above. As of June 30, 2013 and December 31, 2012, one of the Non-Core Properties was classified as held for sale and its results from operations are included in discontinued operations on the Company’s historical statements of operations. Therefore, the results of operations for this property are not reflected in this adjustment for both the six months ended June 30, 2013 and the year ended December 31, 2012.
67
(DD) The adjustment reflects (i) additional estimated management and other fees that will be earned from our Sponsor for the management of the Non-Core Properties following the offering and (ii) the elimination of the historical management and other fees earned by us from the Acquired Properties summarized as follows:
| Six months ended June 30, 2013 | Year ended December 31, 2012 | |||||||||||||||
| Other Income | Operating Costs | Other Income | Operating Costs | |||||||||||||
Additions: | ||||||||||||||||
Management fees and other fees earned on non-core properties | $ | 1,267 | — | $ | 2,986 | — | ||||||||||
Less: | ||||||||||||||||
Elimination of management and other fees from the Acquired Properties | (1,149 | ) | (1,149 | ) | (1,990 | ) | (1,990 | ) | ||||||||
|
|
|
|
|
|
|
| |||||||||
Net adjustment to Pro Forma | $ | 118 | $ | (1,149 | ) | $ | 996 | $ | (1,990 | ) | ||||||
|
|
|
|
|
|
|
| |||||||||
Management fees payable to us are equal to a percentage of gross rental revenues. Other fees include (1) leasing fees (commissions) which are equal to a percentage of ABR for any new and renewal lease signed and (2) overhead reimbursements for out of pocket expenses incurred.
(EE) Reflects the reduction of interest expense attributable to the following, (i) repayment of outstanding indebtedness with the proceeds of our Unsecured Credit Facility as discussed in Note (D) above resulting in a reduction to interest expense. Interest on the existing debt arrangements with principal balances of $2,383.1 million was approximately $69.4 million and $138.4 million, for the six months ended June 30, 2013 and the year ended December 31, 2012, respectively. The $2,383.1 million debt reduction will be repaid with proceeds from our Unsecured Credit Facility, comprised of a term loan with a balance of $1,500.0 million with an interest rate of 2.44% and a revolving credit line of approximately $883.1 million with an interest rate of 1.89%, resulting in interest expense of approximately $29.6 million and $59.7 million with a corresponding interest expense reduction of $39.8 million and $78.7 million for the six months ended June 30, 2013 and the year ended December 31, 2012, respectively, and (ii) partial repayment of the revolving credit line (see above) with the net proceeds of this offering resulting in a reduction of outstanding principle by $632.5 million and a corresponding decrease in interest expense of $5.9 million and $11.9 million for the six months ended June 30, 2013 and the year ended December 31, 2012, respectively.
Borrowings under the Unsecured Credit Facility bear interest, at our option, at a rate equal to a margin over either (a) a base rate determined by reference to the highest of (1) the administrative agent’s prime lending rate, (2) the federal funds effective rate plus 0.5% and (3) the LIBOR rate that would be payable on such day for a LIBOR rate loan with a one-month interest period plus 1% or (b) a LIBOR rate determined by reference to the BBA LIBOR rate for the interest period relevant to such borrowing. The margin for the term loans is based on a total leverage based grid and ranges from 0.40% to 1.00%, in the case of base rate loans, and 1.40% to 2.00%, in the case of LIBOR rate loans. The margin for the revolving credit facility is also based on a total leverage based grid and ranges from 0.50% to 1.10%, in the case of base rate loans, and 1.50% to 2.10%, in the case of LIBOR rate loans. We have entered into several interest rate swaps with third parties whereby we have effectively locked the interest rate on the $1,500 million term loan at 2.44% through October 1, 2016. The interest rate on our LIBOR-based initial borrowings of the revolving credit facility is 1.89% which is comprised of a LIBOR rate of 0.19% plus a margin of 1.70% based on our current leverage ratio.
A 1/8% change to the variable interest rate on the revolving credit facility would change the pro forma interest expense by $0.2 million and $0.3 million for the six months ended June 30, 2013 and the year ended December 31, 2012, respectively.
68
The following table summarizes the interest expense adjustment:
| Six months ended June 30, 2013 | Year ended December 31, 2012 | |||||||||||||||
| Principal Balance Increase/ (Decrease) | Interest Expense Increase/ (Decrease) | Principal Balance Increase/ (Decrease) | Interest Expense Increase/ (Decrease) | |||||||||||||
Repayment of outstanding indebtedness | $ | (2,383,088 | ) | $ | (69,424 | ) | $ | (2,383,088 | ) | $ | (138,360 | ) | ||||
Unsecured Credit Facility borrowings | 2,383,088 | 29,635 | 2,383,088 | 59,728 | ||||||||||||
Unsecured Credit Facility repayment using offering net proceeds | (632,476 | ) | (5,920 | ) | (632,476 | ) | (11,938 | ) | ||||||||
|
|
|
| |||||||||||||
Net adjustment to Pro Forma interest expense | $ | (45,709 | ) | $ | (90,570 | ) | ||||||||||
|
|
|
| |||||||||||||
69
On a periodic basis, management assesses whether there are indicators that the value of our real estate assets (including any related intangible assets or liabilities) may be impaired.
If an indicator is identified, a real estate asset is considered impaired only if management’s estimate of current and projected operating cash flows (undiscounted and unleveraged), taking into account the anticipated and probability weighted holding period, are less than a real estate asset’s carrying value. Various factors are considered in the estimation process, including expected future operating income, trends and prospects and the effects of demand, competition, and other economic factors. If management determines that the carrying value of a real estate asset is impaired, a loss will be recorded for the excess of its carrying amount over its fair value.
In situations in which a lease or leases associated with a significant tenant have been, or are expected to be, terminated early, we evaluate the remaining useful lives of depreciable or amortizable assets in the asset group related to the lease that will be terminated (i.e., tenant improvements, above- and below-market lease intangibles, in-place lease value and leasing commissions). Based upon consideration of the facts and circumstances surrounding the termination, we may write-off or accelerate the depreciation and amortization associated with the asset group. Such write-offs are included within Depreciation and amortization in the Statements of Operations.
Stock Based Compensation
In accordance with Financial Accounting Board’s Accounting Standards Codification Topic 718,Stock Compensation,as modified or supplemented, we measure compensation cost for share-based payment awards granted to employees and non-employee directors at fair value using the Black-Scholes-Merton option-pricing model. Share-based compensation includes awards granted to employees and has been reported in general and administrative expenses in our consolidated statements of income.
Certain employees of the Company have been granted long term incentive awards which provide them with equity interests in the Company’s equity holders and ultimate parent investors (“Class B Units”). The awards were granted with service conditions and performance and market conditions. The fair value of the units with service conditions are recognized ratably over the applicable service period. The units granted subject to performance and market conditions will be recognized as the applicable conditions are met. The awards granted are profits interests having economic characteristics similar to stock appreciation rights and representing the right to share in any increase in value that exceeds a specified threshold. Therefore, the Class B units only have value to the extent there is an appreciation in the value of the business from and after the applicable date of grant and the appreciation rights exceeds a specified threshold. The units granted subject to performance and market conditions vest on the date, if any, that our Sponsor receives cash proceeds resulting in a 15% internal rate of return, subject to continued employment on such date.
During the six months ended June 30, 2013 and 2012, we recognized approximately $1.6 million and $3.2 million, respectively, of compensation expense relating to the Class B Units. During the year ended December 31, 2012 and the period from June 28, 2011, we recognized approximately $6.4 million and $1.1 million, respectively, of compensation expense relating to the Class B Units.
We calculate the fair value of share based compensation awards using the Black-Scholes-Merton option-pricing model which requires the use of subjective assumptions, including share price volatility, the expected life of the award, risk free interest rate and expected dividend yield. In developing our assumptions we take into account the following:
| • | As a result of our status as a private company for the last several years we do not have sufficient history to estimate the volatility of our common share price. We calculate the expected volatility based on reported data for selected reasonably similar publicly traded companies for which historical information is available. We plan to continue to use the guideline peer group volatility information until the historical volatility of our common shares is relevant to measure expected volatility for future award grants; |
103
| • | We determine the risk free interest rate by reference to implied yields available from United States Treasury securities with a remaining term equal to the expected life assumed at the date of the grant; |
| • | We assumed dividend yield is based on our historical dividends paid, excluding dividends that resulted from activities to be one time in nature; |
| • | We estimate the average expected life of the awards based on the projected liquidity event. |
The assumptions used in the Black-Scholes-Merton option pricing model are set forth below:
| 2011 | 2013 | |||||||
Dividend yield | 0.0% | 0.0% | ||||||
Risk free interest rate | 0.9% | 0.2% | ||||||
Expected volatility | 80.0% | 35.0% | ||||||
Expected life | | 5 years | | | 1.6 years | | ||
The following table presents the grant dates and numbers of underlying shares granted to employees from June 28, 2011 through June 30, 2013:
| Number of Class B Units Granted (in millions) | Estimated Fair Value Per Class B Units at Grant Date | Total Estimated Value of Class B Units at Grant Date (in millions) | ||||||||||||||||||
Date of Grant | Service Condition | Performance and Market Condition | Service Condition | Performance and Market Condition | ||||||||||||||||
November 1, 2011 | 96.8 | $ | 0.45 | $ | 0.44 | $ | 21.8 | $ | 21.3 | |||||||||||
March 29, 2013 | 9.1 | $ | 0.445 | $ | 0.444 | $ | 2.0 | $ | 2.0 | |||||||||||
April 30, 2013 | 1.8 | $ | 0.445 | $ | 0.444 | $ | 0.4 | $ | 0.4 | |||||||||||
May 20, 2013 | 20.6 | $ | 0.289 | $ | 0.289 | $ | 3.0 | $ | 3.0 | |||||||||||
Certain employees of the company have been granted awards in affiliated entities that are managed by the company. The awards granted to these employees are due to their employment and capacity at the company. The company records management fee income from the affiliated entities as well as additional compensation expense to reflect the fair value of the awards as they are earned by the employees.
Offering Price
We have determined the anticipated initial public offering price range of $14.00 to $16.00 per share. This estimated price range is based on a number of factors, including our results of operations, our future prospects, the economic conditions in and future prospects for the industry in which we compete, current market valuations of publicly traded companies considered comparable to our company and the other factors described in the section titled “Underwriting.” The actual initial price to the public for the offering has not yet been determined and remains subject to adjustment based on factors outside of our control.
The methodology applied to determine the value of the awards at grant date and initial public offering would be substantially the same. The following table sets forth the value of the 2013 Class B Units at grant date and at the time of the initial public offering based on an assumed initial public offering price of $15.00 (the mid-point of the anticipated price range).
Date of Grant | Value of Class B Units at Grant Date (in millions) | Assumed Value at Initial Public Offering (in millions) | ||||||
March 29, 2013 | $ | 4.0 | $ | 6.0 | ||||
April 30, 2013 | $ | 0.8 | $1.2 | |||||
May 20, 2013 | $ | 6.0 | $ | 6.7 | ||||
104
The increase in value between grant date and value at the initial public offering is due to improved operating results driven by an increase in underlying property performance and the impact of the July 2013 debt refinancing (specifically the new Unsecured Credit Facility closed July 2013).
Inflation
The majority of our leases contain provisions designed to mitigate the adverse impact of inflation. Such provisions contain clauses enabling us to receive percentage rents, which generally increase as prices rise but may be adversely impacted by tenant sales decreases, and/or escalation clauses which are typically related to increases in the consumer price index or similar inflation indices. In addition, we believe that many of our existing lease rates are below current market levels for comparable space and that upon renewal or re-rental such rates may be increased to be consistent with, or closer to, current market rates. This belief is based upon an analysis of relevant market conditions, including a comparison of comparable market rental rates, , and upon the fact that many of our leases have been in place for a number of years and may not contain escalation clauses sufficient to match the increase in market rental rates over such time. Most of our leases require the tenant to pay its share of operating expenses, including common area maintenance, real estate taxes and insurance, thereby reducing our exposure to increases in costs and operating expenses resulting from inflation. In addition, we periodically evaluate our exposure to interest rate fluctuations, and may enter into interest rate protection agreements which mitigate, but do not eliminate, the effect of changes in interest rates on our floating rate loans.
In the normal course of business, we also face risks that are either non-financial or non-qualitative. Such risks principally include credit risks and legal risks. For a discussion of other factors which may adversely affect our liquidity and capital resources, please see the section titled “Risk Factors” in this prospectus.
Off-Balance Sheet Arrangements
We had no material off-balance sheet arrangements as of June 30, 2013.
Quantitative and Qualitative Disclosures About Market Risk
We may be exposed to interest rate changes primarily as a result of long-term debt used to maintain liquidity and fund capital expenditures and expansion of our real estate investment portfolio and operations. Our interest rate risk management objectives are to limit the impact of interest rate changes on earnings and cash flows and to lower our overall borrowing costs. To achieve our objectives we borrow primarily at fixed rates or variable rates with the lowest margins available.
With regard to variable rate financing, we assess interest rate cash flow risk by continually identifying and monitoring changes in interest rate exposures that may adversely impact expected future cash flows and by evaluating hedging opportunities. We maintain risk management control systems to monitor interest rate cash flow risk attributable to both our outstanding or forecasted debt obligations as well as our potential offsetting hedge positions. The risk management control systems involve the use of analytical techniques, including cash flow sensitivity analysis, to estimate the expected impact of changes in interest rates on our future cash flows.
We may use additional derivative financial instruments to hedge exposures to changes in interest rates on loans secured by our properties or unsecured debt obligations. To the extent we do we are exposed to market and credit risk. Market risk is the adverse effect on the value of the financial instrument that result a change in interest rates. The market risk associated with interest-rate contracts is managed by establishing and monitoring parameters that limit the types and degree of market risk that may be undertaken. Credit risk is the failure of the counterparty to perform under the terms of the derivative contract. When the fair value derivative contract is positive, the counterparty owes us, which creates credit risk to us. We will minimize the credit risk in derivative instruments by entering into transactions with high-quality counterparties.
105
The following table sets forth information regarding the beneficial ownership of the Outstanding Brixmor Interests immediately following this offering by (1) each person known to us to beneficially own more than 5% of any class of the outstanding voting securities of Brixmor Property Group Inc., (2) each of our directors, director nominees and named executive officers and (3) all of our directors and executive officers as a group.
The information set forth below regarding the number of shares of our common stock, OP Units and BPG Subsidiary Shares beneficially owned by the identified persons gives effect to the acquisition by such persons of such shares and units pursuant to the IPO Property Transfers.
Beneficial ownership is determined in accordance with the rules of the SEC.
Name of Beneficial Owner (1) | Number of Shares of Common Stock Beneficially Owned | Percentage of All Shares of Common Stock (2) | Number of BPG Subsidiary Shares Beneficially Owned (3) | Number of OP Units Beneficially Owned (3) | Percentage of All Outstanding Brixmor Interests (2)(3) | |||||||||||||||
Blackstone (4) | 211,612,524 | 73.33 | % | 75,770,245 | 20,341,246 | 79.68 | % | |||||||||||||
Centerbridge (5) | 23,778,850 | 8.24 | % | — | — | 6.16 | % | |||||||||||||
Michael Carroll | 868,944 | * | 280,655 | 110,932 | * | |||||||||||||||
John G. Schreiber (6) | — | — | — | — | — | |||||||||||||||
A.J. Agarwal (7) | — | — | — | — | — | |||||||||||||||
Michael Berman (8) | — | — | — | — | — | |||||||||||||||
Anthony W. Deering (8) | — | — | — | — | — | |||||||||||||||
Jonathan D. Gray (7) | — | — | — | — | — | |||||||||||||||
Nadeem Meghji (7) | — | — | — | — | — | |||||||||||||||
William D. Rahm (9) | — | — | — | — | — | |||||||||||||||
William J. Stein (7) | — | — | — | — | — | |||||||||||||||
Timothy Bruce | 237,040 | * | 76,301 | 36,380 | * | |||||||||||||||
Steven F. Siegel | 312,787 | * | 100,732 | 33,214 | * | |||||||||||||||
Dean Bernstein | 237,040 | * | 76,301 | 29,062 | * | |||||||||||||||
All directors, director nominees and executive officers as a group (15 persons) (8) | 2,378,517 | * | 766,790 | 300,261 | * | |||||||||||||||
| * | Less than 1%. |
| (1) | Our named executive officers for 2012 were Michael Carroll, Timothy Bruce, Steven F. Siegel, Dean Berstein and Tiffanie Fisher. Ms. Fisher, who formerly served as our Executive Vice President and Chief Financial Officer, has been omitted from the table as she does not beneficially own any Brixmor Interests as of the date of this prospectus. On May 20, 2013, Michael V. Pappagallo became our President and Chief Financial Officer. |
| (2) | Assumes 288,583,716 shares of our common stock, 20,784,571 OP Units and 76,798,997 BPG Subsidiary Shares outstanding immediately following this offering. |
| (3) | Subject to certain requirements and restrictions, the BPG Subsidiary Shares are exchangeable for shares of our common stock, on a one-for-one basis, or, at our option, cash and the OP Units are redeemable for cash or, at our option, exchangeable for shares of our common stock, on a one-for-one basis, in each case, from and after the first anniversary date of the closing of this offering. See “Organizational Structure.” Beneficial ownership of BPG Subsidiary Shares and OP Units reflected in this table are presented separately from the beneficial ownership of the shares of our common stock for which such BPG Subsidiary Shares or OP Units may be exchanged. Notwithstanding the foregoing, our Sponsor and Centerbridge are generally permitted to exchange BPG Subsidiary Shares and redeem their OP Units for shares of our common stock at any time. |
| (4) | Reflects 211,612,524 shares of our common stock directly held by BRE Retail Holdco L.P. (“BRE Retail Holdco”) and 75,770,245 BPG Subsidiary Shares directly held by Blackstone Retail Transaction II Holdco L.P. (“Blackstone Retail Transaction II”). The general partner of each of BRE Retail Holdco and Blackstone |
194
| Retail Transaction II is Blackstone Real Estate Associates VI L.P. The general partner for Blackstone Real Estate Associates VI L.P. is BREA VI L.L.C. The managing member of BREA VI L.L.C. is Blackstone Holdings III L.P. |
Also reflects 11,323,788 OP Units directly held by BRE Southeast Retail and 9,017,458 OP Units directly held by BRE Throne JV Member LLC (“BRE Throne JV”). The majority member of BRE Throne JV is BRE Throne Parent LLC. The sole or majority member of each of the members of BRE Throne Parent LLC that together control a majority membership interest therein is BRE Throne Holdings Member LLC. The majority member of BRE Throne Holdings Member LLC is BRE Throne NR Parent LLC (“BRE Throne Parent”). BRE Southeast Retail and BRE Throne Parent are owned by a number of affiliated limited partnerships (the “BREP VII Partnerships”) holding a majority membership interest in BRE Throne Parent and BRE Southeast Retail, respectively. The general partner of each of the BREP VII Partnerships is Blackstone Real Estate Associates VII L.P. The general partner of Blackstone Real Estate Associates VII L.P. is BREA VII L.L.C. The managing member of BREA VII L.L.C. is Blackstone Holdings III L.P.
The general partner of Blackstone Holdings III L.P. is Blackstone Holdings III GP L.P. The general partner of Blackstone Holdings III GP L.P. is Blackstone Holdings III GP Management L.L.C. The sole member of Blackstone Holdings III GP Management L.L.C. is The Blackstone Group L.P. The general partner of The Blackstone Group L.P. is Blackstone Group Management L.L.C. Blackstone Group Management L.L.C. is wholly-owned by Blackstone’s senior managing directors and controlled by its founder, Steven A. Schwarzman. Each of such Blackstone entities (other than BRE Retail Holdco, Blackstone Retail Transaction II, BRE Southeast Retail and BRE Throne JV to the extent of their direct holdings) and Mr. Schwarzman may be deemed to beneficially own the shares beneficially owned by BRE Retail Holdco, Blackstone Retail Transaction II, BRE Southeast Retail and BRE Throne JV directly or indirectly controlled by it or him, but each disclaims beneficial ownership of such shares. The address of each of Mr. Schwarzman and each of the other entities listed in this footnote is c/o The Blackstone Group L.P., 345 Park Avenue, New York, New York 10154.
| (5) | Reflects 6,203,458 shares of our common stock held directly by Centerbridge Credit Partners, L.P., 8,141,924 shares of our common stock held directly by Centerbridge Credit Partners TE Intermediate I, L.P., 2,676,594 shares of our common stock held directly by Centerbridge Credit Partners Offshore Intermediate III, L.P. and 6,758,812 shares of our common stock held directly by Centerbridge Special Credit Partners, L.P. Centerbridge Credit Partners General Partner, L.P. is the general partner of Centerbridge Credit Partners, L.P. and Centerbridge Credit Partners TE Intermediate I, L.P. Centerbridge Credit GP Investors, L.L.C. is the general partner of Centerbridge Credit Partners General Partner, L.P. Centerbridge Special Credit Partners General Partner, L.P. is the general partner of Centerbridge Special Credit Partners, L.P. Centerbridge Special GP Investors, L.L.C. is the general partner of Centerbridge Special Credit Partners General Partner, L.P. Centerbridge Credit Partners Offshore General Partner, L.P. is the general partner of Centerbridge Credit Partners Offshore Intermediate III, L.P. Centerbridge Credit Offshore GP Investors, L.L.C. is the general partner of Centerbridge Credit Partners Offshore General Partner, L.P. Mark. T. Gallogly and Jeffrey H. Aronson are the managing members of Centerbridge Credit GP Investors, L.L.C., Centerbridge Special GP Investors, L.L.C. and Centerbridge Credit Offshore GP Investors, L.L.C. The address of Mr. Gallogly, Mr. Aronson and each entity or individual described in this footnote (5) is c/o Centerbridge Partners, L.P., 375 Park Avenue, 12th Floor, New York, New York 10152. |
| (6) | Mr. Schreiber is a partner and co-founder of Blackstone Real Estate Advisors, which is affiliated with Blackstone. Mr. Schreiber disclaims beneficial ownership of the shares beneficially owned by Blackstone. |
| (7) | Messrs. Agarwal, Gray, Meghji and Stein are each employees of Blackstone, but each disclaims beneficial ownership of the shares beneficially owned by Blackstone. The address for Messrs. Agarwal, Gray, Meghji and Stein is c/o The Blackstone Group L.P., 345 Park Avenue, New York, New York 10154. |
| (8) | As described in “Management—Director Compensation,” we anticipate that each of Mr. Berman and Mr. Deering will receive, at the time of this offering, a grant of restricted stock or restricted stock units in an amount having a value of $100,000 based on the initial public offering price. |
| (9) | Mr. Rahm is an employee of Centerbridge, but disclaims beneficial ownership of the shares beneficially owned by Centerbridge. |
195
The foregoing table assumes that the initial public offering price for shares of our common stock to be sold in this offering is $15.00 per share, which is the midpoint of the price range indicated on the front cover of this prospectus. However, as discussed in “Organizational Structure—IPO Property Transfers” and “Management—Compensation Discussion and Analysis—Compensation Elements—Long-Term Equity Compensation,” the precise holdings of shares of our common stock, BPG Subsidiary Shares and OP Units by particular existing owners would differ from that presented in the table above if the actual initial public offering price per share differs from this assumed price.
For example, if the initial public offering price per share of common stock in this offering is $14.00, which is the low-point of the price range indicated on the front cover of this prospectus, the beneficial ownership of Brixmor Interests of the identified holders would be as follows:
Name of Beneficial | Number of Shares of Common Stock Beneficially Owned | Number of BPG Subsidiary Shares Beneficially Owned | Number of OP Units Beneficially Owned | |||||||||
Blackstone | 212,153,514 | 75,963,951 | 20,311,397 | |||||||||
Centerbridge | 23,839,641 | — | — | |||||||||
Michael Carroll | 740,433 | 239,290 | 101,195 | |||||||||
Timothy Bruce | 193,716 | 62,355 | 32,496 | |||||||||
Steven F. Siegel | 261,293 | 84,157 | 29,338 | |||||||||
Dean Bernstein | 193,716 | 62,355 | 25,670 | |||||||||
All directors, director nominees and executive officers as a group (15 persons) | 1,918,793 | 618,810 | 263,977 | |||||||||
Conversely, if the initial public offering price per share of common stock in this offering is $16.00, which is the high-point of the price range indicated on the front cover of this prospectus, the beneficial ownership of Brixmor Interests of the identified holders would be as follows:
Name of Beneficial Owner | Number of Shares of Common Stock Beneficially Owned | Number of BPG Subsidiary Shares Beneficially Owned | Number of OP Units Beneficially Owned | |||||||||
Blackstone | 211,139,156 | 75,600,752 | 20,367,365 | |||||||||
Centerbridge | 23,725,658 | — | — | |||||||||
Michael Carroll | 980,449 | 316,545 | 119,452 | |||||||||
Timothy Bruce | 274,814 | 88,460 | 39,780 | |||||||||
Steven F. Siegel | 357,467 | 115,114 | 36,606 | |||||||||
Dean Bernstein | 274,814 | 88,460 | 32,030 | |||||||||
All directors, director nominees and executive officers as a group (15 persons) | 2,781,520 | 896,511 | 332,010 | |||||||||
196