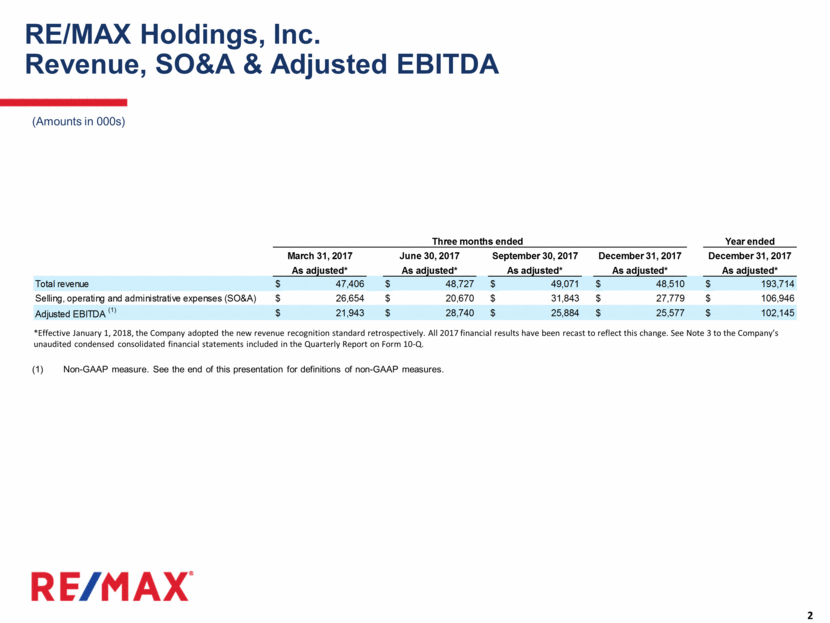
(Amounts in 000s) Represents (gain) loss on the sale or disposition of assets as well as the (gains) losses on the sublease of a portion of the Company’s corporate headquarters office building. Acquisition related expense includes legal costs incurred in connection with our acquisition and integration of certain assets of Tails, Inc. (“Tails”) in October 2013, expenses related to the acquisitions of certain independent regions during 2016 (New Jersey, Georgia, Kentucky/Tennessee and Southern Ohio) and RE/MAX of Northern Illinois in 2017. Costs include legal, accounting and advisory fees and consulting fees for integration services. Gain on reduction in tax receivable agreement liability is a result of the Tax Cuts and Jobs Act enacted in December 2017. Special Committee Investigation expense relates to costs incurred in relation to the previously-disclosed investigation by the special committee of independent directors of actions of certain members of our senior management. Fair value adjustments to contingent consideration include amounts recognized for changes in the estimated fair value of the contingent consideration liability related to the acquisition of Full House Mortgage Connection, Inc. (“Full House”). Non-GAAP measure. See the end of this document for definitions of non-GAAP measures. *Effective January 1, 2018, the Company adopted the new revenue recognition standard retrospectively. All 2017 financial results have been recast to reflect this change. See Note 3 to the Company’s unaudited condensed consolidated financial statements included in the Quarterly Report on Form 10-Q. RE/MAX Holdings, Inc. Adjusted EBITDA Reconciliation to Net Income (Reflects RE/MAX Holdings with 100% ownership of RMCO, LLC) Net income (loss) $ 9,388 $ 15,539 $ 7,290 $ (402) $ 31,815 Depreciation and amortization 5,995 5,397 4,286 4,834 20,512 Interest expense 2,354 2,462 2,598 2,582 9,996 Interest income (26) (25) (145) (157) (352) Provision for income taxes 3,030 4,735 3,021 46,261 57,047 EBITDA 20,741 28,108 17,050 53,118 119,018 (Gain) loss on sale or disposition of assets and sublease, net (1) (47) (74) 3,980 401 4,260 Equity-based compensation expense 562 732 868 739 2,900 Acquisition related expense (2) 557 274 3,566 1,491 5,889 Gain on reduction in TRA liability (3) — — — (32,736) (32,736) Special Committee Investigation expense (4) — — — 2,634 2,634 Fair value adjustments to contingent consideration (5) 130 (300) 420 (70) 180 Adjusted EBITDA (6) $ 21,943 $ 28,740 $ 25,884 $ 25,577 $ 102,145 Adjusted EBITDA Margin (6) 46.3 % 59.0 % 52.7 % 52.7 % 52.7 % December 31, 2017 As adjusted* Year ended September 30, 2017 Three months ended As adjusted* As adjusted* March 31, 2017 June 30, 2017 As adjusted* December 31, 2017 As adjusted*


