Exhibit 99.1

BUILDING STRENGTH Investor Day November 13, 2017 1
FORWARD-LOOKING STATEMENTS This presentation contains forward-looking statements within the meaning of Section 27A of the Securities Act of 1933, as amended, as Section 21E of the Securities Exchange Act of 1934, as amended. These forward-looking statements, which are based on current expectations, estimates and projections about the industry and markets in which MAA operates and beliefs of and assumptions made by MAA management, involve uncertainties that could significantly affect the financial results of MAA. Words such as “expects,” “anticipates,” “intends,” “plans,” “believes,” “seeks,” “estimates,” and variations of such words and similar expressions are intended to identify such forward-looking statements, which are not historical in nature. In this presentation, forward-looking statements include, but are not limited to, statements about forecasted 2017 operating results, expected benefits and synergies from the merger with Post Properties, Inc. and the timing of those benefits and synergies, the anticipated value of current development projects, estimated costs of property development, the anticipated timing of completion of current development projects and the stabilization of such projects, MAA’s future development projects, the anticipated scope of MAA’s future redevelopment activities and projected incremental rent growth, and other information that is not historical. All statements that address operating performance, events or developments that MAA anticipates or expects will occur in the future are forward-looking statements. These statements are not guarantees of future performance and involve certain risks, uncertainties and assumptions that are difficult to predict. Although MAA believes the expectations reflected in any forward-looking statements are based on reasonable assumptions, MAA can give no assurance that its expectations will be achieved, and therefore actual outcomes and results may differ materially from what is expressed or forecasted in such forward-looking statements. Some of the factors that may affect outcomes and results include, but are not limited to: inability to generate sufficient cash flows due to market conditions, changes in supply and/or demand, competition, uninsured losses, changes in tax and housing laws, or other factors; exposure as a multifamily-focused REIT to risks inherent in investments in a single industry and sector; adverse changes in real estate markets; failure of new acquisitions to achieve anticipated results or be efficiently integrated; failure of development communities to be completed, if at all, within budget and on a timely basis or tolease-up as anticipated; unexpected capital needs; changes in operating costs, including real estate taxes, utilities and insurance costs; losses from catastrophes in excess of our insurance coverage; level and volatility of interest or capitalization rates or capital market conditions; the effect of any rating agency actions; inability to attract and retain qualified personnel; cyberliability or potential liability for breaches of our privacy or information security systems; adverse legislative or regulatory tax changes; litigation and compliance costs associated with laws requiring access for disabled persons; risks associated with the Post Properties, Inc. merger, including the integration of MAA’s and Post Properties, Inc.’s businesses and achieving expected revenue synergies and/or cost savings as a result of the merger; risks associated with unexpected costs or unexpected liabilities that may arise from the Post Properties, Inc. merger; and those additional risks and factors discussed in reports filed with the Securities and Exchange Commission by MAA from time to time, including those discussed under the heading “Risk Factors” in its most recently filed Annual Report on Form10-K and Quarterly Reports on Form10-Q. MAA undertakes no duty to update any forward-looking statements appearing in this presentation. REGULATION G This presentation contains certainnon-GAAP financial measures within the meaning of the Securities Exchange Act of 1934, as amended. MAA’s definitions of thesenon-GAAP financial measures, among other terms, and reconciliations to the most directly comparable GAAP measures, can be found in the accompanying Appendix and under the “Financial Results” navigation tab on the “For Investors” page of MAA’s website at www.maac.com.

INTRODUCTION TIM ARGO Welcome to MAA Investor Day 2017 SVP, Finance

OVERVIEW Portfolio Balance Sheet ERIC BOLTON Operating Platform CEO Management Team
PORTFOLIO Changes Have Strengthened MAA—Enhancing Full Cycle Performance Profile Younger and high quality portfolio More efficient operation Enhanced margin growth More robust AFFO growth 5 Overview

PORTFOLIO Changes Have Strengthened MAA 2012 2017 MARKETS AVERAGE AGE MARKETS AVERAGE AGE 50 15 37 15 SAME STORE NOI SAME STORE NOI AVERAGE RENT1,2 MARGIN2 AVERAGE RENT1,2 MARGIN2,3 $859 58.2% $1,184 62.4% 1 Average Rent is Average Effective Rent per Unit as defined in the Appendix 2 Values as of 9/30/2012 and 9/30/2017 6 Overview 3 Same Store for 2017 is Combined Adjusted Same Store Portfolio as defined in the Appendix.
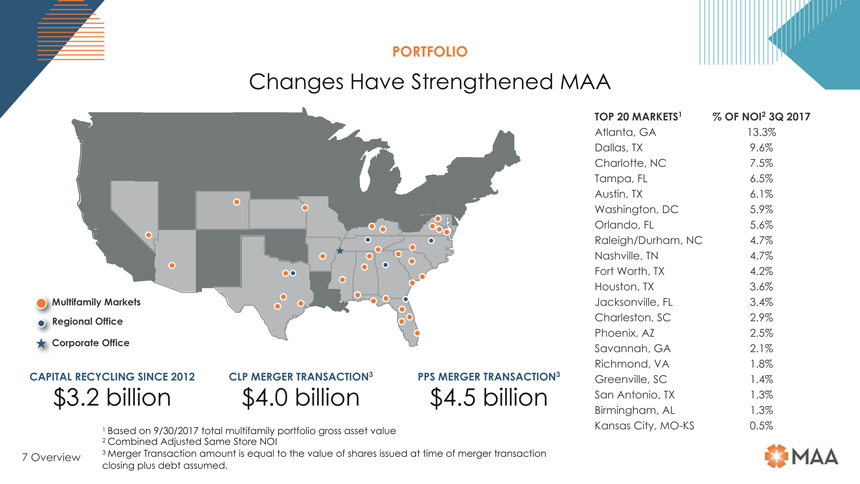
PORTFOLIO Changes Have Strengthened MAA TOP 20 MARKETS1 % OF NOI2 3Q 2017 Atlanta, GA 13.3% Dallas, TX 9.6% Charlotte, NC 7.5% Tampa, FL 6.5% Austin, TX 6.1% Washington, DC 5.9% Orlando, FL 5.6% Raleigh/Durham, NC 4.7% Nashville, TN 4.7% Fort Worth, TX 4.2% Houston, TX 3.6% Multifamily Markets Jacksonville, FL 3.4% Regional Office Charleston, SC 2.9% Phoenix, AZ 2.5% Corporate Office Savannah, GA 2.1% Richmond, VA 1.8% CAPITAL RECYCLING SINCE 2012 CLP MERGER TRANSACTION3 PPS MERGER TRANSACTION3 Greenville, SC 1.4% $3.2 billion $4.0 billion $4.5 billion San Antonio, TX 1.3% Birmingham, AL 1.3% 1 Based on 9/30/2017 total multifamily portfolio gross asset value Kansas City,MO-KS 0.5% 2 Combined Adjusted Same Store NOI 7 Overview 3 Merger Transaction amount is equal to the value of shares issued at time of merger transaction closing plus debt assumed.
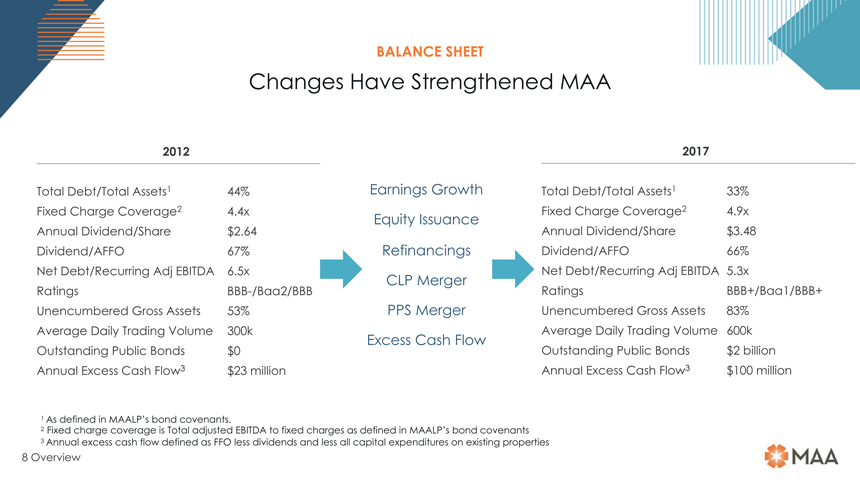
BALANCE SHEET Changes Have Strengthened MAA 2012 2017 Total Debt/Total Assets1 44% Earnings Growth Total Debt/Total Assets1 33% Fixed Charge Coverage2 4.4x Fixed Charge Coverage2 4.9x Equity Issuance Annual Dividend/Share $2.64 Annual Dividend/Share $3.48 Dividend/AFFO 67% Refinancings Dividend/AFFO 66% Net Debt/Recurring Adj EBITDA 6.5x Net Debt/Recurring Adj EBITDA 5.3x CLP Merger RatingsBBB-/Baa2/BBB Ratings BBB+/Baa1/BBB+ Unencumbered Gross Assets 53% PPS Merger Unencumbered Gross Assets 83% Average Daily Trading Volume 300k Average Daily Trading Volume 600k Excess Cash Flow Outstanding Public Bonds $0 Outstanding Public Bonds $2 billion Annual Excess Cash Flow3 $23 million Annual Excess Cash Flow3 $100 million 1 As defined in MAALP’s bond covenants. 2 Fixed charge coverage is Total adjusted EBITDA to fixed charges as defined in MAALP’s bond covenants 3 Annual excess cash flow defined as FFO less dividends and less all capital expenditures on existing properties 8 Overview
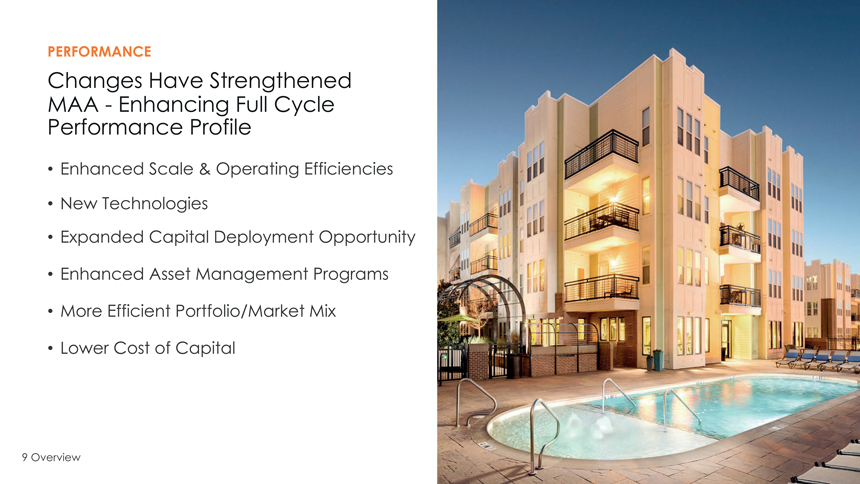
PERFORMANCE Changes Have Strengthened MAA—Enhancing Full Cycle Performance Profile Enhanced Scale & Operating Efficiencies New Technologies Expanded Capital Deployment Opportunity Enhanced Asset Management Programs More Efficient Portfolio/Market Mix Lower Cost of Capital 9 Overview
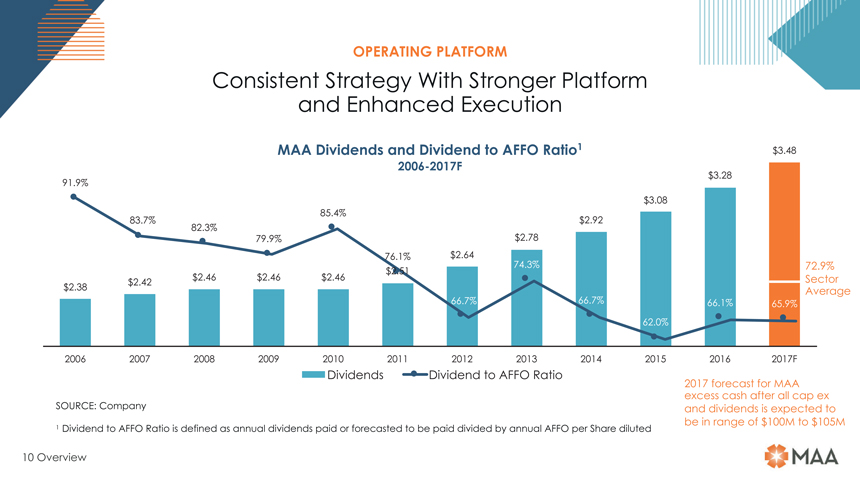
OPERATING PLATFORM Consistent Strategy With Stronger Platform and Enhanced Execution MAA Dividends and Dividend to AFFO Ratio1 $3.48 2006-2017F $3.28 91.9% $3.08 85.4% 83.7% $2.92 82.3% $2.78 79.9% 76.1% $2.64 74.3% $2.51 72.9% $2.46 $2.46 $2.46 Sector $2.42 $2.38 Average 66.7% 66.7% 66.1% 65.9% 62.0% 2006 2007 2008 2009 2010 2011 2012 2013 2014 2015 2016 2017F Dividends Dividend to AFFO Ratio 2017 forecast for MAA SOURCE: Company excess cash after all cap ex and dividends is expected to be in range of $100M to $105M 1 Dividend to AFFO Ratio is defined as annual dividends paid or forecasted to be paid divided by annual AFFO per Share diluted 10 Overview
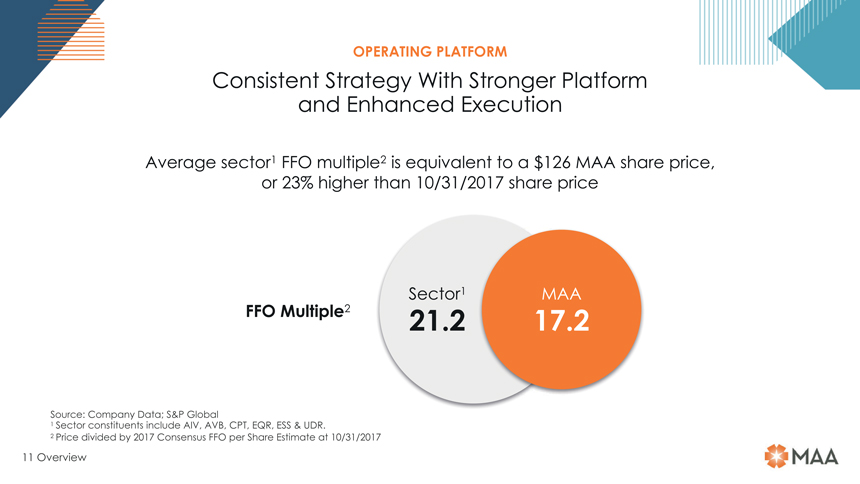
OPERATING PLATFORM Consistent Strategy With Stronger Platform and Enhanced Execution Average sector1 FFO multiple2 is equivalent to a $126 MAA share price, or 23% higher than 10/31/2017 share price Sector1 MAA FFO Multiple2 21.2 17.2 Source: Company Data; S&P Global 1 Sector constituents include AIV, AVB, CPT, EQR, ESS & UDR. 2 Price divided by 2017 Consensus FFO per Share Estimate at 10/31/2017 11 Overview

MANAGEMENT TEAM Experienced, strengthened, and broadened Finance Human management team Resources enhances execution capabilities Al Campbell Melanie Carpenter EVP, Chief Financial Officer EVP, Chief Human Resources Officer Team of 19 Senior VPs with 19 years with MAA 17 years with MAA wide range of technical experience and expertise General Counsel drives competitive & Commercial Multifamily Property advantages. Property Operations Operations Average 10 years Rob DelPriore Tom Grimes with MAA EVP, General Counsel EVP, Chief Operating Officer 4 years with MAA 23 years with MAA Merger transactions have combined the top talents of each company Acquisitions & Dispositions New Development Brad Hill David Ward 12 Overview EVP, Director of Multifamily Investing EVP, Development 7 years with MAA 13 years with MAA (including PPS tenure)
FINANCE Balance Sheet Transformation AL CAMPBELL Merger Integration Status CFO Technology Landscape
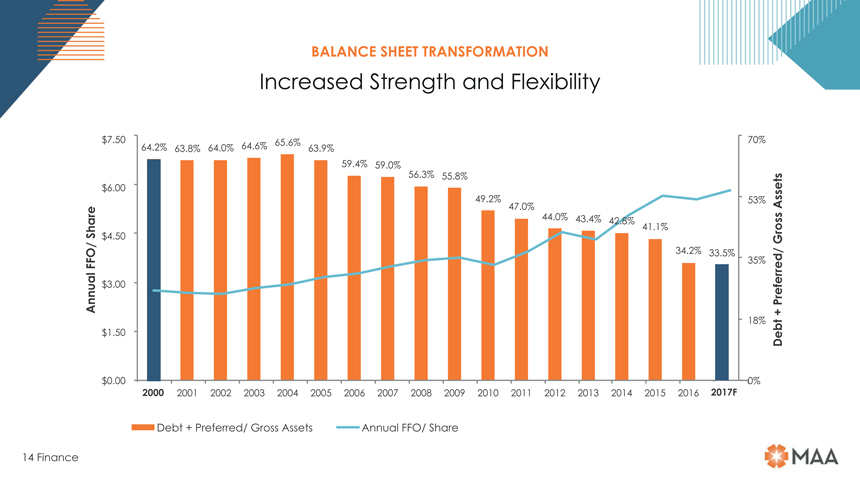
BALANCE SHEET TRANSFORMATION Increased Strength and Flexibility $ 7.50 64.2% 63.8% 64.0% 64.6% 65.6% 63.9% 70% 59.4% 59.0% 56.3% 55.8% $ 6.00 49.2% 53% Assets 47.0% 44.0% 43.4% 42.8% 41.1% Share $ 4.50 Gross 34.2% 33.5% FFO/ 35% Annual $ 3.00 Preferred/ 18% + $ 1.50 Debt $ 0.00 0% 2000 2001 2002 2003 2004 2005 2006 2007 2008 2009 2010 2011 2012 2013 2014 2015 2016 2017F Debt + Preferred/ Gross Assets Annual FFO/ Share 14 Finance
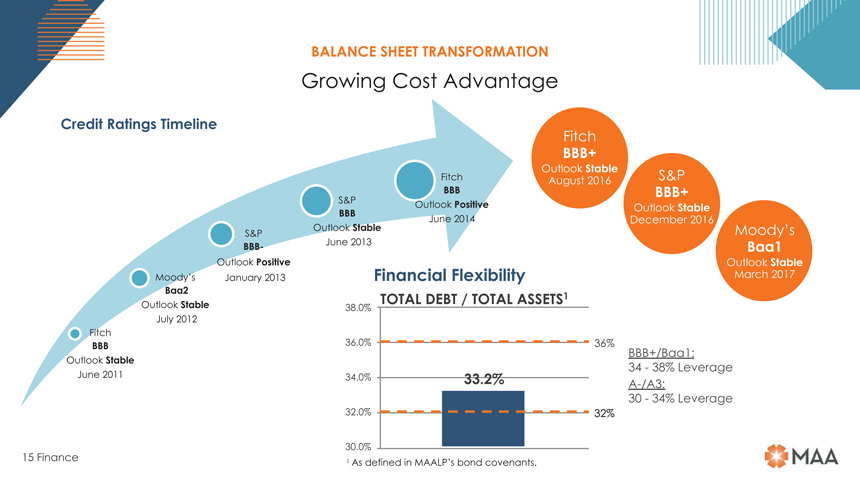
BALANCE SHEET TRANSFORMATION Growing Cost Advantage Credit Ratings Timeline Fitch BBB Outlook Stable June 2011 Moody’s Baa2 Outlook Stable July 2012 S&P BBBOutlook Positive January 2013 S&P BBB Outlook Stable June 2013 Fitch BBB Outlook Positive June 2014 Financial Flexibility TOTAL DEBT / TOTAL ASSETS1 38.0% 36.0% 34.0% 32.0% 30.0% As defined in MAALP’s bond covenants. 36% 32% BBB+/Baa1: 34—38% LeverageA-/A3: 30—34% Leverage 15 Finance
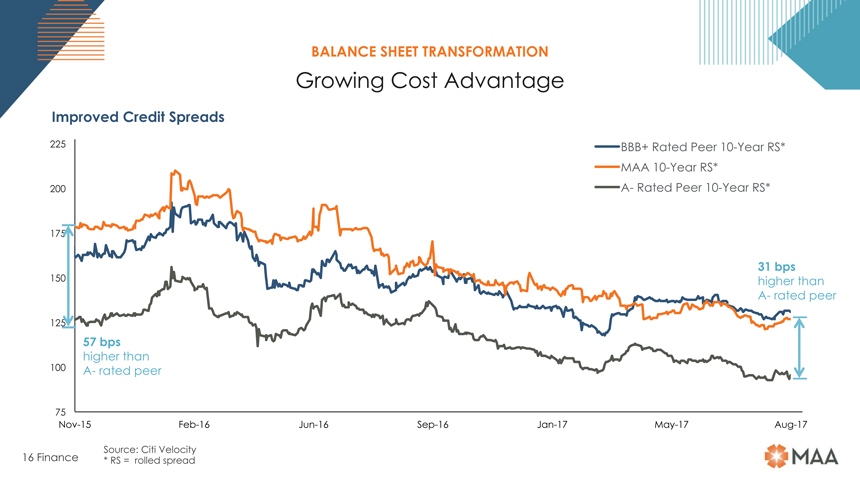
BALANCE SHEET TRANSFORMATION Growing Cost Advantage Improved Credit Spreads 225 BBB+ Rated Peer10-Year RS* MAA10-Year RS* 200A- Rated Peer10-Year RS* 175 31 bps 150 higher thanA- rated peer 125 57 bps higher than 100A- rated peer 75Nov-15Feb-16Jun-16Sep-16Jan-17May-17Aug-17 Source: Citi Velocity 16 Finance * RS = rolled spread
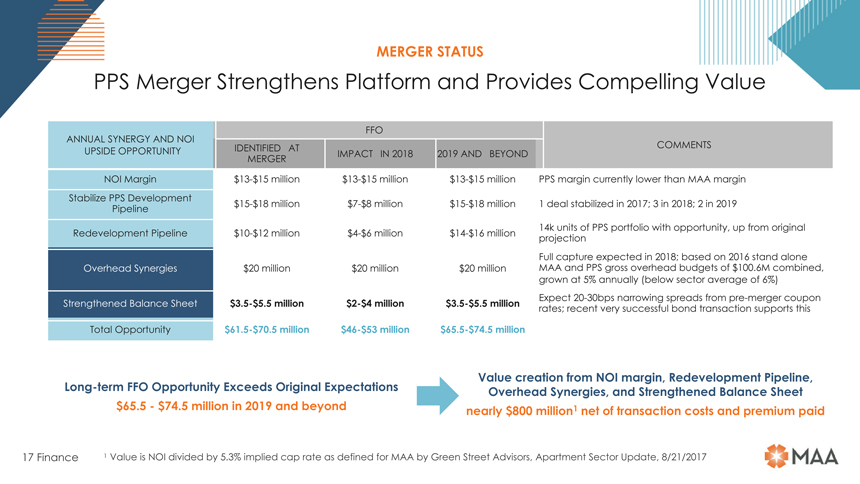
MERGER STATUS PPS Merger Strengthens Platform and Provides Compelling Value FFO SYANNUALERGYSYNERGYA D NOIAND UPSIDENOI UPSIDEOPPORTUNITYOPPORTUNITY IDENTIFIED AT IMPACT IN 2018 2019 AND BEYOND COMCOMMENTSTS MERGER NOI Margin$13-$15 million$13-$15 million$13-$15 millionValuePPS marginc eationcurrently lowerfromthan MAANOImarginmargin, Stabilize Long-term PPS PipelineDevelopment FFO Opportunity$15-$18 million$7-$8 million$15-$18 million Redev1 deal stabilizedlopmentin 2017; 3 in 2018;Pipeline,2 in 2019 ExcRedevelopmenteds PipelineOriginalExpectations$10-$12 million$4-$6 million$14-$16 million Overhead14k units of PPS portfolioSynergies,with opportunity, upandfrom original Strengthenedprojection Balance Sheet Full capture expected in 2018; based on 2016 stand alone $65.5Overhead Synergies- $74.5$20 millionmillion $20 million $20 million MAA and PPS gross overhead budgets of $100.6M combined, nearlygrown at 5% annually$800(below sectormillionaverage of 6%) 1 inBalance2019Sheetandbeyond$3.5-$5.5 million$2-$4 million$3.5-$5.5 million Expect20-30bps narrowing spreads frompre-merger coupon Strengthened nerates;ofrecenttransavery successfultionbondcotransactionts andsupports this Total Opportunity$61.5-$70.5 million$46-$53 million$65.5-$74.5 million premium paid Value creation from NOI margin, Redevelopment Pipeline, Long-term FFO Opportunity Exceeds Original Expectations Overhead Synergies, and Strengthened Balance Sheet $65.5—$74.5 million in 2019 and beyond nearly $800 million1 net of transaction costs and premium paid 17 Finance 1 Value is NOI divided by 5.3% implied cap rate as defined for MAA by Green Street Advisors, Apartment Sector Update, 8/21/2017
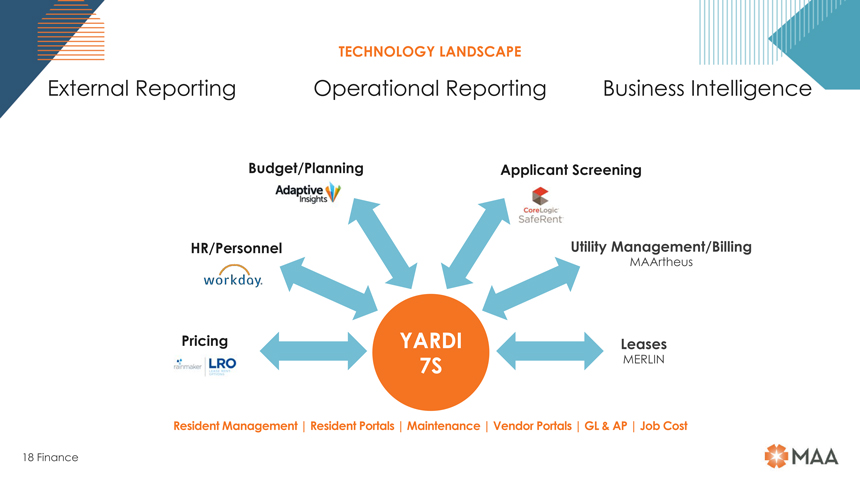
TECHNOLOGY LANDSCAPE External Reporting
Operational Reporting Business Intelligence Budget/Planning Applicant Screening HR/Personnel Utility Management/Billing MAArtheus Pricing YARDI Leases 7S MERLIN Resident Management | Resident Portals | Maintenance | Vendor Portals | GL & AP | Job Cost 18 Finance
OPERATIONS Market Update TOM GRIMES Merger Update COO Operational Strength

MARKET UPDATE Portfolio Balanced and Diversified in Key Growth Markets Diversified in Markets1 9% 50% 41% Job Growth 2.2% 2.2% Suburban Inner Loop Downtown/CBD 1.4% 1.5% Diversified in Price Points1,2 1 Based on 9/30/2017 total multifamily portfolio gross asset value 2 Average effective rent/unit for 9/30/2017 of $1,250 or higher for A to A+ and lower 48% than $1,250 for B to B+ for total 52% 2017 2018 multifamily portfolio Source: Company, Moody’s economy.com MAA Market Average National Average A to A+ B to B+ 20 Operations
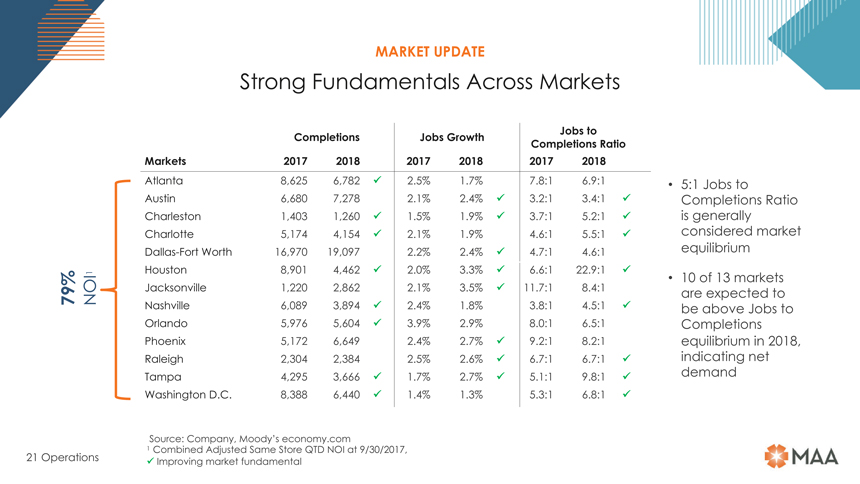
MARKET UPDATE Strong Fundamentals Across Markets Completions Jobs Growth Jobs to Completions Ratio Markets 2017 2018 2017 2018 2017 2018 Atlanta 8,625 6,782 2.5% 1.7% 7.8:1 6.9:1 5:1 Jobs to Austin 6,680 7,278 2.1% 2.4% 3.2:1 3.4:1 Completions Ratio Charleston 1,403 1,260 1.5% 1.9% 3.7:1 5.2:1 is generally Charlotte 5,174 4,154 2.1% 1.9% 4.6:1 5.5:1 considered market Dallas-Fort Worth 16,970 19,097 2.2% 2.4% 4.7:1 4.6:1 equilibrium Houston 8,901 4,462 2.0% 3.3% 6.6:1 22.9:1 1 10 of 13 markets 79% NOI Jacksonville 1,220 2,862 2.1% 3.5% 11.7:1 8.4:1 are expected to Nashville 6,089 3,894 2.4% 1.8% 3.8:1 4.5:1 be above Jobs to Orlando 5,976 5,604 3.9% 2.9% 8.0:1 6.5:1 Completions Phoenix 5,172 6,649 2.4% 2.7% 9.2:1 8.2:1 equilibrium in 2018, Raleigh 2,304 2,384 2.5% 2.6% 6.7:1 6.7:1 indicating net Tampa 4,295 3,666 1.7% 2.7% 5.1:1 9.8:1 demand Washington D.C. 8,388 6,440 1.4% 1.3% 5.3:1 6.8:1 Source: Company, Moody’s economy.com 1 Combined Adjusted Same Store QTD NOI at 9/30/2017, 21 Operations Improving market fundamental
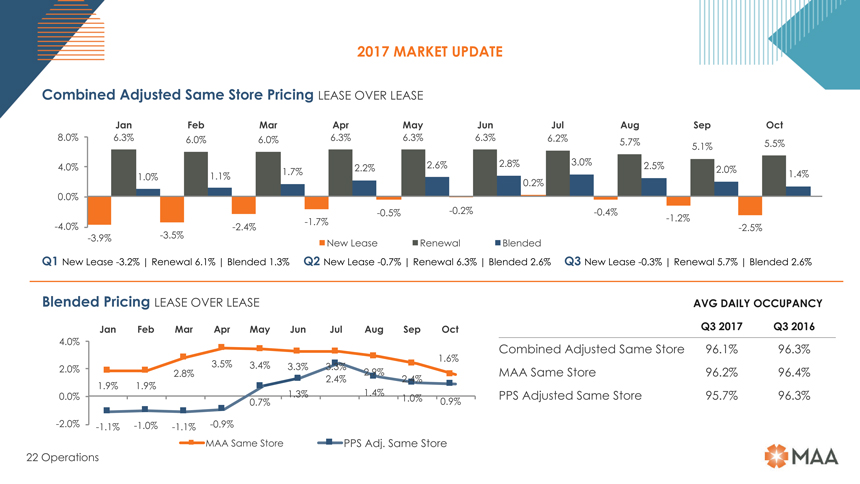
2017 MARKET UPDATE Combined Adjusted Same Store Pricing LEASE OVER LEASE Jan Feb Mar Apr May Jun Jul Aug Sep Oct 8.0% 6.3% 6.0% 6.0% 6.3% 6.3% 6.3% 6.2% 5.7% 5.1% 5.5% 4.0% 1.7% 2.2% 2.6% 2.8% 3.0% 2.5% 2.0% 1.0% 1.1% 1.4% 0.2% 0.0% -0.5%-0.2%-0.4%-4.0% -2.4%-1.7% -1.2%-2.5%-3.9%-3.5% New Lease Renewal Blended Q1 New Lease-3.2% | Renewal 6.1% | Blended 1.3% Q2 New Lease-0.7% | Renewal 6.3% | Blended 2.6% Q3 New Lease-0.3% | Renewal 5.7% | Blended 2.6% Blended Pricing LEASE OVER LEASE AVG DAILY OCCUPANCY Jan Feb Mar Apr May Jun Jul Aug Sep Oct Q3 2017 Q3 2016 4.0% Combined Adjusted Same Store 96.1% 96.3% 3.5% 3.4% 3.3% 3.3% 1.6% 2.0% 2.8% 2.9% MAA Same Store 96.2% 96.4% 1.9% 1.9% 2.4% 2.4% 0.0% 0.7% 1.3% 1.4% 1.0% 0.9% PPS Adjusted Same Store 95.7% 96.3%-2.0%-1.1%-1.0%-1.1%-0.9% MAA Same Store PPS Adj. Same Store 22 Operations
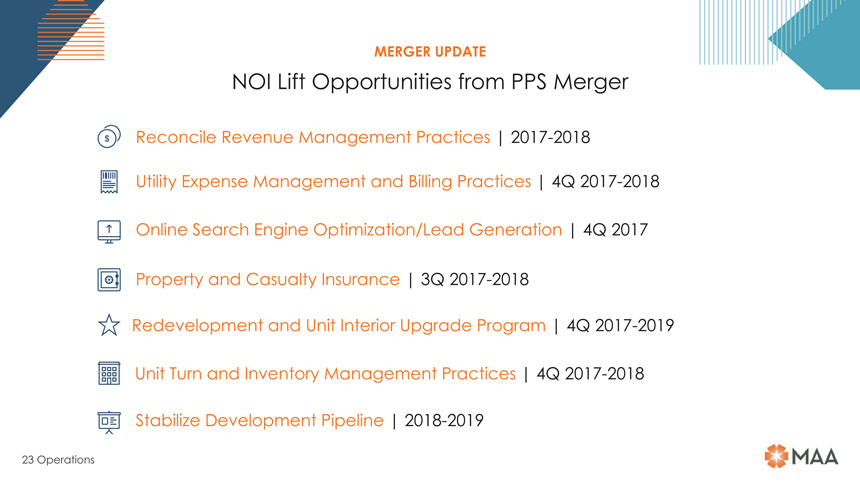
MERGER UPDATE NOI Lift Opportunities from PPS Merger Reconcile Revenue Management Practices | 2017-2018 Utility Expense Management and Billing Practices | 4Q 2017-2018 Online Search Engine Optimization/Lead Generation | 4Q 2017 Property and Casualty Insurance | 3Q 2017-2018 Redevelopment and Unit Interior Upgrade Program | 4Q 2017-2019 Unit Turn and Inventory Management Practices | 4Q 2017-2018 Stabilize Development Pipeline | 2018-2019 23 Operations
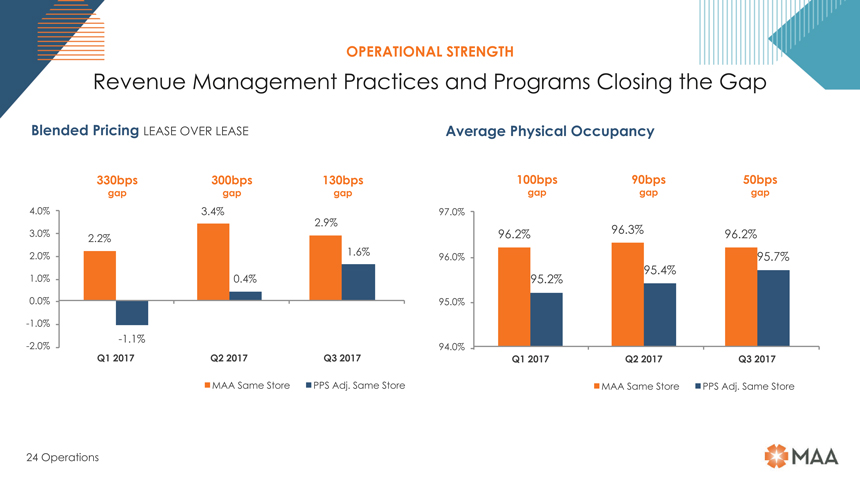
OPERATIONAL STRENGTH Revenue Management Practices and Programs Closing the Gap Blended Pricing LEASE OVER LEASE Average Physical Occupancy 330bps 300bps 130bps 100bps 90bps 50bps gap gap gap gap gap gap 4.0% 3.4% 97.0% 2.9% 96.3% 3.0% 2.2% 96.2% 96.2% 2.0% 1.6% 96.0% 95.7% 1.0% 0.4% 95.2% 95.4% 0.0% 95.0%-1.0% -1.1% -2.0% 94.0% Q1 2017 Q2 2017 Q3 2017 Q1 2017 Q2 2017 Q3 2017 MAA Same Store PPS Adj. Same Store MAA Same Store PPS Adj. Same Store 24 Operations
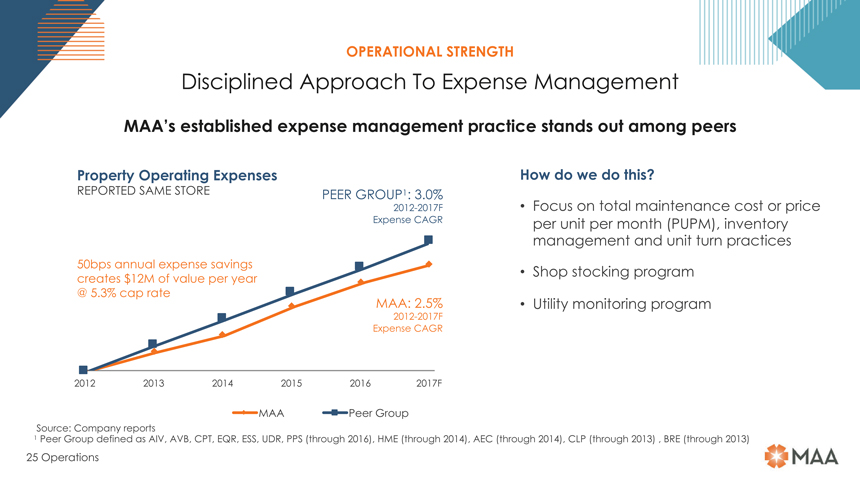
OPERATIONAL STRENGTH Disciplined Approach To Expense Management MAA’s established expense management practice stands out among peers Property Operating Expenses How do we do this REPORTED SAME STORE PEER GROUP1: 3.0% 2012-2017F Focus on total maintenance cost or price Expense CAGR per unit per month (PUPM), inventory management and unit turn practices 50bps annual expense savings Shop stocking program creates $12M of value per year @ 5.3% cap rate MAA: 2.5% Utility monitoring program 2012-2017F Expense CAGR 2012 2013 2014 2015 2016 2017F MAA Peer Group Source: Company reports 1 Peer Group defined as AIV, AVB, CPT, EQR, ESS, UDR, PPS (through 2016), HME (through 2014), AEC (through 2014), CLP (through 2013) , BRE (through 2013) 25 Operations
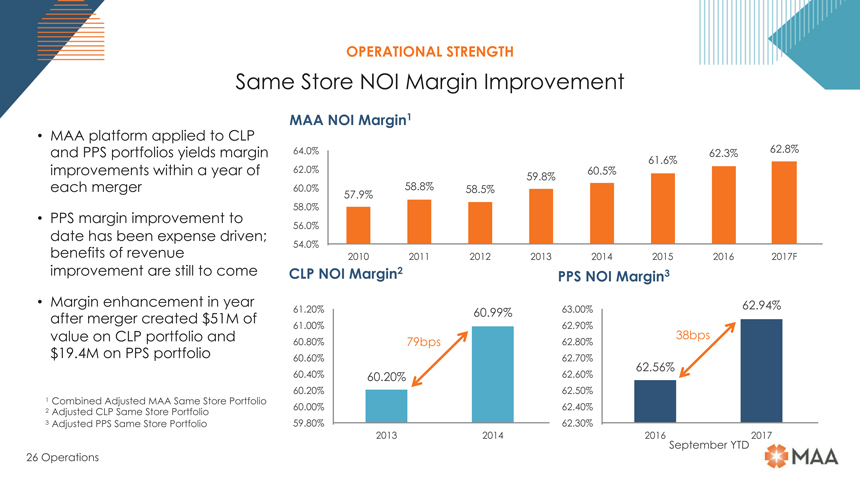
OPERATIONAL STRENGTH Same Store NOI Margin Improvement MAA NOI Margin1 MAA platform applied to CLP and PPS portfolios yields margin 64.0% 62.3% 62.8% 61.6% improvements within a year of 62.0% 59.8% 60.5% each merger 60.0% 57.9% 58.8% 58.5% 58.0% PPS margin improvement to 56.0% date has been expense driven; 54.0% benefits of revenue 2010 2011 2012 2013 2014 2015 2016 2017F improvement are still to come CLP NOI Margin2 PPS NOI Margin3 Margin enhancement in year 61.20% 60.99% 63.00% 62.94% after merger created $51M of 61.00% 62.90% value on CLP portfolio and 60.80% 79bps 62.80% 38bps $19.4M on PPS portfolio 60.60% 62.70% 62.56% 60.40% 60.20% 62.60% 60.20% 62.50% 1 Combined Adjusted MAA Same Store Portfolio 2 Adjusted CLP Same Store Portfolio 60.00% 62.40% 3 Adjusted PPS Same Store Portfolio 59.80% 62.30% 2013 2014 2016 2017 September YTD 26 Operations

DEVELOPMENT Disciplined Approach DAVID WARD Execution Capability EVP, Development Current Pipeline and Future Opportunity
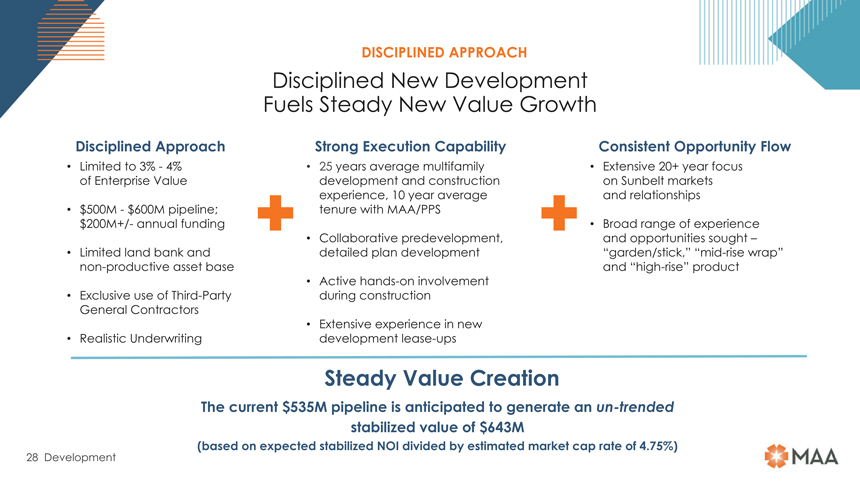
DISCIPLINED APPROACH Disciplined New Development Fuels Steady New Value Growth Disciplined Approach Strong Execution Capability Consistent Opportunity Flow Limited to 3%—4% 25 years average multifamily Extensive 20+ year focus of Enterprise Value development and construction on Sunbelt markets experience, 10 year average and relationships $ 500M—$600M pipeline; tenure with MAA/PPS $ 200M+/- annual funding Broad range of experience Collaborative predevelopment, and opportunities sought – Limited land bank and detailed plan development “garden/stick,”“mid-rise wrap”non-productive asset base and “high-rise” product Activehands-on involvement Exclusive use of Third-Party during construction General Contractors Extensive experience in new Realistic Underwriting developmentlease-ups Steady Value Creation The current $535M pipeline is anticipated to generate anun-trended stabilized value of $643M (based on expected stabilized NOI divided by estimated market cap rate of 4.75%) 28 Development
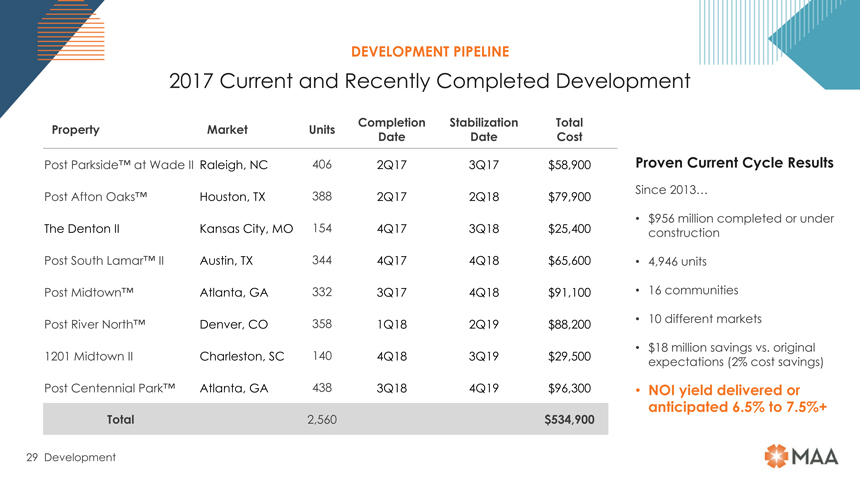
DEVELOPMENT PIPELINE 2017 Current and Recently Completed Development Property Market Units Completion Stabilization Total Date Date Cost Post Parkside™ at Wade II Raleigh, NC 406 2Q17 3Q17 $58,900 Proven Current Cycle Results Post Afton Oaks™ Houston, TX 388 2Q17 2Q18 $79,900 Since 2013… $956 million completed or under The Denton II Kansas City, MO 154 4Q17 3Q18 $25,400 construction Post South Lamar™ II Austin, TX 344 4Q17 4Q18 $65,600 4,946 units Post Midtown™ Atlanta, GA 332 3Q17 4Q18 $91,100 16 communities Post River North™ Denver, CO 358 1Q18 2Q19 $88,200 10 different markets $18 million savings vs. original 1201 Midtown II Charleston, SC 140 4Q18 3Q19 $29,500 expectations (2% cost savings) Post Centennial Park™ Atlanta, GA 438 3Q18 4Q19 $96,300 NOI yield delivered or anticipated 6.5% to 7.5%+ Total 2,560 $534,900 29 Development
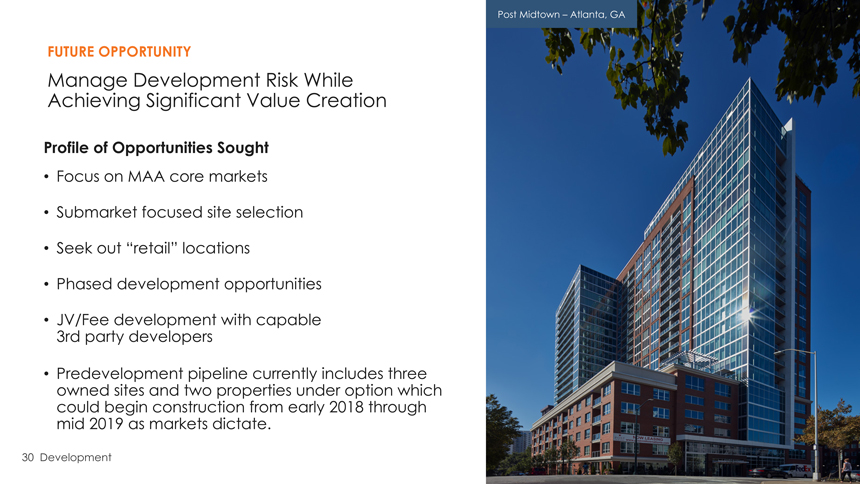
Post Midtown – Atlanta, GA FUTURE OPPORTUNITY Manage Development Risk While Achieving Significant Value Creation Profile of Opportunities Sought Focus on MAA core markets Submarket focused site selection Seek out “retail” locations Phased development opportunities JV/Fee development with capable 3rd party developers Predevelopment pipeline currently includes three owned sites and two properties under option which could begin construction from early 2018 through mid 2019 as markets dictate. 30 Development

Post Centennial Park Atlanta, GA DEVELOPMENT PROJECTS Post River North Post South Lamar II Denver, CO Austin, TX Cherry Creek Concept Denver, CO 31 Development
TRANSACTIONS Transaction Performance How We Execute BRAD HILL Case Studies EVP, Director of Multifamily Investing Future Outlook
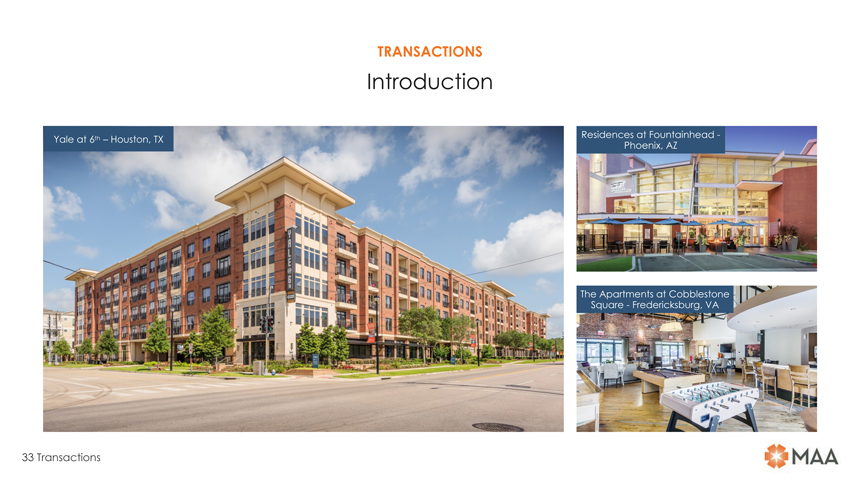
TRANSACTIONS Introduction Yale at 6th – Houston, TX Residences at Fountainhead— Phoenix, AZ The Apartments at Cobblestone Square—Fredericksburg, VA 33 Transactions
TRANSACTIONS Effective Buyer and Seller Since 2012: Sold just under 17k units in mostlyone-off full retail priced transactions, totaling $1.1B Achieved an average IRR of 15.1% on dispositions Redeployed the capital into just under 10k units, totaling $1.6B in acquisitions Significant Value Creation $1.27B of acquisitions have been stabilized > 1 year and have resulted in $239M in value creation 1 1 Asset value reflects trailing12-month actual NOI, 3% management fee, and $350/unit capital reserves capped using estimated market capitalization rates. Value creation equals asset value minus the purchase price. 34 Transactions
TRANSACTIONS How We Execute Significant scale and focus in region 1 Greater Market Share Extensive industry relationships High deal flow Quick execution with 20/10 close All cash – no finance contingency 2 Proven Execution Capabilities Ability to undertake complex deals Flexible deal structure No limit to deal size Broad submarket interest = high deal flow 3 Diversified Market Focus Region with high merchant builder focus = high deal flow 4 Disciplined Underwriting Provides stability Ensures we are not overpaying 35 Transactions
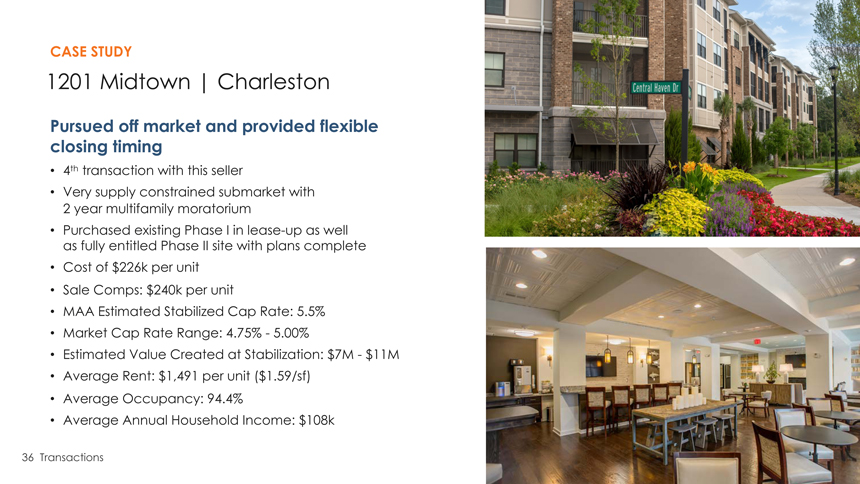
CASE STUDY 1201 Midtown | Charleston Pursued off market and provided flexible closing timing 4th transaction with this seller Very supply constrained submarket with 2 year multifamily moratorium Purchased existing Phase I inlease-up as well as fully entitled Phase II site with plans complete Cost of $226k per unit Sale Comps: $240k per unit MAA Estimated Stabilized Cap Rate: 5.5% Market Cap Rate Range: 4.75%—5.00% Estimated Value Created at Stabilization: $7M—$11M Average Rent: $1,491 per unit ($1.59/sf) Average Occupancy: 94.4% Average Annual Household Income: $108k 36 Transactions
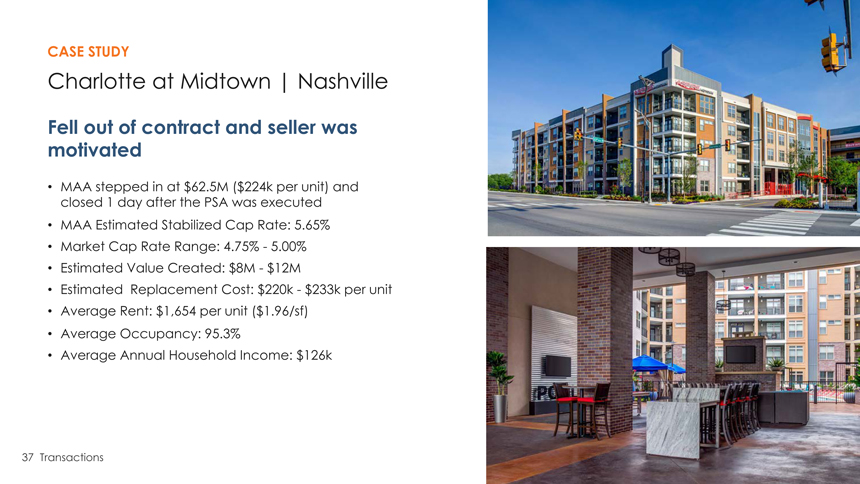
CASE STUDY Charlotte at Midtown | Nashville Fell out of contract and seller was motivated MAA stepped in at $62.5M ($224k per unit) and closed 1 day after the PSA was executed MAA Estimated Stabilized Cap Rate: 5.65% Market Cap Rate Range: 4.75%—5.00% Estimated Value Created: $8M—$12M Estimated Replacement Cost: $220k—$233k per unit Average Rent: $1,654 per unit ($1.96/sf) Average Occupancy: 95.3% Average Annual Household Income: $126k 37 Transactions
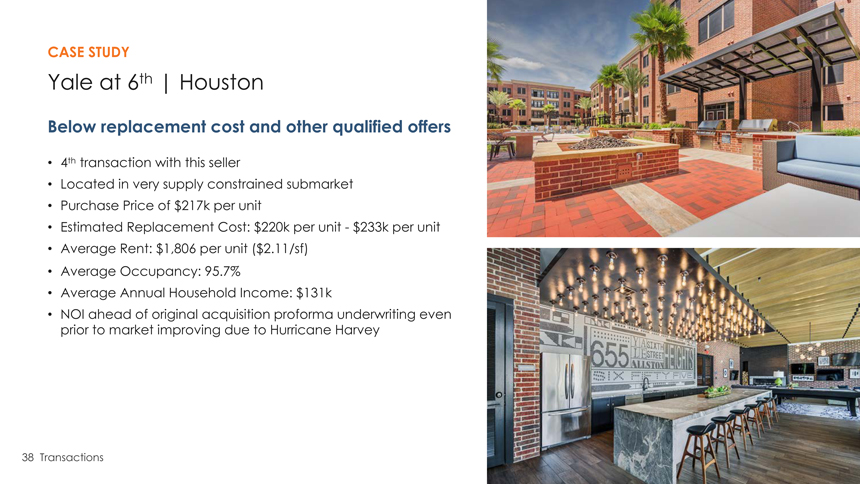
CASE STUDY Yale at 6th | Houston Below replacement cost and other qualified offers 4th transaction with this seller Located in very supply constrained submarket Purchase Price of $217k per unit Estimated Replacement Cost: $220k per unit—$233k per unit Average Rent: $1,806 per unit ($2.11/sf) Average Occupancy: 95.7% Average Annual Household Income: $131k NOI ahead of original acquisition proforma underwriting even prior to market improving due to Hurricane Harvey 38 Transactions
TRANSACTIONS Future Outlook Elevated level of supply should lead to growing acquisition opportunities. Focus onpre-stabilized opportunities that have less competition due to lower loan proceeds available for leveraged buyers.Pre-stabilized opportunities should increase as absorption is likely to slow, causing some sellers to want/need to exit early. Continue to diversify by market, submarket, product type, and price point. Focus on steadily enhancing portfolio AFFO growth rates, operating margins and operational efficiency through disciplined growth and capital recycling on a match funded basis. 39 Transactions

BUILDING STRENGTH Q&A 40

THANK YOU Investor Day November 13, 2017

BUILDING STRENGTH PROPERTY TOURS Post Katy Trail Post Uptown Village 42
REVENUE Platform MANAGEMENT LRO® WARREN DAVIS Performance vs Market SVP, Director of Revenue Management PPS Opportunity
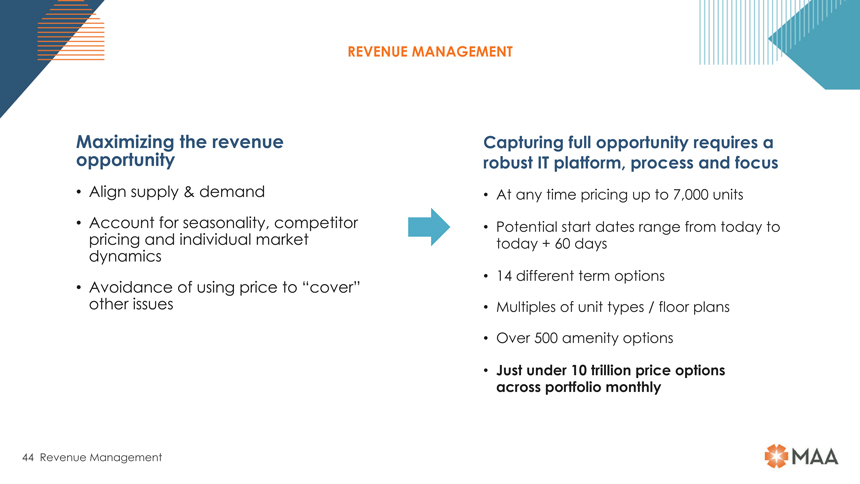
REVENUE MANAGEMENT Maximizing the revenue Capturing full opportunity requires a opportunity robust IT platform, process and focus Align supply & demand At any time pricing up to 7,000 units Account for seasonality, competitor Potential start dates range from today to pricing and individual market today + 60 days dynamics 14 different term options Avoidance of using price to “cover” other issues Multiples of unit types / floor plans Over 500 amenity options Just under 10 trillion price options across portfolio monthly 44 Revenue Management
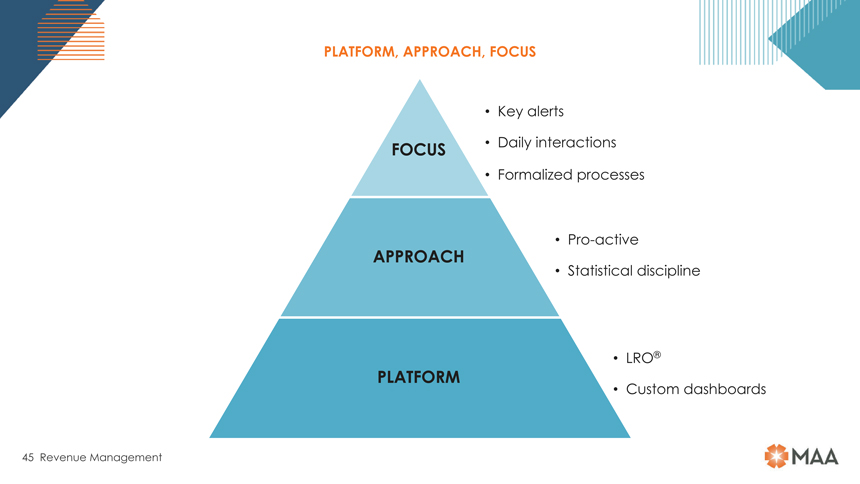
PLATFORM, APPROACH, FOCUS Key alerts FOCUS Daily interactions Formalizedprocesses Pro-active APPROACH Statistical discipline LRO® PLATFORM Custom dashboards 45 Revenue Management
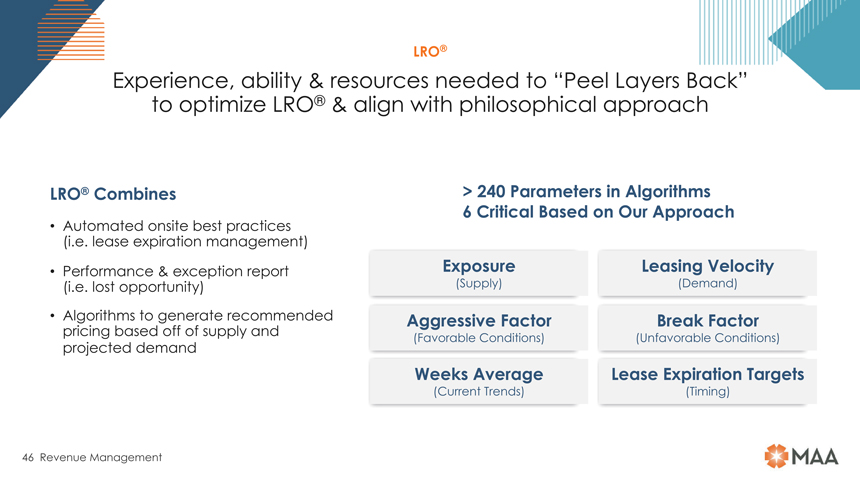
LRO® Experience, ability & resources needed to “Peel Layers Back” to optimize LRO® & align with philosophical approach LRO® Combines > 240 Parameters in Algorithms 6 Critical Based on Our Approach Automated onsite best practices (i.e. lease expiration management) Performance & exception report Exposure Leasing Velocity (i.e. lost opportunity) (Supply) (Demand) Algorithms to generate recommended Aggressive Factor Break Factor pricing based off of supply and (Favorable Conditions) (Unfavorable Conditions) projected demand Weeks Average Lease Expiration Targets (Current Trends) (Timing) 46 Revenue Management
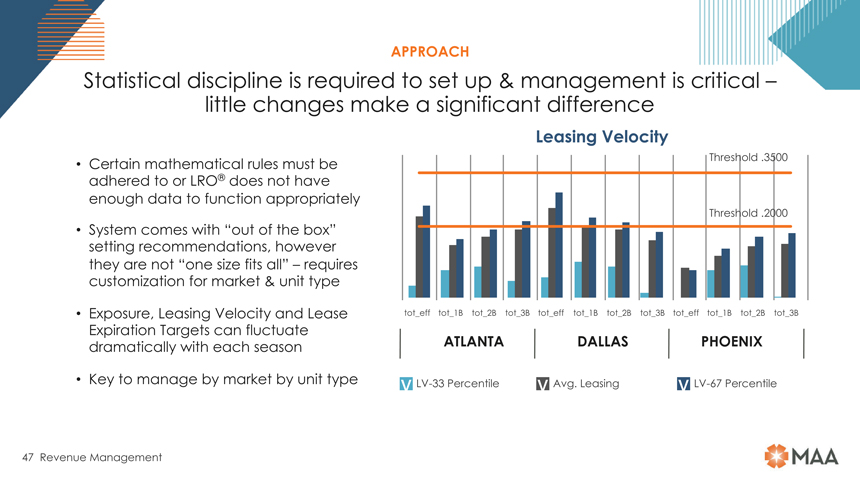
APPROACH Statistical discipline is required to set up & management is critical – little changes make a significant difference Leasing Velocity Certain mathematical rules must be Threshold .3500 adhered to or LRO® does not have enough data to function appropriately Threshold .2000 System comes with “out of the box” setting recommendations, however they are not “one size fits all” – requires customization for market & unit type Exposure, Leasing Velocity and Lease tot_eff tot_1B tot_2B tot_3B tot_eff tot_1B tot_2B tot_3B tot_eff tot_1B tot_2B tot_3B Expiration Targets can fluctuate dramatically with each season ATLANTA DALLAS PHOENIX Key to manage by market by unit type vLV-33 Percentile v Avg. Leasing vLV-67 Percentile 47 Revenue Management
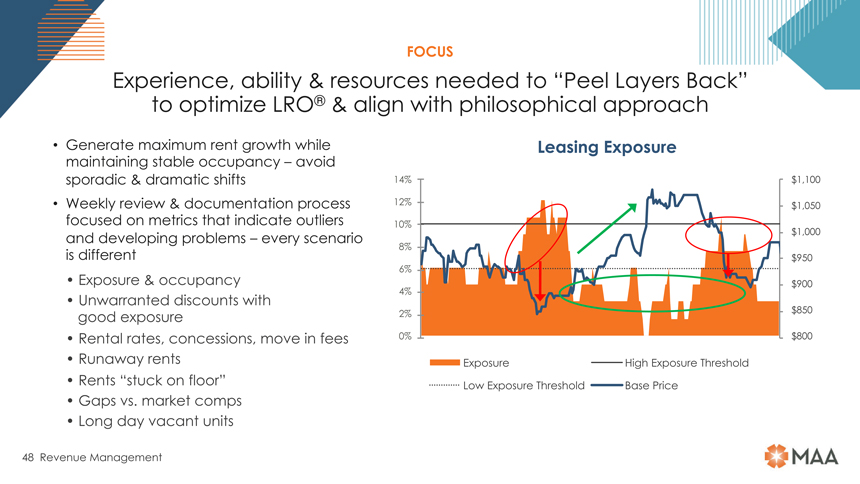
FOCUS Experience, ability & resources needed to “Peel Layers Back” to optimize LRO® & align with philosophical approach Generate maximum rent growth while Leasing Exposure maintaining stable occupancy – avoid sporadic & dramatic shifts 14% $ 1,100 Weekly review & documentation process 12% $ 1,050 focused on metrics that indicate outliers 10% and developing problems – every scenario $ 1,000 8% is different $ 950 6% Exposure & occupancy $ 900 Unwarranted discounts with 4% good exposure 2% $ 850 Rental rates, concessions, move in fees 0% $ 800 Runaway rents Exposure High Exposure Threshold Rents “stuck on floor” Low Exposure Threshold Base Price Gaps vs. market comps Long day vacant units 48 Revenue Management
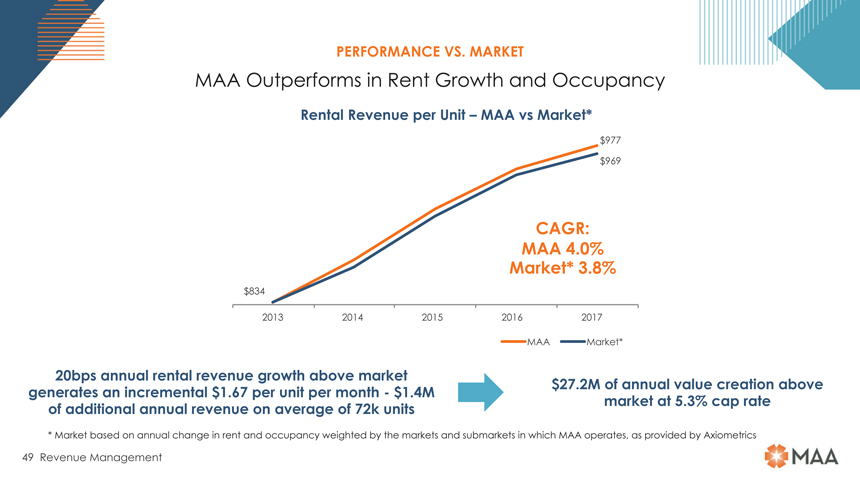
PERFORMANCE VS. MARKET MAA Outperforms in Rent Growth and Occupancy Rental Revenue per Unit – MAA vs Market* $977 $969 CAGR: MAA 4.0% Market* 3.8% $834 2013 2014 2015 2016 2017 MAA Market* 20bps annual rental revenue growth above market generates an incremental $1.67 per unit per month—$1.4M $27.2M of annual value creation above of additional annual revenue on average of 72k units market at 5.3% cap rate * Market based on annual change in rent and occupancy weighted by the markets and submarkets in which MAA operates, as provided by Axiometrics 49 Revenue Management
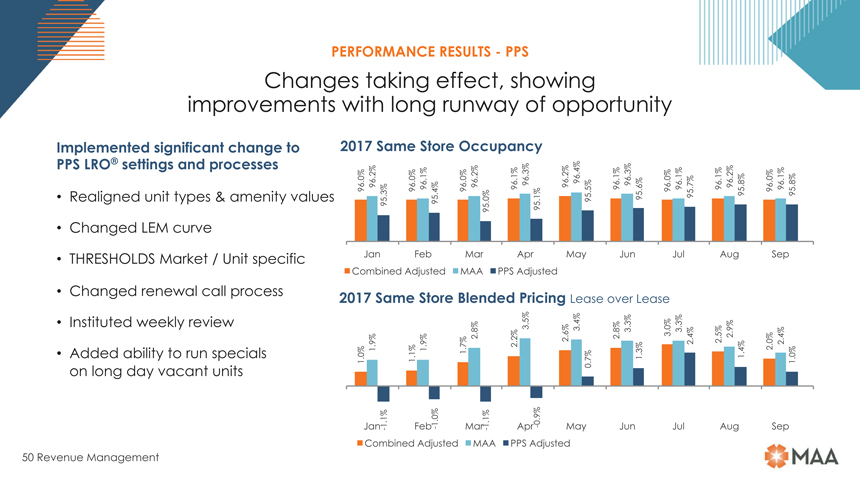
PERFORMANCE RESULTS—PPS Changes taking effect, showing improvements with long runway of opportunity Implemented significant change to 2017 Same Store Occupancy PPS LRO® settings and processes 96.0% 96.2% 96.0% 96.1% 96.0% 96.2% 96.1% 96.3% 96.2% 96.4% 96.1% 96.3% 96.0% 96.1% 96.1% 96.2% 96.0% 96.1% Realigned unit types & amenity values 95.3% 95.4% 95.0% 95.1% 95.5% 95.6% 95.7% 95.8% 95.8% Changed LEM curve THRESHOLDS Market / Unit specific Jan Feb Mar Apr May Jun Jul Aug Sep Combined Adjusted MAA PPS Adjusted Changed renewal call process 2017 Same Store Blended Pricing Lease over Lease Instituted weekly review 2.8% 2.2% 3.5% 2.6% 3.4% 2.8% 3.3% 3.0% 3.3% 2.5% 2.9% Added ability to run specials 1.0% 1.9% 1.1% 1.9% 1.7% 0.7% 1.3% 2.4% 1.4% 2.0% 2.4% 1.0% on long day vacant units 1.1% 1.0%1.1%—0.9% Jan-Feb- Mar—Apr May Jun Jul Aug Sep Combined Adjusted MAA PPS Adjusted 50 Revenue Management

MARKETING Paid and Organic Search Anna Harris Social Media Strategy SVP, Director of Marketing Online Reputation Management
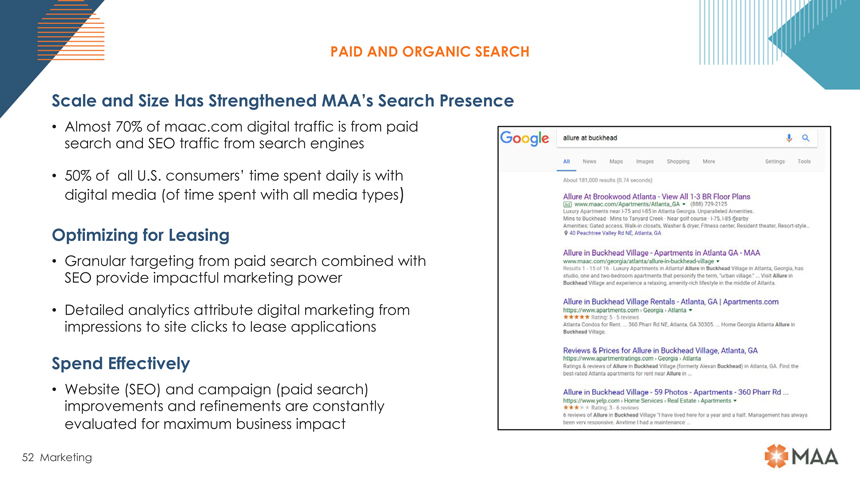
PAID AND ORGANIC SEARCH Scale and Size Has Strengthened MAA’s Search Presence Almost 70% of maac.com digital traffic is from paid search and SEO traffic from search engines 50% of all U.S. consumers’ time spent daily is with digital media (of time spent with all media types) Optimizing for Leasing Granular targeting from paid search combined with SEO provide impactful marketing power Detailed analytics attribute digital marketing from impressions to site clicks to lease applications Spend Effectively Website (SEO) and campaign (paid search) improvements and refinements are constantly evaluated for maximum business impact 52 Marketing

PAID AND ORGANIC SEARCH MAA Strategy—Driven by Business Goals, Award-Winning People &Best-in-Class Tools Strategic ApproachBest-in-Class Tools INTELLIGENCE ENGAGEMENT Kenshoo paid media & bid management platform SEMrush cross-channel research & competitive insights Business Challenge Specialist Approach Consumer Insight Ecosystem Brightedge SEO & content performance marketing platform Strategy Data Plan Activation Activate & Learn Proprietary iReport, iActivate Guidelines management & analysis tools 53 Marketing

SOCIAL MEDIA STRATEGY Leverage Social Media for Insights, Planning and Engagement Amplify awareness of brand-owned social media content Drive targeted traffic to brand-owned web properties within priority markets Foster content discovery to drive social media engagement (by way of monthly content calendars) Real time tracking of analytics to measure impact of social media in fan growth, site traffic and leasing by source ATTRACT ENGAGE RETARGET CONVERT 54 Marketing

SOCIAL MEDIA STRATEGY Leverage Social Media for Insights, Planning and Engagement MAA’s customized measurement approach takes a holistic approach that integrates organic and paid metrics and performance into one comprehensive view. Our goal is to leverage the data to improve campaign performance and inform strategic marketing decision making. Impressions Sentiment Share of Voice Social Channel Engagement Website Traffic Internal DataBest-in-Class Analytics Tools Process & Cadence for Analysis Current/Recent Performance Against Key Success Metrics Ongoing and Campaign-Specific Internal and Competitive Leasing Metrics Market Share Marketing ROI 55 Marketing
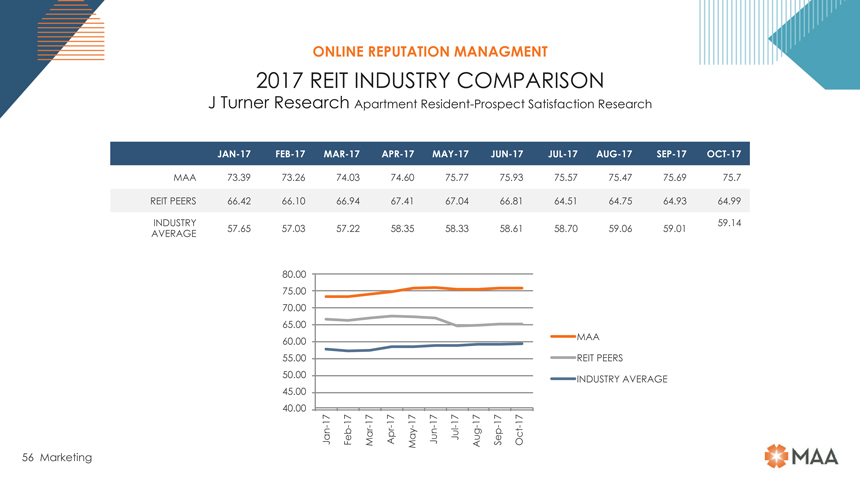
\ONLINE REPUTATION MANAGMENT 2017 REIT INDUSTRY COMPARISON J Turner Research Apartment Resident-Prospect SatisfactionResearch JAN-17FEB-17MAR-17APR-17MAY-17JUN-17JUL-17AUG-17SEP-17OCT-17 MAA 73.39 73.26 74.03 74.60 75.77 75.93 75.57 75.47 75.69 75.7 REIT PEERS 66.42 66.10 66.94 67.41 67.04 66.81 64.51 64.75 64.93 64.99 INDUSTRY 59.14 AVERAGE 57.65 57.03 57.22 58.35 58.33 58.61 58.70 59.06 59.01 80.00 75.00 70.00 65.00 60.00 MAA 55.00 REIT PEERS 50.00 INDUSTRY AVERAGE 45.00 40.00 17 17 17 17 17 17 17 17 17 17 — — — — — Jan Feb Mar Apr May Jun Jul Aug Sep Oct 56 Marketing

REDEVELOPMENT Unit Interior Redevelopment Strategy PPS Merger Opportunity MICHAEL HALBROOK Redevelopment Pipeline SVP, Director of Redevelopment Exterior Redevelopment
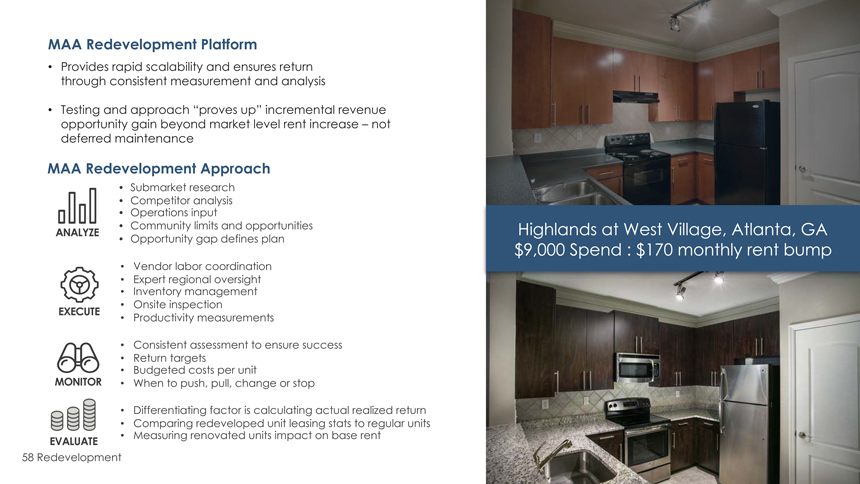
MAA Redevelopment Platform Provides rapid scalability and ensures return through consistent measurement and analysis Testing and approach “proves up” incremental revenue opportunity gain beyond market level rent increase – not deferred maintenance MAA Redevelopment Approach Submarket research Competitor analysis Operations input Community limits and opportunities ANALYZE Opportunity gap defines plan Vendor labor coordination Expert regional oversight Inventory management Onsite inspection EXECUTE Productivity measurements Consistent assessment to ensure success Return targets Budgeted costs per unit MONITOR When to push, pull, change or stop Differentiating factor is calculating actual realized return Comparing redeveloped unit leasing stats to regular units EVALUATE Measuring renovated units impact on base rent 58 Redevelopment Highlands at West Village, Atlanta, GA $9,000 Spend : $170 monthly rent bump
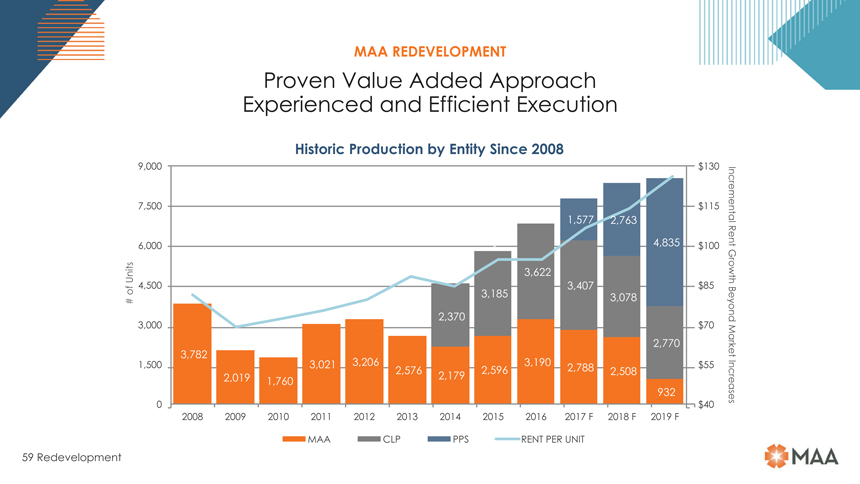
MAA REDEVELOPMENT Proven Value Added Approach Experienced and Efficient Execution Historic Production by Entity Since 2008 9,000 $130 7,500 $115—1,577 2,763 Incremental 6,000—4,835 $100 Rent 3,622 Units -Growth 4,500 3,407 $85 of 3,185 3,078 # — 2,370 Beyond 3,000 — $70 —2,770 3,782—Market 1,500 3,021 3,206 3,190 $55 2,576 2,596 2,788 2,508 2,019 2,179 1,760 932 Increases 0 $40 2008 2009 2010 2011 2012 2013 2014 2015 2016 2017 F 2018 F 2019 F MAA CLP PPS RENT PER UNIT 59 Redevelopment
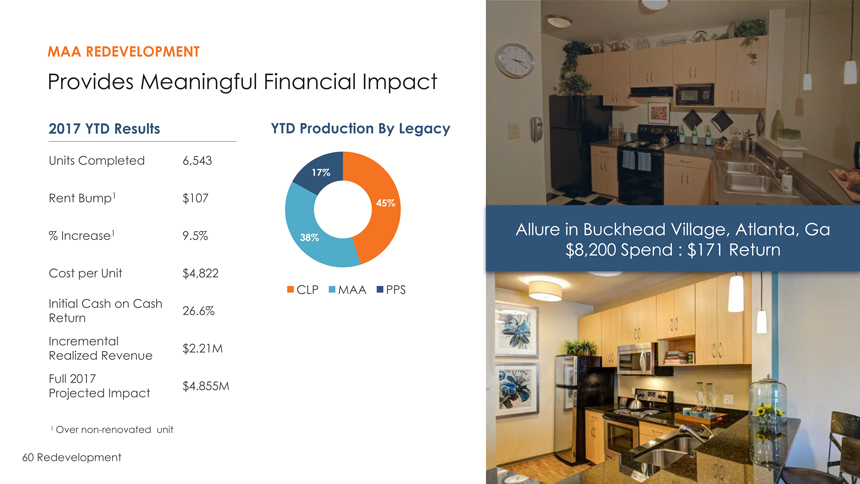
MAA REDEVELOPMENT Provides Meaningful Financial Impact 2017 YTD Results YTD Production By Legacy Units Completed 6,543 17% Rent Bump1 $107 45% % Increase1 9.5% 38% Allure in Buckhead Village, Atlanta, Ga $8,200 Spend : $171 Return Cost per Unit $4,822 CLP MAA PPS Initial Cash on Cash 26.6% Return Incremental $2.21M Realized Revenue Full 2017 $4.855M Projected Impact 1 Overnon-renovated unit 60 Redevelopment
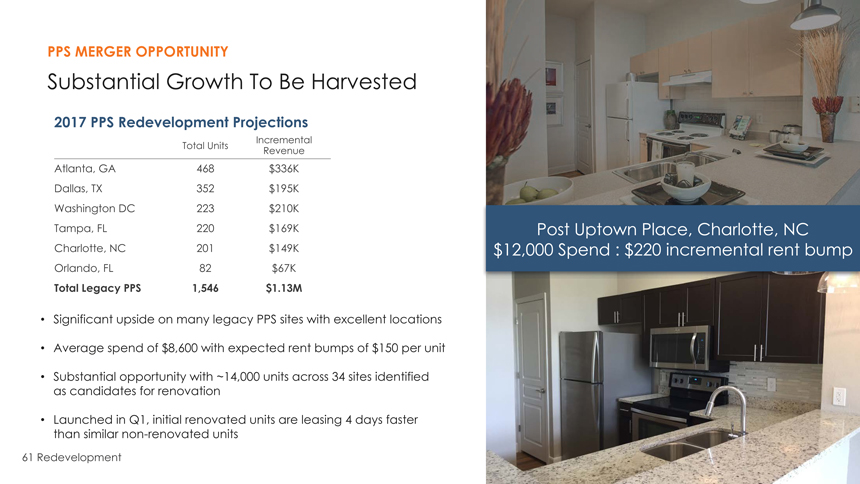
PPS MERGER OPPORTUNITY Substantial Growth To Be Harvested 2017 PPS Redevelopment Projections Incremental Total Units Revenue Atlanta, GA 468 $336K Dallas, TX 352 $195K Washington DC 223 $210K Tampa, FL 220 $169K Post Uptown Place, Charlotte, NC Charlotte, NC 201 $149K $12,000 Spend : $220 incremental rent bump Orlando, FL 82 $67K Total Legacy PPS 1,546 $1.13M Significant upside on many legacy PPS sites with excellent locations Average spend of $8,600 with expected rent bumps of $150 per unit Substantial opportunity with ~14,000 units across 34 sites identified as candidates for renovation Launched in Q1, initial renovated units are leasing 4 days faster than similarnon-renovated units 61 Redevelopment
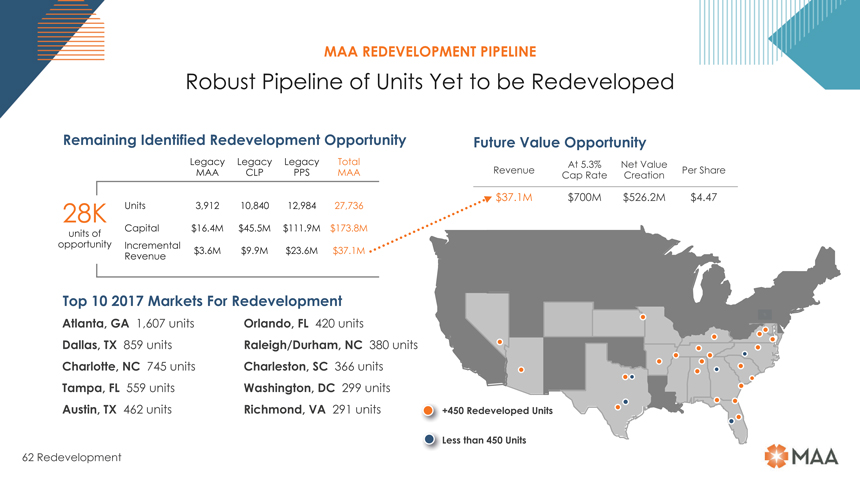
MAA REDEVELOPMENT PIPELINE Robust Pipeline of Units Yet to be Redeveloped Remaining Identified Redevelopment Opportunity Future Value Opportunity Legacy Legacy Legacy Total At 5.3% Net Value MAA CLP PPS MAA Revenue Per Share Cap Rate Creation $37.1M $700M $526.2M $4.47 28K Units 3,912 10,840 12,984 27,736 Capital $16.4M $45.5M $111.9M $173.8M units of opportunity Incremental $3.6M $9.9M $23.6M $37.1M Revenue Top 10 2017 Markets For Redevelopment Atlanta, GA 1,607 units Orlando, FL 420 units Dallas, TX 859 units Raleigh/Durham, NC 380 units Charlotte, NC 745 units Charleston, SC 366 units Tampa, FL 559 units Washington, DC 299 units Austin, TX 462 units Richmond, VA 291 units +450 Redeveloped Units Less than 450 Units 62 Redevelopment
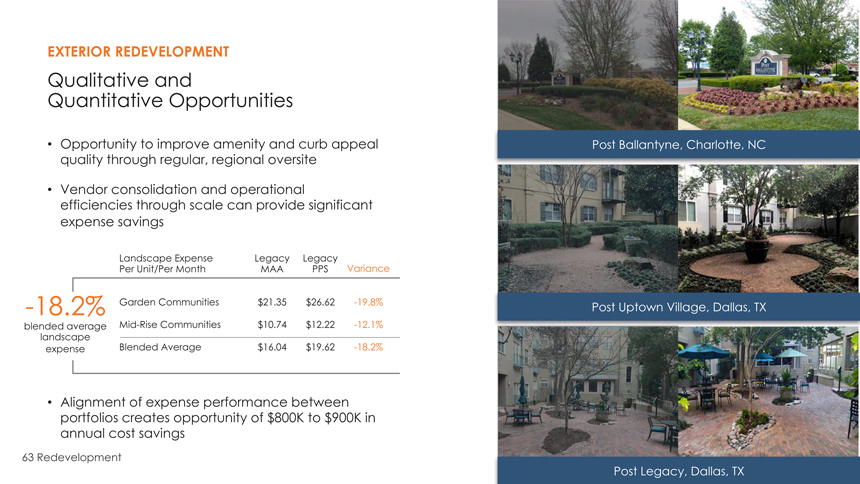
EXTERIOR REDEVELOPMENT Qualitative and Quantitative Opportunities Opportunity to improve amenity and curb appeal Post Ballantyne, Charlotte, NC quality through regular, regional oversite Vendor consolidation and operational efficiencies through scale can provide significant expense savings Landscape Expense Legacy Legacy Per Unit/Per Month MAA PPS Variance-18.2% Garden Communities $ 21.35 $26.62-19.8% Post Uptown Village, Dallas, TX blended averageMid-Rise Communities $ 10.74 $12.22-12.1% landscape expense Blended Average $ 16.04 $19.62-18.2% Alignment of expense performance between portfolios creates opportunity of $ 800K to $900K in annual cost savings 63 Redevelopment Post Legacy, Dallas, TX
APPENDIX Reconciliation ofNon-GAAP Financial Measures Definitions ofNon-GAAP Financial Measures
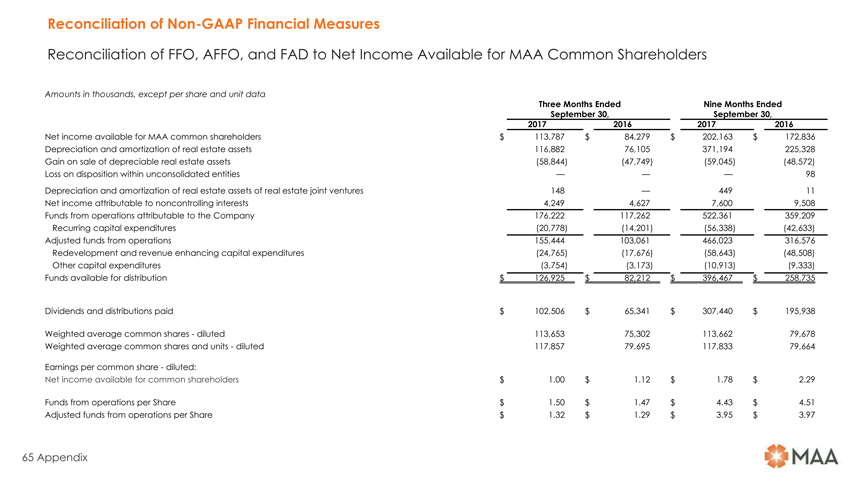
Reconciliation ofNon-GAAP Financial Measures Reconciliation of FFO, AFFO, and FAD to Net Income Available for MAA Common Shareholders Amounts in thousands, except per share and unit data Three Months Ended Nine Months Ended September 30, September 30, 2017 2016 2017 2016 Net income available for MAA common shareholders $ 113,787 $ 84,279 $ 202,163 $ 172,836 Depreciation and amortization of real estate assets 116,882 76,105 371,194 225,328 Gain on sale of depreciable real estate assets (58,844) (47,749) (59,045) (48,572) Loss on disposition within unconsolidated entities — — — 98 Depreciation and amortization of real estate assets of real estate joint ventures 148 — 449 11 Net income attributable to noncontrolling interests 4,249 4,627 7,600 9,508 Funds from operations attributable to the Company 176,222 117,262 522,361 359,209 Recurring capital expenditures (20,778) (14,201) (56,338) (42,633) Adjusted funds from operations 155,444 103,061 466,023 316,576 Redevelopment and revenue enhancing capital expenditures (24,765) (17,676) (58,643) (48,508) Other capital expenditures (3,754) (3,173) (10,913) (9,333) Funds available for distribution $ 126,925 $ 82,212 $ 396,467 $ 258,735 Dividends and distributions paid $ 102,506 $ 65,341 $ 307,440 $ 195,938 Weighted average common shares—diluted 113,653 75,302 113,662 79,678 Weighted average common shares and units—diluted 117,857 79,695 117,833 79,664 Earnings per common share—diluted: Net income available for common shareholders $ 1.00 $ 1.12 $ 1.78 $ 2.29 Funds from operations per Share $ 1.50 $ 1.47 $ 4.43 $ 4.51 Adjusted funds from operations per Share $ 1.32 $ 1.29 $ 3.95 $ 3.97 65 Appendix
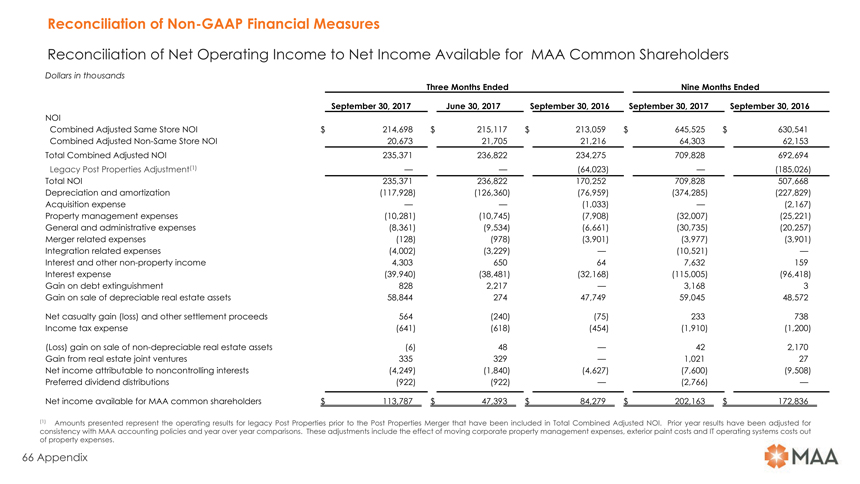
Reconciliation ofNon-GAAP Financial Measures Reconciliation of Net Operating Income to Net Income Available for MAA Common Shareholders Dollars in thousands Three Months Ended Nine Months Ended September 30, 2017 June 30, 2017 September 30, 2016 September 30, 2017 September 30, 2016 NOI Combined Adjusted Same Store NOI $ 214,698 $ 215,117 $ 213,059 $ 645,525 $ 630,541 Combined AdjustedNon-Same Store NOI 20,673 21,705 21,216 64,303 62,153 Total Combined Adjusted NOI 235,371 236,822 234,275 709,828 692,694 Legacy Post Properties Adjustment(1) — — (64,023) — (185,026) Total NOI 235,371 236,822 170,252 709,828 507,668 Depreciation and amortization (117,928) (126,360) (76,959) (374,285) (227,829) Acquisition expense — — (1,033) — (2,167) Property management expenses (10,281) (10,745) (7,908) (32,007) (25,221) General and administrative expenses (8,361) (9,534) (6,661) (30,735) (20,257) Merger related expenses (128) (978) (3,901) (3,977) (3,901) Integration related expenses (4,002) (3,229) — (10,521) — Interest and othernon-property income 4,303 650 64 7,632 159 Interest expense (39,940) (38,481) (32,168) (115,005) (96,418) Gain on debt extinguishment 828 2,217 — 3,168 3 Gain on sale of depreciable real estate assets 58,844 274 47,749 59,045 48,572 Net casualty gain (loss) and other settlement proceeds 564 (240) (75) 233 738 Income tax expense (641) (618) (454) (1,910) (1,200) (Loss) gain on sale ofnon-depreciable real estate assets (6) 48 — 42 2,170 Gain from real estate joint ventures 335 329 — 1,021 27 Net income attributable to noncontrolling interests (4,249) (1,840) (4,627) (7,600) (9,508) Preferred dividend distributions (922) (922) — (2,766) — Net income available for MAA common shareholders $ 113,787 $ 47,393 $ 84,279 $ 202,163 $ 172,836 (1) Amounts presented represent the operating results for legacy Post Properties prior to the Post Properties Merger that have been included in Total Combined Adjusted NOI. Prior year results have been adjusted for consistency with MAA accounting policies and year over year comparisons. These adjustments include the effect of moving corporate property management expenses, exterior paint costs and IT operating systems costs out of property expenses. 66 Appendix
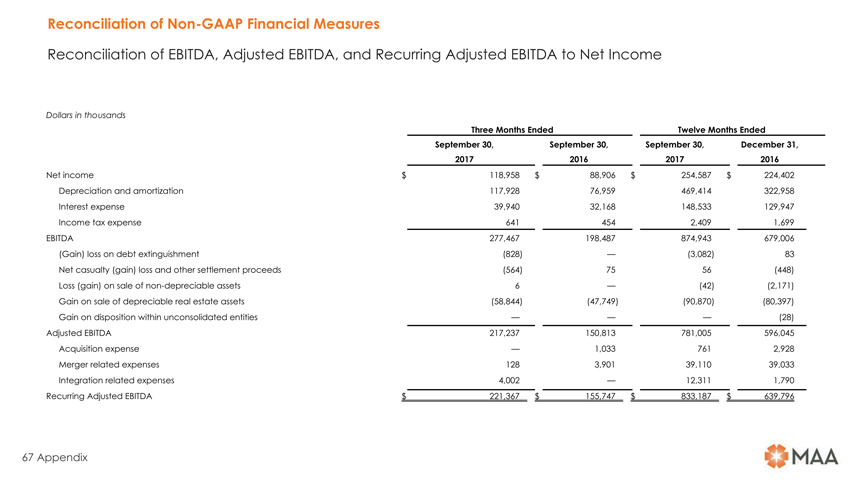
Reconciliation ofNon-GAAP Financial Measures Reconciliation of EBITDA, Adjusted EBITDA, and Recurring Adjusted EBITDA to Net Income Dollars in thousands Three Months Ended Twelve Months Ended September 30, September 30, September 30, December 31, 2017 2016 2017 2016 Net income $ 118,958 $ 88,906 $ 254,587 $ 224,402 Depreciation and amortization 117,928 76,959 469,414 322,958 Interest expense 39,940 32,168 148,533 129,947 Income tax expense 641 454 2,409 1,699 EBITDA 277,467 198,487 874,943 679,006 (Gain) loss on debt extinguishment (828) — (3,082) 83 Net casualty (gain) loss and other settlement proceeds (564) 75 56 (448) Loss (gain) on sale ofnon-depreciable assets 6 — (42) (2,171) Gain on sale of depreciable real estate assets (58,844) (47,749) (90,870) (80,397) Gain on disposition within unconsolidated entities — — — (28) Adjusted EBITDA 217,237 150,813 781,005 596,045 Acquisition expense — 1,033 761 2,928 Merger related expenses 128 3,901 39,110 39,033 Integration related expenses 4,002 — 12,311 1,790 Recurring Adjusted EBITDA $ 221,367 $ 155,747 $ 833,187 $ 639,796 67 Appendix
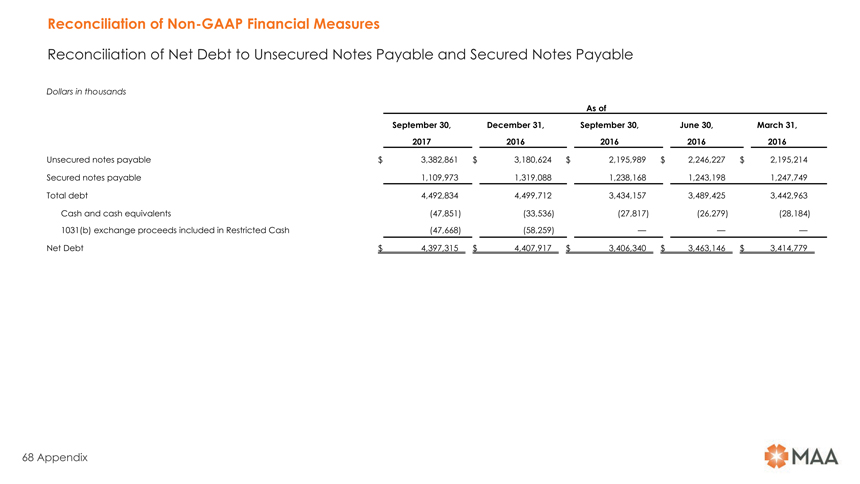
Reconciliation ofNon-GAAP Financial Measures Reconciliation of Net Debt to Unsecured Notes Payable and Secured Notes Payable Dollars in thousands As of September 30, December 31, September 30, June 30, March 31, 2017 2016 2016 2016 2016 Unsecured notes payable $ 3,382,861 $ 3,180,624 $ 2,195,989 $ 2,246,227 $ 2,195,214 Secured notes payable 1,109,973 1,319,088 1,238,168 1,243,198 1,247,749 Total debt 4,492,834 4,499,712 3,434,157 3,489,425 3,442,963 Cash and cash equivalents (47,851) (33,536) (27,817) (26,279) (28,184) 1031(b) exchange proceeds included in Restricted Cash (47,668) (58,259) — — — Net Debt $ 4,397,315 $ 4,407,917 $ 3,406,340 $ 3,463,146 $ 3,414,779 68 Appendix
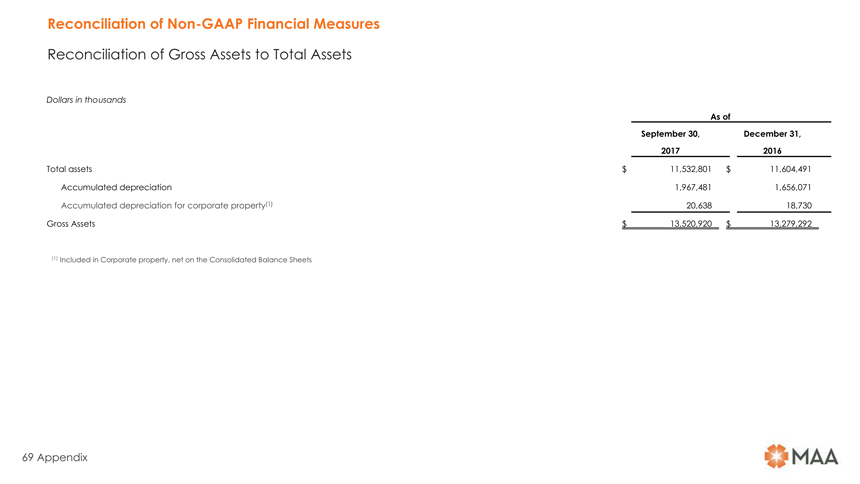
Reconciliation ofNon-GAAP Financial Measures Reconciliation of Gross Assets to Total Assets Dollars in thousands As of September 30, December 31, 2017 2016 Total assets $ 11,532,801 $ 11,604,491 Accumulated depreciation 1,967,481 1,656,071 Accumulated depreciation for corporate property(1) 20,638 18,730 Gross Assets $ 13,520,920 $ 13,279,292 (1) Included in Corporate property, net on the Consolidated Balance Sheets 69 Appendix
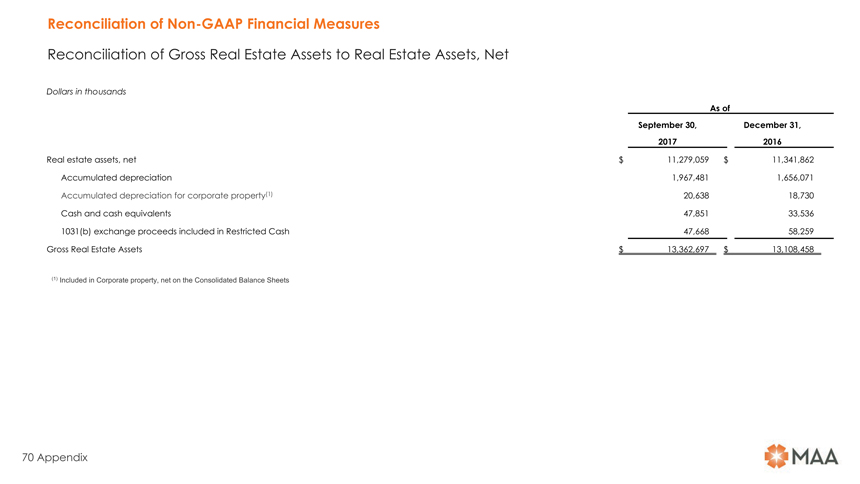
Reconciliation ofNon-GAAP Financial Measures Reconciliation of Gross Real Estate Assets to Real Estate Assets, Net Dollars in thousands As of September 30, December 31, 2017 2016 Real estate assets, net $ 11,279,059 $ 11,341,862 Accumulated depreciation 1,967,481 1,656,071 Accumulated depreciation for corporate property(1) 20,638 18,730 Cash and cash equivalents 47,851 33,536 1031(b) exchange proceeds included in Restricted Cash 47,668 58,259 Gross Real Estate Assets $ 13,362,697 $ 13,108,458 (1) Included in Corporate property, net on the Consolidated Balance Sheets 70 Appendix
Definitions ofNon-GAAP Financial Measures Adjusted EBITDA For purposes of calculations in this release, Adjusted Earnings Before Interest, Income Taxes, Depreciation and Amortization, or Adjusted EBITDA, is composed of EBITDA adjusted for net gain or loss on asset sales and insurance and other settlement proceeds, and gain or loss on debt extinguishment. As an owner and operator of real estate, MAA considers Adjusted EBITDA to be an important measure of performance from core operations because Adjusted EBITDA does not include various income and expense items that are not indicative of operating performance. Adjusted EBITDA should not be considered as an alternative to Net income available for MAA common shareholders as an indicator of financial performance. MAA’s computation of Adjusted EBITDA may differ from the methodology utilized by other companies to calculate Adjusted EBITDA. Adjusted Funds From Operations (AFFO) AFFO is composed of FFO less recurring capital expenditures. AFFO should not be considered as an alternative to Net income available for MAA common shareholders. As an owner and operator of real estate, MAA considers AFFO to be an important measure of performance from operations because AFFO measures the ability to control revenues, expenses and recurring capital expenditures. Combined Adjusted Same Store NOI Combined Adjusted Same Store NOI represents total operating revenues less total property operating expenses, excluding depreciation, for all properties classified within the Combined Adjusted Same Store Portfolio during the period. Combined Adjusted Same Store NOI should not be considered as an alternative to Net income available for MAA common shareholders. MAA believes Combined Adjusted Same Store NOI is a helpful tool in evaluating the operating performance within MAA’s markets because it measures the core operations of property performance by excluding corporate level expenses and other items not related to property operating performance. 71 Appendix
Definitions ofNon-GAAP Financial Measures EBITDA For purposes of calculations in this release, Earnings Before Interest, Income Taxes, Depreciation and Amortization, or EBITDA, is composed of net income plus depreciation and amortization, interest expense, and income taxes. As an owner and operator of real estate, MAA considers EBITDA to be an important measure of performance from core operations because EBITDA does not include various expense items that are not indicative of operating performance. EBITDA should not be considered as an alternative to Net income available for MAA common shareholders as an indicator of financial Funds Available for Distribution (FAD) FAD is composed of FFO less total capital expenditures, excluding development spending and property acquisitions. FAD should not be considered as an alternative to Net income available for MAA common shareholders. As an owner and operator of real estate, MAA considers FAD to be an important measure of performance from core operations because FAD measures the ability to control revenues, expenses and total capital expenditures. 72 Appendix
Definitions ofNon-GAAP Financial Measures Funds From Operations (FFO) FFO represents net income available for MAA common shareholders (computed in accordance with U.S. generally accepted accounting principles, or GAAP) excluding extraordinary items, asset impairment, gains or losses on disposition of real estate assets, plus net income attributable to noncontrolling interest, depreciation and amortization of real estate assets, and adjustments for joint ventures to reflect FFO on the same basis. Because noncontrolling interest is added back, FFO, when used in this document, represents FFO attributable to the Company. While MAA’s definition of FFO is in accordance with the National Association of Real Estate Investment Trusts’ definition, it may differ from the methodology for calculating FFO utilized by other REITs and, accordingly, may not be comparable to such other REITs. FFO should not be considered as an alternative to Net income available for MAA common shareholders as an indicator of operating performance. MAA believes that FFO is helpful in understanding operating performance in that FFO excludes depreciation and amortization of real estate assets. MAA believes that GAAP historical cost depreciation of real estate assets is generally not correlated with changes in the value of those assets, whose value does not diminish predictably over time, as historical cost depreciation implies. Gross Assets Gross Assets represents Total assets plus Accumulated depreciation, the accumulated depreciation for corporate properties, which is included in Corporate property, net on the Consolidated Balance Sheets and accumulated depreciation for Assets held for sale, which is included in Assets held for sale on the Consolidated Balance Sheets. MAA believes that Gross Assets can be used as a helpful tool in evaluating its balance sheet positions. MAA believes that GAAP historical cost depreciation of real estate assets is generally not correlated with changes in the value of those assets, whose value does not diminish predictably over time, as historical cost depreciation implies. 73 Appendix
Definitions ofNon-GAAP Financial Measures Gross Real Estate Assets Gross Real Estate Assets represents Real estate assets, net plus Accumulated depreciation, the accumulated depreciation for corporate properties, which is included in Corporate property, net on the Consolidated Balance Sheets, and accumulated depreciation for Assets held for sale, which is included in Assets held for sale on the Consolidated Balance Sheets plus Cash and cash equivalents plus 1031(b) exchange proceeds included in Restricted cash on the Consolidated Balance Sheets. MAA believes that Gross Real Estate Assets can be used as a helpful tool in evaluating its balance sheet positions. MAA believes that GAAP historical cost depreciation of real estate assets is generally not correlated with changes in the value of those assets, whose value does not diminish predictably over time, as historical cost depreciation implies. Net Debt Net Debt represents Unsecured notes payable and Secured notes payable less Cash and cash equivalents and 1031(b) proceeds included in Restricted cash on the Consolidated Balance Sheets. MAA believes Net Debt is a helpful tool in evaluating its debt position. Net Operating Income (NOI) Net operating income represents total operating revenues less total property operating expenses, excluding depreciation, for all properties held during the period, regardless of their status as held for sale. NOI should not be considered as an alternative to Net income available for MAA common shareholders. MAA believes NOI by market is a helpful tool in evaluating the operating performance within MAA’s markets because it measures the core operations of property performance by excluding corporate level expenses and other items not related to property operating performance. 74 Appendix
Definitions ofNon-GAAP Financial Measures Recurring Adjusted EBITDA Recurring Adjusted EBITDA represents Adjusted EBITDA further adjusted to exclude certain items that are not considered part of MAA’s core business operations such as acquisition and merger and integration expenses. MAA believes Recurring Adjusted EBITDA is an important performance measure as it adjusts for certain items that by their nature are not comparable over periods and therefore tend to obscure actual operating performance. Recurring Adjusted EBITDA should not be considered as an alternative to Net income available for MAA common shareholders as an indicator of operating performance. MAA’s computation of Recurring Adjusted EBITDA may differ from the methodology utilized by other companies to calculate Recurring Adjusted EBITDA. Average Effective Rent per Unit Average effective rent per unit represents the average of gross rent amounts after the effect of leasing concessions for occupied units plus prevalent market rates asked for unoccupied units, divided by the total number of units. Leasing concessions represent discounts to the current market rate. MAA believes average effective rent is a helpful measurement in evaluating average pricing. It does not represent actual rental revenue collected per unit. Average Physical Occupancy Average physical occupancy represents the average of the daily physical occupancy for the quarter. Combined Adjusted Same Store Portfolio Combined Adjusted Same Store Portfolio represents the MAA Same Store Portfolio and the Post Adjusted Same Store Portfolio considered as a single portfolio, as if the Post Adjusted Same Store Portfolio was owned by MAA during all periods presented. For comparability purposes, certain adjustments have been made to the prior year Post Adjusted Same Store Portfolio. See the definition of the Post Adjusted Same Store Portfolio for more details. 75 Appendix
Definitions ofNon-GAAP Financial Measures Development Portfolio Communities remain identified as development until certificates of occupancy are obtained for all units under development. Once all units are delivered and available for occupancy, the community moves into theLease-up Portfolio.Lease-up Portfolio New acquisitions acquired duringlease-up and newly developed communities remain in theLease-up Portfolio until stabilized.Non-Same Store Portfolio OtherNon-Same Store Portfolio includes recent acquisitions, communities that have been identified for disposition, and communities that have undergone a significant casualty loss. MAA Same Store Portfolio MAA reviews its Same Store Portfolio at the beginning of each calendar year, or as significant transactions warrant. Communities are generally added into the MAA Same Store Portfolio if they were owned and stabilized at the beginning of the previous year. Communities that have been approved by MAA’s Board of Directors for disposition are excluded from the MAA Same Store Portfolio. Communities that have undergone a significant casualty loss are also excluded from the MAA Same Store Portfolio. Within the MAA Same Store Portfolio communities are designated as operating in Large or Secondary Markets: Large Market Same Store communities are generally those communities in markets with a population of at least one million and at least 1% of the total public multifamily REIT units. Secondary Market Same Store communities are generally those communities in markets with either a population less than one million or less than 1% of the total public multifamily REIT units, or both. 76 Appendix
Definitions ofNon-GAAP Financial Measures Post Adjusted Same Store Portfolio Post Adjusted Same Store Portfolio represents the Post Properties same store portfolio that would have been in effect had the properties been owned by MAA since January 1, 2016. Prior year results have been adjusted for consistency with MAA accounting policies and year over year comparisons. The primary adjustments include moving corporate property management expenses, exterior paint costs and IT operating systems costs out of property expenses. Because these properties have only been owned by MAA since December 1, 2016, they are not included in the MAA Same Store Portfolio. See MAA Same Store Portfolio for more information regarding inclusion. These properties have been identified in certain tables to provide Combined Adjusted Same Store results as if the properties had been owned by MAA in prior periods. These properties will be eligible to join the MAA Same Store portfolio in January 2018. Stabilized Communities Communities are considered stabilized after achieving at least 90% occupancy for 90 days. Total Market Capitalization Total Market Capitalization equals the number of shares of common stock plus units not held by MAA at period end multiplied by the closing stock price at period end, plus total debt outstanding. Unencumbered NOI Unencumbered NOI represents NOI generated by our unencumbered assets (as defined in MAALP’s bond covenants). 77 Appendix