
August 26, 2016
ViaEDGAR
Mr. Andrew Mew Senior Assistant Chief Accountant Office of Transportation and Leisure United States Securities and Exchange Commission Division of Corporation Finance 100 F Street, N.E. Washington, DC 20549 Mail Stop 3561 | T: +44 (0)20 7340 4850 F: +44 (0)20 7340 4850 E: mail@navigatorgas.com
www.navigatorgas.com
21 Palmer Street London SW1H 0AD United Kingdom | |||||
| Re: | Navigator Holdings Ltd. |
| Form 20-F for the Year Ended December 31, 2015 |
| Filed March 3, 2016 |
| File No. 001-36202 |
Dear Mr. Mew:
Set forth below is the response of Navigator Holdings Ltd. (the “Company,” “we,” “us,” or “our”) to a comment received from the staff of the Division of Corporation Finance (the “Staff”) of the Securities and Exchange Commission (the “Commission”) by letter dated August 15, 2016, with respect to the Company’s Form 20-F for the Year Ended December 31, 2015, filed with the Commission on March 3, 2016 (the “Form 20-F”).
For your convenience, the response is prefaced by the exact text of the Staff’s comment in bold text. All references to page numbers and captions correspond to the Form 20-F, unless otherwise specified.
Form 20-F for the year ended December 31, 2015
Item 5. Operating and Financial Review and Prospects
H. Critical Accounting Estimates
Impairment of Vessels, page 69
| 1. | We note your response to prior comment one, and the fact that due to a decline of 3.3% in charter rates through the first quarter, and an additional 25% through the second quarter, you performed an updated impairment analysis as of June 30, 2016, and do not expect to record an impairment. Please provide for us the following information: |
| • | Your basis for using 10 year historical average one year rates, for both the December 31, 2015 and June 30, 2016 analysis, and what factual evidence you have considered as proof to cyclicality. |
Securities and Exchange Commission August 26, 2016, Page 2
| • | The utilization rate used and how it compares to actual utilization rates, considering that through June 30, 2016 you had idle vessels, and how this fact impacted your assumption that your contracts tend to be “evergreen”. |
| • | Whether the 10 year historical average one year TCE rate is being used in internal budgets, and if not, describe the reasons for using a different rate. |
| • | The current TCE rates to date and whether you are aware of any factual evidence such as industry reports that support any expected changes. |
| • | Please explain to us why your aggregate undiscounted cash flows for your vessels increased significantly at June 30, 2016 compared to December 31, 2015. As part of your response, please explain to us your consideration for any changes in assumptions, such as utilization rates and operating expenses, used in your analysis at December 31, 2015 as compared to the one at June 30, 2016, due to the deteriorating industry conditions. |
Response:
General Comment
The Company notes that, in general, the undiscounted cash flows for a handysize LPG vessel over its estimated 30 year economic life, using assumptions that would generally be considered to be very conservative, are significantly in excess of its purchase price.
Management considers the charter rates, vessel utilization and other data used in its impairment analyses to be most appropriate. Even if the Company was to apply the lowest historical average daily charter rate recorded by the Company for any year during the past ten years ($23,600 per day for the twelve months ended December 31, 2010), the lowest average utilization rate recorded by the Company for a reporting period during the past ten years (86.8% for the six months ended June 30, 2016), the highest fleet average daily operating expense incurred by the Company for a reporting period during the past ten years ($8,445 per day for the three months ended June 30, 2016), the effects of the estimated cost of five yearly drydockings, but ignoring any inflation factors, the undiscounted cash flows for a single vessel owned by the Company over its estimated 30 year economic life would be approximately $123.3 million (which represents between two and three times the vessel’s construction cost of between $45.0 million and $50.0 million).
Historical Average Charter Rates
Management believes the use of charter rate estimates based on the 10-year historical average one year rates calculated as of the reporting date is appropriate for both the December 31, 2015 and June 30, 2016 analysis. All of the Company’s vessels are
Securities and Exchange Commission August 26, 2016, Page 3
handysize vessels operating in a sector that is relatively young. There are a limited number of vessels in the sector world fleet that are older than 10 years. The only available data beyond 10 years is for vessels different than the vessels in the Company’s fleet. Accordingly, management believes using charter rate data older than 10 years would be less reliable and less indicative of charter rates for the handysize vessel sector than the 10-year charter rate data.
Management also believes the historical average one year charter rates for the trailing one- and five-year periods are each for too short a time frame and do not necessarily include the peaks and troughs of a typical seaborne transportation cycle. For example, as at December 31, 2015, historical average one year charter rates were at near all-time highs for the LPG handysize sector, which is primarily the sector in which the Company’s vessels operate. Such high charter rates as of the end of 2015 were not inclusive of previous market sector declines or the then current charter rate environment. Similarly, historical average one year charter rates for the trailing five-year period would not reflect the previous downturn in the sector, which occurred between 2010 and 2012. Management believes such peaks and troughs in historical average charter rate levels are indicative of cyclicality.
In addition, Management applied sensitivity analysis that considered historical average one year charter rates for one- and five-year periods, looking back as of both December 31, 2015 and June 30, 2016. The sensitivity analysis using historical average one year charter rates for one- and five-year periods, in each case and as of both December 31, 2015 and June 30, 2016, resulted in higher average one-year charter rates than would result using the 10-year average one year charter rates.
The following graph illustrates a leading shipbroker’s assessment of the historical average one year charter rates for a typical handysize - 20,500 cubic meters - LPG carrier from 2008, when charter rates for these vessel types was first analyzed and made publicly available, to June 30, 2016.
Securities and Exchange Commission August 26, 2016, Page 4
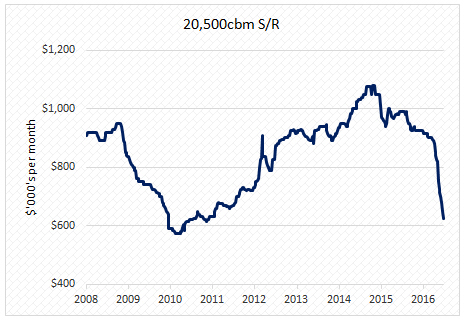
As set forth in the discussion above, management considered several factors in its determination of what management believes to be an appropriate period for observing historical average one-year time charter rates. Management considered the limited number of vessels in the sector that are older than 10 years and the size and type of vessels that would be included in historical average charter rate data beyond 10 years. In addition, management considered the cyclicality in liquefied gas carrier charter rates evidenced by the historical peaks and troughs in such charter rates. Although the current average one year charter rates have declined since December 31, 2015, management believes that with the additional LPG and petrochemical volumes expected to be transported by sea over the coming three years, supported by independent market research and the potential cancelation of new vessel orders within the sector, as evidenced by the recent announcement from Odfjell, the supply / demand balance for handysize vessels is likely to result in charter rates remaining within the rate range observed over the past 10 years. Management also considered the results of sensitivity analysis that indicated higher historical average one year charter rates for trailing one- and five-year periods as compared to for the trailing 10-year period. After having considered these factors, management believes that using charter rate estimates based on the historical average one year charter rates for a 10-year period, calculated as of the reporting date, is appropriate for both the December 31, 2015 and June 30, 2016 analysis.
Utilization Rate
Actual utilization rate for the Company’s fleet for the year ended December 31, 2015 was 94.3% and the six months ended June 30, 2016 was 86.8%, compared to a trailing 10-year average utilization rate of 97.0%, as of December 31, 2015 and 96.6% as of June 30, 2016.
Securities and Exchange Commission August 26, 2016, Page 5
Management believes that estimated vessel utilization rates should be based on the trailing 10-year average utilization rates actually achieved by the Company for reasons similar to why management believes historical average one year charter rates for the trailing 10-year period are the appropriate charter rates to use in the analysis. Sector wide utilization data is unavailable and the sample size using similar companies (to the extent such information is publicly available) would, in management’s view, be too small to yield meaningful indicative data. The Company’s historical utilization rates for each of the last 10 years have been consistently above 90% for each full year, ranging between 92.9% and 99.5%. The decline in the Company’s utilization rate for the year to December 31, 2015 and the six months to June 30, 2016 was impacted a vessel collision in June 2015 as well as by sequencing factors associated with a larger than normal number of drydockings undertaken during the six months ended June 30, 2016 in addition to market conditions. The Company does not currently anticipate further deterioration in the Company’s utilization rates.
As part of the December 31, 2015 and June 30, 2016 impairment analyses, management also conducted a series of sensitivity evaluations, in which utilization rates were reduced to certain percentages, including down to 86.8%, which was the utilization achieved by the Company for the six months ended June 30, 2016. Each such sensitivity analysis indicated that the aggregate future undiscounted cash flows of the Company’s vessels at both December 31, 2015 and June 30, 2016 meaningfully exceed their carrying values as of such dates. Despite the fact that the actual utilization rate for the Company’s fleet was 86.8% for the six months ended June 30, 2016 and that, even using such rate, the aggregate future undiscounted cash flows of the Company’s vessels at June 30, 2016 meaningfully exceed their carrying values as of such date, the Company believes that using a trailing 10-year average utilization rate is more appropriate than using the rate obtained for just the first six months of 2016. The Company believes that a trailing 10-year average utilization rate is relatively more indicative of the Company’s vessel utilization going forward than the utilization rate for just one six-month period.
The Company’s reference to some of its charters being ‘evergreen’ was only with respect to the time charters that are of twelve months duration. The Company has vessels with charters of other durations and vessels operating on the spot market. Vessels operating on the spot market are contributors to the number of idle days in the overall fleet. As of December 31, 2015 and June 30, 2016, the Company had several vessels in its fleet operating in the spot market. Although some of the Company’s twelve months charters tend to renew annually, due to customer loyalty and the specific nature of the Company’s vessels, charter rates are agreed at each renewal based on the then prevailing market rates. Management believes that with the additional cargo volumes expected to be transported by sea, referred to above, and the cancelation of some newbuild vessel orders, the best estimation of future utilization will be the historical trailing 10-year average utilization rate used in the impairment analyses.
Securities and Exchange Commission August 26, 2016, Page 6
TCE Rates in Budgets
Management prepares internal revenue budgets and forecasts using an array of assumptions. The current budgets, which were approved by the Company’s Board of Directors in December 2015, contain charter rates for the years 2016, 2017 and 2018 that Management deemed attainable for those respective years at the time the budgets were set. The budgeted charter rates for each of these years are higher than those used in the vessel impairment analyses for both December 31, 2015 and June 30, 2016. Management believes that using the historical average one year charter rates for the trailing 10-year period as of the reporting date is more appropriate for impairment analyses of a vessel with an expected economic life of 30 years than using charter rates from the Company’s budget that only represent a charter rate estimation for the following one to three years. The Company also notes that in vessel investment cases, the Company typically considers charter rates based on the average one year charter rates for the trailing 10 years.
Current TCE Rates
The Company is not aware of any formal industry reports that indicate expected future charter rates. Certain brokers assess the one year charter rate for the handysize vessel sector on a weekly basis and, as of August 19, 2016, the current one year charter rate as of the end of that week was quoted at $18,586 per day. They do not provide any forward looking rates. Although new charters that the Company may enter into are likely to be at or near the then quoted rates, the Company’s current average TCE rates will differ from such broker assessed TCE rate, because the Company’s charters were entered into in past dates, and are for durations of one, three, five or ten years. Further, the spot rate for the Company’s vessels operating in the spot market will not be determinable until the time of any spot charter.
Aggregate Undiscounted Cash Flows
The Company took delivery of two newbuild vessels during the six months ended June 30, 2016, which increased the fleet’s future undiscounted cash flows as of June 30, 2016, relative to December 31, 2015. The Company consistently used the 10-year historical average one year rates in its analysis at both balance sheet dates. The average one year charter rates for the trailing 10 years calculated as of June 30, 2016 increased as compared to December 31, 2015, notwithstanding the decline in charter rates seen during the six months ended June 30, 2016. In addition, operating
Securities and Exchange Commission August 26, 2016, Page 7
expenses were adjusted for inflation by 2% in connection with the December 31, 2015 impairment analysis. The impairment analysis at June 30, 2016 did not include an inflation factor. If the same inflation factor had been included in the June 30, 2016 analyses, the resulting aggregate future undiscounted cash flows for the vessels in the Company’s fleet as of June 30, 2016 would still have meaningfully exceeded their carrying value by $3,870 million as of such date.
* * * * *
The Company acknowledges that:
| • | the company is responsible for the adequacy and accuracy of the disclosure in the filing; |
| • | staff comments or changes to disclosure in response to staff comments do not foreclose the Commission from taking any action with respect to the filing; and |
| • | the company may not assert staff comments as a defense in any proceeding initiated by the Commission or any person under the federal securities laws of the United States. |
Please direct any questions you have with respect to the foregoing responses to me at +44 (0) 20 7340 4852 (niall.nolan@navigatorgas.com) or Adorys Velazquez of Vinson & Elkins L.L.P. at (212) 237-0036 (avelazquez@velaw.com).
| Very truly yours, |
/s/ Niall J. Nolan |
| Niall J. Nolan |
| Chief Financial Officer |
| Navigator Holdings Ltd. |
| cc: | Effie Simpson (Securities and Exchange Commission) |
| Claire Erlanger (Securities and Exchange Commission) |
| Adorys Velazquez (Vinson & Elkins L.L.P.) |