UNITED STATES
SECURITIES AND EXCHANGE COMMISSION
Washington, D.C. 20549
FORM N-CSR
CERTIFIED SHAREHOLDER REPORT OF REGISTERED
MANAGEMENT INVESTMENT COMPANIES
Investment Company Act file number 811-22875
Bluestone Community Development Fund
(Exact name of registrant as specified in charter)
37 West Avenue, Suite 301
Wayne, PA 19087
(Address of principal executive offices) (Zip code)
Kenneth R. Smith
Bluestone Community Development Fund
37 West Avenue, Suite 301
Wayne, PA 19087
(Name and address of agent for service)
Registrant's telephone number, including area code: (610) 337-6500
Date of fiscal year end: June 30
Date of reporting period: December 31, 2020
ITEM 1. REPORTS TO STOCKHOLDERS.
(a)
| 
SEMI-ANNUAL REPORT (UNAUDITED) FOR THE SIX MONTHS ENDED
DECEMBER 31, 2020 |

|
TABLE OF CONTENTS
|
| | |
Schedule of Investments | 1 |
Statement of Assets and Liabilities | 5 |
Statement of Operations | 6 |
Statements of Changes in Net Assets | 7 |
Statement of Cash Flows | 8 |
Financial Highlights | 9 |
Notes to Financial Statements | 10 |
Other Information | 19 |
Trustees and Officers | 20 |

|
Schedule of Investments
december 31, 2020 (unaudited)
|
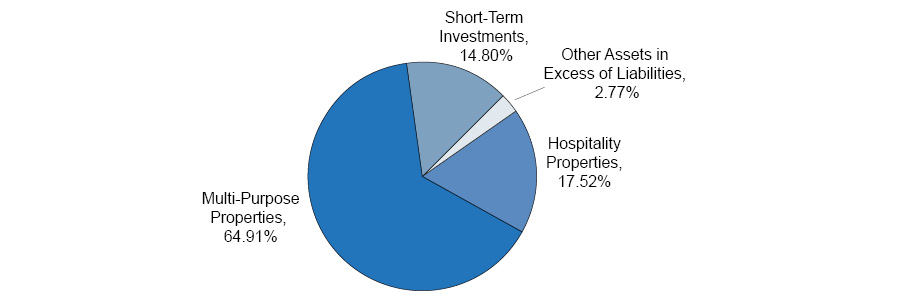
INVESTMENT TYPE AS A PERCENTAGE OF NET ASSETS AS FOLLOWS:
Description, State(a),
Acquisition Date | Stated
Interest Rate | | Effective
Interest Rate | | | Maturity | | | Cost | | | Principal | | | Fair Value | |
504 First Lien Loans(b) — 82.43% | | | | | | | | | | | | | | | | | | | | |
Hospitality Properties — 17.52% | | | | | | | | | | | | | | | | | | | | |
McDonough Hospitality Plaza, LLC, Georgia, 12/1/2016 | 6.500% (6.500% Fixed) | | | 5.250%(c) | | | | 9/5/2024 | | | $ | 4,501,588 | | | $ | 4,500,000 | | | $ | 4,823,685 | |
Moses Lake Investors, LLC, Washington, 9/18/2014(d) | Prime + 2.250% (5.500% Floor) | | | 5.500% | | | | 10/1/2039 | | | | 944,856 | | | | 914,122 | | | | 928,721 | |
Vaibhav Laxmi, Inc., Illinois, 8/14/2015 | 5 Year Libor + 4.750% (6.500% Floor) | | | 6.000%(c) | | | | 9/1/2026 | | | | 1,585,795 | | | | 1,585,728 | | | | 1,654,057 | |
Total Hospitality Properties | | | | | | | 7,406,463 | |
| | | | | | | | | | | | | | | | | | | | | |
Multi-Purpose Properties — 64.91% | | | | | | | | | | | | | | | | | | | | |
1250 Philadelphia, LLC, California, 10/3/2014 | 5 Year Libor + 4.000% (5.930% Floor) | | | 5.930% | | | | 10/15/2039 | | | | 2,349,917 | | | | 2,272,732 | | | | 2,449,642 | |
413 East 53rd Street, LLC, New York, 2/4/2014 | 3 Year Libor + 4.170% (4.950% Floor) | | | 5.681% | | | | 2/1/2044 | | | | 1,599,471 | | | | 1,575,991 | | | | 1,645,319 | |
7410-7428 Bellaire, LLC, California, 8/22/2014 | 5 Year Libor + 4.000% (5.780% Floor) | | | 5.780% | | | | 9/15/2039 | | | | 2,196,567 | | | | 2,124,030 | | | | 2,097,925 | |
77 West Mount Pleasant Avenue, LLC, New Jersey, 4/30/2015 | 3 Year Libor + 4.000% (5.125% Floor) | | | 6.836% | | | | 5/1/2040 | | | | 307,963 | | | | 295,330 | | | | 304,878 | |
AKT Elevon Partners, LLC, California, 9/17/2015 | 5 Year Libor + 3.880% (5.700% Floor) | | | 4.970%(c) | | | | 10/1/2045 | | | | 3,944,101 | | | | 3,946,438 | | | | 4,104,098 | |
CBERT Williston, LLC, North Dakota, 9/18/2015 | 5 Year Libor + 4.250% (5.132% Floor) | | | 6.450% | | | | 1/1/2038 | | | | 1,169,690 | | | | 1,137,345 | | | | 820,629 | |
See accompanying notes to financial statements.
1

|
SCHEDULE OF INVESTMENTS (continued)
DECEMBER 31, 2020 (UNAUDITED)
|
Description, State(a),
Acquisition Date — (continued) | Stated
Interest Rate | | Effective
Interest Rate | | | Maturity | | | Cost | | | Principal | | | Fair Value | |
Multi-Purpose Properties — (continued) | | | | | | | | | | | | | | | | | | | | |
CV Investment Properties, LLC, Arizona, 5/29/2014 | 5 Year Libor + 4.750% (6.000% Floor) | | | 7.821% | | | | 10/30/2038 | | | $ | 426,327 | | | $ | 406,748 | | | $ | 443,437 | |
Grigorian Investments, LLC, California, 9/2/2014(e) | 5 Year Libor + 4.500% (6.330% Floor) | | | 6.330% | | | | 9/15/2039 | | | | 520,937 | | | | 505,697 | | | | 430,829 | |
Janet J. Lopez and Robert E. Lopez, California, 10/16/2020 | 5 Year USD Swap + 5.000%(6.750% Floor) | | | 6.750% | | | | 9/1/2045 | | | | 454,966 | | | | 430,227 | | | | 453,863 | |
JPEG, Inc., Florida, 12/11/2020 | 5 Year Prime + 0.500% (6.500% Floor) | | | 6.500% | | | | 8/1/2030 | | | | 167,090 | | | | 155,847 | | | | 167,159 | |
KES, Inc., Georgia, 12/9/2020 | 6.750%(6.750% Fixed) | | | 6.750% | | | | 12/2/2029 | | | | 484,189 | | | | 458,186 | | | | 484,339 | |
Marcus D. Chu, Tracey Chu, California, 3/13/2015 | 5 Year Libor + 4.750% (6.586% Floor) | | | 6.586% | | | | 3/10/2040 | | | | 1,685,764 | | | | 1,613,594 | | | | 1,741,423 | |
Mariano D. Cibran, Florida, 5/23/2016 | 3 Year Libor + 5.160% (6.160% Floor) | | | 6.240% | | | | 6/1/2046 | | | | 1,246,054 | | | | 1,207,440 | | | | 1,251,330 | |
Rayr Holdings, LLC, California, 7/31/2015 | 3 Year Libor + 5.775% (7.025% Floor) | | | 8.628% | | | | 7/1/2045 | | | | 917,620 | | | | 875,294 | | | | 901,465 | |
Ruby View Investments, LLC, Nevada, 5/15/2014 | 5 Year Libor + 4.000% (6.500% Floor) | | | 6.500% | | | | 6/26/2037 | | | | 1,873,076 | | | | 1,798,088 | | | | 1,922,048 | |
Rug Palace, Inc. dba Rug Palace Expo, California, 2/27/2014 | Prime + 2.250% (5.500% Floor) | | | 4.370%(c) | | | | 2/15/2044 | | | | 643,576 | | | | 643,576 | | | | 639,000 | |
SGLP Enterprises, LLC, Smokin’ Guns BBQ & Catering, Inc., Missouri, 3/18/2016 | 1 Month Libor + 4.500% | | | 4.650% | | | | 9/12/2023 | | | | 550,710 | | | | 547,326 | | | | 552,788 | |
Shiv Shakti Investments, LLC, Georgia, 6/20/2017 | 6.500%(6.500% Fixed) | | | 5.250%(c) | | | | 12/15/2024 | | | | 1,752,121 | | | | 1,750,000 | | | | 1,840,632 | |
Stanley Avenue Realty, LLC, New York, 9/17/2014 | 4 Year Libor + 3.720% (5.370% Floor) | | | 6.073%(c) | | | | 9/15/2044 | | | | 1,766,419 | | | | 1,766,359 | | | | 1,867,589 | |
STMX Partners, LLC, Georgia, 12/16/2020 | 5 Year Prime + 0.500% (6.000% Floor) | | | 6.000% | | | | 10/15/2030 | | | | 541,821 | | | | 512,778 | | | | 541,960 | |
Storage Fit, LLC, Texas, 2/12/2015 | 5 Year Libor + 5.750% (7.390% Floor) | | | 5.140%(c) | | | | 3/1/2045 | | | | 301,174 | | | | 301,421 | | | | 310,470 | |
Watson Kellogg Property, LLC, Idaho, 2/9/2015 | 5 Year Libor + 2.750% (5.700% Floor) | | | 6.000% | | | | 6/1/2040 | | | | 607,033 | | | | 583,163 | | | | 626,422 | |
See accompanying notes to financial statements.
2

|
SCHEDULE OF INVESTMENTS (continued)
december 31, 2020 (unaudited)
|
Description, State(a),
Acquisition Date — (continued) | Stated
Interest Rate | | Effective
Interest Rate | | | Maturity | | | Cost | | | Principal | | | Fair Value | |
Multi-Purpose Properties — (continued) | | | | | | | | | | | | | | | | | | | | |
Watson Osburn Property, LLC, Idaho, 2/9/2015 | 5 Year Libor + 2.750% (5.700% Floor) | | | 6.000% | | | | 6/1/2040 | | | $ | 485,153 | | | $ | 465,369 | | | $ | 500,239 | |
ZC Park, LLC, Arizona, 10/17/2014 | 5 Year Libor + 4.000% (5.880% Floor) | | | 5.880% | | | | 10/15/2044 | | | | 1,306,994 | | | | 1,251,739 | | | | 1,345,219 | |
Total Multi-Purpose Properties | | | | | | | 27,442,703 | |
| | | | | | | | | | | | | | | | | | | | | | |
Total 504 First Lien Loans (identified cost of $34,330,972) | | | | | | $ | 34,849,166 | |
| | Shares | | | Fair Value | |
Short-Term Investments — 14.80% | | | | | | | | |
Morgan Stanley Liquidity Fund - Institutional Class, 0.010%(f) | | | 6,257,328 | | | $ | 6,257,328 | |
Total Short-Term Investments (Cost $6,257,328) | | | | | | | 6,257,328 | |
| | | | | | | | | |
Total Investments — 97.23% Cost ($40,588,300) | | | | | | | 41,106,494 | |
Other Assets in Excess of Liabilities — 2.77% | | | | | | | 1,170,050 | |
TOTAL NET ASSETS — 100.00% | | | | | | $ | 42,276,544 | |
(a) | The states listed correspond to the location of the underlying collateral of the 504 First Lien Loan, which may differ from the location of the borrower. |
(b) | 504 First Lien Loans are restricted as to resale. The cost and fair value as of December 31, 2020 was $34,330,972 and $34,849,166, respectively. Fair value is determined using significant unobservable inputs. |
(c) | The effective rate is net of a sub-servicing fee collected on the 504 First Lien Loan by the selling agent. As a result, the effective rate may be less than the 504 First Lien Loan floor rate. |
(d) | Represents an investment in the 504 First Lien Loan through a participation agreement with a financial institution. A participation agreement typically results in a contractual relationship only with a financial institution, not with the borrower. |
(e) | Currently in forbearance, whereas the borrower is making partial payments on the 504 First Lien Loan. See note 2. |
(f) | The rate shown is the annualized 7-day yield as of December 31, 2020. |
See accompanying notes to financial statements.
3

|
SCHEDULE OF INVESTMENTS (continued)
december 31, 2020 (unaudited)
|
INVESTMENT TYPE AS A PERCENTAGE OF NET ASSETS BY STATE:
Hospitality Properties | | | | |
Georgia | | | 11.41 | % |
Illinois | | | 3.91 | % |
Washington | | | 2.20 | % |
Total Hospitality Properties | | | 17.52 | % |
| | | | | |
Multi-Purpose Properties | | | | |
Arizona | | | 4.23 | % |
California | | | 30.32 | % |
Florida | | | 3.36 | % |
Georgia | | | 6.78 | % |
Idaho | | | 2.66 | % |
Missouri | | | 1.31 | % |
Nevada | | | 4.55 | % |
New Jersey | | | 0.72 | % |
New York | | | 8.31 | % |
North Dakota | | | 1.94 | % |
Texas | | | 0.73 | % |
Total Multi-Purpose Properties | | | 64.91 | % |
| | | | | |
Short-Term Investments | | | 14.80 | % |
Total Investments | | | 97.23 | % |
| | | | | |
Other Assets in Excess of Liabilities | | | 2.77 | % |
| | | | | |
Total Net Assets | | | 100.00 | % |
See accompanying notes to financial statements.
4

|
Statement of Assets and Liabilities
december 31, 2020 (unaudited)
|
Assets: | | | | |
Investments in 504 First Lien Loans, at fair value (cost $34,330,972) | | $ | 34,849,166 | |
Short-term investments, at fair value (cost $6,257,328) | | | 6,257,328 | |
Receivables: | | | | |
Interest | | | 210,446 | |
Receivable for paydowns | | | 977,482 | |
Prepaid expenses | | | 65,119 | |
Other assets | | | 520 | |
Total Assets | | | 42,360,061 | |
| | | | | |
Liabilities: | | | | |
Payables: | | | | |
Audit | | | 39,925 | |
Advisory fees | | | 13,134 | |
Legal | | | 11,915 | |
Accounting and administration | | | 7,470 | |
Chief Compliance Officer | | | 5,246 | |
Transfer agent | | | 3,755 | |
Custodian | | | 1,181 | |
Accrued other expenses | | | 891 | |
Total Liabilities | | | 83,517 | |
| | | | | |
Net Assets | | $ | 42,276,544 | |
| | | | | |
Net Assets Consist of: | | | | |
Paid in Capital (unlimited shares authorized, no par value) | | $ | 41,828,774 | |
Total distributable earnings | | | 447,770 | |
Net Assets | | $ | 42,276,544 | |
| | | | | |
Shares | | | | |
Net assets applicable to outstanding shares | | $ | 42,276,544 | |
Number of outstanding shares | | | 4,197,438 | |
Net asset and redemption price value per share | | $ | 10.07 | |
Maximum offering price per share (Net asset value per share divided by 0.99)1 | | $ | 10.17 | |
1 | The offering price per share reflects a maximum sales charge of 1.00%. |
See accompanying notes to financial statements.
5

|
Statement of Operations
FOR THE SIX MONTHS ENDED
DECEMBER 31, 2020 (UNAUDITED)
|
Investment Income: | | | | |
Interest | | $ | 991,670 | |
Total Investment Income | | | 991,670 | |
| | | | | |
Expenses: | | | | |
Advisory fees | | | 319,667 | |
Legal expense | | | 68,443 | |
Accounting and administration expenses | | | 44,339 | |
Audit expense | | | 40,007 | |
Trustees’ expenses | | | 36,295 | |
Chief Compliance Officer expense | | | 30,246 | |
Insurance expense | | | 17,935 | |
Registration expense | | | 12,347 | |
Transfer agent expense | | | 10,039 | |
Custodian expense | | | 5,346 | |
Printing expense | | | 3,372 | |
Miscellaneous | | | 9,682 | |
Total Expenses | | | 597,718 | |
Less: Expenses waived | | | (224,774 | ) |
Net expenses | | | 372,944 | |
Net investment income | | | 618,726 | |
| | | | | |
Net Change in Unrealized Appreciation on Investments: | | | | |
Net change in unrealized appreciation on investments | | | 44,616 | |
Total net change in unrealized appreciation on investments | | | 44,616 | |
| | | | | |
Net Increase in Net Assets from Operations | | $ | 663,342 | |
See accompanying notes to financial statements.
6

|
Statements of Changes in Net Assets
|
| | Six Months Ended
December 31, 2020
(Unaudited) | | | Year Ended
June 30, 2020 | |
Increase (Decrease) in Net Assets From: | | | | | | | | |
Operations: | | | | | | | | |
Net investment income | | $ | 618,726 | | | $ | 1,507,598 | |
Net change in unrealized appreciation on investments | | | 44,616 | | | | 1,113,446 | |
Net increase in net assets from operations | | | 663,342 | | | | 2,621,044 | |
| | | | | | | | | |
Distributions to Shareholders: | | | | | | | | |
Distributions | | | (649,478 | ) | | | (1,521,853 | ) |
Total distributions to shareholders | | | (649,478 | ) | | | (1,521,853 | ) |
| | | | | | | | | |
Capital Transactions: | | | | | | | | |
Reinvestment of distributions | | | 233,466 | | | | 510,831 | |
Cost of shares redeemed | | | — | | | | (4,519,451 | ) |
Net increase (decrease) from capital transactions | | | 233,466 | | | | (4,008,620 | ) |
| | | | | | | | | |
Total increase (decrease) in net assets | | | 247,330 | | | | (2,909,429 | ) |
| | | | | | | | | |
Net Assets: | | | | | | | | |
Beginning of period | | | 42,029,214 | | | | 44,938,643 | |
End of period | | $ | 42,276,544 | | | $ | 42,029,214 | |
| | | | | | | | | |
Capital Share Transactions: | | | | | | | | |
Shares reinvested | | | 23,182 | | | | 52,804 | |
Shares redeemed | | | — | | | | (460,698 | ) |
Net increase (decrease) | | | 23,182 | | | | (407,894 | ) |
See accompanying notes to financial statements.
7

|
Statement of Cash Flows
FOR THE SIX MONTHS ENDED
DECEMBER 31, 2020 (UNAUDITED)
|
Cash Flows from Operating Activities: | | | | |
Net increase in net assets resulting from operations | | $ | 663,342 | |
Adjustments to reconcile net increase in net assets from operations to net cash provided by operating activities: | | | | |
Principal paydowns | | | 6,717,531 | |
Purchases of long-term investments | | | (2,708,914 | ) |
Net purchase of short-term investments | | | (3,238,537 | ) |
Increase in other assets and prepaid expenses | | | (46,593 | ) |
Increase in interest receivables | | | (40,343 | ) |
Increase in receivables for principal paydowns | | | (977,482 | ) |
Increase in accrued expenses | | | 56,702 | |
Net realized paydown losses | | | 22,400 | |
Amortization of premium on investments | | | 12,522 | |
Net change in unrealized appreciation on investments | | | (44,616 | ) |
Net cash provided by operating activities | | | 416,012 | |
| | | | | |
Cash Flows from Financing Activities: | | | | |
Cash distributions paid1 | | | (416,012 | ) |
Net cash used in financing activities | | | (416,012 | ) |
| | | | | |
Net increase in cash | | | — | |
| | | | | |
Cash at beginning of period | | | — | |
Cash at end of period | | $ | — | |
1 | Noncash financing activities not included herein consist of reinvestment of dividends of $233,466. |
See accompanying notes to financial statements.
8

|
Financial Highlights
|
Per share income and capital changes for a share outstanding throughout the period.
| | | Six Months
Ended
December 31,
2020
(Unaudited) | | | Year Ended
June 30,
2020 | | | Year Ended
June 30,
2019 | | | Year Ended
June 30,
2018 | | | Year Ended
June 30,
2017 | | | Year Ended
June 30,
2016 | |
Net asset value, beginning of period | | $ | 10.07 | | | $ | 9.81 | | | $ | 9.61 | | | $ | 9.79 | | | $ | 10.17 | | | $ | 9.93 | |
| | | | | | | | | | | | | | | | | | | | | | | | | |
Income (loss) from Investment Operations: | | | | | | | | | | | | | | | | | | | | | | | | |
Net investment income | | | 0.15 | | | | 0.35 | | | | 0.35 | | | | 0.41 | | | | 0.34 | | | | 0.31 | |
Net realized and unrealized gain (loss) on investments | | | 0.01 | | | | 0.26 | | | | 0.21 | | | | (0.21 | ) | | | (0.37 | ) | | | 0.28 | |
Total income (loss) from investment operations | | | 0.16 | | | | 0.61 | | | | 0.56 | | | | 0.20 | | | | (0.03 | ) | | | 0.59 | |
| | | | | | | | | | | | | | | | | | | | | | | | | |
Less Distributions: | | | | | | | | | | | | | | | | | | | | | | | | |
Net investment income | | | (0.16 | ) | | | (0.35 | ) | | | (0.35 | ) | | | (0.38 | ) | | | (0.35 | ) | | | (0.35 | ) |
Net realized gains | | | — | | | | — | | | | (0.01 | ) | | | — | | | | — | | | | — | |
Total distributions | | | (0.16 | ) | | | (0.35 | ) | | | (0.36 | ) | | | (0.38 | ) | | | (0.35 | ) | | | (0.35 | ) |
| | | | | | | | | | | | | | | | | | | | | | | | | |
Net asset value, end of period | | $ | 10.07 | | | $ | 10.07 | | | $ | 9.81 | | | $ | 9.61 | | | $ | 9.79 | | | $ | 10.17 | |
| | | | | | | | | | | | | | | | | | | | | | | | | |
Total return | | | 2.06 | %1 | | | 6.40 | % | | | 5.96 | % | | | 2.04 | % | | | (0.30 | )% | | | 5.98 | % |
| | | | | | | | | | | | | | | | | | | | | | | | | |
Ratios/Supplemental Data: | | | | | | | | | | | | | | | | | | | | | | | | |
Net assets, end of period (in thousands) | | $ | 42,277 | | | $ | 42,029 | | | $ | 44,939 | | | $ | 45,846 | | | $ | 48,611 | | | $ | 52,681 | |
Ratio of expenses to average net assets | | | | | | | | | | | | | | | | | | | | | | | | |
Before waiver inclusive of interest expense | | | 2.80 | %2 | | | 2.80 | % | | | 2.87 | % | | | 3.08 | % | | | 3.11 | % | | | 2.84 | % |
After waiver inclusive of interest expense | | | 1.75 | %2 | | | 1.75 | % | | | 1.75 | % | | | 1.89 | % | | | 1.79 | % | | | 1.43 | % |
Before waiver exclusive of interest expense | | | 2.80 | %2 | | | 2.80 | % | | | 2.87 | % | | | 2.94 | % | | | 3.07 | % | | | 2.83 | % |
After waiver exclusive of interest expense | | | 1.75 | %2 | | | 1.75 | % | | | 1.75 | % | | | 1.75 | % | | | 1.75 | % | | | 1.42 | % |
Ratio of net investment income to average net assets | | | 2.90 | %2 | | | 3.49 | % | | | 3.57 | % | | | 4.17 | % | | | 3.40 | % | | | 3.18 | % |
Portfolio turnover rate | | | 8 | %1 | | | 7 | % | | | 0 | % | | | 0 | % | | | 4 | % | | | 13 | % |
See accompanying notes to financial statements.
9

|
Notes to Financial Statements
(UNAUDITED)
DECEMBER 31, 2020
|
1. Organization
Bluestone Community Development Fund (the “Fund”), formerly known as The 504 Fund, was organized as a Delaware statutory trust on July 29, 2013 and is registered with the Securities and Exchange Commission (the “SEC”) as a closed-end, non-diversified management investment company under the Investment Company Act of 1940, as amended (the “1940 Act”), that operates as an “interval fund” pursuant to Rule 23c-3 under the 1940 Act. The Fund is managed by Bluestone Capital Partners LLC (the “Adviser”), a Puerto Rico limited liability company registered under the Investment Advisers Act of 1940, as amended (the “Advisers Act”). Three officers of the Fund are officers and members of the Adviser. Prior to March 1, 2019, the Fund was managed by 504 Fund Advisors, LLC (the “Prior Adviser”), an Illinois limited liability company registered under the Advisers Act, which was a wholly owned subsidiary of Live Oak Bancshares, Inc. (“Live Oak”), a bank holding company. Government Loan Solutions, Inc. (“GLS”), also a subsidiary of Live Oak, provides the Adviser with data and research which is material to the Adviser’s valuation of the Fund’s investments. Robert O. Judge, a portfolio manager for the Fund, is the chief executive officer of GLS, and Jordan M. Blanchard, a portfolio manager for the Fund, is an employee of Live Oak. Prior to March 1, 2019, Messrs. Judge and Blanchard, each an officer of the Prior Adviser, each served as an officer of the Fund. The offering of shares of beneficial interest in the Fund (the “Shares”) is registered under the Securities Act of 1933, as amended (the “Securities Act”). Shares are offered on a continuous basis monthly (generally as of the last business day of each month) at the net asset value (“NAV”) per Share plus a sales charge of up to 1.00%. There are an unlimited number of authorized Shares.
The Fund’s investment objectives are to provide current income, consistent with the preservation of capital, and to enable institutional Fund investors that are subject to regulatory examination for CRA compliance to claim favorable regulatory consideration of their investment under the Community Reinvestment Act of 1977, as amended (the “CRA”). The Fund seeks to achieve its objectives by investing primarily in a portfolio of 504 First Lien Loans secured by owner-occupied commercial real estate which represent the non-guaranteed portions of U.S. Small Business Administration (“SBA”) Section 504 transactions (“504 First Lien Loans”). 504 First Lien Loans are not guaranteed by the SBA, the U.S. government or by its agencies, instrumentalities or sponsored enterprises.
2. Accounting Policies
The following is a summary of significant accounting policies followed by the Fund in preparation of its financial statements. The policies are in conformity with accounting principles generally accepted in the United States of America (“GAAP”). The Fund is an investment company and follows the investment company accounting and reporting guidance under Financial Accounting Standards Board (“FASB”) Accounting Standards Codification (“ASC”) Topic 946, Financial Services-Investment Companies. In the normal course of business, the Fund has entered into contracts that contain a variety of representations which provide general indemnifications. The Fund’s maximum exposure under these arrangements is unknown as this would involve future claims that may be made against the Fund that have not yet occurred. However, the Fund expects the risk of loss to be remote.
Investment Valuation – Investments for which market quotations are readily available are valued at current fair value, and all other investments are valued at fair value as determined in good faith by the Fund’s Board of Trustees (the “Board”), in accordance with the policies and procedures (the “Valuation Procedures”) adopted by the Board. The Board has a standing valuation committee (the “Valuation Committee”) that is composed of members appointed by the Board. The Valuation Committee operates under the Valuation Procedures approved by the Board. The Valuation Committee makes quarterly reports to the Board concerning investments for which market quotations are not readily available. Investments in money market funds (short-term investments) are valued at the closing NAV per share.
10

|
Notes to Financial Statements
(UNAUDITED)
DECEMBER 31, 2020
|
2. Accounting Policies (continued)
504 First Lien Loans – The fair values of 504 First Lien Loans are analyzed using a pricing methodology designed to incorporate, among other things, the present value of the projected stream of cash flows on such investments (the “discounted cash flow” methodology). This pricing methodology takes into account a number of relevant factors, including changes in prevailing interest rates, yield spreads, the borrower’s creditworthiness, the debt service coverage ratio, lien position, delinquency status, frequency of previous late payments and the projected rate of prepayments. Newly purchased loans are initially fair valued at cost and subsequently analyzed using the discounted cash flow methodology. Loans with a pending short payoff will be fair valued at the anticipated recovery rate. Valuations of 504 First Lien Loans are determined no less frequently than weekly by the Valuation Committee.
Investment Transactions and Income – Investment transactions are recorded on the trade date basis. Interest income is recorded on the basis of interest accrued, adjusted for amortization of premium or accretion of discount using the effective yield. Fees associated with loan amendments, paydown gain/losses, and prepayment penalties are recognized immediately. Dividend income is recorded on the ex-dividend date for dividends received in cash and/or securities. 504 First Lien Loans will be placed in non-accrual status and related interest income reduced by ceasing current accruals and writing off interest receivables when the collection of all or a portion of interest has become doubtful as identified by the Adviser as part of the valuation process. During forbearance periods, any interest and fees on deferred payments will be added to the principal amount and re-amortized over the remaining life of the 504 First Lien Loan. There will be no impact to the maturity date of the loan.
Distributions to Shareholders – The Fund expects to declare and pay dividends of net investment income quarterly and net realized capital gains annually. Unless shareholders specify otherwise, dividends will be reinvested in Shares of the Fund.
Use of Estimates – The preparation of financial statements in conformity with GAAP requires management to make estimates and assumptions that affect the reported amounts of assets and liabilities and disclosure of contingent assets and liabilities at the date of the financial statements and the reported amounts of increases and decreases in net assets from operations during the reporting period. Actual results could differ from those estimates.
Federal Income Taxes – The Fund intends to elect and to qualify each year to be treated as a regulated investment company under the provisions of Subchapter M of the Internal Revenue Code of 1986, as amended. In order to so qualify, the Fund must meet certain requirements with respect to the sources of its income, the diversification of its assets and the distribution of its income. If the Fund qualifies as a regulated investment company, it will not be subject to federal income or excise tax on income or net capital gains that it distributes in a timely manner to its shareholders in the form of investment company taxable income or net capital gain distributions.
Accounting for Uncertainty in Income Taxes – GAAP requires an evaluation of tax positions taken (or expected to be taken) in the course of preparing a Fund’s tax return to determine whether these positions meet a “more-likely-than-not” standard that, based on the technical merits, have a more than fifty percent likelihood of being sustained by a taxing authority upon examination. A tax position that meets the “more-likely-than-not” recognition threshold is measured to determine the amount of benefit to recognize in the financial statements. The Fund recognizes interest and penalties, if any, related to unrecognized tax benefits as income tax expense in the Statement of Operations.
GAAP requires management of the Fund to analyze all open tax years for all major jurisdictions, which the Fund considers to be its federal and relevant state income tax filings. The open tax years for the Fund include the current year plus the prior three tax years. As of and during the year ended June 30, 2020, the Fund did not record a liability for any unrecognized tax benefits. The Fund has no examination in progress and is not aware of any tax positions for which it is reasonably possible that the total amounts of unrecognized tax benefits will significantly change in the next twelve months.
11

|
Notes to Financial Statements
(UNAUDITED)
DECEMBER 31, 2020
|
2. Accounting Policies (continued)
Expenses – Fund expenses are charged to the Fund and recorded on an accrual basis.
Fair Value Measurements – Under GAAP for fair value measurements, a three-tier hierarchy to prioritize the assumptions, referred to as inputs, is used in valuation techniques to measure fair value. The three-tier hierarchy of inputs is summarized in the three broad levels listed below.
| | ● | Level 1 – Unadjusted quoted prices in active markets for identical, unrestricted assets or liabilities that the Fund has the ability to access at the measurement date. |
| | ● | Level 2 – Other significant observable inputs (including quoted prices for similar investments, interest rates, prepayment speeds, credit risk, etc.). |
| | ● | Level 3 – Significant unobservable inputs (including the Fund’s own assumptions in determining the fair value of investment). |
The following table sets forth information about the levels within the fair value hierarchy at which the Fund’s investments are measured as of December 31, 2020:
| | Level 1 | | | Level 2 | | | Level 3 | | | Total | |
Hospitality Properties | | $ | — | | | $ | — | | | $ | 7,406,463 | | | $ | 7,406,463 | |
Multi-Purpose Properties | | | — | | | | — | | | | 27,442,703 | | | | 27,442,703 | |
Short-Term Investments | | | 6,257,328 | | | | — | | | | — | | | | 6,257,328 | |
Total Investments | | $ | 6,257,328 | | | $ | — | | | $ | 34,849,166 | | | $ | 41,106,494 | |
For the six months ended December 31, 2020, there were no transfers into or out of Level 3.
The following is a reconciliation of investments in which significant unobservable inputs (Level 3) were used in determining fair value:
Investments | | Balance as of
June 30, 2020 | | | Purchase and
funding of
investments | | | Proceeds
from principal
payments* | | | Net realized
gain on
investments | | | Net change
in unrealized
appreciation
(depreciation)
on
investments | | | Amortization
of discount
and premium | | | Balance as of
December 31,
2020 | |
Hospitality Properties1 | | $ | 7,298,679 | | | $ | 26,141 | | | $ | (19,028 | ) | | $ | — | | | $ | 101,356 | | | $ | (685 | ) | | $ | 7,406,463 | |
Multi-Purpose Properties2 | | | 31,549,410 | | | | 2,682,773 | | | | (6,720,903 | ) | | | — | | | | (56,740 | ) | | | (11,837 | ) | | | 27,442,703 | |
Total Investments | | $ | 38,848,089 | | | $ | 2,708,914 | | | $ | (6,739,931 | ) | | $ | — | | | $ | 44,616 | | | $ | (12,522 | ) | | $ | 34,849,166 | |
* | Inclusive of net realized paydown losses and prepayment penalty fees received. |
1 | Change in unrealized appreciation from Hospitality Properties held at December 31, 2020 is $101,356. |
2 | Change in unrealized appreciation from Multi-Purpose Properties held at December 31, 2020 is $17,432. |
12

|
Notes to Financial Statements
(UNAUDITED)
DECEMBER 31, 2020
|
2. Accounting Policies (continued)
The following is a summary of quantitative information about significant unobservable valuation inputs for Level 3 fair value measurements for investments held as of December 31, 2020:
Type of Level 3
Investments | | Fair Value as of
December 31,
2020 | | | Valuation
Technique | | | Unobservable
Inputs | | | Weighted
Average | | | Range | | | Impact to Fair
Value from
an Increase
in Input | |
Hospitality Properties | | $ | 7,406,463 | | | | Discounted
Cash Flows | | | | Purchase Price | | | | $100.52 | | | | $100-104 | | | | Decrease** | |
| | | | | | | | | | | Debt Service Coverage Ratio | | | | 1.85 | | | | 1.34-2.06 | | | | N/A* | |
| | | | | | | | | | | Effective Loan To Value Ratio | | | | 45.54% | | | | 42%-53% | | | | Decrease | |
| | | | | | | | | | | Average Personal Credit Score | | | | 732 | | | | 687-761 | | | | N/A* | |
Multi-Purpose Properties | | $ | 27,442,703 | | | | Discounted
Cash Flows | | | | Purchase Price | | | | $102.94 | | | | $100-107.25 | | | | Decrease** | |
| | | | | | | | | | | Debt Service Coverage Ratio | | | | 1.85 | | | | 0.78-8.09 | | | | N/A* | |
| | | | | | | | | | | Effective Loan To Value Ratio | | | | 53.43% | | | | 42%-114% | | | | Decrease | |
| | | | | | | | | | | Average Personal Credit Score | | | | 759 | | | | 627-819 | | | | N/A* | |
Total Level 3 Investments | | $ | 34,849,166 | | | | | | | | | | | | | | | | | | | | | |
* | A decrease in the input would result in a decrease in fair value. |
** | An increase in the spread from the Fund’s purchase price to the benchmark utilized within the fair value methodology would result in a decrease in fair value. |
3. Concentration of Risk
504 First Lien Loans Risk – The Fund predominantly invests in fixed or variable rate 504 First Lien Loans arranged through private negotiations between a small business borrower (the “Borrower”) and one or more 504 First Lien Loan lenders. 504 First Lien Loans are secured by real property and have a claim on the assets of the Borrower that is senior to the second lien held by a certified development company and any claims held by unsecured creditors. The 504 First Lien Loans the Fund will invest in are not rated. 504 First Lien Loans are subject to a number of risks, including credit risk, liquidity risk, valuation risk and interest rate risk. Although the 504 First Lien Loans in which the Fund will invest will be secured by real property, there can be no assurance that such real property can be readily liquidated or that the liquidation of such real property would satisfy the Borrower’s obligation in the event of non-payment of scheduled interest or principal, which could result in substantial loss to the Fund. In the event of the bankruptcy or insolvency of a Borrower, the Fund could experience delays or limitations with respect to its ability to realize the benefits of the real property securing a 504 First Lien Loan. In the event of a decline in the value of the already pledged real property, the Fund will be exposed to the risk that the value of the real property will not at all times equal or exceed the amount of the Borrower’s obligations under the 504 First Lien Loan. In
13

|
Notes to Financial Statements
(UNAUDITED)
DECEMBER 31, 2020
|
3. Concentration of Risk (continued)
general, the secondary trading market for 504 First Lien Loans is not fully-developed. No active trading market may exist for certain 504 First Lien Loans, which may make it difficult to value them. Illiquidity and adverse market conditions may mean that the Fund may not be able to sell certain 504 First Lien Loans quickly or at a fair price. To the extent that a secondary market does exist for certain 504 First Lien Loans, the market for them may be subject to irregular trading activity, wide bid/ask spreads and extended trade settlement periods.
Credit Risk – Credit risk is the risk that one or more debt instruments in the Fund’s portfolio will decline in price or fail to pay interest or principal when due because the borrower experiences a decline in its financial status. Losses may occur because the market value of a debt security is affected by the creditworthiness of the issuer and by general economic and specific industry conditions.
Qualification for CRA Credit Risk – Although the Adviser believes that the Fund’s 504 First Lien Loan investments will have the community development qualities that are eligible for favorable consideration as community development loans and qualified investments under the CRA, there is no guarantee that an investor will receive CRA credit for an investment in the Fund.
Geographic Concentration Risk – The Fund’s 504 First Lien Loan investments are currently concentrated in California. As a result, the Fund may be more susceptible to being adversely affected by any single occurrence in California. Mortgaged properties in California may be particularly susceptible to economic risks of the state and certain types of hazards, such as earthquakes, floods, mudslides, wildfires and other natural disasters, for which there may or may not be insurance. As of December 31, 2020, 30.32% of the Fund’s investments were associated with properties located in California. Mortgaged properties in other states similarly may be adversely affected by natural disasters, for which there may not be insurance and which could result in substantial loss to the Fund.
Valuation Risk – Unlike publicly traded equity securities that trade on national exchanges, there is no central place or exchange for 504 First Lien Loans to trade. Due to the lack of centralized information and trading, the Adviser’s judgment plays a greater role in the valuation process and the valuation of 504 First Lien Loans. Uncertainties in the conditions of the financial market, unreliable reference data, lack of transparency and inconsistency of valuation models and processes may lead to inaccurate asset pricing. In addition, other market participants may value instruments differently than the Fund, and therefore the actual amount received in the sale of the 504 First Lien Loan may be less than the fair value of such loan, as determined by the Fund.
LIBOR Transition Risk – Certain instruments in which the Fund may invest rely in some fashion upon the London Interbank Offered Rate (LIBOR). The United Kingdom’s Financial Conduct Authority, which regulates LIBOR, has announced plans to phase out the use of LIBOR by the end of 2021. There remains uncertainty regarding the future utilization of LIBOR and the nature of any replacement rate, and any potential effects of the transition away from LIBOR on the Fund or on certain instruments in which the Fund invests are not known. The transition process may involve, among other things, increased volatility or illiquidity in markets for instruments that currently rely on LIBOR. The transition may also result in a reduction in the value of certain instruments held by the Fund. Any such effects of the transition away from LIBOR, as well as other unforeseen effects, could result in losses to the Fund.
Recent Market Events Risk – The spread of the novel coronavirus (COVID-19) worldwide has resulted in disruptions to supply chains and customer activity, stress on the global healthcare system, temporary and permanent layoffs in the private sector and rising unemployment claims, quarantines, cancellations, market declines, the closing of borders, restrictions on travel and widespread concern and uncertainty, all of which may lead to a substantial economic downturn or recession in the U.S. and global economies. The recovery from the effects of COVID-19 is uncertain and may last for an extended period of time. Efforts to combat the spread of COVID-19 within the U.S. have caused significant disruptions to the operations of
14

|
Notes to Financial Statements
(UNAUDITED)
DECEMBER 31, 2020
|
3. Concentration of Risk (continued)
many small business borrowers utilizing the SBA 504 Program and may have adverse effects on their long-term health and viability. As a result, the market for 504 First Lien Loans and the value of 504 First Lien Loans held by the Fund is being negatively affected by these market conditions and may also be negatively affected in the future by increased rates of default and foreclosure, loan repayment deferral or forbearance requests by borrowers, lower loan origination volumes and the availability of other government loan and relief programs. In addition, the spread of COVID-19 may exacerbate certain risks, including 504 First Lien Loans risk, hospitality industry concentration risk, credit risk, valuation risk, liquidity risk and interest rate risk. The Adviser will monitor developments and seek to manage the Fund in a manner consistent with achieving the Fund’s investment objective, but there can be no assurance that it will be successful in doing so.
For other risks associated with the Fund and its investments please refer to the “Risks” section in the Fund’s current prospectus.
4. Periodic Repurchase Offers
The Fund will make periodic offers to repurchase a portion of its outstanding Shares at NAV per Share. The Fund has adopted a fundamental policy to make repurchase offers once every twelve months. The Fund will offer to repurchase 10% of its outstanding Shares, unless the Board has approved a different amount (not less than 5% or more than 25% of its outstanding Shares for a particular repurchase offer). The Fund does not currently expect to charge a repurchase fee.
For the year ended June 30, 2020, the Fund had one repurchase offer as follows:
Repurchase
Offer Notice | Repurchase
Request Deadline | Repurchase
Pricing Date | Repurchase
Offer Amount | % of Shares
Repurchased | Number
of Shares
Repurchased |
December 13, 2019 | January 8, 2020 | January 17, 2020 | 10% | 10% | 460,698 |
5. Administration, Distribution, Transfer Agency and Custodian Agreements
The Fund and its administrator, UMB Fund Services, Inc. (“UMBFS”), are parties to an administration agreement under which UMBFS provides administrative and fund accounting services.
UMBFS also serves as the transfer agent and dividend disbursing agent for the Fund.
UMB Bank, N.A. serves as the custodian and escrow agent (the “Custodian”) for the Fund. The Custodian plays no role in determining the investment policies of the Fund or which securities are to be purchased and sold by the Fund.
The Fund and Foreside Fund Services, LLC (the “Distributor”) are parties to a distribution agreement under which the Distributor acts as the principal underwriter for the Fund.
6. Investment Advisory Agreement
The Fund has entered into an investment advisory agreement (the “Investment Advisory Agreement”) with the Adviser, effective May 1, 2019. Under the Investment Advisory Agreement, the Adviser makes investment decisions for the Fund and continuously reviews, supervises and administers the investment program of the Fund, subject to the supervision of, and policies established by, the Board. For providing these services, the Adviser will receive a fee from the Fund, accrued daily and paid monthly, at an annual rate equal to 1.50% of the Fund’s average daily net assets. In addition, the Adviser has contractually agreed to waive or reduce its advisory fees and/or reimburse expenses of the Fund to ensure that total
15

|
Notes to Financial Statements
(UNAUDITED)
DECEMBER 31, 2020
|
6. Investment Advisory Agreement (continued)
annual fund operating expenses (“Total Annual Expenses”) after fee waiver and/or expense reimbursement (excluding interest, leverage interest (i.e., any expenses incurred in connection with borrowings made by the Fund), taxes, brokerage commissions, acquired fund fees and expenses and extraordinary expenses (collectively, “Excluded Expenses”)) will not exceed 1.75% of the Fund’s average net assets pursuant to an operating expenses limitation agreement dated March 1, 2019 (the “Operating Expenses Limitation Agreement”). Under the terms of the Operating Expenses Limitation Agreement, the Adviser is permitted to be reimbursed in any subsequent month in the three-year period from the date of the fee waiver and/or expense reimbursement if the aggregate amount actually paid by the Fund toward operating expenses for such month (taking into account the reimbursement) will not cause the Fund to exceed the lesser of: (a) the expense limitation in effect at the time of the fee waiver and/or expense reimbursement; or (b) the expense limitation in effect at the time of the reimbursement. The Operating Expenses Limitation Agreement is in effect through May 1, 2021, and may be terminated only by, or with the consent of, the Board. Pursuant to a separate operating expenses limitation agreement between the Adviser and the Fund, the Adviser has contractually agreed to waive or reduce its advisory fees and/or reimburse expenses of the Fund to ensure that the Fund’s Total Annual Expenses after fee waiver and/or expense reimbursement (excluding Excluded Expenses) will not exceed 2.25% of the Fund’s average annual net assets effective May 2, 2021 through at least October 31, 2021. This new operating expenses limitation agreement may be terminated only by, or with the consent of, the Board.
For the six months ended December 31, 2020, the Adviser waived expenses totaling $224,774 that are subject to reimbursement.
As of June 30, 2020, the Adviser’s fees and expenses subject to reimbursement were as follows:
| | June 30, 2022 | | | June 30, 2023 | |
| | $136,921 | | | $452,378 | |
7. Investment Transactions
For the six months ended December 31, 2020, there were proceeds from principal payments of $6,717,531 and long term purchases of $2,708,914 in the Fund.
8. Federal Tax Information
At December 31, 2020, gross unrealized appreciation (depreciation) of investments owned by the Fund, based on cost for federal income tax purposes, were as follows:
Cost of investments | | $ | 40,588,300 | |
Gross unrealized appreciation | | $ | 1,097,472 | |
Gross unrealized depreciation | | | (579,278 | ) |
Net unrealized appreciation on investments | | $ | 518,194 | |
16

|
Notes to Financial Statements
(UNAUDITED)
DECEMBER 31, 2020
|
8. Federal Tax Information (continued)
GAAP requires that certain components of net assets be reclassified between financial and tax reporting. These reclassifications have no effect on net assets or net asset value per share. For the year ended June 30, 2020, permanent differences in book and tax accounting resulting primarily from differing treatments for amortization of organizational costs have been reclassified to paid in capital and total accumulated deficit as follows:
Increase (Decrease) |
Paid in Capital | Total Accumulated
Deficit |
$1,422 | $(1,422) |
As of June 30, 2020, the components of distributable earnings (accumulated deficit) on a tax basis for the Fund were as follows:
Undistributed ordinary income | | $ | 29,473 | |
Accumulated capital and other losses | | | (69,145 | ) |
Unrealized appreciation on investments | | | 473,578 | |
Total distributable earnings (accumulated deficit) | | $ | 433,906 | |
As of June 30, 2020, the Fund had a short-term capital loss carry forward of $2,721 and long-term capital loss carry forward of $66,424. To the extent that the fund may realize future net capital gains, those gains will be offset by any of its unused capital loss carry forward. Future capital loss carry forward utilization in any given year may be subject to Internal Revenue Code limitations.
The tax character of distributions paid during the fiscal years ended June 30, 2020 and June 30, 2019 were as follows:
| | 2020 | | | 2019 | |
Distribution paid from: | | | | | | | | |
Ordinary income | | $ | 1,521,853 | | | $ | 1,644,310 | |
Long-term capital gains | | | — | | | | 44,551 | |
Total Distributions | | $ | 1,521,853 | | | $ | 1,688,861 | |
9. Control Ownership
The beneficial ownership, either directly or indirectly, of more than 25% of the voting securities creates a presumption of control of the Fund, under Section 2(a)(9) of the 1940 Act. As of December 31, 2020, Northwest Federal Credit Union had ownership in the Fund in the amount of 43.15%.
17

|
Notes to Financial Statements
(UNAUDITED)
DECEMBER 31, 2020
|
10. Subsequent Events
The Fund has evaluated the events and transactions through the date the financial statements were issued and determined there were no subsequent events that required adjustments to our disclosure in the financial statements except for the following:
During the six months ended December 31, 2020, the Fund had one repurchase offer as follows:
Repurchase
Offer Notice | Repurchase
Request Deadline | Repurchase
Pricing Date | Repurchase
Offer Amount | % of Shares
Repurchased | Number
of Shares
Repurchased |
December 15, 2020 | January 8, 2021 | January 15, 2021 | 10% | 10% | 419,744 |
18

|
Other Information (Unaudited)
DECEMBER 31, 2020
|
Proxy Voting
For a description of the policies and procedures that the Fund uses to determine how to vote proxies relating to portfolio securities, please call the Fund at 855-386-3504 and request a Statement of Additional Information. One will be mailed to you free of charge. The Statement of Additional Information is also available on the SEC’s website at http://www.sec.gov.
Information on how the Fund voted proxies relating to portfolio securities during the most recent 12-month period ended June 30 is available without charge, upon request, by calling the Fund at 855-386-3504 or by accessing the SEC’s website http://www.sec.gov.
Disclosure of Portfolio Holdings
The Fund files a complete schedule of portfolio holdings with the SEC for the first and third quarters of each fiscal year on Part F of Form N-PORT. The Fund’s Form N-PORT reports are available on the SEC’s website at www.sec.gov.
19

|
Trustees and Officers (Unaudited)
DECEMBER 31, 2020
|
Information pertaining to the Trustees and officers of the Fund is set forth below. Trustees who are not “interested persons” of the Fund as that term is defined in the 1940 Act are referred to as “Independent Trustees.” Unless otherwise noted, the business address of each Trustee or officer is c/o Bluestone Community Development Fund, 37 West Avenue, Suite 301, Wayne, PA 19087. The business address for Mr. Gladue is c/o Bluestone Capital Partners LLC, 151 Calle San Francisco, Suite 200 PMB 5333, San Juan, PR 00901-1607. The business address for Mr. Pelos is c/o Oyster Consulting, LLC, 4128 Innslake Dr., Glen Allen, VA 23060. The Statement of Additional Information includes additional information about the Trustees and is available, without charge, upon request by calling the Fund at 855-386-3504.
Name and
Year of Birth | Position with
Fund and
Length of Term | Principal Occupations
in the Past 5 Years | Number of
Portfolios
in Fund
Complex
Overseen
By Trustee | Other Directorships
Held in the Past 5
Years |
Independent Trustees | | | |
J. Clay Singleton, Ph.D., CFA Born: 1947 | Trustee (Indefinite term; since 2013) | Principal in Marshall-Singleton (a fiduciary liability consulting firm) (since 2017); Professor Emeritus of Finance, Crummer Graduate School of Business, Rollins College (2002-2017) | 1 | Independent Trustee, USFS Funds Trust (an open-end investment company with two series) (2013-2014) |
Cornelius J. Lavelle Born: 1944 | Trustee (Indefinite term; since 2013) | Retired; Director-Institutional Equities, Citigroup Global Markets Inc. (multinational financial services firm) (1997-2009) | 1 | Independent Trustee, Broadview Funds Trust (an open-end investment company with one series) (2013-2019); Independent Trustee, USFS Funds Trust (an open-end investment company with two series) (2013-2014) |
20

|
Trustees and Officers (Unaudited)
DECEMBER 31, 2020
|
Name and
Year of Birth | Position with
Fund and
Length of Term | Principal Occupations
in the Past 5 Years | Number of
Portfolios
in Fund
Complex
Overseen
By Trustee | Other Directorships
Held in the Past 5
Years |
Independent Trustees (continued) | | | |
George Stelljes, III Born: 1961 | Chairman of the Board (Indefinite term; since August 2016) and Trustee (Indefinite term; since 2013) | Managing Partner, St. John’s Capital, LLC (private investment fund) (since 2012); President, Chief Investment Officer and Director of the Gladstone Companies (family of public and private investment funds) (2001-2012) | 1 | Director and Chairman of Valuation Committee, Oxford Square Capital Corp. (f/k/a TICC Capital Corp.) (business development company) (since 2016); Director, Intrepid Capital Corporation (asset management firm) (since 2003); Director, Gladstone Capital Corporation (business development company) (2001–2012); Director, Gladstone Commercial Corporation (real estate investment trust) (2003–2012); Director, Gladstone Investment Corporation (business development company) (2005–2012) |
Jorge A. Junquera Diez Born: 1948 | Trustee (Indefinite term; since 2020) | Managing Partner of Kohly Capital, LLC (private investment firm) (since 2016) | 1 | Director, EVERTEC, Inc. (a transaction processing company) (since 2012); Director, Sacred Heart University (Puerto Rico) (since 2014) |
21

|
Trustees and Officers (Unaudited)
DECEMBER 31, 2020
|
Name and
Year of Birth | Position with
Fund and
Length of Term | Principal Occupations
in the Past 5 Years | Number of
Portfolios
in Fund
Complex
Overseen
By Trustee | Other Directorships
Held in the Past 5
Years |
Other Officers | | | | |
Lee A. Calfo Born: 1977 | President and Principal Executive Officer (Indefinite term; since 2019) | Chief Executive Officer and Portfolio Manager, Bluestone Capital Partners LLC (investment advisory firm) (since 2019); Chief Executive Officer, J. Alden Associates, Inc. (broker-dealer) (since 2018); Chief Executive Officer, Alden Capital Management, LLC (asset management firm) (since 2018); Chief Executive Officer and Portfolio Manager, Bluestone Capital Management, LLC (investment advisory firm) (since 2010); President, MCG Securities LLC (broker-dealer) (2012-2017) | N/A | N/A |
Joseph Gladue Born: 1959 | Treasurer, Principal Financial Officer and Principal Accounting Officer (Indefinite term; since 2019) | Chief Financial Officer and Portfolio Manager, Bluestone Capital Partners LLC (investment advisory firm) (since 2019); Director of Research, J. Alden Associates, Inc. (broker-dealer) (since 2019); Director of Research, MCG Securities, LLC (broker-dealer) (2015-2018); Vice President Corporate Development, BofI Federal Bank (2014-2015) | N/A | N/A |
22

|
Trustees and Officers (Unaudited)
DECEMBER 31, 2020
|
Name and
Year of Birth | Position with
Fund and
Length of Term | Principal Occupations
in the Past 5 Years | Number of
Portfolios
in Fund
Complex
Overseen
By Trustee | Other Directorships
Held in the Past 5
Years |
Other Officers (continued) | | | |
Kenneth R. Smith Born: 1967 | Secretary (Indefinite term; since 2019) | Chief Compliance Officer, Bluestone Capital Partners LLC (investment advisory firm) (since 2019); Chief Compliance Officer and Partner, Alden Capital Management, LLC (asset management firm) (since 2018); Chief Compliance Officer and Partner, J. Alden Associates, Inc. (broker dealer) (since 2018); Chief Compliance Officer, Dekania Capital Management, LLC (investment advisory firm) (since 2016); Chief Compliance Officer, Cohen & Company Financial Management, LLC (investment advisory firm) (since 2016); Chief Compliance Officer, Bluestone Capital Management, LLC (investment advisory firm) (since 2014); Chief Compliance Officer, MCG Securities LLC (broker dealer) (since 2011); Chief Compliance Officer and Founder, Compass Financial Advisors, LLC (investment advisory firm) (since 2003) | N/A | N/A |
Constantine Andrew (Dean) Pelos Born: 1960 | Chief Compliance Officer and AML Compliance Officer (Indefinite term; since 2019) | Director, Oyster Consulting, LLC (compliance consulting to financial service firms) (2019-present); Chief Compliance Officer and Vice President, M Holdings Securities, Inc., M Financial Investment Advisors, M Fund and M Wealth (2018-2019); Director, Oyster Consulting, LLC (2015-2018); Senior Consultant, Oyster Consulting, LLC (2013-2015) | N/A | N/A |
23
THIS PAGE INTENTIONALLY LEFT BLANK
THIS PAGE INTENTIONALLY LEFT BLANK
BLUESTONE COMMUNITY DEVELOPMENT FUND
37 West Avenue, Suite 301
Wayne, PA 19087
INVESTMENT ADVISER
Bluestone Capital Partners LLC
151 Calle San Francisco, Suite 200 PMB 5333
San Juan, PR 00901-1607
INDEPENDENT REGISTERED PUBLIC ACCOUNTING FIRM
Cohen & Company, Ltd.
342 North Water Street, Suite 830
Milwaukee, WI 53202
LEGAL COUNSEL
Godfrey & Kahn, S.C.
833 East Michigan Street, Suite 1800
Milwaukee, WI 53202
CUSTODIAN
UMB Bank, N.A.
1010 Grand Boulevard
Kansas City, MO 64106
DISTRIBUTOR
Foreside Fund Services, LLC
Three Canal Plaza, Suite 100
Portland, ME 04101
TRANSFER AGENT
UMB Fund Services, Inc.
235 West Galena Street
Milwaukee, WI 53212
There can be no assurance that the Fund will achieve its investment objectives. An investment in the Fund is an appropriate investment only for those investors who can tolerate a high degree of risk and do not require a liquid investment. Investors may lose some or all of their investment in the Fund. The Fund is not designed to be a complete investment program and may not be a suitable investment for all investors. The risk factors described are the principal risk factors associated with an investment in the Fund, as well as those factors associated with an investment in an investment company with similar investment objectives and investment policies.
This report is submitted for the general information of the shareholders of the Fund. It is not authorized for distribution to prospective investors unless preceded or accompanied by an effective prospectus, which includes information regarding the Fund’s risks, objectives, fees, expenses and experience of its management and other considerations.
ITEM 1. REPORTS TO STOCKHOLDERS CONT.
(b) Not applicable.
ITEM 2. CODE OF ETHICS.
Not applicable to semi-annual reports.
ITEM 3. AUDIT COMMITTEE FINANCIAL EXPERT.
Not applicable to semi-annual reports.
ITEM 4. PRINCIPAL ACCOUNTANT FEES AND SERVICES.
Not applicable to semi-annual reports.
ITEM 5. AUDIT COMMITTEE OF LISTED REGISTRANTS.
Not applicable to semi-annual reports.
ITEM 6. INVESTMENTS.
Schedule of Investments in securities of unaffiliated issuers as of the close of the reporting period is included as part of the report to shareholders filed under Item 1 of this Form.
ITEM 7. DISCLOSURE OF PROXY VOTING POLICIES AND PROCEDURES FOR CLOSED-END MANAGEMENT INVESTMENT COMPANIES.
Not applicable to semi-annual reports.
ITEM 8. PORTFOLIO MANAGERS OF CLOSED-END MANAGEMENT INVESTMENT COMPANIES.
(a) Not applicable to semi-annual reports.
(b) There have been no changes, as of the date of this filing, in any of the Portfolio Managers identified in response to paragraph (a)(1) of this Item in the registrant’s most recent annual report on Form N-CSR.
ITEM 9. PURCHASES OF EQUITY SECURITIES BY CLOSED-END MANAGEMENT INVESTMENT COMPANY AND AFFILIATED PURCHASERS.
There were no purchases made by or on behalf of the registrant or any “affiliated purchaser,” as defined in Rule 10b-18(a)(3) under the Exchange Act (17 CFR 240.10b-18(a)(3)), of shares or other units of any class of the registrant’s equity securities that is registered by the registrant pursuant to Section 12 of the Exchange Act (15 U.S.C. 781).
There were no purchases that do not satisfy the conditions of the safe harbor of Rule 10b-18 under the Exchange Act (17 CFR 240.10b-18), made in the period covered by this report.
ITEM 10. SUBMISSION OF MATTERS TO A VOTE OF SECURITY HOLDERS.
There have been no material changes to the procedures by which the shareholders may recommend nominees to the registrant's board of trustees, where those changes were implemented after the registrant last provided disclosure in response to the requirements of Item 407(c)(2)(iv) of Regulation S-K (17 CFR 229.407) (as required by Item 22(b)(15) of Schedule 14A (17 CFR 240.14a-101)), or this Item.
ITEM 11. CONTROLS AND PROCEDURES.
(a) The registrant's principal executive and principal financial officers, or persons performing similar functions, have concluded that the registrant's disclosure controls and procedures (as defined in Rule 30a-3(c) under the Investment Company Act of 1940, as amended (the "1940 Act") (17 CFR 270.30a-3(c))) are effective, as of a date within 90 days of the filing date of the report that includes the disclosure required by this paragraph, based on their evaluation of these controls and procedures required by Rule 30a-3(b) under the 1940 Act (17 CFR 270.30a-3(b)) and Rules 13a-15(b) or 15d-15(b) under the Securities Exchange Act of 1934, as amended (17 CFR 240.13a-15(b) or 240.15d-15(b)).
(b) There were no changes in the registrant's internal control over financial reporting (as defined in Rule 30a-3(d) under the 1940 Act (17 CFR 270.30a-3(d)) that occurred during the period covered by this report that have materially affected, or are reasonably likely to materially affect, the registrant's internal control over financial reporting.
ITEM 12. DISCLOSURE OF SECURITIES LENDING ACTIVITIES FOR CLOSED-END MANAGEMENT INVESTMENT COMPANIES.
Not applicable
ITEM 13. EXHIBITS.
(a)(1) Not applicable.
(a)(2) Certifications pursuant to Rule 30a-2(a) under the 1940 Act and Section 302 of the Sarbanes-Oxley Act of 2002 are filed herewith.
(a)(3) Not applicable.
(a)(4) There was no change in the registrant’s independent public accountant for the period covered by this report.
(b) Certifications pursuant to Rule 30a-2(b) under the 1940 Act and Section 906 of the Sarbanes-Oxley Act of 2002 are filed herewith.
SIGNATURES
Pursuant to the requirements of the Securities Exchange Act of 1934 and the Investment Company Act of 1940, the registrant has duly caused this report to be signed on its behalf by the undersigned, thereunto duly authorized.
| (Registrant) | Bluestone Community Development Fund | |
| | | |
| By (Signature and Title) | /s/ Lee A. Calfo | |
| | Lee A. Calfo, President | |
| | (principal executive officer) | |
| | | |
| Date | March 3, 2021 | |
Pursuant to the requirements of the Securities Exchange Act of 1934 and the Investment Company Act of 1940, this report has been signed below by the following persons on behalf of the registrant and in the capacities and on the dates indicated.
| By (Signature and Title) | /s/ Lee A. Calfo | |
| | Lee A. Calfo, President | |
| | (principal executive officer) | |
| | | |
| Date | March 3, 2021 | |
| | | |
| By (Signature and Title) | /s/ Joseph Gladue | |
| | Joseph Gladue, Treasurer | |
| | (principal financial officer) | |
| | | |
| Date | March 3, 2021 | |