Exhibit (c)(3)

CONFIDENTIAL PBF Energy Board Presentation July 26, 2022
CONFIDENTIAL Important Notice This presentation (this “Presentation”) was prepared by Barclays Capital Inc. (“we” or “Barclays”), at the request of PBF Energy Inc. (the “Company”) in the context of an evaluation of the potential transaction further described herein. This Presentation is the intellectual property of Barclays and was prepared exclusively by Barclays in order to assist the Company in the context of an evaluation of the potential transaction further described herein. The effective date of this Presentation is July 22, 2022 and it is valid only for the date specified herein. Barclays has received financial and operating information with respect to the business, operations and prospects of PBF Logistics LP (the “Target”), including financial projections of the Target prepared by management of the Company based on such information (the “Company Target Projections”), which were used in this Presentation. With respect to the Company Target Projections, upon the advice of the Company, we have assumed that such projections have been reasonably prepared on a basis reflecting the best currently available estimates and judgments of the management of the Company as to the future financial performance of the Target and that the Target will perform substantially in accordance with such projections. We assume no responsibility for and we express no view as to any such assumptions, projections and forecasts or estimates or the assumptions on which they are based. In addition, in connection with the Presentation we have reviewed (a) a comparison of the historical financial results and present financial condition of the Target and the Company with those of other companies that we deemed relevant, (b) a comparison of the financial terms of the proposed transaction with the financial terms of certain other transactions that we deemed relevant, and (c) published estimates of independent research analysts with respect to the future financial performance and price targets of the Company and the Target. Barclays may also have obtained information not made available by the Company, including, among other items, demographic, macroeconomic, regulatory, and market information related to the Target and its business mentioned in this Presentation from acknowledged and reliable public sources or from sources that to Barclays’ best knowledge were considered reliable. Barclays did not conduct any independent verification of any such information or any other information received from the Company or the Target involved in the execution of this Presentation. Barclays does not assume liability or responsibility for the precision, accuracy, or completeness of such information, nor does it express any opinion about the reliability of the information supplied and highlights that any errors or changes in such information could significantly affect Barclays’ analysis. In addition, in preparing this Presentation, we have not conducted a physical inspection of the properties and facilities of the Company or the Target and have not made or obtained any evaluations or appraisals of the assets or liabilities of the Company or the Target. Barclays’ work does not intend to be an audit of financial statements or any other information supplied to us by the Company or the Target. Our work took into account the relevance of each item, and therefore assets, rights, and obligations of low relative relevance may not have been the object of detailed analysis. During the preparation of this Presentation, Barclays has adopted as an assumption, with the express consent of the Company, the reliability, accuracy, veracity, completeness, sufficiency, and integrity of all data which was prepared or discussed, and Barclays has not made or obtained any independent evaluation or appraisal of the assets or liabilities of the Company or the Target or their solvency and has further relied upon the assurances of the management of the Company and the Target that they are not aware of any facts or circumstances that would make any such information inaccurate or misleading. The estimates and forecasts contained in this Presentation are inherently subject to uncertainties and various events or factors that are beyond the control of the Company and the Target, as well as of Barclays, especially those whose occurrence depend on future and uncertain events. There is no guarantee that the estimates and projections used in this Presentation will be effectively achieved. The information herein contained relating to the accounting and financial position of the Company, the Target and their markets, are those available as of July 21, 2022 unless otherwise stated herein. Any changes in those positions can affect the results of this Presentation. Barclays does not assume any obligation of updating, reviewing, reaffirming or amending this Presentation, as a result of disclosure of any subsequent information after the date hereof or as result of any other subsequent event or circumstances that may occur after the date of this Presentation. This Presentation was generated according to the economic and market conditions, among others, existing on the date of its preparation, so the conclusion presented is subject to variations of several factors, over which Barclays does not have any control. There is no guarantee that the assumptions, estimates, forecasts, partial or total results, or conclusions used or presented in this Presentation will be effectively reached or verified, in part or in whole. The future results of the Company and the Target may be different from the results included in the projections, and differences may be significant, as a result of several factors, including, but not limited to, changes in the market conditions. This Presentation was prepared to assist the Company in evaluating the Target, but it does not intend to be the only reference for such evaluation, and is not in any way a guarantee in relation to the past or future performance of the Company or the Target nor a formal appraisal, and therefore, it does not contain all the information necessary for such objective, and consequently does not represent nor constitute a proposal, solicitation, suggestion, advice, recommendation, fairness opinion or solvency opinion by Barclays in connection with the proposed transaction referred to herein or any other transaction related to such transaction, as such decision is the sole responsibility of the Company, and Barclays does not assume any responsibility for such decision. The Company shall make its own analysis in relation to any transaction involving the Target, and shall consult its own accounting, tax, and legal advisors before making its own decision about such transaction. This Presentation is confidential and cannot be circulated, copied, published, reproduced or used in any form, neither can it be archived, included or referenced, in whole or in part, in any document, without the previous written consent of Barclays. Barclays highlights that its services do not include advisory services of any nature, such as legal, tax or accounting. Barclays accepts no liability whatsoever for any losses arising from the use of this Presentation or reliance on information contained herein. This Presentation shall be read and interpreted according to the restrictions and qualifications previously mentioned. The reader shall take into account the restrictions and characteristics of the information sources utilized. 1

CONFIDENTIAL Executive Summary
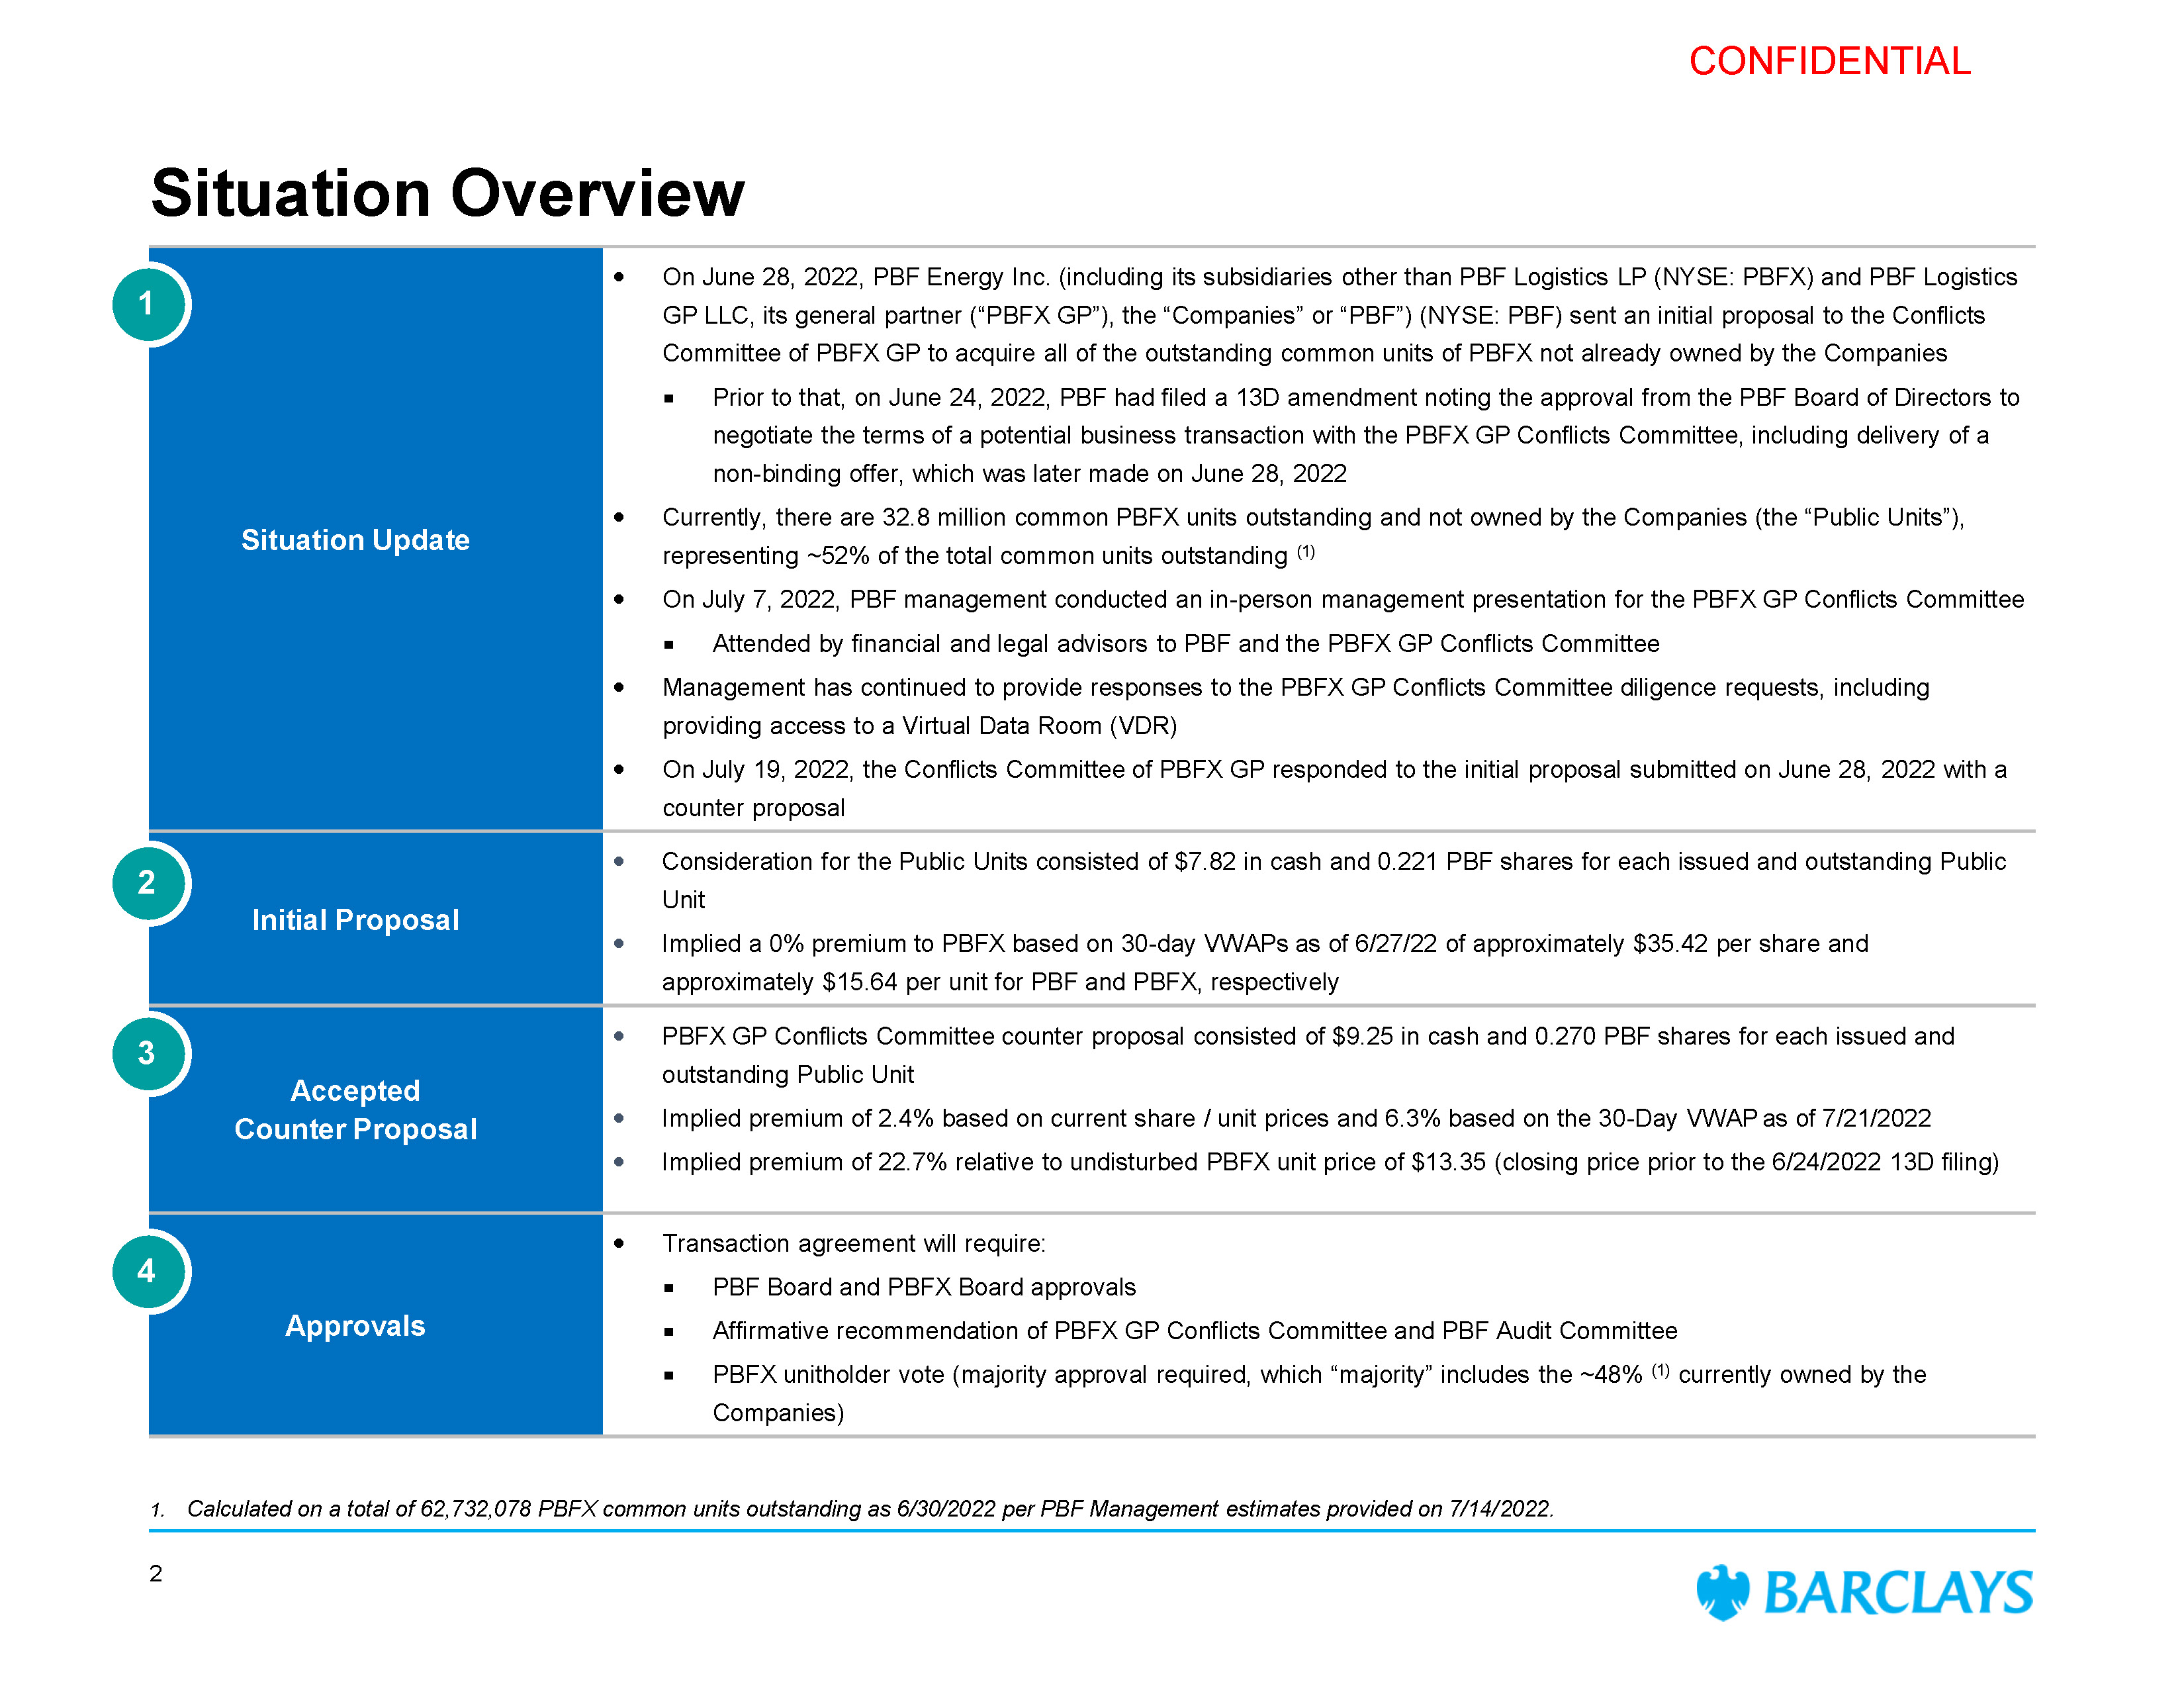
CONFIDENTIAL Situation Overview 1. Calculated on a total of 62,732,078 PBFX common units outstanding as 6/30/2022 per PBF Management estimates provided on 7/14/2022. Situation Update On June 28, 2022, PBF Energy Inc. (including its subsidiaries other than PBF Logistics LP (NYSE: PBFX) and PBF Logistics GP LLC, its general partner (“PBFX GP”), the “Companies” or “PBF”) (NYSE: PBF) sent an initial proposal to the Conflicts Committee of PBFX GP to acquire all of the outstanding common units of PBFX not already owned by the Companies Prior to that, on June 24, 2022, PBF had filed a 13D amendment noting the approval from the PBF Board of Directors to negotiate the terms of a potential business transaction with the PBFX GP Conflicts Committee, including delivery of a non-binding offer, which was later made on June 28, 2022 Currently, there are 32.8 million common PBFX units outstanding and not owned by the Companies (the “Public Units”), representing ~52% of the total common units outstanding (1) On July 7, 2022, PBF management conducted an in-person management presentation for the PBFX GP Conflicts Committee Attended by financial and legal advisors to PBF and the PBFX GP Conflicts Committee Management has continued to provide responses to the PBFX GP Conflicts Committee diligence requests, including providing access to a Virtual Data Room (VDR) On July 19, 2022, the Conflicts Committee of PBFX GP responded to the initial proposal submitted on June 28, 2022 with a counter proposal Initial Proposal Consideration for the Public Units consisted of $7.82 in cash and 0.221 PBF shares for each issued and outstanding Public Unit Implied a 0% premium to PBFX based on 30-day VWAPs as of 6/27/22 of approximately $35.42 per share and approximately $15.64 per unit for PBF and PBFX, respectively Accepted Counter Proposal PBFX GP Conflicts Committee counter proposal consisted of $9.25 in cash and 0.270 PBF shares for each issued and outstanding Public Unit Implied premium of 2.4% based on current share / unit prices and 6.3% based on the 30-Day VWAP as of 7/21/2022 Implied premium of 22.7% relative to undisturbed PBFX unit price of $13.35 (closing price prior to the 6/24/2022 13D filing) Approvals Transaction agreement will require: PBF Board and PBFX Board approvals Affirmative recommendation of PBFX GP Conflicts Committee and PBF Audit Committee PBFX unitholder vote (majority approval required, which “majority” includes the ~48% (1) currently owned by the Companies) 1 2 3 4 2
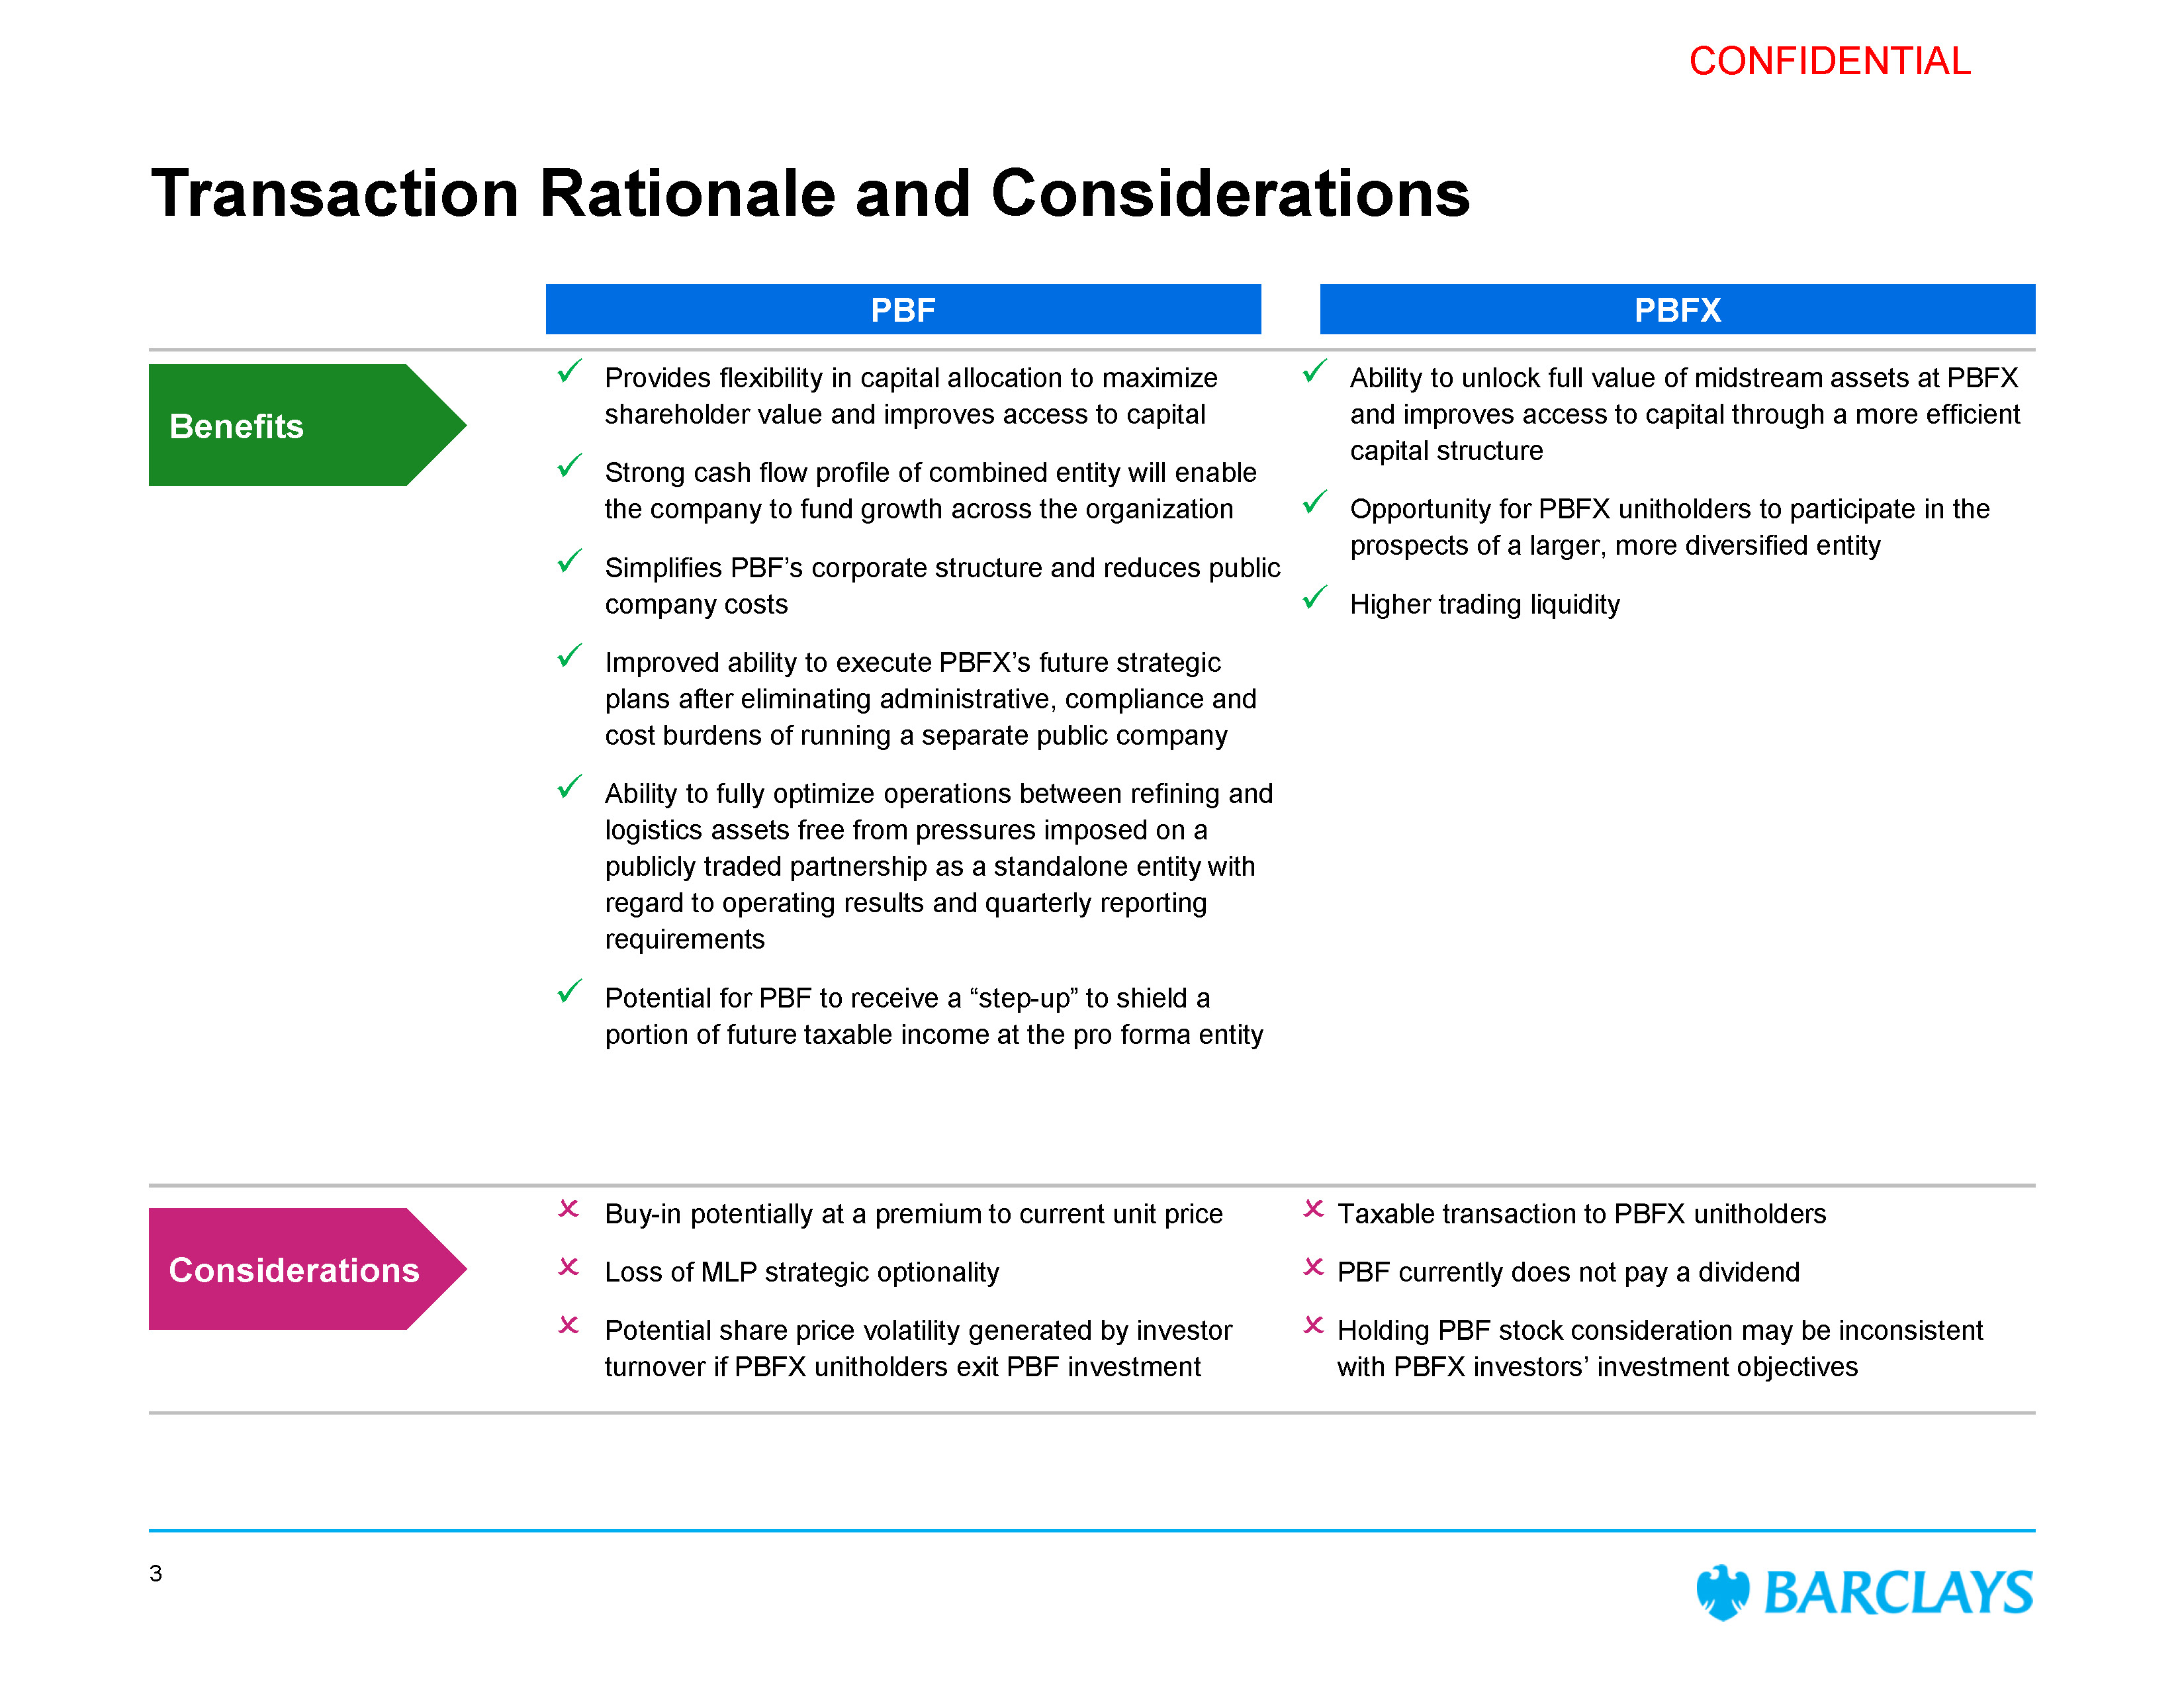
CONFIDENTIAL Transaction Rationale and Considerations Provides flexibility in capital allocation to maximize Benefits shareholder value and improves access to capital Strong cash flow profile of combined entity will enable the company to fund growth across the organization Simplifies PBF’s corporate structure and reduces public company costs Improved ability to execute PBFX’s future strategic plans after eliminating administrative, compliance and cost burdens of running a separate public company Ability to fully optimize operations between refining and logistics assets free from pressures imposed on a publicly traded partnership as a standalone entity with regard to operating results and quarterly reporting requirements Potential for PBF to receive a “step-up” to shield a portion of future taxable income at the pro forma entity Ability to unlock full value of midstream assets at PBFX and improves access to capital through a more efficient capital structure Opportunity for PBFX unitholders to participate in the prospects of a larger, more diversified entity Higher trading liquidity Buy-in potentially at a premium to current unit price Considerations Loss of MLP strategic optionality Potential share price volatility generated by investor turnover if PBFX unitholders exit PBF investment Taxable transaction to PBFX unitholders PBF currently does not pay a dividend Holding PBF stock consideration may be inconsistent with PBFX investors’ investment objectives 3 PBFX PBF
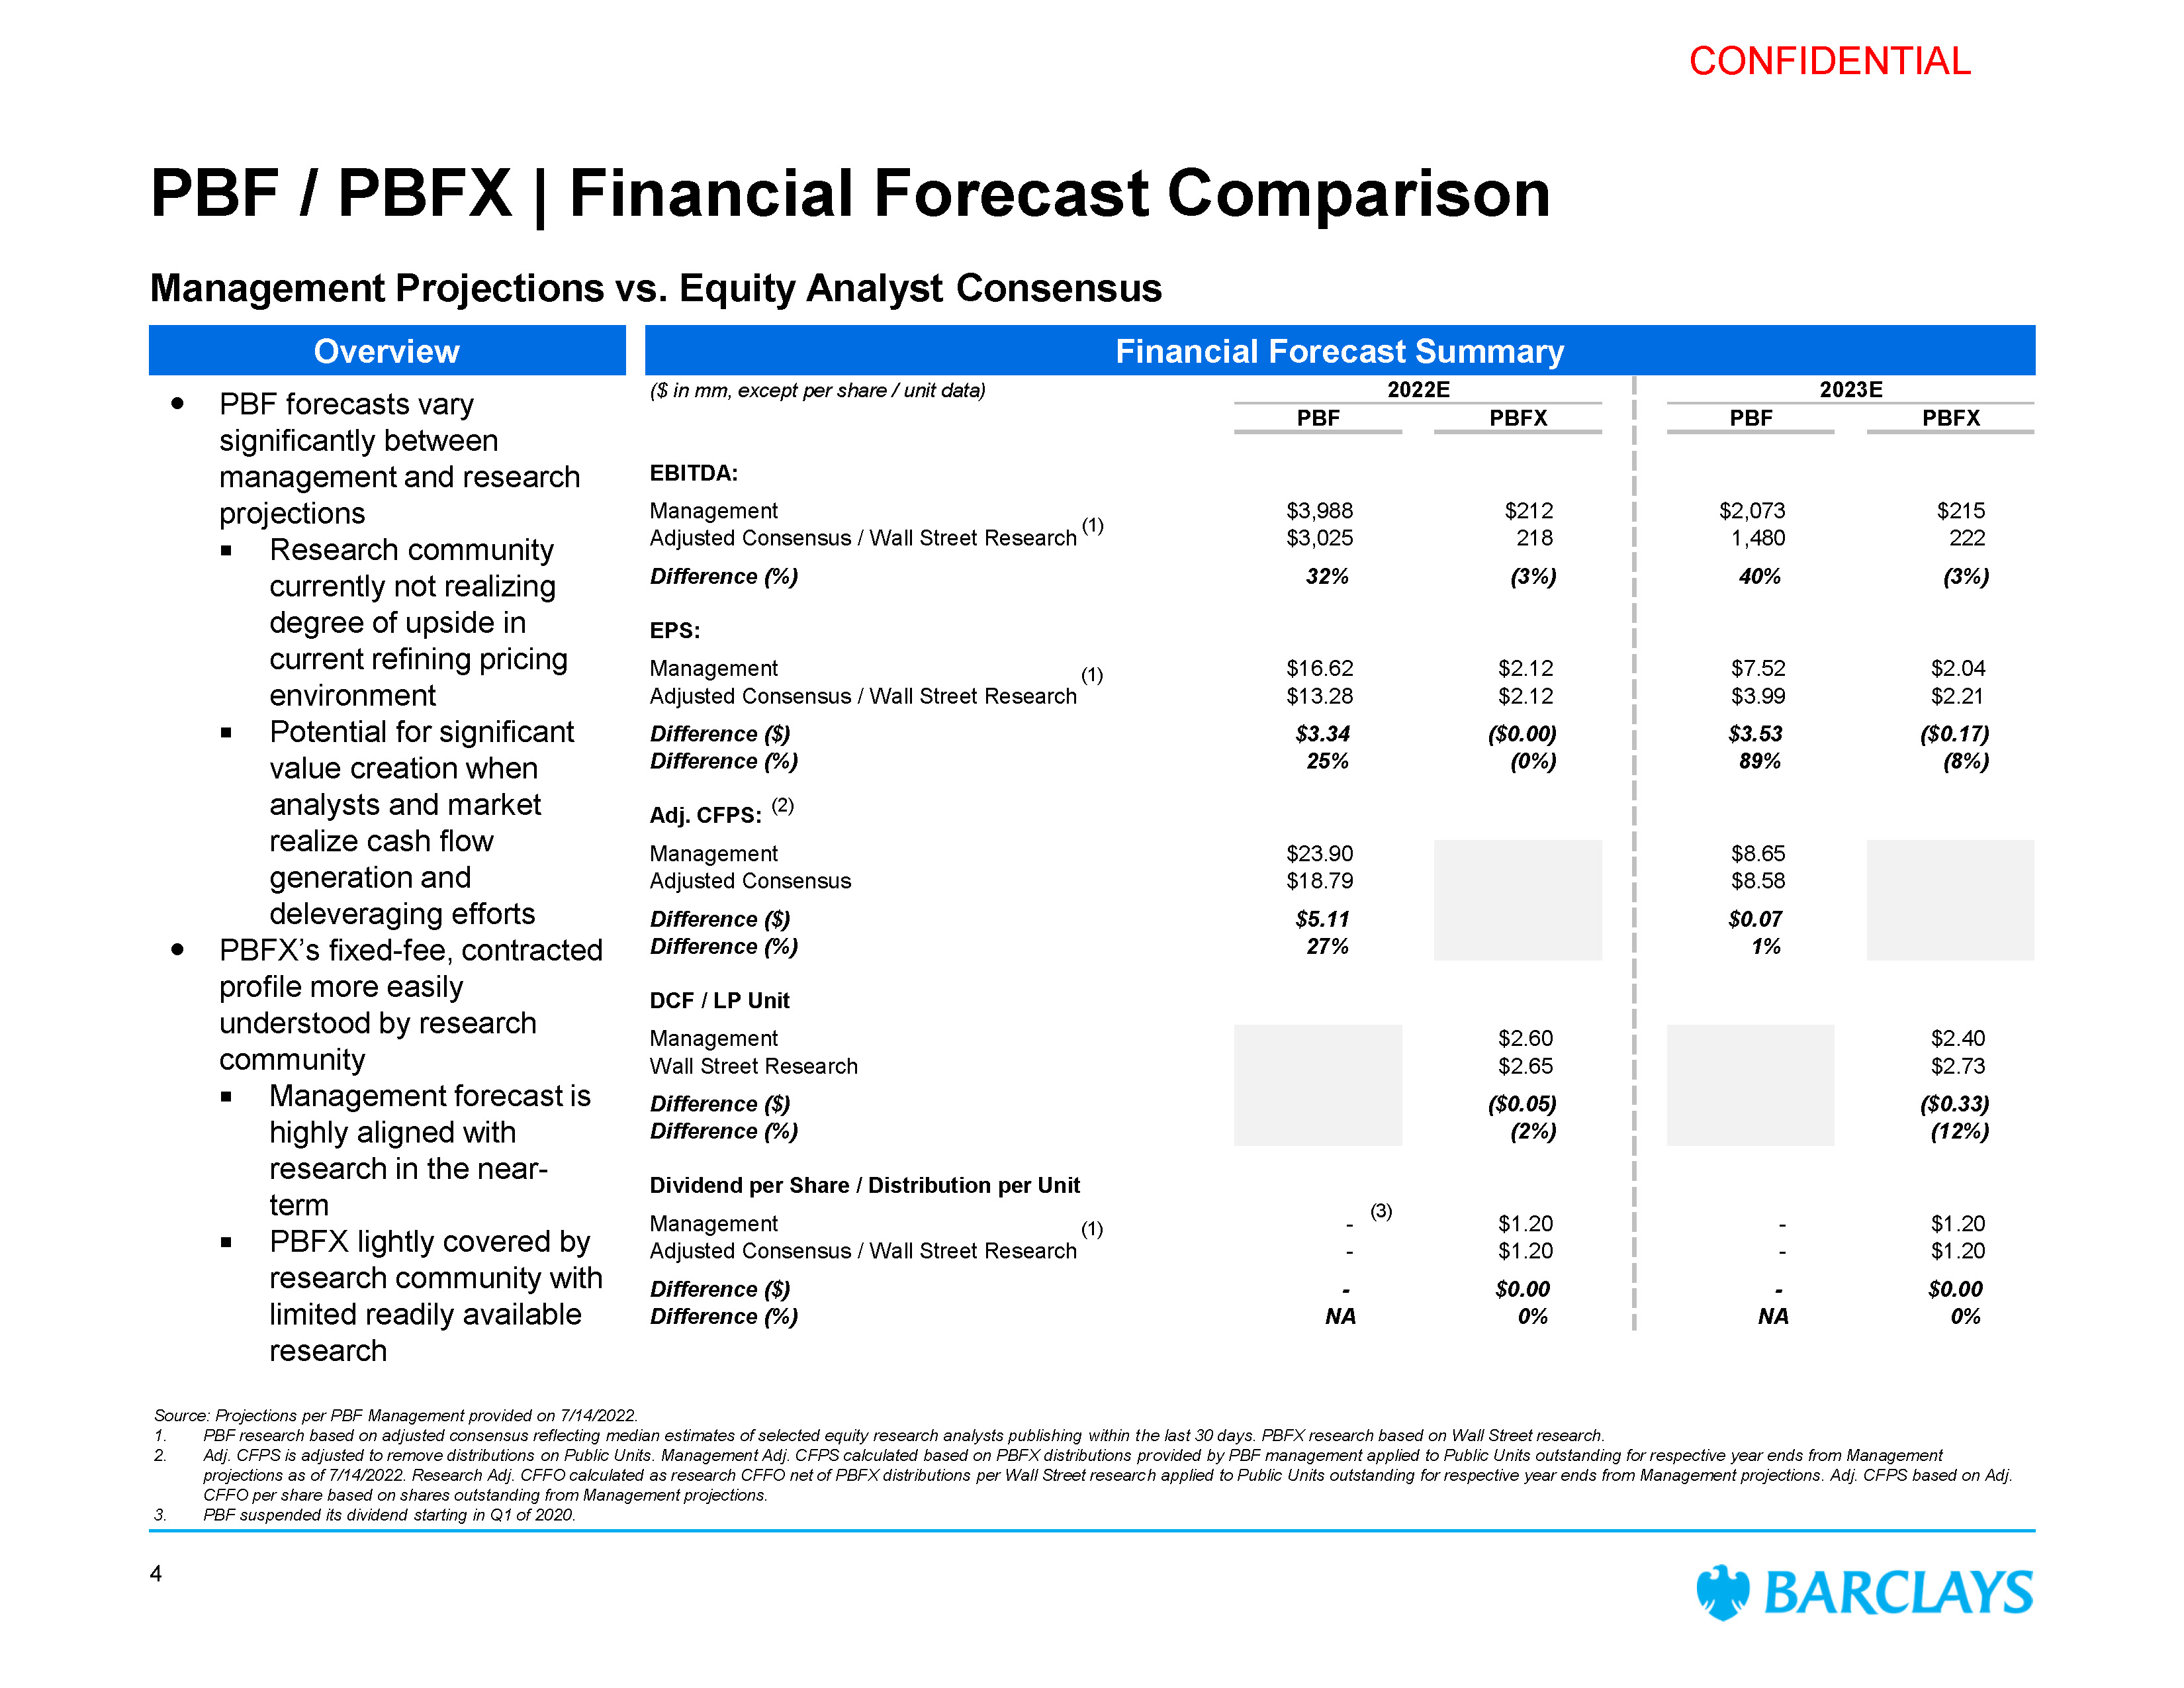
CONFIDENTIAL PBF / PBFX | Financial Forecast Comparison Management Projections vs. Equity Analyst Consensus Financial Forecast Summary Overview ($ in mm, except per share / unit data) 2022E 2023E PBF PBFX PBF PBFX EBITDA: $1 Adjusted Consensus Difference ($) Difference (%) Management Adjusted Consensus / Wall Street Research (1) $3,988 $3,025 $212 218 $2,073 1,480 Difference (%) 32% (3%) 4 EPS: Management (1) $16.62 $2.12 Adjusted Consensus / Wall Street Research $13.28 $2.12 Difference ($) $3.34 ($0 Difference (%) 25% Adj. CFPS: (2) Management $23.9 DCF / LP Unit Management Wall Street Research Difference ($) Difference (%) Dividend per Share / Management Adjusted Co Differ Di PBF forecasts vary significantly between management and research projections 4 Research community currently not realizing degree of upside in current refining pricing environment Potential for significant value creation when analysts and market realize cash flow generation and deleveraging efforts PBFX’s fixed-fee, contracted profile more easily understood by research community Management forecast is highly aligned with research in the near- term PBFX lightly covered by research community with limited readily available research Source: Projections per PBF Management provided on 7/14/2022. 1. 2. PBF research based on adjusted consensus reflecting median estimates of selected equity research analysts publishing within the last 30 days. PBFX research based on Wall Street research. Adj. CFPS is adjusted to remove distributions on Public Units. Management Adj. CFPS calculated based on PBFX distributions provided by PBF management applied to Public Units outstanding for respective year ends from Management projections as of 7/14/2022. Research Adj. CFFO calculated as research CFFO net of PBFX distributions per Wall Street research applied to Public Units outstanding for respective year ends from Management projections. Adj. CFPS based on Adj. CFFO per share based on shares outstanding from Management projections. PBF suspended its dividend starting in Q1 of 2020. 3. (1) (3)
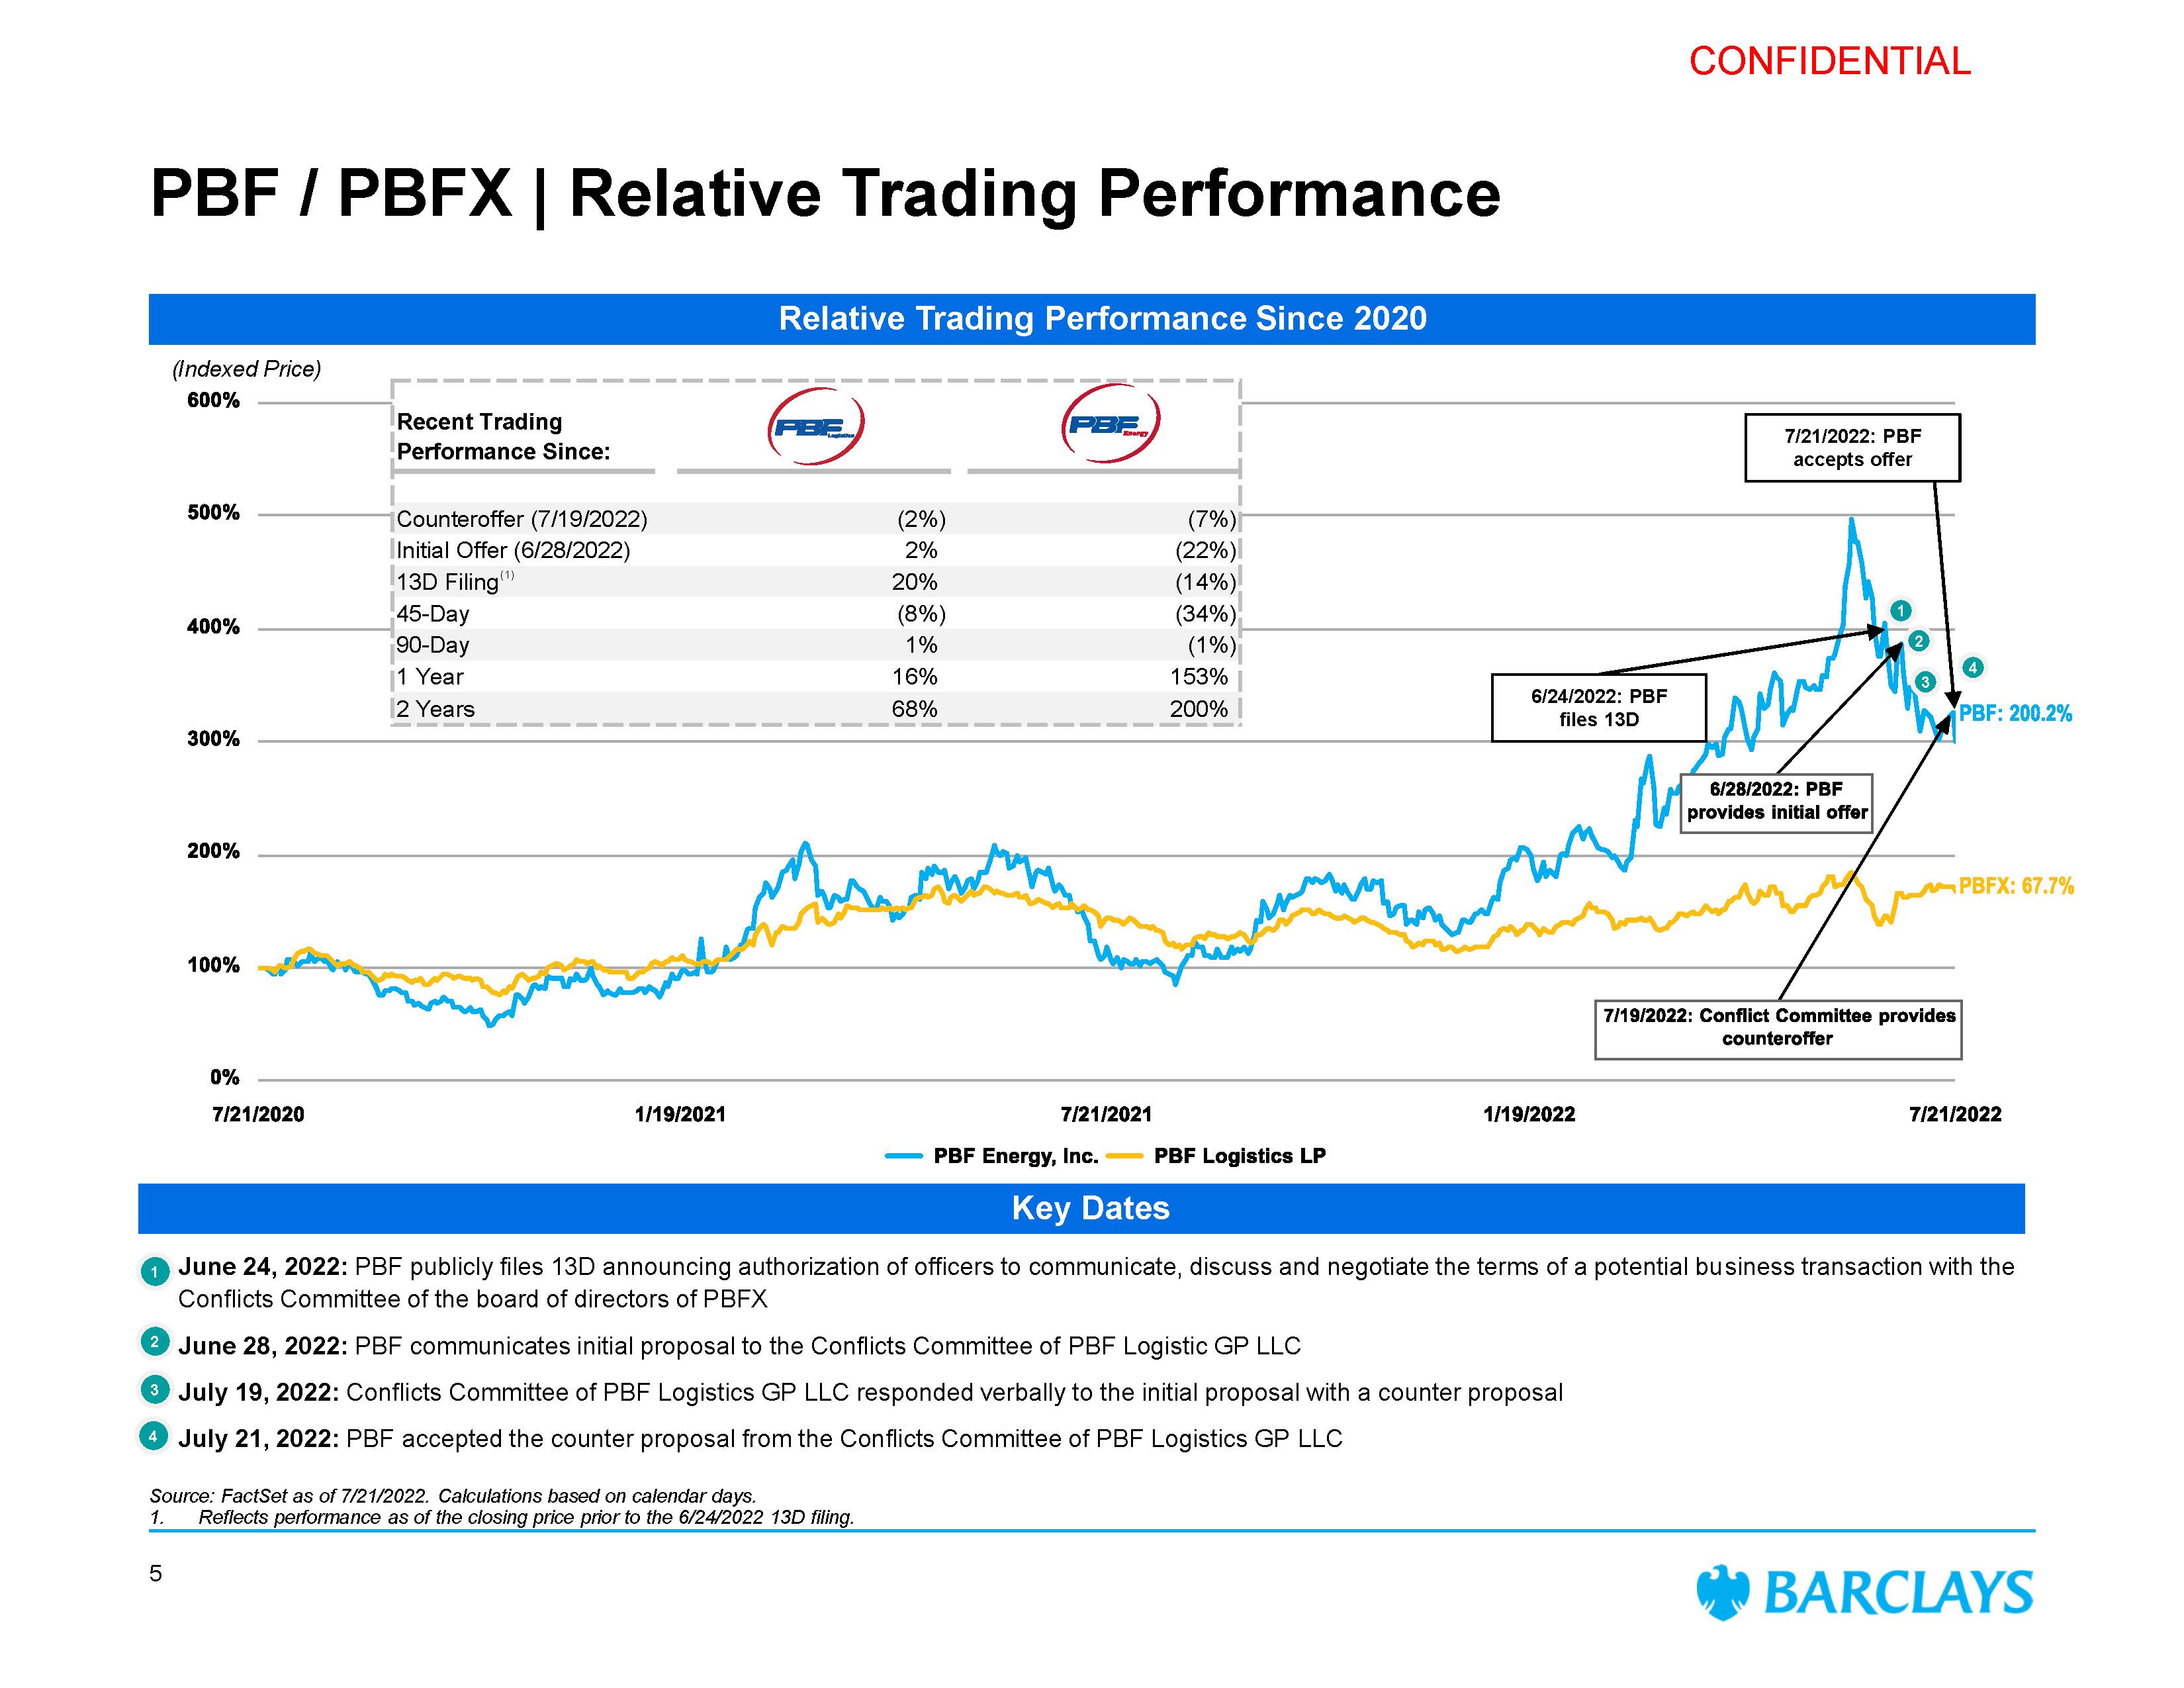
CONFIDENTIAL PBF / PBFX | Relative Trading Performance July 21, 2022: PBF accepted the counter proposal from the Conflicts Committee of PBF Logistics GP LLC (Indexed Price) Relative Trading Performance Since 2020 Key Dates 3 1 June 24, 2022: PBF publicly files 13D announcing authorization of officers to communicate, discuss and negotiate the terms of a potential business transaction with the Conflicts Committee of the board of directors of PBFX 2 June 28, 2022: PBF communicates initial proposal to the Conflicts Committee of PBF Logistic GP LLC 3 July 19, 2022: Conflicts Committee of PBF Logistics GP LLC responded verbally to the initial proposal with a counter proposal 6/24/2022: PBF files 13D Source: FactSet as of 7/21/2022. Calculations based on calendar days. 7/21/2022: PBF accepts offer 1 2 4 4 Recent Trading Performance Since: Counteroffer (7/19/2022) (2%) (7%) Initial Offer (6/28/2022) 2% (22%) 13D Filing(1) 20% (14%) 45-Day (8%) (34%) 90-Day 1% (1%) 1 Year 16% 153% 2 Years 68% 200% 1. Reflects performance as of the closing price prior to the 6/24/2022 13D filing. 5
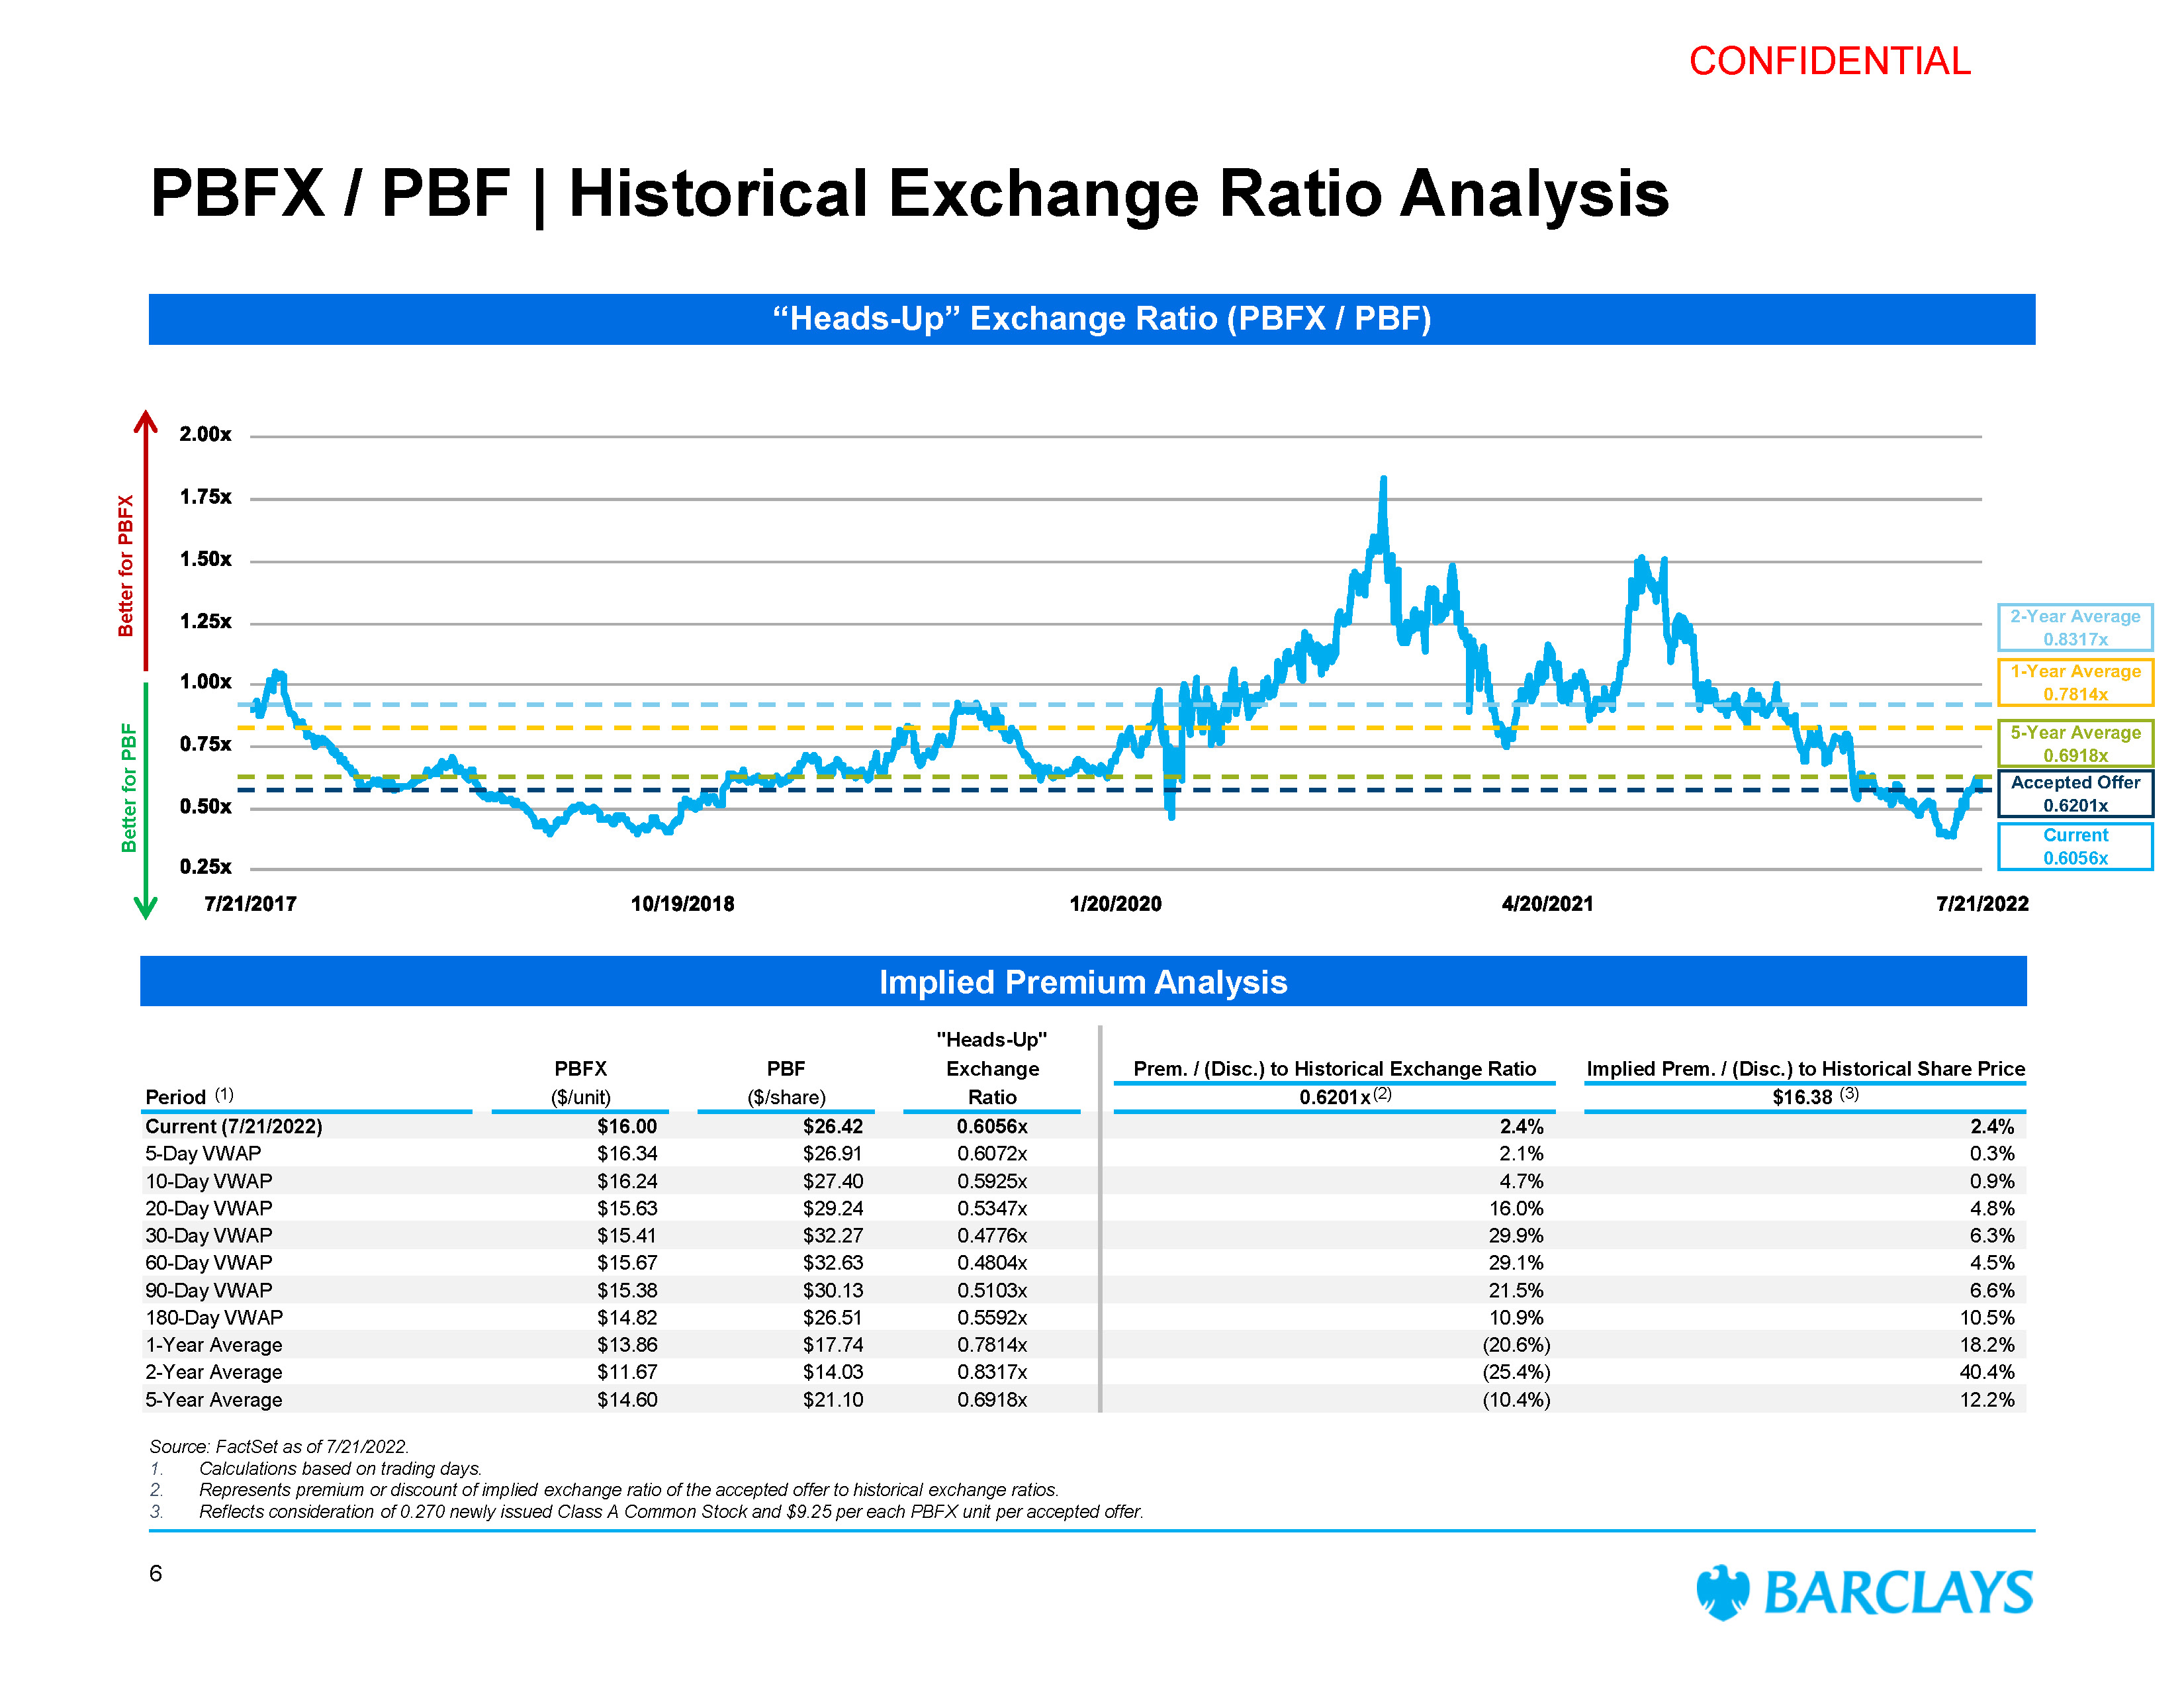
CONFIDENTIAL PBFX / PBF | Historical Exchange Ratio Analysis Implied Premium Analysis 2-Year Average 0.8317x 1-Year Average 0.7814x 5-Year Average 0.6918x Accepted Offer 0.6201x Current 0.6056x Prem. / (Disc.) to Historical Exchange Ratio Implied Prem. / (Disc.) to Historical Share Price PBFX ($/unit) PBF ($/share) "Heads-Up" Exchange Ratio Current (7/21/2022) $16.00 $26.42 0.6056x 2.4% 2.4% 5-Day VWAP $16.34 $26.91 0.6072x 2.1% 0.3% 10-Day VWAP $16.24 $27.40 0.5925x 4.7% 0.9% 20-Day VWAP $15.63 $29.24 0.5347x 16.0% 4.8% 30-Day VWAP $15.41 $32.27 0.4776x 29.9% 6.3% 60-Day VWAP $15.67 $32.63 0.4804x 29.1% 4.5% 90-Day VWAP $15.38 $30.13 0.5103x 21.5% 6.6% 180-Day VWAP $14.82 $26.51 0.5592x 10.9% 10.5% 1-Year Average $13.86 $17.74 0.7814x (20.6%) 18.2% 2-Year Average $11.67 $14.03 0.8317x (25.4%) 40.4% 5-Year Average $14.60 $21.10 0.6918x (10.4%) 12.2% Period (1) 0.6201x (2) $16.38 (3) Better for PBFX Better for PBF “Heads-Up” Exchange Ratio (PBFX / PBF) Source: FactSet as of 7/21/2022. Calculations based on trading days. Represents premium or discount of implied exchange ratio of the accepted offer to historical exchange ratios. 3. Reflects consideration of 0.270 newly issued Class A Common Stock and $9.25 per each PBFX unit per accepted offer. 6
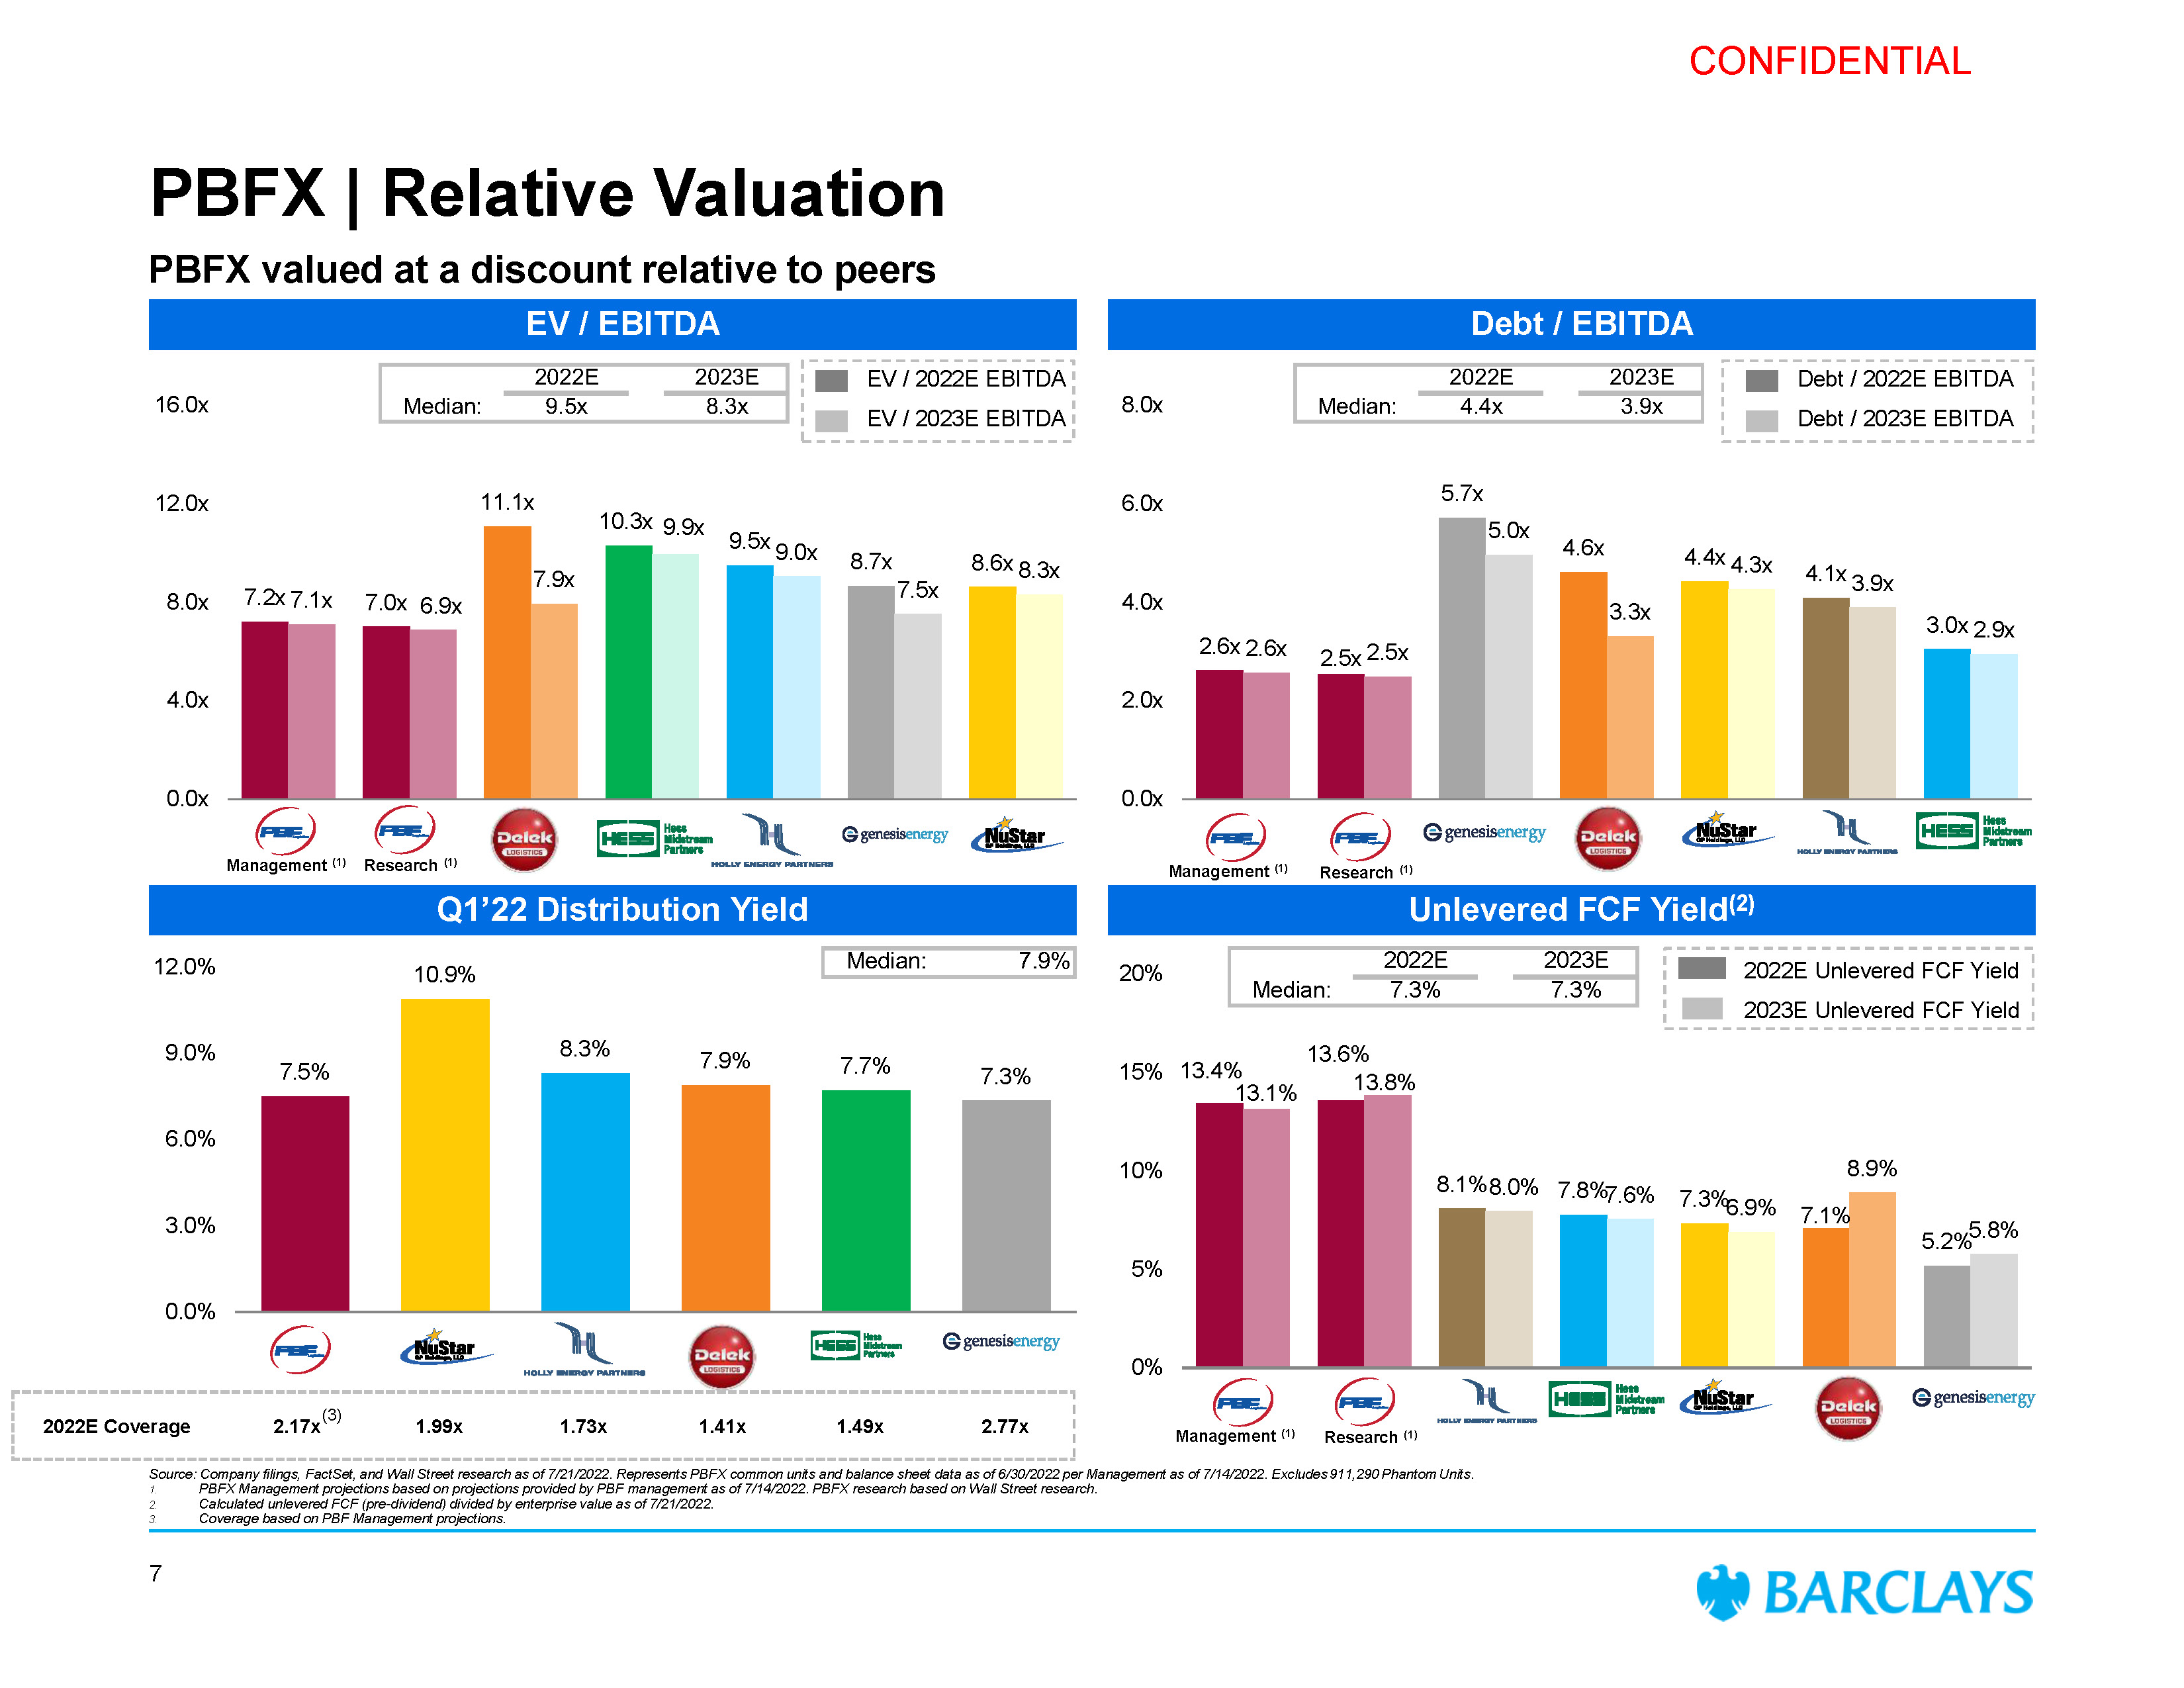
CONFIDENTIAL 5.7x 4.6x 2.6x 2.6x 2.5x 2.5x 5.0x 3.3x 4.4x 4.3x 4.1x 3.9x 3.0x 2.9x 0.0x 2.0x 4.0x 6.0x 8.0x 7.5% 10.9% 8.3% 7.9% 7.7% 7.3% 0.0% 3.0% 6.0% 9.0% 12.0% 7.1% 13.1% 13.6% 13.8% 8.1%8.0% 7.8% 7.6% 7.3%6.9% 8.9% 5.2%5.8% 15% 13.4% 0% 5% 10% 20% 7.2x 11.1x 9.5x 8.7x 7.1x 7.0x 6.9x 7.9x 10.3x 9.9x 9.0x 7.5x 8.6x 8.3x 0.0x 4.0x 8.0x 12.0x 16.0x PBFX | Relative Valuation EV / EBITDA Debt / EBITDA Q1’22 Distribution Yield Unlevered FCF Yield(2) EV / 2022E EBITDA EV / 2023E EBITDA Debt / 2022E EBITDA Debt / 2023E EBITDA 2022E Unlevered FCF Yield 2023E Unlevered FCF Yield PBFX valued at a discount relative to peers 2022E Median: 7.3% 2023E 7.3% 2022E Median: 4.4x 2023E 3.9x 2022E Median: 9.5x 2023E 8.3x Median: 7.9% Management (1) Research (1) Source: Company filings, FactSet, and Wall Street research as of 7/21/2022. Represents PBFX common units and balance sheet data as of 6/30/2022 per Management as of 7/14/2022. Excludes 911,290 Phantom Units. PBFX Management projections based on projections provided by PBF management as of 7/14/2022. PBFX research based on Wall Street research. Calculated unlevered FCF (pre-dividend) divided by enterprise value as of 7/21/2022. Coverage based on PBF Management projections. Management (1) Research (1) Management (1) Research (1) 2022E Coverage 2.17x(3) 1.99x 1.73x 1.41x 1.49x 2.77x 7
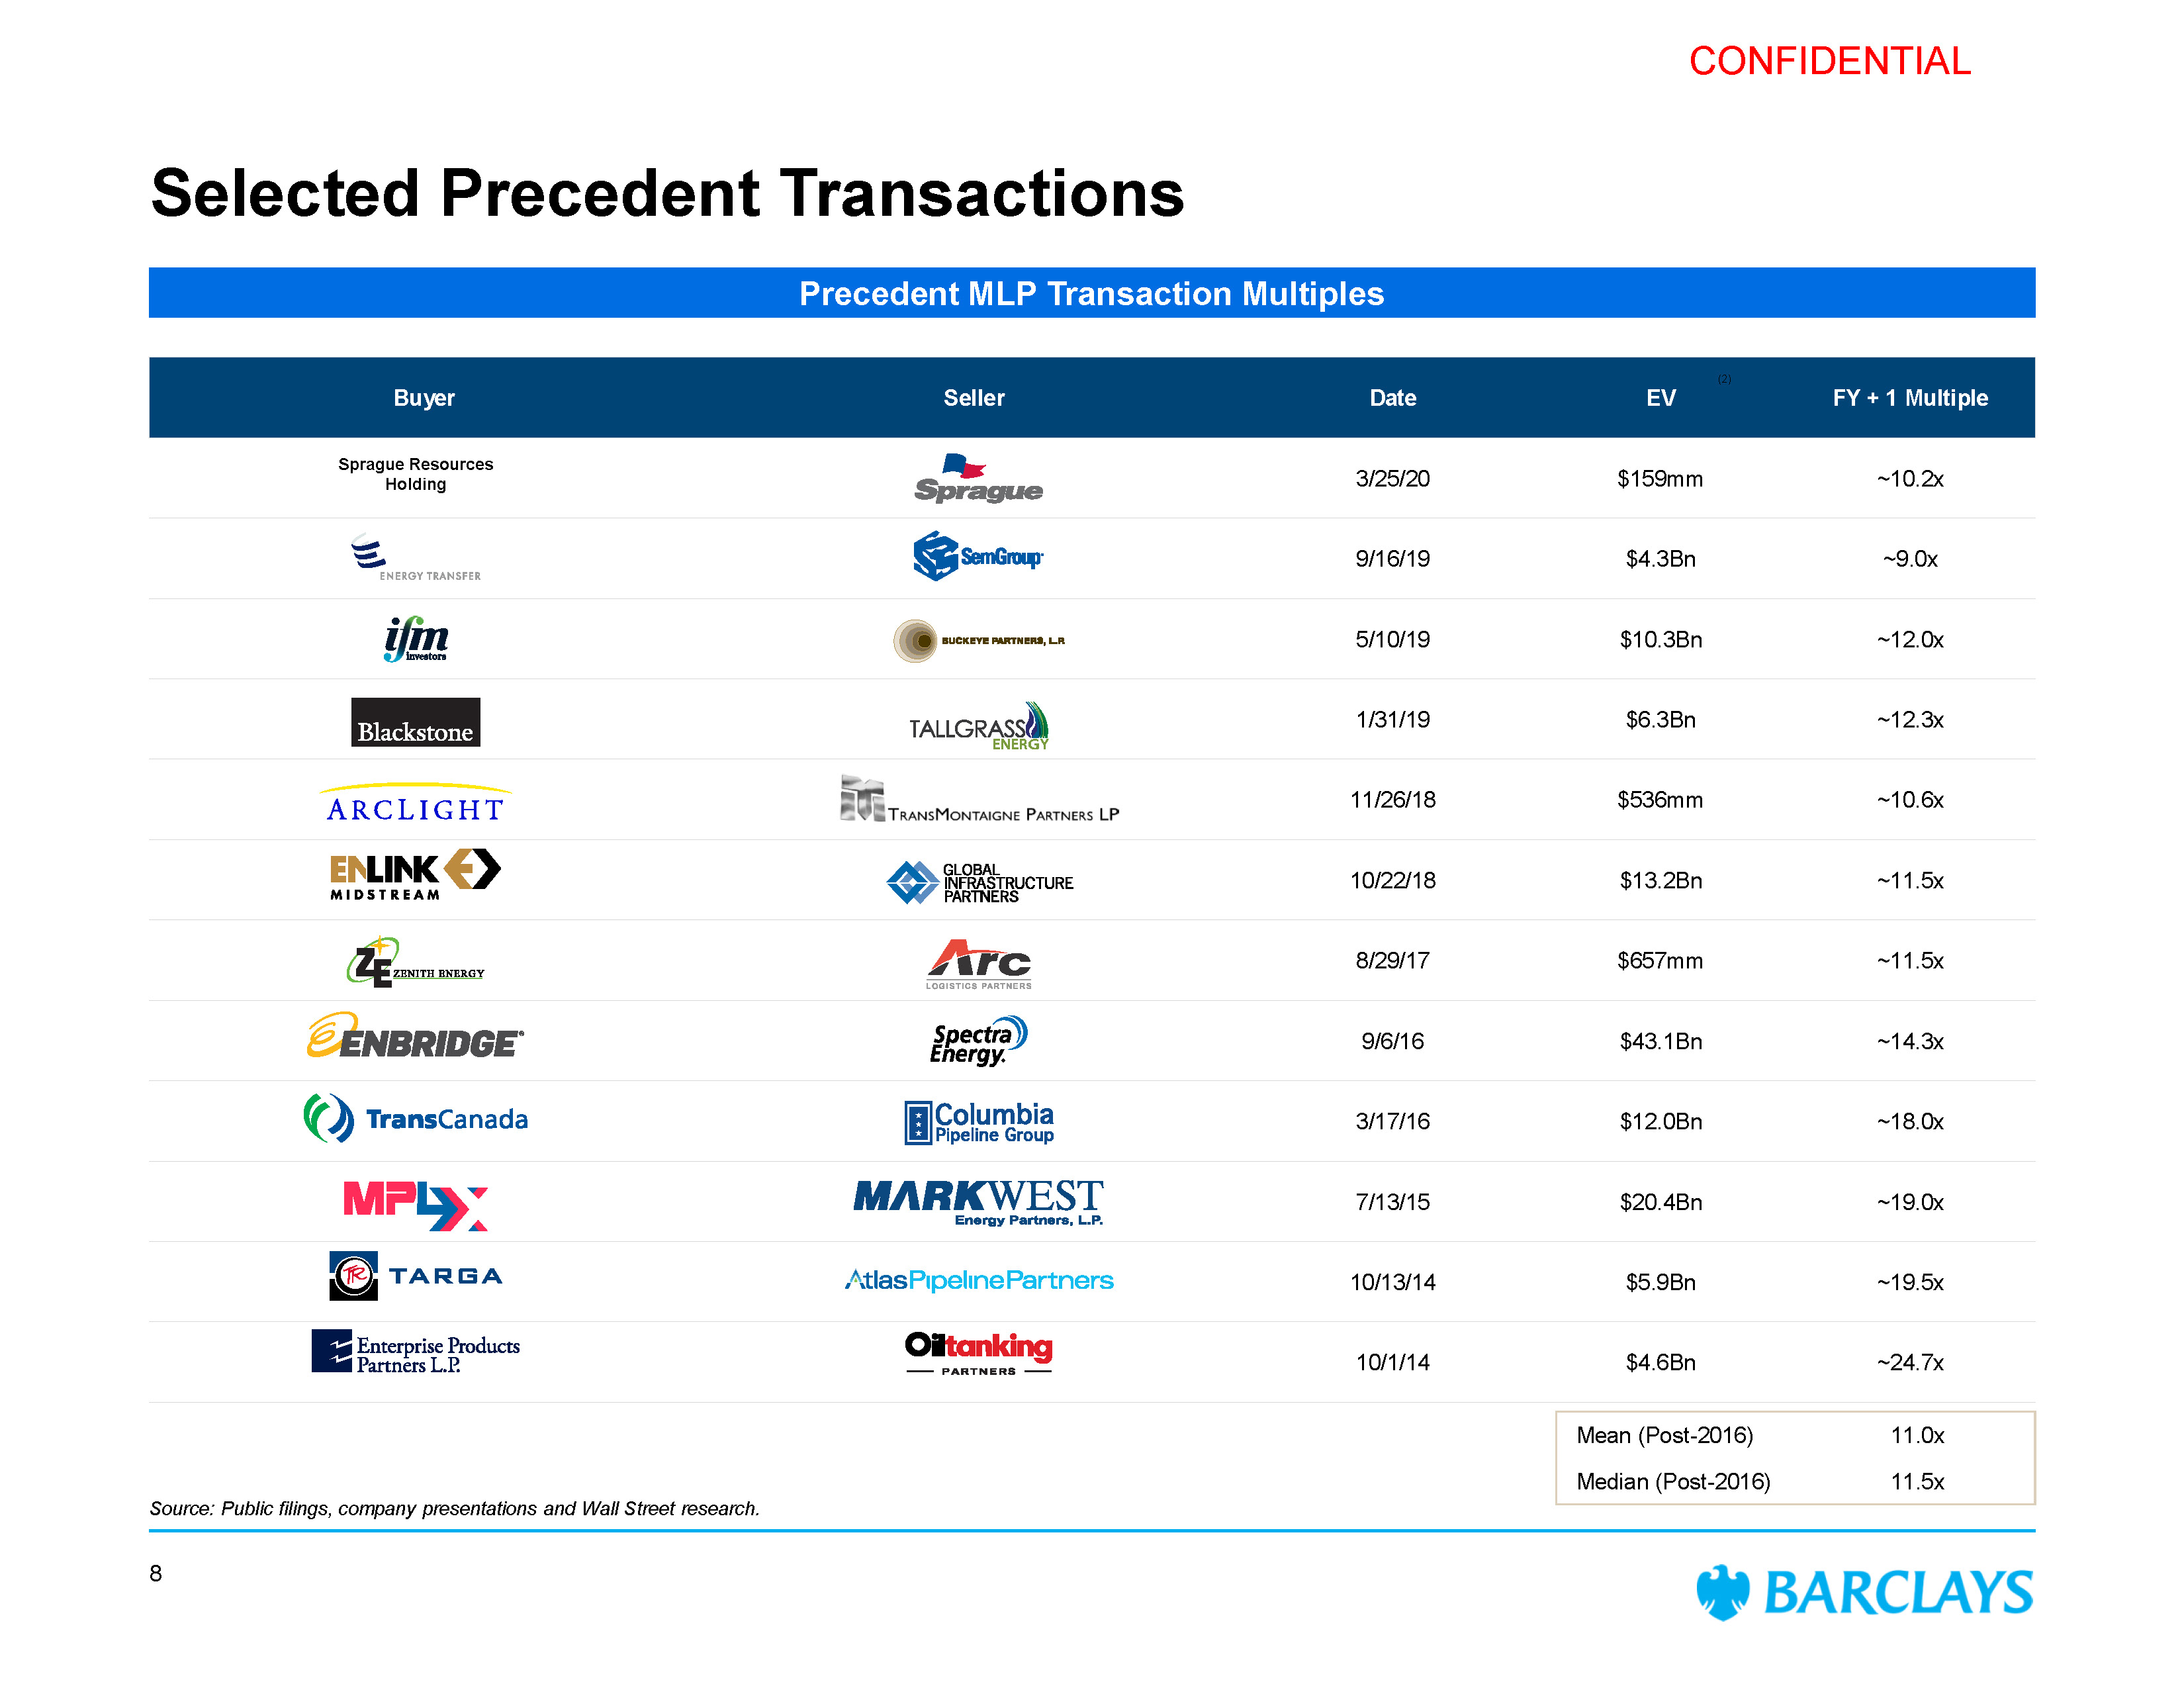
CONFIDENTIAL Selected Precedent Transactions Source: Public filings, company presentations and Wall Street research. Precedent MLP Transaction Multiples Buyer Seller Date (2) EV FY + 1 Multiple Sprague Resource Holding s 3/25/20 $159mm ~10.2x ® 9/16/19 $4.3Bn ~9.0x 5/10/19 $10.3Bn ~12.0x 1/31/19 $6.3Bn ~12.3x 11/26/18 $536mm ~10.6x 10/22/18 $13.2Bn ~11.5x 8/29/17 $657mm ~11.5x 9/6/16 $43.1Bn ~14.3x 3/17/16 $12.0Bn ~18.0x 7/13/15 $20.4Bn ~19.0x 10/13/14 $5.9Bn ~19.5x 10/1/14 $4.6Bn Mean (Post-2016) Median (Post-2016) ~24.7x 11.0x 11.5x 8
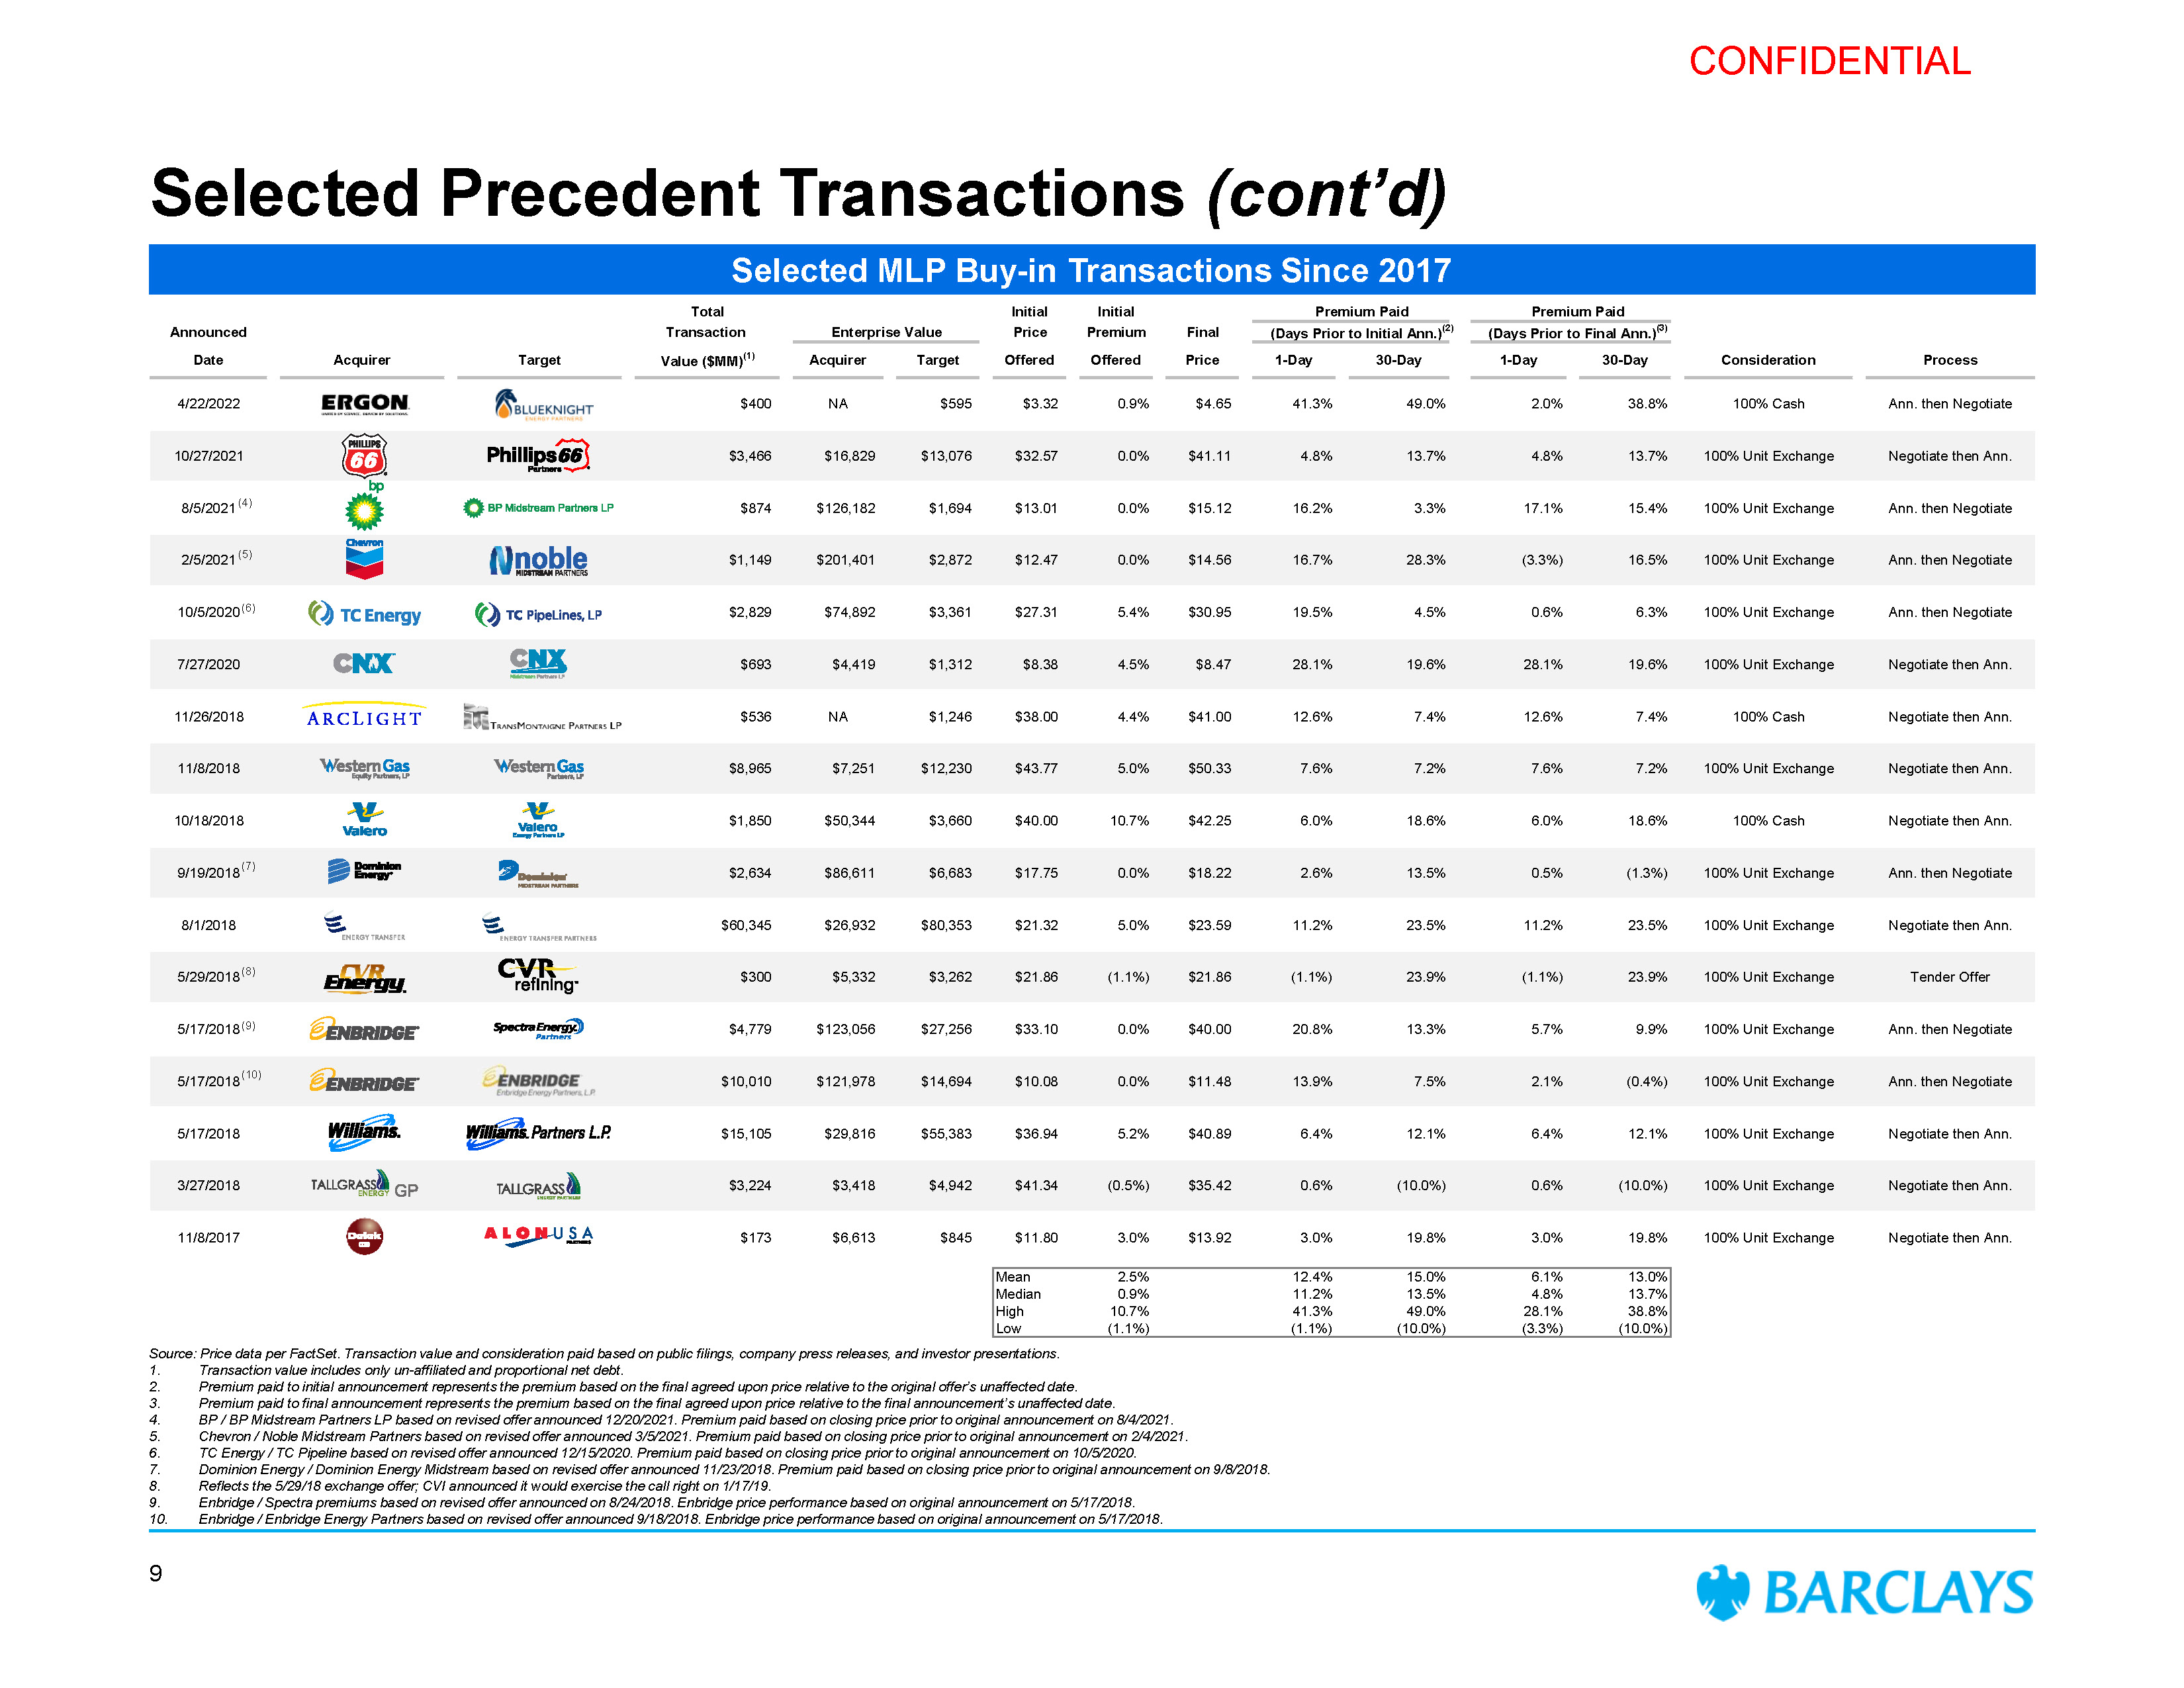
CONFIDENTIAL Total Initial Initial Premium Paid Premium Paid Announced Transaction Enterprise Value Price Premium Final (Days Prior to Initial Ann.)(2) (Days Prior to Final Ann.)(3) Date Acquirer Target Value ($MM)(1) Acquirer Target Offered Offered Price 1-Day 30-Day 1-Day 30-Day Consideration Process 4/22/2022 $400 NA $595 $3.32 0.9% $4.65 41.3% 49.0% 2.0% 38.8% 100% Cash Ann. then Negotiate 10/27/2021 $3,466 $16,829 $13,076 $32.57 0.0% $41.11 4.8% 13.7% 4.8% 13.7% 100% Unit Exchange Negotiate then Ann. 8/5/2021 (4) $874 $126,182 $1,694 $13.01 0.0% $15.12 16.2% 3.3% 17.1% 15.4% 100% Unit Exchange Ann. then Negotiate 2/5/2021 (5) $1,149 $201,401 $2,872 $12.47 0.0% $14.56 16.7% 28.3% (3.3%) 16.5% 100% Unit Exchange Ann. then Negotiate 10/5/2020 (6) $2,829 $74,892 $3,361 $27.31 5.4% $30.95 19.5% 4.5% 0.6% 6.3% 100% Unit Exchange Ann. then Negotiate 7/27/2020 $693 $4,419 $1,312 $8.38 4.5% $8.47 28.1% 19.6% 28.1% 19.6% 100% Unit Exchange Negotiate then Ann. 11/26/2018 $536 NA $1,246 $38.00 4.4% $41.00 12.6% 7.4% 12.6% 7.4% 100% Cash Negotiate then Ann. 11/8/2018 $8,965 $7,251 $12,230 $43.77 5.0% $50.33 7.6% 7.2% 7.6% 7.2% 100% Unit Exchange Negotiate then Ann. 10/18/2018 $1,850 $50,344 $3,660 $40.00 10.7% $42.25 6.0% 18.6% 6.0% 18.6% 100% Cash Negotiate then Ann. 9/19/2018 (7) $2,634 $86,611 $6,683 $17.75 0.0% $18.22 2.6% 13.5% 0.5% (1.3%) 100% Unit Exchange Ann. then Negotiate 8/1/2018 $60,345 $26,932 $80,353 $21.32 5.0% $23.59 11.2% 23.5% 11.2% 23.5% 100% Unit Exchange Negotiate then Ann. 5/29/2018 (8) $300 $5,332 $3,262 $21.86 (1.1%) $21.86 (1.1%) 23.9% (1.1%) 23.9% 100% Unit Exchange Tender Offer 5/17/2018 (9) $4,779 $123,056 $27,256 $33.10 0.0% $40.00 20.8% 13.3% 5.7% 9.9% 100% Unit Exchange Ann. then Negotiate 5/17/2018 (10) $10,010 $121,978 $14,694 $10.08 0.0% $11.48 13.9% 7.5% 2.1% (0.4%) 100% Unit Exchange Ann. then Negotiate 5/17/2018 $15,105 $29,816 $55,383 $36.94 5.2% $40.89 6.4% 12.1% 6.4% 12.1% 100% Unit Exchange Negotiate then Ann. 3/27/2018 $3,224 $3,418 $4,942 $41.34 (0.5%) $35.42 0.6% (10.0%) 0.6% (10.0%) 100% Unit Exchange Negotiate then Ann. 11/8/2017 $173 $6,613 $845 $11.80 3.0% $13.92 3.0% 19.8% 3.0% 19.8% 100% Unit Exchange Negotiate then Ann. Mean 2.5% 12.4% 15.0% 6.1% 13.0% Median 0.9% 11.2% 13.5% 4.8% 13.7% High 10.7% 41.3% 49.0% 28.1% 38.8% Low (1.1%) (1.1%) (10.0%) (3.3%) (10.0%) Source: Price data per FactSet. Transaction value and consideration paid based on public filings, company press releases, and investor presentations. 1. 2. 3. 4. 5. 6. 7. 8. 9. 10. Transaction value includes only un-affiliated and proportional net debt. Premium paid to initial announcement represents the premium based on the final agreed upon price relative to the original offer’s unaffected date. Premium paid to final announcement represents the premium based on the final agreed upon price relative to the final announcement’s unaffected date. BP / BP Midstream Partners LP based on revised offer announced 12/20/2021. Premium paid based on closing price prior to original announcement on 8/4/2021. Chevron / Noble Midstream Partners based on revised offer announced 3/5/2021. Premium paid based on closing price prior to original announcement on 2/4/2021. TC Energy / TC Pipeline based on revised offer announced 12/15/2020. Premium paid based on closing price prior to original announcement on 10/5/2020. Dominion Energy / Dominion Energy Midstream based on revised offer announced 11/23/2018. Premium paid based on closing price prior to original announcement on 9/8/2018. Reflects the 5/29/18 exchange offer; CVI announced it would exercise the call right on 1/17/19. Enbridge / Spectra premiums based on revised offer announced on 8/24/2018. Enbridge price performance based on original announcement on 5/17/2018. Enbridge / Enbridge Energy Partners based on revised offer announced 9/18/2018. Enbridge price performance based on original announcement on 5/17/2018. Selected Precedent Transactions (cont’d) Selected MLP Buy-in Transactions Since 2017 9
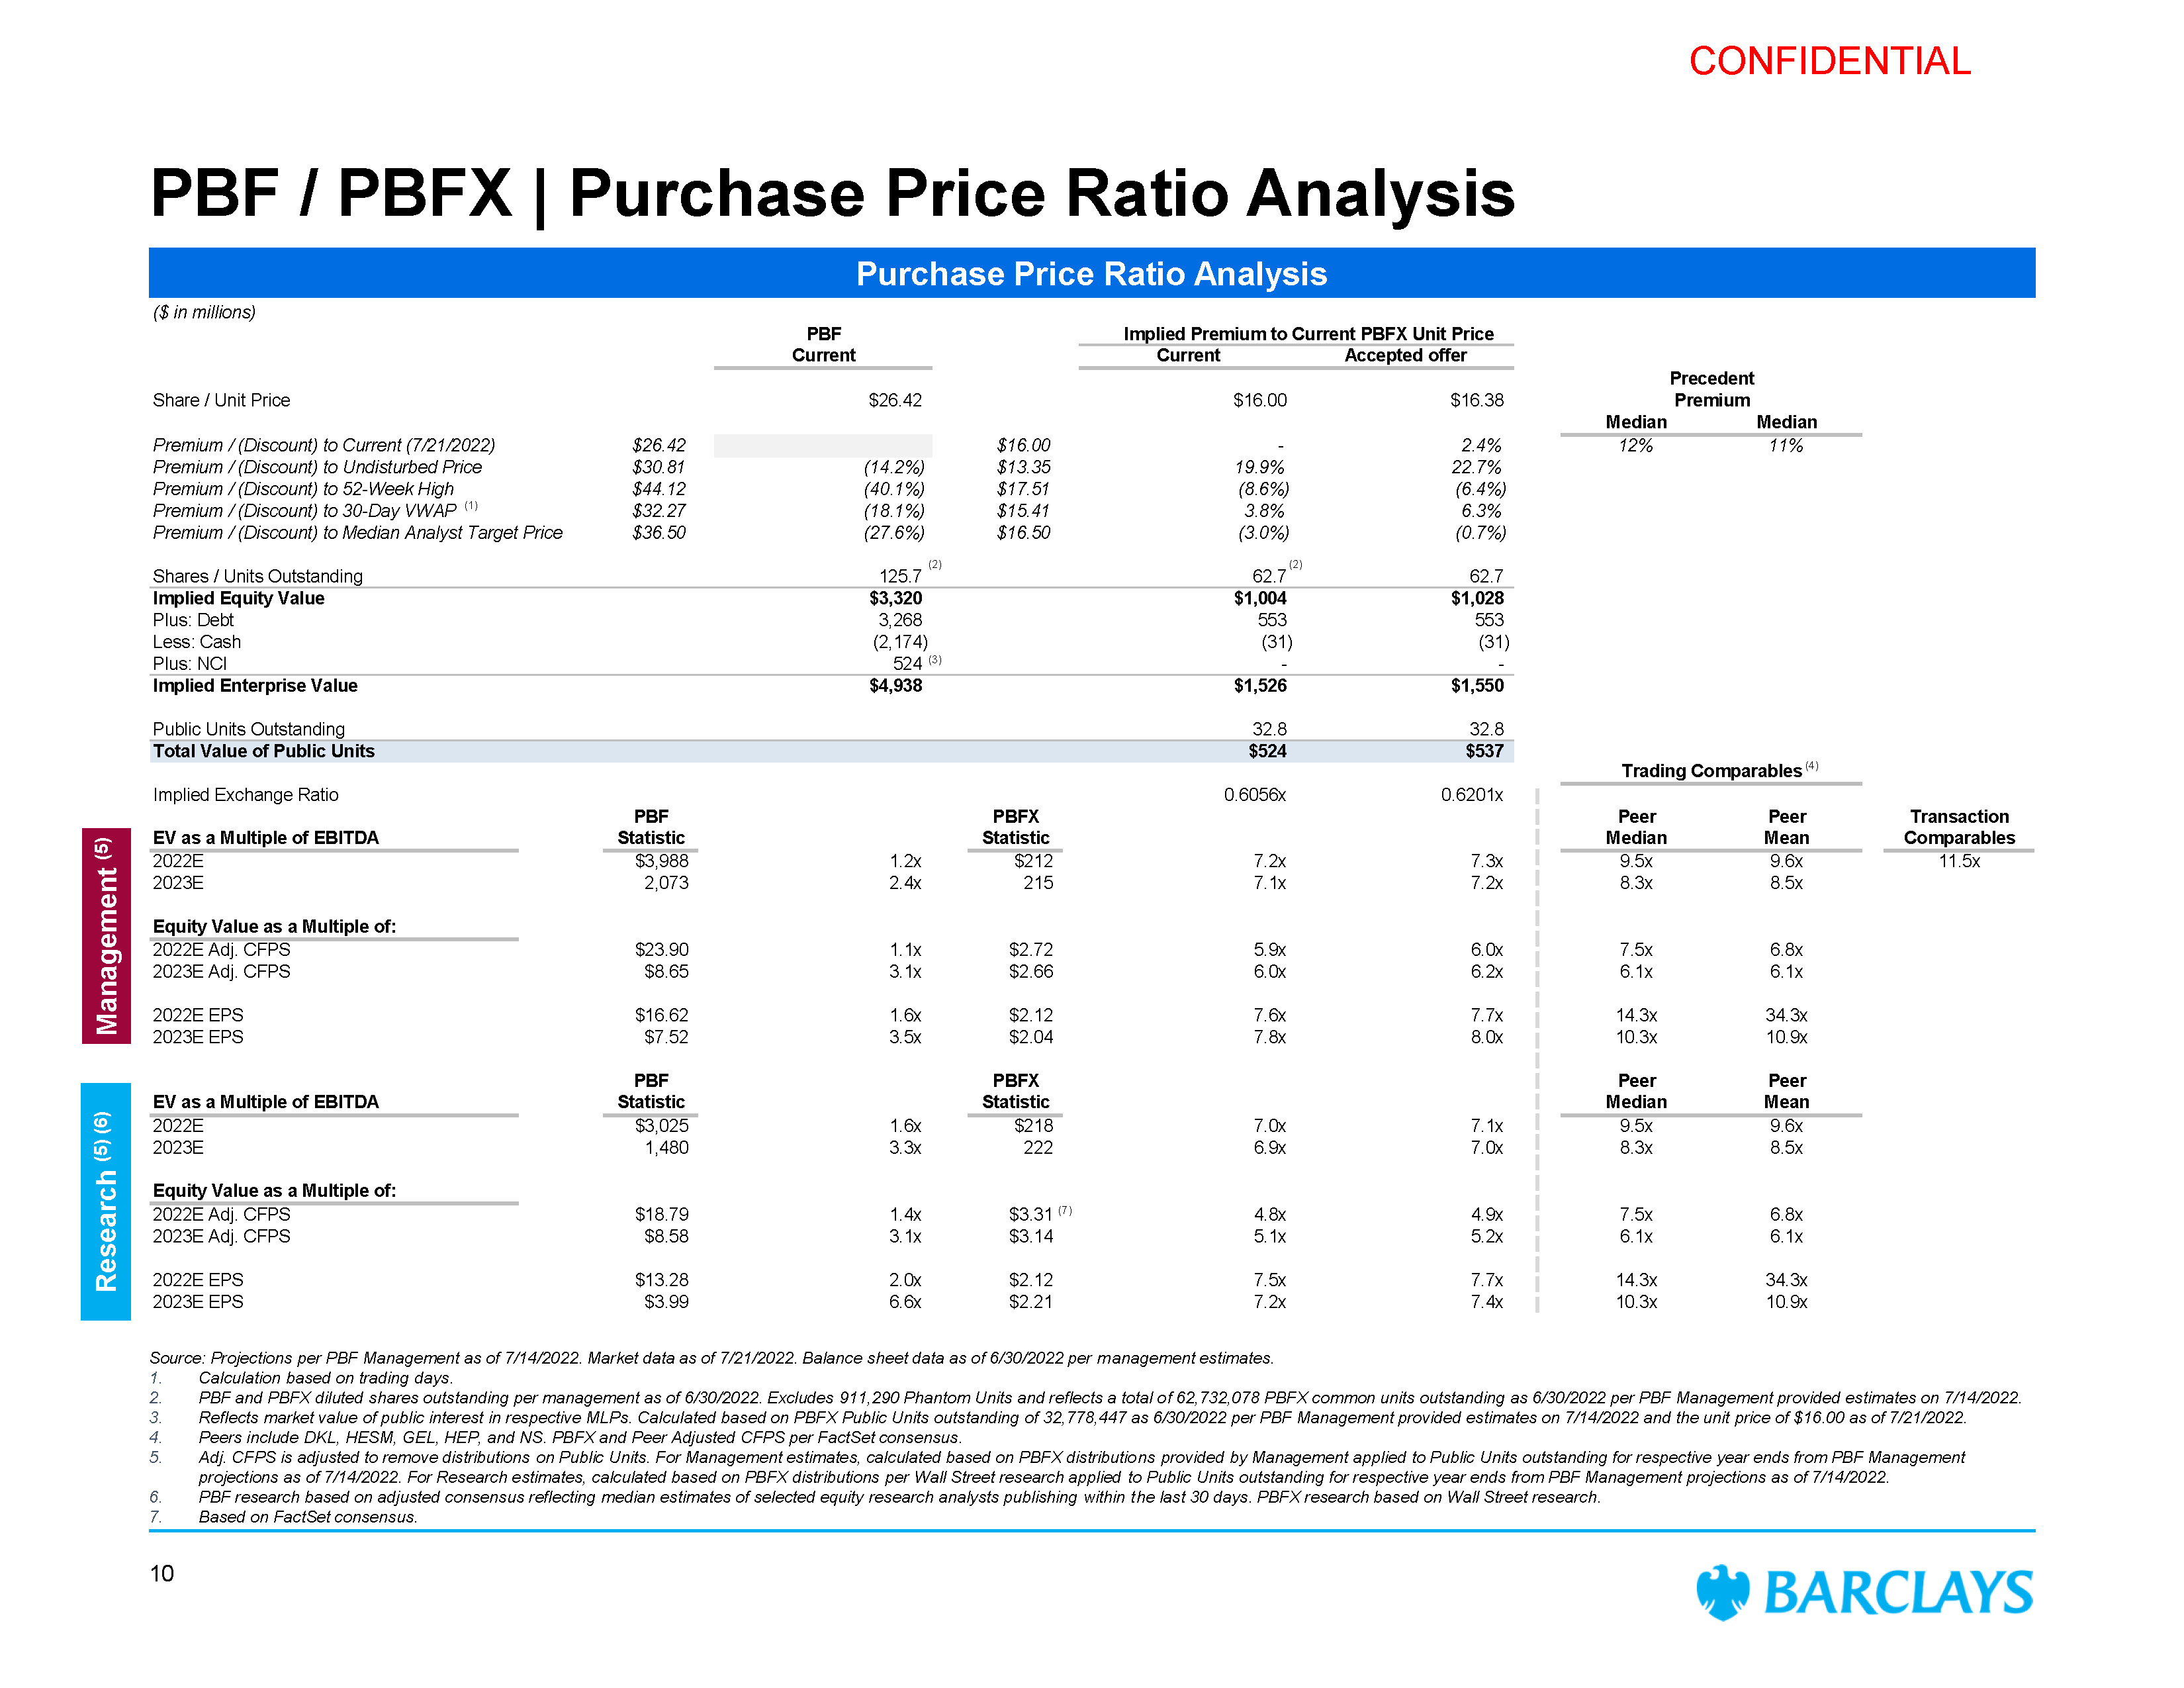
CONFIDENTIAL ($ in millions) PBF Implied Premium to Current PBFX Unit Price Current Current Accepted offer Precedent Share / Unit Price $26.42 $16.00 $16.38 Premium Median Median Premium / (Discount) to Current (7/21/2022) $26.42 $16.00 - 2.4% 12% 11% Premium / (Discount) to Undisturbed Price $30.81 (14.2%) $13.35 19.9% 22.7% Premium / (Discount) to 52-Week High $44.12 (40.1%) $17.51 (8.6%) (6.4%) Premium / (Discount) to 30-Day VWAP (1) $32.27 (18.1%) $15.41 3.8% 6.3% Premium / (Discount) to Median Analyst Target Price $36.50 (27.6%) $16.50 (3.0%) (0.7%) (2) (2) Shares / Units Outstanding 125.7 62.7 62.7 Implied Equity Value $3,320 $1,004 $1,028 Plus: Debt 3,268 553 553 Less: Cash (2,174) (31) (31) Plus: NCI 524 (3) - - Implied Enterprise Value $4,938 $1,526 $1,550 Public Units Outstanding 32.8 32.8 Total Value of Public Units $524 $537 Trading Comparables (4) Implied Exchange Ratio 0.6056x 0.6201x PBF PBFX Peer Peer Transaction EV as a Multiple of EBITDA Statistic Statistic Median Mean Comparables 2022E $3,988 1.2x $212 7.2x 7.3x 9.5x 9.6x 11.5x 2023E 2,073 2.4x 215 7.1x 7.2x 8.3x 8.5x Equity Value as a Multiple of: 2022E Adj. CFPS $23.90 1.1x $2.72 5.9x 6.0x 7.5x 6.8x 2023E Adj. CFPS $8.65 3.1x $2.66 6.0x 6.2x 6.1x 6.1x 2022E EPS $16.62 1.6x $2.12 7.6x 7.7x 14.3x 34.3x 2023E EPS $7.52 3.5x $2.04 7.8x 8.0x 10.3x 10.9x PBF PBFX Peer Peer EV as a Multiple of EBITDA Statistic Statistic Median Mean 2022E $3,025 1.6x $218 7.0x 7.1x 9.5x 9.6x 2023E 1,480 3.3x 222 6.9x 7.0x 8.3x 8.5x Equity Value as a Multiple of: 2022E Adj. CFPS $18.79 1.4x $3.31 (7) 4.8x 4.9x 7.5x 6.8x 2023E Adj. CFPS $8.58 3.1x $3.14 5.1x 5.2x 6.1x 6.1x 2022E EPS $13.28 2.0x $2.12 7.5x 7.7x 14.3x 34.3x 2023E EPS $3.99 6.6x $2.21 7.2x 7.4x 10.3x 10.9x PBF / PBFX | Purchase Price Ratio Analysis Purchase Price Ratio Analysis Management (5) Research (5) (6) 7. Based on FactSet consensus. 10 Source: Projections per PBF Management as of 7/14/2022. Market data as of 7/21/2022. Balance sheet data as of 6/30/2022 per management estimates. 1. 2. 3. 4. 5. Calculation based on trading days. PBF and PBFX diluted shares outstanding per management as of 6/30/2022. Excludes 911,290 Phantom Units and reflects a total of 62,732,078 PBFX common units outstanding as 6/30/2022 per PBF Management provided estimates on 7/14/2022. Reflects market value of public interest in respective MLPs. Calculated based on PBFX Public Units outstanding of 32,778,447 as 6/30/2022 per PBF Management provided estimates on 7/14/2022 and the unit price of $16.00 as of 7/21/2022. Peers include DKL, HESM, GEL, HEP, and NS. PBFX and Peer Adjusted CFPS per FactSet consensus. Adj. CFPS is adjusted to remove distributions on Public Units. For Management estimates, calculated based on PBFX distributions provided by Management applied to Public Units outstanding for respective year ends from PBF Management projections as of 7/14/2022. For Research estimates, calculated based on PBFX distributions per Wall Street research applied to Public Units outstanding for respective year ends from PBF Management projections as of 7/14/2022. PBF research based on adjusted consensus reflecting median estimates of selected equity research analysts publishing within the last 30 days. PBFX research based on Wall Street research. 6.

CONFIDENTIAL Appendices

CONFIDENTIAL Financial Forecast
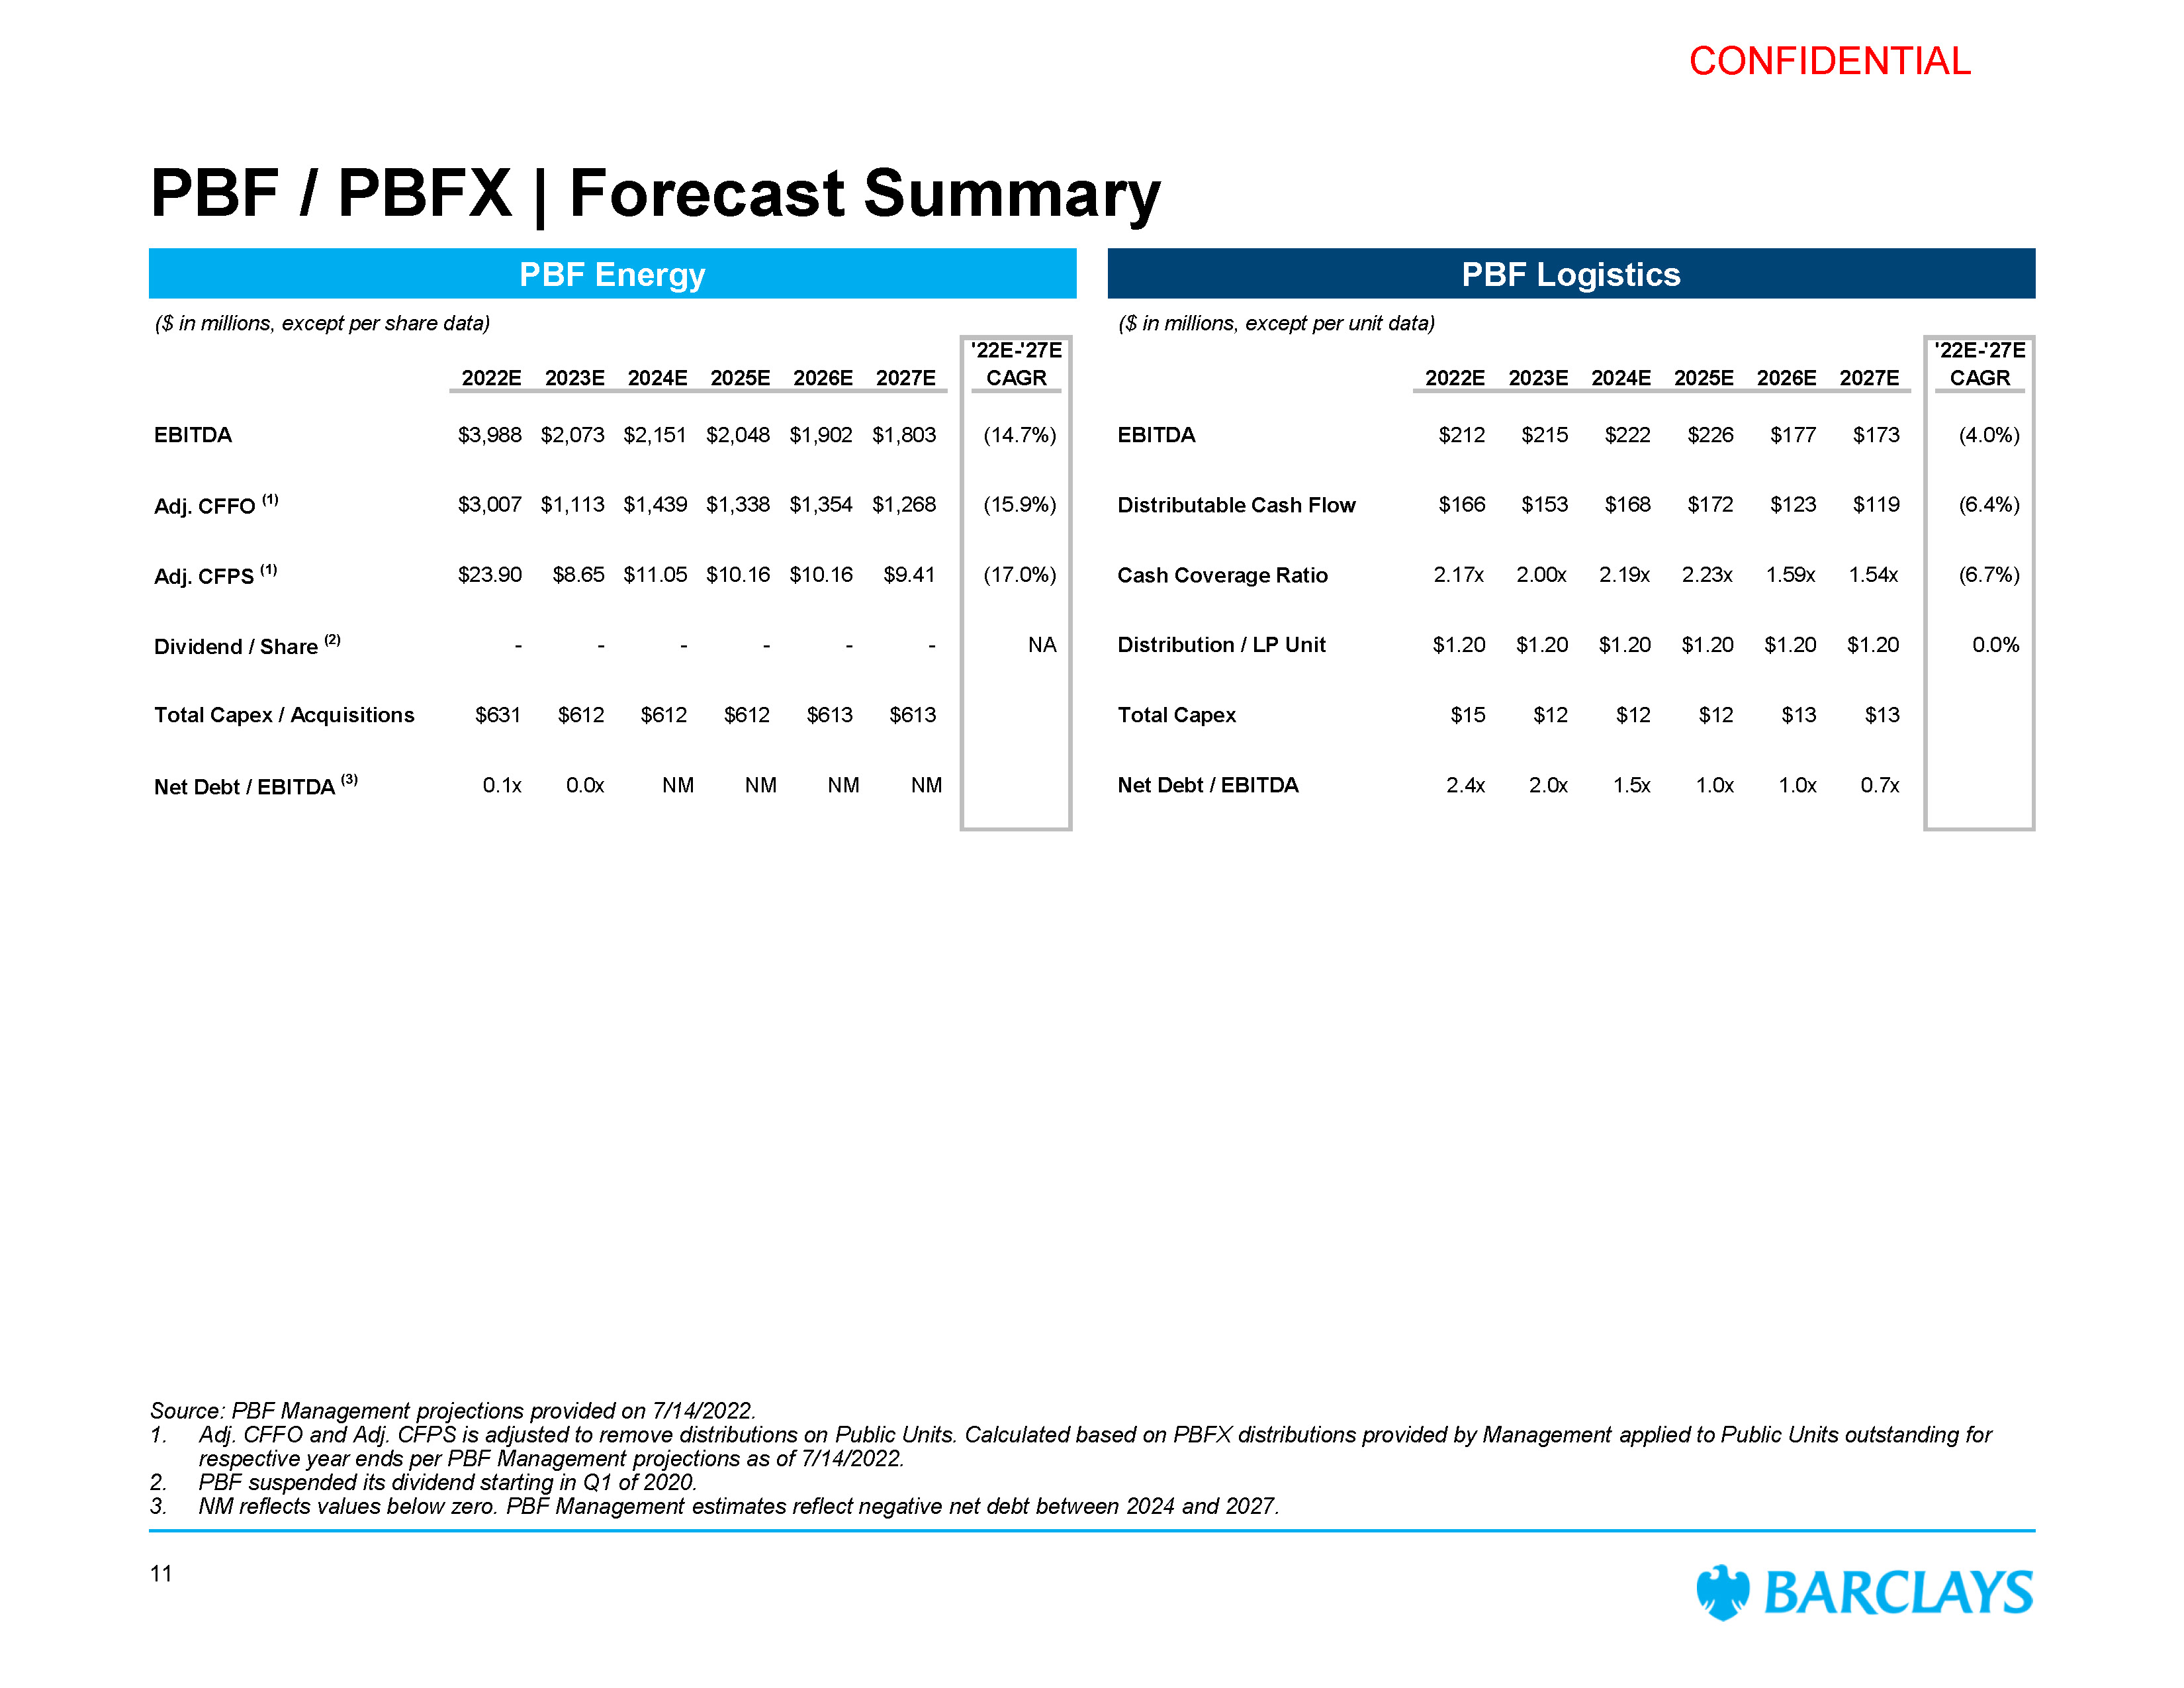
CONFIDENTIAL ($ in millions, except per share data) ($ in millions, except per unit data) '22E-'27E '22E-'27E 2022E 2023E 2024E 2025E 2026E 2027E CAGR 2022E 2023E 2024E 2025E 2026E 2027E CAGR EBITDA $3,988 $2,073 $2,151 $2,048 $1,902 $1,803 (14.7%) EBITDA $212 $215 $222 $226 $177 $173 (4.0%) Adj. CFFO (1) $3,007 $1,113 $1,439 $1,338 $1,354 $1,268 (15.9%) Distributable Cash Flow $166 $153 $168 $172 $123 $119 (6.4%) Adj. CFPS (1) $23.90 $8.65 $11.05 $10.16 $10.16 $9.41 (17.0%) Cash Coverage Ratio 2.17x 2.00x 2.19x 2.23x 1.59x 1.54x (6.7%) Dividend / Share (2) - - - - - - NA Distribution / LP Unit $1.20 $1.20 $1.20 $1.20 $1.20 $1.20 0.0% Total Capex / Acquisitions $631 $612 $612 $612 $613 $613 Total Capex $15 $12 $12 $12 $13 $13 Net Debt / EBITDA (3) 0.1x 0.0x NM NM NM NM Net Debt / EBITDA 2.4x 2.0x 1.5x 1.0x 1.0x 0.7x PBF / PBFX | Forecast Summary 11 PBF Energy PBF Logistics Source: PBF Management projections provided on 7/14/2022. Adj. CFFO and Adj. CFPS is adjusted to remove distributions on Public Units. Calculated based on PBFX distributions provided by Management applied to Public Units outstanding for respective year ends per PBF Management projections as of 7/14/2022. PBF suspended its dividend starting in Q1 of 2020. NM reflects values below zero. PBF Management estimates reflect negative net debt between 2024 and 2027.
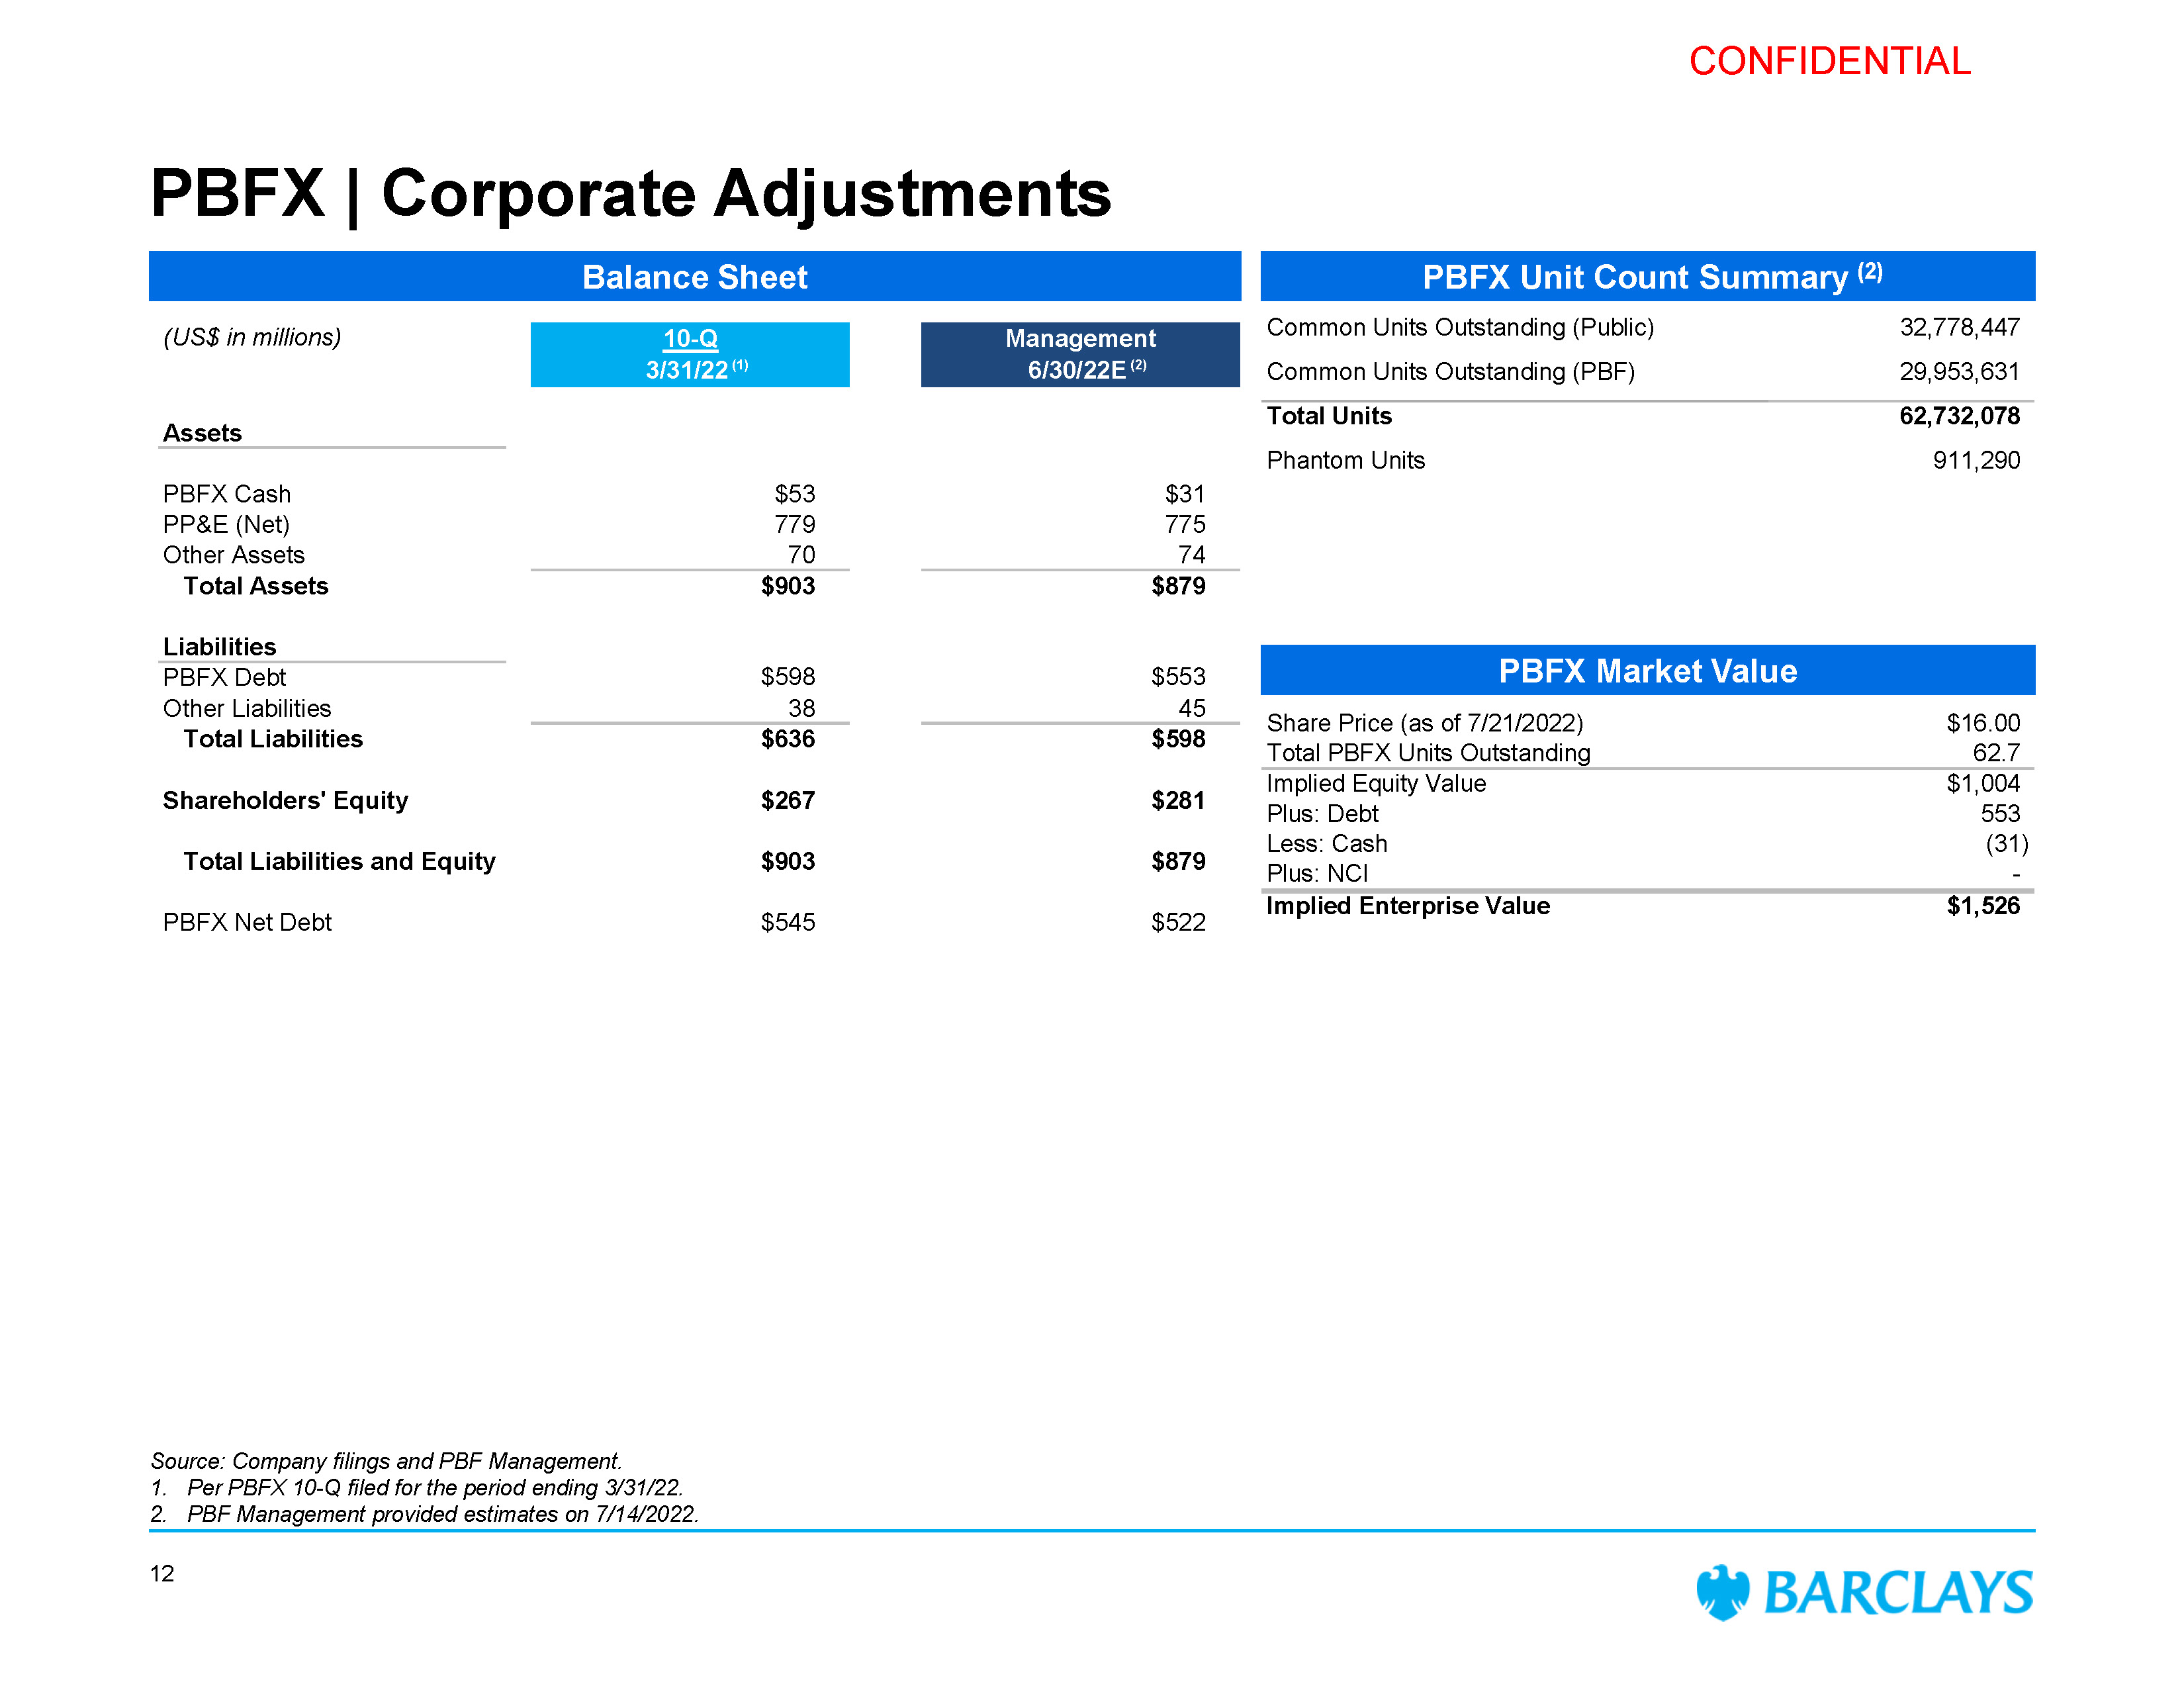
CONFIDENTIAL PBFX | Corporate Adjustments Source: Company filings and PBF Management. Per PBFX 10-Q filed for the period ending 3/31/22. PBF Management provided estimates on 7/14/2022. Balance Sheet PBFX Market Value Share Price (as of 7/21/2022) $16.00 Total PBFX Units Outstanding 62.7 Implied Equity Value $1,004 Plus: Debt 553 Less: Cash (31) Plus: NCI - Implied Enterprise Value $1,526 PBFX Unit Count Summary (2) Common Units Outstanding (Public) Common Units Outstanding (PBF) 32,778,447 29,953,631 Total Units Phantom Units 62,732,078 911,290 (US$ in millions) 10-Q 3/31/22 (1) Management 6/30/22E (2) Assets PBFX Cash PP&E (Net) Other Assets Total Assets $53 779 70 $9 Liabilities PBFX Debt Other Liabilities Total Liabilities Shareholders' Equity Total Liab PB 12
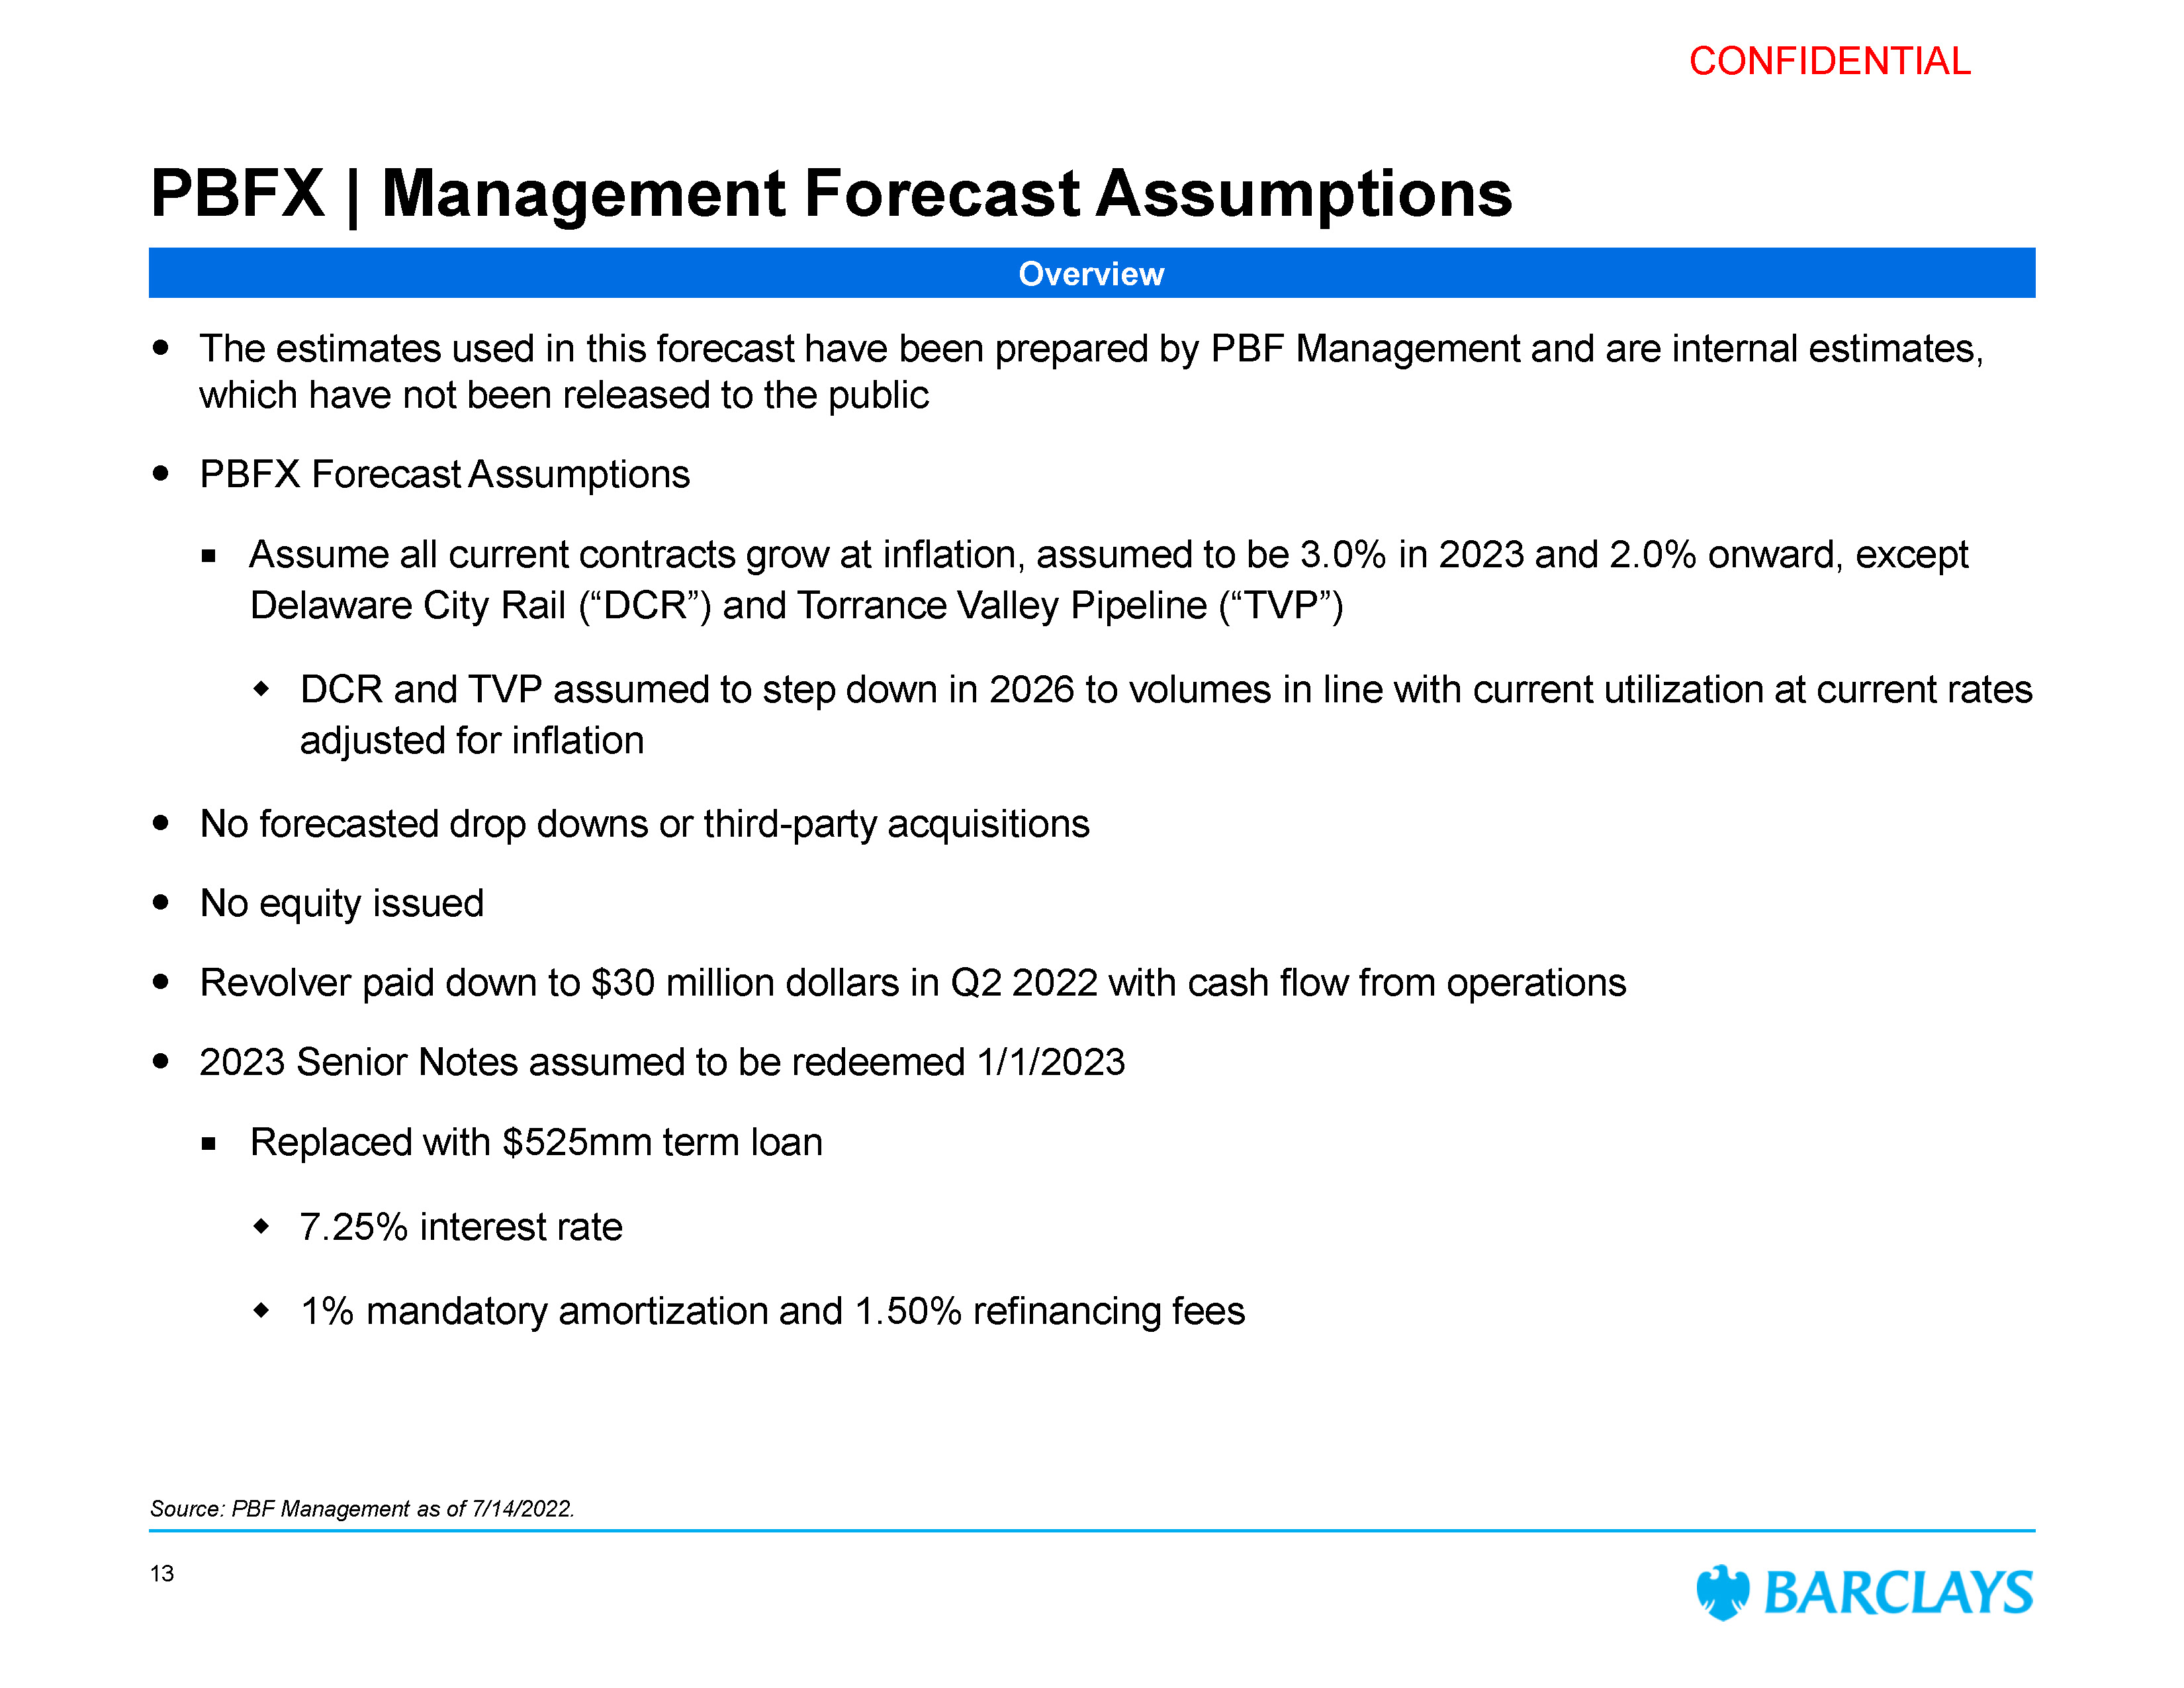
CONFIDENTIAL Overview Source: PBF Management as of 7/14/2022. 13 PBFX | Management Forecast Assumptions The estimates used in this forecast have been prepared by PBF Management and are internal estimates, which have not been released to the public PBFX Forecast Assumptions Assume all current contracts grow at inflation, assumed to be 3.0% in 2023 and 2.0% onward, except Delaware City Rail (“DCR”) and Torrance Valley Pipeline (“TVP”) DCR and TVP assumed to step down in 2026 to volumes in line with current utilization at current rates adjusted for inflation No forecasted drop downs or third-party acquisitions No equity issued Revolver paid down to $30 million dollars in Q2 2022 with cash flow from operations 2023 Senior Notes assumed to be redeemed 1/1/2023 Replaced with $525mm term loan 7.25% interest rate 1% mandatory amortization and 1.50% refinancing fees

CONFIDENTIAL Comparable Companies
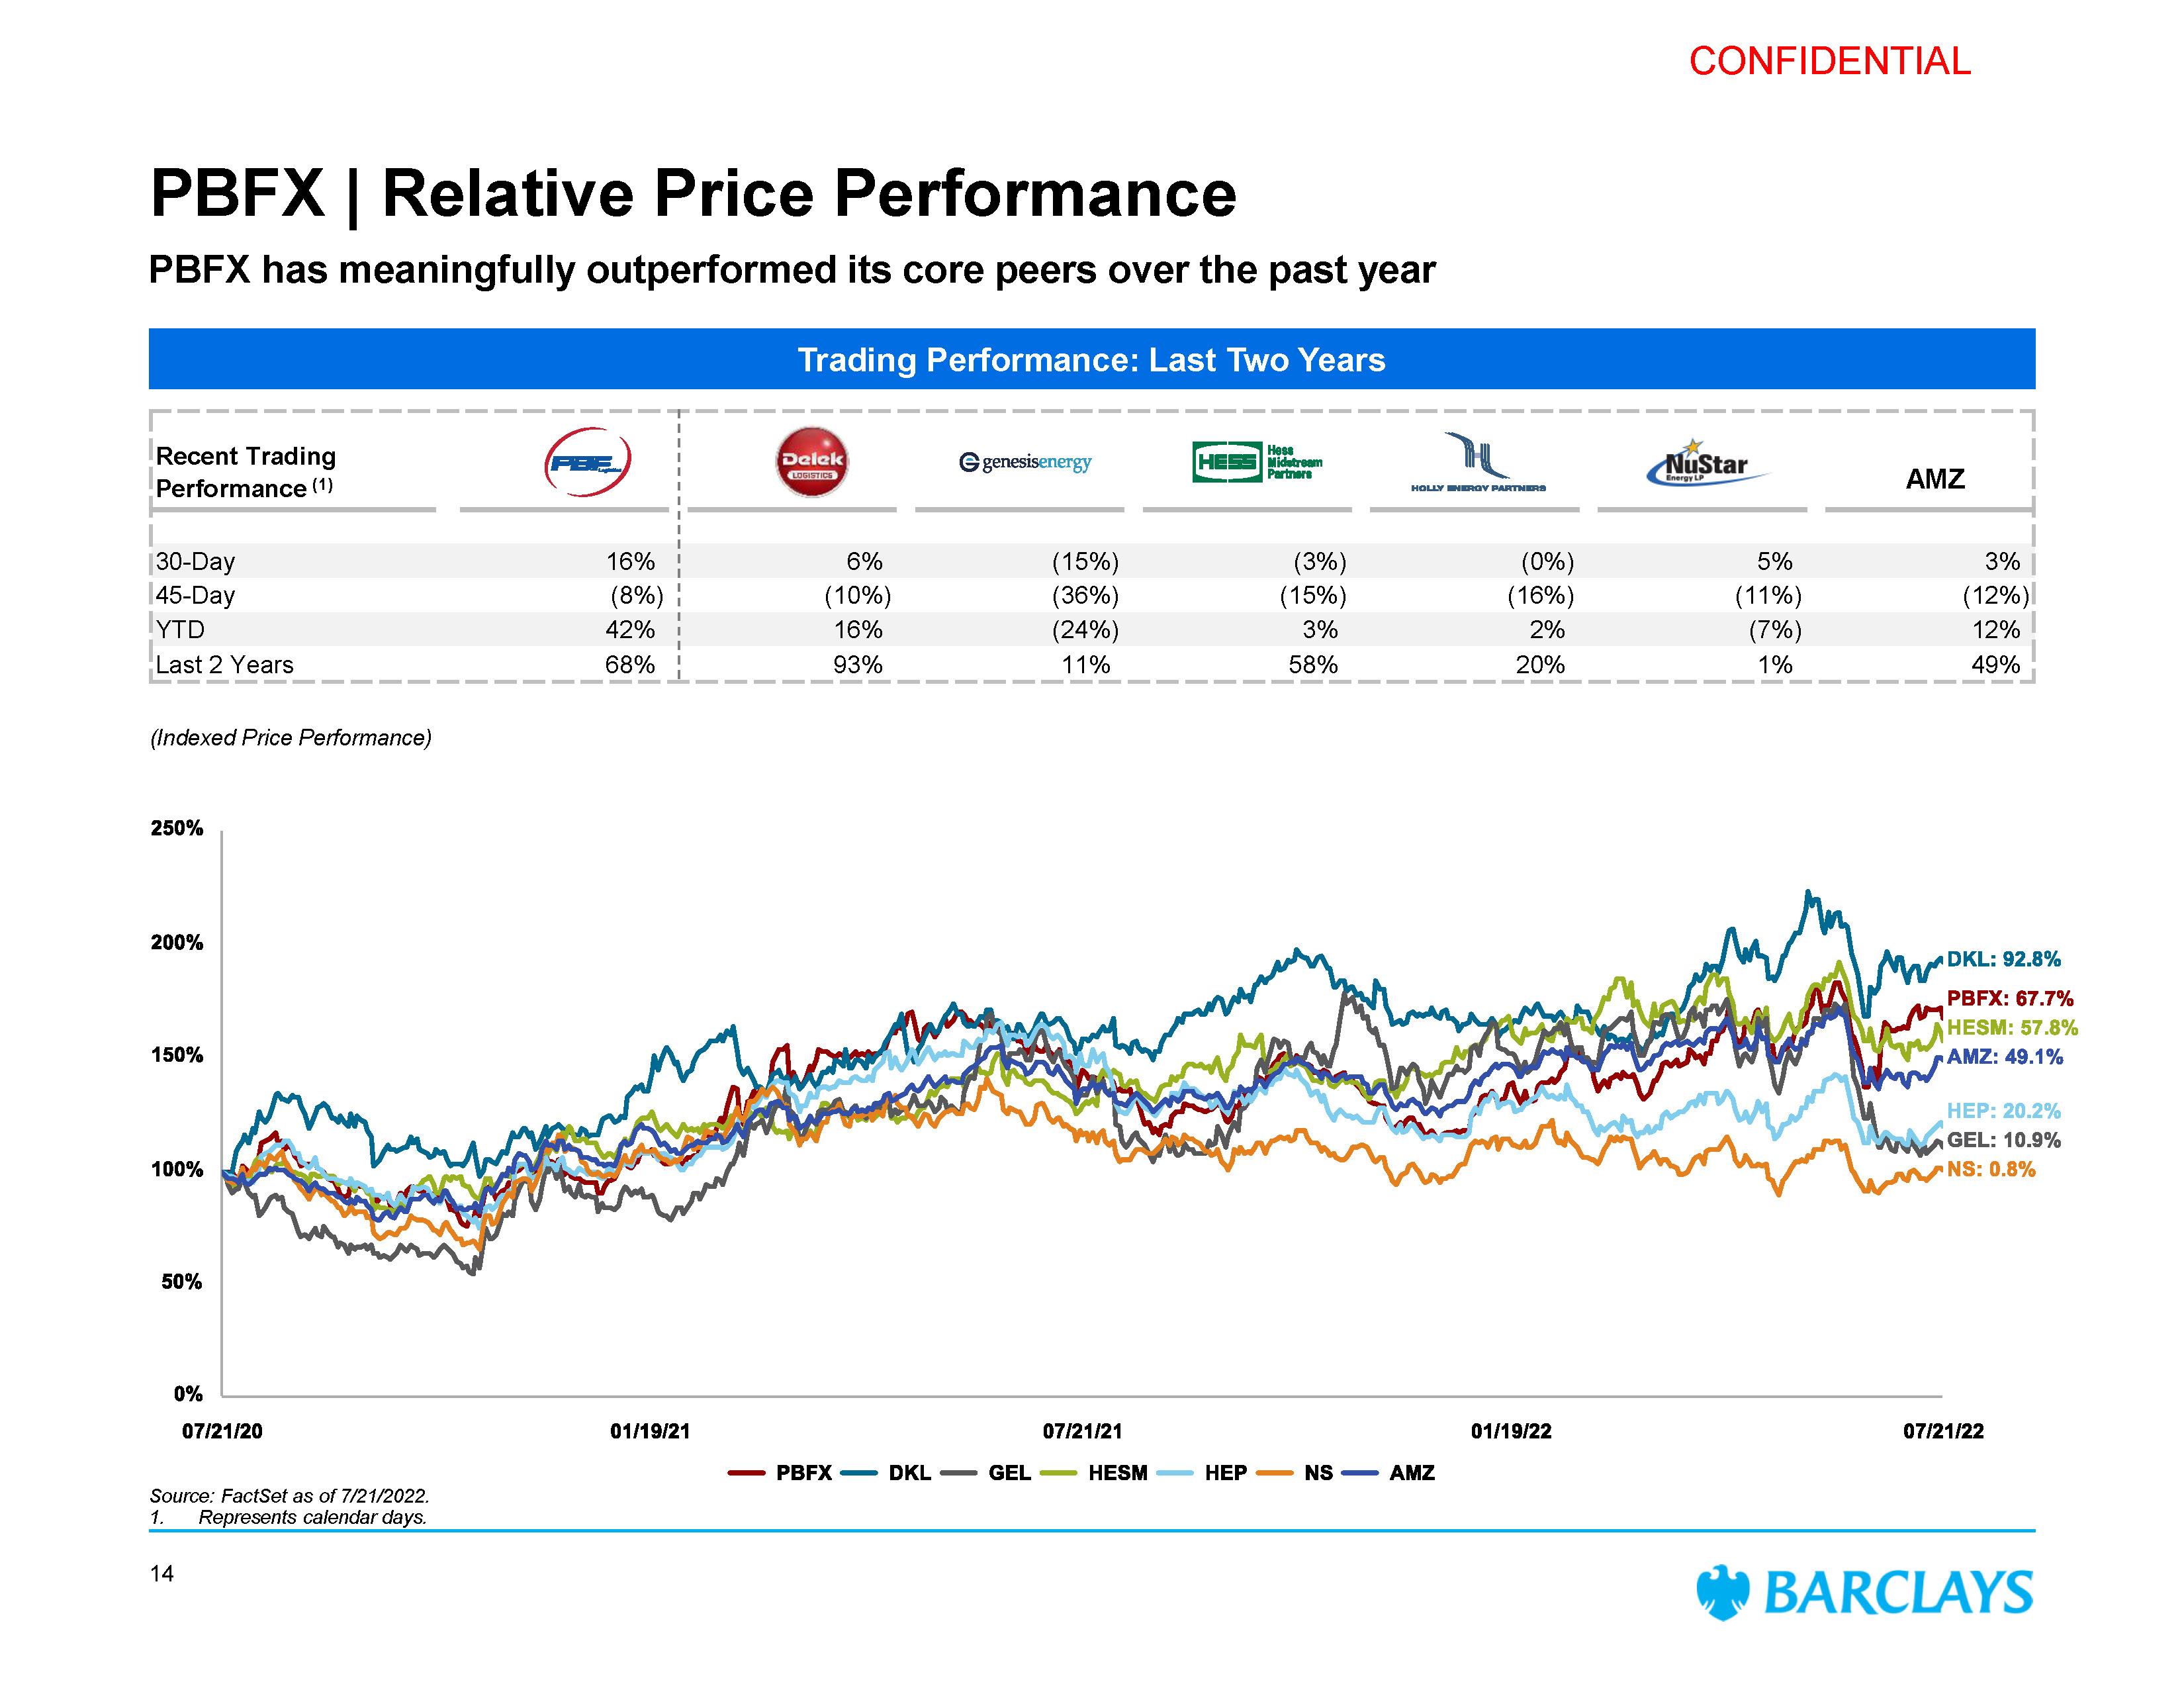
CONFIDENTIAL PBFX | Relative Price Performance PBFX has meaningfully outperformed its core peers over the past year Trading Performance: Last Two Years (Indexed Price Performance) Source: FactSet as of 7/21/2022. 1. Represents calendar days. Recent Trading Performance (1) AMZ 6% 30-Day 16% 45-Day (8%) YTD Last 2 Year 14
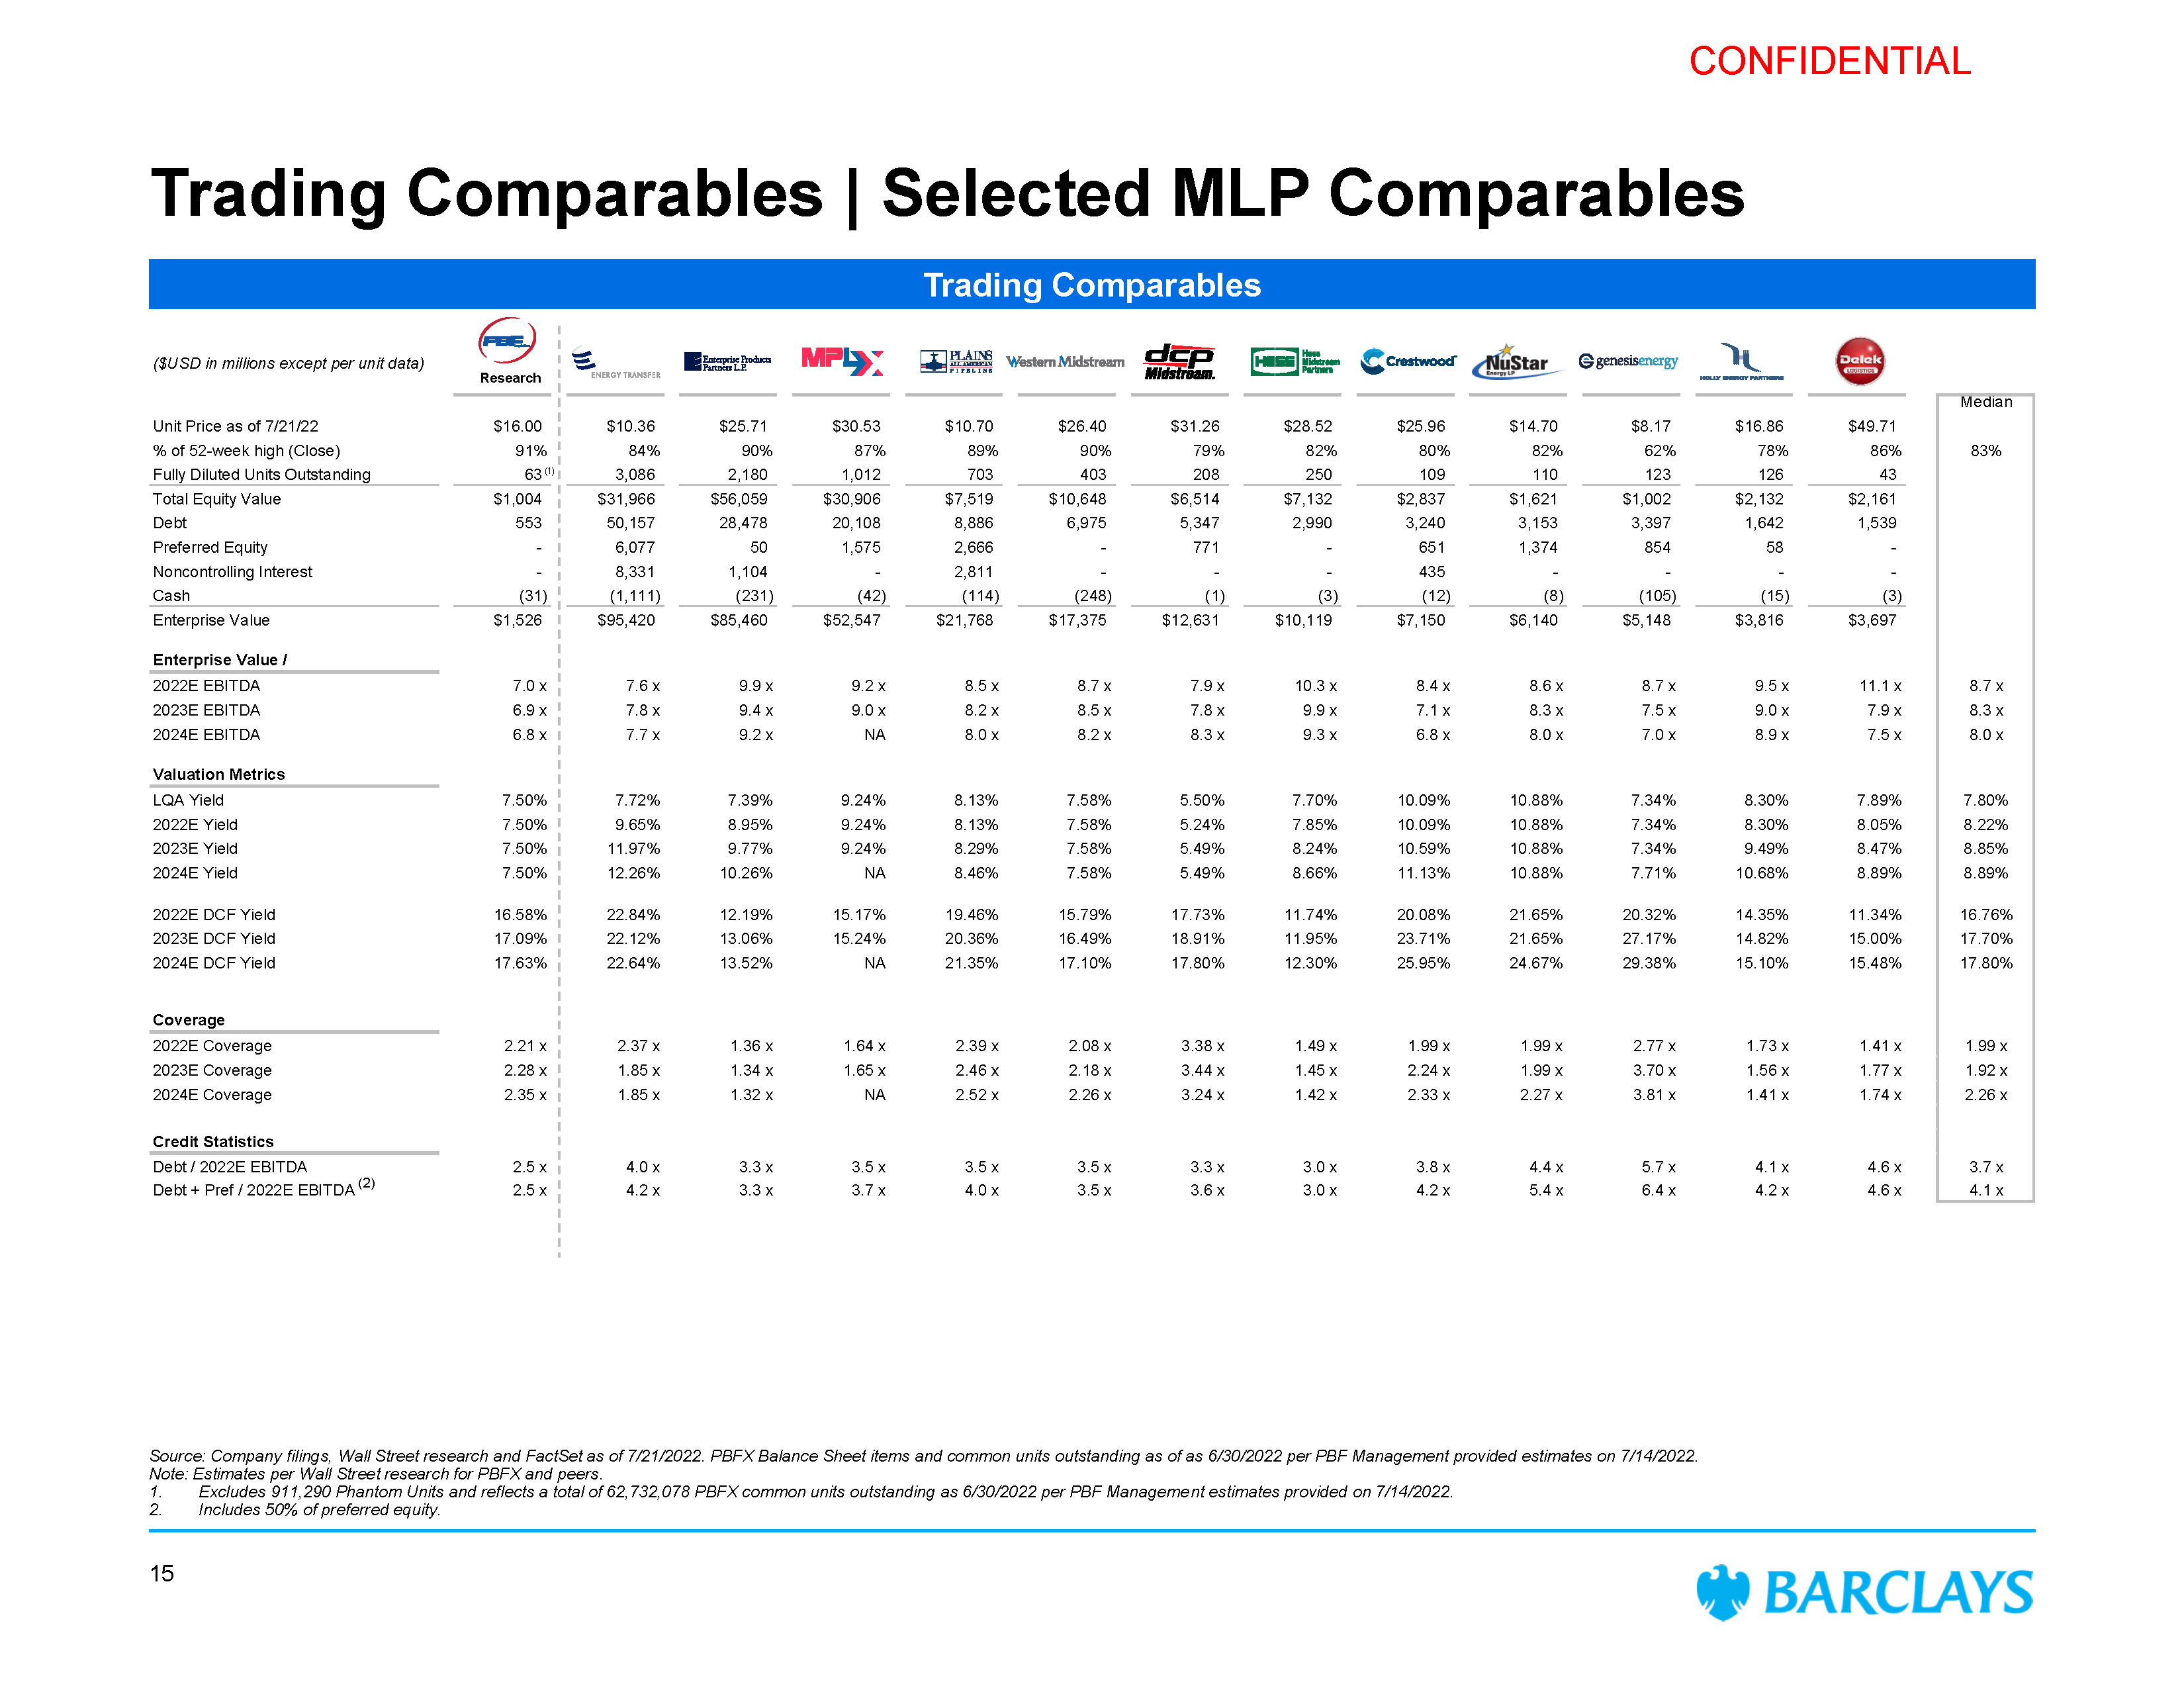
CONFIDENTIAL Source: Company filings, Wall Street research and FactSet as of 7/21/2022. PBFX Balance Sheet items and common units outstanding as of as 6/30/2022 per PBF Management provided estimates on 7/14/2022. Note: Estimates per Wall Street research for PBFX and peers. Excludes 911,290 Phantom Units and reflects a total of 62,732,078 PBFX common units outstanding as 6/30/2022 per PBF Management estimates provided on 7/14/2022. Includes 50% of preferred equity. ($USD in millions except per unit data) Research Median Unit Price as of 7/21/22 $16.00 $10.36 $25.71 $30.53 $10.70 $26.40 $31.26 $28.52 $25.96 $14.70 $8.17 $16.86 $49.71 % of 52-week high (Close) 91% 84% 90% 87% 89% 90% 79% 82% 80% 82% 62% 78% 86% 83% Fully Diluted Units Outstanding 63 (1) 3,086 2,180 1,012 703 403 208 250 109 110 123 126 43 Total Equity Value $1,004 $31,966 $56,059 $30,906 $7,519 $10,648 $6,514 $7,132 $2,837 $1,621 $1,002 $2,132 $2,161 Debt 553 50,157 28,478 20,108 8,886 6,975 5,347 2,990 3,240 3,153 3,397 1,642 1,539 Preferred Equity - 6,077 50 1,575 2,666 - 771 - 651 1,374 854 58 - Noncontrolling Interest - 8,331 1,104 - 2,811 - - - 435 - - - - Cash (31) (1,111) (231) (42) (114) (248) (1) (3) (12) (8) (105) (15) (3) Enterprise Value $1,526 $95,420 $85,460 $52,547 $21,768 $17,375 $12,631 $10,119 $7,150 $6,140 $5,148 $3,816 $3,697 Enterprise Value / 2022E EBITDA 7.0 x 7.6 x 9.9 x 9.2 x 8.5 x 8.7 x 7.9 x 10.3 x 8.4 x 8.6 x 8.7 x 9.5 x 11.1 x 8.7 x 2023E EBITDA 6.9 x 7.8 x 9.4 x 9.0 x 8.2 x 8.5 x 7.8 x 9.9 x 7.1 x 8.3 x 7.5 x 9.0 x 7.9 x 8.3 x 2024E EBITDA 6.8 x 7.7 x 9.2 x NA 8.0 x 8.2 x 8.3 x 9.3 x 6.8 x 8.0 x 7.0 x 8.9 x 7.5 x 8.0 x Valuation Metrics LQA Yield 7.50% 7.72% 7.39% 9.24% 8.13% 7.58% 5.50% 7.70% 10.09% 10.88% 7.34% 8.30% 7.89% 7.80% 2022E Yield 7.50% 9.65% 8.95% 9.24% 8.13% 7.58% 5.24% 7.85% 10.09% 10.88% 7.34% 8.30% 8.05% 8.22% 2023E Yield 7.50% 11.97% 9.77% 9.24% 8.29% 7.58% 5.49% 8.24% 10.59% 10.88% 7.34% 9.49% 8.47% 8.85% 2024E Yield 7.50% 12.26% 10.26% NA 8.46% 7.58% 5.49% 8.66% 11.13% 10.88% 7.71% 10.68% 8.89% 8.89% 2022E DCF Yield 16.58% 22.84% 12.19% 15.17% 19.46% 15.79% 17.73% 11.74% 20.08% 21.65% 20.32% 14.35% 11.34% 16.76% 2023E DCF Yield 17.09% 22.12% 13.06% 15.24% 20.36% 16.49% 18.91% 11.95% 23.71% 21.65% 27.17% 14.82% 15.00% 17.70% 2024E DCF Yield 17.63% 22.64% 13.52% NA 21.35% 17.10% 17.80% 12.30% 25.95% 24.67% 29.38% 15.10% 15.48% 17.80% Coverage 2022E Coverage 2.21 x 2.37 x 1.36 x 1.64 x 2.39 x 2.08 x 3.38 x 1.49 x 1.99 x 1.99 x 2.77 x 1.73 x 1.41 x 1.99 x 2023E Coverage 2.28 x 1.85 x 1.34 x 1.65 x 2.46 x 2.18 x 3.44 x 1.45 x 2.24 x 1.99 x 3.70 x 1.56 x 1.77 x 1.92 x 2024E Coverage 2.35 x 1.85 x 1.32 x NA 2.52 x 2.26 x 3.24 x 1.42 x 2.33 x 2.27 x 3.81 x 1.41 x 1.74 x 2.26 x Credit Statistics Debt / 2022E EBITDA 2.5 x 4.0 x 3.3 x 3.5 x 3.5 x 3.5 x 3.3 x 3.0 x 3.8 x 4.4 x 5.7 x 4.1 x 4.6 x 3.7 x Debt + Pref / 2022E EBITDA (2) 2.5 x 4.2 x 3.3 x 3.7 x 4.0 x 3.5 x 3.6 x 3.0 x 4.2 x 5.4 x 6.4 x 4.2 x 4.6 x 4.1 x Trading Comparables Trading Comparables | Selected MLP Comparables 15
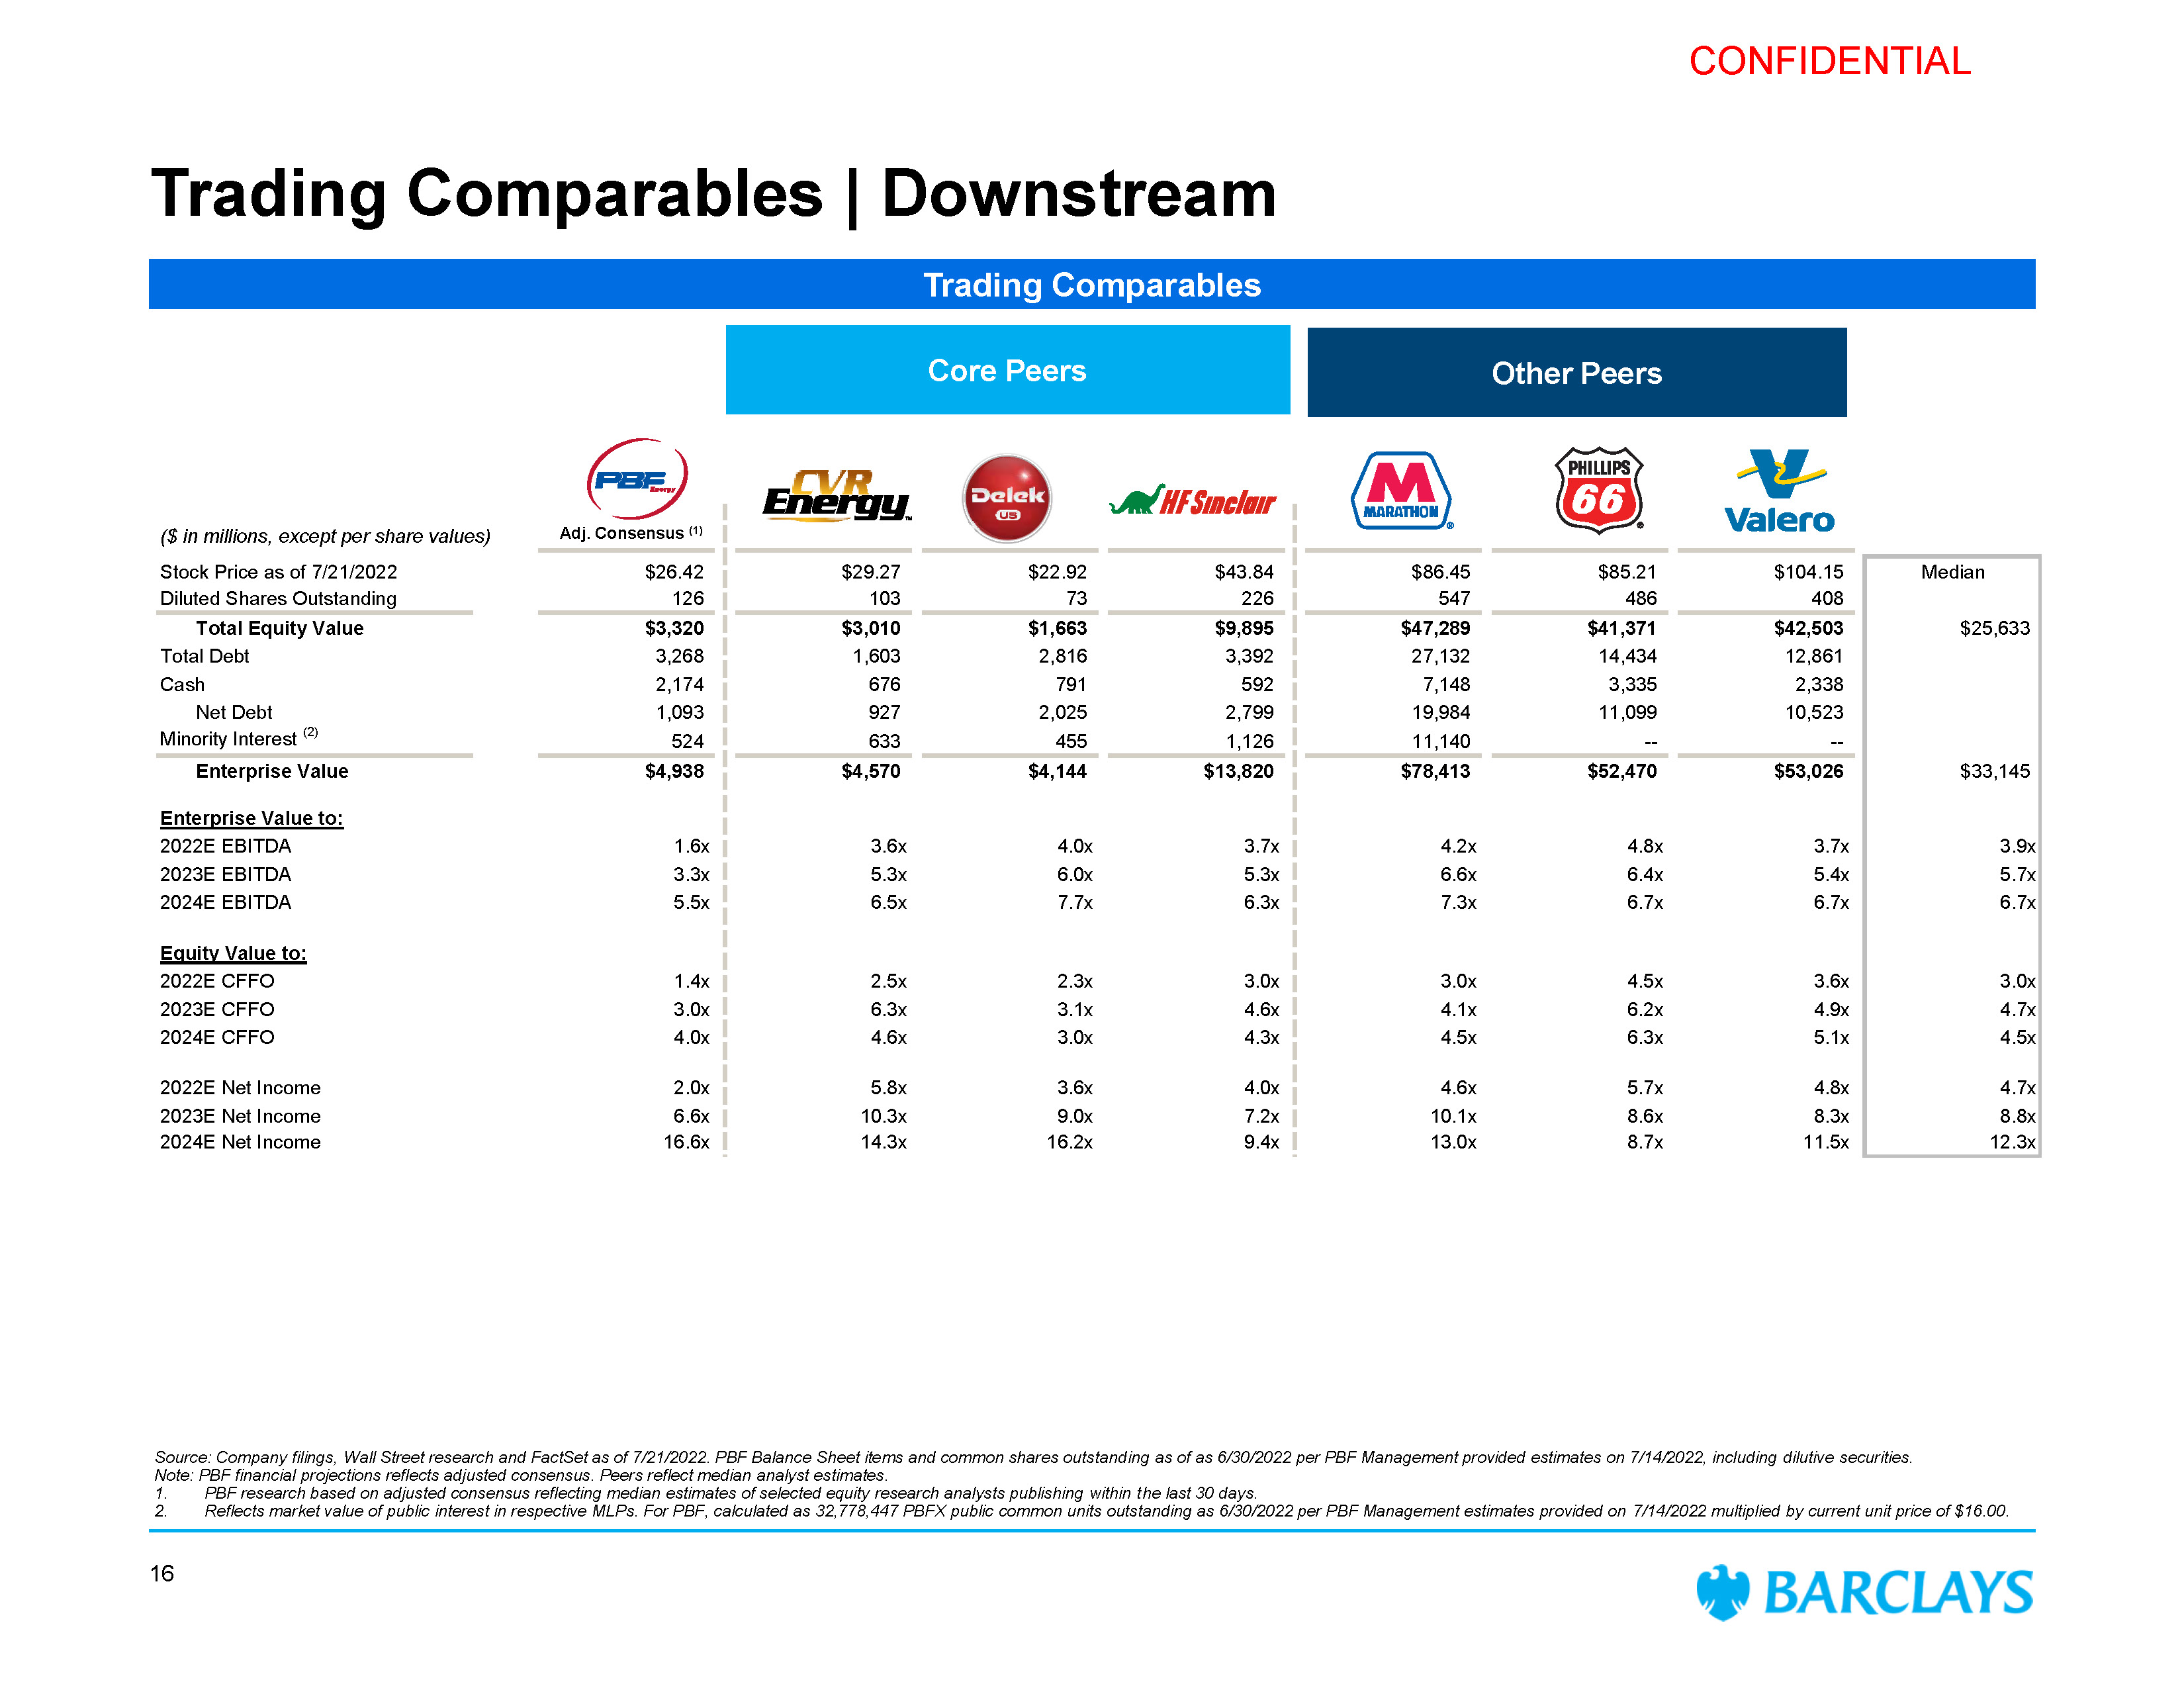
CONFIDENTIAL Trading Comparables | Downstream ($ in millions, except per share values) Stock Price as of 7/21/2022 $26.42 $29.27 $22.92 $43.84 Diluted Shares Outstanding 126 103 73 226 Total Equity Value $3,320 $3,010 $1,663 $9,895 Total Debt 3,268 1,603 2,816 3,392 Cash 2,174 676 791 592 Net Debt 1,093 927 2,025 2,799 Minority Interest (2) 524 633 455 1,126 Enterprise Value $4,938 $4,570 $4,144 $13,820 Enterprise Value to: 2022E EBITDA 1.6x 3.6x 4.0x 3.7x 2023E EBITDA 3.3x 5.3x 6.0x 5.3x 2024E EBITDA 5.5x 6.5x 7.7x 6.3x Equity Value to: 2022E CFFO 1.4x 2.5x 2.3x 3.0x 2023E CFFO 3.0x 6.3x 3.1x 4.6x 2024E CFFO 4.0x 4.6x 3.0x 4.3x 2022E Net Income 2.0x 5.8x 3.6x 4.0x 2023E Net Income 6.6x 10.3x 9.0x 7.2x 2024E Net Income 16.6x 14.3x 16.2x 9.4x $86.45 547 $85.21 486 $104.15 408 Median $47,289 $41,371 $42,503 $25,633 27,132 14,434 12,861 7,148 3,335 2,338 19,984 11,099 10,523 11,140 -- -- $78,413 $52,470 $53,026 $33,145 4.2x 4.8x 3.7x 3.9x 6.6x 6.4x 5.4x 5.7x 7.3x 6.7x 6.7x 6.7x 3.0x 4.5x 3.6x 3.0x 4.1x 6.2x 4.9x 4.7x 4.5x 6.3x 5.1x 4.5x 4.6x 5.7x 4.8x 4.7x 10.1x 8.6x 8.3x 8.8x 13.0x 8.7x 11.5x 12.3x Source: Company filings, Wall Street research and FactSet as of 7/21/2022. PBF Balance Sheet items and common shares outstanding as of as 6/30/2022 per PBF Management provided estimates on 7/14/2022, including dilutive securities. Note: PBF financial projections reflects adjusted consensus. Peers reflect median analyst estimates. PBF research based on adjusted consensus reflecting median estimates of selected equity research analysts publishing within the last 30 days. Reflects market value of public interest in respective MLPs. For PBF, calculated as 32,778,447 PBFX public common units outstanding as 6/30/2022 per PBF Management estimates provided on 7/14/2022 multiplied by current unit price of $16.00. Core Peers Other Peers Trading Comparables 16 Adj. Consensus (1)
CONFIDENTIAL Disclaimer 17 The preceding pages contain material that was provided to the Board of Directors (the “Board”) of PBF Energy, Inc. (the “Company”) by Barclays Capital Inc. (“Barclays”). The accompanying material and any Barclays presentation related to the material was compiled or prepared on a confidential basis solely for consideration by the Board and no part of it may be reproduced, distributed or transmitted without the prior written consent of Barclays. The information contained in this material was obtained from the Company and/or publicly available sources, and Barclays has relied upon such information without independent verification thereof and does not assume any liability for any such information. These materials are being provided in connection with an actual corporate engagement and may not be used or relied upon for any purpose other than as specifically contemplated by a written agreement with Barclays. Moreover, any information provided herein was not prepared for or intended for use by any individual for personal, family or household purposes. Any estimates, historical financial information, projections and other information contained herein have been prepared by management of the Company or were obtained from publicly available sources (approved for Barclays’ use by the Company) or are based upon such estimates and projections. The projections contained herein may or may not be achieved and differences between projected results and those actually achieved may be material. No representation or warranty, expressed or implied, is made as to the accuracy or completeness of such information and nothing contained herein is, or shall be relied upon as, a promise or representation, whether as to the past or the future. The analysis contained herein is based on current market conditions which are subject to change and Barclays assumes no obligation to update or otherwise revise these materials. Nothing in these materials shall be deemed to constitute a recommendation or investment, legal, tax, financial, accounting or other advice. Because these materials were prepared for use in the context of a presentation to the Board, these materials are incomplete without reference to, and should be assessed solely in conjunction with, the oral briefing provided by Barclays to the Board (in their capacity as directors and not in any individual capacity and is not for the benefit of any individual, including any individual officer, director, shareholder or any other person). These materials were not prepared for or intended for use by any individual for personal, family or household purposes nor were they prepared to comply with the disclosure standards under state and federal securities laws or any other applicable laws and, to the extent the material may be considered by readers not as familiar with the business and affairs of the Company as the Board, none of the Company, Barclays, their respective affiliates or any of their respective legal or financial advisors or accountants takes any responsibility for the accuracy or completeness of any of the material if used by persons other than the Board. These materials are not intended to provide the sole basis for evaluation of the proposed corporate transaction and do not purport to contain all information that may be required and should not be considered a recommendation with respect to the proposed corporate transaction. Barclays has not made or obtained any evaluations or appraisals of the assets or liabilities of the Company or any other party to any corporate transaction or any of their respective affiliates and has no obligation to evaluate the solvency of the Company or any other party to any transaction under any state or federal laws relating to bankruptcy, insolvency or similar matters. The analyses contained herein do not purport to be appraisals nor do they necessarily reflect the prices at which businesses or securities actually may be sold or purchased. Barclays’ role in any due diligence review is limited solely to performing such a review as it shall deem necessary to support its own advice and analysis and shall not be on behalf of the Company, the Board or any individual officer, director, shareholder or any other person. Barclays, its subsidiaries and affiliates engage in a wide range of businesses from investment and commercial banking, lending, asset management and other financial and non-financial services. In the ordinary course of its business, Barclays and its affiliates may actively trade and effect transactions in the equity, debt and/or other securities (and any derivatives thereof) and financial instruments (including loans and other obligations) of the Company and the Target for its own account and for the accounts of its customers and, accordingly, may at any time hold long or short positions and investments in such securities and financial instruments or in other financial products and instruments. Unless otherwise expressly agreed or provided for in other applicable Barclays disclosures governing such corporate transactions or required by law or regulation, Barclays conducts these activities as principal and executes its principal transactions as an arm’s length counterparty. Barclays does not act as a fiduciary in relation to these corporate transactions. These materials do not constitute investment advice nor do they form part of an offer to sell or purchase, or the solicitation of an offer to sell or purchase, any securities or any of the businesses or assets described herein or an offer of financing or an offer or recommendation to enter into any corporate transaction described herein. Barclays Capital Inc. is the United States investment bank of Barclays Bank PLC. Barclays Bank PLC is authorised by the Prudential Regulation Authority and regulated by the Financial Conduct Authority and the Prudential Regulation Authority (Financial Services Register No. 122702). Registered in England. Registered No. 1026167. Registered office: 1 Churchill Place, London E14 5HP. Copyright Barclays Bank PLC, 2022 (all rights reserved).