UNITED STATES
SECURITIES AND EXCHANGE COMMISSION
Washington, D.C. 20549
FORM N-CSR
CERTIFIED SHAREHOLDER REPORT OF REGISTERED MANAGEMENT INVESTMENT
COMPANIES
Investment Company Act file number: 811-22873
Name of Fund: BlackRock CoRI Funds
BlackRock CoRI 2015 Fund
BlackRock CoRI 2017 Fund
BlackRock CoRI 2019 Fund
BlackRock CoRI 2021 Fund
BlackRock CoRI 2023 Fund
Fund Address: 100 Bellevue Parkway, Wilmington, DE 19809
Name and address of agent for service: John M. Perlowski, Chief Executive Officer, BlackRock CoRI Funds, 55
East 52nd Street, New York, NY 10055
Registrant’s telephone number, including area code: (800) 441-7762
Date of fiscal year end: 10/31/2016
Date of reporting period: 04/30/2016
Item 1 – Report to Stockholders
APRIL 30, 2016
| | | | | | |
SEMI-ANNUAL REPORT (UNAUDITED) | | | | | |  |
BlackRock CoRI Funds
| Ø | BlackRock CoRI 2015 Fund |
| Ø | BlackRock CoRI 2017 Fund |
| Ø | BlackRock CoRI 2019 Fund |
| Ø | BlackRock CoRI 2021 Fund |
| Ø | BlackRock CoRI 2023 Fund |
|
| Not FDIC Insured • May Lose Value • No Bank Guarantee |

| | | | | | |
| | | | | | | |
| 2 | | BLACKROCK CORI FUNDS | | APRIL 30, 2016 | | |
Dear Shareholder,
Diverging monetary policies and shifting economic outlooks across regions have been the overarching themes driving financial markets over the past couple of years. Investors spent most of 2015 anticipating the end of the Federal Reserve’s (the “Fed”) near-zero interest rate policy as U.S. growth outpaced other developed markets. The Fed ultimately hiked rates in December, whereas the European Central Bank and the Bank of Japan took additional steps to stimulate growth, even introducing negative interest rates. The U.S. dollar had strengthened considerably ahead of these developments, causing profit challenges for U.S. companies that generate revenues overseas, and pressuring emerging market currencies and commodities prices.
Global market volatility increased in the latter part of 2015 and spilled over into early 2016. Oil prices were a key factor behind the instability after collapsing in mid-2015 due to excess global supply. China, one of the world’s largest consumers of oil, was another notable source of stress for financial markets. Signs of slowing economic growth, a depreciating yuan and declining confidence in the country’s policymakers stoked investors’ worries about the potential impact of China’s weakness on the global economy. Risk assets (such as equities and high yield bonds) suffered in this environment.
After a painful start to the new year, fears of a global recession began to fade as the first quarter wore on, allowing markets to calm and risk assets to rebound. Central bank stimulus in Europe and Japan, combined with a more tempered outlook for rate hikes in the United States, helped bolster financial markets. A softening in U.S. dollar strength offered some relief to U.S. exporters and emerging market economies. Oil prices found firmer footing as global supply showed signs of leveling off.
The selloff in risk assets at the turn of the year brought valuations to more reasonable levels, creating some appealing entry points for investors in 2016. Nonetheless, slow but relatively stable growth in the United States is countered by a less optimistic global economic outlook and uncertainties around the efficacy of China’s policy response, the potential consequences of negative interest rates in Europe and Japan, and a host of geopolitical risks.
For the 12 months ended April 30, 2016, higher-quality assets such as municipal bonds, U.S. Treasuries and investment grade corporate bonds generated positive returns, while riskier assets such as non-U.S. and small cap equities broadly declined.
At BlackRock, we believe investors need to think globally, extend their scope across a broad array of asset classes and be prepared to adjust accordingly as market conditions change over time. We encourage you to talk with your financial advisor and visit blackrock.com for further insight about investing in today’s markets.
Sincerely,

Rob Kapito
President, BlackRock Advisors, LLC

Rob Kapito
President, BlackRock Advisors, LLC
| | | | | | | | |
| Total Returns as of April 30, 2016 | |
| | | 6-month | | | 12-month | |
U.S. large cap equities
(S&P 500® Index) | | | 0.43 | % | | | 1.21 | % |
U.S. small cap equities
(Russell 2000® Index) | | | (1.90 | ) | | | (5.94 | ) |
International equities
(MSCI Europe, Australasia,
Far East Index) | | | (3.07 | ) | | | (9.32 | ) |
Emerging market equities
(MSCI Emerging
Markets Index) | | | (0.13 | ) | | | (17.87 | ) |
3-month Treasury bills
(BofA Merrill Lynch 3-Month
U.S. Treasury Bill Index) | | | 0.14 | | | | 0.15 | |
U.S. Treasury securities
(BofA Merrill Lynch 10-Year
U.S. Treasury Index) | | | 3.76 | | | | 3.74 | |
U.S. investment grade
bonds (Barclays
U.S. Aggregate Bond Index) | | | 2.82 | | | | 2.72 | |
Tax-exempt municipal
bonds (S&P Municipal
Bond Index) | | | 3.52 | | | | 5.16 | |
U.S. high yield bonds
(Barclays U.S.
Corporate High Yield 2%
Issuer Capped Index) | | | 2.38 | | | | (1.08 | ) |
| Past performance is no guarantee of future results. Index performance is shown for illustrative purposes only. You cannot invest directly in an index. | |
| | | | | | |
| | | | | | | |
| | THIS PAGE NOT PART OF YOUR FUND REPORT | | | | 3 |
| | | | |
| Funds’ Summary as of April 30, 2016 | | BlackRock CoRI Funds |
The BlackRock CoRI Funds’ (the “Funds”) investment objective is to seek to provide long-term investment results that correspond to the total return of each Fund’s respective benchmark.
|
| Portfolio Management Commentary |
How did the Funds perform?
| • | | For the six-month period ended April 30, 2016, the Funds’ Institutional Shares of CoRI 2015 Fund and CoRI 2017 Fund performed in line while CoRI 2019 Fund, CoRI 2021 Fund and CoRI 2023 Fund outperformed their respective primary benchmarks. The Funds’ Investor A Shares of CoRI 2015 Fund, CoRI 2017 Fund and CoRI 2019 Fund underperformed their respective primary benchmarks, while Investor A Shares of CoRI 2021 Fund and CoRI 2023 Fund performed in line. The following discussion of relative performance pertains to each Fund’s respective primary benchmark. |
What factors influenced performance?
| • | | The Funds were positioned to match the performance of their respective benchmarks. The sampling methodology used to replicate the return of its respective benchmark was the key factor in each Fund’s relative performance. With that said, the Funds were helped by having longer durations than their respective peer groups. (Duration is a measure of interest-rate sensitivity.) Longer-term bonds outperformed the overall market during the past six months, reflecting the environment of slow global growth. |
| • | | The Funds utilized futures positions in order to manage interest rate exposure, but there was no significant impact to performance. |
Describe recent portfolio activity.
| • | | In order to provide results that corresponded to each benchmarks’ total return, the Funds selected securities in accordance with their relative proportion within the respective benchmarks. The Funds also considered credit quality, industry, maturity structure, coupon rates and call features when selecting securities. |
| • | | The Funds were rebalanced on a monthly basis to reflect changes in their respective benchmarks. Each Fund’s benchmark has its own time horizon, which affects its acceptable level of risk and, in turn, the strategic allocation of its holdings. The strategic allocation of each Fund’s benchmark is systematically adjusted on a monthly basis to reflect the remaining investment time horizon. |
Describe portfolio positioning at period end.
| • | | As of period end, the Funds were positioned to match the risk and return characteristics of their respective benchmarks. |
| | | | | | |
| | | | | | | |
| 4 | | BLACKROCK CORI FUNDS | | APRIL 30, 2016 | | |
|
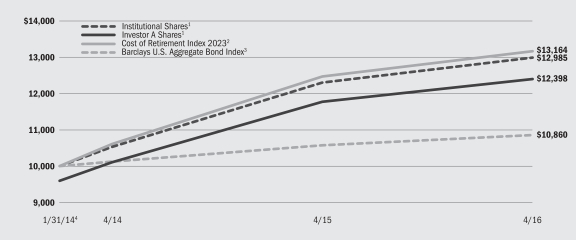
| Total Return Based on a $10,000 Investment |
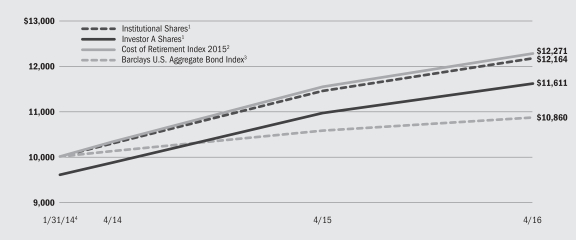
| | 1 | | Assuming maximum sales charges, if any, transaction costs and other operating expenses, including investment advisory fees and administration fees, if any. Institutional Shares do not have a sales charge. |
| | 2 | | An unmanaged total return index comprised of approximately 300 to 400 investment grade fixed-income securities, including corporate U.S. dollar-denominated bonds (issued by U.S. and non-U.S. entities), U.S. government bonds, and Treasuries (bonds and STRIPS). |
| | 3 | | A widely recognized unmanaged market-weighted index, comprised of investment-grade corporate bonds rated BBB or better, mortgages and U.S. Treasury and U.S. Government agency issues with at least one year to maturity. |
| | 4 | | Commencement of operations. |
|
| Performance Summary for the Period Ended April 30, 2016 |
| | | | | | | | | | | | | | | | | | | | | | | | | | | | |
| | | Average Annual Total Returns5 | |
| | | | | | | | | | | | 1 Year | | | Since Inception6 | |
| | | Standardized 30-Day Yields | | | Unsubsidized 30-Day Yields | | | 6-Month Total Returns | | | w/o sales charge | | | w/sales charge | | | w/o sales charge | | | w/sales charge | |
Institutional | | | 2.47 | % | | | 1.03 | % | | | 6.25 | % | | | 6.25 | % | | | N/A | | | | 9.12 | % | | | N/A | |
Investor A | | | 2.13 | | | | 0.63 | | | | 6.09 | | | | 5.89 | | | | 1.66 | % | | | 8.85 | | | | 6.88 | % |
Cost of Retirement Index 2015 | | | — | | | | — | | | | 6.24 | | | | 6.36 | | | | N/A | | | | 9.52 | | | | N/A | |
Barclays U.S. Aggregate Bond Index | | | — | | | | — | | | | 2.82 | | | | 2.72 | | | | N/A | | | | 3.73 | | | | N/A | |
| | 5 | | Assuming maximum sales charges, if any. Average annual total returns with and without sales charges reflect reductions for distribution and service fees. See “About Fund Performance” on page 12 for a detailed description of share classes, including any related sales charges and fees. |
| | 6 | | The Fund commenced operations on January 31, 2014. |
| | | | N/A — Not applicable as share class and index do not have a sales charge. |
| | | | Past performance is not indicative of future results. |
| | | | | | | | | | | | | | | | | | | | | | | | | | | | |
| | | Actual | | | Hypothetical8 | | | | |
| | | Beginning
Account Value
November 1, 2015 | | | Ending
Account Value
April 30, 2016 | | | Expenses Paid
During the Period7 | | | Beginning
Account Value November 1, 2015 | | | Ending
Account Value
April 30, 2016 | | | Expenses Paid
During the Period7 | | | Annualized
Expense Ratio | |
Institutional | | $ | 1,000.00 | | | $ | 1,062.50 | | | $ | 1.33 | | | $ | 1,000.00 | | | $ | 1,023.61 | | | $ | 1.31 | | | | 0.26 | % |
Investor A | | $ | 1,000.00 | | | $ | 1,060.90 | | | $ | 2.56 | | | $ | 1,000.00 | | | $ | 1,022.41 | | | $ | 2.51 | | | | 0.50 | % |
| | 7 | | For each class of the Fund, expenses are equal to the annualized expense ratio for the class multiplied by the average account value over the period, multiplied by 182/366 (to reflect the one half year period shown). |
| | 8 | | Hypothetical 5% annual return before expenses is pro rated for the number of days in the most recent fiscal period. |
| | | | See “Disclosure of Expenses” on page 12 for further information on how expenses were calculated. |
| | | | | | |
| | | | | | | |
| | BLACKROCK CORI FUNDS | | APRIL 30, 2016 | | 5 |
|
| Total Return Based on a $10,000 Investment |
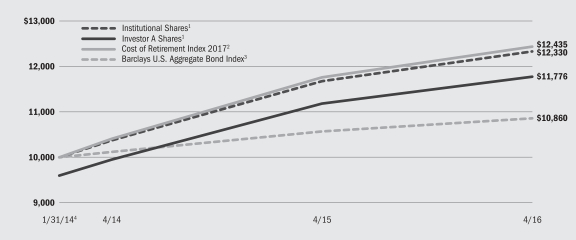
| | 1 | | Assuming maximum sales charges, if any, transaction costs and other operating expenses, including investment advisory fees and administration fees, if any. Institutional Shares do not have a sales charge. |
| | 2 | | An unmanaged total return index comprised of approximately 300 to 400 investment grade fixed-income securities, including corporate U.S. dollar-denominated bonds (issued by U.S. and non-U.S. entities), U.S. government bonds, and Treasuries (bonds and STRIPS). |
| | 3 | | A widely recognized unmanaged market-weighted index, comprised of investment-grade corporate bonds rated BBB or better, mortgages and U.S. Treasury and U.S. Government agency issues with at least one year to maturity. |
| | 4 | | Commencement of operations. |
|
| Performance Summary for the Period Ended April 30, 2016 |
| | | | | | | | | | | | | | | | | | | | | | | | | | | | |
| | | | | | | | | | | | Average Annual Total Returns5 | |
| | | | | | | | | | | | 1 Year | | | Since Inception6 | |
| | | Standardized 30-Day Yields | | | Unsubsidized 30-Day Yields | | | 6-Month Total Returns | | | w/o sales charge | | | w/sales charge | | | w/o sales charge | | | w/sales charge | |
Institutional | | | 2.56 | % | | | 1.12 | % | | | 6.33 | % | | | 5.58 | % | | | N/A | | | | 9.79 | % | | | N/A | |
Investor A | | | 2.23 | | | | 0.74 | | | | 6.14 | | | | 5.29 | | | | 1.08 | % | | | 9.53 | | | | 7.56 | % |
Cost of Retirement Index 2017 | | | — | | | | — | | | | 6.31 | | | | 5.71 | | | | N/A | | | | 10.17 | | | | N/A | |
Barclays U.S. Aggregate Bond Index | | | — | | | | — | | | | 2.82 | | | | 2.72 | | | | N/A | | | | 3.73 | | | | N/A | |
| | 5 | | Assuming maximum sales charges, if any. Average annual total returns with and without sales charges reflect reductions for distribution and service fees. See “About Fund Performance” on page 12 for a detailed description of share classes, including any related sales charges and fees. |
| | 6 | | The Fund commenced operations on January 31, 2014. |
| | | | N/A — Not applicable as share class and index do not have a sales charge. |
| | | | Past performance is not indicative of future results. |
| | | | | | | | | | | | | | | | | | | | | | | | | | | | |
| | | Actual | | | Hypothetical8 | | | | |
| | | Beginning Account Value November 1, 2015 | | | Ending
Account Value
April 30, 2016 | | | Expenses Paid
During the Period7 | | | Beginning
Account Value
November 1, 2015 | | | Ending
Account Value
April 30, 2016 | | | Expenses Paid
During the Period7 | | | Annualized
Expense Ratio | |
Institutional | | $ | 1,000.00 | | | $ | 1,063.30 | | | $ | 1.33 | | | $ | 1,000.00 | | | $ | 1,023.61 | | | $ | 1.31 | | | | 0.26 | % |
Investor A | | $ | 1,000.00 | | | $ | 1,061.40 | | | $ | 2.61 | | | $ | 1,000.00 | | | $ | 1,022.36 | | | $ | 2.56 | | | | 0.51 | % |
| | 7 | | For each class of the Fund, expenses are equal to the annualized expense ratio for the class multiplied by the average account value over the period, multiplied by 182/366 (to reflect the one half year period shown). |
| | 8 | | Hypothetical 5% annual return before expenses is pro rated for the number of days in the most recent fiscal period. |
| | | | See “Disclosure of Expenses” on page 12 for further information on how expenses were calculated. |
| | | | | | |
| | | | | | | |
| 6 | | BLACKROCK CORI FUNDS | | APRIL 30, 2016 | | |
|
| Total Return Based on a $10,000 Investment |
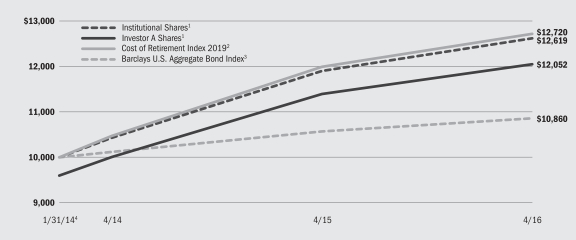
| | 1 | | Assuming maximum sales charges, if any, transaction costs and other operating expenses, including investment advisory fees and administration fees, if any. Institutional Shares do not have a sales charge. |
| | 2 | | An unmanaged total return index comprised of approximately 300 to 400 investment grade fixed-income securities, including corporate U.S. dollar-denominated bonds (issued by U.S. and non-U.S. entities), U.S. government bonds, and Treasuries (bonds and STRIPS). |
| | 3 | | A widely recognized unmanaged market-weighted index, comprised of investment-grade corporate bonds rated BBB or better, mortgages and U.S. Treasury and U.S. Government agency issues with at least one year to maturity. |
| | 4 | | Commencement of operations. |
|
| Performance Summary for the Period Ended April 30, 2016 |
| | | | | | | | | | | | | | | | | | | | | | | | | | | | |
| | | | | | | | | | | | Average Annual Total Returns5 | |
| | | | | | | | | | | | 1 Year | | | Since Inception6 | |
| | | Standardized
30-Day Yields | | | Unsubsidized
30-Day Yields | | | 6-Month
Total Returns | | | w/o sales
charge | | | w/sales
charge | | | w/o sales
charge | | | w/sales
charge | |
Institutional | | | 2.77 | % | | | 1.43 | % | | | 6.85 | % | | | 6.01 | % | | | N/A | | | | 10.92 | % | | | N/A | |
Investor A | | | 2.42 | | | | 1.06 | | | | 6.70 | | | | 5.76 | | | | 1.53 | % | | | 10.67 | | | | 8.67 | % |
Cost of Retirement Index 2019 | | | — | | | | — | | | | 6.77 | | | | 6.09 | | | | N/A | | | | 11.29 | | | | N/A | |
Barclays U.S. Aggregate Bond Index | | | — | | | | — | | | | 2.82 | | | | 2.72 | | | | N/A | | | | 3.73 | | | | N/A | |
| | 5 | | Assuming maximum sales charges, if any. Average annual total returns with and without sales charges reflect reductions for distribution and service fees. See “About Fund Performance” on page 12 for a detailed description of share classes, including any related sales charges and fees. |
| | 6 | | The Fund commenced operations on January 31, 2014. |
| | | | N/A — Not applicable as share class and index do not have a sales charge. |
| | | | Past performance is not indicative of future results. |
| | | | | | | | | | | | | | | | | | | | | | | | | | | | |
| | | Actual | | | Hypothetical8 | | | | |
| | | Beginning Account Value November 1, 2015 | | | Ending Account Value
April 30, 2016 | | | Expenses Paid
During the Period7 | | | Beginning Account Value November 1, 2015 | | | Ending Account Value
April 30, 2016 | | | Expenses Paid
During the Period7 | | | Annualized
Expense Ratio | |
Institutional | | $ | 1,000.00 | | | $ | 1,068.50 | | | $ | 1.34 | | | $ | 1,000.00 | | | $ | 1,023.61 | | | $ | 1.31 | | | | 0.26 | % |
Investor A | | $ | 1,000.00 | | | $ | 1,067.00 | | | $ | 2.62 | | | $ | 1,000.00 | | | $ | 1,022.36 | | | $ | 2.56 | | | | 0.51 | % |
| | 7 | | For each class of the Fund, expenses are equal to the annualized expense ratio for the class multiplied by the average account value over the period, multiplied by 182/366 (to reflect the one half year period shown). |
| | 8 | | Hypothetical 5% annual return before expenses is pro rated for the number of days in the most recent fiscal period. |
| | | | See “Disclosure of Expenses” on page 12 for further information on how expenses were calculated. |
| | | | | | |
| | | | | | | |
| | BLACKROCK CORI FUNDS | | APRIL 30, 2016 | | 7 |
|
| Total Return Based on a $10,000 Investment |
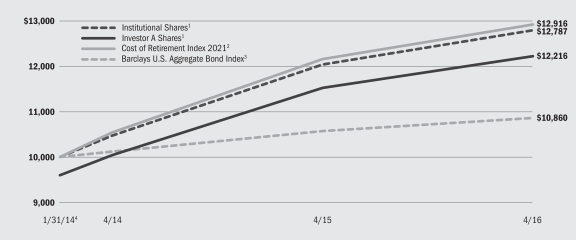
| | 1 | | Assuming maximum sales charges, if any, transaction costs and other operating expenses, including investment advisory fees and administration fees, if any. Institutional Shares do not have a sales charge. |
| | 2 | | An unmanaged total return index comprised of approximately 300 to 400 investment grade fixed-income securities, including corporate U.S. dollar-denominated bonds (issued by U.S. and non-U.S. entities), U.S. government bonds, and Treasuries (bonds and STRIPS). |
| | 3 | | A widely recognized unmanaged market-weighted index, comprised of investment-grade corporate bonds rated BBB or better, mortgages and U.S. Treasury and U.S. Government agency issues with at least one year to maturity. |
| | 4 | | Commencement of operations. |
|
| Performance Summary for the Period Ended April 30, 2016 |
| | | | | | | | | | | | | | | | | | | | | | | | | | | | |
| | | | | | | | | | | | Average Annual Total Returns5 | |
| | | | | | | | | | | | 1 Year | | | Since Inception6 | |
| | | Standardized
30-Day Yields | | | Unsubsidized
30-Day Yields | | | 6-Month
Total Returns | | | w/o sales
charge | | | w/sales
charge | | | w/o sales
charge | | | w/sales
charge | |
Institutional | | | 3.01 | % | | | 1.73 | % | | | 7.73 | % | | | 6.24 | % | | | N/A | | | | 11.58 | % | | | N/A | |
Investor A | | | 2.65 | | | | 1.37 | | | | 7.69 | | | | 6.01 | | | | 1.77 | % | | | 11.34 | | | | 9.33 | % |
Cost of Retirement Index 2021 | | | — | | | | — | | | | 7.64 | | | | 6.28 | | | | N/A | | | | 12.04 | | | | N/A | |
Barclays U.S. Aggregate Bond Index | | | — | | | | — | | | | 2.82 | | | | 2.72 | | | | N/A | | | | 3.73 | | | | N/A | |
| | 5 | | Assuming maximum sales charges, if any. Average annual total returns with and without sales charges reflect reductions for distribution and service fees. See “About Fund Performance” on page 12 for a detailed description of share classes, including any related sales charges and fees. |
| | 6 | | The Fund commenced operations on January 31, 2014. |
| | | | N/A — Not applicable as share class and index do not have a sales charge. |
| | | | Past performance is not indicative of future results. |
| | | | | | | | | | | | | | | | | | | | | | | | | | | | |
| | | Actual | | | Hypothetical8 | | | | |
| | | Beginning Account Value
November 1, 2015 | | | Ending Account Value
April 30, 2016 | | | Expenses Paid
During the Period7 | | | Beginning Account Value
November 1, 2015 | | | Ending Account Value
April 30, 2016 | | | Expenses Paid
During the Period7 | | | Annualized
Expense Ratio | |
Institutional | | $ | 1,000.00 | | | $ | 1,077.30 | | | $ | 1.34 | | | $ | 1,000.00 | | | $ | 1,023.61 | | | $ | 1.31 | | | | 0.26 | % |
Investor A | | $ | 1,000.00 | | | $ | 1,076.90 | | | $ | 2.58 | | | $ | 1,000.00 | | | $ | 1,022.41 | | | $ | 2.51 | | | | 0.50 | % |
| | 7 | | For each class of the Fund, expenses are equal to the annualized expense ratio for the class multiplied by the average account value over the period, multiplied by 182/366 (to reflect the one half year period shown). |
| | 8 | | Hypothetical 5% annual return before expenses is pro rated for the number of days in the most recent fiscal period. |
| | | | See “Disclosure of Expenses” on page 12 for further information on how expenses were calculated. |
| | | | | | |
| | | | | | | |
| 8 | | BLACKROCK CORI FUNDS | | APRIL 30, 2016 | | |
|
| Total Return Based on a $10,000 Investment |
| | 1 | | Assuming maximum sales charges, if any, transaction costs and other operating expenses, including investment advisory fees and administration fees, if any. Institutional Shares do not have a sales charge. |
| | 2 | | An unmanaged total return index comprised of approximately 300 to 400 investment grade fixed-income securities, including corporate U.S. dollar-denominated bonds (issued by U.S. and non-U.S. entities), U.S. government bonds, and Treasuries (bonds and STRIPS). |
| | 3 | | A widely recognized unmanaged market-weighted index, comprised of investment-grade corporate bonds rated BBB or better, mortgages and U.S. Treasury and U.S. Government agency issues with at least one year to maturity. |
| | 4 | | Commencement of operations. |
|
| Performance Summary for the Period Ended April 30, 2016 |
| | | | | | | | | | | | | | | | | | | | | | | | | | | | |
| | | | | | | | | | | | Average Annual Total Returns5 | |
| | | | | | | | | | | | 1 Year | | | Since Inception6 | |
| | | Standardized
30-Day Yields | | | Unsubsidized
30-Day Yields | | | 6-Month
Total Returns | | | w/o sales
charge | | | w/sales
charge | | | w/o sales
charge | | | w/sales
charge | |
Institutional | | | 3.17 | % | | | 1.85 | % | | | 8.37 | % | | | 5.53 | % | | | N/A | | | | 12.35 | % | | | N/A | |
Investor A | | | 2.80 | | | | 1.32 | | | | 8.25 | | | | 5.31 | | | | 1.10 | % | | | 12.07 | | | | 10.05 | % |
Cost of Retirement Index 2023 | | | — | | | | — | | | | 8.29 | | | | 5.56 | | | | N/A | | | | 13.00 | | | | N/A | |
Barclays U.S. Aggregate Bond Index | | | — | | | | — | | | | 2.82 | | | | 2.72 | | | | N/A | | | | 3.73 | | | | N/A | |
| | 5 | | Assuming maximum sales charges, if any. Average annual total returns with and without sales charges reflect reductions for distribution and service fees. See “About Fund Performance” on page 12 for a detailed description of share classes, including any related sales charges and fees. |
| | 6 | | The Fund commenced operations on January 31, 2014. |
| | | | N/A — Not applicable as share class and index do not have a sales charge. |
| | | | Past performance is not indicative of future results. |
| | | | | | | | | | | | | | | | | | | | | | | | | | | | |
| | | Actual | | | Hypothetical8 | | | | |
| | | Beginning
Account Value
November 1, 2015 | | | Ending
Account Value
April 30, 2016 | | | Expenses Paid
During the Period7 | | | Beginning
Account Value
November 1, 2015 | | | Ending
Account Value
April 30, 2016 | | | Expenses Paid
During the Period7 | | | Annualized
Expense Ratio | |
Institutional | | $ | 1,000.00 | | | $ | 1,083.70 | | | $ | 1.30 | | | $ | 1,000.00 | | | $ | 1,023.66 | | | $ | 1.26 | | | | 0.25 | % |
Investor A | | $ | 1,000.00 | | | $ | 1,082.50 | | | $ | 2.59 | | | $ | 1,000.00 | | | $ | 1,022.41 | | | $ | 2.51 | | | | 0.50 | % |
| | 7 | | For each class of the Fund, expenses are equal to the annualized expense ratio for the class multiplied by the average account value over the period, multiplied by 182/366 (to reflect the one half year period shown). |
| | 8 | | Hypothetical 5% annual return before expenses is pro rated for the number of days in the most recent fiscal period. |
| | | | See “Disclosure of Expenses” on page 12 for further information on how expenses were calculated. |
| | | | | | |
| | | | | | | |
| | BLACKROCK CORI FUNDS | | APRIL 30, 2016 | | 9 |
|
| Overview of the Fund’s Total Investments |
| | | | |
| Portfolio Composition | | 4/30/16 | |
U.S. Treasury Obligations | | | 59 | % |
Corporate Bonds | | | 41 | |
| | | | |
| Credit Quality Allocation1 | | 4/30/16 | |
AAA/Aaa2 | | | 59 | % |
AA/Aa | | | 4 | |
A | | | 20 | |
BBB/Baa | | | 17 | |
| | 1 | | For financial reporting purposes, credit quality ratings shown above reflect the highest rating assigned by either Standard & Poor’s (“S&P”) or Moody’s Investors Service (“Moody’s”) if ratings differ. These rating agencies are independent, nationally recognized statistical rating organizations and are widely used. Investment grade ratings are credit ratings of BBB/Baa or higher. Below investment grade ratings are credit ratings of BB/Ba or lower. Credit quality ratings are subject to change. |
| | 2 | | Includes U.S. Treasury Obligations which are deemed AAA/Aaa by the investment advisor. |
BlackRock CoRI 2017 Fund
|
| Overview of the Fund’s Total Investments |
| | | | |
| Portfolio Composition | | 4/30/16 | |
U.S. Treasury Obligations | | | 60 | % |
Corporate Bonds | | | 40 | |
| | | | |
| Credit Quality Allocation1 | | 4/30/16 | |
AAA/Aaa2 | | | 60 | % |
AA/Aa | | | 4 | |
A | | | 19 | |
BBB/Baa | | | 17 | |
| | 1 | | For financial reporting purposes, credit quality ratings shown above reflect the highest rating assigned by either S&P or Moody’s if ratings differ. These rating agencies are independent, nationally recognized statistical rating organizations and are widely used. Investment grade ratings are credit ratings of BBB/Baa or higher. Below investment grade ratings are credit ratings of BB/Ba or lower. Credit quality ratings are subject to change. |
| | 2 | | Includes U.S. Treasury Obligations which are deemed AAA/Aaa by the investment advisor. |
BlackRock CoRI 2019 Fund
|
| Overview of the Fund’s Total Investments |
| | | | |
| Portfolio Composition | | 4/30/16 | |
U.S. Treasury Obligations | | | 62 | % |
Corporate Bonds | | | 38 | |
| | | | |
| Credit Quality Allocation1 | | 4/30/16 | |
AAA/Aaa2 | | | 62 | % |
AA/Aa | | | 4 | |
A | | | 18 | |
BBB/Baa | | | 16 | |
| | 1 | | For financial reporting purposes, credit quality ratings shown above reflect the highest rating assigned by either S&P or Moody’s if ratings differ. These rating agencies are independent, nationally recognized statistical rating organizations and are widely used. Investment grade ratings are credit ratings of BBB/Baa or higher. Below investment grade ratings are credit ratings of BB/Ba or lower. Credit quality ratings are subject to change. |
| | 2 | | Includes U.S. Treasury Obligations which are deemed AAA/Aaa by the investment advisor. |
| | | | | | |
| | | | | | | |
| 10 | | BLACKROCK CORI FUNDS | | APRIL 30, 2016 | | |
|
| Overview of the Fund’s Total Investments |
| | | | |
| Portfolio Composition | | 4/30/16 | |
U.S. Treasury Obligations | | | 61 | % |
Corporate Bonds | | | 39 | |
| | | | |
| Credit Quality Allocation1 | | 4/30/16 | |
AAA/Aaa2 | | | 61 | % |
AA/Aa | | | 4 | |
A | | | 19 | |
BBB/Baa | | | 16 | |
| | 1 | | For financial reporting purposes, credit quality ratings shown above reflect the highest rating assigned by either S&P or Moody’s if ratings differ. These rating agencies are independent, nationally recognized statistical rating organizations and are widely used. Investment grade ratings are credit ratings of BBB/Baa or higher. Below investment grade ratings are credit ratings of BB/Ba or lower. Credit quality ratings are subject to change. |
| | 2 | | Includes U.S. Treasury Obligations which are deemed AAA/Aaa by the investment advisor. |
BlackRock CoRI 2023 Fund
|
| Overview of the Fund’s Total Investments |
| | | | |
| Portfolio Composition | | 4/30/16 | |
U.S. Treasury Obligations | | | 55 | % |
Corporate Bonds | | | 45 | |
| | | | |
| Credit Quality Allocation1 | | 4/30/16 | |
AAA/Aaa2 | | | 55 | % |
AA/Aa | | | 4 | |
A | | | 22 | |
BBB/Baa | | | 19 | |
| | 1 | | For financial reporting purposes, credit quality ratings shown above reflect the highest rating assigned by either S&P or Moody’s if ratings differ. These rating agencies are independent, nationally recognized statistical rating organizations and are widely used. Investment grade ratings are credit ratings of BBB/Baa or higher. Below investment grade ratings are credit ratings of BB/Ba or lower. Credit quality ratings are subject to change. |
| | 2 | | Includes U.S. Treasury Obligations which are deemed AAA/Aaa by the investment advisor. |
| | | | | | |
| | | | | | | |
| | BLACKROCK CORI FUNDS | | APRIL 30, 2016 | | 11 |
| • | | Institutional Shares are not subject to any sales charge. These shares bear no ongoing distribution or service fees and are available only to certain eligible investors. |
| • | | Investor A Shares are subject to a maximum initial sales charge (front-end load) of 4.00% and a service fee of 0.25% per year (but no distribution fee). Certain redemptions of these shares may be subject to a contingent deferred sales charge (“CDSC”) where no initial sales charge was paid at the time of purchase. These shares are generally available through financial intermediaries. |
Performance information reflects past performance and does not guarantee future results. Current performance may be lower or higher than the performance data quoted. Refer to www.blackrock.com/funds to obtain performance data current to the most recent month end. Performance results do not reflect the deduction of taxes that a shareholder would pay on fund distributions or the redemption of fund shares. Figures shown in the performance tables on the previous pages
assume reinvestment of all distributions, if any, at net asset value (“NAV”) on the ex-dividend date. Investment return and principal value of shares will fluctuate so that shares, when redeemed, may be worth more or less than their original cost. Distributions paid to each class of shares will vary because of the different levels of service, distribution and transfer agency fees applicable to each class, which are deducted from the income available to be paid to shareholders.
BlackRock Advisors, LLC (the “Manager”), each Fund’s investment advisor, has contractually agreed to waive and/or reimburse a portion of the Funds’ expenses. Without such waiver and/or reimbursement, the Funds’ performance would have been lower. The Manager is under no obligation to continue waiving and/or reimbursing its fees after the applicable termination date of such agreement. See Note 6 of the Notes to Financial Statements for additional information on waivers and/or reimbursements. The standardized 30-day yield includes the effects of any waivers and/or reimbursements. The unsubsidized 30-day yield excludes the effects of any waivers and/or reimbursements.
Shareholders of these Funds may incur the following charges: (a) transactional expenses, such as sales charges; and (b) operating expenses, including investment advisory fees, service and distribution fees, including 12b-1 fees, acquired fund fees and expenses, and other fund expenses. The expense examples on previous pages (which are based on a hypothetical investment of $1,000 invested on November 1, 2015 and held through April 30, 2016) are intended to assist shareholders both in calculating expenses based on an investment in each Fund and in comparing these expenses with similar costs of investing in other mutual funds.
The expense examples provide information about actual account values and actual expenses. In order to estimate the expenses a shareholder paid during the period covered by this report, shareholders can divide their account value by $1,000 and then multiply the result by the number corresponding to their Fund and share class under the heading entitled “Expenses Paid During the Period.”
The expense examples also provide information about hypothetical account values and hypothetical expenses based on a Fund’s actual expense ratio and an assumed rate of return of 5% per year before expenses. In order to assist shareholders in comparing the ongoing expenses of investing in these Funds and other funds, compare the 5% hypothetical examples with the 5% hypothetical examples that appear in shareholder reports of other funds.
The expenses shown in the expense examples are intended to highlight shareholders’ ongoing costs only and do not reflect any transactional expenses, such as sales charges, if any. Therefore, the hypothetical examples are useful in comparing ongoing expenses only, and will not help shareholders determine the relative total expenses of owning different funds. If these transactional expenses were included, shareholder expenses would have been higher.
| | |
| Derivative Financial Instruments | | |
The Funds may invest in various derivative financial instruments. These instruments are used to obtain exposure to a security, commodity, index, market, and/or other asset without owning or taking physical custody of securities, commodities, and/or other referenced assets or to manage market, equity, credit, interest rate, foreign currency exchange rate, commodity and/or other risks. Derivative financial instruments may give rise to a form of economic leverage and involve risks, including the imperfect correlation between the value of a derivative financial instrument and the underlying asset, possible
default of the counterparty to the transaction or illiquidity of the instrument. The Funds’ successful use of a derivative financial instrument depends on the investment advisor’s ability to predict pertinent market movements accurately, which cannot be assured. The use of these instruments may result in losses greater than if they had not been used, may limit the amount of appreciation a Fund can realize on an investment and/or may result in lower distributions paid to shareholders. The Funds’ investments in these instruments, if any, are discussed in detail in the Notes to Financial Statements.
| | | | | | |
| | | | | | | |
| 12 | | BLACKROCK CORI FUNDS | | APRIL 30, 2016 | | |
| | |
Schedule of Investments April 30, 2016 (Unaudited) | | BlackRock CoRI 2015 Fund (Percentages shown are based on Net Assets) |
| | | | | | | | |
| Corporate Bonds | | Par
(000) | | | Value | |
Aerospace & Defense — 0.9% | | | | | | | | |
Lockheed Martin Corp.: | | | | | | | | |
4.85%, 9/15/41 | | $ | 10 | | | $ | 11,543 | |
4.07%, 12/15/42 | | | 10 | | | | 10,427 | |
Northrop Grumman Corp., 3.25%, 8/01/23 | | | 25 | | | | 26,338 | |
United Technologies Corp.: | | | | | | | | |
3.10%, 6/01/22 | | | 15 | | | | 15,871 | |
5.70%, 4/15/40 | | | 15 | | | | 19,024 | |
4.50%, 6/01/42 | | | 25 | | | | 27,844 | |
| | | | | | | | |
| | | | | 111,047 | |
Air Freight & Logistics — 0.2% | | | | | | | | |
FedEx Corp.: | | | | | | | | |
4.90%, 1/15/34 | | | 10 | | | | 11,031 | |
4.10%, 2/01/45 | | | 10 | | | | 9,989 | |
United Parcel Service, Inc., 6.20%, 1/15/38 | | | 5 | | | | 6,884 | |
| | | | | | | | |
| | | | | 27,904 | |
Automobiles — 0.4% | | | | | | | | |
Daimler Finance North America LLC,
8.50%, 1/18/31 | | | 5 | | | | 7,912 | |
Ford Motor Co., 4.75%, 1/15/43 | | | 35 | | | | 36,385 | |
| | | | | | | | |
| | | | | 44,297 | |
Banks — 4.0% | | | | | | | | |
BNP Paribas SA, 3.25%, 3/03/23 | | | 20 | | | | 20,747 | |
Cooperatieve Rabobank UA, 3.88%, 2/08/22 | | | 75 | | | | 80,739 | |
Fifth Third Bancorp, 8.25%, 3/01/38 | | | 10 | | | | 14,365 | |
HSBC Finance Corp., 6.68%, 1/15/21 | | | 25 | | | | 28,723 | |
HSBC Holdings PLC, 6.10%, 1/14/42 | | | 60 | | | | 76,199 | |
Sumitomo Mitsui Financial Group, Inc.,
3.78%, 3/09/26 | | | 25 | | | | 26,127 | |
Wells Fargo & Co.: | | | | | | | | |
3.00%, 1/22/21 | | | 25 | | | | 25,948 | |
3.50%, 3/08/22 | | | 25 | | | | 26,566 | |
3.45%, 2/13/23 | | | 75 | | | | 76,825 | |
3.30%, 9/09/24 | | | 15 | | | | 15,459 | |
5.38%, 11/02/43 | | | 5 | | | | 5,696 | |
5.61%, 1/15/44 | | | 25 | | | | 29,286 | |
4.65%, 11/04/44 | | | 10 | | | | 10,366 | |
4.90%, 11/17/45 | | | 30 | | | | 32,438 | |
| | | | | | | | |
| | | | | 469,484 | |
Beverages — 1.2% | | | | | | | | |
Anheuser-Busch InBev Finance, Inc.,
4.63%, 2/01/44 | | | 7 | | | | 7,721 | |
Anheuser-Busch InBev Worldwide, Inc.,
2.50%, 7/15/22 | | | 43 | | | | 43,323 | |
Diageo Investment Corp.: | | | | | | | | |
2.88%, 5/11/22 | | | 25 | | | | 26,114 | |
4.25%, 5/11/42 | | | 10 | | | | 10,781 | |
Molson Coors Brewing Co., 5.00%, 5/01/42 | | | 10 | | | | 10,851 | |
PepsiCo, Inc.: | | | | | | | | |
2.75%, 3/01/23 | | | 35 | | | | 36,539 | |
4.00%, 3/05/42 | | | 10 | | | | 10,381 | |
| | | | | | | | |
| | | | | 145,710 | |
| | | | | | | | |
| Corporate Bonds | | Par
(000) | | | Value | |
Biotechnology — 0.6% | | | | | | | | |
Amgen, Inc., 6.40%, 2/01/39 | | $ | 15 | | | $ | 19,370 | |
Biogen, Inc., 3.63%, 9/15/22 | | | 20 | | | | 21,340 | |
Celgene Corp., 3.55%, 8/15/22 | | | 25 | | | | 26,168 | |
| | | | | | | | |
| | | | | 66,878 | |
Capital Markets — 3.6% | | | | | | | | |
Ameriprise Financial, Inc., 3.70%, 10/15/24 | | | 20 | | | | 20,876 | |
Bank of New York Mellon Corp., 4.15%, 2/01/21 | | | 25 | | | | 27,329 | |
Credit Suisse USA, Inc., 7.13%, 7/15/32 | | | 15 | | | | 19,360 | |
Goldman Sachs Group, Inc.: | | | | | | | | |
3.63%, 1/22/23 | | | 40 | | | | 41,453 | |
6.13%, 2/15/33 | | | 35 | | | | 42,857 | |
6.75%, 10/01/37 | | | 55 | | | | 66,675 | |
Morgan Stanley: | | | | | | | | |
3.75%, 2/25/23 | | | 25 | | | | 26,057 | |
3.70%, 10/23/24 | | | 75 | | | | 77,363 | |
5.00%, 11/24/25 | | | 25 | | | | 27,211 | |
4.35%, 9/08/26 | | | 10 | | | | 10,333 | |
3.95%, 4/23/27 | | | 30 | | | | 29,956 | |
4.30%, 1/27/45 | | | 20 | | | | 20,311 | |
State Street Corp., 3.70%, 11/20/23 | | | 10 | | | | 10,884 | |
| | | | | | | | |
| | | | | 420,665 | |
Chemicals — 0.6% | | | | | | | | |
CF Industries, Inc., 5.15%, 3/15/34 | | | 5 | | | | 4,938 | |
Dow Chemical Co., 7.38%, 11/01/29 | | | 5 | | | | 6,533 | |
E.I. du Pont de Nemours & Co., 2.80%, 2/15/23 | | | 25 | | | | 25,303 | |
Ecolab, Inc., 4.35%, 12/08/21 | | | 25 | | | | 27,851 | |
LYB International Finance BV, 4.88%, 3/15/44 | | | 5 | | | | 5,222 | |
Potash Corp. of Saskatchewan, Inc.,
5.88%, 12/01/36 | | | 5 | | | | 6,032 | |
| | | | | | | | |
| | | | | 75,879 | |
Commercial Services & Supplies — 0.2% | |
Republic Services, Inc., 5.25%, 11/15/21 | | | 25 | | | | 28,509 | |
Communications Equipment — 0.4% | |
Cisco Systems, Inc., 5.90%, 2/15/39 | | | 30 | | | | 39,680 | |
Motorola Solutions, Inc., 4.00%, 9/01/24 | | | 10 | | | | 9,726 | |
| | | | | | | | |
| | | | | 49,406 | |
Consumer Finance — 0.7% | |
American Express Co., 4.05%, 12/03/42 | | | 20 | | | | 20,296 | |
Capital One Financial Corp., 3.50%, 6/15/23 | | | 25 | | | | 25,347 | |
John Deere Capital Corp., 2.80%, 1/27/23 | | | 10 | | | | 10,173 | |
MasterCard, Inc., 3.38%, 4/01/24 | | | 25 | | | | 26,797 | |
| | | | | | | | |
| | | | | 82,613 | |
Diversified Financial Services — 6.5% | |
Bank of America Corp.: | | | | | | | | |
5.63%, 7/01/20 | | | 25 | | | | 28,093 | |
3.30%, 1/11/23 | | | 45 | | | | 45,733 | |
4.13%, 1/22/24 | | | 25 | | | | 26,505 | |
4.00%, 1/22/25 | | | 25 | | | | 25,038 | |
4.25%, 10/22/26 | | | 55 | | | | 56,214 | |
5.88%, 2/07/42 | | | 15 | | | | 18,567 | |
| | |
| STRIPS | | Separate Trading of Registered Interest and Principal Securities |
See Notes to Financial Statements.
| | | | | | |
| | | | | | | |
| | BLACKROCK CORI FUNDS | | APRIL 30, 2016 | | 13 |
| | |
Schedule of Investments (continued) | | BlackRock CoRI 2015 Fund |
| | | | | | | | |
| Corporate Bonds | | Par
(000) | | | Value | |
Diversified Financial Services (continued) | |
Bank of America Corp. (continued): | | | | | | | | |
5.00%, 1/21/44 | | $ | 10 | | | $ | 11,146 | |
4.88%, 4/01/44 | | | 15 | | | | 16,502 | |
Series L, 4.75%, 4/21/45 | | | 5 | | | | 5,003 | |
Citigroup, Inc.: | | | | | | | | |
3.88%, 10/25/23 | | | 25 | | | | 26,436 | |
5.50%, 9/13/25 | | | 25 | | | | 27,696 | |
4.30%, 11/20/26 | | | 45 | | | | 46,062 | |
8.13%, 7/15/39 | | | 25 | | | | 38,329 | |
6.68%, 9/13/43 | | | 10 | | | | 12,385 | |
4.65%, 7/30/45 | | | 15 | | | | 16,041 | |
Deutsche Bank AG, 4.10%, 1/13/26 | | | 10 | | | | 10,045 | |
General Electric Capital Corp., 3.10%, 1/09/23 | | | 50 | | | | 53,088 | |
General Electric Co.: | | | | | | | | |
6.75%, 3/15/32 | | | 40 | | | | 55,288 | |
5.88%, 1/14/38 | | | 10 | | | | 13,184 | |
JPMorgan Chase & Co.: | | | | | | | | |
4.50%, 1/24/22 | | | 75 | | | | 82,827 | |
3.38%, 5/01/23 | | | 25 | | | | 25,280 | |
3.88%, 9/10/24 | | | 45 | | | | 46,497 | |
6.40%, 5/15/38 | | | 25 | | | | 33,788 | |
5.63%, 8/16/43 | | | 30 | | | | 35,247 | |
Northern Trust Corp., 3.95%, 10/30/25 | | | 10 | | | | 10,917 | |
| | | | | | | | |
| | | | | 765,911 | |
Diversified Telecommunication Services — 3.7% | |
AT&T, Inc.: | | | | | | | | |
3.00%, 2/15/22 | | | 25 | | | | 25,570 | |
3.80%, 3/15/22 | | | 25 | | | | 26,480 | |
6.30%, 1/15/38 | | | 20 | | | | 23,856 | |
6.55%, 2/15/39 | | | 10 | | | | 12,141 | |
5.35%, 9/01/40 | | | 25 | | | | 26,925 | |
6.38%, 3/01/41 | | | 10 | | | | 11,934 | |
5.55%, 8/15/41 | | | 5 | | | | 5,542 | |
5.15%, 3/15/42 | | | 5 | | | | 5,251 | |
Telefonica Emisiones SAU, 7.05%, 6/20/36 | | | 10 | | | | 12,943 | |
Verizon Communications, Inc.: | | | | | | | | |
4.50%, 9/15/20 | | | 25 | | | | 27,642 | |
5.15%, 9/15/23 | | | 50 | | | | 57,505 | |
6.40%, 9/15/33 | | | 35 | | | | 43,904 | |
6.55%, 9/15/43 | | | 25 | | | | 32,976 | |
4.86%, 8/21/46 | | | 40 | | | | 42,868 | |
4.52%, 9/15/48 | | | 30 | | | | 30,444 | |
5.01%, 8/21/54 | | | 20 | | | | 20,541 | |
4.67%, 3/15/55 | | | 30 | | | | 29,012 | |
| | | | | | | | |
| | | | | 435,534 | |
Electric Utilities — 1.6% | |
Berkshire Hathaway Energy Co., 6.13%, 4/01/36 | | | 15 | | | | 19,445 | |
Consolidated Edison Co. of New York, Inc., Series C, 5.50%, 12/01/39 | | | 10 | | | | 12,092 | |
Duke Energy Florida LLC, 6.40%, 6/15/38 | | | 25 | | | | 34,923 | |
Exelon Generation Co. LLC, 6.25%, 10/01/39 | | | 10 | | | | 10,887 | |
Georgia Power Co., 4.30%, 3/15/42 | | | 15 | | | | 16,160 | |
Pacific Gas & Electric Co.: | | | | | | | | |
6.05%, 3/01/34 | | | 20 | | | | 26,558 | |
5.40%, 1/15/40 | | | 20 | | | | 24,706 | |
Southern California Edison Co., Series A,
5.95%, 2/01/38 | | | 10 | | | | 13,098 | |
Southern Power Co., 5.15%, 9/15/41 | | | 5 | | | | 5,220 | |
| | | | | | | | |
| Corporate Bonds | | Par
(000) | | | Value | |
Electric Utilities (continued) | |
Virginia Electric & Power Co., 8.88%, 11/15/38 | | $ | 15 | | | $ | 24,320 | |
| | | | | | | | |
| | | | | 187,409 | |
Energy Equipment & Services — 0.4% | |
Baker Hughes, Inc., 5.13%, 9/15/40 | | | 5 | | | | 5,151 | |
Enterprise Products Operating LLC: | | | | | | | | |
5.95%, 2/01/41 | | | 10 | | | | 11,070 | |
5.70%, 2/15/42 | | | 15 | | | | 16,386 | |
Halliburton Co., 7.45%, 9/15/39 | | | 15 | | | | 19,693 | |
| | | | | | | | |
| | | | | 52,300 | |
Food & Staples Retailing — 0.1% | | | | | | | | |
Walgreen Co., 3.10%, 9/15/22 | | | 10 | | | | 10,203 | |
Food Products — 0.5% | | | | | | | | |
Archer-Daniels-Midland Co., 4.54%, 3/26/42 | | | 10 | | | | 10,949 | |
Kellogg Co., 4.50%, 4/01/46 | | | 10 | | | | 10,554 | |
Kraft Heinz Foods Co. (fka Kraft Foods Group, Inc.): | | | | | | | | |
3.50%, 6/06/22 | | | 25 | | | | 26,526 | |
5.00%, 6/04/42 | | | 10 | | | | 11,149 | |
| | | | | | | | |
| | | | | 59,178 | |
Health Care Equipment & Supplies — 0.6% | | | | | | | | |
Express Scripts Holding Co., 4.75%, 11/15/21 | | | 25 | | | | 27,487 | |
Medtronic, Inc.: | | | | | | | | |
4.63%, 3/15/44 | | | 6 | | | | 6,825 | |
4.63%, 3/15/45 | | | 35 | | | | 39,927 | |
| | | | | | | | |
| | | | | 74,239 | |
Health Care Providers & Services — 0.8% | | | | | | | | |
Aetna, Inc., 6.63%, 6/15/36 | | | 5 | | | | 6,337 | |
Anthem, Inc., 5.10%, 1/15/44 | | | 20 | | | | 21,998 | |
Cardinal Health, Inc., 3.20%, 3/15/23 | | | 15 | | | | 15,517 | |
UnitedHealth Group, Inc.: | | | | | | | | |
6.88%, 2/15/38 | | | 15 | | | | 21,276 | |
4.75%, 7/15/45 | | | 20 | | | | 23,108 | |
| | | | | | | | |
| | | | | 88,236 | |
Hotels, Restaurants & Leisure — 0.1% | | | | | | | | |
McDonald’s Corp., 6.30%, 10/15/37 | | | 10 | | | | 12,939 | |
Household Products — 0.2% | | | | | | | | |
Kimberly-Clark Corp., 6.63%, 8/01/37 | | | 5 | | | | 7,140 | |
Koninklijke Philips NV, 6.88%, 3/11/38 | | | 10 | | | | 12,658 | |
| | | | | | | | |
| | | | | 19,798 | |
Industrial Conglomerates — 0.4% | | | | | | | | |
General Electric Co.: | | | | | | | | |
2.70%, 10/09/22 | | | 10 | | | | 10,328 | |
4.50%, 3/11/44 | | | 30 | | | | 33,711 | |
| | | | | | | | |
| | | | | 44,039 | |
Insurance — 1.4% | | | | | | | | |
Aflac, Inc., 3.63%, 6/15/23 | | | 15 | | | | 15,873 | |
Allstate Corp., 3.15%, 6/15/23 | | | 10 | | | | 10,375 | |
American International Group, Inc.: | | | | | | | | |
3.38%, 8/15/20 | | | 25 | | | | 25,863 | |
4.13%, 2/15/24 | | | 25 | | | | 26,175 | |
Arch Capital Group US, Inc., 5.14%, 11/01/43 | | | 10 | | | | 10,419 | |
AXA SA, 8.60%, 12/15/30 | | | 5 | | | | 6,701 | |
MetLife, Inc.: | | | | | | | | |
4.88%, 11/13/43 | | | 25 | | | | 27,139 | |
See Notes to Financial Statements.
| | | | | | |
| | | | | | | |
| 14 | | BLACKROCK CORI FUNDS | | APRIL 30, 2016 | | |
| | |
Schedule of Investments (continued) | | BlackRock CoRI 2015 Fund |
| | | | | | | | |
| Corporate Bonds | | Par
(000) | | | Value | |
Insurance (continued) | | | | | | | | |
MetLife, Inc. (continued): | | | | | | | | |
4.05%, 3/01/45 | | $ | 15 | | | $ | 14,368 | |
Prudential Financial, Inc., 6.63%, 12/01/37 | | | 10 | | | | 12,549 | |
Travelers Cos., Inc., 4.60%, 8/01/43 | | | 10 | | | | 11,339 | |
| | | | | | | | |
| | | | | 160,801 | |
Life Sciences Tools & Services — 0.2% | | | | | | | | |
Thermo Fisher Scientific, Inc., 4.50%, 3/01/21 | | | 25 | | | | 27,102 | |
Machinery — 0.1% | | | | | | | | |
Caterpillar, Inc., 3.80%, 8/15/42 | | | 15 | | | | 14,844 | |
Media — 3.2% | | | | | | | | |
21st Century Fox America, Inc.: | | | | | | | | |
6.40%, 12/15/35 | | | 35 | | | | 44,118 | |
5.40%, 10/01/43 | | | 10 | | | | 11,543 | |
Comcast Corp.: | | | | | | | | |
3.13%, 7/15/22 | | | 25 | | | | 26,499 | |
4.25%, 1/15/33 | | | 5 | | | | 5,404 | |
6.45%, 3/15/37 | | | 20 | | | | 26,927 | |
6.40%, 3/01/40 | | | 20 | | | | 27,568 | |
4.65%, 7/15/42 | | | 15 | | | | 16,927 | |
Discovery Communications LLC, 6.35%, 6/01/40 | | | 15 | | | | 15,605 | |
NBCUniversal Media LLC: | | | | | | | | |
6.40%, 4/30/40 | | | 20 | | | | 27,517 | |
5.95%, 4/01/41 | | | 5 | | | | 6,533 | |
Omnicom Group, Inc., 3.63%, 5/01/22 | | | 20 | | | | 21,222 | |
Thomson Reuters Corp., 5.85%, 4/15/40 | | | 2 | | | | 2,219 | |
Time Warner Cable, Inc.: | | | | | | | | |
6.55%, 5/01/37 | | | 15 | | | | 17,262 | |
7.30%, 7/01/38 | | | 5 | | | | 6,147 | |
6.75%, 6/15/39 | | | 5 | | | | 5,920 | |
Time Warner, Inc.: | | | | | | | | |
4.05%, 12/15/23 | | | 25 | | | | 27,008 | |
7.63%, 4/15/31 | | | 25 | | | | 32,889 | |
6.10%, 7/15/40 | | | 15 | | | | 18,148 | |
5.35%, 12/15/43 | | | 10 | | | | 11,201 | |
Viacom, Inc., 4.38%, 3/15/43 | | | 10 | | | | 7,922 | |
Walt Disney Co., 2.35%, 12/01/22 | | | 15 | | | | 15,351 | |
| | | | | | | | |
| | | | | 373,930 | |
Metals & Mining — 0.7% | | | | | | | | |
BHP Billiton Finance USA Ltd.: | | | | | | | | |
3.85%, 9/30/23 | | | 15 | | | | 15,991 | |
5.00%, 9/30/43 | | | 10 | | | | 11,169 | |
Newmont Mining Corp., 6.25%, 10/01/39 | | | 5 | | | | 5,226 | |
Rio Tinto Finance USA Ltd., 5.20%, 11/02/40 | | | 15 | | | | 16,371 | |
Southern Copper Corp.: | | | | | | | | |
5.25%, 11/08/42 | | | 15 | | | | 12,922 | |
5.88%, 4/23/45 | | | 20 | | | | 18,335 | |
| | | | | | | | |
| | | | | 80,014 | |
Multiline Retail — 0.2% | | | | | | | | |
Target Corp., 4.00%, 7/01/42 | | | 20 | | | | 21,168 | |
Oil, Gas & Consumable Fuels — 2.2% | | | | | | | | |
Anadarko Petroleum Corp., 6.45%, 9/15/36 | | | 20 | | | | 21,577 | |
BP Capital Markets PLC: | | | | | | | | |
3.25%, 5/06/22 | | | 20 | | | | 20,606 | |
2.75%, 5/10/23 | | | 25 | | | | 24,975 | |
ConocoPhillips: | | | | | | | | |
5.90%, 5/15/38 | | | 10 | | | | 11,616 | |
6.50%, 2/01/39 | | | 20 | | | | 24,816 | |
| | | | | | | | |
| Corporate Bonds | | Par
(000) | | | Value | |
Oil, Gas & Consumable Fuels (continued) | | | | | | | | |
ConocoPhillips Holding Co., 6.95%, 4/15/29 | | $ | 15 | | | $ | 18,052 | |
Devon Financing Co. LLC, 7.88%, 9/30/31 | | | 15 | | | | 16,059 | |
Marathon Petroleum Corp., 5.13%, 3/01/21 | | | 25 | | | | 27,108 | |
Petro-Canada, 6.80%, 5/15/38 | | | 5 | | | | 5,903 | |
Phillips 66, 5.88%, 5/01/42 | | | 5 | | | | 5,831 | |
Suncor Energy, Inc., 6.50%, 6/15/38 | | | 25 | | | | 29,436 | |
TransCanada PipeLines Ltd., | | | | | | | | |
7.63%, 1/15/39 | | | 15 | | | | 19,361 | |
6.10%, 6/01/40 | | | 10 | | | | 11,675 | |
Valero Energy Corp., 6.63%, 6/15/37 | | | 15 | | | | 16,857 | |
| | | | | | | | |
| | | | | 253,872 | |
Pharmaceuticals — 2.0% | | | | | | | | |
Abbott Laboratories, 5.30%, 5/27/40 | | | 5 | | | | 5,713 | |
AbbVie, Inc.: | | | | | | | | |
2.90%, 11/06/22 | | | 25 | | | | 25,542 | |
4.40%, 11/06/42 | | | 10 | | | | 10,303 | |
AstraZeneca PLC: | | | | | | | | |
3.38%, 11/16/25 | | | 15 | | | | 15,630 | |
6.45%, 9/15/37 | | | 10 | | | | 13,388 | |
4.38%, 11/16/45 | | | 10 | | | | 10,827 | |
Bristol-Myers Squibb Co., 3.25%, 11/01/23 | | | 25 | | | | 26,924 | |
GlaxoSmithKline Capital, Inc., 6.38%, 5/15/38 | | | 15 | | | | 20,699 | |
Merck & Co., Inc., 2.80%, 5/18/23 | | | 25 | | | | 26,199 | |
Pfizer, Inc., 7.20%, 3/15/39 | | | 35 | | | | 51,642 | |
Teva Pharmaceutical Finance Co. BV,
2.95%, 12/18/22 | | | 25 | | | | 25,113 | |
| | | | | | | | |
| | | | | 231,980 | |
Real Estate Investment Trusts (REITs) — 0.2% | | | | | | | | |
Weyerhaeuser Co., 7.38%, 3/15/32 | | | 15 | | | | 18,672 | |
Road & Rail — 0.1% | | | | | | | | |
Norfolk Southern Corp., 4.84%, 10/01/41 | | | 15 | | | | 16,719 | |
Semiconductors & Semiconductor Equipment — 0.2% | |
Applied Materials, Inc., 5.85%, 6/15/41 | | | 5 | | | | 6,027 | |
Intel Corp., 4.80%, 10/01/41 | | | 10 | | | | 11,325 | |
| | | | | | | | |
| | | | | 17,352 | |
Software — 0.6% | | | | | | | | |
Oracle Corp.: | | | | | | | | |
2.50%, 10/15/22 | | | 25 | | | | 25,513 | |
6.13%, 7/08/39 | | | 20 | | | | 26,400 | |
5.38%, 7/15/40 | | | 15 | | | | 18,217 | |
| | | | | | | | |
| | | | | 70,130 | |
Specialty Retail — 0.2% | | | | | | | | |
Home Depot, Inc., 5.88%, 12/16/36 | | | 15 | | | | 19,717 | |
Technology Hardware, Storage & Peripherals — 0.3% | |
HP, Inc. (fka Hewlett-Packard Co.): | | | | | | | | |
4.65%, 12/09/21 | | | 25 | | | | 26,695 | |
6.00%, 9/15/41 | | | 10 | | | | 9,410 | |
| | | | | | | | |
| | | | | 36,105 | |
Tobacco — 0.6% | | | | | | | | |
Altria Group, Inc.: | | | | | | | | |
4.00%, 1/31/24 | | | 10 | | | | 11,055 | |
4.25%, 8/09/42 | | | 5 | | | | 5,266 | |
5.38%, 1/31/44 | | | 10 | | | | 12,411 | |
Philip Morris International, Inc.: | | | | | | | | |
3.60%, 11/15/23 | | | 15 | | | | 16,290 | |
See Notes to Financial Statements.
| | | | | | |
| | | | | | | |
| | BLACKROCK CORI FUNDS | | APRIL 30, 2016 | | 15 |
| | |
Schedule of Investments (continued) | | BlackRock CoRI 2015 Fund |
| | | | | | | | |
| Corporate Bonds | | Par
(000) | | | Value | |
Tobacco (continued) | | | | | | | | |
Philip Morris International, Inc. (continued): | | | | | | | | |
4.88%, 11/15/43 | | $ | 15 | | | $ | 17,465 | |
4.25%, 11/10/44 | | | 10 | | | | 10,685 | |
| | | | | | | | |
| | | | | 73,172 | |
Wireless Telecommunication Services — 0.6% | | | | | | | | |
America Movil SAB de CV, 6.38%, 3/01/35 | | | 20 | | | | 24,362 | |
Vodafone Group PLC: | | | | | | | | |
2.95%, 2/19/23 | | | 15 | | | | 14,997 | |
6.15%, 2/27/37 | | | 20 | | | | 23,506 | |
4.38%, 2/19/43 | | | 10 | | | | 9,454 | |
| | | | | | | | |
| | | | | 72,319 | |
| Total Corporate Bonds — 40.5% | | | | 4,760,075 | |
| | | | | | | | |
| | | | | | | | | |
| | |
| U.S. Treasury Obligations | | | | | | |
U.S. Treasury Bonds: | | | | | | | | |
7.50%, 11/15/24 | | | 80 | | | | 116,928 | |
5.25%, 11/15/28 | | | 25 | | | | 34,026 | |
6.13%, 8/15/29 | | | 45 | | | | 66,535 | |
4.38%, 2/15/38 | | | 20 | | | | 26,805 | |
4.38%, 11/15/39 | | | 10 | | | | 13,361 | |
4.25%, 11/15/40 | | | 30 | | | | 39,429 | |
3.13%, 2/15/42 | | | 20 | | | | 22,049 | |
2.75%, 11/15/42 | | | 20 | | | | 20,459 | |
3.63%, 8/15/43 | | | 20 | | | | 24,081 | |
3.75%, 11/15/43 | | | 20 | | | | 24,628 | |
3.63%, 2/15/44 | | | 20 | | | | 24,057 | |
3.38%, 5/15/44 | | | 10 | | | | 11,493 | |
3.13%, 8/15/44 | | | 20 | | | | 21,938 | |
3.00%, 11/15/44 | | | 40 | | | | 42,811 | |
U.S. Treasury Notes: | | | | | | | | |
2.63%, 8/15/20 | | | 50 | | | | 52,947 | |
2.13%, 8/31/20 | | | 40 | | | | 41,527 | |
2.63%, 11/15/20 | | | 20 | | | | 21,209 | |
| | | | | | | | |
| U.S. Treasury Obligations | |
| Par
(000) |
| | | Value | |
U.S. Treasury Notes (continued): | | | | | | | | |
2.38%, 12/31/20 | | $ | 30 | | | $ | 31,505 | |
2.13%, 1/31/21 | | | 20 | | | | 20,780 | |
3.63%, 2/15/21 | | | 20 | | | | 22,174 | |
3.13%, 5/15/21 | | | 25 | | | | 27,215 | |
2.00%, 10/31/21 | | | 20 | | | | 20,634 | |
1.50%, 1/31/22 | | | 20 | | | | 20,067 | |
1.75%, 2/28/22 | | | 30 | | | | 30,490 | |
1.75%, 3/31/22 | | | 30 | | | | 30,477 | |
1.75%, 5/15/23 | | | 40 | | | | 40,411 | |
2.75%, 11/15/23 | | | 40 | | | | 43,180 | |
2.75%, 2/15/24 | | | 30 | | | | 32,381 | |
2.50%, 5/15/24 | | | 30 | | | | 31,814 | |
2.38%, 8/15/24 | | | 20 | | | | 21,006 | |
2.25%, 11/15/24 | | | 45 | | | | 46,795 | |
2.00%, 2/15/25 | | | 50 | | | | 50,936 | |
2.13%, 5/15/25 | | | 100 | | | | 102,824 | |
2.00%, 8/15/25 | | | 65 | | | | 66,107 | |
2.25%, 11/15/25 | | | 70 | | | | 72,661 | |
U.S. Treasury Principal STRIPS, 0.00%, 2/15/31 (a) | | | 7,560 | | | | 5,524,062 | |
| Total U.S. Treasury Obligations — 58.3% | | | | 6,839,802 | |
Total Long-Term Investments
(Cost — $10,439,866) — 98.8% | | | | 11,599,877 | |
| | | | | | | | |
| | | | | | | | | |
| | |
| Short-Term Securities — 1.2% | | Shares | | | | |
BlackRock Liquidity Funds, TempFund, Institutional Class, 0.40% (b)(c) | | | 139,087 | | | | 139,087 | |
Total Short-Term Securities
(Cost — $139,087) — 1.2% | | | | 139,087 | |
| Total Investments (Cost — $10,578,953) — 100.0% | | | | 11,738,964 | |
| Other Assets Less Liabilities — 0.0% | | | | 1,255 | |
| | | | | |
Net Assets — 100.0% | | | $ | 11,740,219 | |
| | | | | | | | |
|
| Notes to Schedule of Investments |
| (b) | | During the period ended April 30, 2016, investments in issuers considered to be affiliates of the Fund for purposes of Section 2(a)(3) of the Investment Company Act of 1940, as amended, were as follows: |
| | | | | | | | | | | | | | | | | | |
| Affiliate | | Shares Held
at October 31,
2015 | | | Net
Activity | | | Shares Held
at April 30,
2016 | | | Income | | | |
BlackRock Liquidity Funds, TempFund, Institutional Class | | | 157,525 | | | | (18,438 | ) | | | 139,087 | | | $ | 245 | | | |
| (c) | | Current yield as of period end. |
|
| Derivative Financial Instruments Outstanding as of Period End |
Futures Contracts
| | | | | | | | | | | | | | |
Contracts
Long | | | Issue | | Expiration | | Notional
Value | | Unrealized
Depreciation | | | |
| | 1 | | | U.S. Treasury Long Bond | | June 2016 | | $163,313 | | $ | (1,977 | ) | | |
See Notes to Financial Statements.
| | | | | | |
| | | | | | | |
| 16 | | BLACKROCK CORI FUNDS | | APRIL 30, 2016 | | |
| | |
Schedule of Investments (concluded) | | BlackRock CoRI 2015 Fund |
|
| Derivative Financial Instruments Categorized by Risk Exposure |
As of period end, the fair values of derivative financial instruments located in the Statements of Assets and Liabilities were as follows:
| | | | | | | | | | | | | | | | | | | | | | | | | | | | | | | | |
| Liabilities — Derivative Financial Instruments | | | Commodity
Contracts | | | Credit
Contracts | | | Equity
Contracts | | | Foreign
Currency
Exchange
Contracts | | | Interest
Rate
Contracts | | | Other
Contracts | | | Total | |
Futures contracts | | | Net unrealized depreciation | 1 | | | — | | | | — | | | | — | | | | — | | | $ | 1,977 | | | | — | | | $ | 1,977 | |
1 Includes cumulative appreciation (depreciation) on futures contracts, if any, as reported in the Schedule of Investments. Only current day’s variation margin is reported within the Statements of Assets and Liabilities. | |
For the period ended April 30, 2016, the effect of derivative financial instruments in the Statements of Operations was as follows:
| | | | | | | | | | | | | | | | | | | | | | | | | | | | |
| Net Realized Gain (Loss) from: | | Commodity
Contracts | | | Credit
Contracts | | | Equity
Contracts | | | Foreign
Currency
Exchange
Contracts | | | Interest
Rate
Contracts | | | Other
Contracts | | | Total | |
Futures contracts | | | — | | | | — | | | | — | | | | — | | | $ | 11,410 | | | | — | | | $ | 11,410 | |
| | | | | | | | | | | | | | | | | | | | | | | | | | | | | |
| Net Change in Unrealized Appreciation (Depreciation) on: | | | | | | | | | | | | | | | | | | | | | |
Futures contracts | | | — | | | | — | | | | — | | | | — | | | $ | (1,851 | ) | | | — | | | $ | (1,851 | ) |
|
| Average Quarterly Balances of Outstanding Derivative Financial Instruments |
| | | | |
| Futures contracts: | | | | |
Average notional value of contracts — long | | $ | 162,172 | |
For more information about the Fund’s investment risks regarding derivative financial instruments, refer to the Notes to Financial Statements.
|
| Fair Value Hierarchy as of Period End |
Various inputs are used in determining the fair value of investments and derivative financial instruments. For information about the Fund’s policy regarding valuation of investments and derivative financial instruments, refer to the Notes to Financial Statements.
The following tables summarize the Fund’s investments and derivative financial instruments categorized in the disclosure hierarchy:
| | | | | | | | | | | | | | | | |
| | | Level 1 | | | Level 2 | | | Level 3 | | | Total | |
Assets: | | | | | | | | | | | | | | | | |
| Investments: | | | | | | | | | | | | | | | | |
Long-Term Investments1 | | | — | | | $ | 11,599,877 | | | | — | | | $ | 11,599,877 | |
Short-Term Securities | | $ | 139,087 | | | | — | | | | — | | | | 139,087 | |
| | | | | | | | | | | | | | | | |
Total | | $ | 139,087 | | | $ | 11,599,877 | | | | — | | | $ | 11,738,964 | |
| | | | |
| | | | | | | | | | | | | | | | |
| Derivative Financial Instruments2 | | | | | | | | | | | | | | | | |
Liabilities: | | | | | | | | | | | | | | | | |
Interest rate contracts | | $ | (1,977 | ) | | | — | | | | — | | | $ | (1,977 | ) |
1 See above Schedule of Investments for values in each industry. | |
2 Derivative financial instruments are futures contracts. Futures contracts are valued at the unrealized appreciation (depreciation) on the instrument. | |
The Fund may hold assets and/or liabilities in which the fair value approximates the carrying amount for financial statement purposes. As of period end, cash pledged for futures contracts of $4,400 is categorized as Level 1 within the disclosure hierarchy.
During the six months ended April 30, 2016, there were no transfers between levels.
See Notes to Financial Statements.
| | | | | | |
| | | | | | | |
| | BLACKROCK CORI FUNDS | | APRIL 30, 2016 | | 17 |
| | |
Schedule of Investments April 30, 2016 (Unaudited) | | BlackRock CoRI 2017 Fund (Percentages shown are based on Net Assets) |
| | | | | | | | |
| Corporate Bonds | | Par
(000) | | | Value | |
Aerospace & Defense — 0.6% | |
Lockheed Martin Corp., 4.07%, 12/15/42 | | $ | 15 | | | $ | 15,641 | |
Northrop Grumman Corp., 3.25%, 8/01/23 | | | 10 | | | | 10,535 | |
United Technologies Corp.: | | | | | | | | |
3.10%, 6/01/22 | | | 10 | | | | 10,581 | |
4.50%, 6/01/42 | | | 35 | | | | 38,982 | |
| | | | | | | | |
| | | | | 75,739 | |
Air Freight & Logistics — 0.4% | |
FedEx Corp.: | | | | | | | | |
4.90%, 1/15/34 | | | 15 | | | | 16,547 | |
5.10%, 1/15/44 | | | 10 | | | | 11,443 | |
4.10%, 2/01/45 | | | 10 | | | | 9,989 | |
United Parcel Service, Inc., 6.20%, 1/15/38 | | | 5 | | | | 6,884 | |
| | | | | | | | |
| | | | | 44,863 | |
Automobiles — 0.4% | |
Daimler Finance North America LLC, 8.50%, 1/18/31 | | | 10 | | | | 15,823 | |
Ford Motor Co., 4.75%, 1/15/43 | | | 35 | | | | 36,386 | |
| | | | | | | | |
| | | | | 52,209 | |
Banks — 3.0% | |
BNP Paribas SA, 3.25%, 3/03/23 | | | 5 | | | | 5,187 | |
Fifth Third Bancorp, 8.25%, 3/01/38 | | | 10 | | | | 14,366 | |
HSBC Holdings PLC, 6.10%, 1/14/42 | | | 60 | | | | 76,199 | |
Sumitomo Mitsui Financial Group, Inc., 3.78%, 3/09/26 | | | 25 | | | | 26,127 | |
Wells Fargo & Co.: | | | | | | | | |
3.00%, 1/22/21 | | | 25 | | | | 25,948 | |
3.45%, 2/13/23 | | | 75 | | | | 76,825 | |
3.30%, 9/09/24 | | | 30 | | | | 30,918 | |
5.38%, 11/02/43 | | | 10 | | | | 11,392 | |
5.61%, 1/15/44 | | | 25 | | | | 29,286 | |
4.65%, 11/04/44 | | | 15 | | | | 15,549 | |
4.90%, 11/17/45 | | | 35 | | | | 37,844 | |
| | | | | | | | |
| | | | | 349,641 | |
Beverages — 0.8% | |
Anheuser-Busch InBev Finance, Inc., 4.63%, 2/01/44 | | | 11 | | | | 12,133 | |
Anheuser-Busch InBev Worldwide, Inc., 2.50%, 7/15/22 | | | 39 | | | | 39,293 | |
Molson Coors Brewing Co., 5.00%, 5/01/42 | | | 10 | | | | 10,851 | |
PepsiCo, Inc.: | | | | | | | | |
2.75%, 3/01/23 | | | 15 | | | | 15,660 | |
4.00%, 3/05/42 | | | 15 | | | | 15,571 | |
| | | | | | | | |
| | | | | 93,508 | |
Biotechnology — 0.6% | |
Amgen, Inc., 6.40%, 2/01/39 | | | 20 | | | | 25,827 | |
Biogen, Inc., 3.63%, 9/15/22 | | | 20 | | | | 21,340 | |
Celgene Corp., 3.55%, 8/15/22 | | | 25 | | | | 26,168 | |
| | | | | | | | |
| | | | | 73,335 | |
Capital Markets — 3.5% | |
Ameriprise Financial, Inc., 3.70%, 10/15/24 | | | 20 | | | | 20,876 | |
Credit Suisse USA, Inc., 7.13%, 7/15/32 | | | 15 | | | | 19,360 | |
Goldman Sachs Group, Inc.: | | | | | | | | |
3.63%, 1/22/23 | | | 10 | | | | 10,363 | |
6.13%, 2/15/33 | | | 45 | | | | 55,101 | |
6.75%, 10/01/37 | | | 50 | | | | 60,614 | |
| | | | | | | | |
| Corporate Bonds | | Par
(000) | | | Value | |
Capital Markets (continued) | |
Goldman Sachs Group, Inc. (continued): | | | | | | | | |
6.25%, 2/01/41 | | $ | 5 | | | $ | 6,367 | |
5.15%, 5/22/45 | | | 5 | | | | 5,141 | |
Morgan Stanley: | | | | | | | | |
3.75%, 2/25/23 | | | 25 | | | | 26,057 | |
3.70%, 10/23/24 | | | 70 | | | | 72,206 | |
5.00%, 11/24/25 | | | 25 | | | | 27,211 | |
4.35%, 9/08/26 | | | 10 | | | | 10,333 | |
3.95%, 4/23/27 | | | 40 | | | | 39,942 | |
6.38%, 7/24/42 | | | 10 | | | | 13,214 | |
4.30%, 1/27/45 | | | 15 | | | | 15,233 | |
State Street Corp.: | | | | | | | | |
3.70%, 11/20/23 | | | 10 | | | | 10,884 | |
3.55%, 8/18/25 | | | 10 | | | | 10,748 | |
| | | | | | | | |
| | | | | 403,650 | |
Chemicals — 0.6% | |
CF Industries, Inc.: | | | | | | | | |
5.15%, 3/15/34 | | | 5 | | | | 4,938 | |
5.38%, 3/15/44 | | | 10 | | | | 9,847 | |
Dow Chemical Co., 7.38%, 11/01/29 | | | 10 | | | | 13,067 | |
E.I. du Pont de Nemours & Co., 2.80%, 2/15/23 | | | 25 | | | | 25,303 | |
LYB International Finance BV, 4.88%, 3/15/44 | | | 5 | | | | 5,222 | |
Potash Corp. of Saskatchewan, Inc., 5.88%, 12/01/36 | | | 10 | | | | 12,063 | |
| | | | | | | | |
| | | | | 70,440 | |
Communications Equipment — 0.5% | |
Cisco Systems, Inc., 5.90%, 2/15/39 | | | 35 | | | | 46,294 | |
Motorola Solutions, Inc., 4.00%, 9/01/24 | | | 10 | | | | 9,725 | |
| | | | | | | | |
| | | | | 56,019 | |
Consumer Finance — 0.8% | | | | | | | | |
American Express Co., 4.05%, 12/03/42 | | | 20 | | | | 20,296 | |
Capital One Financial Corp., 3.50%, 6/15/23 | | | 25 | | | | 25,347 | |
John Deere Capital Corp., 2.80%, 1/27/23 | | | 15 | | | | 15,259 | |
MasterCard, Inc., 3.38%, 4/01/24 | | | 25 | | | | 26,797 | |
| | | | | | | | |
| | | | | 87,699 | |
Diversified Financial Services — 6.4% | |
Bank of America Corp.: | | | | | | | | |
3.30%, 1/11/23 | | | 45 | | | | 45,733 | |
4.13%, 1/22/24 | | | 25 | | | | 26,505 | |
4.00%, 4/01/24 | | | 25 | | | | 26,262 | |
4.00%, 1/22/25 | | | 40 | | | | 40,060 | |
4.25%, 10/22/26 | | | 50 | | | | 51,103 | |
5.88%, 2/07/42 | | | 20 | | | | 24,757 | |
5.00%, 1/21/44 | | | 10 | | | | 11,146 | |
4.88%, 4/01/44 | | | 5 | | | | 5,501 | |
Series L, 4.75%, 4/21/45 | | | 5 | | | | 5,003 | |
Citigroup, Inc.: | | | | | | | | |
3.88%, 10/25/23 | | | 25 | | | | 26,436 | |
5.50%, 9/13/25 | | | 25 | | | | 27,696 | |
4.30%, 11/20/26 | | | 5 | | | | 5,118 | |
8.13%, 7/15/39 | | | 30 | | | | 45,995 | |
6.68%, 9/13/43 | | | 25 | | | | 30,962 | |
4.65%, 7/30/45 | | | 15 | | | | 16,041 | |
Deutsche Bank AG, 4.10%, 1/13/26 | | | 25 | | | | 25,113 | |
General Electric Capital Corp., 3.10%, 1/09/23 | | | 25 | | | | 26,544 | |
See Notes to Financial Statements.
| | | | | | |
| | | | | | | |
| 18 | | BLACKROCK CORI FUNDS | | APRIL 30, 2016 | | |
| | |
Schedule of Investments (continued) | | BlackRock CoRI 2017 Fund |
| | | | | | | | |
| Corporate Bonds | | Par
(000) | | | Value | |
Diversified Financial Services (continued) | |
General Electric Co.: | | | | | | | | |
6.75%, 3/15/32 | | $ | 35 | | | $ | 48,377 | |
5.88%, 1/14/38 | | | 25 | | | | 32,960 | |
JPMorgan Chase & Co.: | | | | | | | | |
3.38%, 5/01/23 | | | 50 | | | | 50,560 | |
3.88%, 9/10/24 | | | 80 | | | | 82,662 | |
6.40%, 5/15/38 | | | 25 | | | | 33,788 | |
5.60%, 7/15/41 | | | 10 | | | | 12,406 | |
5.63%, 8/16/43 | | | 30 | | | | 35,247 | |
Northern Trust Corp., 3.95%, 10/30/25 | | | 10 | | | | 10,917 | |
| | | | | | | | |
| | | | | 746,892 | |
Diversified Telecommunication Services — 3.5% | |
AT&T, Inc.: | | | | | | | | |
6.30%, 1/15/38 | | | 25 | | | | 29,819 | |
6.55%, 2/15/39 | | | 5 | | | | 6,070 | |
5.35%, 9/01/40 | | | 25 | | | | 26,925 | |
6.38%, 3/01/41 | | | 10 | | | | 11,934 | |
5.55%, 8/15/41 | | | 15 | | | | 16,627 | |
5.15%, 3/15/42 | | | 5 | | | | 5,251 | |
Orange SA, 5.38%, 1/13/42 | | | 5 | | | | 6,069 | |
Telefonica Emisiones SAU, 7.05%, 6/20/36 | | | 10 | | | | 12,943 | |
Verizon Communications, Inc.: | | | | | | | | |
5.15%, 9/15/23 | | | 50 | | | | 57,505 | |
6.40%, 9/15/33 | | | 35 | | | | 43,904 | |
4.27%, 1/15/36 | | | 25 | | | | 25,139 | |
6.55%, 9/15/43 | | | 35 | | | | 46,166 | |
4.86%, 8/21/46 | | | 35 | | | | 37,510 | |
4.52%, 9/15/48 | | | 30 | | | | 30,444 | |
5.01%, 8/21/54 | | | 25 | | | | 25,676 | |
4.67%, 3/15/55 | | | 25 | | | | 24,177 | |
| | | | | | | | |
| | | | | 406,159 | |
Electric Utilities — 1.9% | |
Berkshire Hathaway Energy Co., 6.13%, 4/01/36 | | | 20 | | | | 25,926 | |
Consolidated Edison Co. of New York, Inc., Series C, 5.50%, 12/01/39 | | | 10 | | | | 12,092 | |
Duke Energy Florida LLC, 6.40%, 6/15/38 | | | 25 | | | | 34,924 | |
Exelon Generation Co. LLC, 6.25%, 10/01/39 | | | 10 | | | | 10,887 | |
Georgia Power Co., 4.30%, 3/15/42 | | | 25 | | | | 26,933 | |
Pacific Gas & Electric Co.: | | | | | | | | |
6.05%, 3/01/34 | | | 25 | | | | 33,197 | |
5.40%, 1/15/40 | | | 20 | | | | 24,706 | |
PacifiCorp, 6.00%, 1/15/39 | | | 15 | | | | 19,498 | |
Southern California Edison Co., Series A, 5.95%, 2/01/38 | | | 10 | | | | 13,098 | |
Southern Power Co., 5.15%, 9/15/41 | | | 5 | | | | 5,220 | |
Virginia Electric & Power Co., 8.88%, 11/15/38 | | | 10 | | | | 16,213 | |
| | | | | | | | |
| | | | | 222,694 | |
Energy Equipment & Services — 0.4% | | | | | | | | |
Baker Hughes, Inc., 5.13%, 9/15/40 | | | 5 | | | | 5,151 | |
Enterprise Products Operating LLC: | | | | | | | | |
5.95%, 2/01/41 | | | 10 | | | | 11,070 | |
5.70%, 2/15/42 | | | 15 | | | | 16,386 | |
Halliburton Co., 7.45%, 9/15/39 | | | 15 | | | | 19,693 | |
| | | | | | | | |
| | | | | 52,300 | |
| | | | | | | | |
| Corporate Bonds | | Par
(000) | | | Value | |
Food & Staples Retailing — 0.1% | | | | | | | | |
Walgreen Co., 3.10%, 9/15/22 | | $ | 15 | | | $ | 15,304 | |
Food Products — 0.6% | | | | | | | | |
Archer-Daniels-Midland Co., 4.54%, 3/26/42 | | | 10 | | | | 10,949 | |
Kellogg Co., 4.50%, 4/01/46 | | | 15 | | | | 15,830 | |
Kraft Heinz Foods Co. (fka Kraft Foods Group Inc.): | | | | | | | | |
3.50%, 6/06/22 | | | 25 | | | | 26,527 | |
5.00%, 6/04/42 | | | 15 | | | | 16,723 | |
| | | | | | | | |
| | | | | 70,029 | |
Health Care Equipment & Supplies — 0.5% | |
Express Scripts Holding Co., 6.13%, 11/15/41 | | | 5 | | | | 5,622 | |
Medtronic, Inc.: | | | | | | | | |
4.63%, 3/15/44 | | | 7 | | | | 7,962 | |
4.63%, 3/15/45 | | | 40 | | | | 45,631 | |
| | | | | | | | |
| | | | | 59,215 | |
Health Care Providers & Services — 0.8% | |
Aetna, Inc., 6.63%, 6/15/36 | | | 5 | | | | 6,337 | |
Anthem, Inc., 5.10%, 1/15/44 | | | 20 | | | | 21,998 | |
Cardinal Health, Inc., 3.20%, 3/15/23 | | | 10 | | | | 10,344 | |
UnitedHealth Group, Inc.: | | | | | | | | |
6.88%, 2/15/38 | | | 15 | | | | 21,276 | |
4.75%, 7/15/45 | | | 25 | | | | 28,886 | |
| | | | | | | | |
| | | | | 88,841 | |
Hotels, Restaurants & Leisure — 0.1% | |
McDonald’s Corp., 6.30%, 10/15/37 | | | 10 | | | | 12,939 | |
Household Products — 0.2% | |
Kimberly-Clark Corp., 6.63%, 8/01/37 | | | 5 | | | | 7,139 | |
Koninklijke Philips NV, 6.88%, 3/11/38 | | | 15 | | | | 18,988 | |
| | | | | | | | |
| | | | | 26,127 | |
Industrial Conglomerates — 0.5% | |
General Electric Co.: | | | | | | | | |
2.70%, 10/09/22 | | | 15 | | | | 15,492 | |
4.50%, 3/11/44 | | | 35 | | | | 39,330 | |
| | | | | | | | |
| | | | | 54,822 | |
Insurance — 1.5% | |
Aflac, Inc., 3.63%, 6/15/23 | | | 10 | | | | 10,582 | |
Allstate Corp., 3.15%, 6/15/23 | | | 15 | | | | 15,563 | |
American International Group, Inc., 4.13%, 2/15/24 | | | 50 | | | | 52,349 | |
Arch Capital Group US, Inc., 5.14%, 11/01/43 | | | 10 | | | | 10,419 | |
AXA SA, 8.60%, 12/15/30 | | | 10 | | | | 13,403 | |
MetLife, Inc., 4.88%, 11/13/43 | | | 35 | | | | 37,995 | |
Prudential Financial, Inc., 6.63%, 12/01/37 | | | 15 | | | | 18,823 | |
Travelers Cos., Inc., 4.60%, 8/01/43 | | | 10 | | | | 11,338 | |
| | | | | | | | |
| | | | | 170,472 | |
Machinery — 0.1% | |
Caterpillar, Inc., 3.80%, 8/15/42 | | | 15 | | | | 14,844 | |
Media — 3.3% | |
21st Century Fox America, Inc.: | | | | | | | | |
6.40%, 12/15/35 | | | 45 | | | | 56,723 | |
5.40%, 10/01/43 | | | 10 | | | | 11,543 | |
Comcast Corp.: | | | | | | | | |
3.13%, 7/15/22 | | | 25 | | | | 26,499 | |
4.25%, 1/15/33 | | | 15 | | | | 16,213 | |
6.45%, 3/15/37 | | | 25 | | | | 33,659 | |
6.40%, 3/01/40 | | | 20 | | | | 27,568 | |
4.65%, 7/15/42 | | | 10 | | | | 11,285 | |
Discovery Communications LLC, 6.35%, 6/01/40 | | | 20 | | | | 20,807 | |
See Notes to Financial Statements.
| | | | | | |
| | | | | | | |
| | BLACKROCK CORI FUNDS | | APRIL 30, 2016 | | 19 |
| | |
Schedule of Investments (continued) | | BlackRock CoRI 2017 Fund |
| | | | | | | | |
| Corporate Bonds | | Par
(000) | | | Value | |
Media (continued) | |
NBCUniversal Media LLC: | | | | | | | | |
6.40%, 4/30/40 | | $ | 20 | | | $ | 27,517 | |
5.95%, 4/01/41 | | | 10 | | | | 13,065 | |
Thomson Reuters Corp., 5.85%, 4/15/40 | | | 3 | | | | 3,329 | |
Time Warner Cable, Inc.: | | | | | | | | |
6.55%, 5/01/37 | | | 15 | | | | 17,262 | |
7.30%, 7/01/38 | | | 5 | | | | 6,147 | |
6.75%, 6/15/39 | | | 10 | | | | 11,839 | |
Time Warner, Inc.: | | | | | | | | |
4.05%, 12/15/23 | | | 25 | | | | 27,008 | |
7.63%, 4/15/31 | | | 5 | | | | 6,578 | |
6.10%, 7/15/40 | | | 15 | | | | 18,148 | |
5.35%, 12/15/43 | | | 20 | | | | 22,402 | |
Viacom, Inc., 4.38%, 3/15/43 | | | 15 | | | | 11,883 | |
Walt Disney Co., 2.35%, 12/01/22 | | | 10 | | | | 10,234 | |
| | | | | | | | |
| | | | | 379,709 | |
Metals & Mining — 0.8% | |
BHP Billiton Finance USA Ltd.: | | | | | | | | |
3.85%, 9/30/23 | | | 10 | | | | 10,661 | |
5.00%, 9/30/43 | | | 25 | | | | 27,922 | |
Newmont Mining Corp., 6.25%, 10/01/39 | | | 10 | | | | 10,452 | |
Rio Tinto Finance USA Ltd., 5.20%, 11/02/40 | | | 10 | | | | 10,914 | |
Southern Copper Corp.: | | | | | | | | |
5.25%, 11/08/42 | | | 15 | | | | 12,922 | |
5.88%, 4/23/45 | | | 25 | | | | 22,919 | |
| | | | | | | | |
| | | | | 95,790 | |
Multiline Retail — 0.2% | |
Target Corp., 4.00%, 7/01/42 | | | 20 | | | | 21,168 | |
Oil, Gas & Consumable Fuels — 2.0% | |
Anadarko Petroleum Corp., 6.45%, 9/15/36 | | | 20 | | | | 21,577 | |
BP Capital Markets PLC: | | | | | | | | |
3.25%, 5/06/22 | | | 10 | | | | 10,303 | |
2.75%, 5/10/23 | | | 25 | | | | 24,975 | |
ConocoPhillips, 6.50%, 2/01/39 | | | 30 | | | | 37,223 | |
ConocoPhillips Holding Co., 6.95%, 4/15/29 | | | 20 | | | | 24,069 | |
Devon Financing Co. LLC, 7.88%, 9/30/31 | | | 15 | | | | 16,059 | |
Phillips 66, 5.88%, 5/01/42 | | | 10 | | | | 11,663 | |
Suncor Energy, Inc., 6.50%, 6/15/38 | | | 30 | | | | 35,323 | |
TransCanada PipeLines Ltd.: | | | | | | | | |
6.20%, 10/15/37 | | | 5 | | | | 5,688 | |
7.63%, 1/15/39 | | | 15 | | | | 19,361 | |
6.10%, 6/01/40 | | | 10 | | | | 11,675 | |
Valero Energy Corp., 6.63%, 6/15/37 | | | 15 | | | | 16,857 | |
| | | | | | | | |
| | | | | 234,773 | |
Pharmaceuticals — 2.1% | |
Abbott Laboratories, 5.30%, 5/27/40 | | | 10 | | | | 11,426 | |
AbbVie, Inc., 2.90%, 11/06/22 | | | 25 | | | | 25,542 | |
AstraZeneca PLC: | | | | | | | | |
3.38%, 11/16/25 | | | 15 | | | | 15,630 | |
6.45%, 9/15/37 | | | 15 | | | | 20,083 | |
4.38%, 11/16/45 | | | 10 | | | | 10,827 | |
Bristol-Myers Squibb Co., 3.25%, 11/01/23 | | | 25 | | | | 26,924 | |
GlaxoSmithKline Capital, Inc., 6.38%, 5/15/38 | | | 15 | | | | 20,699 | |
Merck & Co., Inc., 2.80%, 5/18/23 | | | 25 | | | | 26,199 | |
Pfizer, Inc., 7.20%, 3/15/39 | | | 40 | | | | 59,019 | |
Teva Pharmaceutical Finance Co. BV, 2.95%, 12/18/22 | | | 25 | | | | 25,113 | |
| | | | | | | | |
| | | | | 241,462 | |
| | | | | | | | |
| Corporate Bonds | | Par
(000) | | | Value | |
Road & Rail — 0.2% | |
Norfolk Southern Corp., 4.84%, 10/01/41 | | $ | 20 | | | $ | 22,292 | |
Semiconductors & Semiconductor Equipment — 0.2% | |
Applied Materials, Inc., 5.85%, 6/15/41 | | | 5 | | | | 6,027 | |
Intel Corp., 4.80%, 10/01/41 | | | 15 | | | | 16,987 | |
| | | | | | | | |
| | | | | 23,014 | |
Software — 0.7% | |
Oracle Corp.: | | | | | | | | |
2.50%, 10/15/22 | | | 25 | | | | 25,513 | |
6.13%, 7/08/39 | | | 20 | | | | 26,400 | |
5.38%, 7/15/40 | | | 20 | | | | 24,289 | |
| | | | | | | | |
| | | | | 76,202 | |
Specialty Retail — 0.2% | |
Home Depot, Inc., 5.88%, 12/16/36 | | | 15 | | | | 19,717 | |
Lowe’s Cos., Inc., 6.65%, 9/15/37 | | | 5 | | | | 6,895 | |
| | | | | | | | |
| | | | | 26,612 | |
Technology Hardware, Storage & Peripherals — 0.1% | |
HP, Inc. (fka Hewlett-Packard Co.), 6.00%, 9/15/41 | | | 10 | | | | 9,410 | |
Tobacco — 0.7% | |
Altria Group, Inc.: | | | | | | | | |
4.00%, 1/31/24 | | | 15 | | | | 16,582 | |
5.38%, 1/31/44 | | | 20 | | | | 24,821 | |
Philip Morris International, Inc.: | | | | | | | | |
3.60%, 11/15/23 | | | 10 | | | | 10,860 | |
4.88%, 11/15/43 | | | 25 | | | | 29,109 | |
| | | | | | | | |
| | | | | 81,372 | |
Wireless Telecommunication Services — 0.6% | |
America Movil SAB de CV, 6.38%, 3/01/35 | | | 25 | | | | 30,453 | |
Vodafone Group PLC: | | | | | | | | |
2.95%, 2/19/23 | | | 10 | | | | 9,998 | |
6.15%, 2/27/37 | | | 25 | | | | 29,383 | |
4.38%, 2/19/43 | | | 5 | | | | 4,727 | |
| | | | | | | | |
| | | | | 74,561 | |
| Total Corporate Bonds — 38.9% | | | | 4,534,106 | |
| | | | | | | | |
| | | | | | | | | |
| | |
| U.S. Treasury Obligations | | | | | | |
U.S. Treasury Bonds: | | | | | | | | |
7.25%, 8/15/22 | | | 110 | | | | 148,195 | |
7.13%, 2/15/23 | | | 55 | | | | 74,783 | |
7.50%, 11/15/24 | | | 130 | | | | 190,008 | |
7.63%, 2/15/25 | | | 90 | | | | 133,428 | |
6.00%, 2/15/26 | | | 125 | | | | 172,427 | |
6.38%, 8/15/27 | | | 150 | | | | 218,109 | |
4.38%, 2/15/38 | | | 10 | | | | 13,402 | |
4.50%, 5/15/38 | | | 10 | | | | 13,627 | |
4.38%, 11/15/39 | | | 10 | | | | 13,361 | |
4.38%, 5/15/41 | | | 50 | | | | 66,980 | |
3.13%, 2/15/42 | | | 80 | | | | 88,197 | |
2.75%, 11/15/42 | | | 310 | | | | 317,108 | |
3.13%, 2/15/43 | | | 50 | | | | 54,943 | |
2.88%, 5/15/43 | | | 80 | | | | 83,675 | |
3.63%, 8/15/43 | | | 270 | | | | 325,097 | |
3.75%, 11/15/43 | | | 150 | | | | 184,711 | |
3.63%, 2/15/44 | | | 50 | | | | 60,143 | |
See Notes to Financial Statements.
| | | | | | |
| | | | | | | |
| 20 | | BLACKROCK CORI FUNDS | | APRIL 30, 2016 | | |
| | |
Schedule of Investments (continued) | | BlackRock CoRI 2017 Fund |
| | | | | | | | |
| U.S. Treasury Obligations | | Par
(000) | | | Value | |
U.S. Treasury Bonds (continued): | | | | | | | | |
3.38%, 5/15/44 | | $ | 75 | | | $ | 86,200 | |
3.13%, 8/15/44 | | | 60 | | | | 65,815 | |
3.00%, 11/15/44 | | | 30 | | | | 32,108 | |
2.50%, 2/15/45 | | | 40 | | | | 38,644 | |
2.88%, 8/15/45 | | | 80 | | | | 83,472 | |
U.S. Treasury Notes: | | | | | | | | |
1.63%, 8/15/22 | | | 60 | | | | 60,427 | |
1.63%, 11/15/22 | | | 60 | | | | 60,286 | |
2.00%, 2/15/23 | | | 50 | | | | 51,371 | |
1.75%, 5/15/23 | | | 170 | | | | 171,746 | |
2.50%, 8/15/23 | | | 130 | | | | 137,988 | |
2.75%, 11/15/23 | | | 230 | | | | 248,283 | |
2.75%, 2/15/24 | | | 180 | | | | 194,287 | |
2.50%, 5/15/24 | | | 70 | | | | 74,233 | |
2.38%, 8/15/24 | | | 160 | | | | 168,050 | |
2.00%, 2/15/25 | | | 125 | | | | 127,339 | |
2.13%, 5/15/25 | | | 90 | | | | 92,542 | |
2.00%, 8/15/25 | | | 180 | | | | 183,066 | |
| | | | | | | | |
| U.S. Treasury Obligations | | Par
(000) | | | Value | |
U.S. Treasury Notes (continued): | | | | | | | | |
2.25%, 11/15/25 | | $ | 145 | | | $ | 150,511 | |
U.S. Treasury Principal STRIPS, 0.00%, 2/15/36 (a) | | | 4,298 | | | | 2,725,998 | |
| Total U.S. Treasury Obligations — 59.2% | | | | 6,910,560 | |
Total Long-Term Investments
(Cost — $10,295,410) — 98.1% | | | | 11,444,666 | |
| | | | | | | | |
| | | | | | | | | |
| | |
| Short-Term Securities — 1.5% | | Shares | | | | |
BlackRock Liquidity Funds, TempFund, Institutional Class, 0.40% (b)(c) | | | 177,716 | | | | 177,716 | |
Total Short-Term Securities
(Cost — $177,716) — 1.5% | | | | 177,716 | |
| Total Investments (Cost — $10,473,126) — 99.6% | | | | 11,622,382 | |
| Other Assets Less Liabilities — 0.4% | | | | 47,377 | |
| | | | | | | | |
| Net Assets — 100.0% | | | $ | 11,669,759 | |
| | | | | | | | |
|
| Notes to Schedule of Investments |
| (b) | | During the period ended April 30, 2016, investments in issuers considered to be affiliates of the Fund for purposes of Section 2(a)(3) of the Investment Company Act of 1940, as amended, were as follows: |
| | | | | | | | | | | | | | | | |
| Affiliate | | Shares Held
at October 31,
2015 | | | Net
Activity | | | Shares Held
at April 30,
2016 | | | Income | |
BlackRock Liquidity Funds, TempFund, Institutional Class | | | 154,645 | | | | 23,071 | | | | 177,716 | | | $ | 342 | |
| (c) | | Current yield as of period end. |
| | |
| Derivative Financial Instruments Outstanding as of Period End |
Futures Contracts
| | | | | | | | | | | | |
Contracts
Long | | | Issue | | Expiration | | Notional
Value | | Unrealized
Depreciation | |
| | 1 | | | U.S. Treasury Long Bond | | June 2016 | | $163,313 | | $ | (1,977 | ) |
|
| Derivative Financial Instruments Categorized by Risk Exposure |
As of period end, the fair values of derivative financial instruments located in the Statements of Assets and Liabilities were as follows:
| | | | | | | | | | | | | | | | | | | | | | | | | | | | | | | | |
| Liabilities — Derivative Financial Instruments | | | Commodity
Contracts | | | Credit
Contracts | | | Equity
Contracts | | | Foreign
Currency
Exchange
Contracts | | | Interest
Rate
Contracts | | | Other
Contracts | | | Total | |
Futures contracts | | | Net unrealized depreciation | 1 | | | — | | | | — | | | | — | | | | — | | | $ | 1,977 | | | | — | | | $ | 1,977 | |
1 Includes cumulative appreciation (depreciation) on futures contracts, if any, as reported in the Schedule of Investments. Only current day’s variation margin is reported within the Statements of Assets and Liabilities. | |
See Notes to Financial Statements.
| | | | | | |
| | | | | | | |
| | BLACKROCK CORI FUNDS | | APRIL 30, 2016 | | 21 |
| | |
Schedule of Investments (concluded) | | BlackRock CoRI 2017 Fund |
For the period ended April 30, 2016, the effect of derivative financial instruments in the Statements of Operations was as follows:
| | | | | | | | | | | | | | | | | | | | | | | | | | | | |
| Net Realized Gain (Loss) from: | | Commodity Contracts | | | Credit Contracts | | | Equity Contracts | | | Foreign Currency Exchange Contracts | | | Interest Rate Contracts | | | Other
Contracts | | | Total | |
Futures contracts | | | — | | | | — | | | | — | | | | — | | | $ | 11,410 | | | | — | | | $ | 11,410 | |
| | | | | | | |
| Net Change in Unrealized Appreciation (Depreciation) on: | | | | | | | | | | | | | | | | | | | | | |
Futures contracts | | | — | | | | — | | | | — | | | | — | | | $ | (1,851 | ) | | | — | | | $ | (1,851 | ) |
| | |
| Average Quarterly Balances of Outstanding Derivative Financial Instruments |
| | | | |
| Futures contracts: | | | | |
Average notional value of contracts — long | | $ | 162,172 | |
For more information about the Fund’s investment risks regarding derivative financial instruments, refer to the Notes to Financial Statements.
|
| Fair Value Hierarchy as of Period End |
Various inputs are used in determining the fair value of investments and derivative financial instruments. For information about the Fund’s policy regarding valuation of investments and derivative financial instruments, refer to the Notes to Financial Statements.
The following tables summarize the Fund’s investments and derivative financial instruments categorized in the disclosure hierarchy:
| | | | | | | | | | | | | | |
| | | Level 1 | | | Level 2 | | | Level 3 | | Total | |
Assets: | | | | | | | | | | | | | | |
| Investments: | | | | | | | | | | | | | | |
Long-Term Investments1 | | | — | | | $ | 11,444,666 | | | — | | $ | 11,444,666 | |
Short-Term Securities | | $ | 177,716 | | | | — | | | — | | | 177,716 | |
| | | | |
Total | | $ | 177,716 | | | $ | 11,444,666 | | | — | | $ | 11,622,382 | |
| | | | | | | | | | | | | | |
| | | | | | | | | | | | | | |
| Derivative Financial Instruments 2 | | | | | | | | | | | | | | |
Liabilities: | | | | | | | | | | | | | | |
Interest rate contracts | | $ | (1,977 | ) | | | — | | | — | | $ | (1,977 | ) |
1 See above Schedule of Investments for values in each industry. | |
2 Derivative financial instruments are futures contracts. Futures contracts are valued at the unrealized appreciation (depreciation) on the instrument. | |
The Fund may hold assets and/or liabilities in which the fair value approximates the carrying amount for financial statement purposes. As of period end, cash pledged for futures contracts of $4,400 is categorized as Level 1 within the disclosure hierarchy.
During the six months ended April 30, 2016, there were no transfers between levels.
See Notes to Financial Statements.
| | | | | | |
| | | | | | | |
| 22 | | BLACKROCK CORI FUNDS | | APRIL 30, 2016 | | |
| | |
Schedule of Investments April 30, 2016 (Unaudited) | | BlackRock CoRI 2019 Fund (Percentages shown are based on Net Assets) |
| | | | | | | | |
| Corporate Bonds | | Par (000) | | | Value | |
Aerospace & Defense — 0.8% | | | | | | | | |
Lockheed Martin Corp., 4.07%, 12/15/42 | | $ | 30 | | | $ | 31,282 | |
Northrop Grumman Corp., 4.75%, 6/01/43 | | | 15 | | | | 17,381 | |
United Technologies Corp., 4.50%, 6/01/42 | | | 50 | | | | 55,688 | |
| | | | | | | | |
| | | | | 104,351 | |
Air Freight & Logistics — 0.3% | | | | | | | | |
FedEx Corp.: | | | | | | | | |
4.90%, 1/15/34 | | | 15 | | | | 16,547 | |
4.10%, 2/01/45 | | | 10 | | | | 9,989 | |
United Parcel Service, Inc., 6.20%, 1/15/38 | | | 10 | | | | 13,768 | |
| | | | | | | | |
| | | | | 40,304 | |
Automobiles — 0.5% | | | | | | | | |
Daimler Finance North America LLC, 8.50%, 1/18/31 | | | 10 | | | | 15,823 | |
Ford Motor Co., 4.75%, 1/15/43 | | | 40 | | | | 41,584 | |
| | | | | | | | |
| | | | | 57,407 | |
Banks — 2.2% | | | | | | | | |
Fifth Third Bancorp, 8.25%, 3/01/38 | | | 10 | | | | 14,365 | |
HSBC Holdings PLC, 6.10%, 1/14/42 | | | 70 | | | | 88,899 | |
Wells Fargo & Co.: | | | | | | | | |
3.30%, 9/09/24 | | | 10 | | | | 10,306 | |
5.38%, 11/02/43 | | | 40 | | | | 45,570 | |
5.61%, 1/15/44 | | | 45 | | | | 52,714 | |
4.65%, 11/04/44 | | | 15 | | | | 15,549 | |
4.90%, 11/17/45 | | | 40 | | | | 43,251 | |
| | | | | | | | |
| | | | | 270,654 | |
Beverages — 0.4% | | | | | | | | |
Anheuser-Busch InBev Finance, Inc., 4.63%, 2/01/44 | | | 15 | | | | 16,545 | |
Molson Coors Brewing Co., 5.00%, 5/01/42 | | | 10 | | | | 10,851 | |
PepsiCo, Inc., 4.00%, 3/05/42 | | | 25 | | | | 25,952 | |
| | | | | | | | |
| | | | | 53,348 | |
Biotechnology — 0.3% | | | | | | | | |
Amgen, Inc., 6.40%, 2/01/39 | | | 25 | | | | 32,283 | |
Capital Markets — 3.6% | | | | | | | | |
Ameriprise Financial, Inc., 3.70%, 10/15/24 | | | 10 | | | | 10,438 | |
Credit Suisse USA, Inc., 7.13%, 7/15/32 | | | 35 | | | | 45,172 | |
Goldman Sachs Group, Inc.: | | | | | | | | |
6.13%, 2/15/33 | | | 25 | | | | 30,612 | |
6.75%, 10/01/37 | | | 70 | | | | 84,859 | |
6.25%, 2/01/41 | | | 25 | | | | 31,834 | |
5.15%, 5/22/45 | | | 10 | | | | 10,283 | |
Morgan Stanley: | | | | | | | | |
3.88%, 4/29/24 | | | 25 | | | | 26,293 | |
3.70%, 10/23/24 | | | 35 | | | | 36,103 | |
5.00%, 11/24/25 | | | 25 | | | | 27,211 | |
4.35%, 9/08/26 | | | 15 | | | | 15,500 | |
3.95%, 4/23/27 | | | 45 | | | | 44,934 | |
6.38%, 7/24/42 | | | 10 | | | | 13,214 | |
4.30%, 1/27/45 | | | 25 | | | | 25,389 | |
State Street Corp.: | | | | | | | | |
3.30%, 12/16/24 | | | 10 | | | | 10,503 | |
3.55%, 8/18/25 | | | 40 | | | | 42,993 | |
| | | | | | | | |
| | | | | 455,338 | |
| | | | | | | | |
| Corporate Bonds | | Par (000) | | | Value | |
Chemicals — 0.6% | | | | | | | | |
CF Industries, Inc.: | | | | | | | | |
5.15%, 3/15/34 | | $ | 5 | | | $ | 4,939 | |
5.38%, 3/15/44 | | | 10 | | | | 9,847 | |
Dow Chemical Co., 7.38%, 11/01/29 | | | 10 | | | | 13,067 | |
E.I. du Pont de Nemours & Co., 4.15%, 2/15/43 | | | 5 | | | | 5,012 | |
Ecolab, Inc., 5.50%, 12/08/41 | | | 10 | | | | 11,858 | |
LYB International Finance BV: | | | | | | | | |
5.25%, 7/15/43 | | | 10 | | | | 10,910 | |
4.88%, 3/15/44 | | | 5 | | | | 5,222 | |
Potash Corp. of Saskatchewan, Inc., 5.88%, 12/01/36 | | | 10 | | | | 12,063 | |
| | | | | | | | |
| | | | | 72,918 | |
Communications Equipment — 0.5% | | | | | | | | |
Cisco Systems, Inc., 5.90%, 2/15/39 | | | 40 | | | | 52,907 | |
Motorola Solutions, Inc., 4.00%, 9/01/24 | | | 5 | | | | 4,863 | |
| | | | | | | | |
| | | | | 57,770 | |
Consumer Finance — 0.4% | | | | | | | | |
American Express Co., 4.05%, 12/03/42 | | | 20 | | | | 20,296 | |
MasterCard, Inc., 3.38%, 4/01/24 | | | 25 | | | | 26,797 | |
| | | | | | | | |
| | | | | 47,093 | |
Diversified Financial Services — 5.4% | | | | | | | | |
Bank of America Corp.: | | | | | | | | |
4.00%, 1/22/25 | | | 30 | | | | 30,045 | |
4.25%, 10/22/26 | | | 75 | | | | 76,655 | |
5.88%, 2/07/42 | | | 20 | | | | 24,757 | |
5.00%, 1/21/44 | | | 65 | | | | 72,451 | |
4.88%, 4/01/44 | | | 5 | | | | 5,501 | |
Series L, 4.75%, 4/21/45 | | | 5 | | | | 5,003 | |
Citigroup, Inc.: | | | | | | | | |
5.50%, 9/13/25 | | | 25 | | | | 27,696 | |
4.30%, 11/20/26 | | | 20 | | | | 20,472 | |
8.13%, 7/15/39 | | | 35 | | | | 53,661 | |
6.68%, 9/13/43 | | | 15 | | | | 18,577 | |
5.30%, 5/06/44 | | | 25 | | | | 26,740 | |
4.65%, 7/30/45 | | | 20 | | | | 21,388 | |
General Electric Co.: | | | | | | | | |
6.75%, 3/15/32 | | | 40 | | | | 55,288 | |
5.88%, 1/14/38 | | | 35 | | | | 46,144 | |
JPMorgan Chase & Co.: | | | | | | | | |
3.88%, 9/10/24 | | | 75 | | | | 77,496 | |
6.40%, 5/15/38 | | | 30 | | | | 40,546 | |
5.60%, 7/15/41 | | | 30 | | | | 37,217 | |
5.63%, 8/16/43 | | | 15 | | | | 17,623 | |
4.95%, 6/01/45 | | | 15 | | | | 16,223 | |
| | | | | | | | |
| | | | | 673,483 | |
Diversified Telecommunication Services — 3.7% | |
AT&T, Inc.: | | | | | | | | |
6.30%, 1/15/38 | | | 30 | | | | 35,783 | |
6.55%, 2/15/39 | | | 10 | | | | 12,141 | |
5.35%, 9/01/40 | | | 35 | | | | 37,695 | |
6.38%, 3/01/41 | | | 10 | | | | 11,933 | |
5.55%, 8/15/41 | | | 15 | | | | 16,627 | |
5.15%, 3/15/42 | | | 5 | | | | 5,251 | |
Orange SA, 5.38%, 1/13/42 | | | 5 | | | | 6,069 | |
Telefonica Emisiones SAU, 7.05%, 6/20/36 | | | 15 | | | | 19,415 | |
See Notes to Financial Statements.
| | | | | | |
| | | | | | | |
| | BLACKROCK CORI FUNDS | | APRIL 30, 2016 | | 23 |
| | |
Schedule of Investments (continued) | | BlackRock CoRI 2019 Fund |
| | | | | | | | |
| Corporate Bonds | | Par (000) | | | Value | |
Diversified Telecommunication Services (continued) | |
Verizon Communications, Inc.: | | | | | | | | |
6.40%, 9/15/33 | | $ | 35 | | | $ | 43,904 | |
4.27%, 1/15/36 | | | 25 | | | | 25,139 | |
6.55%, 9/15/43 | | | 80 | | | | 105,523 | |
4.86%, 8/21/46 | | | 25 | | | | 26,793 | |
4.52%, 9/15/48 | | | 30 | | | | 30,444 | |
5.01%, 8/21/54 | | | 35 | | | | 35,946 | |
4.67%, 3/15/55 | | | 50 | | | | 48,354 | |
| | | | | | | | |
| | | | | 461,017 | |
Electric Utilities — 2.3% | | | | | | | | |
Berkshire Hathaway Energy Co.: | | | | | | | | |
6.13%, 4/01/36 | | | 20 | | | | 25,926 | |
6.50%, 9/15/37 | | | 10 | | | | 13,506 | |
Consolidated Edison Co. of New York, Inc., Series C, 5.50%, 12/01/39 | | | 20 | | | | 24,184 | |
Duke Energy Florida LLC, 6.40%, 6/15/38 | | | 35 | | | | 48,893 | |
Exelon Generation Co. LLC, 6.25%, 10/01/39 | | | 15 | | | | 16,330 | |
Georgia Power Co., 4.30%, 3/15/42 | | | 30 | | | | 32,320 | |
Pacific Gas & Electric Co.: | | | | | | | | |
6.05%, 3/01/34 | | | 35 | | | | 46,476 | |
5.40%, 1/15/40 | | | 20 | | | | 24,706 | |
PacifiCorp, 6.00%, 1/15/39 | | | 10 | | | | 12,999 | |
Southern California Edison Co., Series A, 5.95%, 2/01/38 | | | 15 | | | | 19,647 | |
Southern Power Co., 5.15%, 9/15/41 | | | 10 | | | | 10,441 | |
Virginia Electric & Power Co., 8.88%, 11/15/38 | | | 10 | | | | 16,213 | |
| | | | | | | | |
| | | | | 291,641 | |
Energy Equipment & Services — 0.6% | | | | | | | | |
Baker Hughes, Inc., 5.13%, 9/15/40 | | | 10 | | | | 10,302 | |
Enterprise Products Operating LLC: | | | | | | | | |
5.95%, 2/01/41 | | | 10 | | | | 11,070 | |
5.70%, 2/15/42 | | | 20 | | | | 21,848 | |
Halliburton Co., 7.45%, 9/15/39 | | | 20 | | | | 26,257 | |
| | | | | | | | |
| | | | | 69,477 | |
Food & Staples Retailing — 0.1% | | | | | | | | |
CVS Health Corp., 6.13%, 9/15/39 | | | 5 | | | | 6,419 | |
Walgreen Co., 4.40%, 9/15/42 | | | 10 | | | | 9,659 | |
| | | | | | | | |
| | | | | 16,078 | |
Food Products — 0.5% | | | | | | | | |
Archer-Daniels-Midland Co., 4.54%, 3/26/42 | | | 15 | | | | 16,424 | |
Kellogg Co., 4.50%, 4/01/46 | | | 20 | | | | 21,108 | |
Kraft Heinz Foods Co. (fka Kraft Foods Group, Inc.): | | | | | | | | |
6.88%, 1/26/39 | | | 5 | | | | 6,566 | |
5.00%, 6/04/42 | | | 20 | | | | 22,297 | |
| | | | | | | | |
| | | | | 66,395 | |
Health Care Equipment & Supplies — 0.6% | | | | | | | | |
Express Scripts Holding Co., 6.13%, 11/15/41 | | | 5 | | | | 5,622 | |
Medtronic, Inc.: | | | | | | | | |
4.63%, 3/15/44 | | | 8 | | | | 9,099 | |
4.63%, 3/15/45 | | | 50 | | | | 57,039 | |
| | | | | | | | |
| | | | | 71,760 | |
Health Care Providers & Services — 0.9% | | | | | | | | |
Aetna, Inc., 6.63%, 6/15/36 | | | 5 | | | | 6,337 | |
Anthem, Inc., 5.10%, 1/15/44 | | | 25 | | | | 27,498 | |
| | | | | | | | |
| Corporate Bonds | | Par (000) | | | Value | |
Health Care Providers & Services (continued) | |
UnitedHealth Group, Inc.: | | | | | | | | |
4.63%, 7/15/35 | | $ | 10 | | | $ | 11,287 | |
6.88%, 2/15/38 | | | 20 | | | | 28,368 | |
4.75%, 7/15/45 | | | 30 | | | | 34,663 | |
| | | | | | | | |
| | | | | 108,153 | |
Hotels, Restaurants & Leisure — 0.1% | | | | | | | | |
McDonald’s Corp., 6.30%, 10/15/37 | | | 15 | | | | 19,408 | |
Household Products — 0.3% | | | | | | | | |
Kimberly-Clark Corp., 6.63%, 8/01/37 | | | 10 | | | | 14,279 | |
Koninklijke Philips NV, 6.88%, 3/11/38 | | | 15 | | | | 18,987 | |
| | | | | | | | |
| | | | | 33,266 | |
Industrial Conglomerates — 0.4% | | | | | | | | |
General Electric Co., 4.50%, 3/11/44 | | | 40 | | | | 44,948 | |
Insurance — 1.5% | | | | | | | | |
Allstate Corp., 4.50%, 6/15/43 | | | 15 | | | | 16,665 | |
American International Group, Inc., 4.13%, 2/15/24 | | | 50 | | | | 52,349 | |
Arch Capital Group US, Inc., 5.14%, 11/01/43 | | | 10 | | | | 10,419 | |
AXA SA, 8.60%, 12/15/30 | | | 10 | | | | 13,403 | |
MetLife, Inc., 4.88%, 11/13/43 | | | 45 | | | | 48,850 | |
Prudential Financial, Inc., 6.63%, 12/01/37 | | | 20 | | | | 25,097 | |
Travelers Cos., Inc., 4.60%, 8/01/43 | | | 15 | | | | 17,008 | |
| | | | | | | | |
| | | | | 183,791 | |
Machinery — 0.2% | | | | | | | | |
Caterpillar, Inc., 3.80%, 8/15/42 | | | 20 | | | | 19,792 | |
Media — 3.5% | | | | | | | | |
21st Century Fox America, Inc.: | | | | | | | | |
6.40%, 12/15/35 | | | 60 | | | | 75,631 | |
5.40%, 10/01/43 | | | 10 | | | | 11,543 | |
Comcast Corp.: | | | | | | | | |
4.25%, 1/15/33 | | | 20 | | | | 21,617 | |
6.45%, 3/15/37 | | | 20 | | | | 26,928 | |
6.40%, 3/01/40 | | | 25 | | | | 34,461 | |
4.65%, 7/15/42 | | | 15 | | | | 16,927 | |
4.75%, 3/01/44 | | | 25 | | | | 28,939 | |
Discovery Communications LLC, 6.35%, 6/01/40 | | | 20 | | | | 20,807 | |
NBCUniversal Media LLC: | | | | | | | | |
6.40%, 4/30/40 | | | 20 | | | | 27,517 | |
5.95%, 4/01/41 | | | 10 | | | | 13,065 | |
Thomson Reuters Corp., 5.85%, 4/15/40 | | | 5 | | | | 5,548 | |
Time Warner Cable, Inc.: | | | | | | | | |
6.55%, 5/01/37 | | | 20 | | | | 23,016 | |
7.30%, 7/01/38 | | | 5 | | | | 6,147 | |
6.75%, 6/15/39 | | | 10 | | | | 11,839 | |
Time Warner, Inc.: | | | | | | | | |
4.05%, 12/15/23 | | | 25 | | | | 27,008 | |
7.63%, 4/15/31 | | | 15 | | | | 19,733 | |
6.10%, 7/15/40 | | | 20 | | | | 24,197 | |
5.35%, 12/15/43 | | | 20 | | | | 22,402 | |
Viacom, Inc., 4.38%, 3/15/43 | | | 20 | | | | 15,843 | |
Walt Disney Co., 4.13%, 6/01/44 | | | 5 | | | | 5,432 | |
| | | | | | | | |
| | | | | 438,600 | |
Metals & Mining — 0.8% | | | | | | | | |
BHP Billiton Finance USA Ltd., 5.00%, 9/30/43 | | | 25 | | | | 27,922 | |
Newmont Mining Corp., 6.25%, 10/01/39 | | | 10 | | | | 10,452 | |
Rio Tinto Finance USA Ltd., 5.20%, 11/02/40 | | | 15 | | | | 16,371 | |
See Notes to Financial Statements.
| | | | | | |
| | | | | | | |
| 24 | | BLACKROCK CORI FUNDS | | APRIL 30, 2016 | | |
| | |
Schedule of Investments (continued) | | BlackRock CoRI 2019 Fund |
| | | | | | | | |
| Corporate Bonds | | Par (000) | | | Value | |
Metals & Mining (continued) | | | | | | | | |
Southern Copper Corp.: | | | | | | | | |
5.25%, 11/08/42 | | $ | 20 | | | $ | 17,230 | |
5.88%, 4/23/45 | | | 30 | | | | 27,502 | |
| | | | | | | | |
| | | | | 99,477 | |
Multiline Retail — 0.2% | | | | | | | | |
Target Corp., 4.00%, 7/01/42 | | | 25 | | | | 26,460 | |
Oil, Gas & Consumable Fuels — 2.1% | | | | | | | | |
Anadarko Petroleum Corp., 6.45%, 9/15/36 | | | 30 | | | | 32,365 | |
ConocoPhillips, 6.50%, 2/01/39 | | | 40 | | | | 49,631 | |
ConocoPhillips Holding Co., 6.95%, 4/15/29 | | | 25 | | | | 30,086 | |
Devon Financing Co. LLC, 7.88%, 9/30/31 | | | 20 | | | | 21,413 | |
ONEOK Partners LP, 6.85%, 10/15/37 | | | 5 | | | | 4,809 | |
Phillips 66, 5.88%, 5/01/42 | | | 10 | | | | 11,663 | |
Suncor Energy, Inc., 6.50%, 6/15/38 | | | 35 | | | | 41,210 | |
TransCanada PipeLines Ltd.: | | | | | | | | |
7.63%, 1/15/39 | | | 20 | | | | 25,814 | |
6.10%, 6/01/40 | | | 15 | | | | 17,512 | |
Valero Energy Corp., 6.63%, 6/15/37 | | | 20 | | | | 22,476 | |
| | | | | | | | |
| | | | | 256,979 | |
Pharmaceuticals — 1.9% | | | | | | | | |
Abbott Laboratories, 5.30%, 5/27/40 | | | 10 | | | | 11,426 | |
AbbVie, Inc., 4.40%, 11/06/42 | | | 15 | | | | 15,454 | |
AstraZeneca PLC: | | | | | | | | |
3.38%, 11/16/25 | | | 20 | | | | 20,840 | |
6.45%, 9/15/37 | | | 15 | | | | 20,083 | |
4.38%, 11/16/45 | | | 20 | | | | 21,654 | |
Bristol-Myers Squibb Co., 3.25%, 8/01/42 | | | 5 | | | | 4,799 | |
GlaxoSmithKline Capital, Inc., 6.38%, 5/15/38 | | | 20 | | | | 27,598 | |
Merck & Co., Inc., 2.80%, 5/18/23 | | | 25 | | | | 26,199 | |
Pfizer, Inc.: | | | | | | | | |
7.20%, 3/15/39 | | | 50 | | | | 73,774 | |
4.40%, 5/15/44 | | | 5 | | | | 5,688 | |
Teva Pharmaceutical Finance Co. LLC, 6.15%, 2/01/36 | | | 5 | | | | 5,972 | |
| | | | | | | | |
| | | | | 233,487 | |
Real Estate Investment Trusts (REITs) — 0.1% | | | | | | | | |
Weyerhaeuser Co., 7.38%, 3/15/32 | | | 15 | | | | 18,672 | |
Road & Rail — 0.3% | | | | | | | | |
CSX Corp., 6.22%, 4/30/40 | | | 5 | | | | 6,402 | |
Norfolk Southern Corp., 4.84%, 10/01/41 | | | 25 | | | | 27,865 | |
| | | | | | | | |
| | | | | 34,267 | |
Semiconductors & Semiconductor Equipment — 0.2% | |
Applied Materials, Inc., 5.85%, 6/15/41 | | | 5 | | | | 6,028 | |
Intel Corp., 4.80%, 10/01/41 | | | 15 | | | | 16,987 | |
| | | | | | | | |
| | | | | 23,015 | |
Software — 0.4% | | | | | | | | |
Oracle Corp.: | | | | | | | | |
6.13%, 7/08/39 | | | 20 | | | | 26,401 | |
5.38%, 7/15/40 | | | 25 | | | | 30,361 | |
| | | | | | | | |
| | | | | 56,762 | |
Specialty Retail — 0.2% | | | | | | | | |
Home Depot, Inc., 5.88%, 12/16/36 | | | 20 | | | | 26,289 | |
Technology Hardware, Storage & Peripherals — 0.1% | |
HP, Inc. (fka Hewlett-Packard Co.), 6.00%, 9/15/41 | | | 15 | | | | 14,115 | |
| | | | | | | | |
| Corporate Bonds | | Par (000) | | | Value | |
Tobacco — 0.6% | | | | | | | | |
Altria Group, Inc., 5.38%, 1/31/44 | | $ | 30 | | | $ | 37,232 | |
Philip Morris International, Inc., 4.88%, 11/15/43 | | | 35 | | | | 40,753 | |
| | | | | | | | |
| | | | | 77,985 | |
Wireless Telecommunication Services — 0.6% | |
America Movil SAB de CV, 6.38%, 3/01/35 | | | 30 | | | | 36,544 | |
Vodafone Group PLC: | | | | | | | | |
6.15%, 2/27/37 | | | 30 | | | | 35,259 | |
4.38%, 2/19/43 | | | 10 | | | | 9,454 | |
| | | | | | | | |
| | | | | 81,257 | |
| Total Corporate Bonds — 37.2% | | | | 4,638,040 | |
| | | | | | | | |
| | | | | | | | | |
| | |
| U.S. Treasury Obligations | | | | | | |
U.S. Treasury Bonds: | | | | | | | | |
7.50%, 11/15/24 | | | 90 | | | | 131,544 | |
7.63%, 2/15/25 | | | 180 | | | | 266,857 | |
6.00%, 2/15/26 | | | 190 | | | | 262,089 | |
6.50%, 11/15/26 | | | 60 | | | | 86,775 | |
6.13%, 8/15/29 | | | 230 | | | | 340,068 | |
5.38%, 2/15/31 | | | 50 | | | | 71,145 | |
4.50%, 2/15/36 | | | 30 | | | | 40,813 | |
4.38%, 2/15/38 | | | 20 | | | | 26,805 | |
4.50%, 5/15/38 | | | 20 | | | | 27,253 | |
3.50%, 2/15/39 | | | 40 | | | | 47,228 | |
4.25%, 5/15/39 | | | 20 | | | | 26,263 | |
4.50%, 8/15/39 | | | 20 | | | | 27,192 | |
4.63%, 2/15/40 | | | 10 | | | | 13,828 | |
4.38%, 5/15/41 | | | 20 | | | | 26,792 | |
3.13%, 2/15/42 | | | 130 | | | | 143,320 | |
2.75%, 8/15/42 | | | 30 | | | | 30,758 | �� |
2.75%, 11/15/42 | | | 410 | | | | 419,401 | |
2.88%, 5/15/43 | | | 60 | | | | 62,756 | |
3.63%, 8/15/43 | | | 280 | | | | 337,137 | |
3.75%, 11/15/43 | | | 200 | | | | 246,281 | |
3.63%, 2/15/44 | | | 150 | | | | 180,428 | |
3.38%, 5/15/44 | | | 160 | | | | 183,894 | |
3.13%, 8/15/44 | | | 80 | | | | 87,753 | |
3.00%, 11/15/44 | | | 80 | | | | 85,622 | |
2.50%, 2/15/45 | | | 30 | | | | 28,983 | |
3.00%, 5/15/45 | | | 10 | | | | 10,699 | |
2.88%, 8/15/45 | | | 120 | | | | 125,208 | |
U.S. Treasury Notes: | | | | | | | | |
2.38%, 8/15/24 | | | 135 | | | | 141,792 | |
2.25%, 11/15/24 | | | 25 | | | | 25,997 | |
2.00%, 2/15/25 | | | 230 | | | | 234,303 | |
2.13%, 5/15/25 | | | 300 | | | | 308,473 | |
2.00%, 8/15/25 | | | 220 | | | | 223,747 | |
2.25%, 11/15/25 | | | 110 | | | | 114,181 | |
U.S. Treasury Principal STRIPS, 0.00%, 5/15/37 (a) | | | 5,450 | | | | 3,304,580 | |
| Total U.S. Treasury Obligations — 61.6% | | | | 7,689,965 | |
Total Long-Term Investments
(Cost — $10,981,635) — 98.8% | | | | 12,328,005 | |
See Notes to Financial Statements.
| | | | | | |
| | | | | | | |
| | BLACKROCK CORI FUNDS | | APRIL 30, 2016 | | 25 |
| | |
Schedule of Investments (continued) | | BlackRock CoRI 2019 Fund |
| | | | | | | | |
| Short-Term Securities — 0.9% | | Shares | | | Value | |
BlackRock Liquidity Funds, TempFund, Institutional Class, 0.40% (b)(c) | | | 112,906 | | | $ | 112,906 | |
Total Short-Term Securities
(Cost — $112,906) — 0.9% | | | | 112,906 | |
| Total Investments (Cost — $11,094,541) — 99.7% | | | | 12,440,911 | |
| Other Assets Less Liabilities — 0.3% | | | | 43,333 | |
| | | | | | | | |
| Net Assets — 100.0% | | | $ | 12,484,244 | |
| | | | | | | | |
|
| Notes to Schedule of Investments |
| (b) | | During the period ended April 30, 2016, investments in issuers considered to be affiliates of the Fund for purposes of Section 2(a)(3) of the Investment Company Act of 1940, as amended, were as follows: |
| | | | | | | | | | | | | | | | | | |
| Affiliate | | Shares Held
at October 31,
2015 | | | Net
Activity | | | Shares Held
at April 30,
2016 | | | Income | | | |
BlackRock Liquidity Funds, TempFund, Institutional Class | | | 299,546 | | | | (186,640 | ) | | | 112,906 | | | $ | 225 | | | |
| (c) | | Current yield as of period end. |
|
| Derivative Financial Instruments Outstanding as of Period End |
Futures Contracts
| | | | | | | | | | | | | | |
Contracts
Long | | | Issue | | Expiration | | Notional
Value | | Unrealized
Depreciation | | | |
| | 1 | | | U.S. Treasury Long Bond | | June 2016 | | $163,313 | | $ | (1,977 | ) | | |
|
| Derivative Financial Instruments Categorized by Risk Exposure |
As of period end, the fair values of derivative financial instruments located in the Statements of Assets and Liabilities were as follows:
| | | | | | | | | | | | | | | | | | | | | | | | | | | | | | | | |
| Liabilities — Derivative Financial Instruments | | | Commodity
Contracts | | | Credit
Contracts | | | Equity
Contracts | | | Foreign
Currency
Exchange
Contracts | | | Interest
Rate
Contracts | | | Other
Contracts | | | Total | |
Futures contracts | | | Net unrealized depreciation | 1 | | | — | | | | — | | | | — | | | | — | | | $ | 1,977 | | | | — | | | $ | 1,977 | |
1 Includes cumulative appreciation (depreciation) on futures contracts, if any, as reported in the Schedule of Investments. Only current day’s variation margin is reported within the Statements of Assets and Liabilities. | |
For the period ended April 30, 2016, the effect of derivative financial instruments in the Statements of Operations was as follows:
| | | | | | | | | | | | | | | | | | | | | | | | | | | | |
| Net Realized Gain (Loss) from: | | Commodity
Contracts | | | Credit
Contracts | | | Equity
Contracts | | | Foreign
Currency
Exchange
Contracts | | | Interest
Rate
Contracts | | | Other
Contracts | | | Total | |
Futures contracts | | | — | | | | — | | | | — | | | | — | | | $ | 11,410 | | | | — | | | $ | 11,410 | |
| | | | | | | | | | | | | | | | | | | | | | | | | | | | | |
| Net Change in Unrealized Appreciation (Depreciation) on: | | | | | | | | | | | | | | | | | | | | | |
Futures contracts | | | — | | | | — | | | | — | | | | — | | | $ | (1,851 | ) | | | — | | | $ | (1,851 | ) |
|
| Average Quarterly Balances of Outstanding Derivative Financial Instruments |
| | | | |
| Futures contracts: | | | | |
Average notional value of contracts — long | | $ | 162,172 | |
For more information about the Fund’s investment risks regarding derivative financial instruments, refer to the Notes to Financial Statements.
See Notes to Financial Statements.
| | | | | | |
| | | | | | | |
| 26 | | BLACKROCK CORI FUNDS | | APRIL 30, 2016 | | |
| | |
Schedule of Investments (concluded) | | BlackRock CoRI 2019 Fund |
|
| Fair Value Hierarchy as of Period End |
Various inputs are used in determining the fair value of investments and derivative financial instruments. For information about the Fund’s policy regarding valuation of investments and derivative financial instruments, refer to the Notes to Financial Statements.
The following tables summarize the Fund’s investments and derivative financial instruments categorized in the disclosure hierarchy:
| | | | | | | | | | | | | | |
| | | Level 1 | | | Level 2 | | | Level 3 | | Total | |
Assets: | | | | | | | | | | | | | | |
| Investments: | | | | | | | | | | | | | | |
Long-Term Investments1 | | | — | | | $ | 12,328,005 | | | — | | $ | 12,328,005 | |
Short-Term Securities | | $ | 112,906 | | | | — | | | — | | | 112,906 | |
| | | | |
Total | | $ | 112,906 | | | $ | 12,328,005 | | | — | | $ | 12,440,911 | |
| | | | |
| | | | | | | | | | | | | | |
| Derivative Financial Instruments2 | | | | | | | | | | | | | | |
Liabilities: | | | | | | | | | | | | | | |
Interest rate contracts | | $ | (1,977 | ) | | | — | | | — | | $ | (1,977 | ) |
1 See above Schedule of Investments for values in each industry. | |
2 Derivative financial instruments are futures contracts. Futures contracts are valued at the unrealized appreciation (depreciation) on the instrument. | |
The Fund may hold assets and/or liabilities in which the fair value approximates the carrying amount for financial statement purposes. As of period end, cash pledged for futures contracts of $4,400 is categorized as Level 1 within the disclosure hierarchy.
During the six months ended April 30, 2016, there were no transfers between levels.
See Notes to Financial Statements.
| | | | | | |
| | | | | | | |
| | BLACKROCK CORI FUNDS | | APRIL 30, 2016 | | 27 |
| | |
Schedule of Investments April 30, 2016 (Unaudited) | | BlackRock CoRI 2021 Fund (Percentages shown are based on Net Assets) |
| | | | | | | | |
| Corporate Bonds | | Par
(000) | | | Value | |
Aerospace & Defense — 1.1% | | | | | | | | |
Lockheed Martin Corp., 4.07%, 12/15/42 | | $ | 30 | | | $ | 31,283 | |
Northrop Grumman Corp., 4.75%, 6/01/43 | | | 20 | | | | 23,174 | |
United Technologies Corp.: | | | | | | | | |
5.70%, 4/15/40 | | | 20 | | | | 25,365 | |
4.50%, 6/01/42 | | | 50 | | | | 55,688 | |
| | | | | | | | |
| | | | | 135,510 | |
Air Freight & Logistics — 0.4% | | | | | | | | |
FedEx Corp.: | | | | | | | | |
4.90%, 1/15/34 | | | 15 | | | | 16,547 | |
4.10%, 2/01/45 | | | 10 | | | | 9,989 | |
United Parcel Service, Inc., 6.20%, 1/15/38 | | | 15 | | | | 20,652 | |
| | | | | | | | |
| | | | | 47,188 | |
Automobiles — 0.5% | | | | | | | | |
Daimler Finance North America LLC, 8.50%, 1/18/31 | | | 10 | | | | 15,823 | |
Ford Motor Co., 4.75%, 1/15/43 | | | 40 | | | | 41,584 | |
| | | | | | | | |
| | | | | 57,407 | |
Banks — 2.1% | | | | | | | | |
Fifth Third Bancorp, 8.25%, 3/01/38 | | | 10 | | | | 14,366 | |
HSBC Holdings PLC, 6.10%, 1/14/42 | | | 70 | | | | 88,899 | |
Wells Fargo & Co.: | | | | | | | | |
5.38%, 11/02/43 | | | 35 | | | | 39,873 | |
5.61%, 1/15/44 | | | 45 | | | | 52,715 | |
4.65%, 11/04/44 | | | 25 | | | | 25,914 | |
3.90%, 5/01/45 | | | 10 | | | | 9,924 | |
4.90%, 11/17/45 | | | 20 | | | | 21,625 | |
| | | | | | | | |
| | | | | 253,316 | |
Beverages — 0.9% | | | | | | | | |
Anheuser-Busch InBev Finance, Inc., 4.63%, 2/01/44 | | | 25 | | | | 27,576 | |
Anheuser-Busch InBev Worldwide, Inc., 3.75%, 7/15/42 | | | 10 | | | | 9,728 | |
Diageo Investment Corp., 4.25%, 5/11/42 | | | 15 | | | | 16,171 | |
Molson Coors Brewing Co., 5.00%, 5/01/42 | | | 10 | | | | 10,851 | |
PepsiCo, Inc.: | | | | | | | | |
4.00%, 3/05/42 | | | 25 | | | | 25,952 | |
3.60%, 8/13/42 | | | 15 | | | | 14,843 | |
| | | | | | | | |
| | | | | 105,121 | |
Biotechnology — 0.3% | | | | | | | | |
Amgen, Inc., 6.40%, 2/01/39 | | | 30 | | | | 38,740 | |
Capital Markets — 2.3% | | | | | | | | |
Credit Suisse USA, Inc., 7.13%, 7/15/32 | | | 10 | | | | 12,906 | |
Goldman Sachs Group, Inc.: | | | | | | | | |
6.13%, 2/15/33 | | | 60 | | | | 73,469 | |
6.75%, 10/01/37 | | | 60 | | | | 72,737 | |
5.15%, 5/22/45 | | | 10 | | | | 10,282 | |
Morgan Stanley: | | | | | | | | |
4.35%, 9/08/26 | | | 25 | | | | 25,833 | |
3.95%, 4/23/27 | | | 35 | | | | 34,949 | |
6.38%, 7/24/42 | | | 15 | | | | 19,820 | |
4.30%, 1/27/45 | | | 35 | | | | 35,544 | |
| | | | | | | | |
| | | | | 285,540 | |
Chemicals — 0.6% | | | | | | | | |
CF Industries, Inc.: | | | | | | | | |
5.15%, 3/15/34 | | | 5 | | | | 4,938 | |
| | | | | | | | |
| Corporate Bonds | | Par
(000) | | | Value | |
Chemicals (continued) | | | | | | | | |
CF Industries, Inc. (continued): | | | | | | | | |
5.38%, 3/15/44 | | $ | 15 | | | $ | 14,771 | |
Dow Chemical Co., 7.38%, 11/01/29 | | | 15 | | | | 19,601 | |
E.I. du Pont de Nemours & Co., 4.15%, 2/15/43 | | | 10 | | | | 10,024 | |
Ecolab, Inc., 5.50%, 12/08/41 | | | 5 | | | | 5,929 | |
LYB International Finance BV, 5.25%, 7/15/43 | | | 10 | | | | 10,910 | |
Potash Corp. of Saskatchewan, Inc., 5.88%, 12/01/36 | | | 10 | | | | 12,063 | |
| | | | | | | | |
| | | | | 78,236 | |
Communications Equipment — 0.3% | | | | | | | | |
Cisco Systems, Inc., 5.90%, 2/15/39 | | | 30 | | | | 39,680 | |
Consumer Finance — 0.2% | | | | | | | | |
American Express Co., 4.05%, 12/03/42 | | | 20 | | | | 20,296 | |
Diversified Financial Services — 4.4% | | | | | | | | |
Bank of America Corp.: | | | | | | | | |
4.25%, 10/22/26 | | | 40 | | | | 40,883 | |
5.88%, 2/07/42 | | | 20 | | | | 24,757 | |
5.00%, 1/21/44 | | | 40 | | | | 44,585 | |
4.88%, 4/01/44 | | | 25 | | | | 27,503 | |
Series L, 4.75%, 4/21/45 | | | 5 | | | | 5,003 | |
Citigroup, Inc.: | | | | | | | | |
4.30%, 11/20/26 | | | 10 | | | | 10,236 | |
8.13%, 7/15/39 | | | 50 | | | | 76,658 | |
6.68%, 9/13/43 | | | 20 | | | | 24,769 | |
5.30%, 5/06/44 | | | 5 | | | | 5,348 | |
4.65%, 7/30/45 | | | 15 | | | | 16,041 | |
General Electric Co.: | | | | | | | | |
6.75%, 3/15/32 | | | 40 | | | | 55,288 | |
5.88%, 1/14/38 | | | 40 | | | | 52,737 | |
JPMorgan Chase & Co.: | | | | | | | | |
4.13%, 12/15/26 | | | 30 | | | | 31,308 | |
6.40%, 5/15/38 | | | 35 | | | | 47,304 | |
5.60%, 7/15/41 | | | 10 | | | | 12,406 | |
5.40%, 1/06/42 | | | 10 | | | | 12,133 | |
5.63%, 8/16/43 | | | 25 | | | | 29,372 | |
4.95%, 6/01/45 | | | 15 | | | | 16,223 | |
| | | | | | | | |
| | | | | 532,554 | |
Diversified Telecommunication Services — 4.3% | | | | | | | | |
AT&T, Inc.: | | | | | | | | |
6.30%, 1/15/38 | | | 20 | | | | 23,855 | |
6.55%, 2/15/39 | | | 15 | | | | 18,211 | |
5.35%, 9/01/40 | | | 40 | | | | 43,080 | |
6.38%, 3/01/41 | | | 15 | | | | 17,900 | |
5.55%, 8/15/41 | | | 10 | | | | 11,084 | |
5.15%, 3/15/42 | | | 10 | | | | 10,503 | |
Orange SA, 5.38%, 1/13/42 | | | 5 | | | | 6,069 | |
Telefonica Emisiones SAU, 7.05%, 6/20/36 | | | 30 | | | | 38,830 | |
Verizon Communications, Inc.: | | | | | | | | |
6.40%, 9/15/33 | | | 45 | | | | 56,448 | |
4.27%, 1/15/36 | | | 25 | | | | 25,139 | |
6.55%, 9/15/43 | | | 45 | | | | 59,357 | |
4.86%, 8/21/46 | | | 60 | | | | 64,302 | |
4.52%, 9/15/48 | | | 45 | | | | 45,666 | |
5.01%, 8/21/54 | | | 65 | | | | 66,758 | |
4.67%, 3/15/55 | | | 40 | | | | 38,683 | |
| | | | | | | | |
| | | | | 525,885 | |
See Notes to Financial Statements.
| | | | | | |
| | | | | | | |
| 28 | | BLACKROCK CORI FUNDS | | APRIL 30, 2016 | | |
| | |
Schedule of Investments (continued) | | BlackRock CoRI 2021 Fund |
| | | | | | | | |
| Corporate Bonds | | Par
(000) | | | Value | |
Electric Utilities — 2.8% | | | | | | | | |
Berkshire Hathaway Energy Co., 6.13%, 4/01/36 | | $ | 40 | | | $ | 51,853 | |
Consolidated Edison Co. of New York, Inc., Series C,
5.50%, 12/01/39 | | | 15 | | | | 18,138 | |
Duke Energy Florida LLC, 6.40%, 6/15/38 | | | 35 | | | | 48,893 | |
Exelon Generation Co. LLC, 6.25%, 10/01/39 | | | 20 | | | | 21,773 | |
Georgia Power Co., 4.30%, 3/15/42 | | | 25 | | | | 26,933 | |
Pacific Gas & Electric Co.: | | | | | | | | |
6.05%, 3/01/34 | | | 40 | | | | 53,115 | |
5.40%, 1/15/40 | | | 20 | | | | 24,706 | |
PacifiCorp, 6.00%, 1/15/39 | | | 10 | | | | 12,999 | |
Southern California Edison Co., Series A,
5.95%, 2/01/38 | | | 20 | | | | 26,195 | |
Southern Power Co., 5.15%, 9/15/41 | | | 15 | | | | 15,661 | |
Virginia Electric & Power Co.: | | | | | | | | |
8.88%, 11/15/38 | | | 10 | | | | 16,213 | |
Series A, 6.00%, 5/15/37 | | | 15 | | | | 19,227 | |
| | | | | | | | |
| | | | | 335,706 | |
Energy Equipment & Services — 0.7% | | | | | | | | |
Baker Hughes, Inc., 5.13%, 9/15/40 | | | 10 | | | | 10,302 | |
Enterprise Products Operating LLC: | | | | | | | | |
6.13%, 10/15/39 | | | 5 | | | | 5,439 | |
5.95%, 2/01/41 | | | 15 | | | | 16,605 | |
5.70%, 2/15/42 | | | 5 | | | | 5,462 | |
Halliburton Co., 7.45%, 9/15/39 | | | 15 | | | | 19,693 | |
| | | | | | | | |
| | | | | 57,501 | |
Food & Staples Retailing — 0.2% | | | | | | | | |
CVS Health Corp., 6.13%, 9/15/39 | | | 5 | | | | 6,419 | |
Walgreen Co., 4.40%, 9/15/42 | | | 15 | | | | 14,489 | |
| | | | | | | | |
| | | | | 20,908 | |
Food Products — 0.3% | | | | | | | | |
Archer-Daniels-Midland Co., 4.54%, 3/26/42 | | | 20 | | | | 21,899 | |
Kellogg Co., 4.50%, 4/01/46 | | | 15 | | | | 15,830 | |
| | | | | | | | |
| | | | | 37,729 | |
Health Care Equipment & Supplies — 0.6% | | | | | | | | |
Express Scripts Holding Co., 6.13%, 11/15/41 | | | 10 | | | | 11,244 | |
Medtronic, Inc., 4.63%, 3/15/45 | | | 50 | | | | 57,039 | |
| | | | | | | | |
| | | | | 68,283 | |
Health Care Providers & Services — 1.1% | | | | | | | | |
Aetna, Inc., 6.63%, 6/15/36 | | | 5 | | | | 6,337 | |
Anthem, Inc., 5.10%, 1/15/44 | | | 30 | | | | 32,997 | |
UnitedHealth Group, Inc.: | | | | | | | | |
4.63%, 7/15/35 | | | 20 | | | | 22,575 | |
6.88%, 2/15/38 | | | 20 | | | | 28,368 | |
4.75%, 7/15/45 | | | 35 | | | | 40,440 | |
| | | | | | | | |
| | | | | 130,717 | |
Hotels, Restaurants & Leisure — 0.3% | | | | | | | | |
McDonald’s Corp.: | | | | | | | | |
6.30%, 10/15/37 | | | 20 | | | | 25,877 | |
3.70%, 2/15/42 | | | 10 | | | | 9,434 | |
| | | | | | | | |
| | | | | 35,311 | |
Household Products — 0.3% | | | | | | | | |
Kimberly-Clark Corp., 6.63%, 8/01/37 | | | 5 | | | | 7,139 | |
Koninklijke Philips NV, 6.88%, 3/11/38 | | | 20 | | | | 25,317 | |
| | | | | | | | |
| | | | | 32,456 | |
| | | | | | | | |
| Corporate Bonds | | Par
(000) | | | Value | |
Industrial Conglomerates — 0.5% | |
General Electric Co., 4.50%, 3/11/44 | | $ | 55 | | | $ | 61,804 | |
Insurance — 1.5% | |
Allstate Corp., 4.50%, 6/15/43 | | | 15 | | | | 16,665 | |
Arch Capital Group US, Inc., 5.14%, 11/01/43 | | | 10 | | | | 10,419 | |
AXA SA, 8.60%, 12/15/30 | | | 10 | | | | 13,403 | |
Lincoln National Corp., 7.00%, 6/15/40 | | | 10 | | | | 12,338 | |
MetLife, Inc.: | | | | | | | | |
4.88%, 11/13/43 | | | 40 | | | | 43,423 | |
4.05%, 3/01/45 | | | 20 | | | | 19,158 | |
Prudential Financial, Inc., 6.63%, 12/01/37 | | | 25 | | | | 31,372 | |
Travelers Cos., Inc., 4.60%, 8/01/43 | | | 30 | | | | 34,015 | |
| | | | | | | | |
| | | | | 180,793 | |
Machinery — 0.2% | |
Caterpillar, Inc., 3.80%, 8/15/42 | | | 25 | | | | 24,740 | |
Media — 3.9% | |
21st Century Fox America, Inc.: | | | | | | | | |
6.40%, 12/15/35 | | | 65 | | | | 81,934 | |
5.40%, 10/01/43 | | | 15 | | | | 17,315 | |
Comcast Corp.: | | | | | | | | |
4.25%, 1/15/33 | | | 30 | | | | 32,426 | |
6.45%, 3/15/37 | | | 15 | | | | 20,196 | |
6.40%, 3/01/40 | | | 25 | | | | 34,461 | |
4.65%, 7/15/42 | | | 25 | | | | 28,212 | |
NBCUniversal Media LLC: | | | | | | | | |
6.40%, 4/30/40 | | | 25 | | | | 34,397 | |
5.95%, 4/01/41 | | | 20 | | | | 26,130 | |
Thomson Reuters Corp., 5.85%, 4/15/40 | | | 5 | | | | 5,547 | |
Time Warner Cable, Inc.: | | | | | | | | |
6.55%, 5/01/37 | | | 15 | | | | 17,262 | |
7.30%, 7/01/38 | | | 10 | | | | 12,293 | |
6.75%, 6/15/39 | | | 20 | | | | 23,678 | |
Time Warner, Inc.: | | | | | | | | |
7.63%, 4/15/31 | | | 20 | | | | 26,311 | |
6.20%, 3/15/40 | | | 20 | | | | 23,964 | |
6.10%, 7/15/40 | | | 15 | | | | 18,148 | |
6.25%, 3/29/41 | | | 15 | | | | 18,273 | |
5.35%, 12/15/43 | | | 10 | | | | 11,201 | |
Viacom, Inc., 4.38%, 3/15/43 | | | 25 | | | | 19,804 | |
Walt Disney Co., 4.13%, 6/01/44 | | | 25 | | | | 27,161 | |
| | | | | | | | |
| | | | | 478,713 | |
Metals & Mining — 0.8% | |
BHP Billiton Finance USA Ltd., 5.00%, 9/30/43 | | | 25 | | | | 27,922 | |
Newmont Mining Corp., 6.25%, 10/01/39 | | | 10 | | | | 10,452 | |
Rio Tinto Finance USA Ltd., 5.20%, 11/02/40 | | | 15 | | | | 16,371 | |
Southern Copper Corp.: | | | | | | | | |
5.25%, 11/08/42 | | | 25 | | | | 21,538 | |
5.88%, 4/23/45 | | | 30 | | | | 27,502 | |
| | | | | | | | |
| | | | | 103,785 | |
Multiline Retail — 0.4% | |
Target Corp., 4.00%, 7/01/42 | | | 45 | | | | 47,628 | |
Oil, Gas & Consumable Fuels — 2.1% | |
Anadarko Petroleum Corp., 6.45%, 9/15/36 | | | 35 | | | | 37,759 | |
ConocoPhillips: | | | | | | | | |
5.90%, 5/15/38 | | | 5 | | | | 5,808 | |
6.50%, 2/01/39 | | | 35 | | | | 43,427 | |
ConocoPhillips Holding Co., 6.95%, 4/15/29 | | | 30 | | | | 36,103 | |
See Notes to Financial Statements.
| | | | | | |
| | | | | | | |
| | BLACKROCK CORI FUNDS | | APRIL 30, 2016 | | 29 |
| | |
Schedule of Investments (continued) | | BlackRock CoRI 2021 Fund |
| | | | | | | | |
| Corporate Bonds | | Par
(000) | | | Value | |
Oil, Gas & Consumable Fuels (continued) | |
Devon Financing Co. LLC, 7.88%, 9/30/31 | | $ | 25 | | | $ | 26,766 | |
ONEOK Partners LP, 6.85%, 10/15/37 | | | 5 | | | | 4,809 | |
Petro-Canada, 6.80%, 5/15/38 | | | 10 | | | | 11,807 | |
Phillips 66, 5.88%, 5/01/42 | | | 10 | | | | 11,663 | |
Suncor Energy, Inc., 6.50%, 6/15/38 | | | 25 | | | | 29,436 | |
TransCanada PipeLines, Ltd.: | | | | | | | | |
6.20%, 10/15/37 | | | 5 | | | | 5,688 | |
7.63%, 1/15/39 | | | 25 | | | | 32,268 | |
6.10%, 6/01/40 | | | 10 | | | | 11,675 | |
Valero Energy Corp., 6.63%, 6/15/37 | | | 25 | | | | 28,095 | |
| | | | | | | | |
| | | | | 285,304 | |
Pharmaceuticals — 2.2% | |
Abbott Laboratories: | | | | | | | | |
6.00%, 4/01/39 | | | 15 | | | | 18,880 | |
5.30%, 5/27/40 | | | 10 | | | | 11,426 | |
AbbVie, Inc., 4.40%, 11/06/42 | | | 20 | | | | 20,606 | |
AstraZeneca PLC: | | | | | | | | |
6.45%, 9/15/37 | | | 15 | | | | 20,083 | |
4.38%, 11/16/45 | | | 25 | | | | 27,068 | |
Bristol-Myers Squibb Co., 3.25%, 8/01/42 | | | 10 | | | | 9,598 | |
GlaxoSmithKline Capital, Inc., 6.38%, 5/15/38 | | | 25 | | | | 34,498 | |
Merck & Co., Inc., 4.15%, 5/18/43 | | | 15 | | | | 16,511 | |
Pfizer, Inc.: | | | | | | | | |
7.20%, 3/15/39 | | | 60 | | | | 88,529 | |
4.40%, 5/15/44 | | | 5 | | | | 5,687 | |
Teva Pharmaceutical Finance Co. LLC, 6.15%, 2/01/36 | | | 10 | | | | 11,943 | |
| | | | | | | | |
| | | | | 264,829 | |
Road & Rail — 0.4% | |
CSX Corp., 6.22%, 4/30/40 | | | 15 | | | | 19,206 | |
Norfolk Southern Corp., 4.84%, 10/01/41 | | | 30 | | | | 33,438 | |
| | | | | | | | |
| | | | | 52,644 | |
Semiconductors & Semiconductor Equipment — 0.3% | |
Applied Materials, Inc., 5.85%, 6/15/41 | | | 5 | | | | 6,027 | |
Intel Corp., 4.80%, 10/01/41 | | | 25 | | | | 28,312 | |
| | | | | | | | |
| | | | | 34,339 | |
Software — 0.5% | |
Oracle Corp.: | | | | | | | | |
6.13%, 7/08/39 | | | 15 | | | | 19,801 | |
5.38%, 7/15/40 | | | 35 | | | | 42,506 | |
| | | | | | | | |
| | | | | 62,307 | |
Specialty Retail — 0.3% | |
Home Depot, Inc., 5.88%, 12/16/36 | | | 20 | | | | 26,288 | |
Lowe’s Cos., Inc., 6.65%, 9/15/37 | | | 10 | | | | 13,791 | |
| | | | | | | | |
| | | | | 40,079 | |
Technology Hardware, Storage & Peripherals — 0.1% | |
HP, Inc. (fka Hewlett-Packard Co.), 6.00%, 9/15/41 | | | 10 | | | | 9,410 | |
Tobacco — 0.8% | |
Altria Group, Inc., 5.38%, 1/31/44 | | | 25 | | | | 31,027 | |
Philip Morris International, Inc.: | | | | | | | | |
4.88%, 11/15/43 | | | 45 | | | | 52,396 | |
4.25%, 11/10/44 | | | 10 | | | | 10,685 | |
| | | | | | | | |
| | | | | 94,108 | |
| | | | | | | | |
| Corporate Bonds | | Par
(000) | | | Value | |
Wireless Telecommunication Services — 0.8% | |
America Movil SAB de CV, 6.38%, 3/01/35 | | $ | 40 | | | $ | 48,725 | |
Vodafone Group PLC: | | | | | | | | |
6.15%, 2/27/37 | | | 35 | | | | 41,136 | |
4.38%, 2/19/43 | | | 10 | | | | 9,454 | |
| | | | | | | | |
| | | | | 99,315 | |
| Total Corporate Bonds — 38.5% | | | | 4,677,882 | |
| | | | | | | | |
| | | | | | | | | |
| | |
| U.S. Treasury Obligations | | | | | | |
U.S. Treasury Bonds: | | | | | | | | |
6.63%, 2/15/27 | | | 25 | | | | 36,657 | |
5.50%, 8/15/28 | | | 150 | | | | 207,545 | |
6.13%, 8/15/29 | | | 100 | | | | 147,856 | |
5.38%, 2/15/31 | | | 150 | | | | 213,434 | |
4.50%, 2/15/36 | | | 50 | | | | 68,022 | |
4.75%, 2/15/37 | | | 30 | | | | 42,084 | |
4.38%, 2/15/38 | | | 20 | | | | 26,805 | |
4.50%, 5/15/38 | | | 110 | | | | 149,892 | |
3.50%, 2/15/39 | | | 55 | | | | 64,939 | |
4.50%, 8/15/39 | | | 50 | | | | 67,980 | |
4.38%, 11/15/39 | | | 25 | | | | 33,402 | |
4.63%, 2/15/40 | | | 30 | | | | 41,486 | |
3.88%, 8/15/40 | | | 300 | | | | 373,301 | |
4.75%, 2/15/41 | | | 160 | | | | 225,606 | |
4.38%, 5/15/41 | | | 20 | | | | 26,792 | |
2.75%, 8/15/42 | | | 30 | | | | 30,758 | |
2.75%, 11/15/42 | | | 110 | | | | 112,522 | |
3.13%, 2/15/43 | | | 120 | | | | 131,864 | |
2.88%, 5/15/43 | | | 250 | | | | 261,484 | |
3.63%, 8/15/43 | | | 100 | | | | 120,406 | |
3.75%, 11/15/43 | | | 50 | | | | 61,570 | |
3.63%, 2/15/44 | | | 105 | | | | 126,299 | |
3.38%, 5/15/44 | | | 150 | | | | 172,400 | |
3.13%, 8/15/44 | | | 110 | | | | 120,661 | |
3.00%, 11/15/44 | | | 200 | | | | 214,055 | |
3.00%, 5/15/45 | | | 190 | | | | 203,278 | |
2.88%, 8/15/45 | | | 210 | | | | 219,114 | |
2.50%, 2/15/46 | | | 220 | | | | 212,584 | |
U.S. Treasury Principal STRIPS, 0.00%, 5/15/39 (a) | | | 6,375 | | | | 3,502,208 | |
| Total U.S. Treasury Obligations — 59.3% | | | | 7,215,004 | |
Total Long-Term Investments
(Cost — $10,648,866) — 97.8% | | | | 11,892,886 | |
| | | | | | | | |
| | | | | | | | | |
| | |
| Short-Term Securities — 1.7% | | Shares | | | | |
BlackRock Liquidity Funds, TempFund, Institutional Class, 0.40% (b)(c) | | | 202,723 | | | | 202,723 | |
Total Short-Term Securities
(Cost — $202,723) — 1.7% | | | | 202,723 | |
| Total Investments (Cost — $10,851,589) — 99.5% | | | | 12,095,609 | |
| Other Assets Less Liabilities — 0.5% | | | | 61,186 | |
| | | | | | | | |
| Net Assets — 100.0% | | | $ | 12,156,795 | |
| | | | | | | | |
See Notes to Financial Statements.
| | | | | | |
| | | | | | | |
| 30 | | BLACKROCK CORI FUNDS | | APRIL 30, 2016 | | |
| | |
Schedule of Investments (continued) | | BlackRock CoRI 2021 Fund |
|
| Notes to Schedule of Investments |
| (b) | | During the period ended April 30, 2016, investments in issuers considered to be affiliates of the Fund for purposes of Section 2(a)(3) of the Investment Company Act of 1940, as amended, were as follows: |
| | | | | | | | | | | | | | | | | | |
| Affiliate | | Shares Held
at October 31,
2015 | | | Net
Activity | | | Shares Held
at April 30,
2016 | | | Income | | | |
BlackRock Liquidity Funds, TempFund, Institutional Class | | | 150,430 | | | | 52,293 | | | | 202,723 | | | $ | 361 | | | |
| (c) | | Current yield as of period end. |
|
| Derivative Financial Instruments Outstanding as of Period End |
Futures Contracts
| | | | | | | | | | | | | | |
Contracts
Long | | | Issue | | Expiration | | Notional
Value | | Unrealized
Depreciation | | | |
| | 1 | | | U.S. Treasury Long Bond | | June 2016 | | $163,313 | | $ | (1,977 | ) | | |
|
| Derivative Financial Instruments Categorized by Risk Exposure |
As of period end, the fair values of derivative financial instruments located in the Statements of Assets and Liabilities were as follows:
| | | | | | | | | | | | | | | | | | | | | | | | | | | | | | | | |
| Liabilities — Derivative Financial Instruments | | | Commodity
Contracts | | | Credit
Contracts | | | Equity
Contracts | | | Foreign
Currency
Exchange
Contracts | | | Interest
Rate
Contracts | | | Other
Contracts | | | Total | |
Futures contracts | | | Net unrealized depreciation | 1 | | | — | | | | — | | | | — | | | | — | | | $ | 1,977 | | | | — | | | | $1,977 | |
1 Includes cumulative appreciation (depreciation) on futures contracts, if any, as reported in the Schedule of Investments. Only current day’s variation margin is reported within the Statements of Assets and Liabilities. | |
| For the period ended April 30, 2016, the effect of derivative financial instruments in the Statements of Operations was as follows: | |
| Net Realized Gain (Loss) from: | | | Commodity
Contracts | | | Credit
Contracts | | | Equity
Contracts | | | Foreign
Currency
Exchange
Contracts | | | Interest
Rate
Contracts | | | Other
Contracts | | | Total | |
Futures contracts | | | | — | | | | — | | | | — | | | | — | | | $ | 11,410 | | | | — | | | $ | 11,410 | |
| | | | | | | | | | | | | | | | | | | | | | | | | | | | | | | | | |
| Net Change in Unrealized Appreciation (Depreciation) on: | | | | | | | | | | | | | | | | | | | | | | |
Futures contracts | | | | — | | | | — | | | | — | | | | — | | | $ | (1,851 | ) | | | — | | | $ | (1,851 | ) |
|
| Average Quarterly Balances of Outstanding Derivative Financial Instruments |
| | | | |
| Futures contracts: | | | | |
Average notional value of contracts — long | | $ | 162,172 | |
For more information about the Fund’s investment risks regarding derivative financial instruments, refer to the Notes to Financial Statements.
|
| Fair Value Hierarchy as of Period End |
Various inputs are used in determining the fair value of investments and derivative financial instruments. For information about the Fund’s policy regarding valuation of investments and derivative financial instruments, refer to the Notes to Financial Statements.
See Notes to Financial Statements.
| | | | | | |
| | | | | | | |
| | BLACKROCK CORI FUNDS | | APRIL 30, 2016 | | 31 |
| | |
Schedule of Investments (concluded) | | BlackRock CoRI 2021 Fund |
The following tables summarize the Fund’s investments and derivative financial instruments categorized in the disclosure hierarchy:
| | | | | | | | | | | | | | |
| | | Level 1 | | | Level 2 | | | Level 3 | | Total | |
Assets: | | | | | | | | | | | | | | |
| Investments: | | | | | | | | | | | | | | |
Long-Term Investments1 | | | — | | | $ | 11,892,886 | | | — | | $ | 11,892,886 | |
Short-Term Securities | | $ | 202,723 | | | | — | | | — | | | 202,723 | |
| | | | |
Total | | $ | 202,723 | | | $ | 11,892,886 | | | — | | $ | 12,095,609 | |
| | | | |
| | | | | | | | | | | | | | |
| Derivative Financial Instruments2 | | | | | | | | | | | | | | |
Liabilities: | | | | | | | | | | | | | | |
Interest rate contracts | | $ | (1,977 | ) | | | — | | | — | | $ | (1,977 | ) |
1 See above Schedule of Investments for values in each industry. | |
2 Derivative financial instruments are futures contracts. Futures contracts are valued at the unrealized appreciation (depreciation) on the instrument. | |
The Fund may hold assets and/or liabilities in which the fair value approximates the carrying amount for financial statement purposes. As of period end, cash pledged for futures contracts of $4,400 is categorized as Level 1 within the disclosure hierarchy.
During the six months ended April 30, 2016, there were no transfers between levels.
See Notes to Financial Statements.
| | | | | | |
| | | | | | | |
| 32 | | BLACKROCK CORI FUNDS | | APRIL 30, 2016 | | |
| | |
Schedule of Investments April 30, 2016 (Unaudited) | | BlackRock CoRI 2023 Fund (Percentages shown are based on Net Assets) |
| | | | | | | | |
| Corporate Bonds | | Par
(000) | | | Value | |
Aerospace & Defense — 1.3% | |
Honeywell International, Inc., Series 30, 5.38%, 3/01/41 | | $ | 15 | | | $ | 18,813 | |
Lockheed Martin Corp., 4.07%, 12/15/42 | | | 45 | | | | 46,924 | |
Northrop Grumman Corp., 4.75%, 6/01/43 | | | 15 | | | | 17,380 | |
United Technologies Corp., 4.50%, 6/01/42 | | | 75 | | | | 83,532 | |
| | | | | | | | |
| | | | | 166,649 | |
Air Freight & Logistics — 0.5% | |
FedEx Corp.: | | | | | | | | |
4.90%, 1/15/34 | | | 20 | | | | 22,062 | |
5.10%, 1/15/44 | | | 5 | | | | 5,722 | |
4.10%, 2/01/45 | | | 15 | | | | 14,984 | |
United Parcel Service, Inc., 6.20%, 1/15/38 | | | 15 | | | | 20,652 | |
| | | | | | | | |
| | | | | 63,420 | |
Automobiles — 0.5% | |
Daimler Finance North America LLC, 8.50%, 1/18/31 | | | 15 | | | | 23,735 | |
Ford Motor Co., 4.75%, 1/15/43 | | | 40 | | | | 41,583 | |
| | | | | | | | |
| | | | | 65,318 | |
Banks — 1.9% | |
Fifth Third Bancorp, 8.25%, 3/01/38 | | | 10 | | | | 14,365 | |
HSBC Holdings PLC, 6.10%, 1/14/42 | | | 40 | | | | 50,799 | |
Wells Fargo & Co.: | | | | | | | | |
5.38%, 11/02/43 | | | 45 | | | | 51,266 | |
5.61%, 1/15/44 | | | 30 | | | | 35,143 | |
4.65%, 11/04/44 | | | 40 | | | | 41,463 | |
3.90%, 5/01/45 | | | 10 | | | | 9,924 | |
4.90%, 11/17/45 | | | 40 | | | | 43,251 | |
| | | | | | | | |
| | | | | 246,211 | |
Beverages — 0.9% | |
Anheuser-Busch InBev Finance, Inc., 4.63%, 2/01/44 | | | 30 | | | | 33,091 | |
Diageo Investment Corp., 4.25%, 5/11/42 | | | 25 | | | | 26,952 | |
Molson Coors Brewing Co., 5.00%, 5/01/42 | | | 10 | | | | 10,851 | |
PepsiCo, Inc., 4.00%, 3/05/42 | | | 50 | | | | 51,904 | |
| | | | | | | | |
| | | | | 122,798 | |
Biotechnology — 0.4% | |
Amgen, Inc.: | | | | | | | | |
6.90%, 6/01/38 | | | 25 | | | | 33,723 | |
6.40%, 2/01/39 | | | 10 | | | | 12,913 | |
| | | | | | | | |
| | | | | 46,636 | |
Capital Markets — 2.3% | |
Credit Suisse USA, Inc., 7.13%, 7/15/32 | | | 15 | | | | 19,360 | |
Goldman Sachs Group, Inc.: | | | | | | | | |
6.13%, 2/15/33 | | | 10 | | | | 12,245 | |
6.75%, 10/01/37 | | | 95 | | | | 115,166 | |
6.25%, 2/01/41 | | | 25 | | | | 31,834 | |
5.15%, 5/22/45 | | | 35 | | | | 35,988 | |
Morgan Stanley: | | | | | | | | |
6.38%, 7/24/42 | | | 20 | | | | 26,427 | |
4.30%, 1/27/45 | | | 50 | | | | 50,778 | |
| | | | | | | | |
| | | | | 291,798 | |
Chemicals — 0.8% | |
CF Industries, Inc.: | | | | | | | | |
5.15%, 3/15/34 | | | 5 | | | | 4,938 | |
5.38%, 3/15/44 | | | 20 | | | | 19,695 | |
| | | | | | | | |
| Corporate Bonds | | Par
(000) | | | Value | |
Chemicals (continued) | |
Dow Chemical Co., 7.38%, 11/01/29 | | $ | 10 | | | $ | 13,067 | |
E.I. du Pont de Nemours & Co., 4.15%, 2/15/43 | | | 10 | | | | 10,024 | |
Ecolab, Inc., 5.50%, 12/08/41 | | | 10 | | | | 11,858 | |
LYB International Finance BV: | | | | | | | | |
5.25%, 7/15/43 | | | 15 | | | | 16,365 | |
4.88%, 3/15/44 | | | 5 | | | | 5,222 | |
Potash Corp. of Saskatchewan, Inc., 5.88%, 12/01/36 | | | 15 | | | | 18,095 | |
| | | | | | | | |
| | | | | 99,264 | |
Communications Equipment — 0.5% | |
Cisco Systems, Inc., 5.90%, 2/15/39 | | | 45 | | | | 59,521 | |
Consumer Finance — 0.2% | |
American Express Co., 4.05%, 12/03/42 | | | 25 | | | | 25,370 | |
Diversified Financial Services — 4.8% | |
Bank of America Corp.: | | | | | | | | |
5.88%, 2/07/42 | | | 15 | | | | 18,567 | |
5.00%, 1/21/44 | | | 95 | | | | 105,890 | |
4.88%, 4/01/44 | | | 25 | | | | 27,503 | |
Series L, 4.75%, 4/21/45 | | | 5 | | | | 5,003 | |
Citigroup, Inc.: | | | | | | | | |
4.30%, 11/20/26 | | | 20 | | | | 20,472 | |
8.13%, 7/15/39 | | | 35 | | | | 53,661 | |
6.68%, 9/13/43 | | | 20 | | | | 24,770 | |
5.30%, 5/06/44 | | | 30 | | | | 32,088 | |
4.65%, 7/30/45 | | | 15 | | | | 16,041 | |
General Electric Co.: | | | | | | | | |
6.75%, 3/15/32 | | | 45 | | | | 62,199 | |
5.88%, 1/14/38 | | | 50 | | | | 65,921 | |
6.88%, 1/10/39 | | | 15 | | | | 21,953 | |
JPMorgan Chase & Co.: | | | | | | | | |
4.13%, 12/15/26 | | | 20 | | | | 20,872 | |
6.40%, 5/15/38 | | | 35 | | | | 47,304 | |
5.60%, 7/15/41 | | | 20 | | | | 24,811 | |
5.63%, 8/16/43 | | | 35 | | | | 41,121 | |
4.95%, 6/01/45 | | | 25 | | | | 27,038 | |
| | | | | | | | |
| | | | | 615,214 | |
Diversified Telecommunication Services — 5.3% | |
AT&T, Inc.: | | | | | | | | |
6.30%, 1/15/38 | | | 25 | | | | 29,819 | |
6.55%, 2/15/39 | | | 15 | | | | 18,211 | |
5.35%, 9/01/40 | | | 65 | | | | 70,006 | |
6.38%, 3/01/41 | | | 20 | | | | 23,867 | |
5.55%, 8/15/41 | | | 20 | | | | 22,169 | |
5.15%, 3/15/42 | | | 20 | | | | 21,005 | |
Orange SA, 5.38%, 1/13/42 | | | 10 | | | | 12,137 | |
Telefonica Emisiones SAU, 7.05%, 6/20/36 | | | 20 | | | | 25,887 | |
Verizon Communications, Inc.: | | | | | | | | |
6.40%, 9/15/33 | | | 45 | | | | 56,448 | |
4.27%, 1/15/36 | | | 25 | | | | 25,139 | |
6.55%, 9/15/43 | | | 75 | | | | 98,928 | |
4.86%, 8/21/46 | | | 65 | | | | 69,661 | |
4.52%, 9/15/48 | | | 60 | | | | 60,888 | |
5.01%, 8/21/54 | | | 60 | | | | 61,622 | |
4.67%, 3/15/55 | | | 90 | | | | 87,037 | |
| | | | | | | | |
| | | | | 682,824 | |
See Notes to Financial Statements.
| | | | | | |
| | | | | | | |
| | BLACKROCK CORI FUNDS | | APRIL 30, 2016 | | 33 |
| | |
Schedule of Investments (continued) | | BlackRock CoRI 2023 Fund |
| | | | | | | | |
| Corporate Bonds | | Par
(000) | | | Value | |
Electric Utilities — 3.2% | |
Berkshire Hathaway Energy Co.: | | | | | | | | |
6.13%, 4/01/36 | | $ | 50 | | | $ | 64,816 | |
6.50%, 9/15/37 | | | 10 | | | | 13,506 | |
Consolidated Edison Co. of New York, Inc., Series C, 5.50%, 12/01/39 | | | 25 | | | | 30,231 | |
Duke Energy Florida LLC, 6.40%, 6/15/38 | | | 55 | | | | 76,831 | |
Exelon Generation Co. LLC, 6.25%, 10/01/39 | | | 20 | | | | 21,773 | |
Georgia Power Co., 4.30%, 3/15/42 | | | 40 | | | | 43,093 | |
Pacific Gas & Electric Co., 6.05%, 3/01/34 | | | 55 | | | | 73,034 | |
PacifiCorp, 6.00%, 1/15/39 | | | 10 | | | | 12,999 | |
Southern California Edison Co.,
Series A, 5.95%, 2/01/38 | | | 20 | | | | 26,195 | |
Southern Power Co., 5.15%, 9/15/41 | | | 15 | | | | 15,661 | |
Virginia Electric & Power Co., 8.88%, 11/15/38 | | | 20 | | | | 32,426 | |
| | | | | | | | |
| | | | | 410,565 | |
Energy Equipment & Services — 0.9% | |
Baker Hughes, Inc., 5.13%, 9/15/40 | | | 20 | | | | 20,604 | |
Enterprise Products Operating LLC: | | | | | | | | |
6.13%, 10/15/39 | | | 20 | | | | 21,757 | |
5.95%, 2/01/41 | | | 15 | | | | 16,605 | |
5.70%, 2/15/42 | | | 5 | | | | 5,462 | |
Halliburton Co., 7.45%, 9/15/39 | | | 25 | | | | 32,821 | |
| | | | | | | | |
| | | | | 97,249 | |
Food & Staples Retailing — 0.2% | |
CVS Health Corp., 6.13%, 9/15/39 | | | 10 | | | | 12,839 | |
Walgreen Co., 4.40%, 9/15/42 | | | 20 | | | | 19,318 | |
| | | | | | | | |
| | | | | 32,157 | |
Food Products — 0.5% | |
Archer-Daniels-Midland Co., 4.54%, 3/26/42 | | | 20 | | | | 21,899 | |
JM Smucker Co., 4.38%, 3/15/45 | | | 25 | | | | 26,150 | |
Kellogg Co., 4.50%, 4/01/46 | | | 20 | | | | 21,107 | |
| | | | | | | | |
| | | | | 69,156 | |
Health Care Equipment & Supplies — 0.8% | |
Express Scripts Holding Co., 6.13%, 11/15/41 | | | 20 | | | | 22,488 | |
Medtronic, Inc., 4.63%, 3/15/45 | | | 75 | | | | 85,558 | |
| | | | | | | | |
| | | | | 108,046 | |
Health Care Providers & Services — 1.2% | |
Aetna, Inc., 6.63%, 6/15/36 | | | 10 | | | | 12,673 | |
Anthem, Inc.: | | | | | | | | |
4.65%, 1/15/43 | | | 30 | | | | 30,973 | |
5.10%, 1/15/44 | | | 20 | | | | 21,998 | |
UnitedHealth Group, Inc.: | | | | | | | | |
4.63%, 7/15/35 | | | 25 | | | | 28,219 | |
4.75%, 7/15/45 | | | 55 | | | | 63,549 | |
| | | | | | | | |
| | | | | 157,412 | |
Hotels, Restaurants & Leisure — 0.2% | |
McDonald’s Corp., 6.30%, 10/15/37 | | | 20 | | | | 25,877 | |
Household Products — 0.2% | |
Koninklijke Philips NV, 6.88%, 3/11/38 | | | 25 | | | | 31,646 | |
Industrial Conglomerates — 0.3% | |
General Electric Co., 4.50%, 3/11/44 | | | 35 | | | | 39,330 | |
Insurance — 1.9% | |
Allstate Corp., 4.50%, 6/15/43 | | | 20 | | | | 22,220 | |
Arch Capital Group US, Inc., 5.14%, 11/01/43 | | | 10 | | | | 10,419 | |
| | | | | | | | |
| Corporate Bonds | | Par
(000) | | | Value | |
Insurance (continued) | |
AXA SA, 8.60%, 12/15/30 | | $ | 15 | | | $ | 20,104 | |
Chubb Corp., Series 1, 6.50%, 5/15/38 | | | 15 | | | | 20,776 | |
Lincoln National Corp., 7.00%, 6/15/40 | | | 10 | | | | 12,338 | |
MetLife, Inc.: | | | | | | | | |
4.88%, 11/13/43 | | | 45 | | | | 48,850 | |
4.05%, 3/01/45 | | | 15 | | | | 14,368 | |
Principal Financial Group, Inc., 6.05%, 10/15/36 | | | 15 | | | | 17,867 | |
Prudential Financial, Inc.: | | | | | | | | |
6.63%, 12/01/37 | | | 30 | | | | 37,647 | |
6.20%, 11/15/40 | | | 10 | | | | 11,807 | |
Travelers Cos., Inc., 4.60%, 8/01/43 | | | 20 | | | | 22,677 | |
| | | | | | | | |
| | | | | 239,073 | |
Machinery — 0.4% | |
Caterpillar, Inc., 3.80%, 8/15/42 | | | 25 | | | | 24,741 | |
Ingersoll-Rand Global Holding Co. Ltd., 5.75%, 6/15/43 | | | 25 | | | | 30,060 | |
| | | | | | | | |
| | | | | 54,801 | |
Media — 4.7% | |
21st Century Fox America, Inc.: | | | | | | | | |
6.40%, 12/15/35 | | | 50 | | | | 63,026 | |
6.15%, 2/15/41 | | | 15 | | | | 18,536 | |
5.40%, 10/01/43 | | | 30 | | | | 34,629 | |
CBS Corp., 4.60%, 1/15/45 | | | 5 | | | | 4,903 | |
Comcast Corp.: | | | | | | | | |
4.25%, 1/15/33 | | | 35 | | | | 37,830 | |
6.45%, 3/15/37 | | | 30 | | | | 40,391 | |
6.40%, 3/01/40 | | | 25 | | | | 34,461 | |
4.65%, 7/15/42 | | | 35 | | | | 39,497 | |
4.75%, 3/01/44 | | | 25 | | | | 28,939 | |
NBCUniversal Media LLC: | | | | | | | | |
6.40%, 4/30/40 | | | 15 | | | | 20,638 | |
5.95%, 4/01/41 | | | 15 | | | | 19,598 | |
Thomson Reuters Corp., 5.85%, 4/15/40 | | | 10 | | | | 11,095 | |
Time Warner Cable, Inc.: | | | | | | | | |
6.55%, 5/01/37 | | | 30 | | | | 34,524 | |
7.30%, 7/01/38 | | | 20 | | | | 24,587 | |
6.75%, 6/15/39 | | | 10 | | | | 11,839 | |
Time Warner, Inc.: | | | | | | | | |
7.63%, 4/15/31 | | | 25 | | | | 32,889 | |
6.10%, 7/15/40 | | | 55 | | | | 66,542 | |
5.35%, 12/15/43 | | | 25 | | | | 28,002 | |
Viacom, Inc., 4.38%, 3/15/43 | | | 30 | | | | 23,765 | |
Walt Disney Co.: | | | | | | | | |
3.70%, 12/01/42 | | | 15 | | | | 15,303 | |
4.13%, 6/01/44 | | | 15 | | | | 16,297 | |
| | | | | | | | |
| | | | | 607,291 | |
Metals & Mining — 1.1% | |
BHP Billiton Finance USA Ltd., 5.00%, 9/30/43 | | | 45 | | | | 50,260 | |
Newmont Mining Corp., 6.25%, 10/01/39 | | | 15 | | | | 15,678 | |
Rio Tinto Finance USA Ltd., 5.20%, 11/02/40 | | | 25 | | | | 27,284 | |
Southern Copper Corp.: | | | | | | | | |
5.25%, 11/08/42 | | | 25 | | | | 21,538 | |
5.88%, 4/23/45 | | | 35 | | | | 32,086 | |
| | | | | | | | |
| | | | | 146,846 | |
Multiline Retail — 0.4% | |
Target Corp., 4.00%, 7/01/42 | | | 45 | | | | 47,627 | |
See Notes to Financial Statements.
| | | | | | |
| | | | | | | |
| 34 | | BLACKROCK CORI FUNDS | | APRIL 30, 2016 | | |
| | |
Schedule of Investments (continued) | | BlackRock CoRI 2023 Fund |
| | | | | | | | |
| Corporate Bonds | | Par
(000) | | | Value | |
Oil, Gas & Consumable Fuels — 2.7% | |
Anadarko Petroleum Corp., 6.45%, 9/15/36 | | $ | 45 | | | $ | 48,548 | |
Apache Corp., 6.00%, 1/15/37 | | | 15 | | | | 16,198 | |
ConocoPhillips: | | | | | | | | |
5.90%, 5/15/38 | | | 10 | | | | 11,616 | |
6.50%, 2/01/39 | | | 55 | | | | 68,243 | |
ConocoPhillips Holding Co., 6.95%, 4/15/29 | | | 25 | | | | 30,086 | |
Devon Financing Co. LLC, 7.88%, 9/30/31 | | | 25 | | | | 26,766 | |
ONEOK Partners LP, 6.85%, 10/15/37 | | | 10 | | | | 9,617 | |
Petro-Canada, 6.80%, 5/15/38 | | | 25 | | | | 29,516 | |
Phillips 66, 5.88%, 5/01/42 | | | 15 | | | | 17,494 | |
Suncor Energy, Inc., 6.50%, 6/15/38 | | | 20 | | | | 23,549 | |
TransCanada PipeLines, Ltd.: | | | | | | | | |
6.20%, 10/15/37 | | | 15 | | | | 17,065 | |
7.63%, 1/15/39 | | | 15 | | | | 19,361 | |
6.10%, 6/01/40 | | | 15 | | | | 17,512 | |
Valero Energy Corp., 6.63%, 6/15/37 | | | 25 | | | | 28,095 | |
| | | | | | | | |
| | | | | 363,666 | |
Pharmaceuticals — 2.6% | |
Abbott Laboratories, 5.30%, 5/27/40 | | | 10 | | | | 11,426 | |
AbbVie, Inc., 4.40%, 11/06/42 | | | 30 | | | | 30,909 | |
AstraZeneca PLC: | | | | | | | | |
6.45%, 9/15/37 | | | 25 | | | | 33,471 | |
4.00%, 9/18/42 | | | 25 | | | | 25,642 | |
Bristol-Myers Squibb Co., 3.25%, 8/01/42 | | | 10 | | | | 9,598 | |
GlaxoSmithKline Capital, Inc., 6.38%, 5/15/38 | | | 35 | | | | 48,297 | |
Merck & Co., Inc.: | | | | | | | | |
2.80%, 5/18/23 | | | 50 | | | | 52,398 | |
4.15%, 5/18/43 | | | 10 | | | | 11,008 | |
Pfizer, Inc.: | | | | | | | | |
7.20%, 3/15/39 | | | 25 | | | | 36,887 | |
4.30%, 6/15/43 | | | 30 | | | | 33,099 | |
Teva Pharmaceutical Finance Co. LLC, 6.15%, 2/01/36 | | | 10 | | | | 11,943 | |
Wyeth LLC, 5.95%, 4/01/37 | | | 25 | | | | 32,497 | |
| | | | | | | | |
| | | | | 337,175 | |
Real Estate Investment Trusts (REITs) — 0.1% | |
Weyerhaeuser Co., 7.38%, 3/15/32 | | | 10 | | | | 12,448 | |
Road & Rail — 0.4% | |
CSX Corp., 6.22%, 4/30/40 | | | 10 | | | | 12,804 | |
Norfolk Southern Corp., 4.84%, 10/01/41 | | | 35 | | | | 39,011 | |
| | | | | | | | |
| | | | | 51,815 | |
Semiconductors & Semiconductor Equipment — 0.4% | |
Applied Materials, Inc., 5.85%, 6/15/41 | | | 5 | | | | 6,028 | |
Intel Corp., 4.80%, 10/01/41 | | | 35 | | | | 39,636 | |
| | | | | | | | |
| | | | | 45,664 | |
Software — 0.6% | |
Oracle Corp.: | | | | | | | | |
6.13%, 7/08/39 | | | 15 | | | | 19,801 | |
5.38%, 7/15/40 | | | 50 | | | | 60,723 | |
| | | | | | | | |
| | | | | 80,524 | |
Specialty Retail — 0.4% | |
Home Depot, Inc., 5.88%, 12/16/36 | | | 25 | | | | 32,861 | |
Lowe’s Cos., Inc., 6.65%, 9/15/37 | | | 10 | | | | 13,791 | |
| | | | | | | | |
| | | | | 46,652 | |
Technology Hardware, Storage & Peripherals — 0.1% | |
HP, Inc. (fka Hewlett-Packard Co.), 6.00%, 9/15/41 | | | 10 | | | | 9,410 | |
| | | | | | | | |
| Corporate Bonds | | Par
(000) | | | Value | |
Tobacco — 1.0% | |
Altria Group, Inc.: | | | | | | | | |
4.25%, 8/09/42 | | $ | 15 | | | $ | 15,798 | |
5.38%, 1/31/44 | | | 25 | | | | 31,027 | |
Philip Morris International, Inc.: | | | | | | | | |
6.38%, 5/16/38 | | | 25 | | | | 33,708 | |
4.88%, 11/15/43 | | | 20 | | | | 23,287 | |
4.25%, 11/10/44 | | | 20 | | | | 21,370 | |
| | | | | | | | |
| | | | | 125,190 | |
Wireless Telecommunication Services — 0.8% | |
America Movil SAB de CV, 6.38%, 3/01/35 | | | 45 | | | | 54,816 | |
Vodafone Group PLC: | | | | | | | | |
6.15%, 2/27/37 | | | 20 | | | | 23,506 | |
4.38%, 2/19/43 | | | 30 | | | | 28,361 | |
| | | | | | | | |
| | | | | 106,683 | |
| Total Corporate Bonds — 44.5% | | | | 5,731,326 | |
| | | | | | | | |
| | | | | | | | | |
| | |
| U.S. Treasury Obligations | | | | | | |
U.S. Treasury Bonds: | | | | | | | | |
6.13%, 8/15/29 | | | 40 | | | | 59,142 | |
6.25%, 5/15/30 | | | 15 | | | | 22,728 | |
5.38%, 2/15/31 | | | 300 | | | | 426,867 | |
4.50%, 2/15/36 | | | 120 | | | | 163,252 | |
4.50%, 5/15/38 | | | 20 | | | | 27,253 | |
3.50%, 2/15/39 | | | 65 | | | | 76,746 | |
4.25%, 5/15/39 | | | 20 | | | | 26,263 | |
3.88%, 8/15/40 | | | 50 | | | | 62,217 | |
4.25%, 11/15/40 | | | 70 | | | | 92,001 | |
4.38%, 5/15/41 | | | 75 | | | | 100,471 | |
2.75%, 8/15/42 | | | 30 | | | | 30,758 | |
2.75%, 11/15/42 | | | 50 | | | | 51,146 | |
3.13%, 2/15/43 | | | 20 | | | | 21,977 | |
2.88%, 5/15/43 | | | 130 | | | | 135,972 | |
3.63%, 8/15/43 | | | 50 | | | | 60,203 | |
3.75%, 11/15/43 | | | 40 | | | | 49,256 | |
3.63%, 2/15/44 | | | 50 | | | | 60,143 | |
3.38%, 5/15/44 | | | 50 | | | | 57,467 | |
3.13%, 8/15/44 | | | 70 | | | | 76,784 | |
2.50%, 2/15/45 | | | 20 | | | | 19,322 | |
3.00%, 5/15/45 | | | 50 | | | | 53,494 | |
2.88%, 8/15/45 | | | 150 | | | | 156,510 | |
3.00%, 11/15/45 | | | 210 | | | | 224,716 | |
U.S. Treasury Principal STRIPS, 0.00%, 2/15/43 (a) | | | 10,265 | | | | 4,911,710 | |
| Total U.S. Treasury Obligations — 54.1% | | | | 6,966,398 | |
Total Long-Term Investments
(Cost — $11,125,113) — 98.6% | | | | 12,697,724 | |
| | | | | | | | |
| | | | | | | | | |
| | |
| Short-Term Securities — 1.3% | | Shares | | | | |
BlackRock Liquidity Funds, TempFund, Institutional Class, 0.40% (b)(c) | | | 164,611 | | | | 164,611 | |
Total Short-Term Securities
(Cost — $164,611) — 1.3% | | | | 164,611 | |
Total Investments
(Cost — $11,289,724) — 99.9% | | | | 12,862,335 | |
| Other Assets Less Liabilities — 0.1% | | | | 12,254 | |
| | | | | | | | |
| Net Assets — 100.0% | | | $ | 12,874,589 | |
| | | | | | | | |
See Notes to Financial Statements.
| | | | | | |
| | | | | | | |
| | BLACKROCK CORI FUNDS | | APRIL 30, 2016 | | 35 |
| | |
Schedule of Investments (continued) | | BlackRock CoRI 2023 Fund |
|
| Notes to Schedule of Investments |
| (b) | | During the period ended April 30, 2016, investments in issuers considered to be affiliates of the Fund for purposes of Section 2(a)(3) of the Investment Company Act of 1940, as amended, were as follows: |
| | | | | | | | | | | | | | | | | | |
| Affiliate | | Shares Held
at October 31,
2015 | | | Net
Activity | | | Shares Held
at April 30,
2016 | | | Income | | | |
BlackRock Liquidity Funds, TempFund, Institutional Class | | | 129,167 | | | | 35,444 | | | | 164,611 | | | $ | 260 | | | |
| (c) | | Current yield as of period end. |
|
| Derivative Financial Instruments Outstanding as of Period End |
Futures Contracts
| | | | | | | | | | | | | | |
Contracts
Long | | | Issue | | Expiration | | Notional
Value | | Unrealized
Depreciation | | | |
| | 1 | | | U.S. Treasury Long Bond | | June 2016 | | $163,313 | | $ | (1,977 | ) | | |
|
| Derivative Financial Instruments Categorized by Risk Exposure |
As of period end, the fair values of derivative financial instruments located in the Statements of Assets and Liabilities were as follows:
| | | | | | | | | | | | | | | | | | | | | | | | | | | | | | | | |
| Liabilities — Derivative Financial Instruments | | | Commodity
Contracts | | | Credit
Contracts | | | Equity
Contracts | | | Foreign
Currency
Exchange
Contracts | | | Interest
Rate
Contracts | | | Other
Contracts | | | Total | |
Futures contracts | | | Net unrealized depreciation | 1 | | | — | | | | — | | | | — | | | | — | | | $ | 1,977 | | | | — | | | $ | 1,977 | |
1 Includes cumulative appreciation (depreciation) on futures contracts, if any, as reported in the Schedule of Investments. Only current day’s variation margin is reported within the Statements of Assets and Liabilities. | |
| For the year ended April 30, 2016, the effect of derivative financial instruments in the Statements of Operations was as follows: | |
| | | | | | | | | | | | | | | | | | | | | | | | | | | | |
| Net Realized Gain (Loss) from: | | Commodity
Contracts | | | Credit
Contracts | | | Equity
Contracts | | | Foreign
Currency
Exchange
Contracts | | | Interest
Rate
Contracts | | | Other
Contracts | | | Total | |
Futures contracts | | | — | | | | — | | | | — | | | | — | | | $ | 11,410 | | | | — | | | $ | 11,410 | |
| | | | | | |
| Net Change in Unrealized Appreciation (Depreciation) on: | | | | | | | | | | | | | | | | | | | |
Futures contracts | | | — | | | | — | | | | — | | | | — | | | $ | (1,851 | ) | | | — | | | $ | (1,851 | ) |
|
| Average Quarterly Balances of Outstanding Derivative Financial Instruments |
| | | | |
Futures contracts: | | | | |
Average notional value of contracts — long | | $ | 162,172 | |
For more information about the Fund’s investment risks regarding derivative financial instruments, refer to the Notes to Financial Statements.
|
| Fair Value Hierarchy as of Period End |
Various inputs are used in determining the fair value of investments and derivative financial instruments. For information about the Fund’s policy regarding valuation of investments and derivative financial instruments, refer to the Notes to Financial Statements.
See Notes to Financial Statements.
| | | | | | |
| | | | | | | |
| 36 | | BLACKROCK CORI FUNDS | | APRIL 30, 2016 | | |
| | |
Schedule of Investments (concluded) | | BlackRock CoRI 2023 Fund |
The following tables summarize the Fund’s investments and derivative financial instruments categorized in the disclosure hierarchy:
| | | | | | | | | | | | | | | | |
| | | Level 1 | | | Level 2 | | | Level 3 | | | Total | |
Assets: | | | | | | | | | | | | | | | | |
| Investments: | | | | | | | | | | | | | | | | |
Long-Term Investments1 | | | — | | | $ | 12,697,724 | | | | — | | | $ | 12,697,724 | |
Short-Term Securities | | $ | 164,611 | | | | — | | | | — | | | | 164,611 | |
| | | | |
Total | | $ | 164,611 | | | $ | 12,697,724 | | | | — | | | $ | 12,862,335 | |
| | | | |
| | | | | | | | | | | | | | | | |
| Derivative Financial Instruments2 | | | | | | | | | |
Liabilities: | | | | | | | | | | | | | | | | |
Interest Rate contracts | | $ | (1,977 | ) | | | — | | | | — | | | $ | (1,977 | ) |
1 See above Schedule of Investments for values in each industry. | |
2 Derivative financial instruments are futures contracts. Futures contracts are valued at the unrealized appreciation (depreciation) on the instrument. | |
The Fund may hold assets and/or liabilities in which the fair value approximates the carrying amount for financial statement purposes. As of period end, cash pledged for futures contracts of $4,400 is categorized as Level 1 within the disclosure hierarchy.
For the six months ended April 30, 2016, there were no transfers between levels.
See Notes to Financial Statements.
| | | | | | |
| | | | | | | |
| | BLACKROCK CORI FUNDS | | APRIL 30, 2016 | | 37 |
| | |
| Statements of Assets and Liabilities | | |
| | | | | | | | | | | | | | | | | | | | |
| April 30, 2016 (Unaudited) | | BlackRock
CoRI
2015 Fund | | | BlackRock
CoRI
2017 Fund | | | BlackRock
CoRI
2019 Fund | | | BlackRock
CoRI
2021 Fund | | | BlackRock
CoRI
2023 Fund | |
| | | | | | | | | | | | | | | | | | | | |
| Assets | | | | | | | | | | | | | | | | | | | | |
Investments at value — unaffiliated1 | | $ | 11,599,877 | | | $ | 11,444,666 | | | $ | 12,328,005 | | | $ | 11,892,886 | | | $ | 12,697,724 | |
Investments at value — affiliated2 | | | 139,087 | | | | 177,716 | | | | 112,906 | | | | 202,723 | | | | 164,611 | |
Cash pledged for futures contracts | | | 4,400 | | | | 4,400 | | | | 4,400 | | | | 4,400 | | | | 4,400 | |
Receivables: | | | | | | | | | | | | | | | | | | | | |
Interest — unaffiliated | | | 63,602 | | | | 87,685 | | | | 95,705 | | | | 89,305 | | | | 89,957 | |
Investment advisor | | | 21,615 | | | | 21,372 | | | | 20,671 | | | | 20,280 | | | | 21,063 | |
Investments sold | | | — | | | | — | | | | — | | | | 579,902 | | | | 52,712 | |
Variation margin on futures contracts | | | 563 | | | | 563 | | | | 563 | | | | 563 | | | | 563 | |
Dividends — affiliated | | | 53 | | | | 82 | | | | 51 | | | | 77 | | | | 62 | |
Capital shares sold | | | — | | | | — | | | | — | | | | 100 | | | | — | |
Prepaid expenses | | | 17,631 | | | | 17,631 | | | | 17,634 | | | | 17,632 | | | | 18,593 | |
| | | | |
Total assets | | | 11,846,828 | | | | 11,754,115 | | | | 12,579,935 | | | | 12,807,868 | | | | 13,049,685 | |
| | | | |
| | | | | | | | | | | | | | | | | | | | |
| Liabilities | | | | | | | | | | | | | | | | | | | | |
Payables: | | | | | | | | | | | | | | | | | | | | |
Investments purchased | | | 47,519 | | | | 25,428 | | | | 39,544 | | | | 595,566 | | | | 119,185 | |
Officer’s and Trustees’ fees | | | 556 | | | | 552 | | | | 538 | | | | 540 | | | | 538 | |
Service fees | | | 65 | | | | 71 | | | | 184 | | | | 278 | | | | 184 | |
Other accrued expenses | | | 58,469 | | | | 58,305 | | | | 55,425 | | | | 54,689 | | | | 55,189 | |
| | | | |
Total liabilities | | | 106,609 | | | | 84,356 | | | | 95,691 | | | | 651,073 | | | | 175,096 | |
| | | | |
Net Assets | | $ | 11,740,219 | | | $ | 11,669,759 | | | $ | 12,484,244 | | | $ | 12,156,795 | | | $ | 12,874,589 | |
| | | | |
| | | | | | | | | | | | | | | | | | | | |
| Net Assets Consist of | | | | | | | | | | | | | | | | | | | | |
Paid-in capital | | $ | 10,466,836 | | | $ | 10,382,310 | | | $ | 10,982,701 | | | $ | 10,590,714 | | | $ | 11,214,305 | |
Undistributed net investment income | | | 111,056 | | | | 111,863 | | | | 121,282 | | | | 128,205 | | | | 135,439 | |
Accumulated net realized gain (loss) | | | 4,293 | | | | 28,307 | | | | 35,868 | | | | 195,833 | | | | (45,789 | ) |
Net unrealized appreciation (depreciation) | | | 1,158,034 | | | | 1,147,279 | | | | 1,344,393 | | | | 1,242,043 | | | | 1,570,634 | |
| | | | |
Net Assets | | $ | 11,740,219 | | | $ | 11,669,759 | | | $ | 12,484,244 | | | $ | 12,156,795 | | | $ | 12,874,589 | |
| | | | |
1 Investments at cost — unaffiliated | | $ | 10,439,866 | | | $ | 10,295,410 | | | $ | 10,981,635 | | | $ | 10,648,866 | | | $ | 11,125,113 | |
| | | | |
2 Investments at cost — affiliated | | $ | 139,087 | | | $ | 177,716 | | | $ | 112,906 | | | $ | 202,723 | | | $ | 164,611 | |
| | | | |
| | | | | | | | | | | | | | | | | | | | |
| Net Asset Value | | | | | | | | | | | | | | | | | | | | |
Institutional: | | | | | | | | | | | | | | | | | | | | |
Net assets | | $ | 11,429,676 | | | $ | 11,246,692 | | | $ | 11,521,561 | | | $ | 11,505,788 | | | $ | 12,016,569 | |
| | | | |
Shares outstanding3 | | | 1,016,156 | | | | 998,000 | | | | 1,008,151 | | | | 998,339 | | | | 1,011,671 | |
| | | | |
Net asset value | | $ | 11.25 | | | $ | 11.27 | | | $ | 11.43 | | | $ | 11.52 | | | $ | 11.88 | |
| | | | |
Investor A: | | | | | | | | | | | | | | | | | | | | |
Net assets | | $ | 310,543 | | | $ | 423,067 | | | $ | 962,683 | | | $ | 651,007 | | | $ | 858,020 | |
| | | | |
Shares outstanding3 | | | 27,677 | | | | 37,645 | | | | 84,306 | | | | 56,628 | | | | 72,421 | |
| | | | |
Net asset value | | $ | 11.22 | | | $ | 11.24 | | | $ | 11.42 | | | $ | 11.50 | | | $ | 11.85 | |
| | | | |
3 Unlimited number of shares authorized, no par value. | |
| | | | | | |
| See Notes to Financial Statements. | | | | |
| | | | | | | |
| 38 | | BLACKROCK CORI FUNDS | | APRIL 30, 2016 | | |
| | | | | | | | | | | | | | | | | | | | |
| Six Months Ended April 30, 2016 (Unaudited) | | BlackRock
CoRI
2015 Fund | | | BlackRock
CoRI
2017 Fund | | | BlackRock
CoRI
2019 Fund | | | BlackRock
CoRI
2021 Fund | | | BlackRock
CoRI
2023 Fund | |
| | | | | | | | | | | | | | | | | | | | |
| Investment Income | | | | | | | | | | | | | | | | | | | | |
Interest | | $ | 184,479 | | | $ | 185,314 | | | $ | 205,822 | | | $ | 215,149 | | | $ | 241,153 | |
Dividend — affiliated | | | 245 | | | | 342 | | | | 225 | | | | 361 | | | | 260 | |
| | | | |
Total income | | | 184,724 | | | | 185,656 | | | | 206,047 | | | | 215,510 | | | | 241,413 | |
| | | | |
| | | | | | | | | | | | | | | | | | | | |
| Expenses | | | | | | | | | | | | | | | | | | | | |
Professional | | | 35,490 | | | | 35,037 | | | | 35,219 | | | | 35,218 | | | | 35,308 | |
Investment advisory | | | 16,795 | | | | 16,733 | | | | 17,870 | | | | 17,902 | | | | 19,460 | |
Pricing | | | 15,737 | | | | 15,280 | | | | 13,917 | | | | 13,460 | | | | 14,099 | |
Registration | | | 13,905 | | | | 13,905 | | | | 13,905 | | | | 13,905 | | | | 14,529 | |
Printing | | | 4,368 | | | | 4,368 | | | | 4,368 | | | | 4,368 | | | | 4,461 | |
Accounting services | | | 3,640 | | | | 3,640 | | | | 3,640 | | | | 3,640 | | | | 3,822 | |
Officer and Trustees | | | 3,276 | | | | 3,276 | | | | 3,276 | | | | 3,275 | | | | 3,276 | |
Administration | | | 2,799 | | | | 2,789 | | | | 2,978 | | | | 2,984 | | | | 3,243 | |
Custodian | | | 1,727 | | | | 1,727 | | | | 1,816 | | | | 1,820 | | | | 2,002 | |
Service — class specific | | | 312 | | | | 314 | | | | 964 | | | | 1,068 | | | | 1,882 | |
Transfer agent — class specific | | | 183 | | | | 186 | | | | 365 | | | | 337 | | | | 1,088 | |
Miscellaneous | | | 27 | | | | 29 | | | | 32 | | | | 29 | | | | 35 | |
| | | | |
Total expenses excluding excise tax | | | 98,259 | | | | 97,284 | | | | 98,350 | | | | 98,006 | | | | 103,205 | |
Excise tax | | | 325 | | | | 325 | | | | 325 | | | | 325 | | | | 325 | |
| | | | |
Total expenses | | | 98,584 | | | | 97,609 | | | | 98,675 | | | | 98,331 | | | | 103,530 | |
| Less: | | | | | | | | | | | | | | | | | | | | |
Other expenses reimbursed | | | (64,286 | ) | | | (63,435 | ) | | | (61,398 | ) | | | (60,915 | ) | | | (61,448 | ) |
Fees waived by the Manager | | | (16,795 | ) | | | (16,733 | ) | | | (17,870 | ) | | | (17,902 | ) | | | (19,460 | ) |
Fees waived by the Administrator | | | (2,687 | ) | | | (2,670 | ) | | | (2,860 | ) | | | (2,866 | ) | | | (3,111 | ) |
Transfer agent fees waived and/or reimbursed — class specific | | | (183 | ) | | | (186 | ) | | | (365 | ) | | | (337 | ) | | | (1,088 | ) |
| | | | |
Total expenses after fees waived and/or reimbursed | | | 14,633 | | | | 14,585 | | | | 16,182 | | | | 16,311 | | | | 18,423 | |
| | | | |
Net investment income | | | 170,091 | | | | 171,071 | | | | 189,865 | | | | 199,199 | | | | 222,990 | |
| | | | |
| | | | | | | | | | | | | | | | | | | | |
| Realized and Unrealized Gain (Loss) | | | | | | | | | | | | | | | | | | | | |
| Net realized gain (loss) from: | | | | | | | | | | | | | | | | | | | | |
Investments | | | (6,315 | ) | | | 16,929 | | | | 27,670 | | | | 185,058 | | | | (13,625 | ) |
Futures contracts | | | 11,410 | | | | 11,410 | | | | 11,410 | | | | 11,410 | | | | 11,410 | |
| | | | |
| | | 5,095 | | | | 28,339 | | | | 39,080 | | | | 196,468 | | | | (2,215 | ) |
| | | | |
| Net change in unrealized appreciation (depreciation) on: | | | | | | | | | | | | | | | | | | | | |
Investments | | | 499,489 | | | | 484,098 | | | | 557,790 | | | | 495,056 | | | | 720,093 | |
Futures contracts | | | (1,851 | ) | | | (1,851 | ) | | | (1,851 | ) | | | (1,851 | ) | | | (1,851 | ) |
| | | | |
| | | 497,638 | | | | 482,247 | | | | 555,939 | | | | 493,205 | | | | 718,242 | |
| | | | |
Net realized and unrealized gain | | | 502,733 | | | | 510,586 | | | | 595,019 | | | | 689,673 | | | | 716,027 | |
| | | | |
Net Increase in Net Assets Resulting from Operations | | $ | 672,824 | | | $ | 681,657 | | | $ | 784,884 | | | $ | 888,872 | | | $ | 939,017 | |
| | | | |
| | | | | | |
| See Notes to Financial Statements. | | | | |
| | | | | | | |
| | BLACKROCK CORI FUNDS | | APRIL 30, 2016 | | 39 |
| | |
| Statements of Changes in Net Assets | | |
| | | | | | | | | | | | | | | | | | |
| | | BlackRock CoRI 2015 Fund | | | | | BlackRock CoRI 2017 Fund | |
| Increase (Decrease) in Net Assets: | | Six Months Ended
April 30,
2016
(Unaudited) | | | Year Ended
October 31,
2015 | | | | | Six Months Ended
April 30,
2016
(Unaudited) | | | Year Ended
October 31, 2015 | |
| | | | | | | | | | | | | | | | | | |
| Operations | | | | | | | | | | | | | | | | | | |
Net investment income | | $ | 170,091 | | | $ | 326,617 | | | | | $ | 171,071 | | | $ | 345,002 | |
Net realized gain | | | 5,095 | | | | 184,701 | | | | | | 28,339 | | | | 282,138 | |
Net change in unrealized appreciation (depreciation) | | | 497,638 | | | | (23,661 | ) | | | | | 482,247 | | | | (157,056 | ) |
| | | | | | | | | | |
Net increase in net assets resulting from operations | | | 672,824 | | | | 487,657 | | | | | | 681,657 | | | | 470,084 | |
| | | | | | | | | | |
| | | | | | | | | | | | | | | | | | |
| Distributions to Shareholders1 | | | | | | | | | | | | | | | | | | |
| From net investment income: | | | | | | | | | | | | | | | | | | |
Institutional | | | (309,101 | ) | | | (323,644 | ) | | | | | (323,370 | ) | | | (340,114 | ) |
Investor A | | | (5,900 | ) | | | (1,914 | ) | | | | | (6,631 | ) | | | (5,064 | ) |
| From net realized gain: | | | | | | | | | | | | | | | | | | |
Institutional | | | (179,456 | ) | | | (40,729 | ) | | | | | (273,980 | ) | | | (56,890 | ) |
Investor A | | | (3,643 | ) | | | (254 | ) | | | | | (6,016 | ) | | | (869 | ) |
| | | | | | | | | | |
Decrease in net assets resulting from distributions to shareholders | | | (498,100 | ) | | | (366,541 | ) | | | | | (609,997 | ) | | | (402,937 | ) |
| | | | | | | | | | |
| | | | | | | | | | | | | | | | | | |
| Capital Share Transactions | | | | | | | | | | | | | | | | | | |
Net increase in net assets derived from capital share transactions | | | 262,590 | | | | 171,996 | | | | | | 268,509 | | | | 47,368 | |
| | | | | | | | | | |
| | | | | | | | | | | | | | | | | | |
| Net Assets | | | | | | | | | | | | | | | | | | |
Total increase in net assets | | | 437,314 | | | | 293,112 | | | | | | 340,169 | | | | 114,515 | |
Beginning of period | | | 11,302,905 | | | | 11,009,793 | | | | | | 11,329,590 | | | | 11,215,075 | |
| | | | | | | | | | |
End of period | | $ | 11,740,219 | | | $ | 11,302,905 | | | | | $ | 11,669,759 | | | $ | 11,329,590 | |
| | | | | | | | | | |
Undistributed net investment income, end of period | | $ | 111,056 | | | $ | 255,966 | | | | | $ | 111,863 | | | $ | 270,793 | |
| | | | | | | | | | |
1 Distributions for annual periods determined in accordance with federal income tax regulations. | | | | | | | | | | | |
| | | | | | |
| See Notes to Financial Statements. | | | | |
| | | | | | | |
| 40 | | BLACKROCK CORI FUNDS | | APRIL 30, 2016 | | |
| | |
| Statements of Changes in Net Assets | | |
| | | | | | | | | | | | | | | | | | |
| | | BlackRock CoRI 2019 Fund | | | | | BlackRock CoRI 2021 Fund | |
| Increase (Decrease) in Net Assets: | | Six Months Ended
April 30,
2016
(Unaudited) | | | Year Ended
October 31, 2015 | | | | | Six Months Ended
April 30,
2016
(Unaudited) | | | Year Ended
October 31,
2015 | |
| | | | | | | | | | | | | | | | | | |
| Operations | | | | | | | | | | | | | | | | | | |
Net investment income | | $ | 189,865 | | | $ | 370,137 | | | | | $ | 199,199 | | | $ | 382,931 | |
Net realized gain | | | 39,080 | | | | 294,835 | | | | | | 196,468 | | | | 355,354 | |
Net change in unrealized appreciation (depreciation) | | | 555,939 | | | | (140,459 | ) | | | | | 493,205 | | | | (282,115 | ) |
| | | | | | | | | | |
Net increase in net assets resulting from operations | | | 784,884 | | | | 524,513 | | | | | | 888,872 | | | | 456,170 | |
| | | | | | | | | | |
| | | | | | | | | | | | | | | | | | |
| Distributions to Shareholders1 | | | | | | | | | | | | | | | | | | |
| From net investment income: | | | | | | | | | | | | | | | | | | |
Institutional | | | (338,819 | ) | | | (366,679 | ) | | | | | (356,441 | ) | | | (368,625 | ) |
Investor A | | | (21,182 | ) | | | (6,462 | ) | | | | | (18,559 | ) | | | (4,427 | ) |
| From net realized gain: | | | | | | | | | | | | | | | | | | |
Institutional | | | (276,666 | ) | | | (143,279 | ) | | | | | (335,443 | ) | | | (107,191 | ) |
Investor A | | | (18,151 | ) | | | (2,782 | ) | | | | | (18,320 | ) | | | (1,330 | ) |
| | | | | | | | | | |
Decrease in net assets resulting from distributions to shareholders | | | (654,818 | ) | | | (519,202 | ) | | | | | (728,763 | ) | | | (481,573 | ) |
| | | | | | | | | | |
| | | | | | | | | | | | | | | | | | |
| Capital Share Transactions | | | | | | | | | | | | | | | | | | |
Net increase in net assets derived from capital share transactions | | | 235,721 | | | | 436,887 | | | | | | 90,264 | | | | 429,245 | |
| | | | | | | | | | |
| | | | | | | | | | | | | | | | | | |
| Net Assets | | | | | | | | | | | | | | | | | | |
Total increase in net assets | | | 365,787 | | | | 442,198 | | | | | | 250,373 | | | | 403,842 | |
Beginning of period | | | 12,118,457 | | | | 11,676,259 | | | | | | 11,906,422 | | | | 11,502,580 | |
| | | | | | | | | | |
End of period | | $ | 12,484,244 | | | $ | 12,118,457 | | | | | $ | 12,156,795 | | | $ | 11,906,422 | |
| | | | | | | | | | |
Undistributed net investment income, end of period | | $ | 121,282 | | | $ | 291,418 | | | | | $ | 128,205 | | | $ | 304,006 | |
| | | | | | | | | | |
1 Distributions for annual periods determined in accordance with federal income tax regulations. | | | | | | | | | | | |
| | | | | | |
| See Notes to Financial Statements. | | | | |
| | | | | | | |
| | BLACKROCK CORI FUNDS | | APRIL 30, 2016 | | 41 |
| | |
| Statements of Changes in Net Assets | | |
| | | | | | | | |
| | | BlackRock CoRI 2023 Fund | |
| Increase (Decrease) in Net Assets: | | Six Months Ended
April 30,
2016
(Unaudited) | | | Year Ended
October 31,
2015 | |
| | | | | | | | |
| Operations | | | | | | | | |
Net investment income | | $ | 222,990 | | | $ | 452,546 | |
Net realized gain (loss) | | | (2,215 | ) | | | 180,965 | |
Net change in unrealized appreciation (depreciation) | | | 718,242 | | | | (335,338 | ) |
| | | | |
Net increase in net assets resulting from operations | | | 939,017 | | | | 298,173 | |
| | | | |
| | | | | | | | |
| Distributions to Shareholders1 | | | | | | | | |
| From net investment income: | | | | | | | | |
Institutional | | | (374,962 | ) | | | (376,328 | ) |
Investor A | | | (85,039 | ) | | | (10,456 | ) |
| From net realized gain: | | | | | | | | |
Institutional | | | (177,677 | ) | | | (97,482 | ) |
Investor A | | | (43,210 | ) | | | (2,788 | ) |
| | | | |
Decrease in net assets resulting from distributions to shareholders | | | (680,888 | ) | | | (487,054 | ) |
| | | | |
| | | | | | | | |
| Capital Share Transactions | | | | | | | | |
Net increase (decrease) in net assets derived from capital share transactions | | | (2,537,164 | ) | | | 3,493,090 | |
| | | | |
| | | | | | | | |
| Net Assets | | | | | | | | |
Total increase (decrease) in net assets | | | (2,279,035 | ) | | | 3,304,209 | |
Beginning of period | | | 15,153,624 | | | | 11,849,415 | |
| | | | |
End of period | | $ | 12,874,589 | | | $ | 15,153,624 | |
| | | | |
Undistributed net investment income, end of period | | $ | 135,439 | | | $ | 372,450 | |
| | | | |
1 Distributions for annual periods determined in accordance with federal income tax regulations. | | | | | | | | |
| | | | | | |
| See Notes to Financial Statements. | | | | |
| | | | | | | |
| 42 | | BLACKROCK CORI FUNDS | | APRIL 30, 2016 | | |
| | |
| Financial Highlights | | BlackRock CoRI 2015 Fund |
| | | | | | | | | | | | | | | | | | | | | | | | | | |
| | | Institutional | | | | | Investor A | |
| | | Six Months Ended
April 30,
2016
(Unaudited) | | | Year Ended
October 31,
2015 | | | January 31,
20141
to October 31,
2014 | | | | | Six Months Ended
April 30,
2016
(Unaudited) | | | Year Ended
October 31,
2015 | | | January 31,
20141
to October 31,
2014 | |
| | | | | | | | | | | | | | | | | | | | | | | | | | |
| Per Share Operating Performance | | | | | | | | | | | | | | | | | | | | | | | | | | |
Net asset value, beginning of period | | $ | 11.08 | | | $ | 10.96 | | | $ | 10.00 | | | | | $ | 11.05 | | | $ | 10.94 | | | $ | 10.00 | |
| | | | | | | | | | |
Net investment income2 | | | 0.17 | | | | 0.32 | | | | 0.24 | | | | | | 0.15 | | | | 0.30 | | | | 0.22 | |
Net realized and unrealized gain | | | 0.49 | | | | 0.16 | | | | 0.72 | | | | | | 0.49 | | | | 0.16 | | | | 0.72 | |
| | | | | | | | | | |
Net increase from investment operations | | | 0.66 | | | | 0.48 | | | | 0.96 | | | | | | 0.64 | | | | 0.46 | | | | 0.94 | |
| | | | | | | | | | |
| Distributions:3 | | | | | | | | | | | | | | | | | | | | | | | | | | |
From net investment income | | | (0.31 | ) | | | (0.32 | ) | | | — | | | | | | (0.29 | ) | | | (0.31 | ) | | | — | |
From net realized gain | | | (0.18 | ) | | | (0.04 | ) | | | — | | | | | | (0.18 | ) | | | (0.04 | ) | | | — | |
| | | | | | | | | | |
Total distributions | | | (0.49 | ) | | | (0.36 | ) | | | — | | | | | | (0.47 | ) | | | (0.35 | ) | | | — | |
| | | | | | | | | | |
Net asset value, end of period | | $ | 11.25 | | | $ | 11.08 | | | $ | 10.96 | | | | | $ | 11.22 | | | $ | 11.05 | | | $ | 10.94 | |
| | | | | | | | | | |
| | | | | | | | | | | | | | | | | | | | | | | | | | |
| Total Return4 | | | | | | | | | | | | | | | | | | | | | | | | | | |
Based on net asset value | | | 6.25% | 5 | | | 4.45% | | | | 9.60% | 5 | | | | | 6.09% | 5 | | | 4.22% | | | | 9.40% | 5 |
| | | | | | | | | | |
| | | | | | | | | | | | | | | | | | | | | | | | | | |
| Ratios to Average Net Assets | | | | | | | | | | | | | | | | | | | | | | | | | | |
Total expenses | | | 1.75% | 6 | | | 2.02% | | | | 2.64% | 6,7 | | | | | 2.13% | 6 | | | 2.39% | | | | 3.12% | 6,7 |
| | | | | | | | | | |
Total expenses after fees waived and/or reimbursed and excluding excise tax | | | 0.25% | 6 | | | 0.25% | | | | 0.25% | 6 | | | | | 0.50% | 6 | | | 0.50% | | | | 0.50% | 6 |
| | | | | | | | | | |
Net investment income | | | 3.04% | 6 | | | 2.93% | | | | 3.08% | 6 | | | | | 2.79% | 6 | | | 2.70% | | | | 2.80% | 6 |
| | | | | | | | | | |
| | | | | | | | | | | | | | | | | | | | | | | | | | |
| Supplemental Data | | | | | | | | | | | | | | | | | | | | | | | | | | |
Net assets, end of period (000) | | $ | 11,430 | | | $ | 11,060 | | | $ | 10,939 | | | | | $ | 311 | | | $ | 243 | | | $ | 71 | |
| | | | | | | | | | |
Portfolio turnover rate | | | 15% | | | | 36% | | | | 10% | | | | | | 15% | | | | 36% | | | | 10% | |
| | | | | | | | | | |
| | 1 | | Commencement of operations. |
| | 2 | | Based on average shares outstanding. |
| | 3 | | Distributions for annual periods determined in accordance with federal income tax regulations. |
| | 4 | | Where applicable, excludes the effects of any sales charges and assumes the reinvestment of distributions. |
| | 5 | | Aggregate total return. |
| | 7 | | Organization and offering costs were not annualized in the calculation of the expense ratios. If these expenses were annualized, the total expenses would have been 3.06% and 3.48%. |
| | | | | | |
| See Notes to Financial Statements. | | | | |
| | | | | | | |
| | BLACKROCK CORI FUNDS | | APRIL 30, 2016 | | 43 |
| | |
| Financial Highlights | | BlackRock CoRI 2017 Fund |
| | | | | | | | | | | | | | | | | | | | | | | | | | |
| | | Institutional | | | | | Investor A | |
| | | Six Months Ended
April 30,
2016
(Unaudited) | | | Year Ended
October 31,
2015 | | | January 31,
20141
to October 31,
2014 | | | | | Six Months Ended
April 30,
2016
(Unaudited) | | | Year Ended
October 31,
2015 | | | January 31,
20141
to October 31,
2014 | |
| | | | | | | | | | | | | | | | | | | | | | | | | | |
| Per Share Operating Performance | | | | | | | | | | | | | | | | | | | | | | | | | | |
Net asset value, beginning of period | | $ | 11.20 | | | $ | 11.13 | | | $ | 10.00 | | | | | $ | 11.16 | | | $ | 11.11 | | | $ | 10.00 | |
| | | | | | | | | | |
Net investment income2 | | | 0.17 | | | | 0.34 | | | | 0.25 | | | | | | 0.15 | | | | 0.31 | | | | 0.23 | |
Net realized and unrealized gain | | | 0.49 | | | | 0.13 | | | | 0.88 | | | | | | 0.50 | | | | 0.13 | | | | 0.88 | |
| | | | | | | | | | |
Net increase from investment operations | | | 0.66 | | | | 0.47 | | | | 1.13 | | | | | | 0.65 | | | | 0.44 | | | | 1.11 | |
| | | | | | | | | | |
| Distributions:3 | | | | | | | | | | | | | | | | | | | | | | | | | | |
From net investment income | | | (0.32 | ) | | | (0.34 | ) | | | — | | | | | | (0.30 | ) | | | (0.33 | ) | | | — | |
From net realized gain | | | (0.27 | ) | | | (0.06 | ) | | | — | | | | | | (0.27 | ) | | | (0.06 | ) | | | — | |
| | | | | | | | | | |
Total distributions | | | (0.59 | ) | | | (0.40 | ) | | | — | | | | | | (0.57 | ) | | | (0.39 | ) | | | — | |
| | | | | | | | | | |
Net asset value, end of period | | $ | 11.27 | | | $ | 11.20 | | | $ | 11.13 | | | | | $ | 11.24 | | | $ | 11.16 | | | $ | 11.11 | |
| | | | | | | | | | |
| | | | | | | | | | | | | | | | | | | | | | | | | | |
| Total Return4 | | | | | | | | | | | | | | | | | | | | | | | | | | |
Based on net asset value | | | 6.33% | 5 | | | 4.18% | | | | 11.30% | 5 | | | | | 6.14% | 5 | | | 3.93% | | | | 11.10% | 5 |
| | | | | | | | | | |
| | | | | | | | | | | | | | | | | | | | | | | | | | |
| Ratios to Average Net Assets | | | | | | | | | | | | | | | | | | | | | | | | | | |
Total expenses | | | 1.74% | 6 | | | 1.97% | | | | 2.62% | 6,7 | | | | | 2.12% | 6 | | | 2.35% | | | | 3.09% | 6,7 |
| | | | | | | | | | |
Total expenses after fees waived and/or reimbursed and excluding excise tax | | | 0.25% | 6 | | | 0.25% | | | | 0.25% | 6 | | | | | 0.50% | 6 | | | 0.50% | | | | 0.50% | 6 |
| | | | | | | | | | |
Net investment income | | | 3.07% | 6 | | | 3.03% | | | | 3.26% | 6 | | | | | 2.81% | 6 | | | 2.77% | | | | 2.96% | 6 |
| | | | | | | | | | |
| | | | | | | | | | | | | | | | | | | | | | | | | | |
| Supplemental Data | | | | | | | | | | | | | | | | | | | | | | | | | | |
Net assets, end of period (000) | | $ | 11,247 | | | $ | 11,180 | | | $ | 11,120 | | | | | $ | 423 | | | $ | 150 | | | $ | 95 | |
| | | | | | | | | | |
Portfolio turnover rate | | | 14% | | | | 27% | | | | 10% | | | | | | 14% | | | | 27% | | | | 10% | |
| | | | | | | | | | |
| | 1 | | Commencement of operations. |
| | 2 | | Based on average shares outstanding. |
| | 3 | | Distributions for annual periods determined in accordance with federal income tax regulations. |
| | 4 | | Where applicable, excludes the effects of any sales charges and assumes the reinvestment of distributions. |
| | 5 | | Aggregate total return. |
| | 7 | | Organization and offering costs were not annualized in the calculation of the expense ratios. If these expenses were annualized, the total expenses would have been 3.03% and 3.46%. |
| | | | | | |
| See Notes to Financial Statements. | | | | |
| | | | | | | |
| 44 | | BLACKROCK CORI FUNDS | | APRIL 30, 2016 | | |
| | |
| Financial Highlights | | BlackRock CoRI 2019 Fund |
| | | | | | | | | | | | | | | | | | | | | | | | | | |
| | | Institutional | | | | | Investor A | |
| | | Six Months Ended
April 30,
2016
(Unaudited) | | | Year Ended
October 31,
2015 | | | January 31,
20141
to October 31,
2014 | | | | | Six Months Ended
April 30,
2016
(Unaudited) | | | Year Ended
October 31,
2015 | | | January 31,
20141
to October 31,
2014 | |
| | | | | | | | | | | | | | | | | | | | | | | | | | |
| Per Share Operating Performance | | | | | | | | | | | | | | | | | | | | | | | | | | |
Net asset value, beginning of period | | $ | 11.31 | | | $ | 11.30 | | | $ | 10.00 | | | | | $ | 11.30 | | | $ | 11.29 | | | $ | 10.00 | |
| | | | | | | | | | |
Net investment income2 | | | 0.18 | | | | 0.36 | | | | 0.27 | | | | | | 0.16 | | | | 0.33 | | | | 0.25 | |
Net realized and unrealized gain | | | 0.55 | | | | 0.15 | | | | 1.03 | | | | | | 0.55 | | | | 0.15 | | | | 1.04 | |
| | | | | | | | | | |
Net increase from investment operations | | | 0.73 | | | | 0.51 | | | | 1.30 | | | | | | 0.71 | | | | 0.48 | | | | 1.29 | |
| | | | | | | | | | |
| Distributions:3 | | | | | | | | | | | | | | | | | | | | | | | | | | |
From net investment income | | | (0.34 | ) | | | (0.36 | ) | | | — | | | | | | (0.32 | ) | | | (0.33 | ) | | | — | |
From net realized gain | | | (0.27 | ) | | | (0.14 | ) | | | — | | | | | | (0.27 | ) | | | (0.14 | ) | | | — | |
| | | | | | | | | | |
Total distributions | | | (0.61 | ) | | | (0.50 | ) | | | — | | | | | | (0.59 | ) | | | (0.47 | ) | | | — | |
| | | | | | | | | | |
Net asset value, end of period | | $ | 11.43 | | | $ | 11.31 | | | $ | 11.30 | | | | | $ | 11.42 | | | $ | 11.30 | | | $ | 11.29 | |
| | | | | | | | | | |
| | | | | | | | | | | | | | | | | | | | | | | | | | |
| Total Return4 | | | | | | | | | | | | | | | | | | | | | | | | | | |
Based on net asset value | | | 6.85% | 5 | | | 4.51% | | | | 13.00% | 5 | | | | | 6.70% | 5 | | | 4.21% | | | | 12.90% | 5 |
| | | | | | | | | | |
| | | | | | | | | | | | | | | | | | | | | | | | | | |
| Ratios to Average Net Assets | | | | | | | | | | | | | | | | | | | | | | | | | | |
Total expenses | | | 1.64% | 6 | | | 1.89% | | | | 2.55% | 6,7 | | | | | 1.96% | 6 | | | 2.23% | | | | 2.39% | 6,7 |
| | | | | | | | | | |
Total expenses after fees waived and/or reimbursed and excluding excise tax | | | 0.25% | 6 | | | 0.25% | | | | 0.25% | 6 | | | | | 0.50% | 6 | | | 0.50% | | | | 0.50% | 6 |
| | | | | | | | | | |
Net investment income | | | 3.20% | 6 | | | 3.14% | | | | 3.43% | 6 | | | | | 2.95% | 6 | | | 2.90% | | | | 3.02% | 6 |
| | | | | | | | | | |
| | | | | | | | | | | | | | | | | | | | | | | | | | |
| Supplemental Data | | | | | | | | | | | | | | | | | | | | | | | | | | |
Net assets, end of period (000) | | $ | 11,522 | | | $ | 11,418 | | | $ | 11,418 | | | | | $ | 963 | | | $ | 701 | | | $ | 259 | |
| | | | | | | | | | |
Portfolio turnover rate | | | 16% | | | | 31% | | | | 29% | | | | | | 16% | | | | 31% | | | | 29% | |
| | | | | | | | | | |
| | 1 | | Commencement of operations. |
| | 2 | | Based on average shares outstanding. |
| | 3 | | Distributions for annual periods determined in accordance with federal income tax regulations. |
| | 4 | | Where applicable, excludes the effects of any sales charges and assumes the reinvestment of distributions. |
| | 5 | | Aggregate total return. |
| | 7 | | Organization and offering costs were not annualized in the calculation of the expense ratios. If these expenses were annualized, the total expenses would have been 2.95% and 2.66%. |
| | | | | | |
| See Notes to Financial Statements. | | | | |
| | | | | | | |
| | BLACKROCK CORI FUNDS | | APRIL 30, 2016 | | 45 |
| | |
| Financial Highlights | | BlackRock CoRI 2021 Fund |
| | | | | | | | | | | | | | | | | | | | | | | | | | |
| | | Institutional | | | | | Investor A | |
| | | Six Months Ended
April 30,
2016 (Unaudited) | | | Year Ended
October 31, 2015 | | | January 31,
20141
to October 31,
2014 | | | | | Six Months Ended
April 30,
2016
(Unaudited) | | | Year Ended
October 31,
2015 | | | January 31,
20141
to October 31,
2014 | |
| | | | | | | | | | | | | | | | | | | | | | | | | | |
| Per Share Operating Performance | | | | | | | | | | | | | | | | | | | | | | | | | | |
Net asset value, beginning of period | | $ | 11.40 | | | $ | 11.41 | | | $ | 10.00 | | | | | $ | 11.36 | | | $ | 11.39 | | | $ | 10.00 | |
| | | | | | | | | | |
Net investment income2 | | | 0.19 | | | | 0.37 | | | | 0.37 | | | | | | 0.17 | | | | 0.35 | | | | 0.32 | |
Net realized and unrealized gain | | | 0.63 | | | | 0.10 | | | | 1.04 | | | | | | 0.65 | | | | 0.09 | | | | 1.07 | |
| | | | | | | | | | |
Net increase from investment operations | | | 0.82 | | | | 0.47 | | | | 1.41 | | | | | | 0.82 | | | | 0.44 | | | | 1.39 | |
| | | | | | | | | | |
| Distributions:3 | | | | | | | | | | | | | | | | | | | | | | | | | | |
From net investment income | | | (0.36 | ) | | | (0.37 | ) | | | — | | | | | | (0.34 | ) | | | (0.36 | ) | | | — | |
From net realized gain | | | (0.34 | ) | | | (0.11 | ) | | | — | | | | | | (0.34 | ) | | | (0.11 | ) | | | — | |
| | | | | | | | | | |
Total distributions | | | (0.70 | ) | | | (0.48 | ) | | | — | | | | | | (0.68 | ) | | | (0.47 | ) | | | — | |
| | | | | | | | | | |
Net asset value, end of period | | $ | 11.52 | | | $ | 11.40 | | | $ | 11.41 | | | | | $ | 11.50 | | | $ | 11.36 | | | $ | 11.39 | |
| | | | | | | | | | |
| | | | | | | | | | | | | | | | | | | | | | | | | | |
| Total Return4 | | | | | | | | | | | | | | | | | | | | | | | | | | |
Based on net asset value | | | 7.73% | 5 | | | 4.03% | | | | 14.10% | 5 | | | | | 7.69% | 5 | | | 3.75% | | | | 13.90% | 5 |
| | | | | | | | | | |
| | | | | | | | | | | | | | | | | | | | | | | | | | |
| Ratios to Average Net Assets | | | | | | | | | | | | | | | | | | | | | | | | | | |
Total expenses | | | 1.63% | 6 | | | 1.89% | | | | 2.58% | 6,7 | | | | | 1.92% | 6 | | | 2.19% | | | | 2.83% | 6,7 |
| | | | | | | | | | |
Total expenses after fees waived and/or reimbursed and excluding excise tax | | | 0.25% | 6 | | | 0.25% | | | | 0.25% | 6 | | | | | 0.50% | 6 | | | 0.50% | | | | 0.50% | 6 |
| | | | | | | | | | |
Net investment income | | | 3.36% | 6 | | | 3.25% | | | | 3.50% | 6 | | | | | 3.06% | 6 | | | 3.03% | | | | 3.16% | 6 |
| | | | | | | | | | |
| | | | | | | | | | | | | | | | | | | | | | | | | | |
| Supplemental Data | | | | | | | | | | | | | | | | | | | | | | | | | | |
Net assets, end of period (000) | | $ | 11,506 | | | $ | 11,379 | | | $ | 11,390 | | | | | $ | 651 | | | $ | 528 | | | $ | 113 | |
| | | | | | | | | | |
Portfolio turnover rate | | | 32% | | | | 37% | | | | 19% | | | | | | 32% | | | | 37% | | | | 19% | |
| | | | | | | | | | |
| | 1 | | Commencement of operations. |
| | 2 | | Based on average shares outstanding. |
| | 3 | | Distributions for annual periods determined in accordance with federal income tax regulations. |
| | 4 | | Where applicable, excludes the effects of any sales charges and assumes the reinvestment of distributions. |
| | 5 | | Aggregate total return. |
| | 7 | | Organization and offering costs were not annualized in the calculation of the expense ratios. If these expenses were annualized, the total expenses would have been 3.00% and 3.16%. |
| | | | | | |
| See Notes to Financial Statements. | | | | |
| | | | | | | |
| 46 | | BLACKROCK CORI FUNDS | | APRIL 30, 2016 | | |
| | |
| Financial Highlights | | BlackRock CoRI 2023 Fund |
| | | | | | | | | | | | | | | | | | | | | | | | | | |
| | | Institutional | | | | | Investor A | |
| | | Six Months Ended
April 30,
2016
(Unaudited) | | | Year Ended
October 31,
2015 | | | January 31,
20141
to October 31,
2014 | | | | | Six Months Ended
April 30,
2016
(Unaudited) | | | Year Ended
October 31,
2015 | | | January 31,
20141
to October 31,
2014 | |
| | | | | | | | | | | | | | | | | | | | | | | | | | |
| Per Share Operating Performance | | | | | | | | | | | | | | | | | | | | | | | | | | |
Net asset value, beginning of period | | $ | 11.52 | | | $ | 11.56 | | | $ | 10.00 | | | | | $ | 11.48 | | | $ | 11.54 | | | $ | 10.00 | |
| | | | | | | | | | |
Net investment income2 | | | 0.20 | | | | 0.39 | | | | 0.29 | | | | | | 0.18 | | | | 0.36 | | | | 0.27 | |
Net realized and unrealized gain | | | 0.72 | | | | 0.05 | | | | 1.27 | | | | | | 0.72 | | | | 0.05 | | | | 1.27 | |
| | | | | | | | | | |
Net increase from investment operations | | | 0.92 | | | | 0.44 | | | | 1.56 | | | | | | 0.90 | | | | 0.41 | | | | 1.54 | |
| | | | | | | | | | |
| Distributions:3 | | | | | | | | | | | | | | | | | | | | | | | | | | |
From net investment income | | | (0.38 | ) | | | (0.38 | ) | | | — | | | | | | (0.35 | ) | | | (0.37 | ) | | | — | |
From net realized gain | | | (0.18 | ) | | | (0.10 | ) | | | — | | | | | | (0.18 | ) | | | (0.10 | ) | | | — | |
| | | | | | | | | | |
Total distributions | | | (0.56 | ) | | | (0.48 | ) | | | — | | | | | | (0.53 | ) | | | (0.47 | ) | | | — | |
| | | | | | | | | | |
Net asset value, end of period | | $ | 11.88 | | | $ | 11.52 | | | $ | 11.56 | | | | | $ | 11.85 | | | $ | 11.48 | | | $ | 11.54 | |
| | | | | | | | | | |
| | | | | | | | | | | | | | | | | | | | | | | | | | |
| Total Return4 | | | | | | | | | | | | | | | | | | | | | | | | | | |
Based on net asset value | | | 8.37% | 5 | | | 3.65% | | | | 15.60% | 5 | | | | | 8.25% | 5 | | | 3.38% | | | | 15.40% | 5 |
| | | | | | | | | | |
| | | | | | | | | | | | | | | | | | | | | | | | | | |
| Ratios to Average Net Assets | | | | | | | | | | | | | | | | | | | | | | | | | | |
Total expenses | | | 1.56% | 6 | | | 1.71% | | | | 2.56% | 6,7 | | | | | 1.89% | 6 | | | 1.81% | | | | 2.60% | 6,7 |
| | | | | | | | | | |
Total expenses after fees waived and/or reimbursed and excluding excise tax | | | 0.25% | 6 | | | 0.25% | | | | 0.25% | 6 | | | | | 0.50% | 6 | | | 0.50% | | | | 0.50% | 6 |
| | | | | | | | | | |
Net investment income | | | 3.46% | 6 | | | 3.30% | | | | 3.59% | 6 | | | | | 3.25% | 6 | | | 3.08% | | | | 3.22% | 6 |
| | | | | | | | | | |
| | | | | | | | | | | | | | | | | | | | | | | | | | |
| Supplemental Data | | | | | | | | | | | | | | | | | | | | | | | | | | |
Net assets, end of period (000) | | $ | 12,017 | | | $ | 12,435 | | | $ | 11,540 | | | | | $ | 858 | | | $ | 2,719 | | | $ | 309 | |
| | | | | | | | | | |
Portfolio turnover rate | | | 32% | | | | 43% | | | | 20% | | | | | | 32% | | | | 43% | | | | 20% | |
| | | | | | | | | | |
| | 1 | | Commencement of operations. |
| | 2 | | Based on average shares outstanding. |
| | 3 | | Distributions for annual periods determined in accordance with federal income tax regulations. |
| | 4 | | Where applicable, excludes the effects of any sales charges and assumes the reinvestment of distributions. |
| | 5 | | Aggregate total return. |
| | 7 | | Organization and offering costs were not annualized in the calculation of the expense ratios. If these expenses were annualized, the total expenses would have been 2.97% and 2.90%. |
| | | | | | |
| See Notes to Financial Statements. | | | | |
| | | | | | | |
| | BLACKROCK CORI FUNDS | | APRIL 30, 2016 | | 47 |
| | |
| Notes to Financial Statements (Unaudited) | | |
1. Organization:
BlackRock CoRI Funds (the “Trust”) is registered under the Investment Company Act of 1940, as amended (the “1940 Act”), as an open-end management investment company. The following are referred to herein collectively as the “Funds” or individually, a “Fund”:
| | | | | | | | |
| Fund Name | | Herein Referred To As | | | Diversification Classification | |
BlackRock CoRI 2015 Fund | | | CoRI 2015 Fund | | | | Diversified | |
BlackRock CoRI 2017 Fund | | | CoRI 2017 Fund | | | | Diversified | |
BlackRock CoRI 2019 Fund | | | CoRI 2019 Fund | | | | Diversified | |
BlackRock CoRI 2021 Fund | | | CoRI 2021 Fund | | | | Diversified | |
BlackRock CoRI 2023 Fund | | | CoRI 2023 Fund | | | | Diversified | |
Each Fund offers multiple classes of shares. All classes of shares have identical voting, dividend, liquidation and other rights and are subject to the same terms and conditions, except that certain classes bear expenses related to the shareholder servicing and distribution of such shares, and may be subject to a contingent deferred sales charge (“CDSC”). Each class has exclusive voting rights with respect to matters relating to its shareholder servicing and distribution expenditures.
| | | | | | | | | | | | |
| Share Class | | Initial Sales Charge | | | CDSC | | | Conversion Privilege | |
Institutional Shares | | | No | | | | No | | | | None | |
Investor A Shares | | | Yes | | | | No | 1 | | | None | |
| | 1 | | Investor A Shares may be subject to a CDSC for certain redemptions where no initial sales charge was paid at the time of purchase. |
The Funds, together with certain other registered investment companies advised by BlackRock Advisors, LLC (the “Manager”) or its affiliates, are included in a complex of open-end funds referred to as the Equity-Bond Complex.
2. Significant Accounting Policies:
The financial statements are prepared in conformity with accounting principles generally accepted in the United States of America (“U.S. GAAP”), which may require management to make estimates and assumptions that affect the reported amounts of assets and liabilities in the financial statements, disclosure of contingent assets and liabilities at the date of the financial statements and the reported amounts of increases and decreases in net assets from operations during the reporting period. Actual results could differ from those estimates. Each Fund is considered an investment company under U.S. GAAP and follows the accounting and reporting guidance applicable to investment companies. Below is a summary of significant accounting policies:
Segregation and Collateralization: In cases where a Fund enters into certain investments (e.g., futures contracts), that would be treated as “senior securities” for 1940 Act purposes, a Fund may segregate or designate on its books and records cash or liquid assets having a market value at least equal to the amount of its future obligations under such investments. Doing so allows the investment to be excluded from treatment as a “senior security.” Furthermore, if required by an exchange or counterparty agreement, the Fund may be required to deliver/deposit cash and/or securities to/with an exchange, or broker-dealer or custodian as collateral for certain investments or obligations.
Investment Transactions and Investment Income: For financial reporting purposes, investment transactions are recorded on the dates the transactions are entered into (the trade dates). Realized gains and losses on investment transactions are determined on the identified cost basis. Interest income, including amortization and accretion of premiums and discounts on debt securities, is recognized on the accrual basis. Income, expenses and realized and unrealized gains and losses are allocated daily to each class based on its relative net assets.
Distributions: Distributions from net investment income are declared and paid annually. Distributions of capital gains are recorded on the ex-dividend date and made at least annually. The character and timing of distributions are determined in accordance with federal income tax regulations, which may differ from U.S. GAAP.
Indemnifications: In the normal course of business, a Fund enters into contracts that contain a variety of representations that provide general indemnification. A Fund’s maximum exposure under these arrangements is unknown because it involves future potential claims against a Fund, which cannot be predicted with any certainty.
| | | | | | |
| | | | | | | |
| 48 | | BLACKROCK CORI FUNDS | | APRIL 30, 2016 | | |
| | | | |
| Notes to Financial Statements (continued) | | |
Other: Expenses directly related to a Fund or its classes are charged to that Fund or the applicable class. Other operating expenses shared by several funds, including other funds managed by the Manager, are prorated among those funds on the basis of relative net assets or other appropriate methods. Expenses directly related to the Funds and other shared expenses prorated to the Funds are allocated daily to each class based on its relative net assets or other appropriate methods.
The Funds have an arrangement with their custodian whereby fees may be reduced by credits earned on uninvested cash balances, which, if applicable, are shown as fees paid indirectly in the Statements of Operations. The custodian imposes fees on overdrawn cash balances, which can be offset by accumulated credits earned or may result in additional custody charges. Effective October 2015, the custodian is imposing fees on certain uninvested cash balances.
3. Investment Valuation and Fair Value Measurements:
Investment Valuation Policies: The Funds’ investments are valued at fair value (also referred to as “market value” within the financial statements) as of the close of trading on the New York Stock Exchange (“NYSE”) (generally 4:00 p.m., Eastern time) (or if the reporting date falls on a day the NYSE is closed, investments are valued at fair value as of the report date). U.S. GAAP defines fair value as the price the Funds would receive to sell an asset or pay to transfer a liability in an orderly transaction between market participants at the measurement date. The Funds determine the fair values of their financial instruments using various independent dealers or pricing services under policies approved by the Board of Trustees of the Trust (the “Board”). The BlackRock Global Valuation Methodologies Committee (the “Global Valuation Committee”) is the committee formed by management to develop global pricing policies and procedures and to oversee the pricing function for all financial instruments.
Fair Value Inputs and Methodologies: The following methods (or “techniques”) and inputs are used to establish the fair value of each Fund’s assets and liabilities:
| • | | Bond investments are valued on the basis of last available bid prices or current market quotations provided by dealers or pricing services. Floating rate loan interests are valued at the mean of the bid prices from one or more brokers or dealers as obtained from a pricing service. In determining the value of a particular investment, pricing services may use certain information with respect to transactions in such investments, quotations from dealers, pricing matrixes, market transactions in comparable investments, various relationships observed in the market between investments and calculated yield measures. Asset-backed and mortgage-backed securities are valued by independent pricing services using models that consider estimated cash flows of each tranche of the security, establish a benchmark yield and develop an estimated tranche-specific spread to the benchmark yield based on the unique attributes of the tranche. |
| • | | Investments in open-end U.S. mutual funds are valued at net asset value (“NAV”) each business day. |
| • | | Futures contracts traded on exchanges are valued at their last sale price. |
If events (e.g., a company announcement, market volatility or a natural disaster) occur that are expected to materially affect the value of such instruments, or in the event that the application of these methods of valuation results in a price for an investment that is deemed not to be representative of the market value of such investment, or if a price is not available, the investment will be valued by the Global Valuation Committee, or its delegate, in accordance with a policy approved by the Board as reflecting fair value (“Fair Valued Investments”). When determining the price for Fair Valued Investments, the Global Valuation Committee, or its delegate, seeks to determine the price that each Fund might reasonably expect to receive or pay from the current sale or purchase of that asset or liability in an arm’s-length transaction. Fair value determinations shall be based upon all available factors that the Global Valuation Committee, or its delegate, deems relevant consistent with the principles of fair value measurement. The pricing of all Fair Valued Investments is subsequently reported to the Board or a committee thereof on a quarterly basis.
Fair Value Hierarchy: Various inputs are used in determining the fair value of investments and derivative financial instruments. These inputs to valuation techniques are categorized into a fair value hierarchy consisting of three broad levels for financial statement purposes as follows:
| • | | Level 1 — unadjusted price quotations in active markets/exchanges for identical assets or liabilities that each Fund has the ability to access |
| • | | Level 2 — other observable inputs (including, but not limited to, quoted prices for similar assets or liabilities in markets that are active, quoted prices for identical or similar assets or liabilities in markets that are not active, inputs other than quoted prices that are observable for the assets or liabilities (such as interest rates, yield curves, volatilities, prepayment speeds, loss severities, credit risks and default rates) or other market–corroborated inputs) |
| | | | | | |
| | | | | | | |
| | BLACKROCK CORI FUNDS | | APRIL 30, 2016 | | 49 |
| | |
| Notes to Financial Statements (continued) | | |
| • | | Level 3 — unobservable inputs based on the best information available in the circumstances, to the extent observable inputs are not available (including each Fund’s own assumptions used in determining the fair value of investments and derivative financial instruments) |
The hierarchy gives the highest priority to unadjusted quoted prices in active markets for identical assets or liabilities (Level 1 measurements) and the lowest priority to unobservable inputs (Level 3 measurements). Accordingly, the degree of judgment exercised in determining fair value is greatest for instruments categorized in Level 3. The inputs used to measure fair value may fall into different levels of the fair value hierarchy. In such cases, for disclosure purposes, the fair value hierarchy classification is determined based on the lowest level input that is significant to the fair value measurement in its entirety. The significant unobservable inputs used by the Global Valuation Committee in determining the price for Fair Valued Investments are typically categorized as Level 3. The fair value hierarchy for each Fund’s investments and derivative financial instruments has been included in the Schedules of Investments.
Changes in valuation techniques may result in transfers into or out of an assigned level within the hierarchy. In accordance with each Fund’s policy, transfers between different levels of the fair value hierarchy are deemed to have occurred as of the beginning of the reporting period. The categorization of a value determined for investments and derivative financial instruments is based on the pricing transparency of the investments and derivative financial instruments and is not necessarily an indication of the risks associated with investing in those securities.
4. Securities and Other Investments:
Stripped Mortgage-Backed Securities: Stripped mortgage-backed securities issued by the U.S. Government, its agencies and instrumentalities. Stripped mortgage-backed securities are usually structured with two classes that receive different proportions of the interest (IOs) and principal (POs) distributions on a pool of mortgage pass-through securities (the “Mortgage Assets”). A Fund also may invest in stripped mortgage-backed securities that are privately issued.
Zero-Coupon Bonds: Zero-coupon bonds are normally issued at a significant discount from face value and do not provide for periodic interest payments. These bonds may experience greater volatility in market value than other debt obligations of similar maturity which provide for regular interest payments.
5. Derivative Financial Instruments:
The Funds engage in various portfolio investment strategies using derivative contracts both to increase the returns of the Funds and/or to manage their exposure to certain risks such as interest rate risk. Derivative financial instruments categorized by risk exposure are included in the Schedules of Investments. These contracts may be transacted on an exchange.
Futures Contracts: Certain Funds invest in long and/or short positions in futures and options on futures contracts to gain exposure to, or manage exposure to, changes in interest rates (interest rate risk).
Futures contracts are agreements between the Funds and a counterparty to buy or sell a specific quantity of an underlying instrument at a specified price and on a specified date. Depending on the terms of a contract, it is settled either through physical delivery of the underlying instrument on the settlement date or by payment of a cash amount on the settlement date. Upon entering into a futures contract, the Funds are required to deposit initial margin with the broker in the form of cash or securities in an amount that varies depending on a contract’s size and risk profile. The initial margin deposit must then be maintained at an established level over the life of the contract.
Securities deposited as initial margin are designated in the Schedules of Investments and cash deposited, if any, is shown as cash pledged for futures contracts in the Statements of Assets and Liabilities. Pursuant to the contract, the Funds agree to receive from or pay to the broker an amount of cash equal to the daily fluctuation in market value of the contract (“variation margin”). Variation margin is recorded as unrealized appreciation (depreciation) and, if any, shown as variation margin receivable (or payable) on futures contracts in the Statements of Assets and Liabilities. When the contract is closed, a realized gain or loss is recorded in the Statements of Operations equal to the difference between the value of the contract at the time it was opened and the value at the time it was closed. The use of futures contracts involves the risk of an imperfect correlation in the movements in the price of futures contracts and interest, foreign currency exchange rates or underlying assets.
6. Investment Advisory Agreement and Other Transactions with Affiliates:
The PNC Financial Services Group, Inc. is the largest stockholder and an affiliate of BlackRock, Inc. (“BlackRock”) for 1940 Act purposes.
| | | | | | |
| | | | | | | |
| 50 | | BLACKROCK CORI FUNDS | | APRIL 30, 2016 | | |
| | | | |
| Notes to Financial Statements (continued) | | |
The Trust, on behalf of the Funds, entered into an Investment Advisory Agreement with the Manager, the Funds’ investment advisor, an indirect, wholly owned subsidiary of BlackRock, to provide investment advisory services. The Manager is responsible for the management of each Fund’s portfolio and provides the personnel, facilities, equipment and certain other services necessary to the operations of each Fund. For such services, each Fund pays the Manager a monthly fee, which is determined by calculating a percentage of each Fund’s average daily net assets, based on the following annual rates:
| | | | |
| Average Daily Net Assets | | Investment Advisory Fee | |
Not exceeding $1 billion | | | 0.30% | |
In excess of $1 billion but not more than $3 billion | | | 0.28% | |
In excess of $3 billion but not more than $5 billion | | | 0.27% | |
In excess of $5 billion | | | 0.26% | |
The Manager, with respect to the Fund, entered into a sub-advisory agreement with BlackRock International Limited (“BIL”), an affiliate of the Manager. The Manager pays BIL, for services it provides, a monthly fee that is a percentage of the investment advisory fees paid by each Fund to the Manager.
Service and Distribution Fees
The Trust, on behalf of the Funds, entered into a Distribution Agreement and a Distribution and Service Plan with BlackRock Investments, LLC (“BRIL”), an affiliate of the Manager. Pursuant to the Distribution and Service Plan and in accordance with Rule 12b-1 under the 1940 Act, each Fund pays BRIL ongoing service and distribution fees. The fees are accrued daily and paid monthly at an annual rate of 0.25% based upon the average daily net assets of each Fund’s Investor A Shares.
BRIL and broker-dealers, pursuant to sub-agreements with BRIL, provide shareholder servicing and distribution services to the Funds. The ongoing service and/or distribution fee compensates BRIL and each broker-dealer for providing shareholder servicing and/or distribution related services to the shareholders.
Administration
The Manager acts as administrator for the Funds. For these services, the Manager receives an administration fee computed daily and payable monthly, based on a percentage of the average daily net assets of each Fund. The administration fee, which is shown as administration in the Statements of Operations, is paid at the annual rates below.
| | | | |
| Average Daily Net Assets | | Administration Fee | |
First $500 Million | | | 0.05% | |
$500 Million — $1 Billion | | | 0.04% | |
Greater than $1 Billion | | | 0.03% | |
The Manager may have, at its discretion, voluntarily waived all or any portion of its administration fees for the Funds or a share class, which are shown as fees waived by the administrator in the Statements of Operations.
Transfer Agent
Pursuant to written agreements, certain financial intermediaries, some of which may be affiliates, provide the Funds with sub-accounting, recordkeeping, sub-transfer agency and other administrative services with respect to sub-accounts they service. For these services, these entities receive an asset-based fee or an annual fee per shareholder account, which will vary depending on share class and/or net assets. For the six months ended April 30, 2016, the Funds paid the following amounts to affiliates of BlackRock in return for these services, which are included in transfer agent— class specific in the Statements of Operations:
| | | | | | | | |
| | | Institutional | | | Investor A | |
CoRI 2015 Fund | | | — | | | $ | 36 | |
CoRI 2017 Fund | | | — | | | $ | 41 | |
CoRI 2019 Fund | | $ | 32 | | | $ | 164 | |
CoRI 2021 Fund | | | — | | | $ | 173 | |
CoRI 2023 Fund | | $ | 1 | | | $ | 696 | |
| | | | | | |
| | | | | | | |
| | BLACKROCK CORI FUNDS | | APRIL 30, 2016 | | 51 |
| | |
| Notes to Financial Statements (continued) | | |
The Manager maintains a call center that is responsible for providing certain shareholder services to the Funds. Shareholder services include responding to inquiries and processing subscriptions and redemptions transactions based upon instructions from shareholders. For the six months ended April 30, 2016, each Fund reimbursed the Manager the following amounts for costs incurred in running the call center, which are included in transfer agent — class specific in the Statements of Operations:
| | | | | | | | | | | | | | | | | | | | |
| | | CoRI
2015
Fund | | | CoRI
2017
Fund | | | CoRI
2019
Fund | | | CoRI
2021
Fund | | | CoRI
2023
Fund | |
Institutional | | $ | 17 | | | $ | 17 | | | $ | 18 | | | $ | 20 | | | $ | 14 | |
Investor A | | $ | 13 | | | $ | 6 | | | $ | 10 | | | $ | 6 | | | $ | 12 | |
For the six months ended April 30, 2016, the following table shows the class specific transfer agent fees borne directly by each class of each Fund:
| | | | | | | | | | | | | | | | | | | | |
| | | CoRI
2015
Fund | | | CoRI
2017
Fund | | | CoRI
2019
Fund | | | CoRI
2021
Fund | | | CoRI
2023
Fund | |
Institutional | | $ | 7 | | | $ | 7 | | | $ | 17 | | | $ | 25 | | | $ | 100 | |
Investor A | | $ | 110 | | | $ | 115 | | | $ | 124 | | | $ | 113 | | | $ | 265 | |
Other Fees
For the six months ended April 30, 2016, affiliates earned underwriting discounts, direct commissions and dealer concessions on sales of each Fund’s Investor A Shares as follows:
| | | | | | | | | | | | | | | | | | | | |
| | | CoRI
2015
Fund | | | CoRI
2017
Fund | | | CoRI
2019
Fund | | | CoRI
2021
Fund | | | CoRI
2023
Fund | |
Investor A | | $ | 110 | | | $ | 4,273 | | | $ | 4,308 | | | $ | 4,306 | | | $ | 5,305 | |
Expense Limitations, Waivers and Recoupments
The Manager, with respect to each Fund, voluntarily agreed to waive its investment advisory fees by the amount of investment advisory fees each Fund pays to the Manager indirectly through its investment in affiliated money market funds. These amounts are included in fees waived by the Manager in the Statements of Operations. However, the Manager does not waive its investment advisory fees by the amount of investment advisory fees paid in connection with each Fund’s investments in other affiliated investment companies, if any. For the six months ended April 30, 2016, the amounts waived were as follows:
| | | | | | | | | | | | |
| | | Institutional | | | Investor A | | | Total | |
CoRI 2015 Fund | | $ | 2 | | | $ | 53 | | | $ | 55 | |
CoRI 2017 Fund | | $ | 2 | | | $ | 72 | | | $ | 74 | |
CoRI 2019 Fund | | $ | 3 | | | $ | 46 | | | $ | 49 | |
CoRI 2021 Fund | | $ | 6 | | | $ | 72 | | | $ | 78 | |
CoRI 2023 Fund | | $ | 8 | | | $ | 52 | | | $ | 60 | |
The Manager, with respect to the Funds, contractually agreed to waive and/or reimburse fees or expenses in order to limit expenses, excluding interest expense, dividend expense, tax expense, acquired fund fees and expenses, and certain other fund expenses, which constitute extraordinary expenses not incurred in the ordinary course of each Fund’s business. The expense limitations as a percentage of average daily net assets are as follows:
| | | | | | | | |
| | | Contractual1 | | | Voluntary2 | |
Institutional | | | 0.58% | | | | 0.25% | |
Investor A | | | 0.83% | | | | 0.50% | |
| | 1 | | The Manager has agreed not to reduce or discontinue this contractual waiver or reimbursement prior to March 1, 2017 unless approved by the Board, including a majority of the independent Trustees. |
| | 2 | | The voluntary waiver or reimbursement may be reduced or discontinued at any time. |
| | | | | | |
| | | | | | | |
| 52 | | BLACKROCK CORI FUNDS | | APRIL 30, 2016 | | |
| | | | |
| Notes to Financial Statements (continued) | | |
These amounts waived and/or reimbursed are included in fees waived by the Manager, and shown as fees waived by the Administrator and transfer agent fees waived and/or reimbursed, respectively, in the Statements of Operations. For the six months ended April 30, 2016, the amounts included in fees waived by the Manager were as follows:
| | | | | | | | | | | | |
| | | Institutional | | | Investor A | | | Total | |
CoRI 2015 Fund | | $ | 374 | | | $ | 16,366 | | | $ | 16,740 | |
CoRI 2017 Fund | | $ | 375 | | | $ | 16,284 | | | $ | 16,659 | |
CoRI 2019 Fund | | $ | 1,154 | | | $ | 16,667 | | | $ | 17,821 | |
CoRI 2021 Fund | | $ | 1,276 | | | $ | 16,548 | | | $ | 17,824 | |
CoRI 2023 Fund | | $ | 2,251 | | | $ | 17,149 | | | $ | 19,400 | |
Class specific expense waivers and/or reimbursements are as follows:
Administration Fees Waived
| | | | | | | | | | | | |
| | | Institutional | | | Investor A | | | Total | |
CoRI 2015 Fund | | $ | 59 | | | $ | 2,628 | | | $ | 2,687 | |
CoRI 2017 Fund | | $ | 61 | | | $ | 2,609 | | | $ | 2,670 | |
CoRI 2019 Fund | | $ | 186 | | | $ | 2,674 | | | $ | 2,860 | |
CoRI 2021 Fund | | $ | 208 | | | $ | 2,658 | | | $ | 2,866 | |
CoRI 2023 Fund | | $ | 353 | | | $ | 2,758 | | | $ | 3,111 | |
Transfer Agent Fees Waived and/or Reimbursed
| | | | | | | | | | | | |
| | | Institutional | | | Investor A | | | Total | |
CoRI 2015 Fund | | $ | 23 | | | $ | 160 | | | $ | 183 | |
CoRI 2017 Fund | | $ | 23 | | | $ | 163 | | | $ | 186 | |
CoRI 2019 Fund | | $ | 68 | | | $ | 297 | | | $ | 365 | |
CoRI 2021 Fund | | $ | 45 | | | $ | 292 | | | $ | 337 | |
CoRI 2023 Fund | | $ | 115 | | | $ | 973 | | | $ | 1,088 | |
If during a Fund’s fiscal year the operating expenses of a share class, that at any time during the prior two fiscal years received a waiver and/or reimbursement from the Manager, are less than the expense limit for that share class, the Manager is entitled to be reimbursed by such share class up to the lesser of the following expenses:
| | (a) | The amount of fees waived and/or expenses reimbursed during those prior two fiscal years under the agreement. |
| | (b) | The amount by which the expense limit for that share class exceeds the operating expenses of the share class for the current fiscal year, provided that: |
| | • | | Each Fund, of which the share class is a part, has more than $50 million in assets for the fiscal year. |
| | • | | The Manager or an affiliate continues to serve as a Fund’s investment advisor or administrator. |
In the event the expense limit for a share class is changed subsequent to a fiscal year in which the Manager becomes entitled to reimbursement for fees waived and/or reimbursed, the amount available to reimburse the Manager shall be calculated by reference to the expense limit for that share class in effect at the time the Manager became entitled to receive such reimbursement, rather than the subsequently changed expense limit for that share class.
On April 30, 2016 the Fund level and class specific waivers and/or reimbursements subject to possible future recoupment under the expense limitation agreement are as follows:
| | | | | | | | | | | | | | | | | | | | | | | | | | | | | | | | | | | | | | | | | | | | | | | | | | | | | | | | | | | | | | | | |
| | | | | | | | | 2016 | | | | | | | | | | | | | | | | | 2017 | | | | | | | | | | | | | | | | | 2018 | | | | | | | |
| | | CoRI
2015
Fund | | | CoRI
2017
Fund | | | CoRI
2019
Fund | | | CoRI
2021
Fund | | | CoRI
2023
Fund | | | | | CoRI
2015
Fund | | | CoRI
2017
Fund | | | CoRI
2019
Fund | | | CoRI
2021
Fund | | | CoRI
2023
Fund | | | | | CoRI
2015
Fund | | | CoRI
2017
Fund | | | CoRI
2019
Fund | | | CoRI
2021
Fund | | | CoRI
2023
Fund | |
Fund Level | | $ | 151,363 | | | $ | 151,124 | | | $ | 150,262 | | | $ | 150,615 | | | $ | 150,439 | | | | | $ | 156,568 | | | $ | 154,670 | | | $ | 151,404 | | | $ | 150,418 | | | $ | 148,260 | | | | | $ | 64,286 | | | $ | 63,435 | | | $ | 61,397 | | | $ | 60,915 | | | $ | 61,448 | |
Institutional | | $ | 180 | | | $ | 185 | | | $ | 187 | | | $ | 180 | | | $ | 180 | | | | | $ | 51 | | | $ | 60 | | | $ | 135 | | | $ | 74 | | | $ | 85 | | | | | $ | 23 | | | $ | 23 | | | $ | 68 | | | $ | 45 | | | $ | 115 | |
Investor A | | $ | 109 | | | $ | 87 | | | $ | 84 | | | $ | 76 | | | $ | 75 | | | | | $ | 226 | | | $ | 294 | | | $ | 483 | | | $ | 402 | | | $ | 1,613 | | | | | $ | 160 | | | $ | 163 | | | $ | 297 | | | $ | 292 | | | $ | 973 | |
| | | | | | |
| | | | | | | |
| | BLACKROCK CORI FUNDS | | APRIL 30, 2016 | | 53 |
| | |
| Notes to Financial Statements (continued) | | |
Officers and Trustees
Certain officers and/or trustees of the Trust are officers and/or directors of BlackRock or its affiliates. The Funds reimburse the Manager for a portion of the compensation paid to the Funds’ Chief Compliance Officer, which is included in Officer and Trustees in the Statements of Operations.
7. Purchases and Sales:
For the six months ended April 30, 2016, purchases and sales of investments, excluding short-term securities, were as follows:
| | | | | | | | | | | | | | | | | | | | |
| Purchases | | CoRI 2015 Fund | | | CoRI 2017 Fund | | | CoRI 2019 Fund | | | CoRI 2021 Fund | | | CoRI 2023 Fund | |
Non-U.S. Government Securities | | $ | 630,648 | | | $ | 581,789 | | | $ | 650,183 | | | $ | 894,568 | | | $ | 879,512 | |
U.S. Government Securities | | | 992,311 | | | | 1,008,834 | | | | 1,246,145 | | | | 2,843,968 | | | | 3,223,015 | |
| | | | | | | | | | | | | | | | | | | | |
Total Purchases | | $ | 1,622,959 | | | $ | 1,590,623 | | | $ | 1,896,328 | | | $ | 3,738,536 | | | $ | 4,102,527 | |
| | | | | | | | | | | | | | | | | | | | |
| | | | | | | | | | | | | | | | | | | | |
| Sales | | CoRI 2015 Fund | | | CoRI 2017 Fund | | | CoRI 2019 Fund | | | CoRI 2021 Fund | | | CoRI 2023 Fund | |
Non-U.S. Government Securities | | $ | 426,488 | | | $ | 544,549 | | | $ | 605,472 | | | $ | 1,179,859 | | | $ | 2,064,301 | |
U.S. Government Securities | | | 1,260,117 | | | | 1,215,317 | | | | 1,512,633 | | | | 3,097,601 | | | | 5,138,622 | |
| | | | | | | | | | | | | | | | | | | | |
Total Sales | | $ | 1,686,605 | | | $ | 1,759,866 | | | $ | 2,118,105 | | | $ | 4,277,460 | | | $ | 7,202,923 | |
| | | | | | | | | | | | | | | | | | | | |
8. Income Tax Information:
It is the Funds’ policy to comply with the requirements of the Internal Revenue Code of 1986, as amended, applicable to regulated investment companies, and to distribute substantially all of its taxable income to its shareholders. Therefore, no federal income tax provision is required.
Each Fund files U.S. federal and various state and local tax returns. No income tax returns are currently under examination. The statute of limitations on each Fund’s U.S. federal tax returns remains open for the year ended October 31, 2015 and the period ended October 31, 2014. The statutes of limitations on each Fund’s state and local tax returns may remain open for an additional year depending upon the jurisdiction.
Management has analyzed tax laws and regulations and their application to the Funds as of April 30, 2016, inclusive of the open tax return years, and does not believe there are any uncertain tax positions that require recognition of a tax liability in the Funds’ financial statements.
As of April 30, 2016, gross unrealized appreciation and depreciation based on cost for federal income tax purposes were as follows:
| | | | | | | | | | | | | | | | | | | | |
| | | CoRI 2015 Fund | | | CoRI 2017 Fund | | | CoRI 2019 Fund | | | CoRI 2021 Fund | | | CoRI 2023 Fund | |
Tax cost | | $ | 10,579,880 | | | $ | 10,473,284 | | | $ | 11,097,879 | | | $ | 10,852,347 | | | $ | 11,333,424 | |
| | | | | | | | | | | | | | | | | | | | |
Gross unrealized appreciation | | $ | 1,180,275 | | | $ | 1,172,146 | | | $ | 1,378,211 | | | $ | 1,276,005 | | | $ | 1,617,617 | |
Gross unrealized depreciation | | | (21,191 | ) | | | (23,048 | ) | | | (35,179 | ) | | | (32,743 | ) | | | (88,706 | ) |
| | | | | | | | | | | | | | | | | | | | |
Net unrealized appreciation | | $ | 1,159,084 | | | $ | 1,149,098 | | | $ | 1,343,032 | | | $ | 1,243,262 | | | $ | 1,528,911 | |
| | | | | | | | | | | | | | | | | | | | |
9. Bank Borrowings:
The Trust, on behalf of the Funds, along with certain other funds managed by the Manager and its affiliates (“Participating Funds”), is a party to a 364-day, $2.1 billion credit agreement with a group of lenders. Under this agreement, the Funds may borrow to fund shareholder redemptions. Excluding commitments designated for certain individual funds, the Participating Funds, including the Funds, can borrow up to an aggregate commitment amount of $1.6 billion at any time outstanding, subject to asset coverage and other limitations as specified in the agreement. The credit agreement has the following terms: a fee of 0.12% per annum on unused commitment amounts and interest at a rate equal to the higher of (a) one-month LIBOR (but, in any event, not less than 0.00%) on the date the loan is made plus 0.80% per annum or (b) the Fed Funds rate (but, in any event, not less than 0.00%) in effect from time to time plus 0.80% per annum on amounts borrowed. The agreement expires in April 2017 unless extended or renewed. Prior to April 21, 2016, a fee per annum was 0.06% on used commitment amounts and interest at a rate equal to the higher of (a) one-month LIBOR (but, in any event, not less than 0.00%) on the date the loan is made plus 0.80% per annum or (b) the Fed Funds rate (but, in any event, not less than 0.00%) in effect from time to time plus 0.80% per annum on amounts borrowed. Prior to November 25, 2014, the aggregate
| | | | | | |
| | | | | | | |
| 54 | | BLACKROCK CORI FUNDS | | APRIL 30, 2016 | | |
| | | | |
| Notes to Financial Statements (continued) | | |
commitment amount was $1.1 billion, of which the Participating Funds, including the Funds, could borrow up to $650 million at any time outstanding, subject to asset coverage and other limitations as specified in the agreement. Participating Funds paid administration, legal and arrangement fees, which, if applicable, are included in miscellaneous expenses in the Statements of Operations. These fees were allocated among such funds based upon portions of the aggregate commitment available to them and relative net assets of Participating Funds. During the six months ended April 30, 2016, the Funds did not borrow under the credit agreement.
10. Principal Risks:
In the normal course of business, the Funds invest in securities and enter into transactions where risks exist due to fluctuations in the market (market risk) or failure of the issuer to meet all its obligations, including the ability to pay principal and interest when due (issuer credit risk). The value of securities held by the Funds may decline in response to certain events, including those directly involving the issuers of securities owned by the Funds. Changes arising from the general economy, the overall market and local, regional or global political and/or social instability, as well as currency, interest rate and price fluctuations, may also affect the securities’ value.
Each Fund may be exposed to prepayment risk, which is the risk that borrowers may exercise their option to prepay principal earlier than scheduled during periods of declining interest rates, which would force each Fund to reinvest in lower yielding securities. Each Fund may also be exposed to reinvestment risk, which is the risk that income from each Fund’s portfolio will decline if each Fund invests the proceeds from matured, traded or called fixed income securities at market interest rates that are below each Fund portfolio’s current earnings rate.
Counterparty Credit Risk: Similar to issuer credit risk, the Funds may be exposed to counterparty credit risk, or the risk that an entity may fail to or be unable to perform on its commitments related to unsettled or open transactions. The Funds manage counterparty credit risk by entering into transactions only with counterparties that the Manager believes have the financial resources to honor their obligations and by monitoring the financial stability of those counterparties. Financial assets, which potentially expose the Funds to market, issuer and counterparty credit risks, consist principally of financial instruments and receivables due from counterparties. The extent of the Funds’ exposure to market, issuer and counterparty credit risks with respect to these financial assets is approximately their value recorded in the Statements of Assets and Liabilities, less any collateral held by the Funds.
A derivative contract may suffer a mark-to-market loss if the value of the contract decreases due to an unfavorable change in the market rates or values of the underlying instrument. Losses can also occur if the counterparty does not perform under the contract.
With exchange-traded futures, there is less counterparty credit risk to the Funds since the exchange or clearinghouse, as counterparty to such instruments, guarantees against a possible default. The clearinghouse stands between the buyer and the seller of the contract; therefore, credit risk is limited to failure of the clearinghouse. While offset rights may exist under applicable law, a Fund does not have a contractual right of offset against a clearing broker or clearinghouse in the event of a default (including the bankruptcy or insolvency). Additionally, credit risk exists in exchange-traded futures with respect to initial and variation margin that is held in a clearing broker’s customer accounts. While clearing brokers are required to segregate customer margin from their own assets, in the event that a clearing broker becomes insolvent or goes into bankruptcy and at that time there is a shortfall in the aggregate amount of margin held by the clearing broker for all its clients, typically the shortfall would be allocated on a pro rata basis across all the clearing broker’s customers, potentially resulting in losses to the Funds.
Concentration Risk: Certain Funds invest a significant portion of their assets in fixed-income securities and/or use derivatives tied to the fixed-income markets. Changes in market interest rates or economic conditions may affect the value and/or liquidity of such investments. Interest rate risk is the risk that prices of bonds and other fixed-income securities will increase as interest rates fall and decrease as interest rates rise. The Funds may be subject to a greater risk of rising interest rates due to the current period of historically low rates.
| | | | | | |
| | | | | | | |
| | BLACKROCK CORI FUNDS | | APRIL 30, 2016 | | 55 |
| | |
| Notes to Financial Statements (continued) | | |
11. Capital Share Transactions:
Transactions in capital shares for each class were as follows:
| | | | | | | | | | | | | | | | | | |
| | | Six Months Ended
April 30, 2016 | | | | | Year Ended
October 31, 2015 | |
| CoRI 2015 Fund | | Shares | | | Amount | | | | | Shares | | | Amount | |
| Institutional | | | | | | | | | | | | | | | | | | |
Shares sold | | | 18,156 | | | $ | 199,993 | | | | | | — | | | | — | |
Shares issued to shareholders in reinvestment of distributions | | | — | | | | — | | | | | | — | | | | — | |
Shares redeemed | | | — | | | | — | | | | | | — | | | | — | |
| | | | | | | | | | |
Net increase | | | 18,156 | | | $ | 199,993 | | | | | | — | | | | — | |
| | | | | | | | | | |
| | | | | | | | | | | | | | | | | | |
| Investor A | | | | | | | | | | | | | | | | | | |
Shares sold | | | 9,867 | | | $ | 109,054 | | | | | | 17,145 | | | $ | 190,231 | |
Shares issued to shareholders in reinvestment of distributions | | | 818 | | | | 8,601 | | | | | | 134 | | | | 1,470 | |
Shares redeemed | | | (4,977 | ) | | | (55,058 | ) | | | | | (1,777 | ) | | | (19,705 | ) |
| | | | | | | | | | |
Net increase | | | 5,708 | | | $ | 62,597 | | | | | | 15,502 | | | $ | 171,996 | |
| | | | | | | | | | |
Total Net Increase | | | 23,864 | | | $ | 262,590 | | | | | | 15,502 | | | $ | 171,996 | |
| | | | | | | | | | |
| | | |
| | | Six Months Ended
April 30, 2016 | | | | | Year Ended
October 31, 2015 | |
| CoRI 2017 Fund | | Shares | | | Amount | | | | | Shares | | | Amount | |
| Institutional | | | | | | | | | | | | | | | | | | |
Shares sold | | | — | | | | — | | | | | | — | | | | — | |
Shares issued to shareholders in reinvestment of distributions | | | — | | | | — | | | | | | 33 | | | $ | 373 | |
Shares redeemed | | | — | | | | — | | | | | | (971 | ) | | | (10,917 | ) |
| | | | | | | | | | |
Net decrease | | | — | | | | — | | | | | | (938 | ) | | $ | (10,544 | ) |
| | | | | | | | | | |
| | | | | | | | | | | | | | | | | | |
| Investor A | | | | | | | | | | | | | | | | | | |
Shares sold | | | 25,845 | | | $ | 286,897 | | | | | | 15,110 | | | $ | 169,628 | |
Shares issued to shareholders in reinvestment of distributions | | | 1,091 | | | | 11,493 | | | | | | 459 | | | | 5,155 | |
Shares redeemed | | | (2,697 | ) | | | (29,881 | ) | | | | | (10,721 | ) | | | (116,871 | ) |
| | | | | | | | | | |
Net increase | | | 24,239 | | | $ | 268,509 | | | | | | 4,848 | | | $ | 57,912 | |
| | | | | | | | | | |
Total Net Increase | | | 24,239 | | | $ | 268,509 | | | | | | 3,910 | | | $ | 47,368 | |
| | | | | | | | | | |
| | | |
| | | Six Months Ended
April 30, 2016 | | | | | Year Ended
October 31, 2015 | |
| CoRI 2019 Fund | | Shares | | | Amount | | | | | Shares | | | Amount | |
| Institutional | | | | | | | | | | | | | | | | | | |
Shares sold | | | — | | | | — | | | | | | 549 | | | $ | 6,348 | |
Shares issued to shareholders in reinvestment of distributions | | | 643 | | | $ | 6,830 | | | | | | 538 | | | | 6,145 | |
Shares redeemed | | | (1,984 | ) | | | (21,774 | ) | | | | | (1,768 | ) | | | (20,879 | ) |
| | | | | | | | | | |
Net decrease | | | (1,341 | ) | | $ | (14,944 | ) | | | | | (681 | ) | | $ | (8,386 | ) |
| | | | | | | | | | |
| | | | | | | | | | | | | | | | | | |
| Investor A | | | | | | | | | | | | | | | | | | |
Shares sold | | | 30,006 | | | $ | 339,671 | | | | | | 48,802 | | | $ | 554,434 | |
Shares issued to shareholders in reinvestment of distributions | | | 3,582 | | | | 38,146 | | | | | | 726 | | | | 8,301 | |
Shares redeemed | | | (11,318 | ) | | | (127,152 | ) | | | | | (10,404 | ) | | | (117,462 | ) |
| | | | | | | | | | |
Net increase | | | 22,270 | | | $ | 250,665 | | | | | | 39,124 | | | $ | 445,273 | |
| | | | | | | | | | |
Total Net Increase | | | 20,929 | | | $ | 235,721 | | | | | | 38,443 | | | $ | 436,887 | |
| | | | | | | | | | |
| | | | | | |
| | | | | | | |
| 56 | | BLACKROCK CORI FUNDS | | APRIL 30, 2016 | | |
| | | | |
| Notes to Financial Statements (concluded) | | |
| | | | | | | | | | | | | | | | | | |
| | | Six Months Ended
April 30, 2016 | | | | | Year Ended
October 31, 2015 | |
| CoRI 2021 Fund | | Shares | | | Amount | | | | | Shares | | | Amount | |
| Institutional | | | | | | | | | | | | | | | | | | |
Shares sold | | | 54 | | | $ | 600 | | | | | | 103 | | | $ | 1,200 | |
Shares issued to shareholders in reinvestment of distributions | | | 18 | | | | 191 | | | | | | 7 | | | | 79 | |
Shares redeemed | | | — | | | | — | | | | | | — | | | | — | |
| | | | | | | | | | |
Net increase | | | 72 | | | $ | 791 | | | | | | 110 | | | $ | 1,279 | |
| | | | | | | | | | |
| | | | | | | | | | | | | | | | | | |
| Investor A | | | | | | | | | | | | | | | | | | |
Shares sold | | | 92,251 | | | $ | 1,023,861 | | | | | | 40,031 | | | $ | 467,191 | |
Shares issued to shareholders in reinvestment of distributions | | | 3,348 | | | | 35,526 | | | | | | 417 | | | | 4,826 | |
Shares redeemed | | | (85,418 | ) | | | (969,914 | ) | | | | | (3,884 | ) | | | (44,051 | ) |
| | | | | | | | | | |
Net increase | | | 10,181 | | | $ | 89,473 | | | | | | 36,564 | | | $ | 427,966 | |
| | | | | | | | | | |
Total Net Increase | | | 10,253 | | | $ | 90,264 | | | | | | 36,674 | | | $ | 429,245 | |
| | | | | | | | | | |
| | | | | | | | | | | | | | | | | | |
| | | Six Months Ended
April 30, 2016 | | | | | Year Ended
October 31, 2015 | |
| CoRI 2023 Fund | | Shares | | | Amount | | | | | Shares | | | Amount | |
| Institutional | | | | | | | | | | | | | | | | | | |
Shares sold | | | 15,453 | | | $ | 175,989 | | | | | | 82,739 | | | $ | 954,056 | |
Shares issued to shareholders in reinvestment of distributions | | | — | | | | — | | | | | | 51 | | | | 598 | |
Shares redeemed | | | (83,260 | ) | | | (938,177 | ) | | | | | (1,312 | ) | | | (15,256 | ) |
| | | | | | | | | | |
Net increase (decrease) | | | (67,807 | ) | | $ | (762,188 | ) | | | | | 81,478 | | | $ | 939,398 | |
| | | | | | | | | | |
| | | | | | | | | | | | | | | | | | |
| Investor A | | | | | | | | | | | | | | | | | | |
Shares sold | | | 36,780 | | | $ | 419,566 | | | | | | 307,705 | | | $ | 3,695,912 | |
Shares issued to shareholders in reinvestment of distributions | | | 11,712 | | | | 127,192 | | | | | | 1,043 | | | | 12,318 | |
Shares redeemed | | | (212,953 | ) | | | (2,321,734 | ) | | | | | (98,655 | ) | | | (1,154,538 | ) |
| | | | | | | | | | |
Net increase (decrease) | | | (164,461 | ) | | $ | (1,774,976 | ) | | | | | 210,093 | | | $ | 2,553,692 | |
| | | | | | | | | | |
Total Net Increase (Decrease) | | | (232,268 | ) | | $ | (2,537,164 | ) | | | | | 291,571 | | | $ | 3,493,090 | |
| | | | | | | | | | |
At April 30, 2016, shares owned by BlackRock HoldCo 2, Inc., an affiliate of the Funds, were as follows:
| | | | | | | | | | | | | | | | | | | | |
| | | CoRI 2015
Fund | | | CoRI 2017
Fund | | | CoRI 2019
Fund | | | CoRI 2021
Fund | | | CoRI 2023
Fund | |
Institutional | | | 998,000 | | | | 998,000 | | | | 998,000 | | | | 998,000 | | | | 998,000 | |
Investor A | | | 2,000 | | | | 2,000 | | | | 2,000 | | | | 2,000 | | | | 2,000 | |
12. Subsequent Events:
Management has evaluated the impact of all subsequent events on the Funds through the date the financial statements were issued and has determined that there were no subsequent events requiring adjustment or additional disclosure in the financial statements.
| | | | | | |
| | | | | | | |
| | BLACKROCK CORI FUNDS | | APRIL 30, 2016 | | 57 |
Robert M. Hernandez, Chair of the Board and Trustee
Fred G. Weiss, Vice Chair of the Board and Trustee
James H. Bodurtha, Trustee
Bruce R. Bond, Trustee
Valerie G. Brown, Trustee
Donald W. Burton, Trustee
Honorable Stuart E. Eizenstat, Trustee
Kenneth A. Froot, Trustee
John F. O’Brien, Trustee
Donald C. Opatrny, Trustee
Roberta Cooper Ramo, Trustee
David H. Walsh, Trustee
Robert Fairbairn, Trustee
Henry Gabbay, Trustee
John M. Perlowski, Trustee, President and Chief Executive Officer
Jennifer McGovern, Vice President
Neal J. Andrews, Chief Financial Officer
Jay M. Fife, Treasurer
Charles Park, Chief Compliance Officer
Fernanda Piedra, Anti-Money Laundering Compliance Officer
Benjamin Archibald, Secretary
Effective May 6, 2016, Valerie G. Brown resigned as a Trustee of the Trust.
Effective May 10, 2016, Kenneth A. Froot resigned as a Trustee of the Trust.
On June 2, 2016, the Board appointed Henry R. Keizer as a Trustee of the Trust, effective July 28, 2016.
| | | | | | |
| | | | |
Investment Advisor
and Administrator BlackRock Advisors, LLC
Wilmington, DE 19809 | | Transfer Agent BNY Mellon Investment Servicing (US) Inc. Wilmington, DE 19809 | | Distributor BlackRock Investments, LLC New York, NY 10022 | | Legal Counsel Willkie Farr & Gallagher LLP New York, NY 10019 |
| | | |
Sub-Advisor BlackRock International Limited Edinburgh, EH3 8BL
United Kingdom | | Custodian and
Accounting Agent State Street Bank and Trust Company Boston, MA 02110 | | Independent Registered
Public Accounting Firm Deloitte & Touche LLP Boston, MA 02116 | | Address of the Funds 100 Bellevue Parkway Wilmington, DE 19809 |
| | | | | | |
| | | | | | | |
| 58 | | BLACKROCK CORI FUNDS | | APRIL 30, 2016 | | |
Householding
The Funds will mail only one copy of shareholder documents, including prospectuses, annual and semi-annual reports and proxy statements, to shareholders with multiple accounts at the same address. This practice is commonly called “householding” and is intended to reduce expenses and eliminate duplicate mailings of shareholder documents. Mailings of your shareholder documents may be householded indefinitely unless you instruct us otherwise. If you do not want the mailing of these documents to be combined with those for other members of your household, please call the Funds at (800) 441-7762.
Availability of Quarterly Schedule of Investments
The Funds file their complete schedule of portfolio holdings with the SEC for the first and third quarters of each fiscal year on Form N-Q. The Funds’ Forms N-Q are available on the SEC’s website at http://www.sec.gov and may also be reviewed and copied at the SEC’s Public Reference Room in Washington, D.C. Information on how to access documents on the SEC’s website without charge may be obtained by calling (800) SEC-0330. The Funds’ Forms N-Q may also be obtained upon request and without charge by calling (800) 441-7762.
Availability of Proxy Voting Policies and Procedures
A description of the policies and procedures that the Funds use to determine how to vote proxies relating to portfolio securities is available upon request and without charge (1) by calling (800) 441-7762; (2) at http://www.blackrock.com; and (3) on the SEC’s website at http://www.sec.gov.
Availability of Proxy Voting Record
Information about how the Funds voted proxies relating to securities held in the Funds’ portfolios during the most recent 12-month period ended June 30 is available upon request and without charge (1) at http://www.blackrock.com; or by calling (800) 441-7762 and (2) on the SEC’s website at http://www.sec.gov.
BlackRock’s Mutual Fund Family
BlackRock offers a diverse lineup of open-end mutual funds crossing all investment styles and managed by experts in equity, fixed income and tax-exempt investing. Visit http://www.blackrock.com for more information.
| | | | | | |
| | | | | | | |
| | BLACKROCK CORI FUNDS | | APRIL 30, 2016 | | 59 |
| | |
| Additional Information (concluded) | | |
Account Information
Call us at (800) 441-7762 from 8:00 AM to 6:00 PM EST on any business day to get information about your account balances, recent transactions and share prices. You can also reach us on the Web at http://www.blackrock.com/funds.
Automatic Investment Plans
Investor Class shareholders who want to invest regularly can arrange to have $50 or more automatically deducted from their checking or savings account and invested in any of the BlackRock funds.
Systematic Withdrawal Plans
Investor Class shareholders can establish a systematic withdrawal plan and receive periodic payments of $50 or more from their BlackRock funds, as long as their account balance is at least $10,000.
Retirement Plans
Shareholders may make investments in conjunction with Traditional, Rollover, Roth, Coverdell, Simple IRAs, SEP IRAs and 403(b) Plans.
| | |
| BlackRock Privacy Principles | | |
BlackRock is committed to maintaining the privacy of its current and former fund investors and individual clients (collectively, “Clients”) and to safeguarding their non-public personal information. The following information is provided to help you understand what personal information BlackRock collects, how we protect that information and why in certain cases we share such information with select parties.
If you are located in a jurisdiction where specific laws, rules or regulations require BlackRock to provide you with additional or different privacy-related rights beyond what is set forth below, then BlackRock will comply with those specific laws, rules or regulations.
BlackRock obtains or verifies personal non-public information from and about you from different sources, including the following: (i) information we receive from you or, if applicable, your financial intermediary, on applications, forms or other documents; (ii) information about your transactions with us, our affiliates, or others; (iii) information we receive from a consumer reporting agency; and (iv) from visits to our websites.
BlackRock does not sell or disclose to non-affiliated third parties any non-public personal information about its Clients, except as permitted by law or as is necessary to respond to regulatory requests or to service Client accounts. These non-affiliated third parties are required to protect the confidentiality and security of this information and to use it only for its intended purpose.
We may share information with our affiliates to service your account or to provide you with information about other BlackRock products or services that may be of interest to you. In addition, BlackRock restricts access to non-public personal information about its Clients to those BlackRock employees with a legitimate business need for the information. BlackRock maintains physical, electronic and procedural safeguards that are designed to protect the non-public personal information of its Clients, including procedures relating to the proper storage and disposal of such information.
| | | | | | |
| | | | | | | |
| 60 | | BLACKROCK CORI FUNDS | | APRIL 30, 2016 | | |
This report is intended for current holders. It is not authorized for use as an offer of sale or a solicitation of an offer to buy shares of the Funds unless preceded or accompanied by the Funds’ current prospectus. Past performance results shown in this report should not be considered a representation of future performance. Investment returns and principal value of shares will fluctuate so that shares, when redeemed, may be worth more or less than their original cost. Statements and other information herein are as dated and are subject to change.

| | |
| CoRI-4/16-SAR | |  |
| Item 2 – | Code of Ethics – Not Applicable to this semi-annual report |
| Item 3 – | Audit Committee Financial Expert – Not Applicable to this semi-annual report |
| Item 4 – | Principal Accountant Fees and Services – Not Applicable to this semi-annual report |
| Item 5 – | Audit Committee of Listed Registrants – Not Applicable |
(a) The registrant’s Schedule of Investments is included as part of the Report to Stockholders filed under Item 1 of this Form.
(b) Not Applicable due to no such divestments during the semi-annual period covered since the previous
Form N-CSR filing.
| Item 7 – | Disclosure of Proxy Voting Policies and Procedures for Closed-End Management Investment Companies – Not Applicable |
| Item 8 – | Portfolio Managers of Closed-End Management Investment Companies – Not Applicable |
| Item 9 – | Purchases of Equity Securities by Closed-End Management Investment Company and Affiliated Purchasers – Not Applicable |
| Item 10 – | Submission of Matters to a Vote of Security Holders –There have been no material changes to these procedures. |
| Item 11 – | Controls and Procedures |
(a) – The registrant’s principal executive and principal financial officers, or persons performing similar functions, have concluded that the registrant’s disclosure controls and procedures (as defined in Rule 30a-3(c) under the Investment Company Act of 1940, as amended (the “1940 Act”)) are effective as of a date within 90 days of the filing of this report based on the evaluation of these controls and procedures required by
Rule 30a-3(b) under the 1940 Act and Rule 15d-15(b) under the Securities Exchange Act of 1934, as amended.
(b) – There were no changes in the registrant’s internal control over financial reporting (as defined in
Rule 30a-3(d) under the 1940 Act) that occurred during the second fiscal quarter of the period covered by this report that have materially affected, or are reasonably likely to materially affect, the registrant’s internal control over financial reporting.
| Item 12 – | Exhibits attached hereto |
(a)(1) – Code of Ethics – Not Applicable to this semi-annual report
(a)(2) – Certifications – Attached hereto
(a)(3) – Not Applicable
(b) – Certifications – Attached hereto
2
Pursuant to the requirements of the Securities Exchange Act of 1934 and the Investment Company Act of 1940, the registrant has duly caused this report to be signed on its behalf by the undersigned, thereunto duly authorized.
BlackRock CoRI Funds
| | | | | | |
| By: | | /s/ John M. Perlowski | | | | |
| | John M. Perlowski | | | | |
| | Chief Executive Officer (principal executive officer) of | | |
| | BlackRock CoRI Funds | | |
Date: July 1, 2016
Pursuant to the requirements of the Securities Exchange Act of 1934 and the Investment Company Act of 1940, this report has been signed below by the following persons on behalf of the registrant and in the capacities and on the dates indicated.
| | | | | | |
| By: | | /s/ John M. Perlowski | | | | |
| | John M. Perlowski | | | | |
| | Chief Executive Officer (principal executive officer) of BlackRock CoRI Funds | | |
Date: July 1, 2016
| | | | | | |
| By: | | /s/ Neal J. Andrews | | | | |
| | Neal J. Andrews | | | | |
| | Chief Financial Officer (principal financial officer) of | | |
| | BlackRock CoRI Funds | | |
Date: July 1, 2016
3