UNITED STATES
SECURITIES AND EXCHANGE COMMISSION
Washington, D.C. 20549
FORM N-CSR
CERTIFIED SHAREHOLDER REPORT OF REGISTERED MANAGEMENT
INVESTMENT COMPANIES
Investment Company Act file number: 811-22873
| Name of Fund: | BlackRock CoRI Funds |
BlackRock CoRI 2015 Fund
BlackRock CoRI 2017 Fund
BlackRock CoRI 2019 Fund
BlackRock CoRI 2021 Fund
BlackRock CoRI 2023 Fund
| Fund Address: | 100 Bellevue Parkway, Wilmington, DE 19809 |
Name and address of agent for service: John M. Perlowski, Chief Executive Officer, BlackRock CoRI Funds, 55 East 52nd Street, New York, NY 10055
Registrant’s telephone number, including area code: (800) 441-7762
Date of fiscal year end: 10/31/2016
Date of reporting period: 10/31/2016
Item 1 – Report to Stockholders
OCTOBER 31, 2016
ANNUAL REPORT
|  |
BlackRock CoRI Funds
| Ø | BlackRock CoRI 2015 Fund |
| Ø | BlackRock CoRI 2017 Fund |
| Ø | BlackRock CoRI 2019 Fund |
| Ø | BlackRock CoRI 2021 Fund |
| Ø | BlackRock CoRI 2023 Fund |
| Not FDIC Insured • May Lose Value • No Bank Guarantee |
| Table of Contents | ||||
| Page | ||||
| 3 | ||||
Annual Report: | ||||
| 4 | ||||
| 12 | ||||
| 12 | ||||
| 12 | ||||
| 13 | ||||
| 36 | ||||
| 37 | ||||
| 38 | ||||
| 41 | ||||
| 51 | ||||
| 60 | ||||
| 60 | ||||
Disclosure of Investment Advisory Agreement and Sub-Advisory Agreement | 61 | |||
| 65 | ||||
| 68 | ||||

| 2 | BLACKROCK CORI FUNDS | OCTOBER 31, 2016 |
| The Markets in Review |
Dear Shareholder,
Central bank policy decisions have continued to provide support to financial markets, while changing economic outlooks and geopolitical risks have been major drivers of investor sentiment. After ending its near-zero interest rate policy at the end of 2015, the Federal Reserve (the “Fed”) remained in focus as investors considered the anticipated pace of future rate hikes. With the European Central Bank and the Bank of Japan having moved into stimulus mode, the divergence in global monetary policies drove heightened market volatility at the beginning of 2016 and caused the U.S. dollar to strengthen considerably.
Financial markets had a rough start to the year as the strong dollar challenged U.S. companies that generate revenues overseas and pressured emerging market currencies and commodities prices. Low and volatile oil prices and signs of slowing growth in China were also meaningful factors behind the decline in risk assets early in the year. However, as the first quarter wore on, these pressures abated and a more tempered outlook for U.S. rate hikes helped the markets rebound.
Volatility spiked in late June when the United Kingdom shocked investors with its vote to leave the European Union. Uncertainty around how the British exit might affect the global economy and political landscape drove investors to high-quality assets, pushing already low global yields to even lower levels. However, risk assets recovered swiftly in July as economic data suggested that the consequences had thus far been contained to the United Kingdom.
In a second episode of surprise vote results, equities fell sharply after the news of Donald Trump’s victory in the U.S. presidential election, but quickly recovered, and the yield curve steepened due to expectations for rising inflation. Broadly, a reflation theme has been building amid signs of rising price pressures, central banks signaling a greater tolerance to let inflation run hotter, and policy emphasis shifting from monetary to fiscal stimulus.
At BlackRock, we believe investors need to think globally, extend their scope across a broad array of asset classes and be prepared to adjust accordingly as market conditions change over time. We encourage you to talk with your financial advisor and visit blackrock.com for further insight about investing in today’s markets.
Sincerely,

Rob Kapito
President, BlackRock Advisors, LLC

Rob Kapito
President, BlackRock Advisors, LLC
| Total Returns as of October 31, 2016 | ||||||||
| 6-month | 12-month | |||||||
U.S. large cap equities | 4.06 | % | 4.51 | % | ||||
U.S. small cap equities | 6.13 | 4.11 | ||||||
International equities | (0.16 | ) | (3.23 | ) | ||||
Emerging market equities | 9.41 | 9.27 | ||||||
3-month Treasury bills | 0.17 | 0.31 | ||||||
U.S. Treasury securities | 0.46 | 4.24 | ||||||
U.S. investment grade bonds | 1.51 | 4.37 | ||||||
Tax-exempt municipal | 0.98 | 4.53 | ||||||
U.S. high yield bonds | 7.59 | 10.16 | ||||||
| Past performance is no guarantee of future results. Index performance is shown for illustrative purposes only. You cannot invest directly in an index. | ||||||||
| THIS PAGE NOT PART OF YOUR FUND REPORT | 3 |
| Funds’ Summary as of October 31, 2016 | BlackRock CoRI Funds | |||
| Investment Objective |
The BlackRock CoRI Funds’ (the “Funds”) investment objective is to seek to provide long-term investment results that correspond to the total return of each Fund’s respective benchmark.
| Portfolio Management Commentary |
How did the Funds perform?
| • | For the 12-month period ended October 31, 2016, the Funds underperformed their respective Cost of Retirement Index benchmarks, while outperforming the Bloomberg Barclays U.S. Aggregate Bond Index. The following discussion of relative performance pertains to the Funds’ respective Cost of Retirement Index benchmarks. |
What factors influenced performance?
| • | The Funds were positioned to match the performance of their respective benchmarks. The sampling methodology used to replicate the return of its respective benchmark was the key factor in each Fund’s relative performance. With that said, the Funds were helped by having longer durations than their respective peer groups. (Duration is a measure of interest-rate sensitivity.) Longer-term bonds outperformed the overall market during the past 12 months, reflecting the environment of slow global growth. |
| • | The Funds utilized futures positions in order to manage interest rate exposure, which provided a modest positive impact to Fund performance during the period. |
Describe recent portfolio activity.
| • | In order to provide results that corresponded to each benchmarks’ total return, the Funds selected securities in accordance with their relative proportion within the respective benchmarks. The Funds also considered credit quality, industry, maturity structure, coupon rates and call features when selecting securities. |
| • | The Funds were rebalanced on a monthly basis to reflect changes in their respective benchmarks. Each Fund’s benchmark has its own time horizon, which affects its acceptable level of risk and, in turn, the strategic allocation of its holdings. The strategic allocation of each Fund’s benchmark is systematically adjusted on a monthly basis to reflect the remaining investment time horizon. |
Describe portfolio positioning at period end.
| • | As of period end, the Funds were positioned to match the risk and return characteristics of their respective benchmarks. |
| 4 | BLACKROCK CORI FUNDS | OCTOBER 31, 2016 |
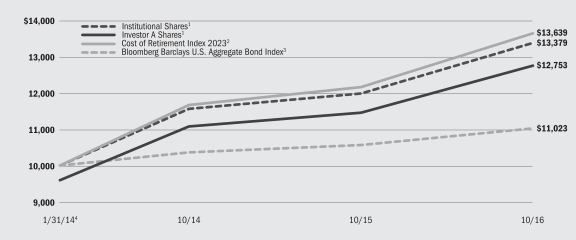
| BlackRock CoRI 2015 Fund |
| Total Return Based on a $10,000 Investment |
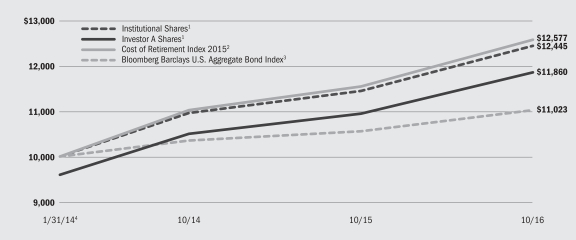
| 1 | Assuming maximum sales charges, if any, transaction costs and other operating expenses, including investment advisory fees and administration fees, if any. Institutional Shares do not have a sales charge. |
| 2 | An unmanaged total return index comprised of investment grade fixed-income securities, including corporate U.S. dollar-denominated bonds (issued by U.S. and non-U.S. entities), U.S. government bonds, and Treasuries (bonds and STRIPS). |
| 3 | A widely recognized unmanaged market-weighted index, comprised of investment-grade corporate bonds rated BBB or better, mortgages and U.S. Treasury and U.S. Government agency issues with at least one year to maturity. |
| 4 | Commencement of operations. |
| Performance Summary for the Period Ended October 31, 2016 |
| Average Annual Total Returns5 | ||||||||||||||||||||||||||||
| 1 Year | Since Inception6 | |||||||||||||||||||||||||||
Standardized 30-Day Yields | Unsubsidized 30-Day Yields | 6-Month Total Returns | w/o sales charge | w/sales charge | w/o sales charge | w/sales charge | ||||||||||||||||||||||
Institutional | 2.28 | % | 0.79 | % | 2.31 | % | 8.71 | % | N/A | 8.29 | % | N/A | ||||||||||||||||
Investor A | 1.95 | 0.31 | 2.14 | 8.36 | 4.02 | % | 8.00 | 6.40 | % | |||||||||||||||||||
Cost of Retirement Index 2015 | — | — | 2.49 | 8.89 | N/A | 8.69 | N/A | |||||||||||||||||||||
Bloomberg Barclays U.S. Aggregate Bond Index | — | — | 1.51 | 4.37 | N/A | 3.61 | N/A | |||||||||||||||||||||
| 5 | Assuming maximum sales charges, if any. Average annual total returns with and without sales charges reflect reductions for distribution and service fees. See “About Fund Performance” on page 12 for a detailed description of share classes, including any related sales charges and fees. |
| 6 | The Fund commenced operations on January 31, 2014. |
| N/A — Not applicable as share class and index do not have a sales charge. |
| Past performance is not indicative of future results. |
| Performance results may include adjustments made for financial reporting purposes in accordance with U.S. generally accepted accounting principles. |
| Expense Example |
| Actual | Hypothetical8 | |||||||||||||||||||||||||||
| Beginning Account Value May 1, 2016 | Ending Account Value October 31, 2016 | Expenses Paid During the Period7 | Beginning May 1, 2016 | Ending Account Value October 31, 2016 | Expenses Paid During the Period7 | Annualized Expense Ratio | ||||||||||||||||||||||
Institutional | $ | 1,000.00 | $ | 1,023.10 | $ | 1.27 | $ | 1,000.00 | $ | 1,023.88 | $ | 1.27 | 0.25 | % | ||||||||||||||
Investor A | $ | 1,000.00 | $ | 1,021.40 | $ | 2.54 | $ | 1,000.00 | $ | 1,022.62 | $ | 2.54 | 0.50 | % | ||||||||||||||
| 7 | For each class of the Fund, expenses are equal to the annualized expense ratio for the class, multiplied by the average account value over the period, multiplied by 184/366 (to reflect the one-half year period shown). |
| 8 | Hypothetical 5% annual return before expenses is calculated by prorating the number of days in the most recent fiscal half year divided by 366. |
| See “Disclosure of Expenses” on page 12 for further information on how expenses were calculated. |
| BLACKROCK CORI FUNDS | OCTOBER 31, 2016 | 5 |
| BlackRock CoRI 2017 Fund | ||||
| Total Return Based on a $10,000 Investment |
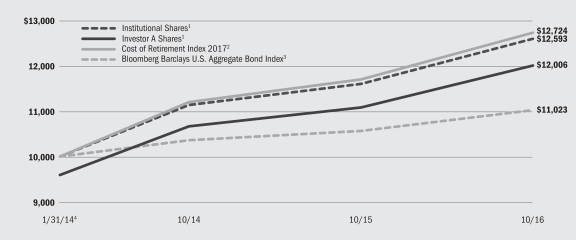
| 1 | Assuming maximum sales charges, if any, transaction costs and other operating expenses, including investment advisory fees and administration fees, if any. Institutional Shares do not have a sales charge. |
| 2 | An unmanaged total return index comprised of investment grade fixed-income securities, including corporate U.S. dollar-denominated bonds (issued by U.S. and non-U.S. entities), U.S. government bonds, and Treasuries (bonds and STRIPS). |
| 3 | A widely recognized unmanaged market-weighted index, comprised of investment-grade corporate bonds rated BBB or better, mortgages and U.S. Treasury and U.S. Government agency issues with at least one year to maturity. |
| 4 | Commencement of operations. |
| Performance Summary for the Period Ended October 31, 2016 |
| Average Annual Total Returns5 | ||||||||||||||||||||||||||||
| 1 Year | Since Inception6 | |||||||||||||||||||||||||||
Standardized 30-Day Yields | Unsubsidized 30-Day Yields | 6-Month Total Returns | w/o sales charge | w/sales charge | w/o sales charge | w/sales charge | ||||||||||||||||||||||
Institutional | 2.36 | % | 0.89 | % | 2.13 | % | 8.60 | % | N/A | 8.75 | % | N/A | ||||||||||||||||
Investor A | 2.03 | 0.52 | 1.96 | 8.32 | 3.99 | % | 8.48 | 6.88 | % | |||||||||||||||||||
Cost of Retirement Index 2017 | — | — | 2.33 | 8.79 | N/A | 9.16 | N/A | |||||||||||||||||||||
Bloomberg Barclays U.S. Aggregate Bond Index | — | — | 1.51 | 4.37 | N/A | 3.61 | N/A | |||||||||||||||||||||
| 5 | Assuming maximum sales charges, if any. Average annual total returns with and without sales charges reflect reductions for distribution and service fees. See “About Fund Performance” on page 12 for a detailed description of share classes, including any related sales charges and fees. |
| 6 | The Fund commenced operations on January 31, 2014. |
| N/A — Not applicable as share class and index do not have a sales charge. |
| Past performance is not indicative of future results. |
| Performance results may include adjustments made for financial reporting purposes in accordance with U.S. generally accepted accounting principles. |
| Expense Example |
| Actual | Hypothetical8 | |||||||||||||||||||||||||||
Beginning Account Value May 1, 2016 | Ending Account Value October 31, 2016 | Expenses Paid During the Period7 | Beginning Account Value May 1, 2016 | Ending Account Value October 31, 2016 | Expenses Paid During the Period7 | Annualized Expense Ratio | ||||||||||||||||||||||
Institutional | $ | 1,000.00 | $ | 1,021.30 | $ | 1.27 | $ | 1,000.00 | $ | 1,023.88 | $ | 1.27 | 0.25 | % | ||||||||||||||
Investor A | $ | 1,000.00 | $ | 1,019.60 | $ | 2.54 | $ | 1,000.00 | $ | 1,022.62 | $ | 2.54 | 0.50 | % | ||||||||||||||
| 7 | For each class of the Fund, expenses are equal to the annualized expense ratio for the class, multiplied by the average account value over the period, multiplied by 184/366 (to reflect the one-half year period shown). |
| 8 | Hypothetical 5% annual return before expenses is calculated by prorating the number of days in the most recent fiscal half year divided by 366. |
| See “Disclosure of Expenses” on page 12 for further information on how expenses were calculated. |
| 6 | BLACKROCK CORI FUNDS | OCTOBER 31, 2016 |
| BlackRock CoRI 2019 Fund |
| Total Return Based on a $10,000 Investment |
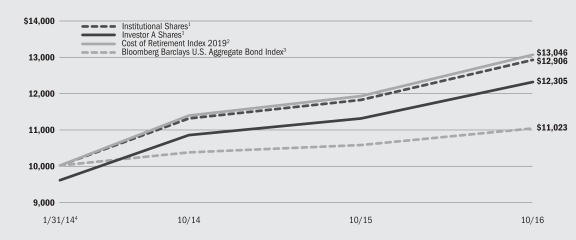
| 1 | Assuming maximum sales charges, if any, transaction costs and other operating expenses, including investment advisory fees and administration fees, if any. Institutional Shares do not have a sales charge. |
| 2 | An unmanaged total return index comprised of investment grade fixed-income securities, including corporate U.S. dollar-denominated bonds (issued by U.S. and non-U.S. entities), U.S. government bonds, and Treasuries (bonds and STRIPS). |
| 3 | A widely recognized unmanaged market-weighted index, comprised of investment-grade corporate bonds rated BBB or better, mortgages and U.S. Treasury and U.S. Government agency issues with at least one year to maturity. |
| 4 | Commencement of operations. |
| Performance Summary for the Period Ended October 31, 2016 |
| Average Annual Total Returns5 | ||||||||||||||||||||||||||||
| 1 Year | Since Inception6 | |||||||||||||||||||||||||||
| Standardized 30-Day Yields | Unsubsidized 30-Day Yields | 6-Month Total Returns | w/o sales charge | w/sales charge | w/o sales charge | w/sales charge | ||||||||||||||||||||||
Institutional | 2.55 | % | 1.18 | % | 2.28 | % | 9.28 | % | N/A | 9.73 | % | N/A | ||||||||||||||||
Investor A | 2.20 | 0.82 | 2.10 | 8.94 | 4.58 | % | 9.45 | 7.84 | % | |||||||||||||||||||
Cost of Retirement Index 2019 | — | — | 2.57 | 9.51 | N/A | 10.15 | N/A | |||||||||||||||||||||
Bloomberg Barclays U.S. Aggregate Bond Index | — | — | 1.51 | 4.37 | N/A | 3.61 | N/A | |||||||||||||||||||||
| 5 | Assuming maximum sales charges, if any. Average annual total returns with and without sales charges reflect reductions for distribution and service fees. See “About Fund Performance” on page 12 for a detailed description of share classes, including any related sales charges and fees. |
| 6 | The Fund commenced operations on January 31, 2014. |
| N/A — Not applicable as share class and index do not have a sales charge. |
| Past performance is not indicative of future results. |
| Performance results may include adjustments made for financial reporting purposes in accordance with U.S. generally accepted accounting principles. |
| Expense Example |
| Actual | Hypothetical8 | |||||||||||||||||||||||||||
Beginning Account Value May 1, 2016 | Ending Account Value | Expenses Paid During the Period7 | Beginning Account Value May 1, 2016 | Ending Account Value | Expenses Paid During the Period7 | Annualized Expense Ratio | ||||||||||||||||||||||
Institutional | $ | 1,000.00 | $ | 1,022.80 | $ | 1.27 | $ | 1,000.00 | $ | 1,023.88 | $ | 1.27 | 0.25 | % | ||||||||||||||
Investor A | $ | 1,000.00 | $ | 1,021.00 | $ | 2.54 | $ | 1,000.00 | $ | 1,022.62 | $ | 2.54 | 0.50 | % | ||||||||||||||
| 7 | For each class of the Fund, expenses are equal to the annualized expense ratio for the class, multiplied by the average account value over the period, multiplied by 184/366 (to reflect the one-half year period shown). |
| 8 | Hypothetical 5% annual return before expenses is calculated by prorating the number of days in the most recent fiscal half year divided by 366. |
| See “Disclosure of Expenses” on page 12 for further information on how expenses were calculated. |
| BLACKROCK CORI FUNDS | OCTOBER 31, 2016 | 7 |
| BlackRock CoRI 2021 Fund | ||||
| Total Return Based on a $10,000 Investment |
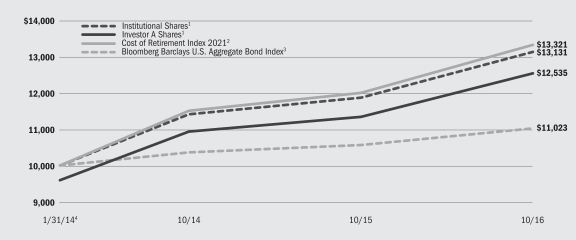
| 1 | Assuming maximum sales charges, if any, transaction costs and other operating expenses, including investment advisory fees and administration fees, if any. Institutional Shares do not have a sales charge. |
| 2 | An unmanaged total return index comprised of investment grade fixed-income securities, including corporate U.S. dollar-denominated bonds (issued by U.S. and non-U.S. entities), U.S. government bonds, and Treasuries (bonds and STRIPS). |
| 3 | A widely recognized unmanaged market-weighted index, comprised of investment-grade corporate bonds rated BBB or better, mortgages and U.S. Treasury and U.S. Government agency issues with at least one year to maturity. |
| 4 | Commencement of operations. |
| Performance Summary for the Period Ended October 31, 2016 |
| Average Annual Total Returns5 | ||||||||||||||||||||||||||||
| 1 Year | Since Inception6 | |||||||||||||||||||||||||||
| Standardized 30-Day Yields | Unsubsidized 30-Day Yields | 6-Month Total Returns | w/o sales charge | w/sales charge | w/o sales charge | w/sales charge | ||||||||||||||||||||||
Institutional | 2.78 | % | 1.41 | % | 2.78 | % | 10.63 | % | N/A | 10.42 | % | N/A | ||||||||||||||||
Investor A | 2.43 | 0.93 | 2.61 | 10.50 | 6.08 | % | 10.19 | 8.57 | % | |||||||||||||||||||
Cost of Retirement Index 2021 | — | — | 3.14 | 11.02 | N/A | 10.99 | N/A | |||||||||||||||||||||
Bloomberg Barclays U.S. Aggregate Bond Index | — | — | 1.51 | 4.37 | N/A | 3.61 | N/A | |||||||||||||||||||||
| 5 | Assuming maximum sales charges, if any. Average annual total returns with and without sales charges reflect reductions for distribution and service fees. See “About Fund Performance” on page 12 for a detailed description of share classes, including any related sales charges and fees. |
| 6 | The Fund commenced operations on January 31, 2014. |
| N/A — Not applicable as share class and index do not have a sales charge. |
| Past performance is not indicative of future results. |
| Performance results may include adjustments made for financial reporting purposes in accordance with U.S. generally accepted accounting principles. |
| Expense Example |
| Actual | Hypothetical8 | |||||||||||||||||||||||||||
Beginning Account Value | Ending Account Value | Expenses Paid During the Period7 | Beginning Account Value | Ending Account Value | Expenses Paid During the Period7 | Annualized Expense Ratio | ||||||||||||||||||||||
Institutional | $ | 1,000.00 | $ | 1,027.80 | $ | 1.27 | $ | 1,000.00 | $ | 1,023.88 | $ | 1.27 | 0.25 | % | ||||||||||||||
Investor A | $ | 1,000.00 | $ | 1,026.10 | $ | 2.55 | $ | 1,000.00 | $ | 1,022.62 | $ | 2.54 | 0.50 | % | ||||||||||||||
| 7 | For each class of the Fund, expenses are equal to the annualized expense ratio for the class, multiplied by the average account value over the period, multiplied by 184/366 (to reflect the one-half year period shown). |
| 8 | Hypothetical 5% annual return before expenses is calculated by prorating the number of days in the most recent fiscal half year divided by 366. |
| See “Disclosure of Expenses” on page 12 for further information on how expenses were calculated. |
| 8 | BLACKROCK CORI FUNDS | OCTOBER 31, 2016 |
| BlackRock CoRI 2023 Fund |
| Total Return Based on a $10,000 Investment |
| 1 | Assuming maximum sales charges, if any, transaction costs and other operating expenses, including investment advisory fees and administration fees, if any. Institutional Shares do not have a sales charge. |
| 2 | An unmanaged total return index comprised of investment grade fixed-income securities, including corporate U.S. dollar-denominated bonds (issued by U.S. and non-U.S. entities), U.S. government bonds, and Treasuries (bonds and STRIPS). |
| 3 | A widely recognized unmanaged market-weighted index, comprised of investment-grade corporate bonds rated BBB or better, mortgages and U.S. Treasury and U.S. Government agency issues with at least one year to maturity. |
| 4 | Commencement of operations. |
| Performance Summary for the Period Ended October 31, 2016 |
| Average Annual Total Returns5 | ||||||||||||||||||||||||||||
| 1 Year | Since Inception6 | |||||||||||||||||||||||||||
| Standardized 30-Day Yields | Unsubsidized 30-Day Yields | 6-Month Total Returns | w/o sales charge | w/sales charge | w/o sales charge | w/sales charge | ||||||||||||||||||||||
Institutional | 2.94 | % | 1.80 | % | 3.03 | % | 11.66 | % | N/A | 11.17 | % | N/A | ||||||||||||||||
Investor A | 2.57 | 1.49 | 2.87 | 11.35 | 6.90 | % | 10.89 | 9.25 | % | |||||||||||||||||||
Cost of Retirement Index 2023 | — | — | 3.60 | 12.19 | N/A | 11.95 | N/A | |||||||||||||||||||||
Bloomberg Barclays U.S. Aggregate Bond Index | — | — | 1.51 | 4.37 | N/A | 3.61 | N/A | |||||||||||||||||||||
| 5 | Assuming maximum sales charges, if any. Average annual total returns with and without sales charges reflect reductions for distribution and service fees. See “About Fund Performance” on page 12 for a detailed description of share classes, including any related sales charges and fees. |
| 6 | The Fund commenced operations on January 31, 2014. |
| N/A — Not applicable as share class and index do not have a sales charge. |
| Past performance is not indicative of future results. |
| Performance results may include adjustments made for financial reporting purposes in accordance with U.S. generally accepted accounting principles. |
| Expense Example |
| Actual | Hypothetical8 | |||||||||||||||||||||||||||
| Beginning Account Value May 1, 2016 | Ending Account Value October 31, 2016 | Expenses Paid During the Period7 | Beginning Account Value May 1, 2016 | Ending Account Value October 31, 2016 | Expenses Paid During the Period7 | Annualized Expense Ratio | ||||||||||||||||||||||
Institutional | $ | 1,000.00 | $ | 1,030.30 | $ | 1.28 | $ | 1,000.00 | $ | 1,023.88 | $ | 1.27 | 0.25 | % | ||||||||||||||
Investor A | $ | 1,000.00 | $ | 1,028.70 | $ | 2.55 | $ | 1,000.00 | $ | 1,022.62 | $ | 2.54 | 0.50 | % | ||||||||||||||
| 7 | For each class of the Fund, expenses are equal to the annualized expense ratio for the class, multiplied by the average account value over the period, multiplied by 184/366 (to reflect the one-half year period shown). |
| 8 | Hypothetical 5% annual return before expenses is calculated by prorating the number of days in the most recent fiscal half year divided by 366. |
| See “Disclosure of Expenses” on page 12 for further information on how expenses were calculated. |
| BLACKROCK CORI FUNDS | OCTOBER 31, 2016 | 9 |
| BlackRock CoRI 2015 Fund | ||||
| Overview of the Fund’s Total Investments |
| Portfolio Composition | 10/31/16 | |||
U.S. Treasury Obligations | 62 | % | ||
Corporate Bonds | 38 | |||
| Credit Quality Allocation1 | 10/31/16 | |||
AAA/Aaa2 | 62 | % | ||
AA/Aa | 3 | |||
A | 19 | |||
BBB/Baa | 16 | |||
| 1 | For financial reporting purposes, credit quality ratings shown above reflect the highest rating assigned by either Standard & Poor’s (“S&P”) or Moody’s Investors Service (“Moody’s”) if ratings differ. These rating agencies are independent, nationally recognized statistical rating organizations and are widely used. Investment grade ratings are credit ratings of BBB/Baa or higher. Below investment grade ratings are credit ratings of BB/Ba or lower. Credit quality ratings are subject to change. |
| 2 | Includes U.S. Treasury Obligations which are deemed AAA/Aaa by the investment adviser. |
BlackRock CoRI 2017 Fund
| Overview of the Fund’s Total Investments |
| Portfolio Composition | 10/31/16 | |||
U.S. Treasury Obligations | 64 | % | ||
Corporate Bonds | 36 | |||
| Credit Quality Allocation1 | 10/31/16 | |||
AAA/Aaa2 | 64 | % | ||
AA/Aa | 2 | |||
A | 18 | |||
BBB/Baa | 16 | |||
| 1 | For financial reporting purposes, credit quality ratings shown above reflect the highest rating assigned by either S&P or Moody’s if ratings differ. These rating agencies are independent, nationally recognized statistical rating organizations and are widely used. Investment grade ratings are credit ratings of BBB/Baa or higher. Below investment grade ratings are credit ratings of BB/Ba or lower. Credit quality ratings are subject to change. |
| 2 | Includes U.S. Treasury Obligations which are deemed AAA/Aaa by the investment adviser. |
BlackRock CoRI 2019 Fund
| Overview of the Fund’s Total Investments |
| Portfolio Composition | 10/31/16 | |||
U.S. Treasury Obligations | 66 | % | ||
Corporate Bonds | 34 | |||
| Credit Quality Allocation1 | 10/31/16 | |||
AAA/Aaa2 | 66 | % | ||
AA/Aa | 2 | |||
A | 17 | |||
BBB/Baa | 15 | |||
| 1 | For financial reporting purposes, credit quality ratings shown above reflect the highest rating assigned by either S&P or Moody’s if ratings differ. These rating agencies are independent, nationally recognized statistical rating organizations and are widely used. Investment grade ratings are credit ratings of BBB/Baa or higher. Below investment grade ratings are credit ratings of BB/Ba or lower. Credit quality ratings are subject to change. |
| 2 | Includes U.S. Treasury Obligations which are deemed AAA/Aaa by the investment adviser. |
| 10 | BLACKROCK CORI FUNDS | OCTOBER 31, 2016 |
| BlackRock CoRI 2021 Fund |
| Overview of the Fund’s Total Investments |
| Portfolio Composition | 10/31/16 | |||
U.S. Treasury Obligations | 64 | % | ||
Corporate Bonds | 36 | |||
| Credit Quality Allocation1 | 10/31/16 | |||
AAA/Aaa2 | 64 | % | ||
AA/Aa | 2 | |||
A | 19 | |||
BBB/Baa | 15 | |||
| 1 | For financial reporting purposes, credit quality ratings shown above reflect the highest rating assigned by either S&P or Moody’s if ratings differ. These rating agencies are independent, nationally recognized statistical rating organizations and are widely used. Investment grade ratings are credit ratings of BBB/Baa or higher. Below investment grade ratings are credit ratings of BB/Ba or lower. Credit quality ratings are subject to change. |
| 2 | Includes U.S. Treasury Obligations which are deemed AAA/Aaa by the investment adviser. |
BlackRock CoRI 2023 Fund
| Overview of the Fund’s Total Investments |
| Portfolio Composition | 10/31/16 | |||
U.S. Treasury Obligations | 59 | % | ||
Corporate Bonds | 41 | |||
| Credit Quality Allocation1 | 10/31/16 | |||
AAA/Aaa2 | 59 | % | ||
AA/Aa | 3 | |||
A | 22 | |||
BBB/Baa | 16 | |||
| 1 | For financial reporting purposes, credit quality ratings shown above reflect the highest rating assigned by either S&P or Moody’s if ratings differ. These rating agencies are independent, nationally recognized statistical rating organizations and are widely used. Investment grade ratings are credit ratings of BBB/Baa or higher. Below investment grade ratings are credit ratings of BB/Ba or lower. Credit quality ratings are subject to change. |
| 2 | Includes U.S. Treasury Obligations which are deemed AAA/Aaa by the investment adviser. |
| BLACKROCK CORI FUNDS | OCTOBER 31, 2016 | 11 |
| About Fund Performance |
| • | Institutional Shares are not subject to any sales charge. These shares bear no ongoing distribution or service fees and are available only to certain eligible investors. |
| • | Investor A Shares are subject to a maximum initial sales charge (front-end load) of 4.00% and a service fee of 0.25% per year (but no distribution fee). Certain redemptions of these shares may be subject to a contingent deferred sales charge (“CDSC”) where no initial sales charge was paid at the time of purchase. These shares are generally available through financial intermediaries. |
Performance information reflects past performance and does not guarantee future results. Current performance may be lower or higher than the performance data quoted. Refer to www.blackrock.com/funds to obtain performance data current to the most recent month end. Performance results do not reflect the deduction of taxes that a shareholder would pay on fund distributions or the redemption of fund shares. Figures shown in the performance tables on the previous pages
assume reinvestment of all distributions, if any, at net asset value (“NAV”) on the ex-dividend date. Investment return and principal value of shares will fluctuate so that shares, when redeemed, may be worth more or less than their original cost. Distributions paid to each class of shares will vary because of the different levels of service, distribution and transfer agency fees applicable to each class, which are deducted from the income available to be paid to shareholders.
BlackRock Advisors, LLC (the “Manager”), each Fund’s investment adviser, has contractually agreed to waive and/or reimburse a portion of the Funds’ expenses. Without such waiver and/or reimbursement, the Funds’ performance would have been lower. The Manager is under no obligation to continue waiving and/or reimbursing its fees after the applicable termination date of such agreement. See Note 6 of the Notes to Financial Statements for additional information on waivers and/or reimbursements. The standardized 30-day yield includes the effects of any waivers and/or reimbursements. The unsubsidized 30-day yield excludes the effects of any waivers and/or reimbursements.
| Disclosure of Expenses |
Shareholders of these Funds may incur the following charges: (a) transactional expenses, such as sales charges; and (b) operating expenses, including investment advisory fees, service and distribution fees, including 12b-1 fees, acquired fund fees and expenses, and other fund expenses. The expense examples on previous pages (which are based on a hypothetical investment of $1,000 invested on May 1, 2016 and held through October 31, 2016) are intended to assist shareholders both in calculating expenses based on an investment in each Fund and in comparing these expenses with similar costs of investing in other mutual funds.
The expense examples provide information about actual account values and actual expenses. In order to estimate the expenses a shareholder paid during the period covered by this report, shareholders can divide their account value by $1,000 and then multiply the result by the number corresponding to their Fund and share class under the heading entitled “Expenses Paid During the Period.”
The expense examples also provide information about hypothetical account values and hypothetical expenses based on a Fund’s actual expense ratio and an assumed rate of return of 5% per year before expenses. In order to assist shareholders in comparing the ongoing expenses of investing in these Funds and other funds, compare the 5% hypothetical examples with the 5% hypothetical examples that appear in shareholder reports of other funds.
The expenses shown in the expense examples are intended to highlight shareholders’ ongoing costs only and do not reflect any transactional expenses, such as sales charges, if any. Therefore, the hypothetical examples are useful in comparing ongoing expenses only, and will not help shareholders determine the relative total expenses of owning different funds. If these transactional expenses were included, shareholder expenses would have been higher.
| Derivative Financial Instruments |
The Funds may invest in various derivative financial instruments. These instruments are used to obtain exposure to a security, commodity, index, market, and/or other asset without owning or taking physical custody of securities, commodities, and/or other referenced assets or to manage market, equity, credit, interest rate, foreign currency exchange rate, commodity and/or other risks. Derivative financial instruments may give rise to a form of economic leverage and involve risks, including the imperfect correlation between the value of a derivative financial instrument and the underlying asset, possible
default of the counterparty to the transaction or illiquidity of the instrument. The Funds’ successful use of a derivative financial instrument depends on the investment adviser’s ability to predict pertinent market movements accurately, which cannot be assured. The use of these instruments may result in losses greater than if they had not been used, may limit the amount of appreciation a Fund can realize on an investment and/or may result in lower distributions paid to shareholders. The Funds’ investments in these instruments, if any, are discussed in detail in the Notes to Financial Statements.
| 12 | BLACKROCK CORI FUNDS | OCTOBER 31, 2016 |
BlackRock CoRI 2015 Fund (Percentages shown are based on Net Assets) |
| Corporate Bonds | Par (000) | Value | ||||||
Aerospace & Defense — 0.9% |
| |||||||
Lockheed Martin Corp.: | ||||||||
4.85%, 9/15/41 | $10 | $ | 11,470 | |||||
4.07%, 12/15/42 | 10 | 10,327 | ||||||
Northrop Grumman Corp., 3.25%, 8/01/23 | 25 | 26,399 | ||||||
United Technologies Corp.: | ||||||||
3.10%, 6/01/22 | 15 | 15,862 | ||||||
5.70%, 4/15/40 | 15 | 19,126 | ||||||
4.50%, 6/01/42 | 25 | 27,386 | ||||||
|
| |||||||
| 110,570 | ||||||||
Air Freight & Logistics — 0.1% |
| |||||||
FedEx Corp., 4.10%, 2/01/45 | 10 | 9,851 | ||||||
United Parcel Service, Inc., 6.20%, 1/15/38 | 5 | 6,931 | ||||||
|
| |||||||
| 16,782 | ||||||||
Automobiles — 0.2% |
| |||||||
Ford Motor Co., 4.75%, 1/15/43 | 20 | 20,008 | ||||||
Banks — 4.2% |
| |||||||
BNP Paribas SA, 3.25%, 3/03/23 | 20 | 20,887 | ||||||
Cooperatieve Rabobank UA, 3.88%, 2/08/22 | 75 | 81,344 | ||||||
Fifth Third Bancorp, 8.25%, 3/01/38 | 10 | 14,415 | ||||||
HSBC Finance Corp., 6.68%, 1/15/21 | 25 | 28,534 | ||||||
HSBC Holdings PLC, 6.10%, 1/14/42 | 70 | 90,692 | ||||||
Sumitomo Mitsui Financial Group, Inc., 3.78%, 3/09/26 | 25 | 26,633 | ||||||
Wells Fargo & Co.: | ||||||||
3.00%, 1/22/21 | 25 | 25,773 | ||||||
3.50%, 3/08/22 | 25 | 26,283 | ||||||
3.45%, 2/13/23 | 75 | 76,983 | ||||||
3.30%, 9/09/24 | 15 | 15,413 | ||||||
5.61%, 1/15/44 | 25 | 29,315 | ||||||
4.65%, 11/04/44 | 10 | 10,336 | ||||||
3.90%, 5/01/45 | 20 | 20,045 | ||||||
4.90%, 11/17/45 | 30 | 32,249 | ||||||
|
| |||||||
| 498,902 | ||||||||
Beverages — 1.1% |
| |||||||
Anheuser-Busch InBev Worldwide, Inc.: | ||||||||
2.50%, 7/15/22 | 43 | 43,476 | ||||||
3.75%, 7/15/42 | 10 | 9,787 | ||||||
Diageo Investment Corp.: | ||||||||
2.88%, 5/11/22 | 25 | 26,021 | ||||||
4.25%, 5/11/42 | 10 | 10,747 | ||||||
PepsiCo, Inc.: | ||||||||
2.75%, 3/01/23 | 35 | 36,291 | ||||||
4.00%, 3/05/42 | 10 | 10,461 | ||||||
|
| |||||||
| 136,783 | ||||||||
Biotechnology — 0.4% |
| |||||||
Biogen, Inc., 3.63%, 9/15/22 | 20 | 21,315 | ||||||
Celgene Corp., 3.55%, 8/15/22 | 25 | 26,319 | ||||||
|
| |||||||
| 47,634 | ||||||||
Capital Markets — 3.5% |
| |||||||
Ameriprise Financial, Inc., 3.70%, 10/15/24 | 20 | 21,323 | ||||||
Bank of New York Mellon Corp., 4.15%, 2/01/21 | 25 | 27,096 | ||||||
Credit Suisse USA, Inc., 7.13%, 7/15/32 | 15 | 20,445 | ||||||
Goldman Sachs Group, Inc.: | ||||||||
3.63%, 1/22/23 | 40 | 42,085 | ||||||
6.13%, 2/15/33 | 35 | 43,322 | ||||||
6.75%, 10/01/37 | 30 | 37,837 | ||||||
5.15%, 5/22/45 | 15 | 16,206 | ||||||
| Corporate Bonds | Par (000) | Value | ||||||
Capital Markets (continued) |
| |||||||
Morgan Stanley: | ||||||||
3.75%, 2/25/23 | $25 | $ | 26,394 | |||||
3.70%, 10/23/24 | 75 | 78,564 | ||||||
5.00%, 11/24/25 | 25 | 27,653 | ||||||
4.35%, 9/08/26 | 10 | 10,617 | ||||||
3.95%, 4/23/27 | 30 | 30,863 | ||||||
4.30%, 1/27/45 | 20 | 20,944 | ||||||
State Street Corp., 3.70%, 11/20/23 | 10 | 10,821 | ||||||
|
| |||||||
| 414,170 | ||||||||
Chemicals — 0.6% |
| |||||||
CF Industries, Inc., 5.15%, 3/15/34 | 5 | 4,490 | ||||||
Dow Chemical Co., 7.38%, 11/01/29 | 5 | 6,758 | ||||||
E.I. du Pont de Nemours & Co., 2.80%, 2/15/23 | 25 | 25,310 | ||||||
Ecolab, Inc., 4.35%, 12/08/21 | 25 | 27,837 | ||||||
LYB International Finance BV, 4.88%, 3/15/44 | 5 | 5,307 | ||||||
Potash Corp. of Saskatchewan, Inc., 5.88%, 12/01/36 | 5 | 5,874 | ||||||
|
| |||||||
| 75,576 | ||||||||
Commercial Services & Supplies — 0.2% |
| |||||||
Republic Services, Inc., 5.25%, 11/15/21 | 25 | 28,573 | ||||||
Communications Equipment — 0.4% |
| |||||||
Cisco Systems, Inc., 5.90%, 2/15/39 | 30 | 39,190 | ||||||
Motorola Solutions, Inc., 4.00%, 9/01/24 | 10 | 10,111 | ||||||
|
| |||||||
| 49,301 | ||||||||
Consumer Finance — 0.7% |
| |||||||
American Express Co., 4.05%, 12/03/42 | 20 | 20,266 | ||||||
Capital One Financial Corp., 3.50%, 6/15/23 | 25 | 25,799 | ||||||
John Deere Capital Corp., 2.80%, 1/27/23 | 10 | 10,316 | ||||||
MasterCard, Inc., 3.38%, 4/01/24 | 25 | 26,617 | ||||||
|
| |||||||
| 82,998 | ||||||||
Diversified Financial Services — 5.9% |
| |||||||
Bank of America Corp.: | ||||||||
5.63%, 7/01/20 | 25 | 27,981 | ||||||
3.30%, 1/11/23 | 45 | 46,288 | ||||||
4.13%, 1/22/24 | 25 | 26,830 | ||||||
4.00%, 1/22/25 | 25 | 25,705 | ||||||
4.25%, 10/22/26 | 55 | 57,789 | ||||||
5.88%, 2/07/42 | 15 | 18,969 | ||||||
5.00%, 1/21/44 | 10 | 11,451 | ||||||
4.88%, 4/01/44 | 20 | 22,584 | ||||||
Series L, 4.75%, 4/21/45 | 5 | 5,205 | ||||||
Citigroup, Inc.: | ||||||||
3.88%, 10/25/23 | 25 | 26,588 | ||||||
5.50%, 9/13/25 | 25 | 28,152 | ||||||
4.30%, 11/20/26 | 45 | 46,960 | ||||||
8.13%, 7/15/39 | 25 | 38,126 | ||||||
6.68%, 9/13/43 | 10 | 12,869 | ||||||
4.65%, 7/30/45 | 15 | 16,412 | ||||||
4.75%, 5/18/46 | 10 | 10,297 | ||||||
Daimler Finance North America LLC, 8.50%, 1/18/31 | 5 | 7,999 | ||||||
Deutsche Bank AG, 4.10%, 1/13/26 | 10 | 9,765 | ||||||
General Electric Capital Corp., 3.10%, 1/09/23 | 50 | 52,672 | ||||||
JPMorgan Chase & Co.: | ||||||||
4.50%, 1/24/22 | 75 | 82,625 | ||||||
3.38%, 5/01/23 | 25 | 25,586 | ||||||
3.88%, 9/10/24 | 45 | 46,997 | ||||||
6.40%, 5/15/38 | 25 | 33,694 | ||||||
5.63%, 8/16/43 | 15 | 17,597 | ||||||
| Portfolio Abbreviations |
| STRIPS | Separate Trading of Registered Interest and Principal Securities |
See Notes to Financial Statements.
| BLACKROCK CORI FUNDS | OCTOBER 31, 2016 | 13 |
Schedule of Investments (continued) | BlackRock CoRI 2015 Fund |
| Corporate Bonds | Par (000) | Value | ||||||
Diversified Financial Services (continued) |
| |||||||
Northern Trust Corp., 3.95%, 10/30/25 | $10 | $ | 10,888 | |||||
|
| |||||||
| 710,029 | ||||||||
Diversified Telecommunication Services — 3.1% |
| |||||||
AT&T, Inc.: | ||||||||
3.00%, 2/15/22 | 25 | 25,354 | ||||||
3.80%, 3/15/22 | 25 | 26,316 | ||||||
6.30%, 1/15/38 | 20 | 23,203 | ||||||
5.35%, 9/01/40 | 10 | 10,513 | ||||||
6.38%, 3/01/41 | 10 | 11,795 | ||||||
5.55%, 8/15/41 | 5 | 5,424 | ||||||
4.50%, 3/09/48 (a) | 13 | 12,193 | ||||||
Telefonica Emisiones SAU, 7.05%, 6/20/36 | 10 | 12,644 | ||||||
Verizon Communications, Inc.: | ||||||||
4.50%, 9/15/20 | 25 | 27,176 | ||||||
5.15%, 9/15/23 | 50 | 57,193 | ||||||
6.40%, 9/15/33 | 15 | 18,711 | ||||||
6.55%, 9/15/43 | 25 | 32,757 | ||||||
4.86%, 8/21/46 | 40 | 42,367 | ||||||
4.52%, 9/15/48 | 30 | 29,833 | ||||||
5.01%, 8/21/54 | 20 | 20,623 | ||||||
4.67%, 3/15/55 | 20 | 19,497 | ||||||
|
| |||||||
| 375,599 | ||||||||
Electric Utilities — 1.5% |
| |||||||
Berkshire Hathaway Energy Co., 6.13%, 4/01/36 | 15 | 19,628 | ||||||
Consolidated Edison Co. of New York, Inc., | 10 | 12,439 | ||||||
Duke Energy Florida LLC, 6.40%, 6/15/38 | 25 | 34,542 | ||||||
Exelon Generation Co. LLC, 6.25%, 10/01/39 | 10 | 10,844 | ||||||
Georgia Power Co., 4.30%, 3/15/42 | 15 | 15,896 | ||||||
Pacific Gas & Electric Co., 6.05%, 3/01/34 | 20 | 26,254 | ||||||
Public Service Electric & Gas Co., 3.80%, 3/01/46 | 15 | 15,685 | ||||||
Southern California Edison Co., Series A, 5.95%, 2/01/38 | 10 | 13,263 | ||||||
Southern Power Co., 5.15%, 9/15/41 | 5 | 5,336 | ||||||
Virginia Electric & Power Co., 8.88%, 11/15/38 | 15 | 24,991 | ||||||
|
| |||||||
| 178,878 | ||||||||
Energy Equipment & Services — 0.4% |
| |||||||
Baker Hughes, Inc., 5.13%, 9/15/40 | 5 | 5,784 | ||||||
Enterprise Products Operating LLC, 5.70%, 2/15/42 | 15 | 16,947 | ||||||
Halliburton Co., 7.45%, 9/15/39 | 15 | 20,790 | ||||||
|
| |||||||
| 43,521 | ||||||||
Food & Staples Retailing — 0.2% |
| |||||||
Target Corp., 3.63%, 4/15/46 | 15 | 14,776 | ||||||
Walgreen Co., 3.10%, 9/15/22 | 10 | 10,340 | ||||||
|
| |||||||
| 25,116 | ||||||||
Food Products — 0.5% |
| |||||||
Archer-Daniels-Midland Co., 4.54%, 3/26/42 | 10 | 11,298 | ||||||
Kellogg Co., 4.50%, 4/01/46 | 10 | 10,386 | ||||||
Kraft Heinz Foods Co.: | ||||||||
3.50%, 6/06/22 | 25 | 26,399 | ||||||
5.00%, 6/04/42 | 10 | 11,077 | ||||||
|
| |||||||
| 59,160 | ||||||||
Health Care Equipment & Supplies — 0.2% |
| |||||||
Medtronic, Inc.: | ||||||||
4.63%, 3/15/44 | 6 | 6,820 | ||||||
4.63%, 3/15/45 | 20 | 22,627 | ||||||
|
| |||||||
| 29,447 | ||||||||
Health Care Providers & Services — 0.9% |
| |||||||
Aetna, Inc., 6.63%, 6/15/36 | 5 | 6,546 | ||||||
Anthem, Inc., 5.10%, 1/15/44 | 20 | 22,649 | ||||||
Cardinal Health, Inc., 3.20%, 3/15/23 | 15 | 15,599 | ||||||
Express Scripts Holding Co., 4.75%, 11/15/21 | 25 | 27,660 | ||||||
| Corporate Bonds | Par (000) | Value | ||||||
Health Care Providers & Services (continued) |
| |||||||
UnitedHealth Group, Inc.: | ||||||||
6.88%, 2/15/38 | $15 | $ | 20,983 | |||||
4.75%, 7/15/45 | 10 | 11,577 | ||||||
|
| |||||||
| 105,014 | ||||||||
Hotels, Restaurants & Leisure — 0.1% |
| |||||||
McDonald’s Corp., 6.30%, 10/15/37 | 10 | 12,844 | ||||||
Household Products — 0.1% |
| |||||||
Kimberly-Clark Corp., 6.63%, 8/01/37 | 5 | 7,259 | ||||||
Industrial Conglomerates — 0.1% |
| |||||||
General Electric Co., 2.70%, 10/09/22 | 10 | 10,334 | ||||||
Insurance — 1.4% |
| |||||||
Aflac, Inc., 3.63%, 6/15/23 | 15 | 16,005 | ||||||
Allstate Corp., 3.15%, 6/15/23 | 10 | 10,500 | ||||||
American International Group, Inc.: | ||||||||
3.38%, 8/15/20 | 25 | 26,268 | ||||||
4.13%, 2/15/24 | 25 | 26,874 | ||||||
Arch Capital Group US, Inc., 5.14%, 11/01/43 | 10 | 10,689 | ||||||
AXA SA, 8.60%, 12/15/30 | 5 | 7,025 | ||||||
MetLife, Inc.: | ||||||||
4.88%, 11/13/43 | 25 | 27,496 | ||||||
4.05%, 3/01/45 | 15 | 14,895 | ||||||
Prudential Financial, Inc., 6.63%, 12/01/37 | 10 | 13,122 | ||||||
Travelers Cos., Inc., 4.60%, 8/01/43 | 10 | 11,525 | ||||||
|
| |||||||
| 164,399 | ||||||||
Life Sciences Tools & Services — 0.2% |
| |||||||
Thermo Fisher Scientific, Inc., 4.50%, 3/01/21 | 25 | 27,534 | ||||||
Machinery — 0.1% |
| |||||||
Caterpillar, Inc., 3.80%, 8/15/42 | 15 | 15,171 | ||||||
Media — 2.5% |
| |||||||
21st Century Fox America, Inc.: | ||||||||
6.40%, 12/15/35 | 10 | 12,546 | ||||||
6.15%, 2/15/41 | 15 | 18,620 | ||||||
5.40%, 10/01/43 | 10 | 11,481 | ||||||
Comcast Corp.: | ||||||||
3.13%, 7/15/22 | 25 | 26,291 | ||||||
4.25%, 1/15/33 | 5 | 5,378 | ||||||
6.45%, 3/15/37 | 20 | 26,788 | ||||||
6.40%, 3/01/40 | 20 | 27,314 | ||||||
Discovery Communications LLC, 6.35%, 6/01/40 | 15 | 16,383 | ||||||
NBCUniversal Media LLC: | ||||||||
6.40%, 4/30/40 | 20 | 27,275 | ||||||
5.95%, 4/01/41 | 5 | 6,511 | ||||||
Omnicom Group, Inc., 3.63%, 5/01/22 | 20 | 21,307 | ||||||
Thomson Reuters Corp., 5.85%, 4/15/40 | 2 | 2,303 | ||||||
Time Warner, Inc.: | ||||||||
4.05%, 12/15/23 | 25 | 26,896 | ||||||
7.63%, 4/15/31 | 25 | 34,935 | ||||||
5.38%, 10/15/41 | 10 | 11,338 | ||||||
5.35%, 12/15/43 | 10 | 11,301 | ||||||
Walt Disney Co., 2.35%, 12/01/22 | 15 | 15,320 | ||||||
|
| |||||||
| 301,987 | ||||||||
Metals & Mining — 0.5% |
| |||||||
BHP Billiton Finance USA Ltd.: | ||||||||
3.85%, 9/30/23 | 15 | 16,272 | ||||||
5.00%, 9/30/43 | 5 | 5,694 | ||||||
Newmont Mining Corp., 6.25%, 10/01/39 | 5 | 5,884 | ||||||
Rio Tinto Finance USA Ltd., 5.20%, 11/02/40 | 5 | 5,725 | ||||||
Southern Copper Corp.: | ||||||||
5.25%, 11/08/42 | 15 | 14,189 | ||||||
5.88%, 4/23/45 | 15 | 14,986 | ||||||
|
| |||||||
| 62,750 | ||||||||
See Notes to Financial Statements.
| 14 | BLACKROCK CORI FUNDS | OCTOBER 31, 2016 |
Schedule of Investments (continued) | BlackRock CoRI 2015 Fund |
| Corporate Bonds | Par (000) | Value | ||||||
Multiline Retail — 0.2% | ||||||||
Target Corp., 4.00%, 7/01/42 | $20 | $ | 21,028 | |||||
Oil, Gas & Consumable Fuels — 2.3% |
| |||||||
Anadarko Petroleum Corp., 6.45%, 9/15/36 | 20 | 23,733 | ||||||
BP Capital Markets PLC: | ||||||||
3.25%, 5/06/22 | 20 | 20,867 | ||||||
2.75%, 5/10/23 | 25 | 25,246 | ||||||
ConocoPhillips: | ||||||||
5.90%, 5/15/38 | 10 | 11,934 | ||||||
6.50%, 2/01/39 | 10 | 12,766 | ||||||
ConocoPhillips Holding Co., 6.95%, 4/15/29 | 15 | 19,043 | ||||||
Devon Financing Co. LLC, 7.88%, 9/30/31 | 15 | 19,096 | ||||||
Enterprise Products Operating LLC, 5.95%, 2/01/41 | 10 | 11,553 | ||||||
Marathon Petroleum Corp., 5.13%, 3/01/21 | 25 | 27,696 | ||||||
Petro-Canada, 6.80%, 5/15/38 | 5 | 6,585 | ||||||
Phillips 66, 5.88%, 5/01/42 | 5 | 6,107 | ||||||
Suncor Energy, Inc., 6.50%, 6/15/38 | 25 | 32,054 | ||||||
TransCanada PipeLines Ltd.: | ||||||||
7.63%, 1/15/39 | 15 | 22,195 | ||||||
6.10%, 6/01/40 | 10 | 12,722 | ||||||
Valero Energy Corp.: | ||||||||
6.63%, 6/15/37 | 15 | 17,555 | ||||||
4.90%, 3/15/45 | 5 | 4,898 | ||||||
|
| |||||||
| 274,050 | ||||||||
Pharmaceuticals — 2.2% |
| |||||||
Abbott Laboratories, 5.30%, 5/27/40 | 5 | 5,852 | ||||||
AbbVie, Inc.: | ||||||||
2.90%, 11/06/22 | 25 | 25,307 | ||||||
4.40%, 11/06/42 | 10 | 9,794 | ||||||
AstraZeneca PLC: | ||||||||
3.38%, 11/16/25 | 15 | 15,617 | ||||||
6.45%, 9/15/37 | 10 | 13,601 | ||||||
4.38%, 11/16/45 | 10 | 10,604 | ||||||
Bristol-Myers Squibb Co., 3.25%, 11/01/23 | 25 | 26,986 | ||||||
GlaxoSmithKline Capital, Inc., 6.38%, 5/15/38 | 15 | 20,855 | ||||||
Merck & Co., Inc., 2.80%, 5/18/23 | 25 | 25,801 | ||||||
Pfizer, Inc., 7.20%, 3/15/39 | 35 | 52,346 | ||||||
Teva Pharmaceutical Finance Co. BV, 2.95%, 12/18/22 | 25 | 25,280 | ||||||
Teva Pharmaceutical Finance Netherlands III BV: | ||||||||
3.15%, 10/01/26 | 25 | 24,313 | ||||||
4.10%, 10/01/46 | 10 | 9,283 | ||||||
|
| |||||||
| 265,639 | ||||||||
Real Estate Investment Trusts (REITs) — 0.2% |
| |||||||
Weyerhaeuser Co., 7.38%, 3/15/32 | 15 | 19,846 | ||||||
Road & Rail — 0.1% |
| |||||||
Norfolk Southern Corp., 4.84%, 10/01/41 | 15 | 16,945 | ||||||
Semiconductors & Semiconductor Equipment — 0.2% |
| |||||||
Applied Materials, Inc., 5.85%, 6/15/41 | 5 | 6,188 | ||||||
Intel Corp., 4.80%, 10/01/41 | 10 | 11,377 | ||||||
|
| |||||||
| 17,565 | ||||||||
Software — 0.6% |
| |||||||
Oracle Corp.: | ||||||||
2.50%, 10/15/22 | 25 | 25,413 | ||||||
6.13%, 7/08/39 | 20 | 26,234 | ||||||
5.38%, 7/15/40 | 15 | 17,910 | ||||||
|
| |||||||
| 69,557 | ||||||||
Specialty Retail — 0.2% |
| |||||||
Home Depot, Inc., 5.88%, 12/16/36 | 15 | 19,877 | ||||||
Technology Hardware, Storage & Peripherals — 0.3% |
| |||||||
HP, Inc.: | ||||||||
4.65%, 12/09/21 | 25 | 27,251 | ||||||
6.00%, 9/15/41 | 5 | 5,089 | ||||||
|
| |||||||
| 32,340 | ||||||||
| Corporate Bonds | Par (000) | Value | ||||||
Tobacco — 0.6% | ||||||||
Altria Group, Inc.: | ||||||||
4.00%, 1/31/24 | $ | 10 | $ | 10,975 | ||||
4.25%, 8/09/42 | 5 | 5,194 | ||||||
5.38%, 1/31/44 | 10 | 12,198 | ||||||
Philip Morris International, Inc.: | ||||||||
3.60%, 11/15/23 | 15 | 16,147 | ||||||
4.25%, 11/10/44 | 25 | 26,210 | ||||||
|
| |||||||
| 70,724 | ||||||||
Wireless Telecommunication Services — 0.6% |
| |||||||
America Movil SAB de CV, 6.38%, 3/01/35 | 20 | 24,339 | ||||||
Vodafone Group PLC: | ||||||||
2.95%, 2/19/23 | 15 | 15,155 | ||||||
6.15%, 2/27/37 | 20 | 23,798 | ||||||
4.38%, 2/19/43 | 10 | 9,629 | ||||||
|
| |||||||
| 72,921 | ||||||||
| Total Corporate Bonds — 37.5% | 4,490,831 | |||||||
| U.S. Treasury Obligations | ||||||||
U.S. Treasury Bonds: | ||||||||
6.25%, 5/15/30 | 40 | 60,205 | ||||||
5.38%, 2/15/31 | 25 | 35,510 | ||||||
3.75%, 8/15/41 | 100 | 123,012 | ||||||
2.75%, 11/15/42 | 10 | 10,378 | ||||||
3.00%, 11/15/44 | 10 | 10,862 | ||||||
3.00%, 11/15/45 | 20 | 21,714 | ||||||
2.50%, 2/15/46 | 40 | 39,248 | ||||||
2.50%, 5/15/46 | 75 | 73,626 | ||||||
2.25%, 8/15/46 | 10 | 9,300 | ||||||
U.S. Treasury Notes: | ||||||||
2.50%, 8/15/23 | 50 | 52,885 | ||||||
1.38%, 9/30/23 | 150 | 147,633 | ||||||
2.75%, 11/15/23 | 40 | 43,011 | ||||||
2.75%, 2/15/24 | 30 | 32,285 | ||||||
2.50%, 5/15/24 | 30 | 31,777 | ||||||
2.38%, 8/15/24 | 20 | 20,993 | ||||||
2.25%, 11/15/24 | 45 | 46,786 | ||||||
2.25%, 11/15/25 | 70 | 72,598 | ||||||
1.63%, 2/15/26 | 40 | 39,337 | ||||||
1.63%, 5/15/26 | 250 | 245,547 | ||||||
1.50%, 8/15/26 | 100 | 97,016 | ||||||
U.S. Treasury Principal STRIPS, 0.00%, 2/15/31 (b) | 8,215 | 6,157,553 | ||||||
| Total U.S. Treasury Obligations — 61.6% | 7,371,276 | |||||||
| Total Long-Term Investments (Cost — $10,722,847) — 99.1% | 11,862,107 | |||||||
| Short-Term Securities — 1.0% | Shares | |||||||
BlackRock Liquidity Funds, T-Fund, Institutional Class, 0.22% (c)(d) | 117,510 | 117,510 | ||||||
| Total Short-Term Securities (Cost — $117,510) — 1.0% | 117,510 | |||||||
| Total Investments (Cost — $10,840,357) — 100.1% | 11,979,617 | |||||||
Liabilities in Excess of Other Assets — (0.1)% | (15,364 | ) | ||||||
|
| |||||||
Net Assets — 100.0% | $ | 11,964,253 | ||||||
|
| |||||||
See Notes to Financial Statements.
| BLACKROCK CORI FUNDS | OCTOBER 31, 2016 | 15 |
Schedule of Investments (continued) | BlackRock CoRI 2015 Fund |
| Notes to Schedule of Investments |
| (a) | Security exempt from registration pursuant to Rule 144A under the Securities Act of 1933, as amended. These securities may be resold in transactions exempt from registration to qualified institutional investors. |
| (b) | Zero-coupon bond. |
| (c) | Current yield as of period end. |
| (d) | During the year ended October 31, 2016, investments in issuers considered to be affiliates of the Fund for purposes of Section 2(a)(3) of the Investment Company Act of 1940, as amended, were as follows: |
| Affiliate | Shares October 31, 2015 | Net Activity | Shares October 31, 2016 | Value at October 31, 2016 | Income | |||||||||||||||
BlackRock Liquidity Funds, TempFund, Institutional Class | 157,525 | (157,525 | ) | — | — | $ | 416 | |||||||||||||
BlackRock Liquidity Funds, T-Fund, Institutional Class | — | 117,510 | 117,510 | $ | 117,510 | 40 | ||||||||||||||
Total | $ | 117,510 | $ | 456 | ||||||||||||||||
|
| |||||||||||||||||||
| Derivative Financial Instruments Outstanding as of Period End |
| Futures Contracts | ||||||||||||||
| Contracts Long | Issue | Expiration | Notional Value | Unrealized Depreciation | ||||||||||
| 1 | U.S. Treasury Long Bond | December 2016 | $ | 162,719 | $ | (7,692 | ) | |||||||
| Derivative Financial Instruments Categorized by Risk Exposure |
As of period end, the fair values of derivative financial instruments located in the Statements of Assets and Liabilities were as follows:
| Liabilities — Derivative Financial Instruments | Commodity Contracts | Credit Contracts | Equity Contracts | Foreign Currency Exchange Contracts | Interest Rate Contracts | Other Contracts | Total | |||||||||||||||||||||||
Futures contracts | Net unrealized depreciation1 | — | — | — | — | $ | 7,692 | — | $ | 7,692 | ||||||||||||||||||||
1 Includes cumulative appreciation (depreciation) on futures contracts, if any, as reported in the Schedule of Investments. Only current day’s variation margin is reported within the Statements of Assets and Liabilities. |
| |||||||||||||||||||||||||||||
For the year ended October 31, 2016, the effect of derivative financial instruments in the Statements of Operations was as follows:
| Net Realized Gain (Loss) from: | Commodity Contracts | Credit Contracts | Equity Contracts | Foreign Currency Exchange Contracts | Interest Rate Contracts | Other Contracts | Total | |||||||||||||||||||||
Futures contracts | — | — | — | — | $ | 19,355 | — | $ | 19,355 | |||||||||||||||||||
Net Change in Unrealized Appreciation (Depreciation) on: |
| |||||||||||||||||||||||||||
Futures contracts | — | — | — | — | $ | (7,566 | ) | — | $ | (7,566 | ) | |||||||||||||||||
| Average Quarterly Balances of Outstanding Derivative Financial Instruments |
| Futures contracts: | ||||
Average notional value of contracts — long | $ | 165,375 |
For more information about the Fund’s investment risks regarding derivative financial instruments, refer to the Notes to Financial Statements.
See Notes to Financial Statements.
| 16 | BLACKROCK CORI FUNDS | OCTOBER 31, 2016 |
Schedule of Investments (concluded) | BlackRock CoRI 2015 Fund |
| Fair Value Hierarchy as of Period End |
Various inputs are used in determining the fair value of investments and derivative financial instruments. For information about the Fund’s policy regarding valuation of investments and derivative financial instruments, refer to the Notes to Financial Statements.
The following tables summarize the Fund’s investments and derivative financial instruments categorized in the disclosure hierarchy:
| Level 1 | Level 2 | Level 3 | Total | |||||||||||||
Assets: | ||||||||||||||||
| Investments: | ||||||||||||||||
Long-Term Investments1 | — | $ | 11,862,107 | — | $ | 11,862,107 | ||||||||||
Short-Term Securities | $ | 117,510 | — | — | 117,510 | |||||||||||
|
| |||||||||||||||
Total | $ | 117,510 | $ | 11,862,107 | — | $ | 11,979,617 | |||||||||
|
| |||||||||||||||
| Derivative Financial Instruments2 | ||||||||||||||||
Liabilities: | ||||||||||||||||
Interest rate contracts | $ | (7,692 | ) | — | — | $ | (7,692 | ) | ||||||||
1 See above Schedule of Investments for values in each Industry. |
| |||||||||||||||
2 Derivative financial instruments are futures contracts. Futures contracts are valued at the unrealized appreciation (depreciation) on the instrument. |
| |||||||||||||||
The Fund may hold assets and/or liabilities in which the fair value approximates the carrying amount for financial statement purposes. As of period end, cash pledged for futures contracts of $4,400 is categorized as Level 1 within the disclosure hierarchy.
During the year ended October 31, 2016, there were no transfers between levels.
See Notes to Financial Statements.
| BLACKROCK CORI FUNDS | OCTOBER 31, 2016 | 17 |
Schedule of Investments October 31, 2016 | BlackRock CoRI 2017 Fund (Percentages shown are based on Net Assets) |
| Corporate Bonds | Par (000) | Value | ||||||
Aerospace & Defense — 0.7% | ||||||||
Lockheed Martin Corp., 4.07%, 12/15/42 | $15 | $ | 15,490 | |||||
Northrop Grumman Corp., 3.25%, 8/01/23 | 10 | 10,560 | ||||||
United Technologies Corp.: | ||||||||
3.10%, 6/01/22 | 10 | 10,575 | ||||||
4.50%, 6/01/42 | 45 | 49,294 | ||||||
|
| |||||||
| 85,919 | ||||||||
Air Freight & Logistics — 0.2% | ||||||||
FedEx Corp.: | ||||||||
5.10%, 1/15/44 | 10 | 11,419 | ||||||
4.10%, 2/01/45 | 10 | 9,851 | ||||||
United Parcel Service, Inc., 6.20%, 1/15/38 | 5 | 6,931 | ||||||
|
| |||||||
| 28,201 | ||||||||
Automobiles — 0.3% | ||||||||
Ford Motor Co., 4.75%, 1/15/43 | 35 | 35,014 | ||||||
Banks — 3.2% | ||||||||
BNP Paribas SA, 3.25%, 3/03/23 | 5 | 5,222 | ||||||
Fifth Third Bancorp, 8.25%, 3/01/38 | 10 | 14,415 | ||||||
HSBC Holdings PLC, 6.10%, 1/14/42 | 70 | 90,692 | ||||||
Sumitomo Mitsui Financial Group, Inc., 3.78%, 3/09/26 | 25 | 26,634 | ||||||
Wells Fargo & Co.: | ||||||||
3.00%, 1/22/21 | 25 | 25,773 | ||||||
3.45%, 2/13/23 | 75 | 76,983 | ||||||
3.30%, 9/09/24 | 30 | 30,826 | ||||||
5.61%, 1/15/44 | 25 | 29,315 | ||||||
4.65%, 11/04/44 | 15 | 15,504 | ||||||
3.90%, 5/01/45 | 15 | 15,033 | ||||||
4.90%, 11/17/45 | 35 | 37,624 | ||||||
|
| |||||||
| 368,021 | ||||||||
Beverages — 0.7% | ||||||||
Anheuser-Busch InBev Finance, Inc., 4.63%, 2/01/44 | 11 | 12,170 | ||||||
Anheuser-Busch InBev Worldwide, Inc., 2.50%, 7/15/22 | 39 | 39,432 | ||||||
PepsiCo, Inc.: | ||||||||
2.75%, 3/01/23 | 15 | 15,553 | ||||||
4.00%, 3/05/42 | 15 | 15,692 | ||||||
|
| |||||||
| 82,847 | ||||||||
Biotechnology — 0.4% | ||||||||
Biogen, Inc., 3.63%, 9/15/22 | 20 | 21,315 | ||||||
Celgene Corp., 3.55%, 8/15/22 | 25 | 26,319 | ||||||
|
| |||||||
| 47,634 | ||||||||
Capital Markets — 3.5% | ||||||||
Ameriprise Financial, Inc., 3.70%, 10/15/24 | 20 | 21,323 | ||||||
Credit Suisse USA, Inc., 7.13%, 7/15/32 | 15 | 20,445 | ||||||
Goldman Sachs Group, Inc.: | ||||||||
3.63%, 1/22/23 | 10 | 10,521 | ||||||
6.13%, 2/15/33 | 45 | 55,699 | ||||||
6.75%, 10/01/37 | 35 | 44,143 | ||||||
6.25%, 2/01/41 | 5 | 6,404 | ||||||
5.15%, 5/22/45 | 20 | 21,609 | ||||||
Morgan Stanley: | ||||||||
3.75%, 2/25/23 | 25 | 26,394 | ||||||
3.70%, 10/23/24 | 70 | 73,326 | ||||||
5.00%, 11/24/25 | 25 | 27,653 | ||||||
4.35%, 9/08/26 | 10 | 10,617 | ||||||
3.95%, 4/23/27 | 40 | 41,151 | ||||||
6.38%, 7/24/42 | 10 | 13,360 | ||||||
4.30%, 1/27/45 | 15 | 15,708 | ||||||
State Street Corp.: | ||||||||
3.70%, 11/20/23 | 10 | 10,821 | ||||||
3.55%, 8/18/25 | 10 | 10,758 | ||||||
|
| |||||||
| 409,932 | ||||||||
| Corporate Bonds | Par (000) | Value | ||||||
Chemicals — 0.6% | ||||||||
CF Industries, Inc.: | ||||||||
5.15%, 3/15/34 | $ 5 | $ | 4,490 | |||||
5.38%, 3/15/44 | 10 | 8,553 | ||||||
Dow Chemical Co., 7.38%, 11/01/29 | 10 | 13,516 | ||||||
E.I. du Pont de Nemours & Co., 2.80%, 2/15/23 | 25 | 25,310 | ||||||
LYB International Finance BV, 4.88%, 3/15/44 | 5 | 5,307 | ||||||
Potash Corp. of Saskatchewan, Inc., 5.88%, 12/01/36 | 10 | 11,748 | ||||||
|
| |||||||
| 68,924 | ||||||||
Communications Equipment — 0.3% | ||||||||
Cisco Systems, Inc., 5.90%, 2/15/39 | 15 | 19,595 | ||||||
Motorola Solutions, Inc., 4.00%, 9/01/24 | 10 | 10,111 | ||||||
|
| |||||||
| 29,706 | ||||||||
Consumer Finance — 0.8% | ||||||||
American Express Co., 4.05%, 12/03/42 | 20 | 20,266 | ||||||
Capital One Financial Corp., 3.50%, 6/15/23 | 25 | 25,799 | ||||||
John Deere Capital Corp., 2.80%, 1/27/23 | 15 | 15,474 | ||||||
MasterCard, Inc., 3.38%, 4/01/24 | 25 | 26,617 | ||||||
|
| |||||||
| 88,156 | ||||||||
Diversified Financial Services — 5.9% | ||||||||
Bank of America Corp.: | ||||||||
3.30%, 1/11/23 | 45 | 46,288 | ||||||
4.13%, 1/22/24 | 25 | 26,830 | ||||||
4.00%, 4/01/24 | 25 | 26,711 | ||||||
4.00%, 1/22/25 | 40 | 41,128 | ||||||
4.25%, 10/22/26 | 50 | 52,535 | ||||||
5.88%, 2/07/42 | 20 | 25,292 | ||||||
5.00%, 1/21/44 | 10 | 11,451 | ||||||
4.88%, 4/01/44 | 25 | 28,230 | ||||||
Series L, 4.75%, 4/21/45 | 5 | 5,205 | ||||||
Citigroup, Inc.: | ||||||||
3.88%, 10/25/23 | 25 | 26,587 | ||||||
5.50%, 9/13/25 | 25 | 28,152 | ||||||
4.30%, 11/20/26 | 5 | 5,218 | ||||||
8.13%, 7/15/39 | 30 | 45,751 | ||||||
6.68%, 9/13/43 | 25 | 32,172 | ||||||
4.65%, 7/30/45 | 15 | 16,412 | ||||||
4.75%, 5/18/46 | 10 | 10,297 | ||||||
Daimler Finance North America LLC, 8.50%, 1/18/31 | 10 | 15,998 | ||||||
Deutsche Bank AG, 4.10%, 1/13/26 | 25 | 24,413 | ||||||
General Electric Capital Corp., 3.10%, 1/09/23 | 25 | 26,336 | ||||||
JPMorgan Chase & Co.: | ||||||||
3.38%, 5/01/23 | 50 | 51,173 | ||||||
3.88%, 9/10/24 | 80 | 83,550 | ||||||
6.40%, 5/15/38 | 25 | 33,694 | ||||||
5.60%, 7/15/41 | 10 | 12,353 | ||||||
Northern Trust Corp., 3.95%, 10/30/25 | 10 | 10,888 | ||||||
|
| |||||||
| 686,664 | ||||||||
Diversified Telecommunication Services — 2.8% | ||||||||
AT&T, Inc.: | ||||||||
6.30%, 1/15/38 | 25 | 29,004 | ||||||
5.35%, 9/01/40 | 10 | 10,514 | ||||||
6.38%, 3/01/41 | 10 | 11,795 | ||||||
5.55%, 8/15/41 | 15 | 16,273 | ||||||
4.50%, 3/09/48 (a) | 6 | 5,627 | ||||||
Orange SA, 5.38%, 1/13/42 | 5 | 5,871 | ||||||
Telefonica Emisiones SAU, 7.05%, 6/20/36 | 10 | 12,644 | ||||||
Verizon Communications, Inc.: | ||||||||
5.15%, 9/15/23 | 50 | 57,193 | ||||||
4.27%, 1/15/36 | 25 | 25,102 | ||||||
6.55%, 9/15/43 | 35 | 45,860 | ||||||
4.86%, 8/21/46 | 35 | 37,071 | ||||||
4.52%, 9/15/48 | 30 | 29,833 | ||||||
5.01%, 8/21/54 | 25 | 25,778 | ||||||
4.67%, 3/15/55 | 15 | 14,623 | ||||||
|
| |||||||
| 327,188 | ||||||||
See Notes to Financial Statements.
| 18 | BLACKROCK CORI FUNDS | OCTOBER 31, 2016 |
Schedule of Investments (continued) | BlackRock CoRI 2017 Fund |
| Corporate Bonds | Par (000) | Value | ||||||
Electric Utilities — 1.7% | ||||||||
Berkshire Hathaway Energy Co., 6.13%, 4/01/36 | $20 | $ | 26,171 | |||||
Consolidated Edison Co. of New York, Inc., Series C, 5.50%, 12/01/39 | 10 | 12,439 | ||||||
Duke Energy Florida LLC, 6.40%, 6/15/38 | 25 | 34,542 | ||||||
Exelon Generation Co. LLC, 6.25%, 10/01/39 | 10 | 10,844 | ||||||
Georgia Power Co., 4.30%, 3/15/42 | 10 | 10,597 | ||||||
Pacific Gas & Electric Co., 6.05%, 3/01/34 | 25 | 32,817 | ||||||
PacifiCorp, 6.00%, 1/15/39 | 15 | 19,828 | ||||||
Public Service Electric & Gas Co., 3.80%, 3/01/46 | 15 | 15,685 | ||||||
Southern California Edison Co., Series A, 5.95%, 2/01/38 | 10 | 13,263 | ||||||
Southern Power Co., 5.15%, 9/15/41 | 5 | 5,336 | ||||||
Virginia Electric & Power Co., 8.88%, 11/15/38 | 10 | 16,661 | ||||||
|
| |||||||
| 198,183 | ||||||||
Energy Equipment & Services — 0.4% | ||||||||
Baker Hughes, Inc., 5.13%, 9/15/40 | 5 | 5,784 | ||||||
Enterprise Products Operating LLC, 5.70%, 2/15/42 | 15 | 16,947 | ||||||
Halliburton Co., 7.45%, 9/15/39 | 15 | 20,790 | ||||||
|
| |||||||
| 43,521 | ||||||||
Food & Staples Retailing — 0.1% | ||||||||
Walgreen Co., 3.10%, 9/15/22 | 15 | 15,510 | ||||||
Food Products — 0.6% | ||||||||
Archer-Daniels-Midland Co., 4.54%, 3/26/42 | 10 | 11,298 | ||||||
Kellogg Co., 4.50%, 4/01/46 | 15 | 15,579 | ||||||
Kraft Heinz Foods Co.: | ||||||||
3.50%, 6/06/22 | 25 | 26,399 | ||||||
5.00%, 6/04/42 | 15 | 16,616 | ||||||
|
| |||||||
| 69,892 | ||||||||
Health Care Equipment & Supplies — 0.3% | ||||||||
Medtronic, Inc.: | ||||||||
4.63%, 3/15/44 | 7 | 7,957 | ||||||
4.63%, 3/15/45 | 20 | 22,627 | ||||||
|
| |||||||
| 30,584 | ||||||||
Health Care Providers & Services — 0.6% | ||||||||
Aetna, Inc., 6.63%, 6/15/36 | 5 | 6,546 | ||||||
Anthem, Inc., 5.10%, 1/15/44 | 20 | 22,649 | ||||||
Cardinal Health, Inc., 3.20%, 3/15/23 | 10 | 10,399 | ||||||
UnitedHealth Group, Inc.: | ||||||||
6.88%, 2/15/38 | 15 | 20,983 | ||||||
4.75%, 7/15/45 | 10 | 11,577 | ||||||
|
| |||||||
| 72,154 | ||||||||
Hotels, Restaurants & Leisure — 0.1% | ||||||||
McDonald’s Corp., 6.30%, 10/15/37 | 10 | 12,844 | ||||||
Household Products — 0.1% | ||||||||
Kimberly-Clark Corp., 6.63%, 8/01/37 | 5 | 7,259 | ||||||
Industrial Conglomerates — 0.1% | ||||||||
General Electric Co., 2.70%, 10/09/22 | 15 | 15,500 | ||||||
Insurance — 1.5% | ||||||||
Aflac, Inc., 3.63%, 6/15/23 | 10 | 10,670 | ||||||
Allstate Corp., 3.15%, 6/15/23 | 15 | 15,750 | ||||||
American International Group, Inc., 4.13%, 2/15/24 | 50 | 53,748 | ||||||
Arch Capital Group US, Inc., 5.14%, 11/01/43 | 10 | 10,689 | ||||||
AXA SA, 8.60%, 12/15/30 | 10 | 14,050 | ||||||
MetLife, Inc., 4.88%, 11/13/43 | 35 | 38,495 | ||||||
Prudential Financial, Inc., 6.63%, 12/01/37 | 15 | 19,683 | ||||||
Travelers Cos., Inc., 4.60%, 8/01/43 | 10 | 11,525 | ||||||
|
| |||||||
| 174,610 | ||||||||
Machinery — 0.1% | ||||||||
Caterpillar, Inc., 3.80%, 8/15/42 | 15 | 15,171 | ||||||
| Corporate Bonds | Par (000) | Value | ||||||
Media — 2.6% | ||||||||
21st Century Fox America, Inc.: | ||||||||
6.40%, 12/15/35 | $25 | $ | 31,365 | |||||
6.15%, 2/15/41 | 5 | 6,207 | ||||||
5.40%, 10/01/43 | 10 | 11,481 | ||||||
Comcast Corp.: | ||||||||
3.13%, 7/15/22 | 25 | 26,291 | ||||||
4.25%, 1/15/33 | 15 | 16,134 | ||||||
6.45%, 3/15/37 | 25 | 33,485 | ||||||
6.40%, 3/01/40 | 20 | 27,314 | ||||||
Discovery Communications LLC, 6.35%, 6/01/40 | 20 | 21,844 | ||||||
NBCUniversal Media LLC: | ||||||||
6.40%, 4/30/40 | 20 | 27,275 | ||||||
5.95%, 4/01/41 | 10 | 13,023 | ||||||
Thomson Reuters Corp., 5.85%, 4/15/40 | 3 | 3,455 | ||||||
Time Warner, Inc.: | ||||||||
4.05%, 12/15/23 | 25 | 26,896 | ||||||
7.63%, 4/15/31 | 5 | 6,987 | ||||||
5.38%, 10/15/41 | 15 | 17,006 | ||||||
5.35%, 12/15/43 | 20 | 22,603 | ||||||
Walt Disney Co., 2.35%, 12/01/22 | 10 | 10,213 | ||||||
|
| |||||||
| 301,579 | ||||||||
Metals & Mining — 0.7% | ||||||||
BHP Billiton Finance USA Ltd.: | ||||||||
3.85%, 9/30/23 | 10 | 10,848 | ||||||
5.00%, 9/30/43 | 15 | 17,082 | ||||||
Newmont Mining Corp., 6.25%, 10/01/39 | 10 | 11,768 | ||||||
Rio Tinto Finance USA Ltd., 5.20%, 11/02/40 | 10 | 11,450 | ||||||
Southern Copper Corp.: | ||||||||
5.25%, 11/08/42 | 15 | 14,189 | ||||||
5.88%, 4/23/45 | 10 | 9,991 | ||||||
|
| |||||||
| 75,328 | ||||||||
Multiline Retail — 0.2% | ||||||||
Target Corp., 4.00%, 7/01/42 | 20 | 21,028 | ||||||
Oil, Gas & Consumable Fuels — 2.2% | ||||||||
Anadarko Petroleum Corp., 6.45%, 9/15/36 | 20 | 23,734 | ||||||
BP Capital Markets PLC: | ||||||||
3.25%, 5/06/22 | 10 | 10,434 | ||||||
2.75%, 5/10/23 | 25 | 25,246 | ||||||
ConocoPhillips, 6.50%, 2/01/39 | 20 | 25,531 | ||||||
ConocoPhillips Holding Co., 6.95%, 4/15/29 | 20 | 25,391 | ||||||
Devon Financing Co. LLC, 7.88%, 9/30/31 | 15 | 19,096 | ||||||
Enterprise Products Operating LLC, 5.95%, 2/01/41 | 10 | 11,553 | ||||||
Phillips 66, 5.88%, 5/01/42 | 10 | 12,214 | ||||||
Suncor Energy, Inc., 6.50%, 6/15/38 | 30 | 38,464 | ||||||
TransCanada PipeLines Ltd.: | ||||||||
6.20%, 10/15/37 | 5 | 6,388 | ||||||
7.63%, 1/15/39 | 15 | 22,195 | ||||||
6.10%, 6/01/40 | 10 | 12,722 | ||||||
Valero Energy Corp.: | ||||||||
6.63%, 6/15/37 | 15 | 17,555 | ||||||
4.90%, 3/15/45 | 5 | 4,898 | ||||||
|
| |||||||
| 255,421 | ||||||||
Pharmaceuticals — 2.2% | ||||||||
Abbott Laboratories, 5.30%, 5/27/40 | 10 | 11,703 | ||||||
AbbVie, Inc., 2.90%, 11/06/22 | 25 | 25,307 | ||||||
AstraZeneca PLC: | ||||||||
3.38%, 11/16/25 | 15 | 15,617 | ||||||
6.45%, 9/15/37 | 15 | 20,401 | ||||||
Bristol-Myers Squibb Co., 3.25%, 11/01/23 | 25 | 26,986 | ||||||
GlaxoSmithKline Capital, Inc., 6.38%, 5/15/38 | 15 | 20,855 | ||||||
Merck & Co., Inc., 2.80%, 5/18/23 | 25 | 25,801 | ||||||
Pfizer, Inc., 7.20%, 3/15/39 | 40 | 59,825 | ||||||
Teva Pharmaceutical Finance Co. BV, 2.95%, 12/18/22 | 25 | 25,280 | ||||||
See Notes to Financial Statements.
| BLACKROCK CORI FUNDS | OCTOBER 31, 2016 | 19 |
Schedule of Investments (continued) | BlackRock CoRI 2017 Fund |
| Corporate Bonds | Par (000) | Value | ||||||
Pharmaceuticals (continued) | ||||||||
Teva Pharmaceutical Finance Netherlands III BV: | ||||||||
3.15%, 10/01/26 | $ 15 | $ | 14,588 | |||||
4.10%, 10/01/46 | 15 | 13,925 | ||||||
|
| |||||||
| 260,288 | ||||||||
Road & Rail — 0.2% | ||||||||
Norfolk Southern Corp., 4.84%, 10/01/41 | 20 | 22,593 | ||||||
Semiconductors & Semiconductor Equipment — 0.2% |
| |||||||
Applied Materials, Inc., 5.85%, 6/15/41 | 5 | 6,188 | ||||||
Intel Corp., 4.80%, 10/01/41 | 15 | 17,065 | ||||||
|
| |||||||
| 23,253 | ||||||||
Software — 0.6% | ||||||||
Oracle Corp.: | ||||||||
2.50%, 10/15/22 | 25 | 25,413 | ||||||
6.13%, 7/08/39 | 20 | 26,234 | ||||||
5.38%, 7/15/40 | 10 | 11,940 | ||||||
|
| |||||||
| 63,587 | ||||||||
Specialty Retail — 0.2% | ||||||||
Home Depot, Inc., 5.88%, 12/16/36 | 15 | 19,877 | ||||||
Lowe’s Cos., Inc., 6.65%, 9/15/37 | 5 | 6,986 | ||||||
|
| |||||||
| 26,863 | ||||||||
Technology Hardware, Storage & Peripherals — 0.0% |
| |||||||
HP, Inc., 6.00%, 9/15/41 | 5 | 5,089 | ||||||
Tobacco — 0.7% | ||||||||
Altria Group, Inc.: | ||||||||
4.00%, 1/31/24 | 15 | 16,463 | ||||||
5.38%, 1/31/44 | 20 | 24,396 | ||||||
Philip Morris International, Inc.: | ||||||||
3.60%, 11/15/23 | 10 | 10,764 | ||||||
4.88%, 11/15/43 | 10 | 11,335 | ||||||
4.25%, 11/10/44 | 15 | 15,726 | ||||||
|
| |||||||
| 78,684 | ||||||||
Wireless Telecommunication Services — 0.7% | ||||||||
America Movil SAB de CV, 6.38%, 3/01/35 | 25 | 30,424 | ||||||
Vodafone Group PLC: | ||||||||
2.95%, 2/19/23 | 10 | 10,103 | ||||||
6.15%, 2/27/37 | 25 | 29,748 | ||||||
4.38%, 2/19/43 | 5 | 4,814 | ||||||
|
| |||||||
| 75,089 | ||||||||
| Total Corporate Bonds — 35.5% | 4,122,236 | |||||||
| U.S. Treasury Obligations | ||||||||
U.S. Treasury Bonds: | ||||||||
7.25%, 8/15/22 | 110 | 145,479 | ||||||
7.13%, 2/15/23 | 55 | 73,543 | ||||||
7.50%, 11/15/24 | 130 | 187,403 | ||||||
7.63%, 2/15/25 | 90 | 131,439 | ||||||
6.00%, 2/15/26 | 125 | 170,068 | ||||||
6.38%, 8/15/27 | 150 | 215,766 | ||||||
| U.S. Treasury Obligations | Par (000) | Value | ||||||
U.S. Treasury Bonds (continued): | ||||||||
6.13%, 8/15/29 | $ | 50 | $ | 73,449 | ||||
6.25%, 5/15/30 | 105 | 158,037 | ||||||
4.50%, 2/15/36 | 50 | 67,982 | ||||||
4.38%, 2/15/38 | 25 | 33,618 | ||||||
4.50%, 5/15/38 | 10 | 13,674 | ||||||
4.38%, 11/15/39 | 10 | 13,405 | ||||||
4.38%, 5/15/41 | 30 | 40,403 | ||||||
3.75%, 8/15/41 | 10 | 12,301 | ||||||
3.13%, 2/15/42 | 40 | 44,523 | ||||||
2.75%, 11/15/42 | 80 | 83,028 | ||||||
3.13%, 2/15/43 | 50 | 55,605 | ||||||
2.88%, 5/15/43 | 80 | 84,919 | ||||||
3.63%, 8/15/43 | 230 | 279,621 | ||||||
3.75%, 11/15/43 | 150 | 186,434 | ||||||
3.63%, 2/15/44 | 50 | 60,768 | ||||||
3.38%, 5/15/44 | 75 | 87,290 | ||||||
3.13%, 8/15/44 | 60 | 66,745 | ||||||
3.00%, 11/15/44 | 30 | 32,585 | ||||||
2.50%, 2/15/45 | 40 | 39,303 | ||||||
2.88%, 8/15/45 | 30 | 31,791 | ||||||
3.00%, 11/15/45 | 130 | 141,141 | ||||||
2.50%, 2/15/46 | 150 | 147,182 | ||||||
2.25%, 8/15/46 | 15 | 13,951 | ||||||
U.S. Treasury Notes: | ||||||||
1.63%, 8/15/22 | 110 | 110,915 | ||||||
1.63%, 11/15/22 | 60 | 60,345 | ||||||
2.00%, 2/15/23 | 50 | 51,340 | ||||||
1.75%, 5/15/23 | 170 | 171,786 | ||||||
2.50%, 8/15/23 | 130 | 137,500 | ||||||
2.75%, 11/15/23 | 230 | 247,313 | ||||||
2.75%, 2/15/24 | 180 | 193,711 | ||||||
2.50%, 5/15/24 | 70 | 74,145 | ||||||
2.38%, 8/15/24 | 160 | 167,944 | ||||||
2.00%, 2/15/25 | 125 | 127,393 | ||||||
2.13%, 5/15/25 | 90 | 92,538 | ||||||
2.00%, 8/15/25 | 180 | 183,087 | ||||||
2.25%, 11/15/25 | 145 | 150,381 | ||||||
1.63%, 2/15/26 | 125 | 122,930 | ||||||
U.S. Treasury Principal STRIPS, 0.00%, 2/15/36 (b) | 4,288 | 2,778,937 | ||||||
| Total U.S. Treasury Obligations — 63.3% | 7,361,718 | |||||||
| Total Long-Term Investments (Cost — $10,687,137) — 98.8% | 11,483,954 | |||||||
| Short-Term Securities — 0.8% | Shares | |||||||
BlackRock Liquidity Funds, T-Fund, Institutional Class, 0.22% (c)(d) | 97,715 | 97,715 | ||||||
| Total Short-Term Securities (Cost — $97,715) — 0.8% | 97,715 | |||||||
| Total Investments (Cost — $10,784,852) — 99.6% | 11,581,669 | |||||||
Other Assets Less Liabilities — 0.4% |
| 45,026 | ||||||
|
| |||||||
Net Assets — 100.0% | $ | 11,626,695 | ||||||
|
| |||||||
| Notes to Schedule of Investments |
| (a) | Security exempt from registration pursuant to Rule 144A under the Securities Act of 1933, as amended. These securities may be resold in transactions exempt from registration to qualified institutional investors. |
| (b) | Zero-coupon bond. |
| (c) | Current yield as of period end. |
See Notes to Financial Statements.
| 20 | BLACKROCK CORI FUNDS | OCTOBER 31, 2016 |
Schedule of Investments (continued) | BlackRock CoRI 2017 Fund |
| (d) | During the year ended October 31, 2016, investments in issuers considered to be affiliates of the Fund for purposes of Section 2(a)(3) of the Investment Company Act of 1940, as amended, were as follows: |
| Affiliate | Shares Held at October 31, 2015 | Net Activity | Shares Held at October 31, 2016 | Value at October 31, 2016 | Income | |||||||||||||||
BlackRock Liquidity Funds, TempFund, Institutional Class | 154,645 | (154,645 | ) | — | — | $ | 593 | |||||||||||||
BlackRock Liquidity Funds, T-Fund, Institutional Class | — | 97,715 | 97,715 | $ | 97,715 | 53 | ||||||||||||||
Total | $ | 97,715 | $ | 646 | ||||||||||||||||
|
| |||||||||||||||||||
| Derivative Financial Instruments Outstanding as of Period End |
| Futures Contracts | ||||||||||||||
| Contracts Long | Issue | Expiration | Notional Value | Unrealized Depreciation | ||||||||||
| 1 | U.S. Treasury Long Bond | December 2016 | $ | 162,719 | $ | (7,692 | ) | |||||||
| Derivative Financial Instruments Categorized by Risk Exposure |
As of period end, the fair values of derivative financial instruments located in the Statements of Assets and Liabilities were as follows:
| Liabilities — Derivative Financial Instruments | Commodity Contracts | Credit Contracts | Equity Contracts | Foreign Currency Exchange Contracts | Interest Rate Contracts | Other Contracts | Total | |||||||||||||||||||||||
Futures contracts | Net unrealized depreciation1 | — | — | — | — | $ | 7,692 | — | $ | 7,692 | ||||||||||||||||||||
1 Includes cumulative appreciation (depreciation) on futures contracts, if any, as reported in the Schedule of Investments. Only current day’s variation margin is reported within the Statements of Assets and Liabilities. |
| |||||||||||||||||||||||||||||
For the year ended October 31, 2016, the effect of derivative financial instruments in the Statements of Operations was as follows:
| Net Realized Gain (Loss) from: | Commodity Contracts | Credit Contracts | Equity Contracts | Foreign Currency Exchange Contracts | Interest Rate Contracts | Other Contracts | Total | |||||||||||||||||||||
Futures contracts | — | — | — | — | $ | 19,355 | — | $ | 19,355 | |||||||||||||||||||
| Net Change in Unrealized Appreciation (Depreciation) on: | ||||||||||||||||||||||||||||
Futures contracts | — | — | — | — | $ | (7,566 | ) | — | $ | (7,566 | ) | |||||||||||||||||
| Average Quarterly Balances of Outstanding Derivative Financial Instruments | ||
| Futures contracts: | ||||
Average notional value of contracts — long | $ | 165,375 |
For more information about the Fund’s investment risks regarding derivative financial instruments, refer to the Notes to Financial Statements.
See Notes to Financial Statements.
| BLACKROCK CORI FUNDS | OCTOBER 31, 2016 | 21 |
Schedule of Investments (concluded) | BlackRock CoRI 2017 Fund |
| Fair Value Hierarchy as of Period End |
Various inputs are used in determining the fair value of investments and derivative financial instruments. For information about the Fund’s policy regarding valuation of investments and derivative financial instruments, refer to the Notes to Financial Statements.
The following tables summarize the Fund’s investments and derivative financial instruments categorized in the disclosure hierarchy:
| Level 1 | Level 2 | Level 3 | Total | |||||||||||||
Assets: | ||||||||||||||||
| Investments: | ||||||||||||||||
Long-Term Investments1 | — | $ | 11,483,954 | — | $ | 11,483,954 | ||||||||||
Short-Term Securities | $ | 97,715 | — | — | 97,715 | |||||||||||
|
| |||||||||||||||
Total | $ | 97,715 | $ | 11,483,954 | — | $ | 11,581,669 | |||||||||
|
| |||||||||||||||
| Derivative Financial Instruments2 | ||||||||||||||||
Liabilities: | ||||||||||||||||
Interest rate contracts | $ | (7,692 | ) | — | — | $ | (7,692 | ) | ||||||||
1 See above Schedule of Investments for values in each industry. |
| |||||||||||||||
2 Derivative financial instruments are futures contracts. Futures contracts are valued at the unrealized appreciation (depreciation) on the instrument. |
| |||||||||||||||
The Fund may hold assets and/or liabilities in which the fair value approximates the carrying amount for financial statement purposes. As of period end, cash pledged for futures contracts of $4,400 is categorized as Level 1 within the disclosure hierarchy.
During the year ended October 31, 2016, there were no transfers between levels.
See Notes to Financial Statements.
| 22 | BLACKROCK CORI FUNDS | OCTOBER 31, 2016 |
Schedule of Investments October 31, 2016 | BlackRock CoRI 2019 Fund (Percentages shown are based on Net Assets) |
| Corporate Bonds | Par (000) | Value | ||||||
Aerospace & Defense — 0.9% | ||||||||
Lockheed Martin Corp., 4.07%, 12/15/42 | $30 | $ | 30,981 | |||||
Northrop Grumman Corp., 4.75%, 6/01/43 | 15 | 17,029 | ||||||
United Technologies Corp., 4.50%, 6/01/42 | 65 | 71,203 | ||||||
|
| |||||||
| 119,213 | ||||||||
Air Freight & Logistics — 0.3% | ||||||||
FedEx Corp.: | ||||||||
4.90%, 1/15/34 | 15 | 16,850 | ||||||
4.10%, 2/01/45 | 10 | 9,851 | ||||||
United Parcel Service, Inc., 6.20%, 1/15/38 | 10 | 13,861 | ||||||
|
| |||||||
| 40,562 | ||||||||
Automobiles — 0.4% | ||||||||
Ford Motor Co., 4.75%, 1/15/43 | 50 | 50,019 | ||||||
Banks — 2.3% | ||||||||
Fifth Third Bancorp, 8.25%, 3/01/38 | 10 | 14,415 | ||||||
HSBC Holdings PLC, 6.10%, 1/14/42 | 80 | 103,648 | ||||||
Wells Fargo & Co.: | ||||||||
3.30%, 9/09/24 | 10 | 10,275 | ||||||
5.38%, 11/02/43 | 30 | 34,282 | ||||||
5.61%, 1/15/44 | 45 | 52,767 | ||||||
4.65%, 11/04/44 | 15 | 15,504 | ||||||
3.90%, 5/01/45 | 20 | 20,045 | ||||||
4.90%, 11/17/45 | 40 | 42,999 | ||||||
|
| |||||||
| 293,935 | ||||||||
Beverages — 0.4% | ||||||||
Anheuser-Busch InBev Finance, Inc., 4.63%, 2/01/44 | 5 | 5,532 | ||||||
Anheuser-Busch InBev Worldwide, Inc., 3.75%, 7/15/42 | 15 | 14,680 | ||||||
PepsiCo, Inc., 4.00%, 3/05/42 | 25 | 26,153 | ||||||
|
| |||||||
| 46,365 | ||||||||
Capital Markets — 3.8% | ||||||||
Ameriprise Financial, Inc., 3.70%, 10/15/24 | 10 | 10,661 | ||||||
Credit Suisse USA, Inc., 7.13%, 7/15/32 | 35 | 47,704 | ||||||
Goldman Sachs Group, Inc.: | ||||||||
6.13%, 2/15/33 | 25 | 30,944 | ||||||
6.75%, 10/01/37 | 50 | 63,062 | ||||||
6.25%, 2/01/41 | 25 | 32,020 | ||||||
5.15%, 5/22/45 | 30 | 32,413 | ||||||
Morgan Stanley: | ||||||||
3.88%, 4/29/24 | 25 | 26,446 | ||||||
3.70%, 10/23/24 | 55 | 57,613 | ||||||
5.00%, 11/24/25 | 25 | 27,653 | ||||||
4.35%, 9/08/26 | 15 | 15,925 | ||||||
3.95%, 4/23/27 | 45 | 46,295 | ||||||
6.38%, 7/24/42 | 10 | 13,360 | ||||||
4.30%, 1/27/45 | 25 | 26,180 | ||||||
State Street Corp.: | ||||||||
3.30%, 12/16/24 | 10 | 10,549 | ||||||
3.55%, 8/18/25 | 40 | 43,032 | ||||||
|
| |||||||
| 483,857 | ||||||||
Chemicals — 0.6% | ||||||||
CF Industries, Inc.: | ||||||||
5.15%, 3/15/34 | 5 | 4,490 | ||||||
5.38%, 3/15/44 | 10 | 8,554 | ||||||
Dow Chemical Co., 7.38%, 11/01/29 | 10 | 13,517 | ||||||
E.I. du Pont de Nemours & Co., 4.15%, 2/15/43 | 5 | 4,958 | ||||||
Ecolab, Inc., 5.50%, 12/08/41 | 10 | 12,349 | ||||||
EI du Pont de Nemours & Co., 4.90%, 1/15/41 | 10 | 10,948 | ||||||
LYB International Finance BV: | ||||||||
5.25%, 7/15/43 | 5 | 5,505 | ||||||
4.88%, 3/15/44 | 5 | 5,307 | ||||||
Potash Corp. of Saskatchewan, Inc., 5.88%, 12/01/36 | 10 | 11,748 | ||||||
|
| |||||||
| 77,376 | ||||||||
| Corporate Bonds | Par (000) | Value | ||||||
Communications Equipment — 0.5% | ||||||||
Cisco Systems, Inc., 5.90%, 2/15/39 | $40 | $ | 52,253 | |||||
Motorola Solutions, Inc., 4.00%, 9/01/24 | 5 | 5,055 | ||||||
|
| |||||||
| 57,308 | ||||||||
Consumer Finance — 0.4% | ||||||||
American Express Co., 4.05%, 12/03/42 | 20 | 20,266 | ||||||
MasterCard, Inc., 3.38%, 4/01/24 | 25 | 26,617 | ||||||
|
| |||||||
| 46,883 | ||||||||
Diversified Financial Services — 4.7% | ||||||||
Bank of America Corp.: | ||||||||
4.00%, 1/22/25 | 30 | 30,846 | ||||||
4.25%, 10/22/26 | 75 | 78,803 | ||||||
5.88%, 2/07/42 | 20 | 25,292 | ||||||
5.00%, 1/21/44 | 50 | 57,254 | ||||||
4.88%, 4/01/44 | 15 | 16,938 | ||||||
Series L, 4.75%, 4/21/45 | 5 | 5,205 | ||||||
Citigroup, Inc.: | ||||||||
5.50%, 9/13/25 | 25 | 28,152 | ||||||
4.30%, 11/20/26 | 20 | 20,871 | ||||||
8.13%, 7/15/39 | 35 | 53,376 | ||||||
6.68%, 9/13/43 | 15 | 19,303 | ||||||
5.30%, 5/06/44 | 25 | 27,575 | ||||||
4.65%, 7/30/45 | 20 | 21,883 | ||||||
4.75%, 5/18/46 | 20 | 20,595 | ||||||
Daimler Finance North America LLC, 8.50%, 1/18/31 | 10 | 15,998 | ||||||
JPMorgan Chase & Co.: | ||||||||
3.88%, 9/10/24 | 75 | 78,328 | ||||||
6.40%, 5/15/38 | 30 | 40,433 | ||||||
5.60%, 7/15/41 | 30 | 37,058 | ||||||
4.95%, 6/01/45 | 15 | 16,485 | ||||||
|
| |||||||
| 594,395 | ||||||||
Diversified Telecommunication Services — 2.9% | ||||||||
AT&T, Inc.: | ||||||||
6.30%, 1/15/38 | 30 | 34,804 | ||||||
5.35%, 9/01/40 | 25 | 26,284 | ||||||
6.38%, 3/01/41 | 10 | 11,795 | ||||||
5.55%, 8/15/41 | 15 | 16,273 | ||||||
4.50%, 3/09/48 (a) | 13 | 12,193 | ||||||
Orange SA, 5.38%, 1/13/42 | 5 | 5,871 | ||||||
Telefonica Emisiones SAU, 7.05%, 6/20/36 | 15 | 18,966 | ||||||
Verizon Communications, Inc.: | ||||||||
4.27%, 1/15/36 | 25 | 25,102 | ||||||
6.55%, 9/15/43 | 70 | 91,721 | ||||||
4.86%, 8/21/46 | 25 | 26,479 | ||||||
4.52%, 9/15/48 | 30 | 29,833 | ||||||
5.01%, 8/21/54 | 35 | 36,089 | ||||||
4.67%, 3/15/55 | 35 | 34,120 | ||||||
|
| |||||||
| 369,530 | ||||||||
Electric Utilities — 2.1% | ||||||||
Berkshire Hathaway Energy Co.: | ||||||||
6.13%, 4/01/36 | 20 | 26,171 | ||||||
6.50%, 9/15/37 | 10 | 13,611 | ||||||
Consolidated Edison Co. of New York, Inc., Series C, 5.50%, 12/01/39 | 20 | 24,878 | ||||||
Duke Energy Florida LLC, 6.40%, 6/15/38 | 35 | 48,358 | ||||||
Exelon Generation Co. LLC, 6.25%, 10/01/39 | 15 | 16,267 | ||||||
Georgia Power Co., 4.30%, 3/15/42 | 10 | 10,597 | ||||||
Pacific Gas & Electric Co., 6.05%, 3/01/34 | 35 | 45,944 | ||||||
PacifiCorp, 6.00%, 1/15/39 | 10 | 13,219 | ||||||
Public Service Electric & Gas Co., 3.80%, 3/01/46 | 15 | 15,684 | ||||||
Southern California Edison Co., Series A, 5.95%, 2/01/38 | 15 | 19,894 | ||||||
Southern Power Co., 5.15%, 9/15/41 | 10 | 10,672 | ||||||
Virginia Electric & Power Co., 8.88%, 11/15/38 | 10 | 16,661 | ||||||
|
| |||||||
| 261,956 | ||||||||
See Notes to Financial Statements.
| BLACKROCK CORI FUNDS | OCTOBER 31, 2016 | 23 |
Schedule of Investments (continued) | BlackRock CoRI 2019 Fund |
| Corporate Bonds | Par (000) | Value | ||||||
Energy Equipment & Services — 0.5% | ||||||||
Baker Hughes, Inc., 5.13%, 9/15/40 | $10 | $ | 11,569 | |||||
Enterprise Products Operating LLC, 5.70%, 2/15/42 | 20 | 22,595 | ||||||
Halliburton Co., 7.45%, 9/15/39 | 20 | 27,720 | ||||||
|
| |||||||
| 61,884 | ||||||||
Food & Staples Retailing — 0.2% | ||||||||
Target Corp., 3.63%, 4/15/46 | 25 | 24,627 | ||||||
Food Products — 0.3% | ||||||||
Archer-Daniels-Midland Co., 4.54%, 3/26/42 | 15 | 16,948 | ||||||
Kellogg Co., 4.50%, 4/01/46 | 20 | 20,772 | ||||||
Kraft Heinz Foods Co., 6.88%, 1/26/39 | 5 | 6,698 | ||||||
|
| |||||||
| 44,418 | ||||||||
Health Care Equipment & Supplies — 0.3% | ||||||||
Medtronic, Inc.: | ||||||||
4.63%, 3/15/44 | 8 | 9,094 | ||||||
4.63%, 3/15/45 | 30 | 33,941 | ||||||
|
| |||||||
| 43,035 | ||||||||
Health Care Providers & Services — 0.7% | ||||||||
Aetna, Inc., 6.63%, 6/15/36 | 5 | 6,546 | ||||||
Anthem, Inc., 5.10%, 1/15/44 | 25 | 28,311 | ||||||
UnitedHealth Group, Inc.: | ||||||||
4.63%, 7/15/35 | 10 | 11,406 | ||||||
6.88%, 2/15/38 | 20 | 27,977 | ||||||
4.75%, 7/15/45 | 10 | 11,577 | ||||||
|
| |||||||
| 85,817 | ||||||||
Hotels, Restaurants & Leisure — 0.3% | ||||||||
McDonald’s Corp.: | ||||||||
6.30%, 10/15/37 | 15 | 19,266 | ||||||
3.70%, 2/15/42 | 15 | 14,244 | ||||||
|
| |||||||
| 33,510 | ||||||||
Household Products — 0.1% | ||||||||
Kimberly-Clark Corp., 6.63%, 8/01/37 | 10 | 14,518 | ||||||
Industrial Conglomerates — 0.1% | ||||||||
General Electric Co., 5.88%, 1/14/38 | 10 | 13,061 | ||||||
Insurance — 1.5% | ||||||||
Allstate Corp., 4.50%, 6/15/43 | 15 | 17,045 | ||||||
American International Group, Inc., 4.13%, 2/15/24 | 50 | 53,749 | ||||||
Arch Capital Group US, Inc., 5.14%, 11/01/43 | 10 | 10,689 | ||||||
AXA SA, 8.60%, 12/15/30 | 10 | 14,050 | ||||||
MetLife, Inc., 4.88%, 11/13/43 | 45 | 49,493 | ||||||
Prudential Financial, Inc., 6.63%, 12/01/37 | 20 | 26,245 | ||||||
Travelers Cos., Inc., 4.60%, 8/01/43 | 15 | 17,287 | ||||||
|
| |||||||
| 188,558 | ||||||||
Machinery — 0.2% | ||||||||
Caterpillar, Inc., 3.80%, 8/15/42 | 20 | 20,228 | ||||||
Media — 2.6% | ||||||||
21st Century Fox America, Inc.: | ||||||||
6.40%, 12/15/35 | 35 | 43,911 | ||||||
6.15%, 2/15/41 | 10 | 12,414 | ||||||
5.40%, 10/01/43 | 10 | 11,481 | ||||||
Comcast Corp.: | ||||||||
4.25%, 1/15/33 | 20 | 21,512 | ||||||
6.45%, 3/15/37 | 20 | 26,788 | ||||||
6.40%, 3/01/40 | 25 | 34,142 | ||||||
4.75%, 3/01/44 | 25 | 28,282 | ||||||
NBCUniversal Media LLC: | ||||||||
6.40%, 4/30/40 | 20 | 27,275 | ||||||
5.95%, 4/01/41 | 10 | 13,023 | ||||||
Thomson Reuters Corp., 5.85%, 4/15/40 | 5 | 5,758 | ||||||
| Corporate Bonds | Par (000) | Value | ||||||
Media (continued) | ||||||||
Time Warner, Inc.: | ||||||||
4.05%, 12/15/23 | $25 | $ | 26,896 | |||||
7.63%, 4/15/31 | 15 | 20,961 | ||||||
5.38%, 10/15/41 | 20 | 22,675 | ||||||
5.35%, 12/15/43 | 20 | 22,603 | ||||||
Walt Disney Co., 4.13%, 6/01/44 | 5 | 5,448 | ||||||
|
| |||||||
| 323,169 | ||||||||
Metals & Mining — 0.6% | ||||||||
BHP Billiton Finance USA Ltd., 5.00%, 9/30/43 | 10 | 11,388 | ||||||
Newmont Mining Corp., 6.25%, 10/01/39 | 10 | 11,767 | ||||||
Rio Tinto Finance USA Ltd., 5.20%, 11/02/40 | 15 | 17,176 | ||||||
Southern Copper Corp.: | ||||||||
5.25%, 11/08/42 | 20 | 18,918 | ||||||
5.88%, 4/23/45 | 15 | 14,986 | ||||||
|
| |||||||
| 74,235 | ||||||||
Multiline Retail — 0.2% | ||||||||
Target Corp., 4.00%, 7/01/42 | 25 | 26,285 | ||||||
Oil, Gas & Consumable Fuels — 2.2% | ||||||||
Anadarko Petroleum Corp., 6.45%, 9/15/36 | 30 | 35,600 | ||||||
ConocoPhillips, 6.50%, 2/01/39 | 25 | 31,914 | ||||||
ConocoPhillips Holding Co., 6.95%, 4/15/29 | 25 | 31,739 | ||||||
Devon Financing Co. LLC, 7.88%, 9/30/31 | 20 | 25,462 | ||||||
Enterprise Products Operating LLC, 5.95%, 2/01/41 | 10 | 11,553 | ||||||
ONEOK Partners LP, 6.85%, 10/15/37 | 5 | 5,771 | ||||||
Phillips 66, 5.88%, 5/01/42 | 10 | 12,214 | ||||||
Suncor Energy, Inc., 6.50%, 6/15/38 | 35 | 44,875 | ||||||
TransCanada PipeLines Ltd.: | ||||||||
7.63%, 1/15/39 | 20 | 29,593 | ||||||
6.10%, 6/01/40 | 15 | 19,084 | ||||||
Valero Energy Corp.: | ||||||||
6.63%, 6/15/37 | 20 | 23,406 | ||||||
4.90%, 3/15/45 | 10 | 9,797 | ||||||
|
| |||||||
| 281,008 | ||||||||
Pharmaceuticals — 2.0% | ||||||||
Abbott Laboratories, 5.30%, 5/27/40 | 10 | 11,703 | ||||||
AbbVie, Inc., 4.40%, 11/06/42 | 15 | 14,691 | ||||||
AstraZeneca PLC: | ||||||||
3.38%, 11/16/25 | 20 | 20,823 | ||||||
6.45%, 9/15/37 | 15 | 20,401 | ||||||
4.38%, 11/16/45 | 10 | 10,604 | ||||||
Bristol-Myers Squibb Co., 3.25%, 8/01/42 | 5 | 4,815 | ||||||
GlaxoSmithKline Capital, Inc., 6.38%, 5/15/38 | 20 | 27,807 | ||||||
Merck & Co., Inc., 2.80%, 5/18/23 | 25 | 25,801 | ||||||
Pfizer, Inc.: | ||||||||
7.20%, 3/15/39 | 50 | 74,781 | ||||||
4.40%, 5/15/44 | 5 | 5,622 | ||||||
Teva Pharmaceutical Finance Co. LLC, 6.15%, 2/01/36 | 5 | 6,156 | ||||||
Teva Pharmaceutical Finance Netherlands III BV: | ||||||||
3.15%, 10/01/26 | 25 | 24,313 | ||||||
4.10%, 10/01/46 | 10 | 9,283 | ||||||
|
| |||||||
| 256,800 | ||||||||
Real Estate Investment Trusts (REITs) — 0.2% | ||||||||
Weyerhaeuser Co., 7.38%, 3/15/32 | 15 | 19,846 | ||||||
Road & Rail — 0.3% | ||||||||
CSX Corp., 6.22%, 4/30/40 | 5 | 6,529 | ||||||
Norfolk Southern Corp., 4.84%, 10/01/41 | 25 | 28,241 | ||||||
|
| |||||||
| 34,770 | ||||||||
Semiconductors & Semiconductor Equipment — 0.2% | ||||||||
Applied Materials, Inc., 5.85%, 6/15/41 | 5 | 6,188 | ||||||
Intel Corp., 4.80%, 10/01/41 | 15 | 17,065 | ||||||
|
| |||||||
| 23,253 | ||||||||
See Notes to Financial Statements.
| 24 | BLACKROCK CORI FUNDS | OCTOBER 31, 2016 |
Schedule of Investments (continued) | BlackRock CoRI 2019 Fund |
| Corporate Bonds | Par (000) | Value | ||||||
Software — 0.3% | ||||||||
Oracle Corp.: | ||||||||
6.13%, 7/08/39 | $ 20 | $ | 26,234 | |||||
5.38%, 7/15/40 | 10 | 11,940 | ||||||
|
| |||||||
| 38,174 | ||||||||
Specialty Retail — 0.2% | ||||||||
Home Depot, Inc., 5.88%, 12/16/36 | 20 | 26,503 | ||||||
Technology Hardware, Storage & Peripherals — 0.0% |
| |||||||
HP, Inc., 6.00%, 9/15/41 | 5 | 5,089 | ||||||
Tobacco — 0.6% | ||||||||
Altria Group, Inc., 5.38%, 1/31/44 | 30 | 36,595 | ||||||
Philip Morris International, Inc.: | ||||||||
4.88%, 11/15/43 | 15 | 17,002 | ||||||
4.25%, 11/10/44 | 20 | 20,968 | ||||||
|
| |||||||
| 74,565 | ||||||||
Wireless Telecommunication Services — 0.6% | ||||||||
America Movil SAB de CV, 6.38%, 3/01/35 | 30 | 36,509 | ||||||
Vodafone Group PLC: | ||||||||
6.15%, 2/27/37 | 30 | 35,698 | ||||||
4.38%, 2/19/43 | 10 | 9,629 | ||||||
|
| |||||||
| 81,836 | ||||||||
| Total Corporate Bonds — 33.5% | 4,236,588 | |||||||
| U.S. Treasury Obligations | ||||||||
U.S. Treasury Bonds: | ||||||||
7.50%, 11/15/24 | 90 | 129,741 | ||||||
7.63%, 2/15/25 | 180 | 262,877 | ||||||
6.00%, 2/15/26 | 190 | 258,504 | ||||||
6.50%, 11/15/26 | 185 | 264,268 | ||||||
6.13%, 8/15/29 | 250 | 367,246 | ||||||
6.25%, 5/15/30 | 25 | 37,628 | ||||||
5.38%, 2/15/31 | 50 | 71,020 | ||||||
4.50%, 2/15/36 | 160 | 217,544 | ||||||
4.38%, 2/15/38 | 20 | 26,895 | ||||||
4.50%, 5/15/38 | 20 | 27,348 | ||||||
3.50%, 2/15/39 | 10 | 11,894 | ||||||
4.25%, 5/15/39 | 20 | 26,366 | ||||||
4.50%, 8/15/39 | 10 | 13,623 | ||||||
4.63%, 2/15/40 | 10 | 13,862 | ||||||
| U.S. Treasury Obligations | Par (000) | Value | ||||||
U.S. Treasury Bonds (continued) : | ||||||||
4.38%, 5/15/41 | $ | 10 | $ | 13,468 | ||||
3.13%, 2/15/42 | 50 | 55,654 | ||||||
2.75%, 8/15/42 | 30 | 31,172 | ||||||
2.75%, 11/15/42 | 330 | 342,491 | ||||||
2.88%, 5/15/43 | 60 | 63,689 | ||||||
3.63%, 8/15/43 | 280 | 340,408 | ||||||
3.75%, 11/15/43 | 200 | 248,578 | ||||||
3.63%, 2/15/44 | 150 | 182,303 | ||||||
3.38%, 5/15/44 | 160 | 186,219 | ||||||
3.13%, 8/15/44 | 80 | 88,994 | ||||||
3.00%, 11/15/44 | 50 | 54,309 | ||||||
2.50%, 2/15/45 | 30 | 29,477 | ||||||
3.00%, 5/15/45 | 10 | 10,856 | ||||||
2.88%, 8/15/45 | 50 | 52,984 | ||||||
3.00%, 11/15/45 | 170 | 184,569 | ||||||
2.50%, 2/15/46 | 150 | 147,182 | ||||||
2.50%, 5/15/46 | 75 | 73,626 | ||||||
2.25%, 8/15/46 | 25 | 23,251 | ||||||
U.S. Treasury Notes: | ||||||||
2.38%, 8/15/24 | 50 | 52,482 | ||||||
2.25%, 11/15/24 | 25 | 25,992 | ||||||
2.00%, 2/15/25 | 230 | 234,402 | ||||||
2.13%, 5/15/25 | 300 | 308,461 | ||||||
2.00%, 8/15/25 | 220 | 223,773 | ||||||
2.25%, 11/15/25 | 110 | 114,082 | ||||||
1.63%, 2/15/26 | 200 | 196,688 | ||||||
1.63%, 5/15/26 | 100 | 98,219 | ||||||
U.S. Treasury Principal STRIPS, 0.00%, 5/15/37 (b) | 5,180 | 3,206,886 | ||||||
| Total U.S. Treasury Obligations — 65.8% | 8,319,031 | |||||||
| Total Long-Term Investments (Cost — $11,645,689) — 99.3% | 12,555,619 | |||||||
| Short-Term Securities — 0.3% | Shares | |||||||
BlackRock Liquidity Funds, T-Fund, Institutional Class, 0.22% (c)(d) | 42,367 | 42,367 | ||||||
| Total Short-Term Securities (Cost — $42,367) — 0.3% | 42,367 | |||||||
| Total Investments (Cost — $11,688,056) — 99.6% | $ | 12,597,986 | ||||||
Other Assets Less Liabilities — 0.4% | 55,194 | |||||||
|
| |||||||
Net Assets — 100.0% | $ | 12,653,180 | ||||||
|
| |||||||
| Notes to Schedule of investments |
| (a) | Security exempt from registration pursuant to Rule 144A under the Securities Act of 1933, as amended. These securities may be resold in transactions exempt from registration to qualified institutional investors. |
| (b) | Zero-coupon bond. |
| (c) | During the year ended October 31, 2016, investments in issuers considered to be affiliates of the Fund for purposes of Section 2(a)(3) of the Investment Company Act of 1940, as amended, were as follows: |
| Affiliate | Shares Held at October 31, 2015 | Net Activity | Shares Held at October 31, 2016 | Value at October 31, 2016 | Income | |||||||||||||||
BlackRock Liquidity Funds, TempFund, Institutional Class | 299,546 | (299,546 | ) | — | — | $ | 362 | |||||||||||||
BlackRock Liquidity Funds, T-Fund, Institutional Class | — | 42,367 | 42,367 | $ | 42,367 | 44 | ||||||||||||||
Total | $ | 42,367 | $ | 406 | ||||||||||||||||
|
| |||||||||||||||||||
| (d) | Current yield as of period end. |
See Notes to Financial Statements.
| BLACKROCK CORI FUNDS | OCTOBER 31, 2016 | 25 |
Schedule of Investments (concluded) | BlackRock CoRI 2019 Fund |
| Derivative Financial Instruments Outstanding as of Period End |
| Futures Contracts | ||||||||||||||
| Contracts Long | Issue | Expiration | Notional Value | Unrealized Depreciation | ||||||||||
| 1 | U.S. Treasury Long Bond | December 2016 | $ | 162,719 | $ | (7,692 | ) | |||||||
| Derivative Financial Instruments Categorized by Risk Exposure |
As of period end, the fair values of derivative financial instruments located in the Statements of Assets and Liabilities were as follows:
| Liabilities — Derivative Financial Instruments | Commodity Contracts | Credit Contracts | Equity Contracts | Foreign Currency Exchange Contracts | Interest Rate Contracts | Other Contracts | Total | |||||||||||||||||||||||
Futures contracts | Net unrealized depreciation1 | — | — | — | — | $ | 7,692 | — | $ | 7,692 | ||||||||||||||||||||
1 Includes cumulative appreciation (depreciation) on futures contracts, if any, as reported in the Schedule of Investments. Only current day’s variation margin is reported within the Statements of Assets and Liabilities. |
| |||||||||||||||||||||||||||||
For the year ended October 31, 2016, the effect of derivative financial instruments in the Statements of Operation was as follows:
| Net Realized Gain (Loss) from: | Commodity Contracts | Credit Contracts | Equity Contracts | Foreign Currency Exchange Contracts | Interest Rate Contracts | Other Contracts | Total | |||||||||||||||||||||
Futures contracts | — | — | — | — | $ | 19,355 | — | $ | 19,355 | |||||||||||||||||||
Net Change in Unrealized Appreciation (Depreciation) on: | ||||||||||||||||||||||||||||
Futures contracts | — | — | — | — | $ | (7,566 | ) | — | $ | (7,566 | ) | |||||||||||||||||
| Average Quarterly Balances of Outstanding Derivative Financial Instruments |
| Futures contracts: | ||||
Average notional value of contracts — long | $ | 165,375 |
For more information about the Fund’s investment risks regarding derivative financial instruments, refer to the Notes to Financial Statements.
| Fair Value Hierarchy as of Period End |
Various inputs are used in determining the fair value of investments and derivative financial instruments. For information about the Fund’s policy regarding valuation of investments and derivative financial instruments, refer to the Notes to Financial Statements.
The following tables summarize the Fund’s investments and derivative financial instruments categorized in the disclosure hierarchy:
| Level 1 | Level 2 | Level 3 | Total | |||||||||||||
Assets: | ||||||||||||||||
| Investments: | ||||||||||||||||
Long-Term Investments1 | — | $ | 12,555,619 | — | $ | 12,555,619 | ||||||||||
Short-Term Securities | $ | 42,367 | — | — | 42,367 | |||||||||||
|
| |||||||||||||||
Total | $ | 42,367 | $ | 12,555,619 | — | $ | 12,597,986 | |||||||||
|
| |||||||||||||||
| Derivative Financial Instruments2 | ||||||||||||||||
Liabilities: | ||||||||||||||||
Interest rate contracts | $ | (7,692 | ) | — | — | $ | (7,692 | ) | ||||||||
1 See above Schedule of Investments for values in each industry. |
| |||||||||||||||
2 Derivative financial instruments are futures contracts. Futures contracts are valued at the unrealized appreciation (depreciation) on the instrument. |
| |||||||||||||||
The Fund may hold assets and/or liabilities in which the fair value approximates the carrying amount for financial statement purposes. As of period end, cash pledged for futures contracts of $4,400 is categorized as Level 1 within the disclosure hierarchy.
During the year ended October 31, 2016, there were no transfers between levels.
See Notes to Financial Statements.
| 26 | BLACKROCK CORI FUNDS | OCTOBER 31, 2016 |
Schedule of Investments October 31, 2016 | BlackRock CoRI 2021 Fund (Percentages shown are based on Net Assets) |
| Corporate Bonds | Par (000) | Value | ||||||
Aerospace & Defense — 1.3% | ||||||||
Eaton Corp., 4.00%, 11/02/32 | $20 | $ | 20,898 | |||||
Lockheed Martin Corp., 4.07%, 12/15/42 | 30 | 30,980 | ||||||
Northrop Grumman Corp., 4.75%, 6/01/43 | 20 | 22,706 | ||||||
United Technologies Corp.: | ||||||||
5.70%, 4/15/40 | 20 | 25,502 | ||||||
4.50%, 6/01/42 | 65 | 71,203 | ||||||
|
| |||||||
| 171,289 | ||||||||
Air Freight & Logistics — 0.5% | ||||||||
FedEx Corp.: | ||||||||
4.90%, 1/15/34 | 15 | 16,850 | ||||||
5.10%, 1/15/44 | 10 | 11,419 | ||||||
4.10%, 2/01/45 | 10 | 9,851 | ||||||
United Parcel Service, Inc., 6.20%, 1/15/38 | 15 | 20,792 | ||||||
|
| |||||||
| 58,912 | ||||||||
Automobiles — 0.2% | ||||||||
Ford Motor Co., 4.75%, 1/15/43 | 30 | 30,012 | ||||||
Banks — 2.6% | ||||||||
Fifth Third Bancorp, 8.25%, 3/01/38 | 10 | 14,415 | ||||||
HSBC Holdings PLC, 6.10%, 1/14/42 | 85 | 110,126 | ||||||
Wells Fargo & Co.: | ||||||||
4.30%, 7/22/27 | 45 | 47,826 | ||||||
5.38%, 11/02/43 | 35 | 39,996 | ||||||
5.61%, 1/15/44 | 45 | 52,767 | ||||||
4.65%, 11/04/44 | 25 | 25,840 | ||||||
3.90%, 5/01/45 | 25 | 25,056 | ||||||
4.90%, 11/17/45 | 20 | 21,499 | ||||||
|
| |||||||
| 337,525 | ||||||||
Beverages — 0.7% | ||||||||
Anheuser-Busch InBev Finance, Inc., 4.63%, 2/01/44 | 10 | 11,064 | ||||||
Anheuser-Busch InBev Worldwide, Inc., 3.75%, 7/15/42 | 20 | 19,573 | ||||||
Diageo Investment Corp., 4.25%, 5/11/42 | 15 | 16,120 | ||||||
PepsiCo, Inc.: | ||||||||
4.00%, 3/05/42 | 25 | 26,153 | ||||||
3.60%, 8/13/42 | 15 | 14,831 | ||||||
|
| |||||||
| 87,741 | ||||||||
Capital Markets — 2.1% | ||||||||
Credit Suisse USA, Inc., 7.13%, 7/15/32 | 10 | 13,630 | ||||||
Goldman Sachs Group, Inc.: | ||||||||
6.13%, 2/15/33 | 10 | 12,378 | ||||||
6.75%, 10/01/37 | 60 | 75,674 | ||||||
5.15%, 5/22/45 | 45 | 48,619 | ||||||
Morgan Stanley: | ||||||||
4.35%, 9/08/26 | 25 | 26,542 | ||||||
3.95%, 4/23/27 | 35 | 36,007 | ||||||
6.38%, 7/24/42 | 15 | 20,040 | ||||||
4.30%, 1/27/45 | 35 | 36,652 | ||||||
|
| |||||||
| 269,542 | ||||||||
Chemicals — 0.7% | ||||||||
CF Industries, Inc.: | ||||||||
5.15%, 3/15/34 | 5 | 4,490 | ||||||
5.38%, 3/15/44 | 15 | 12,830 | ||||||
Dow Chemical Co., 7.38%, 11/01/29 | 15 | 20,275 | ||||||
E.I. du Pont de Nemours & Co., 4.15%, 2/15/43 | 10 | 9,916 | ||||||
Ecolab, Inc., 5.50%, 12/08/41 | 5 | 6,175 | ||||||
EI du Pont de Nemours & Co., 4.90%, 1/15/41 | 10 | 10,948 | ||||||
LYB International Finance BV, 5.25%, 7/15/43 | 10 | 11,011 | ||||||
Potash Corp. of Saskatchewan, Inc., 5.88%, 12/01/36 | 10 | 11,747 | ||||||
|
| |||||||
| 87,392 | ||||||||
| Corporate Bonds | Par (000) | Value | ||||||
Communications Equipment — 0.5% | ||||||||
Cisco Systems, Inc., 5.90%, 2/15/39 | $45 | $ | 58,784 | |||||
Consumer Finance — 0.1% | ||||||||
American Express Co., 4.05%, 12/03/42 | 20 | 20,267 | ||||||
Diversified Financial Services — 3.7% | ||||||||
Bank of America Corp.: | ||||||||
4.25%, 10/22/26 | 40 | 42,028 | ||||||
5.88%, 2/07/42 | 20 | 25,292 | ||||||
5.00%, 1/21/44 | 40 | 45,803 | ||||||
4.88%, 4/01/44 | 15 | 16,938 | ||||||
Series L, 4.75%, 4/21/45 | 15 | 15,617 | ||||||
Citigroup, Inc.: | ||||||||
4.30%, 11/20/26 | 10 | 10,436 | ||||||
4.45%, 9/29/27 | 10 | 10,536 | ||||||
8.13%, 7/15/39 | 35 | 53,376 | ||||||
6.68%, 9/13/43 | 20 | 25,738 | ||||||
5.30%, 5/06/44 | 5 | 5,515 | ||||||
4.65%, 7/30/45 | 15 | 16,412 | ||||||
4.75%, 5/18/46 | 25 | 25,743 | ||||||
Daimler Finance North America LLC, 8.50%, 1/18/31 | 10 | 15,998 | ||||||
JPMorgan Chase & Co.: | ||||||||
4.13%, 12/15/26 | 30 | 31,661 | ||||||
4.25%, 10/01/27 | 25 | 26,590 | ||||||
6.40%, 5/15/38 | 35 | 47,172 | ||||||
5.60%, 7/15/41 | 10 | 12,353 | ||||||
5.40%, 1/06/42 | 30 | 36,341 | ||||||
4.95%, 6/01/45 | 15 | 16,485 | ||||||
|
| |||||||
| 480,034 | ||||||||
Diversified Telecommunication Services — 3.8% | ||||||||
AT&T, Inc.: | ||||||||
6.30%, 1/15/38 | 20 | 23,203 | ||||||
5.35%, 9/01/40 | 40 | 42,054 | ||||||
6.38%, 3/01/41 | 15 | 17,692 | ||||||
5.55%, 8/15/41 | 25 | 27,121 | ||||||
4.50%, 3/09/48 (a) | 19 | 17,820 | ||||||
Orange SA, 5.38%, 1/13/42 | 5 | 5,871 | ||||||
Telefonica Emisiones SAU, 7.05%, 6/20/36 | 30 | 37,932 | ||||||
Telefonica Europe BV, 8.25%, 9/15/30 | 10 | 14,205 | ||||||
Verizon Communications, Inc.: | ||||||||
4.27%, 1/15/36 | 25 | 25,102 | ||||||
4.75%, 11/01/41 | 15 | 15,648 | ||||||
6.55%, 9/15/43 | 35 | 45,860 | ||||||
4.86%, 8/21/46 | 60 | 63,551 | ||||||
4.52%, 9/15/48 | 45 | 44,750 | ||||||
5.01%, 8/21/54 | 65 | 67,023 | ||||||
4.67%, 3/15/55 | 40 | 38,994 | ||||||
|
| |||||||
| 486,826 | ||||||||
Electric Utilities — 2.7% | ||||||||
Appalachian Power Co., 7.00%, 4/01/38 | 10 | 13,738 | ||||||
Berkshire Hathaway Energy Co., 6.13%, 4/01/36 | 40 | 52,343 | ||||||
Consolidated Edison Co. of New York, Inc., Series C, 5.50%, 12/01/39 | 15 | 18,658 | ||||||
Duke Energy Florida LLC, 6.40%, 6/15/38 | 35 | 48,358 | ||||||
Exelon Generation Co. LLC, 6.25%, 10/01/39 | 20 | 21,689 | ||||||
Georgia Power Co., 4.30%, 3/15/42 | 25 | 26,494 | ||||||
Pacific Gas & Electric Co., 6.05%, 3/01/34 | 40 | 52,507 | ||||||
PacifiCorp, 6.00%, 1/15/39 | 10 | 13,218 | ||||||
Public Service Electric & Gas Co., 3.80%, 3/01/46 | 20 | 20,913 | ||||||
Southern California Edison Co., Series A, 5.95%, 2/01/38 | 20 | 26,526 | ||||||
Southern Power Co., 5.15%, 9/15/41 | 15 | 16,008 | ||||||
Virginia Electric & Power Co.: | ||||||||
8.88%, 11/15/38 | 10 | 16,661 | ||||||
Series A, 6.00%, 5/15/37 | 15 | 19,659 | ||||||
|
| |||||||
| 346,772 | ||||||||
See Notes to Financial Statements.
| BLACKROCK CORI FUNDS | OCTOBER 31, 2016 | 27 |
Schedule of Investments (continued) | BlackRock CoRI 2021 Fund |
| Corporate Bonds | Par (000) | Value | ||||||
Energy Equipment & Services — 0.3% | ||||||||
Baker Hughes, Inc., 5.13%, 9/15/40 | $10 | $ | 11,568 | |||||
Enterprise Products Operating LLC: | ||||||||
6.13%, 10/15/39 | 5 | 5,745 | ||||||
5.70%, 2/15/42 | 5 | 5,649 | ||||||
Halliburton Co., 7.45%, 9/15/39 | 15 | 20,790 | ||||||
|
| |||||||
| 43,752 | ||||||||
Food & Staples Retailing — 0.1% | ||||||||
Target Corp., 3.63%, 4/15/46 | 15 | 14,776 | ||||||
Walgreen Co., 4.40%, 9/15/42 | 5 | 5,069 | ||||||
|
| |||||||
| 19,845 | ||||||||
Food Products — 0.4% | ||||||||
Archer-Daniels-Midland Co., 4.54%, 3/26/42 | 20 | 22,596 | ||||||
Kellogg Co., 4.50%, 4/01/46 | 15 | 15,579 | ||||||
Mondelez International, Inc., 6.50%, 2/09/40 | 10 | 13,338 | ||||||
|
| |||||||
| 51,513 | ||||||||
Health Care Equipment & Supplies — 0.5% | ||||||||
Medtronic, Inc.: | ||||||||
4.38%, 3/15/35 | 30 | 32,910 | ||||||
4.63%, 3/15/45 | 25 | 28,284 | ||||||
|
| |||||||
| 61,194 | ||||||||
Health Care Providers & Services — 0.9% | ||||||||
Aetna, Inc., 6.63%, 6/15/36 | 5 | 6,546 | ||||||
Anthem, Inc.: | ||||||||
4.65%, 1/15/43 | 10 | 10,598 | ||||||
5.10%, 1/15/44 | 30 | 33,973 | ||||||
UnitedHealth Group, Inc.: | ||||||||
4.63%, 7/15/35 | 20 | 22,813 | ||||||
6.88%, 2/15/38 | 20 | 27,977 | ||||||
4.75%, 7/15/45 | 10 | 11,577 | ||||||
|
| |||||||
| 113,484 | ||||||||
Hotels, Restaurants & Leisure — 0.2% | ||||||||
McDonald’s Corp., 6.30%, 10/15/37 | 20 | 25,689 | ||||||
Household Products — 0.1% | ||||||||
Kimberly-Clark Corp., 6.63%, 8/01/37 | 5 | 7,259 | ||||||
Insurance — 1.6% | ||||||||
Allstate Corp., 4.50%, 6/15/43 | 15 | 17,045 | ||||||
Arch Capital Group US, Inc., 5.14%, 11/01/43 | 10 | 10,689 | ||||||
AXA SA, 8.60%, 12/15/30 | 10 | 14,050 | ||||||
Lincoln National Corp.: | ||||||||
6.15%, 4/07/36 | 10 | 11,570 | ||||||
7.00%, 6/15/40 | 10 | 12,769 | ||||||
MetLife, Inc.: | ||||||||
4.88%, 11/13/43 | 40 | 43,994 | ||||||
4.05%, 3/01/45 | 20 | 19,859 | ||||||
Prudential Financial, Inc.: | ||||||||
6.63%, 12/01/37 | 25 | 32,806 | ||||||
4.60%, 5/15/44 | 10 | 10,633 | ||||||
Travelers Cos., Inc., 4.60%, 8/01/43 | 30 | 34,575 | ||||||
|
| |||||||
| 207,990 | ||||||||
Machinery — 0.2% | ||||||||
Caterpillar, Inc., 3.80%, 8/15/42 | 25 | 25,285 | ||||||
Media �� 3.1% | ||||||||
21st Century Fox America, Inc.: | ||||||||
6.40%, 12/15/35 | 50 | 62,731 | ||||||
6.15%, 2/15/41 | 10 | 12,413 | ||||||
5.40%, 10/01/43 | 15 | 17,221 | ||||||
Comcast Corp.: | ||||||||
4.25%, 1/15/33 | 30 | 32,269 | ||||||
6.45%, 3/15/37 | 15 | 20,091 | ||||||
6.40%, 3/01/40 | 25 | 34,142 | ||||||
4.65%, 7/15/42 | 10 | 11,092 | ||||||
| Corporate Bonds | Par (000) | Value | ||||||
Media (continued) | ||||||||
Comcast Corp. (continued): | ||||||||
4.75%, 3/01/44 | $20 | $ | 22,626 | |||||
NBCUniversal Media LLC: | ||||||||
6.40%, 4/30/40 | 25 | 34,094 | ||||||
5.95%, 4/01/41 | 10 | 13,023 | ||||||
4.45%, 1/15/43 | 10 | 10,813 | ||||||
Thomson Reuters Corp., 5.85%, 4/15/40 | 5 | 5,758 | ||||||
Time Warner, Inc.: | ||||||||
7.63%, 4/15/31 | 20 | 27,948 | ||||||
6.20%, 3/15/40 | 20 | 24,380 | ||||||
6.10%, 7/15/40 | 5 | 5,981 | ||||||
5.38%, 10/15/41 | 20 | 22,675 | ||||||
5.35%, 12/15/43 | 10 | 11,301 | ||||||
Walt Disney Co., 4.13%, 6/01/44 | 25 | 27,241 | ||||||
|
| |||||||
| 395,799 | ||||||||
Metals & Mining — 0.8% | ||||||||
BHP Billiton Finance USA Ltd., 5.00%, 9/30/43 | 20 | 22,775 | ||||||
Newmont Mining Corp., 6.25%, 10/01/39 | 10 | 11,768 | ||||||
Rio Tinto Finance USA Ltd., 5.20%, 11/02/40 | 10 | 11,450 | ||||||
Southern Copper Corp.: | ||||||||
5.25%, 11/08/42 | 25 | 23,648 | ||||||
5.88%, 4/23/45 | 30 | 29,972 | ||||||
|
| |||||||
| 99,613 | ||||||||
Multiline Retail — 0.4% | ||||||||
Target Corp., 4.00%, 7/01/42 | 45 | 47,312 | ||||||
Oil, Gas & Consumable Fuels — 2.7% | ||||||||
Anadarko Petroleum Corp., 6.45%, 9/15/36 | 35 | 41,534 | ||||||
Apache Corp., 6.00%, 1/15/37 | 10 | 11,659 | ||||||
ConocoPhillips: | ||||||||
5.90%, 5/15/38 | 15 | 17,901 | ||||||
6.50%, 2/01/39 | 25 | 31,914 | ||||||
ConocoPhillips Holding Co., 6.95%, 4/15/29 | 30 | 38,087 | ||||||
Devon Financing Co. LLC, 7.88%, 9/30/31 | 25 | 31,827 | ||||||
Enterprise Products Operating LLC, 5.95%, 2/01/41 | 15 | 17,329 | ||||||
ONEOK Partners LP, 6.85%, 10/15/37 | 5 | 5,771 | ||||||
Petro-Canada, 6.80%, 5/15/38 | 10 | 13,169 | ||||||
Phillips 66, 5.88%, 5/01/42 | 10 | 12,214 | ||||||
Suncor Energy, Inc., 6.50%, 6/15/38 | 25 | 32,054 | ||||||
TransCanada PipeLines Ltd.: | ||||||||
6.20%, 10/15/37 | 5 | 6,388 | ||||||
7.63%, 1/15/39 | 25 | 36,991 | ||||||
6.10%, 6/01/40 | 10 | 12,722 | ||||||
Valero Energy Corp.: | ||||||||
6.63%, 6/15/37 | 25 | 29,258 | ||||||
4.90%, 3/15/45 | 10 | 9,797 | �� | |||||
|
| |||||||
| 348,615 | ||||||||
Pharmaceuticals — 2.6% | ||||||||
Abbott Laboratories: | ||||||||
6.00%, 4/01/39 | 15 | 18,688 | ||||||
5.30%, 5/27/40 | 10 | 11,703 | ||||||
AbbVie, Inc., 4.40%, 11/06/42 | 20 | 19,587 | ||||||
AstraZeneca PLC: | ||||||||
6.45%, 9/15/37 | 15 | 20,401 | ||||||
4.38%, 11/16/45 | 25 | 26,511 | ||||||
Bristol-Myers Squibb Co., 3.25%, 8/01/42 | 10 | 9,629 | ||||||
GlaxoSmithKline Capital, Inc.: | ||||||||
6.38%, 5/15/38 | 25 | 34,759 | ||||||
4.20%, 3/18/43 | 20 | 22,090 | ||||||
Merck & Co., Inc., 4.15%, 5/18/43 | 15 | 16,472 | ||||||
Pfizer, Inc.: | ||||||||
7.20%, 3/15/39 | 60 | 89,737 | ||||||
4.40%, 5/15/44 | 5 | 5,622 | ||||||
Teva Pharmaceutical Finance Co. LLC, 6.15%, 2/01/36 | 10 | 12,311 | ||||||
See Notes to Financial Statements.
| 28 | BLACKROCK CORI FUNDS | OCTOBER 31, 2016 |
Schedule of Investments (continued) | BlackRock CoRI 2021 Fund |
| Corporate Bonds | Par (000) | Value | ||||||
Pharmaceuticals (continued) | ||||||||
Teva Pharmaceutical Finance Netherlands III BV: | ||||||||
3.15%, 10/01/26 | $ 35 | $ | 34,039 | |||||
4.10%, 10/01/46 | 15 | 13,925 | ||||||
|
| |||||||
| 335,474 | ||||||||
Road & Rail — 0.4% | ||||||||
CSX Corp., 6.22%, 4/30/40 | 15 | 19,585 | ||||||
Norfolk Southern Corp., 4.84%, 10/01/41 | 30 | 33,890 | ||||||
|
| |||||||
| 53,475 | ||||||||
Semiconductors & Semiconductor Equipment — 0.3% |
| |||||||
Applied Materials, Inc., 5.85%, 6/15/41 | 5 | 6,188 | ||||||
Intel Corp., 4.80%, 10/01/41 | 25 | 28,442 | ||||||
|
| |||||||
| 34,630 | ||||||||
Software — 0.5% | ||||||||
Oracle Corp.: | ||||||||
6.13%, 7/08/39 | 15 | 19,675 | ||||||
5.38%, 7/15/40 | 35 | 41,792 | ||||||
|
| |||||||
| 61,467 | ||||||||
Specialty Retail — 0.3% | ||||||||
Home Depot, Inc., 5.88%, 12/16/36 | 20 | 26,503 | ||||||
Lowe’s Cos., Inc., 6.65%, 9/15/37 | 10 | 13,972 | ||||||
|
| |||||||
| 40,475 | ||||||||
Technology Hardware, Storage & Peripherals — 0.1% | ||||||||
HP, Inc., 6.00%, 9/15/41 | 10 | 10,178 | ||||||
Tobacco — 0.7% | ||||||||
Altria Group, Inc., 5.38%, 1/31/44 | 35 | 42,694 | ||||||
Philip Morris International, Inc.: | ||||||||
4.88%, 11/15/43 | 20 | 22,669 | ||||||
4.25%, 11/10/44 | 25 | 26,210 | ||||||
|
| |||||||
| 91,573 | ||||||||
Wireless Telecommunication Services — 0.8% | ||||||||
America Movil SAB de CV, 6.38%, 3/01/35 | 40 | 48,678 | ||||||
Vodafone Group PLC: | ||||||||
6.15%, 2/27/37 | 35 | 41,648 | ||||||
4.38%, 2/19/43 | 10 | 9,629 | ||||||
|
| |||||||
| 99,955 | ||||||||
| Total Corporate Bonds — 35.9% | 4,609,673 | |||||||
| U.S. Treasury Obligations | ||||||||
U.S. Treasury Bonds: | ||||||||
6.50%, 11/15/26 | 130 | 185,702 | ||||||
6.63%, 2/15/27 | 70 | 101,380 | ||||||
| U.S. Treasury Obligations | Par (000) | Value | ||||||
U.S. Treasury Bonds (continued): | ||||||||
5.25%, 2/15/29 | $ | 110 | $ | 149,368 | ||||
6.13%, 8/15/29 | 125 | 183,623 | ||||||
6.25%, 5/15/30 | 25 | 37,628 | ||||||
5.38%, 2/15/31 | 120 | 170,447 | ||||||
4.50%, 2/15/36 | 255 | 346,710 | ||||||
4.38%, 2/15/38 | 15 | 20,171 | ||||||
3.50%, 2/15/39 | 55 | 65,420 | ||||||
4.50%, 8/15/39 | 50 | 68,117 | ||||||
4.38%, 11/15/39 | 25 | 33,513 | ||||||
4.63%, 2/15/40 | 50 | 69,312 | ||||||
3.88%, 8/15/40 | 250 | 312,754 | ||||||
4.75%, 2/15/41 | 200 | 283,211 | ||||||
4.38%, 5/15/41 | 110 | 148,143 | ||||||
3.75%, 8/15/41 | 50 | 61,506 | ||||||
3.13%, 11/15/41 | 50 | 55,604 | ||||||
2.75%, 8/15/42 | 30 | 31,172 | ||||||
2.75%, 11/15/42 | 110 | 114,164 | ||||||
3.13%, 2/15/43 | 120 | 133,453 | ||||||
2.88%, 5/15/43 | 250 | 265,371 | ||||||
3.63%, 8/15/43 | 100 | 121,574 | ||||||
3.75%, 11/15/43 | 50 | 62,145 | ||||||
3.63%, 2/15/44 | 105 | 127,612 | ||||||
3.38%, 5/15/44 | 150 | 174,580 | ||||||
3.13%, 8/15/44 | 110 | 122,366 | ||||||
3.00%, 11/15/44 | 200 | 217,234 | ||||||
3.00%, 5/15/45 | 190 | 206,269 | ||||||
2.88%, 8/15/45 | 225 | 238,430 | ||||||
3.00%, 11/15/45 | 230 | 249,712 | ||||||
2.50%, 2/15/46 | 440 | 431,733 | ||||||
2.50%, 5/15/46 | 30 | 29,450 | ||||||
U.S. Treasury Notes, 1.50%, 8/15/26 | 60 | 58,209 | ||||||
U.S. Treasury Principal STRIPS, 0.00%, 5/15/39 (b) | 5,650 | 3,204,889 | ||||||
| Total U.S. Treasury Obligations — 63.0% | 8,080,972 | |||||||
| Total Long-Term Investments (Cost — $11,763,021) — 98.9% | 12,690,645 | |||||||
| Short-Term Securities — 1.3% | Shares | |||||||
BlackRock Liquidity Funds, T-Fund, Institutional Class, 0.22% (c)(d) | 168,695 | 168,695 | ||||||
| Total Short-Term Securities (Cost — $168,695) — 1.3% | 168,695 | |||||||
| Total Investments (Cost — $11,931,716) — 100.2% | 12,859,340 | |||||||
Liabilities in Excess of Other Assets — (0.2)% | (29,131 | ) | ||||||
|
| |||||||
Net Assets — 100.0% | $ | 12,830,209 | ||||||
|
| |||||||
| Notes to Schedule of Investments |
| (a) | Security exempt from registration pursuant to Rule 144A under the Securities Act of 1933, as amended. These securities may be resold in transactions exempt from registration to qualified institutional investors. |
| (b) | Zero-coupon bond. |
| (c) | During the year ended October 31, 2016, investments in issuers considered to be affiliates of the Fund for purposes of Section 2(a)(3) of the Investment Company Act of 1940, as amended, were as follows: |
| Affiliate | Shares Held at October 31, 2015 | Net Activity | Shares Held at October 31, 2016 | Value at October 31, 2016 | Income | |||||||||||||||
BlackRock Liquidity Funds, TempFund, Institutional Class | 150,430 | (150,430 | ) | — | — | $ | 706 | |||||||||||||
BlackRock Liquidity Funds, T-Fund, Institutional Class | — | 168,695 | 168,695 | $ | 168,695 | 73 | ||||||||||||||
Total | $ | 168,695 | $ | 779 | ||||||||||||||||
|
|
|
| |||||||||||||||||
| (d) | Current yield as of period end. |
See Notes to Financial Statements.
| BLACKROCK CORI FUNDS | OCTOBER 31, 2016 | 29 |
Schedule of Investments (concluded) | BlackRock CoRI 2021 Fund |
| Derivative Financial Instruments Outstanding as of Period End |
| Futures Contracts | ||||||||||||||
| Contracts Long | Issue | Expiration | Notional Value | Unrealized Depreciation | ||||||||||
| 1 | U.S. Treasury Long Bond | December 2016 | $ | 162,719 | $ | (7,692 | ) | |||||||
| Derivative Financial Instruments Categorized by Risk Exposure |
As of period end, the fair values of derivative financial instruments located in the Statements of Assets and Liabilities were as follows:
| Liabilities — Derivative Financial Instruments | Commodity Contracts | Credit Contracts | Equity Contracts | Foreign Currency Exchange Contracts | Interest Rate Contracts | Other Contracts | Total | |||||||||||||||||||||||
Futures contracts | Net unrealized depreciation1 | — | — | — | — | $ | 7,692 | — | $ | 7,692 | ||||||||||||||||||||
1 Includes cumulative appreciation (depreciation) on futures contracts, if any, as reported in the Schedule of Investments. Only current day’s variation margin is reported within the Statements of Assets and Liabilities. |
| |||||||||||||||||||||||||||||
For the year ended October 31, 2016, the effect of derivative financial instruments in the Statements of Operation was as follows:
| Net Realized Gain (Loss) from: | Commodity Contracts | Credit Contracts | Equity Contracts | Foreign Currency Exchange Contracts | Interest Rate Contracts | Other Contracts | Total | |||||||||||||||||||||
Futures contracts | – | – | – | – | $ | 19,355 | – | $ | 19,355 | |||||||||||||||||||
Net Change in Unrealized Appreciation (Depreciation) on: | ||||||||||||||||||||||||||||
Futures contracts | – | – | – | – | $ | (7,566 | ) | – | $ | (7,566 | ) | |||||||||||||||||
| Average Quarterly Balances of Outstanding Derivative Financial Instruments |
| Futures contracts: | ||||
Average notional value of contracts — long | $ | 165,375 |
For more information about the Fund’s investment risks regarding derivative financial instruments, refer to the Notes to Financial Statements.
| Fair Value Hierarchy as of Period End |
Various inputs are used in determining the fair value of investments and derivative financial instruments. For information about the Fund’s policy regarding valuation of investments and derivative financial instruments, refer to the Notes to Financial Statements.
The following tables summarize the Fund’s investments and derivative financial instruments categorized in the disclosure hierarchy:
| Level 1 | Level 2 | Level 3 | Total | |||||||||||||
Assets: | ||||||||||||||||
| Investments: | ||||||||||||||||
Long-Term Investments1 | — | $ | 12,690,645 | — | $ | 12,690,645 | ||||||||||
Short-Term Securities | $ | 168,695 | — | — | 168,695 | |||||||||||
|
|
|
|
|
|
|
| |||||||||
Total | $ | 168,695 | $ | 12,690,645 | — | $ | 12,859,340 | |||||||||
|
|
|
|
|
|
|
| |||||||||
| Derivative Financial Instruments2 | ||||||||||||||||
Liabilities: | ||||||||||||||||
Interest rate contracts | $ | (7,692 | ) | — | — | $ | (7,692 | ) | ||||||||
1 See above Schedule of Investments for values in each industry. |
| |||||||||||||||
2 Derivative financial instruments are futures contracts. Futures contracts are valued at the unrealized appreciation (depreciation) on the instrument. |
| |||||||||||||||
The Fund may hold assets and/or liabilities in which the fair value approximates the carrying amount for financial statement purposes. As of period end, cash pledged for futures contracts of $4,400 is categorized as Level 1 within the disclosure hierarchy.
During the year ended October 31, 2016, there were no transfers between levels.
See Notes to Financial Statements.
| 30 | BLACKROCK CORI FUNDS | OCTOBER 31, 2016 |
Schedule of Investments October 31, 2016 | BlackRock CoRI 2023 Fund (Percentages shown are based on Net Assets) |
| Corporate Bonds | Par (000) | Value | ||||||
Aerospace & Defense — 1.3% | ||||||||
Honeywell International, Inc., Series 30, 5.38%, 3/01/41 | $15 | $ | 19,179 | |||||
Lockheed Martin Corp., 4.07%, 12/15/42 | 45 | 46,470 | ||||||
Northrop Grumman Corp., 4.75%, 6/01/43 | 15 | 17,029 | ||||||
United Technologies Corp.: | ||||||||
5.70%, 4/15/40 | 15 | 19,127 | ||||||
4.50%, 6/01/42 | 90 | 98,589 | ||||||
|
| |||||||
| 200,394 | ||||||||
Air Freight & Logistics — 0.4% | ||||||||
FedEx Corp.: | ||||||||
4.90%, 1/15/34 | 20 | 22,466 | ||||||
5.10%, 1/15/44 | 5 | 5,709 | ||||||
4.10%, 2/01/45 | 15 | 14,777 | ||||||
United Parcel Service, Inc., 6.20%, 1/15/38 | 15 | 20,792 | ||||||
|
| |||||||
| 63,744 | ||||||||
Automobiles — 0.4% | ||||||||
Ford Motor Co., 4.75%, 1/15/43 | 55 | 55,021 | ||||||
Banks — 2.4% | ||||||||
Fifth Third Bancorp, 8.25%, 3/01/38 | 10 | 14,415 | ||||||
HSBC Holdings PLC, 6.10%, 1/14/42 | 95 | 123,082 | ||||||
Wells Fargo & Co.: | ||||||||
5.38%, 11/02/43 | 20 | 22,855 | ||||||
5.61%, 1/15/44 | 30 | 35,178 | ||||||
4.65%, 11/04/44 | 40 | 41,344 | ||||||
3.90%, 5/01/45 | 40 | 40,089 | ||||||
4.90%, 11/17/45 | 40 | 42,999 | ||||||
4.40%, 6/14/46 | 50 | 50,150 | ||||||
|
| |||||||
| 370,112 | ||||||||
Beverages — 0.8% | ||||||||
Anheuser-Busch InBev Finance, Inc.: | ||||||||
4.00%, 1/17/43 | 15 | 15,015 | ||||||
4.63%, 2/01/44 | 10 | 11,064 | ||||||
Anheuser-Busch InBev Worldwide, Inc., 3.75%, 7/15/42 | 15 | 14,680 | ||||||
Diageo Investment Corp., 4.25%, 5/11/42 | 25 | 26,867 | ||||||
PepsiCo, Inc., 4.00%, 3/05/42 | 50 | 52,306 | ||||||
|
| |||||||
| 119,932 | ||||||||
Biotechnology — 0.1% | ||||||||
Amgen, Inc., 4.95%, 10/01/41 | 20 | 21,586 | ||||||
Capital Markets — 2.3% | ||||||||
Credit Suisse USA, Inc., 7.13%, 7/15/32 | 40 | 54,519 | ||||||
Goldman Sachs Group, Inc.: | ||||||||
6.13%, 2/15/33 | 35 | 43,322 | ||||||
6.75%, 10/01/37 | 70 | 88,287 | ||||||
6.25%, 2/01/41 | 25 | 32,020 | ||||||
5.15%, 5/22/45 | 55 | 59,423 | ||||||
Morgan Stanley: | ||||||||
6.38%, 7/24/42 | 20 | 26,720 | ||||||
4.30%, 1/27/45 | 50 | 52,359 | ||||||
|
| |||||||
| 356,650 | ||||||||
Chemicals — 0.7% | ||||||||
CF Industries, Inc.: | ||||||||
5.15%, 3/15/34 | 5 | 4,491 | ||||||
5.38%, 3/15/44 | 20 | 17,107 | ||||||
Dow Chemical Co., 7.38%, 11/01/29 | 10 | 13,517 | ||||||
E.I. du Pont de Nemours & Co., 4.15%, 2/15/43 | 10 | 9,916 | ||||||
Ecolab, Inc., 5.50%, 12/08/41 | 10 | 12,349 | ||||||
EI du Pont de Nemours & Co., 4.90%, 1/15/41 | 15 | 16,422 | ||||||
LYB International Finance BV: | ||||||||
5.25%, 7/15/43 | 5 | 5,505 | ||||||
4.88%, 3/15/44 | 5 | 5,307 | ||||||
Potash Corp. of Saskatchewan, Inc., 5.88%, 12/01/36 | 15 | 17,621 | ||||||
|
| |||||||
| 102,235 | ||||||||
| Corporate Bonds | Par (000) | Value | ||||||
Communications Equipment — 0.5% | ||||||||
Cisco Systems, Inc.: | ||||||||
5.90%, 2/15/39 | $45 | $ | 58,784 | |||||
5.50%, 1/15/40 | 10 | 12,684 | ||||||
|
| |||||||
| 71,468 | ||||||||
Consumer Finance — 0.2% | ||||||||
American Express Co., 4.05%, 12/03/42 | 25 | 25,333 | ||||||
Diversified Financial Services — 3.5% | ||||||||
Bank of America Corp.: | ||||||||
5.88%, 2/07/42 | 15 | 18,969 | ||||||
5.00%, 1/21/44 | 95 | 108,783 | ||||||
4.88%, 4/01/44 | 35 | 39,521 | ||||||
Series L, 4.75%, 4/21/45 | 5 | 5,206 | ||||||
Citigroup, Inc.: | ||||||||
4.30%, 11/20/26 | 20 | 20,871 | ||||||
4.13%, 7/25/28 | 25 | 25,621 | ||||||
8.13%, 7/15/39 | 35 | 53,376 | ||||||
6.68%, 9/13/43 | 20 | 25,738 | ||||||
5.30%, 5/06/44 | 20 | 22,060 | ||||||
4.65%, 7/30/45 | 15 | 16,412 | ||||||
4.75%, 5/18/46 | 15 | 15,446 | ||||||
Daimler Finance North America LLC, 8.50%, 1/18/31 | 15 | 23,998 | ||||||
JPMorgan Chase & Co.: | ||||||||
6.40%, 5/15/38 | 35 | 47,172 | ||||||
5.60%, 7/15/41 | 30 | 37,058 | ||||||
5.40%, 1/06/42 | 25 | 30,284 | ||||||
5.63%, 8/16/43 | 15 | 17,598 | ||||||
4.95%, 6/01/45 | 25 | 27,474 | ||||||
|
| |||||||
| 535,587 | ||||||||
Diversified Telecommunication Services — 4.6% | ||||||||
AT&T, Inc.: | ||||||||
6.30%, 1/15/38 | 25 | 29,003 | ||||||
5.35%, 9/01/40 | 65 | 68,337 | ||||||
5.55%, 8/15/41 | 20 | 21,697 | ||||||
5.15%, 3/15/42 | 30 | 30,963 | ||||||
4.50%, 3/09/48 (a) | 19 | 17,820 | ||||||
Orange SA, 5.38%, 1/13/42 | 10 | 11,743 | ||||||
Telefonica Emisiones SAU, 7.05%, 6/20/36 | 20 | 25,288 | ||||||
Telefonica Europe BV, 8.25%, 9/15/30 | 25 | 35,513 | ||||||
Verizon Communications, Inc.: | ||||||||
6.40%, 9/15/33 | 50 | 62,369 | ||||||
4.27%, 1/15/36 | 50 | 50,205 | ||||||
4.75%, 11/01/41 | 20 | 20,863 | ||||||
6.55%, 9/15/43 | 50 | 65,515 | ||||||
4.86%, 8/21/46 | 65 | 68,847 | ||||||
4.52%, 9/15/48 | 75 | 74,582 | ||||||
5.01%, 8/21/54 | 60 | 61,867 | ||||||
4.67%, 3/15/55 | 60 | 58,492 | ||||||
|
| |||||||
| 703,104 | ||||||||
Electric Utilities — 2.9% | ||||||||
Berkshire Hathaway Energy Co.: | ||||||||
6.13%, 4/01/36 | 50 | 65,428 | ||||||
6.50%, 9/15/37 | 10 | 13,611 | ||||||
Consolidated Edison Co. of New York, Inc., Series C, 5.50%, 12/01/39 | 25 | 31,097 | ||||||
Duke Energy Florida LLC, 6.40%, 6/15/38 | 55 | 75,992 | ||||||
Exelon Generation Co. LLC, 6.25%, 10/01/39 | 35 | 37,956 | ||||||
Georgia Power Co., 4.30%, 3/15/42 | 40 | 42,390 | ||||||
Pacific Gas & Electric Co., 6.05%, 3/01/34 | 55 | 72,197 | ||||||
PacifiCorp, 6.00%, 1/15/39 | 10 | 13,219 | ||||||
Public Service Electric & Gas Co., 3.80%, 3/01/46 | 25 | 26,141 | ||||||
Southern California Edison Co., Series A, 5.95%, 2/01/38 | 20 | 26,526 | ||||||
Southern Power Co., 5.15%, 9/15/41 | 15 | 16,008 | ||||||
Virginia Electric & Power Co., 8.88%, 11/15/38 | 20 | 33,321 | ||||||
|
| |||||||
| 453,886 | ||||||||
See Notes to Financial Statements.
| BLACKROCK CORI FUNDS | OCTOBER 31, 2016 | 31 |
Schedule of Investments (continued) | BlackRock CoRI 2023 Fund |
| Corporate Bonds | Par (000) | Value | ||||||
Energy Equipment & Services — 0.6% | ||||||||
Baker Hughes, Inc., 5.13%, 9/15/40 | $20 | $ | 23,137 | |||||
Enterprise Products Operating LLC: | ||||||||
6.13%, 10/15/39 | 20 | 22,981 | ||||||
5.70%, 2/15/42 | 5 | 5,649 | ||||||
Halliburton Co., 7.45%, 9/15/39 | 25 | 34,649 | ||||||
|
| |||||||
| 86,416 | ||||||||
Food & Staples Retailing — 0.5% | ||||||||
Sysco Corp., 5.38%, 9/21/35 | 25 | 29,020 | ||||||
Target Corp., 3.63%, 4/15/46 | 20 | 19,702 | ||||||
Walgreen Co., 4.40%, 9/15/42 | 25 | 25,344 | ||||||
|
| |||||||
| 74,066 | ||||||||
Food Products — 0.3% | ||||||||
Archer-Daniels-Midland Co., 4.54%, 3/26/42 | 20 | 22,596 | ||||||
JM Smucker Co., 4.38%, 3/15/45 | 10 | 10,652 | ||||||
Kellogg Co., 4.50%, 4/01/46 | 20 | 20,772 | ||||||
|
| |||||||
| 54,020 | ||||||||
Health Care Equipment & Supplies — 0.7% | ||||||||
Medtronic, Inc., 4.63%, 3/15/45 | 100 | 113,136 | ||||||
Health Care Providers & Services — 1.2% | ||||||||
Aetna, Inc.: | ||||||||
6.63%, 6/15/36 | 10 | 13,091 | ||||||
6.75%, 12/15/37 | 20 | 26,820 | ||||||
Anthem, Inc.: | ||||||||
4.65%, 1/15/43 | 30 | 31,794 | ||||||
5.10%, 1/15/44 | 20 | 22,649 | ||||||
UnitedHealth Group, Inc.: | ||||||||
4.63%, 7/15/35 | 25 | 28,516 | ||||||
4.75%, 7/15/45 | 55 | 63,676 | ||||||
|
| |||||||
| 186,546 | ||||||||
Hotels, Restaurants & Leisure — 0.3% | ||||||||
McDonald’s Corp.: | ||||||||
6.30%, 10/15/37 | 20 | 25,688 | ||||||
3.70%, 2/15/42 | 20 | 18,992 | ||||||
|
| |||||||
| 44,680 | ||||||||
Insurance — 1.7% | ||||||||
Allstate Corp., 4.50%, 6/15/43 | 20 | 22,727 | ||||||
Arch Capital Group US, Inc., 5.14%, 11/01/43 | 10 | 10,689 | ||||||
AXA SA, 8.60%, 12/15/30 | 15 | 21,075 | ||||||
Chubb Corp., Series 1, 6.50%, 5/15/38 | 15 | 21,021 | ||||||
Lincoln National Corp., 7.00%, 6/15/40 | 10 | 12,769 | ||||||
MetLife, Inc.: | ||||||||
4.88%, 11/13/43 | 60 | 65,991 | ||||||
4.05%, 3/01/45 | 15 | 14,894 | ||||||
Principal Financial Group, Inc., 6.05%, 10/15/36 | 15 | 18,402 | ||||||
Prudential Financial, Inc.: | ||||||||
6.63%, 12/01/37 | 30 | 39,367 | ||||||
6.20%, 11/15/40 | 10 | 12,618 | ||||||
Travelers Cos., Inc., 4.60%, 8/01/43 | 20 | 23,050 | ||||||
|
| |||||||
| 262,603 | ||||||||
Machinery — 0.4% | ||||||||
Caterpillar, Inc., 3.80%, 8/15/42 | 25 | 25,285 | ||||||
Ingersoll-Rand Global Holding Co. Ltd., 5.75%, 6/15/43 | 25 | 30,578 | ||||||
|
| |||||||
| 55,863 | ||||||||
Media — 4.0% | ||||||||
21st Century Fox America, Inc.: | ||||||||
6.40%, 12/15/35 | 40 | 50,185 | ||||||
6.15%, 2/15/41 | 30 | 37,241 | ||||||
5.40%, 10/01/43 | 30 | 34,442 | ||||||
CBS Corp., 4.60%, 1/15/45 | 5 | 5,072 | ||||||
| Corporate Bonds | Par (000) | Value | ||||||
Media (continued) | ||||||||
Comcast Corp.: | ||||||||
4.25%, 1/15/33 | $35 | $ | 37,647 | |||||
6.45%, 3/15/37 | 30 | 40,181 | ||||||
6.95%, 8/15/37 | 25 | 35,519 | ||||||
6.40%, 3/01/40 | 25 | 34,142 | ||||||
4.65%, 7/15/42 | 35 | 38,822 | ||||||
4.75%, 3/01/44 | 25 | 28,282 | ||||||
NBCUniversal Media LLC: | ||||||||
6.40%, 4/30/40 | 15 | 20,456 | ||||||
5.95%, 4/01/41 | 15 | 19,535 | ||||||
4.45%, 1/15/43 | 25 | 27,033 | ||||||
Thomson Reuters Corp., 5.85%, 4/15/40 | 10 | 11,516 | ||||||
Time Warner, Inc.: | ||||||||
7.63%, 4/15/31 | 25 | 34,935 | ||||||
6.10%, 7/15/40 | 20 | 23,923 | ||||||
5.38%, 10/15/41 | 20 | 22,675 | ||||||
4.90%, 6/15/42 | 20 | 21,427 | ||||||
5.35%, 12/15/43 | 25 | 28,253 | ||||||
The Walt Disney Co., 3.70%, 12/01/42 | 15 | 15,240 | ||||||
Walt Disney Co.: | ||||||||
4.13%, 6/01/44 | 15 | 16,345 | ||||||
Series E, 4.13%, 12/01/41 | 30 | 32,498 | ||||||
|
| |||||||
| 615,369 | ||||||||
Metals & Mining — 1.0% | ||||||||
BHP Billiton Finance USA Ltd., 5.00%, 9/30/43 | 45 | 51,245 | ||||||
Newmont Mining Corp., 6.25%, 10/01/39 | 15 | 17,652 | ||||||
Rio Tinto Finance USA Ltd., 5.20%, 11/02/40 | 25 | 28,626 | ||||||
Southern Copper Corp.: | ||||||||
5.25%, 11/08/42 | 25 | 23,648 | ||||||
5.88%, 4/23/45 | 40 | 39,962 | ||||||
|
| |||||||
| 161,133 | ||||||||
Multi-Utilities — 0.1% | ||||||||
Sempra Energy, 6.00%, 10/15/39 | 15 | 18,798 | ||||||
Multiline Retail — 0.3% | ||||||||
Target Corp., 4.00%, 7/01/42 | 45 | 47,312 | ||||||
Oil, Gas & Consumable Fuels — 3.0% | ||||||||
Anadarko Petroleum Corp., 6.45%, 9/15/36 | 45 | 53,400 | ||||||
Apache Corp., 6.00%, 1/15/37 | 15 | 17,488 | ||||||
ConocoPhillips: | ||||||||
5.90%, 5/15/38 | 10 | 11,934 | ||||||
6.50%, 2/01/39 | 70 | 89,360 | ||||||
ConocoPhillips Holding Co., 6.95%, 4/15/29 | 25 | 31,739 | ||||||
Devon Financing Co. LLC, 7.88%, 9/30/31 | 25 | 31,827 | ||||||
Enterprise Products Operating LLC: | ||||||||
6.45%, 9/01/40 | 5 | 5,972 | ||||||
5.95%, 2/01/41 | 15 | 17,329 | ||||||
ONEOK Partners LP, 6.85%, 10/15/37 | 10 | 11,542 | ||||||
Petro-Canada, 6.80%, 5/15/38 | 25 | 32,923 | ||||||
Phillips 66, 5.88%, 5/01/42 | 15 | 18,321 | ||||||
Suncor Energy, Inc.: | ||||||||
6.50%, 6/15/38 | 20 | 25,643 | ||||||
6.85%, 6/01/39 | 10 | 13,470 | ||||||
TransCanada PipeLines Ltd.: | ||||||||
6.20%, 10/15/37 | 15 | 19,164 | ||||||
7.63%, 1/15/39 | 15 | 22,195 | ||||||
6.10%, 6/01/40 | 15 | 19,084 | ||||||
Valero Energy Corp.: | ||||||||
6.63%, 6/15/37 | 25 | 29,258 | ||||||
4.90%, 3/15/45 | 15 | 14,695 | ||||||
|
| |||||||
| 465,344 | ||||||||
Pharmaceuticals — 2.7% |
| |||||||
Abbott Laboratories, 5.30%, 5/27/40 | 10 | 11,703 | ||||||
AbbVie, Inc., 4.40%, 11/06/42 | 30 | 29,381 | ||||||
See Notes to Financial Statements.
| 32 | BLACKROCK CORI FUNDS | OCTOBER 31, 2016 |
Schedule of Investments (continued) | BlackRock CoRI 2023 Fund |
| Corporate Bonds | Par (000) | Value | ||||||
Pharmaceuticals (continued) |
| |||||||
AstraZeneca PLC: | ||||||||
6.45%, 9/15/37 | $25 | $ | 34,002 | |||||
4.00%, 9/18/42 | 25 | 25,235 | ||||||
4.38%, 11/16/45 | 15 | 15,906 | ||||||
Bristol-Myers Squibb Co., 3.25%, 8/01/42 | 10 | 9,630 | ||||||
GlaxoSmithKline Capital, Inc., 6.38%, 5/15/38 | 55 | 76,470 | ||||||
Merck & Co., Inc.: | ||||||||
2.80%, 5/18/23 | 50 | 51,602 | ||||||
4.15%, 5/18/43 | 10 | 10,981 | ||||||
Pfizer, Inc.: | ||||||||
7.20%, 3/15/39 | 25 | 37,390 | ||||||
4.30%, 6/15/43 | 30 | 33,142 | ||||||
4.40%, 5/15/44 | 10 | 11,243 | ||||||
Teva Pharmaceutical Finance Co. LLC, 6.15%, 2/01/36 | 10 | 12,311 | ||||||
Teva Pharmaceutical Finance Netherlands III BV, 4.10%, 10/01/46 | 25 | 23,208 | ||||||
Wyeth LLC, 5.95%, 4/01/37 | 25 | 32,297 | ||||||
|
| |||||||
| 414,501 | ||||||||
Real Estate Investment Trusts (REITs) — 0.1% |
| |||||||
Weyerhaeuser Co., 7.38%, 3/15/32 | 10 | 13,231 | ||||||
Road & Rail — 0.3% |
| |||||||
CSX Corp., 6.22%, 4/30/40 | 10 | 13,057 | ||||||
Norfolk Southern Corp., 4.84%, 10/01/41 | 35 | 39,538 | ||||||
|
| |||||||
| 52,595 | ||||||||
Semiconductors & Semiconductor Equipment — 0.5% |
| |||||||
Applied Materials, Inc., 5.85%, 6/15/41 | 5 | 6,188 | ||||||
Intel Corp.: | ||||||||
4.80%, 10/01/41 | 35 | 39,819 | ||||||
4.25%, 12/15/42 | 25 | 26,471 | ||||||
|
| |||||||
| 72,478 | ||||||||
Software — 0.5% |
| |||||||
Oracle Corp.: | ||||||||
6.13%, 7/08/39 | 25 | 32,792 | ||||||
5.38%, 7/15/40 | 40 | 47,762 | ||||||
|
| |||||||
| 80,554 | ||||||||
Specialty Retail — 0.3% |
| |||||||
Home Depot, Inc., 5.88%, 12/16/36 | 25 | 33,128 | ||||||
Lowe’s Cos., Inc., 6.65%, 9/15/37 | 10 | 13,973 | ||||||
|
| |||||||
| 47,101 | ||||||||
Technology Hardware, Storage & Peripherals — 0.1% |
| |||||||
HP, Inc., 6.00%, 9/15/41 | 10 | 10,178 | ||||||
Tobacco — 1.0% |
| |||||||
Altria Group, Inc.: | ||||||||
4.25%, 8/09/42 | 15 | 15,582 | ||||||
5.38%, 1/31/44 | 25 | 30,495 | ||||||
Philip Morris International, Inc.: | ||||||||
6.38%, 5/16/38 | 25 | 33,582 | ||||||
4.50%, 3/20/42 | 25 | 26,988 | ||||||
4.88%, 11/15/43 | 20 | 22,669 | ||||||
4.25%, 11/10/44 | 30 | 31,452 | ||||||
|
| |||||||
| 160,768 | ||||||||
| Corporate Bonds | Par (000) | Value | ||||||
Wireless Telecommunication Services — 0.8% |
| |||||||
America Movil SAB de CV, 6.38%, 3/01/35 | $ | 45 | $ | 54,763 | ||||
Vodafone Group PLC: | ||||||||
6.15%, 2/27/37 | 20 | 23,798 | ||||||
4.38%, 2/19/43 | 45 | 43,332 | ||||||
|
| |||||||
| 121,893 | ||||||||
| Total Corporate Bonds — 40.5% | 6,237,637 | |||||||
| U.S. Treasury Obligations | ||||||||
U.S. Treasury Bonds: | ||||||||
6.13%, 8/15/29 | 220 | 323,177 | ||||||
5.38%, 2/15/31 | 225 | 319,588 | ||||||
4.50%, 2/15/36 | 100 | 135,965 | ||||||
4.50%, 5/15/38 | 40 | 54,695 | ||||||
3.50%, 2/15/39 | 65 | 77,314 | ||||||
4.25%, 5/15/39 | 20 | 26,366 | ||||||
3.88%, 8/15/40 | 50 | 62,551 | ||||||
4.25%, 11/15/40 | 170 | 224,559 | ||||||
4.75%, 2/15/41 | 30 | 42,482 | ||||||
4.38%, 5/15/41 | 15 | 20,201 | ||||||
3.75%, 8/15/41 | 375 | 461,294 | ||||||
3.13%, 11/15/41 | 490 | 544,914 | ||||||
2.75%, 8/15/42 | 30 | 31,172 | ||||||
2.75%, 11/15/42 | 50 | 51,893 | ||||||
3.13%, 2/15/43 | 20 | 22,242 | ||||||
2.88%, 5/15/43 | 130 | 137,993 | ||||||
3.63%, 8/15/43 | 50 | 60,787 | ||||||
3.75%, 11/15/43 | 40 | 49,716 | ||||||
3.63%, 2/15/44 | 50 | 60,768 | ||||||
3.38%, 5/15/44 | 50 | 58,193 | ||||||
3.13%, 8/15/44 | 50 | 55,621 | ||||||
2.50%, 2/15/45 | 20 | 19,652 | ||||||
3.00%, 5/15/45 | 50 | 54,281 | ||||||
2.88%, 8/15/45 | 125 | 132,461 | ||||||
3.00%, 11/15/45 | 135 | 146,570 | ||||||
2.50%, 2/15/46 | 380 | 372,860 | ||||||
2.50%, 5/15/46 | 280 | 274,870 | ||||||
2.25%, 8/15/46 | 30 | 27,901 | ||||||
U.S. Treasury Principal STRIPS, 0.00%, 2/15/43 (b) | 10,520 | 5,236,646 | ||||||
| Total U.S. Treasury Obligations — 58.9% | 9,086,732 | |||||||
| Total Long-Term Investments (Cost — $13,813,301) — 99.4% | 15,324,369 | |||||||
| Short-Term Securities — 0.5% | Shares | |||||||
BlackRock Liquidity Funds, T-Fund, Institutional Class, 0.22% (c)(d) | 81,923 | 81,923 | ||||||
| Total Short-Term Securities (Cost — $81,923) — 0.5% | 81,923 | |||||||
| Total Investments (Cost — $13,895,224) — 99.9% | 15,406,292 | |||||||
Other Assets Less Liabilities — 0.1% | 11,082 | |||||||
|
| |||||||
Net Assets — 100.0% | $ | 15,417,374 | ||||||
|
| |||||||
| Notes to Schedule of Investments |
| (a) | Security exempt from registration pursuant to Rule 144A under the Securities Act of 1933, as amended. These securities may be resold in transactions exempt from registration to qualified institutional investors. |
| (b) | Zero-coupon bond. |
See Notes to Financial Statements.
| BLACKROCK CORI FUNDS | OCTOBER 31, 2016 | 33 |
Schedule of Investments (continued) | BlackRock CoRI 2023 Fund |
| (c) | During the year ended October 31, 2016, investments in issuers considered to be affiliates of the Fund for purposes of Section 2(a)(3) of the Investment Company Act of 1940, as amended, were as follows: |
| Affiliate | Shares Held at October 31, 2015 | Net Activity | Shares Held at October 31, 2016 | Value at October 31, 2016 | Income | |||||||||||||||
BlackRock Liquidity Funds, TempFund, Institutional Class | 129,167 | (129,167 | ) | — | — | $ | 593 | |||||||||||||
BlackRock Liquidity Funds, T-Fund, Institutional Class | — | 81,923 | 81,923 | $ | 81,923 | 95 | ||||||||||||||
Total | $ | 81,923 | $ | 688 | ||||||||||||||||
|
|
|
| |||||||||||||||||
| (d) | Current yield as of period end. |
| Derivative Financial Instruments Outstanding as of Period End | ||||||||
| Futures Contracts | ||||||||||
| Contracts Long | Issue | Expiration | Notional Value | Unrealized Depreciation | ||||||
| 1 | U.S. Treasury Long Bond | December 2016 | $162,719 | $(7,692) | ||||||
| Derivative Financial Instruments Categorized by Risk Exposure |
As of period end, the fair values of derivative financial instruments located in the Statements of Assets and Liabilities were as follows:
| Liabilities — Derivative Financial Instruments | Commodity Contracts | Credit Contracts | Equity Contracts | Foreign Currency Exchange Contracts | Interest Rate Contracts | Other Contracts | Total | |||||||||||||||||||||||
Futures contracts | Net unrealized depreciation1 | — | — | — | — | $ | 7,692 | — | $ | 7,692 | ||||||||||||||||||||
1 Includes cumulative appreciation (depreciation) on futures contracts, if any, as reported in the Schedule of Investments. Only current day’s variation margin is reported within the Statements of Assets and Liabilities. |
| |||||||||||||||||||||||||||||
For the year ended October 31, 2016, the effect of derivative financial instruments in the Statements of Operation was as follows:
| Net Realized Gain (Loss) from: | Commodity Contracts | Credit Contracts | Equity Contracts | Foreign Currency Exchange Contracts | Interest Rate Contracts | Other Contracts | Total | |||||||||||||||||||||
Futures contracts | — | — | — | — | $ | 19,355 | — | $ | 19,355 | |||||||||||||||||||
Net Change in Unrealized Appreciation (Depreciation) on: | ||||||||||||||||||||||||||||
Futures contracts | — | — | — | — | $ | (7,566 | ) | — | $ | (7,566 | ) | |||||||||||||||||
| Average Quarterly Balances of Outstanding Derivative Financial Instruments |
| Futures contracts: | ||||
Average notional value of contracts — long | $ | 165,375 |
For more information about the Fund’s investment risks regarding derivative financial instruments, refer to the Notes to Financial Statements.
See Notes to Financial Statements.
| 34 | BLACKROCK CORI FUNDS | OCTOBER 31, 2016 |
Schedule of Investments (concluded) | BlackRock CoRI 2023 Fund |
| Fair Value Hierarchy as of Period End |
Various inputs are used in determining the fair value of investments and derivative financial instruments. For information about the Fund’s policy regarding valuation of investments and derivative financial instruments, refer to the Notes to Financial Statements.
The following tables summarize the Fund’s investments and derivative financial instruments categorized in the disclosure hierarchy:
| Level 1 | Level 2 | Level 3 | Total | |||||||||||||
Assets: | ||||||||||||||||
| Investments: | ||||||||||||||||
Long-Term Investments1 | — | $ | 15,324,369 | — | $ | 15,324,369 | ||||||||||
Short-Term Securities | $ | 81,923 | — | — | 81,923 | |||||||||||
|
| |||||||||||||||
Total | $ | 81,923 | $ | 15,324,369 | — | $ | 15,406,292 | |||||||||
|
| |||||||||||||||
| Derivative Financial Instruments2 | ||||||||||||||||
Liabilities: | ||||||||||||||||
Interest rate contracts | $ | (7,692 | ) | — | — | $ | (7,692 | ) | ||||||||
1 See above Schedule of Investments for values in each industry. |
| |||||||||||||||
2 Derivative financial instruments are futures contracts. Futures contracts are valued at the unrealized appreciation (depreciation) on the instrument. |
| |||||||||||||||
The Fund may hold assets and/or liabilities in which the fair value approximates the carrying amount for financial statement purposes. As of period end, cash pledged for futures contracts of $4,400 is categorized as Level 1 within the disclosure hierarchy.
During the year ended October 31, 2016, there were no transfers between levels.
See Notes to Financial Statements.
| BLACKROCK CORI FUNDS | OCTOBER 31, 2016 | 35 |
| Statements of Assets and Liabilities |
| October 31, 2016 | BlackRock CoRI 2015 Fund | BlackRock CoRI 2017 Fund | BlackRock CoRI 2019 Fund | BlackRock CoRI 2021 Fund | BlackRock CoRI 2023 Fund | |||||||||||||||
| Assets | ||||||||||||||||||||
Investments at value — unaffiliated1 | $ | 11,862,107 | $ | 11,483,954 | $ | 12,555,619 | $ | 12,690,645 | $ | 15,324,369 | ||||||||||
Investments at value — affiliated2 | 117,510 | 97,715 | 42,367 | 168,695 | 81,923 | |||||||||||||||
Cash pledged for futures contracts | 4,400 | 4,400 | 4,400 | 4,400 | 4,400 | |||||||||||||||
| Receivables: | ||||||||||||||||||||
Investments sold — unaffiliated | 337,532 | — | — | — | — | |||||||||||||||
Capital shares sold | — | — | — | — | 174 | |||||||||||||||
Dividends — affiliated | 21 | 29 | 21 | 33 | 37 | |||||||||||||||
Interest — unaffiliated | 55,311 | 85,587 | 97,809 | 98,895 | 110,298 | |||||||||||||||
Investment advisor | 43,083 | 42,260 | 41,343 | 40,956 | 39,517 | |||||||||||||||
Variation margin on futures contracts | 531 | 531 | 531 | 531 | 531 | |||||||||||||||
Prepaid expenses | 3,683 | 3,683 | 3,716 | 3,683 | 4,035 | |||||||||||||||
|
| |||||||||||||||||||
Total assets | 12,424,178 | 11,718,159 | 12,745,806 | 13,007,838 | 15,565,284 | |||||||||||||||
|
| |||||||||||||||||||
| Liabilities | ||||||||||||||||||||
Payables: | ||||||||||||||||||||
Investments purchased — unaffiliated | 369,300 | — | — | 88,180 | 39,692 | |||||||||||||||
Capital shares redeemed | — | — | 2,400 | — | 17,071 | |||||||||||||||
Officer’s and Trustees’ fees | 1,350 | 1,347 | 1,352 | 1,349 | 1,337 | |||||||||||||||
Other accrued expenses | 89,182 | 90,021 | 88,592 | 87,787 | 89,022 | |||||||||||||||
Service fees | 93 | 96 | 282 | 313 | 788 | |||||||||||||||
|
| |||||||||||||||||||
Total liabilities | 459,925 | 91,464 | 92,626 | 177,629 | 147,910 | |||||||||||||||
|
| |||||||||||||||||||
Net Assets | $ | 11,964,253 | $ | 11,626,695 | $ | 12,653,180 | $ | 12,830,209 | $ | 15,417,374 | ||||||||||
|
| |||||||||||||||||||
| Net Assets Consist of | ||||||||||||||||||||
Paid-in capital | $ | 10,416,997 | $ | 10,102,286 | $ | 10,877,622 | $ | 10,879,890 | $ | 13,549,747 | ||||||||||
Undistributed net investment income | 280,518 | 277,897 | 305,514 | 330,472 | 358,513 | |||||||||||||||
Accumulated net realized gain | 135,170 | 457,387 | 567,806 | 699,915 | 5,738 | |||||||||||||||
Net unrealized appreciation (depreciation) | 1,131,568 | 789,125 | 902,238 | 919,932 | 1,503,376 | |||||||||||||||
|
| |||||||||||||||||||
Net Assets | $ | 11,964,253 | $ | 11,626,695 | $ | 12,653,180 | $ | 12,830,209 | $ | 15,417,374 | ||||||||||
|
| |||||||||||||||||||
1 Investments at cost — unaffiliated | $ | 10,722,847 | $ | 10,687,137 | $ | 11,645,689 | $ | 11,763,021 | $ | 13,813,301 | ||||||||||
|
| |||||||||||||||||||
2 Investments at cost — affiliated | $ | 117,510 | $ | 97,715 | $ | 42,367 | $ | 168,695 | $ | 81,923 | ||||||||||
|
| |||||||||||||||||||
| Net Asset Value | ||||||||||||||||||||
| Institutional: | ||||||||||||||||||||
Net assets | $ | 11,543,052 | $ | 11,482,337 | $ | 11,781,433 | $ | 11,830,394 | $ | 12,378,108 | ||||||||||
|
| |||||||||||||||||||
Shares outstanding3 | 1,003,176 | 998,000 | 1,008,131 | 998,835 | 1,011,268 | |||||||||||||||
|
| |||||||||||||||||||
Net asset value | $ | 11.51 | $ | 11.51 | $ | 11.69 | $ | 11.84 | $ | 12.24 | ||||||||||
|
| |||||||||||||||||||
| Investor A: | ||||||||||||||||||||
Net assets | $ | 421,201 | $ | 144,358 | $ | 871,747 | $ | 999,815 | $ | 3,039,266 | ||||||||||
|
| |||||||||||||||||||
Shares outstanding3 | 36,743 | 12,597 | 74,753 | 84,739 | 249,228 | |||||||||||||||
|
| |||||||||||||||||||
Net asset value | $ | 11.46 | $ | 11.46 | $ | 11.66 | $ | 11.80 | $ | 12.19 | ||||||||||
|
| |||||||||||||||||||
3 Unlimited number of shares authorized, no par value. |
| |||||||||||||||||||
| See Notes to Financial Statements. | ||||||
| 36 | BLACKROCK CORI FUNDS | OCTOBER 31, 2016 | ||||
| Statements of Operations |
| Year Ended October 31, 2016 | BlackRock CoRI 2015 Fund | BlackRock CoRI 2017 Fund | BlackRock CoRI 2019 Fund | BlackRock CoRI 2021 Fund | BlackRock CoRI 2023 Fund | |||||||||||||||
| Investment Income | ||||||||||||||||||||
Interest — unaffiliated | $ | 369,550 | $ | 366,784 | $ | 407,965 | $ | 437,115 | $ | 486,039 | ||||||||||
Dividends — affiliated | 456 | 646 | 406 | 779 | 688 | |||||||||||||||
|
| |||||||||||||||||||
Total investment income | 370,006 | 367,430 | 408,371 | 437,894 | 486,727 | |||||||||||||||
|
| |||||||||||||||||||
| Expenses | ||||||||||||||||||||
Professional | 67,121 | 66,634 | 67,091 | 67,147 | 68,547 | |||||||||||||||
Investment advisory | 35,169 | 34,979 | 37,803 | 39,091 | 42,376 | |||||||||||||||
Pricing | 24,359 | 22,343 | 20,048 | 19,368 | 19,233 | |||||||||||||||
Registration | 28,423 | 28,423 | 28,468 | 28,451 | 30,018 | |||||||||||||||
Printing | 10,421 | 10,394 | 10,394 | 10,422 | 10,424 | |||||||||||||||
Accounting services | 7,082 | 7,103 | 7,229 | 7,201 | 7,294 | |||||||||||||||
Officer and Trustees | 6,721 | 6,721 | 6,749 | 6,749 | 6,749 | |||||||||||||||
Administration | 5,862 | 5,830 | 6,301 | 6,515 | 7,063 | |||||||||||||||
Custodian | 2,916 | 2,643 | 2,839 | 3,177 | 3,571 | |||||||||||||||
Service — class specific | 819 | 850 | 2,444 | 3,525 | 5,021 | |||||||||||||||
Transfer agent — class specific | 521 | 428 | 885 | 1,122 | 1,702 | |||||||||||||||
Miscellaneous | 10,440 | 11,268 | 11,280 | 11,316 | 11,240 | |||||||||||||||
|
| |||||||||||||||||||
Total expenses | 199,854 | 197,616 | 201,531 | 204,084 | 213,238 | |||||||||||||||
| Less: | ||||||||||||||||||||
Other expenses reimbursed | (127,962 | ) | (126,173 | ) | (122,387 | ) | (121,045 | ) | (121,566 | ) | ||||||||||
Fees waived by the Manager | (35,169 | ) | (34,979 | ) | (37,803 | ) | (39,091 | ) | (42,376 | ) | ||||||||||
Administration fees waived | (5,749 | ) | (5,711 | ) | (6,182 | ) | (6,398 | ) | (6,931 | ) | ||||||||||
Transfer agent fees waived and/or reimbursed — class specific | (521 | ) | (428 | ) | (885 | ) | (1,122 | ) | (1,702 | ) | ||||||||||
|
| |||||||||||||||||||
Total expenses after fees waived and/or reimbursed | 30,453 | 30,325 | 34,274 | 36,428 | 40,663 | |||||||||||||||
|
| |||||||||||||||||||
Net investment income | 339,553 | 337,105 | 374,097 | 401,466 | 446,064 | |||||||||||||||
|
| |||||||||||||||||||
| Realized and Unrealized Gain (Loss) | ||||||||||||||||||||
| Net realized gain (loss) from: | ||||||||||||||||||||
Investments | 116,617 | 438,064 | 551,663 | 681,195 | 29,957 | |||||||||||||||
Futures contracts | 19,355 | 19,355 | 19,355 | 19,355 | 19,355 | |||||||||||||||
|
| |||||||||||||||||||
| 135,972 | 457,419 | 571,018 | 700,550 | 49,312 | ||||||||||||||||
|
| |||||||||||||||||||
| Net change in unrealized appreciation (depreciation) on: | ||||||||||||||||||||
Investments | 478,738 | 131,659 | 121,350 | 178,660 | 658,550 | |||||||||||||||
Futures contracts | (7,566 | ) | (7,566 | ) | (7,566 | ) | (7,566 | ) | (7,566 | ) | ||||||||||
|
| |||||||||||||||||||
| 471,172 | 124,093 | 113,784 | 171,094 | 650,984 | ||||||||||||||||
|
| |||||||||||||||||||
Net realized and unrealized gain | 607,144 | 581,512 | 684,802 | 871,644 | 700,296 | |||||||||||||||
|
| |||||||||||||||||||
Net Increase in Net Assets Resulting from Operations | $ | 946,697 | $ | 918,617 | $ | 1,058,899 | $ | 1,273,110 | $ | 1,146,360 | ||||||||||
|
| |||||||||||||||||||
| See Notes to Financial Statements. | ||||||
| BLACKROCK CORI FUNDS | OCTOBER 31, 2016 | 37 | ||||
| Statements of Changes in Net Assets |
| BlackRock CoRI 2015 Fund | BlackRock CoRI 2017 Fund | |||||||||||||||||||
| Year Ended October 31, | Year Ended October 31, | |||||||||||||||||||
| Increase (Decrease) in Net Assets: | 2016 | 2015 | 2016 | 2015 | ||||||||||||||||
| Operations | ||||||||||||||||||||
Net investment income | $ | 339,553 | $ | 326,617 | $ | 337,105 | $ | 345,002 | ||||||||||||
Net realized gain | 135,972 | 184,701 | 457,419 | 282,138 | ||||||||||||||||
Net change in unrealized appreciation (depreciation) | 471,172 | (23,661 | ) | 124,093 | (157,056 | ) | ||||||||||||||
|
|
|
| |||||||||||||||||
Net increase in net assets resulting from operations | 946,697 | 487,657 | 918,617 | 470,084 | ||||||||||||||||
|
|
|
| |||||||||||||||||
| Distributions to Shareholders1 | ||||||||||||||||||||
From net investment income: | ||||||||||||||||||||
Institutional | (309,101 | ) | (323,644 | ) | (323,370 | ) | (340,114 | ) | ||||||||||||
Investor A | (5,900 | ) | (1,914 | ) | (6,631 | ) | (5,064 | ) | ||||||||||||
From net realized gain: | ||||||||||||||||||||
Institutional | (179,456 | ) | (40,729 | ) | (273,980 | ) | (56,890 | ) | ||||||||||||
Investor A | (3,643 | ) | (254 | ) | �� | (6,016 | ) | (869 | ) | |||||||||||
|
|
|
| |||||||||||||||||
Decrease in net assets resulting from distributions to shareholders | (498,100 | ) | (366,541 | ) | (609,997 | ) | (402,937 | ) | ||||||||||||
|
|
|
| |||||||||||||||||
| Capital Share Transactions | ||||||||||||||||||||
Net increase (decrease) in net assets derived from capital share transactions | 212,751 | 171,996 | (11,515 | ) | 47,368 | |||||||||||||||
|
|
|
| |||||||||||||||||
| Net Assets | ||||||||||||||||||||
Total increase in net assets | 661,348 | 293,112 | 297,105 | 114,515 | ||||||||||||||||
Beginning of year | 11,302,905 | 11,009,793 | 11,329,590 | 11,215,075 | ||||||||||||||||
|
|
|
| |||||||||||||||||
End of year | $ | 11,964,253 | $ | 11,302,905 | $ | 11,626,695 | $ | 11,329,590 | ||||||||||||
|
|
|
| |||||||||||||||||
Undistributed net investment income, end of year | $ | 280,518 | $ | 255,966 | $ | 277,897 | $ | 270,793 | ||||||||||||
|
|
|
| |||||||||||||||||
1 Distributions for annual periods determined in accordance with federal income tax regulations. |
| |||||||||||||||||||
| See Notes to Financial Statements. | ||||||
| 38 | BLACKROCK CORI FUNDS | OCTOBER 31, 2016 | ||||
| Statements of Changes in Net Assets |
| BlackRock CoRI 2019 Fund | BlackRock CoRI 2021 Fund | |||||||||||||||||||
| Year Ended October 31, | Year Ended October 31, | |||||||||||||||||||
| Increase (Decrease) in Net Assets: | 2016 | 2015 | 2016 | 2015 | ||||||||||||||||
| Operations | ||||||||||||||||||||
Net investment income | $ | 374,097 | $ | 370,137 | $ | 401,466 | $ | 382,931 | ||||||||||||
Net realized gain | 571,018 | 294,835 | 700,550 | 355,354 | ||||||||||||||||
Net change in unrealized appreciation (depreciation) | 113,784 | (140,459 | ) | 171,094 | (282,115 | ) | ||||||||||||||
|
|
|
| |||||||||||||||||
Net increase in net assets resulting from operations | 1,058,899 | 524,513 | 1,273,110 | 456,170 | ||||||||||||||||
|
|
|
| |||||||||||||||||
| Distributions to Shareholders1 | ||||||||||||||||||||
From net investment income: | ||||||||||||||||||||
Institutional | (338,819 | ) | (366,679 | ) | (356,441 | ) | (368,625 | ) | ||||||||||||
Investor A | (21,182 | ) | (6,462 | ) | (18,559 | ) | (4,427 | ) | ||||||||||||
From net realized gain: | ||||||||||||||||||||
Institutional | (276,666 | ) | (143,279 | ) | (335,443 | ) | (107,191 | ) | ||||||||||||
Investor A | (18,151 | ) | (2,782 | ) | (18,320 | ) | (1,330 | ) | ||||||||||||
|
|
|
| |||||||||||||||||
Decrease in net assets resulting from distributions to shareholders | (654,818 | ) | (519,202 | ) | (728,763 | ) | (481,573 | ) | ||||||||||||
|
|
|
| |||||||||||||||||
| Capital Share Transactions | ||||||||||||||||||||
Net increase in net assets derived from capital share transactions | 130,642 | 436,887 | 379,440 | 429,245 | ||||||||||||||||
|
|
|
| |||||||||||||||||
| Net Assets | ||||||||||||||||||||
Total increase in net assets | 534,723 | 442,198 | 923,787 | 403,842 | ||||||||||||||||
Beginning of year | 12,118,457 | 11,676,259 | 11,906,422 | 11,502,580 | ||||||||||||||||
|
|
|
| |||||||||||||||||
End of year | $ | 12,653,180 | $ | 12,118,457 | $ | 12,830,209 | $ | 11,906,422 | ||||||||||||
|
|
|
| |||||||||||||||||
Undistributed net investment income, end of year | $ | 305,514 | $ | 291,418 | $ | 330,472 | $ | 304,006 | ||||||||||||
|
|
|
| |||||||||||||||||
1 Distributions for annual periods determined in accordance with federal income tax regulations. |
| |||||||||||||||||||
| See Notes to Financial Statements. | ||||||
| BLACKROCK CORI FUNDS | OCTOBER 31, 2016 | 39 | ||||
| Statements of Changes in Net Assets |
| BlackRock CoRI 2023 Fund | ||||||||
| Year Ended October 31, | ||||||||
| Increase (Decrease) in Net Assets: | 2016 | 2015 | ||||||
| Operations | ||||||||
Net investment income | $ | 446,064 | $ | 452,546 | ||||
Net realized gain | 49,312 | 180,965 | ||||||
Net change in unrealized appreciation (depreciation) | 650,984 | (335,338 | ) | |||||
|
| |||||||
Net increase in net assets resulting from operations | 1,146,360 | 298,173 | ||||||
�� |
| |||||||
| Distributions to Shareholders1 | ||||||||
| From net investment income: | ||||||||
Institutional | (374,962 | ) | (376,328 | ) | ||||
Investor A | (85,039 | ) | (10,456 | ) | ||||
| From net realized gain: | ||||||||
Institutional | (177,677 | ) | (97,482 | ) | ||||
Investor A | (43,210 | ) | (2,788 | ) | ||||
|
| |||||||
Decrease in net assets resulting from distributions to shareholders | (680,888 | ) | (487,054 | ) | ||||
|
| |||||||
| Capital Share Transactions | ||||||||
Net increase (decrease) in net assets derived from capital share transactions | (201,722 | ) | 3,493,090 | |||||
|
| |||||||
| Net Assets | ||||||||
Total increase in net assets | 263,750 | 3,304,209 | ||||||
Beginning of year | 15,153,624 | 11,849,415 | ||||||
|
| |||||||
End of year | $ | 15,417,374 | $ | 15,153,624 | ||||
|
| |||||||
Undistributed net investment income, end of year | $ | 358,513 | $ | 372,450 | ||||
|
| |||||||
1 Distributions for annual periods determined in accordance with federal income tax regulations. |
| |||||||
| See Notes to Financial Statements. | ||||||
| 40 | BLACKROCK CORI FUNDS | OCTOBER 31, 2016 | ||||
| Financial Highlights | BlackRock CoRI 2015 Fund |
| Institutional | ||||||||||||||||
| Year Ended October 31, | January 31, 20141 2014 | |||||||||||||||
| 2016 | 2015 | |||||||||||||||
| Per Share Operating Performance | ||||||||||||||||
Net asset value, beginning of period | $ | 11.08 | $ | 10.96 | $ | 10.00 | ||||||||||
|
| |||||||||||||||
Net investment income2 | 0.33 | 0.32 | 0.24 | |||||||||||||
Net realized and unrealized gain | 0.59 | 0.16 | 0.72 | |||||||||||||
|
| |||||||||||||||
Net increase from investment operations | 0.92 | 0.48 | 0.96 | |||||||||||||
|
| |||||||||||||||
| Distributions:3 | ||||||||||||||||
From net investment income | (0.31 | ) | (0.32 | ) | — | |||||||||||
From net realized gain | (0.18 | ) | (0.04 | ) | — | |||||||||||
|
| |||||||||||||||
Total distributions | (0.49 | ) | (0.36 | ) | — | |||||||||||
|
| |||||||||||||||
Net asset value, end of period | $ | 11.51 | $ | 11.08 | $ | 10.96 | ||||||||||
|
| |||||||||||||||
| Total Return4 | ||||||||||||||||
Based on net asset value | 8.71% | 4.45% | 9.60% | 5 | ||||||||||||
|
| |||||||||||||||
| Ratios to Average Net Assets | ||||||||||||||||
Total expenses | 1.69% | 2.02% | 2.64% | 6,7 | ||||||||||||
|
| |||||||||||||||
Total expenses after fees waived and/or reimbursed | 0.25% | 0.25% | 0.25% | 6 | ||||||||||||
|
| |||||||||||||||
Net investment income | 2.90% | 2.93% | 3.08% | 6 | ||||||||||||
|
| |||||||||||||||
| Supplemental Data | ||||||||||||||||
Net assets, end of period (000) | $ | 11,543 | $ | 11,060 | $ | 10,939 | ||||||||||
|
| |||||||||||||||
Portfolio turnover rate | 52% | 36% | 10% | |||||||||||||
|
| |||||||||||||||
| 1 | Commencement of operations. |
| 2 | Based on average shares outstanding. |
| 3 | Distributions for annual periods determined in accordance with federal income tax regulations. |
| 4 | Where applicable, assumes the reinvestment of distributions. |
| 5 | Aggregate total return. |
| 6 | Annualized. |
| 7 | Organization and offering costs were not annualized in the calculation of the expense ratios. If these expenses were annualized, the total expenses would have been 3.06%. |
| See Notes to Financial Statements. | ||||||
| BLACKROCK CORI FUNDS | OCTOBER 31, 2016 | 41 | ||||
| Financial Highlights (concluded) | BlackRock CoRI 2015 Fund |
| Investor A | ||||||||||||||||
| Year Ended October 31, | January 31, 20141 2014 | |||||||||||||||
| 2016 | 2015 | |||||||||||||||
| Per Share Operating Performance | ||||||||||||||||
Net asset value, beginning of period | $ | 11.05 | $ | 10.94 | $ | 10.00 | ||||||||||
|
| |||||||||||||||
Net investment income2 | 0.30 | 0.30 | 0.22 | |||||||||||||
Net realized and unrealized gain | 0.58 | 0.16 | 0.72 | |||||||||||||
|
| |||||||||||||||
Net increase from investment operations | 0.88 | 0.46 | 0.94 | |||||||||||||
|
| |||||||||||||||
| Distributions:3 | ||||||||||||||||
From net investment income | (0.29 | ) | (0.31 | ) | — | |||||||||||
From net realized gain | (0.18 | ) | (0.04 | ) | — | |||||||||||
|
| |||||||||||||||
Total distributions | (0.47 | ) | (0.35 | ) | — | |||||||||||
|
| |||||||||||||||
Net asset value, end of period | $ | 11.46 | $ | 11.05 | $ | 10.94 | ||||||||||
|
| |||||||||||||||
| Total Return4 | ||||||||||||||||
Based on net asset value | 8.36% | 4.22% | 9.40% | 5 | ||||||||||||
|
| |||||||||||||||
| Ratios to Average Net Assets | ||||||||||||||||
Total expenses | 2.06% | 2.39% | 3.12% | 6,7 | ||||||||||||
|
| |||||||||||||||
Total expenses after fees waived and/or reimbursed | 0.50% | 0.50% | 0.50% | 6 | ||||||||||||
|
| |||||||||||||||
Net investment income | 2.62% | 2.70% | 2.80% | 6 | ||||||||||||
|
| |||||||||||||||
| Supplemental Data | ||||||||||||||||
Net assets, end of period (000) | $ | 421 | $ | 243 | $ | 71 | ||||||||||
|
| |||||||||||||||
Portfolio turnover rate | 52% | 36% | 10% | |||||||||||||
|
| |||||||||||||||
| 1 | Commencement of operations. |
| 2 | Based on average shares outstanding. |
| 3 | Distributions for annual periods determined in accordance with federal income tax regulations. |
| 4 | Where applicable, excludes the effects of any sales charges and assumes the reinvestment of distributions. |
| 5 | Aggregate total return. |
| 6 | Annualized. |
| 7 | Organization and offering costs were not annualized in the calculation of the expense ratios. If these expenses were annualized, the total expenses would have been 3.48%. |
| See Notes to Financial Statements. | ||||||
| 42 | BLACKROCK CORI FUNDS | OCTOBER 31, 2016 | ||||
| Financial Highlights | BlackRock CoRI 2017 Fund |
| Institutional | ||||||||||||||||
| Year Ended October 31, | January 31, 20141 2014 | |||||||||||||||
| 2016 | 2015 | |||||||||||||||
| Per Share Operating Performance | ||||||||||||||||
Net asset value, beginning of period | $ | 11.20 | $ | 11.13 | $ | 10.00 | ||||||||||
|
| |||||||||||||||
Net investment income2 | 0.33 | 0.34 | 0.25 | |||||||||||||
Net realized and unrealized gain | 0.57 | 0.13 | 0.88 | |||||||||||||
|
| |||||||||||||||
Net increase from investment operations | 0.90 | 0.47 | 1.13 | |||||||||||||
|
| |||||||||||||||
| Distributions:3 | ||||||||||||||||
From net investment income | (0.32 | ) | (0.34 | ) | — | |||||||||||
From net realized gain | (0.27 | ) | (0.06 | ) | — | |||||||||||
|
| |||||||||||||||
Total distributions | (0.59 | ) | (0.40 | ) | — | |||||||||||
|
| |||||||||||||||
Net asset value, end of period | $ | 11.51 | $ | 11.20 | $ | 11.13 | ||||||||||
|
| |||||||||||||||
| Total Return4 | ||||||||||||||||
Based on net asset value | 8.60% | 4.18% | 11.30% | 5 | ||||||||||||
|
| |||||||||||||||
| Ratios to Average Net Assets | ||||||||||||||||
Total expenses | 1.68% | 1.97% | 2.62% | 6,7 | ||||||||||||
|
| |||||||||||||||
Total expenses after fees waived and/or reimbursed | 0.25% | 0.25% | 0.25% | 6 | ||||||||||||
|
| |||||||||||||||
Net investment income | 2.90% | 3.03% | 3.26% | 6 | ||||||||||||
|
| |||||||||||||||
| Supplemental Data | ||||||||||||||||
Net assets, end of period (000) | $ | 11,482 | $ | 11,180 | $ | 11,120 | ||||||||||
|
| |||||||||||||||
Portfolio turnover rate | 47% | 27% | 10% | |||||||||||||
|
| |||||||||||||||
| 1 | Commencement of operations. |
| 2 | Based on average shares outstanding. |
| 3 | Distributions for annual periods determined in accordance with federal income tax regulations. |
| 4 | Where applicable, assumes the reinvestment of distributions. |
| 5 | Aggregate total return. |
| 6 | Annualized. |
| 7 | Organization and offering costs were not annualized in the calculation of the expense ratios. If these expenses were annualized, the total expenses would have been 3.03%. |
| See Notes to Financial Statements. | ||||||
| BLACKROCK CORI FUNDS | OCTOBER 31, 2016 | 43 | ||||
| Financial Highlights (concluded) | BlackRock CoRI 2017 Fund |
| Investor A | ||||||||||||||||
| Year Ended October 31, | January 31, 20141 2014 | |||||||||||||||
| 2016 | 2015 | |||||||||||||||
| Per Share Operating Performance | ||||||||||||||||
Net asset value, beginning of period | $ | 11.16 | $ | 11.11 | $ | 10.00 | ||||||||||
|
| |||||||||||||||
Net investment income2 | 0.30 | 0.31 | 0.23 | |||||||||||||
Net realized and unrealized gain | 0.57 | 0.13 | 0.88 | |||||||||||||
|
| |||||||||||||||
Net increase from investment operations | 0.87 | 0.44 | 1.11 | |||||||||||||
|
| |||||||||||||||
| Distributions:3 | ||||||||||||||||
From net investment income | (0.30 | ) | (0.33 | ) | — | |||||||||||
From net realized gain | (0.27 | ) | (0.06 | ) | — | |||||||||||
|
| |||||||||||||||
Total distributions | (0.57 | ) | (0.39 | ) | — | |||||||||||
|
| |||||||||||||||
Net asset value, end of period | $ | 11.46 | $ | 11.16 | $ | 11.11 | ||||||||||
|
| |||||||||||||||
| Total Return4 | ||||||||||||||||
Based on net asset value | 8.32% | 3.93% | 11.10% | 5 | ||||||||||||
|
| |||||||||||||||
| Ratios to Average Net Assets | ||||||||||||||||
Total expenses | 2.04% | 2.35% | 3.09% | 6,7 | ||||||||||||
|
| |||||||||||||||
Total expenses after fees waived and/or reimbursed | 0.50% | 0.50% | 0.50% | 6 | ||||||||||||
|
| |||||||||||||||
Net investment income | 2.60% | 2.77% | 2.96% | 6 | ||||||||||||
|
| |||||||||||||||
| Supplemental Data | ||||||||||||||||
Net assets, end of period (000) | $ | 144 | $ | 150 | $ | 95 | ||||||||||
|
| |||||||||||||||
Portfolio turnover rate | 47% | 27% | 10% | |||||||||||||
|
| |||||||||||||||
| 1 | Commencement of operations. |
| 2 | Based on average shares outstanding. |
| 3 | Distributions for annual periods determined in accordance with federal income tax regulations. |
| 4 | Where applicable, excludes the effects of any sales charges and assumes the reinvestment of distributions. |
| 5 | Aggregate total return. |
| 6 | Annualized. |
| 7 | Organization and offering costs were not annualized in the calculation of the expense ratios. If these expenses were annualized, the total expenses would have been 3.46%. |
| See Notes to Financial Statements. | ||||||
| 44 | BLACKROCK CORI FUNDS | OCTOBER 31, 2016 | ||||
| Financial Highlights | BlackRock CoRI 2019 Fund |
| Institutional | ||||||||||||||||
| Year Ended October 31, | January 31, 20141 to October 31, 2014 | |||||||||||||||
| 2016 | 2015 | |||||||||||||||
| Per Share Operating Performance | ||||||||||||||||
Net asset value, beginning of period | $ | 11.31 | $ | 11.30 | $ | 10.00 | ||||||||||
|
| |||||||||||||||
Net investment income2 | 0.34 | 0.36 | 0.27 | |||||||||||||
Net realized and unrealized gain | 0.65 | 0.15 | 1.03 | |||||||||||||
|
| |||||||||||||||
Net increase from investment operations | 0.99 | 0.51 | 1.30 | |||||||||||||
|
| |||||||||||||||
| Distributions:3 | ||||||||||||||||
From net investment income | (0.34 | ) | (0.36 | ) | — | |||||||||||
From net realized gain | (0.27 | ) | (0.14 | ) | — | |||||||||||
|
| |||||||||||||||
Total distributions | (0.61 | ) | (0.50 | ) | — | |||||||||||
|
| |||||||||||||||
Net asset value, end of period | $ | 11.69 | $ | 11.31 | $ | 11.30 | ||||||||||
|
| |||||||||||||||
| Total Return4 | ||||||||||||||||
Based on net asset value | 9.28% | 4.51% | 13.00% | 5 | ||||||||||||
|
| |||||||||||||||
| Ratios to Average Net Assets | ||||||||||||||||
Total expenses | 1.57% | 1.89% | 2.55% | 6,7 | ||||||||||||
|
| |||||||||||||||
Total expenses after fees waived and/or reimbursed | 0.25% | 0.25% | 0.25% | 6 | ||||||||||||
|
| |||||||||||||||
Net investment income | 2.99% | 3.14% | 3.43% | 6 | ||||||||||||
|
| |||||||||||||||
| Supplemental Data | ||||||||||||||||
Net assets, end of period (000) | $ | 11,781 | $ | 11,418 | $ | 11,418 | ||||||||||
|
| |||||||||||||||
Portfolio turnover rate | 58% | 31% | 29% | |||||||||||||
|
| |||||||||||||||
| 1 | Commencement of operations. |
| 2 | Based on average shares outstanding. |
| 3 | Distributions for annual periods determined in accordance with federal income tax regulations. |
| 4 | Where applicable, assumes the reinvestment of distributions. |
| 5 | Aggregate total return. |
| 6 | Annualized. |
| 7 | Organization and offering costs were not annualized in the calculation of the expense ratios. If these expenses were annualized, the total expenses for Institutional Shares would have been 2.95%. |
| See Notes to Financial Statements. | ||||||
| BLACKROCK CORI FUNDS | OCTOBER 31, 2016 | 45 | ||||
| Financial Highlights (concluded) | BlackRock CoRI 2019 Fund |
| Investor A | ||||||||||||||||
| Year Ended October 31, | January 31, 20141 to October 31, 2014 | |||||||||||||||
| 2016 | 2015 | |||||||||||||||
| Per Share Operating Performance | ||||||||||||||||
Net asset value, beginning of period | $ | 11.30 | $ | 11.29 | $ | 10.00 | ||||||||||
|
| |||||||||||||||
Net investment income2 | 0.31 | 0.33 | 0.25 | |||||||||||||
Net realized and unrealized gain | 0.64 | 0.15 | 1.04 | |||||||||||||
|
| |||||||||||||||
Net increase from investment operations | 0.95 | 0.48 | 1.29 | |||||||||||||
|
| |||||||||||||||
| Distributions:3 | ||||||||||||||||
From net investment income | (0.32 | ) | (0.33 | ) | — | |||||||||||
From net realized gain | (0.27 | ) | (0.14 | ) | — | |||||||||||
|
| |||||||||||||||
Total distributions | (0.59 | ) | (0.47 | ) | — | |||||||||||
|
| |||||||||||||||
Net asset value, end of period | $ | 11.66 | $ | 11.30 | $ | 11.29 | ||||||||||
|
| |||||||||||||||
| Total Return4 | ||||||||||||||||
Based on net asset value | 8.94% | 4.21% | 12.90% | 5 | ||||||||||||
|
| |||||||||||||||
| Ratios to Average Net Assets | ||||||||||||||||
Total expenses | 1.89% | 2.23% | 2.39% | 6,7 | ||||||||||||
|
| |||||||||||||||
Total expenses after fees waived and/or reimbursed | 0.50% | 0.50% | 0.50% | 6 | ||||||||||||
|
| |||||||||||||||
Net investment income | 2.69% | 2.90% | 3.02% | 6 | ||||||||||||
|
| |||||||||||||||
| Supplemental Data | ||||||||||||||||
Net assets, end of period (000) | $ | 872 | $ | 701 | $ | 259 | ||||||||||
|
| |||||||||||||||
Portfolio turnover rate | 58% | 31% | 29% | |||||||||||||
|
| |||||||||||||||
| 1 | Commencement of operations. |
| 2 | Based on average shares outstanding. |
| 3 | Distributions for annual periods determined in accordance with federal income tax regulations. |
| 4 | Where applicable, excludes the effects of any sales charges and assumes the reinvestment of distributions. |
| 5 | Aggregate total return. |
| 6 | Annualized. |
| 7 | Organization and offering costs were not annualized in the calculation of the expense ratios. If these expenses were annualized, the total expenses for Investor a Shares would have been 2.66%. |
| See Notes to Financial Statements. | ||||||
| 46 | BLACKROCK CORI FUNDS | OCTOBER 31, 2016 | ||||
| Financial Highlights | BlackRock CoRI 2021 Fund |
| Institutional | ||||||||||||||||
| Year Ended October 31, | January 31, 20141 to October 31, 2014 | |||||||||||||||
| 2016 | 2015 | |||||||||||||||
| Per Share Operating Performance | ||||||||||||||||
Net asset value, beginning of period | $ | 11.40 | $ | 11.41 | $ | 10.00 | ||||||||||
|
| |||||||||||||||
Net investment income2 | 0.36 | 0.37 | 0.37 | |||||||||||||
Net realized and unrealized gain | 0.78 | 0.10 | 1.04 | |||||||||||||
|
| |||||||||||||||
Net increase from investment operations | 1.14 | 0.47 | 1.41 | |||||||||||||
|
| |||||||||||||||
| Distributions:3 | ||||||||||||||||
From net investment income | (0.36 | ) | (0.37 | ) | — | |||||||||||
From net realized gain | (0.34 | ) | (0.11 | ) | — | |||||||||||
|
| |||||||||||||||
Total distributions | (0.70 | ) | (0.48 | ) | — | |||||||||||
|
| |||||||||||||||
Net asset value, end of period | $ | 11.84 | $ | 11.40 | $ | 11.41 | ||||||||||
|
| |||||||||||||||
| Total Return4 | ||||||||||||||||
Based on net asset value | 10.63% | 4.03% | 14.10% | 5 | ||||||||||||
|
| |||||||||||||||
| Ratios to Average Net Assets | ||||||||||||||||
Total expenses | 1.54% | 1.89% | 2.58% | 6,7 | ||||||||||||
|
| |||||||||||||||
Total expenses after fees waived and/or reimbursed | 0.25% | 0.25% | 0.25% | 6 | ||||||||||||
|
| |||||||||||||||
Net investment income | 3.11% | 3.25% | 3.50% | 6 | ||||||||||||
|
| |||||||||||||||
| Supplemental Data | ||||||||||||||||
Net assets, end of period (000) | $ | 11,830 | $ | 11,379 | $ | 11,390 | ||||||||||
|
| |||||||||||||||
Portfolio turnover rate | 93% | 37% | 19% | |||||||||||||
|
| |||||||||||||||
| 1 | Commencement of operations. |
| 2 | Based on average shares outstanding. |
| 3 | Distributions for annual periods determined in accordance with federal income tax regulations. |
| 4 | Where applicable, assumes the reinvestment of distributions. |
| 5 | Aggregate total return. |
| 6 | Annualized. |
| 7 | Organization costs were not annualized in the calculation of the expense ratios. If these expenses were annualized, the total expenses for Institutional Shares would have been 3.00%. |
| See Notes to Financial Statements. | ||||||
| BLACKROCK CORI FUNDS | OCTOBER 31, 2016 | 47 | ||||
| Financial Highlights (concluded) | BlackRock CoRI 2021 Fund |
| Investor A | ||||||||||||||||
| Year Ended October 31, | January 31, 20141 to October 31, 2014 | |||||||||||||||
| 2016 | 2015 | |||||||||||||||
| Per Share Operating Performance | ||||||||||||||||
Net asset value, beginning of period | $ | 11.36 | $ | 11.39 | $ | 10.00 | ||||||||||
|
| |||||||||||||||
Net investment income2 | 0.33 | 0.35 | 0.32 | |||||||||||||
Net realized and unrealized gain | 0.79 | 0.09 | 1.07 | |||||||||||||
|
| |||||||||||||||
Net increase from investment operations | 1.12 | 0.44 | 1.39 | |||||||||||||
|
| |||||||||||||||
| Distributions:3 | ||||||||||||||||
From net investment income | (0.34 | ) | (0.36 | ) | — | |||||||||||
From net realized gain | (0.34 | ) | (0.11 | ) | — | |||||||||||
|
| |||||||||||||||
Total distributions | (0.68 | ) | (0.47 | ) | — | |||||||||||
|
| |||||||||||||||
Net asset value, end of period | $ | 11.80 | $ | 11.36 | $ | 11.39 | ||||||||||
|
| |||||||||||||||
| Total Return4 | ||||||||||||||||
Based on net asset value | 10.50% | 3.75% | 13.90% | 5 | ||||||||||||
|
| |||||||||||||||
| Ratios to Average Net Assets | ||||||||||||||||
Total expenses | 1.81% | 2.19% | 2.83% | 6,7 | ||||||||||||
|
| |||||||||||||||
Total expenses after fees waived and/or reimbursed | 0.50% | 0.50% | 0.50% | 6 | ||||||||||||
|
| |||||||||||||||
Net investment income | 2.81% | 3.03% | 3.16% | 6 | ||||||||||||
|
| |||||||||||||||
| Supplemental Data | ||||||||||||||||
Net assets, end of period (000) | $ | 1,000 | $ | 528 | $ | 113 | ||||||||||
|
| |||||||||||||||
Portfolio turnover rate | 93% | 37% | 19% | |||||||||||||
|
| |||||||||||||||
| 1 | Commencement of operations. |
| 2 | Based on average shares outstanding. |
| 3 | Distributions for annual periods determined in accordance with federal income tax regulations. |
| 4 | Where applicable, excludes the effects of any sales charges and assumes the reinvestment of distributions. |
| 5 | Aggregate total return. |
| 6 | Annualized. |
| 7 | Organization costs were not annualized in the calculation of the expense ratios. If these expenses were annualized, the total expenses for Investor A Shares would have been 3.16%. |
| See Notes to Financial Statements. | ||||||
| 48 | BLACKROCK CORI FUNDS | OCTOBER 31, 2016 | ||||
| Financial Highlights | BlackRock CoRI 2023 Fund |
| Institutional | ||||||||||||||||
| Year Ended October 31, | January 31, 20141 to October 31, 2014 | |||||||||||||||
| 2016 | 2015 | |||||||||||||||
| Per Share Operating Performance | ||||||||||||||||
Net asset value, beginning of period | $ | 11.52 | $ | 11.56 | $ | 10.00 | ||||||||||
|
| |||||||||||||||
Net investment income2 | 0.38 | 0.39 | 0.29 | |||||||||||||
Net realized and unrealized gain | 0.90 | 0.05 | 1.27 | |||||||||||||
|
| |||||||||||||||
Net increase from investment operations | 1.28 | 0.44 | 1.56 | |||||||||||||
|
| |||||||||||||||
| Distributions:3 | ||||||||||||||||
From net investment income | (0.38 | ) | (0.38 | ) | — | |||||||||||
From net realized gain | (0.18 | ) | (0.10 | ) | — | |||||||||||
|
| |||||||||||||||
Total distributions | (0.56 | ) | (0.48 | ) | — | |||||||||||
|
| |||||||||||||||
Net asset value, end of period | $ | 12.24 | $ | 11.52 | $ | 11.56 | ||||||||||
|
| |||||||||||||||
| Total Return4 | ||||||||||||||||
Based on net asset value | 11.66% | 3.65% | 15.60% | 5 | ||||||||||||
|
| |||||||||||||||
| Ratios to Average Net Assets | ||||||||||||||||
Total expenses | 1.47% | 1.71% | 2.56% | 6,7 | ||||||||||||
|
| |||||||||||||||
Total expenses after fees waived and/or reimbursed | 0.25% | 0.25% | 0.25% | 6 | ||||||||||||
|
| |||||||||||||||
Net investment income | 3.20% | 3.30% | 3.59% | 6 | ||||||||||||
|
| |||||||||||||||
| Supplemental Data | ||||||||||||||||
Net assets, end of period (000) | $ | 12,378 | $ | 12,435 | $ | 11,540 | ||||||||||
|
| |||||||||||||||
Portfolio turnover rate | 110% | 43% | 20% | |||||||||||||
|
| |||||||||||||||
| 1 | Commencement of operations. |
| 2 | Based on average shares outstanding. |
| 3 | Distributions for annual periods determined in accordance with federal income tax regulations. |
| 4 | Where applicable, assumes the reinvestment of distributions. |
| 5 | Aggregate total return. |
| 6 | Annualized. |
| 7 | Organization costs were not annualized in the calculation of the expense ratios. If these expenses were annualized, the total expenses for Institutional Shares would have been 2.97%. |
| See Notes to Financial Statements. | ||||||
| BLACKROCK CORI FUNDS | OCTOBER 31, 2016 | 49 | ||||
| Financial Highlights (concluded) | BlackRock CoRI 2023 Fund |
| Investor A | ||||||||||||||||
| Year Ended October 31, | January 31, 20141 to October 31, 2014 | |||||||||||||||
| 2016 | 2015 | |||||||||||||||
| Per Share Operating Performance | ||||||||||||||||
Net asset value, beginning of period | $ | 11.48 | $ | 11.54 | $ | 10.00 | ||||||||||
|
| |||||||||||||||
Net investment income2 | 0.35 | 0.36 | 0.27 | |||||||||||||
Net realized and unrealized gain | 0.89 | 0.05 | 1.27 | |||||||||||||
|
| |||||||||||||||
Net increase from investment operations | 1.24 | 0.41 | 1.54 | |||||||||||||
|
| |||||||||||||||
| Distributions:3 | ||||||||||||||||
From net investment income | (0.35 | ) | (0.37 | ) | — | |||||||||||
From net realized gain | (0.18 | ) | (0.10 | ) | — | |||||||||||
|
| |||||||||||||||
Total distributions | (0.53 | ) | (0.47 | ) | — | |||||||||||
|
| |||||||||||||||
Net asset value, end of period | $ | 12.19 | $ | 11.48 | $ | 11.54 | ||||||||||
|
| |||||||||||||||
| Total Return4 | ||||||||||||||||
Based on net asset value | 11.35% | 3.38% | 15.40% | 5 | ||||||||||||
|
| |||||||||||||||
| Ratios to Average Net Assets | ||||||||||||||||
Total expenses | 1.72% | 1.81% | 2.60% | 6,7 | ||||||||||||
|
| |||||||||||||||
Total expenses after fees waived and/or reimbursed | 0.50% | 0.50% | 0.50% | 6 | ||||||||||||
|
| |||||||||||||||
Net investment income | 2.89% | 3.08% | 3.22% | 6 | ||||||||||||
|
| |||||||||||||||
| Supplemental Data | ||||||||||||||||
Net assets, end of period (000) | $ | 3,039 | $ | 2,719 | $ | 309 | ||||||||||
|
| |||||||||||||||
Portfolio turnover rate | 110% | 43% | 20% | |||||||||||||
|
| |||||||||||||||
| 1 | Commencement of operations. |
| 2 | Based on average shares outstanding. |
| 3 | Distributions for annual periods determined in accordance with federal income tax regulations. |
| 4 | Where applicable, excludes the effects of any sales charges and assumes the reinvestment of distributions. |
| 5 | Aggregate total return. |
| 6 | Annualized. |
| 7 | Organization costs were not annualized in the calculation of the expense ratios. If these expenses were annualized, the total expenses for Investor A Shares would have been 2.90%. |
| See Notes to Financial Statements. | ||||||
| 50 | BLACKROCK CORI FUNDS | OCTOBER 31, 2016 | ||||
| Notes to Financial Statements | ||||
1. Organization:
BlacRock CoRI Funds (the “Trust”) is registered under the Investment Company Act of 1940, as amended (the “1940 Act”), as an open-end management investment company. The Trust is organized as a Massachusetts business trust. The following are referred to herein collectively as the “Funds” or individually, a “Fund”:
| Fund Name | Herein Referred To As | Diversification Classification | ||||||
BlackRock CoRI 2015 Fund | CoRI 2015 Fund | Diversified | ||||||
BlackRock CoRI 2017 Fund | CoRI 2017 Fund | Diversified | ||||||
BlackRock CoRI 2019 Fund | CoRI 2019 Fund | Diversified | ||||||
BlackRock CoRI 2021 Fund | CoRI 2021 Fund | Diversified | ||||||
BlackRock CoRI 2023 Fund | CoRI 2023 Fund | Diversified | ||||||
Each Fund offers multiple classes of shares. All classes of shares have identical voting, dividend, liquidation and other rights and are subject to the same terms and conditions, except that certain classes bear expenses related to the shareholder servicing and distribution of such shares, and may be subject to a contingent deferred sales charge (“CDSC”). Each class has exclusive voting rights with respect to matters relating to its shareholder servicing and distribution expenditures.
| Share Class | Initial Sales Charge | CDSC | Conversion Privilege | |||||||||
Institutional Shares | No | No | None | |||||||||
Investor A Shares | Yes | No | 1 | None | ||||||||
| 1 | Investor A Shares may be subject to a CDSC for certain redemptions where no initial sales charge was paid at the time of purchase. |
The Funds, together with certain other registered investment companies advised by BlackRock Advisors, LLC (the “Manager”) or its affiliates, are included in a complex of open-end funds referred to as the Equity-Bond Complex.
2. Significant Accounting Policies:
The financial statements are prepared in conformity with accounting principles generally accepted in the United States of America (“U.S. GAAP”), which may require management to make estimates and assumptions that affect the reported amounts of assets and liabilities in the financial statements, disclosure of contingent assets and liabilities at the date of the financial statements and the reported amounts of increases and decreases in net assets from operations during the reporting period. Actual results could differ from those estimates. Each Fund is considered an investment company under U.S. GAAP and follows the accounting and reporting guidance applicable to investment companies. Below is a summary of significant accounting policies:
Segregation and Collateralization: In cases where a Fund enters into certain investments (e.g., futures contracts) that would be treated as “senior securities” for 1940 Act purposes, a Fund may segregate or designate on its books and records cash or liquid assets having a market value at least equal to the amount of its future obligations under such investments. Doing so allows the investment to be excluded from treatment as a “senior security.” Furthermore, if required by an exchange or counterparty agreement, the Fund may be required to deliver/deposit cash and/or securities to/with an exchange, or broker-dealer or custodian as collateral for certain investments or obligations.
Investment Transactions and Investment Income: For financial reporting purposes, investment transactions are recorded on the dates the transactions are entered into (the trade dates). Realized gains and losses on investment transactions are determined on the identified cost basis. Interest income, including amortization and accretion of premiums and discounts on debt securities, is recognized on the accrual basis. Income, expenses and realized and unrealized gains and losses are allocated daily to each class based on its relative net assets.
Distributions: Distributions from net investment income are declared and paid annually. Distributions of capital gains are recorded on the ex-dividend dates and made it at least annually. The character and timing of distributions are determined in accordance with federal income tax regulations, which may differ from U.S. GAAP.
Indemnifications: In the normal course of business, a Fund enters into contracts that contain a variety of representations that provide general indemnification. A Fund’s maximum exposure under these arrangements is unknown because it involves future potential claims against a Fund, which cannot be predicted with any certainty.
Other: Expenses directly related to a Fund or its classes are charged to that Fund or the applicable class. Other operating expenses shared by several funds, including other funds managed by the Manager, are prorated among those funds on the basis of relative net assets or other appropriate methods. Expenses directly related to the Funds and other shared expenses prorated to the Funds are allocated daily to each class based on its relative net assets or other appropriate methods.
Through May 31, 2016, the Funds had an arrangement with their custodian whereby credits were earned on uninvested cash balances, which could be used to reduce custody fees and/or overdraft charges. Credits previously earned may be utilized until December 31, 2016. Under current arrangements effective June 1, 2016, the Funds no longer earn credits on uninvested cash, and may incur charges on uninvested cash balances and overdrafts, subject to certain conditions.
| BLACKROCK CORI FUNDS | OCTOBER 31, 2016 | 51 |
| Notes to Financial Statements (continued) |
3. Investment Valuation and Fair Value Measurements:
Investment Valuation Policies: The Funds’ investments are valued at fair value (also referred to as “market value” within the financial statements) as of the close of trading on the New York Stock Exchange (“NYSE”) (generally 4:00 p.m., Eastern time). U.S. GAAP defines fair value as the price the Funds would receive to sell an asset or pay to transfer a liability in an orderly transaction between market participants at the measurement date. The Funds determine the fair values of their financial instruments using various independent dealers or pricing services under policies approved by the Board of Trustees of the Trust (the “Board”). The BlackRock Global Valuation Methodologies Committee (the “Global Valuation Committee”) is the committee formed by management to develop global pricing policies and procedures and to oversee the pricing function for all financial instruments.
Fair Value Inputs and Methodologies: The following methods and inputs are used to establish the fair value of each Fund’s assets and liabilities:
| • | Fixed-income securities for which market quotations are readily available are generally valued using the last available bid prices or current market quotations provided by independent dealers or third party pricing services. Floating rate loan interests are valued at the mean of the bid prices from one or more independent brokers or dealers as obtained from a third party pricing service. Pricing services generally value fixed-income securities assuming orderly transactions of an institutional round lot size, but the Funds may hold or transact in such securities in smaller, odd lot sizes. Odd lots often trade at lower prices than institutional round lots. The pricing services may use matrix pricing or valuation models that utilize certain inputs and assumptions to derive values, including transaction data (e.g., recent representative bids and offers), credit quality information, perceived market movements, news, and other relevant information. Certain fixed-income securities, including asset-backed and mortgage related securities may be valued based on valuation models that consider the estimated cash flows of each tranche of the entity, establish a benchmark yield and develop an estimated tranche specific spread to the benchmark yield based on the unique attributes of the tranche. The amortized cost method of valuation may be used with respect to debt obligations with sixty days or less remaining to maturity unless the Manager determines such method does not represent fair value. |
| • | Investments in open-end U.S. mutual funds are valued at net asset value (“NAV”) each business day. |
| • | Futures contracts traded on exchanges are valued at their last sale price. |
| • | If events (e.g., a company announcement, market volatility or a natural disaster) occur that are expected to materially affect the value of such investments, or in the event that the application of these methods of valuation results in a price for an investment that is deemed not to be representative of the market value of such investment, or if a price is not available, the investment will be valued by the Global Valuation Committee, or its delegate, in accordance with a policy approved by the Board as reflecting fair value (“Fair Valued Investments”). When determining the price for Fair Valued Investments, the Global Valuation Committee, or its delegate, seeks to determine the price that each Fund might reasonably expect to receive or pay from the current sale or purchase of that asset or liability in an arm’s-length transaction. Fair value determinations shall be based upon all available factors that the Global Valuation Committee, or its delegate, deems relevant and consistent with the principles of fair value measurement. The pricing of all Fair Valued Investments is subsequently reported to the Board or a committee thereof on a quarterly basis. |
Fair Value Hierarchy: Various inputs are used in determining the fair value of investments and derivative financial instruments. These inputs to valuation methodologies are categorized into a fair value hierarchy consisting of three broad levels for financial statement purposes as follows:
| • | Level 1 — unadjusted price quotations in active markets/exchanges for identical assets or liabilities that each Fund has the ability to access |
| • | Level 2 — other observable inputs (including, but not limited to, quoted prices for similar assets or liabilities in markets that are active, quoted prices for identical or similar assets or liabilities in markets that are not active, inputs other than quoted prices that are observable for the assets or liabilities (such as interest rates, yield curves, volatilities, prepayment speeds, loss severities, credit risks and default rates) or other market–corroborated inputs) |
| • | Level 3 — unobservable inputs based on the best information available in the circumstances, to the extent observable inputs are not available (including each Fund’s own assumptions used in determining the fair value of investments and derivative financial instruments) |
The hierarchy gives the highest priority to unadjusted quoted prices in active markets for identical assets or liabilities (Level 1 measurements) and the lowest priority to unobservable inputs (Level 3 measurements). Accordingly, the degree of judgment exercised in determining fair value is greatest for instruments categorized in Level 3. The inputs used to measure fair value may fall into different levels of the fair value hierarchy. In such cases, for disclosure purposes, the fair value hierarchy classification is determined based on the lowest level input that is significant to the fair value measurement in its entirety. Investments classified within Level 3 have significant unobservable inputs used by the Global Valuation Committee in determining the price for Fair Valued Investments. Level 3 Investments include equity or debt issued by privately-held companies. There may not be a secondary market, and/or there are a limited number of investors. Level 3 investments may also be adjusted to reflect illiquidity and/or non-transferability, with the amount of such discount estimated by the Global Valuation Committee in the absence of market information.
Changes in valuation techniques may result in transfers into or out of an assigned level within the hierarchy. In accordance with each Fund’s policy, transfers between different levels of the fair value hierarchy are deemed to have occurred as of the beginning of the reporting period. The categorization of a value determined for investments and derivative financial instruments is based on the pricing transparency of the investments and derivative financial instruments and is not necessarily an indication of the risks associated with investing in those securities.
| 52 | BLACKROCK CORI FUNDS | OCTOBER 31, 2016 |
| Notes to Financial Statements (continued) | ||||
4. Securities and Other Investments:
Stripped Mortgage-Backed Securities: Stripped mortgage-backed securities are typically issued by the U.S. Government, its agencies and instrumentalities. Stripped mortgage-backed securities are usually structured with two classes that receive different proportions of the interest (IOs) and principal (POs) distributions on a pool of mortgage pass-through securities (the “Mortgage Assets”). Stripped mortgage-backed securities may be privately issued.
Zero-Coupon Bonds: Zero-coupon bonds are normally issued at a significant discount from face value and do not provide for periodic interest payments. These bonds may experience greater volatility in market value than other debt obligations of similar maturity which provide for regular interest payments.
5. Derivative Financial Instruments:
The Funds engage in various portfolio investment strategies using derivative contracts both to increase the returns of the Funds and/or to manage their exposure to certain risks such as credit risk, equity risk, interest rate risk, foreign currency exchange rate risk, commodity price risk or other risks (e.g., inflation risk). Derivative financial instruments categorized by risk exposure are included in the Schedules of Investments. These contracts may be transacted on an exchange.
Futures Contracts: Certain Funds invest in long and/or short positions in futures and options on futures contracts to gain exposure to, or manage exposure to changes in interest rates (interest rate risk), changes in the value of equity securities (equity risk) or foreign currencies (foreign currency exchange rate risk).
Futures contracts are agreements between the Funds and a counterparty to buy or sell a specific quantity of an underlying instrument at a specified price and on a specified date. Depending on the terms of a contract, it is settled either through physical delivery of the underlying instrument on the settlement date or by payment of a cash amount on the settlement date. Upon entering into a futures contract, the Funds are required to deposit initial margin with the broker in the form of cash or securities in an amount that varies depending on a contract’s size and risk profile. The initial margin deposit must then be maintained at an established level over the life of the contract.
Securities deposited as initial margin are designated in the Schedules of Investments and cash deposited, if any, is shown as cash pledged for futures contracts in the Statements of Assets and Liabilities. Pursuant to the contract, the Funds agree to receive from or pay to the broker an amount of cash equal to the daily fluctuation in market value of the contract (“variation margin”). Variation margin is recorded as unrealized appreciation (depreciation) and, if any, shown as variation margin receivable (or payable) on futures contracts in the Statements of Assets and Liabilities. When the contract is closed, a realized gain or loss is recorded in the Statements of Operations equal to the difference between the value of the contract at the time it was opened and the value at the time it was closed. The use of futures contracts involves the risk of an imperfect correlation in the movements in the price of futures contracts and interest, foreign currency exchange rates or underlying assets.
6. Investment Advisory Agreement and Other Transactions with Affiliates:
The PNC Financial Services Group, Inc. is the largest stockholder and an affiliate of BlackRock, Inc. (“BlackRock”) for 1940 Act purposes.
Investment Advisory: The Trust, on behalf of the Funds, entered into an Investment Advisory Agreement with the Manager, the Funds’ investment adviser, an indirect, wholly-owned subsidiary of BlackRock, to provide investment advisory services. The Manager is responsible for the management of each Fund’s portfolio and provides the personnel, facilities, equipment and certain other services necessary to the operations of each Fund.
For such services, each Fund pays the Manager a monthly fee at an annual rate equal to the following percentages of the average daily value of each Fund’s net asset.
| Average Daily Net Assets | Investment Advisory Fee | |||
First $1 Billion | 0.30% | |||
$1 Billion — $3 Billion | 0.28% | |||
$3 Billion — $5 Billion | 0.27% | |||
Greater than $5 Billion | 0.26% | |||
With respect to the Funds, the Manager entered into separate sub-advisory agreements with BlackRock International Limited (“BIL”), an affiliate of the Manager. The Manager pays BIL, for services it provides, a monthly fee that is a percentage of the investment advisory fees paid by each Fund to the Manager.
Service and Distribution Fees: The Trust, on behalf of the Funds, entered into a Distribution Agreement and a Distribution and Service Plan with BlackRock Investments, LLC (“BRIL”), an affiliate of the Manager. Pursuant to the Distribution and Service Plan and in accordance with Rule 12b-1 under the 1940 Act, each Fund pays BRIL ongoing service and distribution fees. The fees are accrued daily and paid monthly at an annual rate of 0.25% based upon the average daily net assets of each Fund’s Investor A Shares.
| BLACKROCK CORI FUNDS | OCTOBER 31, 2016 | 53 |
| Notes to Financial Statements (continued) |
BRIL and broker-dealers, pursuant to sub-agreements with BRIL, provide shareholder servicing and distribution services to the Funds. The ongoing service and/or distribution fee compensates BRIL and each broker-dealer for providing shareholder servicing and/or distribution related services to the shareholders.
Administration: The Trust, on behalf of the Funds, entered into an Administration Agreement with the Manager, an indirect, wholly-owned subsidiary of BlackRock, to provide administrative services. For these services, the Manager receives an administration fee computed daily and payable monthly, based on a percentage of the average daily net assets of each Fund. The administration fee, which is shown as administration in the Statements of Operations, is paid at the annual rates below.
| Average Daily Net Assets | Administration Fee | |||
First $500 Million | 0.05% | |||
$500 Million — $1 Billion | 0.04% | |||
Greater than $1 Billion | 0.03% | |||
The Manager may have, at its discretion, voluntarily waived all or any portion of its administration fees for the Funds or a share class, which are shown as administration fees waived in the Statements of Operations.
Transfer Agent: Pursuant to written agreements, certain financial intermediaries, some of which may be affiliates, provide the Funds with sub-accounting, recordkeeping, sub-transfer agency and other administrative services with respect to sub-accounts they service. For these services, these entities receive an asset-based fee or an annual fee per shareholder account, which will vary depending on share class and/or net assets.
The Manager maintains a call center that is responsible for providing certain shareholder services to the Funds. Shareholder services include responding to inquiries and processing subscriptions and redemptions based upon instructions from shareholders. For the year ended October 31, 2016, each Fund reimbursed the Manager the following amounts for costs incurred in running the call center, which are included in transfer agent — class specific in the Statements of Operations:
| Institutional | Investor A | Total | ||||||||||
CoRI 2015 Fund | $ | 33 | $ | 26 | $ | 59 | ||||||
CoRI 2017 Fund | $ | 32 | $ | 17 | $ | 49 | ||||||
CoRI 2019 Fund | $ | 34 | $ | 33 | $ | 67 | ||||||
CoRI 2021 Fund | $ | 43 | $ | 29 | $ | 72 | ||||||
CoRI 2023 Fund | $ | 25 | $ | 27 | $ | 52 | ||||||
For the year ended October 31, 2016, the following table shows the class specific transfer agent fees borne directly by each class of each Fund:
| Institutional | Investor A | Total | ||||||||||
CoRI 2015 Fund | $ | 92 | $ | 429 | $ | 521 | ||||||
CoRI 2017 Fund | $ | 39 | $ | 389 | $ | 428 | ||||||
CoRI 2019 Fund | $ | 113 | $ | 772 | $ | 885 | ||||||
CoRI 2021 Fund | $ | 82 | $ | 1,040 | $ | 1,122 | ||||||
CoRI 2023 Fund | $ | 409 | $ | 1,293 | $ | 1,702 | ||||||
Other Fees: For the year ended October 31, 2016, affiliates earned underwriting discounts, direct commissions and dealer concessions on sales of each Fund’s Investor A Shares as follows:
| Investor A | ||||
CoRI 2015 Fund | $ | 110 | ||
CoRI 2017 Fund | $ | 546 | ||
CoRI 2019 Fund | $ | 554 | ||
CoRI 2021 Fund | $ | 727 | ||
CoRI 2023 Fund | $ | 1,143 | ||
Expense Limitations, Waivers, Reimbursements, and Recoupments: With respect to the Fund, the Manager agreed to waive and/or reimburse fees or expenses in order to limit expenses, excluding interest expense, dividend expense, tax expense, acquired fund fees and expenses, and certain other fund expenses, which constitute extraordinary expenses not incurred in the ordinary course of each Fund’s business (“expense limitation”). The expense limitations as a percentage of average daily net assets are as follows:
| Contractual1 | Voluntary2 | |||||||
Institutional | 0.58% | 0.25% | ||||||
Investor A | 0.83% | 0.50% | ||||||
| 1 | The Manager has agreed not to reduce or discontinue this contractual waiver or reimbursement prior to March 1, 2017 unless approved by the Board, including a majority of the non-interested Trustees of the Trust. |
| 2 | The voluntary waiver or reimbursement may be reduced or discontinued at any time. |
| 54 | BLACKROCK CORI FUNDS | OCTOBER 31, 2016 |
| Notes to Financial Statements (continued) | ||||
With respect to each Fund, the Manager voluntarily agreed to waive its investment advisory fees by the amount of investment advisory fees each Fund pays to the Manager indirectly through its investment in affiliated money market funds. These amounts are included in fees waived by the Manager in the Statements of Operations. For the year ended October 31, 2016, the amounts waived were as follows:
| Institutional | Investor A | Total | ||||||||||
CoRI 2015 Fund | $ | 90 | $ | 3 | $ | 93 | ||||||
CoRI 2017 Fund | $ | 125 | $ | 4 | $ | 129 | ||||||
CoRI 2019 Fund | $ | 79 | $ | 6 | $ | 85 | ||||||
CoRI 2021 Fund | $ | 137 | $ | 16 | $ | 153 | ||||||
CoRI 2023 Fund | $ | 124 | $ | 23 | $ | 147 | ||||||
Effective September 1, 2016, the Manager has voluntarily agreed to waive the investment advisory fees with respect to any portion of such Fund’s assets estimated to be attributable to investments in other equity and fixed-income mutual funds and exchange-traded funds managed by the Manager or its affiliates that have a contractual management fee. This voluntary waiver may be reduced or discontinued at any time without notice.
These amounts waived and/or reimbursed are included in fees waived by the Manager, and shown as administration fees waived and transfer agent fees waived and/or reimbursed, respectively, in the Statements of Operations. For the year ended October 31, 2016, the amounts included in fees waived by the Manager were as follows:
| Institutional | Investor A | Total | ||||||||||
CoRI 2015 Fund | $ | 34,095 | $ | 981 | $ | 35,076 | ||||||
CoRI 2017 Fund | $ | 33,832 | $ | 1,018 | $ | 34,850 | ||||||
CoRI 2019 Fund | $ | 34,790 | $ | 2,928 | $ | 37,718 | ||||||
CoRI 2021 Fund | $ | 34,722 | $ | 4,216 | $ | 38,938 | ||||||
CoRI 2023 Fund | $ | 36,223 | $ | 6,006 | $ | 42,229 | ||||||
Class specific expense waivers and/or reimbursements are as follows:
Administration Fees Waived
| Institutional | Investor A | Total | ||||||||||
CoRI 2015 Fund | $ | 5,591 | $ | 158 | $ | 5,749 | ||||||
CoRI 2017 Fund | $ | 5,553 | $ | 158 | $ | 5,711 | ||||||
CoRI 2019 Fund | $ | 5,705 | $ | 477 | $ | 6,182 | ||||||
CoRI 2021 Fund | $ | 5,706 | $ | 692 | $ | 6,398 | ||||||
CoRI 2023 Fund | $ | 5,962 | $ | 969 | $ | 6,931 | ||||||
Transfer Agent Fees Waived and/or Reimbursed
| Institutional | Investor A | Total | ||||||||||
CoRI 2015 Fund | $ | 92 | $ | 429 | $ | 521 | ||||||
CoRI 2017 Fund | $ | 39 | $ | 389 | $ | 428 | ||||||
CoRI 2019 Fund | $ | 113 | $ | 772 | $ | 885 | ||||||
CoRI 2021 Fund | $ | 82 | $ | 1,040 | $ | 1,122 | ||||||
CoRI 2023 Fund | $ | 409 | $ | 1,293 | $ | 1,702 | ||||||
If during a Fund’s fiscal year the operating expenses of a share class, that at any time during the prior two fiscal years received a waiver and/or reimbursement from the Manager, are less than the expense cap for that share class, the Manager is entitled to be reimbursed by such share class up to the lesser of the following expenses:
(a) The amount of fees waived and/or expenses reimbursed during those prior two fiscal years under the agreement.
| (b) | The amount by which the expense limit for that share class exceeds the operating expenses of the share class for the current fiscal year, provided that: |
| • | Each Fund, of which the share class is a part, has more than $50 million in assets for the fiscal year; and |
| • | The Manager or an affiliate continues to serve as a Fund’s investment adviser or administrator. |
In the event the expense cap for a share class is changed subsequent to a fiscal year in which the Manager becomes entitled to reimbursement for fees waived and/or reimbursed, the amount available to reimburse the Manager shall be calculated by reference to the expense cap for that share class in effect at the time the Manager became entitled to receive such reimbursement, rather than the subsequently changed expense cap for that share class.
| BLACKROCK CORI FUNDS | OCTOBER 31, 2016 | 55 |
| Notes to Financial Statements (continued) |
On October 31, 2016, the fund level and class specific waivers and/or reimbursements subject to possible future recoupment under the expense limitation agreement are as follows:
2017 | 2018 | |||||||||||||||||||||||||||||||||||||||
| CoRI 2015 Fund | CoRI 2017 Fund | CoRI 2019 Fund | CoRI 2021 Fund | CoRI 2023 Fund | CoRI 2015 Fund | CoRI 2017 Fund | CoRI 2019 Fund | CoRI 2021 Fund | CoRI 2023 Fund | |||||||||||||||||||||||||||||||
Fund Level | $ | 156,568 | $ | 154,670 | $ | 151,404 | $ | 150,418 | $ | 148,260 | $ | 131,213 | $ | 129,350 | $ | 125,778 | $ | 124,472 | $ | 125,187 | ||||||||||||||||||||
Institutional | $ | 50 | $ | 57 | $ | 130 | $ | 72 | $ | 82 | $ | 91 | $ | 39 | $ | 115 | $ | 82 | $ | 411 | ||||||||||||||||||||
Investor A | $ | 224 | $ | 289 | $ | 476 | $ | 396 | $ | 1,607 | $ | 433 | $ | 393 | $ | 780 | $ | 1,055 | $ | 1,297 | ||||||||||||||||||||
The following fund level and class specific waivers and/or reimbursements previously recorded by the Fund, which were subject to recoupment by the Manager, expired on October 31, 2016:
2016 | ||||||||||||||||||||
| CoRI 2015 Fund | CoRI 2017 Fund | CoRI 2019 Fund | CoRI 2021 Fund | CoRI 2023 Fund | ||||||||||||||||
Fund Level | $ | 151,363 | $ | 151,124 | $ | 150,262 | $ | 150,615 | $ | 150,439 | ||||||||||
Institutional | $ | 180 | $ | 185 | $ | 188 | $ | 180 | $ | 180 | ||||||||||
Investor A | $ | 109 | $ | 89 | $ | 84 | $ | 76 | $ | 75 | ||||||||||
Officers and Trustees: Certain officers and/or trustees of the Trust are officers and/or trustees of BlackRock or its affiliates. The Funds reimburse the Manager for a portion of the compensation paid to the Funds’ Chief Compliance Officer, which is included in Officer and Trustees in the Statements of Operations.
7. Purchases and Sales:
For the year ended October 31, 2016, purchases and sales of investments, excluding short-term securities, were as follows:
| Purchases | CoRI 2015 Fund | CoRI 2017 Fund | CoRI 2019 Fund | CoRI 2021 Fund | CoRI 2023 Fund | |||||||||||||||
Non-U.S. Government Securities | $ | 860,583 | $ | 791,976 | $ | 1,024,762 | $ | 1,825,794 | $ | 2,829,930 | ||||||||||
U.S. Government Securities | 5,189,474 | 4,579,153 | 6,230,933 | 9,967,334 | 12,525,876 | |||||||||||||||
|
|
|
|
|
|
|
|
|
| |||||||||||
Total Purchases | $ | 6,050,057 | $ | 5,371,129 | $ | 7,255,695 | $ | 11,793,128 | $ | 15,355,806 | ||||||||||
|
|
|
|
|
|
|
|
|
| |||||||||||
| Sales | CoRI 2015 Fund | CoRI 2017 Fund | CoRI 2019 Fund | CoRI 2021 Fund | CoRI 2023 Fund | |||||||||||||||
Non-U.S. Government Securities | $ | 988,149 | $ | 1,230,846 | $ | 1,461,652 | $ | 2,272,286 | $ | 3,545,011 | ||||||||||
U.S. Government Securities | 5,038,518 | 4,357,912 | 5,898,628 | 9,473,579 | 12,321,491 | |||||||||||||||
|
|
|
|
|
|
|
|
|
| |||||||||||
Total Sales | $ | 6,026,667 | $ | 5,588,758 | $ | 7,360,280 | $ | 11,745,865 | $ | 15,866,502 | ||||||||||
|
|
|
|
|
|
|
|
|
| |||||||||||
8. Income Tax Information:
It is the Funds’ policy to comply with the requirements of the Internal Revenue Code of 1986, as amended, applicable to regulated investment companies, and to distribute substantially all of their taxable income to their shareholders. Therefore, no federal income tax provision is required.
Each Fund files U.S. federal and various state and local tax returns. No income tax returns are currently under examination. The statute of limitations on each Fund’s U.S. federal tax returns generally remains open for each of the four years ended October 31, 2016. The statutes of limitations on each Fund’s state and local tax returns may remain open for an additional year depending upon the jurisdiction.
Management has analyzed tax laws and regulations and their application to the Funds as of October 31, 2016, inclusive of the open tax return years, and does not believe that there are any uncertain tax positions that require recognition of a tax liability in the Funds’ financial statements.
The tax character of distributions paid was as follows:
| CoRI 2015 Fund | CoRI 2017 Fund | CoRI 2019 Fund | CoRI 2021 Fund | CoRI 2023 Fund | ||||||||||||||||||||
Ordinary income | 10/31/2016 | $ | 384,244 | $ | 415,949 | $ | 525,139 | $ | 501,720 | $ | 559,481 | |||||||||||||
| 10/31/2015 | 359,961 | 396,358 | 512,623 | 471,471 | 476,950 | |||||||||||||||||||
Long-term capital gains | 10/31/2016 | 113,856 | 194,048 | 129,679 | 227,043 | 121,407 | ||||||||||||||||||
| 10/31/2015 | 6,580 | 6,579 | 6,579 | 10,102 | 10,104 | |||||||||||||||||||
|
|
|
|
|
|
|
|
|
|
|
| |||||||||||||
Total | 10/31/2016 | $ | 498,100 | $ | 609,997 | $ | 654,818 | $ | 728,763 | $ | 680,888 | |||||||||||||
|
|
|
|
|
|
|
|
|
|
|
| |||||||||||||
| 10/31/2015 | $ | 366,541 | $ | 402,937 | $ | 519,202 | $ | 481,573 | $ | 487,054 | ||||||||||||||
|
|
|
|
|
|
|
|
|
|
|
| |||||||||||||
| 56 | BLACKROCK CORI FUNDS | OCTOBER 31, 2016 |
| Notes to Financial Statements (continued) | ||||
As of the period end, the tax components of accumulated net earnings were as follows:
| CoRI 2015 Fund | CoRI 2017 Fund | CoRI 2019 Fund | CoRI 2021 Fund | CoRI 2023 Fund | ||||||||||||||||
Undistributed ordinary income | $ | 310,398 | $ | 285,815 | $ | 309,395 | $ | 377,296 | $ | 358,513 | ||||||||||
Undistributed long-term capital gains | 101,326 | 450,741 | 565,231 | 688,004 | 52,831 | |||||||||||||||
Net unrealized gains1 | 1,135,532 | 787,853 | 900,932 | 885,019 | 1,456,283 | |||||||||||||||
|
|
|
|
|
|
|
|
|
| |||||||||||
Total | $ | 1,547,256 | $ | 1,524,409 | $ | 1,775,558 | $ | 1,950,319 | $ | 1,867,627 | ||||||||||
|
|
|
|
|
|
|
|
|
| |||||||||||
| 1 | The differences between book-basis and tax-basis net unrealized gains were attributable primarily to the tax deferral of losses on wash sales and the realization for tax purposes of unrealized losses on certain futures contracts. |
As of October 31, 2016, gross unrealized appreciation and depreciation based on cost for federal income tax purposes were as follows:
| CoRI 2015 Fund | CoRI 2017 Fund | CoRI 2019 Fund | CoRI 2021 Fund | CoRI 2023 Fund | ||||||||||||||||
Tax cost | $ | 10,844,085 | $ | 10,793,816 | $ | 11,697,054 | $ | 11,974,321 | $ | 13,950,009 | ||||||||||
|
|
|
|
|
|
|
|
|
| |||||||||||
Gross unrealized appreciation | $ | 1,161,069 | $ | 832,343 | $ | 947,889 | $ | 953,906 | $ | 1,646,196 | ||||||||||
Gross unrealized depreciation | (25,537 | ) | (44,490 | ) | (46,957 | ) | (68,887 | ) | (189,913 | ) | ||||||||||
|
|
|
|
|
|
|
|
|
| |||||||||||
Net unrealized appreciation | $ | 1,135,532 | $ | 787,853 | $ | 900,932 | $ | 885,019 | $ | 1,456,283 | ||||||||||
|
|
|
|
|
|
|
|
|
| |||||||||||
9. Bank Borrowings:
The Trust, on behalf of the Funds, along with certain other funds managed by the Manager and its affiliates (“Participating Funds”), is a party to a 364-day, $2.1 billion credit agreement with a group of lenders. Under this agreement, the Funds may borrow to fund shareholder redemptions. Excluding commitments designated for certain individual funds, the Participating Funds, including the Funds, can borrow up to an aggregate commitment amount of $1.6 billion at any time outstanding, subject to asset coverage and other limitations as specified in the agreement. The credit agreement has the following terms: a fee of 0.12% per annum on unused commitment amounts and interest at a rate equal to the higher of (a) one-month LIBOR (but, in any event, not less than 0.00%) on the date the loan is made plus 0.80% per annum or (b) the Fed Funds rate (but, in any event, not less than 0.00%) in effect from time to time plus 0.80% per annum on amounts borrowed. The agreement expires in April 2017 unless extended or renewed. Prior to April 21, 2016, the credit agreement had a fee per annum of 0.06% on unused commitment amounts and interest at a rate equal to the higher of (a) one-month LIBOR (but, in any event, not less than 0.00%) on the date the loan is made plus 0.80% per annum or (b) the Fed Funds rate (but, in any event, not less than 0.00%) in effect from time to time plus 0.80% per annum on amounts borrowed. Participating Funds paid administration, legal and arrangement fees, which, if applicable, are included in miscellaneous expenses in the Statements of Operations. These fees were allocated among such funds based upon portions of the aggregate commitment available to them and relative net assets of Participating Funds. During the year ended October 31, 2016, the Funds did not borrow under the credit agreement.
10. Principal Risks:
In the normal course of business, the Funds invest in securities and enter into transactions where risks exist due to fluctuations in the market (market risk) or failure of the issuer to meet all its obligations, including the ability to pay principal and interest when due (issuer credit risk). The value of securities held by the Funds may decline in response to certain events, including those directly involving the issuers of securities owned by the Funds. Changes arising from the general economy, the overall market and local, regional or global political and/or social instability, as well as currency, interest rate and price fluctuations, may also affect the securities’ value.
Each Fund may be exposed to prepayment risk, which is the risk that borrowers may exercise their option to prepay principal earlier than scheduled during periods of declining interest rates, which would force each Fund to reinvest in lower yielding securities. Each Fund may also be exposed to reinvestment risk, which is the risk that income from each Fund’s portfolio will decline if each Fund invests the proceeds from matured, traded or called fixed income securities at market interest rates that are below each Fund portfolio’s current earnings rate.
Counterparty Credit Risk: Similar to issuer credit risk, the Funds may be exposed to counterparty credit risk, or the risk that an entity may fail to or be unable to perform on its commitments related to unsettled or open transactions. The Funds manage counterparty credit risk by entering into transactions only with counterparties that the Manager believes have the financial resources to honor their obligations and by monitoring the financial stability of those counterparties. Financial assets, which potentially expose the Funds to market, issuer and counterparty credit risks, consist principally of financial instruments and receivables due from counterparties. The extent of the Funds’ exposure to market, issuer and counterparty credit risks with respect to these financial assets is approximately their value recorded in the Statements of Assets and Liabilities, less any collateral held by the Funds.
A derivative contract may suffer a mark-to-market loss if the value of the contract decreases due to an unfavorable change in the market rates or values of the underlying instrument. Losses can also occur if the counterparty does not perform under the contract.
| BLACKROCK CORI FUNDS | OCTOBER 31, 2016 | 57 |
| Notes to Financial Statements (continued) |
With exchange-traded futures, there is less counterparty credit risk to the Funds since the exchange or clearinghouse, as counterparty to such instruments, guarantees against a possible default. The clearinghouse stands between the buyer and the seller of the contract; therefore, credit risk is limited to failure of the clearinghouse. While offset rights may exist under applicable law, a Fund does not have a contractual right of offset against a clearing broker or clearinghouse in the event of a default (including the bankruptcy or insolvency). Additionally, credit risk exists in exchange-traded futures with respect to initial and variation margin that is held in a clearing broker’s customer accounts. While clearing brokers are required to segregate customer margin from their own assets, in the event that a clearing broker becomes insolvent or goes into bankruptcy and at that time there is a shortfall in the aggregate amount of margin held by the clearing broker for all its clients, typically the shortfall would be allocated on a pro rata basis across all the clearing broker’s customers, potentially resulting in losses to the Funds.
Concentration Risk: Certain Funds invest a significant portion of their assets in fixed income securities and/or use derivatives tied to the fixed income markets. Changes in market interest rates or economic conditions may affect the value and/or liquidity of such investments. Interest rate risk is the risk that prices of bonds and other fixed income securities will increase as interest rates fall and decrease as interest rates rise. The Funds may be subject to a greater risk of rising interest rates due to the current period of historically low rates.
11. Capital Share Transactions:
Transactions in capital shares for each class were as follows:
| Year Ended October 31, 2016 | Year Ended October 31, 2015 | |||||||||||||||||||
| CoRI 2015 Fund | Shares | Amount | Shares | Amount | ||||||||||||||||
| Institutional | ||||||||||||||||||||
Shares sold | 18,156 | $ | 199,993 | — | — | |||||||||||||||
Shares issued to shareholders in reinvestment of distributions | — | — | — | — | ||||||||||||||||
Shares redeemed | (12,980 | ) | (154,628 | ) | — | — | ||||||||||||||
|
|
|
| |||||||||||||||||
Net increase | 5,176 | $ | 45,365 | — | — | |||||||||||||||
|
|
|
| |||||||||||||||||
| Investor A | ||||||||||||||||||||
Shares sold | 20,953 | $ | 237,334 | 17,145 | $ | 190,231 | ||||||||||||||
Shares issued to shareholders in reinvestment of distributions | 818 | 8,601 | 134 | 1,470 | ||||||||||||||||
Shares redeemed | (6,997 | ) | (78,549 | ) | (1,777 | ) | (19,705 | ) | ||||||||||||
|
|
|
| |||||||||||||||||
Net increase | 14,774 | $ | 167,386 | 15,502 | $ | 171,996 | ||||||||||||||
|
|
|
| |||||||||||||||||
Total Net Increase | 19,950 | $ | 212,751 | 15,502 | $ | 171,996 | ||||||||||||||
|
|
|
| |||||||||||||||||
| Year Ended October 31, 2016 | Year Ended October 31, 2015 | |||||||||||||||||||
| CoRI 2017 Fund | Shares | Amount | Shares | Amount | ||||||||||||||||
| Institutional | ||||||||||||||||||||
Shares sold | — | — | — | — | ||||||||||||||||
Shares issued to shareholders in reinvestment of distributions | — | — | 33 | $ | 373 | |||||||||||||||
Shares redeemed | — | — | (971 | ) | (10,917 | ) | ||||||||||||||
|
|
|
| |||||||||||||||||
Net increase (decrease) | — | — | (938 | ) | $ | (10,544 | ) | |||||||||||||
|
|
|
| |||||||||||||||||
| Investor A | ||||||||||||||||||||
Shares sold | 41,279 | $ | 469,395 | 15,110 | $ | 169,628 | ||||||||||||||
Shares issued to shareholders in reinvestment of distributions | 1,091 | 11,492 | 459 | 5,155 | ||||||||||||||||
Shares redeemed | (43,179 | ) | (492,402 | ) | (10,721 | ) | (116,871 | ) | ||||||||||||
|
|
|
| |||||||||||||||||
Net increase (decrease) | (809 | ) | $ | (11,515 | ) | 4,848 | $ | 57,912 | ||||||||||||
|
|
|
| |||||||||||||||||
Total Net Increase (Decrease) | (809 | ) | $ | (11,515 | ) | 3,910 | $ | 47,368 | ||||||||||||
|
|
|
| |||||||||||||||||
| Year Ended October 31, 2016 | Year Ended October 31, 2015 | |||||||||||||||||||
| CoRI 2019 Fund | Shares | Amount | Shares | Amount | ||||||||||||||||
| Institutional | ||||||||||||||||||||
Shares sold | 1,505 | $ | 17,857 | 549 | $ | 6,348 | ||||||||||||||
Shares issued to shareholders in reinvestment of distributions | 642 | 6,830 | 538 | 6,145 | ||||||||||||||||
Shares redeemed | (3,508 | ) | (40,111 | ) | (1,768 | ) | (20,879 | ) | ||||||||||||
|
|
|
| |||||||||||||||||
Net decrease | (1,361 | ) | $ | (15,424 | ) | (681 | ) | $ | (8,386 | ) | ||||||||||
|
|
|
| |||||||||||||||||
| Investor A | ||||||||||||||||||||
Shares sold | 73,528 | $ | 853,402 | 48,802 | $ | 554,434 | ||||||||||||||
Shares issued to shareholders in reinvestment of distributions | 3,582 | 38,146 | 726 | 8,301 | ||||||||||||||||
Shares redeemed | (64,393 | ) | (745,482 | ) | (10,404 | ) | (117,462 | ) | ||||||||||||
|
|
|
| |||||||||||||||||
Net increase | 12,717 | $ | 146,066 | 39,124 | $ | 445,273 | ||||||||||||||
|
|
|
| |||||||||||||||||
Total Net Increase | 11,356 | $ | 130,642 | 38,443 | $ | 436,887 | ||||||||||||||
|
|
|
| |||||||||||||||||
| 58 | BLACKROCK CORI FUNDS | OCTOBER 31, 2016 |
| Notes to Financial Statements (concluded) | ||||
| Year Ended October 31, 2016 | Year Ended October 31, 2015 | |||||||||||||||||||
| CoRI 2021 Fund | Shares | Amount | Shares | Amount | ||||||||||||||||
| Institutional | ||||||||||||||||||||
Shares sold | 906 | $ | 10,800 | 103 | $ | 1,200 | ||||||||||||||
Shares issued to shareholders in reinvestment of distributions | 18 | 191 | 7 | 79 | ||||||||||||||||
Shares redeemed | (356 | ) | (4,395 | ) | — | — | ||||||||||||||
|
|
|
| |||||||||||||||||
Net increase | 568 | $ | 6,596 | 110 | $ | 1,279 | ||||||||||||||
|
|
|
| |||||||||||||||||
| Investor A | ||||||||||||||||||||
Shares sold | 231,515 | $ | 2,639,995 | 40,031 | $ | 467,191 | ||||||||||||||
Shares issued to shareholders in reinvestment of distributions | 3,348 | 35,526 | 417 | 4,826 | ||||||||||||||||
Shares redeemed | (196,571 | ) | (2,302,677 | ) | (3,884 | ) | (44,051 | ) | ||||||||||||
|
|
|
| |||||||||||||||||
Net increase | 38,292 | $ | 372,844 | 36,564 | $ | 427,966 | ||||||||||||||
|
|
|
| |||||||||||||||||
Total Net Increase | 38,860 | $ | 379,440 | 36,674 | $ | 429,245 | ||||||||||||||
|
|
|
| |||||||||||||||||
| Year Ended October 31, 2016 | Year Ended October 31, 2015 | |||||||||||||||||||
| CoRI 2023 Fund | Shares | Amount | Shares | Amount | ||||||||||||||||
| Institutional | ||||||||||||||||||||
Shares sold | 40,589 | $ | 501,037 | 82,739 | $ | 954,056 | ||||||||||||||
Shares issued to shareholders in reinvestment of distributions | — | — | 51 | 598 | ||||||||||||||||
Shares redeemed | (108,799 | ) | (1,257,105 | ) | (1,312 | ) | (15,256 | ) | ||||||||||||
|
|
|
| |||||||||||||||||
Net increase (decrease) | (68,210 | ) | $ | (756,068 | ) | 81,478 | $ | 939,398 | ||||||||||||
|
|
|
| |||||||||||||||||
| Investor A | ||||||||||||||||||||
Shares sold | 349,258 | $ | 4,427,853 | 307,705 | $ | 3,695,912 | ||||||||||||||
Shares issued to shareholders in reinvestment of distributions | 11,712 | 127,192 | 1,043 | 12,318 | ||||||||||||||||
Shares redeemed | (348,624 | ) | (4,000,699 | ) | (98,655 | ) | (1,154,538 | ) | ||||||||||||
|
|
|
| |||||||||||||||||
Net increase | 12,346 | $ | 554,346 | 210,093 | $ | 2,553,692 | ||||||||||||||
|
|
|
| |||||||||||||||||
Total Net Increase (Decrease) | (55,864 | ) | $ | (201,722 | ) | 291,571 | $ | 3,493,090 | ||||||||||||
|
|
|
| |||||||||||||||||
At October 31, 2016, shares owned by BlackRock HoldCo 2, Inc., an affiliate of the Funds, were as follows:
| CoRI 2015 Fund | CoRI 2017 Fund | CoRI 2019 Fund | CoRI 2021 Fund | CoRI 2023 Fund | ||||||||||||||||
Institutional | 998,000 | 998,000 | 998,000 | 998,000 | 998,000 | |||||||||||||||
Investor A | 2,000 | 2,000 | 2,000 | 2,000 | 2,000 | |||||||||||||||
12. Subsequent Events:
Management has evaluated the impact of all subsequent events on the Funds through the date the financial statements were issued and has determined that there were no subsequent events requiring adjustment or additional disclosure in the financial statements.
| BLACKROCK CORI FUNDS | OCTOBER 31, 2016 | 59 |
| Report of Independent Registered Public Accounting Firm | ||
To the Shareholders of BlackRock CoRI 2015 Fund, BlackRock CoRI 2017 Fund, BlackRock CoRI 2019 Fund,
BlackRock CoRI 2021 Fund, and BlackRock CoRI 2023 Fund and the Board of Trustees of BlackRock CoRI Funds:
We have audited the accompanying statements of assets and liabilities, including the schedules of investments, of BlackRock CoRI 2015 Fund, BlackRock CoRI 2017 Fund, BlackRock CoRI 2019 Fund, BlackRock CoRI 2021 Fund, and BlackRock CoRI 2023 Fund (collectively, the “Funds”), each a series of BlackRock CoRI Funds, as of October 31, 2016, and the related statements of operations for the year then ended, the statements of changes in net assets for each of the two years in the period then ended, and the financial highlights for each of the periods presented. These financial statements and financial highlights are the responsibility of the Funds’ management. Our responsibility is to express an opinion on these financial statements and financial highlights based on our audits.
We conducted our audits in accordance with the standards of the Public Company Accounting Oversight Board (United States). Those standards require that we plan and perform the audit to obtain reasonable assurance about whether the financial statements and financial highlights are free of material misstatement. The Funds are not required to have, nor were we engaged to perform, an audit of their internal control over financial reporting. Our audits included consideration of internal control over financial reporting as a basis for designing audit procedures that are appropriate in the circumstances, but not for the purpose of expressing an opinion on the effectiveness of the Funds’ internal control over financial reporting.
Accordingly, we express no such opinion. An audit also includes examining, on a test basis, evidence supporting the amounts and disclosures in the financial statements, assessing the accounting principles used and significant estimates made by management, as well as evaluating the overall financial statement presentation. Our procedures included confirmation of securities owned as of October 31, 2016, by correspondence with the custodian and brokers; when replies were not received from brokers, we performed other auditing procedures. We believe that our audits provide a reasonable basis for our opinion.
In our opinion, the financial statements and financial highlights referred to above present fairly, in all material respects, the financial position of BlackRock CoRI 2015 Fund, BlackRock CoRI 2017 Fund, BlackRock CoRI 2019 Fund, BlackRock CoRI 2021 Fund, and BlackRock CoRI 2023 Fund as of October 31, 2016, the results of their operations for the year then ended, the changes in their net assets for each of the two years in the period then ended, and the financial highlights for each of the periods presented, in conformity with accounting principles generally accepted in the United States of America.
Deloitte & Touche LLP
December 22, 2016
| Important Tax Information (Unaudited) |
During the fiscal year ended October 31, 2016, the following information is provided with respect to distributions paid.
| Payable Date | Federal Obligation Interest1 | Interest-Related Dividends and Qualified Short-Term Capital Gains for non-U.S. Residents2 | Long-Term Capital Gain Per Share | |||||||||||||
CoRI 2015 Fund | 12/23/2015 | 43.01% | 93.48% | $0.111815 | ||||||||||||
CoRI 2017 Fund | 12/23/2015 | 44.85% | 94.32% | $0.190260 | ||||||||||||
CoRI 2019 Fund | 12/23/2015 | 39.34% | 95.54% | $0.120586 | ||||||||||||
CoRI 2021 Fund | 12/23/2015 | 40.50% | 94.90% | $0.215657 | ||||||||||||
CoRI 2023 Fund | 12/23/2015 | 46.45% | 93.63% | $0.097853 | ||||||||||||
| 1 | The law varies in each state as to whether and what percentage of dividend income attributable to federal obligations is exempt from state income tax. We recommend that you consult your tax advisor to determine if any portion of the dividends you received is exempt from state income taxes |
| 2 | Represents the portion of the taxable ordinary income dividends eligible for exemption from U.S. withholding tax for nonresident aliens and foreign corporations. |
| 60 | BLACKROCK CORI FUNDS | OCTOBER 31, 2016 |
| Disclosure of Investment Advisory Agreement and Sub-Advisory Agreement |
The Board of Trustees (the “Board,” the members of which are referred to as “Board Members”) of BlackRock CoRI Funds (the “Trust”) met in person on April 12, 2016 (the “April Meeting”) and May 10-11, 2016 (the “May Meeting”) to consider the approval of the investment advisory agreement (the “Advisory Agreement”) between the Trust, on behalf of BlackRock CoRI 2015 Fund (the “2015 Fund”), BlackRock CoRI 2017 Fund (the “2017 Fund”), BlackRock CoRI 2019 Fund (the “2019 Fund”), BlackRock CoRI 2021 Fund (the “2021 Fund”) and BlackRock CoRI 2023 Fund (the “2023 Fund”) (each, a “Fund,” and collectively, the “Funds”), each a series of the Trust, and BlackRock Advisors, LLC (the “Manager”), each Fund’s investment advisor. The Board also considered the approval of the sub-advisory agreement (the “Sub-Advisory Agreement”) between the Manager and BlackRock International Limited (the “Sub-Advisor”), with respect to the Funds. The Manager and the Sub-Advisor are referred to herein as “BlackRock”. The Advisory Agreement and the Sub-Advisory Agreement are referred to herein as the “Agreements”.
Activities and Composition of the Board
On the date of the May Meeting, the Board consisted of thirteen individuals, ten of whom were not “interested persons” of the Trust as defined in the Investment Company Act of 1940, as amended (the “1940 Act”) (the “Independent Board Members”). One of the Board Members is a non-management interested Board Member by virtue of his former positions with BlackRock, Inc. and its affiliates. The Board Members are responsible for the oversight of the operations of the Funds and perform the various duties imposed on the directors of investment companies by the 1940 Act. The Independent Board Members have retained independent legal counsel to assist them in connection with their duties. The Chair of the Board is an Independent Board Member. The Board has established five standing committees: an Audit Committee, a Governance and Nominating Committee, a Compliance Committee, a Performance Oversight Committee and an Executive Committee, each of which is chaired by an Independent Board Member and composed of Independent Board Members (except for the Performance Oversight Committee and the Executive Committee, each of which also has one interested Board Member).
The Agreements
Pursuant to the 1940 Act, the Board is required to consider the continuation of the Agreements on an annual basis. The Board has four quarterly meetings per year, each extending over two days, a fifth one-day meeting to consider specific information surrounding the consideration of renewing the Agreements and additional in-person and telephonic meetings as needed. In connection with this year-long deliberative process, the Board assessed, among other things, the nature, extent and quality of the services provided to each Fund by BlackRock, BlackRock’s personnel and affiliates, including (as applicable): investment management; administrative and shareholder services; the oversight of fund service providers; marketing; risk oversight; compliance; and ability to meet applicable legal and regulatory requirements.
The Board, acting directly and through its committees, considers at each of its meetings, and from time to time as appropriate, factors that are relevant to its annual consideration of the renewal of the Agreements, including the services and support provided by BlackRock to each Fund and its shareholders. BlackRock also furnished additional information to the Board in response to specific questions from the Board. This additional information is discussed further below in the section titled “Board Considerations in Approving the Agreements.” Among the matters the Board considered were: (a) investment performance for one-year, three-year, five-year, ten-year, and/or since inception periods, as applicable, against peer funds, applicable benchmark, and performance metrics, as applicable, as well as senior management’s and portfolio managers’ analysis of the reasons for any over-performance or underperformance relative to its peers, benchmarks, and other performance metrics, as applicable; (b) fees, including advisory, administration, if applicable, and other amounts paid to BlackRock and its affiliates by each Fund for services; (c) Fund operating expenses and how BlackRock allocates expenses to each Fund; (d) the resources devoted to, risk oversight of, and compliance reports relating to, implementation of each Fund’s investment objective(s), policies and restrictions, and meeting regulatory requirements; (e) each Fund’s compliance with its compliance policies and procedures; (f) the nature, cost and character of non-investment management services provided by BlackRock and its affiliates; (g) BlackRock’s and other service providers’ internal controls and risk and compliance oversight mechanisms; (h) BlackRock’s implementation of the proxy voting policies approved by the Board; (i) execution quality of portfolio transactions; (j) BlackRock’s implementation of each Fund’s valuation and liquidity procedures; (k) an analysis of management fees for products with similar investment mandates across the open-end fund, exchange-traded fund (“ETF”), closed-end fund and institutional account product channels, as applicable, and the similarities and differences between these products and the services provided as compared to each Fund; (l) BlackRock’s compensation methodology for its investment professionals and the incentives and accountability it creates, along with investment professionals’ investments in the fund(s) they manage; and (m) periodic updates on BlackRock’s business.
Board Considerations in Approving the Agreements
The Approval Process: Prior to the April Meeting, the Board requested and received materials specifically relating to the Agreements. The Board is continuously engaged in a process with its independent legal counsel and BlackRock to review the nature and scope of the information provided to better assist its deliberations. The materials provided in connection with the April Meeting included (a) information independently compiled and prepared by Broadridge Financial Solutions, Inc. (“Broadridge”) on Fund fees and expenses as compared with a peer group of funds as determined by Broadridge (“Expense Peers”) and the investment performance of each Fund as compared with a peer group of funds as determined by Broadridge1; (b) information on the profits realized by BlackRock and its affiliates pursuant to the Agreements and a discussion of fall-out benefits to BlackRock and its affiliates; (c) a general analysis provided by BlackRock concerning investment management fees charged to other clients, such as institutional clients, sub-advised mutual
| 1 | Funds are ranked by Broadridge in quartiles, ranging from first to fourth, where first is the most desirable quartile position and fourth is the least desirable. |
| BLACKROCK CORI FUNDS | OCTOBER 31, 2016 | 61 |
| Disclosure of Investment Advisory Agreement and Sub-Advisory Agreement (continued) | ||||
funds, ETFs and closed-end funds, under similar investment mandates, as well as the performance of such other clients, as applicable; (d) review of non-management fees; (e) the existence, impact and sharing of potential economies of scale; (f) a summary of aggregate amounts paid by each Fund to BlackRock; and (g) sales and redemption data regarding each Fund’s shares.
At the April Meeting, the Board reviewed materials relating to its consideration of the Agreements. As a result of the discussions that occurred during the April Meeting, and as a culmination of the Board’s year-long deliberative process, the Board presented BlackRock with questions and requests for additional information. BlackRock responded to these requests with additional written information in advance of the May Meeting.
At the May Meeting, the Board, including the Independent Board Members, approved the continuation of the Advisory Agreement between the Manager and the Trust, on behalf of each Fund, and the Sub-Advisory Agreement between the Manager and the Sub-Advisor, with respect to each Fund, each for a one-year term ending June 30, 2017. In approving the continuation of the Agreements, the Board considered: (a) the nature, extent and quality of the services provided by BlackRock; (b) the investment performance of each Fund; (c) the advisory fee and the cost of the services and profits to be realized by BlackRock and its affiliates from their relationship with each Fund; (d) each Fund’s costs to investors compared to the costs of Expense Peers and performance compared to the relevant performance metrics as previously discussed; (e) the sharing of potential economies of scale; (f) fall-out benefits to BlackRock and its affiliates as a result of its relationship with each Fund; and (g) other factors deemed relevant by the Board Members.
The Board also considered other matters it deemed important to the approval process, such as other payments made to BlackRock or its affiliates, securities lending and cash management, services related to the valuation and pricing of Fund portfolio holdings, and materials submitted for the Board’s review. The Board noted the willingness of BlackRock personnel to engage in open, candid discussions with the Board. The Board did not identify any particular information as determinative, and each Board Member may have attributed different weights to the various items considered.
A. Nature, Extent and Quality of the Services Provided by BlackRock: The Board, including the Independent Board Members, reviewed the nature, extent and quality of services provided by BlackRock, including the investment advisory services and the resulting performance of each Fund. Throughout the year, the Board compared Fund performance to the performance of a comparable group of mutual funds, a relevant benchmark, and performance metrics, as applicable. The Board met with BlackRock’s senior management personnel responsible for investment activities, including the senior investment officers. The Board also reviewed the materials provided by each Fund’s portfolio management team discussing the Fund’s performance and the Fund’s investment objective(s), strategies and outlook.
The Board considered, among other factors, with respect to BlackRock: the number, education and experience of investment personnel generally and each Fund’s portfolio management team; BlackRock’s research capabilities; investments by portfolio managers in the funds they manage; portfolio trading capabilities; use of technology; commitment to compliance; credit analysis capabilities; risk analysis and oversight capabilities; and the approach to training and retaining portfolio managers and other research, advisory and management personnel. The Board engaged in a review of BlackRock’s compensation structure with respect to each Fund’s portfolio management team and BlackRock’s ability to attract and retain high-quality talent and create performance incentives.
In addition to investment advisory services, the Board considered the quality of the administrative and other non-investment advisory services provided to each Fund. BlackRock and its affiliates provide each Fund with certain administrative, shareholder and other services (in addition to any such services provided to the Fund by third parties) and officers and other personnel as are necessary for the operations of the Fund. In particular, BlackRock and its affiliates provide each Fund with administrative services including, among others: (i) preparing disclosure documents, such as the prospectus, the summary prospectus (as applicable), the statement of additional information and periodic shareholder reports; (ii) oversight of daily accounting and pricing; (iii) preparing periodic filings with regulators; (iv) overseeing and coordinating the activities of other service providers; (v) organizing Board meetings and preparing the materials for such Board meetings; (vi) providing legal and compliance support; (vii) furnishing analytical and other support to assist the Board in its consideration of strategic issues such as the merger, consolidation or repurposing of certain open-end funds; and (viii) performing other administrative functions necessary for the operation of each Fund, such as tax reporting, fulfilling regulatory filing requirements and call center services. The Board reviewed the structure and duties of BlackRock’s fund administration, shareholder services, and legal & compliance departments and considered BlackRock’s policies and procedures for assuring compliance with applicable laws and regulations.
B. The Investment Performance of each Fund and BlackRock: The Board, including the Independent Board Members, also reviewed and considered the performance history of each Fund. In preparation for the April Meeting, the Board was provided with reports independently prepared by Broadridge, which included a comprehensive analysis of each Fund’s performance. The Board also reviewed a narrative and statistical analysis of the Broadridge data that was prepared by BlackRock. In connection with its review, the Board received and reviewed information regarding the investment performance of each Fund as compared to other funds in its applicable Broadridge category. The Board was provided with a description of the methodology used by Broadridge to select peer funds and periodically meets with Broadridge representatives to review its methodology. The Board was provided with information on the composition of the Broadridge performance universes and expense universes. The Board and its Performance Oversight Committee regularly review, and meet with Fund management to discuss, the performance of each Fund throughout the year.
In evaluating performance, the Board recognized that the performance data reflects a snapshot of a period as of a particular date and that selecting a different performance period could produce significantly different results. Further, the Board recognized that it is possible that long-term performance can
| 62 | BLACKROCK CORI FUNDS | OCTOBER 31, 2016 |
| Disclosure of Investment Advisory Agreement and Sub-Advisory Agreement (continued) | ||
be adversely affected by even one period of significant underperformance so that a single investment decision or theme has the ability to affect long-term performance disproportionately.
The Board noted that for the one-year and since-inception periods reported, the 2015 Fund ranked in the second and first quartiles, respectively, against its Broadridge Performance Universe.
The Board noted that for the one-year and since-inception periods reported, the 2017 Fund ranked in the third and first quartiles, respectively, against its Broadridge Performance Universe. The Board and BlackRock reviewed and discussed the reasons for the 2017 Fund’s underperformance during the one-year period.
The Board noted that for the one-year and since-inception periods reported, the 2019 Fund ranked in the fourth and first quartiles, respectively, against its Broadridge Performance Universe. The Board and BlackRock reviewed and discussed the reasons for the 2019 Fund’s underperformance during the one-year period.
The Board noted that for the one-year and since-inception periods reported, the 2021 Fund ranked in the fourth and first quartiles, respectively, against its Broadridge Performance Universe. The Board and BlackRock reviewed and discussed the reasons for the 2021 Fund’s underperformance during the one-year period.
The Board noted that for the one-year and since-inception periods reported, the 2023 Fund ranked in the fourth and first quartiles, respectively, against its Broadridge Performance Universe. The Board and BlackRock reviewed and discussed the reasons for the 2023 Fund’s underperformance during the one-year period.
C. Consideration of the Advisory/Management Fees and the Cost of the Services and Profits to be Realized by BlackRock and its Affiliates from their Relationship with each Fund: The Board, including the Independent Board Members, reviewed each Fund’s contractual management fee rate compared with the other funds in its Broadridge category. The contractual management fee rate represents a combination of the advisory fee and any administrative fees, before taking into account any reimbursements or fee waivers. The Board also compared each Fund’s total expense ratio, as well as its actual management fee rate, to those of other funds in its Broadridge category. The total expense ratio represents a fund’s total net operating expenses, including any 12b-1 or non 12b-1 service fees. The total expense ratio gives effect to any expense reimbursements or fee waivers that benefit a fund, and the actual management fee rate gives effect to any management fee reimbursements or waivers that benefit a fund. The Board considered the services provided and the fees charged by BlackRock and its affiliates to other types of clients with similar investment mandates, as applicable, including institutional accounts and sub-advised mutual funds (including mutual funds sponsored by third parties).
The Board received and reviewed statements relating to BlackRock’s financial condition. The Board reviewed BlackRock’s profitability methodology and was also provided with a profitability analysis that detailed the revenues earned and the expenses incurred by BlackRock for services provided to each Fund. The Board reviewed BlackRock’s profitability with respect to each Fund and other funds the Board currently oversees for the year ended December 31, 2015 compared to available aggregate profitability data provided for the prior two years. The Board reviewed BlackRock’s profitability with respect to certain other U.S. fund complexes managed by the Manager and/or its affiliates. The Board reviewed BlackRock’s assumptions and methodology of allocating expenses in the profitability analysis, noting the inherent limitations in allocating costs among various advisory products. The Board recognized that profitability may be affected by numerous factors including, among other things, fee waivers and expense reimbursements by the Manager, the types of funds managed, precision of expense allocations and business mix. As a result, calculating and comparing profitability at individual fund level is difficult.
The Board noted that, in general, individual fund or product line profitability of other advisors is not publicly available. The Board reviewed BlackRock’s overall operating margin, in general, compared to that of certain other publicly-traded asset management firms. The Board considered the differences between BlackRock and these other firms, including the contribution of technology at BlackRock, BlackRock’s expense management, and the relative product mix.
In addition, the Board considered the cost of the services provided to each Fund by BlackRock, and BlackRock’s and its affiliates’ profits relating to the management and distribution of each Fund and the other funds advised by BlackRock and its affiliates. As part of its analysis, the Board reviewed BlackRock’s methodology in allocating its costs of managing the Funds, to each Fund. The Board may receive and review information from independent third parties as part of its annual evaluation. The Board considered whether BlackRock has the financial resources necessary to attract and retain high quality investment management personnel to perform its obligations under the Agreements and to continue to provide the high quality of services that is expected by the Board. The Board further considered factors including but not limited to BlackRock’s commitment of time, assumption of risk, and liability profile in servicing each Fund in contrast to what is required of BlackRock with respect to other products with similar investment mandates across the open-end fund, ETF, closed-end fund, sub-advised mutual fund and institutional account product channels, as applicable.
The Board noted that the 2015 Fund’s contractual management fee rate ranked in the first quartile, and that the actual management fee rate and total expense ratio each ranked in the first quartile, relative to the Fund’s Expense Peers. The Board also noted that the 2015 Fund has an advisory fee arrangement that includes breakpoints that adjust the fee rate downward as the size of the Fund increases above certain contractually specified levels. The
| BLACKROCK CORI FUNDS | OCTOBER 31, 2016 | 63 |
| Disclosure of Investment Advisory Agreement and Sub-Advisory Agreement (continued) | ||||
Board further noted that BlackRock has contractually and/or voluntarily agreed to a cap on the 2015 Fund’s total expenses as a percentage of the Fund’s average daily net assets on a class-by-class basis.
The Board noted that the 2017 Fund’s contractual management fee rate ranked in the first quartile, and that the actual management fee rate and total expense ratio each ranked in the first quartile, relative to the Fund’s Expense Peers. The Board also noted that the 2017 Fund has an advisory fee arrangement that includes breakpoints that adjust the fee rate downward as the size of the Fund increases above certain contractually specified levels. The Board further noted that BlackRock has contractually and/or voluntarily agreed to a cap on the 2017 Fund’s total expenses as a percentage of the Fund’s average daily net assets on a class-by-class basis.
The Board noted that the 2019 Fund’s contractual management fee rate ranked in the first quartile, and that the actual management fee rate and total expense ratio each ranked in the first quartile, relative to the Fund’s Expense Peers. The Board also noted that the 2019 Fund has an advisory fee arrangement that includes breakpoints that adjust the fee rate downward as the size of the Fund increases above certain contractually specified levels. The Board further noted that BlackRock has contractually and/or voluntarily agreed to a cap on the 2019 Fund’s total expenses as a percentage of the Fund’s average daily net assets on a class-by-class basis.
The Board noted that the 2021 Fund’s contractual management fee rate ranked in the first quartile, and that the actual management fee rate and total expense ratio each ranked in the first quartile, relative to the Fund’s Expense Peers. The Board also noted that the 2021 Fund has an advisory fee arrangement that includes breakpoints that adjust the fee rate downward as the size of the Fund increases above certain contractually specified levels. The Board further noted that BlackRock has contractually and/or voluntarily agreed to a cap on the 2021 Fund’s total expenses as a percentage of the Fund’s average daily net assets on a class-by-class basis.
The Board noted that the 2023 Fund’s contractual management fee rate ranked in the first quartile, and that the actual management fee rate and total expense ratio each ranked in the first quartile, relative to the Fund’s Expense Peers. The Board also noted that the 2023 Fund has an advisory fee arrangement that includes breakpoints that adjust the fee rate downward as the size of the Fund increases above certain contractually specified levels. The Board further noted that BlackRock has contractually and/or voluntarily agreed to a cap on the 2023 Fund’s total expenses as a percentage of the Fund’s average daily net assets on a class-by-class basis.
D. Economies of Scale: The Board, including the Independent Board Members, considered the extent to which economies of scale might be realized as the assets of each Fund increase, as well as the existence of expense caps, as applicable. The Board also considered the extent to which each Fund benefits from such economies in a variety of ways, and whether there should be changes in the advisory fee rate or breakpoint structure in order to enable each Fund to more fully participate in these economies of scale. The Board considered each Fund’s asset levels and whether the current fee schedule was appropriate. In its consideration, the Board Members took into account the existence of any expense caps and further considered the continuation and/or implementation, as applicable, of such caps.
E. Other Factors Deemed Relevant by the Board Members: The Board, including the Independent Board Members, also took into account other ancillary or “fall-out” benefits that BlackRock or its affiliates may derive from their respective relationships with each Fund, both tangible and intangible, such as BlackRock’s ability to leverage its investment professionals who manage other portfolios and risk management personnel, an increase in BlackRock’s profile in the investment advisory community, and the engagement of BlackRock’s affiliates as service providers to each Fund, including for administrative, distribution, securities lending and cash management services. The Board also considered BlackRock’s overall operations and its efforts to expand the scale of, and improve the quality of, its operations. The Board also noted that BlackRock may use and benefit from third party research obtained by soft dollars generated by certain registered fund transactions to assist in managing all or a number of its other client accounts. The Board further noted that it had considered the investment by BlackRock’s funds in affiliated ETFs without any offset against the management fees payable by the funds to BlackRock.
In connection with its consideration of the Agreements, the Board also received information regarding BlackRock’s brokerage and soft dollar practices. The Board received reports from BlackRock which included information on brokerage commissions and trade execution practices throughout the year.
The Board noted the competitive nature of the open-end fund marketplace, and that shareholders are able to redeem their Fund shares if they believe that each Fund’s fees and expenses are too high or if they are dissatisfied with the performance of each Fund.
Conclusion
The Board, including the Independent Board Members, approved the continuation of the Advisory Agreement between the Manager and the Trust, on behalf of each Fund, for a one-year term ending June 30, 2017, and the Sub-Advisory Agreement between the Manager and the Sub-Advisor, with respect to the Funds, for a one-year term ending June 30, 2017. Based upon its evaluation of all of the aforementioned factors in their totality, as well as other information, the Board, including the Independent Board Members, was satisfied that the terms of the Agreements were fair and reasonable and in the best interest of each Fund and its shareholders. In arriving at its decision to approve the Agreements, the Board did not identify any single factor or group of factors as all-important or controlling, but considered all factors together, and different Board Members may have attributed different weights to the various factors considered. The Independent Board Members were also assisted by the advice of independent legal counsel in making this determination. The contractual fee arrangements for each Fund reflect the results of several years of review by the Board Members and predecessor Board Members, and discussions between such Board Members (and predecessor Board Members) and BlackRock. As a result, the Board Members’ conclusions may be based in part on their consideration of these arrangements in prior years.
| 64 | BLACKROCK CORI FUNDS | OCTOBER 31, 2016 |
| Officers and Trustees |
| Name, Address1 and Year of Birth | Position(s) Held with the Trust | Length of Time Served³ | Principal Occupation(s) During Past Five Years | Number of BlackRock- Advised Registered Investment Companies (“RICs”) Consisting of Investment Portfolios (“Portfolios”) Overseen | Public Company and Other Investment Company Directorships Held During Past Five Years | |||||
| Independent Trustees2 | ||||||||||
Robert M. Hernandez
1944 | Chair of the Board and Trustee | Since 2007 | Director, Vice Chairman and Chief Financial Officer of USX Corporation (energy and steel business) from 1991 to 2001; Director, RTI International Metals, Inc. from 1990 to 2015; Director, TE Connectivity (electronics) from 2006 to 2012. | 28 RICs consisting of 98 Portfolios | Chubb Limited (insurance company); Eastman Chemical Company | |||||
Fred G. Weiss
1941 | Vice Chair of the Board and Trustee | Since 2007 | Managing Director, FGW Consultancy LLC (consulting and investment company) since 1997; Director and Treasurer, Michael J. Fox Foundation for Parkinson’s Research since 2000. | 28 RICs consisting of 98 Portfolios | Allergan plc (pharmaceuticals) | |||||
James H. Bodurtha
1944 | Trustee | Since 2007 | Director, The China Business Group, Inc. (consulting and investing firm) from 1996 to 2013 and Executive Vice President thereof from 1996 to 2003; Chairman of the Board, Berkshire Holding Corporation since 1980; Director, ICI Mutual since 2010. | 28 RICs consisting of 98 Portfolios | None | |||||
Bruce R. Bond
1946 | Trustee | Since 2007 | Trustee and Member of the Governance Committee, State Street Research Mutual Funds from 1997 to 2005; Board Member of Governance, Audit and Finance Committee, Avaya Inc. (computer equipment) from 2003 to 2007. | 28 RICs consisting of 98 Portfolios | None | |||||
Donald W. Burton
1944 | Trustee | Since 2007 | Managing General Partner, The Burton Partnership, LP (an investment partnership) since 1979; Managing General Partner, The Burton Partnership (QP), LP (an investment partnership) since 2000; Managing General Partner, The South Atlantic Venture Funds from 1983 to 2012; Director, IDology, Inc. (technology solutions) since 2006; Director, Knology, Inc. (telecommunications) from 1996 to 2012; Director, Capital Southwest (financial) from 2006 to 2012; Director, Besito (restaurant) since 2013; Director, PDQ South Texas (restaurant) since 2013; Director, ITC/Talon (data) since 2015. | 28 RICs consisting of 98 Portfolios | None | |||||
Honorable Stuart E. Eizenstat
1943 | Trustee | Since 2007 | Partner and Head of International Practice, Covington and Burling LLP (law firm) since 2001; International Advisory Board Member, The Coca-Cola Company from 2002 to 2011; Advisory Board Member, Veracity Worldwide, LLC (risk management) from 2007 to 2012; Member of the International Advisory Board GML Ltd. (energy) since 2003; Advisory Board Member, BT Americas (telecommunications) from 2004 to 2009. | 28 RICs consisting of 98 Portfolios | Alcatel-Lucent (telecommunications); Global Specialty Metallurgical; UPS Corporation (delivery service) | |||||
John F. O’Brien
1943 | Trustee | Since 2007 | Trustee, Woods Hole Oceanographic Institute since 2003 and Chairman thereof from 2009 to 2015; Co-Founder and Managing Director, Board Leaders LLC (director education) since 2005. | 28 RICs consisting of 98 Portfolios | Cabot Corporation (chemicals); LKQ Corporation (auto parts manufacturing); TJX Companies, Inc. (retailer) | |||||
Donald C. Opatrny
1952 | Trustee | Since 2015 | Trustee, Member of the Executive Committee and Chair of the Investment Committee, Cornell University since 2004; Member of the Board and Investment Committee, University School since 2007; Member of the Investment Committee, Mellon Foundation from 2009 to 2015; President and Trustee, the Center for the Arts, Jackson Hole since 2011; Director, Athena Capital Advisors LLC (investment management firm) since 2013; Trustee and Chair of the Investment Committee, Community Foundation of Jackson Hole since 2014; Trustee, Artstor (a Mellon Foundation affiliate) from 2010 to 2015; President, Trustee and Member of the Investment Committee, The Aldrich Contemporary Art Museum from 2007 to 2014. | 28 RICs consisting of 98 Portfolios | None | |||||
Roberta Cooper Ramo
1942 | Trustee | Since 2007 | Shareholder and Attorney, Modrall, Sperling, Roehl, Harris & Sisk, P.A. (law firm) since 1993; Director, ECMC Group (service provider to students, schools and lenders) since 2001; President, The American Law Institute (non-profit) since 2008; Vice President, Santa Fe Opera (non-profit) since 2011; Chair, Think New Mexico (non-profit) since 2013; Chairman of the Board, Cooper’s Inc. (retail) from 1999 to 2011. | 28 RICs consisting of 98 Portfolios | None | |||||
| BLACKROCK CORI FUNDS | OCTOBER 31, 2016 | 65 |
| Officers and Trustees (continued) |
| Name, Address1 and Year of Birth | Position(s) Held with the Trust | Length of Time Served³ | Principal Occupation(s) During Past Five Years | Number of BlackRock- Advised Registered Investment Companies (“RICs”) Consisting of Investment Portfolios (“Portfolios”) Overseen | Public Company and Other Investment Company Directorships Held During Past Five Years | |||||
| Independent Trustees2 (concluded) | ||||||||||
David H. Walsh
1941 | Trustee | Since 2007 | Director, National Museum of Wildlife Art since 2007; Trustee, University of Wyoming Foundation from 2008 to 2012; Director, The American Museum of Fly Fishing since 1997. | 28 RICs consisting of 98 Portfolios | None | |||||
| Interested Trustees4 | ||||||||||
Robert Fairbairn
1965
| Trustee | Since 2015 | Senior Managing Director of BlackRock, Inc. since 2010; Global Head of BlackRock’s Retail and iShares® businesses since 2012; Member of BlackRock’s Global Executive and Global Operating Committees; Head of BlackRock’s Global Client Group from 2009 to 2012; Chairman of BlackRock’s international businesses from 2007 to 2010. | 28 RICs consisting of 98 Portfolios | None | |||||
Henry Gabbay
1947 | Trustee | Since 2007 | Consultant, BlackRock, Inc. from 2007 to 2008; Managing Director, BlackRock, Inc. from 1989 to 2007; Chief Administrative Officer, BlackRock Advisors, LLC from 1998 to 2007; President of BlackRock Funds and BlackRock Allocation Target Shares (formerly, BlackRock Bond Allocation Target Shares) from 2005 to 2007 and Treasurer of certain closed-end funds in the BlackRock fund complex from 1989 to 2006. | 28 RICs consisting of 98 Portfolios | None | |||||
Henry R. Keizer
1956 | Trustee | Since 2016 | Director, Park Indemnity Ltd. (captive insurer) since 2010; Director, MUFG Americas Holdings Corporation and MUFG Union Bank, N.A. (financial and bank holding company) from 2014 to 2016; Director, Montpelier Re Holdings, Ltd. (publicly held property and casual reinsurance) from 2013 to 2015; Director, American Institute of Certified Public Accountants from 2009 to 2011; Director, KPMG LLP (audit, tax and advisory services) in 2004 to 2005 and 2010 to 2012; Director, KPMG International in 2012, Deputy Chairman and Chief Operating Officer thereof from 2010 to 2012 and U.S. Vice Chairman of Audit thereof from 2005 to 2010; Global Head of Audit, KPMGI (consortium of KPMG firms) from 2006 to 2010; Director, YMCA of Greater New York from 2006 to 2010. | 28 RICs consisting of 98 Portfolios | Hertz Global Holdings (car rental); WABCO (commercial vehicle safety systems) | |||||
John M. Perlowski
1964 | Trustee, President and Chief Executive Officer | Since 2015 (Director); Since 2010 (President and Chief Executive Officer) | Managing Director of BlackRock, Inc. since 2009; Head of BlackRock Global Fund & Accounting Services since 2009; Managing Director and Chief Operating Officer of the Global Product Group at Goldman Sachs Asset Management, L.P. from 2003 to 2009; Treasurer of Goldman Sachs Mutual Funds from 2003 to 2009 and Senior Vice President thereof from 2007 to 2009; Director of Goldman Sachs Offshore Funds from 2002 to 2009; Director of Family Resource Network (charitable foundation) since 2009. | 128 RICs consisting of 315 Portfolios | None | |||||
1 The address of each Trustee is c/o BlackRock, Inc., 55 East 52nd Street, New York, NY 10055. | ||||||||||
2 Each Independent Trustee holds office until his or her successor is duly elected and qualifies or until his or her earlier death, resignation, retirement or removal as provided by the Trust’s by-laws or charter or statute, or until December 31 of the year in which he or she turns 75. The Board has determined to extend the terms of Independent Trustees on a case-by-case basis, as appropriate. The Board has unanimously approved extending the mandatory retirement age for Messrs. Walsh and Weiss until January 31, 2017, which the Board believes to be in the best interests of shareholders of the Trust. Interested Trustees serve until their successor is duly elected and qualifies or until their earlier death, resignation, retirement or removal as provided by the Trust’s by-laws or statute, or until December 31 of the year in which they turn 72. | ||||||||||
3 Following the combination of Merrill Lynch Investment Managers, L.P. (“MLIM”) and BlackRock, Inc. in September 2006, the various legacy MLIM and legacy BlackRock fund boards were realigned and consolidated into three new fund boards in 2007. As a result, although the chart shows certain Independent Trustees as joining the Funds’ Board in 2007, those Trustees first became members of the boards of other legacy MLIM or legacy BlackRock funds as follows: James H. Bodurtha, 1995; Bruce R. Bond, 2005; Donald W. Burton, 2002; Honorable Stuart E. Eizenstat, 2001; Robert M. Hernandez, 1996; John F. O’Brien, 2005; Roberta Cooper Ramo, 1999; David H. Walsh, 2003; and Fred G. Weiss, 1998. | ||||||||||
4 Messrs. Fairbairn and Perlowski are both “interested persons,” as defined in the 1940 Act, of the Trust based on their positions with BlackRock, Inc. and its affiliates. Mr. Perlowski is also a board member of the BlackRock Closed-End Complex and the BlackRock Equity-Liquidity Complex. Mr. Gabbay may be deemed an “interested person” of the Trust based on his former positions with BlackRock, Inc. and its affiliates. Mr. Keizer may be deemed an “interested person” of the Trust based on his former directorship at another company which is not an affiliate of BlackRock, Inc. It is anticipated that Mr. Keizer will become an Independent Trustee effective January 31, 2017. Messrs. Gabbay and Keizer do not currently serve as officers or employees of BlackRock, Inc. or its affiliates or own any securities of BlackRock, Inc. or The PNC Financial Services Group, Inc. Each of Messrs. Gabbay and Keizer is a non-management Interested Trustee. | ||||||||||
| 66 | BLACKROCK CORI FUNDS | OCTOBER 31, 2016 |
| Officers and Trustees (concluded) |
Name, Address1 and Year of Birth | Position(s) Held with the Fund | Length of Time Served as an Officer | Principal Occupation(s) During Past Five Years | |||
| Officers Who Are Not Trustees2 | ||||||
Jennifer McGovern
1977 | Vice President | Since 2014 | Managing Director of BlackRock, Inc. since 2016; Director of BlackRock, Inc. from 2011 to 2015; Head of Product Structure and Oversight for BlackRock’s U.S. Wealth Advisory Group since 2013; Vice President of BlackRock, Inc. from 2008 to 2010. | |||
Neal J. Andrews
1966 | Chief Financial Officer | Since 2007 | Managing Director of BlackRock, Inc. since 2006; Senior Vice President and Line of Business Head of Fund Accounting and Administration at PNC Global Investment Servicing (U.S.) Inc. from 1992 to 2006. | |||
Jay M. Fife
1970 | Treasurer | Since 2007 | Managing Director of BlackRock, Inc. since 2007; Director of BlackRock, Inc. in 2006; Assistant Treasurer of the MLIM and Fund Asset Management, L.P. advised funds from 2005 to 2006; Director of MLIM Fund Services Group from 2001 to 2006. | |||
Charles Park
1967 | Chief Compliance Officer | Since 2014 | Anti-Money Laundering Compliance Officer for the BlackRock-advised Funds in the Equity-Bond Complex, the Equity-Liquidity Complex and the Closed-End Complex from 2014 to 2015; Chief Compliance Officer of BlackRock Advisors, LLC and the BlackRock-advised Funds in the Equity-Bond Complex, the Equity-Liquidity Complex and the Closed-End Complex since 2014; Principal of and Chief Compliance Officer for iShares® Delaware Trust Sponsor LLC since 2012 and BlackRock Fund Advisors (“BFA”) since 2006; Chief Compliance Officer for the BFA-advised iShares® exchange traded funds since 2006; Chief Compliance Officer for BlackRock Asset Management International Inc. since 2012. | |||
Fernanda Piedra
1969 | Anti-Money Laundering Compliance Officer | Since 2015 | Director of BlackRock, Inc. since 2014; Anti-Money Laundering Compliance Officer and Regional Head of Financial Crime for the Americas at BlackRock, Inc. since 2014; Head of Regulatory Changes and Remediation for the Asset Wealth Management Division of Deutsche Bank from 2010 to 2014; Vice President of Goldman Sachs (Anti-Money Laundering/Suspicious Activities Group) from 2004 to 2010. | |||
Benjamin Archibald
1975 | Secretary | Since 2012 | Managing Director of BlackRock, Inc. since 2014; Director of BlackRock, Inc. from 2010 to 2013; Secretary of the iShares® exchange traded funds since 2015; Secretary of the BlackRock-advised mutual funds since 2012. | |||
1 The address of each Officer is c/o BlackRock, Inc., 55 East 52nd Street, New York, NY 10055. | ||||||
2 Officers of the Funds serve at the pleasure of the Board. | ||||||
| Further information about the Funds’ Officers and Trustees is available in the Funds’ Statement of Additional Information, which can be obtained without charge by calling (800) 441-7762. | ||||||
On September 26, 2016, the Board appointed Lena G. Goldberg as a Trustee of the Trust effective November 4, 2016.
Investment Adviser BlackRock Advisors, LLC | Transfer Agent BNY Mellon Investment Servicing (US) Inc. Wilmington, DE 19809 | Distributor BlackRock Investments, LLC New York, NY 10022 | Legal Counsel Willkie Farr & Gallagher LLP New York, NY 10019 | |||
Sub-Advisor BlackRock International Limited Edinburgh, EH3 8BL United Kingdom | Custodian and State Street Bank and Trust Company Boston, MA 02110 | Independent Registered Deloitte & Touche LLP Boston, MA 02116 | Address of the Funds 100 Bellevue Parkway Wilmington, DE 19809 | |||
| BLACKROCK CORI FUNDS | OCTOBER 31, 2016 | 67 |
| Additional Information |
| General Information |
Householding
The Funds will mail only one copy of shareholder documents, including prospectuses, annual and semi-annual reports and proxy statements, to shareholders with multiple accounts at the same address. This practice is commonly called “householding” and is intended to reduce expenses and eliminate duplicate mailings of shareholder documents. Mailings of your shareholder documents may be householded indefinitely unless you instruct us otherwise. If you do not want the mailing of these documents to be combined with those for other members of your household, please call the Funds at (800) 441-7762.
Availability of Quarterly Schedule of Investments
The Funds file their complete schedule of portfolio holdings with the SEC for the first and third quarters of each fiscal year on Form N-Q. The Funds’ Forms N-Q are available on the SEC’s website at http://www.sec.gov and may also be reviewed and copied at the SEC’s Public Reference Room in Washington, D.C. Information on the operation of the Public Reference Room or how to access documents on the SEC’s website without charge may be obtained by calling (800) SEC-0330. The Funds’ Forms N-Q may also be obtained upon request and without charge by calling (800) 441-7762.
Availability of Proxy Voting Policies and Procedures
A description of the policies and procedures that the Funds use to determine how to vote proxies relating to portfolio securities is available upon request and without charge (1) by calling (800) 441-7762; (2) at http://www.blackrock.com; and (3) on the SEC’s website at http://www.sec.gov.
Availability of Proxy Voting Record
Information about how the Funds voted proxies relating to securities held in the Funds’ portfolios during the most recent 12-month period ended June 30 is available upon request and without charge (1) at http://www.blackrock.com; or by calling (800) 441-7762 and (2) on the SEC’s website at http://www.sec.gov.
BlackRock’s Mutual Fund Family
BlackRock offers a diverse lineup of open-end mutual funds crossing all investment styles and managed by experts in equity, fixed income and tax-exempt investing. Visit http://www.blackrock.com for more information.
| 68 | BLACKROCK CORI FUNDS | OCTOBER 31, 2016 |
| Additional Information (concluded) |
| Shareholder Privileges |
Account Information
Call us at (800) 441-7762 from 8:00 AM to 6:00 PM ET on any business day to get information about your account balances, recent transactions and share prices. You can also reach us on the Web at http://www.blackrock.com/funds.
Automatic Investment Plans
Investor Class shareholders who want to invest regularly can arrange to have $50 or more automatically deducted from their checking or savings account and invested in any of the BlackRock funds.
Systematic Withdrawal Plans
Investor Class shareholders can establish a systematic withdrawal plan and receive periodic payments of $50 or more from their BlackRock funds, as long as their account balance is at least $10,000.
Retirement Plans
Shareholders may make investments in conjunction with Traditional, Rollover, Roth, Coverdell, Simple IRAs, SEP IRAs and 403(b) Plans.
| BlackRock Privacy Principles |
BlackRock is committed to maintaining the privacy of its current and former fund investors and individual clients (collectively, “Clients”) and to safeguarding their non-public personal information. The following information is provided to help you understand what personal information BlackRock collects, how we protect that information and why in certain cases we share such information with select parties.
If you are located in a jurisdiction where specific laws, rules or regulations require BlackRock to provide you with additional or different privacy-related rights beyond what is set forth below, then BlackRock will comply with those specific laws, rules or regulations.
BlackRock obtains or verifies personal non-public information from and about you from different sources, including the following: (i) information we receive from you or, if applicable, your financial intermediary, on applications, forms or other documents; (ii) information about your transactions with us, our affiliates, or others; (iii) information we receive from a consumer reporting agency; and (iv) from visits to our websites.
BlackRock does not sell or disclose to non-affiliated third parties any non-public personal information about its Clients, except as permitted by law or as is necessary to respond to regulatory requests or to service Client accounts. These non-affiliated third parties are required to protect the confidentiality and security of this information and to use it only for its intended purpose.
We may share information with our affiliates to service your account or to provide you with information about other BlackRock products or services that may be of interest to you. In addition, BlackRock restricts access to non-public personal information about its Clients to those BlackRock employees with a legitimate business need for the information. BlackRock maintains physical, electronic and procedural safeguards that are designed to protect the non-public personal information of its Clients, including procedures relating to the proper storage and disposal of such information.
| BLACKROCK CORI FUNDS | OCTOBER 31, 2016 | 69 |
This report is intended for current holders. It is not authorized for use as an offer of sale or a solicitation of an offer to buy shares of a Fund unless preceded or accompanied by the Fund’s current prospectus. Past performance results shown in this report should not be considered a representation of future performance. Investment returns and principal value of shares will fluctuate so that shares, when redeemed, may be worth more or less than their original cost. Statements and other information herein are as dated and are subject to change.

| CoRI-10/16-AR |  |
| Item 2 – | Code of Ethics – The registrant (or the “Fund”) has adopted a code of ethics, as of the end of the period covered by this report, applicable to the registrant’s principal executive officer, principal financial officer, principal accounting officer or controller, or persons performing similar functions. During the period covered by this report, the code of ethics was amended to update certain information and to make other non-material changes. During the period covered by this report, there have been no waivers granted under the code of ethics. The registrant undertakes to provide a copy of the code of ethics to any person upon request, without charge, by calling 1-800-441-7762. |
| Item 3 – | Audit Committee Financial Expert – The registrant’s board of trustees (the “board of trustees”), has determined that (i) the registrant has the following audit committee financial experts serving on its audit committee and (ii) each audit committee financial expert is independent: |
Robert M. Hernandez
Fred G. Weiss
Stuart E. Eizenstat
Bruce R. Bond
Under applicable securities laws, a person determined to be an audit committee financial expert will not be deemed an “expert” for any purpose, including without limitation for the purposes of Section 11 of the Securities Act of 1933, as a result of being designated or identified as an audit committee financial expert. The designation or identification of a person as an audit committee financial expert does not impose on such person any duties, obligations, or liabilities greater than the duties, obligations, and liabilities imposed on such person as a member of the audit committee and board of trustees in the absence of such designation or identification.
| Item 4 – | Principal Accountant Fees and Services |
The following table presents fees billed by Deloitte & Touche LLP (“D&T”) in each of the last two fiscal years for the services rendered to the Fund:
| (a) Audit Fees | (b) Audit-Related Fees1 | (c) Tax Fees2 | (d) All Other Fees3 | |||||||||||||
| Entity Name | Current Fiscal Year End | Previous Fiscal Year End | Current Fiscal Year End | Previous Fiscal Year End | Current Fiscal Year End | Previous Fiscal Year End | Current Fiscal Year End | Previous Fiscal Year End | ||||||||
BlackRock CoRI 2015 Fund | $35,000 | $35,000 | $0 | $0 | $15,402 | $15,402 | $0 | $0 | ||||||||
BlackRock CoRI 2017 Fund | $35,000 | $35,000 | $0 | $0 | $15402 | $15,402 | $0 | $0 | ||||||||
BlackRock CoRI 2019 Fund | $35,000 | $35,000 | $0 | $0 | $15,402 | $15,402 | $0 | $0 | ||||||||
BlackRock CoRI 2021 Fund | $35,000 | $35,000 | $0 | $0 | $15,402 | $15,402 | $0 | $0 | ||||||||
BlackRock CoRI 2023 Fund | $35,000 | $35,000 | $0 | $0 | $15,402 | $15,402 | $0 | $0 | ||||||||
The following table presents fees billed by D&T that were required to be approved by the registrant’s audit committee (the “Committee”) for services that relate directly to the operations or financial reporting of the Fund and that are rendered on behalf of BlackRock Advisors, LLC (“Investment Adviser” or “BlackRock”) and entities controlling, controlled by, or under common control with BlackRock (not including any sub-adviser whose role is primarily portfolio management and is subcontracted with or overseen by another investment adviser) that provide ongoing services to the Fund (“Fund Service Providers”):
2
| Current Fiscal Year End | Previous Fiscal Year End | |||
(b) Audit-Related Fees1 | $0 | $0 | ||
(c) Tax Fees2 | $0 | $0 | ||
(d) All Other Fees3 | $2,129,000 | $2,391,000 |
1 The nature of the services includes assurance and related services reasonably related to the performance of the audit of financial statements not included in Audit Fees.
2 The nature of the services includes tax compliance, tax advice and tax planning.
3 Aggregate fees borne by BlackRock in connection with the review of compliance procedures and attestation thereto performed by D&T with respect to all of the registered closed-end funds and some of the registered open-end funds advised by BlackRock.
(e)(1) Audit Committee Pre-Approval Policies and Procedures:
The Committee has adopted policies and procedures with regard to the pre-approval of services. Audit, audit-related and tax compliance services provided to the registrant on an annual basis require specific pre-approval by the Committee. The Committee also must approve other non-audit services provided to the registrant and those non-audit services provided to the Investment Adviser and Fund Service Providers that relate directly to the operations and the financial reporting of the registrant. Certain of these non-audit services that the Committee believes are (a) consistent with the SEC’s auditor independence rules and (b) routine and recurring services that will not impair the independence of the independent accountants may be approved by the Committee without consideration on a specific case-by-case basis (“general pre-approval”). The term of any general pre-approval is 12 months from the date of the pre-approval, unless the Committee provides for a different period. Tax or other non-audit services provided to the registrant which have a direct impact on the operations or financial reporting of the registrant will only be deemed pre-approved provided that any individual project does not exceed $10,000 attributable to the registrant or $50,000 per project. For this purpose, multiple projects will be aggregated to determine if they exceed the previously mentioned cost levels.
Any proposed services exceeding the pre-approved cost levels will require specific pre-approval by the Committee, as will any other services not subject to general pre-approval (e.g., unanticipated but permissible services). The Committee is informed of each service approved subject to general pre-approval at the next regularly scheduled in-person board meeting. At this meeting, an analysis of such services is presented to the Committee for ratification. The Committee may delegate to the Committee Chairman the authority to approve the provision of and fees for any specific engagement of permitted non-audit services, including services exceeding pre-approved cost levels.
(e)(2) None of the services described in each of Items 4(b) through (d) were approved by the Committee pursuant to the de minimis exception in paragraph (c)(7)(i)(C) of Rule 2-01 of Regulation S-X.
(f) Not Applicable
3
(g) The aggregate non-audit fees paid to the accountant for services rendered by the accountant to the registrant, the Investment Adviser and the Fund Service Providers were:
| Entity Name | Current Fiscal Year End | Previous Fiscal Year End | ||||
BlackRock CoRI 2015 Fund | $15,402 | $15,402 | ||||
BlackRock CoRI 2017 Fund | $15,402 | $15,402 | ||||
BlackRock CoRI 2019 Fund | $15,402 | $15,402 | ||||
BlackRock CoRI 2021 Fund | $15,402 | $15,402 | ||||
BlackRock CoRI 2023 Fund | $15,402 | $15,402 |
Additionally, SSAE 16 Review (Formerly, SAS No. 70) fees for the current and previous fiscal years of $2,129,000 and $2,391,000, respectively, were billed by D&T to the Investment Adviser.
(h) The Committee has considered and determined that the provision of non-audit services that were rendered to the Investment Adviser and the Fund Service Providers that were not pre-approved pursuant to paragraph (c)(7)(ii) of Rule 2-01 of Regulation S-X is compatible with maintaining the principal accountant’s independence.
| Item 5 – | Audit Committee of Listed Registrants – Not Applicable |
| Item 6 – | Investments |
(a) The registrant’s Schedule of Investments is included as part of the Report to Stockholders filed under Item 1 of this Form.
(b) Not Applicable due to no such divestments during the semi-annual period covered since the previous Form N-CSR filing.
| Item 7 – | Disclosure of Proxy Voting Policies and Procedures for Closed-End Management Investment Companies – Not Applicable |
| Item 8 – | Portfolio Managers of Closed-End Management Investment Companies – Not Applicable |
| Item 9 – | Purchases of Equity Securities by Closed-End Management Investment Company and Affiliated Purchasers – Not Applicable |
| Item 10 – | Submission of Matters to a Vote of Security Holders – There have been no material changes to these procedures. |
| Item 11 – | Controls and Procedures |
(a) – The registrant’s principal executive and principal financial officers, or persons performing similar functions, have concluded that the registrant’s disclosure controls and procedures (as defined in Rule 30a-3(c) under the Investment Company Act of 1940, as amended (the “1940 Act”)) are effective as of a date within 90 days of the filing of this report based on the evaluation of these controls and procedures required by Rule 30a-3(b) under the 1940 Act and Rule 15d-15(b) under the Securities Exchange Act of 1934, as amended.
(b) – There were no changes in the registrant’s internal control over financial reporting (as defined in Rule 30a-3(d) under the 1940 Act) that occurred during the second fiscal quarter of the period covered by this report that have materially affected, or are reasonably likely to materially affect, the registrant’s internal control over financial reporting.
4
Item 12 – Exhibits attached hereto
(a)(1) – Code of Ethics – See Item 2
(a)(2) – Certifications – Attached hereto
(a)(3) – Not Applicable
(b) – Certifications – Attached hereto
5
Pursuant to the requirements of the Securities Exchange Act of 1934 and the Investment Company Act of 1940, the registrant has duly caused this report to be signed on its behalf by the undersigned, thereunto duly authorized.
| BlackRock CoRI Funds | ||
| By: | /s/ John M. Perlowski | |
| John M. Perlowski | ||
| Chief Executive Officer (principal executive officer) of | ||
| BlackRock CoRI Funds | ||
Date: January 4, 2017
Pursuant to the requirements of the Securities Exchange Act of 1934 and the Investment Company Act of 1940, this report has been signed below by the following persons on behalf of the registrant and in the capacities and on the dates indicated.
| By: | /s/ John M. Perlowski | |
| John M. Perlowski | ||
| Chief Executive Officer (principal executive officer) of | ||
| BlackRock CoRI Funds |
Date: January 4, 2017
| By: | /s/ Neal J. Andrews | |
| Neal J. Andrews | ||
| Chief Financial Officer (principal financial officer) of | ||
| BlackRock CoRI Funds |
Date: January 4, 2017
6