Exhibit (c)-(2)
|
exhibit (c)-(2)
Sungy Mobile Limited June 8, 2015
Fairness Analysis Presented to the Special Committee of Independent Directors
The information contained herein is of a confidential nature and is intended for the use of the persons or firm to whom it is furnished by us.
Reproduction, publication, or dissemination of portions hereof may not be made without prior approval of Duff & Phelps, LLC and its affiliates.
|
Duff & Phelps Disclaimer
The following pages contain materials that are being provided by Duff & Phelps, LLC (“Duff & Phelps”) to the special committee of independent directors (the “Special Committee”) of the board of directors (the “Board of Directors”) of Sungy Mobile Limited (“Sungy Mobile” or the “Company”) in the context of a meeting of the Special Committee held to consider the Proposed Transaction (as defined herein).
The accompanying materials are, and any Opinion (as defined herein) will be, compiled and presented on a confidential basis, solely for the use and benefit of the Special Committee in connection with their evaluation of the Proposed Transaction and may not be distributed to any other party, publicly disclosed, or relied upon for any other purpose without the prior written consent of Duff & Phelps.
Because these materials were prepared for use in the context of an oral presentation to the Special Committee, whose members are familiar with the business and affairs of the Company, neither the Company nor Duff & Phelps, nor any of their respective legal or financial advisors or accountants, take any responsibility for the accuracy or completeness of any of the materials if used by persons other than the Special Committee.
These materials are not intended to represent an Opinion but rather to serve as discussion materials for the Special Committee and as a summary of the basis upon which Duff & Phelps may render an Opinion.
The accompanying material does not, and any Opinion provided by Duff & Phelps would not: (i) address the merits of the underlying business decision of the Special Committee, the Board of Directors or the Company or any other party to the Proposed Transaction to enter into the Proposed Transaction versus any alternative strategy or transaction; (ii) constitute a recommendation to the Special Committee, the Board of Directors, the Company or any other person including security holders of the Company as to how such person should vote or as to any other specific action that should be taken in connection with the Proposed Transaction; or (iii) create any fiduciary duty on Duff & Phelps’ part to any party.
The information utilized in preparing this presentation was obtained from the Company and from public sources. Any estimates and forecasts contained herein have been prepared by or are based on discussions with the senior management of the Company and involve numerous and significant subjective determinations, which may or may not prove to be correct. No representation or warranty, expressed or implied, is made as to the accuracy or completeness of such information and nothing contained herein is, or shall be relied upon as, a representation, whether as to the past or the future. Duff & Phelps did not independently verify such information.
No selected company or selected transaction used in our analysis is directly comparable to the Company or the Proposed Transaction.
Duff & Phelps’ affiliate, Duff & Phelps Securities, LLC (“DPS”), has acted as financial advisor to the Special Committee providing such financial and market related advice and assistance as requested by the Special Committee in connection with the Proposed Transaction, and will receive a fee for certain investment banking services if requested by the Special Committee.
CONFIDENTIAL 2
|
Table of Contents
1. Introduction and Transaction Overview
2. Valuation Analysis
Discounted Cash Flow Analysis
Selected Public Companies Analysis
Appendix
1. Assumptions, Qualifications, and Limiting Conditions
2. Selected M&A Transactions Analysis
3. Summary of Premiums Paid – Supplemental
CONFIDENTIAL 3
|

Section 01 Introduction and Transaction Overview
|
Introduction and Transaction Overview
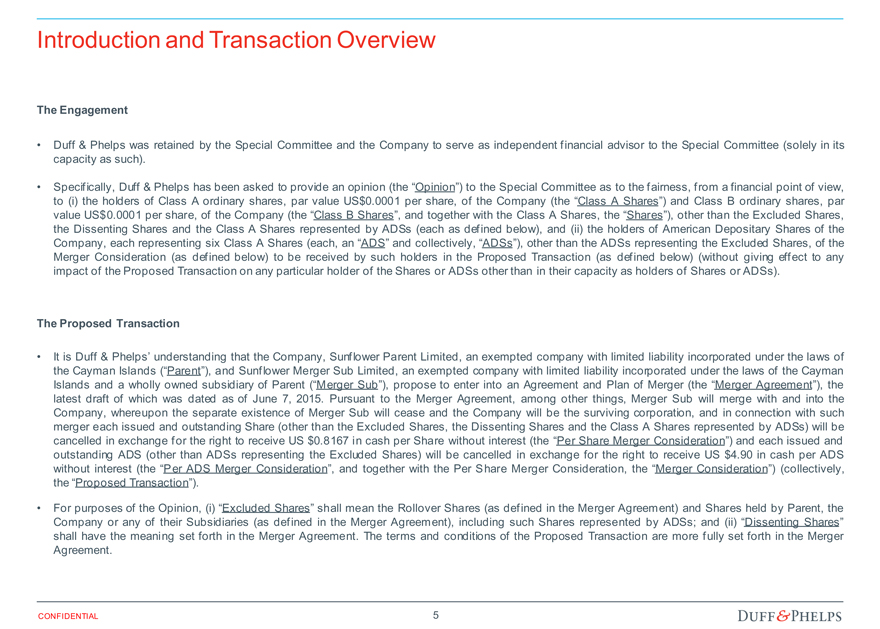
The Engagement
Duff & Phelps was retained by the Special Committee and the Company to serve as independent financial advisor to the Special Committee (solely in its capacity as such).
Specifically, Duff & Phelps has been asked to provide an opinion (the “Opinion”) to the Special Committee as to the fairness, from a financial point of view, to (i) the holders of Class A ordinary shares, par value US$0.0001 per share, of the Company (the “Class A Shares”) and Class B ordinary shares, par value US$0.0001 per share, of the Company (the “Class B Shares”, and together with the Class A Shares, the “Shares”), other than the Excluded Shares, the Dissenting Shares and the Class A Shares represented by ADSs (each as defined below), and (ii) the holders of American Depositary Shares of the Company, each representing six Class A Shares (each, an “ADS” and collectively, “ADSs”), other than the ADSs representing the Excluded Shares, of the Merger Consideration (as defined below) to be received by such holders in the Proposed Transaction (as defined below) (without giving effect to any impact of the Proposed Transaction on any particular holder of the Shares or ADSs other than in their capacity as holders of Shares or ADSs).
The Proposed Transaction
It is Duff & Phelps’ understanding that the Company, Sunflower Parent Limited, an exempted company with limited liability incorporated under the laws of the Cayman Islands (“Parent”), and Sunflower Merger Sub Limited, an exempted company with limited liability incorporated under the laws of the Cayman Islands and a wholly owned subsidiary of Parent (“Merger Sub”), propose to enter into an Agreement and Plan of Merger (the “Merger Agreement”), the latest draft of which was dated as of June 7, 2015. Pursuant to the Merger Agreement, among other things, Merger Sub will merge with and into the Company, whereupon the separate existence of Merger Sub will cease and the Company will be the surviving corporation, and in connection with such merger each issued and outstanding Share (other than the Excluded Shares, the Dissenting Shares and the Class A Shares represented by ADSs) will be cancelled in exchange for the right to receive US $0.8167 in cash per Share without interest (the “Per Share Merger Consideration”) and each issued and outstanding ADS (other than ADSs representing the Excluded Shares) will be cancelled in exchange for the right to receive US $4.90 in cash per ADS without interest (the “Per ADS Merger Consideration”, and together with the Per Share Merger Consideration, the “Merger Consideration”) (collectively, the “Proposed Transaction”).
For purposes of the Opinion, (i) “Excluded Shares” shall mean the Rollover Shares (as defined in the Merger Agreement) and Shares held by Parent, the Company or any of their Subsidiaries (as defined in the Merger Agreement), including such Shares represented by ADSs; and (ii) “Dissenting Shares” shall have the meaning set forth in the Merger Agreement. The terms and conditions of the Proposed Transaction are more fully set forth in the Merger Agreement.
CONFIDENTIAL 5
|
Introduction and Transaction Overview
Scope of Analysis
Duff & Phelps has made such reviews, analyses and inquiries as it has deemed necessary and appropriate under the circumstances. Duff & Phelps also took into account its assessment of general economic, market and financial conditions, as well as its experience in securities and business valuation, in general, and with respect to similar transactions, in particular. Duff & Phelps’ procedures, investigations, and financial analysis with respect to the preparation of its analysis included, but were not limited to, the items summarized below:
1. Reviewed the following documents:
The Company’s annual reports and audited financial statements on Form 20-F filed with the Securities and Exchange Commission (“SEC”) for the years ended December 31, 2013 and December 31, 2014;
The Company’s unaudited financial statements for the three months ended March 31, 2014 and March 31, 2015;
A detailed financial projection model for the years ending December 31, 2015 through December 31, 2024, prepared and provided to Duff & Phelps by management of the Company, upon which Duff & Phelps has relied, with your consent, in performing its analysis (the “Management Projections”);
Other internal documents relating to the history, past and current operations, financial conditions, and probable future outlook of the Company, provided to Duff & Phelps by management of the Company;
A letter dated June 5, 2015 from the management of the Company which made certain representations as to the Management Projections and the underlying assumptions for the Company (the “Management Representation Letter”); and
Documents related to the Proposed Transaction, including the Merger Agreement;
2. Discussed the information referred to above and the background and other elements of the Proposed Transaction with the management of the Company;
3. Discussed with Company management its plans and intentions with respect to the management and operation of the business;
4. Reviewed the historical trading price and trading volume of the ADSs and the publicly traded securities of certain other companies that Duff & Phelps deemed relevant;
5. Performed certain valuation and comparative analyses using generally accepted valuation and analytical techniques including a discounted cash flow analysis, an analysis of selected public companies that Duff & Phelps deemed relevant, an analysis of selected transactions that Duff & Phelps deemed relevant, and a review of premiums paid in selected transactions that Duff & Phelps deemed relevant; and
6. Conducted such other analyses and considered such other factors as Duff & Phelps deemed appropriate.
CONFIDENTIAL 6
|
Introduction and Transaction Overview
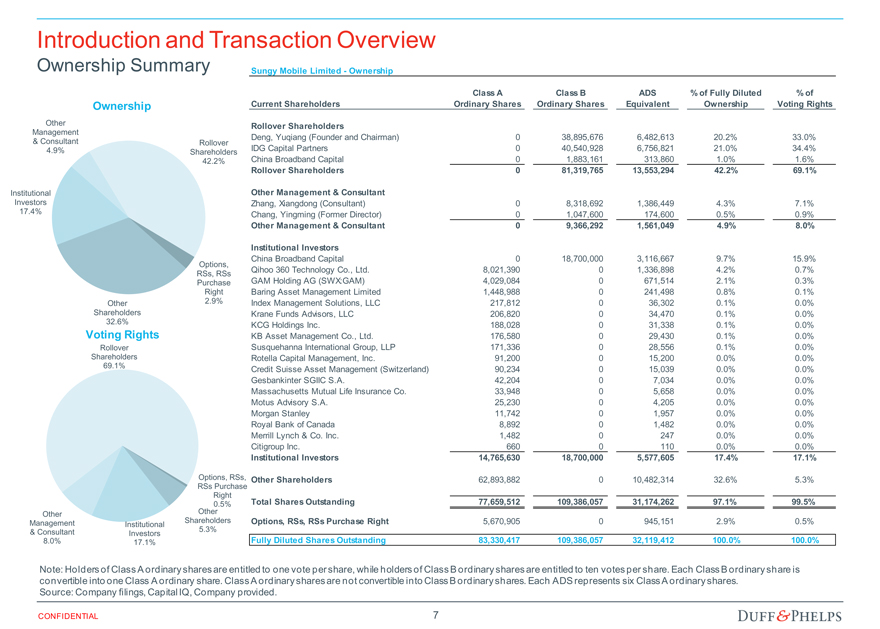
Ownership Summary Sungy Mobile Limited—Ownership
Ownership
Other
Management
& Consultant Rollover
4.9% Shareholders
42.2%
Institutional
Investors
17.4%
Options,
RSs, RSs
Purchase
Right
Other 2.9%
Shareholders
32.6%
Voting Rights
Rollover
Shareholders
69.1%
Options, RSs,
RSs Purchase
Right
0.5%
Other Other
Management Institutional Shareholders
& Consultant Investors 5.3%
8.0% 17.1%
Class A Class B ADS % of Fully Diluted % of
Current Shareholders Ordinary Shares Ordinary Shares Equivalent Ownership Voting Rights
Rollover Shareholders
Deng, Yuqiang (Founder and Chairman) 0 38,895,676 6,482,613 20.2% 33.0%
IDG Capital Partners 0 40,540,928 6,756,821 21.0% 34.4%
China Broadband Capital 0 1,883,161 313,860 1.0% 1.6%
Rollover Shareholders 0 81,319,765 13,553,294 42.2% 69.1%
Other Management & Consultant
Zhang, Xiangdong (Consultant) 0 8,318,692 1,386,449 4.3% 7.1%
Chang, Yingming (Former Director) 0 1,047,600 174,600 0.5% 0.9%
Other Management & Consultant 0 9,366,292 1,561,049 4.9% 8.0%
Institutional Investors
China Broadband Capital 0 18,700,000 3,116,667 9.7% 15.9%
Qihoo 360 Technology Co., Ltd. 8,021,390 0 1,336,898 4.2% 0.7%
GAM Holding AG (SWX:GAM) 4,029,084 0 671,514 2.1% 0.3%
Baring Asset Management Limited 1,448,988 0 241,498 0.8% 0.1%
Index Management Solutions, LLC 217,812 0 36,302 0.1% 0.0%
Krane Funds Advisors, LLC 206,820 0 34,470 0.1% 0.0%
KCG Holdings Inc. 188,028 0 31,338 0.1% 0.0%
KB Asset Management Co., Ltd. 176,580 0 29,430 0.1% 0.0%
Susquehanna International Group, LLP 171,336 0 28,556 0.1% 0.0%
Rotella Capital Management, Inc. 91,200 0 15,200 0.0% 0.0%
Credit Suisse Asset Management (Switzerland) 90,234 0 15,039 0.0% 0.0%
Gesbankinter SGIIC S.A. 42,204 0 7,034 0.0% 0.0%
Massachusetts Mutual Life Insurance Co. 33,948 0 5,658 0.0% 0.0%
Motus Advisory S.A. 25,230 0 4,205 0.0% 0.0%
Morgan Stanley 11,742 0 1,957 0.0% 0.0%
Royal Bank of Canada 8,892 0 1,482 0.0% 0.0%
Merrill Lynch & Co. Inc. 1,482 0 247 0.0% 0.0%
Citigroup Inc. 660 0 110 0.0% 0.0%
Institutional Investors 14,765,630 18,700,000 5,577,605 17.4% 17.1%
Other Shareholders 62,893,882 0 10,482,314 32.6% 5.3%
Total Shares Outstanding 77,659,512 109,386,057 31,174,262 97.1% 99.5%
Options, RSs, RSs Purchase Right 5,670,905 0 945,151 2.9% 0.5%
Fully Diluted Shares Outstanding 83,330,417 109,386,057 32,119,412 100.0% 100.0%
Note: Holders of Class A ordinary shares are entitled to one vote per share, while holders of Class B ordinary shares are entitled to ten votes per share. Each Class B ordinary share is
convertible into one Class A ordinary share. Class A ordinary shares are not convertible into Class B ordinary shares. Each ADS represents six Class A ordinary shares.
Source: Company filings, Capital IQ, Company provided.
CONFIDENTIAL 7
|
Introduction and Transaction Overview
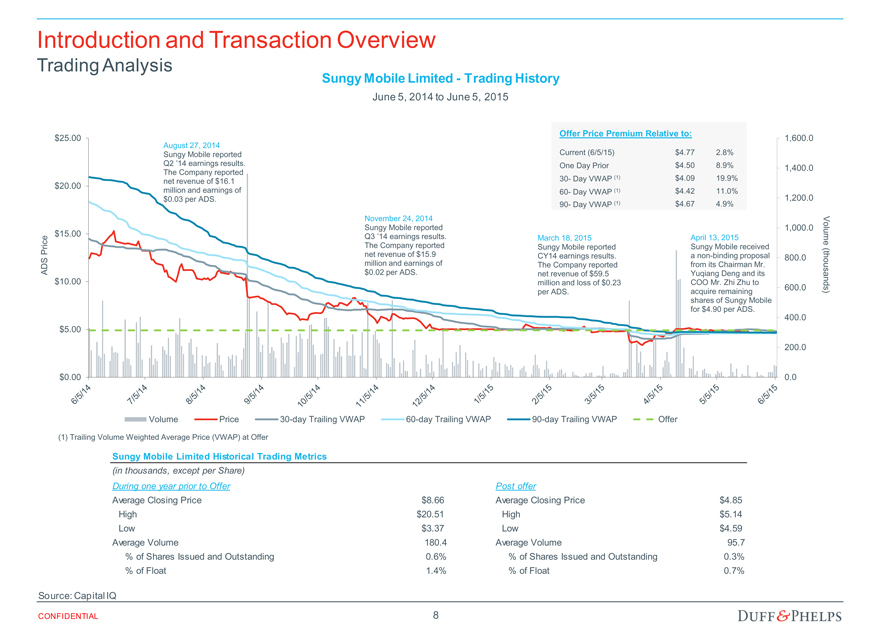
Trading Analysis Sungy Mobile Limited—Trading History
June 5, 2014 to June 5, 2015
Offer Price Premium Relative to:
$25.00 1,600.0
August 27, 2014
Sungy Mobile reported Current (6/5/15) $ 4.77 2.8%
Q2 ’14 earnings results. One Day Prior $ 4.50 8.9% 1,400.0
The Company reported
net revenue of $16.1 30- Day VWAP (1) $ 4.09 19.9%
$20.00 million and earnings of 60- Day VWAP (1) $ 4.42 11.0%
$0.03 per ADS. 1,200.0
90- Day VWAP (1) $ 4.67 4.9%
November 24, 2014 V
Sungy Mobile reported 1,000.0 ol
ce $15.00 Q3 ’14 earnings results. March 18, 2015 April 13, 2015 um
i e
r The Company reported Sungy Mobile reported Sungy Mobile received (
P net revenue of $15.9 CY14 earnings results. a non-binding proposal 800.0
DS million and earnings of The Company reported from its Chairman Mr. thous
A $0.02 per ADS. net revenue of $59.5 Yuqiang Deng and its
$10.00 million and loss of $0.23 COO Mr. Zhi Zhu to ands
600.0
per ADS. acquire remaining )
shares of Sungy Mobile
for $4.90 per ADS.
400.0
$5.00
200.0
$0.00 0.0
Volume Price 30-day Trailing VWAP 60-day Trailing VWAP 90-day Trailing VWAP Offer
(1) Trailing Volume Weighted Average Price (VWAP) at Offer
Sungy Mobile Limited Historical Trading Metrics
(in thousands, except per Share)
During one year prior to Offer Post offer
Average Closing Price $8.66 Average Closing Price $4.85
High $20.51 High $5.14
Low $3.37 Low $4.59
Average Volume 180.4 Average Volume 95.7
% of Shares Issued and Outstanding 0.6% % of Shares Issued and Outstanding 0.3%
% of Float 1.4% % of Float 0.7%
Source: Capital IQ
CONFIDENTIAL 8
|
Introduction and Transaction Overview
Proposed Transaction
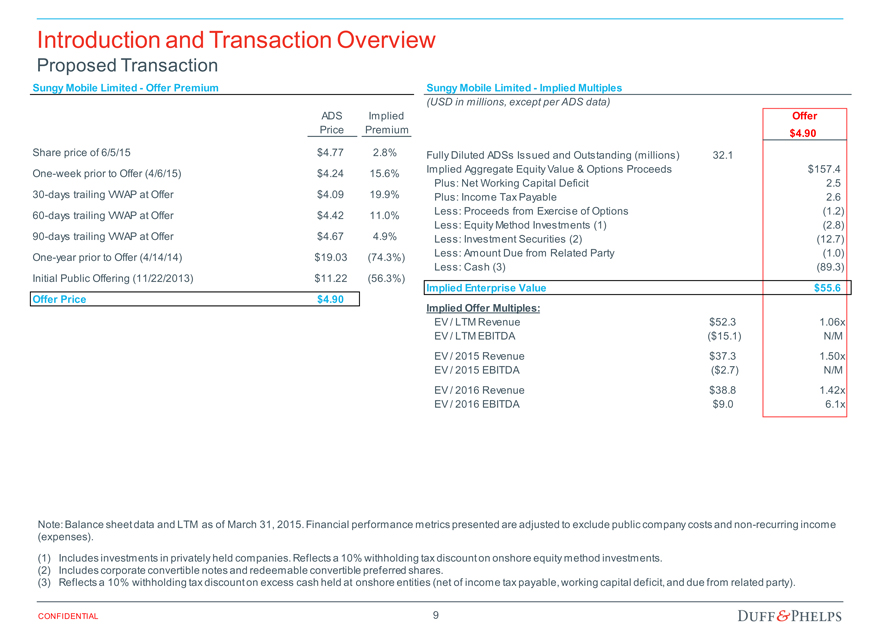
Sungy Mobile Limited—Offer Premium
ADS Implied
Price Premium
Share price of 6/5/15 $4.77 2.8%
One-week prior to Offer (4/6/15) $4.24 15.6%
30-days trailing VWAP at Offer $4.09 19.9%
60-days trailing VWAP at Offer $4.42 11.0%
90-days trailing VWAP at Offer $4.67 4.9%
One-year prior to Offer (4/14/14) $19.03 (74.3%)
Initial Public Offering (11/22/2013) $11.22 (56.3%)
Offer Price $4.90
Sungy Mobile Limited—Implied Multiples
(USD in millions, except per ADS data)
Offer
$4.90
Fully Diluted ADSs Issued and Outstanding (millions) 32.1 32.12
Implied Aggregate Equity Value & Options Proceeds $157.4
Plus: Net Working Capital Deficit $2.5 2.5
Plus: Income Tax Payable $2.6 2.6
Less: Proceeds from Exercise of Options ($1.2) (1.2)
Less: Equity Method Investments (1) ($2.8) (2.8)
Less: Investment Securities (2) ($12.7) (12.7)
Less: Amount Due from Related Party ($1.0) (1.0)
Less: Cash (3) ($89.3) (89.3)
Implied Enterprise Value $55.6
Implied Offer Multiples:
EV / LTM Revenue $52.3 1.06x
EV / LTM EBITDA ($15.1) N/M
EV / 2015 Revenue $37.3 1.50x
EV / 2015 EBITDA ($2.7) N/M
EV / 2016 Revenue $38.8 1.42x
EV / 2016 EBITDA $9.0 6.1x
Note: Balance sheet data and LTM as of March 31, 2015. Financial performance metrics presented are adjusted to exclude public company costs and non-recurring income
(expenses).
(1) Includes investments in privately held companies. Reflects a 10% withholding tax discount on onshore equity method investments.
(2) Includes corporate convertible notes and redeemable convertible preferred shares.
(3) Reflects a 10% withholding tax discount on excess cash held at onshore entities (net of income tax payable, working capital deficit, and due from related party).
CONFIDENTIAL 9
|
Introduction and Transaction Overview
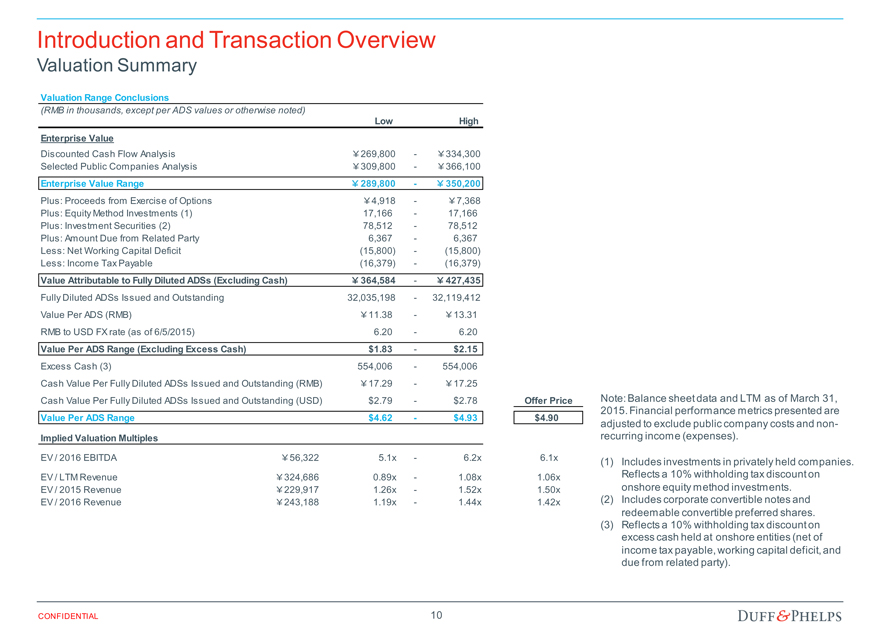
Valuation Summary
Valuation Range Conclusions
(RMB in thousands, except per ADS values or otherwise noted)
Low High
Enterprise Value
Discounted Cash Flow Analysis 269,800 — 334,300
Selected Public Companies Analysis 309,800 — 366,100
Enterprise Value Range 289,800 — 350,200
Plus: Proceeds from Exercise of Options 4,918 — 7,368
Plus: Equity Method Investments (1) 17,166 — 17,166
Plus: Investment Securities (2) 78,512 — 78,512
Plus: Amount Due from Related Party 6,367 — 6,367
Less: Net Working Capital Deficit (15,800) — (15,800)
Less: Income Tax Payable (16,379) — (16,379)
Value Attributable to Fully Diluted ADSs (Excluding Cash) 364,584 — 427,435
Fully Diluted ADSs Issued and Outstanding 32,035,198 — 32,119,412
Value Per ADS (RMB) 11.38 — 13.31
RMB to USD FX rate (as of 6/5/2015) 6.20 — 6.20
Value Per ADS Range (Excluding Excess Cash) $1.83 — $2.15
Excess Cash (3) 554,006 — 554,006
Cash Value Per Fully Diluted ADSs Issued and Outstanding (RMB) 17.29 — 17.25
Cash Value Per Fully Diluted ADSs Issued and Outstanding (USD) $2.79 — $2.78 Offer Price
Value Per ADS Range $4.62 — $4.93 $4.90
Implied Valuation Multiples
EV / 2016 EBITDA 56,322 5.1x — 6.2x 6.1x
EV / LTM Revenue 324,686 0.89x — 1.08x 1.06x
EV / 2015 Revenue 229,917 1.26x — 1.52x 1.50x
EV / 2016 Revenue 243,188 1.19x — 1.44x 1.42x
Note: Balance sheet data and LTM as of March 31, 2015. Financial performance metrics presented are adjusted to exclude public company costs and non-recurring income (expenses).
(1) Includes investments in privately held companies. Reflects a 10% withholding tax discount on onshore equity method investments.
(2) Includes corporate convertible notes and redeemable convertible preferred shares. (3) Reflects a 10% withholding tax discount on excess cash held at onshore entities (net of income tax payable, working capital deficit, and due from related party).
CONFIDENTIAL 10
|
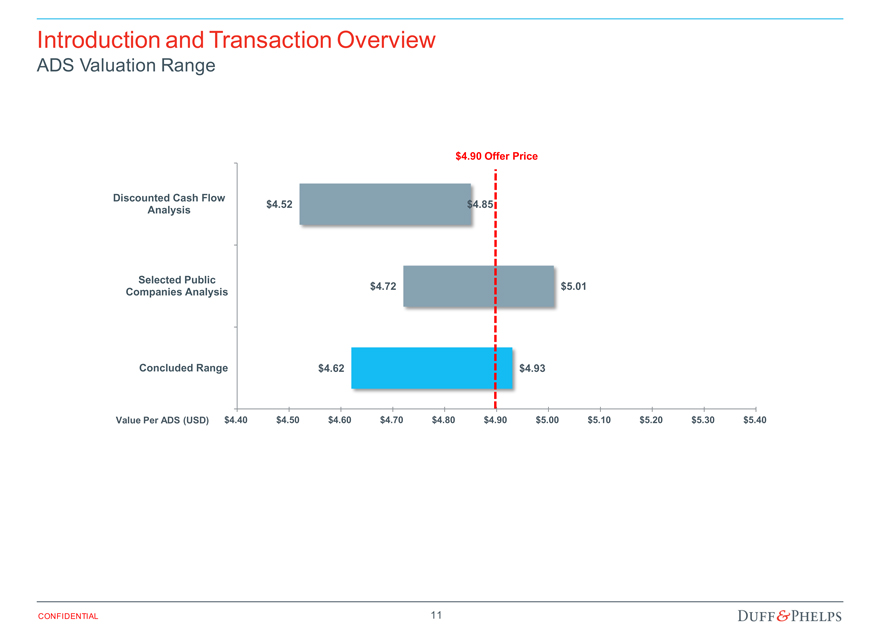
Introduction and Transaction Overview
ADS Valuation Range
$4.90 Offer Price
Discounted Cash Flow
Analysis $4.52 $4.85
Selected Public
Companies Analysis $4.72 $5.01
Concluded Range $4.62 $4.93
Value Per ADS (USD) $4.40 $4.50 $4.60 $4.70 $4.80 $4.90 $5.00 $5.10 $5.20 $5.30 $5.40
CONFIDENTIAL 11
|
Section 02 Valuation Analysis
|
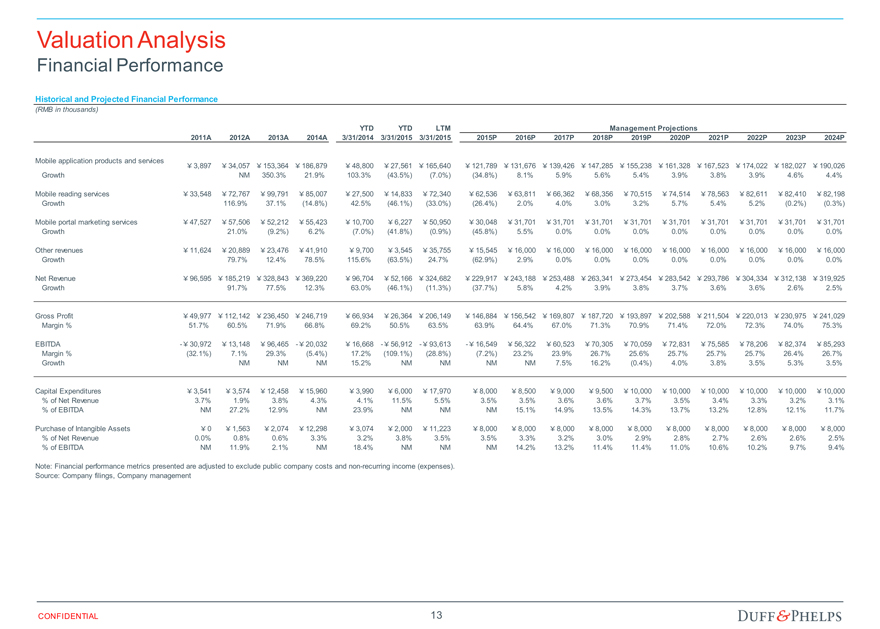
Valuation Analysis
Financial Performance
Historical and Projected Financial Performance
(RMB in thousands)
YTD YTD LTM Management Projections
2011A 2012A 2013A 2014A 3/31/2014 3/31/2015 3/31/2015 2015P 2016P 2017P 2018P 2019P 2020P 2021P 2022P 2023P 2024P
Mobile application products and services
3,897 34,057 153,364 186,879 48,800 27,561 165,640 121,789 131,676 139,426 147,285 155,238 161,328 167,523 174,022 182,027 190,026
Growth NM 350.3% 21.9% 103.3% (43.5%) (7.0%) (34.8%) 8.1% 5.9% 5.6% 5.4% 3.9% 3.8% 3.9% 4.6% 4.4%
Mobile reading services 33,548 72,767 99,791 85,007 27,500 14,833 72,340 62,536 63,811 66,362 68,356 70,515 74,514 78,563 82,611 82,410 82,198
Growth 116.9% 37.1% (14.8%) 42.5% (46.1%) (33.0%) (26.4%) 2.0% 4.0% 3.0% 3.2% 5.7% 5.4% 5.2% (0.2%) (0.3%)
Mobile portal marketing services 47,527 57,506 52,212 55,423 10,700 6,227 50,950 30,048 31,701 31,701 31,701 31,701 31,701 31,701 31,701 31,701 31,701
Growth 21.0% (9.2%) 6.2% (7.0%) (41.8%) (0.9%) (45.8%) 5.5% 0.0% 0.0% 0.0% 0.0% 0.0% 0.0% 0.0% 0.0%
Other revenues 11,624 20,889 23,476 41,910 9,700 3,545 35,755 15,545 16,000 16,000 16,000 16,000 16,000 16,000 16,000 16,000 16,000
Growth 79.7% 12.4% 78.5% 115.6% (63.5%) 24.7% (62.9%) 2.9% 0.0% 0.0% 0.0% 0.0% 0.0% 0.0% 0.0% 0.0%
Net Revenue 96,595 185,219 328,843 369,220 96,704 52,166 324,682 229,917 243,188 253,488 263,341 273,454 283,542 293,786 304,334 312,138 319,925
Growth 91.7% 77.5% 12.3% 63.0% (46.1%) (11.3%) (37.7%) 5.8% 4.2% 3.9% 3.8% 3.7% 3.6% 3.6% 2.6% 2.5%
Gross Profit 49,977 112,142 236,450 246,719 66,934 26,364 206,149 146,884 156,542 169,807 187,720 193,897 202,588 211,504 220,013 230,975 241,029
Margin % 51.7% 60.5% 71.9% 66.8% 69.2% 50.5% 63.5% 63.9% 64.4% 67.0% 71.3% 70.9% 71.4% 72.0% 72.3% 74.0% 75.3%
EBITDA - 30,972 13,148 96,465 - 20,032 16,668 - 56,912 - 93,613 - 16,549 56,322 60,523 70,305 70,059 72,831 75,585 78,206 82,374 85,293
Margin % (32.1%) 7.1% 29.3% (5.4%) 17.2% (109.1%) (28.8%) (7.2%) 23.2% 23.9% 26.7% 25.6% 25.7% 25.7% 25.7% 26.4% 26.7%
Growth NM NM NM 15.2% NM NM NM NM 7.5% 16.2% (0.4%) 4.0% 3.8% 3.5% 5.3% 3.5%
Capital Expenditures 3,541 3,574 12,458 15,960 3,990 6,000 17,970 8,000 8,500 9,000 9,500 10,000 10,000 10,000 10,000 10,000 10,000
% of Net Revenue 3.7% 1.9% 3.8% 4.3% 4.1% 11.5% 5.5% 3.5% 3.5% 3.6% 3.6% 3.7% 3.5% 3.4% 3.3% 3.2% 3.1%
% of EBITDA NM 27.2% 12.9% NM 23.9% NM NM NM 15.1% 14.9% 13.5% 14.3% 13.7% 13.2% 12.8% 12.1% 11.7%
Purchase of Intangible Assets 0 1,563 2,074 12,298 3,074 2,000 11,223 8,000 8,000 8,000 8,000 8,000 8,000 8,000 8,000 8,000 8,000
% of Net Revenue 0.0% 0.8% 0.6% 3.3% 3.2% 3.8% 3.5% 3.5% 3.3% 3.2% 3.0% 2.9% 2.8% 2.7% 2.6% 2.6% 2.5%
% of EBITDA NM 11.9% 2.1% NM 18.4% NM NM NM 14.2% 13.2% 11.4% 11.4% 11.0% 10.6% 10.2% 9.7% 9.4%
Note: Financial performance metrics presented are adjusted to exclude public company costs and non-recurring income (expenses).
Source: Company filings, Company management
CONFIDENTIAL 13
|
Valuation Analysis
Discounted Cash Flow Analysis – Methodology and Key Assumptions
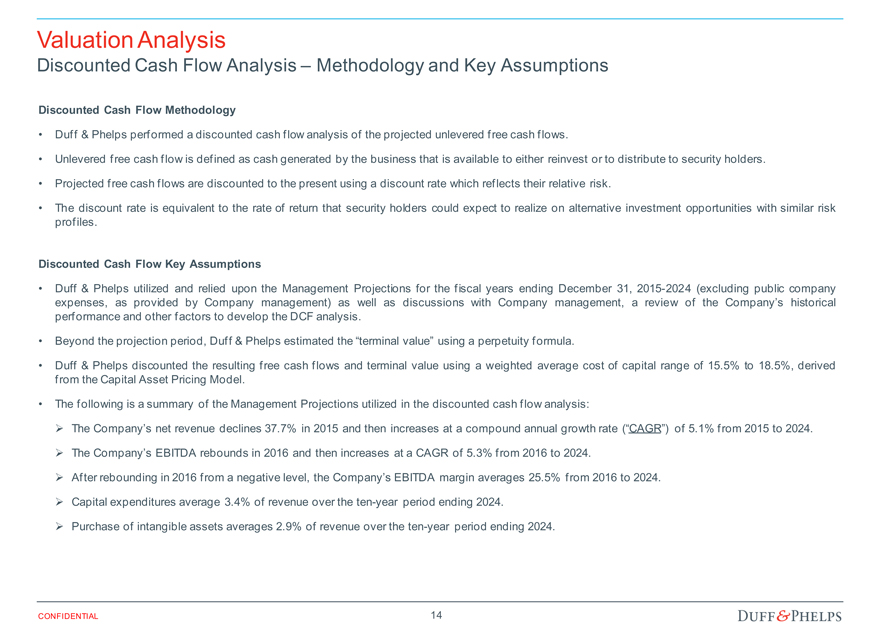
Discounted Cash Flow Methodology
Duff & Phelps performed a discounted cash flow analysis of the projected unlevered free cash flows.
Unlevered free cash flow is defined as cash generated by the business that is available to either reinvest or to distribute to security holders.
Projected free cash flows are discounted to the present using a discount rate which reflects their relative risk.
The discount rate is equivalent to the rate of return that security holders could expect to realize on alternative investment opportunities with similar risk profiles.
Discounted Cash Flow Key Assumptions
Duff & Phelps utilized and relied upon the Management Projections for the fiscal years ending December 31, 2015-2024 (excluding public company expenses, as provided by Company management) as well as discussions with Company management, a review of the Company’s historical performance and other factors to develop the DCF analysis.
Beyond the projection period, Duff & Phelps estimated the “terminal value” using a perpetuity formula.
Duff & Phelps discounted the resulting free cash flows and terminal value using a weighted average cost of capital range of 15.5% to 18.5%, derived from the Capital Asset Pricing Model.
The following is a summary of the Management Projections utilized in the discounted cash flow analysis:
The Company’s net revenue declines 37.7% in 2015 and then increases at a compound annual growth rate (“CAGR”) of 5.1% from 2015 to 2024.
The Company’s EBITDA rebounds in 2016 and then increases at a CAGR of 5.3% from 2016 to 2024.
After rebounding in 2016 from a negative level, the Company’s EBITDA margin averages 25.5% from 2016 to 2024.
Capital expenditures average 3.4% of revenue over the ten-year period ending 2024.
Purchase of intangible assets averages 2.9% of revenue over the ten-year period ending 2024.
CONFIDENTIAL 14
|
Valuation Analysis
DCF Valuation Summary
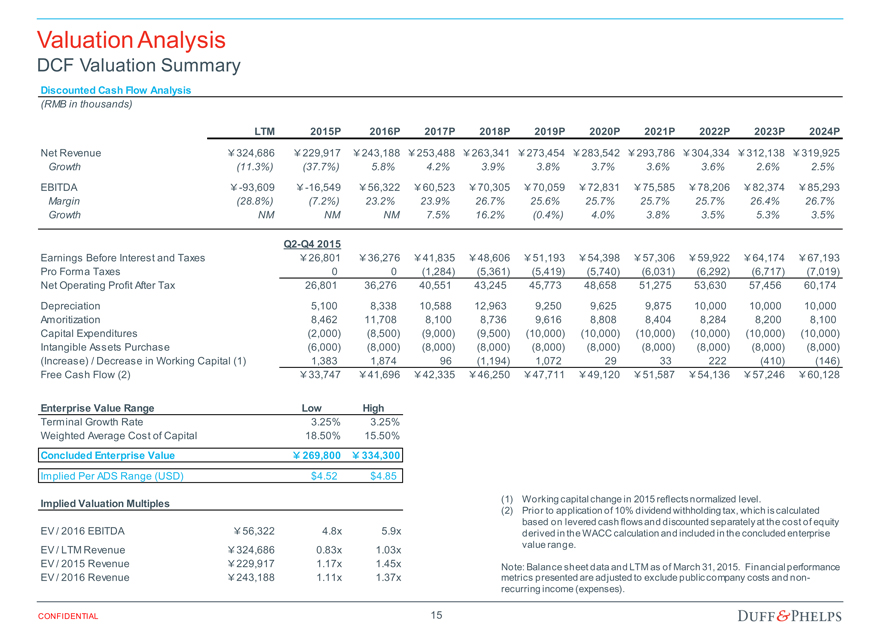
Discounted Cash Flow Analysis
(RMB in thousands)
LTM 2015P 2016P 2017P 2018P 2019P 2020P 2021P 2022P 2023P 2024P
Net Revenue 324,686 229,917 243,188 253,488 263,341 273,454 283,542 293,786 304,334 312,138 319,925
Growth (11.3%) (37.7%) 5.8% 4.2% 3.9% 3.8% 3.7% 3.6% 3.6% 2.6% 2.5%
EBITDA -93,609 -16,549 56,322 60,523 70,305 70,059 72,831 75,585 78,206 82,374 85,293
Margin (28.8%) (7.2%) 23.2% 23.9% 26.7% 25.6% 25.7% 25.7% 25.7% 26.4% 26.7%
Growth NM NM NM 7.5% 16.2% (0.4%) 4.0% 3.8% 3.5% 5.3% 3.5%
Q2-Q4 2015
Earnings Before Interest and Taxes 26,801 36,276 41,835 48,606 51,193 54,398 57,306 59,922 64,174 67,193
Pro Forma Taxes 0 0 (1,284) (5,361) (5,419) (5,740) (6,031) (6,292) (6,717) (7,019)
Net Operating Profit After Tax 26,801 36,276 40,551 43,245 45,773 48,658 51,275 53,630 57,456 60,174
Depreciation 5,100 8,338 10,588 12,963 9,250 9,625 9,875 10,000 10,000 10,000
Amoritization 8,462 11,708 8,100 8,736 9,616 8,808 8,404 8,284 8,200 8,100
Capital Expenditures (2,000) (8,500) (9,000) (9,500) (10,000) (10,000) (10,000) (10,000) (10,000) (10,000)
Intangible Assets Purchase (6,000) (8,000) (8,000) (8,000) (8,000) (8,000) (8,000) (8,000) (8,000) (8,000)
(Increase) / Decrease in Working Capital (1) 1,383 1,874 96 (1,194) 1,072 29 33 222 (410) (146)
Free Cash Flow (2) 33,747 41,696 42,335 46,250 47,711 49,120 51,587 54,136 57,246 60,128
Enterprise Value Range Low High
Terminal Growth Rate 3.25% 3.25%
Weighted Average Cost of Capital 18.50% 15.50%
Concluded Enterprise Value 269,800 334,300
Implied Per ADS Range (USD) $4.52 $4.85
Implied Valuation Multiples
EV / 2016 EBITDA 56,322 4.8x 5.9x
EV / LTM Revenue 324,686 0.83x 1.03x
EV / 2015 Revenue 229,917 1.17x 1.45x
EV / 2016 Revenue 243,188 1.11x 1.37x
(1) Working capital change in 2015 reflects normalized level.
(2) Prior to application of 10% dividend withholding tax, which is calculated based on levered cash flows and discounted separately at the cost of equity derived in the WACC calculation and included in the concluded enterprise value range.
Note: Balance sheet data and LTM as of March 31, 2015. Financial performance metrics presented are adjusted to exclude public company costs and non-recurring income (expenses).
CONFIDENTIAL 15
|
Valuation Analysis
Selected Public Companies / M&A Transactions Analysis Methodology
Selected Public Companies Analysis
Duff & Phelps selected eleven publicly traded companies in the mobile application, portal and internet industry that were deemed relevant to its analysis.
Duff & Phelps analyzed the financial performance of each of the publicly traded companies. Duff & Phelps then analyzed the selected public companies’ trading multiples of enterprise value to revenue, enterprise value to EBITDA, and price to earnings per share.
Selected M&A Transactions Analysis
Duff & Phelps selected precedent transactions within the mobile application and portal industry that it determined to be relevant to its analysis. Duff &
Phelps computed the LTM revenue and EBITDA for each of the target companies (where publicly disclosed). Duff & Phelps then calculated the implied enterprise value to revenue and enterprise value to EBITDA multiples for each transaction.
Due to certain characteristics of the transactions and the target companies in the Selected M&A Transactions Analysis, including business comparability, profitability, and lack of recent relevant transactions with enterprise value to EBITDA multiples, Duff & Phelps did not select valuation multiples for the Company based on the Selected M&A Transactions Analysis. Details on the Selected M&A Transactions Analysis are included in Appendix 2.
Duff & Phelps analyzed a number of factors in comparing the Company to the selected public companies, including historical and forecasted growth in revenue and profits, profit margins and other characteristics that we deemed relevant.
Rather than applying the average or median multiple from the public company set, Duff & Phelps selected multiples that reflect the Company’s size, growth outlook, capital requirements, profit margins, revenue mix, and other characteristics relative to the group.
None of the companies utilized for comparative purposes in the following analysis are directly comparable to the Company, and none of the transactions utilized for comparative purposes in the following analysis are directly comparable to the Proposed Transaction. Duff & Phelps does not have access to non-public information of any of the companies used for comparative purposes. Accordingly, a complete valuation analysis of the Company and the Proposed Transaction cannot rely solely upon a quantitative review of the selected companies and selected transactions, and involves complex considerations and judgments concerning differences in financial and operating characteristics of such companies and targets, as well as other factors that could affect their value relative to that of the Company. Therefore, the Selected Public
Companies / Selected M&A Transactions Analysis is subject to certain limitations.
CONFIDENTIAL 16
|
Valuation Analysis
Selected Public Companies Analysis – Financial Metrics
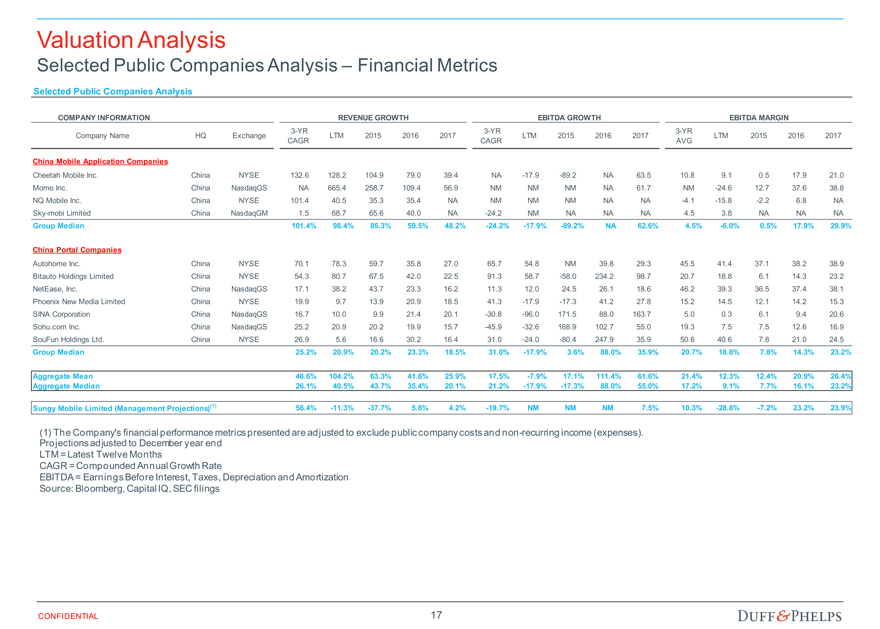
Selected Public Companies Analysis
($ in millions, except per share data)
COMPANY INFORMATION REVENUE GROWTH EBITDA GROWTH EBITDA MARGIN
3-YR 3-YR 3-YR
Company Name HQ Exchange LTM 2015 2016 2017 LTM 2015 2016 2017 LTM 2015 2016 2017
CAGR CAGR AVG
China Mobile Application Companies
Cheetah Mobile Inc. China NYSE 132.6 128.2 104.9 79.0 39.4 NA -17.9 -89.2 NA 63.5 10.8 9.1 0.5 17.9 21.0
Momo Inc. China NasdaqGS NA 665.4 258.7 109.4 56.9 NM NM NM NA 61.7 NM -24.6 12.7 37.6 38.8
NQ Mobile Inc. China NYSE 101.4 40.5 35.3 35.4 NA NM NM NM NA NA -4.1 -15.8 -2.2 6.8 NA
Sky-mobi Limited China NasdaqGM 1.5 68.7 65.6 40.0 NA -24.2 NM NA NA NA 4.5 3.8 NA NA NA
Group Median 101.4% 98.4% 85.3% 59.5% 48.2% -24.2% -17.9% -89.2% NA 62.6% 4.5% -6.0% 0.5% 17.9% 29.9%
China Portal Companies
Autohome Inc. China NYSE 70.1 78.3 59.7 35.8 27.0 65.7 54.8 NM 39.8 29.3 45.5 41.4 37.1 38.2 38.9
Bitauto Holdings Limited China NYSE 54.3 80.7 67.5 42.0 22.5 91.3 58.7 -58.0 234.2 98.7 20.7 18.8 6.1 14.3 23.2
NetEase, Inc. China NasdaqGS 17.1 38.2 43.7 23.3 16.2 11.3 12.0 24.5 26.1 18.6 46.2 39.3 36.5 37.4 38.1
Phoenix New Media Limited China NYSE 19.9 9.7 13.9 20.9 18.5 41.3 -17.9 -17.3 41.2 27.8 15.2 14.5 12.1 14.2 15.3
SINA Corporation China NasdaqGS 16.7 10.0 9.9 21.4 20.1 -30.8 -96.0 171.5 88.0 163.7 5.0 0.3 6.1 9.4 20.6
Sohu.com Inc. China NasdaqGS 25.2 20.9 20.2 19.9 15.7 -45.9 -32.6 168.9 102.7 55.0 19.3 7.5 7.5 12.6 16.9
SouFun Holdings Ltd. China NYSE 26.9 5.6 16.6 30.2 16.4 31.0 -24.0 -80.4 247.9 35.9 50.6 40.6 7.8 21.0 24.5
Group Median 25.2% 20.9% 20.2% 23.3% 18.5% 31.0% -17.9% 3.6% 88.0% 35.9% 20.7% 18.8% 7.8% 14.3% 23.2%
Aggregate Mean 46.6% 104.2% 63.3% 41.6% 25.9% 17.5% -7.9% 17.1% 111.4% 61.6% 21.4% 12.3% 12.4% 20.9% 26.4%
Aggregate Median 26.1% 40.5% 43.7% 35.4% 20.1% 21.2% -17.9% -17.3% 88.0% 55.0% 17.2% 9.1% 7.7% 16.1% 23.2%
Sungy Mobile Limited (Management Projections)(1) 56.4% -11.3% -37.7% 5.8% 4.2% -19.7% NM NM NM 7.5% 10.3% -28.8% -7.2% 23.2% 23.9%
(1) The Company’s financial performance metrics presented are adjusted to exclude public company costs and non-recurring income (expenses).
Projections adjusted to December year end
LTM = Latest Twelve Months
CAGR = Compounded Annual Growth Rate
EBITDA = Earnings Before Interest, Taxes, Depreciation and Amortization
Source: Bloomberg, Capital IQ, SEC filings CONFIDENTIAL 17
|
Valuation Analysis
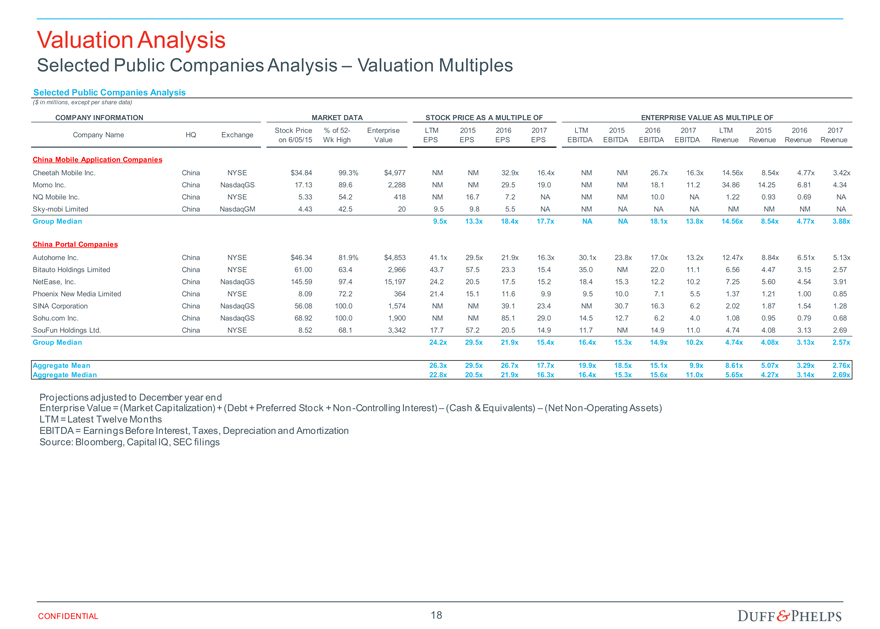
Selected Public Companies Analysis – Valuation Multiples
Selected Public Companies Analysis
($ in millions, except per share data)
COMPANY INFORMATION MARKET DATA STOCK PRICE AS A MULTIPLE OF ENTERPRISE VALUE AS MULTIPLE OF
Company Name HQ Exchange Stock Price % of 52- Enterprise LTM 2015 2016 2017 LTM 2015 2016 2017 LTM 2015 2016 2017
on 6/05/15 Wk High Value EPS EPS EPS EPS EBITDA EBITDA EBITDA EBITDA Revenue Revenue Revenue Revenue
China Mobile Application Companies
Cheetah Mobile Inc. China NYSE $34.84 99.3% $4,977 NM NM 32.9x 16.4x NM NM 26.7x 16.3x 14.56x 8.54x 4.77x 3.42x
Momo Inc. China NasdaqGS 17.13 89.6 2,288 NM NM 29.5 19.0 NM NM 18.1 11.2 34.86 14.25 6.81 4.34
NQ Mobile Inc. China NYSE 5.33 54.2 418 NM 16.7 7.2 NA NM NM 10.0 NA 1.22 0.93 0.69 NA
Sky-mobi Limited China NasdaqGM 4.43 42.5 20 9.5 9.8 5.5 NA NM NA NA NA NM NM NM NA
Group Median 9.5x 13.3x 18.4x 17.7x NA NA 18.1x 13.8x 14.56x 8.54x 4.77x 3.88x
China Portal Companies
Autohome Inc. China NYSE $46.34 81.9% $4,853 41.1x 29.5x 21.9x 16.3x 30.1x 23.8x 17.0x 13.2x 12.47x 8.84x 6.51x 5.13x
Bitauto Holdings Limited China NYSE 61.00 63.4 2,966 43.7 57.5 23.3 15.4 35.0 NM 22.0 11.1 6.56 4.47 3.15 2.57
NetEase, Inc. China NasdaqGS 145.59 97.4 15,197 24.2 20.5 17.5 15.2 18.4 15.3 12.2 10.2 7.25 5.60 4.54 3.91
Phoenix New Media Limited China NYSE 8.09 72.2 364 21.4 15.1 11.6 9.9 9.5 10.0 7.1 5.5 1.37 1.21 1.00 0.85
SINA Corporation China NasdaqGS 56.08 100.0 1,574 NM NM 39.1 23.4 NM 30.7 16.3 6.2 2.02 1.87 1.54 1.28
Sohu.com Inc. China NasdaqGS 68.92 100.0 1,900 NM NM 85.1 29.0 14.5 12.7 6.2 4.0 1.08 0.95 0.79 0.68
SouFun Holdings Ltd. China NYSE 8.52 68.1 3,342 17.7 57.2 20.5 14.9 11.7 NM 14.9 11.0 4.74 4.08 3.13 2.69
Group Median 24.2x 29.5x 21.9x 15.4x 16.4x 15.3x 14.9x 10.2x 4.74x 4.08x 3.13x 2.57x
Aggregate Mean 26.3x 29.5x 26.7x 17.7x 19.9x 18.5x 15.1x 9.9x 8.61x 5.07x 3.29x 2.76x
Aggregate Median 22.8x 20.5x 21.9x 16.3x 16.4x 15.3x 15.6x 11.0x 5.65x 4.27x 3.14x 2.69x
Projections adjusted to December year end
Enterprise Value = (Market Capitalization) + (Debt + Preferred Stock + Non-Controlling Interest) – (Cash & Equivalents) – (Net Non-Operating Assets)
LTM = Latest Twelve Months
EBITDA = Earnings Before Interest, Taxes, Depreciation and Amortization
Source: Bloomberg, Capital IQ, SEC filings
CONFIDENTIAL 18
|
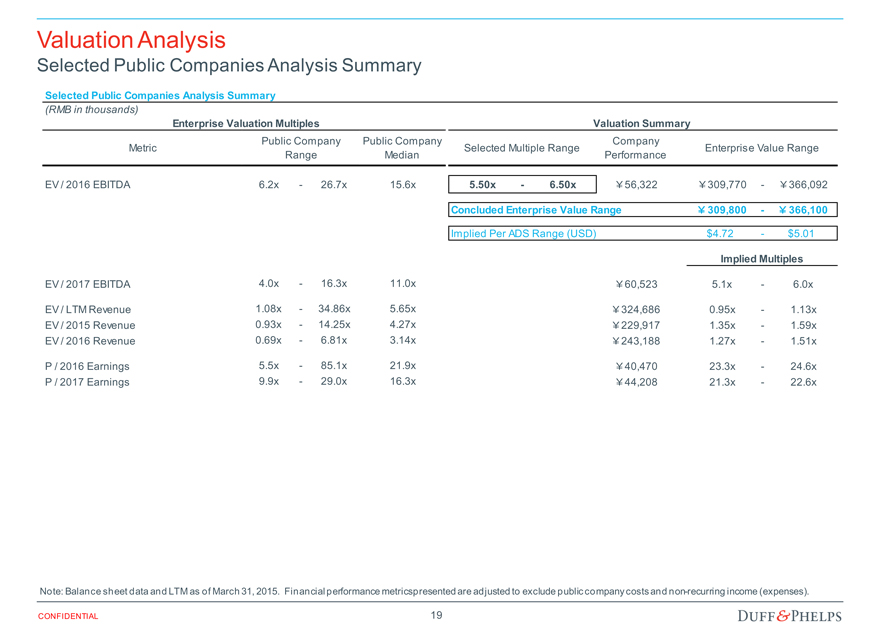
Valuation Analysis
Selected Public Companies Analysis Summary
Selected Public Companies Analysis Summary
(RMB in thousands)
Enterprise Valuation Multiples Valuation Summary
Public Company Public Company Company
Metric Selected Multiple Range Enterprise Value Range
Range Median Performance
EV / 2016 EBITDA 6.2x—26.7x 15.6x 5.50x—6.50x 56,322 309,770— 366,092
Concluded Enterprise Value Range 309,800— 366,100
Implied Per ADS Range (USD) $4.72—$5.01
Implied Multiples
EV / 2017 EBITDA 4.0x—16.3x 11.0x 60,523 5.1x—6.0x
EV / LTM Revenue 1.08x—34.86x 5.65x 324,686 0.95x—1.13x
EV / 2015 Revenue 0.93x—14.25x 4.27x 229,917 1.35x—1.59x
EV / 2016 Revenue 0.69x—6.81x 3.14x 243,188 1.27x—1.51x
P / 2016 Earnings 5.5x—85.1x 21.9x 40,470 23.3x—24.6x
P / 2017 Earnings 9.9x—29.0x 16.3x 44,208 21.3x—22.6x
Note: Balance sheet data and LTM as of March 31, 2015. Financial performance metrics presented are adjusted to exclude public company costs and non-recurring income (expenses).
CONFIDENTIAL 19
|
Appendix 01 Assumptions, Qualifications, and Limiting
Conditions
|
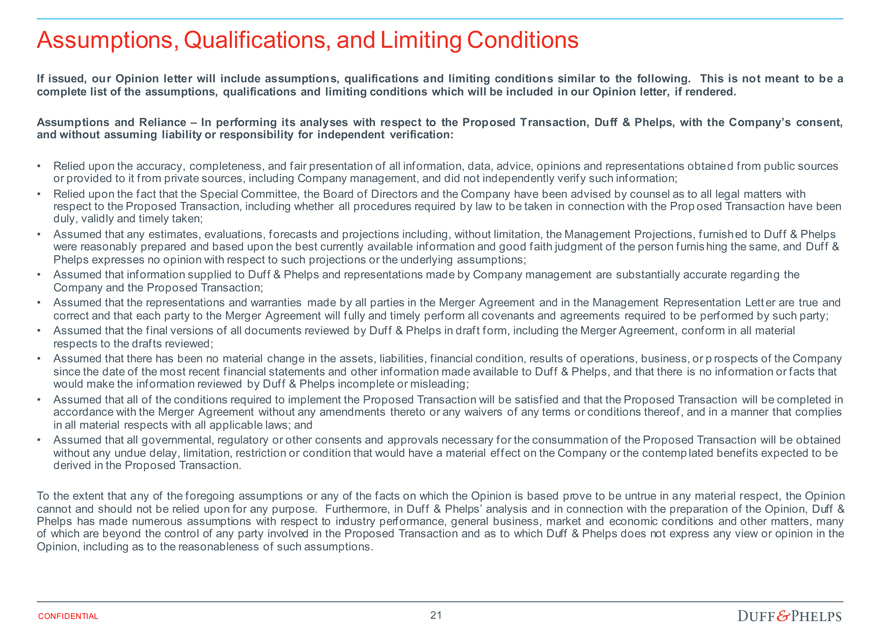
Assumptions, Qualifications, and Limiting Conditions
If issued, our Opinion letter will include assumptions, qualifications and limiting conditions similar to the following. This is not meant to be a
complete list of the assumptions, qualifications and limiting conditions which will be included in our Opinion letter, if rendered.
Assumptions and Reliance – In performing its analyses with respect to the Proposed Transaction, Duff & Phelps, with the Company’s consent,
and without assuming liability or responsibility for independent verification:
Relied upon the accuracy, completeness, and fair presentation of all information, data, advice, opinions and representations obtained from public sources
or provided to it from private sources, including Company management, and did not independently verify such information;
Relied upon the fact that the Special Committee, the Board of Directors and the Company have been advised by counsel as to all legal matters with
respect to the Proposed Transaction, including whether all procedures required by law to be taken in connection with the Proposed Transaction have been
duly, validly and timely taken;
Assumed that any estimates, evaluations, forecasts and projections including, without limitation, the Management Projections, furnished to Duff & Phelps
were reasonably prepared and based upon the best currently available information and good faith judgment of the person furnishing the same, and Duff &
Phelps expresses no opinion with respect to such projections or the underlying assumptions;
Assumed that information supplied to Duff & Phelps and representations made by Company management are substantially accurate regarding the
Company and the Proposed Transaction;
Assumed that the representations and warranties made by all parties in the Merger Agreement and in the Management Representation Letter are true and
correct and that each party to the Merger Agreement will fully and timely perform all covenants and agreements required to be performed by such party;
Assumed that the final versions of all documents reviewed by Duff & Phelps in draft form, including the Merger Agreement, conform in all material
respects to the drafts reviewed;
Assumed that there has been no material change in the assets, liabilities, financial condition, results of operations, business, or prospects of the Company
since the date of the most recent financial statements and other information made available to Duff & Phelps, and that there is no information or facts that
would make the information reviewed by Duff & Phelps incomplete or misleading;
Assumed that all of the conditions required to implement the Proposed Transaction will be satisfied and that the Proposed Transaction will be completed in
accordance with the Merger Agreement without any amendments thereto or any waivers of any terms or conditions thereof, and in a manner that complies
in all material respects with all applicable laws; and
Assumed that all governmental, regulatory or other consents and approvals necessary for the consummation of the Proposed Transaction will be obtained
without any undue delay, limitation, restriction or condition that would have a material effect on the Company or the contemplated benefits expected to be
derived in the Proposed Transaction.
To the extent that any of the foregoing assumptions or any of the facts on which the Opinion is based prove to be untrue in any material respect, the Opinion
cannot and should not be relied upon for any purpose. Furthermore, in Duff & Phelps’ analysis and in connection with the preparation of the Opinion, Duff &
Phelps has made numerous assumptions with respect to industry performance, general business, market and economic conditions and other matters, many
of which are beyond the control of any party involved in the Proposed Transaction and as to which Duff & Phelps does not express any view or opinion in the
Opinion, including as to the reasonableness of such assumptions.
CONFIDENTIAL 21
|
Assumptions, Qualifications, and Limiting Conditions
Qualifications – If issued, our Opinion will be qualified by the following:
Duff & Phelps has prepared the Opinion effective as of the date thereof. The Opinion is necessarily based upon the information made available to Duff & Phelps as of the date thereof and market, economic, financial and other conditions as they exist and can be evaluated as of the date thereof, and Duff & Phelps disclaims any undertaking or obligation to advise any person of any change in any fact or matter affecting the Opinion which may come or be brought to the attention of Duff & Phelps after the date thereof.
Duff & Phelps did not evaluate the Company’s solvency or conduct an independent appraisal or physical inspection of any specific assets, properties or liabilities (contingent or otherwise) of the Company.
Duff & Phelps has not been requested to, and did not, (i) initiate any discussions with, or solicit any indications of interest from, third parties with respect to the Proposed Transaction, the assets, businesses or operations of the Company, or any alternatives to the Proposed Transaction, (ii) negotiate the terms of the Proposed Transaction, and therefore, Duff & Phelps has assumed that such terms are the most beneficial terms, from the Company’s perspective, that could, under the circumstances, be negotiated among the parties to the Merger Agreement and the Proposed Transaction, or (iii) advise the Special Committee or any other party with respect to alternatives to the Proposed Transaction.
Duff & Phelps is not expressing any opinion as to the market price or value of Shares or ADSs (or anything else) after the announcement or the consummation of the Proposed Transaction (or any other time). The Opinion should not be construed as a valuation opinion, credit rating, solvency opinion, an analysis of the Company’s credit worthiness, as tax advice, or as accounting advice. Duff & Phelps has not made, and assumes no responsibility to make, any representation, or render any opinion, as to any legal matter.
In rendering the Opinion, Duff & Phelps is not expressing any opinion with respect to the amount or nature or any other aspect of any compensation payable to or to be received by the Company’s officers, directors, or employees, or any class of such persons, relative to the Merger Consideration, or with respect to the fairness of any such compensation. In addition, the Opinion does not address the fairness to, or any other consideration of, the holders of any class of securities, creditors or other constituencies of the Company, other than the holders of Shares (excluding the Excluded Shares, the Dissenting Shares and Class B Shares represented by ADSs) and ADSs (excluding ADSs representing the Excluded Shares).
CONFIDENTIAL 22
|
Assumptions, Qualifications, and Limiting Conditions
Limiting Conditions – If issued, the use of our Opinion will be strictly limited and will state:
The Opinion is furnished solely for the use and benefit of the Special Committee in connection with its consideration of the Proposed Transaction and is not intended to, and does not, confer any rights or remedies upon any other person, and is not intended to be used, and may not be used, by any other person or for any other purpose, without Duff & Phelps’ express consent.
The Opinion (i) does not address the merits of the underlying business decision to enter into the Proposed Transaction versus any alternative strategy or transaction; (ii) does not address any transaction related to the Proposed Transaction; (iii) is not a recommendation as to how the Special Committee or any stockholder should vote or act with respect to any matters relating to the Proposed Transaction, or whether to proceed with the Proposed Transaction or any related transaction, and (iv) does not indicate that the Merger Consideration is the best possibly attainable under any circumstances; instead, it merely states whether the Merger Consideration is within a range suggested by certain financial analyses. The decision as to whether to proceed with the Proposed Transaction or any related transaction may depend on an assessment of factors unrelated to the financial analysis on which the Opinion is based.
The Opinion should not be construed as creating any fiduciary duty on the part of Duff & Phelps to any party.
The Opinion is solely that of Duff & Phelps, and Duff & Phelps’ liability in connection with the Opinion shall be limited in accordance with the terms set forth in the engagement letter between Duff & Phelps, the Company, and the Special Committee dated April 28, 2015 (the “Engagement Letter”).
The Opinion is confidential, and its use and disclosure is strictly limited in accordance with the terms set forth in the Engagement Letter.
CONFIDENTIAL 23
|
Appendix 02 Selected M&A Transactions Analysis
|
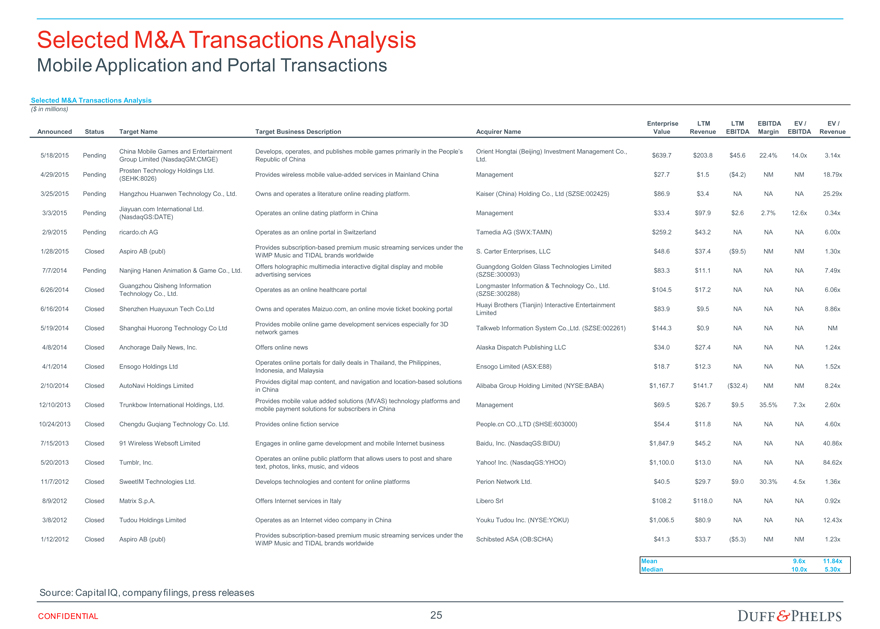
Selected M&A Transactions Analysis
Mobile Application and Portal Transactions
Selected M&A Transactions Analysis
($ in millions)
Enterprise LTM LTM EBITDA EV / EV /
Announced Status Target Name Target Business Description Acquirer Name Value Revenue EBITDA Margin EBITDA Revenue
China Mobile Games and Entertainment Develops, operates, and publishes mobile games primarily in the People’s Orient Hongtai (Beijing) Investment Management Co.,
5/18/2015 Pending $639.7 $203.8 $45.6 22.4% 14.0x 3.14x
Group Limited (NasdaqGM:CMGE) Republic of China Ltd.
Prosten Technology Holdings Ltd.
4/29/2015 Pending Provides wireless mobile value-added services in Mainland China Management $27.7 $1.5 ($4.2) NM NM 18.79x
(SEHK:8026)
3/25/2015 Pending Hangzhou Huanwen Technology Co., Ltd. Owns and operates a literature online reading platform. Kaiser (China) Holding Co., Ltd (SZSE:002425) $86.9 $3.4 NA NA NA 25.29x
Jiayuan.com International Ltd.
3/3/2015 Pending Operates an online dating platform in China Management $33.4 $97.9 $2.6 2.7% 12.6x 0.34x
(NasdaqGS:DATE)
2/9/2015 Pending ricardo.ch AG Operates as an online portal in Switzerland Tamedia AG (SWX:TAMN) $259.2 $43.2 NA NA NA 6.00x
Provides subscription-based premium music streaming services under the
1/28/2015 Closed Aspiro AB (publ) S. Carter Enterprises, LLC $48.6 $37.4 ($9.5) NM NM 1.30x
WiMP Music and TIDAL brands worldwide
Offers holographic multimedia interactive digital display and mobile Guangdong Golden Glass Technologies Limited
7/7/2014 Pending Nanjing Hanen Animation & Game Co., Ltd. $83.3 $11.1 NA NA NA 7.49x
advertising services (SZSE:300093)
Guangzhou Qisheng Information Longmaster Information & Technology Co., Ltd.
6/26/2014 Closed Operates as an online healthcare portal $104.5 $17.2 NA NA NA 6.06x
Technology Co., Ltd. (SZSE:300288)
Huayi Brothers (Tianjin) Interactive Entertainment
6/16/2014 Closed Shenzhen Huayuxun Tech Co.Ltd Owns and operates Maizuo.com, an online movie ticket booking portal $83.9 $9.5 NA NA NA 8.86x
Limited
Provides mobile online game development services especially for 3D
5/19/2014 Closed Shanghai Huorong Technology Co Ltd Talkweb Information System Co.,Ltd. (SZSE:002261) $144.3 $0.9 NA NA NA NM
network games
4/8/2014 Closed Anchorage Daily News, Inc. Offers online news Alaska Dispatch Publishing LLC $34.0 $27.4 NA NA NA 1.24x
Operates online portals for daily deals in Thailand, the Philippines,
4/1/2014 Closed Ensogo Holdings Ltd Ensogo Limited (ASX:E88) $18.7 $12.3 NA NA NA 1.52x
Indonesia, and Malaysia
Provides digital map content, and navigation and location-based solutions
2/10/2014 Closed AutoNavi Holdings Limited Alibaba Group Holding Limited (NYSE:BABA) $1,167.7 $141.7 ($32.4) NM NM 8.24x
in China
Provides mobile value added solutions (MVAS) technology platforms and
12/10/2013 Closed Trunkbow International Holdings, Ltd. Management $69.5 $26.7 $9.5 35.5% 7.3x 2.60x
mobile payment solutions for subscribers in China
10/24/2013 Closed Chengdu Guqiang Technology Co. Ltd. Provides online fiction service People.cn CO.,LTD (SHSE:603000) $54.4 $11.8 NA NA NA 4.60x
7/15/2013 Closed 91 Wireless Websoft Limited Engages in online game development and mobile Internet business Baidu, Inc. (NasdaqGS:BIDU) $1,847.9 $45.2 NA NA NA 40.86x
Operates an online public platform that allows users to post and share
5/20/2013 Closed Tumblr, Inc. Yahoo! Inc. (NasdaqGS:YHOO) $1,100.0 $13.0 NA NA NA 84.62x
text, photos, links, music, and videos
11/7/2012 Closed SweetIM Technologies Ltd. Develops technologies and content for online platforms Perion Network Ltd. $40.5 $29.7 $9.0 30.3% 4.5x 1.36x
8/9/2012 Closed Matrix S.p.A. Offers Internet services in Italy Libero Srl $108.2 $118.0 NA NA NA 0.92x
3/8/2012 Closed Tudou Holdings Limited Operates as an Internet video company in China Youku Tudou Inc. (NYSE:YOKU) $1,006.5 $80.9 NA NA NA 12.43x
Provides subscription-based premium music streaming services under the
1/12/2012 Closed Aspiro AB (publ) Schibsted ASA (OB:SCHA) $41.3 $33.7 ($5.3) NM NM 1.23x
WiMP Music and TIDAL brands worldwide
Mean 9.6x 11.84x
Median 10.0x 5.30x
Source: Capital IQ, company filings, press releases
CONFIDENTIAL 25
|
Appendix 03 Summary of Premiums Paid
|
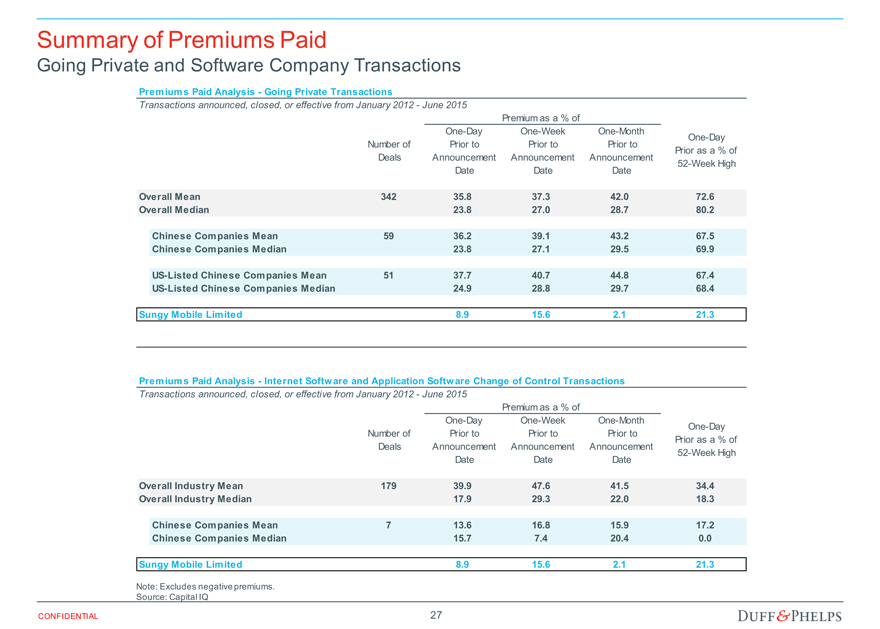
Summary of Premiums Paid
Going Private and Software Company Transactions
Premiums Paid Analysis—Going Private Transactions
Transactions announced, closed, or effective from January 2012—June 2015
Premium as a % of
One-Day One-Week One-Month One-Day
Number of Prior to Prior to Prior to Prior as a % of
Deals Announcement Announcement Announcement 52-Week High
Date Date Date
Overall Mean 342 35.8 37.3 42.0 72.6
Overall Median 23.8 27.0 28.7 80.2
Chinese Companies Mean 59 36.2 39.1 43.2 67.5
Chinese Companies Median 23.8 27.1 29.5 69.9
US-Listed Chinese Companies Mean 51 37.7 40.7 44.8 67.4
US-Listed Chinese Companies Median 24.9 28.8 29.7 68.4
Sungy Mobile Limited 8.9 15.6 2.1 21.3
Premiums Paid Analysis—Internet Softw are and Application Softw are Change of Control Transactions
Transactions announced, closed, or effective from January 2012—June 2015
Premium as a % of
One-Day One-Week One-Month One-Day
Number of Prior to Prior to Prior to Prior as a % of
Deals Announcement Announcement Announcement 52-Week High
Date Date Date
Overall Industry Mean 179 39.9 47.6 41.5 34.4
Overall Industry Median 17.9 29.3 22.0 18.3
Chinese Companies Mean 7 13.6 16.8 15.9 17.2
Chinese Companies Median 15.7 7.4 20.4 0.0
Sungy Mobile Limited 8.9 15.6 2.1 21.3
Note: Excludes negative premiums.
Source: Capital IQ
CONFIDENTIAL 27