SPRINGLEAF HOLDINGS, INC. REPORTS THIRD QUARTER 2014 RESULTS
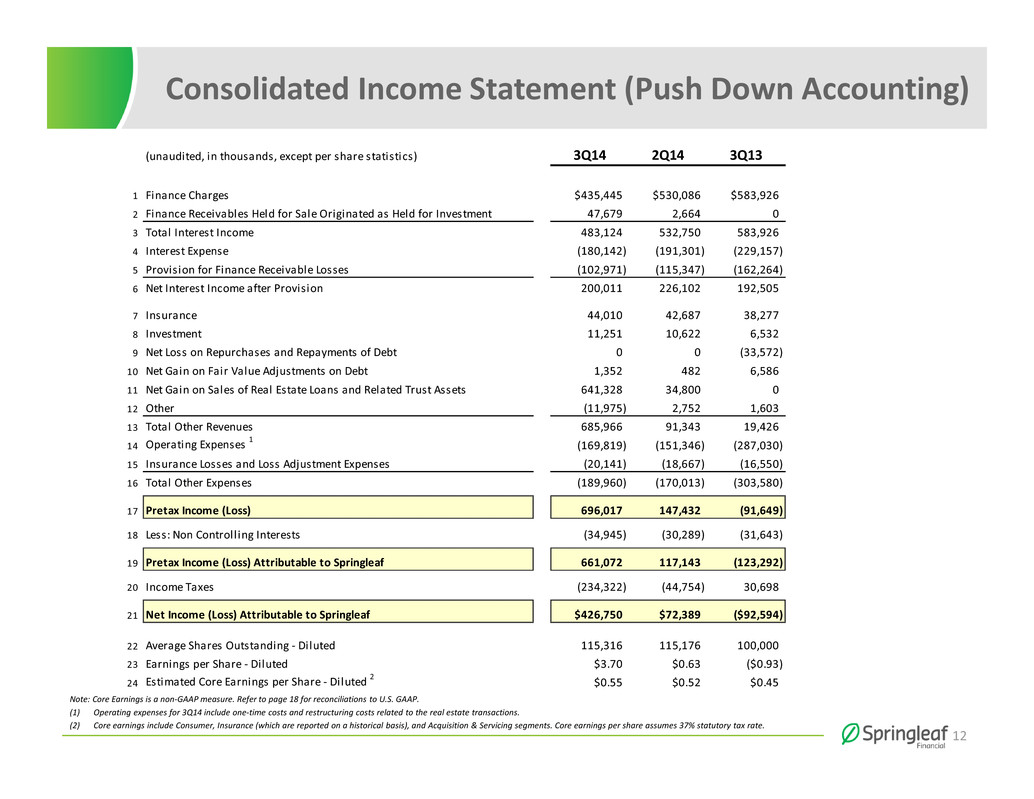
Evansville, IN, November 14, 2014 - Springleaf Holdings, Inc. (NYSE:LEAF), today reported net income of $427 million, or $3.70 per diluted share for the third quarter of 2014, compared with a net loss of $93 million or $0.93 per diluted share in the third quarter of 2013 (based on the pre-initial public offering share count of 100 million shares).
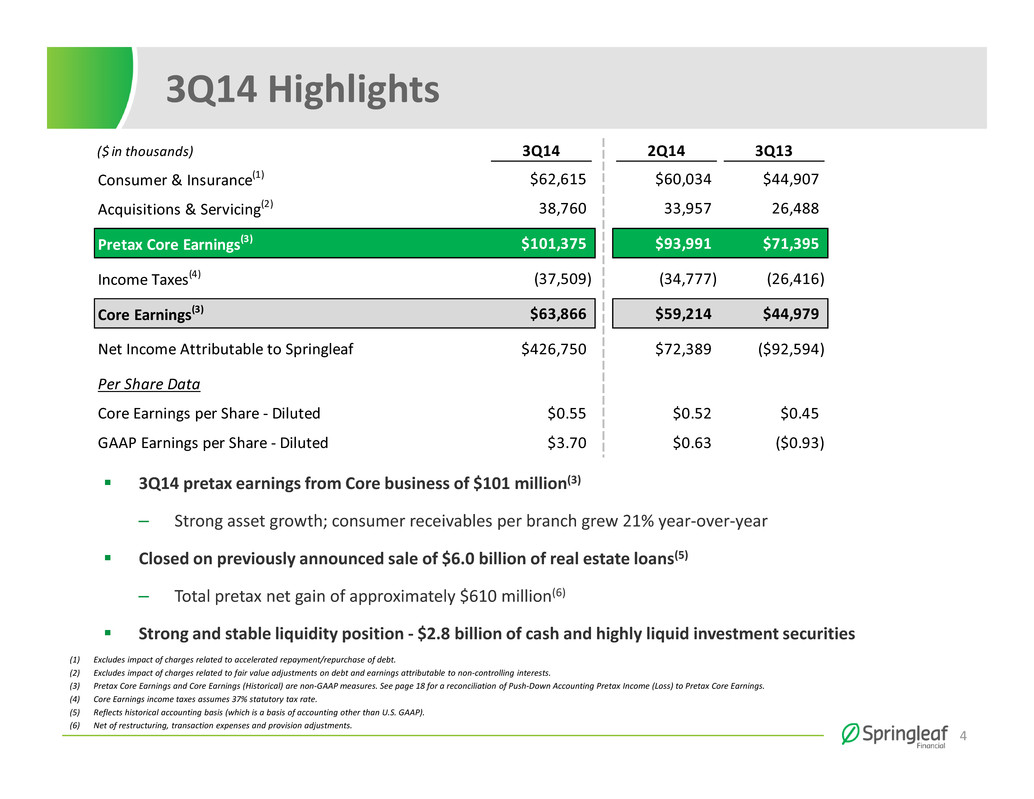
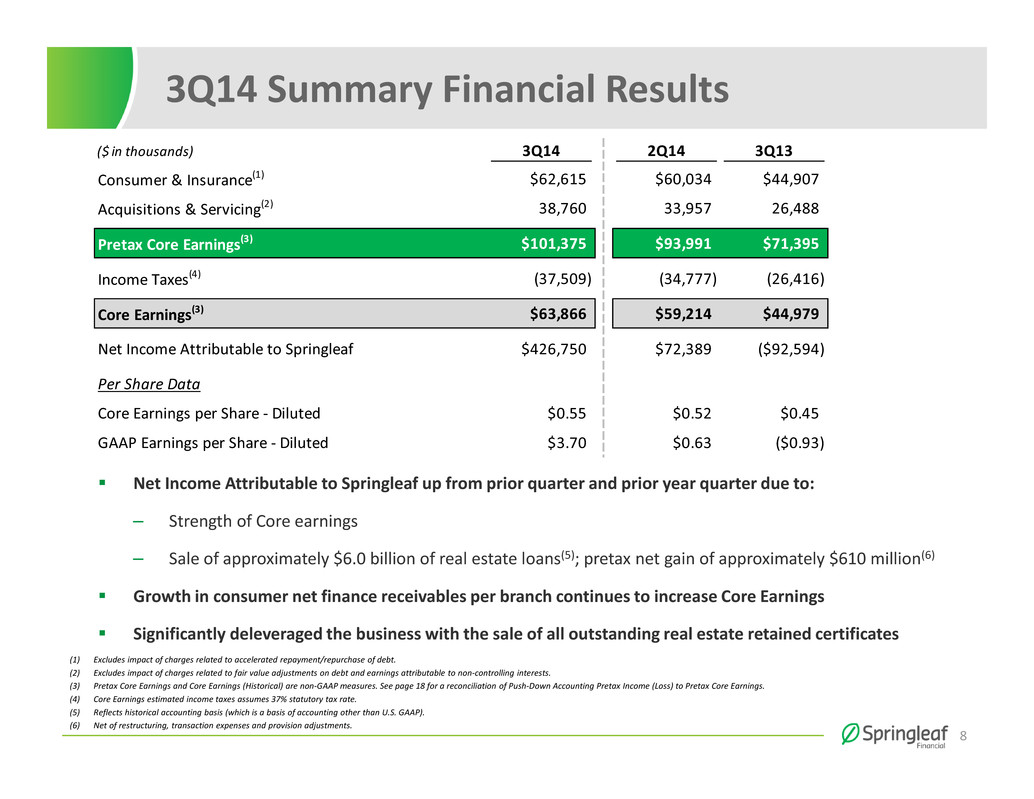
Net income in the third quarter of 2014 included an approximately $610 million pretax net gain1 from the sale of approximately $6.0 billion of real estate assets2,3.
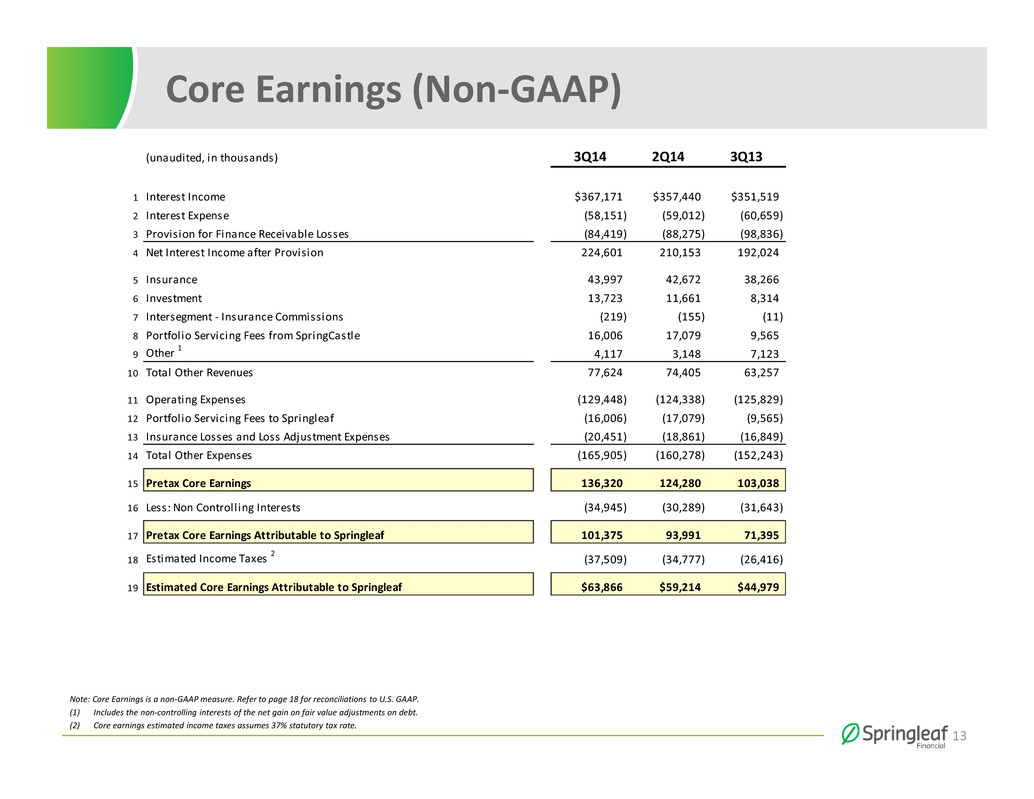
Core Earnings (a non-GAAP measure) for our Core Consumer Operations for the quarter was $64 million, versus $45 million in the prior year quarter, and Core Earnings per diluted share (a non-GAAP measure) was $0.55 for the third quarter versus $0.45 in the prior year quarter4.
Third Quarter Highlights
| |
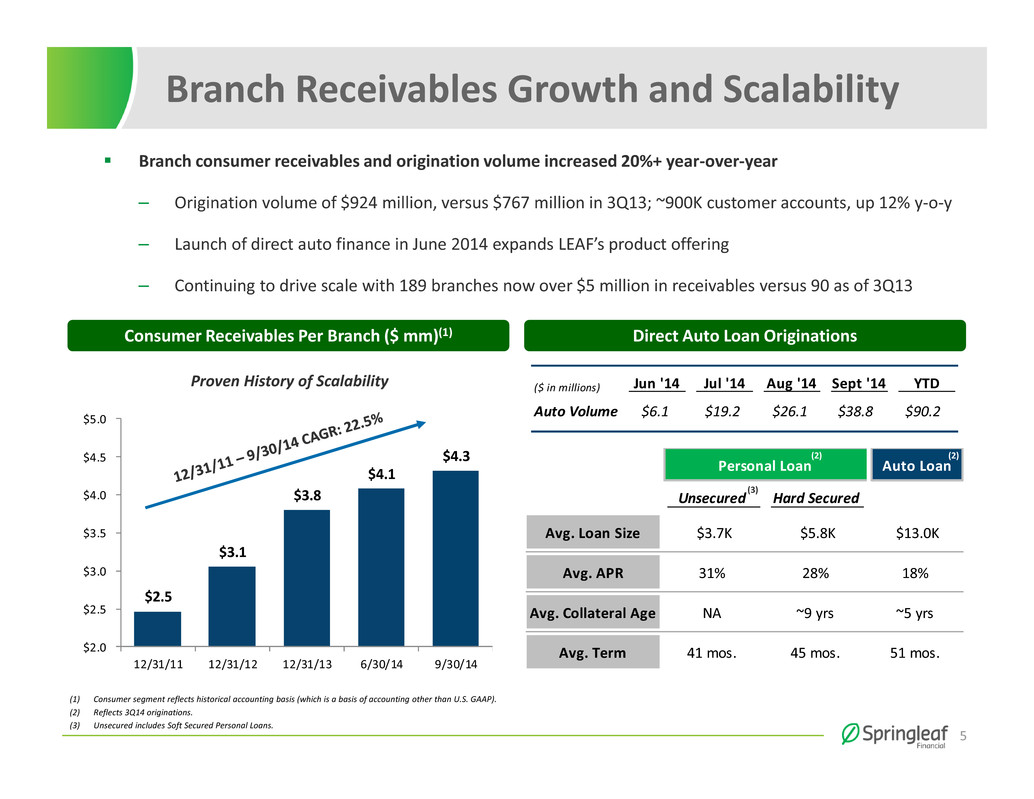
| • | Branch consumer net finance receivables reached $3.6 billion at September 30, 2014, an increase of $610 million, or 21% from September 30, 2013, and up 6% from June 30, 2014. |
| |
| • | Consumer net finance receivables per branch were $4.3 million at September 30, 2014, up 21% from September 30, 2013 and 6% from June 30, 2014. |
| |
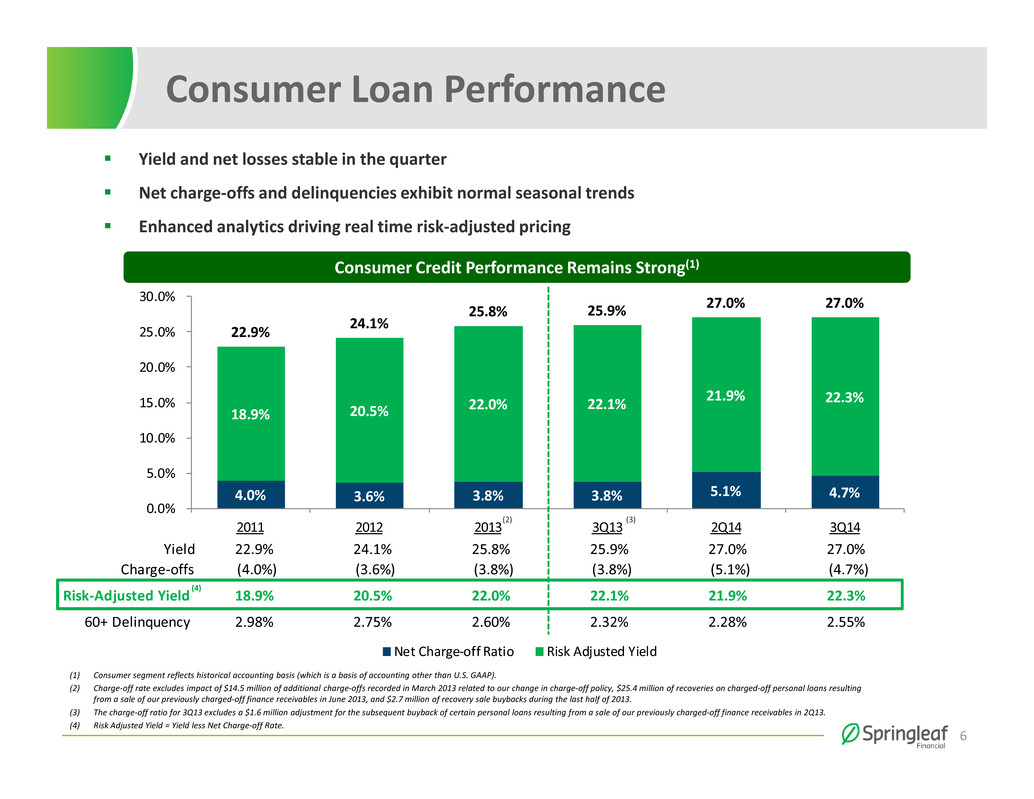
| • | Risk-adjusted yield for our Consumer segment in the quarter was 22.34%, up 45 basis points from the third quarter 20135. |
| |
| • | The company closed on the sale of its interests in approximately $6.0 billion of non-core real estate assets and related servicing2,3, essentially completing the company’s previously disclosed mortgage liquidation plan. The transactions generated a pretax gain of approximately $610 million1. |
“Continued execution of our strategy to drive profitable growth in our Core Consumer business led to another quarter of outstanding results,” said Jay Levine, President and CEO of Springleaf. “Our principal objective in the consumer lending business has been to realize the benefits of scale in our branch operations by continuing to grow receivables per branch, and we reached
1 Gain from sale of real estate assets net of restructuring, transaction expenses and provision adjustments.
2 Reflects historical accounting basis (which is a basis of accounting other than U.S. GAAP). All references to non-GAAP measures in this press release are reconciled at the end of the release.
3 Historical receivables, excluding allowance.
4 Excludes the impact of charges related to accelerated repayment/repurchase of debt, fair value adjustments on debt and earnings attributable to non-controlling interests.
5 The charge off ratio for 3Q13 includes a $1.6 million adjustment for the subsequent buyback of certain personal loans resulting from a sale of our previously charged-off finance receivables in 2Q13.
that objective again this quarter, helping to drive Core Earnings up 42% from last year. The combination of solid performance in our branches and our very strong cash position leaves us well-positioned to continue to grow.”
Core Consumer Operations: (Reported on a historical accounting basis, which is a non-GAAP measure. Refer to the reconciliation of non-GAAP to comparable GAAP measures below.)
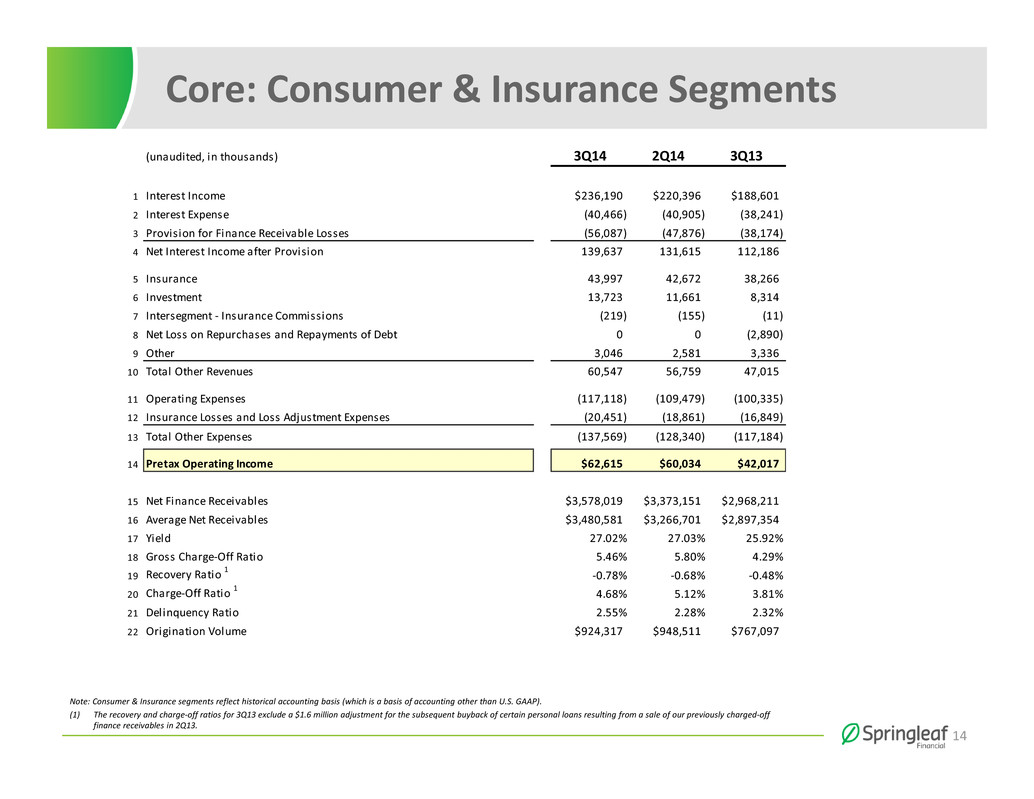
Consumer & Insurance
Consumer and Insurance pretax income was $63 million in the quarter versus $45 million in the third quarter of 2013, and up from $60 million in the second quarter of 20146.
Consumer net finance receivables reached $3.6 billion at September 30, 2014, an increase of 21% from September 30, 2013 and 6% from June 30, 2014, driven by the company’s focus on increasing personal loan originations through its branch network and diversifying its product offerings. Consumer net finance receivables per branch continued to grow, reaching $4.3 million at September 30, 2014, up from $4.1 million at June 30, 2014 and $3.6 million at September 30, 2013.
Net interest income of $196 million increased 30% from the prior year quarter, driven by 20% growth in average net receivables and strength in consumer yield of 27.02%. Net interest income increased 9% from the prior quarter. Yield in the current quarter continued to benefit from the change in the state-by-state mix of loan originations. Risk adjusted yield, representing yield less net charge-off rate, was 22.34% in the quarter, up 45 basis points from the third quarter of 2013 and 43 basis points from the second quarter of 2014.
The annualized net charge-off ratio was 4.68% in the quarter, versus 4.03% in the prior year quarter and 5.12% in the prior quarter7.
The annualized gross charge-off ratio was 5.46% in the quarter, up 117 basis points from the prior year quarter and down 34 basis points from the second quarter 2014. Recoveries continued to normalize in the quarter at 78 basis points versus 26 basis points in the third quarter of 2013, following the sale of a pool of previously charged-off accounts in June 20137.
The 60+ delinquency ratio was 2.55% at quarter end, versus 2.32% in the prior year quarter and 2.28% in the prior quarter.
6 Consumer and Insurance segments reflect historical accounting basis (which is a basis of accounting other than U.S. GAAP). Pretax income excludes impact of charges related to accelerated repayment / repurchase of debt.
7 The recovery and charge off ratios for 3Q13 include a $1.6 million adjustment for the subsequent buyback of certain personal loans resulting from a sale of our previously charged-off finance receivables in 2Q13.
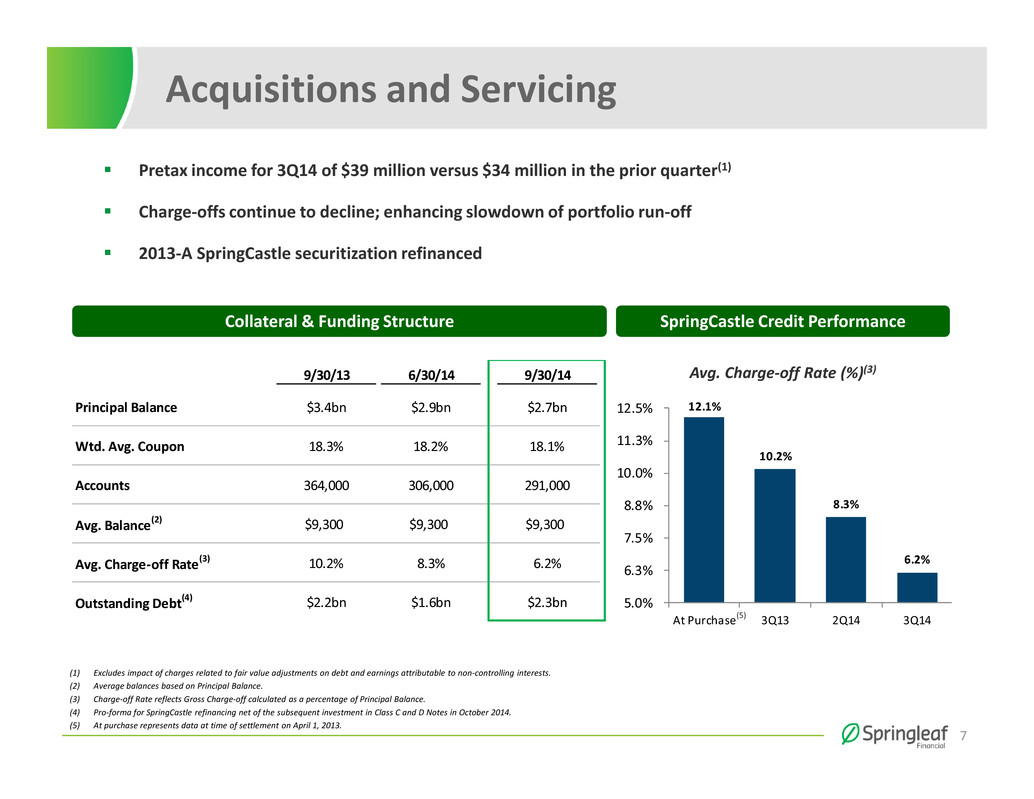
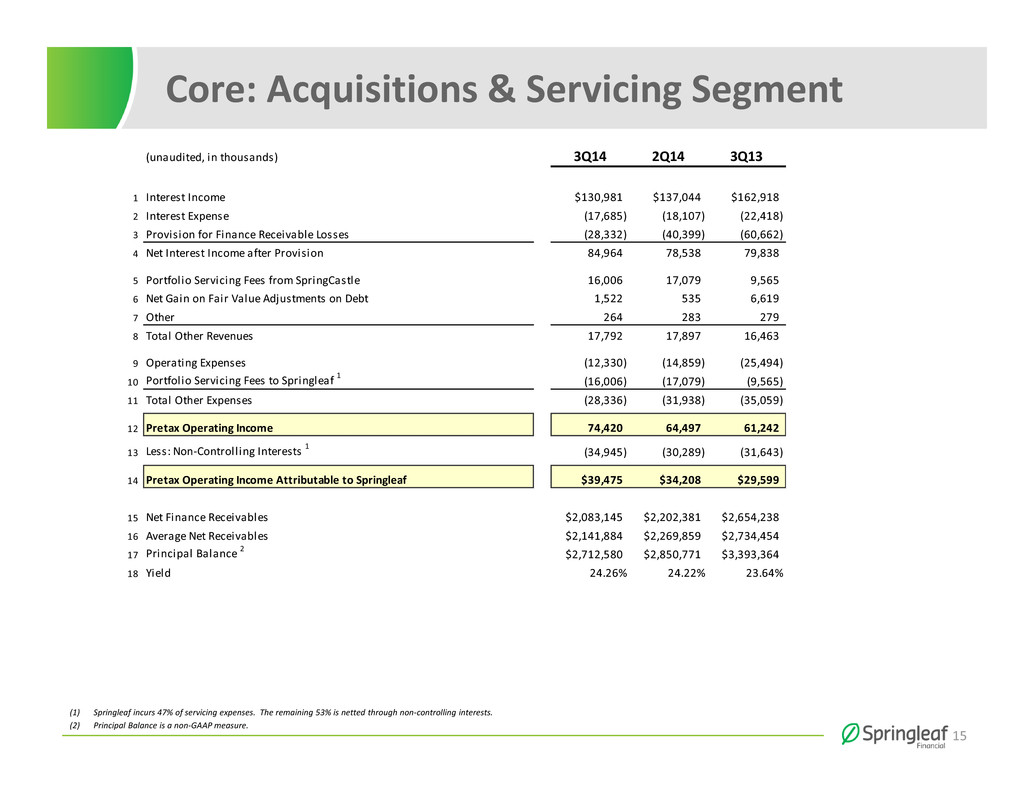
Acquisitions and Servicing
The Acquisitions and Servicing segment contributed $39 million to the company’s consolidated pretax income in the quarter8. The entire Acquisitions and Servicing segment generated pretax income of $74 million in the quarter, with net interest income of $113 million and yield of 24.26%9. Actual net finance receivables at quarter-end were $2.1 billion, down from $2.2 billion at June 30, 2014. The principal balance of the portfolio was $2.7 billion at quarter-end versus $2.9 billion at June 30, 2014.
The annualized net charge-off ratio was 5.31% in the quarter, versus 8.58% in the prior year quarter and 7.07% in the prior quarter.
The annualized gross charge-off ratio was 5.83% in the quarter, down 307 basis points from the prior year quarter and down 195 basis points from the second quarter 2014, largely due to the slower pace of portfolio run-off. Recoveries continued to improve in the quarter at 52 basis points versus 32 basis points in the third quarter of 2013.
The delinquency ratio for the Acquisitions and Servicing segment was 5.11% at the end of the quarter, an increase of 7 basis points from the prior quarter end.
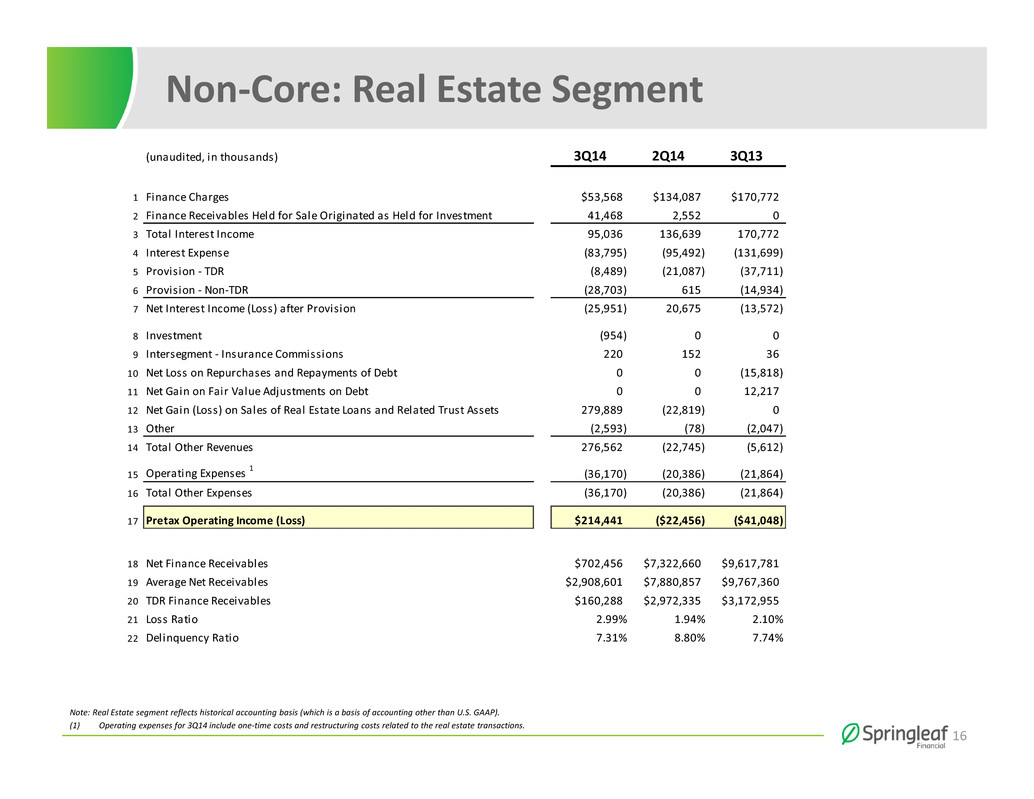
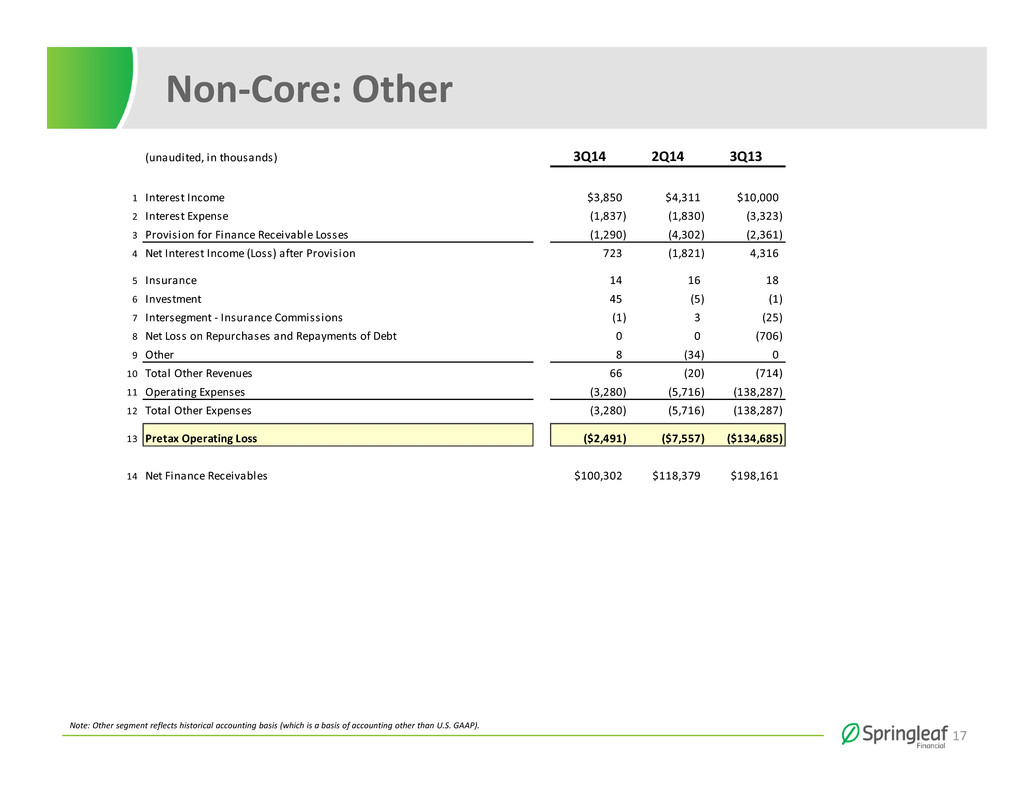
Legacy Real Estate and Other Non-Core
Excluding gains from the recent sales10, the Non-Core Portfolio (consisting of legacy real estate loans) and Other Non-Core activities generated a pretax loss of $50 million in the quarter, including a pretax loss of $48 million attributable to the legacy real estate loan portfolio11. Other Non-Core activities resulted in a loss of $2 million in the quarter.
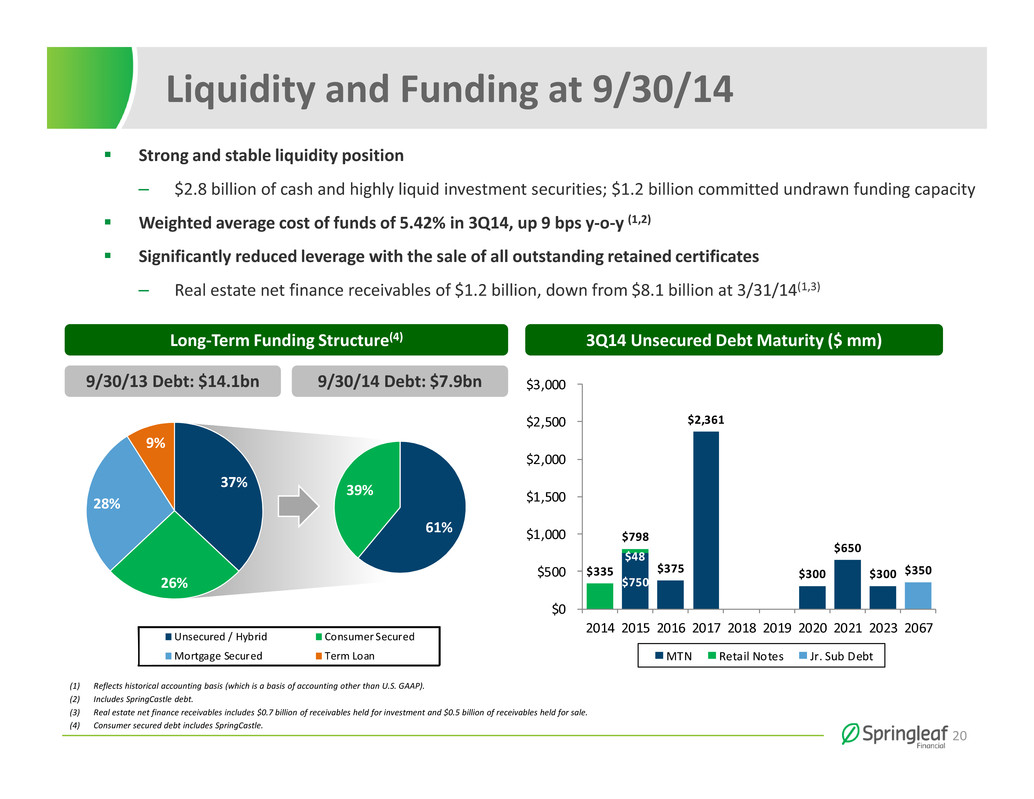
Liquidity and Capital Resources
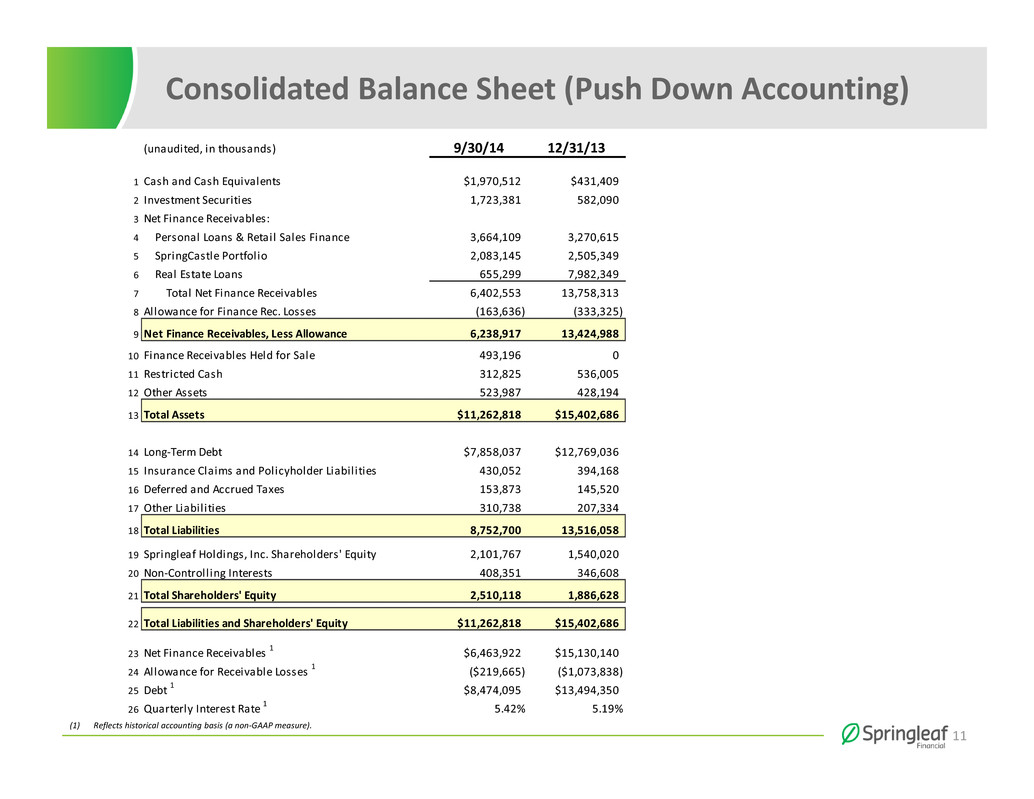
As of September 30, 2014, the company had $2.8 billion of cash and highly liquid investment securities. The company had total outstanding debt of $7.9 billion at quarter-end, in a variety of debt instruments.
8 Excludes impact of one-time items related to fair value adjustments on debt and earnings attributable to non-controlling interests.
9 Includes impact of charges related to fair value adjustments on debt and earnings attributable to non-controlling interests.
10 Gain from sale of real estate assets net of restructuring, transaction expenses and provision adjustments.
11 Real Estate segment and Other Non-Core reflect historical accounting basis (which is a basis of accounting other than U.S. GAAP).
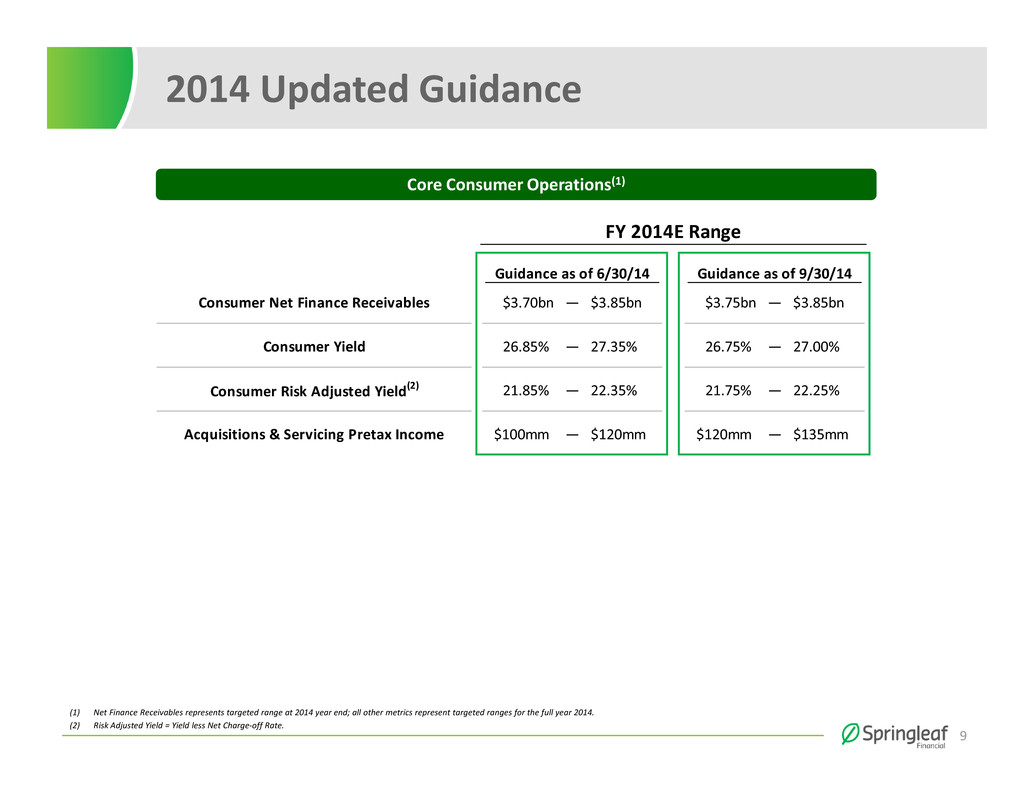
2014 Guidance
The company has previously established 2014 guidance ranges for certain metrics related to its Core Consumer Operations. The company is updating its previously provided ranges as follows:
|
| | | | |
| | FY 2013(1) | 3Q14(2) | 2014 Guidance (as of 6/30/14) | 2014 Guidance (as of 9/30/14) |
| Consumer Net Finance Receivables at Period End | $3.14bn | $3.58bn | $3.70bn - $3.85bn | $3.75bn - $3.85bn |
| Consumer Yield | 25.84% | 27.02% | 26.85% - 27.35% | 26.75% - 27.00% |
Consumer Risk-Adjusted Yield(3) | 22.03% | 22.34% | 21.85% - 22.35% | 21.75% - 22.25% |
Acquisitions & Servicing Pretax Income(4) | $109mm | $39mm | $100mm - $120mm | $120mm - $135mm |
| |
| (1) | Net Finance Receivables represents data as of December 31, 2013. All other metrics represent data for the year ended December 31, 2013. |
| |
| (2) | Net Finance Receivables represents data as of September 30, 2014. All other metrics represent data for the quarter ended September 30, 2014. |
| |
| (3) | Risk Adjusted Yield = Yield less Net Charge-off rates. For FY 2013, charge-off rates exclude impact from change in charge-off policy, the sale of charged-off accounts in June 2013, and recovery sale buybacks in 3Q13 and 4Q13. |
| |
| (4) | Excludes impact of charges related to fair value adjustments on debt and earnings attributable to non-controlling interests. |
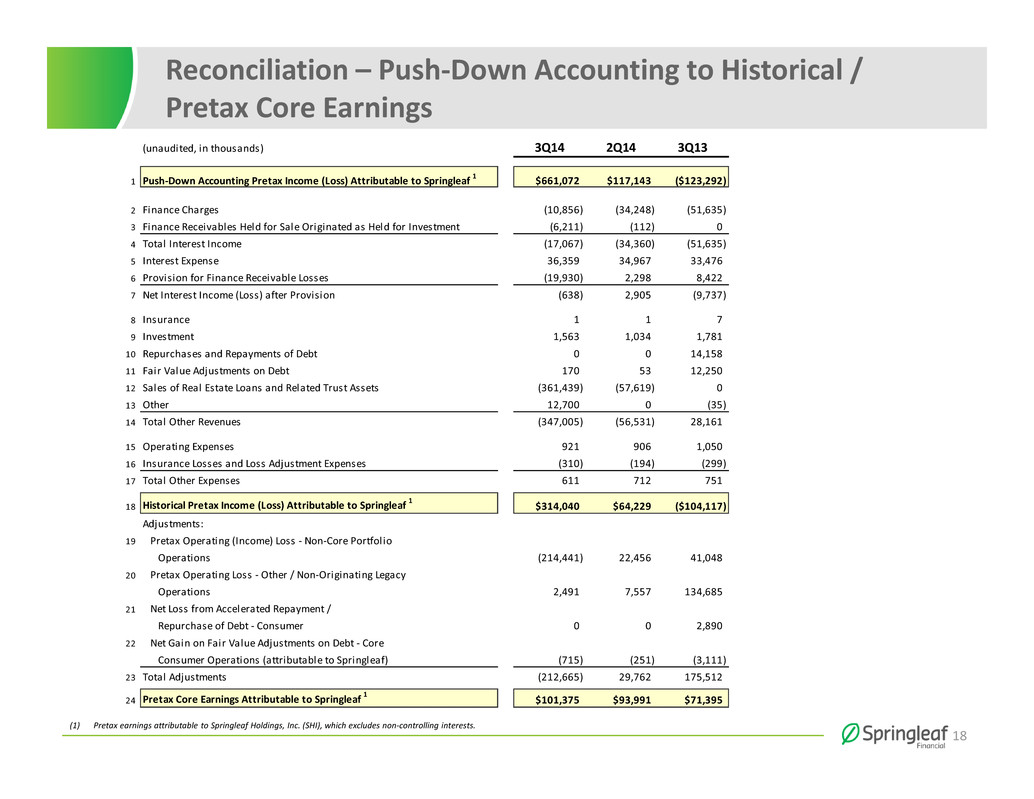
Use of Non-GAAP Measures
We report the operating results of our Core Consumer Operations, Non-Core Portfolio and Other Non-Core using the same accounting basis that we employed prior to 2010 when we were acquired by Fortress (the “Fortress Acquisition”), which we refer to as “historical accounting basis,” to provide a consistent basis for both management and other interested third parties to better understand our operating results. The historical accounting basis (which is a basis of accounting other than U.S. GAAP) also provides better comparability of the operating results of these segments to our competitors and other companies in the financial services industry. The historical accounting basis is not applicable to Acquisitions and Servicing since this segment resulted from the purchase of the SpringCastle Portfolio on April 1, 2013 and therefore, was not affected by the Fortress Acquisition.
Pretax Core Earnings is a key performance measure used by management in evaluating the performance of our Core Consumer Operations. Pretax Core Earnings represents our income (loss) before provision for (benefit from) income taxes on a historical accounting basis and excludes results of operations from our Non-Core Portfolio (legacy real estate loans) and other
non-originating legacy operations, gains (losses) resulting from accelerated long-term debt repayment and repurchases of long-term debt related to Consumer, gains (losses) on fair value adjustments on debt related to Core Consumer Operations (attributable to Springleaf) and results of operations attributable to non-controlling interests. Pretax Core Earnings provides us with a key measure of our Core Consumer Operations’ performance as it assists us in comparing its performance on a consistent basis. Management believes Pretax Core Earnings is useful in assessing the profitability of our core business and uses Pretax Core Earnings in evaluating our operating performance. Pretax Core Earnings is a non-GAAP measure and should be considered in addition to, but not as a substitute for or superior to, operating income, net income, operating cash flow, and other measures of financial performance prepared in accordance with U.S. GAAP.
Conference Call Information
Springleaf management will host a conference call and webcast to discuss our third quarter results and other general matters at 10:00 am Eastern on Friday, November 14, 2014. Both the call and webcast are open to the general public. The general public is invited to listen to the call by dialing 877-330-3668 (U.S. domestic), or 678-304-6859 (international), conference ID 28787400, or via a live audio webcast through the Investor Relations section of the website. For those unable to listen to the live broadcast, a replay will be available on our website or by dialing 800-585-8367 (U.S. domestic), or 404-537-3406, conference ID 28787400, beginning approximately two hours after the event. The replay of the conference call will be available through November 27, 2014. An investor presentation will be available by visiting the Investor Relations page of Springleaf’s website at www.springleaf.com on Friday, November 14, 2014, prior to the start of the conference call.
Forward Looking Statements
This press release contains “forward‐looking statements” within the meaning of the U.S. federal securities laws. Forward‐looking statements include, without limitation, statements concerning plans, objectives, goals, projections, strategies, future events or performance, our 2014 guidance ranges and underlying assumptions and other statements, which are not statements of historical facts. Statements preceded by, followed by or that otherwise include the words “anticipate,” “appears,” “believe,” “foresee,” “intend,” “should,” “expect,” “estimate,” “project,” “plan,” “may,” “could,” “will,” “are likely” and similar expressions are intended to identify forward‐looking statements. These statements involve predictions of our future financial condition, performance, plans and strategies, and are thus dependent on a number of
factors including, without limitation, assumptions and data that may be imprecise or incorrect. Specific factors that may impact performance or other predictions of future actions include, but are not limited to: changes in general economic conditions, including the interest rate environment and the financial markets; levels of unemployment and personal bankruptcies; shifts in residential real estate values; shifts in collateral values, delinquencies, or credit losses; natural or accidental events such as earthquakes, hurricanes, tornadoes, fires, or floods; war, acts of terrorism, riots, civil disruption, pandemics, or other events disrupting business or commerce; our ability to successfully realize the benefits of the SpringCastle Portfolio; the effectiveness of our credit risk scoring models; changes in our ability to attract and retain employees or key executives; changes in the competitive environment in which we operate; changes in federal, state and local laws, regulations, or regulatory policies and practices; potential liability relating to real estate and personal loans which we have sold or may sell in the future, or relating to securitized loans; the costs and effects of any litigation or governmental inquiries or investigations; our continued ability to access the capital markets or the sufficiency of our current sources of funds to satisfy our cash flow requirements; our ability to generate sufficient cash to service all of our indebtedness; the potential for downgrade of our debt by rating agencies; and other risks described in the “Risk Factors” section of the Company’s Form 2013 10-K filed with the SEC on April 15, 2014. Forward‐looking statements involve known and unknown risks, uncertainties and other factors which may cause the actual results, performance or achievements of the Company to be materially different from any future results, performance or achievements expressed or implied by such forward‐looking statements. We caution you not to place undue reliance on these forward‐looking statements that speak only as of the date they were made. We do not undertake any obligation to publicly release any revisions to these forward‐looking statements to reflect events or circumstances after the date of this presentation or to reflect the occurrence of unanticipated events. You should not rely on forward looking statements as the sole basis upon which to make any investment decision.
CONSOLIDATED STATEMENTS OF OPERATIONS (UNAUDITED)
|
| | | | | | | | | | | | | | | | |
| (dollars in thousands except earnings (loss) per share) | | Three Months
Ended
September 30,
2014 | | Three Months
Ended
September 30,
2013 | | Nine Months
Ended
September 30,
2014 | | Nine Months
Ended
September 30,
2013 |
| | | | | Revised | | | | Revised |
| Interest income: | | | | | | | | |
| Finance charges | | $ | 435,445 |
| | $ | 583,926 |
| | $ | 1,513,590 |
| | $ | 1,577,561 |
|
| Finance receivables held for sale originated as held for investment | | 47,679 |
| | — |
| | 54,921 |
| | — |
|
| Total interest income | | 483,124 |
| | 583,926 |
| | 1,568,511 |
| | 1,577,561 |
|
| | | | | | | | | |
| Interest expense | | 180,142 |
| | 229,157 |
| | 576,863 |
| | 700,868 |
|
| | | | | | | | | |
| Net interest income | | 302,982 |
| | 354,769 |
| | 991,648 |
| | 876,693 |
|
| | | | | | | | | |
| Provision for finance receivable losses | | 102,971 |
| | 162,264 |
| | 379,196 |
| | 339,061 |
|
| | | | | | | | | |
| Net interest income after provision for finance receivable losses | | 200,011 |
| | 192,505 |
| | 612,452 |
| | 537,632 |
|
| | | | | | | | | |
| Other revenues: | | |
| | |
| | |
| | |
|
| Insurance | | 44,010 |
| | 38,277 |
| | 125,116 |
| | 107,144 |
|
| Investment | | 11,251 |
| | 6,532 |
| | 31,334 |
| | 27,254 |
|
| Net loss on repurchases and repayments of debt | | — |
| | (33,572 | ) | | (6,615 | ) | | (33,809 | ) |
| Net gain (loss) on fair value adjustments on debt | | 1,352 |
| | 6,586 |
| | (15,033 | ) | | 7,097 |
|
| Net gain on sales of real estate loans and related trust assets | | 641,328 |
| | — |
| | 731,314 |
| | — |
|
| Other | | (11,975 | ) | | 1,603 |
| | (7,403 | ) | | 6,986 |
|
| Total other revenues | | 685,966 |
| | 19,426 |
| | 858,713 |
| | 114,672 |
|
| | | | | | | | | |
| Other expenses: | | |
| | |
| | |
| | |
|
| Operating expenses: | | |
| | |
| | |
| | |
|
| Salaries and benefits | | 94,702 |
| | 214,552 |
| | 278,504 |
| | 371,842 |
|
| Other operating expenses | | 75,117 |
| | 72,478 |
| | 192,889 |
| | 194,457 |
|
| Insurance losses and loss adjustment expenses | | 20,141 |
| | 16,550 |
| | 57,173 |
| | 47,650 |
|
| Total other expenses | | 189,960 |
| | 303,580 |
| | 528,566 |
| | 613,949 |
|
| | | | | | | | | |
| Income (loss) before provision for (benefit from) income taxes | | 696,017 |
| | (91,649 | ) | | 942,599 |
| | 38,355 |
|
| | | | | | | | | |
| Provision for (benefit from) income taxes | | 234,322 |
| | (30,698 | ) | | 309,594 |
| | (1,998 | ) |
| | | | | | | | | |
| Net income (loss) | | 461,695 |
| | (60,951 | ) | | 633,005 |
| | 40,353 |
|
| | | | | | | | | |
| Net income attributable to non-controlling interests | | 34,945 |
| | 31,643 |
| | 81,542 |
| | 86,383 |
|
| | | | | | | | | |
| Net income (loss) attributable to Springleaf Holdings, Inc. | | $ | 426,750 |
| | $ | (92,594 | ) | | $ | 551,463 |
| | $ | (46,030 | ) |
| | | | | | | | | |
| Share Data: | | |
| | |
| | |
| | |
|
| Weighted average number of shares outstanding: | | |
| | |
| | |
| | |
|
| Basic | | 114,788,439 |
| | 100,000,000 |
| | 114,788,439 |
| | 100,000,000 |
|
| Diluted | | 115,316,314 |
| | 100,000,000 |
| | 115,212,398 |
| | 100,000,000 |
|
| Earnings (loss) per share: | | |
| | |
| | |
| | |
|
| Basic | | $ | 3.72 |
| | $ | (0.93 | ) | | $ | 4.80 |
| | $ | (0.46 | ) |
| Diluted | | $ | 3.70 |
| | $ | (0.93 | ) | | $ | 4.79 |
| | $ | (0.46 | ) |
CONSOLIDATED BALANCE SHEET (UNAUDITED)
|
| | | | | | | | |
| (dollars in thousands) | | September 30,
2014 | | December 31,
2013 |
| | | | | |
| Assets | | |
| | |
|
| | | | | |
| Cash and cash equivalents | | $ | 1,970,512 |
| | $ | 431,409 |
|
| Investment securities | | 1,723,381 |
| | 582,090 |
|
| Net finance receivables: | | |
| | |
|
| Personal loans | | 3,607,209 |
| | 3,171,704 |
|
| SpringCastle Portfolio | | 2,083,145 |
| | 2,505,349 |
|
| Real estate loans | | 655,299 |
| | 7,982,349 |
|
| Retail sales finance | | 56,900 |
| | 98,911 |
|
| Net finance receivables | | 6,402,553 |
| | 13,758,313 |
|
| Allowance for finance receivable losses | | (163,636 | ) | | (333,325 | ) |
| Net finance receivables, less allowance for finance receivable losses | | 6,238,917 |
| | 13,424,988 |
|
| Finance receivables held for sale | | 493,196 |
| | — |
|
| Restricted cash | | 312,825 |
| | 536,005 |
|
| Other assets | | 523,987 |
| | 428,194 |
|
| | | | | |
| Total assets | | $ | 11,262,818 |
| | $ | 15,402,686 |
|
| | | | | |
| Liabilities and Shareholders’ Equity | | |
| | |
|
| | | | | |
| Long-term debt | | $ | 7,858,037 |
| | $ | 12,769,036 |
|
| Insurance claims and policyholder liabilities | | 430,052 |
| | 394,168 |
|
| Deferred and accrued taxes | | 153,873 |
| | 145,520 |
|
| Other liabilities | | 310,738 |
| | 207,334 |
|
| Total liabilities | | 8,752,700 |
| | 13,516,058 |
|
| | | | | |
| Shareholders’ equity: | | |
| | |
|
| Common stock | | 1,148 |
| | 1,148 |
|
| Additional paid-in capital | | 528,177 |
| | 524,087 |
|
| Accumulated other comprehensive income | | 34,289 |
| | 28,095 |
|
| Retained earnings | | 1,538,153 |
| | 986,690 |
|
| Springleaf Holdings, Inc. shareholders’ equity | | 2,101,767 |
| | 1,540,020 |
|
| Non-controlling interests | | 408,351 |
| | 346,608 |
|
| Total shareholders’ equity | | 2,510,118 |
| | 1,886,628 |
|
| | | | | |
| Total liabilities and shareholders’ equity | | $ | 11,262,818 |
| | $ | 15,402,686 |
|
CORE KEY METRICS
|
| | | | | | | | | | | | | | | | |
| (dollars in thousands) | | Three Months
Ended
September 30,
2014 | | Three Months
Ended
September 30,
2013 | | At or for the Nine Months
Ended
September 30,
2014 | | At or for the Nine Months
Ended
September 30,
2013 |
| | | | | | | | | |
| Consumer | | |
| | |
| | |
| | |
|
| | | | | | | | | |
| Net finance receivables | | |
| | |
| | $ | 3,578,019 |
| | $ | 2,968,211 |
|
| Number of accounts | | |
| | |
| | 894,182 |
| | 797,406 |
|
| | | | | | | | | |
| Average net receivables | | $ | 3,480,581 |
| | $ | 2,897,354 |
| | $ | 3,295,101 |
| | $ | 2,705,438 |
|
| | | | | | | | | |
| Yield | | 27.02 | % | | 25.92 | % | | 27.00 | % | | 25.65 | % |
| | | | | | | | | |
| Gross charge-off ratio | | 5.46 | % | | 4.29 | % | | 5.60 | % | | 5.06 | % |
| Recovery ratio | | (0.78 | )% | | (0.26 | )% | | (0.67 | )% | | (2.16 | )% |
| Charge-off ratio | | 4.68 | % | | 4.03 | % | | 4.93 | % | | 2.90 | % |
| | | | | | | | | |
| Delinquency ratio | | |
| | |
| | 2.55 | % | | 2.32 | % |
| | | | | | | | | |
| Origination volume | | $ | 924,317 |
| | $ | 767,097 |
| | $ | 2,594,645 |
| | $ | 2,326,961 |
|
| Number of accounts | | 193,288 |
| | 192,225 |
| | 566,032 |
| | 563,531 |
|
| | | | | | | | | |
| Acquisitions and Servicing | | | | |
| | | | |
|
| | | | | | | | | |
| Net finance receivables | | | | |
| | $ | 2,083,145 |
| | $ | 2,654,238 |
|
| Number of accounts | | | | |
| | 291,153 |
| | 363,912 |
|
| | | | | | | | | |
| Average net receivables | | $ | 2,141,884 |
| | $ | 2,734,454 |
| | $ | 2,279,237 |
| | $ | 2,808,221 |
|
| | | | | | | | | |
| Yield | | 24.26 | % | | 23.64 | % | | 24.28 | % | | 23.53 | % |
| | | | | | | | | |
| Net charge-off ratio | | 5.31 | % | | 8.58 | % | | 7.09 | % | | 5.48 | % |
| | | | | | | | | |
| Delinquency ratio | | |
| | |
| | 5.11 | % | | 7.45 | % |
RECONCILIATION OF PGAAP AND HISTORICAL INCOME (NON-GAAP)
|
| | | | | | | | | | | | | | | | |
| (dollars in thousands) | | Three Months
Ended
September 30,
2014 | | Three Months
Ended
September 30,
2013 | | Nine Months
Ended
September 30,
2014 | | Nine Months
Ended
September 30,
2013 |
| | | | | | | | | |
| Income (loss) before provision for (benefit from) income taxes - push-down accounting basis | | $ | 696,017 |
| | $ | (91,649 | ) | | $ | 942,599 |
| | $ | 38,355 |
|
| Interest income adjustments | | (17,067 | ) | | (51,635 | ) | | (88,294 | ) | | (153,674 | ) |
| Interest expense adjustments | | 36,359 |
| | 33,476 |
| | 99,886 |
| | 102,977 |
|
| Provision for finance receivable losses adjustments | | (19,930 | ) | | 8,422 |
| | (17,272 | ) | | 23,062 |
|
| Repurchases and repayments of long-term debt adjustments | | — |
| | 14,158 |
| | (4,884 | ) | | (6,976 | ) |
| Fair value adjustments on debt | | 170 |
| | 12,250 |
| | 8,521 |
| | 44,950 |
|
| Sales of finance receivables held for sale originated as held for investment adjustments | | (361,439 | ) | | — |
| | (536,420 | ) | | — |
|
| Amortization of other intangible assets | | 1,073 |
| | 1,228 |
| | 3,294 |
| | 3,946 |
|
| Other | | 13,802 |
| | 1,276 |
| | 14,872 |
| | 4,685 |
|
| Income (loss) before provision for (benefit from) income taxes - historical accounting basis | | $ | 348,985 |
| | $ | (72,474 | ) | | $ | 422,302 |
| | $ | 57,325 |
|
PRETAX CORE EARNINGS (NON-GAAP) RECONCILIATION
|
| | | | | | | | | | | | | | | | |
| (dollars in thousands) | | Three Months
Ended
September 30,
2014 | | Three Months
Ended
September 30,
2013 | | Nine Months
Ended
September 30,
2014 | | Nine Months
Ended
September 30,
2013 |
| | | | | | | | | |
| Income (loss) before provision for (benefit from) income taxes - historical accounting basis | | $ | 348,985 |
| | $ | (72,474 | ) | | $ | 422,302 |
| | $ | 57,325 |
|
| Adjustments: | | | | |
| | | | |
|
| Pretax operating (income) loss - Non-Core Portfolio Operations | | (214,441 | ) | | 41,048 |
| | (87,103 | ) | | 135,535 |
|
| Pretax operating loss - Other/non- originating legacy operations | | 2,491 |
| | 134,685 |
| | 12,799 |
| | 129,817 |
|
| Net loss from accelerated repayment/repurchase of debt - Consumer | | — |
| | 2,890 |
| | 1,429 |
| | 4,390 |
|
| Net (gain) loss on fair value adjustments on debt - Core Consumer Operations (attributable to SHI) | | (715 | ) | | (3,111 | ) | | 6,961 |
| | (3,111 | ) |
| Pretax operating income attributable to non-controlling interests | | (34,945 | ) | | (31,643 | ) | | (81,542 | ) | | (86,383 | ) |
| Pretax core earnings | | $ | 101,375 |
| | $ | 71,395 |
| | $ | 274,846 |
| | $ | 237,573 |
|
Springleaf Holdings, Inc.
Contact:
Craig Streem, 812-468-5752
craig.streem@springleaf.com
Source: Springleaf Holdings, Inc.