|
Exhibit 99.1 lp12 |
APX Group Holdings, Inc.
JP Morgan Global High Yield & Leveraged Finance Conference
March 1, 2016
Preliminary Statement
This presentation includes forward-looking statements as defined by the Private Securities Litigation Reform Act of 1995 regarding, among other things, statements with respect to certain
preliminary unaudited financial results for the Company’s quarter and full year ended December 31, 2015, which are subject to finalization and contingencies associated with the Company’s
quarterly and annual financial and accounting procedures. These statements are based on the beliefs and assumptions of management. Although the Company believes that its estimates,
plans, intentions and expectations reflected in or suggested by these forward-looking statements are reasonable, the Company cannot assure you that it will achieve or realize these
estimates, plans, intentions or expectations. Forward-looking statements are inherently subject to risks, uncertainties and assumptions. Generally, statements that are not historical facts,
including statements concerning the Company’s possible or assumed future actions, business strategies, events or results of operations, are forward-looking statements. These statements
may be preceded by, followed by or include the words “believes,” “estimates,” “expects,” “projects,” “forecasts,” “may,” “will,” “should,” “seeks,” “plans,” “scheduled,” “anticipates” or “intends” or
similar expressions.
Forward-looking statements are not guarantees of performance. You should not put undue reliance on these statements which speak only as of the date hereof. You should understand that
the following important factors, among others, could affect the Company’s future results and could cause those results or other outcomes to differ materially from those expressed or implied
in the Company’s forward-looking statements: 1) risks of the security and smart home industry, including risks of and publicity surrounding the sales, subscriber origination and retention
process; 2) the highly competitive nature of the security and smart home industry and product introductions and promotional activity by the Company’s competitors; 3) litigation, complaints
or adverse publicity; 4) the impact of changes in consumer spending patterns, consumer preferences, local, regional, and national economic conditions, crime, weather, demographic trends
and employee availability; 5) adverse publicity and product liability claims; 5) increases and/or decreases in utility and other energy costs, increased costs related to utility or governmental
requirements; and 6) cost increases or shortages in security and smart home technology products or components. In addition, the origination and retention of new subscribers will depend
on various factors, including, but not limited to, market availability, subscriber interest, the availability of suitable components, the negotiation of acceptable contract terms with subscribers,
local permitting, licensing and regulatory compliance, and the Company’s ability to manage anticipated expansion and to hire, train and retain personnel, the financial viability of subscribers
and general economic conditions.
These and other factors that could cause actual results to differ from those implied by the forward-looking statements in this presentation are more fully described in the “Risk Factors” section
in the Company’s Amendment No. 1 on Form 10-K/A to the Company’s annual report on form 10-K for the year ended December 31, 2014, filed with the Securities Exchange Commission
(SEC), as such factors may be updated from time to time in the Company’s periodic filings with the SEC, which are available on the SEC’s website at www.sec.gov. The risks described in
“Risk Factors” are not exhaustive. New risk factors emerge from time to time and it is not possible for us to predict all such risk factors, nor can we assess the impact of all such risk factors on
the Company’s business or the extent to which any factor or combination of factors may cause actual results to differ materially from those contained in any forward-looking statements. All
forward-looking statements attributable to the Company or persons acting on its behalf are expressly qualified in their entirety by the foregoing cautionary statements. The Company
undertakes no obligations to update or revise publicly any forward-looking statements, whether as a result of new information, future events or otherwise, except as required by law.
The selected preliminary financial data in this Current Report on Form 8-K, including the presentation slides furnished as Exhibit 99.1 to this report has been prepared by, and is the
responsibility of, the management of the Company. The information and estimates have not been compiled or examined by the Company’s independent auditors and are subject to revision
as the Company prepares its financial statements as of and for the year ended December 31, 2015. Because the Company has not completed its normal quarterly and annual closing, review
and audit procedures for the year ended December 31, 2015, and subsequent events may occur that require adjustments to these results, there can be no assurance that the final results for
the quarter and full year ended December 31, 2015 will not differ materially from these estimates. These estimates should not be viewed as a substitute for financial statements prepared in
accordance with U.S. GAAP or as a measure of performance. In addition, these estimated results for the quarter and full year ended December 31, 2015 are not necessarily indicative of the
results to be achieved for any future period.
This presentation includes Adjusted EBITDA, which is a supplemental measure that is not required by, or presented in accordance with, accounting principles generally accepted in the
United States (“GAAP”). Adjusted EBITDA is not a measurement of our financial performance under GAAP and should not be considered as an alternative to net income (loss) or any other
measure derived in accordance with GAAP or as an alternative to cash flows from operating activities as a measure of our liquidity. We believe that Adjusted EBITDA provides useful
information about flexibility under our covenants to investors, lenders, financial analysts and rating agencies since these groups have historically used EBITDA-related measures in our
industry, along with other measures, to estimate the value of a company, to make informed investment decisions, and to evaluate a company’s ability to meet its debt service requirements.
Adjusted EBITDA eliminates the effect of non-cash depreciation of tangible assets and amortization of intangible assets, much of which results from acquisitions accounted for under the
purchase method of accounting. Adjusted EBITDA also eliminates the effects of interest rates and changes in capitalization which management believes may not necessarily be indicative of
a company’s underlying operating performance. Adjusted EBITDA is also used by us to measure covenant compliance under the indenture governing our senior secured notes, the indenture
governing our senior unsecured notes and the credit agreement governing our revolving credit facility. We caution investors that amounts presented in accordance with our definition of
Adjusted EBITDA may not be comparable to similar measures disclosed by other issuers, because not all issuers and analysts calculate Adjusted EBITDA in the same manner. See the
Appendix of this presentation for a reconciliation of Adjusted EBITDA to net loss for the Company, which we believe is the most closely comparable financial measure calculated in
accordance with GAAP. Adjusted EBITDA should be considered in addition to and not as a substitute for, or superior to, financial measures presented in accordance with GAAP.
2
Presenters
Alex Dunn President
Mark Davies Chief Financial Officer
Dale Gerard SVP Finance and Treasurer
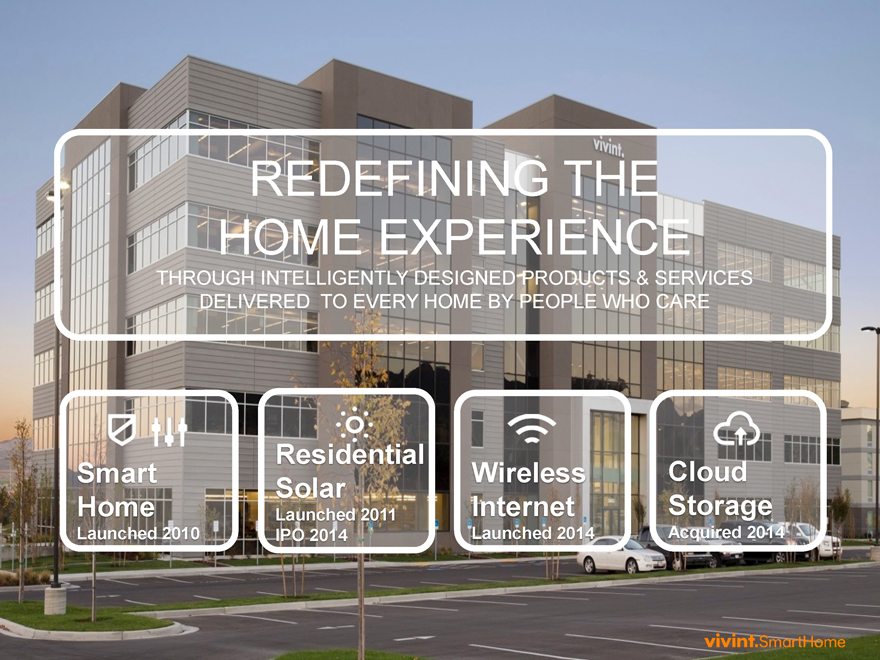
REDEFINING THE HOME EXPERIENCE
THROUGH INTELLIGENTLY DESIGNED PRODUCTS & SERVICES DELIVERED TO EVERY HOME BY PEOPLE WHO CARE
Home
Launched 2010
Residential Solar
Launched 2011 IPO 2014
Internet
Launched 2014
Storage
Acquired 2014
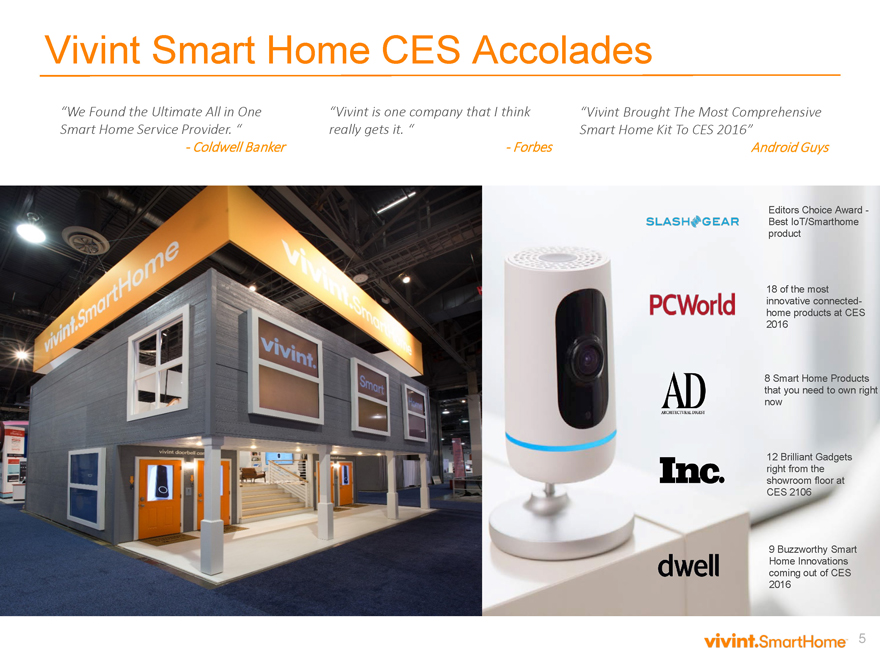
Vivint Smart Home CES Accolades
“We Found the Ultimate All in One “Vivint is one company that I think “Vivint Brought The Most Comprehensive
Smart Home Service Provider. “ really gets it. “ Smart Home Kit To CES 2016”
Coldwell Banker Forbes Android Guys
Editors Choice Award -Best IoT/Smarthome product
18 of the most innovative connected-home products at CES 2016
8 Smart Home Products that you need to own right now
12 Brilliant Gadgets right from the showroom floor at CES 2106
9 Buzzworthy Smart Home Innovations coming out of CES 2016
5
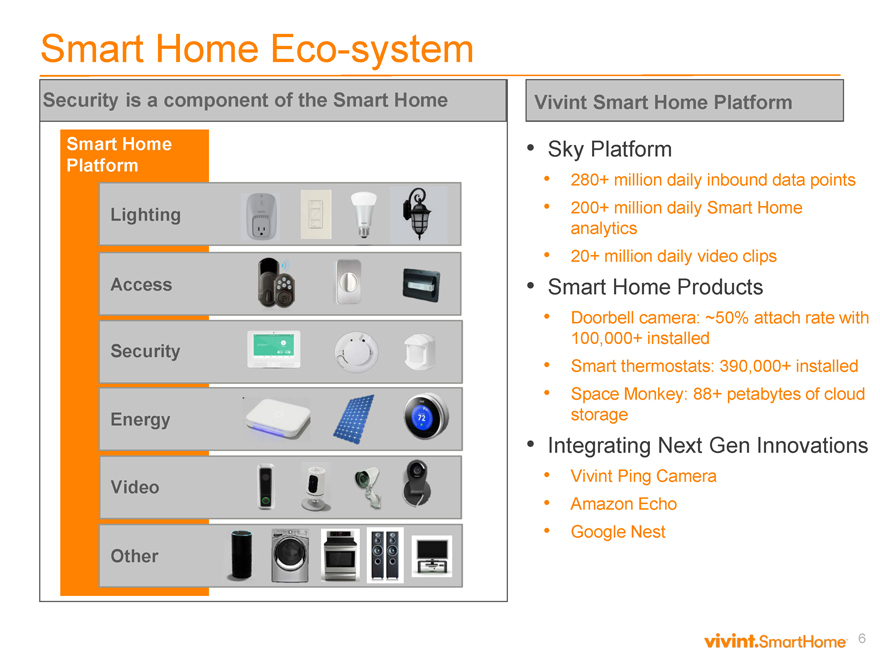
Smart Home Eco-system
Security is a component of the Smart Home
Smart Home Platform
Lighting Access Security Energy Video Other
Vivint Smart Home Platform
Sky Platform
280+ million daily inbound data points
200+ million daily Smart Home analytics
20+ million daily video clips
Smart Home Products
Doorbell camera: ~50% attach rate with 100,000+ installed
Smart thermostats: 390,000+ installed
Space Monkey: 88+ petabytes of cloud storage
Integrating Next Gen Innovations
Vivint Ping Camera
Amazon Echo
Google Nest
6
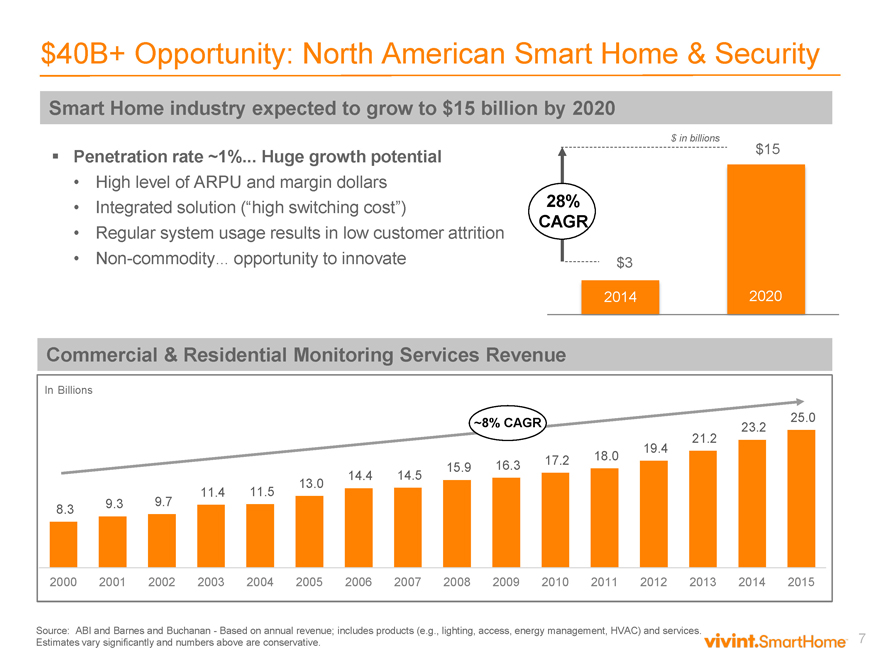
$40B+ Opportunity: North American Smart Home & Security
Smart Home industry expected to grow to $15 billion by 2020
Penetration rate ~1%. Huge growth potential
High level of ARPU and margin dollars
Integrated solution (“high switching cost”)
Regular system usage results in low customer attrition
Non-commodity… opportunity to innovate
$ in billions
$15
28%
CAGR
$3
2014 2020
Commercial & Residential Monitoring Services Revenue
In Billions
25.0
~8% CAGR 23.2
21.2
19.4
15.9 16.3 17.2 18.0
13.0 14.4 14.5
11.4 11.5
8.3 9.3 9.7
2000 2001 2002 2003 2004 2005 2006 2007 2008 2009 2010 2011 2012 2013 2014 2015
Source: ABI and Barnes and Buchanan—Based on annual revenue; includes products (e.g., lighting, access, energy management, HVAC) and services.
Estimates vary significantly and numbers above are conservative. 7
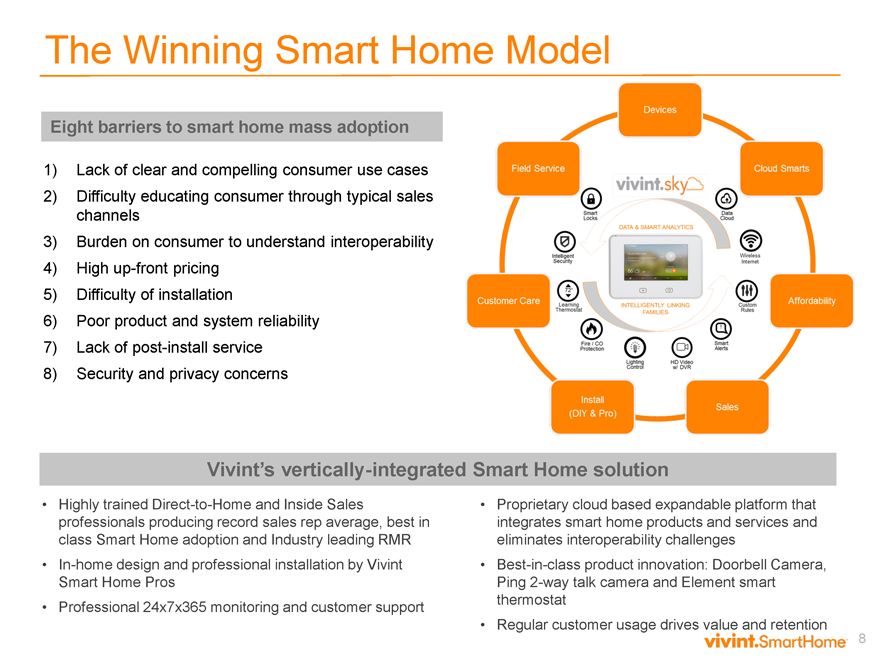
The Winning Smart Home Model
Eight barriers to smart home mass adoption
1) Lack of clear and compelling consumer use cases
2) Difficulty educating consumer through typical sales channels
3) Burden on consumer to understand interoperability
4) High up-front pricing
5) Difficulty of installation
6) Poor product and system reliability
7) Lack of post-install service
8) Security and privacy concerns
Vivint’s vertically-integrated Smart Home solution
Highly trained Direct-to-Home and Inside Sales professionals producing record sales rep average, best in class Smart Home adoption and Industry leading RMR
In-home design and professional installation by Vivint Smart Home Pros
Professional 24x7x365 monitoring and customer support
Proprietary cloud based expandable platform that integrates smart home products and services and eliminates interoperability challenges
Best-in-class product innovation: Doorbell Camera, Ping 2-way talk camera and Element smart thermostat
Regular customer usage drives value and retention
8
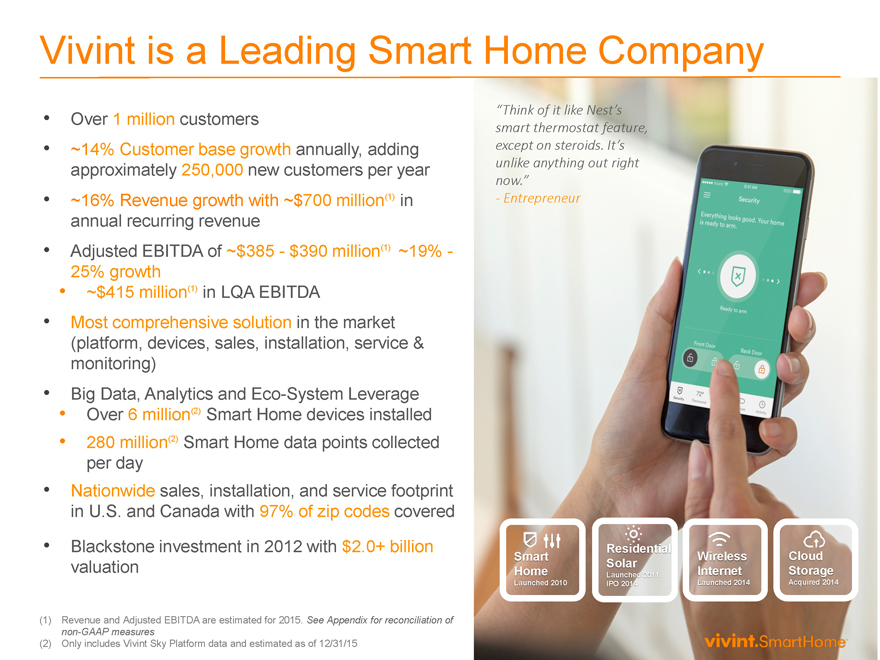
Vivint is a Leading Smart Home Company
Over 1 million customers
~14% Customer base growth annually, adding approximately 250,000 new customers per year
~16% Revenue growth with ~$700 million(1) in annual recurring revenue
Adjusted EBITDA of ~$385—$390 million(1) ~19% -25% growth
~$415 million(1) in LQA EBITDA
Most comprehensive solution in the market (platform, devices, sales, installation, service & monitoring)
Big Data, Analytics and Eco-System Leverage
Over 6 million(2) Smart Home devices installed
280 million(2) Smart Home data points collected per day
Nationwide sales, installation, and service footprint in U.S. and Canada with 97% of zip codes covered
Blackstone investment in 2012 with $2.0+ billion valuation
(1) Revenue and Adjusted EBITDA are estimated for 2015. See Appendix for reconciliation of non-GAAP measures
(2) Only includes Vivint Sky Platform data and estimated as of 12/31/15
“Think of it like Nest’s smart thermostat feature, except on steroids. It’s unlike anything out right now.” Entrepreneur
Residential
Smart Wireless Cloud Solar Home Launched 2010111 Internet Storage
Launched 2010 IPO 2014 Launched 2014 Acquired 2014
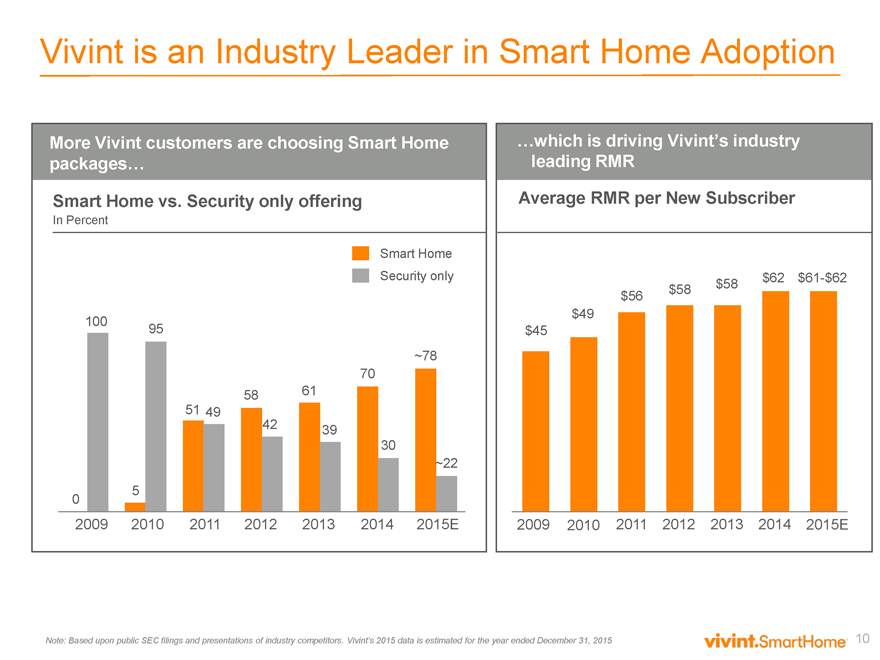
Vivint is an Industry Leader in Smart Home Adoption
More Vivint customers are choosing Smart Home …which is driving Vivint’s industry
packages… leading RMR
Smart Home vs. Security only offering Average RMR per New Subscriber
In Percent
Smart Home
Security only $62 $61-$62
$58 $58
$56
$49
100 95 $45
~78
70
58 61
51 49
42 39
30
~22
0 5
2009 2010 2011 2012 2013 2014 2015E 2009 2010 2011 2012 2013 2014 2015E
Note: Based upon public SEC filings and presentations of industry competitors. Vivint’s 2015 data is estimated for the year ended December 31, 2015 10
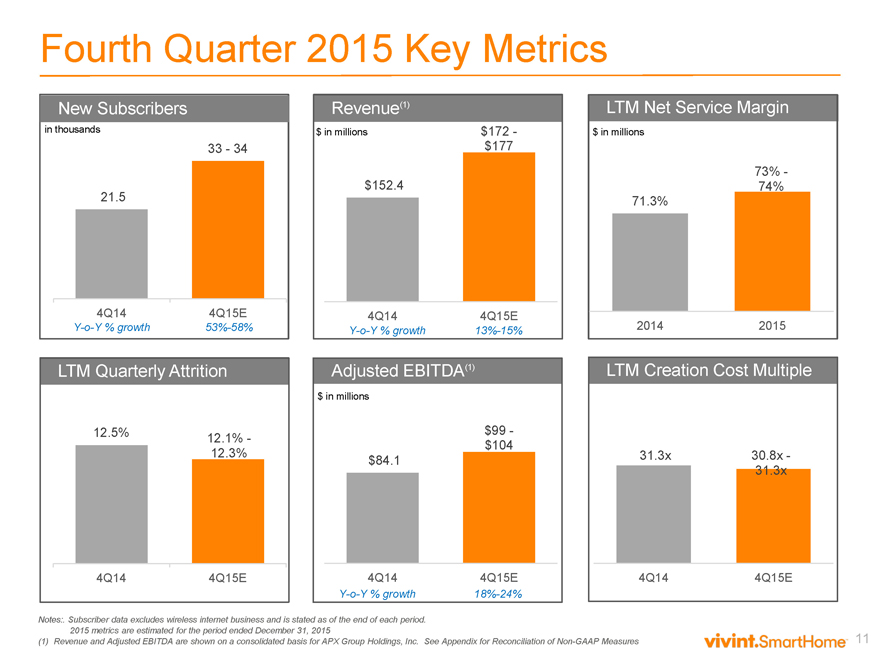
Fourth Quarter 2015 Key Metrics
New Subscribers Revenue(1) LTM Net Service Margin
in thousands $ in millions $172—$ in millions
33—34 $177
73% -
$152.4 74%
21.5 71.3%
4Q14 4Q15E 4Q14 4Q15E
Y-o-Y % growth 53%-58% Y-o-Y % growth 13%-15% 2014 2015
LTM Quarterly Attrition Adjusted EBITDA(1) LTM Creation Cost Multiple
$ in millions
12.5% 12.1%—$99 -
$104
12.3% $84.1 31.3x 30.8x -
31.3x
4Q14 4Q15E 4Q14 4Q15E 4Q14 4Q15E
Y-o-Y % growth 18%-24%
Notes:. Subscriber data excludes wireless internet business and is stated as of the end of each period. 2015 metrics are estimated for the period ended December 31, 2015
(1) Revenue and Adjusted EBITDA are shown on a consolidated basis for APX Group Holdings, Inc. See Appendix for Reconciliation of Non-GAAP Measures 11
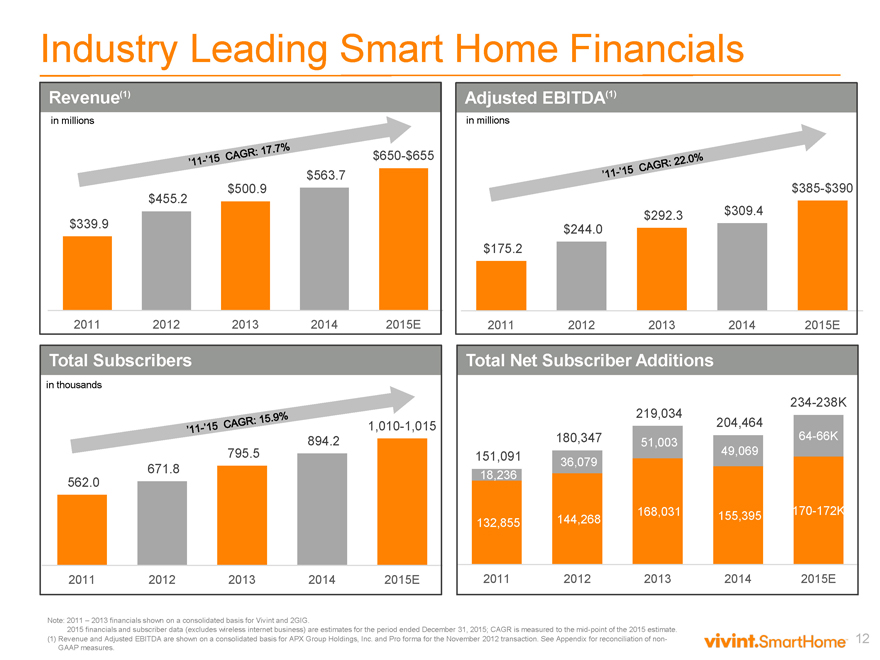
Industry Leading Smart Home Financials
Revenue(1) Adjusted EBITDA(1)
in millions in millions
$650-$655
$563.7
$500.9 $385-$390
$455.2
$292.3 $309.4
$339.9 $244.0
$175.2
2011 2012 2013 2014 2015E 2011 2012 2013 2014 2015E
Total Subscribers Total Net Subscriber Additions
in thousands
234-238K
219,034
1,010-1,015 204,464
894.2 180,347 51,003 64-66K
795.5 151,091 49,069
36,079
562.0 671.8 18,236
132,855 144,268 168,031 155,395 170-172K
2011 2012 2013 2014 2015E 2011 2012 2013 2014 2015E
Note: 2011 – 2013 financials shown on a consolidated basis for Vivint and 2GIG.
2015 financials and subscriber data (excludes wireless internet business) are estimates for the period ended December 31, 2015; CAGR is measured to the mid-point of the 2015 estimate.
(1) Revenue and Adjusted EBITDA are shown on a consolidated basis for APX Group Holdings, Inc. and Pro forma for the November 2012 transaction. See Appendix for reconciliation of non- 12 GAAP measures.
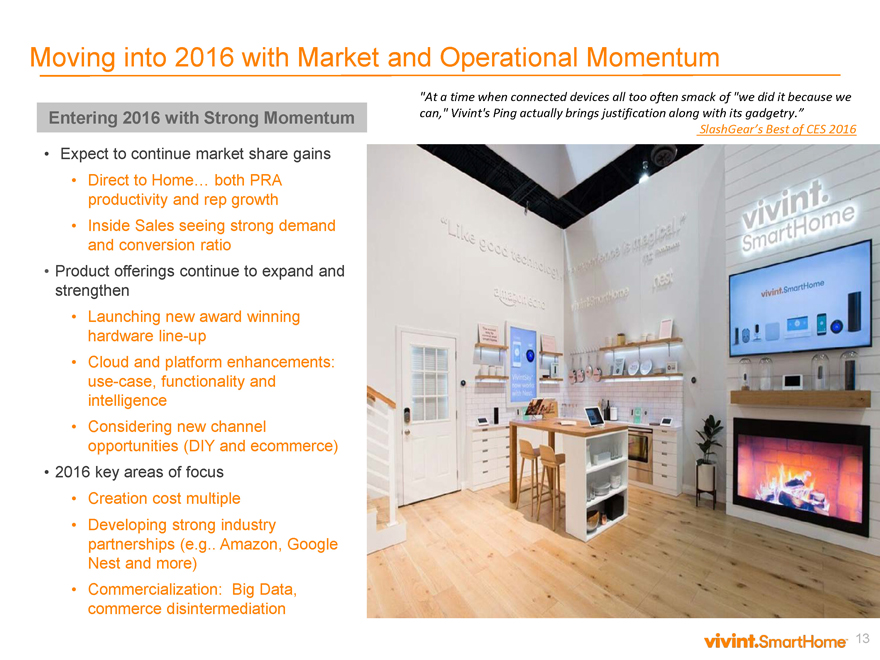
Moving into 2016 with Market and Operational Momentum
Entering 2016 with Strong Momentum
Expect to continue market share gains
Direct to Home… both PRA productivity and rep growth
Inside Sales seeing strong demand and conversion ratio
Product offerings continue to expand and strengthen
Launching new award winning hardware line-up
Cloud and platform enhancements: use-case, functionality and intelligence
Considering new channel opportunities (DIY and ecommerce)
2016 key areas of focus
Creation cost multiple
Developing strong industry partnerships (e.g. Amazon, Google Nest and more)
Commercialization: Big Data, commerce disintermediation
“At a time when connected devices all too often smack of “we did it because we can,” Vivint’s Ping actually brings justification along with its gadgetry.” SlashGear’s Best of CES 2016
13
Q&A
Appendix
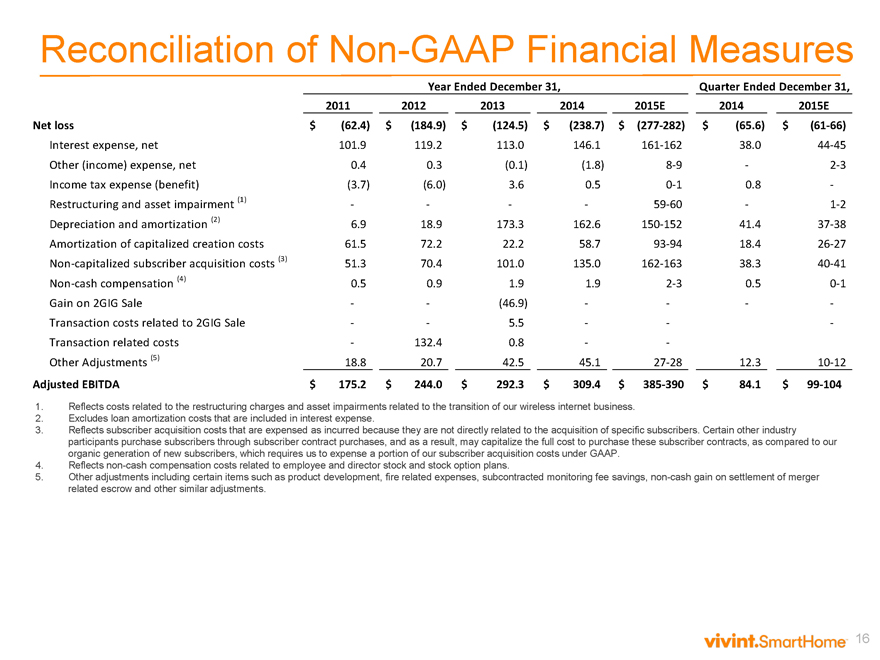
Reconciliation of Non-GAAP Financial Measures
Year Ended December 31, Quarter Ended December 31,
2011 2012 2013 2014 2015E 2014 2015E
Net loss $ (62.4) $ (184.9) $ (124.5) $ (238.7) $ (277 282) $ (65.6) $ (61 66)
Interest expense, net 101.9 119.2 113.0 146.1 161 162 38.0 44 45
Other (income) expense, net 0.4 0.3 (0.1) (1.8) 8 9 2 3
Income tax expense (benefit) (3.7) (6.0) 3.6 0.5 0 1 0.8
Restructuring and asset impairment (1) 59 60 1 2
Depreciation and amortization (2) 6.9 18.9 173.3 162.6 150 152 41.4 37 38
Amortization of capitalized creation costs 61.5 72.2 22.2 58.7 93 94 18.4 26 27
Non capitalized subscriber acquisition costs (3) 51.3 70.4 101.0 135.0 162 163 38.3 40 41
Non cash compensation (4) 0.5 0.9 1.9 1.9 2 3 0.5 0 1
Gain on 2GIG Sale (46.9)
Transaction costs related to 2GIG Sale 5.5
Transaction related costs 132.4 0.8
Other Adjustments (5) 18.8 20.7 42.5 45.1 27 28 12.3 10 12
Adjusted EBITDA $ 175.2 $ 244.0 $ 292.3 $ 309.4 $ 385 390 $ 84.1 $ 99 104
1. Reflects costs related to the restructuring charges and asset impairments related to the transition of our wireless internet business.
2. Excludes loan amortization costs that are included in interest expense.
3. Reflects subscriber acquisition costs that are expensed as incurred because they are not directly related to the acquisition of specific subscribers. Certain other industry
participants purchase subscribers through subscriber contract purchases, and as a result, may capitalize the full cost to purchase these subscriber contracts, as compared to our
organic generation of new subscribers, which requires us to expense a portion of our subscriber acquisition costs under GAAP.
4. Reflects non-cash compensation costs related to employee and director stock and stock option plans.
5. Other adjustments including certain items such as product development, fire related expenses, subcontracted monitoring fee savings, non-cash gain on settlement of merger
related escrow and other similar adjustments.
16
Certain Definitions
Total Subscribers – The aggregate number of active smart home and security subscribers at the end of a given period RMR – The recurring monthly revenue billed to a smart home and security subscriber Total RMR – The aggregate RMR billed for all smart home and security subscribers
Average RMR per Subscriber – The Total RMR divided by Total Subscribers. This is also commonly referred to as Average Revenue per User, or ARPU
Average RMR per New Subscriber – The aggregate RMR for new smart home and security subscribers originated during a period divided by the number of new security and smart home subscribers originated during such period Attrition – The aggregate number of canceled smart home and security subscribers during a period divided by the monthly weighted average number of Total Subscribers for such period. Subscribers are considered canceled when they terminate in accordance with the terms of their contract, are terminated by us, or if payment from such subscribers is deemed uncollectible (120 days past due). Sales of contracts to third parties and moves are excluded from the attrition calculation Net Subscriber Acquisition Cost – Defined as direct and indirect costs to create a new smart home and security subscriber. These include commissions, equipment, installation, marketing and other allocations (G&A and overhead), less activation fees and up sell revenue. These costs also exclude residuals and long-term equity expenses associated with the direct-to-home sales channel. Net Creation Cost Multiple – Defined as Net Subscriber Acquisition Costs, divided by the number of new subscribers originated, and then divided by the Average RMR per New Subscriber Adjusted EBITDA – Net Income (loss) before interest expense (net of interest income), income and franchise taxes and depreciation and amortization (including amortization of capitalized subscriber acquisition costs), further adjusted to exclude the effects of certain contract sales to third parties, non-capitalized subscriber acquisition costs, stock-based compensation, the historical results of the Company’s Solar variable interest entity and certain unusual, non-cash, non-recurring and other items permitted in certain covenant calculations under the indentures governing the notes Net Service Margin – Defined as Average RMR per Subscriber less net service costs divided by Average RMR per Subscriber
17