|
Exhibit 99.1 
|
APX Group Holdings, Inc.
JP Morgan Global High Yield & Leveraged Finance Conference
February 27, 2017
2
Presenters
Mark Davies
Chief Financial Officer
Dale Gerard
SVP Finance and Treasurer
3
Preliminary Statement
This presentation includes forward-looking statements as defined by the Private Securities Litigation Reform Act of 1995 regarding, among other things, statements with respect to certain preliminary unaudited financial
results for the Company’s quarter and full year ended December 31, 2016, which are subject to finalization and contingencies associated with the Company’s quarterly and annual financial and accounting procedures.
These statements are based on the beliefs and assumptions of management. Although the Company believes that its estimates, plans, intentions and expectations reflected in or suggested by these forward-looking
statements are reasonable, the Company cannot assure you that it will achieve or realize these estimates, plans, intentions or expectations. Forward-looking statements are inherently subject to risks, uncertainties and
assumptions. Generally, statements that are not historical facts, including statements concerning the Company’s possible or assumed future actions, business strategies, events or results of operations, are forwardlooking
statements. These statements may be preceded by, followed by or include the words “believes,” “estimates,” “expects,” “projects,” “forecasts,” “may,” “will,” “should,” “seeks,” “plans,” “scheduled,” “anticipates” or
“intends” or similar expressions.
Forward-looking statements are not guarantees of performance. You should not put undue reliance on these statements which speak only as of the date hereof. You should understand that the following important
factors, among others, could affect the Company’s future results and could cause those results or other outcomes to differ materially from those expressed or implied in the Company’s forward-looking statements: 1)
risks of the smart home and security industry, including risks of and publicity surrounding the sales, subscriber origination and retention process; 2) the highly competitive nature of the smart home and security industry
and product introductions and promotional activity by the Company’s competitors; 3) litigation, complaints or adverse publicity; 4) the impact of changes in consumer spending patterns, consumer preferences, local,
regional, and national economic conditions, crime, weather, demographic trends and employee availability; 5) adverse publicity and product liability claims; 6) increases and/or decreases in utility and other energy
costs, increased costs related to utility or governmental requirements; 7) cost increases or shortages in smart home and security technology products or components; and the impact to the Company’s business results
of operations, financial conditions, regulatory compliance and customer experience of the Vivint Flex Pay plan In addition, the origination and retention of new subscribers will depend on various factors, including, but
not limited to, market availability, subscriber interest, the availability of suitable components, the negotiation of acceptable contract terms with subscribers, local permitting, licensing and regulatory compliance, and the
Company’s ability to manage anticipated expansion and to hire, train and retain personnel, the financial viability of subscribers and general economic conditions.
These and other factors that could cause actual results to differ from those implied by the forward-looking statements in this presentation are more fully described in the “Risk Factors” section in the Company’s annual
report on form10-K for the year ended December 31, 2015, filed with the Securities Exchange Commission (SEC), as such factors may be updated from time to time in the Company’s periodic filings with the SEC,
which are available on the SEC’s website at www.sec.gov. The risks described in “Risk Factors” are not exhaustive. New risk factors emerge from time to time and it is not possible for us to predict all such risk factors,
nor can we assess the impact of all such risk factors on the Company’s business or the extent to which any factor or combination of factors may cause actual results to differ materially from those contained in any
forward-looking statements. All forward-looking statements attributable to the Company or persons acting on its behalf are expressly qualified in their entirety by the foregoing cautionary statements. The Company
undertakes no obligations to update or revise publicly any forward-looking statements, whether as a result of new information, future events or otherwise, except as required by law.
This presentation includes Adjusted EBITDA, which is a supplemental measure that is not required by, or presented in accordance with, accounting principles generally accepted in the United States (“GAAP”). Adjusted
EBITDA is not a measurement of our financial performance under GAAP and should not be considered as an alternative to net income (loss) or any other measure derived in accordance with GAAP or as an alternative
to cash flows from operating activities as a measure of our liquidity. We believe that Adjusted EBITDA provides useful information about flexibility under our covenants to investors, lenders, financial analysts and rating
agencies since these groups have historically used EBITDA-related measures in our industry, along with other measures, to estimate the value of a company, to make informed investment decisions, and to evaluate a
company’s ability to meet its debt service requirements. Adjusted EBITDA eliminates the effect ofnon-cash depreciation of tangible assets and amortization of intangible assets, much of which results from acquisitions
accounted for under the purchase method of accounting. Adjusted EBITDA also eliminates the effects of interest rates and changes in capitalization which management believes may not necessarily be indicative of a
company’s underlying operating performance. Adjusted EBITDA is also used by us to measure covenant compliance under the indenture governing our senior secured notes, the indenture governing our senior
unsecured notes and the credit agreement governing our revolving credit facility. We caution investors that amounts presented in accordance with our definition of Adjusted EBITDA may not be comparable to similar
measures disclosed by other issuers, because not all issuers and analysts calculate Adjusted EBITDA in the same manner. See the Appendix of this presentation for a reconciliation of Adjusted EBITDA to net loss for
the Company, which we believe is the most closely comparable financial measure calculated in accordance with GAAP. Adjusted EBITDA should be considered in addition to and not as a substitute for, or superior to,
financial measures presented in accordance with GAAP.
4
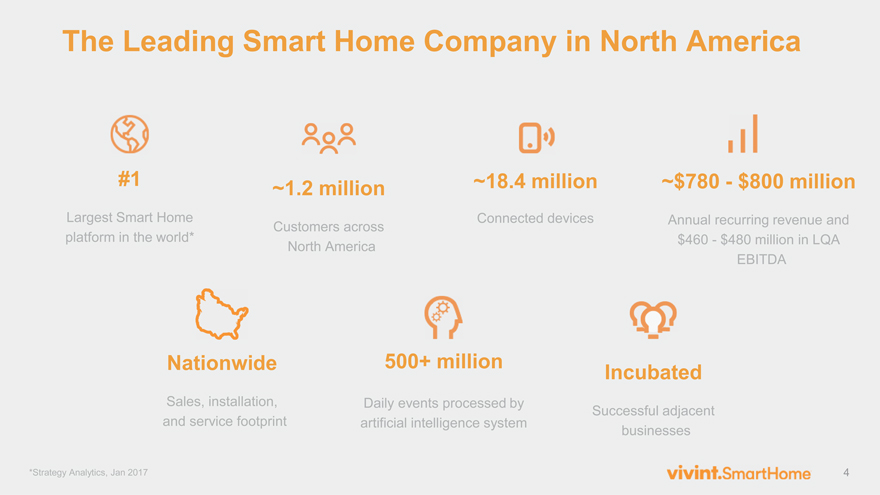
The Leading Smart Home Company in North America
#1
Largest Smart Home
platform in the world*
~1.2 million
Customers across
North America
~18.4 million
Connected devices
~$780—$800 million
Annual recurring revenue and
$460—$480 million in LQA
EBITDA
Incubated
Successful adjacent
businesses
500+ million
Daily events processed by
artificial intelligence system
Nationwide
Sales, installation,
and service footprint
*Strategy Analytics, Jan 2017
5
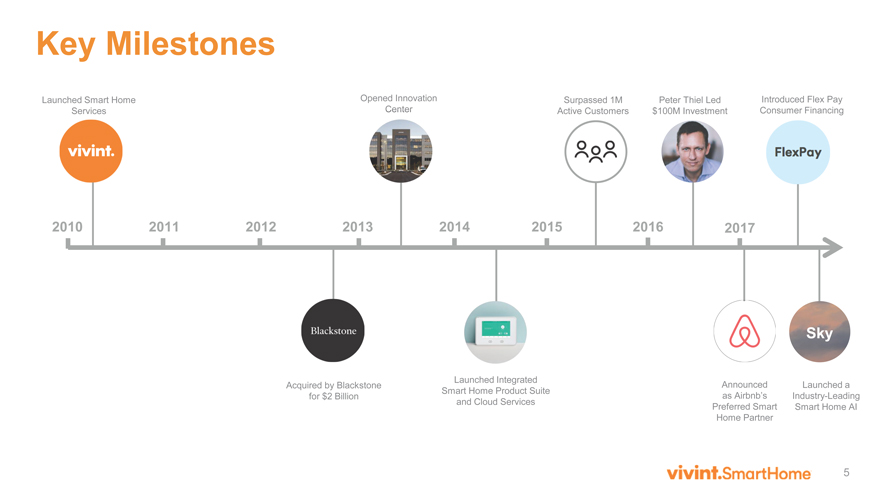
2010 2011 2012 2013 2014 2015 2016 2017
Launched Smart Home
Services
Opened Innovation
Center
Key Milestones
Launched Integrated
Smart Home Product Suite
and Cloud Services
Introduced Flex Pay
Consumer Financing
Surpassed 1M
Active Customers
Announced
as Airbnb’s
Preferred Smart
Home Partner
Acquired by Blackstone
for $2 Billion
Peter Thiel Led
$100M Investment
Launched a
Industry-Leading
Smart Home AI
Sky
6
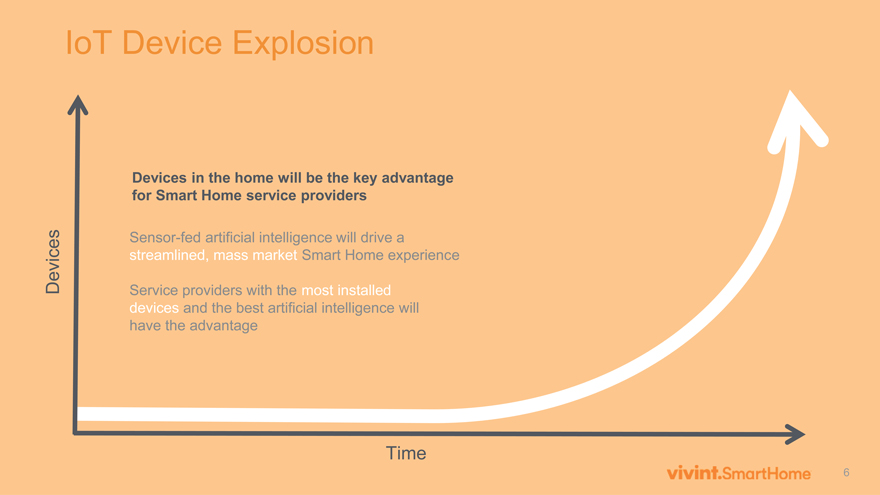
IoT Device Explosion
Devices
Time
Sensor-fed artificial intelligence will drive a
streamlined, mass market Smart Home experience
Service providers with the most installed
devices and the best artificial intelligence will
have the advantage
Devices in the home will be the key advantage
for Smart Home service providers
7
Accelerating Momentum as the Smart Home Leader
8
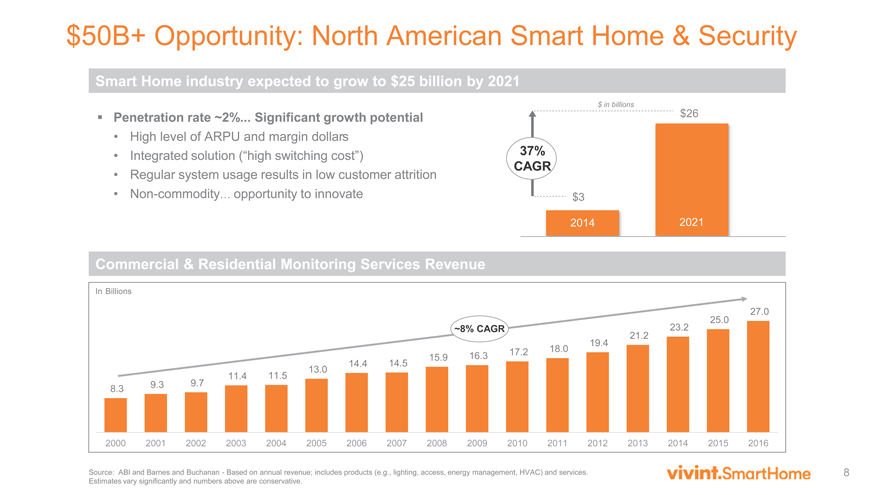
8.3 9.3 9.7
11.4 11.5
13.0
14.4 14.5
15.9 16.3 17.2 18.0
19.4
21.2
23.2
25.0
27.0
2000 2001 2002 2003 2004 2005 2006 2007 2008 2009 2010 2011 2012 2013 2014 2015 2016
$50B+ Opportunity: North American Smart Home & Security
? Penetration rate ~2%... Significant growth potential
• High level of ARPU and margin dollars
• Integrated solution (“high switching cost”)
• Regular system usage results in low customer attrition
•Non-commodity… opportunity to innovate
2014 2021
$3
$26
37%
CAGR
Source: ABI and Barnes and Buchanan—Based on annual revenue; includes products (e.g., lighting, access, energy management, HVAC) and services.
Estimates vary significantly and numbers above are conservative.
~8% CAGR
Smart Home industry expected to grow to $25 billion by 2021
Commercial & Residential Monitoring Services Revenue
In Billions
$ in billions
9
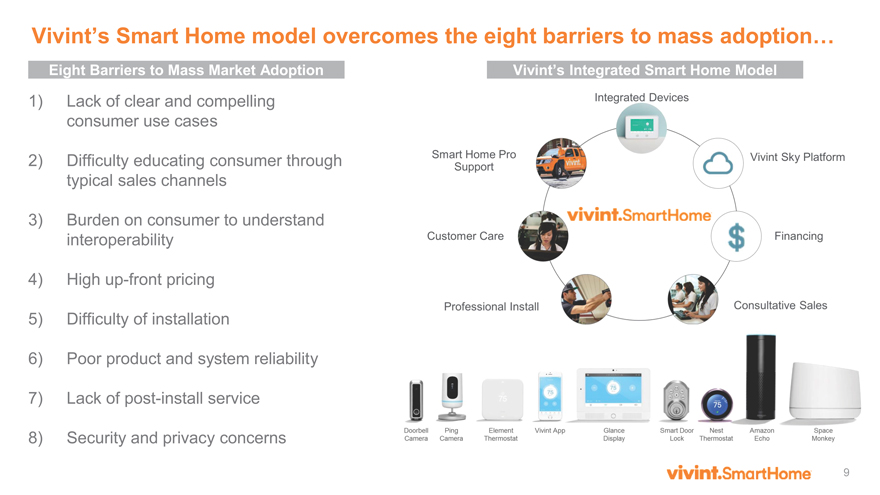
Vivint’s Smart Home model overcomes the eight barriers to mass adoption…
1) Lack of clear and compelling
consumer use cases
2) Difficulty educating consumer through
typical sales channels
3) Burden on consumer to understand
interoperability
4) Highup-front pricing
5) Difficulty of installation
6) Poor product and system reliability
7) Lack of post-install service
8) Security and privacy concerns
Eight Barriers to Mass Market Adoption Vivint’s Integrated Smart Home Model
10
Vivint’s Paths to Subscriber Growth
Grow what we know
Pull through Adjacent markets
Acceleration in
existing channels
New sales channels
Same value proposition,
new paths to market
Using smart home to
solve critical problems in
large adjacent markets
Integration andco-marketing
with high volume products
11
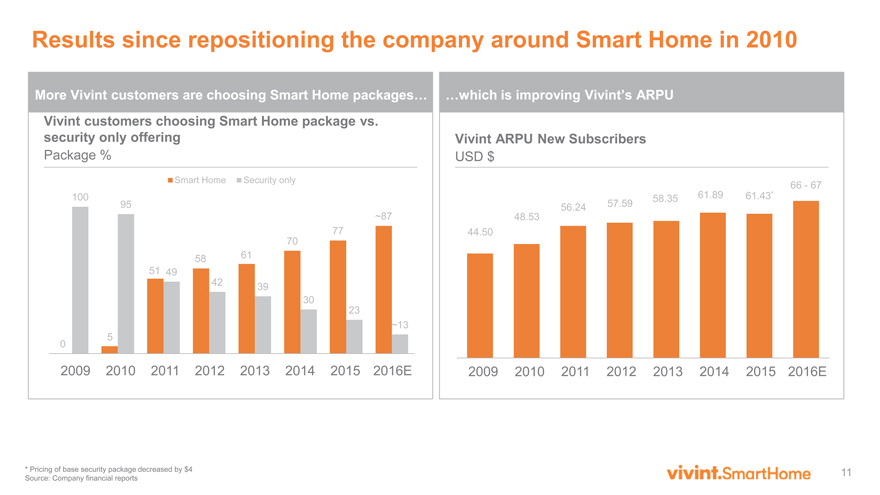
Results since repositioning the company around Smart Home in 2010
Vivint ARPU New Subscribers
USD $
Vivint customers choosing Smart Home package vs.
security only offering
Package %
More Vivint customers are choosing Smart Home packages… …which is improving Vivint’s ARPU
0
5
51
58 61
70
77
~87
100
95
49
42 39
30
23
~13
Smart Home Security only
2009 2011 2012 2013 2014
44.50
48.53
56.24 57.59
58.35 61.89 61.43*
66—67
2010 2015 2016E 2009 2010 2011 2012 2013 2014 2015 2016E
* Pricing of base security package decreased by $4
Source: Company financial reports
12
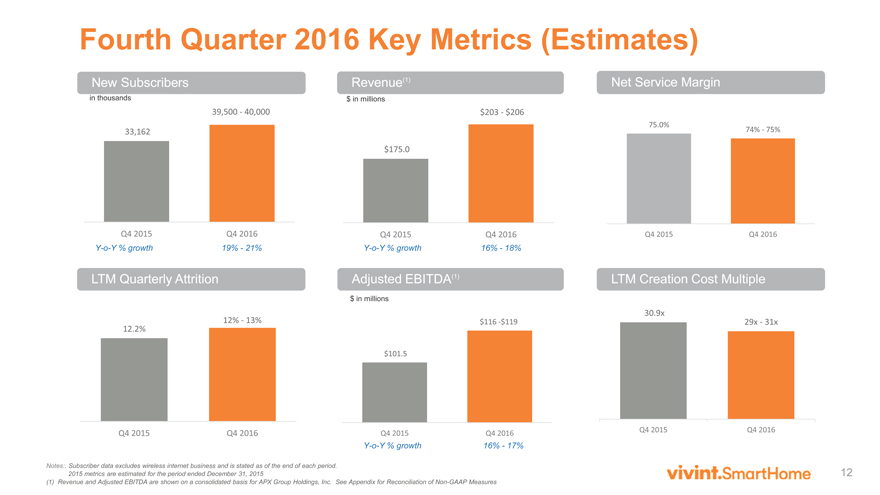
$101.5
$116 -$119
Q4 2015 Q4 2016
33,162
39,500—40,000
Q4 2015 Q4 2016
Fourth Quarter 2016 Key Metrics (Estimates)
Notes:. Subscriber data excludes wireless internet business and is stated as of the end of each period.
2015 metrics are estimated for the period ended December 31, 2015
(1) Revenue and Adjusted EBITDA are shown on a consolidated basis for APX Group Holdings, Inc. See Appendix for Reconciliation ofNon-GAAP Measures
Y-o-Y % growth 16%—18%
Y-o-Y % growth 16%—17%
Revenue(1)
Adjusted EBITDA(1) LTM Quarterly Attrition
$ in millions
$ in millions
New Subscribers
in thousands
Y-o-Y % growth 19%—21%
LTM Creation Cost Multiple
Net Service Margin
12.2%
12%—13%
Q4 2015 Q4 2016
$175.0
$203—$206
Q4 2015 Q4 2016
30.9x
29x—31x
Q4 2015 Q4 2016
75.0%
74%—75%
Q4 2015 Q4 2016
13
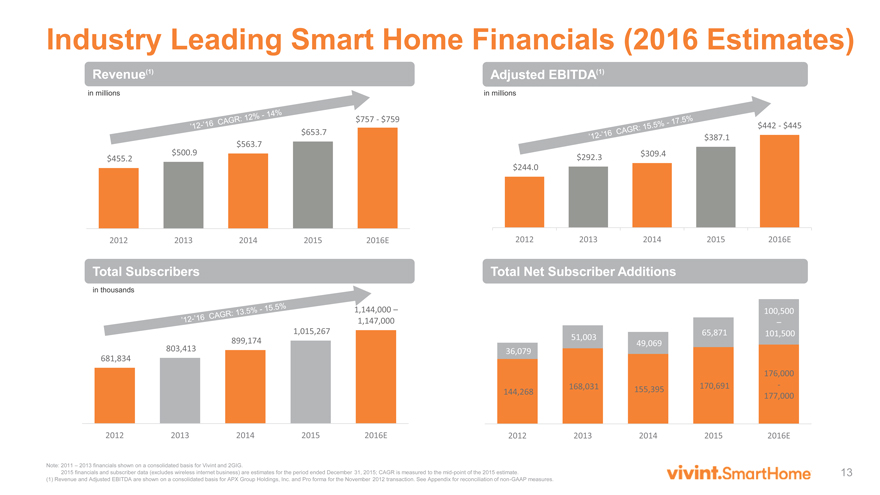
681,834
803,413
899,174
1,015,267
1,144,000 –
1,147,000
2012 2013 2014 2015 2016E
$455.2
$500.9
$563.7
$653.7
$757—$759
2012 2013 2014 2015 2016E
$244.0
$292.3 $309.4
$387.1
$442—$445
2012 2013 2014 2015 2016E
Industry Leading Smart Home Financials (2016 Estimates)
Note: 2011 – 2013 financials shown on a consolidated basis for Vivint and 2GIG.
2015 financials and subscriber data (excludes wireless internet business) are estimates for the period ended December 31, 2015; CAGR is measured to themid-point of the 2015 estimate.
(1) Revenue and Adjusted EBITDA are shown on a consolidated basis for APX Group Holdings, Inc. and Pro forma for the November 2012 transaction. See Appendix for reconciliation ofnon-GAAP measures.
Revenue(1) Adjusted EBITDA(1)
Total Subscribers Total Net Subscriber Additions
in millions in millions
in thousands
144,268
168,031 155,395 170,691
176,000
-
177,000
36,079
51,003
49,069
65,871
100,500
–
101,500
2012 2013 2014 2015 2016E
14
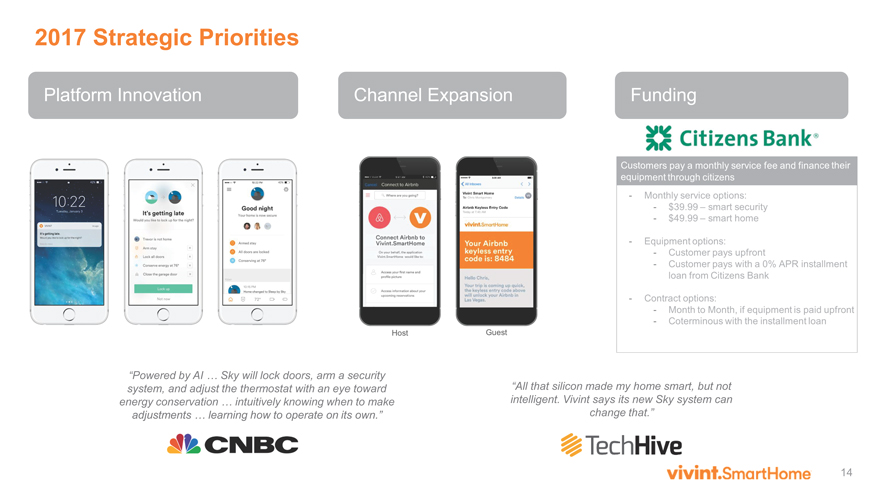
2017 Strategic Priorities
Platform Innovation Channel Expansion Funding
“Powered by AI … Sky will lock doors, arm a security
system, and adjust the thermostat with an eye toward
energy conservation … intuitively knowing when to make
adjustments … learning how to operate on its own.”
“All that silicon made my home smart, but not
intelligent. Vivint says its new Sky system can
change that.”
15
APX Group Holdings, Inc.
Annex A
16
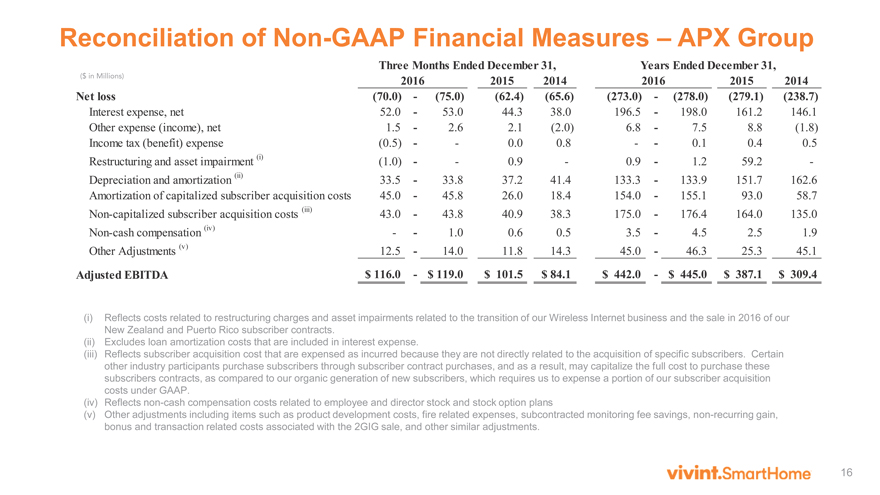
2015 2014 2015 2014
Net loss (70.0)—(75.0) (62.4) (65.6) (273.0)—(278.0) (279.1) (238.7)
Interest expense, net 52.0—53.0 44.3 38.0 196.5—198.0 161.2 146.1
Other expense (income), net 1.5—2.6 2.1 (2.0) 6.8—7.5 8.8 (1.8)
Income tax (benefit) expense (0.5) — 0.0 0.8 — 0.1 0.4 0.5
Restructuring and asset impairment (i) (1.0) — 0.9—0.9—1.2 59.2 -
Depreciation and amortization (ii) 33.5—33.8 37.2 41.4 133.3—133.9 151.7 162.6
Amortization of capitalized subscriber acquisition costs 45.0—45.8 26.0 18.4 154.0—155.1 93.0 58.7
Non-capitalized subscriber acquisition costs (iii) 43.0—43.8 40.9 38.3 175.0—176.4 164.0 135.0
Non-cash compensation (iv) — 1.0 0.6 0.5 3.5—4.5 2.5 1.9
Other Adjustments (v) 12.5—14.0 11.8 14.3 45.0—46.3 25.3 45.1
Adjusted EBITDA $ 116.0—$ 119.0 $ 101.5 $ 84.1 $ 442.0—$ 445.0 $ 387.1 $ 309.4
Three Months Ended December 31, Years Ended December 31,
2016 2016
Reconciliation ofNon-GAAP Financial Measures – APX Group
($ in Millions)
(i) Reflects costs related to restructuring charges and asset impairments related to the transition of our Wireless Internet business and the sale in 2016 of our
New Zealand and Puerto Rico subscriber contracts.
(ii) Excludes loan amortization costs that are included in interest expense.
(iii) Reflects subscriber acquisition cost that are expensed as incurred because they are not directly related to the acquisition of specific subscribers. Certain
other industry participants purchase subscribers through subscriber contract purchases, and as a result, may capitalize the full cost to purchase these
subscribers contracts, as compared to our organic generation of new subscribers, which requires us to expense a portion of our subscriber acquisition
costs under GAAP.
(iv) Reflectsnon-cash compensation costs related to employee and director stock and stock option plans
(v) Other adjustments including items such as product development costs, fire related expenses, subcontracted monitoring fee savings,non-recurring gain,
bonus and transaction related costs associated with the 2GIG sale, and other similar adjustments.
17
Total Subscribers – The aggregate number of active security and home automation subscribers at the end of a given period
Monthly Revenue per User (“RPU”) – The recurring monthly revenue billed to a smart home and security subscriber
Total Revenue per User – The aggregate RPU billed for all smart home and security subscribers
Average RPU – The Total RPU divided by Total Subscribers.
Average Revenue per New User (“ARPNU’)– The aggregate RPU for new subscribers originated during a period divided by the number of new subscribers originated during such period
Attrition – The aggregate number of canceled security and home automation subscribers during a period divided by the monthly weighted average number of total security and home automation
subscribers for such period. Subscribers are considered canceled when they terminate in accordance with the terms of their contract, are terminated by us, or if payment from such subscribers is
deemed uncollectible (when at least four monthly billings become past due). Sales of contracts to third parties and moves are excluded from the attrition calculation
Net Subscriber Acquisition Costs – Defined as direct and indirect costs to create a new security and home automation subscriber. These include commissions, equipment, installation, marketing and
other allocations (G&A and overhead), less activation fees and up sell revenue. These costs also exclude residuals and long-term equity expenses associated with thedirect-to-home sales channel.
Net Creation Cost Multiple – Defined as Net Subscriber Acquisition Costs, divided by the number of net new subscribers originated, and then divided by the ARPNU
Adjusted EBITDA – Net Income (loss) before interest expense (net of interest income), income and franchise taxes and depreciation and amortization (including amortization of capitalized subscriber
acquisition costs), further adjusted to exclude the effects of certain contract sales to third parties,non-capitalized subscriber acquisition costs, stock-based compensation, the historical results of the
Company’s Solar variable interest entity and certain unusual,non-cash,non-recurring and other items permitted in certain covenant calculations under the indentures governing the notes
Last Quarter Annualized Adjusted EBITDA (“LQA Adjusted EBITDA”) – A common industry measure used to reflect the step-function in earnings during the sales season related to the subscribers
generated from April to August. LQA Adjusted EBITDA, calculated by multiplying Adjusted EBITDA for the most recent fiscal quarter by 4, represents the ongoing earnings power of Vivint’s current
subscriber base and is potentially a more relevant metric than LTM due to the recurring nature of the revenue and expected earnings
Net Service Cost – Defined as total service costs, including monitoring, customer service, field service and other allocations (G&A and overhead) costs, less total service revenue divided by total
service subscribers
Net Service Margin – Defined as Average RPU per subscriber less Net Service Costs divided by Average RPU
Steady State Free Cash Flow (“SSFCF”) – Provides an estimate of the cash flow of a company, if it were to invest in new RPU only to the extent required to replace attrition. SSFCF is defined as LQA
Adjusted EBITDA less cost to replace RPU attrited, plus anadd-back for pro forma G&A expenses. Cost to replace RPU attrited is calculated by multiplying RPU by the attrition rate in steady state by
the Net Creation Cost Multiple
Certain Definitions