
Exhibit 99.1 APX Group Holdings, Inc. JMP Securities Technology Conference February 25, 2019 1

Forward-looking statements This presentation includes forward-looking statements, including but not limited to, statements of APX Group Holdings, Inc. (the “Company”, “Vivint”, “we”, “our”, or “us”, related to the performance of our business, our financial results, our liquidity and capital resources, our plans, strategies and prospects, both business and financial, and other non-historical statements. Forward-looking statements convey the Company’s current expectations or forecasts of future events. All statements contained in this presentation other than statements of historical fact are forward-looking statements. These statements are based on the beliefs and assumptions of our management. Although we believe that our plans, intentions and expectations reflected in or suggested by these forward-looking statements are reasonable, we cannot assure you that we will achieve or realize these plans, intentions or expectations. Forward-looking statements are inherently subject to risks, uncertainties and assumptions. These statements may be preceded by, followed by or include the words “believes,” “estimates,” “expects,” “projects,” “forecasts,” “may,” “will,” “should,” “seeks,” “plans,” “scheduled,” “anticipates” or “intends” or similar expressions. Forward-looking statements are not guarantees of performance. You should not put undue reliance on these statements which speak only as of this date hereof. You should understand that the following important factors could affect our future results and could cause those results or other outcomes to differ materially from those expressed or implied in our forward-looking statements: (1) risks of the smart home and security industry, including risks of and publicity surrounding the sales, subscriber origination and retention process; (2) the highly competitive nature of the smart home and security industry and product introductions and promotional activity by our competitors; (3) litigation, complaints or adverse publicity; (4) the impact of changes in consumer spending patterns, consumer preferences, local, regional, and national economic conditions, crime, weather, demographic trends and employee availability; (5) adverse publicity and product liability claims; (6) increases and/or decreases in utility and other energy costs, increased costs related to utility or governmental requirements; (7) cost increases or shortages in smart home and security technology products or components; (8) the introduction of unsuccessful new SmartHome Services; (9) privacy and data protection laws, privacy or data breaches, or the loss of data; and (10) the impact to our business, results of operations, financial condition, regulatory compliance and customer experience of the Vivint FlexPay plan and our ability to successfully compete in retail sales channels. In addition, the origination and retention of new subscribers will depend on various factors, including, but not limited to, market availability, subscriber interest, the availability of suitable components, the negotiation of acceptable contract terms with subscribers, local permitting, licensing and regulatory compliance, and our ability to manage anticipated expansion and to hire, train and retain personnel, the financial viability of subscribers and general economic conditions. These and other factors that could cause actual results to differ from those implied by the forward-looking statements in this presentation are more fully described in the “Risk Factors” section of our most recent annual report on Form10-K, as such factors may be updated from time to time in our periodic and other filings with the Securities Exchange Commission. These risk factors should not be construed as exhaustive. We disclaim any obligations to and do not intend to update the above list or to announce publicly the results of any revisions to any of the forward-looking statements to reflect future events or developments. All forward-looking statements attributable to us or persons acting on our behalf are expressly qualified in their entirety by the foregoing cautionary statements. We undertake no obligations to update or revise publicly any forward-looking statements, whether a result of new information, future events, or otherwise. 2
Non-GAAP financial measures This presentation includes Adjusted EBITDA, which is a supplemental measure that is not required by, or presented in accordance with, accounting principles generally accepted in the United States (“GAAP”). “Adjusted EBITDA” is defined as net income (loss) before interest expense (net of interest income), income and franchise taxes and depreciation and amortization (including amortization of capitalized subscriber acquisition costs), further adjusted to exclude the effects of certain contract sales to third parties, non-capitalized subscriber acquisition costs, stock based compensation and certain unusual, non-cash, non-recurring and other items permitted in certain covenant calculations under the indentures and other agreements governing our notes and the credit agreement governing our revolving credit facility. We believe that the presentation of Adjusted EBITDA is appropriate to provide additional information to investors about the calculation of, and compliance with, certain covenants in the indentures and other agreements governing our notes and the credit agreement governing our revolving credit facility. We caution investors that amounts presented in accordance with our definition of Adjusted EBITDA may not be comparable to similar measures disclosed by other issuers, because not all issuers and analysts calculate Adjusted EBITDA in the same manner. Adjusted EBITDA is not a measurement of our financial performance under GAAP and should not be considered as an alternative to net income (loss) or any other performance measures derived in accordance with GAAP or as an alternative to cash flows from operating activities as a measure of our liquidity. See Annex A of this presentation for a reconciliation of Adjusted EBITDA to net loss for the Company, which we believe is the most closely comparable financial measure calculated in accordance with GAAP. Adjusted EBITDA should be considered in addition to and not as a substitute for, or superior to, financial measures presented in accordance with GAAP. 3

Vivint Smart Home at a glance Highest App Engagement ~1.44 Million $1.09 - $1.12 Billion In the Smart Home industry1 Subscribers across North America2 Q4 2018 annualized revenue2 79% new entrants to the market3 20+ Million US & Canada Increasing IRRs Devices managed on our platform4 Sales, installation and service footprint Net SAC decreasing with Flex Pay with coverage of 98% of U.S. zip codes 1. App Annie, average Open Rate during the period September 1 - November 29, 2018 2. Estimated Q4 2018 revenue annualized. Estimated Total Subscribers as of December 31, 2018 3. New subscribers 2016-2018 4 4. As of December 2018
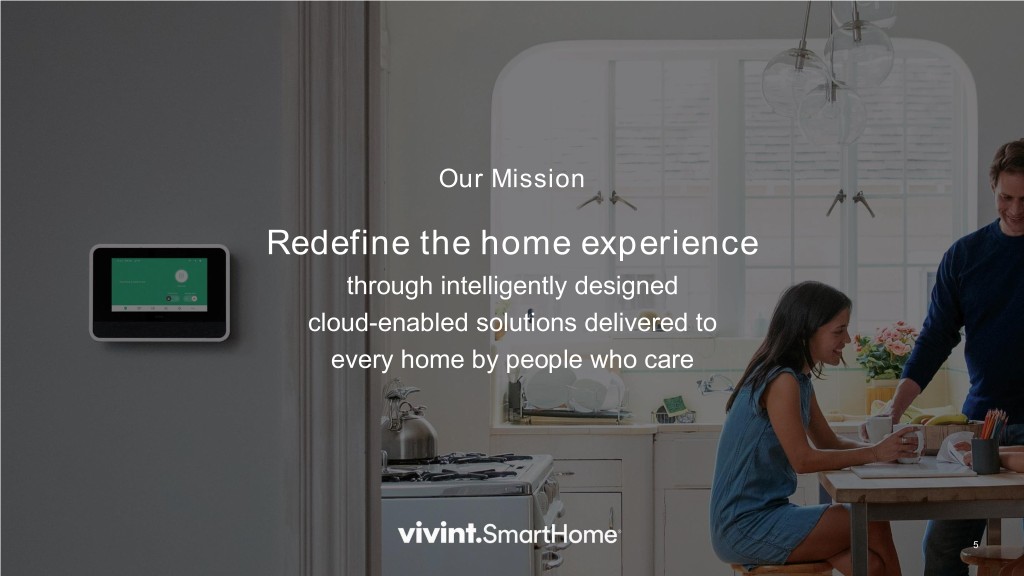
Our Mission Redefine the home experience through intelligently designed cloud-enabled solutions delivered to every home by people who care 5
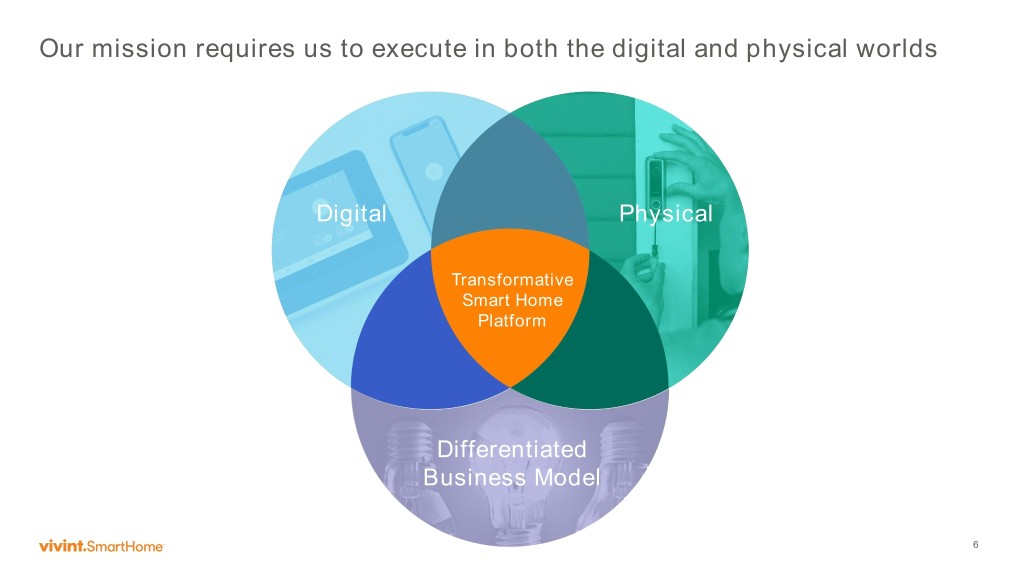
Our mission requires us to execute in both the digital and physical worlds Digital Physical Transformative Smart Home Platform Differentiated Business Model 6
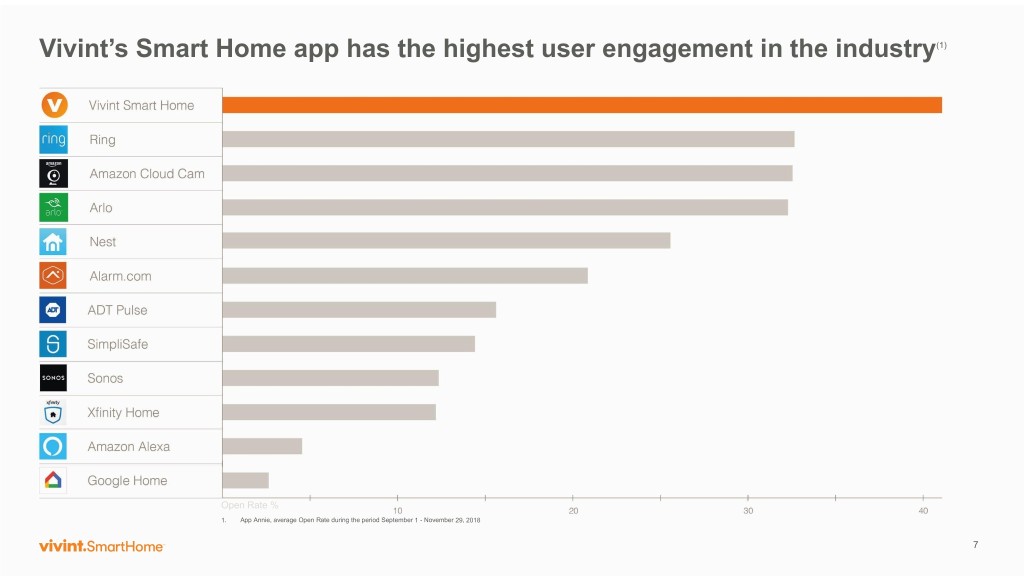
Vivint’s Smart Home app has the highest user engagement in the industry(1) Open Rate % 1. App Annie, average Open Rate during the period September 1 - November 29, 2018 7
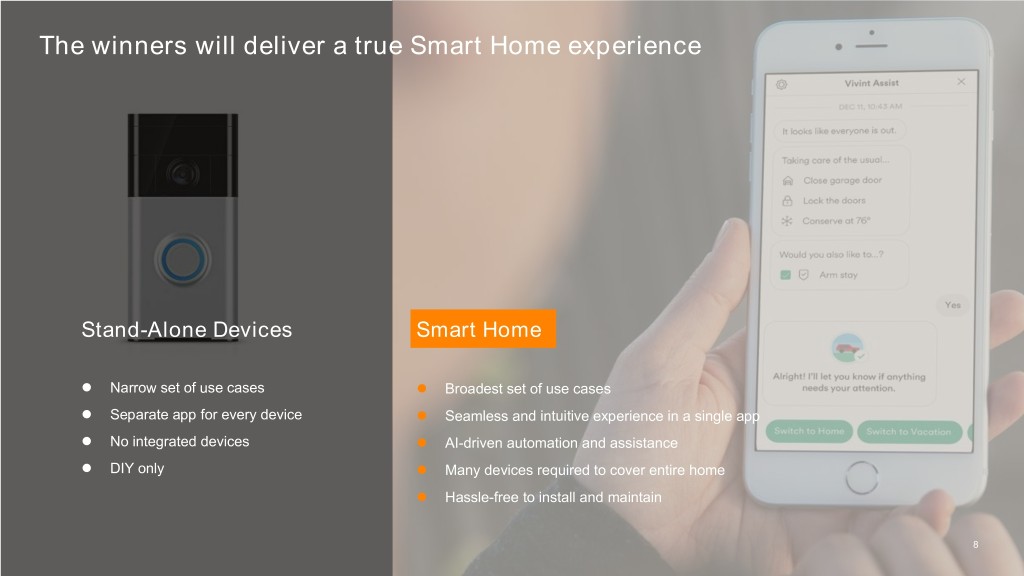
The winners will deliver a true Smart Home experience Stand-Alone Devices Smart Home Narrow set of use cases Broadest set of use cases Separate app for every device Seamless and intuitive experience in a single app No integrated devices AI-driven automation and assistance DIY only Many devices required to cover entire home Hassle-free to install and maintain 8
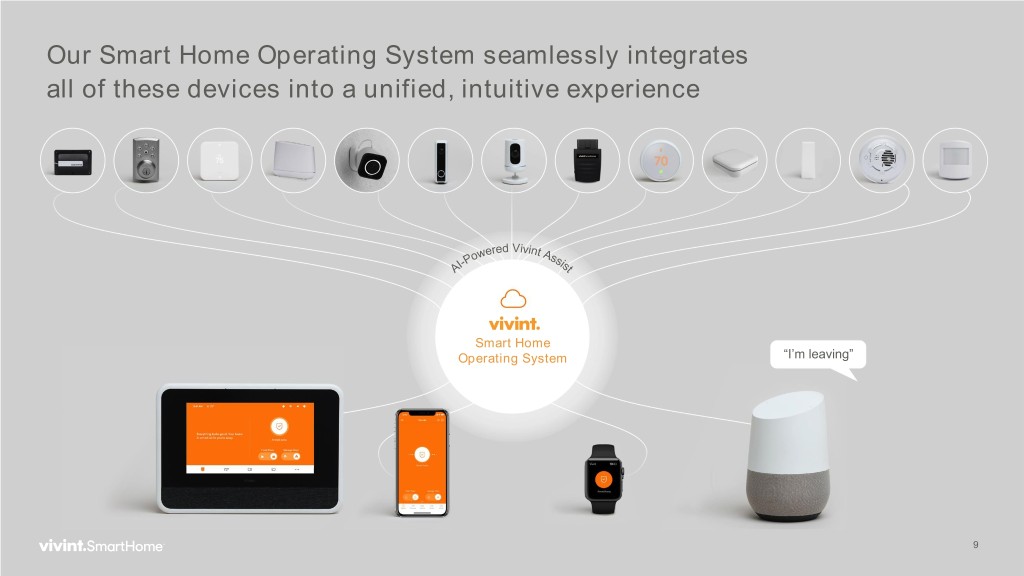
Our Smart Home Operating System seamlessly integrates all of these devices into a unified, intuitive experience Smart Home Operating System “I’m leaving” 9
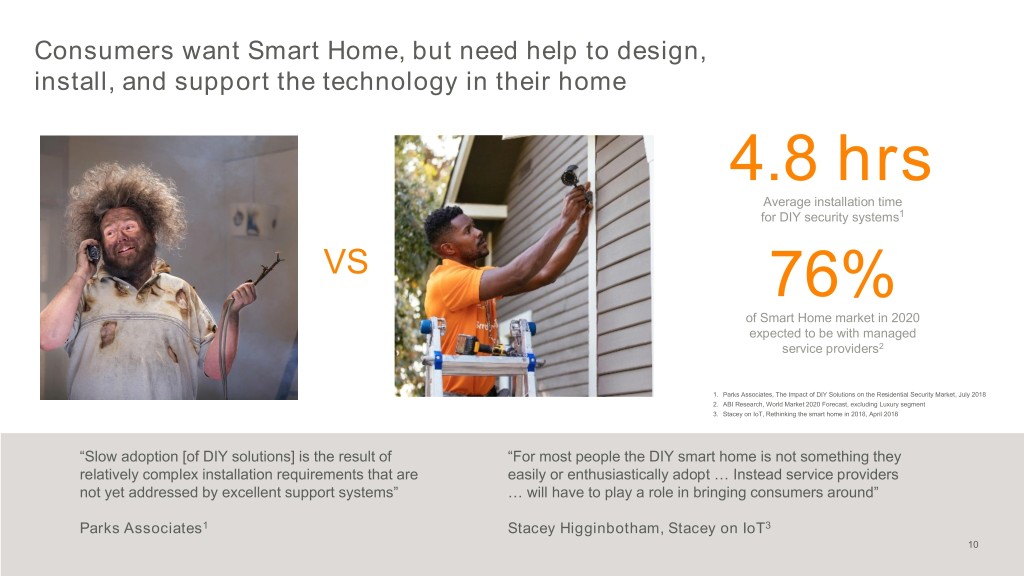
Consumers want Smart Home, but need help to design, install, and support the technology in their home 4 4.8 hrs Average installation time for DIY security systems1 VS 76% of Smart Home market in 2020 expected to be with managed service providers2 1. Parks Associates, The Impact of DIY Solutions on the Residential Security Market, July 2018 2. ABI Research, World Market 2020 Forecast, excluding Luxury segment 3. Stacey on IoT, Rethinking the smart home in 2018, April 2018 “Slow adoption [of DIY solutions] is the result of “For most people the DIY smart home is not something they relatively complex installation requirements that are easily or enthusiastically adopt … Instead service providers not yet addressed by excellent support systems” … will have to play a role in bringing consumers around” Parks Associates1 Stacey Higginbotham, Stacey on IoT3 10
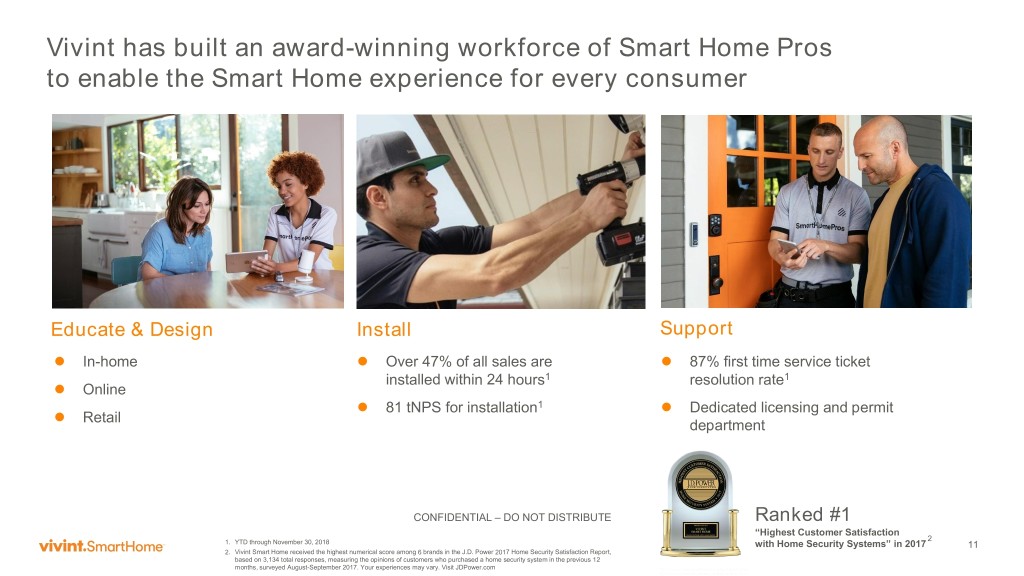
Vivint has built an award-winning workforce of Smart Home Pros to enable the Smart Home experience for every consumer Educate & Design Install Support In-home Over 47% of all sales are 87% first time service ticket installed within 24 hours1 resolution rate1 Online 81 tNPS for installation1 Dedicated licensing and permit Retail department CONFIDENTIAL – DO NOT DISTRIBUTE Ranked #1 “Highest Customer Satisfaction 2 1. YTD through November 30, 2018 with Home Security Systems” in 2017 11 2. Vivint Smart Home received the highest numerical score among 6 brands in the J.D. Power 2017 Home Security Satisfaction Report, based on 3,134 total responses, measuring the opinions of customers who purchased a home security system in the previous 12 months, surveyed August-September 2017. Your experiences may vary. Visit JDPower.com

Our consultative sales channels bring Smart Home to the consumer In Home Online In Store 2800+ sales representatives1 Digital marketing Several retail partnerships underway 10 million homes 41% of net new subscribers visited per year in 2017 Additional retail pilots forthcoming 33% 4-year CAGR2 1. Q3 2018 -10Q Report 12 2. CAGR pertains to Net New Subscriber adds during that period
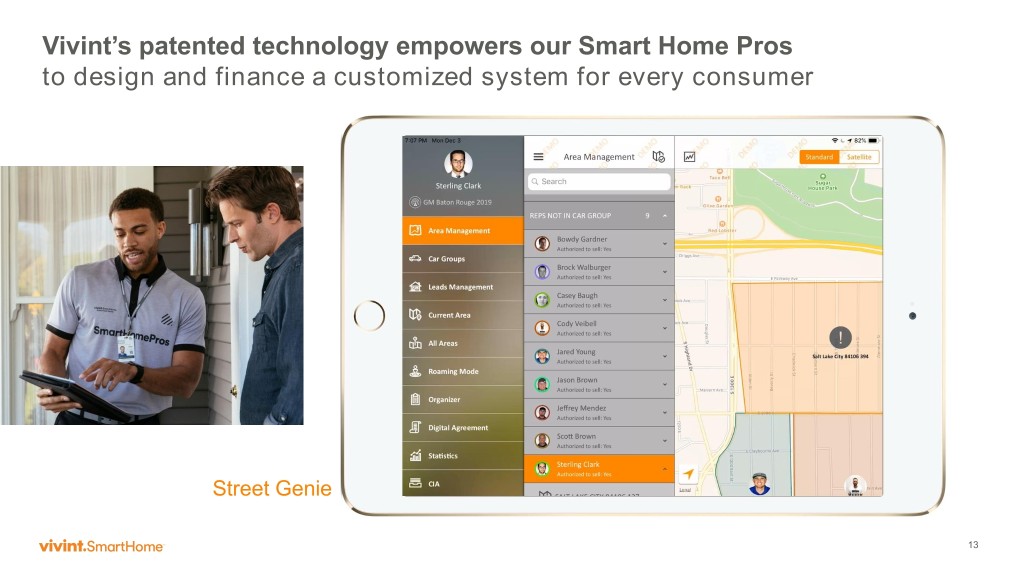
Vivint’s patented technology empowers our Smart Home Pros to design and finance a customized system for every consumer Street Genie 13
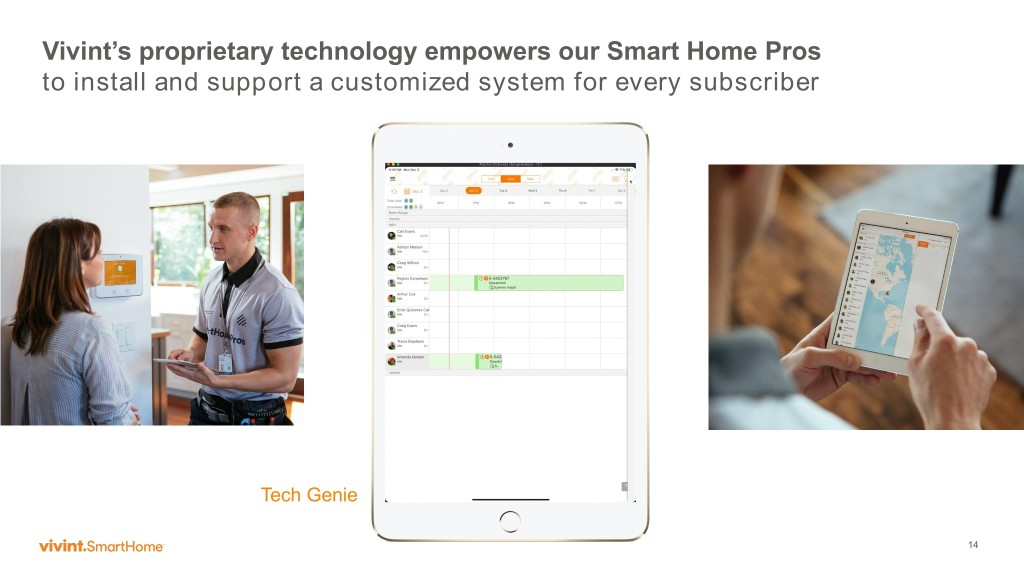
Vivint’s proprietary technology empowers our Smart Home Pros to install and support a customized system for every subscriber Tech Genie 14 14
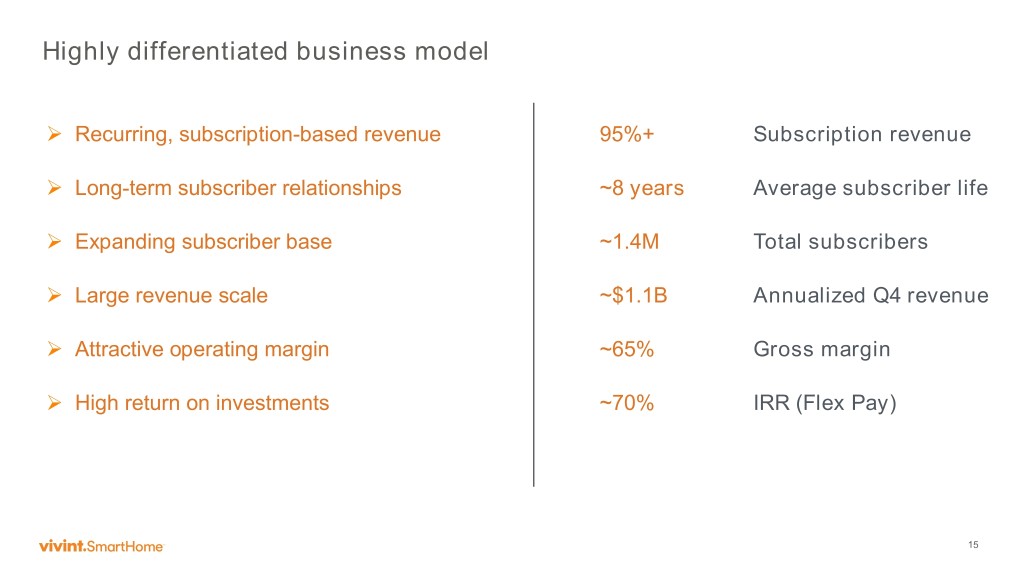
Highly differentiated business model Recurring, subscription-based revenue 95%+ Subscription revenue Long-term subscriber relationships ~8 years Average subscriber life Expanding subscriber base ~1.4M Total subscribers Large revenue scale ~$1.1B Annualized Q4 revenue Attractive operating margin ~65% Gross margin High return on investments ~70% IRR (Flex Pay) 15
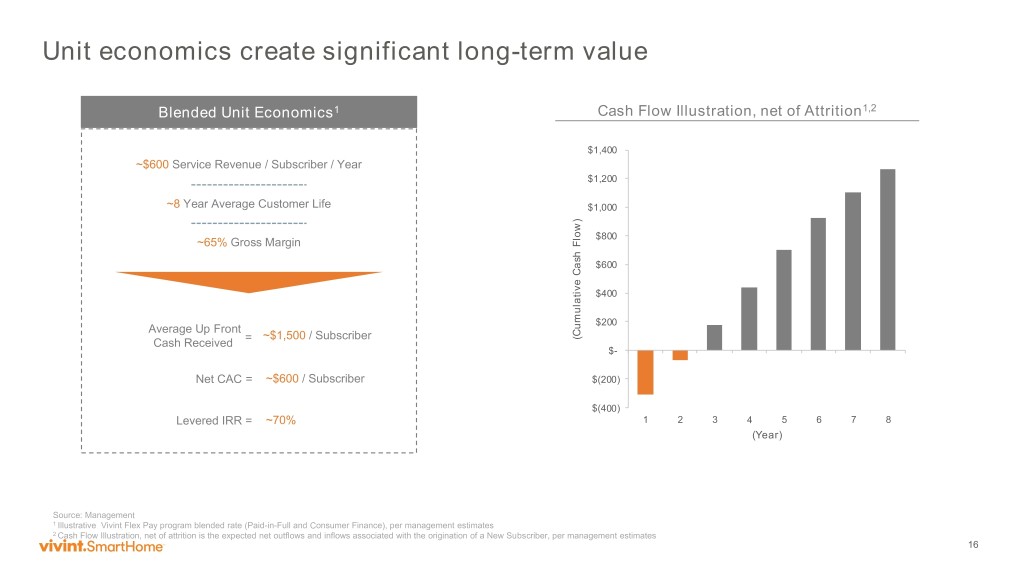
Unit economics create significant long-term value Blended Unit Economics1 Cash Flow Illustration, net of Attrition1,2 $1,400 ~$600 Service Revenue / Subscriber / Year $1,200 ~8 Year Average Customer Life $1,000 $800 ~65% Gross Margin $600 $400 $200 Average Up Front ~$1,500 / Subscriber (Cumulative Cash Flow) Cash Received = $- Net CAC = ~$600 / Subscriber $(200) $(400) Levered IRR = ~70% 1 2 3 4 5 6 7 8 (Year) Source: Management 1 Illustrative Vivint Flex Pay program blended rate (Paid-in-Full and Consumer Finance), per management estimates 2 Cash Flow Illustration, net of attrition is the expected net outflows and inflows associated with the origination of a New Subscriber, per management estimates 16

Subscription revenue growth driven by subscriber and MRR growth New Subscribers Revenue / Gross Margin (000) ($ in Millions) 2012-16 320 - 326 CAGR 11% 277 280 $1,047 - $1,053 $882 $758 $723- $636 $729 $560 Historical Accounting Method (1) Growth: 1.1% 14.3% - 16.4% Revenue Growth: 16.4% 18.7% - 19.6% 1) Historical Accounting Method removes the impact of the adoption of Financial Accounting Standards Board (FSAB”) Accounting Standard Codification (“ASC”) Topic 606, Revenue From contracts with Customers (“Topic 606”) 17

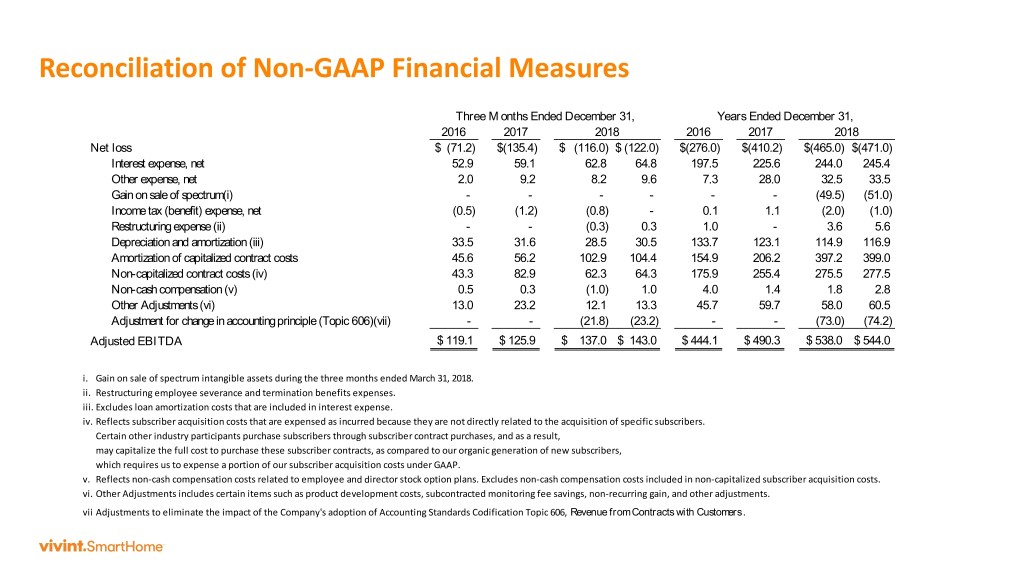
Reconciliation of Non-GAAP Financial Measures Three Months Ended December 31, Years Ended December 31, 2016 2017 2018 2016 2017 2018 Net loss $ (71.2) $(135.4) $ (116.0) $ (122.0) $(276.0) $(410.2) $(465.0) $(471.0) Interest expense, net 52.9 59.1 62.8 64.8 197.5 225.6 244.0 245.4 Other expense, net 2.0 9.2 8.2 9.6 7.3 28.0 32.5 33.5 Gain on sale of spectrum(i) - - - - - - (49.5) (51.0) Income tax (benefit) expense, net (0.5) (1.2) (0.8) - 0.1 1.1 (2.0) (1.0) Restructuring expense (ii) - - (0.3) 0.3 1.0 - 3.6 5.6 Depreciation and amortization (iii) 33.5 31.6 28.5 30.5 133.7 123.1 114.9 116.9 Amortization of capitalized contract costs 45.6 56.2 102.9 104.4 154.9 206.2 397.2 399.0 Non-capitalized contract costs (iv) 43.3 82.9 62.3 64.3 175.9 255.4 275.5 277.5 Non-cash compensation (v) 0.5 0.3 (1.0) 1.0 4.0 1.4 1.8 2.8 Other Adjustments (vi) 13.0 23.2 12.1 13.3 45.7 59.7 58.0 60.5 Adjustment for change in accounting principle (Topic 606)(vii) - - (21.8) (23.2) - - (73.0) (74.2) Adjusted EBITDA $ 119.1 $ 125.9 $ 137.0 $ 143.0 $ 444.1 $ 490.3 $ 538.0 $ 544.0 i. Gain on sale of spectrum intangible assets during the three months ended March 31, 2018. ii. Restructuring employee severance and termination benefits expenses. iii. Excludes loan amortization costs that are included in interest expense. iv. Reflects subscriber acquisition costs that are expensed as incurred because they are not directly related to the acquisition of specific subscribers. Certain other industry participants purchase subscribers through subscriber contract purchases, and as a result, may capitalize the full cost to purchase these subscriber contracts, as compared to our organic generation of new subscribers, which requires us to expense a portion of our subscriber acquisition costs under GAAP. v. Reflects non-cash compensation costs related to employee and director stock option plans. Excludes non-cash compensation costs included in non-capitalized subscriber acquisition costs. vi. Other Adjustments includes certain items such as product development costs, subcontracted monitoring fee savings, non-recurring gain, and other adjustments. vii.Adjustments to eliminate the impact of the Company's adoption of Accounting Standards Codification Topic 606, Revenue from Contracts with Customers .
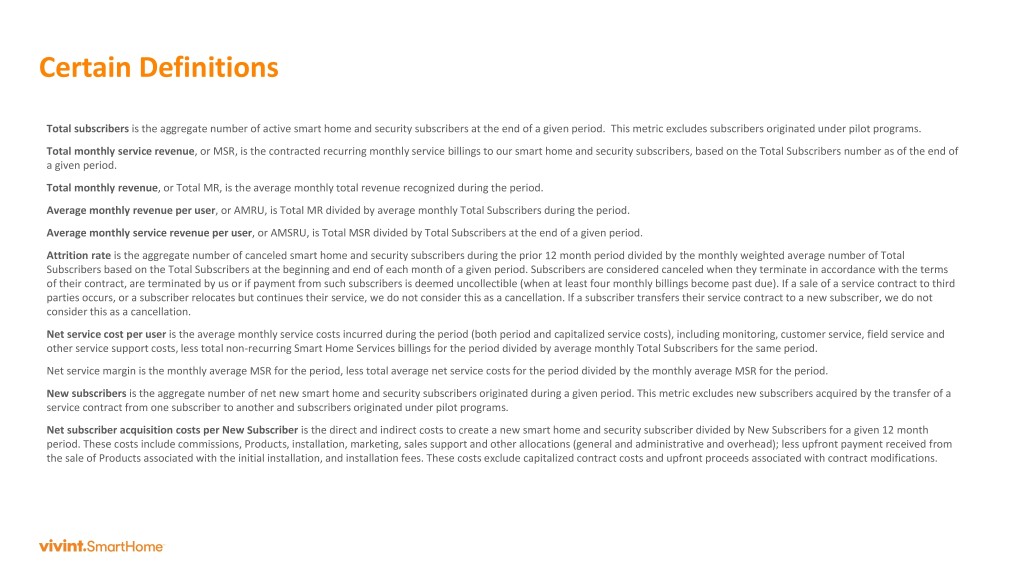
Certain Definitions Total subscribers is the aggregate number of active smart home and security subscribers at the end of a given period. This metric excludes subscribers originated under pilot programs. Total monthly service revenue, or MSR, is the contracted recurring monthly service billings to our smart home and security subscribers, based on the Total Subscribers number as of the end of a given period. Total monthly revenue, or Total MR, is the average monthly total revenue recognized during the period. Average monthly revenue per user, or AMRU, is Total MR divided by average monthly Total Subscribers during the period. Average monthly service revenue per user, or AMSRU, is Total MSR divided by Total Subscribers at the end of a given period. Attrition rate is the aggregate number of canceled smart home and security subscribers during the prior 12 month period divided by the monthly weighted average number of Total Subscribers based on the Total Subscribers at the beginning and end of each month of a given period. Subscribers are considered canceled when they terminate in accordance with the terms of their contract, are terminated by us or if payment from such subscribers is deemed uncollectible (when at least four monthly billings become past due). If a sale of a service contract to third parties occurs, or a subscriber relocates but continues their service, we do not consider this as a cancellation. If a subscriber transfers their service contract to a new subscriber, we do not consider this as a cancellation. Net service cost per user is the average monthly service costs incurred during the period (both period and capitalized service costs), including monitoring, customer service, field service and other service support costs, less total non-recurring Smart Home Services billings for the period divided by average monthly Total Subscribers for the same period. Net service margin is the monthly average MSR for the period, less total average net service costs for the period divided by the monthly average MSR for the period. New subscribers is the aggregate number of net new smart home and security subscribers originated during a given period. This metric excludes new subscribers acquired by the transfer of a service contract from one subscriber to another and subscribers originated under pilot programs. Net subscriber acquisition costs per New Subscriber is the direct and indirect costs to create a new smart home and security subscriber divided by New Subscribers for a given 12 month period. These costs include commissions, Products, installation, marketing, sales support and other allocations (general and administrative and overhead); less upfront payment received from the sale of Products associated with the initial installation, and installation fees. These costs exclude capitalized contract costs and upfront proceeds associated with contract modifications.


