PART II – INFORMATION REQUIRED IN OFFERING CIRCULAR
An Offering Statement pursuant to Regulation A relating to these securities has been filed with the Securities and Exchange Commission. Information contained in this Preliminary Offering Circular is subject to completion or amendment. These securities may not be sold nor may offers to buy be accepted before the Offering Statement filed with the Securities and Exchange Commission is qualified. This Preliminary Offering Circular shall not constitute an offer to sell or the solicitation of an offer to buy nor may there be any sales of these securities in any state in which such offer, solicitation, or sale would be unlawful before registration or qualification under the laws of any such state. We may elect to satisfy our obligation to deliver a Final Offering Circular by sending you a notice within two business days after the completion of our sale to you that contains the URL where the Final Offering Circular or the Offering Statement in which such Final Offering Circular was filed may be obtained.
REGULATION A OFFERING CIRCULAR UNDER THE SECURITIES ACT OF 1933
PRELIMINARY OFFERING CIRCULAR DATED FEBRUARY [ ], 2021, SUBJECT TO COMPLETION
COLABS INT’L CORP
3,000,000 Shares of Common Stock
18593 Main Street
Huntington Beach, CA 92648
(888) 878-5536
www.colabsintl.com
CoLabs Int’l, Corp., a Nevada corporation (the “Company,” “we,” “us,” or “our”) is offering up to 3,000,000 (the “Maximum Offering”) shares (the “Shares”) of our Common Stock, par value $0.001 per share (the “Common Stock”) to be sold in this offering (the “Offering”). The Shares are being offered at a purchase price of $6.50 per Share on a “best efforts” basis. (See “Securities Being Offered” for a discussion of certain items required by Item 14 of Part II of Form 1-A.)
| 1 |
We are selling our Shares through a Tier 2 offering pursuant to Regulation A (Regulation A+) under the Securities Act of 1933, as amended (the “Securities Act”), and we intend to sell the Shares either directly to investors or through registered broker-dealers who are paid commissions. This Offering will terminate on the earlier of (i) March 1, 2022, (ii) the date on which the Maximum Offering is sold, or (iii) when our Board of Directors elect to terminate the Offering (in each such case, the “Termination Date”).
There is currently no escrow established for this Offering, although management reserves the right to establish an escrow and engage an escrow agent in its discretion without a subsequent offering circular supplement or prior notice to investors. We will hold closings upon the receipt of investors’ subscriptions and acceptance of such subscriptions by us. If, on the initial closing date, we have sold less than the Maximum Offering, then we may hold one or more additional closings for additional sales, until the Termination Date.
Subscriptions made by investors pursuant to subscription agreements in this Offering are irrevocable. There is no aggregate minimum requirement for the Offering to become effective; therefore, we reserve the right, subject to applicable securities laws, to begin applying “dollar one” of the proceeds from the Offering towards our business strategy, including, without limitation: marketing staff and campaigns; raw materials and inventory; research and development expenses; testing and lab equipment; legal fees for business matters and protection of intellectual property and related regulatory costs; leasing additional administrative facilities; working capital; offering expenses; and other uses, as more specifically set forth in the “Use of Proceeds” section of this offering circular (the “Offering Circular”).
We expect to commence the sale of the Shares as of the date on which the offering statement of which this Offering Circular is a part (the “Offering Statement”) is qualified by the United States Securities and Exchange Commission (the “SEC”).
Investing in our Common Stock involves a high degree of risk. These are speculative securities. You should purchase these securities only if you can afford a complete loss of your investment. (See “Risk Factors” for a discussion of certain risks that you should consider in connection with an investment in our Common Stock.)
THE SECURITIES AND EXCHANGE COMMISSION (THE “SEC”) DOES NOT PASS UPON THE MERITS OF OR GIVE ITS APPROVAL TO ANY SECURITIES OFFERED OR THE TERMS OF THE OFFERING, NOR DOES IT PASS UPON THE ACCURACY OR COMPLETENESS OF ANY OFFERING CIRCULAR OR OTHER SOLICITATION MATERIALS. THESE SECURITIES ARE OFFERED PURSUANT TO AN EXEMPTION FROM REGISTRATION WITH THE SEC; HOWEVER, THE SEC HAS NOT MADE AN INDEPENDENT DETERMINATION THAT THE SECURITIES OFFERED ARE EXEMPT FROM REGISTRATION.
Price to Public(1)(4) | Compensation to the Selling Group | Proceeds to the Company(2) | ||||||||||
| Per Share(3) | $ | 6.50 | $ | 0.065 | $ | 6.435 | ||||||
| Total | $ | 19,500,000 | $ | 195,000 | $ | 19,305,000 | ||||||
| (1) | The minimum investment amount for each subscription is 100 Shares or $650. We have the option in our sole discretion to accept less than the minimum investment. The Offering is being made directly to investors by our management on a “best efforts” basis. We have engaged Dalmore Group, LLC, member FINRA/SIPC (“Dalmore”), to act as the broker-dealer of record in connection with this Offering, but not as underwriting or placement agent. This includes a 1% commission but does not include the one-time set-up fee of $5,000 for out-of-pocket expenses or the $20,000 consulting fee payable by us to Dalmore. See “Plan of Distribution” for details. We have not engaged any other commissioned sales agents, placement agents, or underwriters in connection with this Offering. To the extent that we do so, we will file a supplement to the Offering Statement of which this Offering Circular is a part. |
| 2 |
| (2) | The amounts shown in the “Proceeds to the Company” column are before deducting Offering costs to be borne by us, estimated to be approximately $2,535,000, including legal, accounting, printing, due diligence, marketing, selling, and other costs incurred in the Offering of the Shares. (See “Use of Proceeds” and “Plan of Distribution and Selling Securityholders.”) | |
| (3) | The Shares are being offered pursuant to Regulation A of Section 3(b) of the Securities Act for Tier 2 offerings. The Shares are only being issued to purchasers who satisfy the requirements set forth in Regulation A. | |
| (4) | We are offering shares on a continuous basis. See “Plan of Distribution and Selling Securityholders.” |
GENERALLY, NO SALE MAY BE MADE TO YOU IN THIS OFFERING IF THE AGGREGATE PURCHASE PRICE YOU PAY IS MORE THAN TEN PERCENT (10%) OF THE GREATER OF YOUR ANNUAL INCOME OR YOUR NET WORTH. DIFFERENT RULES APPLY TO ACCREDITED INVESTORS AND NON-NATURAL PERSONS. BEFORE MAKING ANY REPRESENTATION THAT YOUR INVESTMENT DOES NOT EXCEED APPLICABLE THRESHOLDS, WE ENCOURAGE YOU TO REVIEW RULE 251(d)(2)(i)(C) OF REGULATION A+. FOR GENERAL INFORMATION ON INVESTING, WE ENCOURAGE YOU TO REFER TO WWW.INVESTOR.GOV.
This Offering Circular contains all of the representations by us concerning this Offering, and no person shall make different or broader statements than those contained herein. Investors are cautioned not to rely upon any information not expressly set forth in this Offering Circular.
Sale of the Shares of our Common Stock will commence on approximately [ ], 2021.
The Company is following the “Offering Circular” format of disclosure under Regulation A+.
The date of this Offering Circular is [ ], 2021
| 3 |
TABLE OF CONTENTS
| 4 |
IMPORTANT INFORMATION ABOUT THIS OFFERING CIRCULAR
We are offering to sell, and seeking offers to buy, our securities only in jurisdictions where such offers and sales are permitted. Please carefully read the information in this offering circular and any accompanying offering circular supplements, which we refer to collectively as the “Offering Circular.” You should rely only on the information contained in the Offering Circular. We have not authorized anyone to provide you with any information other than the information contained in this Offering Circular. The information contained in this Offering Circular is accurate only as of its date or as of the respective dates of any documents or other information incorporated herein by reference, regardless of the time of its delivery or of any sale or delivery of our securities. Neither the delivery of this Offering Circular nor any sale or delivery of our securities shall, under any circumstances, imply that there has been no change in our affairs since the date of this Offering Circular. This Offering Circular will be updated and made available for delivery to the extent required by the federal securities laws.
This Offering Circular is part of the Offering Statement that we are filing with the SEC using a continuous offering process. Periodically, we may provide an offering circular supplement that would add, update, or change information contained in this Offering Circular. Any statement that we make in this Offering Circular will be modified or superseded by any inconsistent statement made by us in a subsequent offering circular supplement. The Offering Statement filed with the SEC includes exhibits that provide more detailed descriptions of the matters discussed in this Offering Circular. You should read this Offering Circular and the related exhibits filed with the SEC and any offering circular supplement, together with additional information contained in our annual reports, semi-annual reports, and other reports and information statements that we will file periodically with the SEC. The Offering Statement and all supplements and reports that we have filed or will file in the future can be read at the SEC website, www.sec.gov.
Unless otherwise indicated, data contained in this Offering Circular concerning our business is based on information from various public sources. Although we believe that such data is generally reliable, such information is inherently imprecise, and our estimates and expectations based on this data involve a number of assumptions and limitations. As a result, you are cautioned not to give undue weight to such data, estimates or expectations.
In this Offering Circular, unless the context indicates otherwise, references to the “Company,” “we,” “our,” and “us” refer to the activities of and the assets and liabilities of the business and operations of CoLabs Int’l, Corp., a Nevada corporation.
| 5 |
CAUTIONARY STATEMENT REGARDING FORWARD-LOOKING STATEMENTS
Some of the statements under “Summary,” “Risk Factors,” “Management’s Discussion and Analysis of Financial Condition and Results of Operations,” “Description of Business,” and elsewhere in this Offering Circular constitute forward-looking statements. Forward-looking statements relate to expectations, beliefs, projections, future plans and strategies, anticipated events or trends, and similar matters that are not historical facts. In some cases, you can identify forward-looking statements by terms such as “anticipate,” “believe,” “could,” “estimate,” “expect,” “intend,” “may,” “plan,” “potential,” “should,” and “would” or the negatives of these terms, or other comparable terminology.
You should not place undue reliance on forward-looking statements. The cautionary statements set forth in this Offering Circular, including in “Risk Factors” and elsewhere, identify important factors which you should consider in evaluating our forward-looking statements. These factors include, among other things:
| ● | The success of our products and product candidates will require significant capital resources and years of research and development efforts; |
| ● | Our ability to obtain regulatory approval and market acceptance of our products; |
| ● | Our ability to protect our intellectual property and to develop, maintain, and enhance a strong brand; |
| ● | Our ability to compete and succeed in a highly competitive and evolving industry; |
| ● | Our ability to raise capital and the availability of future financing; |
| ● | Our ability to manage our research and development, planned expansion and growth, and operating expenses; and |
| ● | Our reliance on third parties to conduct our manufacturing and distribution operations. |
Although the forward-looking statements in this Offering Circular are based on our beliefs, assumptions, and expectations, taking into account all information currently available to us, we cannot guarantee future transactions, results, performance, achievements, or outcomes. No assurance can be made to any investor by anyone that the expectations reflected in our forward-looking statements will be attained, or that deviations from them will not be material and adverse. We undertake no obligation, other than as may be required by law, to re-issue this Offering Circular or otherwise make public statements updating our forward-looking statements.
| 6 |
This summary highlights selected information contained elsewhere in this Offering Circular. This summary is not complete and does not contain all of the information that you should consider before deciding whether to invest in our Common Stock. You should carefully read the entire Offering Circular, including the risks associated with an investment in the Company discussed in the “Risk Factors” section of this Offering Circular, before making an investment decision. Some of the statements in this Offering Circular are forward-looking statements. (See the section entitled “Cautionary Statement Regarding Forward-Looking Statements” above.)
Company Information
CoLabs Int’l, Corp. (the “Company,” “CoLabs,” “we,” “our,” and “us”) was formed on August 5, 2008 under the laws of the State of Nevada and is headquartered in Huntington Beach, California. We are a majority-woman owned biotechnology and pharmaceutical manufacturing company. We develop commercially unique and innovative targeted skin delivery systems for topical pharmacology. We currently have 26 issued patents and eight filed pending patents covering our technology.
We are authorized to issue up to 50,000,000 Shares of Common Stock, par value $0.001 per share. As of the date of this Offering Circular, there are 15,800,000 Shares issued and outstanding.
Our mailing address is CoLabs Int’l, Corp., 18593 Main Street, Huntington Beach, CA 92648, and our telephone number is (888) 878-5536. Our website address is www.colabsintl.com. The information contained in our website or accessible thereby is not incorporated into this Offering Circular.
Our Business
We are a mid-stage biotech company, having developed patented, tested formulations. Using our intellectual property, we have tested, commercialized, and manufactured products since 2008. We believe that our unique and scientifically advanced technology makes us a global leader in targeted epidermal delivery systems for cosmeceuticals, fragrances, antibacterial/anti-viral sanitizers/cleaners, and most importantly, topical pharmacology.
We market products through the internet, retailers, distributors, and in dermatologists’ offices. Additionally, we develop marketing relationships whereby we supply formulatory guidance and base formulations directly to our partners for distribution. As a supplier, we sell ingredients and/or finished products into this expanding distribution channel. We have also expanded sunscreen, pest repellents, and sanitizers/soap distribution for our Klēnskin™ products internationally.
Our QuantaSphere® (QS®) Technology formulations provide advanced proprietary, epidermal therapeutic effects that are unique and market disruptive. As such, our products are consumer friendly. QS® Technology blends consumer needs for a healthy lifestyle with our targeted, eco-friendly, multi-tasking efficacy. Our innovative QS® Technology is vastly superior for non-transdermal delivery and importantly, is technologically adaptive, thereby, limiting toxicity for a vast variety of applications.
Our technology places drugs into micro-sized, electrostatically charged encapsulates as well as into other types of micro-encapsulates. These encapsulates are then suspended in uniquely designed formulations. This formulation of a highly advanced micro-technology can: target the delivery of topically applied drugs; limit unwanted absorption of chemicals, drugs, and cosmetics through the skin; and provide a designed release of active ingredients with a prescribed depth of skin penetration.
| 7 |
We have already developed commercially and manufactured unique and innovative targeted skin delivery systems for topical pharmacology. Our technology limits unwanted side effects that can occur as a result of absorption through the skin. The penetration of chemicals through the skin can have serious impact on the body’s organs and systems. Our current applications include anti-bacterial/viral sanitizers/soaps, sunscreens, fragrances, pest-repellents, and healing cosmetic lotions. For consumers, we provide elegant skin delivery and enhanced consumer safety of topically applied drugs and cosmetics. This combined end purpose is the unique foundation of our technology.
Intellectual Property
We currently have 26 issued patents and eight filed pending patents covering our technology. The patents each possess broad claims with multiple applications and ingredient bases thereby providing us with legal infringement enforcement protection. We also have trade secrets inherent in our complex formulations which make duplication of products and specific base formulations extremely difficult.
Risks Related to Our Business
Our business and our ability to execute our business strategy are subject to a number of risks as more fully described in the section titled “Risk Factors”. These risks include, among others:
| ● | Our ability to meet our product development and commercialization milestones; | |
| ● | Our ability to develop and protect our intellectual property and to develop, maintain and enhance a strong brand; | |
| ● | Our ability to compete and succeed in a highly competitive and evolving industry and navigate the changing regulatory environment around our existing and planned products; | |
● | Our ability to raise sufficient capital and the availability of future financing; | |
| ● | Our ability to manage our research, development, expansion, growth, and operating expenses; | |
| ● | Unpredictable events, such as the COVID-19 outbreak, and associated business disruptions could seriously harm our future revenues and financial condition, delay our operations, increase our costs and expenses, and impact our ability to raise capital; | |
| ● | Regulatory risks and changes in applicable laws, regulations, and guidelines; and | |
| ● | Our reliance on third parties to conduct our manufacturing and distribution operations. |
| 8 |
We are offering our Common Stock pursuant to rules of the SEC mandated under the Jumpstart Our Business Startups Act of 2012 (the “JOBS Act”). These offering rules are often referred to as “Regulation A+.” We are relying upon “Tier 2” of Regulation A+, which allows us to offer of up to $75 million in a 12-month period.
In accordance with the requirements of Tier 2 of Regulation A+, we are required to publicly file annual, semiannual, and current event reports with the SEC.
| 9 |
Issuer: | CoLabs Int’l, Corp., a Nevada corporation | |
Securities Offered:
| A maximum of 3,000,000 shares of Common Stock, par value $0.001 (the “Shares”) at an offering price of $6.50 per Share. | |
Common Stock Outstanding Before the Offering(1): | 15,800,000 | |
Common Stock to be Outstanding After the Offering: | 18,800,000 | |
| Price per Share: | $6.50 | |
| Maximum Offering: | 3,000,000 Shares | |
| Use of Proceeds: | If we sell all of the 3,000,000 Shares being offered, our net proceeds (after deducting fees and commissions and estimated offering expenses) will be approximately $17,015,000. We will use these net proceeds for marketing staff and campaigns; raw materials and inventory; research and development expenses; testing and lab equipment; legal fees for general business and protection of intellectual property and related regulatory costs; leasing additional administrative facilities; working capital, Offering expenses; and such other purposes described in the “Use of Proceeds” section of this Offering Circular. | |
| Risk Factors: | Investing in our Shares involve a high degree of risk. (See “Risk Factors.”) |
| (1) | Excludes 5,650,000 Shares issuable upon exercise of stock options outstanding which have a weighted average exercise price of $1.11 per share. |
| 10 |
An investment in our securities involves a high degree of risk. You should carefully consider the risks described below, together with all of the other information included in this Offering Circular, before making an investment decision. If any of the following risks actually occurs, our business, financial condition or results of operations could suffer. In that case, the price of our Common Stock could decline and you may lose all or part of your investment. (See “Cautionary Statement Regarding Forward Looking Statements” above for a discussion of forward-looking statements and the significance of such statements in the context of this Offering Circular.)
The continued impact of the COVID-19 pandemic and related risks could have a material adverse impact on our research and development programs and financial condition.
The degree to which COVID-19 continues to impact our business operations, research and development programs, and financial condition will depend on future developments, including the ultimate duration and/or severity of the outbreak and any resurgences, actions by government authorities to contain the spread of the virus, the timing, availability, and effectiveness of any vaccines, and when and to what extent normal economic and operating conditions can resume.
In the first two quarters of 2020, several of our orders were cancelled due to certain lockdown measures. We also postponed our marketing programs until we were able to ascertain the impact of the COVID-19 pandemic. In addition, our production was postponed due to supply line shortages.
We received a $61,000 PPP loan (defined below) under the CARES Act and a $42,000 Economic Injury Disaster Loan pursuant to the Small Business Administration (SBA) authorized under Section 7(b) of the Small Business Act, as amended.
The full impact of the COVID-19 outbreak remains highly uncertain and subject to change. Though several vaccines have been approved for COVID-19, current surges in the infection rate have led to additional state and local mandated lockdowns. Personal protection equipment guidelines are being followed in our facility according to state regulations and federal guidelines.
The consequences of this pandemic have been already felt and the future remains uncertain. We have modified our marketing efforts to focus on internet sales as opposed to advertising with direct contact with potential users. We have had to seek alternative suppliers of raw materials due to potential shortages caused by transportation issues and production closures by suppliers in various countries.
Our ability to operate without continued significant negative operational impact from the COVID-19 pandemic depends in part on our ability to protect our employees and our supply chain. We have endeavored to follow the recommended actions of government and health authorities to protect our employees. The uncertainty resulting from the pandemic could continue to result in disruptions to our workforce and supply chain (for example, an inability of a key supplier or transportation supplier to source and transport materials) that could negatively impact our operations. Further, it is unknowable whether future governmental orders and other actions to combat the pandemic such as the imposition of the shelter-in-place and other public health orders, may exacerbate the effects of the risks described below.
| 11 |
The SBA may not forgive in whole or in part our PPP loan and we may have to make payments on the PPP loan.
On May 6, 2020, we were granted a loan (the “PPP loan”) from Cross River Bank in the aggregate amount of $61,000, pursuant to the Paycheck Protection Program (the “PPP”) under the CARES Act. The PPP loan agreement is dated May 6, 2020, matures on May 6, 2022, bears interest at a rate of 1% per annum, is unsecured and guaranteed by the SBA. In accordance with the PPP Flexibility Act passed in June 2020, if we apply for loan forgiveness within ten months after the end of the covered period, then no payments are due until the SBA remits payment of a forgiveness amount or determines that no forgiveness is authorized. If we do not submit a request for forgiveness within ten months after the end of the covered period, we will begin making payments on the PPP loan. The PPP loan may be prepaid at any time prior to maturity with no prepayment penalties. Funds from the PPP loan may only be used for qualifying expenses as described in the CARES Act, including qualifying payroll costs, qualifying group health care benefits, qualifying rent and debt obligations, and qualifying utilities. We intend to use the entire loan amount for qualifying expenses. Under the terms of the PPP, certain amounts of the loan may be forgiven if they are used for qualifying expenses. We intend to apply for forgiveness of the PPP loan with respect to these qualifying expenses, however, we cannot be assured that such forgiveness of any portion of the PPP loan will occur.
We may not be able to successfully implement our growth strategy.
Our future growth, profitability, and cash flows depend upon our ability to successfully implement our business strategy, which, in turn, is dependent upon a number of key initiatives, including our ability to:
| - | Develop effective distribution partnerships to present and market products to consumers in vast regional markets; | |
| - | Continually satisfy and perpetuate a loyal consumer base; | |
| - | Continue the growth of product sales to global markets and expand new product pipelines for new market sectors; | |
| - | Preemptively enter advanced technologies into the marketplace before competitors are able to scientifically compete; | |
| - | Design a focused and defined marketing plan, as well as have a capable marketing staff to execute the plan; | |
| - | Concentrate and develop our expertise while keeping the team directed and focused; | |
| - | Rapidly develop new technologies and formulations with the related intellectual property (“IP”) through efficiencies achieved by a focused staff and limited regulatory delays; and | |
| - | Adaptively use new marketing technologies and mediums. |
(See “Our Business – Critical Success Factors: Components to Success.”)
There can be no assurance that we can successfully achieve any or all of the above initiatives in the manner or time period that we expect. We cannot provide any assurance that we will realize, in full or in part, the anticipated benefits we expect our strategy will achieve. The failure to realize those benefits would have a material adverse effect on our business, financial condition, and results of operations.
Investment in us is highly speculative.
Investment in us is speculative and by investing, each investor assumes the risk of losing a substantial portion or all of their investment. There is no guarantee of any return on an Investor’s investment. Only investors who are able to bear the loss of their entire investment, and who otherwise meet the qualifications discussed in this Offering Circular, should consider investing in the Shares.
| 12 |
The biotech research industry is highly competitive, and if we are unable to compete effectively our results will suffer.
We face vigorous competition from companies throughout the world, including large multinational consumer products companies that have many brands under ownership, with many distribution channels. Competition in this industry is based on the introduction of new products, pricing of products, brand awareness, technology, perceived value and quality, innovation, presence and visibility, promotional activities, advertising, editorials, e-commerce, and mobile-commerce initiatives and other activities. We must compete with a high volume of new product introductions and existing products by diverse companies across several different distribution channels.
Many multinational consumer companies have greater financial, technical, or marketing resources, longer operating histories, greater brand recognition, or larger customer bases than we do and may be able to respond more effectively to changing business and economic conditions than we can. We may be unsuccessful in our growth strategy in the event that we are not able to reach our target market or collaborate with our strategic partners. In addition, our competitors, many of whom have greater resources than we do, may be better able to produce similar products or technologies and withstand longer amounts of time without sales.
It is difficult for us to predict the timing and scale of our competitors’ activities in these areas or whether new competitors will emerge in this industry. In addition, further technological breakthroughs, including new and enhanced technologies which increase competition in the online retail market, new product offerings by competitors, and the strength and success of our competitors’ marketing programs may impede our growth and the implementation of our business strategy.
Our ability to compete also depends on the continued strength of our brand and products, the success of our marketing, innovation and execution strategies, the continued diversity of our product offerings, the successful management of new product introductions and innovations, strong operational execution, including in order fulfillment, and our success in entering new markets and expanding our business in existing geographies. If we are unable to continue to compete effectively, it would have a material adverse effect on our business, financial condition, and results of operations.
A disruption in our operations could materially and adversely affect our business.
Our operations, including those of our third-party manufacturers and suppliers, are subject to the risks inherent in such activities, including industrial accidents, environmental events, strikes and other labor disputes, disruptions in information systems, product quality control, safety, licensing requirements. and other regulatory issues, as well as natural disasters, pandemics (such as the COVID-19 pandemic), border disputes, acts of terrorism, and other external factors over which we and our third-party manufacturers and suppliers have no control. If our third-party manufacturers continue to be adversely affected by COVID-19 restrictions, leading to delays in production times, it will directly affect our business and operations. The loss of, or damage to, the manufacturing facilities of our third-party manufacturers and suppliers and could materially and adversely affect our business, financial condition, and results of operations.
We do not manufacture our products ourselves and rely on a number of third-party suppliers, manufacturers, and other vendors, which may lead to delayed production and could have a material adverse effect on our business, results of operation, and financial condition.
We use multiple third-party suppliers and manufacturers to source and manufacture substantially all of our products. With them, we now have the capacity to produce our product on a large-scale, contract-manufacturing basis. We are reliant on FDA licensed facilities to manufacture our products at a high level of quality control. The ability of these third parties to supply and manufacture our products may be affected by:
| - | competing orders from other companies; |
| 13 |
| - | varied quality control and regulatory actions; | |
| - | economic or business interests or goals that are inconsistent with ours; | |
| - | actions taken contrary to our instructions, requests, policies, or objectives; | |
| - | being unable or unwilling to fulfill their obligations under relevant purchase orders, including obligations to meet our production deadlines, quality standards, pricing guidelines and product specifications, or to comply with applicable regulations, including those regarding the safety and quality of products and ingredients and good manufacturing practices; | |
| - | their financial difficulties; | |
| - | not complying with FDA requirements; | |
| - | raw material or labor shortages; | |
| - | COVID-19 restrictions; | |
| - | increases in raw material or labor costs which may affect our costs; and | |
| - | engaging in activities or employing practices that may harm our reputation. |
Should our suppliers or manufacturers be unable to achieve our required levels of production according to our specifications, in a timely manner or on budget, our profitability may be adversely affected. Further, failure to produce as specified as a result of a manufacturing process or ingredients can lead to costly recalls with public relations issues. The occurrence of any of these events, alone or together, could have a material adverse effect on our business, financial condition, and results of operations.
In addition, such problems may require us to find new third-party suppliers or manufacturers, and there can be no assurance that we would be successful in finding new third-party suppliers or manufacturers. If we experience any supply chain disruptions caused by our manufacturing process or by our inability to locate suitable third-party manufacturers or suppliers, or if our manufacturers or raw material suppliers experience problems with product quality or disruptions or delays in the manufacturing process or delivery of the finished products or the raw materials or components used to make such products, our business, financial condition, and results of operations could be materially and adversely affected.
Our success depends, in part, on our retention of key members of our senior management team and ability to attract and retain qualified personnel.
Our success depends, in part, on our ability to recruit and retain key employees, including our executive officers, product development, operations, customer service, sales and marketing personnel. We are a small company that relies on a few key employees, any one of whom would be difficult to replace, and because we are a small company, we believe that the loss of key employees may be more disruptive to us than it would be to a larger company. Our success also depends, in part, on our continuing ability to identify, hire, train, and retain other highly qualified personnel. In addition, we may be unable to effectively plan for the succession of senior management, including our CEO and COO. The loss of key personnel or the failure to attract and retain qualified personnel may have a material adverse effect on our business, financial condition, and results of operations.
Our management has broad discretion as to the use of proceeds from this Offering.
The net proceeds from this Offering will be used as described under “Use of Proceeds.” We reserve the right to use the funds obtained from this Offering for other purposes not presently contemplated which we deem to be in our best interests and our shareholders in order to address changed circumstances and opportunities. As a result of the foregoing, our success may be affected by the judgment of our management with respect to the application and allocation of the net proceeds of the Offering. Investors are entrusting their funds to our management, upon whose judgment and discretion the Investors must depend, with only limited information concerning management’s specific intentions.
| 14 |
There is no assurance of successful expansion of operations.
We intend to increase the scope and the scale of our operations, including the hiring of additional personnel, which will result in higher operating expenses. We anticipate that our operating expenses will continue to increase. Expansion of our operations may also make significant demands on our management, finances, and other resources. Our ability to manage the anticipated future growth, should it occur, will depend upon a significant expansion of our accounting and other internal management systems and the implementation and subsequent improvement of a variety of systems, procedures, and controls. We cannot assure that significant problems in these areas will not occur. Failure to expand these areas and implement and improve such systems, procedures, and controls in an efficient manner at a pace consistent with our business could have a material adverse effect on our business, financial condition, and results of operations. We cannot assure potential investors that attempts to expand our marketing, sales, manufacturing, and customer support efforts will succeed or generate additional sales or profits in any future period. As a result of the expansion of our operations and the anticipated increase in our operating expenses, along with the difficulty in forecasting revenue levels, we expect to continue to experience significant fluctuations in our results of operations.
We are subject to international business uncertainties.
We are currently developing our international sales and distribution channels. We intend to sell to customers outside of the U.S. and maintain our relationships in other foreign countries where we have suppliers and manufacturers. Further, we may establish additional relationships in other countries to grow our operations. The lack of consumer awareness of our products, differences in consumer preferences and trends between the U.S. and other jurisdictions, the risk of inadequate intellectual property protections and differences in packaging, labeling, and related laws, rules, and regulations are all inherent risks that need to be evaluated to do business in new territories. We cannot be assured that our international efforts will be successful. International sales and increased international operations may be subject to risks such as:
| - | difficulties in staffing and managing foreign operations; | |
| - | burdens of complying with a wide variety of laws and regulations, including more stringent regulations relating to data privacy and security; | |
| - | adverse tax effects and foreign exchange controls making it difficult to repatriate earnings and cash; | |
| - | political and economic instability; | |
| - | terrorist activities and natural disasters; | |
| - | trade restrictions; | |
| - | differing employment practices and laws and labor disruptions; | |
| - | the imposition of government controls; | |
| - | an inability to use or to obtain and/or defend and hence provide adequate intellectual property protection for our key brands and products; | |
| - | tariffs and customs duties and the classifications of our goods by applicable governmental bodies; | |
| - | a legal system subject to undue influence or corruption; | |
| - | a business culture in which illegal sales practices may be prevalent; | |
| - | logistics and sourcing; | |
| - | military conflicts: and | |
| - | the effects of governmental regulatory responses to pandemics. |
The occurrence of any of these risks could negatively affect our international business and consequently our overall business, financial condition, and results of operations.
| 15 |
If we are unable to obtain and maintain sufficient intellectual property protection for our products, or if the scope of the intellectual property protection is not sufficiently broad, our competitors could develop and commercialize products similar or identical to ours, and our ability to successfully commercialize our products may be adversely affected.
Our success depends in large part on our ability to obtain and maintain patent protection in the U.S. and other countries with respect to our products. We seek to protect our proprietary position by filing patent applications in the U.S. and abroad related to our technologies, however, we cannot predict:
| - | if and when patents may issue based on our patent applications; | |
| - | the scope of protection of any patent issuing based on our patent applications; | |
| - | whether the claims of any patent issuing based on our patent applications will protect our products and their intended uses or prevent others from commercializing competitive technologies or products; | |
| - | whether or not third parties will find ways to invalidate or circumvent our patent rights; | |
| - | whether or not others will obtain patents claiming aspects similar to those covered by our patents and patent applications; and/or | |
| - | whether we will need to initiate litigation or administrative proceedings to enforce and/or defend our patent rights which will be costly whether we win or lose. |
Obtaining and enforcing patents is expensive and time-consuming, and we may not be able to file and prosecute all necessary or desirable patent applications, or maintain and/or enforce patents that may issue based on our patent applications, at a reasonable cost or in a timely manner. It is also possible that we will fail to identify patentable aspects of our research and development results before it is too late to obtain patent protection. Although we enter into non-disclosure and confidentiality agreements with parties who have access to patentable aspects of our research and development output, such as our employees, corporate collaborators, outside scientific collaborators, contract research organizations, contract manufacturers, consultants, advisors, and other third parties, any of these parties may breach these agreements and disclose such results before a patent application is filed, thereby jeopardizing our ability to seek patent protection.
We may not identify relevant third-party patents or may incorrectly interpret the relevance, scope, or expiration of a third-party patent which might adversely affect our ability to develop and market our products.
We cannot guarantee that any of our patent searches or analyses, including the identification of relevant patents, the scope of patent claims, or the expiration of relevant patents, are complete or thorough, nor can we be certain that we have identified each and every third-party patent and pending application in the U.S. and abroad that is relevant to or necessary for the commercialization of our products in any jurisdiction.
The scope of a patent claim is determined by an interpretation of the law, the written disclosure in a patent, and the patent’s prosecution history. Our interpretation of the relevance or the scope of a patent or a pending application may be incorrect, which may negatively impact our ability to market our products. We may incorrectly determine that our products are not covered by a third-party patent or may incorrectly predict whether a third party’s pending application will issue with claims of relevant scope. Our determination of the expiration date of any patent in the U.S. or abroad that we consider relevant may be incorrect, which may negatively impact our ability to develop and market our products. Our failure to identify and correctly interpret relevant patents may negatively impact our ability to develop and market our products.
| 16 |
In the future, we may need to obtain additional licenses of third-party technology that may not be available to us or are available only on commercially unreasonable terms, and which may cause us to operate our business in a more costly or otherwise adverse manner that was not anticipated.
From time to time we may be required to license technology from additional third parties to further develop or commercialize our own technology and products. Should we be required to obtain licenses to any third-party technology, including any such patents required to manufacture, use, or sell our products and technology, such licenses may not be available to us on commercially reasonable terms, or at all. The inability to obtain any third-party license required to develop or commercialize any of our products or technology could cause us to abandon any related efforts, which could seriously harm our business and operations.
We may become involved in lawsuits alleging that we have infringed the intellectual property rights of third parties or to protect or enforce our patents or other intellectual property, which litigation could be expensive, time consuming, and adversely affect our ability to develop or commercialize our products.
The coverage of patents is subject to interpretation by the courts, and the interpretation is not always uniform. There is a substantial amount of intellectual property litigation in the biotechnology and pharmaceutical industries, and we may become party to, or threatened with, litigation or other adversarial proceedings regarding intellectual property rights. Third parties may assert infringement claims against us based on existing or future intellectual property rights. If we were sued for patent infringement, we would need to demonstrate that our technology, products, or methods either do not infringe the patent claims of the relevant patent or that the patent claims are invalid or unenforceable, and we may not be able to do this. Proving invalidity may be difficult. For example, in the U.S., proving invalidity in court requires a showing of clear and convincing evidence to overcome the presumption of validity enjoyed by issued patents. If we are found to infringe a third party’s intellectual property rights, we could be forced, including by court order, to cease developing, manufacturing, or commercializing the infringing product. Alternatively, we may be required to obtain a license from such third party in order to use the infringing technology and continue developing, manufacturing, or marketing the infringing product. However, we may not be able to obtain any required license on commercially reasonable terms or at all. Even if we were able to obtain a license, it could be non-exclusive, thereby giving our competitors access to the same technologies licensed to us. In addition, we could be found liable for monetary damages, including treble damages and attorneys’ fees if we are found to have willfully infringed a patent. A finding of infringement could prevent us from commercializing our products or force us to cease some of our business operations, which could materially harm our business.
In addition, we may find that competitors are infringing our patents, trademarks, copyrights, or other intellectual property. To counter infringement or unauthorized use, we may be required to file infringement claims, which can be expensive and time consuming and divert the time and attention of our management and scientific personnel. Any claims we assert against perceived infringers could provoke these parties to assert counterclaims against us alleging that we infringe their patents, in addition to counterclaims asserting that our patents are invalid or unenforceable, or both. In any patent infringement proceeding, there is a risk that a court will decide that a patent of ours is invalid or unenforceable, in whole or in part, and that we do not have the right to stop the other party from using the invention at issue. There is also a risk that, even if the validity of such patents is upheld, the court will construe the patent’s claims narrowly or decide that we do not have the right to stop the other party from using the invention at issue on the grounds that our patent claims do not cover the invention. An adverse outcome in a litigation or proceeding involving our patents could limit our ability to assert our patents against those parties or other competitors, and may curtail or preclude our ability to exclude third parties from making and selling similar or competitive products. Any of these occurrences could adversely affect our competitive business position, business prospects, and financial condition. Similarly, if we assert trademark infringement claims, a court may determine that the marks we have asserted are invalid or unenforceable, or that the party against whom we have asserted trademark infringement has superior rights to the marks in question. In this case, we could ultimately be forced to cease use of such trademarks. Even if we establish infringement, the court may decide not to grant an injunction against further infringing activity and instead award only monetary damages, which may or may not be an adequate remedy.
| 17 |
Furthermore, because of the substantial amount of discovery required in connection with intellectual property litigation, there is a risk that some of our confidential information could be compromised by disclosure during litigation. There could also be public announcements of the results of hearings, motions, or other interim proceedings or developments. Moreover, we cannot assure you that we will have sufficient financial or other resources to defend or pursue such litigation, which typically lasts for years before a conclusion. Even if we are successful in such a proceeding, we may incur substantial costs and the time and attention of our management and personnel could be diverted during a proceeding, which could have a material adverse effect on our business and operations. In addition, we may not have sufficient resources to bring an action to a successful conclusion.
Because of the expense and uncertainty of litigation, we may not be in a position to enforce our intellectual property rights against third parties.
Because of the expense and uncertainty of litigation, we may conclude that even if a third party is infringing our issued patent, any patents that may be issued as a result of our pending or future patent applications or other intellectual property rights, the risk-adjusted cost of bringing and enforcing such a claim or action may be too high or not in the best interest of our company or our stockholders. In such cases, we may decide that the more prudent course of action is to simply monitor the situation or initiate or seek some other non-litigious action or solution.
We may be subject to claims that our employees, consultants, or independent contractors have wrongfully used or disclosed confidential information of third parties.
We could in the future be subject to claims that we or our employees have inadvertently or otherwise used or disclosed alleged trade secrets or other confidential information of former employers or competitors. Although we try to ensure that our employees and consultants do not use the intellectual property, proprietary information, know-how or trade secrets of others in their work for us, we may become subject to claims that we caused an employee to breach the terms of his or her non-competition or non-solicitation agreement, or that we or these individuals have, inadvertently or otherwise, used or disclosed the alleged trade secrets or other proprietary information of a former employer or competitor.
While we may litigate to defend ourselves against these claims, even if we are successful, litigation could be a distraction to management and result in substantial costs. If our defenses to these claims fail, in addition to requiring us to pay monetary damages, a court could prohibit us from using technologies or features that are essential to our products, if such technologies or features are found to incorporate or be derived from the trade secrets or other proprietary information of the former employers. Moreover, any such litigation or the threat thereof may adversely affect our reputation, our ability to form strategic alliances or sublicense our rights to collaborators, engage with scientific advisors or hire employees or consultants, each of which would have an adverse effect on our business, results of operations, and financial condition.
| 18 |
We may not be able to protect our intellectual property rights throughout the world.
Patents are of national or regional effect, and filing, prosecuting, and defending patents on all of our products throughout the world would be prohibitively expensive. As such, we may not be able to prevent third parties from producing our inventions in all countries outside the U.S., or from selling or importing products made using our inventions in and into the U.S. or other jurisdictions. Further, the legal systems of certain countries, particularly certain developing countries, do not favor the enforcement of patents and other intellectual property protection, particularly those relating to pharmaceuticals or biologics, which could make it difficult for us to stop the infringement of our patents or marketing of competing products in violation of our proprietary rights generally. In addition, certain developing countries have compulsory licensing laws under which a patent owner may be compelled to grant licenses to third parties. This could limit our potential revenue opportunities. Accordingly, our efforts to enforce our intellectual property rights around the world may be inadequate to obtain a significant commercial advantage from the intellectual property that we develop or license.
We may rely on trade secret and proprietary know-how which can be difficult to trace and enforce and, if we are unable to protect the confidentiality of our trade secrets, our business and competitive position would be harmed.
In addition to seeking patents for some of our technology and products, we may also rely on trade secrets, including unpatented know-how, technology, and other proprietary information, to maintain our competitive position. Elements of our products and technology, including processes for their preparation and manufacture, may involve proprietary know-how, information, or technology that is not covered by patents, and thus for these aspects we may consider trade secrets and know-how to be our primary intellectual property. Any disclosure, either intentional or unintentional, by our employees, the employees of third parties with whom we share facilities or third party consultants and vendors that we engage to perform research, clinical trials, or manufacturing activities, or misappropriation by third parties (such as through a cybersecurity breach) of our trade secrets or proprietary information could enable competitors to duplicate or surpass our technological achievements, thus eroding our competitive position in our market.
Trade secrets and know-how can be difficult to protect. We require our employees to enter into written employment agreements containing provisions of confidentiality and obligations to assign to us any inventions generated in the course of their employment. We and any third parties with whom we share facilities enter into written agreements that include confidentiality and intellectual property obligations to protect each party’s property, potential trade secrets, proprietary know-how, and information. We further seek to protect our potential trade secrets, proprietary know-how, and information in part, by entering into non-disclosure and confidentiality agreements with parties who are given access to them, such as our corporate collaborators, outside scientific collaborators, contract research organizations, contract manufacturers, consultants, advisors, and other third parties. With our consultants, contractors, and outside scientific collaborators, these agreements typically include invention assignment obligations. Despite these efforts, any of these parties may breach the agreements and disclose our proprietary information, including our trade secrets, and we may not be able to obtain adequate remedies for such breaches. Enforcing a claim that a party illegally disclosed or misappropriated a trade secret is difficult, expensive, and time-consuming, and the outcome is unpredictable. In addition, some courts inside and outside the U.S. are less willing or unwilling to protect trade secrets. If any of our trade secrets were to be lawfully obtained or independently developed by a competitor or other third party, we would have no right to prevent them from using that technology or information to compete with us. If any of our trade secrets were to be disclosed to or independently developed by a competitor or other third party, our competitive position would be harmed.
| 19 |
Rapid technological change could make our products obsolete.
Pharmaceutical technologies have historically undergone, and will most likely continue to undergo, rapid and significant change and improvement. Our future will depend in large part on our ability to maintain our competitive position with respect to these rapidly evolving technologies. Any pharmaceutical products or processes that we develop may become obsolete before we recover expenses incurred in connection with their development. Obsolescence of our products and technology would materially and adversely affect our business, financial condition, and results of operations.
Changes in regulations could increase our costs and affect our profitability.
Our activities are highly regulated and subject to government oversight. Various federal, state, provincial and local laws and regulations govern drug approvals, manufacturing, and marketing, as well as licensing, trade, tax, and environmental matters. Governing bodies regularly issue new regulations and changes to existing regulations. Also the regulatory response to a pandemic may adversely affect sales, distribution, and shipping, as well as creating many other potential issues. Our need to comply with new or revised regulations or their interpretation and application including proposed requirements designed to enhance safety or to regulate imported ingredients, could materially and adversely affect our product sales, financial condition, and results of operations.
We may not meet our product development milestones.
We may not meet our product development and commercialization milestones, and may meet adverse competition, marketing restrictions, supply obstacles, pricing restrictions, regulatory issues, and other sales impediments in targeted markets. If any of these events hinder our market development, it will reduce our overall sales and adversely affect our financial condition.
Any event affecting our access to components may affect our production.
Base components used in our formulations may become readily unavailable, restricted, face increased tariffs, realize increased transportation or distribution costs, or have supply issues, which will result in the development of our products becoming more expensive. Any of these events or others would restrict our ability to manufacture products at competitive pricing levels, thereby adversely increasing our costs of production and marketability of our products.
We may enter into agreements with customers and partners that may require us to share our intellectual property rights.
We may enter into agreements with customers and partners that may require us to share our intellectual property rights. Entering into these relationships poses a number of risks, including but not limited to: disputes may arise in the future with respect to the ownership of intellectual property rights; disagreements with corporate partners could delay or terminate the development or commercialization of products, or result in litigation or arbitration; we cannot effectively control whether contractors or partners will devote sufficient resources to our partnership or products; partners with marketing rights may choose to devote fewer resources to the marketing of our products than they do to others; and partners have discretion in electing whether to work with us. Given these risks, any partnership or business relationship may not be successful. Failure of these efforts could delay our product development of impair commercialization of our products. If any of the aforementioned events were to occur, it will adversely affect sales forecasts and market expansion.
| 20 |
Any failure in testing will affect our business plan.
Any failures, missteps, or delays in our testing of our products during any phase of the development through manufacturing processes, could negatively affect our customer relationships, jeopardize sales, increase our costs, delay product production and sales, and give us legal exposure.
Additional Risks of Investment. The additional items set forth below, individually or in combination with some or all of the risk factors set forth above, could cause actual results to differ materially from those contemplated by management:
| ● | The possibility that we will not fully realize the anticipated benefits of our business know how, IP, objectives, acquisitions, and other business strategy; | |
| ● | Our inability to execute our business plan; | |
| ● | Our reliance on one or more suppliers to provide raw materials; | |
| ● | The slowing or lack of growth of sunscreen and skincare markets due to competition or other factors; | |
| ● | Adverse changes in general economic and business conditions; | |
| ● | Our financial condition and liquidity, as well as our future cash flow and earnings; | |
| ● | Our inability to manage our operating expenses; | |
| ● | The adverse effect, interpretation, or application of new or existing laws, regulations, and court decisions; | |
| ● | The lack of availability of operational or developmental funding with terms or in amounts that our business would require; | |
| ● | Developments in technology by our competitors that we cannot match; | |
| ● | Our inability to develop our technology in a timely manner or in a direction that the market will accept; | |
| ● | Catastrophic events and natural disasters such as pandemics, fires, and floods; | |
| ● | Acts of war, political and economic upheavals, and terrorist activities; and | |
| ● | Other economic, political, and technological risks and uncertainties. Importantly these may include other regulatory, quality control, staffing, production, legal, transportation and other unforeseen issues. |
| 21 |
As of the date of this Offering Circular, an aggregate of 15,800,000 Shares are issued and outstanding. In addition, we have 5,650,000 stock options outstanding.
If you purchase Shares in this Offering, your ownership interest in our Common Stock will be diluted immediately, to the extent of the difference between the price to the public charged for each Share in this Offering and the net tangible book value per share of our Common Stock after this Offering.
Our net tangible book value as of September 30, 2020 was $(9,000) or $0.00 per share based on 15,550,000 outstanding Shares as of such date. Net tangible book value per share equals the amount of our total tangible assets less total liabilities, divided by the total number of Shares outstanding, all as of the date specified.
If the Maximum Offering, at an offering price of $6.50 per Share, is sold in this Offering, after deducting approximately $2,485,000 in sales commissions and estimated Offering expenses payable by us, our pro forma as adjusted net tangible book value would be approximately $17,015,000, or $0.92 per Share. This amount represents an immediate increase in pro forma net tangible book value of $0.92 per share to our existing stockholders prior to this Offering, and an immediate dilution in pro forma net tangible book value of approximately $5.58 per share to new investors purchasing Shares in this Offering at a price of $6.50 per Share.
The following table illustrates the per share dilution to new investors discussed above, assuming the sale of the Maximum Offering.
| Funding Level | $ | 19,500,000 | ||
| Offering Price | $ | 6.50 | ||
| Pro forma net tangible book value per share of Common Stock before the Offering | $ | 0.00 | ||
| Increase per share attributable to investors in this Offering | $ | 6.50 | ||
| Pro forma net tangible book value per share of Common Stock after the Offering | $ | 0.92 | ||
| Dilution to investors in the Offering | $ | 5.58 |
The following tables set forth, assuming the sale of the Maximum Offering, the total number of Shares previously sold to existing stockholders as of the date of this Offering Circular including Shares issued for services, the total number of Shares to be sold to investors in this Offering, the total consideration paid for the foregoing (based on cash actually received and the value of Shares issued for services) and the respective percentages applicable to such purchased shares and consideration paid, based on an average price of $2.80 per Share paid by our existing stockholders, and $6.50 per Share paid by new investors in this Offering. The tables below do not include any exercise of outstanding awards.
| Shares Purchased | Total Consideration | |||||||||||||||
| Number | Percentage | Amount | Percentage | |||||||||||||
| Assuming 100% of Shares Sold: | ||||||||||||||||
| Existing stockholders | 15,800,000 | 84 | % | $ | 5,640,000 | 22 | % | |||||||||
| New Investors | 3,000,000 | 16 | % | $ | 19,500,000 | 78 | % | |||||||||
| Total | 18,800,000 | 100 | % | $ | 25,140,000 | 100 | % | |||||||||
| 22 |
PLAN OF DISTRIBUTION AND SELLING SECURITYHOLDERS
This Offering Circular is part of an Offering Statement that we filed with the SEC, using a continuous offering process. Periodically, as we have material developments, we will provide an Offering Circular supplement that may add, update, or change information contained in this Offering Circular. Any statement that we make in this Offering Circular will be modified or superseded by any inconsistent statement made by us in a subsequent Offering Circular supplement. The Offering Statement we filed with the SEC includes exhibits that provide more detailed descriptions of the matters discussed in this Offering Circular. You should read this Offering Circular and the related exhibits filed with the SEC and any Offering Circular supplement, together with additional information contained in our annual reports, semi-annual reports and other reports and information statements that we will file periodically with the SEC. See the section entitled “Where You Can Find More Information” for more details.
The Shares are being offered pursuant to Regulation A of Section 3(b) of the Securities Act of 1933, as amended, for Tier 2 offerings, by our management on a “best-efforts” basis directly to purchasers who satisfy the requirements set forth in Regulation A. We have the option in our sole discretion to accept less than the minimum investment from any subscriber. There is no aggregate minimum to be raised in order for the Offering to become effective, and therefore the Offering will be conducted on a “rolling basis.” This means we are entitled to begin applying “dollar one” of the proceeds from the Offering towards our business strategy, research and development expenses, offering expenses, sales commissions, working capital, and other uses, as more specifically set forth in the “Use of Proceeds to Issuer.”.
Our Offering will expire on the first to occur of (a) the sale of the Maximum Offering, (b) March 1, 2022 or (c) when our Board elects to terminate the Offering.
We are offering the Common Stock for sale in all states. We have engaged Dalmore, a broker-dealer registered with the SEC and a member of FINRA, to act as the broker-dealer of record in connection with this Offering, but not for underwriting or placement agent services. Dalmore will:
● | Review investor information, including KYC (“Know Your Customer”) data, AML (“Anti Money Laundering”) and other compliance background checks, and provide a recommendation to us whether or not to accept investor as a customer; | |
● | Review each investor’s subscription agreement to confirm such investor’s participation in the Offering, and provide a determination to us whether or not to accept the use of the subscription agreement for the investor’s participation; | |
● | Contact and/or notify us, if needed, to gather additional information or clarification on an investor; | |
● | Not provide any investment advice nor any investment recommendations to any investor; | |
● | Keep investor details and data confidential and not disclose to any third-party except as required by regulators or pursuant to the terms of the agreement (e.g. as needed for AML and background checks); and | |
● | Coordinate with third-party providers to ensure adequate review and compliance. |
As compensation for the services listed above, we have agreed to pay Dalmore $5,000 as a one-time set up fee, plus a commission equal to 1% of the amount raised in the Offering to support the Offering. In addition, we have agreed to engage Dalmore as a consultant to provide ongoing general consulting services relating to the Offering, such as coordination with third party vendors and general guidance with respect to the Offering. We will pay a one-time consulting fee of $20,000, which will be due and payable immediately after FINRA issues a No Objection Letter. Assuming that the maximum offering amount is sold, we estimate that the total fees we will pay to Dalmore will be approximately $220,000.
Generally speaking, Rule 3a4-1 provides an exemption from the broker-dealer registration requirements of the Securities Exchange Act of 1934 (the “Exchange Act”) for persons associated with an issuer that participate in an offering of the issuer’s securities. None of our officers or directors are subject to any statutory disqualification, as that term is defined in Section 3(a)(39) of the Exchange Act. None of our officers or directors will be compensated in connection with his or her participation in the Offering by the payment of commissions or other remuneration based either directly or indirectly on transactions in our securities. None of our officers or directors are, or have been within the past 12 months, a broker or dealer, and none of them are, or have been within the past 12 months, an associated person of a broker or dealer. Upon completion of the Offering, our officers or directors will continue to primarily perform substantial duties for us or on our behalf otherwise than in connection with transactions in securities. None of our officers or directors will participate in selling an offering of securities for any issuer more than once every 12 months other than in reliance on Exchange Act Rule 3a4-1(a)(4)(i) or (iii) except that for securities issued pursuant to Rule 415 under the Securities Act, the 12 months shall begin with the last sale of any security included within one Rule 415 registration.
Selling Security Holders
No securities are being sold for the account of security holders; all net proceeds of this Offering will go to the Company.
| 23 |
If the Maximum Offering is sold, the maximum gross proceeds from the sale of our Common Stock in this Offering will be $19,500,000. The net proceeds from the total Maximum Offering are expected to be approximately $17,015,000 after the payment of sales commissions and Offering costs (including filing fees and legal, accounting, printing, due diligence, marketing, selling, and other costs incurred in the Offering, which we intend to pay using a portion of the proceeds of this Offering). The budget for Offering costs is an estimate only and the actual Offering costs may differ. The following table represents management’s best estimate of the uses of the gross proceeds received from the sale of Common Stock in this Offering assuming the Maximum Offering. Management expects to use the unallocated proceeds from the sale of Common Stock in this Offering in roughly the same proportions reflected in the following table for the purposes specified below on a going-forward basis.
| Marketing- Staff and Campaigns | $ | 9,760,000 | 50 | % | ||||
| Administrative Facilities | $ | 1,365,000 | 7 | % | ||||
| Research and Development; Testing and Lab Equipment | $ | 1,170,000 | 6 | % | ||||
| Raw Materials and Inventory | $ | 780,000 | 4 | % | ||||
| Legal, IP, and Regulatory Costs | $ | 585,000 | 3 | % | ||||
| Executive Compensation | $ | 235,000 | 1 | % | ||||
| Working Capital | $ | 2,925,000 | 15 | % | ||||
| Offering Expenses | $ | 2,485,000 | 13 | % | ||||
| Sales Commissions | $ | 195,000 | 1 | % | ||||
| TOTAL | $ | 19,500,000 | 100 | % |
Marketing- Staff and Campaigns. A majority of the proceeds from this Offering is intended to be used to initiate and bolster our marketing efforts, either through the direct expansion of hiring additional senior management and marketing support staff, or through an acquisition of a marketing company. Our efforts will include increasing brand awareness and retail expansion in order to propel sales for the sectors that we have targeted. (See “Our Business.”) Additionally, we intend to retain additional staff to directly support the ingredient sales to our partners who already have prime market positions and can promote our next generation formulations added into their products.
Administrative Facilities. In connection with our intention to expand our administrative staff and our production, we intend to use a portion of the proceeds from this Offering to lease both additional administrative office space for the staff and warehouse space to store finished products and raw materials.
Research and Development; Testing and Lab Equipment. Research and Development (“R&D”) is expected to remain at a level of <10% of future revenues. Our system has evolved with new R&D efficiencies and a designed inherent flexibility. This means that new, highly effective, low cost consumer retail formulations can be rapidly developed for testing. It is not expected that we will face major financial commitments for new generational cosmeceutical projects. Some retail and Over the Counter (“OTC”) formulations may be designed, tested, and deployed into markets in as little as an 18 to 36 month time frame. We will also use certain proceeds to fund R&D, product testing, and the commercialization of new pipeline products.
| 24 |
Raw Materials and Inventory. We intend to use a portion of the proceeds of this Offering for costs of our raw materials and manufacturing inventory.
Legal, IP, and Regulatory Costs. We intend to initially list our Shares on the OTC Markets. In connection therewith, legal costs related to our disclosure and regulatory filings will substantially increase. Additional costs may also be incurred in a potential up listing process onto a senior exchange. We also have legal costs related to producing and developing our pharmaceuticals. Further, we have ongoing R&D which may require further IP and trademark fillings both domestically and internationally. We also have ongoing fees associated with maintaining existing IP and the processing of our pending patent applications.
Executive Compensation. We intend to use a portion of the proceeds raised in this Offering to fund the compensation payable to our executive officers, as described under “Compensation of Directors and Executive Officers.” We may pay our directors cash compensation and compensate them with the proceeds of this Offering.
Working Capital. We anticipate that our operating capital needs will increase along with an increase of our staff and production. We intend to use a portion of the proceeds of this Offering to cover the additional costs of maintaining, shipping, and logistically delivering products prior to final payments for the sale of these goods being received.
Offering Expenses. We intend to use a portion of the proceeds from this Offering for the expenses related to this Offering, including legal, accounting, marketing, printing, and regulatory fees and expenses.
Sales Commissions. We intend to use a portion of the proceeds from this Offering to pay sales commissions in the estimated amount of $0.065 for every Share. Therefore, if the Maximum Offering of $19,500,000 is sold, the total compensation to the selling group will be $195,000.
Our plan of operations for the next few years includes advancing the development, sales, and marketing of our product line, as well as investing in our infrastructure and our continued R&D. The amounts set forth above are our current estimates for such development, and we cannot be certain that actual costs will not vary from these estimates. Our management has significant flexibility and broad discretion in applying the proceeds received in this Offering. We cannot assure you that our assumptions, expected costs and expenses and estimates will prove to be accurate or that unforeseen events, problems, or delays will not occur that would require us to seek additional debt and/or equity funding, which may not be available on favorable terms or at all. (See “Risk Factors.”)
This expected use of the proceeds from this Offering represents our intentions based upon our current financial condition, results of operations, business plans and conditions. As of the date of this Offering Circular, we cannot predict with certainty all of the particular uses for the proceeds to be received upon the closing of this Offering or the amounts that we will actually spend on the uses set forth above. The amounts and timing of our actual expenditures may vary significantly depending on numerous factors. As a result, our management will retain broad discretion over the allocation of the proceeds from this Offering.
We believe that if we raise the Maximum Offering, we will have sufficient capital to finance our operations for the next 12 months. However, if we do not sell the Maximum Offering or if our operating and development costs are higher than expected, we may need to obtain additional financing prior to that time.
Pending our use of the net proceeds from this Offering, we may invest the net proceeds in a variety of capital preservation investments, including short-term, investment grade, interest bearing instruments and United States government securities and including investments in related parties. We may also use a portion of the net proceeds for investment in strategic partnerships and possibly the acquisition of complementary businesses, products, or technologies, although we have no present commitments or agreements for any specific acquisitions or investments.
| 25 |
Corporate Structure
CoLabs Int’l, Corp. (the “Company,” “CoLabs,” “we,” “our,” and “us”) was incorporated on August 5, 2008 under the laws of the State of Nevada as an OTC pharmaceutical company with multi-market applications for our revolutionary targeted epidermal-drug delivery system which is identified as: QuantaSphere® Technology (QS®).
We are authorized to issue 50,000,000 Shares. As of the date of this Offering Circular, we had 15,800,000 Shares issued and outstanding.
We currently hold 26 issued patents and have an additional eight patents applications pending.
Overview
Our technology places drugs into micro-sized, electrostatically charged encapsulates as well as into other types of micro-encapsulates. These encapsulates are then suspended in uniquely designed formulations. This formulation of a highly advanced micro-technology can: target the delivery of topically applied drugs; limit unwanted absorption of chemicals, drugs, and cosmetics through the skin; and provide a designed release of active ingredients with a prescribed depth of skin penetration.
We have already developed commercially unique and innovative targeted skin delivery systems for topical pharmacology. Our technology limits unwanted side effects that can occur as a result of absorption through the skin. The penetration of chemicals through the skin can have serious impact on the body’s organs and systems. Our current applications include anti-bacterial/viral sanitizers/soaps, sunscreens, fragrances, pest-repellents, and healing cosmetic lotions. For consumers, we provide elegant skin delivery and enhanced consumer safety of topically applied drugs and cosmetics. This combined end purpose is the unique foundation of our technology.
The Issue—Therapeutic Risks of Topical Drugs:
Major issues exist for the direct topical application for pharmaceutical ingredients. When drugs are applied to our largest organ, the skin, toxicity from absorption can occur. The Food and Drug Administration (“FDA”) recently released an alarming, highly publicized study that revealed that topically applied sunscreens were detected in blood after several reapplications.
The threat to users of topical skin medications provides the key significance for our unique science for medicine and vast consumer products. Notably, the FDA is in the process of developing new testing protocols (MUsT) for topical OTC drugs to evaluate their effects on the body when absorbed. This major issue is the target of our QS® Technology. (See “Our Business” – “FDA: Maximum Usage Trials (MUst) for Topical Active Ingredients.”)
QS® Technology is designed to improve effectiveness, durability, and tenaciousness when compared with the current, competing application systems. Current competitors’ skin medications offer uncontrolled release; limited effectiveness; and systemic absorption with potentially toxic side-effects. These issues are unacceptable to a growing number of knowledgeable consumers. Most importantly, this is concerning to medical providers, the FDA, and drug manufacturers themselves.
| 26 |
Our Solution:
We can introduce selected cosmetic drugs as well as FDA and Environmental Protection Agency (“EPA”) approved pharmaceutical and chemical active ingredients into proprietary Quantasphere® formulations. When these chemical active ingredients are adapted in our new delivery system, they are significantly enhanced in terms of the targeted delivery and efficacy of the active drug agent.
Our delivery system is revolutionary – a market disruptive, generational step to improve topical drug delivery. QS® formulations can dramatically reduce absorption while providing improved effectiveness. New formulations include slow or time-release systems for new pharmacology actives.
It is important to note that we are providing topical delivery for existing drug active ingredients. We are not currently developing and introducing new drugs for which a New Drug Application (“NDA”) is required. Thus, as new product formulations are developed, we may be able to avoid the long and costly FDA NDA process. We have also engaged a highly regarded FDA law firm to provide necessary FDA legal guidance and support for our products.
Business Structure and Operations
We are a mid-stage biotech company, having developed patented, tested formulations, and commercialized products since 2008. We believe our unique and scientifically advanced technology will make us a global leader in targeted epidermal delivery systems for cosmeceuticals, fragrances, antibacterial/anti-viral sanitizers/cleaners, and most importantly, topical pharmacology.
We directly market select products through the internet and in dermatologists’ offices. Additionally, we develop marketing relationships whereby we supply formulatory guidance and base formulations directly to our partners for distribution. As a supplier, we sell ingredients and/or finished products into this expanding distribution channel. We have also expanded sunscreen and sanitizers/soap distribution for our Klēnskin™ products internationally.
Our QuantaSphere® (QS®) Technology formulations provide advanced proprietary, epidermal therapeutic effects that are unique and market disruptive. As such, our products are consumer friendly. QS® Technology blends consumer needs for a healthy lifestyle with our targeted, eco-friendly, multi-tasking efficacy. Our innovative QS® Technology is vastly superior for non-transdermal delivery and importantly, is technologically adaptive, thereby, limiting toxicity for a wide variety of applications.
We have shown, in our tested and commercialized sun protection factor (“SPF”) and moisturizing formulations, that they provide efficacious, anti-aging, and cosmetically elegant protection. Importantly, this is being validated under the most grueling sun-sport applications. Our Klēnskin™ SPF sunscreen, has been the official sunscreen of both the AVP Beach Volleyball Series and the International FIVB - World Series of Beach Volleyball, Auto Club Speedway, and Talladega Superspeedway. We were selected because of our sunscreen’s effectiveness and cosmetic elegance, as well as the need to provide spectators with sunscreen protection.
Our Facilities and Manufacturing
We are a Nevada corporation, with our administrative offices located in Huntington Beach, California. Our CEO and COO operate from Huntington Beach, and with its limited inventory space, we are able to fulfill certain product orders.
| 27 |
We also operate a research facility in Sarasota, Florida for our product development, product design, and formulation. Daniel Traynor, our Vice-President of Product Development, and a part-time chemist work in this Sarasota laboratory facility.
We also utilize certain FDA licensed manufacturing facilities that receive the specified raw materials for the manufacturing process of our commercialized products. Certain lotions and Wash-On™ products are manufactured in Florida.
Our new solid SPF 30 Sticks and flavorful SPF 50 lip balms were successfully introduced into the market in mid-2019. These are produced in an FDA approved facility located in North Carolina.
We also have partnerships in Asia which are expanding in several countries with a focus on the distribution of our Wash-On™ sunscreens and insect repellent products including soaps, with both natural and chemical repellents. Our ingredient-based bar-soap is being developed and manufactured in Jakarta, Indonesia, with active ingredients supplied from the U.S. and our Aquea Wash On™ is bottled and packaged in Malaysia. We intend to have future production in Singapore.
CoLabs Int’l Corp— Scientific Revolution for Better Global Health
Our Place in Biotechnology
Like other biotech companies, we exist because large pharmaceutical companies are not as focused, responsive, and creatively productive as the smaller, more innovative, and defined biotech companies. Our innovations have developed advanced encapsulate technology and our ownership of intellectual property provides a novel enhanced delivery system for the skin. QS® Technology is applicable for FDA approved, advanced pharmaceutical drugs. We designed QS® Technology, to potentially reduce side-effects from unwanted drug absorption. Thus, we fit into the modern concept of biotech companies producing benefits that accrue to the benefit of consumers’ health and lifestyle.
Our Founder
Laura Cohen, MD, is a Board-Certified Dermatologist, Dermatologic Surgeon, and Academic Medical Clinician, in practice in Southern California. Dr. Cohen has been in private practice for over 30 years. She was part of the medical school clinical faculty at the University of South Florida; is currently part of the Clinical Faculty at the University of California Irvine; and was formerly medical staff at the Veterans Hospitals in Tampa, Florida; Las Vegas, Nevada; and Long Beach, California. She also serves on the Keck (USC) – Hoag Hospital Melanoma Advisory Board, St. Joseph Dermatology Specialty Advisory Group, and was a founding physician at Moffett Cancer Center in Tampa, Florida. Dr. Cohen is also a Fellow with the American Academy of Dermatology. (See “Directors, Executive Officers And Significant Employees.”)
Dr. Cohen realized the need for precision targeting of a drug and/or its delivery system during her years of professionally treating patients with various stages and types of skin cancer. When queried to see if they used preventive sunscreen protection, the answers varied from usually, occasionally, and seldom or never. Her follow up question was, “Do you bathe?” which always resulted in an affirmative answer. Reasons for not wearing sunscreen are well documented in various marketing/research studies. Sunscreens are most typically perceived by consumers as sticky or tacky, inconvenient to use in their daily routine, irritating to the eyes, creating allergic reactions, collecting dust on the skin, and simply viewed as not needed, detrimental, or toxic. Dr. Cohen recognized the failure in the delivery system of sunscreens and sought to address this serious issue.
| 28 |
Unique Features of Klēnskin™ Sunscreen
Most consumers are unaware that the World Health Organization (WHO) places the sun’s UV radiation in the same category as smoking and plutonium in terms of dangerous cancer-causing sources. Sadly, most patients with skin cancers and severe skin aging, did not realize that regular use of sunscreen could have prevented or reduced the damage. Further, over 80% of sun damage is caused by daily incidental sun exposure. It was clear to Dr. Cohen and Lisa LeBlanc that a novel, new type of delivery system was needed. They concluded that a wash-on sunscreen could become a major tool in preventing skin cancer caused by UV radiation exposure.
In 2008, Dr. Cohen and Ms. LeBlanc formed our company with a clear direction and scientific focus to develop a precise, user friendly, topical delivery system. Combining Dr. Cohen’s knowledge in skin pharmaceuticals and cosmetic chemistry with Lisa LeBlanc’s profound commitment to improved skin health led to exhaustive research into polymer-based formulations that could be utilized for sunscreens and other dermatologic applications. Together, they developed a revolutionary Wash-On SPF which could be applied in a shower or used at the sink to provide sunscreen skin protection while performing routine daily hygiene. The initial products were the Klēnskin™ Wash On® SPF 15 sunscreens, which were tested, commercialized, and dispensed through dermatologists’ offices.
The scientific significance of our advanced formulations is that the active ingredients are functionally designed to remain on the surface of the skin. Importantly, this unique innovation reduces absorption systemically of drugs. In the case of sunscreens, this means that photoreaction takes place on the surface of the skin rather than in the deeper living layer of epidermis. These formulations also have the active ingredients supplemented by antioxidants, which quench free radicals produced by the reaction of the chemical sunscreens and UV radiation, and also moisturizing agents, which further enhance the health of the skin.
Our sunscreen formulation advancement is very important because of the vast applications for other skin and healthcare issues using versions of this delivery system. The following graphs illustrate the significant reduction in active ingredients and absorption of the Klēnskin™ SPF 50 lotion, that has been achieved while maintaining a “tactical” efficacy for high intensity outdoor sport applications.
| 29 |
Percentage of Active Sunscreen in Product to Achieve a SPF 50

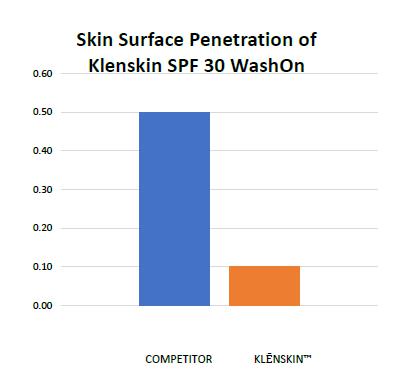
The commercialized example of this is the Klēnskin™ SPF 50 Lotion, water-resistant to 80 minutes. This lotion is highly effective while having less than 50% of the sunscreen active ingredients found in most other sunscreen products. Instead of 25 to 35% sunscreen actives, this product has only 12.5% screen actives while providing a tested SPF 50, water-resistant for 80 minutes, claim for sun protection. This tough tactical product, provides real protection appreciated by athletes, including swimmers, golfers, beach volleyball players, bikers, and campers, as well as anyone seeking sun protection from high-performance SPF lotion. These graphics illustrate the tested characteristics of our sunscreen formulations.
| 30 |

Only KLĒNSKIN™ sunscreen protects skin from the sun without saturating it with sunscreen chemicals.
KLĒNSKIN’S unique, patented formulations containing encapsulated SPF components keep sunscreen where it’s needed, on the skin surface, while inhibiting percutaneous absorption.
Microscopic ENCAPS containing UV filters boost SPF through light scattering and entrapping sunscreen actives. Unlike traditional sunscreens that soak into skin with absorption, KLĒNSKIN™ is the first sunscreen product to demonstrate reduced skin delivery absorption.
We intend to capture a strong position in the biotechnology sector, with the ongoing development of our innovative formulations and by partnering with the major pharmaceutical companies. QS® Technology is directly applicable to the commercialization for many approved products for skin cancer prevention and treatments, pest repellents, fragrances, sanitizing products, sun protection, and topical dermatologic treatments. By introducing these agents into our highly advanced and scientifically unique application and delivery system, we believe these products will become more efficacious and cosmetically elegant for consumers. (See “Our Business” – “Targeted Biotech Industry Sectors.”)
Strategic Direction
Our innovative QS® Technology is vastly superior for non-transdermal delivery and is technologically adaptive. We are taking advantage of our presence in this unique space, utilizing our existing reputation, existing IP, and design capacity in order to uniquely formulate specific versions of its QuantaSphere® Technology for use in major health and beauty market sectors.
| 31 |
We have provided major pharmaceutical companies with sample formulations for testing and evaluation with the purpose of inclusion of our technology into their next generation of products.
We believe that in the long-term, this strategy will produce marketing relationships with strong operating cash flows and expanding market share across multiple market sectors.
We are focused on applying our rapidly evolving biotech delivery technology to key global market sectors both directly and with marketing partners. Our marketing strategy seeks to use regionally defined marketing alliances thereby increasing the potential sales for each targeted market sector.
Critical Success Factors
To understand what it will take to make us successful and accelerate us to a world-class leadership position in the biotechnology and pharmacology industrial sectors, we have examined our proposal from three perspectives:
| 1. | Determine if our science and consumer acceptance intersect to the extent that growing demand will provide strong dynamics to fuel rapid Company sales and product expansion. | |
| 2. | Determine where in the product life cycle our products and technology reside vis-à-vis current and future competition. | |
| 3. | Determine whether funding will provide management the necessary components to propel our success in the global market. |
Our success is dictated by the benefits provided to the consumer in the form of advanced and properly targeted formulation designs and the sale and profitability accrued to those in our distribution chain. Our management is focused on providing all those product benefits necessary to satiate consumers’ needs as well as financial incentives for distributors.
Critical Success Factors: Creating Demand
There are important factors that dictate and drive the demand for our products and technologies. These factors, which are vital to our business plan, can be summarized as follows:
| ● | growth of global consumer demand for competitively priced goods; | |
| ● | developing economies’ needs for scientifically advanced products; | |
| ● | growing economic strength throughout the global marketplace; | |
| ● | growth of regional trade agreements; | |
| ● | worldwide healthcare threats and concerns; | |
| ● | global need for enhancements to preventive healthcare products; | |
| ● | consumer focus on personal care and youthful appearance; | |
| ● | increased consumer awareness of advanced and innovative technologies; and | |
| ● | regulatory compliance. |
| 32 |
Critical Success Factors: Product Life Cycle
The product life cycle is divided into four segments: introduction, growth, maturity, and decline.
| 1. | Introduction: Relatively slow growth and limited profits. | |
| 2. | Growth: Rapid expansion of sales and consumer acceptance with resulting high profitability. | |
| 3. | Maturity: No major sales growth with high profits but slowing profits. | |
| 4. | Decline: Eroding markets and declining sales volume with loss of profit margins. |
The ongoing expansion of our targeted market sectors are being fueled by worldwide economic growth, consumer demands, and complex health threats. As economies expand, consumers have the ability to focus on their own personal care needs and health. Pricing, distribution, technology, and efficacy assist in this market expansion that is being experienced. Knowledge of new technologies by both distributors and consumers drives new product sales thereby replacing older products based on outdated technology.
As such, we consider our products to have biotechnology that is in the very early stages of the product growth cycle. We hope to achieve prominence in markets needing enhancements to products that our IP brings by introducing a new generation of products of Quantasphere Technology™ based derivative products. (See “Product Pipeline.”)
Critical Success Factors: Components to Success
If we achieve high levels of satisfaction from our consumers and distributors with our formulations and products, we believe it will create an influx of new customers. This customer base, in turn, will fuel the expansion of distribution channels. We believe that the repeat consumer purchase cycle in combination with cost efficient distribution alliances are capable of creating overall profits combined with the valuable intrinsic satisfaction of the consumer base.
The following major factors will determine whether we will be successful:
| ● | ability to develop effective distribution partnerships to present and market products to consumers in vast regional markets; | |
| ● | having the ability to continually satisfy and perpetuate a loyal consumer base; | |
| ● | continued growth of product sales to global markets and the expansion of the new product pipeline for new market sectors; | |
| ● | preemptive entry of advanced product technologies into the marketplace before competitors are able to scientifically compete; | |
| ● | having a focused and defined marketing plan, specifically designed for each targeted market, and having a capable marketing staff that is knowledgeable and capable to execute the plans; | |
| ● | concentrating and developing the expertise of the Company while keeping the team directed and focused; | |
| ● | rapidly developing new technologies and formulations with the related intellectual property, through efficiencies achieved by a focused staff and limited regulatory delays; and | |
| ● | adaptive use of new marketing technologies and mediums. |
| 33 |
Growth Strategy
Our growth strategy is to increase revenue and net income by expanding the worldwide demand for our products, formulations, and technology. The avenues to achieve success rest on the fundamentals of our patents and wide applications of our intellectual property. Further, as described in “Strategies for Advancing Market Penetration,” developing these various sales and funding channels is key to establishing a firm market presence with corresponding revenue growth.
Enhancement of Product Performance
We are positioned in several market sectors that are both large and growing. For example, as reported in Business Wire on July 27, 2015, the cosmetic market in 2020 was forecasted to have global sales exceeding $675 billion. This is our largest targeted sector. Cosmetic products (skin care) inherently have numerous applications for our QS® formulations. Anti-aging and moisturization in combination with cosmetic elegance are key basic characteristics found in most cosmetic products. The actual active ingredients for these products do vary greatly. However, skin or revitalizing serums perform best when retained on the surface of the skin or time-released into the epidermis. We believe our formulations achieve these goals to the greatest extent available in today’s market. We believe that we are able to provide consumers and distribution partners product formulations that comprehensively achieve superior performance. For example, after testing by a major cosmetics partner, our moisturizing formulation provided a very high level of skin moisturization and the skin actually felt to the touch far superior when compared to competitive products. This result was because of the partial retention of the actives on the surface of the skin due to our formulation. Our technology has the wide versatility to be applicable to numerous skin care products, including those that may contain the active ingredient CBD.
Leverage the Technology to Provide Value-Added Ingredient Base
We believe that current cosmetics, pest repellents, fragrances, sun care, and soap products ingredients move a generational level higher in performance when the QS® delivery system is employed. This is our competitive strength, which we believe is well suited to be successfully directed into these market sectors. We believe that our goal of enhancing value will be realized by using a combination of sales from internally commercialized products, joint ventures, and licensing and distribution agreements.
Advanced Product Design
Our formulations provide innovative, targeted delivery for FDA designated over-the-counter (“OTC”) drugs and other highly effective skin products. Many medications exist that treat and/or ameliorate health symptoms. These competitive medications comparatively have short duration with potentially systemic toxicity.
Our QuantaSphere® delivery system for medications can be formulated to have superior characteristics, higher efficacy with fewer active ingredients, superior results with less toxic risk from medications, and greater cosmetic elegance. We are looking to advance our pipeline with the appropriate related testing protocols, and the targeted outcome of producing finished commercializing and distributing products into appropriate markets. (See “Our Business” – “Targeted Biotech Industry Sectors.”)
Current Products
Our current product portfolio is as follows:
| ● | SPF 50 Lotion – Water Resistant to 80 Minutes |
| 34 |
| ● | SPF 30 Wash On™ - Wet Skin Application (Three Variations) | |
| ● | SPF 50 Lip Balm - Reef Safe (Four Flavors) | |
| ● | SPF 30 Stick - Reef Safe | |
| ● | SPF 30 Aquea Wash On™ | |
| ● | Spray Sanitizer | |
| ● | Gel Pump Sanitizer | |
| ● | Bug Stick Repellent |
Product Pipeline
We have an extensive pipeline of new products that are being developed for the Klēnskin™ brand of sunscreens and bug repellents as well as for private branding. We also intend to add CBD ingredients to existing formulations with some modifications. These products will enter a highly competitive field. However, we intend that these products will be marketed as private label products to companies already distributing products containing CBD ingredients.
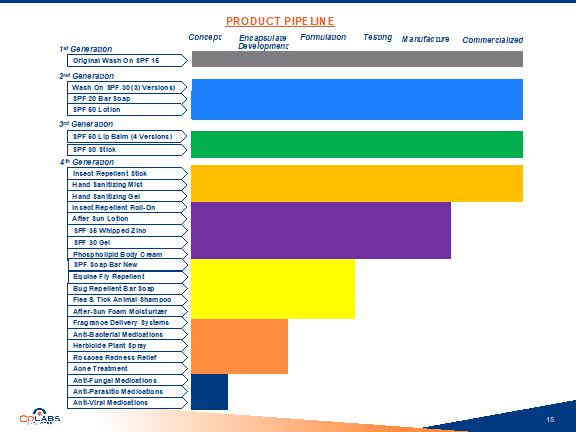
New Products in 2020 and expected to be launched in 2021:
| ● | Hand Gel Sanitizer – Commercialized | |
| ● | Hand Spray Sanitizer - Commercialized |
| 35 |
Bug Repellents:
| ● | Bug Repellent Stick Application Human Use – Commercialized | |
| ● | Bug Repellent Roll-on Application (In Testing) Human and Animal Use | |
| ● | Bug Repellent Soap - Formulation, Human and Animal Use | |
| ● | Bug Repellent Powder (In Testing) Human and Animal Use | |
| ● | Bed Bug Pesticide Powder (In Testing) Human Use |
Sunscreens:
| ● | Reef Safe Whipped Zinc Face Cream SPF 30 (In Production) | |
| ● | Reef Safe SPF 40 Body-Gel (In Testing) | |
| ● | Reef Safe SPF 30-40 Zinc Body-Gel (In Testing) |
Cosmetics:
| ● | After Sun Soothing Body-Gel (In Testing) | |
| ● | Phospholipid Complex Rejuvenating Cream (In Testing) |
CBD Formulations:
| ● | Select Existing Sunscreen Formulations (In Formulation) | |
| ● | After-Sun Soothing Body-Gel (In Formulation) |
2021 – 2023
Targeted Product Pipeline for Commercialization:
| ● | Anti-Acne Treatment Product Line (In Formulation) | |
| ● | SPF Hair Detangler Spray (In Development) | |
| ● | Bar Soap SPF 20 (In Development) | |
| ● | Skin Pre-Cancer Treatment Cream (In Development) | |
| ● | Skin Lightener Cream (In Development) | |
| ● | Anti-Scabietic Cream (In Development) | |
| ● | Peticulicide Cream (In Development) | |
| ● | Timed Release Rosacea Treatment Gel (In Development) |
Pesticides:
| ● | Larvicide Water Application (In Development) | |
| ● | Anti-Algaecide Water Application (In Development) | |
| ● | Agricultural Pesticides (In Development) |
Product Development
We currently meet all of our R&D needs internally with our existing staff. All critical scientific and product development, formulations, and design specifications are done in-house. Product development that provides needed and market accepted formulations is fundamental and inexplicably linked to positive consumer acceptance, brand recognition, and sales growth. We believe we are developing products that meet those criteria.
| 36 |
Unlike many other biotech companies, the time it takes for us to develop, formulate, test, and commercialize a product, is completed in a comparatively short span of time at a substantially lower cost. We have avoided debt and dilution by concentrating our focus on already approved OTC products, which have large markets, and require few regulatory filings. Our products are technically generationally advanced formulations. Independent testing confirms better efficacy and cosmetically elegant characteristics for our products.
Raw material components and advanced ingredients, regulatory advice, intellectual property (“IP”) registration, and legal support are obtained from outside sources.
Our management is engaged in all functions critical to our operations. Our skilled management team provides a focused, high quality product, with cost controls, improved manufacturing capacity utilization, defined operational control, and tight product ingredient specifications which are confirmed by outside testing of both efficacy and product safety. This testing is done by independent FDA and EPA testing laboratories which follow approved guidelines for each targeted test.
Our internal R&D and Product Development groups and external partners are experienced and highly respected in the industry. Further, their unique focused knowledge in our realm of technology is a significant asset and a competitive advantage for us.
We have developed IP protected biotechnology designed for multiple new applications. This IP is technology driven, tested, proven, formidable, and commercialized. We currently hold 26 issued patents and have an additional eight patents pending.
Our internal management and scientific team is augmented by partnerships which externally provide both material and development support. We are able to directly advance our research and manufacturing skills, which are then augmented by our partners’ scientific and production teams.
New formulations are repeatedly tested by independent FDA approved labs. Testing is done during the development, pre-production, and manufacturing stages to assure quality and efficacy. By maximizing our leverage with suppliers and manufacturing partnerships, we have held personnel costs to a very efficient level while rapidly advancing our technological growth.
Our topical delivery system, IP, and internal efficiencies allow our focus to remain directed at the development of formulations for vast commercial applications.
FDA: Maximum Usage Trials (MUst) for Topical Active Ingredients
Issue Background and a CoLabs Proposed Testing Protocol Standard for the FDA
We believe that the absorption and systemic effects of active ingredients for many topically applied OTC products is a major focus of concern. Currently, topically applied active ingredients can be absorbed readily into the body. QS® Technology formulations can be designed to be minimally absorbed over-time or have virtually no absorption through the stratum corneum. It is important to first identify the degree of surface absorption by focusing on the absorption characteristics of a particular active and/or its excipients within its delivery system. As with any test, a time stamped testing protocol must be followed to determine the rate at which the product enters the skin and what depth of penetration occurs.
We have sought to create the safest and most user-friendly sunscreen possible by encapsulating the active ingredients and placing an electrostatic charge on the surface of the encapsulate. The cationic electrostatic charge creates an attraction to the anionic stratum corneum. This charged micro-encapsulated formulation is designed to create an attraction to the surface of the skin and inhibit absorption.
| 37 |
With this in mind, non-absorption was one of our key concerns for three main reasons:
| 1. | Systemic absorption and accumulation of sunscreen chemicals in the body may have unwanted effects; | |
| 2. | Scientific concerns that absorbed chemical sunscreens produce a photoreaction within the skin which releases free radicals and could be damaging to living (DNA containing) epidermal cells; and | |
| 3. | Absorption of sunscreen chemicals is potentially systemically toxic. |
Our encapsulates are specifically manufactured to be approximately the size of a skin cell. We were confident that absorption through the epidermis is greatly inhibited by this specification. Additionally, we place an electrostatic charge on the surface of the encaps which causes the sunscreen encapsulate to attach to the stratum corneum. This unique design combination limits infiltration into the skin and possible systemic absorption. We sought to prove this deduction using the Confocal Stain Test (“CST”).
We proposed to the FDA that the CST be used as a methodology for a MUsT protocol for the following reasons:
| ● | If a product is intended to stay on the surface of the skin, it is an easy testing protocol that could eliminate the need for blood or urine tests to detect unwanted chemicals introduced to the body via topical application; and | |
| ● | There are concerns regarding the accuracy of blood or urine tests because of the possibility that unwanted chemicals may be stored in the body, such as in adipose tissue or the liver. |
Marketing Direction
We have developed a systematic long-term strategy to expand our technology, target product markets, and broaden our in-house capabilities.
We, in combination with our marketing partners, have the opportunity to become a significant force extending into a vast worldwide market that exceeds $600 billion. These expanding group of partnerships include pharmacy purchasing groups, retail stores, outdoor sports stores, medical practice marketers, and national and international sports organizations. We anticipate that these key market sectors, which include cosmetic, pest repellents, fragrances, sunscreens, and topical pharmacology markets to grow significantly over the coming years. More specifically, we have substantial scientific knowledge, expertise, and years of experience in these markets and applications.
We currently own significant issued and filed intellectual property addressing the next generation of product innovations that are directed at both consumers and the major industry suppliers for these global market sectors. The technology we have developed is both novel and scientifically advanced. Once adapted into products, our formulations arguably set an improved standard. Technologically and functionally, this superior product is easily differentiated by testing, efficacy, and consumer acceptance.
Strategies for Advancing Market Penetration
Direct Retail Distribution – We plan to expand our direct retail wholesale personnel in order to target distributers and retailers with our product lines. By servicing B2B accounts with internal and detail personnel, we can expand relationships and provide better hands-on support to retail outlets thereby encouraging their retail sales.
| 38 |
Distribution Partnerships – We will provide either Klēnskin™ branded products, base formulations, exclusive product formulations, or private label existing formulations to partners in order for them to market to their existing clientele. One key example is that we are in discussions with CBD companies that are interested in marketing private labeled products to their distribution chain. We anticipate adding a significant volume of sales with these relationships, should they materialize.
Direct Consumer Marketing – We have been approached and have had discussions with television direct marketing groups. These discussions involved both informative commercials as well as shopping channel marketing. Typically, a celebrity or professional spokesperson is chosen to represent a company and its product lines. The cost of production, inventory, and the talent purchase are considerations weighed against the potential large volume of sales and rapid branding that occurs. We are currently considering expanding into this marketing channel.
Government Sales – Klēnskin™ products offer a generational advance in sanitizers, sunscreens, and bug repellents. These products have great potential to protect those government employees whose jobs require them performing their duties in contaminated environments and outdoors with exposure to the sun’s radiation. We intend for these products to be initially directed to military services and related job areas where these products may excel. We are in discussions with a proven government supplier who is assisting us in meeting the requirements to provide our products to agencies requesting bids for products whose specifications match Klēnskin™ products.
Global Sales – We have greatly expanded our presence in the Asian markets. We believe that targeting products designed for the tastes in this region will propel current relationships and can expand into other distribution companies. Increased marketing presence with experienced personnel, advertising, and new region-specific product offerings are key drivers to sales. We believe that the initial international market acceptance of our products has been exceptional. This is a targeted marketing area that is slated for expansion.
Internet Sales – One of our main goals is to expand sales to targeted consumers and affiliations with key online marketing sites. The priority of our internet sales and marketing staff will be to seek greater social media exposure linked to the activation of target marketing campaigns. The engagement of an internet based marketing component will directly drive sales for company ecommerce, bloggers, social media exposure, lead generation, targeted promotions, and select marketing sites like Amazon. This will be an important key element for new product launches.
Event Participation – As previously noted, our products are designed for active lifestyles. Branding thus far has associated Klēnskin™ with AVP Professional Beach Volleyball and NASCAR as well as prominent cancer fighting organizations and youth and college sports groups. One of our management principles is to support and be a part of the community to improve our health, environment, and quality of life. Our products are designed with safety as well as these societal benefits inherent in all of our formulations. We have successfully offset some of the marketing costs with sales at the event site. We have found that these fan sales are important since these purchasers have become repeat buyers. In sharing their satisfaction with our products, they become Klēnskin™ sales ambassadors to their social network.
| 39 |
SPIR/STTP Grants and SBA Programs – We expect to submit grant applications to various U.S. government agencies. These funding opportunities are designed for small businesses to provide assistance with needed product development and research prior to the products commercialization stage. SPIR/STTP Grants are not repayable and are offered in two phases. Phase 1 offers up to $225,000 in grants. Approximately 30 to 40% of applicants receive funding. Phase 2 provides up to an additional $1.5 million for product development. The SBIR/STTR programs are administered by the Small Business Administration (SBA) and processes through various government agencies. Additional SBA loan programs are being implemented to provide assistance during times of economic stress. We are hopeful that successful loan and grant applications for available SBA programs will assist with the development of several advanced products in the pipeline and provide funding for corporate operations and payroll, thereby helping assure our ongoing viability.
Sales and Marketing Staff – We believe that it essential for our success to retain a qualified marketing team to advance sales. The development of partnerships, the expansion of internet presence, and the development of new domestic and global distribution channels, along with sufficient financial resources, are necessary for an effective campaign. Brand Ambassadors, supporting television and radio advertising linked to event sponsorship will be strategically activated to promote our participation and branding. We recognize that a well engaged and effective staff is vital because of their commitment to garnering sales and their experience to promote their existing relations for the benefit of our product lines.
Targeted Biotech Industry Sectors
Overview of the Global Cosmeceuticals Market
The current global market is huge and estimated to be over $675 billion in 2020 as reported in Business Newswire (July 27, 2015). Innovations in technologies like nanotechnology, plant stem cell technology, and the emergence of new active ingredients are significantly aiding in the growth of the global cosmeceuticals market. Greater health and wellness trends are gaining traction across the globe. New ingredients for the manufacture of topical skincare products are currently a focus of this sector. Advertising is highlighting specific pharmaceutical ingredients and clinically proven facts for the products, which is driving the market’s growth.
We have focused from the onset on dispensing dermatologists to distribute and evaluate our products. This approach has been valuable producing recognitions for its unique and patented technologies.
We believe that consumers are focused on cosmeceutical products primarily in the premium category. This can be attributed to growing consumer awareness of the advertised quality and safety of these premium products. The U.S. is the key revenue generator in the Americas, owing to the high sales of anti-aging, facial serums, face oils, and skin lightening products. We believe that growing consumer demand for natural and organic cosmetics and rapid development in the organized retail sector will have a positive impact on the cosmeceuticals market in the U.S. in the coming years. We anticipate that globally, there will be similar product demand and sales growth.
Overview of the Global Fragrance Market
The global fragrances and flavors markets are large and as reported, in a study by Fortune Business Insights in their report on October 23, 2019, had an estimated $26.5 billion in sales in 2018 and was expected to grow to $38.6 billion in 2026. The rise in demand from emerging markets, such as Asia-Pacific, Latin America, and Eastern Europe, and increased online sales of fragrances and perfumes are predicted to bolster the prospects for growth in this market during the forecast period.
Fortune Business Insights in the same issue also estimated that eminent factors, such as the recent rise in e-retail of fragrances and perfumes, will drive market growth during the forecast period. Recently, it has been observed that individuals prefer to shop online as it helps to save time and is more convenient and not just during the COVID-19 pandemic. This trend of online shopping is envisaged to bolster market growth as it helps vendors to augment sales and spread brand awareness. The segmentation of market is by product and analysis of the fragrances and perfumes market based on two pricing levels: premium and mass.
| 40 |
The premium segment currently dominates the global fragrances and perfumes market and is anticipated to maintain its dominance over the market. The rising disposable income of the populace and a rise in the availability of all brands through online channels are examples of some growth-promoting factors in this segment.
Based on current market research, analysts estimate that North American will dominate the global market for perfumes and fragrances through the decade. Sales of premium brands and the launch of new products in this region are some of the significant factors that spur market growth.
The global fragrance and perfume market is highly competitive and consists of multiple raw material and retail manufacturers and most retail channels. We recognize that social media and e-retail channels are also expanding and are expected to vastly contribute to sales growth in this market at an accelerating rate.
Overview of the Global (Mosquito) Bug Repellent Market
Mosquitoes cause more human suffering than any other organism. According to the WHO, insect vector-borne diseases like malaria threaten half of the world’s population, with over 212 million cases reported annually in the world. With this existing major health threat, the global mosquito/insect repellent market is currently estimated to reach $5.8 billion in 2025, according to a Market Watch report published on December 24, 2020 in AmericaNewsHour.
The public has keen awareness of mosquito-borne diseases due to news reports. In addition, government outreach programs are also launching warning campaigns and to actively educating populations about vector-borne diseases. Innovative repellents are sought for development by both the public and vendors, which are not only safe to use but also provide long-lasting relief from insects like mosquitoes. One of the latest developments in this market is the growing demand for organic/natural repellents because of the perceived toxicity of the chemicals used and the foul smelling household insecticides. Mosquito repellents that are specifically natural and safe for children and also stronger tactical/outdoorsmen type formulations with limited absorption are our marketing and consumer focus.
The rising global health threats of mosquito/insect vector borne diseases like Zika, Black Plague, West Nile Fever, and Monkey Pox, combined with the growing consumer awareness about the importance of preventive measures, are key drivers propelling the growth of this market. There were over one million deaths by parasites in 2013 according to Global Burden of Disease Study in 2013.
Globally, regions which have tropical and sub-tropical climate regions which are favorable for the survival and breeding of insects like mosquitoes, are increasing their demand for insecticide products and mosquito repellents. We consider our repellent soaps, sprays, lotions, and solid bars after preliminary testing, to be the most highly effective repellents available. We are working with one of the global leaders in this area to advance their products sales using our technology. In the U.S., the EPA and states regulate pest repellents. As such, the cost of entry into this market is high and time consuming. We plan to enter the U.S. market with our line of exempt natural repellents and later with chemical repellent formulations.
Currently, internet retail sites, convenience stores, hyperstores, and supermarkets are typical outlets for mosquito repellents. In many regions, repellents are basic requirements and consumers prefer to shop for these locally from retail outlets that offer a wide choice of products. Repellents are offered in the form of coils, sprays, vaporizers, aerosols, sticks, patches, and lotions.
| 41 |
Overview of the Global Sun Care Market
According to a report in the Globe Newswire (March 11, 2020), sun care products are estimated to grow to a level of $12.6 billion globally by 2026. Exposure to harmful UV radiations can cause excessive tanning, premature aging of the skin, and can also lead to skin cancer. Consumer knowledge that solar radiation directly causes skin cancer has made it become much more imperative to use sun care products to protect skin from damage. Manufacturers have addressed this rising concern with products like sprays, wipes, lotions, moisturizers, gels, and sun balms. These are all available in the market with varied SPF levels to suit consumer’s individual requirements.
We design multifunctional sun care products. Sunscreen actives formulated into moisturizers, serums, and foundation for makeup, anti-aging lotions, wipes, and solid stick bars appear to be increasingly in popularity because of the convenience associated with that use. We see consumer demand for such multifunctional products. We believe that an increased demand for multifunctional products like the advanced Klēnskin™ products will positively influence the market as vendors launch new sun care products with added skin care benefits.
The sun care products market can be segmented into three basic groups: sun protection products, after-sun products, and self-tanning products.
SPF products dominate the sun care market and account for the majority of the market share. This market segment has matured in developed countries such as the U.S., Japan, the U.K., and Germany. Increasing awareness and concerns among consumers about the harmful effects of UV radiation and the benefits of using sun protection products may continue to propel the growth prospects for this market.
The U.S. has led the retail sun care products market. Early adoption of sun protection and after-sun products has made the region a mature market for sun care products. Moreover, a growing aging population combined with an informed younger active population, has fueled the demand for multifunctional and anti-aging sun care products. These informed consumers in turn will continue to drive this market’s growth.
Large global brands dominate the global sun care products market. However, the growing presence of many small- and mid-size vendors like us with commercialized SPF products has created a highly competitive marketplace and will positively impact the market revenue shares in the next few years. Vendors compete on the basis of product differentiation, product portfolio, quality, and pricing to gain maximum market share. With the rising demand for improved, innovative, and high-quality products, the market is expected to witness an influx of new and quality product launches, which will drive the market in the near future.
Overview of the Global Personal Care Market
As reported in Globe Newswire (January 24, 2020), research by Fior Markets suggests that the personal care market was $493 billion in 2018 and forecasted to be $475.7 billion in 2026 globally. Fior Markets’ research predicts that this market will grow steadily. There appears to be a growing preference for multifunctional products as one of the primary growth factors for this market. Consumers prefer multifunctional products as they provide streamlined and time saving solutions for their perceived personal care needs. Vendors are thus focusing on developing integrated products that target various issues and offer multiple benefits. The demand for sunscreen products that can be used in makeup is steadily increasing to provide protection and enhance the natural look. Multifunctional products contain active ingredients that can perform multiple functions encourages consumers to adopt such products as they reduce time and give better results.
| 42 |
Additionally, the demand for conditioning agents and their usage in skincare personal care products is steadily increasing. The increasing awareness about the benefits of conditioning agents is encouraging vendors to develop new agents for skin care conditioning applications. The rising trend of professional hair shampoos, professional hair styling services, and hair styling products will contribute to the demand for conditioning agents. We anticipate that conditioning agents will be one of the key trends behind the growth of this market. Conditioning agents that have properties such as cationic, amphiphilic, and contain emollients, humectants, and occlusive agents that allow the retention of water and prevent the deterioration of skin collagen and water loss (anti-aging). These agents will contribute to their increased adoption in shampoos and conditioners.
The personal care market is highly competitive due to the large number of vendors, product differentiation created by marketing, differences in product portfolios, various technology used in formulations, manufacturing capacity for different markets, and pricing. Key vendors are merging to consolidate their market share. New entrants in the personal care active ingredients market have the need for innovative strategies and products in order to compete. The Asian market will witness a growing demand for personal care products for both men and women due to increasing disposable incomes. Additionally, rising urbanization and the growing population will also contribute to the growth of the personal care active ingredients market.
The focus on health due to the COVID-19 pandemic is causing a tremendous demand for soaps, sanitizers, and other antibacterial products. We have been developing products to meet this growing demand. The supply channel for items like alcohol and other key antibacterial agents is very limited but with demand growing, it is expected that the backlog of orders will be addressed with an increase in suppliers and production. Our IP is adaptable for products that will satiate this medical and consumer need.
| 43 |
We currently do not own any real property. We lease office space and warehouse and product development spaces at:
18593 Main St.
Huntington Beach, CA 92648
7222 South Tamiami Trail
Sarasota, FL 34231
7251 W. Lake Mead Blvd., Ste 300
Las Vegas, NV 89128
On June 16, 2017, we entered into that certain First Amendment to Lease agreement with Sarm Five Points Plaza, LLC for our Huntington Beach office for a term of five years beginning on November 1, 2016 and expiring on October 31, 2021, subject to an option to extend for an additional five years. Our monthly rent started at $1,840 which increases incrementally every year until 2021, when our monthly rent is $2,152.
On December 1, 2017, we entered into a Commercial Lease with Branson Corp. for our Florida office for a one year term beginning on December 1, 2017, with an option to extend for subsequent one year periods. The monthly rent is in the amount of $650.
We lease, on a month-to-month basis, a virtual office in Nevada in compliance with being incorporated in Nevada. The monthly rent amount is nominal.
| 44 |
MANAGEMENT’S DISCUSSION AND ANALYSIS OF FINANCIAL CONDITION AND RESULTS OF OPERATIONS
You should read the following discussion and analysis of our financial condition and results of our operations together with the financial statements and notes thereto appearing elsewhere in this Offering Circular. This discussion contains forward-looking statements reflecting our current expectations, whose actual outcomes involve risks and uncertainties. Actual results and the timing of events may differ materially from those stated in or implied by these forward-looking statements due to a number of factors, including those discussed in the sections entitled “Risk Factors,” “Cautionary Statement Regarding Forward-Looking Statements,” and elsewhere in this Offering Circular. Please see the notes to our financial statements for information about our significant accounting policies, critical estimates, judgements and financial management and risk management.
Operating Results
Results of Operations for the Year Ended December 31, 2019 Compared to the Year Ended December 31, 2018 (audited)
Our revenue, operating expenses, and net loss from operations for the year ended December 31, 2019 as compared to the year ended December 31, 2018, were as follows:
| For the year ended | Percentage | |||||||||||||||
| December 31, | Change | |||||||||||||||
2019 (audited) | 2018 (audited) | Change | Inc. (Dec.) | |||||||||||||
| Revenue | $ | 176,000 | $ | 163,000 | $ | 13,000 | 8 | % | ||||||||
| Cost of revenue | 89,000 | 119,000 | (30,000 | ) | (25 | )% | ||||||||||
| Gross profit | 87,000 | 44,000 | 43,000 | 98 | % | |||||||||||
| Operating expenses | ||||||||||||||||
| Selling, general and administrative expenses | 721,000 | 597,000 | 124,000 | 21 | % | |||||||||||
| Research and development | 153,000 | 88,000 | 65,000 | 74 | % | |||||||||||
| Stock-based compensation | - | 1,173,000 | (1,173,000 | ) | (100 | )% | ||||||||||
| Total operating expenses | 874,000 | 1,858,000 | (984,000 | ) | (53 | )% | ||||||||||
| Loss from operations | (787,000 | ) | (1,814,000 | ) | (1,027,000 | ) | (57 | )% | ||||||||
| Interest | (3,000 | ) | - | (3,000 | ) | 100 | % | |||||||||
| Net loss | $ | (790,000 | ) | $ | (1,814,000 | ) | $ | (1,024,000 | ) | (56 | )% | |||||
Revenue
Sales increased by $13,000 (8%) to $176,000 for the year ended December 31, 2019, compared to $163,000 for the year ended December 31, 2018. The increase in revenue is attributed to increased brand awareness of our products generated through sponsoring events such as AVP Beach Volleyball, NASCAR, and golf tournaments.
| 45 |
Cost of Revenue
Cost of revenue decreased by $30,000 (25%) to $89,000 for the year ended December 31, 2019, compared to $119,000 for the year ended December 31, 2018. The decrease in cost of revenue was primarily attributable to the product mix sold and decreased sales discounts and promotions. Gross margin as a percentage of sales increased to 49% for the year ended December 31, 2019, compared to 27% for the year ended December 31, 2018.
Operating Expenses
Operating expenses include selling, general and administrative expenses, product development costs, and non-cash stock-based compensation expense.
Selling, general and administrative expenses increased $124,000 to $721,000 during the year ended December 31, 2019, compared to $597,000 during the year ended December 31, 2018. The increase in selling, and general and administrative expenses was due to increased marketing related expenses and increased professional fees, as compare to the prior year period.
R&D costs increased approximately $65,000 to $153,000 during the year ended December 31, 2019, compared to $88,000 during the year ended December 31, 2018. The increase in product development costs was due primarily to cost associated with the development of new products being developed for consumers in fiscal year 2020 and beyond.
Non-cash stock-based compensation expense was $1,173,000 during the year ended December 31, 2018 and was related to stock options issued to officers and directors. During the year ended December 31, 2019, we did not issue any stock options.
Loss from Operations
Loss from operations decreased to approximately $787,000 during the year ended December 31, 2019, compared to $1,814,000 during the year ended December 31, 2018. The decrease in operating loss was due primarily to the decrease in non-cash stock-based compensation expense discussed above, increased sales and gross profit, offset by increased selling, general and administrative expenses, and increased research and development costs.
Other Expense
Other expenses include interest. Interest increased to $3,000 during the year ended December 31, 2019, compared to no interest expenses during the year ended December 31, 2018. The increase in interest was primarily attributable to the increased loan activity during the year ended December 31, 2019 as compared to the prior year period.
Net Loss
Net loss decreased $1,024,000 to $790,000 during the year ended December 31, 2019, compared to a net loss of $1,814,000 for the year ended December 31, 2018. The decrease in net loss was due to the decrease in non-cash stock-based compensation expense discussed above, increased gross profit, and offset by increased selling, general and administrative expenses, and increased research and development costs.
| 46 |
Results of Operations for the Nine Months Ended September 30, 2020 Compared to the Nine Months Ended September 30, 2019 (unaudited)
Our revenue, operating expenses, and net loss from operations for the nine months ended September 30, 2020 as compared to the nine months ended September 30, 2019 were as follows:
| For the nine months ended | Percentage | |||||||||||||||
| September 30, | Change | |||||||||||||||
2020 (unaudited) | 2019 (unaudited) | Change | Inc. (Dec.) | |||||||||||||
| Revenue | $ | 107,000 | $ | 163,000 | $ | (56,000 | ) | (34 | )% | |||||||
| Cost of revenue | 35,000 | 57,000 | (22,000 | ) | (39 | )% | ||||||||||
| Gross profit | 72,000 | 106,000 | (34,000 | ) | (32 | )% | ||||||||||
| Operating expenses | ||||||||||||||||
| Selling, general and administrative expenses | 478,000 | 482,000 | (4,000 | ) | (1 | )% | ||||||||||
| Research and development costs | 151,000 | 171,000 | (20,000 | ) | (12 | )% | ||||||||||
| Total operating expenses | 629,000 | 653,000 | (24,000 | ) | (4 | )% | ||||||||||
| Loss from operations | (557,000 | ) | (547,000 | ) | (10,000 | ) | (2 | )% | ||||||||
| Interest | (1,000 | ) | (2,000 | ) | 1,000 | 50 | % | |||||||||
| Net loss | $ | (558,000 | ) | $ | (549,000 | ) | $ | (9,000 | ) | (2 | )% | |||||
Revenue
Sales decreased by $56,000 (34%) to $107,000 for the nine months ended September 30, 2020, compared to $163,000 for the nine months ended September 30, 2019. The decrease in revenue is attributed to the negative impacts on domestic and international orders due to COVID-19.
Cost of Revenue
Cost of goods sold decreased by $22,000 (39%) to $35,000 for the nine months ended September 30, 2020, compared to $57,000 for the nine months ended September 30, 2019. The decrease in costs of goods sold was primarily attributable to our decrease in sales, as discussed above. Gross margin as a percentage of sales was 67% for the nine months ended September 30, 2020, compared to 65% for the nine months ended September 30, 2019.
Operating Expenses
Operating expenses include selling, general and administrative expenses, and research and development costs.
Selling, general and administrative expenses decreased approximately $4,000 to $478,000 during the nine months ended September 30, 2020, compared to $482,000 during the nine months ended September 30, 2019. The decrease in selling, and general and administrative expenses was due primarily to decreased professional fees, as compared to the prior year period.
Product development costs decreased approximately $20,000 to $151,000 during the nine months ended September 30, 2020, compared to $171,000 during the nine months ended September 30, 2019. The decrease in product development costs was primarily attributable to the temporary postponement of development activities while we were ascertaining the impact of the COVID-19 pandemic which impacted sales as discussed above.
| 47 |
Loss from Operations
Loss from operations increased to approximately $557,000 during the nine months ended September 30, 2020, compared to $547,000 during the nine months ended September 30, 2019. The increase in operating loss was due primarily to the decrease in gross profit, offset by the decrease in operating expenses discussed above.
Other Expense
Other expenses include interest. Interest decreased $1,000 during the nine months ended September 30, 2020, compared to $2,000 during the nine months ended September 30, 2019.
Net Loss
Net loss increased $9,000 to $558,000 during the nine months ended September 30, 2020, compared to $549,000 for the nine months ended September 30, 2019. The increase in net loss was due to the decrease in gross profit offset by decreased operating expense discussed above.
Liquidity and Capital Resources
Our working capital as of September 30, 2020 and December 31, 2019 was as follows:
| As of | As of | |||||||
| September 30, 2020 | December 31, 2019 | |||||||
| (unaudited) | (audited) | |||||||
| Current Assets | $ | 121,000 | $ | 350,000 | ||||
| Current Liabilities | 57,000 | 122,000 | ||||||
| Net Working Capital | $ | 64,000 | $ | 228,000 | ||||
The following summarizes our cash flow activity for the nine months ended September 30, 2020, and the fiscal year ended December 31, 2019:
| Cash Flows | ||||||||
| Nine months | Year | |||||||
| Ended | Ended | |||||||
| September 30, 2020 | December 31, 2019 | |||||||
| (unaudited) | (audited) | |||||||
| Net cash used in Operating Activities | $ | (654,000 | ) | $ | (745,000 | ) | ||
| Net cash provided by Financing Activities | 368,000 | 1,083,000 | ||||||
| Decrease in Cash during the period | (286,000 | ) | 338,000 | |||||
| Cash, Beginning of Period | 347,000 | 9,000 | ||||||
| Cash, End of Period | $ | 61,000 | $ | 347,000 | ||||
| 48 |
Since inception, our principal sources of liquidity have been cash provided by financing, including through the private placement of equity securities, loans, and gross profit from the sales of our products. Our principal uses of cash have been primarily for labor and outside services, expansion of our operations, development of new products and improvement of existing products, expansion of marketing efforts to promote our products and brand, and capital expenditures. We anticipate that additional expenditures will be necessary to develop and expand our assets before sufficient and consistent positive operating cash flows will be achieved, including sufficient cash flows to service existing liabilities and related interest. Additional funds may be needed in order to continue production and operations, achieve profitability, and achieve our objectives. As such, our cash resources may not be sufficient to meet our current operating expense and production requirements and planned business objectives without receipt of the proceeds of this offering or additional financing.
As further presented in our financial statements and related notes included herewith, during the nine months ended September 30, 2020 we incurred a net loss of $558,000, and at September 30, 2020, had a stockholders’ deficit of $9,000. In addition, during the fiscal year ended December 31, 2019, we incurred a net loss of $790,000, and used cash in operations of $745,000. These factors raise substantial doubt about our ability to continue as a going concern, as noted by our independent registered public accounting firm in its report on our December 31, 2019 financial statements.
Our ability to continue as a going concern is dependent upon our ability to raise additional capital and to maintain revenues and generate profit from operations. Subsequent to September 30, 2020, we received aggregate proceeds of $750,000 from the sale of 250,000 Shares at $3.00 per share. During the nine months ended September 30, 2020, we raised $293,000 through proceeds received from a private placement transaction, and $103,000 from the issuance of note payable. During the fiscal year ended December 31, 2019, we raised $1,041,000 through proceeds received from private placement transactions, and $50,000 from the issuance of a note payable. At September 30, 2020, we had cash on hand of approximately $61,000. We may not be able to generate sufficient funds from our future operations to meet our cash flow requirements. We may need additional funds to meet our cash flow requirements to operate our business through June 30, 2021.
At September 30, 2020, we had working capital of approximately $64,000 compared to working capital of $228,000 at December 31, 2019. The decrease in working capital was primarily related to our net loss during the period. At December 31, 2019, we had a working capital of approximately $228,000 compared to a working capital deficit of $4,000 at December 31, 2018. The increase in working capital was primarily related to the proceeds received from the sale of common stock offset by our net loss during the year ended December 31, 2019.
Net cash used in operating activities for the nine months ended September 30, 2020 totaled $654,000, compared to net cash used in operating activities for the nine months ended September 30, 2019 of $561,000. The increase in net cash used in operations for the nine months ended September 30, 2020 was primarily due to the purchase of $60,000 of inventory, which did not occur during the same prior of the prior year, with the remaining working capital change of $33,000 reflecting routine changes in our working capital accounts. Net cash used in operating activities for the fiscal year ended December 31, 2019 totaled $745,000. This compares to net cash used in operating activities of $637,000 for the year ended December 31, 2018.
| 49 |
Net cash provided by financing activities for the nine months ended September 30, 2020 was $368,000 and included proceeds of $293,000 received in the private placement of common stock, proceeds received of $3,000 on the exercise of stock options, and proceeds received of $103,000 from the issuance of notes payable. These proceeds were offset by the repayment of $31,000 of notes payable. Net cash provided by financing activities for the nine months ended September 30, 2019 was $552,000, which included $542,000 of proceeds from private placement of common stock, and $20,000 in proceeds from a line of credit, offset by repayment of $10,000 on the line of credit. Net cash provided by financing activities for the year ended December 31, 2019 was $1,083,000 and included $1,041,000 of proceeds from the private placement of common stock, $50,000 from the issuance of a promissory note, and $27,000 in proceeds from a line of credit. These proceeds were offset by the payment of $8,000 on a promissory note and repayment of $27,000 on a line of credit.
Plan of Operations
Our mission is to apply our technology to current and future pharmaceutical products whose efficacy depends on their delivery to a defined area. These pharmaceutical products typically have a level of toxicity which is best addressed by limiting absorption into both adjacent areas and systemically into the bodies organ systems. To achieve our goals in terms of both R&D and sales, our staff will be expanded to propel both product development and the related testing and compliance matters, and marketing.
Our R&D is currently performed in our laboratory in Sarasota, Florida under the direction of Mr. Traynor, who develops formulations in conjunction with Dr. Cohen and Mrs. LeBlanc. We anticipate this scientific team to be augmented with an academic development team located in Texas. This academic team will be engaged to design encapsulates to our specifications which follow our current IP. Mr. Traynor will continue to lead this team.
Mrs. LeBlanc plans to continue to work with Mr. Traynor to develop products but will expand her staff to address logistical issues with the shipping and manufacturing of products. Together they will oversee what efficiencies can be gained using various cost control measures. This will include reviews of purchasing, shipping, and inventory control.
Mr. Thaler, our Manager of Investor Relations and Marketing, will continue to service investor relations and public relations for us. Further, he will be involved in the development of marketing programs and monitoring sales. It is expected that his position will be expanded to further allow his acquisition of talent to support his activities.
We currently engage Mr. Steve Handy as a consultant for certain accounting and financial oversight, and we anticipate he will assume a full time role as our Chief Financial Officer in the near future, where he will assist in the preparation of financial statements and ongoing regulatory reporting. Subject to receiving sufficient financing, we will have the opportunity to expand our accounting staff and further utilize external professionals in maintaining our books and records. Mr. Handy will also assist the management team and Board in determining the success of marketing, product sales, and overall execution of our growth plans.
Mr. Cohen, our Chief Development Officer, will continue to interact, as needed, with marketing and public relations firms to expand our overall footprint in the marketplace.
There are multiple risks that exist which may impact our busines as we have outlined in this Offering Circular. The current COVID-19 pandemic has impacted our sales and access to raw materials. We were very successful in restructuring our supply line as needed to compensate for access to our required raw materials. However, we were severely impacted by the loss of international sales due to foreign lockdowns. We believe that diversification of both products and distribution channels in the future is the key to limiting potential financial damages a severe economic decline pose. Additionally, having “in demand” products to address the health issues is another potential solution to this risk.
As stated elsewhere in the Offering Circular, many undefined risks exist including the inherent loss of key members of the management team. Ultimately, a competent management team should be capable of responding to threats to the welfare of the Company. We will continue to add management team members to enhance our ability to address risks with experienced leaders, subject to the receipt of financing.
| 50 |
Trend Information
There are a number of trends potentially affecting our business. Both the macroeconomic and microeconomic outlook are being considered by our management team. These seemingly are impacted by public policy and the private sector response to economic packages. The COVID-19 impact of our domestic and global economies is still being addressed differently by various regulatory agencies and governments as well as the private sector. Lockdowns and restrictions have affected increasing numbers of people filing for unemployment. A future of normalcy is not yet immediately foreseeable.
Focusing on the U.S. economy, in the near-term, programs which will assist the country in building its infrastructure are expected to be introduced as well as further stimulus packages. The national debt has increased and may continue to increase, perhaps a catalyst for some inflation. Correspondingly, taxes are expected to increase to try to offset this deficit spending. Without an improved economy, credit risk and low credit demand will restrict expansion. Adding to this headwind is a likely decline in GDP growth. Offsetting this Keynesian solution is the pandemic and its related costs and undefinable course.
Fortunately, we are in the pharmaceutical/healthcare sector which due to the pandemic and the aging of baby boomers may continue to trend as a key growth area. We are focused on the delivery of drugs in multiple key sectors, including cancer, vector borne diseases, disinfectants, sun protections, anti-aging, pest repellents and anti-scabetic and anti-pediculosis drugs. We believe that our sanguine position addresses these massive focal point health issues. It is incumbent on our management to be proactive, intuitive, and farsighted to adjust to the quickly shifting sands that these uncertain economic events are presenting.
| 51 |
DIRECTORS, EXECUTIVE OFFICERS, AND SIGNIFICANT EMPLOYEES
| Name | Position | Age | Term of Office | |||
| Executive Officers and Significant Employees: | ||||||
| Laura Cohen | President and Chief Executive Officer | 71 | 2008 – Present | |||
| Lisa LeBlanc | Chief Operations Officer | 39 | 2008 – Present | |||
| Daniel Traynor | Vice President of Product Development | 52 | 2017 – Present | |||
| Gerald Birch | Chief Financial Officer | 59 | 2011 - Present | |||
| Directors: | ||||||
| Laura Cohen, MD | Chairman of the Board, Director | 71 | 2008 – Present | |||
| Lisa LeBlanc | Director | 39 | 2008 – Present | |||
| Charles Fritts, Esq. | Independent Director | 69 | 2017 – Present | |||
| Dean Stathakis, Esq. | Independent Director | 59 | 2017 – Present | |||
| Peter Barton-Hutt, Esq. | Independent Director | 87 | 2017 – Present | |||
There is no arrangement or understanding between the persons described above and any other person pursuant to which the person was selected to his or her office or position.
Family Relationships
Laura Cohen, our CEO and President, is the mother of Lisa LeBlanc, our COO. Laura Cohen is married to William Cohen, our Chief Development Officer. Aside from the aforementioned, there are no other family relationships between any other director, executive officer, person nominated or chosen by the Company to become a director or executive officer, or any other significant employee.
Certain Relationships
Except as set forth above and in our discussion below in “Interest of Management and Others in Certain Transactions,” none of our directors or executive officers have been involved in any transactions with us or any of our directors, executive officers, affiliates, or associates which are required to be disclosed pursuant to the rules and regulations of the SEC.
Business Experience:
Laura Cohen, MD, is a Board-Certified Dermatologist, Dermatologic Surgeon and Academic Medical Clinician, in practice in Southern California. Dr. Cohen is skilled, experienced, and knowledgeable concerning dermatological conditions, prevention, and formulation of treatment and prevention products. She received her medical degree from George Washington University School of Medicine and completed her residency in Dermatology at Indiana University School of Medicine. Dr. Cohen is a Fellow in the American Academy of Dermatology and was a Clinical Professor of Medicine at the University of California School of Medicine Irvine, Department of Dermatology from October 2004 to May 2020, and is on the Hoag-USC Melanoma Advisory Board. Dr. Cohen was the Director of the Nevada VA Hospital Department of Dermatology and was a Staff Physician at the Long Beach Veterans Administration Hospital from October 2004 to October 2017. Dr. Cohen is the owner of Advanced Dermatology Care Center, Inc. a Dermatology Practice in Newport Beach and Huntington Beach, California since April 2005 to the present. Previously, Dr. Cohen founded and sold her dermatology practice in Tampa, Florida. Dr. Cohen has authored and published a number of articles relating to skin disease. Dr. Cohen has been our founder, President, and CEO from August 2008 to the present.
| 52 |
Lisa LeBlanc is a graduate of Arizona State University. She has been instrumental in the development of the formulation and marketing of the KlenSkin product and has been working with us since our founding in August 2008. Ms. LeBlanc has been a Manager of Advanced Dermatology Care Center, Inc. located in Southern California, a dermatology practice and skin care facility. Ms. LeBlanc has approximately 15 years of experience managing all aspects of a medical practice and spa.
Daniel Traynor is the Vice-President of Product Development. Mr. Traynor works from our product development facility in Sarasota, Florida. Mr. Traynor started working for us as an independent contractor in August 2010 and became an employee on August 2017. Mr. Traynor is a highly trained, skilled, and accomplished chemist, widely known and respected in the realm of cosmetic chemistry. He is responsible for the product development and formulation bases for use by us and our partners. Mr. Traynor works with corporate partners, who provide formulation and raw material support. He is also assisted by a part-time chemist, who shares the facilities in Sarasota with Mr. Traynor. He also supervises the ongoing independent testing of products both in early development through the final manufacturing stages. He also conducts quality assurance audits at manufacturing sites.
Gerald Birch, CPA, is our Accountant. Mr. Birch graduated with a B.A. in Economics from York University in Toronto and is a Certified Public Accountant since 1998. He is a member of the Florida Board of Accountancy and a U.S. Navy Veteran. Mr. Birch has vast experience in corporate accounting including; M&A work, auditing and performing various other accounting tasks including tax preparation for both public and private companies. Mr. Birch has been an accountant for us since 2009 and was acting Chief Financial Officer from 2011 to the present.
Charles Fritts, Esq. Mr. Fritts is a member of our Board of Directors and is the Chairman of our Audit Committee. He attended Antonin Scalia Law School at George Mason University. He is a retired senior director of Federal Government Relations for the Biotechnology Industry Organization in Washington D.C. where he worked from 2011 to 2020. Since 2020, Mr. Fritts acts as a Legal Consultant for this organization.
Dean Stathakis, Esq., Ph.D. is a member of our Board of Directors. He attended Whittier Law School and has a Doctorate Degree in Molecular Biology from the University of Virginia. He is experienced in health care, life sciences & biotechnology, intellectual property, and patent applications. Since 2017, Mr. Stathakis has been the President of UltimateEdge Law Group LLC in Irvine, California. Prior to that, from 2013 to 2017, he was the President and Chief Operations Officer at One3 IP Management, Irvine, California. Mr. Stathakis is known for patent work on Botox while previously employed at Allergan.
Peter Barton-Hutt, Esq. is a member of our Board of Directors. He received his LL.B. from Harvard Law and his LL.M from New York University Law School. He is currently Senior Counsel in the Washington, D.C. law firm of Covington & Burling LLP, where his has worked since 1960, specializing in Food and Drug Law. Mr. Barton-Hutt was formerly General Counsel at the FDA.
Involvement in Certain Legal Proceedings
To our knowledge, none of our current directors or executive officers has, during the past ten years:
| ● | been convicted in a criminal proceeding or been subject to a pending criminal proceeding (excluding traffic violations and other minor offenses); | |
| ● | had any bankruptcy petition filed by or against the business or property of the person, or of any partnership, corporation, or business association of which he or she was a general partner or executive officer, either at the time of the bankruptcy filing or within two years prior to that time; |
| 53 |
| ● | been subject to any order, judgment, or decree, not subsequently reversed, suspended or vacated, of any court of competent jurisdiction or federal or state authority, permanently or temporarily enjoining, barring, suspending or otherwise limiting, his involvement in any type of business, securities, futures, commodities, investment, banking, savings and loan, or insurance activities, or to be associated with persons engaged in any such activity; | |
| ● | been found by a court of competent jurisdiction in a civil action or by the SEC or the Commodity Futures Trading Commission to have violated a federal or state securities or commodities law, and the judgment has not been reversed, suspended, or vacated; | |
| ● | been the subject of, or a party to, any federal or state judicial or administrative order, judgment, decree, or finding, not subsequently reversed, suspended or vacated (not including any settlement of a civil proceeding among private litigants), relating to an alleged violation of any federal or state securities or commodities law or regulation, any law or regulation respecting financial institutions or insurance companies including, but not limited to, a temporary or permanent injunction, order of disgorgement or restitution, civil money penalty or temporary or permanent cease-and-desist order, or removal or prohibition order, or any law or regulation prohibiting mail or wire fraud or fraud in connection with any business entity; or | |
| ● | been the subject of, or a party to, any sanction or order, not subsequently reversed, suspended or vacated, of any self-regulatory organization (as defined in Section 3(a)(26) of the Exchange Act, any registered entity (as defined in Section 1(a)(29) of the Commodity Exchange Act), or any equivalent exchange, association, entity or organization that has disciplinary authority over its members or persons associated with a member. |
Except as disclosed above under “Involvement in Certain Legal Proceedings” in the “Description of Business” section, we are not currently a party to any legal proceedings, the adverse outcome of which, individually or in the aggregate, we believe will have a material adverse effect on our business, financial condition or operating results.
Board Leadership Structure and Risk Oversight
The Board oversees our business and considers the risks associated with our business strategy and decisions. The Board currently implements its risk oversight function as a whole.
Term of Office
Each of our officers holds office until his or her successor is elected and qualified. Directors are appointed to serve for one year until the meeting of the Board following the annual meeting of shareholders and until their successors have been elected and qualified.
| 54 |
Director Independence
We use the definition of “independence” of The NASDAQ Stock Market to make this determination. NASDAQ Listing Rule 5605(a)(2) provides that an “independent director” is a person other than an officer or employee of the company or any other individual having a relationship which, in the opinion of our Board, would interfere with the exercise of independent judgment in carrying out the responsibilities of a director. The NASDAQ listing rules provide that a director cannot be considered independent if:
| ● the director is, or at any time during the past three years was, an employee of the company; | |
| ● the director or a family member of the director accepted any compensation from the company in excess of $120,000 during any period of twelve consecutive months within the three years preceding the independence determination (subject to certain exemptions, including, among other things, compensation for board or board committee service); | |
| ● the director or a family member of the director is a partner in, controlling shareholder of, or an executive officer of an entity to which the company made, or from which the company received, payments in the current or any of the past three fiscal years that exceed 5% of the recipient’s consolidated gross revenue for that year or $200,000, whichever is greater (subject to certain exemptions); | |
| ● the director or a family member of the director is employed as an executive officer of an entity where, at any time during the past three years, any of the executive officers of the company served on the compensation committee of such other entity; or | |
| ● the director or a family member of the director is a current partner of the company’s outside auditor, or at any time during the past three years was a partner or employee of the company’s outside auditor, and who worked on the company’s audit. |
Under such definitions, Charles Fritts, Esq., Peter Barton-Hutt, Esq, and Dean Stathakis, Esq. are independent directors. However, our Shares are not currently quoted or listed on any national exchange or interdealer quotation system with a requirement that a majority of our Board be independent and, therefore, we are not subject to any director independence requirements.
| 55 |
COMPENSATION OF DIRECTORS AND EXECUTIVE OFFICERS
Executive and Director Compensation
The following table represents information regarding the total compensation of our executive officers and directors during the fiscal year ended December 31, 2020:
Name and Capacity in which Compensation was Received | Cash Compensation ($) | Other Compensation ($) (1) | Total Compensation ($) | |||||||||
Laura Cohen, President, CEO, and Director(1) | $ | 26,000 | $ | 0 | $ | 26,000 | ||||||
| Lisa LeBlanc, COO and Director | $ | 135,000 | $ | 0 | $ | 135,000 | ||||||
| Daniel Traynor, VP of Product Development | $ | 130,000 | (2) | $ | 0 | $ | 125,000 | |||||
| Gerald Birch, Chief Financial Officer | $ | 1,307 | $ | 0 | $ | 1,307 | ||||||
| Charles Fritts, Director | $ | 0 | $ | 0 | $ | 0 | ||||||
| Dean Stathakis, Director | $ | 0 | $ | 0 | $ | 0 | ||||||
| Peter Barton-Hutt, Director | $ | 0 | $ | 0 | $ | 0 | ||||||
| (1) | Laura Cohen did not receive any compensation in her capacity as a director. |
| (2) | Includes salary of $120,000 and a cash bonus of $10,000. |
Employment Agreements, Arrangements, or Plans
The following describes the respective compensation arrangements entered into by us and our executive officers in place as of the date hereof.
Compensation for Laura Cohen
We have not entered into an employment agreement with Laura Cohen. Ms. Cohen’s compensation was determined by the Board. Ms. Cohen’s compensation has been limited based on available working capital and below what we consider comparable to executives in comparable positions. Ms. Cohen has received and may continue to receive stock options as determined by the Board.
Compensation for Lisa LeBlanc
We have not entered into an employment agreement with Lisa LeBlanc. Ms. LeBlanc’s compensation was determined by the Board. Ms. LeBlanc’s compensation has been limited based on available working capital and below what we consider comparable to executives in comparable positions. Ms. LeBlanc has received and may continue to receive stock options as determined by the Board.
| 56 |
Employment Agreement with Daniel Traynor
Effective September 1, 2017, we entered into an Employment Agreement with Daniel Traynor, as our product development chemist and formulator. The agreement provided for an annualized salary of $120,000. We agreed to grant Mr. Traynor 600,000 stock options with ten-year terms, immediate vesting on the grant date, and both the issuance price and the market price was determined to be the share price offered in the private placement in effect at the date of the stock option grant. Under the Employment Agreement, additional stock options may be granted annually, up to maximum fair market value, as determined by us, of 50% of Mr. Traynor’s gross annual salary for the calendar year. On September 1, 2018, the Board of Directors granted Mr. Traynor an additional 60,000 stock options under the same terms as above.
Compensation for Gerald Birch
Gerald Birch works with us as an independent contractor at an hourly rate of $75 per hour for bookkeeping services and $125 per hour for tax-related services.
Director Compensation
We have five directors. We currently do not pay our directors any cash compensation for their services as board members.
Our directors are granted stock options by the Board annually, and decided and approved by the Board on a per Board meeting basis and as approved by the Board. The Board has not authorized any stock options in the past two years.
It is currently contemplated by the Board that starting in 2021, each member of the Board will receive 15,000 stock options annually exercisable at the current offering price of our common stock at the time that the options are granted. However, the determination will be made by the Board during its annual Board meeting.
| 57 |
SECURITY OWNERSHIP OF MANAGEMENT AND CERTAIN SECURITYHOLDERS
The following table shows the beneficial ownership of our Shares as of the date of this Offering Circular held by (i) each person known to us to be the beneficial owner of more than 10% of any class of our voting securities; (ii) each director; (iii) each executive officer; and (iv) all directors and executive officers as a group. As of the date of this Offering Circular, there were 15,800,000 Shares issued and outstanding.
Beneficial ownership is determined in accordance with the rules of the SEC, and generally includes voting power and/or investment power with respect to the securities held. Shares subject to options and warrants currently exercisable or which may become exercisable within 60 days of the date of this Offering Circular, are deemed outstanding and beneficially owned by the person holding such options or warrants for purposes of computing the number of Shares and percentage beneficially owned by such person, but are not deemed outstanding for purposes of computing the percentage beneficially owned by any other person. Except as indicated in the footnotes to this table, the persons or entities named have sole voting and investment power with respect to all of our Common Stock shown as beneficially owned by them.
| Name and Address(1) of Beneficial Owner | Amount and Nature of Beneficial Ownership | Percent of Class Prior to Offering(2) | Percent of Class After Maximum Offering | |||||||||
| Directors and Officers: | ||||||||||||
| Laura Cohen | 10,150,000 | (3) | 56 | % | 48 | % | ||||||
| Lisa LeBlanc | 6,100,000 | (4) | 33 | % | 29 | % | ||||||
| Daniel Traynor | 660,000 | (5) | 4 | % | 3 | % | ||||||
| Gerald Birch | 0 | * | * | |||||||||
| Charles Fritts | 35,000 | (6) | * | * | ||||||||
| Dean Stathakis | 30,000 | (7) | * | * | ||||||||
| Peter Barton-Hutt | 30,000 | (8) | * | * | ||||||||
| All executive officers and directors as a group | 17,005,000 | 79 | % | 70 | % | |||||||
* Less than 1%
| (1) | Unless otherwise indicated, the address is the Company’s address. |
| (2) | This Offering Statement does not contemplate that any of our current listed shareholders will acquire any additional Shares as part of this Offering. |
| (3) | Includes 2,450,000 fully vested stock options exercisable for a term of 7 to 13 years for an exercise price of $1.00 to $1.80. |
| (4) | Includes 2,450,000 fully vested stock options exercisable for a term of 7 to 13 years for an exercise price of $1.00 to $1.80. |
| (5) | Consists of 660,000 fully vested stock options exercisable for a term of 6 to 7 years for an exercise price of $1.00 to $1.80. |
| (6) | Includes 30,000 fully vested stock options exercisable for a term of 12 to 13 years for an exercise price of $1.00 and $1.80. |
| (7) | Consists of 30,000 fully vested stock options exercisable for a term of 12 to 13 years for an exercise price of $1.00 and $1.80. |
| (8) | Consists of 30,000 fully vested stock options exercisable for a term of 12 to 13 years for an exercise price of $1.00 and $1.80. |
| 58 |
INTEREST OF MANAGEMENT AND OTHERS IN CERTAIN TRANSACTIONS
Transactions with Related Persons
Advanced Dermatology Care Center, Inc. (“ADCC”) is a significant related purchaser of Klenskin products. These products are ordered and sold to patients of ADCC and our clients. ADCC is a general dermatology practice owned by our Chief Executive Officer, Laura Cohen, MD. The products sold there are to enhance skin protection from sun exposure to patients having sun damaged skin.
During the nine months ended September 30, 2020 and 2019, sales to ADCC accounted for 17% and 6% of our revenue, respectively.
During the year ended December 31, 2019 and 2018, sales to ADCC accounted for 9% and 13% of our revenue, respectively.
Review, Approval and Ratification of Related Party Transactions
We have formal policies and procedures for the review, approval, or ratification of transactions, such as those described above, with our executive officer(s), director(s), and significant shareholders. Our bylaws provide for the disqualification of certain directors or officers for voting on specific matters where that director or officer deals or contracts with us as either a vendor or purchaser. Additionally, in the employment agreements with our CEO and COO, we have conflict of interest provisions that require them to notify our board of directors before engaging in any activity that creates a potential conflict of interest, and a list of pre-approved activities.
| 59 |
The following is a summary of the rights of our capital stock as provided in our Articles of Incorporation, and bylaws. For more detailed information, please see our Articles of Incorporation and bylaws which have been filed as exhibits to the Offering Statement of which this Offering Circular is a part.
General
We are authorized to issue one class of stock. We are authorized to issue 50,000,000 Shares. As of the date of this Offering Circular, there are 15,800,000 Shares issued and outstanding.
As of the date of this Offering Circular, we have 5,650,000 options outstanding with a weighted average exercise price of $1.11 and an average term of 9.96 years.
Common Stock Voting
The holders of Shares are entitled to one vote for each share held on all matters to be voted on by our stockholders.
Dividends
The holders of Shares are entitled to dividends when and as declared by the Board from funds legally available therefor if, as and when determined by the Board in its sole discretion, subject to provisions of applicable law, and any provision of our Articles of Incorporation, as amended from time to time. There are no preemptive, conversion or redemption privileges, nor sinking fund provisions with respect to the our Common Stock.
Liquidation
In the event of any voluntary or involuntary liquidation, dissolution or winding up of our affairs, the holders of our Common Stock will be entitled to share ratably in the net assets legally available for distribution to stockholders after the payment of or provision for all of our debts and other liabilities.
Fully Paid and Non-assessable
All outstanding Shares are, and the Common Stock to be outstanding upon completion of this Offering will be, duly authorized, validly issued, fully paid and non-assessable.
Changes in Authorized Number
The number of authorized Shares may be increased or decreased subject to our legal commitments at any time and from time to time to issue them, by the affirmative vote of the holders of a majority of our stock entitled to vote.
Absence of Public Market
We currently have 40 stockholders. Upon qualification of this Offering by the SEC, we will be an alternative reporting company under Regulation A+, Tier 2 of the Securities Act. There is currently no public trading market for our Common Stock. We expect , as an alternative reporting company, to qualify our Common Stock for quotation on the OTCQB or other secondary market for which our Common Stock may then qualify. (See “Risk Factors.”)
| 60 |
WHERE YOU CAN FIND MORE INFORMATION
We are filing with the SEC a Regulation A+ Offering Statement on Form 1-A under the Securities Act with respect to the Shares offered hereby. This Offering Circular, which constitutes a part of the Offering Statement, does not contain all of the information set forth in the Offering Statement or the exhibits and schedules filed therewith. For further information about us and the Common Stock offered hereby, we refer you to the Offering Statement and the exhibits and schedules filed therewith. Statements contained in this Offering Circular regarding the contents of any contract or other document that is filed as an exhibit to the Offering Statement are not necessarily complete, and each such statement is qualified in all respects by reference to the full text of such contract or other document filed as an exhibit to the Offering Statement. The SEC maintains a website that contains reports and other information about issuers, including us, that file electronically with the SEC at www.sec.gov.
| 61 |
INDEX TO FINANCIAL STATEMENTS
| 62 |
Management Internally Prepared Financial Statements – Not Reviewed by
Independent Registered Accounting Firm
BALANCE SHEETS
| September 30, 2020 | December 31, 2019 | |||||||
| (Unaudited) | ||||||||
| Assets | ||||||||
| Current assets: | ||||||||
| Cash | $ | 61,000 | $ | 347,000 | ||||
| Accounts receivable | - | 3,000 | ||||||
| Inventory | 60,000 | - | ||||||
| Total current assets | 121,000 | 350,000 | ||||||
| Property and equipment, net | 1,000 | 2,000 | ||||||
| Right of use asset, net | 25,000 | 42,000 | ||||||
| Other assets: | ||||||||
| Other assets | 3,000 | 2,000 | ||||||
| Total assets | $ | 150,000 | $ | 396,000 | ||||
| Liabilities and Stockholders’ Equity | ||||||||
| Current liabilities: | ||||||||
| Accounts payable and accrued expenses | $ | 18,000 | $ | 56,000 | ||||
| Lease liability, current portion | 25,000 | 24,000 | ||||||
| Notes payable, current portion | 14,000 | 42,000 | ||||||
| Total current liabilities | 57,000 | 122,000 | ||||||
| Lease liability | 2,000 | 21,000 | ||||||
| Notes payable | 100,000 | - | ||||||
| Total liabilities | 159,000 | 143,000 | ||||||
| Commitments and contingencies | ||||||||
| Stockholders’ equity (deficit): | ||||||||
| Common stock, $.001 par value; 50,000,000 shares authorized; 15,550,00 and 12,652,000 shares issued and outstanding at September 30, 2020, and December 31, 2019, respectively | 16,000 | 13,000 | ||||||
| Additional paid-in capital | 10,024,000 | 9,731,000 | ||||||
| Accumulated deficit | (10,049,000 | ) | (9,491,000 | ) | ||||
| Total stockholders’ equity (deficit) | (9,000 | ) | 253,000 | |||||
| Total liabilities and stockholders’ equity | $ | 150,000 | $ | 396,000 | ||||
See accompanying notes to the financial statements.
| 63 |
Management Internally Prepared Financial Statements – Not Reviewed by
Independent Registered Accounting Firm
CONDENSED STATEMENTS OF OPERATIONS
(UNAUDITED)
| Nine months ended September 30, | ||||||||
| 2020 | 2019 | |||||||
| Revenue (1) | $ | 107,000 | $ | 163,000 | ||||
| Cost of revenue | 35,000 | 57,000 | ||||||
| Gross profit | 72,000 | 106,000 | ||||||
| Operating expenses | ||||||||
| Selling, general and administrative expenses | 478,000 | 482,000 | ||||||
| Research and development | 151,000 | 171,000 | ||||||
| Total operating expenses | 629,000 | 653,000 | ||||||
| Loss from operations | (557,000 | ) | (547,000 | ) | ||||
| Other expenses | ||||||||
| Interest expense | (1,000 | ) | (2,000 | ) | ||||
| Net loss | $ | (558,000 | ) | $ | (549,000 | ) | ||
| Net loss per common share – basic and diluted | $ | (0.04 | ) | $ | (0.04 | ) | ||
| Weighted average common shares outstanding – basic and diluted | 12,875,022 | 12,485,667 | ||||||
| (1) Sales to related party | $ | 19,000 | $ | 10,000 | ||||
See accompanying notes to the financial statements.
| 64 |
Management Internally Prepared Financial Statements – Not Reviewed by
Independent Registered Accounting Firm
STATEMENTS OF CHANGES IN STOCKHOLDERS’ EQUITY (DEFICIT)
NINE MONTHS ENDED SEPTEMBER 30, 2020 AND 2019
(UNAUDITED)
| Common stock | Additional Paid In | Accumulated | Total Stockholders’ | |||||||||||||||||
| Shares | Amount | Capital | Deficit | Equity | ||||||||||||||||
| Balance, December 31, 2019 | 12,652,000 | $ | 13,000 | $ | 9,731,000 | $ | (9,491,000 | ) | $ | 253,000 | ||||||||||
| Common shares issued on exercise of stock options | 2,800,000 | 3,000 | - | - | 3,000 | |||||||||||||||
| Common shares issued for cash | 98,000 | - | 293,000 | 293,000 | ||||||||||||||||
| Net loss | (558,000 | ) | (558,000 | ) | ||||||||||||||||
| Balance, September 30, 2020 (Unaudited) | 15,550,000 | $ | 16,000 | $ | 10,024,000 | $ | (10,049,000 | ) | $ | (9,000 | ) | |||||||||
| Common stock | Additional Paid In | Accumulated | Total Stockholders’ | |||||||||||||||||
| Shares | Amount | Capital | Deficit | Equity | ||||||||||||||||
| Balance, December 31, 2018 | 12,305,000 | $ | 12,000 | $ | 8,690,000 | $ | (8,701,000 | ) | $ | 1,000 | ||||||||||
| Common shares issued for cash | 180,667 | - | 542,000 | 542,000 | ||||||||||||||||
| Net loss | (549,000 | ) | (549,000 | ) | ||||||||||||||||
| Balance, September 30, 2019 (Unaudited) | 12,485,667 | $ | 12,000 | $ | 9,232,000 | $ | (9,250,000 | ) | $ | (6,000 | ) | |||||||||
See accompanying notes to the financial statements.
| 65 |
Management Internally Prepared Financial Statements – Not Reviewed by
Independent Registered Accounting Firm
STATEMENTS OF CASH FLOWS
NINE MONTHS ENDED SEPTEMBER 30, 2020 AND 2019
(UNAUDITED)
| Nine Months Ended September 30, | ||||||||
| 2020 | 2019 | |||||||
| (Unaudited) | (Unaudited) | |||||||
| Cash flows from operating activities: | ||||||||
| Net loss | $ | (558,000 | ) | $ | (549,000 | ) | ||
| Adjustments to reconcile net loss to cash used in operating activities: | ||||||||
| Depreciation | 1,000 | 1,000 | ||||||
| Amortization of right of use asset | 17,000 | 14,000 | ||||||
| Change in operating assets and liabilities: | ||||||||
| Accounts receivable | 3,000 | (40,000 | ) | |||||
| Inventory | (60,000 | ) | - | |||||
| Other assets | (1,000 | ) | (1,000 | ) | ||||
| Accounts payable and accrued expenses | (38,000 | ) | 26,000 | |||||
| Change in lease liability | (18,000 | ) | (12,000 | ) | ||||
| Net cash used in operating activities | (654,000 | ) | (561,000 | ) | ||||
| Cash flows from financing activities: | ||||||||
| Proceeds from the sale of common shares | 293,000 | 542,000 | ||||||
| Proceeds from the exercise of stock options | 3,000 | - | ||||||
| Proceeds from line of credit | - | 20,000 | ||||||
| Repayment of line of credit | - | (10,000 | ) | |||||
| Proceeds from notes payable | 103,000 | - | ||||||
| Repayment of notes payable | (31,000 | ) | - | |||||
| Net cash provided by financing activities | 368,000 | 552,000 | ||||||
| Net decrease | (286,000 | ) | (9,000 | ) | ||||
| Balance at the beginning of the period | 347,000 | 9,000 | ||||||
| Balance at the end of the period | $ | 61,000 | $ | - | ||||
| Supplemental disclosures of cash flow information: | ||||||||
| Cash paid for: | ||||||||
| Income taxes | $ | - | $ | - | ||||
| Interest | $ | - | $ | 2,000 | ||||
| Non-Cash Operating Activities: | ||||||||
| Recording of right of use asset and lease liability upon adoption of new accounting rule | $ | - | $ | 67,000 | ||||
See accompanying notes to the financial statements.
| 66 |
Management Internally Prepared Financial Statements – Not Reviewed by
Independent Registered Accounting Firm
NOTES TO FINANCIAL STATEMENTS
NINE MONTHS ENDED SEPTEMBER 30, 2020 AND 2019
(UNAUDITED)
| 1. | Organization and Basis of Presentation |
CoLabs Int’l, Corp. (the “Company”) was incorporated in Nevada in 2008 and is a closely-held, majority woman-owned biotechnology company. The Company’s corporate administrative office and warehouse facility are located in Huntington Beach, California.
The Company was founded upon its acquired and internally developed intellectual property on its belief that its intellectual property provides a commercial advantage in the global marketplace. The Company relies on patent, trade secret, copyright, and trademark law, as well as the Company’s contractual terms with its customers, to define, maintain and enforce the Company’s intellectual property rights technologies and relationships.
The Company currently has 26 issued patents and eight filed pending patents covering our technology. In addition, a significant amount of the Company’s intellectual property takes the form of trade secrets and copyrighted works of authorship. The Company currently has a portfolio of registered and pending trademarks in the United States and foreign jurisdictions, including registrations for the marks “Quantasphere®,” “QS®,” “KLĒNSKIN®,” “WASH ON®,” and “SHOWER ON®.”
The Company’s patented Quantasphere® technology is a globally unique, widely adaptable delivery system providing improved effectiveness and consumer acceptance for a multitude of drugs, cosmetics, and chemical applications. The Company’s technology places drugs into micro-sized encapsulates, that have an electrostatic charge and then suspends these into unique formulations, limiting the unwanted absorption or having a timed release. This one-of-a-kind unique delivery system significantly decreases the absorption of potentially dangerous chemicals into the body and organ systems, thereby avoiding potential toxic side-effects. This technology is also able to target the depth of penetration and the degree of dispersion or timed release of the active ingredients into the skin or onto the surface of the skin.
The Company is presently selling sunscreens, SPF lip balms and bug repellent products, utilizing its patented Quantasphere® technology, to the consumer market under the KLĒNSKIN® brand name, with plans to expand its product lines to multiple additional markets, including dermatology, cosmetics, fragrances, and other therapeutic applications.
The Company amended its Articles of Incorporation on January 12, 2021 to increase its authorized shares of common stock to 50,000,000.
COVID-19 Considerations
Through the date these financial statements were issued, the COVID-19 pandemic has significantly impacted the Company’s operating results. Due to COVID-19, the Company experienced reduced demand for its products in its domestic and international markets. Marketing programs planned for 2020 were curtailed by the lockdowns related to the epidemic. These included: AVP Beach Volleyball, NASCAR and golf tournaments events were all cancelled and/or postponed until 2021. In many locations, beaches and outdoor activities were also restricted which again limited sunscreen sales. Since the company has only limited online presence, which is directly related to sport event marketing, sales were seriously affected.
The Company is however, recently experiencing an improving trend in customer orders from both its domestic and international markets. As lockdowns are gradually lifted, more outdoor activities are allowed resulting in increasing sales. In the future, the pandemic may cause reduced demand for the Company’s products. Should the pandemic result in a recessionary economic environment, consumers who purchase the Company’s products will be negatively affected. The Company has not observed any material impairments of its assets or a significant change in the fair value of its assets due to the COVID-19 pandemic.
| 67 |
The Company’s ability to operate without significant negative operational impact from the COVID-19 pandemic will in part depend on its ability to protect its employees and its supply chain. The Company has endeavored to follow the recommended actions of government and health authorities to protect its employees. However, the uncertainty resulting from the COVID-19 pandemic could result in an unforeseen disruption to its workforce and supply chain (for example, an inability of a key supplier or transportation supplier to source and transport materials) that could negatively impact operations.
Going Concern
The Company’s financial statements have been prepared assuming that it will continue as a going concern, which contemplates continuity of operations, the realization of assets, and liquidation of liabilities in the normal course of business. As reflected in the financial statements, during the nine-month period ended September 30, 2020, the Company incurred a net loss of $558,000, and used net cash in operating activities of $654,000, and had a shareholders’ deficit of $9,000 as of September 30, 2020. These factors raise substantial doubt about the Company’s ability to continue as a going concern within one year after the date that the financial statements are issued. The financial statements do not include any adjustments related to the recoverability and classification of recorded asset amounts or the amounts and classification of liabilities that might be necessary should the Company be unable to continue as a going concern.
As discussed in Note 8, and subsequent to September 30, 2020, the Company received proceeds of $750,000 on the sale of 250,000 shares of Company common stock. Management estimates that the current funds on hand will be sufficient to continue operations through June 30, 2021. The ability of the Company to continue as a going concern is dependent on the Company’s ability to execute its strategy and in its ability to raise additional funds. Management is currently seeking additional funds, primarily through the issuance of equity securities for cash to operate its business. No assurance can be given that any future financing will be available or, if available, that it will be on terms that are satisfactory to the Company. Even if the Company can obtain additional financing, it may contain undue restrictions on operations, in the case of debt financing or cause substantial dilution for stockholders, in the case of equity financing.
Preparation of Interim Financial Statements
The financial statements included in this report are unaudited and have been prepared by the Company and, in the opinion of management, include all adjustments (consisting of normal recurring accruals and adjustments necessary for adoption of new accounting standards) necessary to present fairly the results of the interim periods shown. Management believes that its disclosures are sufficiently presented to prevent this information from being misleading. Due to seasonality and other factors, the results for the interim periods are not necessarily indicative of results for a full year. The Balance Sheet information as of December 31, 2019, was derived from the Company’s audited Financial Statements as of and for the year ended December 31, 2019, included elsewhere. These financial statements should be read in conjunction with that report.
| 2. | Summary of Significant Accounting Policies |
Revenue Recognition
The Company products are sold under the brand name KLĒNSKIN®, which consists of distinct sunscreen products titled SPF 30 Shampoo, Face and Body Wash, SunBar SPF 20 Bar Soap, and our Broad Spectrum SPF 50 Lotion, and a hand sanitizer and insect repellant. The products are offered for sale as finished goods only, and there are no performance obligations required post-shipment for customers to derive the expected value from them. Contracts with customers contain no incentives or discounts that could cause revenue to be allocated or adjusted over time. The Company does offer a general right of return, but historically the return rates have been insignificant.
| 68 |
The Company recognizes revenue in accordance with Accounting Standard Update (“ASU”) No. 2014-09. This standard provides authoritative guidance clarifying the principles for recognizing revenue and developing a common revenue standard for U.S. generally accepted accounting principles. The core principle of the guidance is that an entity should recognize revenue to depict the transfer of promised goods and services to customers in an amount that reflects the consideration to which the entity expects to be entitled in the exchange for those goods or services.
Under this guidance, revenue is recognized when control of promised goods or services is transferred to the Company’s customers, in an amount that reflects the consideration the Company expects to be entitled to in exchange for those goods or services. The Company reviews its sales transactions to identify contractual rights, performance obligations, and transaction prices, including the allocation of prices to separate performance obligations, if applicable. Revenue and costs of sales are recognized once products are delivered to the customer’s control and performance obligations are satisfied.
Revenue Concentrations
The Company performs a regular review of customer activity and associated credit risks and does not require collateral or other arrangements.
During the nine months ended September 30, 2020, a related party (see Note 7) accounted for 17% of the Company’s revenue, and one international customer accounted for 42% of the Company’s revenue. Revenue to customers outside the United States comprised 42% of our revenues. During the nine months ended September 30, 2019, one customer accounted for 11% of the Company’s revenue, and one international customer accounted for 59% of the Company’s revenue. Shipments to customers outside the United States comprised 59% of revenues. No other customers accounted for more than 10% of revenues during the nine months ended September 30, 2020 and 2019.
Stock-Based Compensation
The Company periodically issues stock options to employees. The Company accounts for stock options issued and vesting to employees based on the authoritative guidance provided by Accounting Standards Codification (“ASC”) Topic 718 – Stock Compensation, whereas the value of the award is measured on the date of grant and recognized over the vesting period.
The fair value of the Company’s common stock option grants is estimated using the Black-Scholes option-pricing model, which uses certain assumptions related to risk-free interest rates, expected volatility, expected life of the common stock options, and future dividends. Compensation expense is recorded based upon the value derived from the Black-Scholes option pricing model, and based on actual experience. The assumptions used in the Black-Scholes option-pricing model could materially affect compensation expense recorded in future periods.
Fair Value Measurements
The Company uses various inputs in determining the fair value of its investments and measures these assets on a recurring basis. Financial assets recorded at fair value in the consolidated balance sheets are categorized by the level of objectivity associated with the inputs used to measure their fair value. Authoritative guidance provided by ASC Topic 820 - Fair Value Measurements and Disclosure defines the following levels directly related to the amount of subjectivity associated with the inputs to fair valuation of these financial assets:
Level 1—Quoted prices in active markets for identical assets or liabilities;
Level 2—Inputs, other than the quoted prices in active markets, that are observable either directly or indirectly; and
Level 3—Unobservable inputs based on the Company’s assumptions.
The Company is required to use observable market data if such data is available without undue cost and effort. At September 30, 2020 and December 31, 2019, the carrying amounts of financial assets and liabilities, such as cash, accounts receivable, other assets, and accounts payable and accrued expenses approximate their fair values due to their short-term nature. The carrying values of notes payable approximate their fair values due to the fact that the interest rates on these obligations are based on prevailing market interest rates.
| 69 |
Basic and Diluted Net Loss per Common Share
Basic net loss per share is computed by using the weighted-average number of common shares outstanding during the period. Diluted net loss per share is computed giving effect to all dilutive potential shares of Common Stock that were outstanding during the period. Dilutive potential shares of Common Stock consist of incremental shares of Common Stock issuable upon exercise of stock options. No dilutive potential shares of Common Stock were included in the computation of diluted net loss per share because their impact was anti-dilutive. As of September 30, 2020 and 2019, the Company had total outstanding options of 5,650,000 and 8,450,000, respectively, which were excluded from the computation of net loss per share because they are anti-dilutive.
Use of Estimates
The preparation of financial statements in conformity with accounting principles generally accepted in the United States of America requires management to make estimates and assumptions that may affect the reported amounts of assets and liabilities and disclosure of contingent assets and liabilities at the date of the financial statements and reported amounts of revenues and expenses during the reporting period. Those estimates and assumptions include estimates for reserves of uncollectible accounts, analysis of impairments of long-lived assets, accruals for potential liabilities, assumptions made in valuing stock instruments issued for services, and valuation of deferred tax assets. Actual results could differ from those estimates.
Research and Development
Research and development costs are expensed as incurred. Research and development expenses for the nine months ended September 30, 2020 and 2019 were $151,000 and $171,000, respectively.
Advertising Costs
Advertising costs are charged to operations as part of selling, general and administrative expenses at the time the costs are incurred. Advertising costs for the nine months ended September 30, 2020 and 2019 were $3,000 and $2,000, respectively.
Concentration of Credit Risk
The Company maintains the majority of its cash balances with one financial institution, in the form of demand deposits. From time-to-time, the Company had cash deposits that exceeded the federally insured limit of $250,000. The Company believes that no significant concentration of credit risk exists with respect to these cash balances because of its assessment of the creditworthiness and financial viability of the financial institution.
Inventories
Inventories are stated at the lower of cost or net realizable value. Cost is computed on a first-in, first-out basis. The Company’s inventories consist almost entirely of finished goods as of September 30, 2020.
The Company provides inventory reserves based on excess and obsolete inventories determined primarily by future demand forecasts. The write down amount is measured as the difference between the cost of the inventory and market based upon assumptions about future demand and charged to the provision for inventory, which is a component of cost of sales. At the point of the loss recognition, a new, lower cost basis for that inventory is established, and subsequent changes in facts and circumstances do not result in the restoration or increase in that newly established cost basis. At September 30, 2020, the Company determined that no reserve for excess and obsolete inventory was required.
| 70 |
Recent Accounting Pronouncements
In June 2016, the FASB issued ASU No. 2016-13, Credit Losses - Measurement of Credit Losses on Financial Instruments (“ASC 326”). The standard significantly changes how entities will measure credit losses for most financial assets, including accounts and notes receivables. The standard will replace today’s “incurred loss” approach with an “expected loss” model, under which companies will recognize allowances based on expected rather than incurred losses. Entities will apply the standard’s provisions as a cumulative-effect adjustment to retained earnings as of the beginning of the first reporting period in which the guidance is effective. As a small business filer, the standard will be effective for us for interim and annual reporting periods beginning after December 15, 2022. Company management is currently assessing the impact of adopting this standard on the Company’s financial statements and related disclosures.
Other recent accounting pronouncements issued by the FASB, including its Emerging Issues Task Force, the American Institute of Certified Public Accountants, and the Securities and Exchange Commission did not or are not believed by management to have a material impact on the Company’s present or future consolidated financial statements.
| 3. | Lease Payable |
The Company leases its corporate administrative office and warehouse facility located in Huntington Beach, California, with a remaining lease term of 1.10 years as of September 30, 2020. The Company also leases office space in Sarasota, Florida, for its research and development activities on a month-to-month basis. Leases with an initial term of 12 months or less are not recorded on the balance sheet. The Company accounts for the lease and non-lease components of its leases as a single lease component. Rent expense is recognized on a straight-line basis over the lease term.
Operating lease ROU assets and liabilities are recognized at commencement date based on the present value of lease payments over the lease term. ROU assets represent our right to use an underlying asset for the lease term and lease liabilities represent our obligation to make lease payments arising from the lease. Generally, the implicit rate of interest in lease arrangements is not readily determinable and the Company utilizes its incremental borrowing rate in determining the present value of lease payments. Since the Company’s leases do not provide an implicit rate, management estimated their incremental borrowing rates used in its present value calculation, which required subjectivity. The incremental borrowing rate is the rate of interest that a lessee would have to pay to borrow on a collateralized basis over a similar term an amount equal to the lease payments in a similar economic environment. The operating lease ROU asset includes any lease payments made and excludes lease incentives.
During the nine months ended September 30, 2020 and 2019, lease costs totaled $17,000 and $16,000, respectively.
As of December 31, 2019, the Company’s lease liability totaled $45,000. During the nine months ended September 30, 2020, the Company made lease payments of $18,000, leaving a total lease liability of $27,000 at September 30, 2020.
As of September 30, 2020, the weighted average remaining lease term was 1.10 years. As of September 30, 2020, the weighted average discount rate for operating lease is 4.0%.
| 4. | Line of Credit |
In April 2019, the Company entered into a revolving credit agreement with Fundbox. The line of credit carries an interest rate of approximately 10% per annum and is secured by the assets of the Company. During the nine months ended September 30, 2020, the Company did not borrow against the line of credit, leaving no balance outstanding as of September 30, 2020.
| 71 |
| 5. | Notes Payable |
The table below displays the Company’s notes payable balances as of September 30, 2020 and December 31, 2019, respectively.
| September 30, 2020 | December 31, 2019 | |||||||
| Paycheck Protection Program (PPP) Loan (a) | $ | 61,000 | $ | - | ||||
| Economic Injury Disaster Loan (EIDL) (b) | 42,000 | - | ||||||
| Term Loan (c) | 11,000 | 42,000 | ||||||
| Total Loan Balance | $ | 114,000 | $ | 42,000 | ||||
| Short Term Balance | 14,000 | 42,000 | ||||||
| Long Term Balance | $ | 100,000 | $ | - | ||||
| (a) | On May 6, 2020, the Company was granted a loan (the “PPP loan”) from Cross River Bank in the aggregate amount of $61,000, pursuant to the Paycheck Protection Program (the “PPP”) under the CARES Act. |
The PPP loan agreement is dated May 6, 2020, matures on May 6, 2022, bears interest at a rate of 1% per annum, is unsecured and guaranteed by the U.S. Small Business Administration (SBA). The loan term may be extended to May 6, 2025, if mutually agreed to by the Company and lender. The PPP loan is payable monthly commencing 10 months after the end of the covered period, which was approximately November 6, 2020. In accordance with the PPP Flexibility Act passed in June 2020, if the Company applies for loan forgiveness within 10 months after the end of the covered period, then no payments are due until the SBA remits payment of a forgiveness amount or determines that no forgiveness is authorized. If the Company does not submit a request for forgiveness within 10 months after the end of the covered period, the Company will begin making payments on the PPP loan.
The Company applied ASC 470, Debt, to account for the PPP loan. The PPP loan may be prepaid at any time prior to maturity with no prepayment penalties. Funds from the PPP loan may only be used for qualifying expenses as described in the CARES Act, including qualifying payroll costs, qualifying group health care benefits, qualifying rent and debt obligations, and qualifying utilities. The Company intends to use the entire loan amount for qualifying expenses. Under the terms of the PPP, certain amounts of the loan may be forgiven if they are used for qualifying expenses. The Company intends to apply for forgiveness of the PPP loan with respect to these qualifying expenses, however, we cannot assure that such forgiveness of any portion of the PPP loan will occur. As for the potential loan forgiveness, once the PPP loan is, in part or wholly, forgiven and a legal release is received, the liability would be reduced by the amount forgiven and a gain on extinguishment would be recorded. The terms of the PPP loan provide for customary events of default including, among other things, payment defaults, breach of representations and warranties, and insolvency events. The Company was in compliance with the terms of the PPP loan as of September 30, 2020. At September 30, 2020, the note payable balance was $61,000, of which $2,000 were reflected as the current portion of note payable.
| (b) | On June 2, 2020, the Company obtained an Economic Injury Disaster Loan in the amount of $42,000, pursuant to the Small Business Administration (SBA) authorized (under Section 7(b)) of the Small Business Act, as amended. Interest on the loan is at the rate of 3.75% per year, and all loan payments are deferred for twelve months, at which time monthly installment payments are payable over 30 years from the date of the promissory note. The promissory note is secured by all the assets of the Company. The Company will use all the proceeds of this Loan solely as working capital to alleviate economic injury caused by COVID-19. At September 30, 2020, the balance on the loan was $42,000, of which $1,000 were reflected as the current portion of note payable. | |
| (c) | On October 22, 2019, the Company entered into a loan agreement with WebBank for the principal amount of $50,000 with interest at 9.2% per annum. The loan has a 12-month term and requires 52 weekly payments of principal and interest of $1,050. The loan is guaranteed by Laura Cohen, an officer of the Company. The balance owed was $42,000 on December 31, 2019. During the nine months ended September 30, 2020, the Company made principal payments of $31,000, leaving a total of $11,000 owed on the loan as of September 30, 2020. |
| 72 |
| 6. | Stockholders’ Equity |
Private Offerings
During the nine months ended September 30, 2020, the Company received aggregate proceeds of $293,000 from the issuance of 98,000 shares of common stock relating to a private stock offering.
During the nine months ended September 30, 2019, the Company received aggregate proceeds of $542,000 from the issuance of 180,667 shares of common stock relating to a private stock offering.
Stock Options
A summary of the stock options for the nine months ended September 30, 2020 is as follows:
| Weighted | ||||||||
| Number | Average | |||||||
| Of | Exercise | |||||||
| Options | Price | |||||||
| Balance outstanding, December 31, 2019 | 8,450,000 | $ | 0.74 | |||||
| Options granted | - | - | ||||||
| Options exercised | (2,800,000 | ) | 0.001 | |||||
| Options expired or forfeited | - | - | ||||||
| Balance outstanding, September 30, 2020 | 5,650,000 | $ | 1.11 | |||||
| Balance exercisable, September 30, 2020 | 5,650,000 | $ | 1.11 | |||||
Information relating to outstanding stock options at September 30, 2020, summarized by exercise price, is as follows:
| Outstanding | Exercisable | |||||||||||||||||||
| Weighted | Weighted | |||||||||||||||||||
| Average | Average | |||||||||||||||||||
Exercise Price Per Share | Shares | Life (Years) | Exercise Price | Shares | Exercise Price | |||||||||||||||
| $1.000 | 4,860,000 | 9.19 | $ | 1.00 | 4,860,000 | $ | 1.00 | |||||||||||||
| $1.800 | 790,000 | 12.60 | $ | 1.80 | 790,000 | $ | 1.80 | |||||||||||||
| 5,650,000 | 9.66 | $ | 1.11 | 5,650,000 | $ | 1.11 | ||||||||||||||
As of September 30, 2020, the Company had no outstanding unvested options with future compensation costs. As of September 30, 2020, and December 31, 2019, both the outstanding options and exercisable options had an intrinsic value of $10,668,000 and $19,065,200.
| 7. | Related Party |
During the nine months ended September 30, 2020 and 2019, sales to Advanced Dermatology Care Center, a dermatology practice owned by Dr. Laura Cohen, the Company’s Chief Executive Officer, accounted for 17% and 6% of the Company’s revenue, respectively.
| 8. | Subsequent Events |
The Company has evaluated subsequent events occurring from October 1, 2020, through February 11, 2021, the date the financial statements were issued.
Subsequent to September 30, 2020, the Company received aggregate proceeds of $750,000 from the sale of 250,000 shares of common stock at $3.00 per share.
On February 1, 2021, the Company received notice it was granted a loan (the “PPP loan”) from Cross River Bank in the aggregate amount of $49,000 pursuant to the Paycheck Protection Program (the “PPP”) under the CARES Act. The PPP loan agreement matures in five years, bears interest at a rate of 1% per annum, is unsecured and guaranteed by the U.S. Small Business Administration (SBA).
| 73 |
To the Stockholders and Board of Directors
CoLabs Int’l, Corp.
Huntington Beach, California
Opinion on the Financial Statements
We have audited the accompanying balance sheets of CoLabs Int’l, Corp. (the “Company”) as of December 31, 2019 and 2018, the related statements of operations, changes in stockholders’ equity, and cash flows for the years then ended and the related notes (collectively referred to as the “financial statements”). In our opinion, the financial statements present fairly, in all material respects, the financial position of the Company as of December 31, 2019 and 2018, and the results of its operations and its cash flows for the years then ended in conformity with accounting principles generally accepted in the United States of America.
Going Concern
The accompanying financial statements have been prepared assuming that the Company will continue as a going concern. As discussed in Note 1, the Company experienced a net loss and utilized cash from operations during the year ended December 31, 2019. These matters raise substantial doubt about the Company’s ability to continue as a going concern. Management’s plans in regard to these matters are also described in Note 1 to the financial statements. These financial statements do not include any adjustments that might result from the outcome of this uncertainty.
Basis for Opinion
These financial statements are the responsibility of the Company’s management. Our responsibility is to express an opinion on the Company’s financial statements based on our audits. We are a public accounting firm registered with the Public Accounting Oversight Board (United States) (“PCAOB”) and are required to be independent with respect to the Company in accordance with the U.S. federal securities laws and the applicable rules and regulations of the Securities and Exchange Commission and the PCAOB.
We conducted our audits in accordance with the standards of the PCAOB. Those standards require that we plan and perform the audits to obtain reasonable assurance about whether the financial statements are free of material misstatement, whether due to error or fraud. The Company is not required to have, nor were we engaged to perform, an audit of its internal control over financial reporting. As part of our audits we are required to obtain an understanding of internal control over financial reporting but not for the purpose of expressing an opinion on the effectiveness of the Company’s internal control over financial reporting. Accordingly, we express no such opinion.
Our audits included performing procedures to assess the risks of material misstatement, whether due to error, fraud, and performing procedures that respond to those risks. Such procedures included examining, on a test basis, evidence regarding the amounts and disclosures in the financial statements. Our audits also included evaluating the accounting principles used and significant estimates made by management, as well as evaluating the overall presentation of the financial statements. We believe that our audits provide a reasonable basis for our opinion.
/s/ Weinberg & Company, P.A.
Weinberg & Company, P.A.
Los Angeles, California
March 25, 2020
We have served as the Company’s auditor since 2019
| 74 |
BALANCE SHEETS
| December 31, 2019 | December 31, 2018 | |||||||
| Assets | ||||||||
| Current assets: | ||||||||
| Cash | $ | 347,056 | $ | 9,292 | ||||
| Accounts Receivable | 3,409 | 3,908 | ||||||
| Total current assets | 350,465 | 13,200 | ||||||
| Property and equipment, net | 1,463 | 3,168 | ||||||
| Right of use asset | 42,099 | - | ||||||
| Other assets: | ||||||||
| Other assets | 2,250 | 2,250 | ||||||
| Total assets | $ | 396,277 | $ | 18,618 | ||||
| Liabilities and Stockholders’ Equity | ||||||||
| Current liabilities: | ||||||||
| Accounts payable and accrued expenses | $ | 57,132 | $ | 16,822 | ||||
| Lease liability, current portion | 23,639 | - | ||||||
| Note payable | 41,960 | - | ||||||
| Total current liabilities | 122,731 | 16,822 | ||||||
| Lease liability | 21,137 | - | ||||||
| Total liabilities | 143,868 | 16,822 | ||||||
| Commitments and contingencies | ||||||||
| Stockholders’ equity: | ||||||||
| Common stock, $.001 par value; 15,000,000 shares authorized; 12,652,000 and 12,305,000 shares issued and outstanding at December 31, 2019 and 2018, respectively | 12,652 | 12,305 | ||||||
| Additional paid-in capital | 9,730,714 | 8,690,161 | ||||||
| Accumulated deficit | (9,490,957 | ) | (8,700,670 | ) | ||||
| Total stockholders’ equity | 252,409 | 1,796 | ||||||
| Total liabilities and stockholders’ equity | $ | 396,277 | $ | 18,618 | ||||
See accompanying notes to the financial statements.
| 75 |
STATEMENTS OF OPERATIONS
YEARS ENDED DECEMBER 31, 2019 AND 2018
| Years Ended December 31, | ||||||||
| 2019 | 2018 | |||||||
| Revenue (1) | $ | 176,472 | $ | 163,163 | ||||
| Cost of revenue | 89,497 | 119,641 | ||||||
| Gross profit | 86,975 | 43,522 | ||||||
| Operating expenses: | ||||||||
| Selling, general and administrative expenses (including stock-based compensation cost of $0 and $1,172,577, respectively) | 721,970 | 1,769,782 | ||||||
| Research and development | 152,577 | 88,055 | ||||||
| Total operating expenses | 874,547 | 1,857,837 | ||||||
| Operating loss | (787,572 | ) | (1,814,315 | ) | ||||
| Interest expense | (2,715 | ) | - | |||||
| Net loss | $ | (790,287 | ) | $ | (1,814,315 | ) | ||
| Net loss per common share – basic and diluted | $ | (0.06 | ) | $ | (0.15 | ) | ||
| Weighted average common shares outstanding – basic and diluted | 12,437,507 | 12,358,370 | ||||||
| (1) Sales to related party | $ | 15,355 | $ | 20,926 | ||||
See accompanying notes to the financial statements.
| 76 |
STATEMENTS OF CHANGES IN STOCKHOLDERS’ EQUITY
YEARS ENDED DECEMBER 31, 2019 AND 2018
| Common stock | Additional Paid In | Accumulated | Total Stockholders’ | |||||||||||||||||
| Shares | Amount | Capital | Deficit | Equity | ||||||||||||||||
| Balance, December 31, 2017 | 12,000,000 | $ | 12,000 | $ | 6,972,809 | $ | (6,886,355 | ) | $ | 98,454 | ||||||||||
| Common shares issued for cash | 305,000 | 305 | 544,775 | - | 545,080 | |||||||||||||||
| Stock-based compensation | - | - | 1,172,577 | - | 1,172,577 | |||||||||||||||
| Net loss | - | - | - | (1,814,315 | ) | (1,814,315 | ) | |||||||||||||
| Balance, December 31, 2018 | 12,305,000 | 12,305 | 8,690,161 | (8,700,670 | ) | 1,796 | ||||||||||||||
| Common shares issued for cash | 347,000 | 347 | 1,040,553 | 1,040,900 | ||||||||||||||||
| Net loss | (790,287 | ) | (790,287 | ) | ||||||||||||||||
| Balance, December 31, 2019 | 12,652,000 | $ | 12,652 | $ | 9,730,714 | $ | (9,490,957 | ) | $ | 252,409 | ||||||||||
See accompanying notes to the financial statements.
| 77 |
STATEMENTS OF CASH FLOWS
YEARS ENDED DECEMBER 31, 2019 AND 2018
| Years Ended December 31, | ||||||||
| 2019 | 2018 | |||||||
| Cash flows from operating activities: | ||||||||
| Net loss | $ | (790,287 | ) | $ | (1,814,315 | ) | ||
| Adjustments to reconcile net loss to cash used in operating activities: | ||||||||
| Depreciation | 1,705 | 2,190 | ||||||
| Amortization of right of use asset | 21,651 | - | ||||||
| Change in lease liability | (21,774 | ) | ||||||
| Stock-based compensation | - | 1,172,577 | ||||||
| Change in operating assets and liabilities: | ||||||||
| Accounts receivable | 499 | (1,031 | ) | |||||
| Accounts payable and accrued expenses | 43,110 | 3,916 | ||||||
| Net cash used in operating activities | (745,096 | ) | (636,663 | ) | ||||
| Cash flows from financing activities: | ||||||||
| Proceeds from the sale of common shares | 1,040,900 | 545,080 | ||||||
| Proceeds from line of credit | 26,873 | - | ||||||
| Repayment of line of credit | (26,873 | ) | - | |||||
| Proceeds from note payable | 50,000 | - | ||||||
| Repayment of note payable | (8,040 | ) | - | |||||
| Net cash provided by financing activities | 1,082,860 | 545,080 | ||||||
| Net increase (decrease) | 337,764 | (91,583 | ) | |||||
| Balance at the beginning of the period | 9,292 | 100,875 | ||||||
| Balance at the end of the period | $ | 347,056 | $ | 9,292 | ||||
| Supplemental disclosures of cash flow information: | ||||||||
| Cash paid for: | ||||||||
| Income taxes | $ | - | $ | - | ||||
| Interest | $ | 2,715 | $ | - | ||||
| Non-Cash Operating Activities: | ||||||||
| Recording of right of use asset and lease liability upon adoption of new accounting rule | $ | 66,550 | $ | - | ||||
| Reclass of deferred rent to right of use asset | $ | 2,800 | $ | - | ||||
See accompanying notes to the financial statements.
| 78 |
NOTES TO FINANCIAL STATEMENTS
YEARS ENDED DECEMBER 31, 2019 AND 2018
| 3. | Organization and Basis of Presentation |
CoLabs Int’l, Corp. (the “Company”) was incorporated in Nevada in 2008 and is a closely-held, majority woman-owned biotechnology company. The Company’s corporate administrative office and warehouse facility are located in Huntington Beach, California.
The Company was founded upon its acquired and internally developed intellectual property on its belief that its intellectual property provides a commercial advantage in the global marketplace. The Company relies on patent, trade secret, copyright, and trademark law, as well as the Company’s contractual terms with its customers, to define, maintain and enforce the Company’s intellectual property rights technologies and relationships.
The Company currently has a portfolio of twenty U.S. and one foreign patent, and an additional six U.S. and four foreign pending patent applications. A significant amount of the Company’s intellectual property takes the form of trade secrets and copyrighted works of authorship. The Company currently has a portfolio of registered and pending trademarks in the United States and foreign jurisdictions, including registrations for the marks “Quantasphere®,” “QS®,” “KLĒNSKIN®,” “WASH ON®,” and “SHOWER ON®.”
The Company’s patented Quantasphere® technology is a globally unique, widely adaptable delivery system providing improved effectiveness and consumer acceptance for a multitude of drugs, cosmetics, and chemical applications. The Company’s technology places drugs into micro-sized encapsulates, that has an electrostatic charge and suspend them in unique formulations, limiting the unwanted absorption. This one-of-a-kind unique delivery system significantly decreases the absorption of potentially dangerous chemicals into the body and organ systems, thereby avoiding potential toxic side-effects. This technology is also able to target the depth of penetration and the degree of dispersion or timed release of the active ingredients into the skin or onto the surface of the skin.
The Company is presently selling sunscreen products, utilizing its patented Quantasphere® technology, to the consumer market under the KLĒNSKIN® brand name, with plans to expand its product lines to multiple additional markets, including repellants, dermatology, cosmetics, fragrances, and other therapeutic applications.
Going Concern
The Company’s financial statements have been prepared assuming that it will continue as a going concern, which contemplates continuity of operations, the realization of assets, and liquidation of liabilities in the normal course of business. As reflected in the financial statements, the Company incurred a net loss of $790,287, and used net cash in operating activities of $745,096, during the year then ended. These factors raise substantial doubt about the Company’s ability to continue as a going concern within one year after the date that the financial statements are issued. The financial statements do not include any adjustments related to the recoverability and classification of recorded asset amounts or the amounts and classification of liabilities that might be necessary should the Company be unable to continue as a going concern.
Management estimates that the current funds on hand will be sufficient to continue operations through September 30, 2020. The ability of the Company to continue as a going concern is dependent on the Company’s ability to execute its strategy and in its ability to raise additional funds. Management is currently seeking additional funds, primarily through the issuance of equity securities for cash to operate its business. No assurance can be given that any future financing will be available or, if available, that it will be on terms that are satisfactory to the Company. Even if the Company can obtain additional financing, it may contain undue restrictions on our operations, in the case of debt financing or cause substantial dilution for our stockholders, in case of equity financing.
| 79 |
| 4. | Summary of Significant Accounting Policies |
Revenue Recognition
The Company products are sold under the brand name KLĒNSKIN®, which consists of distinct sunscreen products titled SPF 30 Shampoo, Face and Body Wash, SunBar SPF 20 Bar Soap, and our Broad Spectrum SPF 50 Lotion. The products are offered for sale as finished goods only, and there are no performance obligations required post-shipment for customers to derive the expected value from them. Contracts with customers contain no incentives or discounts that could cause revenue to be allocated or adjusted over time. The Company does offer a general right of return, but historically the return rates have been insignificant.
The Company recognizes revenue in accordance with Accounting Standard Update (“ASU”) No. 2014-09. This standard provides authoritative guidance clarifying the principles for recognizing revenue and developing a common revenue standard for U.S. generally accepted accounting principles. The core principle of the guidance is that an entity should recognize revenue to depict the transfer of promised goods and services to customers in an amount that reflects the consideration to which the entity expects to be entitled in the exchange for those goods or services.
Under this guidance, revenue is recognized when control of promised goods or services is transferred to the Company’s customers, in an amount that reflects the consideration the Company expects to be entitled to in exchange for those goods or services. The Company reviews its sales transactions to identify contractual rights, performance obligations, and transaction prices, including the allocation of prices to separate performance obligations, if applicable. Revenue and costs of sales are recognized once products are delivered to the customer’s control and performance obligations are satisfied.
Revenue Concentrations
The Company performs a regular review of customer activity and associated credit risks and does not require collateral or other arrangements. During the year ended December 31, 2019, one customer accounted for 11% of the Company’s revenue, and one international customer accounted for 57% of the Company’s revenue. Shipments to customers outside the United States comprised 57% of revenues. During the year ended December 31, 2018, one customer accounted for 13% of the Company’s revenue, and one international customer accounted for 68% of the Company’s revenue. Shipments to customers outside the United States comprised 68% of our revenues. No other customers accounted for more than 10% of revenues during the years ended December 31, 2019 and 2018.
Property and Equipment
Property and equipment are stated at cost less accumulated depreciation. Depreciation is recorded at the time property and equipment are placed in service using the straight-line method over the estimated useful lives of the related assets, which range from five to seven years.
Management regularly reviews property, equipment, and other long-lived assets for possible impairment. This review occurs annually or more frequently if events or changes in circumstances indicate the carrying amount of the asset may not be recoverable. Based upon management’s annual assessment, there were no indicators of impairment of the Company’s property and equipment and other long-lived assets as of December 31, 2019 or December 31, 2018.
Stock-Based Compensation
The Company periodically issues stock options to employees. The Company accounts for stock options issued and vesting to employees based on the authoritative guidance provided by Accounting Standards Codification (“ASC”) Topic 718 – Stock Compensation, whereas the value of the award is measured on the date of grant and recognized over the vesting period.
| 80 |
The fair value of the Company’s common stock option grants is estimated using the Black-Scholes option-pricing model, which uses certain assumptions related to risk-free interest rates, expected volatility, expected life of the common stock options, and future dividends. Compensation expense is recorded based upon the value derived from the Black-Scholes option pricing model and based on actual experience. The assumptions used in the Black-Scholes option-pricing model could materially affect compensation expense recorded in future periods.
Fair Value Measurements
The Company uses various inputs in determining the fair value of its investments and measures these assets on a recurring basis. Financial assets recorded at fair value in the consolidated balance sheets are categorized by the level of objectivity associated with the inputs used to measure their fair value. Authoritative guidance provided by ASC Topic 820 - Fair Value Measurements and Disclosure defines the following levels directly related to the amount of subjectivity associated with the inputs to fair valuation of these financial assets:
Level 1—Quoted prices in active markets for identical assets or liabilities.
Level 2—Inputs, other than the quoted prices in active markets, that are observable either directly or indirectly; and
Level 3—Unobservable inputs based on the Company’s assumptions.
The Company is required to use observable market data if such data is available without undue cost and effort. At December 31, 2019 and 2018, the carrying amounts of financial assets and liabilities, such as cash, accounts receivable, other assets, and accounts payable and accrued expenses approximate their fair values due to their short-term nature. The carrying values of notes payable approximate their fair values due to the fact that the interest rates on these obligations are based on prevailing market interest rates.
Leases
Prior to January 1, 2019, the Company accounted for leases under ASC 840, Accounting for Leases. Effective January 1, 2019, the Company adopted the guidance of ASC 842, Leases (“ASC 842”), which requires an entity to recognize a right of use (ROU) asset and a lease liability for virtually all leases. The Company adopted ASC 842 using a modified retrospective approach. As a result, the comparative financial information has not been updated and the required disclosures prior to the date of adoption have not been updated and continue to be reported under the accounting standards in effect for those periods. The adoption of ASC 842 on January 1, 2019 resulted in the recognition of operating lease ROU assets and lease liabilities for operating leases of $66,550. There was no cumulative-effect adjustment to accumulated deficit.
Basic and Diluted Net Loss per Common Share
Basic net loss per share is computed by using the weighted-average number of common shares outstanding during the period. Diluted net loss per share is computed giving effect to all dilutive potential shares of Common Stock that were outstanding during the period. Dilutive potential shares of Common Stock consist of incremental shares of Common Stock issuable upon exercise of stock options. No dilutive potential shares of Common Stock were included in the computation of diluted net loss per share because their impact was anti-dilutive. As of December 31, 2019, and 2018, the Company had total outstanding options of 8,450,000 and 8,450,000, respectively, which were excluded from the computation of net loss per share because they are anti-dilutive.
Use of Estimates
The preparation of financial statements in conformity with accounting principles generally accepted in the United States of America requires management to make estimates and assumptions that may affect the reported amounts of assets and liabilities and disclosure of contingent assets and liabilities at the date of the financial statements and reported amounts of revenues and expenses during the reporting period. Those estimates and assumptions include estimates for reserves of uncollectible accounts, analysis of impairments of long-lived assets, accruals for potential liabilities, assumptions made in valuing stock instruments issued for services, and valuation of deferred tax assets. Actual results could differ from those estimates.
| 81 |
Research and Development
Research and development costs are expensed as incurred. Research and development expenses for the years ended December 31, 2019 and 2018, were $152,577 and $88,055, respectively.
Advertising Costs
Advertising costs are charged to operations as part of selling, general and administrative expenses at the time the costs are incurred. Advertising costs for the years ended December 31, 2019 and 2018, were $2,557 and $4,674, respectively.
Concentration of Credit Risk
The Company maintains the majority of its cash balances with one financial institution, in the form of demand deposits. At December 31, 2019, the Company had cash deposits that exceeded the federally insured limit of $250,000. The Company believes that no significant concentration of credit risk exists with respect to these cash balances because of its assessment of the creditworthiness and financial viability of the financial institution.
Recent Accounting Pronouncements
In June 2016, the FASB issued ASU No. 2016-13, Credit Losses - Measurement of Credit Losses on Financial Instruments (“ASC 326”). The standard significantly changes how entities will measure credit losses for most financial assets, including accounts and notes receivables. The standard will replace today’s “incurred loss” approach with an “expected loss” model, under which companies will recognize allowances based on expected rather than incurred losses. Entities will apply the standard’s provisions as a cumulative-effect adjustment to retained earnings as of the beginning of the first reporting period in which the guidance is effective. As a small business filer, the standard will be effective for us for interim and annual reporting periods beginning after December 15, 2022. The management is currently assessing the impact of adopting this standard on the Company’s financial statements and related disclosures.
Other recent accounting pronouncements issued by the FASB, including its Emerging Issues Task Force, the American Institute of Certified Public Accountants, and the Securities and Exchange Commission did not or are not believed by management to have a material impact on the Company’s present or future consolidated financial statements.
| 9. | Property and Equipment |
The table below displays the Company’s property and equipment balances as of December 31, 2019 and 2018, respectively.
| December 31, 2019 | December 31, 2018 | |||||||
| Furniture and fixtures | $ | 3,924 | $ | 3,924 | ||||
| Computer equipment | 6,284 | 6,284 | ||||||
| Office equipment | 4,560 | 4,560 | ||||||
| 14,768 | 14,768 | |||||||
| Less accumulated depreciation | (13,305 | ) | (11,600 | ) | ||||
| Total property and equipment, net | $ | 1,463 | $ | 3,168 | ||||
Depreciation expense was $1,705 and $2,190 for the years ended December 31, 2019 and 2018, respectively.
| 82 |
| 10. | Lease Payable |
The Company leases its corporate administrative office and warehouse facility located in Huntington Beach, California, with a remaining lease term of 1.8 years as of December 31, 2019. The Company also leases office space in Sarasota, Florida, for its research and development activities on a month-to-month basis. Leases with an initial term of 12 months or less are not recorded on the balance sheet. The Company accounts for the lease and non-lease components of its leases as a single lease component. Rent expense is recognized on a straight-line basis over the lease term.
Operating lease ROU assets and liabilities are recognized at commencement date based on the present value of lease payments over the lease term. ROU assets represent our right to use an underlying asset for the lease term and lease liabilities represent our obligation to make lease payments arising from the lease. Generally, the implicit rate of interest in lease arrangements is not readily determinable and the Company utilizes its incremental borrowing rate in determining the present value of lease payments. Since the Company’s leases do not provide an implicit rate, management estimated their incremental borrowing rates used in its present value calculation, which required subjectivity. The incremental borrowing rate is the rate of interest that a lessee would have to pay to borrow on a collateralized basis over a similar term an amount equal to the lease payments in a similar economic environment. The operating lease ROU asset includes any lease payments made and excludes lease incentives.
The components of rent expense and supplemental cash flow information related to leases for the period are as follows:
Year ended December 31, 2019 | ||||
| Lease Cost | ||||
| Operating lease cost (included in general and administration expenses in the statements of operations) | $ | 21,651 | ||
| Other Information | ||||
| Cash paid for amounts included in the measurement of lease liabilities for the year ended December 31, 2019 | $ | - | ||
| Weighted average remaining lease term – operating leases (in years) | 1.8 | |||
| Average discount rate – operating leases | 4.0 | % | ||
The supplemental balance sheet information related to leases for the period is as follows:
| At December 31, 2019 | ||||
| Operating leases | ||||
| ROU assets, net of amortization of $21,651 | $ | 42,099 | ||
| Current operating lease liabilities | $ | 23,639 | ||
| Long-term operating lease liabilities | 21,137 | |||
| Total operating lease liabilities | $ | 44,776 | ||
Maturities of the Company’s lease liabilities are as follows:
| Year Ending | Operating Leases | |||
| 2020 | $ | 25,003 | ||
| 2021 | 21,527 | |||
| Total lease payments | 46,530 | |||
| Less: Imputed interest/present value discount | (1,754 | ) | ||
| Present value of lease liabilities | $ | 44,776 | ||
Rent expense for the twelve months ended December 31, 2019 and 2018 was $41,989 and $37,646, respectively.
| 83 |
| 11. | Line of Credit |
In April 2019, the Company entered into a revolving credit agreement with Fundbox. The line of credit carries an interest rate of approximately 10% per annum and is secured by the assets of the Company. During the 12 months ended December 31, 2019, the Company borrowed $26,873, which was repaid in full, leaving no balance outstanding as of December 31, 2019.
| 12. | Note Payable |
On October 22, 2019, the Company entered into a loan agreement with WebBank for the principal amount of $50,000 with interest at 9.2% per annum. The loan has a 12-month term and requires 52 weekly payments of principal and interest of $1,050. The loan is guaranteed by Laura Cohen, an officer of the Company. During the 12 months ended December 31, 2019, the Company made principal payments of $8,040, leaving a total of $41,960 owed on the loan as of December 31, 2019.
| 13. | Stockholders’ Equity |
Private Offerings
During the years ended December 31, 2019 and 2018, the Company received aggregate proceeds of $1,040,900 and $545,080 from the issuance of 347,000 and 305,000 shares of common stock relating to two separate private stock offerings, respectively.
Stock Options
A summary of the stock options for the years ended December 31, 2019 and 2018, is as follows:
| Weighted | ||||||||
| Number | Average | |||||||
| Of | Exercise | |||||||
| Options | Price | |||||||
| Balance outstanding, December 31, 2017 | 7,660,000 | $ | 0.63 | |||||
| Options granted | 790,000 | 1.80 | ||||||
| Options exercised | - | - | ||||||
| Options expired or forfeited | - | - | ||||||
| Balance outstanding, December 31, 2018 | 8,450,000 | 0.74 | ||||||
| Options granted | - | - | ||||||
| Options exercised | - | - | ||||||
| Options expired or forfeited | - | - | ||||||
| Balance outstanding, December 31, 2019 | 8,450,000 | $ | 0.74 | |||||
| Balance exercisable, December 31, 2019 | 8,450,000 | $ | 0.74 | |||||
| 84 |
Information relating to outstanding stock options at December 31, 2019, summarized by exercise price, is as follows:
| Outstanding | Exercisable | |||||||||||||||||||
| Weighted | Weighted | |||||||||||||||||||
| Average | Average | |||||||||||||||||||
Exercise Price Per Share | Shares | Life (Years) | Exercise Price | Shares | Exercise Price | |||||||||||||||
| $0.001 | 2,800,000 | 5.50 | $ | 0.001 | 2,800,000 | $ | 0.001 | |||||||||||||
| $1.000 | 4,860,000 | 10.19 | $ | 1.00 | 4,860,000 | $ | 1.00 | |||||||||||||
| $1.800 | 790,000 | 13.61 | $ | 1.80 | 790,000 | $ | 1.80 | |||||||||||||
| 8,450,000 | 8.96 | $ | 0.74 | 8,450,000 | $ | 0.74 | ||||||||||||||
During the year ended December 31, 2018, the Board of Directors granted to each of the Company’s Chief Executive Officer, and Chief Operating Officer, 350,000 stock options, or collectively, 700,000 stock options. The stock options were granted with terms of a 15-year life, immediate vesting on the grant date, and both the issuance price and the market price was determined to be the share price offered in the private placement memorandum in effect at the date of the stock option grant. The stock options were valued at $1,046,274 on the date of grant using a Black-Scholes pricing model during the year ended December 31, 2018. No stock options were granted during the year ended December 31, 2019.
Effective September 1, 2017, the Company entered into an Employment Agreement with Daniel Traynor, as the Company’s product development chemist and formulator. The Company agreed to grant Mr. Traynor 600,000 stock options with terms of a 10-year life, immediate vesting on the grant date, and both the issuance price and the market price was determined to be the share price offered in the private placement memorandum in effect at the date of the stock option grant. Under the Employment Agreement, additional stock options may be granted annually, up to maximum fair market value, as determined by the Company, of 50% of Mr. Traynor’s gross annual salary for the calendar year. On September 1, 2018, the Board of Directors granted Mr. Traynor an additional 60,000 stock options under the same terms as above. The stock options were valued at $81,462 on the date of grant using a Black-Scholes pricing model during the year ended December 31, 2018. No stock options were granted during the year ended December 31, 2019.
On December 31, 2018 and 2017, the Board of Directors authorized the issuance of 10,000 and 20,000 stock options per year, respectively, to each of its three non-executive directors. The stock options were granted with terms of a 15-year life, immediate vesting on the grant date, and both the issuance price and the market price was determined to be the share price offered in the private placement memorandum in effect at the date of the stock option grant. During the year ended December 31, 2018, aggregate stock options of 30,000 were issued to non-executive directors. The stock options were valued at $44,841 on the date of grant using a Black-Scholes pricing model during the year ended December 31, 2018.
The fair value of each option on the date of grant was estimated using the Black-Scholes option-pricing model with the following weighted-average assumptions. No stock options were granted during the year ended December 31, 2019.
| 2018 | ||||
| Exercise Price | $ | 1.80 | ||
| Stock Price | $ | 1.80 | ||
| Risk-free interest rate | 2.60 | % | ||
| Expected volatility | 100.00 | % | ||
| Expected life (in years) | 6.85 | |||
| Expected dividend yield | 0.00 | % | ||
The Company recorded compensation expense, relating to the vesting of these options, pursuant to authoritative guidance provided by ASC Topic 718 – Stock Compensation for the years ended December 31, 2019 and 2018, of $0 and $1,172,577, respectively. As of December 31, 2019, the Company had no outstanding unvested options with future compensation costs. As of December 31, 2019 and 2018, both the outstanding options and exercisable options had an intrinsic value of $19,065,200 and $8,925,200.
| 85 |
| 14. | Income Taxes |
Reconciliation between the expected federal income tax rate and the actual tax rate is as follows:
| Year Ended December 31, | ||||||||
| 2019 | 2018 | |||||||
| Federal statutory tax rate | 21 | % | 21 | % | ||||
| State tax, net of federal benefit | 7 | % | 7 | % | ||||
| Total tax rate | 28 | % | 28 | % | ||||
| Allowance | (28 | )% | (28 | )% | ||||
| Effective tax rate | - | % | - | % | ||||
The following is a summary of the deferred tax assets:
| Year Ended December 31, | ||||||||
| 2019 | 2018 | |||||||
| Net operating loss carryforwards | $ | 1,263,000 | $ | 1,141,000 | ||||
| Valuation allowance | (1,263,000 | ) | (1,141,000 | ) | ||||
| Net deferred tax asset | $ | - | $ | - | ||||
The Company has no tax provision for any period presented due to its history of operating losses. As of December 31, 2019, the Company had net operating loss carryforwards of approximately $4,500,000 that may be available to reduce future years’ taxable income through 2039. Future tax benefits which may arise as a result of these losses have not been recognized in these financial statements, as management has determined that their realization is not likely to occur and accordingly, the Company has recorded a valuation allowance for the full value of the deferred tax asset relating to these tax loss carry-forwards.
The Company adopted accounting rules which address the determination of whether tax benefits claimed or expected to be claimed on a tax return should be recorded in the financial statements. Under these rules, the Company may recognize the tax benefit from an uncertain tax position only if it is more likely than not that the tax position will be sustained on examination by the taxing authorities, based on the technical merits of the position. The tax benefits recognized in the financial statements from such a position are measured based on the largest benefit that has a greater than fifty percent likelihood of being realized upon ultimate settlement. These accounting rules also provide guidance on de-recognition, classification, interest, and penalties on income taxes, accounting in interim periods and requires increased disclosures. As of December 31, 2019, no liability for unrecognized tax benefits was required to be recorded.
| 15. | Related Party |
During the year ended December 31, 2019 and 2018, sales to Advanced Dermatology Care Center, a dermatology practice owned by Dr. Laura Cohen, the Company’s Chief Executive Officer, accounted for 9% and 13% of Company’s revenue, respectively.
| 16. | Subsequent Events |
The Company has evaluated subsequent events occurring from January 1, 2020, through March 25, 2020, the date the financial statements were issued.
Subsequent to December 31, 2019, the Company received aggregate proceeds of $225,000 on the sale of 75,000 shares of common stock at $3.00 per share.
| 86 |
Pursuant to the requirements of Regulation A, the issuer certifies that it has reasonable grounds to believe that it meets all of the requirements for filing on Form 1-A and has duly caused this draft Offering Statement to be signed on its behalf by the undersigned, thereunto duly authorized, in the City of Huntington Beach, State of California, on February [ ], 2021.
| CoLabs Int’l, Corp. | ||
| a Nevada corporation | ||
| By: | Laura Cohen | |
| Its: | Chief Executive Officer | |
KNOW ALL PERSONS BY THESE PRESENTS, that each person whose signature appears below constitutes and appoints Laura Cohen as his or her true and lawful attorney-in-fact and agent, with full power of substitution and resubstitution, for him or her and in his or her name, place and stead, in any and all capacities, to sign any and all amendments (including all pre-qualification and post-qualification amendments) to this Form 1-A offering statement and to file the same, with all exhibits thereto and other documents in connection therewith, with the Securities and Exchange Commission, granting unto said attorney-in-fact and agent full power and authority to do and perform each and every act and thing requisite and necessary to be done in connection therewith, as fully to all intents and purposes as he might or could do in person, hereby ratifying and confirming all that each of said attorney-in-fact and agent or his substitutes or substitute, may lawfully do or cause to be done by virtue hereof.
Pursuant to the requirements of Regulation A, this Form 1-A has been signed by the following persons in the capacities indicated on February [ ], 2021.
| By: | Laura Cohen | |
| Its: | Chief Executive Officer and President (Principal Executive Officer) | |
| By: | Gerald Birch | |
| Its: | Chief Financial Officer (Principal Financial Officer and Principal Accounting Officer) | |
| By: | Lisa LeBlanc | |
| Its: | Director | |
| By: | Dean Stathakis | |
| Its: | Director | |
| By: | Peter Barton-Hutt | |
| Its: | Director | |
| By: | Charles Fritts | |
| Its: | Director |
| 87 |
| Exhibit No. | Description | |
| 2.1 | Articles of Incorporation of the Company, dated August 5, 2008 | |
| 2.2 | Amended Articles of Incorporation, dated April 27, 2012 | |
| 2.3 | Amended Articles of Incorporated, dated January 12, 2021 | |
| 2.4 | Amended and Restated Bylaws of the Company | |
| 4.1 | Form of Subscription Agreement | |
| 10.1 | Power of Attorney | |
| 11.1 | Consent of Independent Auditors | |
| 12.1 | Opinion of FitzGerald Yap Kreditor LLP* |
*To be filed by amendment.
| 88 |