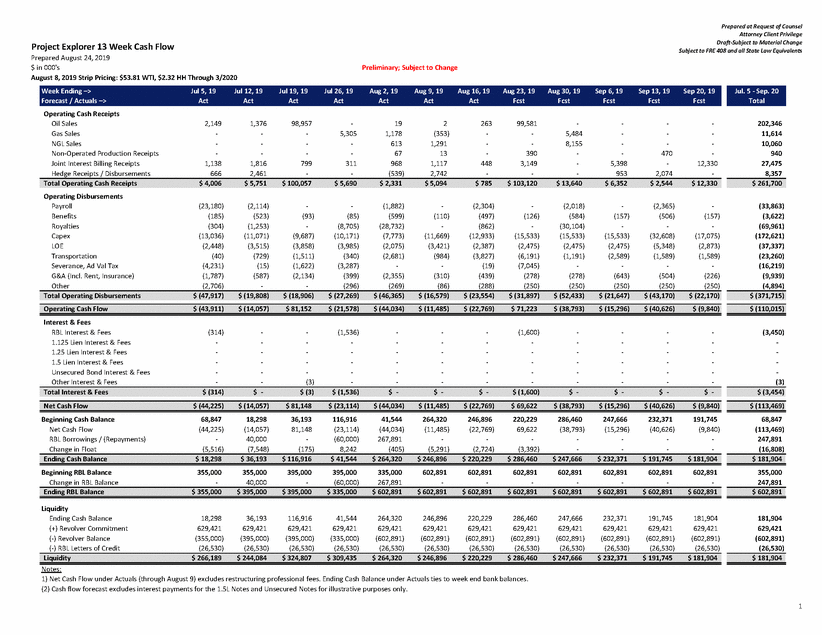
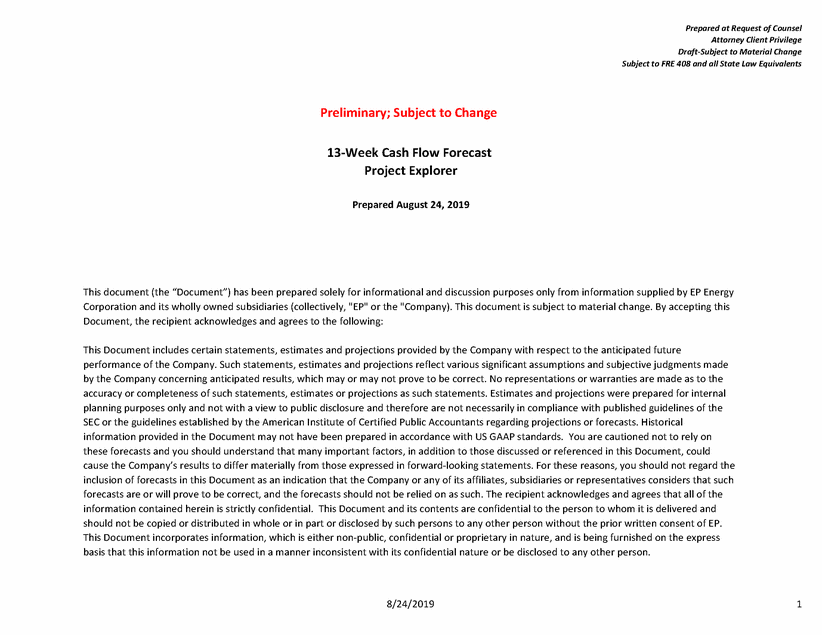
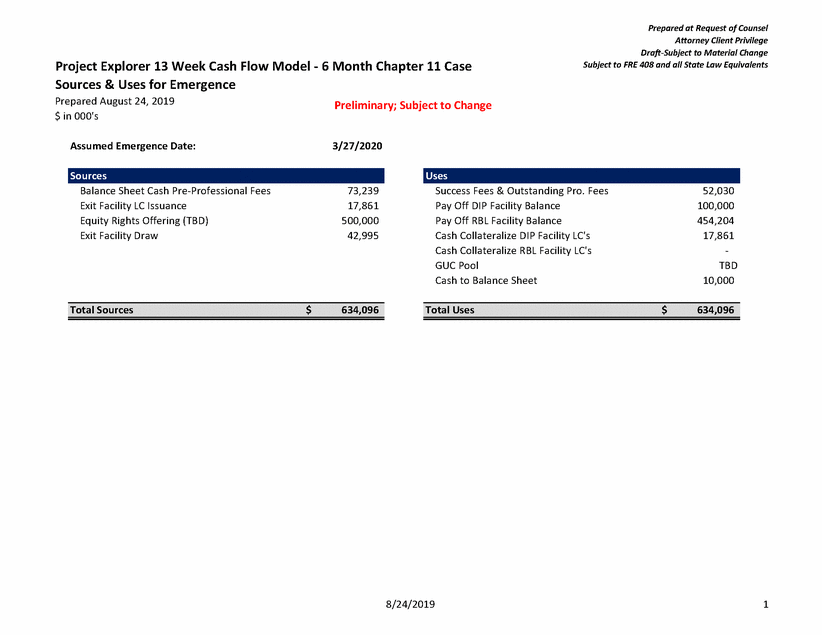
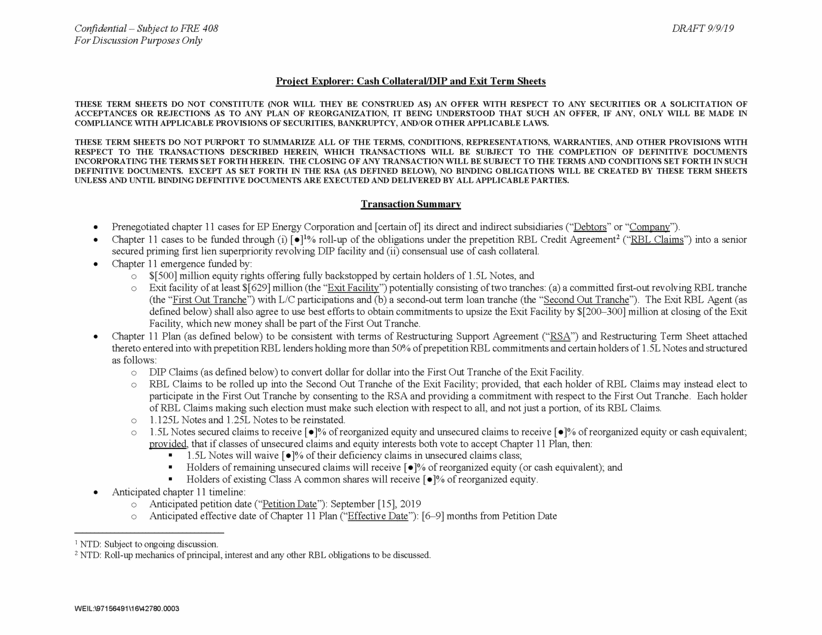
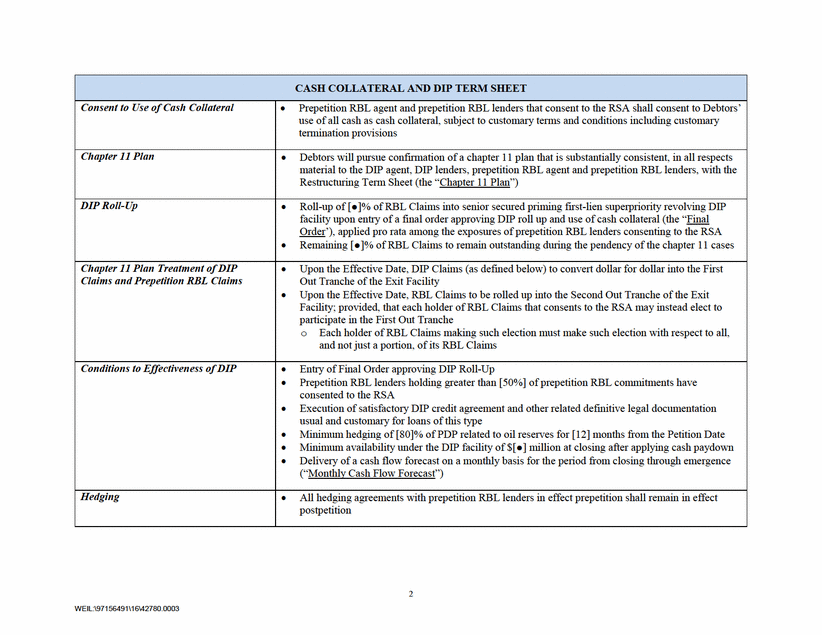
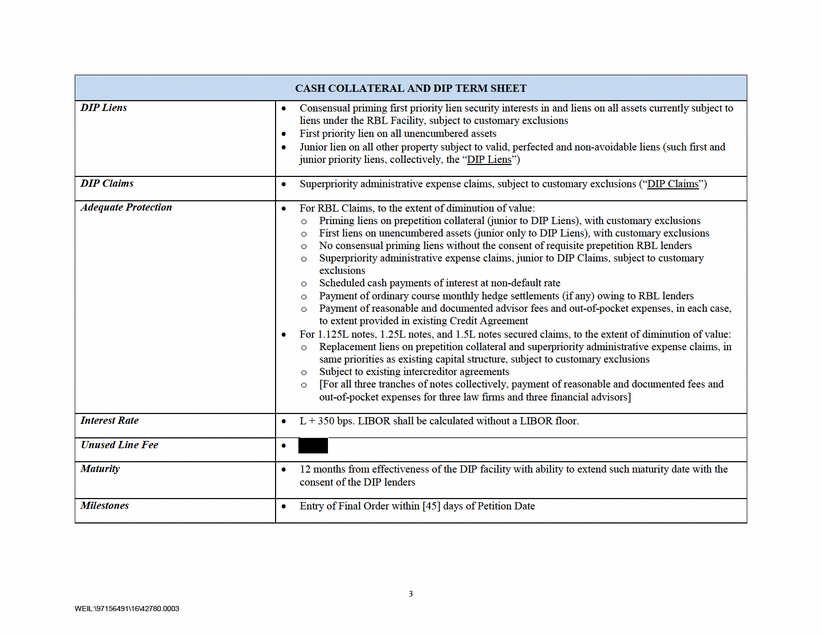
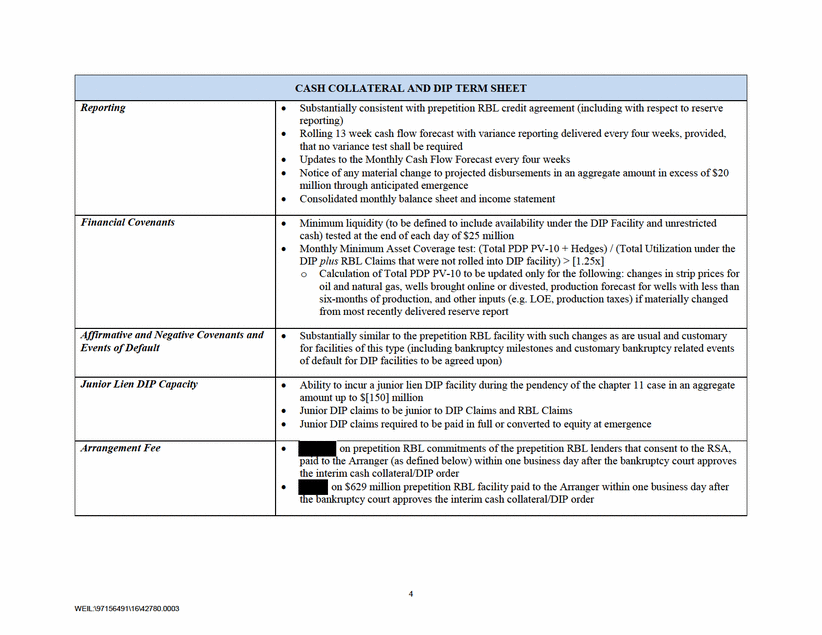
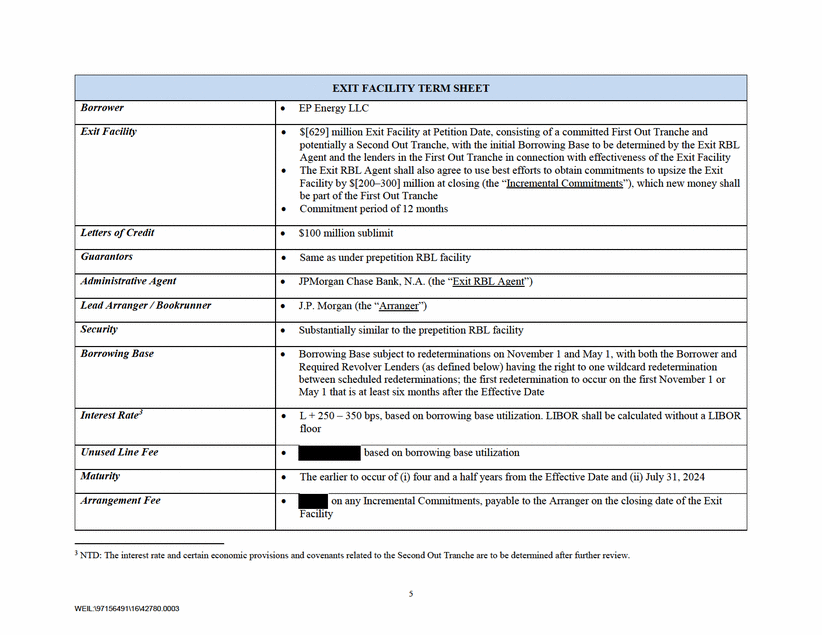
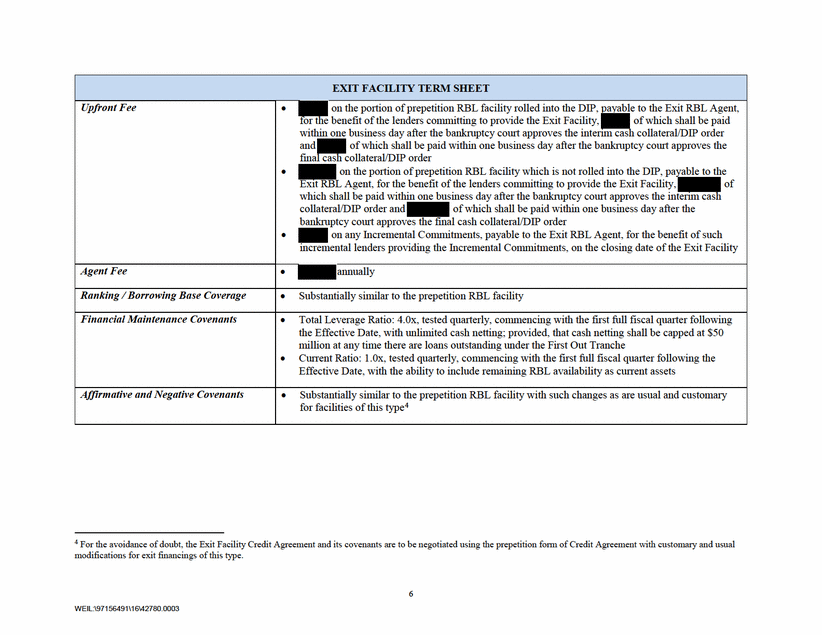
Prepared at Request of Counsel Attorney Client Privilege Draft-Subject to Material Change Subject to FRE 408 and all State Law Equivalents Project Explorer 13 Week Cash Flow Prepared August 24, 2019 $ in 000's August 8, 2019 Strip Pricing: $53.81 WTI, $2.32 HH Through 3/2020 Preliminary; Subject to Change Operating Cash Receipts Oil Sales Gas Sales NGL Sales Non-Operated Production Receipts Joint Interest Billing Receipts Hedge Receipts / Disbursements 2,149 - - - 1,138 666 1,376 - - - 1,816 2,461 98,957 - - - 799 - - 5,305 - - 311 - 19 1,178 613 67 968 (539) 2 (353) 1,291 13 1,117 2,742 263 - - - 448 - 99,581 - - 390 3,149 - - 5,484 8,155 - - - - - - - 5,398 953 - - - 470 - 2,074 - - - - 12,330 - 202,346 11,614 10,060 940 27,475 8,357 Operating Disbursements Payroll Benefits Royalties Capex LOE Transportation Severance, Ad Val Tax G&A (Incl. Rent, Insurance) Other (23,180) (185) (304) (13,036) (2,448) (40) (4,231) (1,787) (2,706) (2,114) (523) (1,253) (11,071) (3,515) (729) (15) (587) - - (93) - (9,687) (3,858) (1,511) (1,622) (2,134) - - (85) (8,705) (10,171) (3,985) (340) (3,287) (399) (296) (1,882) (599) (28,732) (7,773) (2,075) (2,681) - (2,355) (269) - (110) - (11,669) (3,421) (984) - (310) (86) (2,304) (497) (862) (12,933) (2,387) (3,827) (19) (439) (288) - (126) - (15,533) (2,475) (6,191) (7,045) (278) (250) (2,018) (584) (30,104) (15,533) (2,475) (1,191) - (278) (250) - (157) - (15,533) (2,475) (2,589) - (643) (250) (2,365) (506) - (32,608) (5,348) (1,589) - (504) (250) - (157) - (17,075) (2,873) (1,589) - (226) (250) (33,863) (3,622) (69,961) (172,621) (37,337) (23,260) (16,219) (9,939) (4,894) Interest & Fees RBL Interest & Fees 1.125 Lien Interest & Fees 1.25 Lien Interest & Fees 1.5 Lien Interest & Fees Unsecured Bond Interest & Fees Other Interest & Fees (314) - - - - - - - - - - - - - - - - (3) (1,536) - - - - - - - - - - - - - - - - - - - - - - - (1,600) - - - - - - - - - - - - - - - - - - - - - - - - - - - - - (3,450) - - - - (3) Beginning Cash Balance Net Cash Flow RBL Borrowings / (Repayments) Change in Float 68,847 (44,225) - (5,516) 18,298 (14,057) 40,000 (7,548) 36,193 81,148 - (175) 116,916 (23,114) (60,000) 8,242 41,544 (44,034) 267,891 (405) 264,320 (11,485) - (5,291) 246,896 (22,769) - (2,724) 220,229 69,622 - (3,392) 286,460 (38,793) - - 247,666 (15,296) - - 232,371 (40,626) - - 191,745 (9,840) - - 68,847 (113,469) 247,891 (16,808) Beginning RBL Balance Change in RBL Balance 355,000 - 355,000 40,000 395,000 - 395,000 (60,000) 335,000 267,891 602,891 - 602,891 - 602,891 - 602,891 - 602,891 - 602,891 - 602,891 - 355,000 247,891 Liquidity Ending Cash Balance (+) Revolver Commitment (-) Revolver Balance (-) RBL Letters of Credit 18,298 629,421 (355,000) (26,530) 36,193 629,421 (395,000) (26,530) 116,916 629,421 (395,000) (26,530) 41,544 629,421 (335,000) (26,530) 264,320 629,421 (602,891) (26,530) 246,896 629,421 (602,891) (26,530) 220,229 629,421 (602,891) (26,530) 286,460 629,421 (602,891) (26,530) 247,666 629,421 (602,891) (26,530) 232,371 629,421 (602,891) (26,530) 191,745 629,421 (602,891) (26,530) 181,904 629,421 (602,891) (26,530) 181,904 629,421 (602,891) (26,530) Notes: 1) Net Cash Flow under Actuals (through August 9) excludes restructuring professional fees. Ending Cash Balance under Actuals ties to week end bank balances. (2) Cash flow forecast excludes interest payments for the 1.5L Notes and Unsecured Notes for illustrative purposes only. 1 $ 181,904 Liquidity $ 266,189 $ 244,084 $ 324,807 $ 309,435 $ 264,320 $ 246,896 $ 220,229 $ 286,460 $ 247,666 $ 232,371 $ 191,745 $ 181,904 $ 602,891 Ending RBL Balance $ 355,000 $ 395,000 $ 395,000 $ 335,000 $ 602,891 $ 602,891 $ 602,891 $ 602,891 $ 602,891 $ 602,891 $ 602,891 $ 602,891 $ 181,904 Ending Cash Balance $ 18,298 $ 36,193 $ 116,916 $ 41,544 $ 264,320 $ 246,896 $ 220,229 $ 286,460 $ 247,666 $ 232,371 $ 191,745 $ 181,904 $ (113,469) Net Cash Flow $ (44,225) $ (14,057) $ 81,148 $ (23,114) $ (44,034) $ (11,485) $ (22,769) $ 69,622 $ (38,793) $ (15,296) $ (40,626) $ (9,840) $ (3,454) Total Interest & Fees $ (314) $ - $ (3) $ (1,536) $ - $ - $ - $ (1,600) $ - $ - $ - $ - $ (110,015) Operating Cash Flow $ (43,911) $ (14,057) $ 81,152 $ (21,578) $ (44,034) $ (11,485) $ (22,769) $ 71,223 $ (38,793) $ (15,296) $ (40,626) $ (9,840) $ (371,715) Total Operating Disbursements $ (47,917) $ (19,808) $ (18,906) $ (27,269) $ (46,365) $ (16,579) $ (23,554) $ (31,897) $ (52,433) $ (21,647) $ (43,170) $ (22,170) $ 261,700 Total Operating Cash Receipts $ 4,006 $ 5,751 $ 100,057 $ 5,690 $ 2,331 $ 5,094 $ 785 $ 103,120 $ 13,640 $ 6,352 $ 2,544 $ 12,330 Jul. 5 - Sep. 20 Total Week Ending –> Jul 5, 19 Jul 12, 19 Jul 19, 19 Jul 26, 19 Aug 2, 19 Aug 9, 19 Aug 16, 19 Aug 23, 19 Aug 30, 19 Sep 6, 19 Sep 13, 19 Sep 20, 19 Forecast / Actuals –> Act Act Act Act Act Act Act Fcst Fcst Fcst Fcst Fcst
