McGraw-Hill Global Education Intermediate Inactive
Filed: 21 May 14, 12:00am
Exhibit 99.1
|
Exhibit 99.1
McGraw-Hill Global Education Holdings
First Quarter
2014 Investor Update
May 21, 2014
final
|
Important Notice
All statements in this presentation and the oral remarks made in connection herewith that are not statements of historical fact are “forward-looking statements” within the meaning of securities laws.
Forward-looking statements include any statements regarding our strategy, future operations, future financial position, future revenue, projected costs, prospects, plans, and objectives of management. The words ‘‘anticipate,’’ ‘‘believe,’’ ‘‘estimate,’’ ‘‘expect,’’ ‘‘intend,’’ ‘‘may,’’ ‘‘plan,’’ ‘‘predict,’’ ‘‘project,’’ ‘‘target,’’ ‘‘potential,’’ ‘‘will,’’ ‘‘would,’’ ‘‘could,’’ ‘‘should,’’ ‘‘continue,’’ and similar expressions commonly indicate a forward-looking statement, although not all forward-looking statements may contain these words.
You should not put undue reliance on forward-looking statements. All forward-looking statements are subject to certain risks and uncertainties, and actual results or events could differ materially from the plans, intentions and expectations described therein. We undertake no obligation to revise forward-looking statements to reflect events or circumstances that arise after the statements are made.
2
|
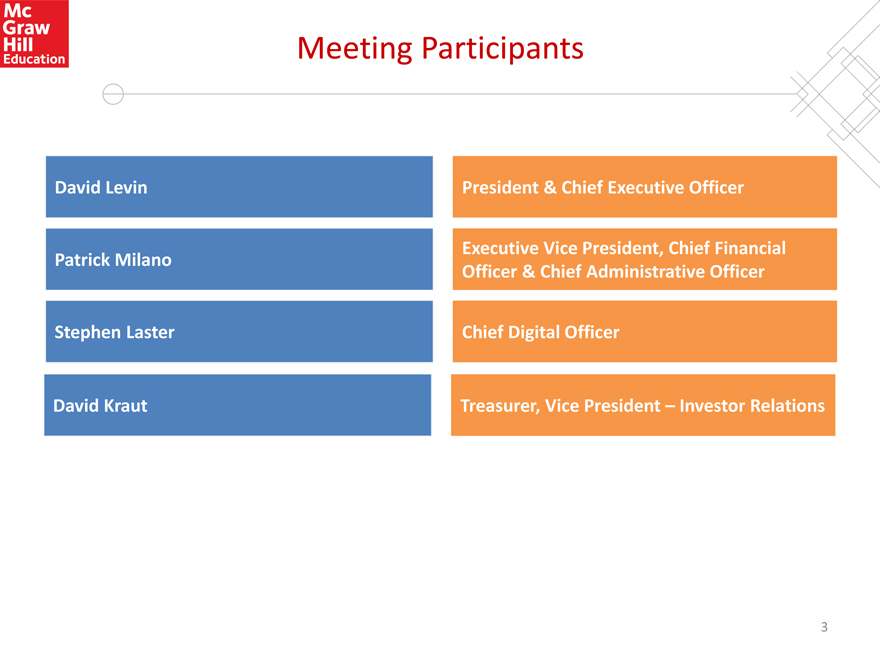
Meeting Participants
David Levin President & Chief Executive Officer
Executive Vice President, Chief Financial
Patrick Milano
Officer & Chief Administrative Officer
Stephen Laster Chief Digital Officer
David Kraut Treasurer, Vice President – Investor Relations
3
|
Agenda
1 Introduction and Business Review David Levin
2 Digital Learning Ecosystem Stephen Laster
3 Financial Update Patrick Milano
4 Conclusion and Q&A David Levin and Patrick Milano
4
|
Introduction and Business Review
5
|
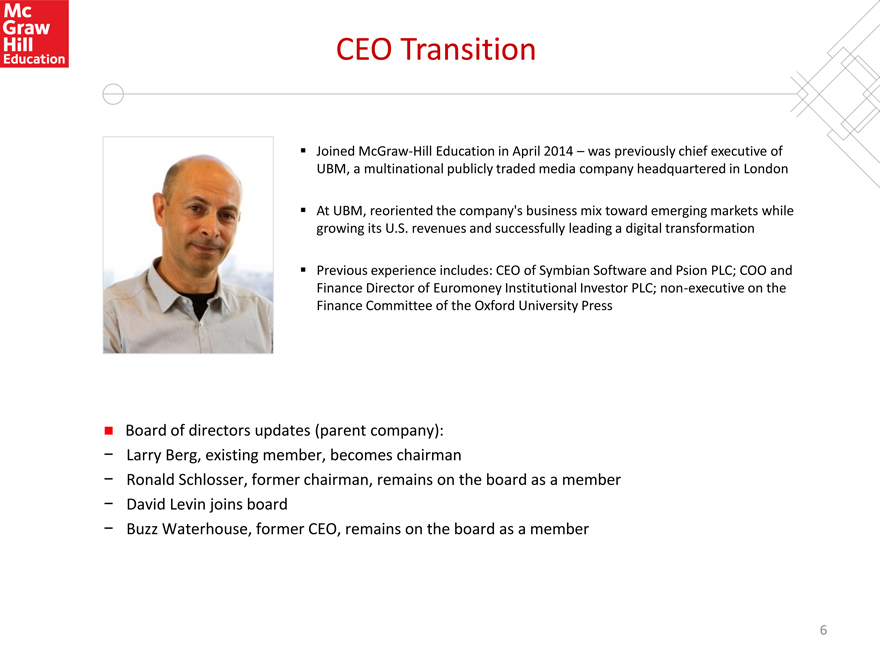
CEO Transition
• Joined McGraw-Hill Education in April 2014 – was previously chief executive of UBM, a multinational publicly traded media company headquartered in London
• At UBM, reoriented the company’s business mix toward emerging markets while growing its U.S. revenues and successfully leading a digital transformation
• Previous experience includes: CEO of Symbian Software and Psion PLC; COO and Finance Director of Euromoney Institutional Investor PLC; non-executive on the Finance Committee of the Oxford University Press
Board of directors updates (parent company):
- Larry Berg, existing member, becomes chairman
- Ronald Schlosser, former chairman, remains on the board as a member
- David Levin joins board
- Buzz Waterhouse, former CEO, remains on the board as a member
6
|
Company Highlights
• First quarter financial results in line with expectations
• Continued strong unique user growth across our digital platforms
• Completed MHGE term loan refinancing with rate reduction of 325 bps
• Announced plan to acquire McGraw-Hill Ryerson remaining minority shares
• Announced and closed Area9 acquisition
• International team completed restructuring; positioning to grow revenues
• Signed outsourcing agreement to support North American warehousing operations
• Increased investment in McGraw-Hill Education Digital Learning Ecosystem to support digital leadership and future top-line growth, largely funded by cost-savings
• Firmed up approximately $55 million of run rate cost savings to date since inception
7
|
Three Strategic Imperatives
8
|
Reimagine Learning: Progress Report
Debuted a new user interface for Smart Book™, the first adaptive reading experience for higher education
Released ClinicalAccess™, an online decision support tool designed to help physicians find answers to clinical questions at the point of care
Introduced Connect Insight™, a first-of-its-kind data analytics and visualization tool for higher education
Connect unique users were up 23% YoY and LearnSmart increased 37%
Inkling licensed as authoring toolset
ALEKS is the only truly adaptive learning solution in Math and provides a competitive advantage when combined with our math programs
9
|
Global Growth: Progress Report
• Multi-year international restructuring positions business to drive future profitable growth
• Finalized workforce reduction of 15% in more than 30 countries
• New program management office established to coordinate execution of growth initiatives
• Leadership upgrades completed, including global Chief Product Officer and Chief Marketing Officer and managing directors for EMEA and India
• Acquisition of McGraw-Hill Ryerson remaining minority interest to be completed in Q2
10
|
Excellence: Progress Report
• Since inception, firmed up approximately $55 million of run rate cost savings
• Outsourcing agreement for North American warehousing operations adds greater distribution flexibility and drives company towards a more variable cost structure
• Recent new hires include senior vice president of Strategy & Business Development (former partner at Bain & Company)
11
|
Recent Corporate Development Activities
Completed several important transactions to solidify portfolio
ALEKS and Area9 (LearnSmart) proven performers – eliminated license fees and brought highly capable tech talent to company
Secure full control of two important businesses through minority interest buyout – Tata McGraw-Hill (2013) and McGraw-Hill Ryerson (pending – 2014)
12
|
McGraw-Hill Education Digital Learning Ecosystem
13
|
Reimagine Learning
Developed a framework called The McGraw-Hill Education Digital Learning Ecosystem for our digital development and market offerings
Go to market in an easy to use, integrated, open, extensible, data-driven and data-aware platform
Own the platform technologies that touch both the educator and learner and create sustainable value
Shift content and course development from book-centric to digital first and modular
Enable personalized learning via adaptive and data-aware/data-generating learning interactions
Compete on the basis of outcomes and ease of use
License and implement enabling technology for enhanced MHE web footprint and commerce capabilities
14
|
Reimagine Learning Selected Progress
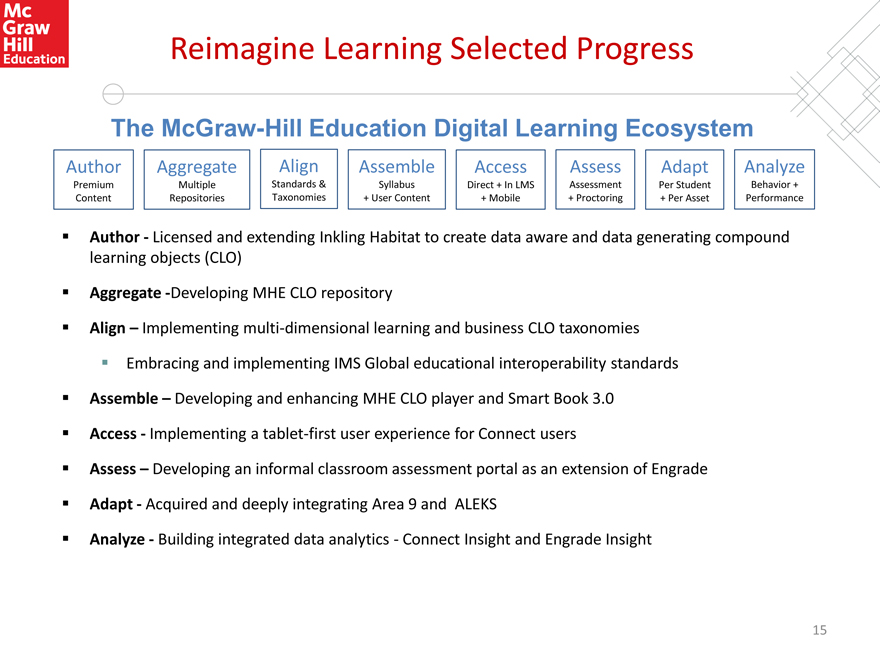
The McGraw-Hill Education Digital Learning Ecosystem
Author Aggregate Align Assemble Access Assess Adapt Analyze
Premium Multiple Standards & Syllabus Direct + In LMS Assessment Per Student Behavior + Content Repositories Taxonomies + User Content + Mobile + Proctoring + Per Asset Performance
Author - Licensed and extending Inkling Habitat to create data aware and data generating compound learning objects (CLO)
Aggregate -Developing MHE CLO repository
Align – Implementing multi-dimensional learning and business CLO taxonomies Embracing and implementing IMS Global educational interoperability standards Assemble – Developing and enhancing MHE CLO player and Smart Book 3.0 Access - Implementing a tablet-first user experience for Connect users Assess – Developing an informal classroom assessment portal as an extension of Engrade Adapt - Acquired and deeply integrating Area 9 and ALEKS
Analyze - Building integrated data analytics - Connect Insight and Engrade Insight
15
|
Financial Update
16
|
Q1 Financial Performance Overview
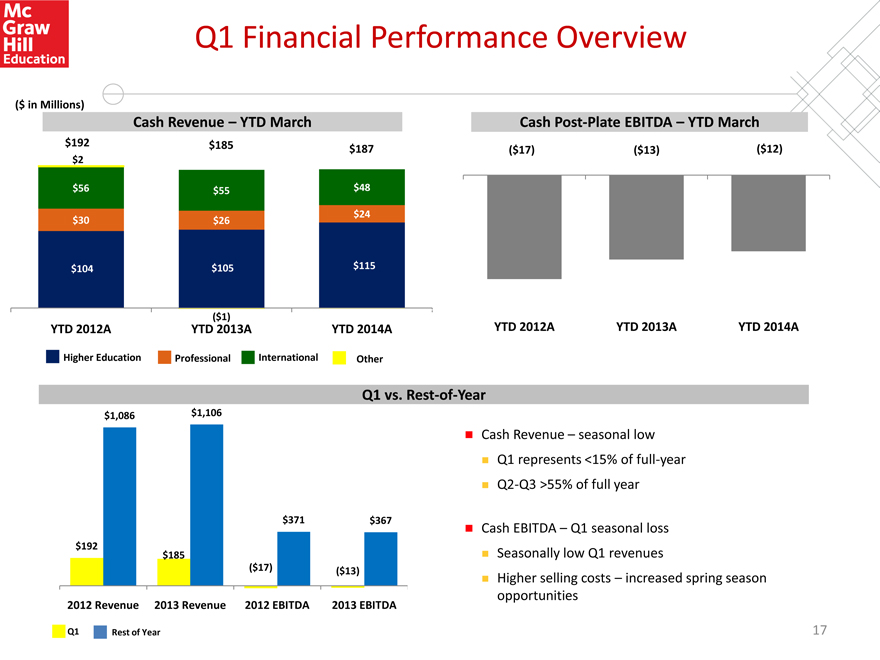
($ in Millions)
Cash Revenue – YTD March Cash Post-Plate EBITDA – YTD March
$192 $185 $187 ($17) ($13) ($12)
$2
$56 $55 $48
$24
$30 $26
$104 $105 $115
($1)
YTD 2012A YTD 2013A YTD 2014A YTD 2012A YTD 2013A YTD 2014A
Higher Education Professional International Other
Q1 vs. Rest-of-Year
$1,086 $1,106
$371 $367
$192 $185
($17) ($13)
2012 Revenue 2013 Revenue 2012 EBITDA 2013 EBITDA
Q1 Rest of Year
• Cash Revenue – seasonal low
• Q1 represents <15% of full-year
• Q2-Q3 >55% of full year
• Cash EBITDA – Q1 seasonal loss
• Seasonally low Q1 revenues
• Higher selling costs – increased spring season opportunities
17
|
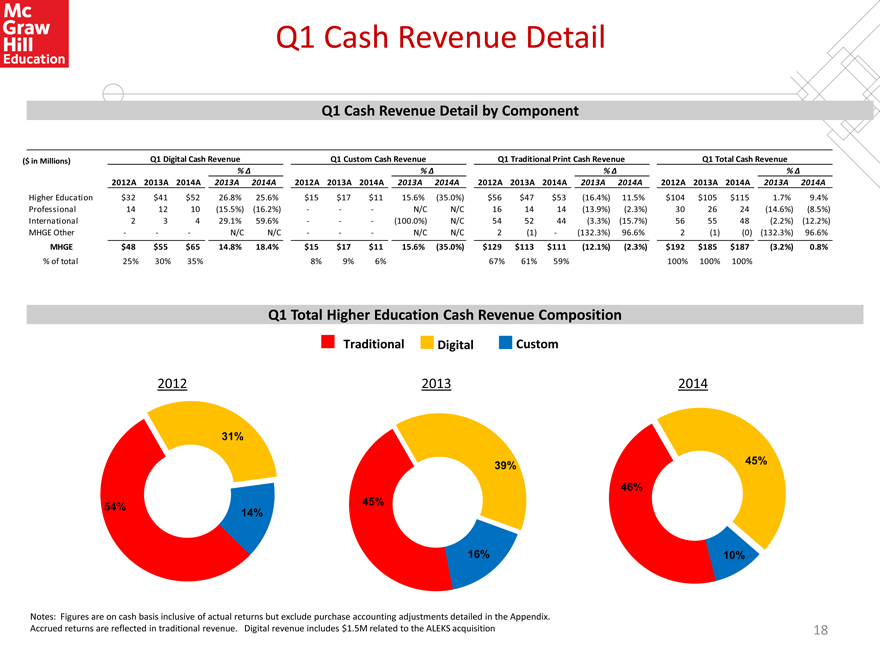
Q1 Cash Revenue Detail
Q1 Cash Revenue Detail by Component
($ in Millions) Q1 Digital Cash Revenue Q1 Custom Cash Revenue Q1 Traditional Print Cash Revenue Q1 Total Cash Revenue
% % % %
2012A 2013A 2014A 2013A 2014A 2012A 2013A 2014A 2013A 2014A 2012A 2013A 2014A 2013A 2014A 2012A 2013A 2014A 2013A 2014A
Higher Education $32 $41 $52 26.8% 25.6% $15 $17 $11 15.6% (35.0%) $56 $47 $53 (16.4%) 11.5% $104 $105 $115 1.7% 9.4% Professional 14 12 10 (15.5%) (16.2%) - - - N/C N/C 16 14 14 (13.9%) (2.3%) 30 26 24 (14.6%) (8.5%) International 2 3 4 29.1% 59.6% - - - (100.0%) N/C 54 52 44 (3.3%) (15.7%) 56 55 48 (2.2%) (12.2%) MHGE Other - - - N/C N/C - - - N/C N/C 2 (1) - (132.3%) 96.6% 2 (1) (0) (132.3%) 96.6%
MHGE $48 $55 $65 14.8% 18.4% $15 $17 $11 15.6% (35.0%) $129 $113 $111 (12.1%) (2.3%) $192 $185 $187 (3.2%) 0.8%
% of total 25% 30% 35% 8% 9% 6% 67% 61% 59% 100% 100% 100%
Q1 Total Higher Education Cash Revenue Composition
Traditional Digital Custom
2012
31%
54%
14%
2013
39%
45%
16%
2014
45%
46%
10%
Notes: Figures are on cash basis inclusive of actual returns but exclude purchase accounting adjustments detailed in the Appendix. Accrued returns are reflected in traditional revenue. Digital revenue includes $1.5M related to the ALEKS acquisition
18
|
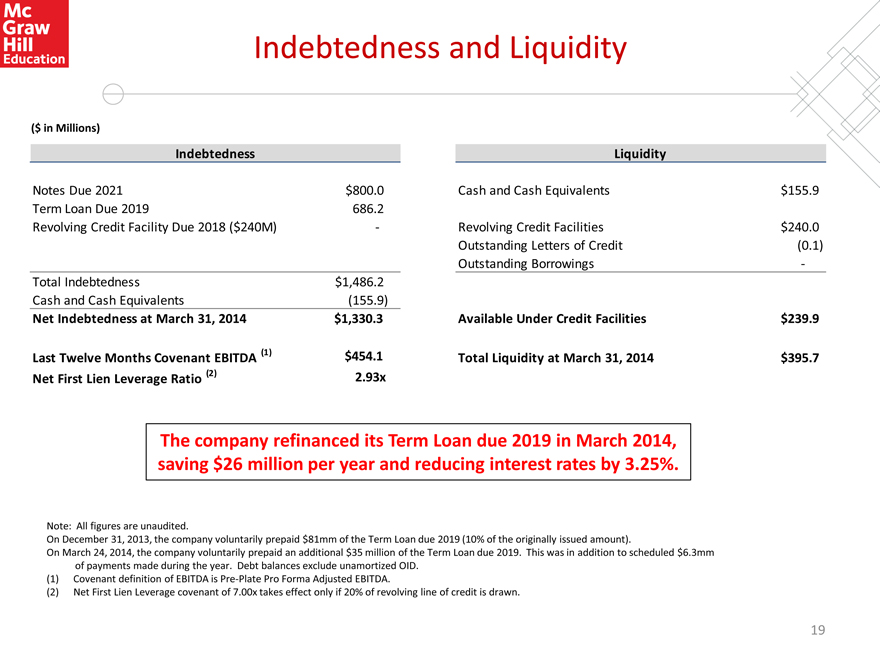
Indebtedness and Liquidity
($ in Millions)
Indebtedness
Notes Due 2021 $800.0 Term Loan Due 2019 686.2 Revolving Credit Facility Due 2018 ($240M) -
Total Indebtedness $1,486.2 Cash and Cash Equivalents (155.9)
Net Indebtedness at March 31, 2014 $1,330.3
(1) $454.1 Last Twelve Months Covenant EBITDA
(2) 2.93x Net First Lien Leverage Ratio
Liquidity
Cash and Cash Equivalents $155.9
Revolving Credit Facilities $240.0 Outstanding Letters of Credit (0.1) Outstanding Borrowings -
Available Under Credit Facilities $239.9
Total Liquidity at March 31, 2014 $395.7
The company refinanced its Term Loan due 2019 in March 2014, saving $26 million per year and reducing interest rates by 3.25%.
Note: All figures are unaudited.
On December 31, 2013, the company voluntarily prepaid $81mm of the Term Loan due 2019 (10% of the originally issued amount).
On March 24, 2014, the company voluntarily prepaid an additional $35 million of the Term Loan due 2019. This was in addition to scheduled $6.3mm of payments made during the year. Debt balances exclude unamortized OID.
(1) Covenant definition of EBITDA is Pre-Plate Pro Forma Adjusted EBITDA.
(2) Net First Lien Leverage covenant of 7.00x takes effect only if 20% of revolving line of credit is drawn.
19
|
Appendix: Financial Detail
20
|
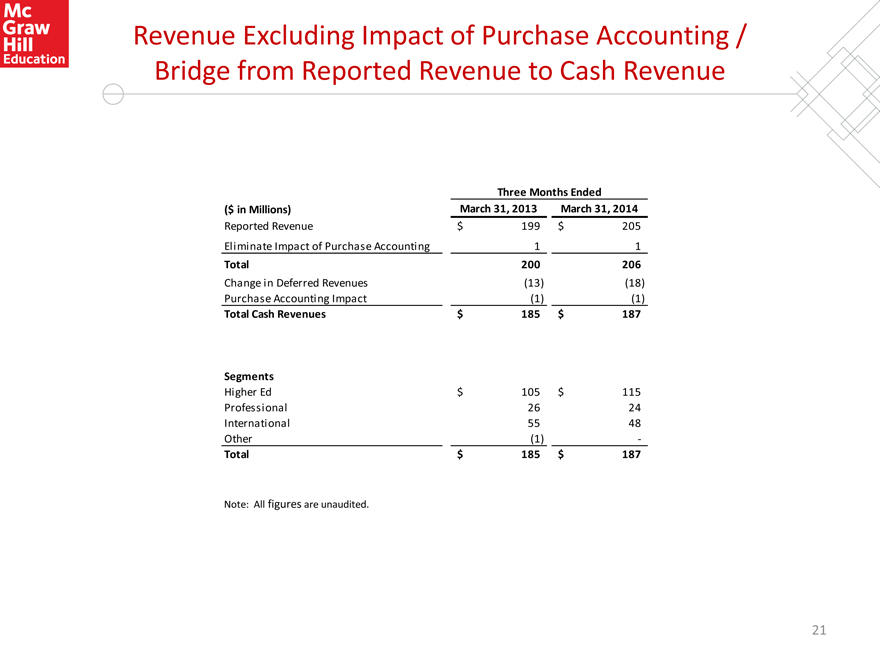
Revenue Excluding Impact of Purchase Accounting / Bridge from Reported Revenue to Cash Revenue
Three Months Ended ($ in Millions) March 31, 2013 March 31, 2014
Reported Revenue $ 199 $ 205
Eliminate Impact of Purchase Accounting 1 1
Total 200 206
Change in Deferred Revenues (13) (18) Purchase Accounting Impact (1) (1)
Total Cash Revenues $ 185 $ 187
Segments
Higher Ed $ 105 $ 115 Professional 26 24 International 55 48 Other (1) -
Total $ 185 $ 187
Note: All figures are unaudited.
21
|
EBITDA and Adjusted EBITDA
EBITDA, a measure used by management to assess operating performance, is defined as income from continuing operations plus interest, income taxes, depreciation and amortization, including amortization of plate investment.
Adjusted EBITDA is defined as EBITDA adjusted to exclude unusual items and other adjustments required or permitted in calculating covenant compliance under the indenture governing our senior secured notes and/or our new senior secured credit facilities. Post-Plate Adjusted EBITDA reflects the impact of cash spent for plate investment. Plate investment costs, which include both the cost of developing education content and testing, scoring and assessment solution products, are capitalized and amortized. These costs are capitalized when the title is expected to generate probable future economic benefits and are amortized upon publication of the title over its estimated useful life of up to six years. Post-Plate Pro Forma Adjusted EBITDA further adjusts the Post-Plate Adjusted EBITDA to reflect the impact of cost savings initiatives.
Each of the above described EBITDA-based measures is not a recognized term under U.S. GAAP and does not purport to be an alternative to income from continuing operations as a measure of operating performance or to cash flows from operations as a measure of liquidity. Additionally, each such measure is not intended to be a measure of free cash flows available for management’s discretionary use, as it does not consider certain cash requirements such as interest payments, tax payments and debt service requirements. Such measures have limitations as analytical tools, and you should not consider any of such measures in isolation or as substitutes for our results as reported under U.S. GAAP. Management compensates for the limitations of using non-GAAP financial measures by using them to supplement U.S. GAAP results to provide a more complete understanding of the factors and trends affecting the business than U.S. GAAP results alone. Because not all companies use identical calculations, these EBITDA-based measures may not be comparable to other similarly titled measures of other companies.
All figures are unaudited.
22
|
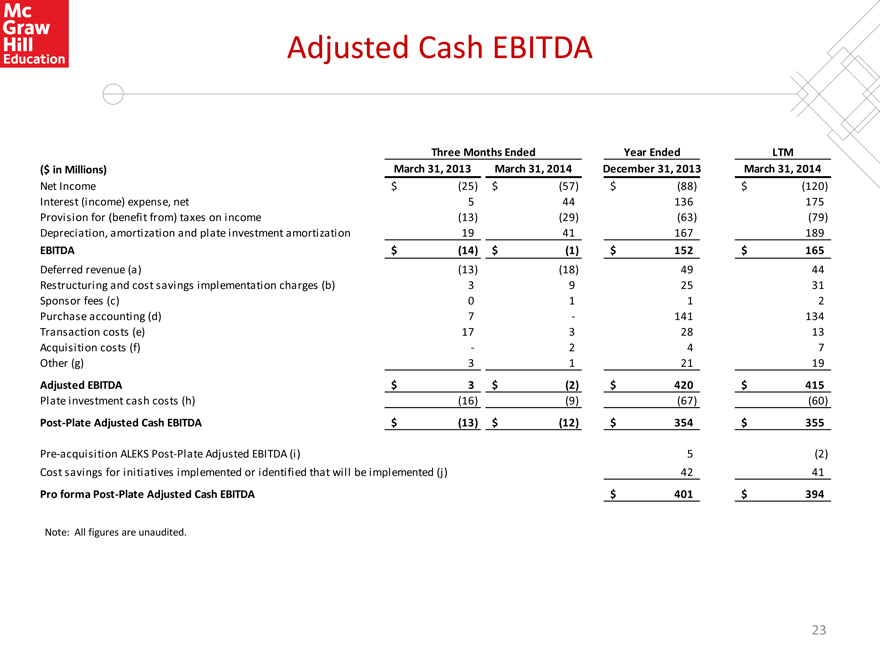
Adjusted Cash EBITDA
Three Months Ended Year Ended LTM ($ in Millions) March 31, 2013 March 31, 2014 December 31, 2013 March 31, 2014
Net Income $ (25) $ (57) $ (88) $ (120) Interest (income) expense, net 5 44 136 175 Provision for (benefit from) taxes on income (13) (29) (63) (79) Depreciation, amortization and plate investment amortization 19 41 167 189
EBITDA $ (14) $ (1) $ 152 $ 165
Deferred revenue (a) (13) (18) 49 44 Restructuring and cost savings implementation charges (b) 3 9 25 31 Sponsor fees (c) 0 1 1 2 Purchase accounting (d) 7 - 141 134 Transaction costs (e) 17 3 28 13 Acquisition costs (f) - 2 4 7 Other (g) 3 1 21 19
Adjusted EBITDA $ 3 $ (2) $ 420 $ 415
Plate investment cash costs (h) (16) (9) (67) (60)
Post-Plate Adjusted Cash EBITDA $ (13) $ (12) $ 354 $ 355
Pre-acquisition ALEKS Post-Plate Adjusted EBITDA (i) 5 (2) Cost savings for initiatives implemented or identified that will be implemented (j) 42 41
Pro forma Post-Plate Adjusted Cash EBITDA $ 401 $ 394
Note: All figures are unaudited.
23
|
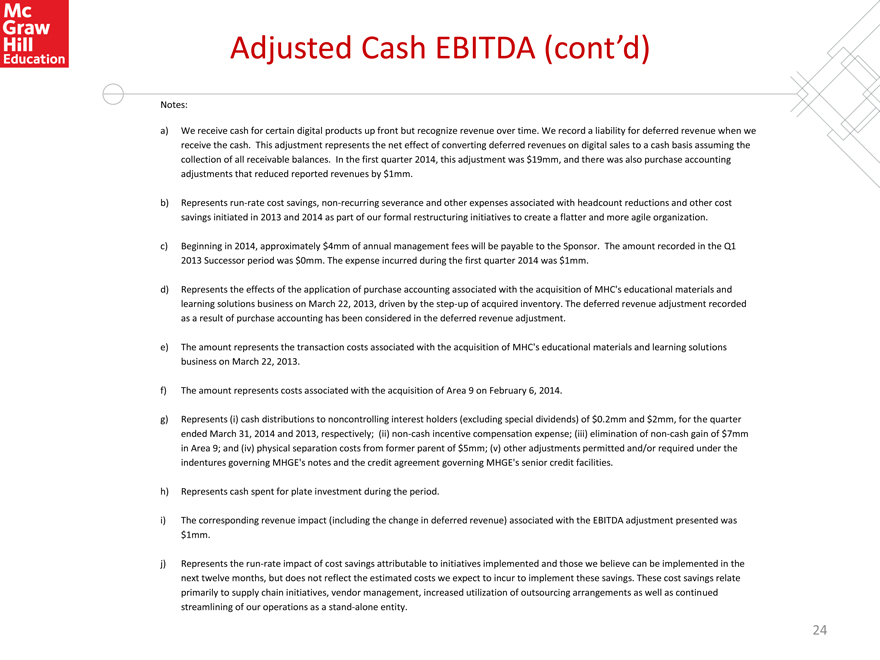
Adjusted Cash EBITDA (cont’d)
Notes:
a) We receive cash for certain digital products up front but recognize revenue over time. We record a liability for deferred revenue when we receive the cash. This adjustment represents the net effect of converting deferred revenues on digital sales to a cash basis assuming the collection of all receivable balances. In the first quarter 2014, this adjustment was $19mm, and there was also purchase accounting adjustments that reduced reported revenues by $1mm.
b) Represents run-rate cost savings, non-recurring severance and other expenses associated with headcount reductions and other cost savings initiated in 2013 and 2014 as part of our formal restructuring initiatives to create a flatter and more agile organization.
c) Beginning in 2014, approximately $4mm of annual management fees will be payable to the Sponsor. The amount recorded in the Q1 2013 Successor period was $0mm. The expense incurred during the first quarter 2014 was $1mm.
d) Represents the effects of the application of purchase accounting associated with the acquisition of MHC’s educational materials and learning solutions business on March 22, 2013, driven by the step-up of acquired inventory. The deferred revenue adjustment recorded as a result of purchase accounting has been considered in the deferred revenue adjustment.
e) The amount represents the transaction costs associated with the acquisition of MHC’s educational materials and learning solutions business on March 22, 2013.
f) The amount represents costs associated with the acquisition of Area 9 on February 6, 2014.
g) Represents (i) cash distributions to noncontrolling interest holders (excluding special dividends) of $0.2mm and $2mm, for the quarter ended March 31, 2014 and 2013, respectively; (ii) non-cash incentive compensation expense; (iii) elimination of non-cash gain of $7mm in Area 9; and (iv) physical separation costs from former parent of $5mm; (v) other adjustments permitted and/or required under the indentures governing MHGE’s notes and the credit agreement governing MHGE’s senior credit facilities.
h) Represents cash spent for plate investment during the period.
i) The corresponding revenue impact (including the change in deferred revenue) associated with the EBITDA adjustment presented was $1mm.
j) Represents the run-rate impact of cost savings attributable to initiatives implemented and those we believe can be implemented in the next twelve months, but does not reflect the estimated costs we expect to incur to implement these savings. These cost savings relate primarily to supply chain initiatives, vendor management, increased utilization of outsourcing arrangements as well as continued streamlining of our operations as a stand-alone entity.
24
|
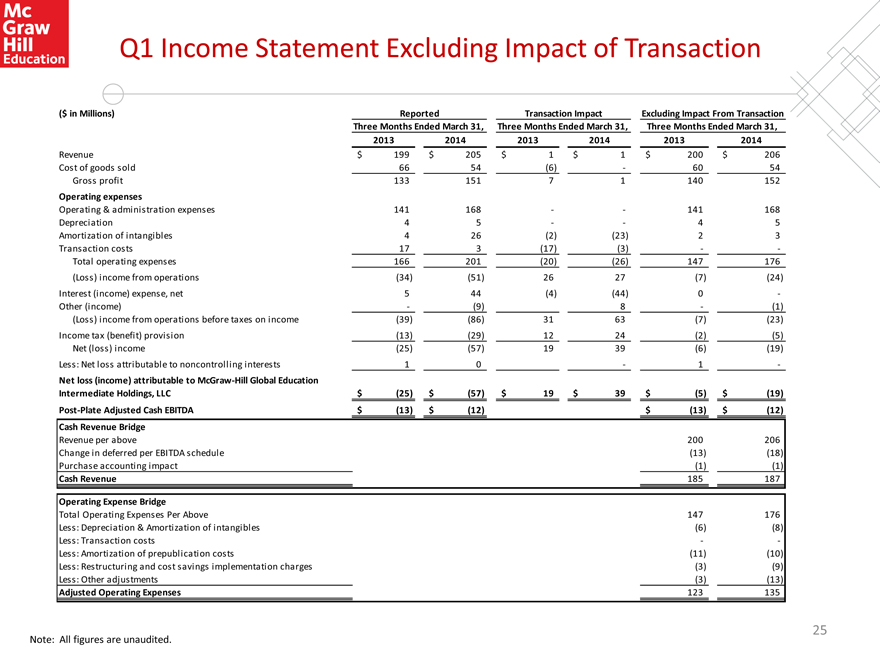
Q1 Income Statement Excluding Impact of Transaction
($ in Millions) Reported Transaction Impact Excluding Impact From Transaction
Three Months Ended March 31, Three Months Ended March 31, Three Months Ended March 31,
2013 2014 2013 2014 2013 2014
Revenue $ 199 $ 205 $ 1 $ 1 $ 200 $ 206
Cost of goods sold 66 54 (6) - 60 54
Gross profit 133 151 7 1 140 152
Operating expenses
Operating & administration expenses 141 168 - - 141 168
Depreciation 4 5 - - 4 5
Amortization of intangibles 4 26 (2) (23) 2 3
Transaction costs 17 3 (17) (3) - -
Total operating expenses 166 201 (20) (26) 147 176
(Loss) income from operations (34) (51) 26 27 (7) (24)
Interest (income) expense, net 5 44 (4) (44) 0 -
Other (income) - (9) 8 - (1)
(Loss) income from operations before taxes on income (39) (86) 31 63 (7) (23)
Income tax (benefit) provision (13) (29) 12 24 (2) (5)
Net (loss) income (25) (57) 19 39 (6) (19)
Less: Net loss attributable to noncontrolling interests 1 0 - 1 -
Net loss (income) attributable to McGraw-Hill Global Education
Intermediate Holdings, LLC $ (25) $ (57) $ 19 $ 39 $ (5) $ (19)
Post-Plate Adjusted Cash EBITDA $ (13) $ (12) $ (13) $ (12)
Cash Revenue Bridge
Revenue per above 200 206
Change in deferred per EBITDA schedule (13) (18)
Purchase accounting impact (1) (1)
Cash Revenue 185 187
Operating Expense Bridge
Total Operating Expenses Per Above 147 176
Less: Depreciation & Amortization of intangibles (6) (8)
Less: Transaction costs - -
Less: Amortization of prepublication costs (11) (10)
Less: Restructuring and cost savings implementation charges (3) (9)
Less: Other adjustments (3) (13)
Adjusted Operating Expenses 123 135
Note: All figures are unaudited.
25