Filed Pursuant to Rule 424(b)(3)
Registration No. 333-220046
HINES GLOBAL INCOME TRUST, INC.
SUPPLEMENT NO. 13, DATED NOVEMBER 14, 2019
TO THE PROSPECTUS, DATED APRIL 29, 2019
This prospectus supplement (this “Supplement”) is part of and should be read in conjunction with the prospectus of Hines Global Income Trust, Inc., dated April 29, 2019 (the “Prospectus”), as supplemented by Supplement No. 1, dated May 15, 2019, Supplement No. 2, dated May 16, 2019, Supplement No. 3, dated June 14, 2019, Supplement No. 5, dated July 18, 2019, and Supplement No. 6, dated July 23, 2019, Supplement No. 7, dated August 16, 2019, Supplement No. 8, dated August 16, 2019, Supplement No. 9, dated September 16, 2019, Supplement No. 10, dated October 17, 2019, Supplement No. 11 dated October 30, 2019 and Supplement No. 12 dated November 14, 2019. Unless otherwise defined herein, capitalized terms used in this Supplement shall have the same meanings as in the Prospectus.
The purpose of this Supplement is to include our Quarterly Report on Form 10-Q for the quarter ended September 30, 2019, as filed with the Securities and Exchange Commission on November 13, 2019. The report (without exhibits) is attached to this Supplement.
UNITED STATES SECURITIES AND EXCHANGE COMMISSION
Washington, D.C. 20549
FORM 10-Q
| (Mark One) | |
| ☒ | QUARTERLY REPORT PURSUANT TO SECTION 13 OR 15(d) OF THE SECURITIES EXCHANGE ACT OF 1934 |
For the quarterly period ended September 30, 2019
or
| ☐ | TRANSITION REPORT PURSUANT TO SECTION 13 OR 15(d) OF THE SECURITIES EXCHANGE ACT OF 1934 |
For the transition period from to
Commission file number: 000-55599
Hines Global Income Trust, Inc.
(Exact name of registrant as specified in its charter)
| Maryland | 80-0947092 | |
| (State or other jurisdiction of incorporation or organization) | (I.R.S. Employer Identification No.) | |
| 2800 Post Oak Boulevard | ||
| Suite 5000 | ||
| Houston | Texas | 77056-6118 |
| (Address of principal executive offices) | (Zip code) | |
(888) 220-6121
(Registrant’s telephone number, including area code)
Securities registered pursuant to Section 12(b) of the Exchange Act: None.
Indicate by check mark whether the registrant (1) has filed all reports required to be filed by Section 13 or 15(d) of the Securities Exchange Act of 1934 during the preceding 12 months (or for such shorter period that the registrant was required to file such reports), and (2) has been subject to such filing requirements for the past 90 days. Yes ☒ No ☐
Indicate by check mark whether the registrant has submitted electronically every Interactive Data File required to be submitted pursuant to Rule 405 of Regulation S-T (§232.405 of this chapter) during the preceding 12 months (or for such shorter period that the registrant was required to submit such files). Yes ☒ No ☐
Indicate by check mark whether the registrant is a large accelerated filer, an accelerated filer, a non-accelerated filer, smaller reporting company, or an emerging growth company. See the definitions of “large accelerated filer,” “accelerated filer,” “smaller reporting company,” and “emerging growth company” in Rule 12b-2 of the Exchange Act.
| Large accelerated filer | ☐ | Accelerated filer | ☐ | Non-accelerated filer | ☒ | ||
| Smaller reporting company | ☒ | Emerging growth company | ☒ | ||||
| If an emerging growth company, indicate by check mark if the registrant has elected not to use the extended transition period for complying with any new or revised financial accounting standards provided pursuant to Section 13 (a) of the Exchange Act. | ☒ | ||||||
Indicate by check mark whether the registrant is a shell company (as defined in Rule 12b-2 of the Exchange Act). Yes ☐ No ☒
As of November 1, 2019, approximately 18.9 million shares of the registrant’s Class AX common stock, 19.9 million shares of the registrant’s Class TX common stock, 0.1 million shares of the registrant’s Class IX common stock, 27.0 million shares of the registrant’s Class T common stock, 6.6 million shares of the registrant’s Class D common stock and 6.4 million shares of the registrant’s Class I common stock were outstanding.
TABLE OF CONTENTS
| PART I – FINANCIAL INFORMATION | ||
| Item 1. | Condensed Consolidated Financial Statements (Unaudited): | |
| Item 2. | ||
| Item 3. | ||
| Item 4. | ||
| PART II – OTHER INFORMATION | ||
| Item 1. | ||
| Item 1A. | ||
| Item 2. | ||
| Item 3. | ||
| Item 4. | ||
| Item 5. | ||
| Item 6. | ||
PART I - FINANCIAL INFORMATION
Item 1. Condensed Consolidated Financial Statements
HINES GLOBAL INCOME TRUST, INC.
CONDENSED CONSOLIDATED BALANCE SHEETS
(UNAUDITED)
| September 30, 2019 | December 31, 2018 | ||||||
| (in thousands, except per share amounts) | |||||||
| ASSETS | |||||||
| Investment property, net | $ | 1,104,769 | $ | 787,189 | |||
| Investments in real estate-related securities | 36,222 | 9,599 | |||||
| Cash and cash equivalents | 48,894 | 27,138 | |||||
| Restricted cash | 13,235 | 9,848 | |||||
| Derivative instruments | 131 | 174 | |||||
| Tenant and other receivables, net | 15,531 | 8,995 | |||||
| Intangible lease assets, net | 81,827 | 90,697 | |||||
| Right-of-use asset, net | 32,347 | — | |||||
| Deferred leasing costs, net | 17,381 | 13,282 | |||||
| Deferred financing costs, net | 259 | — | |||||
| Other assets | 3,828 | 1,907 | |||||
| Total assets | $ | 1,354,424 | $ | 948,829 | |||
| LIABILITIES AND EQUITY | |||||||
| Liabilities: | |||||||
| Accounts payable and accrued expenses | $ | 27,460 | $ | 26,186 | |||
| Due to affiliates | 33,435 | 26,022 | |||||
| Intangible lease liabilities, net | 19,640 | 18,034 | |||||
| Other liabilities | 20,247 | 55,391 | |||||
| Distributions payable | 3,402 | 2,024 | |||||
| Note payable to affiliate | 37,000 | 55,000 | |||||
| Notes payable, net | 702,531 | 487,439 | |||||
| Total liabilities | 843,715 | 670,096 | |||||
| Commitments and contingencies (Note 11) | — | — | |||||
| Equity: | |||||||
| Stockholders’ equity: | |||||||
| Preferred shares, $0.001 par value per share; 500,000 preferred shares authorized, none issued or outstanding as of September 30, 2019 and December 31, 2018 | — | — | |||||
| Common shares, $0.001 par value per share (Note 6) | 72 | 44 | |||||
| Additional paid-in capital | 646,122 | 371,274 | |||||
| Accumulated distributions in excess of earnings | (125,417 | ) | (91,711 | ) | |||
| Accumulated other comprehensive income (loss) | (10,068 | ) | (874 | ) | |||
| Total stockholders’ equity | 510,709 | 278,733 | |||||
| Noncontrolling interests | — | — | |||||
| Total equity | 510,709 | 278,733 | |||||
| Total liabilities and equity | $ | 1,354,424 | $ | 948,829 | |||
See notes to the condensed consolidated financial statements.
1
HINES GLOBAL INCOME TRUST, INC.
CONDENSED CONSOLIDATED STATEMENTS OF OPERATIONS AND COMPREHENSIVE INCOME (LOSS)
For the Three and Nine Months Ended September 30, 2019 and 2018
(UNAUDITED)
| Three Months Ended September 30, | Nine Months Ended September 30, | ||||||||||||||
| 2019 | 2018 | 2019 | 2018 | ||||||||||||
| (in thousands, except per share amounts) | |||||||||||||||
| Revenues: | |||||||||||||||
| Rental revenue | $ | 24,699 | $ | 15,643 | $ | 69,167 | $ | 47,811 | |||||||
| Other revenue | 809 | 235 | 1,633 | 770 | |||||||||||
| Total revenues | 25,508 | 15,878 | 70,800 | 48,581 | |||||||||||
| Expenses: | |||||||||||||||
| Property operating expenses | 6,450 | 3,084 | 17,155 | 8,578 | |||||||||||
| Real property taxes | 2,751 | 1,966 | 8,047 | 6,065 | |||||||||||
| Property management fees | 887 | 330 | 2,531 | 986 | |||||||||||
| Depreciation and amortization | 9,696 | 6,949 | 28,765 | 21,249 | |||||||||||
| Acquisition related expenses | 83 | — | 100 | 144 | |||||||||||
| Asset management fees | 2,177 | 1,253 | 5,465 | 3,674 | |||||||||||
| Performance participation allocation | 1,053 | 1,237 | 3,650 | 4,013 | |||||||||||
| General and administrative expenses | 972 | 763 | 2,767 | 2,275 | |||||||||||
| Total expenses | 24,069 | 15,582 | 68,480 | 46,984 | |||||||||||
| Other income (expenses): | |||||||||||||||
| Gain (loss) on derivative instruments | (97 | ) | (106 | ) | (1,284 | ) | (153 | ) | |||||||
| Gain (loss) on investments in real estate-related securities | 1,199 | — | 2,527 | — | |||||||||||
| Gain on sale of real estate | — | — | — | 14,491 | |||||||||||
| Foreign currency gains (losses) | (1,186 | ) | (67 | ) | (1,522 | ) | (382 | ) | |||||||
| Interest expense | (4,257 | ) | (2,845 | ) | (12,772 | ) | (8,336 | ) | |||||||
| Interest income | 624 | 59 | 993 | 106 | |||||||||||
| Income (loss) before benefit (provision) for income taxes | (2,278 | ) | (2,663 | ) | (9,738 | ) | 7,323 | ||||||||
| Benefit (provision) for income taxes | 505 | (119 | ) | 516 | (138 | ) | |||||||||
| Net income (loss) | (1,773 | ) | (2,782 | ) | (9,222 | ) | 7,185 | ||||||||
| Net (income) loss attributable to noncontrolling interests | (3 | ) | (3 | ) | (10 | ) | (10 | ) | |||||||
| Net income (loss) attributable to common stockholders | $ | (1,776 | ) | $ | (2,785 | ) | $ | (9,232 | ) | $ | 7,175 | ||||
| Basic and diluted income (loss) per common share | $ | (0.03 | ) | $ | (0.07 | ) | $ | (0.16 | ) | $ | 0.18 | ||||
| Weighted average number of common shares outstanding | 68,913 | 40,397 | 57,732 | 39,765 | |||||||||||
| Comprehensive income (loss): | |||||||||||||||
| Net income (loss) | $ | (1,773 | ) | $ | (2,782 | ) | $ | (9,222 | ) | $ | 7,185 | ||||
| Other comprehensive income (loss): | |||||||||||||||
| Foreign currency translation adjustment | (9,265 | ) | (811 | ) | (9,194 | ) | (3,610 | ) | |||||||
| Comprehensive income (loss) | $ | (11,038 | ) | $ | (3,593 | ) | $ | (18,416 | ) | $ | 3,575 | ||||
| Comprehensive (income) loss attributable to noncontrolling interests | (3 | ) | (3 | ) | (10 | ) | (10 | ) | |||||||
| Comprehensive income (loss) attributable to common stockholders | $ | (11,041 | ) | $ | (3,596 | ) | $ | (18,426 | ) | $ | 3,565 | ||||
See notes to the condensed consolidated financial statements.
2
HINES GLOBAL INCOME TRUST, INC.
CONDENSED CONSOLIDATED STATEMENTS OF EQUITY
For the Nine Months Ended September 30, 2019 and 2018
(UNAUDITED)
(In thousands)
| Hines Global Income Trust, Inc. Stockholders | ||||||||||||||||||||||||||
| Common Shares | Additional Paid-in Capital | Accumulated Distributions in Excess of Earnings | Accumulated Other Comprehensive Income (Loss) | Total Stockholders’ Equity | Noncontrolling Interests | |||||||||||||||||||||
| Shares | Amount | |||||||||||||||||||||||||
| Balance as of January 1, 2019 | 43,584 | $ | 44 | $ | 371,274 | $ | (91,711 | ) | $ | (874 | ) | $ | 278,733 | $ | — | |||||||||||
| Issuance of common shares | 6,109 | 7 | 62,886 | — | — | 62,893 | — | |||||||||||||||||||
| Distributions declared | — | — | — | (6,704 | ) | — | (6,704 | ) | (3 | ) | ||||||||||||||||
| Redemption of common shares | (362 | ) | — | (4,014 | ) | — | — | (4,014 | ) | — | ||||||||||||||||
| Selling commissions, dealer manager fees and distribution and stockholder servicing fees | — | — | (4,366 | ) | — | — | (4,366 | ) | — | |||||||||||||||||
| Offering costs | — | — | (1,240 | ) | — | — | (1,240 | ) | — | |||||||||||||||||
| Net income (loss) | — | — | — | (4,002 | ) | — | (4,002 | ) | 3 | |||||||||||||||||
| Foreign currency translation adjustment | — | — | — | — | (2,020 | ) | (2,020 | ) | — | |||||||||||||||||
| Balance as of March 31, 2019 | 49,331 | $ | 51 | $ | 424,540 | $ | (102,417 | ) | $ | (2,894 | ) | $ | 319,280 | $ | — | |||||||||||
| Issuance of common shares | 11,785 | 11 | 121,908 | — | — | 121,919 | — | |||||||||||||||||||
| Distributions declared | — | — | — | (8,062 | ) | — | (8,062 | ) | (4 | ) | ||||||||||||||||
| Redemption of common shares | (402 | ) | — | (3,111 | ) | — | — | (3,111 | ) | — | ||||||||||||||||
| Selling commissions, dealer manager fees and distribution and stockholder servicing fees | — | — | (8,511 | ) | — | — | (8,511 | ) | — | |||||||||||||||||
| Offering costs | — | — | (1,048 | ) | — | — | (1,048 | ) | — | |||||||||||||||||
| Net income (loss) | — | — | — | (3,454 | ) | — | (3,454 | ) | 4 | |||||||||||||||||
| Foreign currency translation adjustment | — | — | — | — | 2,091 | 2,091 | — | |||||||||||||||||||
| Balance as of June 30, 2019 | 60,714 | $ | 62 | $ | 533,778 | $ | (113,933 | ) | $ | (803 | ) | $ | 419,104 | $ | — | |||||||||||
| Issuance of common shares | 12,064 | 11 | 124,687 | — | — | 124,698 | — | |||||||||||||||||||
| Distributions declared | — | — | — | (9,708 | ) | — | (9,708 | ) | (3 | ) | ||||||||||||||||
| Redemption of common shares | (282 | ) | (1 | ) | (3,480 | ) | — | — | (3,481 | ) | — | |||||||||||||||
| Selling commissions, dealer manager fees and distribution and stockholder servicing fees | — | — | (8,042 | ) | — | — | (8,042 | ) | — | |||||||||||||||||
| Offering costs | — | — | (821 | ) | — | — | (821 | ) | — | |||||||||||||||||
| Net income (loss) | — | — | — | (1,776 | ) | — | (1,776 | ) | 3 | |||||||||||||||||
| Foreign currency translation adjustment | — | — | — | — | (9,265 | ) | (9,265 | ) | — | |||||||||||||||||
| Balance as of September 30, 2019 | 72,496 | $ | 72 | $ | 646,122 | $ | (125,417 | ) | $ | (10,068 | ) | $ | 510,709 | $ | — | |||||||||||
3
| Hines Global Income Trust, Inc. Stockholders | ||||||||||||||||||||||||||
| Common Shares | Additional Paid-in Capital | Accumulated Distributions in Excess of Earnings | Accumulated Other Comprehensive Income (Loss) | Total Stockholders’ Equity | Noncontrolling Interests | |||||||||||||||||||||
| Shares | Amount | |||||||||||||||||||||||||
| Balance as of January 1, 2018 | 39,256 | $ | 39 | $ | 336,761 | $ | (68,193 | ) | $ | 4,938 | $ | 273,545 | $ | — | ||||||||||||
| Issuance of common shares | 308 | — | 2,990 | — | — | 2,990 | — | |||||||||||||||||||
| Distributions declared | — | — | — | (5,514 | ) | — | (5,514 | ) | (3 | ) | ||||||||||||||||
| Redemption of common shares | (133 | ) | — | (2,032 | ) | — | — | (2,032 | ) | — | ||||||||||||||||
| Selling commissions, dealer manager fees and distribution and stockholder servicing fees | — | — | 4 | — | — | 4 | — | |||||||||||||||||||
| Offering costs | — | — | (17 | ) | — | — | (17 | ) | — | |||||||||||||||||
| Net income (loss) | — | — | — | 11,373 | — | 11,373 | 3 | |||||||||||||||||||
| Foreign currency translation adjustment | — | — | — | — | 2,716 | 2,716 | — | |||||||||||||||||||
| Balance as of March 31, 2018 | 39,431 | $ | 39 | $ | 337,706 | $ | (62,334 | ) | $ | 7,654 | $ | 283,065 | $ | — | ||||||||||||
| Issuance of common shares | 464 | 1 | 4,598 | — | — | 4,599 | — | |||||||||||||||||||
| Distributions declared | — | — | — | (5,528 | ) | — | (5,528 | ) | (3 | ) | ||||||||||||||||
| Redemption of common shares | (395 | ) | — | (4,212 | ) | — | — | (4,212 | ) | — | ||||||||||||||||
| Selling commissions, dealer manager fees and distribution and stockholder servicing fees | — | — | (28 | ) | — | — | (28 | ) | — | |||||||||||||||||
| Offering costs | — | — | (1,627 | ) | — | — | (1,627 | ) | — | |||||||||||||||||
| Net income (loss) | — | — | — | (1,411 | ) | — | (1,411 | ) | 3 | |||||||||||||||||
| Foreign currency translation adjustment | — | — | — | — | (5,515 | ) | (5,515 | ) | — | |||||||||||||||||
| Balance as of June 30, 2018 | 39,500 | $ | 40 | $ | 336,437 | $ | (69,273 | ) | $ | 2,139 | $ | 269,343 | $ | — | ||||||||||||
| Issuance of common shares | 1,922 | 2 | 19,372 | — | — | 19,374 | — | |||||||||||||||||||
| Distributions declared | — | — | — | (5,650 | ) | — | (5,650 | ) | (4 | ) | ||||||||||||||||
| Redemption of common shares | (338 | ) | — | (3,593 | ) | — | — | (3,593 | ) | — | ||||||||||||||||
| Selling commissions, dealer manager fees and distribution and stockholder servicing fees | — | — | (1,346 | ) | — | — | (1,346 | ) | — | |||||||||||||||||
| Offering costs | — | — | (2,094 | ) | — | — | (2,094 | ) | — | |||||||||||||||||
| Net income (loss) | — | — | — | (2,787 | ) | — | (2,787 | ) | 4 | |||||||||||||||||
| Foreign currency translation adjustment | — | — | — | — | (811 | ) | (811 | ) | — | |||||||||||||||||
| Balance as of September 30, 2018 | 41,084 | $ | 42 | $ | 348,776 | $ | (77,710 | ) | $ | 1,328 | $ | 272,436 | $ | — | ||||||||||||
See notes to the condensed consolidated financial statements.
4
HINES GLOBAL INCOME TRUST, INC.
CONDENSED CONSOLIDATED STATEMENTS OF CASH FLOWS
For the Nine Months Ended September 30, 2019 and 2018
(UNAUDITED)
| 2019 | 2018 | ||||||
| (In thousands) | |||||||
| CASH FLOWS FROM OPERATING ACTIVITIES: | |||||||
| Net income (loss) | $ | (9,222 | ) | $ | 7,185 | ||
| Adjustments to reconcile net income (loss) to net cash from (used in) operating activities: | |||||||
| Depreciation and amortization | 29,409 | 21,063 | |||||
| Gain on sale of real estate | — | (14,491 | ) | ||||
| Foreign currency (gains) losses | 1,522 | 382 | |||||
| (Gain) loss on derivative instruments | 1,284 | 153 | |||||
| (Gain) loss on investments in real estate-related securities | (2,527 | ) | — | ||||
| Changes in assets and liabilities: | |||||||
| Change in other assets | (1,197 | ) | 669 | ||||
| Change in tenant and other receivables | (5,144 | ) | 1,026 | ||||
| Change in deferred leasing costs | (5,646 | ) | (8,548 | ) | |||
| Change in accounts payable and accrued expenses | (1,150 | ) | 4,352 | ||||
| Change in other liabilities | (2,159 | ) | 1,216 | ||||
| Change in due to affiliates | (3,178 | ) | 3,141 | ||||
| Net cash from (used in) operating activities | 1,992 | 16,148 | |||||
| CASH FLOWS FROM INVESTING ACTIVITIES: | |||||||
| Investments in acquired properties and lease intangibles | (415,980 | ) | (72,094 | ) | |||
| Capital expenditures at operating properties | (6,326 | ) | (10,900 | ) | |||
| Proceeds from sale of real estate | — | 37,087 | |||||
| Purchases of real estate-related securities | (38,089 | ) | — | ||||
| Proceeds from settlement of real estate-related securities | 13,993 | — | |||||
| Net cash from (used in) investing activities | (446,402 | ) | (45,907 | ) | |||
| CASH FLOWS FROM FINANCING ACTIVITIES: | |||||||
| Proceeds from issuance of common shares | 296,944 | 18,003 | |||||
| Redemption of common shares | (10,547 | ) | (8,498 | ) | |||
| Payment of offering costs | (4,126 | ) | — | ||||
| Payment of selling commissions, dealer manager fees and distribution and stockholder servicing fees | (9,245 | ) | (2,198 | ) | |||
| Distributions paid to stockholders and noncontrolling interests | (10,539 | ) | (7,697 | ) | |||
| Proceeds from notes payable | 229,565 | 45,000 | |||||
| Payments on notes payable | (2,185 | ) | (1,270 | ) | |||
| Proceeds from related party note payable | 81,000 | 90,500 | |||||
| Payments on related party note payable | (99,000 | ) | (26,700 | ) | |||
| Change in security deposit liability | 200 | 46 | |||||
| Deferred financing costs paid | (1,190 | ) | (929 | ) | |||
| Payments related to interest rate contracts | (39 | ) | (10 | ) | |||
| Net cash from (used in) financing activities | 470,838 | 106,247 | |||||
| Effect of exchange rate changes on cash, restricted cash and cash equivalents | (1,285 | ) | (1,265 | ) | |||
| Net change in cash, restricted cash and cash equivalents | 25,143 | 75,223 | |||||
| Cash, restricted cash and cash equivalents, beginning of period | 36,986 | 24,553 | |||||
| Cash, restricted cash and cash equivalents, end of period | $ | 62,129 | $ | 99,776 | |||
See notes to the condensed consolidated financial statements.
5
HINES GLOBAL INCOME TRUST INC, INC.
NOTES TO THE CONDENSED CONSOLIDATED FINANCIAL STATEMENTS
For the Three and Nine Months Ended September 30, 2019 and 2018
1. ORGANIZATION
The accompanying interim unaudited condensed consolidated financial information has been prepared according to the rules and regulations of the United States Securities and Exchange Commission (“SEC”). In the opinion of management, all adjustments and eliminations, consisting only of normal recurring adjustments, necessary to present fairly and in conformity with accounting principles generally accepted in the United States of America (“GAAP”) the financial position of Hines Global Income Trust, Inc. as of September 30, 2019 and December 31, 2018, the results of operations for the three and nine months ended September 30, 2019 and 2018, the changes in stockholders’ equity for each of the quarterly periods in the nine months ended September 30, 2019 and 2018 and cash flows for the nine months ended September 30, 2019 and 2018 have been included. The results of operations for such interim periods are not necessarily indicative of the results for the full year. Certain information and footnote disclosures normally included in financial statements prepared in accordance with GAAP have been condensed or omitted according to such rules and regulations. For further information, refer to the financial statements and footnotes included in Hines Global Income Trust, Inc.’s Annual Report on Form 10-K for the year ended December 31, 2018.
Hines Global Income Trust, Inc. (the “Company”), formerly known as Hines Global REIT II, Inc., was incorporated in Maryland on July 31, 2013, to invest in a diversified portfolio of quality commercial real estate properties and other real estate investments throughout the United States and internationally, and to a lesser extent, invest in real-estate related securities. The Company is sponsored by Hines Interests Limited Partnership (“Hines”), a fully integrated global real estate investment and management firm that has acquired, developed, owned, operated and sold real estate for over 60 years. The Company is managed by Hines Global REIT II Advisors LP (the “Advisor”), an affiliate of Hines. The Company conducts substantially all of its operations through Hines Global REIT II Properties, LP (the “Operating Partnership”). An affiliate of the Advisor, Hines Global REIT II Associates LP, owns less than a 1% limited partner interest in the Operating Partnership as of September 30, 2019 and the Advisor also owns the special limited partnership interest in the Operating Partnership. The Company has elected to be taxed as a real estate investment trust, or REIT, for U.S. federal income tax purposes beginning with its taxable year ended December 31, 2015.
As of September 30, 2019, the Company owned direct real estate investments in 15 properties totaling 8.5 million square feet that were 96% leased. The Company raises capital for its investments through public offerings of its common stock. The Company commenced its initial public offering of up to $2.5 billion in shares of its common stock (the “Initial Offering”) in August 2014, and commenced its second public offering of up to $2.5 billion in shares of common stock including $500.0 million of shares offered under its distribution reinvestment plan (the “Follow-On Offering”) in December 2017. As of November 13, 2019, the Company had received gross offering proceeds of $842.3 million from the sale of 83.8 million shares through its public offerings, including shares issued pursuant to its distribution reinvestment plan.
2. SUMMARY OF SIGNIFICANT ACCOUNTING POLICIES
Basis of Presentation
The condensed consolidated financial statements of the Company included in this Quarterly Report on Form 10-Q include the accounts of Hines Global Income Trust, Inc. and the Operating Partnership (over which the Company exercises financial and operating control). All intercompany balances and transactions have been eliminated in consolidation.
Investments in Real Estate-Related Securities
In the fourth quarter of 2018, the Company made its initial investments in real estate-related securities, which consist of common equities, preferred equities and debt investments of publicly traded REITs. The Company has elected to classify these investments as trading securities and carry such investments at fair value. These assets are valued on a recurring basis, which resulted in a realized gain of $526,000 and an unrealized gain of $673,000 for the three months ended September 30, 2019, and a realized gain of $754,000 and an unrealized gain of $1.8 million for the nine months ended September 30, 2019, both of which are recorded in “gain (loss) on investments in real estate-related securities” in the Condensed Consolidated Statements of Operations and Comprehensive Income (Loss). The Company has also earned $346,000 and $608,000 in interest and dividend income for the three and nine months ended September 30, 2019, respectively, relating to its investments in these securities, which are recorded in “Interest income” in the Condensed Consolidated Statements of Operations and Comprehensive Income (Loss).
6
Tenant and Other Receivables
Tenant and other receivables consists primarily of receivables attributable to straight-line rent and receivables related to base rents and tenant reimbursements. Straight-line rent receivable consists of the difference between the tenants’ rents calculated on a straight-line basis from the date of acquisition or lease commencement over the remaining terms of the related leases and the tenants’ actual rents due under the lease agreements. Straight-line rent receivables were $7.4 million and $5.8 million as of September 30, 2019 and December 31, 2018, respectively. Tenant and other receivables are shown at cost in the consolidated balance sheets, net of allowance for doubtful accounts of $0.3 million at December 31, 2018.
Other Assets
Other assets included the following (in thousands):
| September 30, 2019 | December 31, 2018 | |||||||
| Prepaid insurance | $ | 953 | $ | 493 | ||||
| Prepaid property taxes | 285 | 80 | ||||||
Deferred tax assets (1) | 1,965 | 844 | ||||||
| Other | 625 | 490 | ||||||
| Other assets | $ | 3,828 | $ | 1,907 | ||||
| (1) | Includes the effects of a valuation allowance of $1.6 million and $0.8 million as of September 30, 2019 and December 31, 2018, respectively. |
Recently Adopted Accounting Pronouncements
In February 2016, the FASB issued ASU 2016-02 which requires companies that lease assets to recognize on the balance sheet the right-of-use assets and related lease liabilities (“ASC 842”). The accounting by companies that own the assets leased by the lessee (the lessor) remains largely unchanged from the adoption of ASC 842. The Company adopted ASC 842 beginning January 1, 2019 and is using the modified retrospective approach. No adjustment to opening retained earnings was required.
In July 2018, the FASB issued ASU 2018-11, which allows lessors to account for lease and non-lease components by class of underlying assets, as a single lease component if certain criteria are met. The new standard permits companies to recognize a cumulative-effect adjustment to the opening balance of retained earnings in the period of adoption in lieu of restating prior periods and provides other optional practical expedients.
On January 1, 2019, the Company elected the following practical expedients:
| • | The transition method in which the application date of January 1, 2019 is the beginning of the reporting period that the Company first applied the new guidance. |
| • | The practical expedient package which allows an entity not to reassess (1) whether any expired or existing contracts are or contain leases; (2) the lease classification for any expired or existing leases; (3) initial direct costs for any existing leases. |
| • | As an accounting policy election, a lessor may choose not to separate the non-lease components, by class of underlying assets, from the lease components and instead account for both types of components as a single component under certain conditions. |
| • | As an accounting policy election, a lessee may choose not to separate the non-lease components, by class of underlying assets, from the lease components and instead account for both types of components as a single component. The Company elected to apply the practical expedient for all of its leases to account for the lease and non-lease components as a single, combined operating lease component. |
7
The Company completed its evaluation of the impact that the adoption of ASC 842 will have on the Company’s consolidated financial statements relating to its leases from both the lessee and lessor perspective. Based on the Company’s analysis, the Company identified the following changes to result from its adoption of ASC 842:
Lessor Accounting
| • | The Company is entitled to receive tenant reimbursements for operating expenses for common area maintenance. Based on guidance in these ASUs, such revenue is defined as a non-lease component, which would be accounted for in accordance with ASC 606. However, the Company elected to apply the practical expedient for all of its leases to account for the lease and non-lease components as a single, combined operating lease component. |
| • | Capitalization of leasing costs is limited to initial direct costs. Initial direct costs have been defined as incremental costs of a lease that would not have been incurred if the lease had not been obtained. Legal costs are no longer capitalized, but expensed as incurred. There is no change in the Company’s accounting for lease inducements and commissions. |
| • | The Company’s existing leases continue to be classified as operating leases, however, leases entered into or modified after January 1, 2019 may be classified as either operating or sales-type leases, based on specific classification criteria. The Company believes all of its leases will continue to be classified as operating leases, and all operating leases will continue to have a similar pattern of recognition as under current GAAP. |
Lessee Accounting
| • | The Company has ground lease agreements in which the Company is the lessee for land underneath Bishop’s Square that the Company accounts for as an operating lease. The Company previously recognized an amount related to this ground lease as part of the allocation of the purchase price of Bishop’s Square, which was recorded to intangible lease assets, net. The lease has a remaining term of 763 years. Upon adoption of ASC 842 on January 1, 2019, the Company determined the lease liability is immaterial and reclassified approximately €29.7 million (approximately $33.9 million assuming a rate of $1.14 per EUR as of January 1, 2019, the date of adoption) from intangible lease assets, net to right-of-use asset, net in the Company’s Condensed Consolidated Balance Sheets. |
New Accounting Pronouncements
In August 2018, the FASB issued ASU No. 2018-13, "Changes to the Disclosure Requirements for Fair Value Measurement." This ASU amends and removes several disclosure requirements including the valuation processes for Level 3 fair value measurements. The ASU also modifies some disclosure requirements and requires additional disclosures for changes in unrealized gains and losses included in other comprehensive income for recurring Level 3 fair value measurements and requires the range and weighted average of significant unobservable inputs used to develop Level 3 fair value measurements. The ASU is effective for fiscal years beginning after December 15, 2019, including interim periods therein. Early adoption is permitted for any eliminated or modified disclosures upon issuance of this ASU. The Company does not expect this new guidance to have a material impact on its financial statements upon adoption.
8
3. INVESTMENT PROPERTY
Investment property consisted of the following amounts as of September 30, 2019 and December 31, 2018 (in thousands):
| September 30, 2019 | December 31, 2018 | |||||||
| Buildings and improvements | $ | 917,456 | $ | 693,834 | (1) | |||
| Less: accumulated depreciation | (44,727 | ) | (30,574 | ) | ||||
| Buildings and improvements, net | 872,729 | 663,260 | ||||||
| Land | 232,040 | 123,929 | ||||||
| Investment property, net | $ | 1,104,769 | $ | 787,189 | ||||
| (1) | Included in buildings and improvements as of December 31, 2018 is approximately $14.5 million of construction-in-progress related to the expansion of Bishop’s Square. The Company commenced construction in October 2017 to add an additional floor and make various upgrades to the property. The construction was completed in July 2019. |
Recent Acquisition of Investment Property
In May 2019, the Company acquired ABC Westland, an industrial property located in The Hague, Netherlands. The net purchase price for ABC Westland was €116.4 million (approximately $130.3 million assuming a rate of $1.12 per EUR as of the acquisition date), exclusive of transaction costs and working capital reserves. The Company funded the purchase in part by obtaining secured mortgage debt at closing. See Note 4—Debt Financing for further details.
In September 2019, the Company acquired The Promenade Shops at Briargate, an outdoor retail center located in Colorado Springs, Colorado. The net purchase price of The Promenade Shops at Briargate was $93.2 million exclusive of transaction costs and working capital reserves.
In September 2019, the Company acquired Segro Logistics Park Gdańsk, an industrial logistics property located in Gdańsk, Poland. The net purchase price was €26.9 million (approximately $29.9 million assuming rate of $1.11 per EUR as of the acquisition date), exclusive of transaction costs and working capital reserves. In October 2019, the Company entered into a facility agreement to fund the acquisition of Segro Logistics Park Gdańsk (the “Segro Logistics Facility”) for the principal sum of approximately €16.8 million (approximately $18.7 million assuming a rate of $1.11 per EUR), which matures in October 2024. The Segro Logistics Facility has a floating interest rate of Euribor +1.40% per annum. In October 2019, the Company also entered into an interest rate swap contract effectively fixing the interest rate for the full term of the Segro Logistics Facility.
In September 2019, the Company acquired Łódź Urban Logistics, an industrial logistics property located in Łódź, Poland. The net purchase price was €22.8 million (approximately $25.4 million assuming a rate of $1.11 per EUR as of the acquisition date), exclusive of transaction costs and working capital reserves. The Company funded the purchase in part by obtaining secured mortgage debt at closing. See Note 4—Debt Financing for further details.
In September 2019, the Company acquired Glasgow West End, a student housing property located in Glasgow, United Kingdom. The net purchase price was £72.2 million (approximately $89.7 million assuming a rate of $1.24 per GBP as of acquisition date), exclusive of transaction costs and working capital reserves. The Company funded the purchase in part by obtaining secured mortgage debt at closing. See Note 4—Debt Financing for further details.
9
The amounts recognized for the asset acquisitions as of the acquisition dates were determined by allocating the net purchase price as follows (in thousands):
| Property Name | Acquisition Date | Building and Improvements | Land | In-place Lease Intangibles | Out-of-Market Lease Intangibles, Net | Total | ||||||||||||||||
| ABC Westland | 5/3/2019 | $ | 74,059 | (1) | $ | 59,664 | $ | 6,902 | $ | (1,124 | ) | $ | 139,501 | |||||||||
| Promenade Shops at Briargate | 9/13/2019 | $ | 55,425 | $ | 19,199 | $ | 20,017 | $ | (1,047 | ) | $ | 93,594 | ||||||||||
| Segro Logistics Park Gdańsk | 9/24/2019 | $ | 18,675 | $ | 6,174 | $ | 5,013 | $ | 449 | $ | 30,311 | |||||||||||
| Łódź Urban Logistics | 9/26/2019 | $ | 18,243 | $ | 4,289 | $ | 3,440 | $ | (131 | ) | $ | 25,841 | ||||||||||
| Glasgow West End | 9/27/2019 | $ | 66,301 | $ | 22,276 | $ | 3,170 | $ | — | $ | 91,747 | |||||||||||
| (1) | Amount includes approximately €14.1 million (approximately $15.8 million assuming a rate of $1.12 per EUR as of the acquisition date) of solar panels at date of acquisition, which are to be depreciated using the straight-line method assuming a useful life of 25 years. |
As of September 30, 2019, the cost basis and accumulated amortization related to lease intangibles are as follows (in thousands):
| Lease Intangibles | |||||||||||
In-Place Leases (1) | Out-of-Market Lease Assets | Out-of-Market Lease Liabilities | |||||||||
| Cost | $ | 116,881 | $ | 7,496 | $ | (25,103 | ) | ||||
| Less: accumulated amortization | (39,891 | ) | (2,659 | ) | 5,463 | ||||||
| Net | $ | 76,990 | $ | 4,837 | $ | (19,640 | ) | ||||
| (1) | The Company adopted ASC 842 beginning January 1, 2019 and reclassified certain assets from Intangible lease assets, net to Right-of-use asset, net in the Company’s Condensed Consolidated Balance Sheets. See Note 2—Summary of Significant Accounting Policies for more information on the adoption of ASC 842. |
As of December 31, 2018, the cost basis and accumulated amortization related to lease intangibles were as follows (in thousands):
| Lease Intangibles | |||||||||||
| In-Place Leases | Out-of-Market Lease Assets | Out-of-Market Lease Liabilities | |||||||||
| Cost | $ | 118,585 | $ | 5,558 | $ | (22,318 | ) | ||||
| Less: accumulated amortization | (31,320 | ) | (2,126 | ) | 4,284 | ||||||
| Net | $ | 87,265 | $ | 3,432 | $ | (18,034 | ) | ||||
Amortization expense of in-place leases was $4.2 million and $3.7 million for the three months ended September 30, 2019 and 2018, respectively. Net amortization of out-of-market leases resulted in an increase to rental revenue of $0.7 million and $0.5 million for the three months ended September 30, 2019 and 2018, respectively.
Amortization expense of in-place leases was $13.5 million and $11.5 million for the nine months ended September 30, 2019 and 2018, respectively. Net amortization of out-of-market leases resulted in an increase to rental revenue of $1.4 million and $0.9 million for the nine months ended September 30, 2019 and 2018, respectively.
10
Anticipated amortization of the Company’s in-place leases and out-of-market leases, net for the period from October 1, 2019 through December 31, 2019 and for each of the years ending December 31, 2020 through December 31, 2024 are as follows (in thousands):
| In-Place Lease | Out-of-Market Leases, Net | ||||||
| October 1, 2019 through December 31, 2019 | $ | 5,899 | $ | (473 | ) | ||
| 2020 | $ | 19,404 | $ | (1,553 | ) | ||
| 2021 | $ | 12,579 | $ | (1,525 | ) | ||
| 2022 | $ | 9,637 | $ | (1,397 | ) | ||
| 2023 | $ | 7,534 | $ | (1,136 | ) | ||
| 2024 | $ | 4,870 | $ | (803 | ) | ||
Commercial Leases
The Company’s commercial leases are generally for terms of 15 years or less and may include multiple options to extend the lease term upon tenant election. The Company’s leases typically do not include an option to purchase. Generally, the Company does not expect the value of its real estate assets to be impacted materially at the end of any individual lease term, as the Company is typically able to re-lease the space and real estate assets tend to hold their value over a long period of time. Tenant terminations prior to the lease end date occasionally result in a one-time termination fee based on the remaining unpaid lease payments including variable payments and could be material to the tenant. Many of the Company’s leases have increasing minimum rental rates during the terms of the leases through escalation provisions. In addition, the majority of the Company’s leases provide for separate billings for variable rent, such as, reimbursements of real estate taxes, maintenance and insurance and may include an amount based on a percentage of the tenants’ sales. Total billings related to expense reimbursements from tenants for the three and nine months ended September 30, 2019, was $3.7 million and $9.4 million, respectively, which is included in Rental revenue on the Condensed Consolidated Statements of Operations and Comprehensive Income (Loss).
The Company has entered into non-cancelable lease agreements with tenants for space. As of September 30, 2019, the approximate fixed future minimum rentals for the period from October 1, 2019 through December 31, 2019, for each of the years ending December 31, 2020 through 2024 and thereafter related to the Company’s commercial properties are as follows (in thousands):
| Fixed Future Minimum Rentals | |||
| October 1, 2019 through December 31, 2019 | $ | 18,146 | |
| 2020 | 69,918 | ||
| 2021 | 61,730 | ||
| 2022 | 52,794 | ||
| 2023 | 47,274 | ||
| 2024 | 40,193 | ||
| Thereafter | 183,974 | ||
| Total | $ | 474,029 | |
During the nine months ended September 30, 2019 and 2018, the Company did not earn more than 10% of its revenue from any individual tenant.
The Company also enters into leases with tenants at its student housing properties and multi-family properties. These leases generally have terms less than one year and do not contain options to extend, terminate or purchase, escalation clauses, or other such terms, which are common in the Company’s commercial leases.
11
4. DEBT FINANCING
As of September 30, 2019 and December 31, 2018, the Company had approximately $743.8 million and $545.8 million of debt outstanding, with weighted average years to maturity of 2.8 years and 2.9 years, respectively, and a weighted average interest rate of 2.57% and 2.85%, respectively. The following table provides additional information regarding the Company’s debt outstanding at September 30, 2019 and December 31, 2018 (in thousands):
| Description | Origination or Assumption Date | Maturity Date | Maximum Capacity in Functional Currency | Interest Rate Description | Interest Rate as of September 30, 2019 | Principal Outstanding at September 30, 2019 | Principal Outstanding at December 31, 2018 | |||||||||||||
| Secured Mortgage Debt | ||||||||||||||||||||
| Bishop's Square | 3/3/2015 | 3/2/2022 | € | 55,200 | Euribor + 1.30% (1) | 1.30% | $ | 60,256 | $ | 63,171 | ||||||||||
| Domain Apartments | 1/29/2016 | 1/29/2020 | $ | 34,300 | Libor + 1.60% | 3.62% | 34,300 | 34,300 | ||||||||||||
| Cottonwood Corporate Center | 7/5/2016 | �� | 8/1/2023 | $ | 78,000 | Fixed | 2.98% | 72,802 | 74,110 | |||||||||||
| Goodyear Crossing II | 8/18/2016 | 8/18/2021 | $ | 29,000 | Libor + 2.00% | 4.09% | 29,000 | 29,000 | ||||||||||||
| Rookwood Commons | 1/6/2017 | 7/1/2020 | $ | 67,000 | Fixed | 3.13% | 67,000 | 67,000 | ||||||||||||
| Rookwood Pavilion | 1/6/2017 | 7/1/2020 | $ | 29,000 | Fixed | 2.87% | 29,000 | 29,000 | ||||||||||||
| Montrose Student Residences | 3/24/2017 | 3/23/2022 | € | 22,605 | Euribor + 1.85% (1) | 1.85% | 24,676 | 25,869 | ||||||||||||
| Queen's Court Student Residences | 12/18/2017 | 12/18/2022 | £ | 29,500 | Libor + 2.00% (1) | 2.82% | 36,279 | 37,565 | ||||||||||||
| Venue Museum District | 9/21/2018 | 10/9/2020 | $ | 45,000 | Libor + 1.95% (1) | 3.99% | 45,000 | 45,000 | ||||||||||||
| Fresh Park Venlo | 10/3/2018 | 8/15/2023 | € | 75,000 | Euribor + 1.50% (1) | 1.50% | 81,850 | 85,809 | ||||||||||||
| Maintal Logistics | 2/21/2019 | 2/28/2024 | € | 23,500 | Euribor + 1.10% (1) | 1.10% | 25,503 | — | ||||||||||||
| ABC Westland | 5/3/2019 | 2/15/2024 | € | 75,000 | Euribor + 1.50% (1) | 1.50% | 81,160 | — | ||||||||||||
| Łódź Urban Logistics | 9/20/2019 | 9/20/2024 | € | 13,600 | Euribor + 1.40% (2) | 1.40% | 14,870 | — | ||||||||||||
| Glasgow West End | 9/26/2019 | 9/26/2024 | £ | 43,200 | Libor + 1.80% (1) | 2.56% | 53,127 | — | ||||||||||||
| Other Notes Payable | ||||||||||||||||||||
| JPMorgan Chase Revolving Credit Facility | 9/13/2019 | 9/13/2022 | $ | 55,000 | Variable | 3.63% | 52,000 | — | ||||||||||||
| Notes Payable | $ | 706,823 | $ | 490,824 | ||||||||||||||||
| Affiliate Note Payable | ||||||||||||||||||||
| Credit Facility with Hines | 10/2/2017 | 12/31/2019 | $ | 75,000 | Variable | 3.68% | 37,000 | 55,000 | ||||||||||||
| Total Note Payable to Affiliate | $ | 37,000 | $ | 55,000 | ||||||||||||||||
| Total Principal Outstanding | $ | 743,823 | $ | 545,824 | ||||||||||||||||
| Unamortized discount | (157 | ) | (316 | ) | ||||||||||||||||
| Unamortized financing fees | (4,135 | ) | (3,069 | ) | ||||||||||||||||
| Total | $ | 739,531 | $ | 542,439 | ||||||||||||||||
| (1) | On the loan origination date, the Company entered into an interest rate cap agreement as an economic hedge against the variability of future interest rates on this borrowing. See Note 5—Derivative Instruments for further details. |
| (2) | In October 2019, the Company entered into an interest rate swap contract effectively fixing the interest rate for the full term of the facility. |
JPMorgan Chase Revolving Credit Facility
On September 13, 2019, the Operating Partnership entered into a Credit Agreement (the “Credit Agreement”) with JPMorgan Chase Bank, N.A. (“JPMorgan”), as lender and Administrative Agent, providing for borrowings denominated in U.S. dollars, British pounds sterling, Euros, Australian dollars, Canadian dollars, or Japanese yen. The initial aggregate amount of the lender’s commitment was a $55.0 million revolving loan commitment (the “Revolving Credit Facility”), with aggregate foreign currency commitments constituting up to 50% of that amount. Pending future commitments, the maximum aggregate borrowings could be increased to up to $300 million. The Credit Agreement has a maturity date of September 13, 2022, subject to two twelve-month extensions at the option of the Company.
Interest on the loans will be payable based on either (a) the Alternate Base Rate (as defined in the Credit Agreement) plus the Applicable Rate (as defined in the Credit Agreement) or (b) the Adjusted LIBO Rate (as defined in the Credit Agreement) plus the Applicable Rate, subject to the Company’s election; provided, however, for revolving loans denominated in Australian dollars, Canadian dollars, Euros, or Japanese Yen, the Australian Bill Rate, the CDOR Rate, the EURIBOR Screen Rate or the Yen Rate, respectively, will be referred to in lieu of the Adjusted LIBO Rate. The Alternate Base Rate is equal to the greatest of: (a) the Prime Rate (as defined in the Credit Agreement), (b) Federal Funds Effective Rate plus 0.5%, or (c) an adjusted
12
LIBO rate for a one month period plus 1.0%. The Adjusted LIBO Rate is equal to the LIBO rate, which is derived from the London interbank offered rate (“LIBOR”), for the applicable interest period, as determined by JPMorgan, multiplied by the Statutory Reserve Rate determined by the Board of Governors of the Federal Reserve System of the United States of America, provided that, with respect to borrowings denominated in a foreign currency, the Adjusted LIBO Rate will be equal to the LIBO Rate. Customary fall-back provisions apply if LIBOR is unavailable. The Applicable Rate is based on the Company’s ratio of indebtedness to total asset value and will be determined as set forth in the Credit Agreement. The Applicable Rate for loans bearing interest determined by reference to the Alternative Base Rate will range from 0.35% to 1.05%, and the Applicable Rate for loans bearing interest determined by reference to the Adjusted LIBO Rate will range from 1.35% to 2.05%, in each case depending on the ratio and whether it is a revolving loan or a term loan.
The Credit Agreement contains customary events of default, with corresponding grace periods, including, without limitation, payment defaults, cross-defaults to other agreements evidencing indebtedness and bankruptcy-related defaults, and customary covenants, including limitations on the incurrence of debt and granting of liens. The Credit Agreement also requires the maintenance by the Company of certain ratios of indebtedness to total asset value, certain levels of debt service coverage, a minimum net worth and other certain unencumbered value and interest coverage ratios.
If any events of default occur and are not cured within applicable grace periods or waived, the outstanding loans may be accelerated and the lenders’ commitments may be terminated. The occurrence of the bankruptcy-related defaults will result in the automatic termination of commitments and acceleration of the loans. The Company and several of its affiliates have unconditionally guaranteed payment and performance of the Operating Partnership’s obligations under the Credit Agreement.
The Company is required to have at least one property unencumbered by debt as of the closing date of the Credit Agreement, increasing to at least five properties within one year from the closing date of the Credit Agreement that are unencumbered by debt, and to maintain an aggregate occupancy rate in the unencumbered pool of at least 80%.
We were in compliance with all covenants under the Credit Agreement as of September 30, 2019.
During the nine months ended September 30, 2019, the Company made draws of approximately $52.0 million and no payments on the Revolving Credit Facility. From October 1, 2019 through November 13, 2019, the Company made payments of $27.5 million and made $27.5 million in additional draws under the Revolving Credit Facility, resulting in an outstanding principal balance of $52.0 million as of November 13, 2019.
Hines Credit Facility
During the nine months ended September 30, 2019, the Company made draws of $81.0 million and made payments of $99.0 million under its credit facility with Hines (the “Hines Credit Facility”). The Company had an outstanding balance of $37.0 million on September 30, 2019. From October 1, 2019 through November 13, 2019, the Company made draws of $44.0 million and payments of $15.0 million under the Hines Credit Facility, resulting in an outstanding balance of $66.0 million on November 13, 2019.
Financial Covenants
The Company’s mortgage agreements and other loan documents for the debt described in the table above contain customary events of default, with corresponding grace periods, including payment defaults, bankruptcy-related defaults, and customary covenants, including limitations on liens and indebtedness and maintenance of certain financial ratios. The Company is not aware of any instances of noncompliance with financial covenants on any of its loans as of September 30, 2019.
13
Principal Payments on Debt
The Company is required to make the following principal payments on its outstanding notes payable for the period from October 1, 2019 through December 31, 2019, for each of the years ending December 31, 2020 through December 31, 2023 and for the period thereafter (in thousands).
| Payments Due by Year | |||||||||||||||||||||||
| October 1, 2019 through December 31, 2019 | 2020 | 2021 | 2022 | 2023 | Thereafter | ||||||||||||||||||
| Principal payments | $ | 38,232 | $ | 180,364 | $ | 34,117 | $ | 178,384 | $ | 151,889 | $ | 160,837 | |||||||||||
As of November 13, 2019, the Company is required to make $241.3 million in principal payments on its outstanding notes payable that mature through November 2020. The Company expects to be able to repay with cash on hand or proceeds raised from its current offering, or to be able to refinance the debt terms on the principal outstanding.
LIBOR is expected to be discontinued after 2021. As of September 30, 2019 the Company has two loans with a variable interest rate tied to LIBOR with maturities beyond 2021. The loan agreements provide procedures for determining a replacement or alternative rate in the event that LIBOR is unavailable. However, there can be no assurances as to whether such replacement or alternative rate will be more or less favorable than LIBOR. The Company intends to monitor the developments with respect to the potential phasing out of LIBOR after 2021 and work with its lenders to ensure any transition away from LIBOR will have minimal impact on its financial condition, but can provide no assurances regarding the impact of the discontinuation of LIBOR.
5. DERIVATIVE INSTRUMENTS
The Company has entered into several interest rate cap contracts in connection with certain of its secured mortgage loans in order to limit its exposure against the variability of future interest rates on its variable interest rate borrowings. The Company’s interest rate cap contracts have economically limited the interest rate on the loan to which they relate. The Company has not designated these derivatives as hedges for accounting purposes. The Company has not entered into a master netting arrangement with its third-party counterparty and does not offset on its Condensed Consolidated Balance Sheets the fair value amount recorded for its derivative instruments.
The Company has also entered into foreign currency forward contracts as economic hedges against the variability of foreign exchange rates related to certain cash flows of some of its international investments. These forward contracts fixed the currency exchange rates on each of the investments to which they related. The Company did not designate any of these contracts as fair value or cash flow hedges for accounting purposes. In December 2018, the Company entered into a €15.0 million foreign currency forward contract with an effective date of December 20, 2018 and a trade date of February 25, 2019, in connection with the funding of the Maintal Logistics acquisition. Additionally, in March 2019, the Company entered into an initial €46.0 million foreign currency forward contract with an effective date of March 1, 2019 and a trade date of March 20, 2019, in connection with the acquisition of ABC Westland. Upon settlement of the initial forward contract in March 2019, the Company entered into a new €46.0 million foreign currency forward contract in connection with the acquisition of ABC Westland with an effective date of March 31, 2019 and a trade date of April 3, 2019. See Note 3—Investment Property for additional information regarding the purchase of ABC Westland.
14
The table below provides additional information regarding the Company’s interest rate contracts (in thousands, except percentages).
| Interest Rate Cap Contracts | |||||||||||||||||
| Property | Effective Date | Expiration Date | Maximum Capacity of Debt in Functional Currency | Notional Amount | Interest Rate Received | Pay Rate /Strike Rate | |||||||||||
| Bishop’s Square | March 3, 2015 | April 25, 2020 | € | 55,200 | € | 55,200 | Euribor | 2.00 | % | ||||||||
| Montrose Student Residences | March 24, 2017 | March 23, 2022 | € | 22,605 | € | 16,954 | Euribor | 1.25 | % | ||||||||
| Queen’s Court Student Residences | December 20, 2017 | December 20, 2020 | £ | 29,500 | £ | 22,125 | LIBOR | 2.00 | % | ||||||||
| Venue Museum District | September 21, 2018 | October 9, 2020 | $ | 45,000 | $ | 45,000 | LIBOR | 3.50 | % | ||||||||
| Fresh Park Venlo | October 8, 2018 | August 15, 2023 | € | 75,000 | € | 52,487 | Euribor | 2.00 | % | ||||||||
| Maintal Logistics | February 28, 2019 | February 28, 2024 | € | 23,500 | € | 16,450 | Euribor | 2.00 | % | ||||||||
| ABC Westland | May 3, 2019 | February 15, 2024 | € | 75,000 | € | 52,500 | Euribor | 1.00 | % | ||||||||
| Glasgow West End | September 27, 2019 | September 24, 2024 | £ | 43,200 | £ | 32,400 | LIBOR | 2.00 | % | ||||||||
The table below presents the effects of the changes in fair value of the Company’s derivative instruments in the Company’s Condensed Consolidated Statements of Operations and Comprehensive Income (Loss) for the three and nine months ended September 30, 2019 and 2018 (in thousands):
| Gain (Loss) Recorded on Derivative Instruments | ||||||||||||||||
| Three months ended September 30, | Nine months ended September 30, | |||||||||||||||
| 2019 | 2018 | 2019 | 2018 | |||||||||||||
| Derivatives not designated as hedging instruments: | ||||||||||||||||
| Interest rate caps | $ | (97 | ) | $ | (106 | ) | $ | (408 | ) | $ | (153 | ) | ||||
| Foreign currency forward contracts | — | — | (876 | ) | — | |||||||||||
| Total gain (loss) on derivatives | $ | (97 | ) | $ | (106 | ) | $ | (1,284 | ) | $ | (153 | ) | ||||
6. STOCKHOLDERS’ EQUITY
Public Offering
On November 30, 2017, the Company (i) redesignated its issued and outstanding Class A shares of common stock, Class T shares of common stock, Class I shares of common stock and Class J shares of common stock as “Class AX shares,” “Class TX shares,” “Class IX shares” and “Class JX shares,” (collectively, the “IPO Shares”) respectively, and (ii) reclassified the authorized but unissued portion of its common stock into four additional classes of shares of common stock: “Class T shares,” “Class S shares,” “Class D shares,” and “Class I shares.” The Company is offering its shares of common stock in the Follow-On Offering (as defined below) in any combination of Class T shares, Class S shares, Class D shares and Class I shares (collectively, the “Follow-On Offering Shares”). All shares of the Company’s common stock have the same voting rights and rights upon liquidation, although distributions received by the Company’s stockholders are expected to differ due to the distribution and stockholder servicing fees payable with respect to the applicable share classes, which reduce distributions.
The Company complies with the FASB ASC 480 “Distinguishing Liabilities from Equity” which requires, among other things, that financial instruments that represent a mandatory obligation of the Company to repurchase shares be classified as liabilities and reported at settlement value. When shares are tendered for redemption and approved (or not prohibited) by the board of directors, the Company will reclassify such obligations from equity to an accrued liability based upon their respective settlement values and redeem those shares in the subsequent month pursuant to the Company’s current share redemption program.
15
Common Stock
As of September 30, 2019 and December 31, 2018, the Company had the following classes of shares of common stock authorized, issued and outstanding (in thousands):
| September 30, 2019 | December 31, 2018 | ||||||
| Shares Authorized | Shares Issued and Outstanding | Shares Authorized | Shares Issued and Outstanding | ||||
| Class AX common stock, $0.001 par value per share | 40,000 | 18,940 | 40,000 | 19,123 | |||
| Class TX common stock, $0.001 par value per share | 40,000 | 20,013 | 40,000 | 19,969 | |||
| Class IX common stock, $0.001 par value per share | 10,000 | 90 | 10,000 | 96 | |||
| Class JX common stock, $0.001 par value per share | 10,000 | — | 10,000 | — | |||
| Class T common stock, $0.001 par value per share | 350,000 | 23,005 | 350,000 | 2,858 | |||
| Class S common stock, $0.001 par value per share | 350,000 | — | 350,000 | — | |||
| Class D common stock, $0.001 par value per share | 350,000 | 5,958 | 350,000 | 1,479 | |||
| Class I common stock, $0.001 par value per share | 350,000 | 4,490 | 350,000 | 59 | |||
The tables below provide information regarding the issuances and redemptions of each class of the Company’s common stock during the nine months ended September 30, 2019 and 2018 (in thousands). There were no Class JX and S shares issued, redeemed or outstanding during the nine months ended September 30, 2019.
| Class AX | Class TX | Class IX | Class T | Class D | Class I | Total | ||||||||||||||||||||||||||||||||||||||||||
| Shares | Amount | Shares | Amount | Shares | Amount | Shares | Amount | Shares | Amount | Shares | Amount | Shares | Amount | |||||||||||||||||||||||||||||||||||
| Balance as of January 1, 2019 | 19,123 | $ | 19 | 19,969 | $ | 21 | 96 | $ | — | 2,858 | $ | 3 | 1,479 | $ | 1 | 59 | $ | — | 43,584 | $ | 44 | |||||||||||||||||||||||||||
| Issuance of common shares | 136 | — | 155 | 1 | 1 | — | 4,011 | 4 | 1,198 | 1 | 608 | 1 | 6,109 | 7 | ||||||||||||||||||||||||||||||||||
| Redemption of common shares | (163 | ) | — | (195 | ) | — | — | — | — | — | (4 | ) | — | — | — | (362 | ) | — | ||||||||||||||||||||||||||||||
| Balance as of March 31, 2019 | 19,096 | $ | 19 | 19,929 | $ | 22 | 97 | $ | — | 6,869 | $ | 7 | 2,673 | $ | 2 | 667 | $ | 1 | 49,331 | $ | 51 | |||||||||||||||||||||||||||
| Issuance of common shares | 134 | — | 154 | — | 1 | — | 8,152 | 8 | 1,824 | 2 | 1,520 | 1 | 11,785 | 11 | ||||||||||||||||||||||||||||||||||
| Redemption of common shares | (270 | ) | — | (132 | ) | — | — | — | — | — | — | — | — | — | (402 | ) | — | |||||||||||||||||||||||||||||||
| Balance as of June 30, 2019 | 18,960 | $ | 19 | 19,951 | $ | 22 | 98 | $ | — | 15,021 | $ | 15 | 4,497 | $ | 4 | 2,187 | $ | 2 | 60,714 | $ | 62 | |||||||||||||||||||||||||||
| Issuance of common shares | 132 | — | 152 | — | 1 | — | 8,001 | 8 | 1,474 | 1 | 2,304 | 2 | 12,064 | 11 | ||||||||||||||||||||||||||||||||||
| Redemption of common shares | (152 | ) | (1 | ) | (90 | ) | — | (9 | ) | — | (17 | ) | — | (13 | ) | — | (1 | ) | — | (282 | ) | (1 | ) | |||||||||||||||||||||||||
| Balance as of September 30, 2019 | 18,940 | $ | 18 | 20,013 | $ | 22 | 90 | $ | — | 23,005 | $ | 23 | 5,958 | $ | 5 | 4,490 | $ | 4 | 72,496 | $ | 72 | |||||||||||||||||||||||||||
| Class AX | Class TX | Class IX | Class T | Class D | Class I | Total | ||||||||||||||||||||||||||||||||||||||||||
| Shares | Amount | Shares | Amount | Shares | Amount | Shares | Amount | Shares | Amount | Shares | Amount | Shares | Amount | |||||||||||||||||||||||||||||||||||
| Balance as of January 1, 2018 | 19,206 | $ | 19 | 19,958 | $ | 20 | 92 | $ | — | — | $ | — | — | $ | — | — | $ | — | 39,256 | $ | 39 | |||||||||||||||||||||||||||
| Issuance of common shares | 145 | — | 162 | — | 1 | — | — | — | — | — | — | — | 308 | — | ||||||||||||||||||||||||||||||||||
| Redemption of common shares | (116 | ) | — | (17 | ) | — | — | — | — | — | — | — | — | — | (133 | ) | — | |||||||||||||||||||||||||||||||
| Balance as of March 31, 2018 | 19,235 | $ | 19 | 20,103 | $ | 20 | 93 | $ | — | — | $ | — | — | $ | — | — | $ | — | 39,431 | $ | 39 | |||||||||||||||||||||||||||
| Issuance of common shares | 143 | — | 159 | 1 | 1 | — | 123 | — | 38 | — | — | — | 464 | 1 | ||||||||||||||||||||||||||||||||||
| Redemption of common shares | (136 | ) | — | (259 | ) | — | — | — | — | — | — | — | — | — | (395 | ) | — | |||||||||||||||||||||||||||||||
| Balance as of June 30, 2018 | 19,242 | $ | 19 | 20,003 | $ | 21 | 94 | $ | — | 123 | $ | — | 38 | $ | — | ��� | $ | — | 39,500 | $ | 40 | |||||||||||||||||||||||||||
| Issuance of common shares | 140 | — | 157 | — | 1 | — | 1,072 | 1 | 545 | 1 | 7 | — | 1,922 | 2 | ||||||||||||||||||||||||||||||||||
| Redemption of common shares | (204 | ) | — | (134 | ) | — | — | — | — | — | — | — | — | — | (338 | ) | — | |||||||||||||||||||||||||||||||
| Balance as of September 30, 2018 | 19,178 | $ | 19 | 20,026 | $ | 21 | 95 | $ | — | 1,195 | $ | 1 | 583 | $ | 1 | 7 | $ | — | 41,084 | $ | 42 | |||||||||||||||||||||||||||
16
Distributions
With the authorization of the Company’s board of directors, the Company declared distributions monthly from January 2019 through October 2019 at a gross distribution rate of $0.05208 per month for each share class (represents an annualized rate of $0.625 per share per year if this rate is declared for an entire year), less any applicable distribution and stockholder servicing fees.
Distributions were made on all classes of the Company’s common stock at the same time. All distributions were paid in cash or reinvested in shares of the Company’s common stock for those participating in the Company’s distribution reinvestment plan and have been paid or issued, respectively, on the first business day following the completion of the month to which they relate. Distributions reinvested pursuant to the Company’s distribution reinvestment plan were reinvested in shares of the same class as the shares on which the distributions were made. Some or all of the cash distributions may be paid from sources other than cash flows from operations.
The following table outlines the Company’s total cash distributions declared to stockholders for each of the quarters ended during 2019 and 2018, including the breakout between the distributions declared in cash and those reinvested pursuant to the Company’s distribution reinvestment plan (in thousands).
| Stockholders | ||||||||||||
| Distributions for the Three Months Ended | Cash Distributions | Distributions Reinvested | Total Declared | |||||||||
| 2019 | ||||||||||||
| September 30, 2019 | $ | 4,383 | $ | 5,325 | $ | 9,708 | ||||||
| June 30, 2019 | 3,647 | 4,415 | 8,062 | |||||||||
| March 31, 2019 | 3,090 | 3,614 | 6,704 | |||||||||
| Total | $ | 11,120 | $ | 13,354 | $ | 24,474 | ||||||
| 2018 | ||||||||||||
| December 31, 2018 | $ | 2,765 | $ | 3,168 | $ | 5,933 | ||||||
| September 30, 2018 | 2,617 | 3,034 | 5,651 | |||||||||
| June 30, 2018 | 2,554 | 2,974 | 5,528 | |||||||||
| March 31, 2018 | 2,544 | 2,970 | 5,514 | |||||||||
| Total | $ | 10,480 | $ | 12,146 | $ | 22,626 | ||||||
The table below outlines the net distributions declared for each class of shares for the three and nine months ended September 30, 2019 and 2018. The net distributions presented below are representative of the gross distribution rate declared by the Company’s board of directors, less any applicable ongoing distribution and stockholder servicing fees.
| Three Months Ended September 30, | Nine Months Ended September 30, | |||||||||||||||
| 2019 | 2018 | 2019 | 2018 | |||||||||||||
| Distributions declared per Class AX share, net | $ | 0.16 | $ | 0.15 | $ | 0.47 | $ | 0.46 | ||||||||
| Distributions declared per Class TX share, net | $ | 0.13 | $ | 0.13 | $ | 0.39 | $ | 0.38 | ||||||||
| Distributions declared per Class IX share, net | $ | 0.15 | $ | 0.15 | $ | 0.45 | $ | 0.44 | ||||||||
| Distributions declared per Class T share, net | $ | 0.13 | $ | 0.13 | $ | 0.39 | $ | 0.38 | ||||||||
| Distributions declared per Class S share, net | $ | 0.13 | $ | 0.13 | $ | 0.39 | $ | 0.38 | ||||||||
| Distributions declared per Class D share, net | $ | 0.15 | $ | 0.15 | $ | 0.45 | $ | 0.44 | ||||||||
| Distributions declared per Class I share, net | $ | 0.16 | $ | 0.15 | $ | 0.47 | $ | 0.46 | ||||||||
17
7. RELATED PARTY TRANSACTIONS
The table below outlines fees and expense reimbursements incurred that are payable by the Company to the Advisor and the Dealer Manager, Hines and its affiliates for the periods indicated below (in thousands):
| Incurred | ||||||||||||||||||||||||
| Three Months Ended September 30, | Nine Months Ended September 30, | Unpaid as of | ||||||||||||||||||||||
| Type and Recipient | 2019 | 2018 | 2019 | 2018 | September 30, 2019 | December 31, 2018 | ||||||||||||||||||
Selling Commissions- Dealer Manager (1) | $ | 2,262 | $ | 313 | $ | 5,822 | $ | 349 | $ | — | $ | 4 | ||||||||||||
| Dealer Manager Fee- Dealer Manager | 411 | 55 | 1,041 | 61 | — | 3 | ||||||||||||||||||
| Distribution & Stockholder Servicing Fees- Dealer Manager | 5,369 | 978 | 14,056 | 960 | 20,011 | 8,332 | ||||||||||||||||||
| Organization and Offering Costs- the Advisor | 821 | 711 | 3,109 | 2,213 | 7,984 | 9,001 | ||||||||||||||||||
| Asset Management Fees- the Advisor | 2,177 | 1,253 | 5,465 | 3,674 | 125 | 1,317 | ||||||||||||||||||
Other- the Advisor (2) | 1,009 | 366 | 2,233 | 1,038 | 510 | 691 | ||||||||||||||||||
Performance Participation Allocation- the Advisor (3) | 1,053 | 1,237 | 3,650 | 4,013 | 3,650 | 5,954 | ||||||||||||||||||
Interest expense- Hines and its affiliates (4) | 72 | 56 | 819 | 254 | 72 | 151 | ||||||||||||||||||
| Property Management Fees- Hines and its affiliates | 404 | 259 | 1,219 | 712 | 203 | 78 | ||||||||||||||||||
| Development and Construction Management Fees- Hines and its affiliates | 36 | 75 | 326 | 326 | 44 | 28 | ||||||||||||||||||
| Leasing Fees- Hines and its affiliates | 95 | 95 | 432 | 205 | 349 | 228 | ||||||||||||||||||
| Expense Reimbursement- Hines and its affiliates (with respect to management and operations of the Company's properties) | 967 | 472 | 2,761 | 1,374 | 487 | 235 | ||||||||||||||||||
| Total | $ | 14,676 | $ | 5,870 | $ | 40,933 | $ | 15,179 | $ | 33,435 | $ | 26,022 | ||||||||||||
| (1) | Some or all of these fees may be reallowed to participating broker dealers rather than being retained by the Dealer Manager. |
| (2) | Includes amounts the Advisor paid on behalf of the Company such as general and administrative expenses and acquisition-related expenses. These amounts are generally reimbursed to the Advisor during the month following the period in which they are incurred. |
| (3) | Through its ownership of the special limited partner interest in the Operating Partnership, the Advisor is entitled to an annual performance participation allocation of 12.5% of the Operating Partnership’s total return. Total return is defined as distributions paid or accrued plus the change in net asset value of the Company’s shares of common stock for the applicable period. This performance participation allocation is subject to the Company earning a 5% total return annually (as defined above), after considering the effect of any losses carried forward from the prior period (as defined in the Operating Partnership agreement). The performance participation allocation accrues monthly and is payable after the completion of each calendar year. |
| (4) | Includes amounts paid related to the Hines Credit Facility. |
8. FAIR VALUE MEASUREMENTS
Fair values determined by Level 1 inputs utilize quoted prices (unadjusted) in active markets for identical assets or liabilities the Company has the ability to access. Fair values determined by Level 2 inputs utilize inputs other than quoted prices included in Level 1 that are observable for the asset or liability, either directly or indirectly. Level 2 inputs include quoted prices for similar assets and liabilities in active markets and inputs other than quoted prices observable for the asset or liability, such as interest rates and yield curves observable at commonly quoted intervals. Level 3 inputs are unobservable inputs for the asset or liability, and include situations where there is little, if any, market activity for the asset or liability. In instances in which the inputs used to measure fair value may fall into different levels of the fair value hierarchy, the level in the fair value hierarchy within which the fair value measurement in its entirety has been determined is based on the lowest level input significant to the fair value measurement in its entirety. The Company’s assessment of the significance of a particular input to the fair value measurement in its entirety requires judgment, and considers factors specific to the asset or liability.
18
Financial Instruments Measured on a Recurring Basis
As described in “Note 5 — Derivative Instruments,” the Company entered into several interest rate contracts as economic hedges against the variability of future interest rates on its variable interest rate borrowings. The valuation of these derivative instruments is determined based on assumptions that management believes market participants would use in pricing, using widely accepted valuation techniques including discounted cash flow analysis on the expected cash flows of each derivative. This analysis reflects the contractual terms of the derivatives, including the period to maturity, and uses observable market-based inputs, including interest rate curves and implied volatilities. The fair values of interest rate contracts have been determined using the market standard methodology of netting the discounted future fixed cash receipts (or payments) and the discounted expected variable cash payments (or receipts). The variable cash payments (or receipts) are based on an expectation of future interest rates (forward curves) derived from observable market interest rate curves.
Although the Company has determined the majority of the inputs used to value its interest rate contracts fall within Level 2 of the fair value hierarchy, the credit valuation adjustments associated with its derivatives utilize Level 3 inputs, such as estimates of current credit spreads, to evaluate the likelihood of default by the Company and its counterparties. In adjusting the fair values of its derivative contracts for the effect of nonperformance risk, the Company has considered the impact of netting and any applicable credit enhancements, such as collateral postings, thresholds and guarantees. However, as of September 30, 2019 and 2018, the Company has assessed the significance of the impact of the credit valuation adjustments on the overall valuation of its derivative positions and has determined that the credit valuation adjustments are not significant to the overall valuations of its derivatives. As a result, the Company has determined its derivative valuations are classified in Level 2 of the fair value hierarchy.
Additionally, as described in “Note 5 — Derivative Instruments,” the Company has entered into foreign currency forward contracts as economic hedges against the variability of foreign exchange rates. The valuation of these forward contracts is determined based on assumptions that management believes market participants would use in pricing, using widely accepted valuation techniques, including discounted cash flow analysis on the expected cash flows of each derivative. This analysis reflects the contractual terms of the derivatives, including the period to maturity, and uses observable market-based inputs, including currency exchange rate curves and implied volatilities. The Company has determined its foreign currency forward contracts valuations are classified in Level 2 of the fair value hierarchy, as they are based on observable inputs but are not traded in active markets.
In the fourth quarter of 2018, the Company made its initial investments in real estate-related securities, which consist of common equities, preferred equities and debt investments of publicly traded REITs. The Company has elected to classify these investments as trading securities and carry such investments at fair value. The following table summarizes activity for the Company’s real estate-related securities measured at fair value on a recurring basis, and excludes balances of uninvested cash in our managed account of $1.4 million and $62,000 as of September 30, 2019 and December 31, 2018, respectively.
| Basis of Fair Value Measurements | ||||||||||||||||||
| As of | Description | Fair Value of Assets | Quoted Prices In Active Markets for Identical Items (Level 1) | Significant Other Observable Inputs (Level 2) | Significant Unobservable Inputs (Level 3) | |||||||||||||
| September 30, 2019 | Investments in real estate-related securities | $ | 36,222 | $ | 36,222 | $ | — | $ | — | |||||||||
| December 31, 2018 | Investments in real estate-related securities | $ | 9,599 | $ | 9,599 | $ | — | $ | — | |||||||||
19
Financial Instruments Fair Value Disclosures
As of September 30, 2019, the Company estimated that the fair value of its notes payable, excluding deferred financing costs, which had a book value of $743.8 million, was $741.0 million. As of December 31, 2018, the Company estimated that the fair value of its notes payable, excluding deferred financing costs, which had a book value of $545.8 million, was $540.3 million. Management has utilized available market information such as interest rate and spread assumptions of notes payable with similar terms and remaining maturities, to estimate the amounts required to be disclosed. Although the Company has determined that the majority of the inputs used to value its notes payable fall within Level 2 of the fair value hierarchy, the credit quality adjustments associated with its fair value of notes payable utilize Level 3 inputs. However, the Company has assessed the significance of the impact of the credit quality adjustments on the overall valuations of the fair market value of its notes payable and has determined they are not significant. Other financial instruments not measured at fair value on a recurring basis include cash and cash equivalents, restricted cash, tenant and other receivables, accounts payable and accrued expenses, other liabilities, due to affiliates and distributions payable. The carrying value of these items reasonably approximates their fair value based on their highly-liquid nature and/or short-term maturities. Due to the short-term nature of these instruments, Level 1 inputs are utilized to estimate the fair value of the cash and cash equivalents and restricted cash and Level 2 inputs are utilized to estimate the fair value of the remaining financial instruments.
20
9. REPORTABLE SEGMENTS
As described previously, the Company invests the net proceeds from its public offerings into its portfolio of quality commercial real estate properties and other real estate investments throughout the United States and internationally. The Company’s current business consists of owning, operating, acquiring, developing, investing in, and disposing of real estate assets and all of the Company’s consolidated revenues and property operating expenses are from these real estate properties.
Management evaluates the operating performance of each of its real estate properties at an individual investment level and considers each investment to be an operating segment. The Company has aggregated its operating segments into seven reportable segments: domestic office investments, domestic residential/living investments, domestic retail investments, domestic industrial investments, international industrial investments, international office investments, and international residential/living investments.
The tables below provide additional information related to each of the Company’s segments (in thousands) and a reconciliation to the Company’s net income (loss), as applicable. “Corporate-Level Accounts” includes amounts incurred by the corporate-level entities which are not allocated to any of the reportable segments.
| Three Months Ended September 30, | Nine Months Ended September 30, | ||||||||||||||
| 2019 | 2018 | 2019 | 2018 | ||||||||||||
| Total Revenue | |||||||||||||||
| Domestic office investments | $ | 4,108 | $ | 4,109 | $ | 12,445 | $ | 12,246 | |||||||
| Domestic residential/living investments | 2,820 | 1,467 | 8,293 | 3,910 | |||||||||||
| Domestic retail investments | 5,587 | 5,262 | 15,439 | 15,316 | |||||||||||
| Domestic industrial investments | 1,088 | 1,254 | 3,275 | 4,547 | |||||||||||
| International industrial investments | 8,033 | — | 19,368 | — | |||||||||||
| International office investments | 2,623 | 1,947 | 6,413 | 6,009 | |||||||||||
| International residential/living investments | 1,249 | 1,839 | 5,567 | 6,553 | |||||||||||
| Total Revenue | $ | 25,508 | $ | 15,878 | $ | 70,800 | $ | 48,581 | |||||||
For the three and nine months ended September 30, 2019 and 2018, the Company’s total revenue was attributable to the following countries:
| Three Months Ended September 30, | Nine Months Ended September 30, | ||||||||||
| 2019 | 2018 | 2019 | 2018 | ||||||||
| Total Revenue | |||||||||||
| United States | 52 | % | 76 | % | 56 | % | 74 | % | |||
| The Netherlands | 28 | % | — | % | 24 | % | — | % | |||
| Ireland | 14 | % | 17 | % | 12 | % | 18 | % | |||
| United Kingdom | 3 | % | 7 | % | 5 | % | 8 | % | |||
| Germany | 3 | % | — | % | 3 | % | — | % | |||
| Poland | N/A* | — | % | N/A* | — | % | |||||
* Less than 1%
21
For the three and nine months ended September 30, 2019 and 2018, the Company’s property revenues in excess of expenses by segment were as follows (in thousands):
| Three Months Ended September 30, | Nine Months Ended September 30, | ||||||||||||||
| 2019 | 2018 | 2019 | 2018 | ||||||||||||
Property revenues in excess of expenses (1) | |||||||||||||||
| Domestic office investments | $ | 2,675 | $ | 2,756 | $ | 8,384 | $ | 8,328 | |||||||
| Domestic residential/living investments | 1,471 | 991 | 4,255 | 2,582 | |||||||||||
| Domestic retail investments | 3,334 | 3,426 | 8,962 | 9,833 | |||||||||||
| Domestic industrial investments | 836 | 1,015 | 2,495 | 3,535 | |||||||||||
| International industrial investments | 4,888 | — | 11,209 | — | |||||||||||
| International office investments | 1,896 | 1,563 | 4,376 | 4,688 | |||||||||||
| International residential/living investments | 320 | 747 | 3,386 | 3,986 | |||||||||||
| Property revenues in excess of expenses | $ | 15,420 | $ | 10,498 | $ | 43,067 | $ | 32,952 | |||||||
| (1) | Revenues less property operating expenses, real property taxes and property management fees. |
As of September 30, 2019 and December 31, 2018, the Company’s total assets by segment were as follows (in thousands):
| September 30, 2019 | December 31, 2018 | ||||||
| Total Assets | |||||||
| Domestic office investments | $ | 126,608 | $ | 130,021 | |||
| Domestic residential/living investments | 121,098 | 126,175 | |||||
| Domestic retail investments | 292,456 | 199,819 | |||||
| Domestic industrial investments | 52,049 | 51,103 | |||||
| International industrial investments | 377,324 | 190,001 | |||||
| International office investments | 117,552 | 122,471 | |||||
| International residential/living investments | 201,989 | 111,803 | |||||
| Corporate-level accounts | 65,348 | 17,436 | |||||
| Total Assets | $ | 1,354,424 | $ | 948,829 | |||
As of September 30, 2019 and December 31, 2018, the Company’s total assets were attributable to the following countries:
| September 30, 2019 | December 31, 2018 | ||||
| Total Assets | |||||
| United States | 49 | % | 55 | % | |
| The Netherlands | 20 | % | 15 | % | |
| Ireland | 12 | % | 18 | % | |
| United Kingdom | 12 | % | 7 | % | |
| Germany | 3 | % | 5 | % | |
| Poland | 4 | % | — | % | |
22
For the three and nine months ended September 30, 2019 and 2018 the Company’s reconciliation of the Company’s property revenues in excess of expenses to the Company’s net income (loss) is as follows (in thousands):
| Three Months Ended September 30, | Nine Months Ended September 30, | ||||||||||||||
| 2019 | 2018 | 2019 | 2018 | ||||||||||||
| Reconciliation to property revenue in excess of expenses | |||||||||||||||
| Net income (loss) | $ | (1,773 | ) | $ | (2,782 | ) | $ | (9,222 | ) | $ | 7,185 | ||||
| Depreciation and amortization | 9,696 | 6,949 | 28,765 | 21,249 | |||||||||||
| Acquisition related expenses | 83 | — | 100 | 144 | |||||||||||
| Asset management fees | 2,177 | 1,253 | 5,465 | 3,674 | |||||||||||
| Performance participation allocation | 1,053 | 1,237 | 3,650 | 4,013 | |||||||||||
| General and administrative expenses | 972 | 763 | 2,767 | 2,275 | |||||||||||
| (Gain) loss on derivative instruments | 97 | 106 | 1,284 | 153 | |||||||||||
| (Gain) loss on real estate-related securities | (1,199 | ) | — | (2,527 | ) | — | |||||||||
| Gain on sale of real estate | — | — | — | (14,491 | ) | ||||||||||
| Foreign currency (gains) losses | 1,186 | 67 | 1,522 | 382 | |||||||||||
| Interest expense | 4,257 | 2,845 | 12,772 | 8,336 | |||||||||||
| Interest income | (624 | ) | (59 | ) | (993 | ) | (106 | ) | |||||||
| (Benefit) provision for income taxes | (505 | ) | 119 | (516 | ) | 138 | |||||||||
| Total property revenues in excess of expenses | $ | 15,420 | $ | 10,498 | $ | 43,067 | $ | 32,952 | |||||||
23
10. SUPPLEMENTAL CASH FLOW DISCLOSURES
Supplemental cash flow disclosures for the nine months ended September 30, 2019 and 2018 (in thousands):
| Nine Months Ended September 30, | |||||||
| 2019 | 2018 | ||||||
| Supplemental Disclosure of Cash Flow Information | |||||||
| Cash paid for interest | $ | 11,593 | $ | 7,784 | |||
| Supplemental Schedule of Non-Cash Investing and Financing Activities | |||||||
| Distributions declared and unpaid | $ | 3,402 | $ | 1,913 | |||
| Distributions reinvested | $ | 12,567 | $ | 8,959 | |||
| Shares tendered for redemption | $ | 1,233 | $ | 1,360 | |||
| Non-cash net liabilities assumed | $ | 8,299 | $ | 1,146 | |||
| Offering costs payable to the Advisor | $ | 3,109 | $ | 2,213 | |||
| Distribution and stockholder servicing fees payable to the Dealer Manager | $ | 14,056 | $ | 960 | |||
| Accrued capital additions | $ | 2,115 | $ | 2,385 | |||
| Accrued acquisition costs | $ | 2,856 | $ | 1,730 | |||
11. COMMITMENTS AND CONTINGENCIES
The Company may be subject to various legal proceedings and claims that arise in the ordinary course of business. These matters are generally covered by insurance. While the resolution of these matters cannot be predicted with certainty, management believes the final outcome of such matters will not have a material adverse effect on the Company’s condensed consolidated financial statements.
12. SUBSEQUENT EVENTS
The Alloy
In October 2019, the Company entered into a purchase and sale agreement to purchase The Alloy, a student-dominated apartment property located in College Park, Maryland. The contract purchase price for The Alloy is expected to be approximately $98.0 million, exclusive of transaction costs and closing prorations. The Company funded a $4.0 million earnest money deposit in November 2019. There is no guarantee that this sale will be consummated and the Company's deposit may not be refunded in such event. The Company expects the closing of this acquisition to occur during the fourth quarter of 2019, subject to a number of closing conditions. However, the Company can provide no assurance that this acquisition will close on the expected timeline or at all.
Domain Apartments
In October 2019, the Company entered into a contract to sell the Domain Apartments, a multi-family community located in Henderson, Nevada. The contract sales price for the Domain Apartments is $80.1 million. We acquired the Domain Apartments in January 2016 for a purchase price of $58.2 million, excluding transaction costs and working capital reserves. The Company expects the closing of this sale to occur during the fourth quarter of 2019, however, the Company can provide no assurance that this sale will close on the expected timeline or at all.
Charles Tyrwhitt DC
In November 2019, the Company acquired Charles Tyrwhitt DC from M&G Real Estate. The net purchase price was £15.5 million, (approximately $19.9 million assuming a rate of $1.286 per GBP as of the acquisition date), exclusive of transaction costs and closing prorations. Charles Tyrwhitt DC is an industrial logistics property located in Milton Keynes, United Kingdom consisting of 139,387 square feet. The property currently has a 100% occupancy rate. M&G Real Estate is not affiliated with The Company or its affiliates.
*****
24
Item 2. Management’s Discussion and Analysis of Financial Condition and Results of Operations
The following discussion and analysis of our financial condition and results of operations should be read in conjunction with our unaudited condensed consolidated financial statements and the notes thereto included in Item 1 in this Quarterly Report on Form 10-Q. The following discussion should also be read in conjunction with our audited consolidated financial statements and the notes thereto and “Management’s Discussion and Analysis of Financial Condition and Results of Operations” included in our Annual Report on Form 10-K for the year ended December 31, 2018.
Cautionary Note Regarding Forward-Looking Statements
This Quarterly Report on Form 10-Q includes forward-looking statements within the meaning of Section 27A of the Securities Act of 1933 (the “Securities Act”), as amended, and Section 21E of the Securities Exchange Act of 1934, as amended (the “Exchange Act”), as amended. Such statements include statements concerning future financial performance and distributions, future debt and financing levels, acquisitions and investment objectives, payments to Hines Global REIT II Advisors LP (the “Advisor”), and its affiliates and other plans and objectives of management for future operations or economic performance, or assumptions or forecasts related thereto as well as all other statements that are not historical statements. These statements are only predictions. We caution that forward-looking statements are not guarantees. Actual events or our investments and results of operations could differ materially from those expressed or implied in forward-looking statements. Forward-looking statements are typically identified by the use of terms such as “may,” “should,” “expect,” “could,” “intend,” “plan,” “anticipate,” “estimate,” “believe,” “continue,” “predict,” “potential” or the negative of such terms and other comparable terminology.
The forward-looking statements included in this Quarterly Report on Form 10-Q are based on our current expectations, plans, estimates, assumptions and beliefs that involve numerous risks and uncertainties. Assumptions relating to the foregoing involve judgments with respect to, among other things, future economic, competitive and market conditions, the availability of future financing and future business decisions, all of which are difficult or impossible to predict accurately and many of which are beyond our control. Any of the assumptions underlying forward-looking statements could prove to be inaccurate. To the extent that our assumptions differ from actual results, our ability to meet such forward-looking statements, including our ability to generate positive cash flow from operations, pay distributions to our shareholders and maintain the value of any real estate investments and real estate-related investments in which we may hold an interest in the future, may be significantly hindered.
The following are some of the risks and uncertainties, which could cause actual results to differ materially from those presented in certain forward-looking statements:
| — | Whether we will have the opportunity to invest offering and distribution reinvestment plan proceeds to acquire properties or other investments or whether such proceeds will be needed to redeem shares or for other purposes, and if proceeds are available for investment, our ability to make such investments in a timely manner and at appropriate amounts that provide acceptable returns; |
| — | Competition for tenants and real estate investment opportunities, including competition with other programs sponsored by or affiliated with Hines Interests Limited Partnership (“Hines”); |
| — | Our reliance on our Advisor, Hines and affiliates of Hines for our day-to-day operations and the selection of real estate investments, and our Advisor’s ability to attract and retain high-quality personnel who can provide service at a level acceptable to us; |
| — | Our ability to complete acquisitions of properties under contract; |
| — | Risks associated with conflicts of interests that result from our relationship with our Advisor and Hines, as well as conflicts of interests certain of our officers and directors face relating to the positions they hold with other entities; |
| — | The potential need to fund tenant improvements, lease-up costs or other capital expenditures, as well as increases in property operating expenses and costs of compliance with environmental matters or discovery of previously undetected environmentally hazardous or other undetected adverse conditions at our properties; |
| — | The availability and timing of distributions we may pay is uncertain and cannot be assured; |
25
| — | Our distributions have been paid using cash flows from financing activities, including proceeds from our public offering, as well as cash from the waiver of fees by our Advisor, and some or all of the distributions we pay in the future may be paid from similar sources or sources such as cash advances by our Advisor, cash resulting from a waiver or deferral of fees, borrowings and/or proceeds from the offering. When we pay distributions from sources other than our cash flow from operations, we will have less funds available for the acquisition of properties, and your overall return may be reduced; |
| — | Risks associated with debt and our ability to secure financing; |
| — | Risks associated with adverse changes in general economic or local market conditions, including terrorist attacks and other acts of violence, which may affect the markets in which we and our tenants operate; |
| — | Catastrophic events, such as hurricanes, earthquakes, tornadoes and terrorist attacks; and our ability to secure adequate insurance at reasonable and appropriate rates; |
| — | The failure of any bank in which we deposit our funds could reduce the amount of cash we have available to pay distributions and make additional investments; |
| — | Changes in governmental, tax, real estate and zoning laws and regulations and the related costs of compliance and increases in our administrative operating expenses, including expenses associated with operating as a public company; |
| — | International investment risks, including the burden of complying with a wide variety of foreign laws and the uncertainty of such laws, the tax treatment of transaction structures, political and economic instability, foreign currency fluctuations, and inflation and governmental measures to curb inflation may adversely affect our operations and our ability to make distributions; |
| — | The lack of liquidity associated with our assets; and |
| — | Our ability to qualify as a real estate investment trust (“REIT”) for U.S. federal income tax purposes. |
These risks are more fully discussed in, and all forward-looking statements should be read in light of, all of the risk factors under the heading “Risk Factors” in our Annual Report on Form 10-K for the year ended December 31, 2018.
You are cautioned not to place undue reliance on any forward-looking statements included in this Quarterly Report on Form 10-Q. All forward-looking statements are made as of the date of this Quarterly Report on Form 10-Q and the risk that actual results will differ materially from the expectations expressed in this Quarterly Report on Form 10-Q may increase with the passage of time. In light of the significant uncertainties inherent in the forward-looking statements included in this Quarterly Report on Form 10-Q, the inclusion of such forward-looking statements should not be regarded as a representation by us or any other person that the objectives and plans set forth in this Quarterly Report on Form 10-Q will be achieved. All subsequent written and oral forward-looking statements attributable to us or persons acting on our behalf are expressly qualified in their entirety by reference to these risks and uncertainties. Each forward-looking statement speaks only as of the date of the particular statement, and we do not undertake to update any forward-looking statement.
The Company
Hines Global Income Trust, Inc. (“Hines Global”), formerly known as Hines Global REIT II, Inc., was formed as a Maryland corporation on July 31, 2013, for the purpose of investing in a diversified portfolio of quality commercial real estate properties and other real estate investments located throughout the United States and internationally. Hines Global is sponsored by Hines Interests Limited Partnership (“Hines”), a fully integrated global real estate investment and management firm that has acquired, developed, owned, operated and sold real estate for over 60 years. The Company has elected to be taxed as a REIT for U.S. federal income tax purposes beginning with its taxable year ended December 31, 2015.
We raise capital for our investments through public offerings of our common stock. We commenced our initial public offering of up to $2.5 billion in shares of our common stock (the “Initial Offering”) in August 2014 and commenced our second public offering of up to $2.5 billion in shares of common stock including $500.0 million of shares offered under our distribution reinvestment plan (the “Follow-On Offering”) in December 2017. It is our intention to conduct a continuous offering for an indefinite period of time by conducting additional offerings of our shares of common stock following the conclusion of the Follow-On Offering. As of November 13, 2019, we had received gross offering proceeds of $842.3 million from the sale of 83.8 million shares through our public offerings, including shares issued pursuant to our distribution reinvestment plan.
26
Portfolio Highlights
We intend to meet our primary investment objectives by investing in a portfolio of quality commercial real estate properties and other real estate investments that relate to properties that are generally diversified by geographic area, lease expirations and tenant industries. As of September 30, 2019, we owned fifteen real estate investments consisting of 8.5 million square feet that were 96% leased. The following chart depicts the percentage of our portfolio’s investment types based on the estimated value of each real estate investment as of September 30, 2019 (“Estimated Values”), which are consistent with the values used to determine our net asset value (“NAV”) per share on that date.
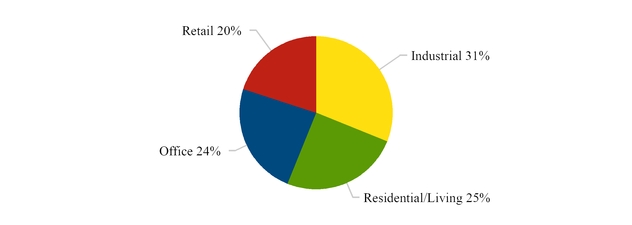
The following charts depict the location of our real estate investments as of September 30, 2019. Approximately 45% of our portfolio is located throughout the United States and approximately 55% is located internationally, based on the Estimated Values.
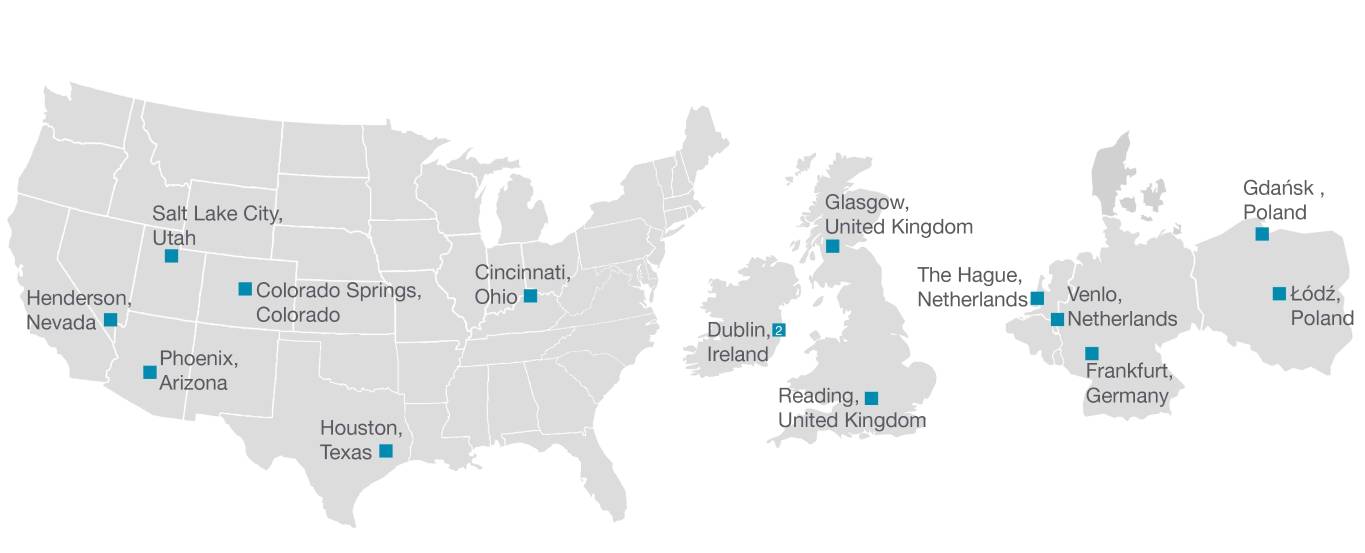
27
The following table provides additional information regarding each of our properties and is presented as of September 30, 2019.
| Property | Location | Investment Type | Date Acquired/ Net Purchase Price (in millions)(1) | Estimated Going-in Capitalization Rate (2) | Leasable Square Feet | Percent Leased | ||||||||
| Bishop’s Square | Dublin, Ireland | Office | 3/2015; $103.2 | 6.1% | 182,370 | 100 | % | |||||||
| Domain Apartments | Las Vegas, Nevada | Residential/Living | 1/2016; $58.1 | 5.5% | 331,038 | 96 | % | |||||||
| Cottonwood Corporate Center | Salt Lake City, Utah | Office | 7/2016; $139.2 | 6.9% | 487,492 | 97 | % | |||||||
| Goodyear Crossing II | Phoenix, Arizona | Industrial | 8/2016; $56.2 | 8.5% | 820,384 | 100 | % | |||||||
| Rookwood | Cincinnati, Ohio | Retail | 1/2017; $193.7 | 6.0% | 567,335 | 96 | % | |||||||
| Montrose Student Residences | Dublin, Ireland | Residential/Living | 3/2017; $40.6 | 5.5% | 53,835 | 100 | % | |||||||
| Queen’s Court Student Residences | Reading, United Kingdom | Residential/Living | 10/2017; $65.3 | 6.2% | 79,115 | 100 | % | |||||||
| Venue Museum District | Houston, Texas | Residential/Living | 9/2018; $72.9 | 3.9% | 294,964 | 95 | % | |||||||
| Fresh Park Venlo | Venlo, Netherlands | Industrial | 10/2018; $136.3 | 6.7% | 2,863,628 | 95 | % | |||||||
| Maintal Logistics | Frankfurt, Germany | Industrial | 12/2018; $43.8 | 5.7% | 387,253 | 96 | % | |||||||
| ABC Westland | The Hague, Netherlands | Industrial | 5/2019; $130.3 | 6.2% | 1,268,515 | 93 | % | |||||||
| Promenade Shops at Briargate | Colorado Springs, Colorado | Retail | 9/2019; $93.2 | 7.7% | 236,539 | 91 | % | |||||||
| Segro Logistics Park Gdańsk | Gdańsk, Poland | Industrial | 9/2019; $29.9 | 6.7% | 346,996 | 100 | % | |||||||
| Łódź Urban Logistics | Łódź, Poland | Industrial | 9/2019; $25.4 | 6.6% | 389,233 | 100 | % | |||||||
| Glasgow West End | Glasgow, United Kingdom | Residential/Living | 9/2019; $89.7 | 5.5% | 232,425 | 100 | % | |||||||
| Total for All Investments | 8,541,122 | 96 | % | |||||||||||
| (1) | For acquisitions denominated in a foreign currency, amounts have been translated to U.S. dollars at a rate based on the exchange rate in effect on the acquisition date. |
| (2) | The estimated going-in capitalization rate is determined as of the date of acquisition by dividing the projected property revenues in excess of expenses for the first fiscal year by the net purchase price (excluding closing costs and taxes). Property revenues in excess of expenses includes all projected operating revenues (rental income, tenant reimbursements, parking and any other property-related income) less all projected operating expenses (property operating and maintenance expenses, property taxes, insurance and property management fees). The projected property revenues in excess of expenses includes assumptions which may not be indicative of the actual future performance of the property, including the assumption that the tenants will perform under their lease agreements during the 12 months following our acquisition of the properties and assumptions concerning estimates of timing and rental rates related to re-leasing vacant space. |
28
NAV and Distributions
We began determining an NAV per share on a monthly basis as of the end of January 2018. Since that time, our NAV per share has increased from $9.69 as of August 31, 2017 to $10.11 as of September 30, 2019 as illustrated in the chart below. Set forth below is additional historical information regarding our NAV per share since February 29, 2016 (the date as of which our board of directors first determined an NAV per share).
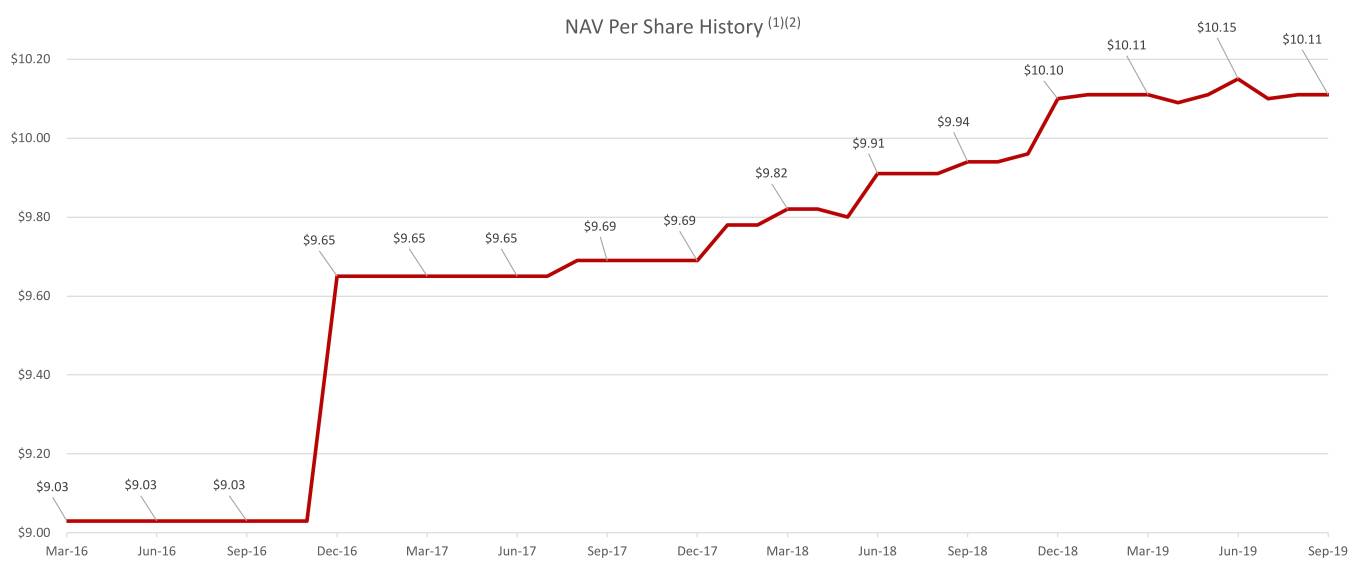
| 1. | Please see our Current Report on Form 8-K filed with the Securities and Exchange Commission (the “SEC”) on October 17, 2019 for additional information concerning the methodology used to determine, and the limitations of, the NAV per share as of September 30, 2019. Please see our Annual Reports on Form 10-K for the years ended December 31, 2018 and December 31, 2017 as well as our Current Reports on Form 8-K for additional information concerning the NAV per share determined as of prior dates. |
| 2. | Our board of directors determined an NAV per share of $9.03 as of February 29, 2016. Prior thereto, $8.92 was considered to be the “net investment value” per share of our common stock, which was equal to the offering price per share of $10.00 in effect at that time, as arbitrarily determined by our board of directors, net of the applicable selling commissions, dealer manager fees and issuer costs. |
Set forth below is information regarding our gross annualized distribution rate, excluding any applicable distribution and stockholder servicing fees, since October 1, 2014 (the date our board first authorized distributions to be declared). As illustrated in the chart below, we increased our gross annualized distribution rate from $0.61 per share to $0.625 per share for the three and nine months ended September 30, 2019.
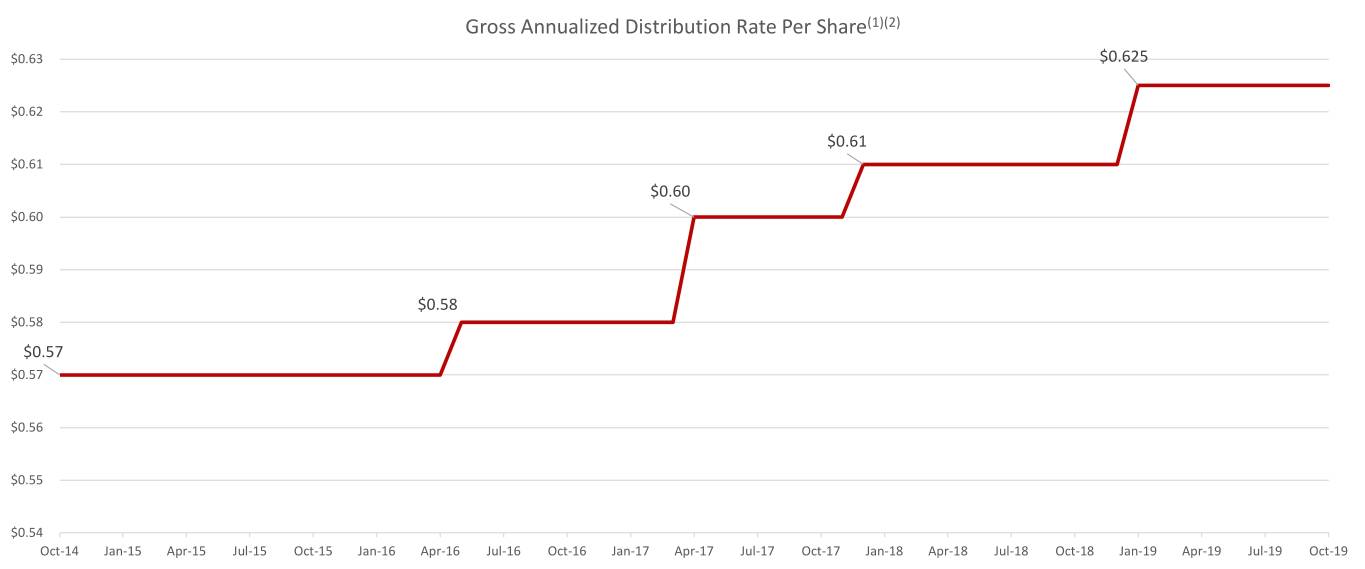
| 1. | With the authorization of our board of directors, we declared distributions as of daily record dates and paid them on a monthly basis through December 31, 2017. Beginning in January 2018, we began, and intend to continue, to declare distributions as of monthly record dates and pay them on a monthly basis. |
29
| 2. | We have not generated and we may continue to be unable to generate sufficient cash flows from operations to fully fund distributions. Therefore, some or all of our distributions have been and may continue to be paid, and during the offering phase, are likely to be paid at least partially from other sources, such as proceeds from the sales of assets, proceeds from our debt financings, proceeds from our public offerings, cash advances by our Advisor and/or cash resulting from a waiver or deferral of fees. See “— Financial Condition, Liquidity and Capital Resources” for additional information concerning our distributions. |
Performance Summary of Share Classes
The table below discloses the total returns for the classes of shares that are no longer available for investment in our current public offering. The total returns shown reflect the percent change in the NAV per share from the beginning of the applicable period, plus the amount of any distribution per share declared during the period. The total returns shown are calculated assuming reinvestment of distributions pursuant to our distribution reinvestment plan, are derived from unaudited financial information, and are net of all Hines expenses, including general and administrative expenses, transaction related expenses, management fees, the performance participation allocation, and share class specific fees, but exclude the impact of early redemption deductions on the redemption of shares that have been outstanding for less than one year. The inception dates for the Class AX Shares, Class TX Shares, and Class IX Shares are October 1, 2014, September 1, 2015, and May 1, 2017, respectively. The returns have been prepared using unaudited data and valuations of the underlying investments in our portfolio, which are estimates of fair value and form the basis for our NAV per share. Valuations based upon unaudited reports from the underlying investments may be subject to later adjustments, may not correspond to realized value and may not accurately reflect the price at which assets could be liquidated.
| As of September 30, 2019 | |||||||||
| Shares Class | 1-Year | 3-Year | ITD | ||||||
| Class AX Shares (No Sales Load) | 8.17 | % | 10.50 | % | 9.05 | % | |||
| Class AX Shares (With Sales Load) | N/A | 6.95 | % | 6.58 | % | ||||
| Class TX Shares (No Sales Load) | 7.10 | % | 9.40 | % | 8.68 | % | |||
| Class TX Shares (With Sales Load) | N/A | 7.91 | % | 7.15 | % | ||||
| Class IX Shares (No Sales Load) | 7.90 | % | N/A | 8.20 | % | ||||
| Class IX Shares (With Sales Load) | N/A | N/A | 7.83 | % | |||||
The table below discloses the total returns for the classes of shares that are available for investment in our current public offering. Class I Shares and Class D Shares are sold without an upfront sales load. The total returns shown reflect the percent change in the NAV per share from the beginning of the applicable period, plus the amount of any distribution per share declared during the period. The total returns shown are calculated assuming reinvestment of distributions pursuant to our distribution reinvestment plan, are derived from unaudited financial information, and are net of all Hines Global expenses, including general and administrative expenses, transaction related expenses, management fees, the performance participation allocation, and share class specific fees, but exclude the impact of early redemption deductions on the redemption of shares that have been outstanding for less than one year. The inception date for Class I, Class D, Class S and Class T Shares is December 6, 2017. Class T Shares and Class S Shares listed as (With Sales Load) reflect the returns after the maximum up-front selling commission and dealer manager fees, which total 3.5% for both share classes. Class T Shares and Class S Shares listed as (No Sales Load) exclude up-front selling commissions and dealer manager fees. The returns have been prepared using unaudited data and valuations of the underlying investments in our portfolio, which are estimates of fair value and form the basis for our NAV per share. Valuations based upon unaudited reports from the underlying investments may be subject to later adjustments, may not correspond to realized value and may not accurately reflect the price at which assets could be liquidated.
| As of September 30, 2019 | ||||||
| Shares Class | 1-Year | ITD | ||||
| Class I Shares | 8.17 | % | 8.98 | % | ||
| Class D Shares | 7.90 | % | 8.71 | % | ||
| Class S Shares (No Sales Load) | 7.10 | % | 7.90 | % | ||
| Class S Shares (With Sales Load) | 3.35 | % | 5.72 | % | ||
| Class T Shares (No Sales Load) | 7.10 | % | 7.90 | % | ||
| Class T Shares (With Sales Load) | 3.35 | % | 5.72 | % | ||
30
Critical Accounting Policies
Each of our critical accounting policies involve the use of estimates that require management to make assumptions that are subjective in nature. Management relies on its experience, collects historical and current market data, and analyzes these assumptions in order to arrive at what it believes to be reasonable estimates. In addition, application of these accounting policies involves the exercise of judgment regarding assumptions as to future uncertainties. Actual results could materially differ from these estimates. For a discussion of recent accounting pronouncements, see Note 2 — Summary of Significant Accounting Policies to the accompanying condensed consolidated financial statements. Also, a disclosure of our critical accounting policies is included in our Annual Report on Form 10-K for the year ended December 31, 2018 under the heading “Management’s Discussion and Analysis of Financial Condition and Results of Operations.” There have been no significant changes to our policies during 2019.
Financial Condition, Liquidity and Capital Resources
Our principal demands for funds are to make real estate investments, including investments in real estate-related securities and capital expenditures, for the payment of operating expenses and distributions, and for the payment of principal and interest on any indebtedness we incur. Generally, we expect to meet operating cash needs from our cash flows from operating activities, and we expect to fund our investments using proceeds from our public offerings, debt proceeds and proceeds from the sales of real estate investments. As described above under the heading “—NAV and Distributions,” we may be required to continue to fund distributions from sources other than cash flows from operations.
We expect that once we have fully invested the proceeds of our public offerings and other potential subsequent offerings, our debt financing, including our pro rata share of the debt financing of entities in which we invest, will be in the range of approximately 40% to 60% of the aggregate value of our real estate investments and other assets. Financing for acquisitions and investments may be obtained at the time an asset is acquired or an investment is made or at such later time as determined to be appropriate. In addition, debt financing may be used from time to time for property improvements, lease inducements, tenant improvements, purchase of real estate-related securities and other working capital needs, including the payment of distributions and redemptions. Our real estate-related securities portfolio may have embedded leverage, including through the use of reverse repurchase agreements and derivatives, including, but not limited to, total return swaps, securities lending arrangements and credit default swaps. Additionally, the amount of debt placed on an individual property or related to a particular investment, including our pro rata share of the amount of debt incurred by an individual entity in which we invest, may be less than 40% or more than 60% of the value of such property/investment or the value of the assets owned by such entity, depending on market conditions and other factors. Our aggregate borrowings, secured and unsecured, must be reasonable in relation to our net assets and must be reviewed by our board of directors at least quarterly. Further, our charter limits our borrowing to 300% of our net assets (which approximates 75% of the cost of our assets) unless any excess borrowing is approved by a majority of our independent directors and is disclosed to our stockholders in our next quarterly report along with justification for the excess. As of September 30, 2019 our portfolio was approximately 50% leveraged, based on the Estimated Values of our real estate investments owned as of that date, with a weighted average interest rate of 2.57%.
Notwithstanding the above, depending on market conditions and other factors, we may choose not to place debt on our portfolio or our assets and may choose not to borrow to finance our operations or to acquire properties. Any indebtedness we do incur will likely be subject to continuing covenants, and we will likely be required to make continuing representations and warranties about our company in connection with such debt. Moreover, some or all of our debt may be secured by some or all of our assets. If we default in the payment of interest or principal on any such debt, breach any representation or warranty in connection with any borrowing or violate any covenant in any loan document, our lender may accelerate the maturity of such debt requiring us to immediately repay all outstanding principal. If we are unable to make such payment, our lender could foreclose on our assets that are pledged as collateral to such lender. The lender could also sue us or force us into bankruptcy. Any such event would have a material adverse effect on the value of an investment in our common shares.
The following discussions provide additional details regarding our cash flows.
Cash Flows from Operating Activities
Our real estate properties generate cash flows in the form of rental revenues, which are used to pay property-level operating expenses, leasing costs and interest payments. Additionally, we incur corporate level costs and fees such as general and administrative expenses, asset management fees, and the performance participation allocation as well as interest expense on our credit facilities with Hines and JPMorgan.
31
Net cash from operating activities for the nine months ended September 30, 2019 decreased by $14.2 million as compared to the same period in the prior year. This change is primarily due to the payment of the performance participation allocation of $6.0 million accrued as of December 31, 2018 related to the year then ended, which was paid to the Advisor during the nine months ended September 30, 2019. This change is also attributable to an increase in costs associated with leasing activities, including tenant inducement payouts, during the nine months ended September 30, 2019 as compared to the same period in the prior year.
Cash Flows from Investing Activities
Net cash used in investing activities for the nine months ended September 30, 2019 and 2018 were primarily due to the following:
Nine months ended September 30, 2019
| • | Payment of $416.0 million, primarily related to the acquisitions of five real estate investments during the nine months ended September 30, 2019. |
| • | Capital expenditures of approximately $6.3 million at our real estate properties. |
| • | Payments of $38.1 million to purchase real estate-related securities. We also received proceeds of $14.0 million from the sales of real estate-related securities. |
Nine months ended September 30, 2018
| • | Payment of $72.1 million primarily related to the acquisition of Venue Museum District. |
| • | Capital expenditures of approximately $10.9 million primarily related to development work at Bishop’s Square, which was completed in July 2019, and various capital improvements at our other properties. |
| • | We received proceeds of $37.1 million from the sale of 2819 Loker Avenue East, a Class–A industrial property located in Carlsbad, California, on March 30, 2018. We sold 2819 Loker Avenue East for a contract sales price of $38.3 million and we acquired 2819 Loker Avenue East in December 2014 for a net purchase price of $25.4 million. |
Cash Flows from Financing Activities
Public Offerings
We raised gross proceeds of $296.9 million from our Follow-On Offering during the nine months ended September 30, 2019, excluding proceeds from the distribution reinvestment plan. We commenced our Follow-On Offering in December 2017, and during the nine months ended September 30, 2018 had not yet raised any gross proceeds. In addition, during the nine months ended September 30, 2019 and 2018, we redeemed $10.5 million and $8.5 million in shares of our common stock pursuant to our share redemption program, respectively.
In addition to the investing activities described previously, we have used proceeds from our public offerings to make certain payments to our Advisor, our Dealer Manager and Hines and their affiliates during the various phases of our organization and operation which include, without limitation, payments to our Dealer Manager for selling commissions, dealer manager fees, distribution and stockholder servicing fees and payments to our Advisor for reimbursement of organization and offering costs. During the nine months ended September 30, 2019 and 2018, we made payments of $9.2 million and $2.2 million, respectively, for selling commissions, dealer manager fees and distribution and stockholder servicing fees related to our Follow-On Offering. The increase in selling commissions, dealer manager fees and distribution and stockholder servicing fees for the nine months ended September 30, 2019 as compared to the same period in 2018 is due to the increase of capital raised since our restructuring and related modifications in our Follow-On Offering, which commenced in December 2017.
Until December 31, 2018, the Advisor advanced all of our organization and offering costs, consisting of issuer costs and certain underwriting costs (but excluding selling commissions, dealer manager fees and distribution and stockholder servicing fees) related to our public offerings, which totaled $9.0 million. In January 2019, we began reimbursing the Advisor in ratable amounts over 60 months for all such advanced expenses, as well as any organization and offering costs incurred subsequent to December 31, 2018, to the extent cumulative organization and offering costs paid by the Company do not exceed an amount equal to 2.5% of gross offering proceeds from our public offerings. The total reimbursement related to organization and offering costs, selling commissions, dealer manager fees and distribution and stockholder servicing fees may not exceed 15.0% of gross proceeds from our public offerings. For the nine months ended September 30, 2019, we reimbursed the Advisor $4.1 million for organization and offering costs.
32
Distributions
In January 2018, we began and intend to continue to declare distributions as of monthly record dates and pay them on a monthly basis. With the authorization of our board of directors, we declared monthly distributions from January 2019 through October 2019 at a gross distribution rate of $0.05208 per month for each share class less any applicable distribution and stockholder servicing fees. Distributions are made on all classes of the Company’s common stock at the same time. All distributions were paid in cash or reinvested in shares of the Company’s common stock for those stockholders participating in our distribution reinvestment plan and have been or will be paid or issued, respectively, on the first business day following the completion of the month to which they relate. Distributions reinvested pursuant to our distribution reinvestment plan were or will be reinvested in shares of the same class as the shares on which the distributions are made. Some or all of the cash distributions may be paid from sources other than cash flows from operations.
Distributions paid to stockholders during the nine months ended September 30, 2019 and 2018 were $23.1 million and $16.6 million, respectively, including those reinvested in shares pursuant to our distribution reinvestment plan. We have not generated and we may continue to be unable to generate sufficient cash flows from operations to fully fund distributions paid. Therefore, some or all of our distributions have been and may continue to be paid and during the offering phase, are likely to be paid at least partially from other sources, such as proceeds from the sales of assets, proceeds from our debt financings, proceeds from our public offerings, cash advances by our Advisor and/or cash resulting from a waiver or deferral of fees. We have not placed a cap on the amount of distributions that may be paid from any of these sources. For example, for the nine months ended September 30, 2019 and September 30, 2018, we funded 92% and 26% of total distributions with cash flows from other sources such as cash flows from investing activities, respectively, which may include proceeds from the sale of real estate and/or cash flows from financing activities, which may include offering proceeds.
The following table outlines our total distributions declared to stockholders for each quarter during 2019 and 2018, including the breakout between the distributions declared in cash and those reinvested pursuant to our distribution reinvestment plan (in thousands, except percentages).
| Stockholders | Distributions Paid With Cash Flows From Operating Activities (1) | ||||||||||||||||||
| Distributions for the Three Months Ended | Cash Distributions | Distributions Reinvested | Total Declared | ||||||||||||||||
| 2019 | |||||||||||||||||||
| September 30, 2019 | $ | 4,383 | $ | 5,325 | $ | 9,708 | $ | 1,992 | 21 | % | |||||||||
| June 30, 2019 | 3,647 | 4,415 | 8,062 | — | — | % | |||||||||||||
| March 31, 2019 | 3,090 | 3,614 | 6,704 | — | — | % | |||||||||||||
| Total | $ | 11,120 | $ | 13,354 | $ | 24,474 | $ | 1,992 | 8 | % | |||||||||
| 2018 | |||||||||||||||||||
| December 31, 2018 | $ | 2,765 | $ | 3,168 | $ | 5,933 | $ | 3,091 | 52 | % | |||||||||
| September 30, 2018 | 2,617 | 3,034 | 5,651 | 5,654 | 100 | % | |||||||||||||
| June 30, 2018 | 2,554 | 2,974 | 5,528 | 2,065 | 37 | % | |||||||||||||
| March 31, 2018 | 2,544 | 2,970 | 5,514 | 4,674 | 85 | % | |||||||||||||
| Total | $ | 10,480 | $ | 12,146 | $ | 22,626 | $ | 15,484 | 68 | % | |||||||||
| (1) | Includes distributions paid to noncontrolling interests. |
Debt Financings
As mentioned above under “—Financial Condition, Liquidity and Capital Resources,” our portfolio was approximately 50% leveraged as of September 30, 2019 (based on the Estimated Values). Our total loan principal outstanding had a weighted average interest rate of 2.57% as of September 30, 2019. Below is additional information regarding our loan activity for the nine months ended September 30, 2019 and 2018. See “Note 4 — Debt Financing” for additional information regarding our outstanding debt and our interest rate exposure.
Nine months ended September 30, 2019
| • | We received proceeds of $229.6 million in permanent mortgage financing as well as draws on our Revolving Credit Facility with JPMorgan. Use of these proceeds was primarily to provide cash for the acquisitions of real estate investments during the nine months ended September 30, 2019. We made draws of approximately $52.0 million |
33
and no payments on the Revolving Credit Facility with JPMorgan during the nine months ended September 30, 2019, resulting in an outstanding balance of $52.0 million as of September 30, 2019.
| • | We borrowed $81.0 million under the Hines Credit Facility primarily to provide cash for the acquisitions of real estate investments during the nine months ended September 30, 2019, and made payments of $99.0 million on this facility. We had an outstanding balance of $37.0 million under the Hines Credit Facility as of September 30, 2019. |
| • | We made payments of $1.2 million in financing costs primarily related to our mortgage loans. |
Nine months ended September 30, 2018
| • | We entered into $45.0 million of permanent mortgage financing related to the acquisition of Venue Museum District. |
| • | We made payments of $0.9 million in financing costs primarily related to the mortgage loan at Venue Museum District. |
| • | We made payments of principal of $1.3 million on the permanent mortgage financing related to Cottonwood Corporate Center. |
| • | We borrowed $90.5 million under the Hines Credit Facility primarily to provide cash for the acquisitions of Venue Museum District and Fresh Park Venlo and made payments of $26.7 million on this facility in April 2018 using proceeds received from the sale of 2819 Loker Avenue East. We had an outstanding balance of $75.0 million under this facility as of September 30, 2018. |
34
Results of Operations
Same Store Analysis
The following table presents the property-level revenues in excess of expenses for the three months ended September 30, 2019, as compared to the same period in 2018, by reportable segment. Same-store properties for the three months ended September 30, 2019 includes seven properties that were 98% leased as of September 30, 2019 and September 30, 2018. In total, property revenues in excess of expenses of the same-store properties decreased 7% for the three months ended September 30, 2019 as compared to the same period in 2018.
Below is additional information regarding our same-store results and other financial results with variances from the comparative period. All amounts are in thousands, except for percentages:
| Three Months Ended September 30, | Change | |||||||||||||
| 2019 | 2018 | $ | % | |||||||||||
Property revenues in excess of expenses(1) | ||||||||||||||
| Same-store properties | ||||||||||||||
| Domestic office investments | $ | 2,674 | $ | 2,756 | $ | (82 | ) | (3 | )% | |||||
| Domestic residential/living investments | 856 | 824 | 32 | 4 | % | |||||||||
| Domestic retail investments | 2,997 | 3,426 | (429 | ) | (2) | (13 | )% | |||||||
| Domestic industrial investments | 836 | 1,015 | (179 | ) | (3) | (18 | )% | |||||||
| International office investments | 1,896 | 1,563 | 333 | (4) | 21 | % | ||||||||
| International residential/living investments | 342 | 747 | (405 | ) | (5) | (54 | )% | |||||||
| Total same-store properties | $ | 9,601 | $ | 10,331 | $ | (730 | ) | (7 | )% | |||||
| Recent acquisitions | 5,819 | 169 | 5,650 | N/A* | ||||||||||
| Disposed properties | — | (2 | ) | 2 | (100 | )% | ||||||||
| Total property revenues in excess of expenses | $ | 15,420 | $ | 10,498 | $ | 4,922 | 47 | % | ||||||
* Not a meaningful percentage
| (1) | Property revenues in excess of expenses include total revenues less property operating expenses, real property taxes and property management fees. |
| (2) | The decrease is primarily due to a decline in revenue resulting from the early move-out of two tenants, as well as various increases in property operating expenses. |
| (3) | The decrease is related to the lease renewal at our domestic industrial property, which commenced during the fourth quarter of 2018 at a lower rental rate than the preceding lease. |
| (4) | The increase is primarily the result of revenue recognition of a new space at our international office property by one of the property’s major tenants. The lease commenced in June 2019. |
| (5) | The decrease is primarily due to a decline in revenue at one of our international student housing properties resulting from summer programs during the second quarter of 2018 that were discontinued prior to the second quarter of 2019. Our international student housing properties are typically seasonally vacant during the summer months. |
35
The following table presents the property-level revenues in excess of expenses for the nine months ended September 30, 2019, as compared to the same period in 2018, by reportable segment. Same-store properties for the nine months ended September 30, 2019 includes seven properties that were 98% leased as of September 30, 2019 and September 30, 2018. In total, property revenues in excess of expenses of the same-store properties decreased 8% for the nine months ended September 30, 2019 as compared to the same period in 2018.
Below is additional information regarding our same-store results and other financial results with variances from the comparative period. All amounts are in thousands, except for percentages:
| Nine Months Ended September 30, | Change | |||||||||||||
| 2019 | 2018 | $ | % | |||||||||||
Property revenues in excess of expenses(1) | ||||||||||||||
| Same-store properties | ||||||||||||||
| Domestic office investments | $ | 8,384 | $ | 8,328 | $ | 56 | 1 | % | ||||||
| Domestic residential/living investments | 2,543 | 2,414 | 129 | 5 | % | |||||||||
| Domestic retail investments | 8,624 | 9,833 | (1,209 | ) | (2) | (12 | )% | |||||||
| Domestic industrial investments | 2,495 | 3,052 | (557 | ) | (3) | (18 | )% | |||||||
| International office investments | 4,376 | 4,688 | (312 | ) | (7 | )% | ||||||||
| International residential/living investments | 3,408 | 3,986 | (578 | ) | (4) | (15 | )% | |||||||
| Total same-store properties | $ | 29,830 | $ | 32,301 | $ | (2,471 | ) | (8 | )% | |||||
| Recent acquisitions | 13,237 | 168 | 13,069 | N/A* | ||||||||||
| Disposed properties | — | 483 | (483 | ) | (100 | )% | ||||||||
| Total property revenues in excess of expenses | $ | 43,067 | $ | 32,952 | $ | 10,115 | 31 | % | ||||||
* Not a meaningful percentage
| (1) | Property revenues in excess of expenses include total revenues less property operating expenses, real property taxes and property management fees. |
| (2) | The decrease is primarily due to a decline in revenue resulting from the early move-out of two tenants, as well as various increases in property operating expenses. |
| (3) | The decrease is related to the lease renewal at our domestic industrial property, which commenced during the fourth quarter of 2018 at a lower rental rate than the preceding lease, including a period of free rent through March 2019. |
| (4) | The decrease is primarily due to a decline in revenue at one of our international student housing properties resulting from summer programs during the second quarter of 2018 that were discontinued prior to the second quarter of 2019. Our international student housing properties are typically seasonally vacant during the summer months. |
36
Other Changes
The table below includes additional information regarding changes in our results of operations for the three months ended September 30, 2019, including explanations for significant changes. All amounts are in thousands, except for percentages:
| Three Months Ended September 30, | Change | |||||||||||||
| 2019 | 2018 | $ | % | |||||||||||
| Other | ||||||||||||||
| Depreciation and amortization | $ | 9,696 | $ | 6,949 | $ | 2,747 | 40 | % | ||||||
| Acquisition related expenses | $ | 83 | $ | — | $ | 83 | 100 | % | ||||||
| Asset management fees | $ | 2,177 | $ | 1,253 | $ | 924 | 74 | % | ||||||
| Performance participation allocation | $ | 1,053 | $ | 1,237 | $ | (184 | ) | (15 | )% | |||||
| General and administrative expenses | $ | 972 | $ | 763 | $ | 209 | 27 | % | ||||||
| Gain (loss) on investments in real estate-related securities | $ | 1,199 | $ | — | $ | 1,199 | 100 | % | ||||||
| Foreign currency gains (losses) | $ | (1,186 | ) | $ | (67 | ) | $ | (1,119 | ) | N/A* | ||||
| Interest expense | $ | 4,257 | $ | 2,845 | $ | 1,412 | 50 | % | ||||||
| Benefit (provision) for income taxes | $ | 505 | $ | (119 | ) | $ | 624 | N/A* | ||||||
* Not a meaningful percentage
Depreciation and amortization: Depreciation and amortization expense increased for the three months ended September 30, 2019 compared to the three months ended September 30, 2018 primarily due to real estate investments acquired since September 30, 2018.
Asset management fees: Asset management fees increased for the three months ended September 30, 2019 as compared to the three months ended September 30, 2018 primarily due to real estate investments acquired since September 30, 2018.
Performance participation allocation: Performance participation allocation decreased for the three months ended September 30, 2019 compared to the three months ended September 30, 2018 primarily due to changes in our NAV per share between the periods. NAV per share decreased by $0.04 during the three months ended September 30, 2019, while an increase of $0.03 per share was seen during the three months ended September 30, 2018.
General and administrative expenses: General and administrative expenses increased for the three months ended September 30, 2019 compared to the three months ended September 30, 2018 primarily due to increased legal costs and shareholder costs. We generally expect our general and administrative expenses to increase as we continue raising capital from our Follow-On Offering.
Gain (loss) on investments in real estate-related securities: In the fourth quarter of 2018, the Company made its initial investments in real estate-related securities, which consist of common equities, preferred equities and debt investments of publicly traded REITs. These assets are valued on a recurring basis, which resulted in realized and unrealized gains for the three months ended September 30, 2019.
Foreign currency gains (losses): Foreign currency gains (losses) primarily reflects the effect of changes in foreign currency exchange rates on transactions that were denominated in currencies other than our functional currencies. During the three months ended September 30, 2019 and 2018, these losses were primarily related to the effect of remeasuring cash held in foreign currencies into U.S. dollars and the changes in exchange rates.
Interest expense: Interest expense increased for the three months ended September 30, 2019 due to an increase in our principal outstanding during the period resulting from real estate investments acquired and the entry into the JPMorgan Credit Facility since September 30, 2018.
Benefit (provision) for income taxes: Provision for income taxes changed from a $119,000 provision for the three months ended September 30, 2018 to a $505,000 benefit for the three months ended September 30, 2019 as a result of changes in our deferred tax assets and liabilities related to book / tax timing differences at our international subsidiaries.
37
The table below includes additional information regarding changes in our results of operations for the nine months ended September 30, 2019, including explanations for significant changes. All amounts are in thousands, except for percentages:
| Nine Months Ended September 30, | Change | |||||||||||||
| 2019 | 2018 | $ | % | |||||||||||
| Other | ||||||||||||||
| Depreciation and amortization | $ | 28,765 | $ | 21,249 | $ | 7,516 | 35 | % | ||||||
| Acquisition related expenses | $ | 100 | $ | 144 | $ | (44 | ) | (31 | )% | |||||
| Asset management fees | $ | 5,465 | $ | 3,674 | $ | 1,791 | 49 | % | ||||||
| Performance participation allocation | $ | 3,650 | $ | 4,013 | $ | (363 | ) | (9 | )% | |||||
| General and administrative expenses | $ | 2,767 | $ | 2,275 | $ | 492 | 22 | % | ||||||
| Gain (loss) on investments in real estate-related securities | $ | 2,527 | $ | — | $ | 2,527 | 100 | % | ||||||
| Gain on sale of real estate | $ | — | $ | 14,491 | $ | (14,491 | ) | (100 | )% | |||||
| Foreign currency gains (losses) | $ | (1,522 | ) | $ | (382 | ) | $ | (1,140 | ) | N/A* | ||||
| Interest expense | $ | 12,772 | $ | 8,336 | $ | 4,436 | 53 | % | ||||||
| Benefit (provision) for income taxes | $ | 516 | $ | (138 | ) | $ | 654 | N/A* | ||||||
* Not a meaningful percentage
Depreciation and amortization: Depreciation and amortization expense increased for the nine months ended September 30, 2019 compared to the nine months ended September 30, 2018 primarily due to real estate investments acquired since September 30, 2018.
Asset management fees: Asset management fees increased for the nine months ended September 30, 2019 as compared to the nine months ended September 30, 2018 primarily due to real estate investments acquired since September 30, 2018.
Performance participation allocation: Performance participation allocation decreased for the nine months ended September 30, 2019 compared to the nine months ended September 30, 2018 primarily due to changes in our NAV per share between the periods. NAV per share increased $0.01 per share throughout the nine months ended September 30, 2019, as compared to $0.25 per share was seen during the nine months ended September 30, 2018.
General and administrative expenses: General and administrative expenses increased for the nine months ended September 30, 2019 compared to the nine months ended September 30, 2018 primarily due to increased legal costs and shareholder costs. We generally expect our general and administrative expenses to increase as we continue raising capital from our Follow-On Offering.
Gain (loss) on investments in real estate-related securities: In the fourth quarter of 2018, the Company made its initial investments in real estate-related securities, which consist of common equities, preferred equities and debt investments of publicly traded REITs. These assets are valued on a recurring basis, which resulted in realized and unrealized gains for the nine months ended September 30, 2019.
Gain on sale of real estate: We sold 2819 Loker Avenue East for a contract sales price of $38.3 million on March 30, 2018 and we acquired 2819 Loker Avenue East in December 2014 for a net purchase price of $25.4 million. We recognized a gain of $14.5 million related to this sale. We had no property dispositions during the nine months ended September 30, 2019.
Foreign currency gains (losses): Foreign currency gains (losses) primarily reflects the effect of changes in foreign currency exchange rates on transactions that were denominated in currencies other than our functional currencies. During the nine months ended September 30, 2019 and 2018, these losses were primarily related to the effect of remeasuring cash held in foreign currencies into U.S. dollars and the changes in exchange rates.
Interest expense: Interest expense increased for the nine months ended September 30, 2019 due to an increase in our principal outstanding during the period resulting from real estate investments acquired since September 30, 2018.
Benefit (provision) for income taxes: Provision for income taxes changed from a $138,000 provision for the nine months ended September 30, 2018 to a $516,000 benefit for the nine months ended September 30, 2019 as a result of changes in our deferred tax assets and liabilities related to book / tax timing differences at our international subsidiaries.
38
Funds from Operations
We believe funds from operations (“FFO”) is a meaningful supplemental non-GAAP operating metric. FFO is a non-GAAP financial performance measure defined by the National Association of Real Estate Investment Trusts (“NAREIT”) and is widely recognized by investors and analysts as one measure of operating performance of a real estate company. FFO excludes items such as real estate depreciation and amortization. Depreciation and amortization, as applied in accordance with GAAP, implicitly assumes that the value of real estate assets diminishes predictably over time and also assumes that such assets are adequately maintained and renovated as required in order to maintain their value. Since real estate values have historically risen or fallen with market conditions such as occupancy rates, rental rates, inflation, interest rates, the business cycle, unemployment and consumer spending, it is management’s view, and we believe the view of many industry investors and analysts, that the presentation of operating results for real estate companies using historical cost accounting alone is insufficient. In addition, FFO excludes gains and losses from the sale of real estate and impairment charges related to depreciable real estate assets and in-substance real estate equity investments, which we believe provides management and investors with a helpful additional measure of the historical performance of our real estate portfolio, as it allows for comparisons, year to year, that reflect the impact on operations from trends in items such as occupancy rates, rental rates, operating costs, general and administrative expenses and interest costs. A property will be evaluated for impairment if events or circumstances indicate that the carrying amount may not be recoverable (i.e. the carrying amount exceeds the total estimated undiscounted future cash flows from the property). Undiscounted future cash flows are based on anticipated operating performance, including estimated future net rental and lease revenues, net proceeds on the sale of the property, and certain other ancillary cash flows. While impairment charges are excluded from the calculation of FFO as described above, stockholders are cautioned that we may not recover any impairment charges.
FFO should not be construed to be more relevant or accurate than the current GAAP methodology in calculating net income or in its applicability in evaluating our operating performance. In addition, FFO should not be considered as an alternative to net income (loss) or income (loss) from continuing operations as an indication of our performance or as an alternative to cash flows from operating activities as an indication of our liquidity, but rather should be reviewed in conjunction with these and other GAAP measurements. Further, FFO is not intended to be used as a liquidity measure indicative of cash flow available to fund our cash needs, including our ability to make distributions to our stockholders. Please see the limitations listed below associated with the use of FFO:
| • | Prior to January 1, 2018, FFO included costs related to our acquisitions, including acquisition fees payable to our Advisor. Although these amounts reduced net income for periods prior to January 1, 2018, we generally funded such costs with proceeds from our public offerings and/or acquisition-related indebtedness and did not consider these fees and expenses in the evaluation of our operating performance. In January 2018, we adopted ASU 2017-01 which clarified the definition of a business and added guidance to assist entities with evaluating whether transactions should be accounted for as acquisitions (or disposals) of assets or businesses. We expect that most of our real estate transactions completed after that date will be accounted for using the asset acquisition guidance and, accordingly, the related acquisition-related expenses incurred will be capitalized and included in the allocated purchase price and will not be expensed. Prior to ASU 2017-01, real estate acquisitions were generally considered business combinations and the acquisition-related expenses and acquisition fees were treated as operating expenses under GAAP. Additionally, effective as of December 6, 2017, we no longer pay acquisition fees to our Advisor. |
| • | We utilize the definition of FFO as set forth by NAREIT. Our FFO may not be comparable to amounts calculated by other REITs, if they use different approaches. |
| • | Our business is subject to volatility in the real estate markets and general economic conditions, and adverse changes in those conditions could have a material adverse impact on our business, results of operations and FFO. Accordingly, the predictive nature of FFO is uncertain and past performance may not be indicative of future results. |
Neither the SEC, NAREIT nor any regulatory body has passed judgment on the acceptability of the adjustments that we use to calculate FFO. In the future, the SEC, NAREIT or a regulatory body may decide to standardize the allowable adjustments across the non-listed REIT industry and we would have to adjust our calculation and characterization of FFO.
39
The following section presents our calculation of FFO attributable to common stockholders and provides additional information related to our operations for the three and nine months ended September 30, 2019 and 2018 and the period from inception through September 30, 2019 (in thousands, except per share amounts). As we are in the capital raising and acquisition phase of our operations, FFO may not be useful in comparing operations for the periods presented below. We expect revenues and expenses to increase in future periods as we raise additional offering proceeds and use them to make additional real estate investments.
| Three Months Ended September 30, | Nine Months Ended September 30, | Period from July 31, 2013 (date of inception) through September 30, 2019 | |||||||||||||||||
| 2019 | 2018 | 2019 | 2018 | ||||||||||||||||
| Net income (loss) | $ | (1,773 | ) | $ | (2,782 | ) | $ | (9,222 | ) | $ | 7,185 | $ | (45,594 | ) | |||||
Depreciation and amortization (1) | 9,696 | 6,949 | 28,765 | 21,249 | 110,558 | ||||||||||||||
| Gain on sale of real estate | — | — | — | (14,491 | ) | (14,491 | ) | ||||||||||||
Adjustments for noncontrolling interests (2) | (6 | ) | (7 | ) | (21 | ) | (13 | ) | 118 | ||||||||||
| Funds From Operations attributable to common stockholders | $ | 7,917 | $ | 4,160 | $ | 19,522 | $ | 13,930 | $ | 50,591 | |||||||||
| Basic and diluted income (loss) per common share | $ | (0.03 | ) | $ | (0.07 | ) | $ | (0.16 | ) | $ | 0.18 | $ | (1.93 | ) | |||||
| Funds From Operations attributable to common stockholders per common share | $ | 0.11 | $ | 0.10 | $ | 0.34 | $ | 0.35 | $ | 2.15 | |||||||||
| Weighted average shares outstanding | 68,913 | 40,397 | 57,732 | 39,765 | 23,544 | ||||||||||||||
Notes to the table:
| (1) | Represents the depreciation and amortization of real estate assets. Historical cost accounting for real estate assets in accordance with GAAP implicitly assumes that the value of real estate assets diminishes predictably over time. Since real estate values have historically risen or fallen with market conditions, we believe that such depreciation and amortization may be of limited relevance in evaluating current operating performance and, as such, these items are excluded from our determination of FFO. |
| (2) | Includes income attributable to noncontrolling interests and all adjustments to eliminate the noncontrolling interests’ share of the adjustments to convert our net loss to FFO. |
Set forth below is additional information, which may be helpful in assessing our operating results:
| • | For the three and nine months ended September 30, 2019, the Dealer Manager earned distribution and stockholder servicing fees of $1.1 million and $2.6 million, respectively, which are paid by Hines Global. For the three and nine months ended September 30, 2018, the Dealer Manager earned distribution and stockholder servicing fees of $0.5 million and $1.5 million, respectively. Total distribution and stockholder servicing fees earned by the Dealer Manager from inception through September 30, 2019 were $6.6 million. |
| • | As of December 6, 2017, through its ownership of the special limited partner interest in the Operating Partnership, our Advisor is entitled to an annual performance participation allocation of 12.5% of the Operating Partnership’s total return subject to the Company earning a 5% total return annually, after considering the effect of any losses carried forward from the prior year. The performance participation allocation accrues monthly and is payable after the completion of each calendar year. We do not consider the performance participation allocation in evaluating our operating performance. For the three and nine months ended September 30, 2019, we incurred $1.1 million and $3.7 million in performance participation allocation fees, respectively. For the three and nine months ended September 30, 2018, we incurred $1.2 million and $4.0 million in performance participation allocation fees, respectively. Total performance participation allocation fees incurred were $9.9 million from inception through September 30, 2019. Refer to “Note 7—Related Party Transactions” for more information on the performance participation allocation. |
| • | For the three and nine months ended September 30, 2019 , we recorded adjustments primarily related to amortization of out-of-market lease intangibles and lease incentives and straight-line rent adjustments, which resulted in a net increase to rental revenue of $1.2 million and $3.8 million, respectively. For the three and nine months ended September 30, 2018 we recorded adjustments primarily related to amortization of out-of-market lease intangibles and lease incentives and straight-line rent adjustments, which resulted in a net increase to rental revenue of $0.7 million and $1.6 million, respectively. |
40
| • | We recorded non-cash adjustments related to gains/losses on derivative instruments and/or foreign currencies and certain amounts related to deferred taxes, which reduced net income by approximately $1.2 million and $2.7 million for the three and nine months ended September 30, 2019, respectively. Such amounts were insignificant in prior periods. |
As noted previously, our cash flows from operations have been and may continue to be insufficient to fund distributions to stockholders. We may continue to choose to use proceeds from the sales of assets, proceeds from our debt financings, proceeds from our public offerings, cash advances by our Advisor and/or cash resulting from a waiver or deferral of fees to fund distributions to our stockholders. For example, we funded 92% and 26% of total distributions for the nine months ended September 30, 2019 and 2018, respectively, with cash flows from other sources, such as cash flows from investing activities, which may include proceeds from the sale of real estate and/or cash flows from financing activities, which may include offering proceeds. We have not placed a cap on the amount of our distributions that may be paid from sources other than cash flows from operations, including proceeds from our debt financings, proceeds from our public offerings, cash advances by our Advisor and cash resulting from a waiver or deferral of fees.
From inception through September 30, 2019, we declared $80.0 million of distributions to our stockholders, compared to our total aggregate FFO of $50.6 million and our total aggregate net loss of $45.6 million for that period. We incurred acquisition fees and expenses of $23.3 million from inception through December 31, 2017 in connection with our real estate investments, which were recorded as reductions to net income (loss) and FFO. We adopted ASU 2017-01 on January 1, 2018, which allows us to capitalize acquisition-related costs and fees instead of treating them as operating expenses under GAAP. For the nine months ended September 30, 2019, we declared $24.5 million of distributions to our stockholders compared to our total aggregate FFO of $19.5 million. For the nine months ended September 30, 2018, we declared $16.7 million of distributions to our stockholders compared to our total aggregate FFO of $13.9 million.
Related Party Transactions and Agreements
We have entered into agreements with our Advisor, our Dealer Manager and Hines and its affiliates, whereby we pay certain fees and reimbursements to these entities during the various phases of our organization and operation. Relating to organization and offering stage, these include payments to our Dealer Manager for selling commissions, the dealer manager fee, distribution and stockholder servicing fees, and payments to our Advisor for reimbursement of organization and offering costs. Relating to acquisition and operational stages, these include payments for certain services related to the management and performance of our investments and operations provided to us by our Advisor and Hines and its affiliates pursuant to various agreements we have entered into with these entities. See Note 7 — Related Party Transactions in Item 1 of this Quarterly Report on Form 10-Q, as well as Note 8 — Related Party Transactions in our Annual Report on Form 10-K for the year ended December 31, 2018 for additional information concerning our related party transactions and agreements.
Off-Balance Sheet Arrangements
As of September 30, 2019 and December 31, 2018, we had no off-balance sheet arrangements that have or are reasonably likely to have a current or future effect on our financial condition, changes in financial condition, revenues or expenses, results of operations, liquidity, capital expenditures or capital resources.
41
Subsequent Events
The Alloy
In October 2019, we entered into a purchase and sale agreement to purchase The Alloy, a student-dominated apartment property located in College Park, Maryland. The contract purchase price for The Alloy is expected to be approximately $98.0 million, exclusive of transaction costs and closing prorations. We funded a $4.0 million earnest money deposit in November 2019. There is no guarantee that this sale will be consummated and our deposit may not be refunded in such event. We expect the closing of this acquisition to occur during the fourth quarter of 2019, subject to a number of closing conditions. However, we can provide no assurance that this acquisition will close on the expected timeline or at all.
Domain Apartments
In October 2019, we entered into a contract to sell the Domain Apartments, a multi-family community located in Henderson, Nevada. The contract sales price for the Domain Apartments is $80.1 million. We acquired the Domain Apartments in January 2016 for a purchase price of $58.2 million, excluding transaction costs and working capital reserves. We expect the closing of this sale to occur during the fourth quarter of 2019, however, we can provide no assurance that this sale will close on the expected timeline or at all.
Charles Tyrwhitt DC
In November 2019, we acquired Charles Tyrwhitt DC from M&G Real Estate. The net purchase price was £15.5 million, (approximately $19.9 million assuming a rate of $1.286 per GBP as of the acquisition date), exclusive of transaction costs and closing prorations. Charles Tyrwhitt DC is an industrial logistics property located in Milton Keynes, United Kingdom consisting of 139,387 square feet. The property currently has a 100% occupancy rate. M&G Real Estate is not affiliated with us or our affiliates.
42
Item 3. Quantitative and Qualitative Disclosures About Market Risk
Market risk includes risks that arise from changes in interest rates, foreign currency exchange rates, commodity prices, equity prices and other market changes that affect market-sensitive instruments. In pursuing our business plan, we believe that interest rate risk and currency risk are the primary market risks to which we are exposed. As of September 30, 2019, we were exposed to the following market risks.
Interest Rate Risk
We are exposed to the effects of interest rate changes primarily as a result of debt used to maintain liquidity and fund expansion of our real estate investment portfolio and operations. As of September 30, 2019, we had $575 million of variable-rate debt outstanding. If interest rates were to increase by 1% and everything else remained the same, we would incur an additional $6 million in interest expense annually. Additionally, we have entered into interest rate cap agreements to limit our exposure to rising interest rates related to our mortgage loans secured by our investment properties. See Note 4 — Debt Financing in the Notes to the Condensed Consolidated Financial Statements for more information concerning our outstanding debt and our interest rate exposure.
Foreign Currency Risk
We currently have real estate investments located in countries outside of the U.S. that are subject to the effects of exchange rate movements between the foreign currency of each real estate investment and the U.S. dollar, which may affect future costs and cash flows as well as amounts translated into U.S. dollars for inclusion in our consolidated financial statements. We have entered into mortgage loans denominated in foreign currencies for these investments, which provide natural hedges with regard to changes in exchange rates between the foreign currencies and U.S. dollar and reduce our exposure to exchange rate differences. Additionally, we are typically a net receiver of these foreign currencies, and, as a result, our foreign operations benefit from a weaker U.S. dollar and are adversely affected by a stronger U.S. dollar. The table below identifies the effect that a 10% immediate, unfavorable change in the exchange rates would have on the net book value of our international real estate investments, including any foreign currency mortgage loans and their year-to-date net income (loss), by foreign currency (in thousands)(1):
| Reduction in Book Value as of September 30, 2019 | Reduction in Net Income (Loss) for the Nine Months Ended September 30, 2019 | |||
| EUR | $15,006 | $298 | ||
| GBP | $5,708 | $25 | ||
(1) Our real estate assets in Poland were purchased in Euros and we expect that when we dispose of these assets, the sale transactions will also be denominated in Euros. Accordingly, we do not expect to have Polish zloty exposure upon disposition.
Item 4. Controls and Procedures
Disclosure Controls and Procedures
In accordance with Exchange Act Rules 13a-15 and 15d-15, we carried out an evaluation, under the supervision and with the participation of management, including our Chief Executive Officer and Chief Financial Officer, of the effectiveness of our disclosure controls and procedures as of the end of the period covered by this report. Based on that evaluation, our Chief Executive Officer and Chief Financial Officer concluded that our disclosure controls and procedures were effective as of September 30, 2019, to provide reasonable assurance that information required to be disclosed in our reports filed or submitted under the Exchange Act is (i) recorded, processed, summarized and reported within the time periods specified in the Securities and Exchange Commission’s rules and forms, and (ii) accumulated and communicated to our management, including our Chief Executive Officer and Chief Financial Officer, as appropriate to allow timely decisions regarding required disclosure.
43
Change in Internal Controls
No changes have occurred in our internal controls over financial reporting (as defined in Rule 13a-15(f) of the Exchange Act) during the quarter ended September 30, 2019 that has materially affected, or is reasonably likely to materially affect, our internal controls over financial reporting.
44
PART II - OTHER INFORMATION
Item 1. Legal Proceedings
From time to time in the ordinary course of business, we or our subsidiaries may become subject to legal proceedings, claims or disputes. As of November 13, 2019, neither we nor any of our subsidiaries were a party to any material pending legal proceedings.
Item 1A. Risk Factors
As of September 30, 2019, there have been no material changes to the risk factors previously disclosed in response to “Part I - Item 1A. ‘Risk Factors’” in our Annual Report on Form 10-K for the year ended December 31, 2018, filed with the SEC on March 29, 2019.
Item 2. Unregistered Sales of Equity Securities and Use of Proceeds
On September 25, 2019, 2,967.359 restricted common shares were granted to each of our independent directors, Messrs. Humberto “Burt” Cabañas, Dougal A. Cameron, and John O. Niemann, Jr. Such restricted shares were granted pursuant to Restricted Share Award Agreements between us and each of our independent directors, as part of the independent directors’ annual compensation for service on our board of directors and without registration under the Securities Act of 1933, as amended (the “Securities Act”), in reliance upon the exemption from registration contained in Section 4(a)(2) of the Securities Act.
Issuer Redemptions of Equity Securities
Our share redemption program may allow stockholders who have purchased shares from us or received their shares through a non-cash transaction, not in the secondary market, to have their shares redeemed subject to certain limitations and restrictions. Redemptions under our share redemption program will be made on a monthly basis. Subject to the limitations of and restrictions on our share redemption program, and subject to funds being available as described below, shares redeemed under our share redemption program will be redeemed at the transaction price in effect on the date of redemption, which generally will be a price equal to the NAV per share applicable to the class of shares being redeemed and most recently disclosed by us in a public filing with the SEC (subject to the 5% holding discount described below).
Under our share redemption program, we may redeem during any calendar month shares whose aggregate value (based on the redemption price per share in effect when the redemption is effected) is 2% of our aggregate NAV as of the last calendar day of the previous month (the “2% Monthly Limitation”) and during any calendar quarter whose aggregate value (based on the redemption price per share in effect when the redemption is effected) is up to 5% of our aggregate NAV as of the last calendar day of the prior calendar quarter (the “5% Quarterly Limitation”). During a given quarter, if in each of the first two months of such quarter the 2% Monthly Limitation is reached and stockholders’ redemptions are reduced pro rata for such months, then in the third and final month of that quarter, the applicable limit for such month will likely be less than 2% of our aggregate NAV as of the last calendar day of the previous month because the redemptions for that month, combined with the redemptions in the previous two months, cannot exceed the 5% Quarterly Limitation.
There is no minimum holding period for shares under our share redemption program and stockholders may request that we redeem their shares at any time. However, shares that have not been outstanding for at least one year will be redeemed at 95% of the transaction price (the “5% holding discount”) that would otherwise apply; provided, that, the period that a share was held prior to being converted into a share of another class pursuant to our charter will count toward the total hold period for such share, as converted. Upon request, we may waive the 5% holding discount in the case of death or disability of a stockholder. The 5% holding discount also will be waived with respect to shares issued pursuant to our distribution reinvestment plan and any shares that we issue as stock dividends.
Unless our board of directors determines otherwise, we intend to fund redemptions pursuant to our share redemption program from any available cash sources at our disposal, including available cash, cash flow from operations, the sale of real estate-related securities and other assets, borrowings or offering proceeds, without any limitation on the amounts we may pay from such sources. If during any consecutive 24-month period, we do not have at least one month in which we fully satisfy 100% of properly submitted redemption requests or accept all properly submitted tenders in a self-tender offer for our shares, we will not make any new investments (excluding short-term cash management investments under 30 days in duration) and we will use all available investable assets to satisfy redemption requests (subject to the limitations under this program) until all outstanding redemption requests, or “Unfulfilled Redemptions,” have been satisfied. For purposes of this policy, investable assets include net proceeds from new subscription agreements, unrestricted cash, working capital, proceeds from marketable securities, proceeds from our distribution
45
reinvestment plan, and net operating cash flows. Notwithstanding this policy, investable assets may be used at any time to fund any of our operating cash needs (as well as to establish reserves to meet such needs), including, without limitation, the following: property operating expenses, taxes and insurance, debt service and repayment or refinancing of debt, debt financing expenses, funding commitments related to real estate, including without limitation, commitments to acquire new real estate investments (provided such commitments were made at least twelve (12) months prior to the end of such 24-consecutive-month period), obligations imposed by law, courts, or arbitration, necessary capital improvements, lease-related expenditures, customary general and administrative expenses, asset management fees and other fees payable to our Advisor as described in the prospectus, or shareholder distributions. Our Advisor also will defer payment of the performance participation allocation until all Unfulfilled Redemptions are satisfied. Furthermore, our board of directors and management will consider additional ways to improve shareholder liquidity through our share redemption program or otherwise. Exceptions to the limitations of this paragraph may be made to complete like-kind exchanges under Section 1031 of the Code necessary to avoid adverse tax consequences, or to take actions necessary to maintain our qualification as a REIT under the Code.
Our board of directors has complete discretion to determine whether all available cash sources at our disposal will be applied to redemptions pursuant to the program, whether such funds are needed for other purposes or whether additional funds from other sources may be used for redemptions pursuant to the program.
If redemption requests, in the business judgment of our board of directors, place an undue burden on our liquidity, adversely affect our operations or risk having an adverse impact on stockholders whose shares are not redeemed, then our board of directors may terminate, suspend or amend the share redemption program at any time without stockholder approval, if it deems such action to be in the best interest of our stockholders. Further, our share redemption program will be terminated in the event that our shares ever become listed on a national securities exchange or in the event a secondary market for our common shares develops. In addition, our board of directors may determine to suspend the share redemption program due to regulatory changes, changes in law or if our board of directors becomes aware of undisclosed material information that it believes should be publicly disclosed before shares are redeemed. Material modifications, including any reduction to the monthly or quarterly limitations on redemptions, and suspensions of the program will be promptly disclosed to stockholders in a prospectus supplement (or post-effective amendment if required by the Securities Act) or current report on Form 8-K filed with the SEC. Any material modifications will also be disclosed on our website.
Any new transaction price may be higher or lower than the most recently disclosed transaction price. The transaction price is not a representation, warranty or guarantee that (i) a stockholder would be able to realize such per share amount if such stockholder attempts to sell his or her shares; (ii) a stockholder would ultimately realize distributions per share equal to such per share amount upon our liquidation or sale; (iii) shares of our common stock would trade at such per share amount on a national securities exchange; or (iv) a third party would offer such per share amount in an arm’s-length transaction to purchase all or substantially all of our shares of common stock.
The following table lists shares we redeemed under our share redemption program during the period covered by this report, including the average price paid per share, which represents all of the share repurchase requests received for the same period.
| Period | Total Number of Shares Redeemed | Average Price Paid Per Share | Total Number of Shares Purchased as Part of Publicly Announced Plans of Programs | Maximum Number of Shares that May Yet be Redeemed Under the Plans or Programs(1) | |||||||||
| July 1, 2019 to July 31, 2019 | 59,039 | $ | 10.11 | 59,039 | 1,161,928 | ||||||||
| August 1, 2019 to August 31, 2019 | 110,587 | $ | 10.15 | 110,587 | 1,186,616 | ||||||||
| September 1, 2019 to September 30, 2019 | 112,311 | $ | 10.10 | 112,311 | 1,382,894 | ||||||||
| Total | 281,937 | 281,937 | |||||||||||
| (1) | Amount provided represents the 2% Monthly Limitation which can be further limited by the 5% Quarterly Limitation. See the description of the share redemption program above for a description of the limitations on the number of shares that may be redeemed pursuant to the share redemption program. |
Item 3. Defaults Upon Senior Securities
Not applicable.
Item 4. Mine Safety Disclosures
Not applicable.
46
Item 5. Other Information
Not applicable.
47
Item 6. Exhibits
| Exhibit No. | Description | |
| 3.1 | ||
| 3.2 | ||
| 3.3 | ||
| 3.4 | ||
| 3.5 | ||
| 3.6 | ||
| 3.7 | ||
| 3.8 | ||
| 3.9 | ||
| 3.10 | ||
| 3.11 | ||
| 4.1 | ||
| 4.2 | ||
| 10.1 | ||
| 10.2 | ||
| 10.3 | ||
| 10.4 | ||
| 10.5 | ||
| 10.6 | ||
48
| 10.7 | ||
| 10.8 | ||
| 10.9 | ||
| 10.10 | ||
| 10.11 | ||
| 10.12 | ||
| 10.13 | ||
| 10.14 | ||
| 10.15 | ||
| 10.16 | ||
| 10.17 | ||
| 10.18 | ||
| 10.19 | ||
| 10.20 | ||
| 10.21 | ||
| 10.22 | ||
| 10.23 | ||
| 10.24 | ||
| 10.25 | Credit agreement dated as of September 13, 2019 among Hines Global REIT II Properties LP and JPMorgan Chase Bank, N.A., as Administrative Agent (filed as exhibit 10.1 to the Registrant’s Current Report on Form 8-K on September 19, 2019 and incorporated by reference herin) | |
| 31.1* | ||
49
| 31.2* | ||
| 32.1* | ||
| 99.1 | ||
| 99.2 | ||
| 101.INS* | Instance Document—The instance document does not appear in the interactive data file because its XBRL tags are embedded within the inline XBRL document. | |
| 101 SCH* | XBRL Taxonomy Extension Schema Document | |
| 101.CAL* | XBRL Taxonomy Extension Calculation Linkbase Document | |
| 101.DEF* | XBRL Taxonomy Extension Definition Linkbase Document | |
| 101.LAB* | XBRL Taxonomy Extension Labels Linkbase Document | |
| 101.PRE* | XBRL Taxonomy Extension Presentation Linkbase Document | |
| * | Filed herewith | |
50
SIGNATURES
Pursuant to the requirements of the Securities Exchange Act of 1934, the registrant has duly caused this report to be signed on its behalf by the undersigned thereunto duly authorized.
| HINES GLOBAL INCOME TRUST, INC. | ||||||
| November 13, 2019 | By: | /s/ Sherri W. Schugart | ||||
| Sherri W. Schugart | ||||||
| President and Chief Executive Officer | ||||||
| November 13, 2019 | By: | /s/ J. Shea Morgenroth | ||||
| J. Shea Morgenroth | ||||||
| Chief Financial Officer | ||||||
51