UNITED STATES SECURITIES AND EXCHANGE COMMISSION
Washington, D.C. 20549
Form 10-K
|
| |
| (Mark One) |
| ☑ | ANNUAL REPORT PURSUANT TO SECTION 13 OR 15(d) OF THE SECURITIES EXCHANGE ACT OF 1934 |
For the fiscal year ended December 31, 2019
OR
|
| |
| ☐ | TRANSITION REPORT PURSUANT TO SECTION 13 OR 15(d) OF THE SECURITIES EXCHANGE ACT OF 1934 |
Commission file number: 000-55599
HINES GLOBAL INCOME TRUST, INC.
(Exact name of registrant as specified in its charter)
|
| | | |
| Maryland | 80-0947092 |
| (State or other jurisdiction of incorporation or organization) | (I.R.S. Employer Identification No.) |
| | | | |
| 2800 Post Oak Boulevard | |
| Suite 5000 | |
| Houston | , | Texas | 77056-6118 |
| (Address of principal executive offices) | (Zip code) |
Registrant’s telephone number, including area code: (888) 220-6121
Securities registered pursuant to Section 12(b) of the Act: None.
Securities registered pursuant to Section 12(g) of the Act: Common Stock, par value $0.001
Indicate by check mark if the registrant is a well-known seasoned issuer, as defined in Rule 405 of the Securities Act. Yes ☐ No ☑
Indicate by check mark if the registrant is not required to file reports pursuant to Section 13 or Section 15(d) of the Exchange Act. Yes ☐ No ☑
Indicate by check mark whether the registrant: (1) has filed all reports required to be filed by Section 13 or 15(d) of the Securities Exchange Act of 1934 during the preceding 12 months (or for such shorter period that the registrant was required to file such reports), and (2) has been subject to such filing requirements for the past 90 days. Yes ☑ No ☐
Indicate by check mark whether the registrant has submitted electronically every Interactive Data File required to be submitted pursuant to Rule 405 of Regulation S-T (§232.405 of this chapter) during the preceding 12 months (or for such shorter period that the registrant was required to submit and post such files). Yes ☑ No ☐
Indicate by check mark whether the registrant is a large accelerated filer, an accelerated filer, a non-accelerated filer, or a smaller reporting company. See the definitions of “large accelerated filer,” “accelerated filer” and “smaller reporting company” in Rule 12b-2 of the Exchange Act.
|
| | | | | | | |
| Large accelerated filer | ☐ | | Accelerated filer | ☐ | | Non-accelerated filer | ☒ |
| Smaller reporting company | ☒ | | | | | Emerging growth company | ☒ |
| If an emerging growth company, indicate by check mark if the registrant has elected not to use the extended transition period for complying with any new or revised financial accounting standards provided pursuant to Section 13 (a) of the Exchange Act. | ☒ |
Indicate by check mark whether the registrant is a shell company (as defined in Rule 12b-2 of the Exchange Act). Yes ☐ No ☑
Aggregate market value of the common stock held by non-affiliates of the registrant: NaN established market exists for the registrant’s common stock.
As of March 1, 2020, approximately 18.9 million shares of the registrant’s Class AX common stock, 19.9 million shares of the registrants Class TX common stock, 0.1 million shares of the registrant’s Class IX common stock, 34.6 million shares of the registrant’s Class T common stock, 8.6 million shares of the registrant’s Class D common stock and 10.1 million shares of the registrant’s Class I common stock were outstanding.
|
| | |
TABLE OF CONTENTS PART I |
| Item 1. | | |
| Item 1A. | | |
| Item 1B. | | |
| Item 2. | | |
| Item 3. | | |
| Item 4. | | |
| PART II |
| Item 5. | | |
| Item 6. | | |
| Item 7. | | |
| Item 7A. | | |
| Item 8. | | |
| Item 9. | | |
| Item 9A. | | |
| Item 9B. | | |
| PART III |
| Item 10. | | |
| Item 11. | | |
| Item 12. | | |
| Item 13. | | |
| Item 14. | | |
| PART IV |
| Item 15. | | |
| Item 16. | | |
| |
| EX- 21.1 | List of Subsidiaries | |
| EX- 23.1 | Consent of Deloitte & Touche LLP | |
| EX- 31.1 | Certification | |
| EX- 31.2 | Certification | |
| EX- 32.1 | Certification of CEO & CFO pursuant to Section 906 | |
| EX- 99.3 | Consent of Altus Group U.S., Inc. | |
| | | |
| EX- 101 | Instance Document | |
| EX- 101 | Schema Document | |
| EX- 101 | Calculation Linkbase Document | |
| EX- 101 | Labels Linkbase Document | |
| EX- 101 | Presentation Linkbase Document | |
| EX- 101 | Definition Linkbase Document | |
PART I
Special Note Regarding Forward-Looking Statements
This Annual Report on Form 10-K includes certain statements that may be deemed forward-looking statements within the meaning of Section 27A of the Securities Act of 1933, as amended (the “Securities Act”), and Section 21E of the Securities Exchange Act of 1934, as amended (the “Exchange Act”). Such forward-looking statements relate to, without limitation, potential future acquisitions, the completion of projects in development, economic conditions that may impact our operations, our future leverage and financial position, our future capital expenditures, future distributions, other developments and trends in the commercial real estate industry and our business strategy. Forward-looking statements are generally identifiable by the use of the words “may,” “will,” “should,” “expect,” “could,” “intend,” “plan,” “anticipate,” “estimate,” “believe,” “continue,” “predict,” “potential” or the negative of these words or other comparable terminology. These statements are not guarantees of future performance, and involve certain risks, uncertainties and assumptions that are difficult to predict.
The forward-looking statements in this Annual Report on Form 10-K are based on our current expectations, plans, estimates, assumptions and beliefs that involve numerous risks and uncertainties. Assumptions relating to the foregoing involve judgments with respect to, among other things, future economic, competitive and market conditions and future business decisions, all of which are difficult or impossible to predict accurately and many of which are beyond our control. Any of the assumptions underlying forward-looking statements could prove to be inaccurate. To the extent that our assumptions differ from actual results, our ability to meet such forward-looking statements, including our ability to generate positive cash flow from operations, provide distributions to our stockholders and maintain the value of the real estate properties in which we hold an interest, may be significantly hindered.
Our stockholders are cautioned not to place undue reliance on any forward-looking statement in this Annual Report on Form 10-K. All forward-looking statements are made as of the date of this Annual Report on Form 10-K, and the risk that actual results will differ materially from the expectations expressed in this Annual Report on Form 10-K may increase with the passage of time. In light of the significant uncertainties inherent in the forward-looking statements in this Annual Report on Form 10-K, the inclusion of such forward-looking statements should not be regarded as a representation by us or any other person that the objectives and plans set forth in this Annual Report on Form 10-K will be achieved. Please see “Item 1A. Risk Factors” for a discussion of some of the risks and uncertainties that could cause actual results to differ materially from those presented in certain forward-looking statements.
Item 1. Business
General Description of Business and Operations
Hines Global Income Trust, Inc. (“Hines Global”), is a Maryland corporation formed in 2013 for the purpose of raising capital through public stock offerings and investing in a diversified portfolio of quality commercial real estate properties and other real estate investments located throughout the United States and internationally, and to a lesser extent, invest in real-estate related securities. Hines Global is sponsored by Hines Interests Limited Partnership (“Hines”), a fully integrated global real estate investment and management firm that has acquired, developed, owned, operated and sold real estate for over 60 years.
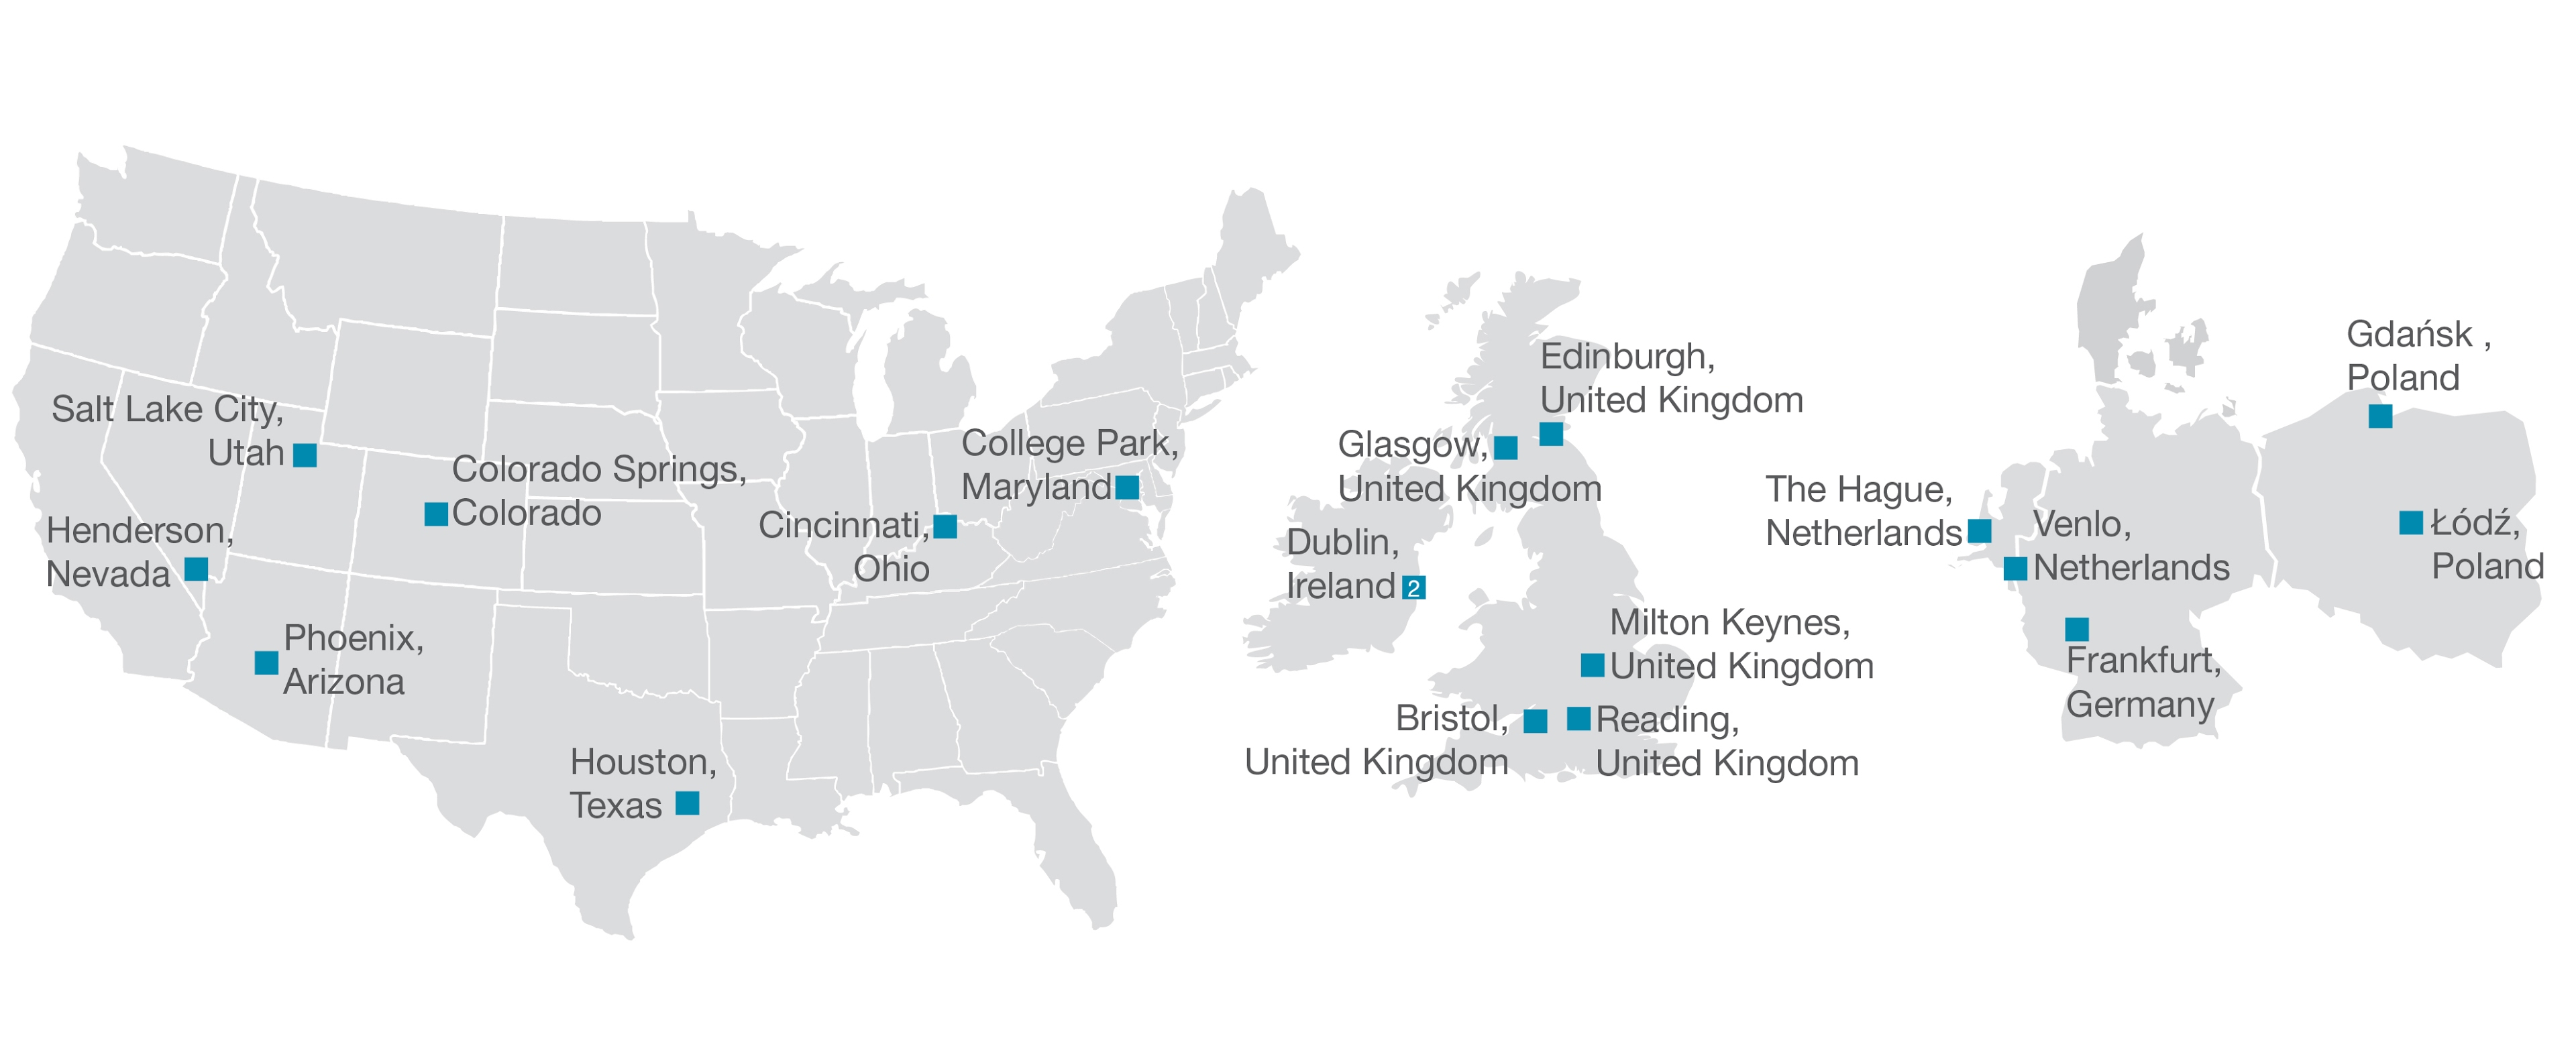
We conduct most of our activities through, and most of our real estate investments are held directly or indirectly by, Hines Global REIT II Properties, LP (the “Operating Partnership”), which was formed on July 31, 2013. As of March 30, 2020, we owned interests in 18 real estate properties. The properties contain, in the aggregate, 8.7 million square feet of leasable space. The properties represent investments in a variety of real estate classes and geographic markets. See Item 2. Properties for additional information regarding our real estate portfolio.
We have no employees. Our business is managed by Hines Global REIT II Advisors LP (the “Advisor”), an affiliate of Hines, under the terms and conditions of an advisory agreement between us, the Operating Partnership and the Advisor (the “Advisory Agreement”). As compensation for these services, we pay our Advisor asset management fees, a performance participation allocation, and fees for other services and we reimburse certain of the Advisor’s expenses incurred on our behalf in accordance with the Advisory Agreement. Hines or affiliates of Hines manage the leasing and operations of most of the properties in which we invest and, accordingly, we pay Hines property management and leasing fees in connection with these services. Hines is owned and controlled by, or for the benefit of, Gerald D. Hines and his son Jeffrey C. Hines, the Chairman of our board of directors and Chief Executive Officer. Hines and its 4,500 employees have over 60 years of experience in the areas of investment selection, underwriting, due diligence, portfolio management, asset management, property management, leasing, disposition, finance, accounting and investor relations.
Our office is located at 2800 Post Oak Boulevard, Suite 5000, Houston, Texas 77056-6118. Our telephone number is 1-888-220-6121. Our web site is www.hinessecurities.com/current-offerings/hgit/. The information on our website is not incorporated by reference into this report.
We refer to Hines Global, the Operating Partnership and its wholly-owned subsidiaries as the “Company,” and the use of “we,” “our,” “us” or similar pronouns in this annual report refers to Hines Global or the Company as required by the context in which such pronoun is used.
Our Public Offerings
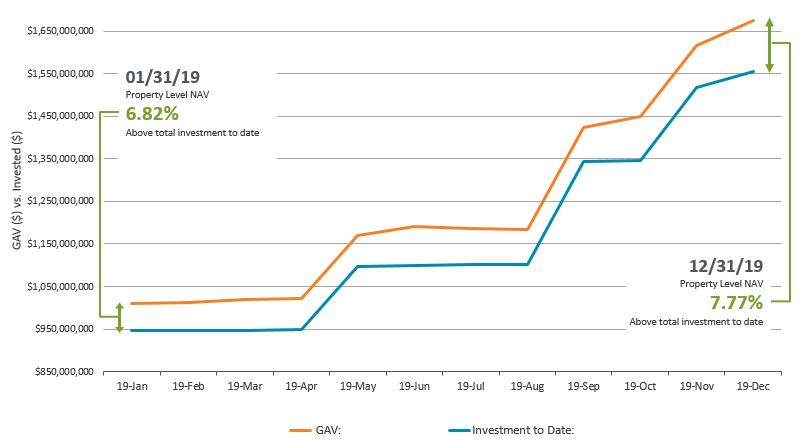
We raise capital for our investments through public offerings of our common stock. We commenced our initial public offering of up to $2.5 billion in shares of our common stock (the “Initial Offering”) in August 2014 and commenced our second public offering of up to $2.5 billion in shares of common stock including $500.0 million of shares offered under our distribution reinvestment plan (the “Follow-on Offering” or the “Offering”) in December 2017. As a result of the changing landscape in the non-traded REIT industry, the Follow-on Offering reflects a restructuring (the “Restructuring”), that our board of directors believes is in the best interests of our stockholders. It is our intention to conduct a continuous offering for an indefinite period of time by conducting additional offerings of our shares of common stock following the conclusion of the Follow-On Offering. Through March 30, 2020, we have received aggregate gross offering proceeds of approximately $985.7 million through our public offerings, including shares issued under our distribution reinvestment plan.
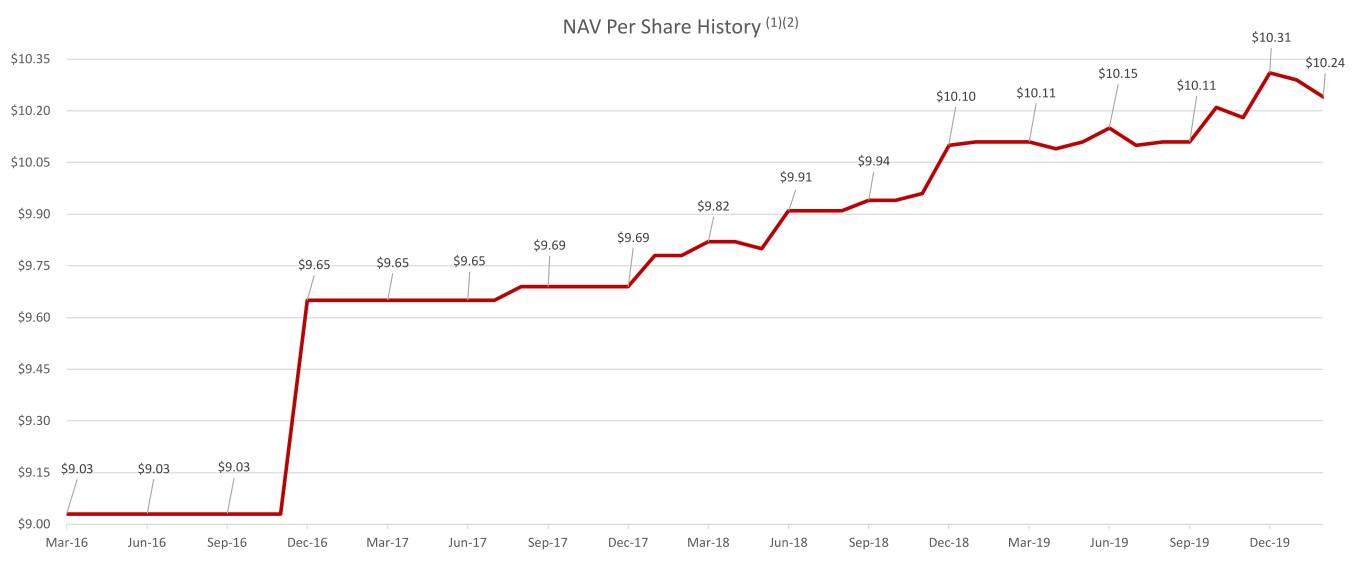
We began determining a new net asset value (“NAV”) per share on a monthly basis as of the end of January 2018. Since that time, our NAV per share has grown from $9.78 as of January 31, 2018 to $10.24 as of February 29, 2020.
Primary Investment Objectives
Our primary investment objectives are to:
| |
| • | provide income in the form of regular, stable cash distributions to achieve an attractive distribution yield; |
| |
| • | preserve and protect invested capital; |
| |
| • | invest in a diversified portfolio of quality commercial real estate properties and other real estate investments across a range of asset types throughout the U.S. and internationally; |
| |
| • | realize appreciation in NAV from proactive investment management and asset management; |
| |
| • | provide an investment alternative for investors seeking to allocate a portion of their long-term investment portfolios to commercial real estate with generally lower volatility than publicly traded real estate companies; and |
| |
| • | qualify and remain qualified as a real estate investment trust (“REIT”) for U.S federal income tax purposes. |
Acquisition and Investment Policies
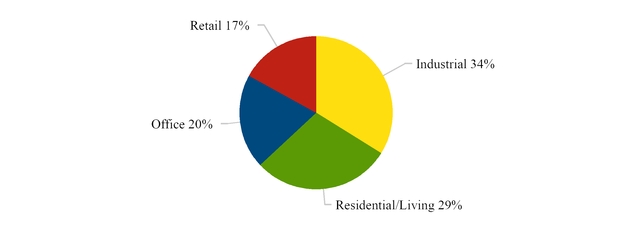
We have invested and expect to continue to invest the proceeds from our public offerings in a diversified portfolio of quality commercial real estate properties and other real estate investments throughout the United States and internationally. We may purchase properties or make other real estate investments that relate to varying property types including office, retail, industrial, multi-family residential, student housing and hospitality or leisure. We may invest in operating properties, properties under development, and undeveloped properties such as land.
We have invested in real estate-related securities and we may invest in debt investments for purposes of generating additional diversification and income as well as to provide additional liquidity for our share redemption program, cash management and other purposes. Real estate-related securities may include, but are not limited to, common or preferred stock of publicly-traded REITs or real estate operating companies, or REOCs, debt or bond securities of such companies, CMBS, U.S. government and agency securities, or other debt and equity securities of public or private real estate-related companies. To the extent that we invest in real estate-related debt, our primary investments may include, but are not limited to, originations of and participations in commercial mortgage loans secured by real estate, B-Notes, mezzanine loans and certain other types of debt-related investments that may help us reach our diversification, liquidity and other investment objectives. During the year ended December 31, 2019, we used and intend to continue to use Security Capital Research & Management Incorporated, who is not an affiliate of Hines, to source, underwrite and service our real estate-related securities and debt investments.
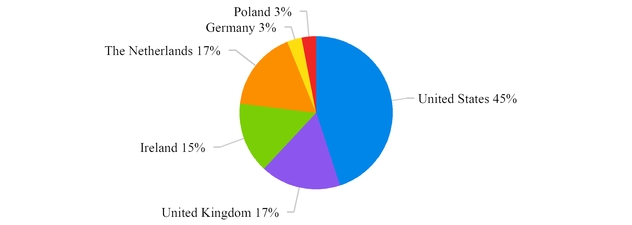
We believe that there is an opportunity to create attractive total returns by employing a strategy of investing in a diversified portfolio of such investments which are well-selected, well-managed and disposed of at an optimal time. We may use proceeds from disposals to make additional strategic acquisitions or we may use proceeds from disposals of properties for future capital expenditures, leasing capital needs, or reducing our leverage in the portfolio. Our principal targeted assets are investments in properties, and other real estate investments that relate to properties, that have quality construction and desirable locations which can attract quality tenants. These types of investments are, or relate to, properties generally located in central business districts or suburban markets of major metropolitan cities worldwide. We intend to invest in a geographically diverse portfolio in order to reduce the risk of reliance on a particular market, a particular property and/or a particular tenant. We anticipate that international real estate investments may comprise a substantial portion of our portfolio.
We may invest in real estate properties and other real estate investments directly by owning 100% of such investments or indirectly by owning less than 100% of such investments through co-ownership or joint-venture arrangements with third parties or with other Hines-affiliated entities. We intend to fund our future acquisitions and investments primarily with proceeds raised in our public offerings and potential follow-on offerings as well as with proceeds from debt financings.
We are not limited as to the asset types or geographic areas in which we may invest and conduct our operations. We are not specifically limited in the number or size of investments we may make, or on the percentage of net proceeds of our public offerings that we may invest in a single property, a real estate investment, real estate-related securities or a loan. Although the actual percentages may vary from those presently anticipated, after the proceeds of our public offerings and any subsequent offerings have been fully invested, we anticipate that international real estate investments will comprise between 40% and 60% of our portfolio and real estate investments other than the acquisition of commercial real estate properties will comprise less than 30% of our portfolio. The number, size and mix of investments we make will depend upon real estate and market conditions and other circumstances existing at the time we are evaluating investment opportunities and the amount of proceeds we raise in our public offerings and any subsequent offerings.
Financing Strategy and Policies
As of December 31, 2019, our portfolio was approximately 50% leveraged (based on the most recent valuations of our real estate investments) with a weighted average interest rate of 2.54%. We expect that once we have fully invested the proceeds of our public offerings, our debt financing, including our pro rata share of the debt financing of entities in which we may invest, will be in the range of approximately 40%-60% of the aggregate value of our real estate investments and other assets. Financing for acquisitions and investments may be obtained at the time an asset is acquired or an investment is made or at such later time as we determine to be appropriate. In addition, debt financing may be used from time to time for property improvements, lease inducements, tenant improvements, purchase of real estate-related securities and other working capital needs, including the payment of distributions. Additionally, the amount of debt placed on an individual property or related to a particular investment, including our pro rata share of the amount of debt incurred by an individual entity in which we invest, may be less than 40% or more than 60% of the value of such property/investment or the value of the assets owned by such entity, depending on market conditions and other factors.
Our aggregate borrowings, secured and unsecured, must be reasonable in relation to our net assets and must be reviewed by our board of directors at least quarterly. Our charter limits our borrowing to 300% of our net assets (which approximates 75% of the cost of our assets) unless any excess borrowing is approved by a majority of our independent directors and is disclosed to our stockholders in our next quarterly report along with justification for the excess.
Our existing indebtedness and any additional indebtedness we do incur will likely be subject to continuing covenants, and we will likely be required to make continuing representations and warranties about our company in connection with such debt. Moreover, some or all of our debt may be secured by some or all of our assets. If we default on the payment of interest or principal on any such debt, breach any representation or warranty in connection with any borrowing or violate any covenant in any loan document, our lender may accelerate the maturity of such debt, requiring us to immediately repay all outstanding principal.
Distribution Objectives
In order to qualify as a REIT for U.S. federal income tax purposes, we generally must distribute at least 90% of our taxable income (excluding capital gains) to our stockholders. We intend, although we are not legally obligated, to continue to make regular monthly distributions to holders of our common shares in excess of the level required to maintain our REIT status unless our results of operations, our general financial condition, general economic conditions or other factors inhibit us from doing so. Distributions are authorized at the discretion of our board of directors, which is directed, in substantial part, by its obligation to cause us to comply with the REIT requirements of the Internal Revenue Code of 1986, as amended (the “Code”).
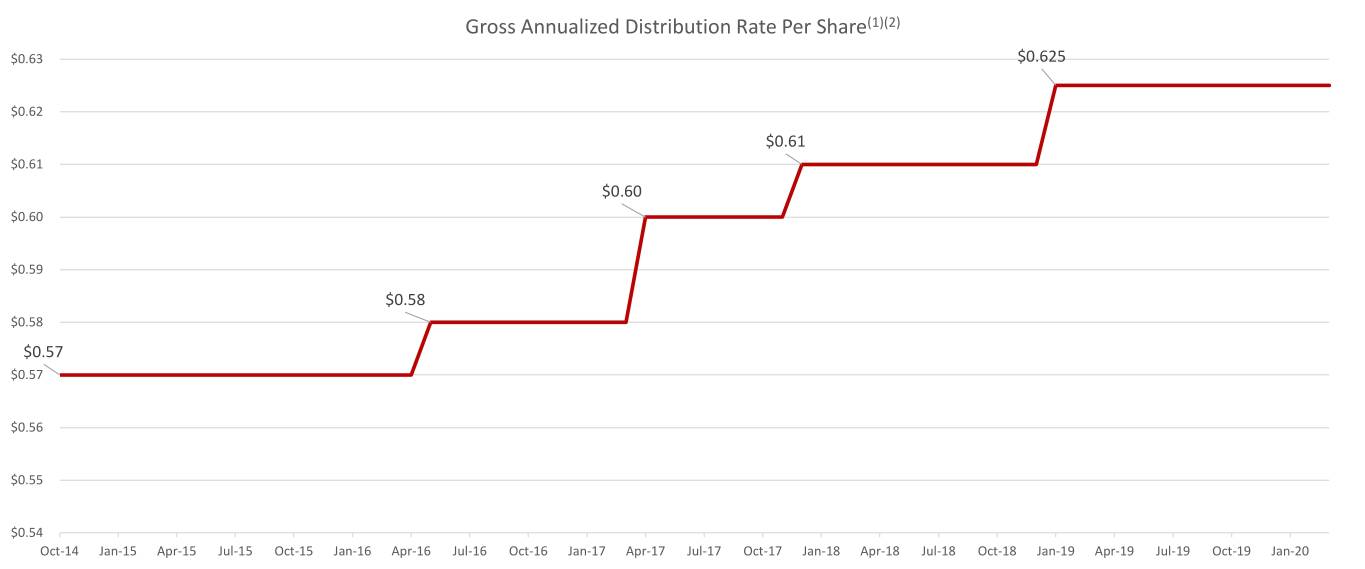
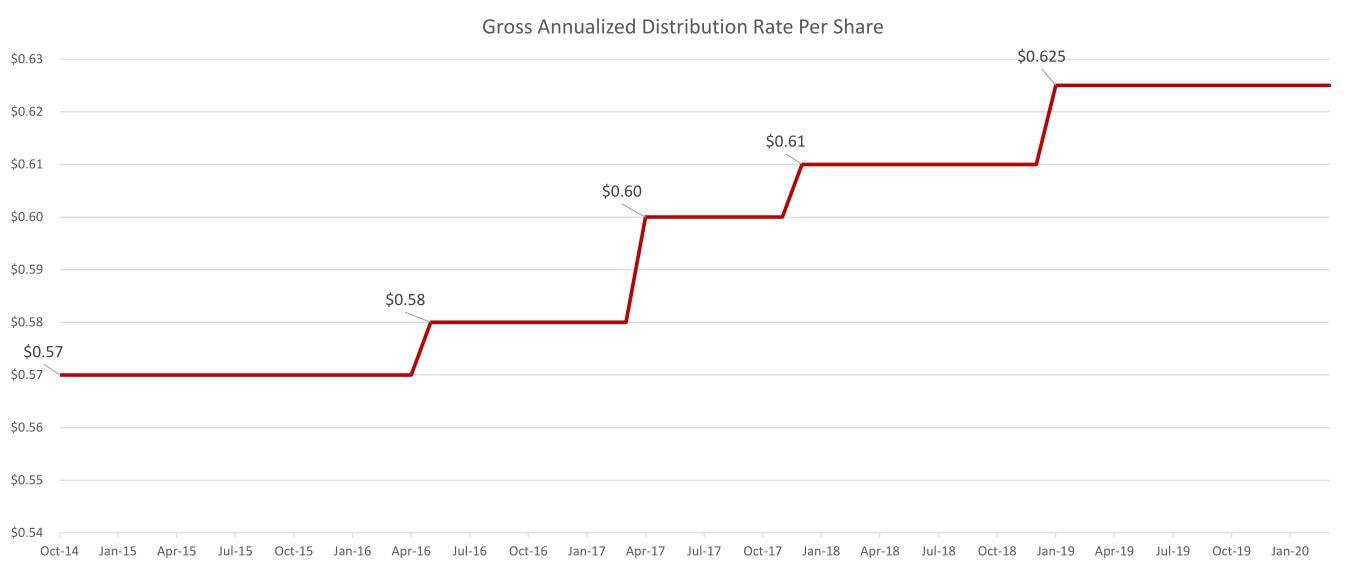
With the authorization of our board of directors, we declared distributions daily through December 31, 2017. Beginning in January 2018, we have accrued and intend to continue to accrue and pay regular distributions on a monthly basis, as of monthly record dates. Distributions will be made on all classes of shares of our common stock, including any outstanding shares related to our Initial Offering (“IPO Shares”) at the same time. All distributions were or will be paid in cash or reinvested in shares of our common stock for those participating in our distribution reinvestment plan and have been or will be paid or issued, respectively, on the first business day following the completion of the month to which they relate. Distributions reinvested pursuant to our distribution reinvestment plan were or will be reinvested in shares of the same class as the shares on which the distributions are being made. Some or all of the cash distributions may be paid from sources other than cash flows from operations.
Set forth below is information regarding our historical gross annualized distribution rates, excluding any applicable distribution and stockholder servicing fees, since October 1, 2014 (the date our board first authorized distributions to be declared).
We have not generated and we may continue to be unable to generate sufficient cash flow from operations to fully fund distributions paid. Therefore, our distributions have been paid and may continue to be paid, and during the offering phase, are likely to be paid at least partially from other sources, such as proceeds from the sale of assets, proceeds from our debt financings, proceeds from our public offerings, cash advances by our Advisor and/or cash resulting from a waiver or deferral of fees. For example, we funded 42%, 32% and 56% of total distributions for the years ended December 31, 2019, 2018 and 2017, respectively, with cash flows from other sources such as cash flows from investing activities, which may include proceeds from the sale of real estate and/or cash flows from financing activities, which may include offering proceeds.
For additional information regarding distributions declared and paid by us, refer to Item 7. “Management’s Discussion and Analysis of Financial Condition and Results of Operations — Distributions History.”
Tax Status
We have elected to be taxed as a REIT under Sections 856 through 860 of the Code, beginning with our taxable year ended December 31, 2015. Our management believes that we operate in such a manner as to qualify for treatment as a REIT and we intend to operate in the foreseeable future in such a manner so that we will remain qualified as a REIT for U.S. federal income tax purposes. Accordingly, no provision has been made for U.S. federal income taxes for the years ended December 31, 2019, 2018 and 2017 in the accompanying consolidated financial statements. From time to time, the Company records income tax expense comprising of foreign income taxes relating to the operation of its international properties. The Company generally does not expect to have any uncertain tax positions or unrecognized tax benefits requiring disclosure.
Competition
Numerous real estate companies, real estate investment trusts and U.S. institutional and foreign investors compete with us in acquiring properties or making other real estate investments and obtaining creditworthy tenants to occupy such properties.
Many of these entities have significant financial and other resources, allowing them to compete effectively with us. Principal factors of competition in our primary business of acquiring properties or making other real estate investments include access to capital, the quality of properties, leasing terms (including rent and other charges and allowances for inducements and tenant improvements), the quality and breadth of tenant services provided, and reputation as an owner and operator of commercial real estate investments in the relevant market. Additionally, our ability to compete depends upon, among other factors, trends of the global, national and local economies, investment alternatives, financial condition and operating results of current and prospective tenants, availability and cost of capital, taxes, governmental regulations, legislation and demographic trends.
We believe Hines’ extensive real estate experience and depth and breadth of its organization of approximately 4,500 employees located in over 100 cities across the United States and 23 foreign countries allows it to better identify investment opportunities for us. However, competition may increase our cost of acquisitions.
Tenants
We are dependent upon the ability of current tenants to pay their contractual rent amounts as the rents become due. For the year ended December 31, 2019, there were no tenants that individually represented more than 10% of our total rental revenue.
Available Information
Stockholders may obtain copies of our filings with the Securities and Exchange Commission (“SEC”), free of charge from the website maintained by the SEC at www.sec.gov or from our website at www.hinessecurities.com/current-offerings/hgit. Our filings will be available on our website as soon as reasonably practicable after we electronically file such materials with the SEC. However, the information from our website is not incorporated by reference into this report.
Item 1A. Risk Factors
You should carefully read and consider the risks described below, together with all other information in this report. If certain of the following risks actually occur, it could have a material adverse effect on our business, financial condition, and results of operations and our ability to pay distributions would likely suffer materially or could be eliminated entirely. As a result, the value of our common shares may decline, and our stockholders could lose all or part of the money they paid to buy our common shares.
Risks Related to Investing in the Offerings and Our Common Stock
We have a limited prior operating history, and the prior performance of other Hines affiliated entities may not be a good measure of our future results; therefore, there is a higher risk that we will not be able to achieve our investment objectives compared to a real estate investment trust with a significant operating history.
We have a limited prior operating history. As a result, an investment in our shares of common stock may entail more risk than the shares of common stock of a real estate investment trust with a significant operating history and we may not be able to achieve our investment objectives. In addition, our stockholders should not rely on the past performance of investments by other investment vehicles sponsored by Hines to predict our future results. Our investment strategy and key employees may differ from the investment strategies and key employees of our affiliates in the past, present and future.
We offer a share redemption program for stockholders seeking liquidity of their shares. However, there is no public market for our common shares; therefore, it will be difficult for our stockholders to sell their shares and, if they are able to sell their shares, they will likely sell them at a discount to the price our stockholders paid.
There is no public market for our common shares, and we do not expect one to develop. We have a share redemption program, but it is limited in terms of the amount of shares which may be redeemed. It will therefore be difficult for our stockholders to sell their shares of common stock promptly or at all. Additionally, our charter contains restrictions on the ownership and transfer of our shares, and these restrictions may limit the ability of our stockholders to sell their shares. If they are able to sell their shares, they may only be able to sell them at a discount from the price they paid. Any redemptions of shares will be at a price equal to the transaction price of the class of shares being redeemed on the date of redemption (which generally will be equal to the most recently determined NAV per share applicable to the class of shares being redeemed and most recently disclosed by us in a public filing with the SEC), and not based on the price at which they initially purchased the shares. Subject to limited exceptions, shares redeemed within one year of the date of issuance will be redeemed at 95% of the transaction price. As a result, stockholders may receive less than the price they paid for their shares when they sell them to us pursuant to our share redemption program. In addition, stockholders may also experience substantial losses if we dispose of our assets or in connection with a liquidation event. We cannot assure stockholders that their shares will ever appreciate in value to equal the price they paid for their shares. Thus, prospective stockholders should consider our common shares as illiquid and a long-term investment, and they must be prepared to hold their shares for an indefinite length of time.
The Offering is a blind pool offering and our stockholders do not have the opportunity to evaluate our future investments prior to purchasing shares of our common stock.
Our stockholders will not be able to evaluate the economic merits, transaction terms or other financial or operational data concerning our future investments prior to purchasing shares of our common stock. In addition, our investment policies and strategies are very broad and permit us to invest in all types of properties and other real estate investments. Our stockholders must rely on our Advisor and our board of directors to implement our investment policies, to evaluate our investment opportunities and to structure the terms of our investments. Because our stockholders cannot evaluate our future investments in advance of purchasing shares of our common stock, a “blind pool” offering may entail more risk than other types of offerings. This additional risk may hinder our stockholders’ ability to achieve their personal investment objectives related to portfolio diversification, risk-adjusted investment returns and other objectives.
The Offering is a “best efforts” offering and if we are unable to raise substantial additional funds, we will be limited in the number and type of investments we may make which could negatively impact an investment in shares of our common stock.
The Offering is being made on a “best efforts” basis, whereby the broker dealers participating in the Offering are only required to use their best efforts to sell shares of our common stock and have no firm commitment or obligation to purchase any of the shares of our common stock. As a result, the amount of proceeds we raise in the Offering may be substantially less than the amount we would need to achieve a diversified industrial portfolio. Our inability to raise substantial additional funds would
increase our fixed operating expenses as a percentage of gross income, and our financial condition and ability to make distributions could be adversely affected. As of March 1, 2020, we have raised aggregate gross proceeds of approximately $985.7 million from the sale of shares in our Public Offering, including shares sold through the distribution reinvestment plan, and as of the date of this Annual Report on Form 10-K, we have acquired eighteen interests in real estate properties. If we are unable to sell a significant number of the shares being offered in the Offering, we are more likely to focus on making investments in loans and real estate related entities, resulting in less diversification in terms of the number of investments owned, the geographic regions in which our property investments are located and the types of investments that we make. As a result, the likelihood increases that any single investment’s poor performance would materially affect our overall investment performance.
The availability and timing of distributions to our stockholders is uncertain and cannot be assured.
There is no assurance that distributions will continue to be authorized and paid. We cannot assure our stockholders that we will have sufficient cash to continue to pay distributions to them or that the amount of any such distributions will increase over time. In addition, the distribution and stockholder servicing fees payable with respect to Class T shares, Class S shares and Class D shares issued in the Offering will reduce the amount of funds available for distribution with respect to all Class T shares, Class S shares and Class D shares (including Class T shares, Class S shares and Class D shares issued pursuant to the distribution reinvestment plan). Further, because the distribution and stockholder servicing fees payable with respect to Class T shares and Class S shares are higher than those payable with respect to Class D shares, distributions with respect to Class T shares and Class S shares will be lower than distributions with respect to Class D shares; also, because there are no distribution and stockholder servicing fees payable with respect to Class I shares, distributions with respect to Class T shares, Class S shares and Class D shares will be lower than distributions with respect to Class I shares. Should we fail for any reason to distribute at least 90% of our REIT taxable income, we would not qualify for the favorable tax treatment accorded to REITs.
We have, may continue, and during the offering phase, are likely to pay distributions from sources other than our cash flow from operations, including advances, deferrals or waivers of fees from our Advisor or affiliates, borrowings and/or proceeds of the Offering. We have not placed a cap on the amount of our distributions that may be paid from any of these sources. The use of sources other than our cash flow from operations to fund distributions could adversely impact our ability to pay distributions in future periods, decrease the amount of cash we have available for operations and new investments and/or potentially impact the value or result in dilution of our stockholders’ investment.
During the offering phase, and from time to time thereafter, our cash flow from operations may be insufficient to fund distributions to stockholders. Our organizational documents permit us to make distributions from any source and we may choose to pay distributions when we do not have sufficient cash flow from operations to fund such distributions. We may choose to use advances, deferrals or waivers of fees, if available, from our Advisor or affiliates, borrowings and/or proceeds of the Offering or other sources to fund distributions to our stockholders. For example, we funded 42% of total distributions for 2019 with cash flows from other sources such as cash flows from investing activities, which may include proceeds from the sale of real estate and/or cash flows from financing activities, which may include offering proceeds. When we pay distributions in excess of earnings and we use cash flows from financing activities, including offering proceeds and borrowings, to fund distributions, then we have less funds available for operations and for acquiring properties and other investments, which could adversely impact our ability to pay distributions in future periods, may reduce our stockholders’ overall return and may result in the dilution of our stockholders’ investment. In addition, our Advisor or its affiliates could choose to receive shares of our common stock or interests in the Operating Partnership in lieu of cash or deferred fees or the repayment of advances to which they are entitled, and the issuance of such securities may dilute our stockholders’ interest in us. Furthermore, to the extent distributions exceed cash flow from operations, a stockholder’s basis in our stock will be reduced and, to the extent distributions exceed a stockholder’s basis, the stockholder may recognize capital gain.
We have incurred net losses on a GAAP basis in the past and may continue to incur such losses in the future.
For the years ended December 31, 2019, 2018 and 2017, we have incurred net losses, on a GAAP basis, of approximately $19.5 million, $0.9 million and $17.2 million, respectively. As a result of these losses, we had accumulated distributions in excess of earnings balances, on a GAAP basis, of approximately $146.8 million, $91.7 million and $68.2 million, respectively, as of December 31, 2019, 2018 and 2017. Our net losses and the related accumulated distributions in excess of earnings balances for these periods are largely attributable to depreciation and amortization of our real estate investments as well as acquisition-related fees and expenses that are incurred while we are in the acquisition phase of our life cycle. Therefore, we may continue to incur net losses and accumulated distributions in excess of earnings balances in the future.
Additionally, we incurred other comprehensive losses, on a GAAP basis, of approximately $16.0 million, $6.7 million and $9.5 million for the years ended December 31, 2019, 2018 and 2017, respectively. These amounts relate to translating the
financial statements of our international subsidiaries into U.S. dollars for financial reporting purposes and represent changes in the exchange rates between the functional currencies of these subsidiaries and the U.S. dollar.
Payments to the holders of OP Units will reduce cash available for distribution to our stockholders.
An affiliate of Hines has received units of limited partnership interests in the Operating Partnership (“OP Units”) in return for its $190,000 contribution to the Operation Partnership. Our Advisor or its affiliates may also choose to receive OP Units in lieu of certain fees. The holders of all OP Units will be entitled to receive cash from operations pro rata with the distributions being paid to us and such distributions to the holder of the OP Units will reduce the cash available for distribution to our stockholders.
Payments to our Advisor in respect of any common stock or OP Units it elects to receive in lieu of fees or distributions will dilute future cash available for distribution to our stockholders.
Our Advisor may choose to receive our common shares or OP Units in lieu of certain fees or distributions. The holders of all OP Units will be entitled to receive cash from operations pro rata with the distributions being paid to us and such distributions to the holders of OP Units will reduce the cash available for distribution to us and to our stockholders. Furthermore, under certain circumstances the OP Units held by our Advisor are required to be repurchased, in cash at the holder’s election and there may not be sufficient cash to make such a repurchase payment; therefore, we may need to use cash from operations, borrowings, offering proceeds, or other sources to make the payment, which will reduce cash available for distribution to our stockholders or for investment in our operations. Redemptions of any of our shares or OP Units that were received by our Advisor in lieu of a cash asset management fee are not subject to the monthly and quarterly volume limitations or the 5% holding discount under our share redemption program. Redemptions of any of our shares or OP Units that were received by our Advisor in lieu of a cash distribution with respect to its performance participation allocation are not subject to the 5% holding discount under our share redemption program, but, in the case of shares, such redemptions are subject to the monthly and quarterly volume limitations and do not receive priority over other shares being put for redemption during such period.
Our stockholders’ ability to have their shares redeemed is limited under our share redemption program, and if they are able to have their shares redeemed, it may be at a price that is less than the price they paid for the shares and the then-current market value of the shares.
Our share redemption program contains significant restrictions and limitations. For example, only stockholders who purchase their shares directly from us or who received their shares through a non-cash transaction, not in the secondary market, are eligible to participate, and if holders of shares do not hold their shares for a minimum of one year, then they will only be eligible for redemption at 95% of the transaction price that would otherwise apply. We may choose to redeem fewer shares than have been requested in any particular month to be redeemed under our share redemption program, or none at all, in our discretion at any time. We may redeem fewer shares than have been requested to be redeemed due to lack of readily available funds because of adverse market conditions beyond our control, the need to maintain liquidity for our operations or because we have determined that investing in real property or other illiquid investments is a better use of our capital than the redemption of our shares. In addition, the total amount of shares that may be redeemed under our share redemption program is limited, in any calendar month, to shares whose aggregate value (based on the transaction price per share on the date on the redemption) is 2% of our aggregate NAV as of the last calendar day of the previous month and during any calendar quarter whose aggregate value (based on the transaction price per share in effect when the redemption is effected) is up to 5% of our aggregate NAV as of the last calendar day of the prior calendar quarter.
The vast majority of our assets consist of properties which cannot generally be readily liquidated on short notice without impacting our ability to realize full value upon their disposition. Therefore, we may not always have a sufficient amount of cash to immediately satisfy redemption requests. Further, we may invest in real estate-related securities and other securities with the primary goal of maintaining liquidity in support of our share redemption program. Any such investments may result in lower returns than an investment in real estate assets, which could adversely impact our ability to pay distributions and your overall return. In addition, our board of directors may modify, suspend or terminate our share redemption program at any time in its sole discretion. As a result of these limitations, our stockholders’ ability to have their shares redeemed by us may be limited, our shares should be considered as having only limited liquidity and at times may be illiquid. In addition, the redemption price our stockholders may receive upon any such redemption may not be indicative of the price our stockholders would receive if our shares were actively traded or if we were liquidated, and our stockholders should not assume that they will be able to sell all or any portion of their shares back to us pursuant to our share redemption program or to third parties at a price that reflects the then current market value of the shares or at all.
The offering and redemption prices per share of our common stock generally will be based on an NAV determined as of the end of the prior month and will not be based on an NAV per share determined as of the date the shares are purchased or redeemed.
Generally, our offering and redemption prices per share of our common stock will be based on our NAV per share as of the last calendar day of the prior month, plus, in the case of our offering price, applicable upfront selling commissions and dealer manager fees. Our offering and redemption prices will not be based on any public trading market. Certain of our investments and liabilities may be subject to more significant volatility from time to time and could change in value materially between the last calendar day of the prior month as of which the NAV per share is determined and the date that our shares are purchased or redeemed, however the NAV per share determined as of the end of the prior month will generally continue to be used as the as the basis for the offering price per share and the redemption price per share in the current month. Accordingly, since the offering and redemption prices will be based on an NAV per share determined as of a date that is approximately 30 days prior to the date the shares are purchased or redeemed, the price at which stockholders purchase shares and the price at which stockholders have their shares redeemed may be higher or lower than the actual then-current NAV per share. In addition, in exceptional circumstances we may, in our sole discretion, offer and redeem shares at a price that we believe reflects the NAV per share more appropriately than the NAV per share determined as of the end of the prior month, including by updating a previously disclosed transaction price, in cases where we believe there has been a material change (positive or negative) to our NAV per share since the end of the prior month. In such exceptional cases, the offering and redemption prices will not equal our NAV per share as of any particular date, but rather will reflect our adjustments to the NAV determined as of the end of the prior month.
Economic events that may cause our stockholders to request that we redeem their shares may materially adversely affect our cash flow and our results of operations and financial condition.
Economic events affecting the U.S. economy, including, without limitation, economic uncertainty and disruption created by global events, such as the outbreak of COVID-19 (more commonly referred to as the Coronavirus), as well as the general negative performance of the real estate sector, could cause our stockholders to seek to sell their shares to us pursuant to our share redemption program at a time when such events are adversely affecting the performance of our assets. Even if we decide to satisfy all resulting redemption requests, our cash flow could be materially adversely affected. In addition, if we determine to sell assets to satisfy redemption requests, we may not be able to realize the return on such assets that we may have been able to achieve had we sold at a more favorable time, and our results of operations and financial condition, including, without limitation, breadth of our portfolio by property type and location, could be materially adversely affected.
Valuations and appraisals of our properties, real estate-related assets and real estate-related liabilities are estimates of value and may not necessarily correspond to realizable value.
The valuation methodologies used to value our properties and certain real estate-related assets involve subjective judgments regarding such factors as comparable sales, rental revenue and operating expense data, known contingencies, the capitalization or discount rate, and projections of future rent and expenses based on appropriate analysis. As a result, valuations and appraisals of our properties, real estate-related assets and real estate-related liabilities are only estimates of current market value. Ultimate realization of the value of an asset or liability depends to a great extent on economic and other conditions beyond our control and the control of the independent valuation firm and other parties involved in the valuation of our assets and liabilities. Further, these valuations may not necessarily represent the price at which an asset or liability would sell, because market prices of assets and liabilities can only be determined by negotiation between a willing buyer and seller. Valuations used for determining our NAV also are generally made without consideration of the expenses that would be incurred in connection with disposing of assets and liabilities. Therefore, the valuations of our properties, our investments in real estate-related assets and our liabilities may not correspond to the timely realizable value upon a sale of those assets and liabilities. In addition, our NAV does not currently represent enterprise value and may not accurately reflect the actual prices at which our assets could be liquidated on any given day, the value a third party would pay for all or substantially all of our shares, or the price that our shares would trade at on a national stock exchange. There will be no retroactive adjustment in the valuation of such assets or liabilities, the price of our shares of common stock, the price we paid to redeem shares of our common stock or NAV-based fees we paid to our Advisor and our Dealer Manager to the extent such valuations prove to not accurately reflect the true estimate of value and are not a precise measure of realizable value. Because the price our stockholders will pay for shares of our common stock in the Offering, and the price at which your shares may be redeemed by us pursuant to our share redemption program, are generally based on our NAV per share, stockholders may pay more than realizable value or receive less than realizable value for their investment.
In order to disclose a monthly NAV, we are reliant on the third parties that we engage for that purpose, in particular the independent valuation firm and the appraisers that we hire to value and appraise our real estate portfolio.
In order to disclose a monthly NAV, our board of directors, including a majority of our independent directors, has adopted valuation procedures to be used in connection with the calculation of our NAV and will cause us to engage independent third parties such as the independent valuation firm, to value our real estate portfolio on a monthly basis and to provide periodic appraisals with respect to our properties. Although our board of directors, with the assistance of our Advisor, oversees all of these parties and the reasonableness of their work product, we will not independently verify our NAV or the components thereof, such as the appraised values of our properties. Our management’s assessment of the market values of our properties may also differ from the appraised values of our properties as determined by the independent valuation firm. If the parties engaged by us to assist in the determination of our monthly NAV are unable or unwilling to perform their obligations to us, our NAV could be inaccurate or unavailable, and we could decide to suspend the Follow- On Offering and our share redemption program.
No rule or regulation requires that we calculate our NAV in a certain way, and our board of directors, including a majority of our independent directors, may adopt changes to the valuation procedures.
There are no existing rules or regulatory bodies that specifically govern the manner in which we calculate our NAV. As a result, it is important that stockholders pay particular attention to the specific methodologies and assumptions we use to calculate our NAV. Other public REITs may use different methodologies or assumptions to determine their NAV. In addition, each year our board of directors, including a majority of our independent directors, reviews the appropriateness of our valuation procedures and may, at any time, adopt changes to the valuation procedures. Our board of directors may change aspects of our valuation procedures, which changes may have an adverse effect on our NAV and the price at which stockholders may sell shares to us under our share redemption program.
Our NAV is not subject to GAAP, is not independently audited and involves subjective judgments by the independent valuation firm and other parties involved in valuing our assets and liabilities.
Our valuation procedures and our NAV are not subject to GAAP, and will not be subject to independent audit. Our NAV may differ from equity (net assets) reflected on our audited financial statements, even if we are required to adopt a fair value basis of accounting for GAAP financial statement purposes. Additionally, we are dependent on the Advisor to be reasonably aware of material events specific to our properties (such as tenant disputes, damage, litigation and environmental issues) that may cause the value of a property to change materially and to promptly notify the independent valuation firm so that the information may be reflected in our real estate portfolio valuation. In addition, the implementation and coordination of our valuation procedures include certain subjective judgments of the Advisor, such as whether the independent valuation firm should be notified of events specific to our properties that could affect their valuations, as well as of the independent valuation firm and other parties we engage, as to whether adjustments to asset and liability valuations are appropriate. Accordingly, you must rely entirely on our board of directors to adopt appropriate valuation procedures and on the independent valuation firm and other parties we engage in order to arrive at our NAV, which may not correspond to realizable value upon a sale of our assets.
Our NAV per share may suddenly change if the valuations of our properties materially change from prior valuations or the actual operating results materially differ from our projections.
It is possible that the annual appraisals of our properties may not be spread evenly throughout the year and may differ from the most recent monthly valuation. As such, when these appraisals are reflected in our valuation of our real estate portfolio, there may be a sudden change in our NAV per share for each class of our common stock. Property valuation changes can occur for a variety of reasons, such as catastrophes, pandemics, local real estate market conditions, the financial condition of our tenants, or lease expirations. For example, we expect to regularly face lease expirations across our portfolio, and as we move further away from lease commencement toward the end of a lease term, the valuation of the underlying property will be expected to drop depending on the likelihood of a renewal or a new lease on similar terms. Such a valuation drop can be particularly significant when closer to a lease expiration, especially for single tenant properties or where an individual tenant occupies a large portion of a property. We will be at the greatest risk of these valuation changes during periods in which we have a large number of lease expirations as well as when the lease of a significant tenant is closer to expiration. In addition, actual operating results may differ from what we originally budgeted, which may cause a sudden increase or decrease in the NAV per share amounts. We accrue estimated income and expenses on a periodic basis based on annual budgets as adjusted from time to time to reflect changes in the business throughout the year. On a periodic basis, we adjust the income and expense accruals we estimated to reflect the income and expenses actually earned and incurred. We will not retroactively adjust the NAV per share of each class for any such adjustments. Therefore, because actual results from operations may be better or worse than what we previously budgeted, the adjustment to reflect actual operating results may cause the NAV per share for each class of our common stock to increase or decrease.
New acquisitions may be valued for purposes of our NAV at less than what we pay for them, which would dilute our NAV.
Pursuant to our valuation procedures, the acquisition price of newly acquired properties will serve as our appraised value for the year of acquisition, and thereafter will be part of the rotating appraisal cycle such that they are appraised at least every calendar year. However, the independent valuation firm will have the ability to adjust property valuations for purposes of our NAV from the most recent appraised value. Similarly, if the independent valuation firm believes that the purchase price for a recent acquisition does not reflect the current value of the property, the valuation may be adjusted downwards immediately after acquisition for purposes of our NAV. Even if the independent valuation firm does not adjust the valuation downwards immediately following the acquisition, when we obtain an appraisal on the property, it may not appraise at a value equal to the purchase price. Accordingly, the value of a new acquisition as established under our NAV procedures could be less than what we paid for it, which could negatively affect our NAV. Large portfolio acquisitions, in particular, may require a “portfolio premium” to be paid by us in order to be a competitive bidder, and this “portfolio premium” may not be taken into consideration in calculating our NAV. In addition, acquisition expenses we incur in connection with new acquisitions will negatively impact our NAV. We may make acquisitions of any size without stockholder approval, and such acquisitions may be dilutive to our NAV.
The NAV per share that we publish may not necessarily reflect changes in our NAV that are not immediately quantifiable.
From time to time, we may experience events with respect to our investments that may have a material impact on our NAV. For example, and not by way of limitation, changes in governmental rules, regulations and fiscal policies, environmental legislation, acts of God, terrorism, social unrest, civil disturbances and major disturbances in financial markets may cause the value of a property to change materially. The NAV per share of each class of our common stock as published for any given month may not reflect such extraordinary events to the extent that their financial impact is not immediately quantifiable. As a result, the NAV per share that we publish may not necessarily reflect changes in our NAV that are not immediately quantifiable, and the NAV per share of each class published after the announcement of a material event may differ significantly from our actual NAV per share for such class until such time as the financial impact is quantified and our NAV is appropriately adjusted in accordance with our valuation procedures. The resulting potential disparity in our NAV may inure to the benefit of redeeming stockholders or non-redeeming stockholders and new purchasers of our common stock, depending on whether our published NAV per share for such class is overstated or understated.
The realizable value of specific properties may change before the value is adjusted and reflected in the calculation of our NAV.
Our valuation procedures generally provide that our Advisor will adjust a real property’s valuation, as necessary, based on known events that have a material impact on the most recent value (adjustments for non-material events may also be made). We are dependent on our Advisor to be reasonably aware of material events specific to our properties (such as tenant disputes, damage, litigation and environmental issues, as well as positive events such as new lease agreements) that may cause the value of a property to change materially and to promptly notify the independent valuation firm so that the information may be reflected in our real estate portfolio valuation. Events may transpire that, for a period of time, are unknown to us or the independent valuation firm that may affect the value of a property, and until such information becomes known and is processed, the value of such asset may differ from the value used to determine our NAV. In addition, although we may have information that suggests a change in value of a property may have occurred, there may be a delay in the resulting change in value being reflected in our NAV until such information is appropriately reviewed, verified and processed. Where possible, adjustments generally are made based on events evidenced by proper final documentation. It is possible that an adjustment to the valuation of a property may occur prior to final documentation if the independent valuation firm determines that events warrant adjustments to certain assumptions that materially affect value. However, to the extent that an event has not yet become final based on proper documentation, its impact on the value of the applicable property may not be reflected (or may be only partially reflected) in the calculation of our NAV.
The performance participation allocation payable to the Advisor is calculated on the basis of the overall investment return on OP Units over a calendar year, so it may not be consistent with the return on your shares.
The performance participation allocation payable to the Advisor is calculated on the basis of the overall investment return over a calendar year. As a result of the manner in which the performance participation allocation is calculated, it is not directly tied to the performance of the shares our stockholders purchase, the class of shares you purchase, or the time period during which our stockholders own their shares. The performance participation allocation may be payable to the Advisor even if the
NAV of a stockholder’s shares at the time the performance participation allocation is calculated is below such stockholder’s purchase price, and the thresholds at which increases in NAV count towards the overall return are not based on such stockholder’s purchase price. Because of the class-specific allocations of the ongoing distribution and stockholder servicing fees, which differ among classes, we do not expect the overall return of each class of shares and OP Units to ever be the same. However, if and when the performance participation allocation is payable, the expense will be allocated among all holders of shares and OP Units ratably according to the NAV of their shares or units, regardless of the different returns achieved by different classes of shares during the year. Further, stockholders who redeem their shares during a given year may redeem their shares at a lower NAV per share as a result of an accrual for the estimated performance participation allocation, even if no performance participation allocation is ultimately payable to the Advisor for all or any portion of such calendar year. In addition, if the Advisor earns the performance participation allocation in any given year, it will not be obligated to return any portion of it based on our subsequent performance.
Our stockholders will not have the benefit of an independent due diligence review in connection with the Offering and, since there is no separate counsel for us and certain of our affiliates in connection with the Offering, if a conflict of interest arises between us and Hines, we may incur additional fees and expenses.
Because our Advisor and our Dealer Manager are affiliates of Hines, our stockholders will not have the benefit of an independent due diligence review and investigation of the type normally performed by an unaffiliated, independent underwriter in connection with a securities offering. In addition, Morrison & Foerster LLP has acted as counsel to us, our Advisor and our Dealer Manager in connection with the Offering and, therefore, investors will not have the benefit of a due diligence review and investigation that might otherwise be performed by independent counsel which increases the risk of their investment. There is a possibility in the future that the interests of the various parties may become adverse and, under the code of professional responsibility of the legal profession, Morrison & Foerster LLP may be precluded from representing any one or all of such parties. If any situation arises in which our interests appear to be in conflict with those of our Advisor, our Dealer Manager or their affiliates, additional counsel may be retained by one or more of the parties to assure that their interests are adequately protected, which may result in us incurring additional fees and expenses. Moreover, should a conflict of interest not be readily apparent, Morrison & Foerster LLP may inadvertently act in derogation of the interest of the parties which could affect our ability to meet our investment objectives.
The fees we pay in connection with the Offering and the agreements entered into with Hines and its affiliates were not determined on an arm’s-length basis and therefore may not be on the same terms we could achieve from a third party.
The compensation paid to our Advisor, Dealer Manager, Hines and other affiliates for services they provide us was not determined on an arm’s-length basis. All service agreements, contracts or arrangements between or among Hines and its affiliates, including our Advisor and us, were not negotiated at arm’s-length. Such agreements include our Advisory Agreement, our Dealer Manager Agreement, and any property management and leasing agreements. A third party unaffiliated with Hines may be willing and able to provide certain services to us at a lower price.
We pay substantial compensation to Hines, our Advisor and their affiliates, which may be increased during the Offering or future offerings by our independent directors.
Subject to limitations in our charter, the fees, compensation, income, expense reimbursements, interests and other payments payable to Hines, our Advisor and their affiliates may increase during the Offering or in the future without stockholder approval if such increase is approved by a majority of our independent directors.
We do not, and do not expect to, have research analysts reviewing our performance.
We do not, and do not expect to, have research analysts reviewing our performance or our securities on an ongoing basis. Therefore, our stockholders will not have an independent review of our performance and the value of our common stock relative to publicly traded companies.
Our stockholders may experience dilution.
Our stockholders do not have preemptive rights. If we engage in a subsequent offering of common shares or securities convertible into common shares, issue shares pursuant to the distribution reinvestment plan or otherwise issue additional shares, investors who purchase shares in the Offering who do not participate in those other stock issuances will experience dilution in their percentage ownership of our outstanding shares. Furthermore, stockholders may experience a dilution in the value of their shares depending on the terms and pricing of any share issuances (including the shares being sold in the Offering) and the value of our assets at the time of issuance.
In order to provide liquidity to fund redemptions, we may maintain an allocation to a number of sources of liquidity including cash, cash equivalents, other short-term investments, liquid real estate-related securities and borrowing capacity under lines of credit or other debt of up to 20% of our equity. These measures may result in lower returns to you.
Although the majority of our assets consist of properties that cannot generally be readily liquidated on short notice without impacting our ability to realize full value upon their disposition, in order to provide liquidity to fund redemptions, we may maintain, under normal operating circumstances and subject to any limitations and requirements relating to our qualification as a REIT, an aggregate allocation to, cash, cash equivalents, short-term investments, liquid real estate-related securities and borrowing capacity under lines of credit or other debt of up to 20% of our equity. Our allocation of a portion of our equity to liquid investments may result in lower returns than if we had invested in additional properties and using borrowings for redemptions will reduce the funds available to retire debt or acquire additional properties, which may result in reduced profitability and restrict our ability to grow our NAV.
Risks Related to Our Business in General
Delays in purchasing properties or making other real estate investments with the proceeds received from the Offering may result in a lower rate of return to investors.
Our ability to locate and commit to purchase specific properties, or make investments, will be partially dependent on our ability to raise sufficient funds for such acquisitions and investments. We may be substantially delayed in making investments due to delays in:
| |
| • | the sale of our common shares, |
| |
| • | obtaining debt financing, |
| |
| • | negotiating or obtaining the necessary purchase documentation, |
| |
| • | locating suitable investments or |
We expect to invest proceeds we receive from the Offering in short-term, highly-liquid investments until we use such funds in our operations. We expect that the income we earn on these temporary investments will not be substantial. Further, we may use the principal amount of these investments, and any returns generated on these investments, to pay for fees and expenses in connection with the Offering and distributions. Therefore, delays in investing proceeds we raise from the Offering could impact our ability to generate cash flow for distributions.
A prolonged national or world-wide economic downturn or volatile capital market conditions could adversely affect our results of operations and our ability to pay distributions to our stockholders.
If prolonged disruptions in the capital and credit markets were to occur, they could adversely affect our ability to obtain loans, credit facilities, debt financing and other financing, or, when available, to obtain such financing on reasonable terms, which could negatively impact our ability to implement our investment strategy. See “[t]he recent global outbreak of the Coronavirus has disrupted economic markets and the prolonged economic impact is uncertain. Some economists and major investment banks have expressed concern that the continued spread of the virus globally could lead to a world-wide economic downturn” for a further discussion of the risks related to Coronavirus pandemic and its potential impact on our financial results.
If these disruptions in the capital and credit markets should continue as a result of, among other factors, uncertainty, and disruption caused by the impact of the Coronavirus, changing regulation, changes in trade agreements, reduced alternatives or additional failures of significant financial institutions, our access to liquidity could be significantly impacted. Prolonged disruptions could result in us taking measures to conserve cash until the markets stabilize or until alternative credit arrangements or other funding for our business needs could be arranged. Such measures could include deferring investments,
reducing or eliminating the number of shares redeemed under our share redemption program and reducing or eliminating distributions we make to our stockholders.
We believe the risks associated with our business are more severe during periods of economic downturn if these periods are accompanied by declining values in real estate. For example, a prolonged economic downturn could negatively impact our property investments as a result of increased customer delinquencies and/or defaults under our leases, generally lower demand for rentable space, potential oversupply of rentable space leading to increased concessions, and/or customer improvement expenditures, or reduced rental rates to maintain occupancies.
Our operations could be negatively affected to a greater extent if an economic downturn occurs, is prolonged or becomes more severe, which could significantly harm our revenues, results of operations, financial condition, liquidity, business prospects and our ability to make distributions to our stockholders and may result in a decrease in the value of our stockholders’ investment.
The recent global outbreak of the Coronavirus has disrupted economic markets and the prolonged economic impact is uncertain. Some economists and major investment banks have expressed concern that the continued spread of the virus globally could lead to a world-wide economic downturn.
The Coronavirus pandemic has had, and is expected to continue to have, an adverse impact on overall market conditions. It has already disrupted global travel and supply chains, adversely impacted global commercial activity, and its long-term economic impact remains uncertain. Some economists and major investment banks have predicted that it could lead to a global economic downturn and many government authorities have imposed shelter-in-place orders, including in the United Kingdom and in many states across the U.S. where our assets are located. Considerable uncertainty still surrounds the Coronavirus and its potential effects on the population, as well as the effectiveness of any responses taken on a national and local level by government authorities and businesses. The travel restrictions, limits on hours of operations and/or closures of non-essential businesses and other efforts to curb the spread of the Coronavirus have significantly disrupted business activity globally, including in the markets where we invest, and could have an adverse impact on the performance of certain of our investments. In addition, the rapidly evolving nature of the pandemic makes it difficult to ascertain the long term impact it will have on commercial real estate markets and our investments.
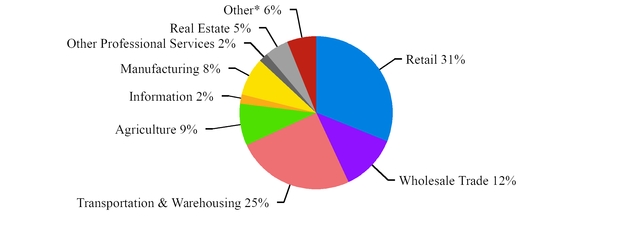
Our tenants operate in industries which are being adversely affected by the disruption to business caused by the outbreak of the Coronavirus. Many of our tenants are subject to shelter in place and other quarantine restrictions, and the restrictions could be in place for an extended period of time. These restrictions are particularly adversely impacting many of our retail tenants (other than grocery tenants), as government instructions regarding social distancing and mandated closures have reduced and, in some cases, eliminated customer foot traffic, causing many of our retail tenants to temporarily close their brick and mortar stores. As of December 31, 2019, we owned two retail properties, which comprised 17% of our portfolio, based on the estimated value of our real estate investments as of that date. If these disruptions continue and the economic downturn is prolonged, it is likely to lead to rent delinquencies and defaults under leases, lower occupancy, or reduced rental rates to maintain or improve occupancy. Any of these developments could have a material adverse effect on our financial results.
Yields on and safety of deposits may be lower if there are extensive declines in the financial markets.
Until we invest the proceeds of the Offering in real properties and other real estate investments, we may hold those funds in investments, including money market funds, bank money market accounts and CDs or other accounts at third-party depository institutions. Unusual declines in the financial markets, similar to those experienced during the Great Recession, could result in a loss of some or all of these funds. In particular, money market funds may experience intense redemption pressure and have difficulty satisfying redemption requests. As a result, we may not be able to access the cash in our money market investments. In addition, current yields from these investments are minimal.
The failure of any bank in which we deposit our funds could reduce the amount of cash we have available to pay distributions and make additional investments.
The Federal Deposit Insurance Corporation only insures amounts up to $250,000 per depositor. It is likely that we will have cash and cash equivalents and restricted cash deposited in certain financial institutions in excess of federally insured levels. If any of the banking institutions in which we deposit funds ultimately fails, we may lose any amounts of our deposits over federally insured levels. The loss of our deposits could reduce the amount of cash we have available to distribute or invest and could result in a decline in the value of our stockholders’ investment.
Because of our inability to retain earnings, we will rely on debt and equity financings for acquisitions, and if we do not have sufficient capital resources from such financings, our growth may be limited.
In order to qualify for taxation as a REIT, we generally are required to distribute to our stockholders at least 90% of our annual ordinary taxable income to maintain such qualification. This requirement limits our ability to retain income or cash flow from operations to finance the acquisition of new investments. We will explore acquisition opportunities from time to time with the intention of expanding our operations and increasing our profitability. We anticipate that we will use debt and equity financing for such acquisitions because of our inability to retain significant earnings. Consequently, if we cannot obtain debt or equity financing on acceptable terms, our ability to acquire new investments and expand our operations will be adversely affected.
We have a substantial amount of indebtedness. In the event we do not repay or refinance such indebtedness, we could face substantial liquidity issues and might be required to issue equity securities or securities convertible into equity securities, or sell some of our assets to meet our debt payment obligations.
As of December 31, 2019, we had approximately $865.7 million of outstanding indebtedness, which, upon final maturity, we will need to refinance or repay. See Note 5 — Debt Financing for a tabular presentation of our outstanding indebtedness. There can be no assurances we will be able to refinance our indebtedness (1) on commercially reasonable terms, (2) on terms, including with respect to interest rates, as favorable as our current debt, or (3) at all.
Economic conditions and the credit markets have historically experienced, and may continue to experience, periods of volatility, uncertainty, or weakness that could impact the availability or cost of debt financing.
As of December 31, 2019, we had two loans that bear interest at floating rates based on the London interbank offered rate (“LIBOR”) and mature after December 2021. In July 2017, the United Kingdom's Financial Conduct Authority, which regulates LIBOR, announced that it will stop compelling banks to submit rates for the calculation of LIBOR after 2021. It is not possible to predict the effect of these changes, other reforms or the establishment of alternative reference rates. Our loan agreements provide for procedures for determining a replacement or alternative rate in the event that LIBOR is unavailable. However, there can be no assurances as to whether such replacement or alternative rate will be more or less favorable than LIBOR. The discontinuation or modification of LIBOR could result in interest rate increases on our debt, which could adversely affect our cash flow, operating results and ability to make distributions to our stockholders at expected levels or at all.
If we are unable to repay or refinance our debt, we cannot guarantee that we will be able to generate enough cash flows from operations or that we will be able to obtain enough capital to service our debt, fund our planned capital expenditures or pay future distributions at expected levels or at all. In such an event, we could face substantial liquidity issues and might be required to sell some of our assets to meet our debt payment obligations. Failure to repay or refinance indebtedness when required could result in a default under such indebtedness. If we incur additional indebtedness, any such indebtedness could exacerbate the risks described above.
We may need to incur borrowings that would otherwise not be incurred to meet REIT minimum distribution requirements.
In order to qualify as a REIT, we are required to distribute to our stockholders at least 90% of our annual ordinary taxable income. In addition, we will be subject to a 4% nondeductible excise tax on the amount, if any, by which certain distributions paid (or deemed paid) by us with respect to any calendar year are less than the sum of (i) 85% of our ordinary income for that year, (ii) 95% of our capital gain net income for that year and (iii) 100% of our undistributed taxable income from prior years.
We expect our income, if any, to consist almost solely of our share of the Operating Partnership’s income, and the cash available for the payment of distributions by us to our stockholders will consist of our share of cash distributions made by the Operating Partnership. As the general partner of the Operating Partnership, we will determine the amount of any distributions made by the Operating Partnership. However, we must consider a number of factors in making such distributions, including:
| |
| • | the amount of the cash available for distribution; |
| |
| • | the impact of such distribution on other partners of the Operating Partnership; |
| |
| • | the Operating Partnership’s financial condition; |
| |
| • | the Operating Partnership’s capital expenditure requirements and reserves therefor; and |
| |
| • | the annual distribution requirements contained in the Code necessary to qualify and maintain our qualification as a REIT. |
Differences in timing between the actual receipt of income and actual payment of deductible expenses and the inclusion of such income and deduction of such expenses when determining our taxable income, as well as the effect of nondeductible capital expenditures, the creation of reserves, the use of cash to purchase shares under our share redemption program or required debt amortization payments, could result in our having taxable income that exceeds cash available for distribution.
In view of the foregoing, we may be unable to meet the REIT minimum distribution requirements and/or avoid the 4% excise tax described above. In certain cases, we may decide to borrow funds in order to meet the REIT minimum distribution and/or avoid the 4% excise tax even if our management believes that the then prevailing market conditions generally are not favorable for such borrowings or that such borrowings would not be advisable in the absence of such tax considerations.
Lenders may require us to enter into restrictive covenants that relate to or otherwise limit our operations, which could limit our ability to make distributions to our stockholders, to replace our Advisor or to otherwise achieve our investment objectives.
When providing financing, a lender may impose restrictions on us that affect our distribution and operating policies and our ability to incur additional debt. Loan documents we enter into may contain covenants that limit our ability to further mortgage property, discontinue insurance coverage, or make distributions under certain circumstances. In addition, provisions of our loan documents may deter us from replacing our Advisor because of the consequences under such agreements and may limit our ability to replace the property manager or terminate certain operating or lease agreements related to the property. These or other limitations may adversely affect our flexibility and our ability to achieve our investment objectives.
Actions of our joint venture partners, including other Hines investment vehicles and third parties, could negatively impact our performance.
We may purchase or develop properties or other real estate investments or make investments in joint ventures or partnerships, co-tenancies or other co-ownership arrangements with Hines affiliates, the sellers of the properties, developers or similar persons. Joint ownership of properties or other investments, under certain circumstances, may involve risks not otherwise present with other methods of owning real estate or other real estate investments. Examples of these risks include:
| |
| • | the possibility that our partners or co-investors might become insolvent or bankrupt; |
| |
| • | that such partners or co-investors might have economic or other business interests or goals that are inconsistent with our business interests or goals, including inconsistent goals relating to the sale of properties or other investments held in the joint venture or the timing of the termination and liquidation of the venture; |
| |
| • | the possibility that we may incur liabilities as the result of actions taken by our partners or co-investors; or |
| |
| • | that such partners or co-investors may be in controlling positions and/or be in a position to take actions contrary to our instructions or requests or contrary to our policies or objectives, including our policy with respect to qualifying and maintaining our qualification as a REIT. |
Actions by a co-venturer, co-tenant or partner may result in subjecting the assets of the joint venture to unexpected liabilities. Under joint venture arrangements, neither co-venturer may have the power to control the venture, and under certain circumstances, an impasse could result and this impasse could have an adverse impact on the operations and profitability of the joint venture.
If we have a right of first refusal or buy/sell right to buy out a co-venturer or partner, we may be unable to finance such a buy-out if it becomes exercisable or we are required to purchase such interest at a time when it would not otherwise be in our best interest to do so. If our interest is subject to a buy/sell right, we may not have sufficient cash, available borrowing capacity or other capital resources to allow us to elect to purchase an interest of a co-venturer subject to the buy/sell right, in which case we may be forced to sell our interest as the result of the exercise of such right when we would otherwise prefer to keep our interest. Finally, we may not be able to sell our interest in a joint venture if we desire to exit the venture for any reason or if our interest is likewise subject to a right of first refusal of our co-venturer or partner, our ability to sell such interest may be adversely impacted by such right. Joint ownership arrangements with Hines affiliates may also entail conflicts of interest.
If we invest in a limited partnership as a general partner, we could be responsible for all liabilities of such partnership.
In some joint ventures or other investments we may make, if the entity in which we invest is a limited partnership, we may acquire all or a portion of our interest in such partnership as a general partner. As a general partner, we could be liable for all the liabilities of such partnership. Additionally, we may acquire a general partner interest in the form of a non-managing general partner interest. As a non-managing general partner, we are potentially liable for all liabilities of the partnership without having the same rights of management or control over the operation of the partnership as the managing general partner. Therefore, we may be held responsible for all of the liabilities of an entity in which we do not have full management rights or control, and our liability may far exceed the amount or value of investment we initially made or then had in the partnership.
We have acquired various financial instruments for purposes of “hedging” or reducing our risks, which may be costly and ineffective and may reduce our cash available for distribution to you.
We have entered into currency rate swaps and caps, or similar hedging or derivative transactions or arrangements, in order to manage or mitigate our risk of exposure to the effects of currency changes as a result of our international investments. Similarly, we may enter into interest rate swaps and caps, or similar hedging or derivative transactions or arrangements, in order to manage or mitigate our risk of exposure to the effects of interest rate changes due to variable interest rate debt that we may have. These transactions may cause us to incur additional costs and may not be effective. In addition, because the performance participation allocation payable to our Advisor is calculated based in part on an increase in our NAV, our Advisor may face a conflict of interest from time to time when determining whether to recommend a hedging or derivative transaction. For example, our Advisor may be incentivized to recommend a riskier hedging or derivative transaction than it would otherwise recommend because it may materially increase the probability that our Advisor will receive the performance participation allocation or our Advisor may oppose a transaction that may otherwise benefit the Company because executing the transaction may make it more likely that our Advisor will not earn the performance participation allocation.
We are different in some respects from other investment vehicles sponsored by Hines, and therefore the past performance of such investments may not be indicative of our future results. In addition, Hines has limited experience in acquiring and operating certain types of real estate investments that we may acquire.
We are Hines’ third publicly-offered real estate investment vehicle. We collectively refer to real estate joint ventures, funds and programs as real estate investment vehicles. All but two of the previous real estate investment vehicles of Hines and its affiliates were conducted through privately-held entities not subject to either the up-front commissions, fees and expenses associated with the Offering or all of the laws and regulations that govern us, including reporting requirements under the federal securities laws and tax and other regulations applicable to REITs.
The past performance of other investment vehicles sponsored by Hines or its affiliates may not be indicative of our future results, and we may not be able to successfully operate our business and implement our investment strategy, which may be different in a number of respects from the operations previously conducted by Hines. In addition, Hines has limited experience in acquiring and operating certain types of real estate investments that we may acquire. For example, a significant amount of real estate investments that have been made by Hines’ other investment vehicles have consisted of acquisitions and development of office or industrial properties or land. Therefore, we will need to use third parties to source or manage investments in which Hines has limited experience. Although we primarily expect to invest in real properties, to a lesser extent, we plan to invest in real estate-related securities to provide a source of liquidity for our share redemption program, cash management and other purposes. Hines has limited experience in sourcing and managing investments in real estate-related securities, so we have engaged a third party to source and manage our real estate-related securities investments, subject to investment guidelines approved by our board of directors, including a majority of our independent directors. In addition, a significant portion of Hines’ other programs and investments involve development projects. Although we are able to invest in development projects, we do not anticipate that a significant portion of the proceeds from this offering will be invested in development projects. As a result of all of these factors, you should not rely on the past performance of other investment vehicles sponsored by Hines and its affiliates to predict, or as an indication of, our future performance.
We have engaged a third party to source and manage our investments in real estate-related securities. We rely on the ability of this third party investment manager to implement our real estate-related securities investment strategy.
We have engaged a third party investment manager to implement our real estate-related securities investment strategy. The investment manager has and will continue to have substantial discretion, subject to investment guidelines approved by our board of directors, including a majority of our independent directors, to make decisions related to the acquisition, management and disposition of real estate-related securities. Our stockholders will have no opportunity to evaluate the terms of transactions or other economic or financial data concerning our investments in real estate-related securities. If the investment manager does
not succeed in implementing the liquid investments portion of our investment strategy, our performance will suffer. If the investment manager is unable to successfully implement our real estate-related securities investment strategy, our results of operations may be adversely impacted and we may not have sufficient liquidity available under our share redemption program. In addition, even though we have the ability to terminate the investment manager on thirty days’ notice, it may be difficult to replace the investment manager.
Our board of directors generally does not approve, in advance, the acquisition and disposition decisions made with respect to our investments in real estate-related securities.
Our board of directors, including a majority of our independent directors, has approved investment guidelines that delegate to our third party investment manager the authority to purchase and sell real estate-related securities, provided that such investments are consistent with our investment guidelines. As a result, the third party investment manager has substantial discretion to make investment decisions with respect to real estate-related securities, within the parameters established by our investment guidelines. We do not expect that our board of directors will review, in advance, the investment decisions made by the investment manager, but rather, we expect that our board of directors will review our investment guidelines on an annual basis and our portfolio of real estate-related securities investments on a quarterly basis or, in each case, as often as the board of directors deems appropriate. Although our board of directors is expected to conduct these periodic reviews, any investment entered into on our behalf by the investment manager may be impossible to unwind if our board of directors deems the investment inconsistent with our investment guidelines when it is subsequently reviewed by our board of directors, such that our only option may be to dispose of the investment, which may be at a loss.
Our success will be dependent on the performance of Hines as well as key employees of Hines. Certain other investment vehicles sponsored by Hines have experienced adverse developments in recent years and there is a risk that we may experience similar adverse developments. Adverse changes in affiliated programs could also adversely affect our ability to raise capital.
Our ability to achieve our investment objectives and to pay distributions is dependent upon the performance of Hines and its affiliates as well as key employees of Hines in the identification and acquisition of investments, the selection of tenants, the determination of any financing arrangements, the management of our assets and operation of our day-to-day activities. Our board of directors and the Advisor have broad discretion when identifying, evaluating, making and managing our investments with the proceeds of the Offering. Our stockholders will have no opportunity to evaluate the terms of transactions or other economic or financial data concerning our investments. We will rely on the management ability of Hines and the oversight of our board of directors as well as the management of any entities or ventures in which we invest.
We may not be able to retain key employees of Hines. To the extent we are unable to retain and/or find qualified successors for key employees that depart from the company, our results of operations may be adversely impacted. Our officers and the management of the Advisor also serve in similar capacities for numerous other entities. If Hines or any of its key employees are distracted by these other activities or suffer from adverse financial or operational problems in connection with operations unrelated to us, the ability of Hines and its affiliates to allocate time and/or resources to our operations may be adversely affected. If Hines is unable to allocate sufficient resources to oversee and perform our operations for any reason, our results of operations would be adversely impacted. We will not provide key-man life insurance policies for any of Hines’ key employees.
Certain other investment vehicles sponsored by Hines have experienced adverse developments in the last decade. Hines REIT sold shares of its common stock from 2004 to 2009 at various prices between $10.00 per share and $10.66 per share. Although Hines REIT re-opened its share redemption program with respect to ordinary redemption requests in April 2013, the program was suspended, except with respect to redemptions in connection with the death or disability of a stockholder, in December 2009. In addition, Hines REIT decreased its distribution rate in July 2010 and further decreased the rate in April 2013. Hines REIT completed its liquidation and dissolution in August 2018 and paid distributions of $7.59 per share to its stockholders, including liquidating distributions of $6.57 per share and special distributions of $1.01 per share. The special distributions were paid from July 2011 through April 2013 and were in addition to the regular operating distributions of up to $5.49 per share paid to Hines REIT’s stockholders between 2004 and 2016. The amount of regular operating distributions received by stockholders varied depending on when they invested and whether they held their shares continuously through 2016.
In addition to Hines REIT, Hines Global REIT and HMS Income Fund, Inc., Hines has sponsored more than 20 privately-offered programs in the past ten years. Several of Hines’ privately-offered programs experienced adverse economic developments due to the global financial crisis and deteriorating economic conditions in several European and South American countries, Mexico and several U.S. markets between 2007 and 2009. The adverse market conditions experienced by these
programs may result in them altering their investment strategy, generating returns lower than originally expected, or ultimately may cause them to incur losses. There is a risk that we may experience similar adverse developments, as an investment vehicle sponsored by Hines.
Adverse results in the other non-traded REITs on the Hines platform have the potential to affect Hines’ and our reputation among financial advisors and investors, which could affect our ability to raise capital.
Terrorist attacks and other acts of violence, civilian unrest or war may affect the markets in which we operate, our business and our profitability.
Terrorist attacks and other acts of violence, civilian unrest or war may negatively affect our operations and our stockholders’ investment in our shares. We may acquire real estate investments located in or that relate to real estate located in areas that are susceptible to attack. In addition, any kind of terrorist activity or violent criminal acts, including terrorist acts against public institutions or buildings or modes of public transportation (including airlines, trains or buses) could have a negative effect on our business. These events may directly impact the value of our assets through damage, destruction, loss or increased security costs. We may not be able to obtain insurance against the risk of terrorism because it may not be available or may not be available on terms that are economically feasible. Further, even if we do obtain terrorism insurance, we may not be able to obtain sufficient coverage to fund any losses we may incur. Risks associated with potential acts of terrorism in the areas in which we acquire properties or other real estate investments could sharply increase the premiums we pay for coverage against property and casualty claims. Additionally, mortgage lenders in some cases have begun to insist that specific coverage against terrorism be purchased by commercial owners as a condition for providing loans.
The consequences of any armed conflict are unpredictable, and we may not be able to foresee events that could have an adverse effect on our business or our stockholders’ investment. More generally, any terrorist attack, other act of violence or war, including armed conflicts, could result in increased volatility in or damage to, the United States and worldwide financial markets and economy. They also could result in a continuation of the current economic uncertainty in the United States or abroad. Our revenues will be dependent upon the payment of rent and the return of our other investments which may be particularly vulnerable to uncertainty in the local economy. Increased economic volatility could adversely affect our tenants’ ability to pay rent or the return on our other investments or our ability to borrow money or issue capital stock at acceptable prices and have a material adverse effect on our business, results of operations, cash flows and financial condition and our ability to make distributions to our stockholders and the value of their investment.
We may be subject to litigation which could have a material adverse effect on our business and financial condition.
We may be subject to litigation, including claims relating to our operations, offerings, unrecognized pre-acquisition contingencies and otherwise in the ordinary course of business. Some of these claims may result in potentially significant judgments against us, some of which are not, or cannot be, insured against. We generally intend to vigorously defend ourselves; however, we cannot be certain of the ultimate outcomes of claims that may arise in the future. Resolution of these types of matters against us may result in our payment of significant fines or settlements, which, if not insured against, or if these fines and settlements exceed insured levels, would adversely impact our earnings and cash flows. Certain litigation or the resolution of certain litigation may affect the availability or cost of some of our insurance coverage which could adversely impact our results of operations and cash flows, expose us to increased risks that would be uninsured and/or adversely impact our ability to attract officers and directors.
Our business could suffer in the event our Advisor, our Dealer Manager, our transfer agent or any other party that provides us with services essential to our operations experiences system failures or cyber incidents or a deficiency in cybersecurity.
Our Advisor, our Dealer Manager, our transfer agent and other parties that provide us with services essential to our operations are vulnerable to damages from any number of sources, including computer viruses, unauthorized access, energy blackouts, natural disasters, terrorism, war and telecommunication failures. Any system failure or accident that causes interruptions in our operations could result in a material disruption to our business. A cyber incident is considered to be any adverse event that threatens the confidentiality, integrity or availability of information resources. More specifically, a cyber incident is an intentional attack or an unintentional event that may include, but is not limited to, gaining unauthorized access to systems to disrupt operations, corrupt data, steal assets or misappropriate confidential information, such as confidential stockholder records. As reliance on technology in our industry has increased, so have the risks posed to our systems, both internal and those we have outsourced. In addition, the risk of a cyber incident, including by computer hackers, foreign governments and cyber terrorists, has generally increased as the number, intensity and sophistication of attempted attacks and instructions from around the world have increased. The remediation costs and lost revenues experienced by a victim of a cyber incident may be significant and significant resources may be required to repair system damage, protect against the threat of future security breaches or to alleviate problems, including reputational harm, loss of revenues and litigation, caused by any breaches. There also may be liability for any stolen assets or misappropriated confidential information. Any material adverse effect experienced by our Advisor, our Dealer Manager, our transfer agent and other parties that provide us with services essential to our operations could, in turn, have an adverse impact on us.
Our share redemption program requires that we follow certain restrictive procedures with respect to new investments if, during any consecutive 24-month period, we do not have at least one month in which we fully satisfy 100% of properly submitted redemption requests or accept all properly submitted tenders in a self-tender offer for our shares, which may adversely affect our flexibility and our ability to achieve our investment objectives.
Subject to certain exceptions, our share redemption program generally requires that if, during any consecutive 24-month period, we do not have at least one month in which we fully satisfy 100% of properly submitted redemption requests or accept all properly submitted tenders in a self-tender offer for our shares, we will not make any new investments (excluding short-term cash management investments under 30 days in duration) and we will use all available investable assets to satisfy redemption requests (subject to the limitations under this program) until all outstanding redemption requests have been satisfied. If triggered, this requirement may prevent us from pursuing potentially accretive investment opportunities and may keep us from fully realizing our investment objectives. In addition, this requirement may limit our ability to pay distributions to our stockholders.
Risks Related to Investments in Real Estate
Geographic concentration of our portfolio may make us particularly susceptible to adverse economic developments in the real estate markets of those areas.
In the event that we have a concentration of properties in, or real estate investments that invest in properties located in, a particular geographic area, our operating results and ability to make distributions are likely to be impacted by economic changes affecting the real estate markets in that area. Therefore, an investment in our common stock will be subject to greater risk to the extent that we lack a geographically diversified portfolio. As of December 31, 2019, we owned interests in nineteen real estate investments, seven of which are located in different domestic and international real estate markets. Please see Item 2. Properties for additional information regarding our investments, including market concentration.
Industry concentration of our tenants may make us particularly susceptible to adverse economic developments in these industries.
In the event we have a concentration of tenants in a particular industry, our operating results and ability to make distributions may be adversely affected by adverse developments in those industries and we will be subject to a greater risk to the extent that our tenants are not diversified by industry. For example, based on leased square footage of our commercial real estate properties, as of December 31, 2019, approximately 31% is leased to tenants in the retail industry. Please see Item 2. Properties for additional information regarding our investments, including industry concentration.
We have not established investment criteria limiting the size of property acquisitions. If we have an investment that represents a material percentage of our assets which experiences a loss, the value of an investment in us would be significantly diminished.
We are not limited in the size of any single property acquisition we may make and certain of our investments may represent a significant percentage of its assets. Should we experience a loss on a portion or all of an investment that represents a significant percentage of our assets, this event would have a material adverse effect on our business and financial condition, which would result in an investment in us being diminished.
We depend on tenants for our revenue, and therefore our revenue will be dependent on the success and economic viability of our tenants. Our reliance on single or significant tenants in certain buildings may decrease our ability to lease vacated space.
We expect that rental income from real property will, directly or indirectly, constitute a significant portion of our income. Delays in collecting accounts receivable from tenants could adversely affect our cash flows and financial condition. In addition, the inability of a single major tenant or a number of smaller tenants to meet their rental obligations would adversely affect our income. Therefore, our financial success will be indirectly dependent on the success of the businesses operated by the tenants in our properties or in the properties securing loans we may own. For the year ended December 31, 2019, there were no tenants that individually represented more than 10% of our total rental revenue. The weakening of the financial condition or the bankruptcy or insolvency of a significant tenant or a number of smaller tenants and vacancies caused by defaults of tenants or the expiration of leases, may adversely affect our operations and our ability to pay distributions.
Due to the risks involved in the ownership of real estate investments and real estate acquisitions, a return on an investment in us is not guaranteed, and our stockholders may lose some or all of their investment.
By owning our shares, stockholders will be subjected to significant risks associated with owning and operating real estate investments. The performance of their investment in us will be subject to such risks, including:
| |
| • | changes in the general economic climate; |
| |
| • | changes in local conditions such as an oversupply of space or reduction in demand for real estate; |
| |
| • | changes in interest rates and the availability of financing; |
| |
| • | changes in market rental rates; |
| |
| • | changes in property level operating expenses due to inflation or otherwise; |
| |
| • | changes in laws and governmental regulations, including those governing real estate usage, zoning and taxes; and |
| |
| • | changes due to factors that are generally outside of our control, such as terrorist attacks and international instability, natural disasters and acts of God, over-building, adverse national, state or local changes in applicable tax, environmental or zoning laws and a taking of any of the properties which we own or in which we otherwise have interests by eminent domain. |
In addition, we expect to acquire properties in the future, which may subject us to additional risks associated with real estate property acquisitions, including the risks that:
| |
| • | the investments will fail to perform in accordance with our expectations because of conditions or liabilities we did not know about at the time of acquisition; and |
| |
| • | our projections or estimates with respect to the performance of the investments, the costs of operating or improving the properties or the effect of the economy or capital markets on the investments will prove inaccurate. |
Any of these factors could have a material adverse effect on our business, results of operations, cash flows and financial condition and our ability to make distributions to our stockholders and the value of their investment.
An economic slowdown or rise in interest rates or other unfavorable changes in economic conditions in the markets in which we operate could adversely impact our business, results of operations, cash flows and financial condition and our ability to make distributions to our stockholders and the value of their investment.
The development of negative economic conditions in the markets in which we operate may significantly affect occupancy, rental rates and our ability to collect rent from our tenants, as well as our property values, which could have a material adverse impact on our cash flows, operating results and carrying value of investment property. For example, an economic recession or rise in interest rates could make it more difficult for us to lease real properties, may require us to lease the real properties we acquire at lower rental rates and may lead to an increase in tenant defaults. In addition, these conditions may also lead to a decline in the value of our properties and make it more difficult for us to dispose of these properties at an attractive price. Other risks that may affect conditions in the markets in which we operate include:
| |
| • | Local conditions, such as an oversupply of the types of properties we invest in or a reduction in demand for such properties in the area; and |
| |
| • | Increased operating costs, if these costs cannot be passed through to tenants. |
International, national, regional and local economic climates have been adversely affected by the slow job growth of recent years. To the extent any of the adverse conditions described above occurs in the specific markets in which we operate, market rents, occupancy rates and our ability to collect rents from our tenants will likely be affected and the value of our properties may decline. We could also face challenges related to adequately managing and maintaining our properties, should we experience increased operating cost and as a result, we may experience a loss of rental revenues. Any of these factors may adversely affect our business, results of operations, cash flows and financial condition, our ability to make distributions to our stockholders and the value of their investment.
Our use of borrowings to partially fund acquisitions and improvements on properties could result in foreclosures and unexpected debt service expenses upon refinancing, both of which could have an adverse impact on our operations and cash flow.
We are relying and intend to continue to rely in part on borrowings under credit facilities and other external sources of financing to fund the costs of new investments, capital expenditures and other items. This may also include our use of short-term mortgage notes to fund our long-term investments in real properties, which could result in the maturity date of such notes being reached prior to a time when the properties securing the notes are generating sufficient cash flows to repay the debt. Accordingly, we are subject to the risks that our cash flow will not be sufficient to cover required debt service payments and that we will be unable to meet other covenants or requirements in the credit agreements.
If we cannot meet our required debt obligations, the property or properties securing such indebtedness could be foreclosed upon by, or otherwise transferred to, our lender, with a consequent loss of income and asset value to us. For tax purposes, a foreclosure of any of our properties would be treated as a sale of the property for a purchase price equal to the outstanding balance of the debt secured by the mortgage. If the outstanding balance of the debt secured by the mortgage exceeds our tax basis in the property, we would recognize taxable income on foreclosure, but we may not receive any cash proceeds. Additionally, we may be required to refinance our debt subject to “lump sum” or “balloon” payment maturities on terms less favorable than the original loan or at a time we would otherwise prefer to not refinance such debt. A refinancing on such terms or at such times could increase our debt service payments, which would decrease the amount of cash we would have available for operations, new investments and distribution payments and may cause us to determine to sell one or more properties at a time when we would not otherwise do so.
Uninsured losses relating to real property may adversely impact the value of our portfolio.
We will attempt to ensure that all of our properties are adequately insured to cover casualty losses. However, there are types of losses, generally catastrophic in nature, which are uninsurable, are not economically insurable or are only insurable subject to limitations. Examples of such catastrophic events include acts of war or terrorism, earthquakes, floods, hurricanes and pollution or environmental matters. We may not have adequate coverage in the event we or our buildings suffer casualty losses. If we do not have adequate insurance coverage, the value of our assets will be reduced as the result of, and to the extent of, any such uninsured losses. Additionally, we may not have access to capital resources to repair or reconstruct any uninsured damage to a property.
We may be unable to obtain desirable types of insurance coverage at a reasonable cost, if at all, and we may be unable to comply with insurance requirements contained in mortgage or other agreements due to high insurance costs.
We may not be able either to obtain certain desirable types of insurance coverage, such as terrorism, earthquake, flood, hurricane and pollution or environmental matter insurance, or to obtain such coverage at a reasonable cost in the future, and this risk may limit our ability to finance or refinance debt secured by our properties. Additionally, we could default under debt or other agreements if the cost and/or availability of certain types of insurance make it impractical or impossible to comply with covenants relating to the insurance we are required to maintain under such agreements. In such instances, we may be required to self-insure against certain losses or seek other forms of financial assurance.
We are subject to extensive regulation, which may result in higher expenses or other negative consequences that could adversely affect us.
Our activities are subject to federal, state and municipal laws, and to regulations, authorizations and license requirements with respect to, among other things, zoning, environmental protection and historical heritage, all of which may affect our business. We may be required to obtain licenses and permits with different governmental authorities in order to acquire and manage our assets.
In addition, the Dodd-Frank Wall Street Reform and Consumer Protection Act (the “Dodd-Frank Act”), which generally took effect in 2011, contains a sweeping overhaul of the regulation of U.S. financial institutions and financial markets. Key provisions of the Dodd-Frank Act require extensive rulemaking by the SEC and the U.S. Commodity Futures Trading Commission, some of which remains ongoing. Thus, the full impact of the Dodd-Frank Act on our business cannot be fully assessed until all final implementing rules and regulations are promulgated.
Various rules currently in effect under the Dodd-Frank Act may have a significant impact on our business, including, without limitation, provisions of the legislation that increase regulation of and disclosure requirements related to investment advisors, swap transactions and hedging policies, corporate governance and executive compensation, investor protection and enforcement provisions, and asset-backed securities. In February 2017, the U.S. President ordered the Secretary of the U.S. Treasury to review certain existing rules and regulations, such as those promulgated under the Dodd-Frank Act; however, the implications of that review are not yet known and none of the rules and regulations promulgated under the Dodd-Frank Act have been modified or rescinded as of the date of this report.
For example, but not by way of limitation, the Dodd-Frank Act and the rules and regulations promulgated thereunder provides for significantly increased regulation of the derivatives markets and transactions that affect our interest rate hedging activities, including: (i) regulatory reporting, (ii) subject to limited exemptions, mandated clearing through central counterparties and execution on regulated exchanges or execution facilities, and (iii) margin and collateral requirements. While the full impact of the Dodd-Frank Act on our interest rate hedging activities cannot be fully assessed until all final implementing rules and regulations are promulgated, the foregoing requirements may affect our ability to enter into hedging or other risk management transactions, may increase our costs in entering into such transactions, and/or may result in us entering into such transactions on less favorable terms than prior to the Dodd-Frank Act. For example, subject to an exception for “end-users” of swaps upon which we may seek to rely, we may be required to clear certain interest rate hedging transactions by submitting them to a derivatives clearing organization. To the extent we are required to clear any such transactions, we will be required to, among other things, post margin in connection with such transactions. The occurrence of any of the foregoing events may have an adverse effect on our business and our stockholders’ return.
In addition, public authorities may enact new and more stringent standards, or interpret existing laws and regulations in a more restrictive manner, which may force companies in the real estate industry, including us, to spend funds to comply with these new rules. Any such action on the part of public authorities may adversely affect our results from operations.
In the event of noncompliance with such laws, regulations, licenses and authorizations, we may face the payment of fines, project shutdowns, cancellation of licenses, and revocation of authorizations, in addition to other civil and criminal penalties.
We operate in a competitive business, and many of our competitors have significant resources and operating flexibility, allowing them to compete effectively with us.
Numerous real estate companies that operate in the markets in which we may operate will compete with us in acquiring real estate investments and obtaining creditworthy tenants to occupy such properties or the properties owned by such investments. Such competition could adversely affect our business. There are numerous real estate companies, real estate investment trusts and U.S. institutional and foreign investors that will compete with us in seeking investments and tenants for properties, including Hines Global REIT. Many of these entities have significant financial and other resources, including operating experience, allowing them to compete effectively with us. In addition, our ability to charge premium rental rates to tenants may be negatively impacted. This increased competition may increase our costs of acquisitions or investments or lower our occupancy rates and the rent we may charge tenants. In addition, the arrival of new competitors in the immediate areas where we have assets could require unplanned investments in our assets, which may adversely affect us. We may also have difficulty in renewing leases or in leasing to new tenants, which may lead to a reduction in our cash flow and operating income, since the proximity of new competitors could divert existing or new tenants to such competitors, resulting in vacancies.
We may have difficulty selling real estate investments, and our ability to distribute all or a portion of the net proceeds from such sales to our stockholders may be limited.
Real estate investments are relatively illiquid. We will have a limited ability to vary our portfolio in response to changes in economic or other conditions. We will also have a limited ability to sell assets in order to fund working capital and similar capital needs such as share redemptions. We expect to generally hold a real estate investment for the long term. When we sell any of our real estate investments, we may not realize a gain on such sale or the amount of our taxable gain could exceed the cash proceeds we receive from such sale. We may not distribute any proceeds from the sale of real estate investments to our stockholders. Rather, we may use such proceeds to:
| |
| • | purchase additional real estate investments; |
| |
| • | buy out interests of any co-venturers or other partners in any joint venture in which we are a party; |
| |
| • | purchase shares under our share redemption program; |
| |
| • | create working capital reserves; or |
| |
| • | make repairs, maintenance, tenant improvements or other capital improvements or expenditures to our other properties. |
Our ability to sell our properties may also be limited by our desire to avoid a 100% penalty tax that is imposed on gain recognized by a REIT from the sale of property characterized as dealer property. In order to avoid such characterization and to take advantage of certain safe harbors under the Code, we may determine to hold our properties for a minimum period of time, generally two years.
Our investment strategy may cause us to incur penalty taxes, fail to maintain our REIT status or own and sell properties through TRSs, each of which would diminish the return to our stockholders.
The sale of one or more of our properties may be considered a “prohibited transaction” under the Code (which generally includes the sale of property held by us primarily for sale to customers in the ordinary course of our trade or business). If we are deemed to have engaged in a prohibited transaction, all net gain that we derive from such sale would be subject to a 100% penalty tax. The Code sets forth a safe harbor for REITs that wish to sell property without risking the imposition of the 100% penalty tax. The principal requirements of the safe harbor are that: (i) the REIT must hold the applicable property for not less than two years for the production of rental income prior to its sale; (ii) the aggregate expenditures made by the REIT, or any partner of the REIT, during the two-year period preceding the date of sale which are includable in the basis of the property do not exceed 30% of the net selling price of the property; and (iii) property sales by the REIT do not exceed at least one of the following thresholds: (a) seven sales in the current year; (b) sales in the current year that do not exceed 10% of the REIT’s assets as of the beginning of the year (as measured by either fair market value or tax basis); or (c) sales in the current year that do not exceed 20% of the REIT’s assets as of the beginning of the year, and sales over a three-year period do not exceed, on average, 10% per annum of the REIT’s assets, in each case as measured by either fair market value or tax basis. Given our investment and operating strategy, the sale of one or more of our properties may not satisfy the above prohibited transaction safe harbor.
If we desire to sell a property pursuant to a transaction that does not satisfy the safe harbor, we may be able to avoid the prohibited transaction tax if we hold and sell the property through a taxable REIT subsidiary, or TRS. In that case, any gain would be taxable to the TRS at regular corporate income tax rates. We may decide to forgo the use of a TRS in a transaction
that does not meet the safe harbor based our own internal analysis, the opinion of counsel or the opinion of other tax advisors that the disposition should not be subject to the prohibited transaction tax. In cases where a property disposition is not effected through a TRS, the Internal Revenue Service, or IRS, could assert that the disposition constitutes a prohibited transaction. If such an assertion were successful, all of the net gain from the sale of the property will be payable as a tax which will have a negative impact on cash flow and the ability to make cash distributions.
Limitations on our ownership of non-real estate securities of our TRSs could adversely affect our operations and/or our ability to quality as a REIT.
As a REIT, the value of our ownership of non-real estate securities of our TRSs may not exceed 20% of the value of all of our assets at the end of any calendar quarter. If the IRS were to determine that the value of our ownership of such securities of all of our TRSs exceeded 20% of the value of our total assets at the end of any calendar quarter, then we could fail to qualify as a REIT. If we determine it to be in our best interest to own a substantial number of our properties through one or more TRSs, then it is possible that the IRS may conclude that the value of our interests in our TRSs exceeds 20% of the value of our total assets at the end of any calendar quarter and therefore cause us to fail to qualify as a REIT. Additionally, as a REIT, generally no more than 25% of our gross income with respect to any year may be from sources other than real estate. Dividends paid to us from a TRS are considered to be non-real estate income. Therefore, we may fail to qualify as a REIT if dividends from all of our TRSs, when aggregated with all other non-real estate income with respect to any one year, are more than 25% of our gross income with respect to such year.
Potential liability as the result of, and the cost of compliance with, environmental matters could adversely affect our operations.
Under various federal, state and local environmental laws, ordinances and regulations, a current or previous owner or operator of real property may be liable for the cost of removal or remediation of hazardous or toxic substances on such property. Such laws often impose liability whether or not the owner or operator knew of, or was responsible for, the presence of such hazardous or toxic substances.
We expect to invest in, or make investments in real estate investments that have interests in, properties historically used for industrial, manufacturing and commercial purposes. These properties are more likely to contain, or may have contained, underground storage tanks for the storage of petroleum products and other hazardous or toxic substances. All of these operations create a potential for the release of petroleum products or other hazardous or toxic substances. Leasing properties to tenants that engage in industrial, manufacturing, and commercial activities will cause us to be subject to increased risk of liabilities under environmental laws and regulations. The presence of hazardous or toxic substances, or the failure to properly remediate these substances, may adversely affect our ability to sell, rent or pledge such property as collateral for future borrowings.
Environmental laws also may impose restrictions on the manner in which properties may be used or businesses may be operated, and these restrictions may require expenditures. Such laws may be amended so as to require compliance with stringent standards which could require us to make unexpected, substantial expenditures. Environmental laws provide for sanctions in the event of noncompliance and may be enforced by governmental agencies or, in certain circumstances, by private parties. We may be potentially liable for such costs in connection with the acquisition and ownership of our properties in the United States. In addition, we may invest in properties located in countries that have adopted laws or observe environmental management standards that are less stringent than those generally followed in the United States, which may pose a greater risk that releases of hazardous or toxic substances have occurred to the environment. The cost of defending against claims of liability, compliance with environmental regulatory requirements or remediating any contaminated property could be substantial and require a material portion of our cash flow.
We face possible risks associated with the physical effects of climate change.
We cannot predict with certainty whether climate change is occurring and, if so, at what rate. However, the physical effects of climate change could have a material adverse effect on our properties, operations and business. To the extent climate change causes changes in weather patterns, our markets could experience increases in storm intensity, such as those experienced in Super Storm Sandy in October 2012 and Hurricane Harvey in 2017, and rising sea-levels. Over time, these conditions could result in declining demand for office space in our buildings or the inability of us to operate the buildings at all. Climate change may also have indirect effects on our business by increasing the cost of (or making unavailable) property insurance on terms we find acceptable, increasing the cost of energy and increasing the cost of snow removal at our properties. There can be no assurance that climate change will not have a material adverse effect on our properties, operations or business.
The properties we acquire will be subject to property taxes that may increase in the future, which could adversely affect our cash flow.
Any properties we acquire will be subject to real and personal property taxes that may increase as property tax rates change and as the properties are assessed or reassessed by taxing authorities. We anticipate that most of our leases will generally provide that the property taxes, or increases therein, are charged to the lessees as an expense related to the properties that they occupy. As the owner of the properties, however, we are ultimately responsible for payment of the taxes to the government. If property taxes increase, our tenants may be unable to make the required tax payments, ultimately requiring us to pay the taxes. In addition, we will generally be responsible for property taxes related to any vacant space. If we purchase residential properties, the leases for such properties typically will not allow us to pass through real estate taxes and other taxes to residents of such properties. Consequently, any tax increases may adversely affect our results of operations at such properties.
Our properties may contain or develop harmful mold, or may suffer from other indoor air quality issues, which could lead to liability for adverse health effects and costs of remediating the problem.
If any of our properties has or develops mold we may be required to undertake a costly program to remediate, contain or remove the mold. Mold growth may occur when moisture accumulates in buildings or on building materials. Some molds may produce airborne toxins or irritants. Concern about indoor exposure to mold has been increasing because exposure to mold may cause a variety of adverse health effects and symptoms, including allergic or other reactions. Similarly, if any of our properties suffers from other indoor quality issues, we may incur material expenses to remediate the issues. We may become liable to our tenants, their employees and others if property damage or health concerns arise, all of which could have a material adverse effect on our business, results of operations, cash flows and financial condition and our ability to make distributions to our stockholders and the value of their investment.
If we set aside insufficient working capital reserves, we may be required to defer necessary or desirable property improvements.
If we do not establish sufficient reserves for working capital to supply necessary funds for capital improvements or similar expenses, we may be required to defer necessary or desirable improvements to our properties. If we defer such improvements, the applicable properties may decline in value, it may be more difficult for us to attract or retain tenants to such properties or the amount of rent we can charge at such properties may decrease.
Risks related to the development of real properties may have an adverse effect on our results of operations and returns to our stockholders.
We may invest in properties on which developments or improvements are to be constructed or completed. As such, we may be subject to the risks associated with development and construction activities including the following:
| |
| • | long periods of time may elapse between the commencement and the completion of our projects; |
| |
| • | our original estimates may not be accurate and our actual construction and development costs may exceed those estimates; |
| |
| • | the level of interest of potential tenants for a recently launched development may be low; |
| |
| • | construction materials and equipment may be unavailable or cost more than expected due to changes in supply and demand; |
| |
| • | construction and sales may not be completed on time, resulting in a cost increase; |
| |
| • | we may not be able to acquire or we may pay too much for the land we acquire for new developments or properties; |
| |
| • | we may be unable to obtain construction financing for development activities on favorable terms, including but not limited to interest rates, term and/or loan-to-value ratios, or at all, which could cause us to delay or even abandon potential developments; |
| |
| • | labor may be in limited availability; |
| |
| • | we may abandon development opportunities that we have already begun to explore, and we may fail to recover expenses already incurred in connection with exploring such development opportunities; and |
| |
| • | changes in tax, real estate and zoning laws may be unfavorable to us. |
In addition, our reputation and the construction quality of our real estate developments, whether operated individually or through partnerships, may be determining factors for our ability to lease space and grow. The timely delivery of real estate projects and the quality of our developments, however, depend on certain factors beyond our full control, including the quality and timeliness of construction materials delivered to us and the technical capabilities of our contractor. If one or more
problems affect our real estate developments, our reputation and future performance may be negatively affected and we may be exposed to civil liability.
We depend on a variety of factors outside of our control to build, develop and operate real estate projects. These factors include, among others, the availability of market resources for financing, land acquisition and project development. Any scarcity of market resources, including human capital, may decrease our development capacity due to either difficulty in obtaining credit for land acquisition or construction financing or a need to reduce the pace of our growth. The combination of these risks may adversely affect our business, results of operations, cash flows and financial condition and our ability to make distributions to our stockholders and the value of their investment.
Delays in the development and construction of real properties may have adverse effects on portfolio diversification, results of operations and returns to our stockholders.
If we experience delays in the development of our real properties, it could adversely affect returns to our stockholders. When properties are acquired prior to the start of construction or during the early stages of construction, it will typically take several months or longer to complete construction, to rent available space, and for rent payments to commence. Therefore, we may not receive any income from these properties and our ability to pay distributions to our stockholders could suffer. If we are delayed in the completion of any such construction project, our tenants may have the right to terminate preconstruction leases for space at such newly developed project. We may incur additional risks when we make periodic progress payments or other advances to builders prior to completion of construction. Each of these factors could result in increased costs of a project or loss of our investment. In addition, we will be subject to normal lease-up risks relating to newly-constructed projects. Furthermore, the price we agree to pay for a real property will be based on our projections of rental income and expenses and estimates of the fair market value of the real property upon completion of construction. If our projections are inaccurate, we may pay too much for a property.
Changes in supply of or demand for similar properties in a particular area may increase the price of real estate assets we may seek to purchase or adversely affect the value of the properties we own.
The real estate industry is subject to market forces and we are unable to predict certain market changes including changes in supply of or demand for similar properties in a particular area. For example, if demand for the types of real estate assets in which we seek to invest were to sharply increase or supply of those assets were to sharply decrease, the prices of those assets could rise significantly. Any potential purchase of an overpriced asset could decrease our rate of return on these investments and result in lower operating results and overall returns to you. Likewise, a sharp increase in supply could adversely affect lease rates and occupancy, which could result in lower operating results and overall returns to you.
Retail properties depend on anchor tenants to attract shoppers and could be adversely affected by the loss of a key anchor tenant and trends in the retail sector generally.
We currently own one retail property, and we may acquire additional retail properties in the future. Retail properties, like other properties, are subject to the risk that tenants may be unable to make their lease payments or may decline to extend a lease upon its expiration. A lease termination by a tenant that occupies a large area of a retail center (commonly referred to as an anchor tenant) could impact leases of other tenants. Other tenants may be entitled to modify the terms of their existing leases in the event of a lease termination by an anchor tenant, or the closure of the business of an anchor tenant that leaves its space vacant even if the anchor tenant continues to pay rent. Any such modifications or conditions could be unfavorable to us as the property owner and could decrease rents or expense recoveries. Additionally, major tenant closures may result in decreased customer traffic, which could lead to decreased sales at other stores. In the event of default by a tenant or anchor store, we may experience delays and costs in enforcing our rights as landlord to recover amounts due to us under the terms of our agreements with those parties.
The retail environment and the market for retail space have been, and in the future could be, adversely affected by weakness in the national, regional, and local economies, the level of consumer spending and consumer confidence, the adverse financial condition of some large retail companies, the ongoing consolidation in the retail sector, the excess amount of retail space in a number of markets, and increasing competition from discount retailers, outlet malls, internet retailers, and other online businesses. Increases in consumer spending via the internet may significantly affect our retail tenants’ ability to generate sales in their stores. New and enhanced technologies, including new digital technologies and new web services technologies, may increase competition for certain of our retail tenants.
Leases with retail properties’ tenants may restrict us from re-leasing space.
Most leases with retail tenants contain provisions giving the particular tenant the exclusive right to sell particular types of merchandise or provide specific types of services within the particular retail center. These provisions may limit the number and types of prospective tenants interested in leasing space in a particular retail property.
Short-term multifamily community leases associated with any multifamily residential properties we acquire may expose us to the effects of declining market rent and could adversely impact our ability to make cash distributions to our stockholders.
Six of the nineteen properties currently in our portfolio as of December 31, 2019 are multi-family residential properties and we expect to acquire additional multi-family residential properties in the future. Substantially all of our multifamily community leases are and will continue to be for a term of one year or less. Because these leases generally permit the residents to leave at the end of the lease term without penalty, our rental revenues may be impacted by declines in market rents more quickly than if our leases were for longer terms.
High levels of unemployment could adversely affect the occupancy and rental rates of any multifamily residential properties we acquire, with high quality multifamily communities suffering even more severely.
Increased levels of unemployment in multifamily markets could significantly decrease occupancy and rental rates. In times of increasing unemployment, multifamily occupancy and rental rates have historically been adversely affected by:
| |
| • | rental residents deciding to share rental units and therefore rent fewer units; |
| |
| • | potential residents moving back into family homes or delaying leaving family homes; |
| |
| • | a reduced demand for higher-rent units, such as those of high quality multifamily communities; |
| |
| • | a decline in household formation; |
| |
| • | persons enrolled in college delaying leaving college or choosing to proceed to or return to graduate school in the absence of available employment; |
| |
| • | the inability or unwillingness of residents to pay rent increases; and |
| |
| • | increased collection losses. |
These factors generally have contributed to lower rental rates. If these factors worsen, our results of operations, financial condition and ability to make distributions to our stockholders may be adversely affected.
We may face risks associated with our student housing properties.
We have investments in student housing properties and may acquire more in the future. Unlike other apartment housing, student housing communities are typically leased on an individual lease basis, by the bed, which limits each resident’s liability to his or her own rent without liability for a roommate’s rent. The lease terms are typically for one year or less and student housing properties must be almost entirely re-leased each year, exposing us to increased leasing risk. If we are unable to find new individual tenants for these properties, it could have an adverse effect on our results of operations.
Many colleges and universities own and operate their own competing on-campus housing facilities, and changes in university admission policies could adversely affect us. For example, if a university reduces the number of student admissions or requires that certain students, such as freshmen, live in a university-owned facility, the demand for beds at our student housing properties may be reduced and the occupancy rate at the properties may decline.
A degradation of a university’s reputation due to negative publicity or other events may adversely impact our student housing properties.
It is important that the universities from which our student housing properties draw residents maintain good reputations and are able to attract the desired number of incoming students. Any degradation in a university’s reputation could inhibit its ability to attract students and reduce the demand for our student housing properties. Reports of crime or other negative publicity regarding the safety of the students residing on, or near, our student housing properties may have an adverse effect on occupancy rates.
If we acquire hospitality, leisure or healthcare properties, we will depend on others to manage those facilities.
In order to qualify as a REIT, we will not be able to operate or participate in the decisions affecting the daily operations of any hospitality, leisure or healthcare properties that we acquire. We may lease any hospitality, leisure or healthcare properties
we acquire to a, or TRS, in which we may own up to a 100% interest. In such an event our TRS will enter into management agreements with eligible independent contractors, potentially including Hines or its affiliates, that are not our subsidiaries or otherwise controlled by us to manage these properties. Thus, independent operators, under management agreements with our TRS, will control the daily operations of our hospitality, leisure and healthcare-related properties.
We will depend on these independent management companies to operate our hospitality, leisure or healthcare properties. We will not have the authority to require these properties to be operated in a particular manner or to govern any particular aspect of the daily operations, such as establishing room rates at our hospitality, leisure or healthcare properties. Thus, even if we believe our hospitality, leisure or healthcare properties are being operated inefficiently or in a manner that does not result in satisfactory results, we may not be able to force the management company to change its method of operation of these properties. We can only seek redress if a management company violates the terms of the applicable management agreement with the TRS, and then only to the extent of the remedies provided for under the terms of the management agreement. In the event that we need to replace any management company, we may be required by the terms of the management agreement to pay substantial termination fees and may experience significant disruptions at the affected properties.
The hospitality or leisure industry is seasonal.
The hospitality or leisure industry is seasonal in nature. As a result of the seasonality of the hospitality or leisure industry, there will likely be quarterly fluctuations in results of operations of any hospitality or leisure properties that we may own. Quarterly financial results may be adversely affected by factors outside our control.
The hospitality or leisure market is highly competitive and generally subject to greater volatility than our other market segments.
The hospitality or leisure business is highly competitive and influenced by factors such as location, room rates, quality, service levels, reputation and reservation systems, among many other factors. There are many competitors in this market, and these competitors may have substantially greater marketing and financial resources than those available to us. This competition, along with other factors, such as over-building in the hospitality or leisure industry and certain deterrents to traveling, may increase the number of rooms available and may decrease the average occupancy and room rates of our hospitality or leisure properties. The demand for rooms at any hospitality or leisure properties that we may acquire will change much more rapidly than the demand for space at other properties that we acquire. This volatility in room demand and occupancy rates could have a material adverse effect on our financial condition, results of operations and ability to pay distributions to our stockholders.
If we purchase assets at a time when the commercial real estate market is experiencing substantial influxes of capital investment and competition for properties, the real estate we purchase may not appreciate or may decrease in value.
Real estate investment transaction volume has increased and estimated going-in capitalization rates, or cap rates (ratio of the net projected operating income of a property in its initial fiscal year divided by the net purchase price), have fallen relative to their post-recession peaks in late 2009. There continues to be a significant amount of investment capital pursuing high-quality, well-located assets that generate stable cash flows, causing aggressive competition and pricing for assets which match our investment strategy. This may continue to drive prices higher, resulting in lower cap rates and returns. To the extent we purchase real estate in the future in this environment, we are subject to the risks that the value of our assets may not appreciate or may decrease significantly below the amount we paid for such assets if the real estate market ceases to attract the same level of capital investment in the future as it has recently attracted, or if the number of companies seeking to acquire such assets decreases. If any of these circumstances occur or the values of our investments are otherwise negatively affected, the value of our stockholders’ investment may be lower.
We depend on the availability of public utilities and services, especially for water and electric power. Any reduction, interruption or cancellation of these services may adversely affect us.
Public utilities, especially those that provide water and electric power, are fundamental for the operation of our assets. The delayed delivery or any material reduction or prolonged interruption of these services could result in tenants terminating their leases or result in an increase in our costs, as we may be forced to use backup generators, which also could be insufficient to fully operate our properties. Accordingly, any interruption or limitation in the provision of these essential services may adversely affect us.
Risks Related to Investments in Real Estate-Related Securities
Investments in real estate-related securities are subject to specific risks relating to the particular issuer of the securities and may be subject to the general risks of investing in subordinated real estate-related securities.
We invest in real estate-related securities to help maintain liquidity to satisfy any share redemptions we choose to make in any particular month and to manage cash before investing subscription proceeds into properties. We have invested in real estate-related common equity, preferred equity and debt securities of both publicly traded and private real estate companies. Investments in real estate-related securities will involve special risks relating to the particular issuer of the securities, including the financial condition and business outlook of the issuer. Issuers of real estate-related securities generally invest in real estate or real estate-related assets and are subject to the inherent risks associated with real estate-related debt investments discussed elsewhere in this Annual Report on Form 10-K.
Real estate-related securities may be unsecured and subordinated to other obligations of the issuer. As a result, investments in real estate-related securities are subject to risks of (i) limited liquidity in the secondary trading market, (ii) substantial market price volatility, (iii) subordination to the prior claims of banks and other senior lenders to the issuer and preferred equity holders, (iv) the operation of mandatory sinking fund or call/redemption provisions during periods of declining interest rates that could cause the issuer to reinvest redemption proceeds in lower yielding assets, (v) the possibility that earnings of the issuer may be insufficient to meet its debt service and distribution obligations and (vi) the declining creditworthiness and potential for insolvency of the issuer during periods of rising interest rates and economic downturn. These risks may adversely affect the value of outstanding real estate-related securities and the ability of the issuers thereof to pay dividends to us.
We are subject to certain risks inherent in investing in publicly traded securities.
We have investments in securities that are publicly traded and are, therefore, subject to the risks inherent in investing in public securities. When investing in public securities, we are generally unable to obtain financial covenants or other contractual rights, including management rights that it might otherwise be able to obtain in making privately negotiated investments. Moreover, we may not have the same access to information in connection with investments in public securities, either when investigating a potential investment or after making an investment, as compared to privately negotiated investments. The inability to sell public securities could materially adversely affect the investment results. In addition, an investment may be sold by us to a public company where the consideration received is a combination of cash and stock of the public company, which may, depending on the securities laws of the relevant jurisdiction, be subject to lock-up periods.
Real estate-related equity securities are subject to specific risks relating to the particular issuer of the securities and may be subject to the general risks of investing in subordinated real estate securities.
The value of real estate-related securities, including those of publicly listed REITs, fluctuates in response to issuer, political, market and economic developments. For example, equity markets are experiencing significant disruption as a result of the outbreak of COVID-19. In the short term, equity prices can fluctuate dramatically in response to these developments. Different parts of the market and different types of equity securities can react differently to these developments and they can affect a single issuer, multiple issuers within an industry, the economic sector or geographic region, or the market as a whole. The real estate industry is sensitive to economic downturns. The value of securities of companies engaged in real estate activities can be affected by changes in real estate values and rental income, property taxes, interest rates and tax and regulatory requirements. Downturns in equity and debt markets, such as the one we are currently experiencing, will significantly impact the value of our real-estate related securities.
We have investments in equity securities of other REITs and other real estate-related companies, which subjects us to certain risks including those risks associated with an investment in our own common stock.
REITs are dependent upon specialized management skills, have limited diversification and are, therefore, subject to risks inherent in financing a limited number of projects. REITs may be subject to a management fees and other expenses, and so when we invest in REITs we will bear our proportionate share of the costs of the REITs’ operations. Investing in REITs and real estate-related companies involves certain unique risks in addition to those risks associated with investing in the real estate industry in general. The market value of REIT shares and the ability of the REIT to distribute income may be adversely affected by several factors, including the risks described herein that relate to an investment in our common stock. REITs depend generally on their ability to generate cash flow to make distributions to stockholders, and certain REITs have self-liquidation provisions by which mortgages held may be paid in full and distributions of capital returns may be made at any time. In addition, distributions received by us from REITs may consist of dividends, capital gains and/or return of capital. Generally, dividends received by us from REIT shares and distributed to our stockholders will not constitute “qualified dividend income” eligible for the reduced tax rate applicable to qualified dividend income. In addition, the performance of a REIT may be affected by changes in the tax laws or by its failure to qualify for tax-free pass-through of income.
REITs are also subject to interest rate risk. Rising interest rates may cause REIT investors to demand a higher annual yield, which may, in turn, cause a decline in the market price of the equity securities issued by a REIT.
Investing in certain REITs and real estate-related companies, which often have small market capitalizations, may also involve the same risks as investing in other small capitalization companies. REITs and real estate-related companies may have limited financial resources and their securities may trade less frequently and in limited volume and may be subject to more abrupt or erratic price movements than larger company securities.
Investments in real estate-related debt securities are subject to risks including various creditor risks and early redemption features which may materially adversely affect our results of operations and financial condition.
The debt securities and other interests in which we have invested and may invest may include secured or unsecured debt at various levels of an issuer’s capital structure. The debt securities in which we may invest may not be protected by financial covenants or limitations upon additional indebtedness, may be illiquid or have limited liquidity, and may not be rated by a credit rating agency. Debt securities are also subject to other creditor risks, including (i) the possible invalidation of an investment transaction as a “fraudulent conveyance” under relevant creditors’ rights laws, (ii) so- called lender liability claims by the issuer of the obligation and (iii) environmental liabilities that may arise with respect to collateral securing the obligations. Our investments may be subject to early redemption features, refinancing options, pre-payment options or similar provisions which, in each case, could result in the issuer repaying the principal on an obligation held by us earlier than expected, resulting in a lower return to us than anticipated or reinvesting in a new obligation at a lower return to us.
We may invest in commercial mortgage-backed securities, or CMBS, which are subject to all of the risks of the underlying mortgage loans and the additional risks of the securitization process.
CMBS are securities that evidence interests in, or are secured by, a single commercial mortgage loan or a pool of commercial mortgage loans. In a rising interest rate environment, the value of CMBS may be adversely affected when payments on underlying mortgages do not occur as anticipated, resulting in the extension of the security’s effective maturity and the related increase in interest rate sensitivity of a longer-term instrument. The value of CMBS may also change due to shifts in the market’s perception of issuers and regulatory or tax changes adversely affecting the mortgage securities market as a whole. In addition, CMBS are subject to the credit risk associated with the performance of the underlying mortgage properties.
The securitization process that CMBS go through may also result in additional risks. Generally, CMBS are issued in classes similar to mortgage loans. To the extent that we invest in a subordinate class, we will be paid interest only to the extent that there are funds available after paying the senior classes. To the extent the collateral pool includes delinquent loans, subordinate classes will likely not be fully paid and may not be paid at all. Subordinate CMBS are also subject to greater credit risk than those CMBS that are more highly rated. Further, the ratings assigned to any particular class of CMBS may not ultimately prove to be accurate. Thus, any particular class of CMBS may be riskier and more volatile than the rating assigned to such security which may result in the returns on any such CMBS investment to be less than anticipated.
Risks Related to Investments in Debt
Hines does not have substantial experience investing in mortgage, mezzanine, bridge or construction loans, B Notes, securitized debt or other debt related to properties in which we may invest, which could adversely affect our return on our loan investments.
We may make investments in mortgage, mezzanine, bridge or construction loans, B-Notes, securitized debt or other debt related to properties if our Advisor determines that it is advantageous to us due to the state of the real estate market or in order to diversify our investment portfolio. However, neither our Advisor nor any of its affiliates has any substantial experience investing in these types of loans and we may not have the expertise necessary to maximize the return on our investment in these types of loans.
If we make or invest in loans, our loans may be impacted by unfavorable real estate market conditions, which could decrease the value of our loan investments.
If we make or invest in loans, we will be at risk of default by the borrowers on those loans. These defaults may be caused by many conditions beyond our control, including interest rate levels and local and other economic conditions affecting real estate values. We may invest in unsecured loans. Even with respect to loans secured by real property, we will not know whether the values of the properties securing the loans will remain at the levels existing on the dates of origination of the loans. If the values of such underlying properties drop, our risk will increase with respect to secured loans because of the lower value of the security associated with such loans.
If we make or invest in loans, our loans will be subject to interest rate fluctuations, which could reduce our returns as compared to market interest rates as well as the value of the loans in the event we sell the loans.
If we invest in fixed-rate, long-term loans and interest rates rise, the loans could yield a return that is lower than then-current market rates. If interest rates decrease, we will be adversely affected to the extent that loans are prepaid, because we may not be able to make new loans at the previously higher interest rate. If we invest in variable interest rate loans, if interest rates decrease, our revenues will likewise decrease. Finally, if interest rates increase, the value of fixed-rate loans we own at such time would decrease which would lower the proceeds we would receive in the event we sell such assets.
Debt investments face prepayment risk that may adversely affect our results of operations and financial condition.
During periods of declining interest rates, the issuer of a security or borrower under a loan may exercise its option to prepay principal earlier than scheduled, forcing us to reinvest the proceeds from such prepayment in lower yielding securities or loans, which may result in a decline in our return. Debt investments frequently have call features that allow the issuer to redeem the security at dates prior to its stated maturity at a specified price (typically greater than par) only if certain prescribed conditions are met. An issuer may choose to redeem a debt security if, for example, the issuer can refinance the debt at a lower cost due to declining interest rates or an improvement in the credit standing of the issuer.
Delays in liquidating defaulted loans could reduce our investment returns.
If there are defaults under our loans secured by real property, we may not be able to repossess and sell the underlying properties quickly. The resulting time delay could reduce the value of our investment in the defaulted loans. An action to foreclose on a property securing a loan is regulated by state statutes and rules and is subject to many of the delays and expenses of other lawsuits if the defendant raises defenses or counterclaims. In the event of default by a borrower, these restrictions, among other things, may impede our ability to foreclose on or sell the secured property or to obtain proceeds sufficient to repay all amounts due to us on the loan.
We may make or invest in mezzanine loans, which involve greater risks of loss than senior loans secured by real properties.
We may make or invest in mezzanine loans that generally take the form of subordinated loans secured by second mortgages on the underlying real property or loans secured by a pledge of the ownership interests of an entity that directly or indirectly owns real property. These types of investments involve a higher degree of risk than long-term senior mortgage loans secured by real property because the investment may become unsecured as a result of foreclosure by the senior lender. In the event of a bankruptcy of the entity providing the pledge of its ownership interests as security, we may not have full recourse to the assets of such entity, or the assets of the entity may not be sufficient to satisfy our mezzanine loan. If a borrower defaults on our mezzanine loan or debt senior to our mezzanine loan, or in the event of a borrower bankruptcy, our mezzanine loan will be satisfied only after the senior debt. As a result, we may not recover some or all of our investment. In addition, mezzanine loans may have higher loan-to-value ratios than traditional mortgage loans, resulting in less equity in the real property and increasing our risk of loss of principal.
We may invest in B-Notes, which are subject to additional risks as a result of the privately negotiated structure and terms of such transactions which may result in losses.
We may invest in B-Notes, which are typically secured by a first mortgage on a single large commercial property or group of related properties and subordinated to an A-Note secured by the same first mortgage on the same collateral. If a borrower defaults on a B-Note, A-Note holders would be paid first and there may not be sufficient funds remaining to repay us and other B-Note holders. B-Notes can vary in their structural characteristics and risks because each transaction is privately negotiated. For example, the rights of holders of B-Notes to control the process following a borrower default may be limited in certain investments. We cannot predict the terms of each B-Note investment. Moreover, because B-Notes are typically secured by a single property or group of related properties, such investments may not be as diversified as investments secured by a pool of properties and therefore may be subject to increased risks.
Bridge loans may involve a greater risk of loss than conventional mortgage loans.
We may provide bridge loans secured by first lien mortgages on properties to borrowers who are typically seeking short-term capital in connection with acquisitions, developments or refinancings of real estate. In connection with such investments, there is a risk that the borrower may not achieve its investment objectives and that we may therefore not recover some or all of our investment in such bridge loans. For example, if we provide a bridge loan to a borrower who has identified an undervalued asset, either due to mismanagement of the underlying assets or as a result of what the borrowers deem to be a recovering market, and the market in which such asset is located fails to recover according to the borrower’s projections, or if the borrower fails to improve the quality of the asset’s management or the value of the asset, the borrower may not receive a sufficient return on the asset to satisfy the bridge loan.
In addition, owners usually borrow funds under a conventional mortgage loan to repay a bridge loan. If the borrower is unable to obtain permanent financing to repay our bridge loan, we may lose some or all of our investment. Bridge loans are also subject to risks of borrower defaults, bankruptcies, fraud, losses and special hazard losses that are not covered by standard hazard insurance. In the event we make a bridge loan to a borrower who defaults, we bear the risk of loss of principal and nonpayment of interest and fees to the extent of any deficiency between the value of the mortgage collateral and the principal amount of the bridge loan. To the extent we suffer such losses with respect to our investments in bridge loans, it could adversely impact our business, results of operations, cash flows and financial ability and our ability to make distributions to our stockholders and the value of their investment.
Non-conforming and non-investment grade loans are subject to an increased risk of loss.
Loans we may acquire or originate may not conform to conventional loan criteria applied by traditional lenders and may not be rated or may be rated as “non-investment grade.” Non-investment grade ratings for these loans typically result from the overall leverage of the loans, the lack of a strong operating history for the properties underlying the loans, the borrowers’ credit history, the properties’ underlying cash flow or other factors. Therefore, non-conforming and investment loans we acquire or originate may have a higher risk of default and loss than conventional loans. Any loss we incur may adversely impact our business, results of operations, cash flows and financial ability and our ability to make distributions to our stockholders and the value of their investment.
Our debt investments may be considered illiquid and we may not be able to adjust our portfolio in response to changes in economic and other conditions.
The debt investments we may make in connection with privately negotiated transactions may not be registered under the relevant securities laws, resulting in a prohibition against their transfer, sale, pledge or other disposition except in a transaction that is exempt from the registration requirements of, or is otherwise in accordance with, those laws. As a result, our ability to vary our portfolio in response to changes in economic and other conditions may be relatively limited. The mezzanine loans we may purchase in the future will be particularly illiquid investments due to their short life, their unsuitability for securitization and the greater difficulty of recoupment in the event of a borrower’s default.
Risks Related to International Investments
We are subject to additional risks from our international investments.
We expect to continue to purchase real estate investments located in, or related to assets located in, the United States and internationally, and may make or purchase loans or participations in loans secured by property located outside the United States. These investments may be affected by factors particular to the laws and business practices of the jurisdictions in which the properties are located. These laws and business practices may expose us to risks that are different from and in addition to those commonly found in the United States. Foreign investments are subject to risk, including the following risks:
| |
| • | the burden of complying with a wide variety of foreign laws; |
| |
| • | changing governmental rules and policies, including changes in land use and zoning laws, more stringent environmental laws or changes in such environmental laws; |
| |
| • | existing or new laws relating to the foreign ownership of real property or loans and laws restricting the ability of foreign persons or companies to remove profits earned from activities within the country to the person’s or company’s country of origin; |
| |
| • | the potential for expropriation; |
| |
| • | possible currency transfer restrictions; |
| |
| • | imposition of adverse or confiscatory taxes; |
| |
| • | changes in real estate and other tax rates and changes in other operating expenses in particular countries; |
| |
| • | possible challenges to the anticipated tax treatment of the structures that allow us to acquire and hold investments; |
| |
| • | adverse market conditions caused by terrorism, civil unrest and changes in national or local governmental or economic conditions; |
| |
| • | the willingness of domestic or foreign lenders to make loans in certain countries and changes in the availability, cost and terms of loan funds resulting from varying national economic policies; |
| |
| • | general political and economic instability in certain regions; |
| |
| • | the potential difficulty of enforcing obligations in other countries; and |
| |
| • | Hines’ limited experience and expertise in foreign countries relative to its experience and expertise in the United States. |
Investments in properties or other real estate investments outside the United States subject us to foreign currency risks, which may adversely affect distributions and our REIT status.
Revenues generated from any properties or other real estate investments we acquire or ventures we enter into relating to transactions involving assets located in markets outside the United States likely will be denominated in the local currency. Therefore, any investments we make outside the United States may subject us to foreign currency risk due to potential fluctuations in exchange rates between foreign currencies and the U.S. dollar. As a result, changes in exchange rates of any such foreign currency to the U.S. dollar may affect our revenues, operating margins and distributions and may also affect the book value of our assets and the amount of stockholders’ equity.
Changes in foreign currency exchange rates used to value a REIT’s foreign assets may be considered changes in the value of the REIT’s assets. These changes may adversely affect our status as a REIT. Further, bank accounts in foreign currency which are not considered cash or cash equivalents may adversely affect our status as a REIT.
As of December 31, 2019, twelve of our nineteen properties were located outside the U.S. and the revenues generated from those properties was denominated in the local currency. This has from time to time negatively impacted our NAV and may continue to negatively impact our NAV in the future.
The United Kingdom’s determination to exit the European Union could adversely affect market rental rates and commercial real estate values in the United Kingdom and Europe.
On June 23, 2016, the United Kingdom held a non-binding referendum in which a majority of voters voted in favor of the United Kingdom’s exit from the European Union. On March 29, 2017, the United Kingdom gave formal notice of its exit from the European Union and commenced the two-year period of negotiations to determine the terms of the United Kingdom’s relationship with the European Union after the exit, including, among other things, the terms of trade between the United Kingdom and the European Union. The effects of the exit will depend on any agreements the United Kingdom makes to retain access to European Union markets either during a transitional period or more permanently. The announcement of the Brexit vote caused significant volatility in global stock markets and currency exchange rate fluctuations that resulted in the strengthening of the U.S. dollar against foreign currencies in which we conduct business. The strengthening of the U.S. dollar relative to other currencies such as the Euro may adversely affect our results of operations. The long-term nature of the United Kingdom’s relationship with the European Union is unclear and there is considerable uncertainty when any relationship will be agreed and implemented. The United Kingdom ceased to be a member state of the European Union on January 31, 2020. The United Kingdom and the European Union agreed to a transition period from February 1, 2020 until December 31, 2020 to negotiate the terms of their future relationship. During the transition period, arrangements between the United Kingdom and the European Union will remain as they were prior to Brexit. As a result, the United Kingdom’s future access to the European Union single market and to European Union trade deals negotiated with other jurisdictions depend on the agreements or arrangements with the European Union for the United Kingdom to retain access to E.U. markets more permanently. In addition, the uncertainty caused by the departure of the United Kingdom from the European Union may:
| |
| • | adversely affect European and worldwide economic and market conditions; |
| |
| • | adversely affect commercial property market rental rates in the United Kingdom and continental Europe; |
| |
| • | adversely affect commercial property market values in the United Kingdom and continental Europe; |
| |
| • | adversely affect the availability of financing for commercial properties in the United Kingdom and continental Europe, which could reduce the price for which we are able to sell properties we have acquired in such geographic locations; and |
| |
| • | create further instability in global financial and foreign exchange markets, including volatility in the value of the sterling and euro. |
As of December 31, 2019, 32% of our real estate investment portfolio consisted of two properties located in Dublin, Ireland, one property in Reading, United Kingdom, one property in Glasgow, United Kingdom, one property in Milton Keynes, United Kingdom, one property in Bristol, United Kingdom and one property in Edinburgh, United Kingdom (based on the estimated aggregate value of our real estate investments). A decline in economic conditions could negatively impact commercial real estate fundamentals and result in lower occupancy, lower rental rates and declining values in our portfolio, which could, among other things, adversely affect our business and financial condition.
Inflation in foreign countries, along with government measures to curb inflation, may have an adverse effect on our investments.
Certain countries have in the past experienced extremely high rates of inflation. Inflation, along with governmental measures to curb inflation, coupled with public speculation about possible future governmental measures to be adopted, has had significant negative effects on these international economies in the past and this could occur again in the future. The introduction of governmental policies to curb inflation can have an adverse effect on our business. High inflation in the countries in which we purchase real estate or make other investments could increase our expenses and we may not be able to pass these increased costs on to our tenants.
Lack of compliance with the United States Foreign Corrupt Practices Act, or FCPA, could subject us to penalties and other adverse consequences.
We are subject to the FCPA, which generally prohibits United States companies from engaging in bribery or other prohibited payments to foreign officials for the purpose of obtaining or retaining business. Foreign companies, including potential competitors, are not subject to these prohibitions. Fraudulent practices, including corruption, extortion, bribery, pay-offs, theft and others, occur from time-to-time in countries in which we may do business. If people acting on our behalf or at our request are found to have engaged in such practices, severe penalties and other consequences could be imposed on us that may have a material adverse effect on our business, results of operations, cash flows and financial condition and our ability to make distributions to our stockholders and the value of their investment.
Risks Related to Organizational Structure
Any interest in us will be diluted by the Special OP Units and any other OP Units in the Operating Partnership and any interest in us may be diluted if we issue additional shares.
We owned a 99.97% general partner interest in the Operating Partnership as of December 31, 2019. Hines Global REIT II Associates Limited Partnership owns the remaining interest in the Operating Partnership, and the Advisor holds the Special OP Units in the Operating Partnership, which were issued as consideration for an obligation by Hines and its affiliates to perform future services in connection with our real estate operations. Payments with respect to these interests will reduce the amount of distributions that would otherwise be payable to you in the future.
Stockholders do not have preemptive rights to acquire any shares issued by us in the future. Therefore, investors purchasing our common shares in the Follow-On Offering may experience dilution of their equity investment if we:
| |
| • | sell shares in the Follow-On Offering or sell additional shares in the future, including those issued pursuant to the distribution reinvestment plan; |
| |
| • | sell securities that are convertible into shares, such as OP Units; |
| |
| • | at the option of our Advisor, issue OP Units to pay for certain fees and distributions; |
| |
| • | issue OP Units or common shares to our Advisor or affiliates in exchange for advances or deferrals of fees; |
| |
| • | issue shares in a private offering; or |
| |
| • | issue shares to sellers of properties acquired by us in connection with an exchange of partnership units from the Operating Partnership. |
We have issued shares of common stock as dividends and may issue preferred shares or separate classes or series of common shares, which issuance could adversely affect the holders of our common shares.
Holders of our common stock do not have preemptive rights to any shares issued by us in the future. With the authorization of our board of directors, we declared special daily stock dividends for the period from October 1, 2014 through June 30, 2015, which may have diluted the value of our shares. In addition, we may issue, without stockholder approval, preferred shares or a class or series of common shares with rights that could adversely affect the holders of our common shares. Upon the affirmative vote of a majority of our directors (including, in the case of preferred shares, a majority of our independent directors), our charter authorizes our board of directors (without any further action by our stockholders) to issue preferred shares or common shares in one or more classes or series, and to fix the voting rights (subject to certain limitations), liquidation preferences, distribution rates, conversion rights, redemption rights and terms, including sinking fund provisions, and certain other rights and preferences with respect to such classes or series of shares. If we ever create and issue preferred shares with a distribution preference over common shares, payment of any distribution preferences of outstanding preferred shares would reduce the amount of funds available for the payment of distributions on the common shares. Further, holders of preferred shares are normally entitled to receive a preference payment in the event we liquidate, dissolve or wind up before any payment is made to the common stockholders, likely reducing the amount common stockholders would otherwise receive upon such an occurrence. We could also designate and issue shares in a class or series of common shares with similar rights. In addition, under certain circumstances, the issuance of preferred shares or a separate class or series of common shares may render more difficult or tend to discourage:
| |
| • | a merger, tender offer or proxy contest; |
| |
| • | the assumption of control by a holder of a large block of our securities; and/or |
| |
| • | the removal of incumbent management. |
Our board of directors determines our major policies and operations which increases the uncertainties faced by our stockholders.
Our board of directors determines our major policies, including our policies regarding acquisitions, dispositions, financing, growth, debt capitalization, REIT qualification, redemptions and distributions. Our board of directors may amend or revise these and other policies without a vote of the stockholders. Under the Maryland General Corporation Law and our charter, our stockholders have a right to vote only on limited matters. Our board of directors’ broad discretion in setting policies and the inability of our stockholders to exert control over those policies increases the uncertainty and risks they face, especially if our board of directors and our stockholders disagree as to what course of action is in the best interests of our stockholders.
Our bylaws designate the Circuit Court for Baltimore City, Maryland as the sole and exclusive forum for certain types of actions and proceedings that may be initiated by our stockholders, which could limit our stockholders' ability to obtain a favorable judicial forum for disputes with us or our directors, officers or employees.
Our bylaws provide that, unless we consent in writing to the selection of an alternative forum, the Circuit Court for Baltimore City, Maryland, or if that Court does not have jurisdiction, the United States District Court for the District of Maryland, Baltimore Division, shall be the sole and exclusive forum for certain types of actions and proceedings that may be initiated by our stockholders with respect to our company, our directors, our officers or our employees (we note we currently have no employees). This choice of forum provision will not apply to claims under the Securities Act or Exchange Act. This choice of forum provision may limit a stockholder's ability to bring a claim in a judicial forum that the stockholder believes is favorable for disputes with us or our directors, officers or employees, which may discourage meritorious claims from being asserted against us and our directors, officers and employees. Alternatively, if a court were to find this provision of our bylaws inapplicable to, or unenforceable in respect of, one or more of the specified types of actions or proceedings, we may incur additional costs associated with resolving such matters in other jurisdictions, which could adversely affect our business, financial condition or results of operations. We adopted this provision because we believe it makes it less likely that we will be forced to incur the expense of defending duplicative actions in multiple forums and less likely that plaintiffs' attorneys will be able to employ such litigation to coerce us into otherwise unjustified settlements, and we believe the risk of a court declining to enforce this provision is remote, as the General Assembly of Maryland has specifically amended the Maryland General Corporation Law to authorize the adoption of such provisions.
The ownership limit in our charter may discourage a takeover attempt.
Our charter provides that no holder of shares, other than any person to whom our board of directors grants an exemption, may directly or indirectly own more than 9.9% of the number or value, whichever is more restrictive, of the aggregate of our outstanding shares or more than 9.9% of the number or value, whichever is more restrictive, of the outstanding shares of any class or series of our outstanding securities. This ownership limit may deter tender offers for our common shares, which offers may be attractive to our stockholders, and thus may limit the opportunity for stockholders to receive a premium for their common shares that might otherwise exist if an investor attempted to assemble a block of common shares in excess of 9.9% of the number or value, whichever is more restrictive, of the aggregate of our outstanding shares, or 9.9% in number or value, whichever is more restrictive, of the outstanding common shares or otherwise to effect a change of control in us.
We will not be afforded the protection of the Maryland General Corporation Law relating to business combinations.
Provisions of the Maryland General Corporation Law prohibit business combinations, unless prior approval of the board of directors is obtained before the person seeking the combination became an interested stockholder, with:
| |
| • | any person who beneficially owns 10% or more of the voting power of our outstanding voting shares (an “interested stockholder���); |
| |
| • | any of our affiliates or associates who, at any time within the two-year period prior to the date in question, was the beneficial owner of 10% or more of the voting power of our then outstanding shares (also an “interested stockholder”); or |
| |
| • | an affiliate of an interested stockholder. |
These prohibitions are intended to prevent a change of control by interested stockholders who do not have the support of our board of directors. Because our charter contains limitations on ownership of more than 9.9% of our common shares, our board of directors has adopted a resolution presently opting out of the business combinations statute. Therefore, we will not be afforded the protections of this statute and, accordingly, there is no guarantee that the ownership limitations in our charter will provide the same measure of protection as the business combinations statute and prevent an undesired change of control by an interested stockholder.
We are not registered as an investment company under the Investment Company Act of 1940, as amended, or the Investment Company Act, and therefore we will not be subject to the requirements imposed on an investment company by the Investment Company Act which may limit or otherwise affect our investment choices.
Hines Global, the Operating Partnership, and our subsidiaries will conduct our businesses so that none of such entities are required to register as “investment companies” under the Investment Company Act. The operation of a business in a manner so as not to be subject to regulation as an investment company requires an analysis of and compliance with complex laws, regulations and SEC staff interpretations, not all of which are summarized herein. Although we could modify our business methods at any time, at the present time we expect that the focus of our activities will involve investments in real estate,
buildings, and other assets that can be referred to as “sticks and bricks” and therefore we will not be an investment company under Section 3(a)(1)(A) of the Investment Company Act. We may invest in other real estate investments and will otherwise be considered to be in the real estate business.
Companies subject to the Investment Company Act are required to comply with a variety of substantive requirements such as requirements relating to:
| |
| • | limitations on the capital structure of the entity; |
| |
| • | restrictions on certain investments; |
| |
| • | prohibitions on transactions with affiliated entities; and |
| |
| • | public reporting disclosures, record keeping, voting procedures, proxy disclosure and similar corporate governance rules and regulations. |
These and other requirements are intended to provide benefits and/or protections to security holders of investment companies. Because we and our subsidiaries do not expect to be subject to these requirements, our stockholders will not be entitled to these benefits or protections. It is our policy to operate in a manner that will not require us to register as an investment company, and we do not expect or intend to register as an “investment company” under the Investment Company Act.
We do not expect that we, the Operating Partnership, or other subsidiaries will be an investment company because we intend to ensure that holdings of investment securities by each such entity will not exceed 40% of the total assets of that entity and that no such entity holds itself out as being engaged primarily in the business of investing in securities. If an entity were to hold investment securities having a value exceeding 40% of the value of the entity’s total assets, and no other exclusion from registration was available, that entity might be required to register as an investment company. In order to avoid such a result, we, the Operating Partnership, or a subsidiary may be unable to sell assets we would otherwise want to sell or may need to sell assets we would otherwise wish to retain. In addition, we may also have to forgo opportunities to acquire certain investments or interests in companies or entities that we would otherwise want to acquire, or acquire assets we might otherwise not select for purchase.
If Hines Global, the Operating Partnership or any subsidiary owns assets that qualify as “investment securities” and the value of such assets exceeds 40% of the value of its total assets, the entity would be deemed to be an investment company absent another exclusion from the Investment Company Act. Certain of the subsidiaries that we may form in the future could seek to rely upon the exclusion provided by Section 3(c)(5)(C) of that Act, which is available for, among other things, entities “primarily engaged in the business of purchasing or otherwise acquiring mortgages and other liens on and interests in real estate.” This exclusion, as interpreted by the staff of the SEC, generally requires that at least 55% of an entity’s portfolio be comprised of qualifying interests and the remaining 45% of the entity’s portfolio be comprised primarily of real estate-type interests (as such terms have been interpreted by the staff of the SEC). SEC staff no-action letters have indicated that the foregoing real estate-type interests test will be met if at least 25% of such entity’s assets are invested in real estate-type interests, which threshold is subject to reduction to the extent that the entity invested more than 55% of its total assets in qualifying interests, and no more than 20% of such entity’s total assets are invested in miscellaneous investments. Qualifying interests for this purpose include actual interests in real estate, certain mortgage loans and other assets as interpreted in a manner consistent with SEC staff guidance. We intend to treat the following as real estate-type interests: non-agency RMBS; CMBS, debt and equity securities of companies primarily engaged in real estate businesses; agency partial pool certificates and securities issued by pass-through entities of which substantially all of the assets consist of qualifying interests; and/or real estate-related assets. Due to the factual nature of this test, we, the Operating Partnership, or a subsidiary may be unable to sell assets we would otherwise want to sell or may need to sell assets we would otherwise wish to retain, if we deem it necessary to remain in compliance with the foregoing standards. In addition, we may have to forgo opportunities to acquire certain investments or interests in companies or entities that we would otherwise want to acquire, or acquire assets we might otherwise not select for purchase, if we deem it necessary to remain in compliance with the foregoing standards.
In addition, we, the Operating Partnership and/or our subsidiaries may rely upon other exclusions, including the exclusion provided by Section 3(c)(6) of the Investment Company Act (which excludes, among other things, parent entities whose primary business is conducted through majority-owned subsidiaries relying upon the exclusion provided by Section 3(c)(5)(C) (discussed above)), from the definition of an investment company and the registration requirements under the Investment Company Act.
There can be no assurance that the laws and regulations governing the Investment Company Act status of REITs (and/or their subsidiaries), including actions by the SEC or its staff providing more specific or different guidance regarding these exclusions, will not change in a manner that adversely affects our operations. For example, on August 31, 2011, the SEC issued
a concept release requesting comments regarding a number of matters relating to the exclusion provided by Section 3(c)(5)(C) of the Investment Company Act, including the nature of assets that qualify for purposes of the exclusion and whether mortgage REITs should be regulated in a manner similar to investment companies. To the extent that the SEC or the SEC staff provides more specific guidance regarding any of the matters bearing upon the exclusions discussed above or other exclusions from the definition of an investment company under the Investment Company Act upon which we may rely, we may be required to change the way we conduct our business or adjust our strategy accordingly. Any additional guidance from the SEC staff could provide additional flexibility to us, or it could further inhibit our ability to pursue the strategies we have chosen. If we meet the definition of an investment company under the Investment Company Act and we fail to qualify for an exclusion therefrom, our ability to use leverage and other business strategies would be substantially reduced. Our business will be materially and adversely affected if we fail to qualify for an exclusion from regulation under the Investment Company Act.
If Hines Global or the Operating Partnership is required to register as an investment company under the Investment Company Act, the additional expenses and operational limitations associated with such registration may reduce our stockholders’ investment return or impair our ability to conduct our business as planned.
If we become an investment company or are otherwise required to register as an investment company, we might be required to revise some of our current policies, or substantially restructure our business, to comply with the Investment Company Act. This would likely require us to incur the expense and delay of holding a stockholder meeting to vote on proposals for such changes. Further, if we were required to register as an investment company, but failed to do so, we would be prohibited from engaging in our business, criminal and civil actions could be brought against us, some of our contracts might be unenforceable, unless a court were to direct enforcement, and a court could appoint a receiver to take control of us and liquidate our business.
If we internalize our management functions, we could incur adverse effects on our business and financial condition, including significant costs associated with becoming and being self-managed and the percentage of our outstanding common stock owned by our stockholders could be reduced.
If we seek to list our shares on an exchange as a way of providing our stockholders with a liquidity event, we may consider internalizing the functions performed for us by our Advisor. An internalization could take many forms, for example, we may hire our own group of executives and other employees or we may acquire our Advisor or its respective assets including its existing workforce. Any internalization could result in significant payments, including in the form of our stock, to the owners of our Advisor as compensation, which could reduce the percentage ownership of our then existing stockholders and concentrate ownership in Hines. In addition, there is no assurance that internalizing our management functions will be beneficial to us and our stockholders. For example, we may not realize the perceived benefits because of: (i) the costs of being self-managed; (ii) our inability to effectively integrate a new staff of managers and employees; or (iii) our inability to properly replicate the services provided previously by our Advisor or its affiliates. Additionally, internalization transactions have also, in some cases, been the subject of litigation and even if these claims are without merit, we could be forced to spend significant amounts of money defending claims which would reduce the amount of funds available for us to invest in real estate investments or to pay distributions. In connection with any such internalization transaction, a special committee consisting of our independent directors will be appointed to evaluate the transaction and to determine whether a fairness opinion should be obtained.
Risks Related to Potential Conflicts of Interest
We compete with affiliates of Hines for real estate investment opportunities and some of these affiliates have preferential rights to accept or reject certain investment opportunities in advance of our right to accept or reject such opportunities.
Hines has existing real estate joint ventures, funds and programs, which we collectively refer to as real estate investment vehicles, with investment objectives and strategies similar to ours, including Hines Global REIT. Because we compete with these real estate investment vehicles for investment opportunities, Hines faces conflicts of interest in allocating investment opportunities between us and these other real estate investment vehicles. We have limited rights to specific investment opportunities located by Hines. Some of these entities have a priority right over other Hines real estate investment vehicles, including us, to accept investment opportunities that meet certain defined investment criteria. Because we and other Hines real estate investment vehicles rely on Hines to present us with investment opportunities, these rights will reduce our investment opportunities. We therefore may not be able to invest in, or we may only invest indirectly with or through another Hines affiliated real estate investment vehicle in, certain investments we otherwise would make directly. To the extent we invest in opportunities with another real estate investment vehicles affiliated with Hines, we may not have the control over such investment we would otherwise have if we owned all of or otherwise controlled such assets.
We do not have priority rights to specific investment opportunities located by Hines. Our right to participate in Hines’ investment allocation process will terminate if we are no longer advised by an affiliate of Hines. For investment opportunities not covered by this allocation procedure, Hines will decide in its discretion, subject to any priority rights it grants or has granted to other Hines-managed or otherwise affiliated real estate investment vehicles, how to allocate such opportunities among us, Hines and other real estate investment vehicles. Because we do not have a right to accept or reject any investment opportunities before Hines or one or more Hines real estate investment vehicles have the right to accept such opportunities, and are otherwise subject to Hines’ discretion as to the investment opportunities we will receive, we may not be able to review and/or invest in opportunities which we would otherwise pursue if we were the only real estate investment vehicle sponsored by Hines or had a priority right in regard to such investments. We are subject to the risk that, as a result of the conflicts of interest between Hines, us and other real estate investment vehicles sponsored or managed by or affiliated with Hines, and the priority rights Hines has granted or may in the future grant to any such other real estate investment vehicles, we may not be offered favorable investment opportunities located by Hines when it would otherwise be in our best interest to accept such investment opportunities, and our business, results of operations, cash flows and financial condition and our ability to make distributions to our stockholders and the value of their investment may be adversely impacted thereby.
We may compete with other investment vehicles affiliated with Hines for tenants.
Hines and its affiliates are not prohibited from engaging, directly or indirectly, in any other business or from possessing interests in any other business venture or ventures, including businesses and ventures involved in the acquisition, development, ownership, management, leasing or sale of real estate projects. Hines or its affiliates own and/or manage properties in most, if not all, geographical areas in which we expect to acquire interests in real estate assets. Therefore, our properties may compete for tenants with other properties owned and/or managed by Hines and its affiliates. Hines may face conflicts of interest when evaluating tenant opportunities for our properties and other properties owned and/or managed by Hines and its affiliates and these conflicts of interest may have a negative impact on our ability to attract and retain tenants.
Employees of our Advisor and Hines will face conflicts of interest relating to time management and allocation of resources and investment opportunities.
We do not have employees. Pursuant to a contract with Hines, we rely on employees of Hines and its affiliates to manage and operate our business and they are contractually bound to devote the time and attention reasonably necessary to conduct our business in an appropriate manner. Our officers and the officers and employees of our Advisor, Hines and its affiliates hold similar positions in numerous entities and they may from time to time allocate more of their time to service the needs of such entities than they allocate to servicing our needs. Hines is not restricted from acquiring, developing, operating, managing, leasing or selling real estate through entities other than us and Hines will continue to be actively involved in real estate operations and activities other than our operations and activities. Hines currently controls and/or operates other entities that own properties in many of the markets in which we will seek to invest. Hines spends a material amount of time managing these properties and other assets unrelated to our business. We lack the ability to manage it without the time and attention of Hines’ employees.
Hines and its affiliates are general partners and sponsors of other real estate investment vehicles having investment objectives and legal and financial obligations similar to ours, including Hines Global REIT. Because Hines and its affiliates have interests in other real estate investment vehicles and also engage in other business activities, they may have conflicts of interest in allocating their time and resources among our business and these other activities. Our officers and directors, as well as those of our Advisor, own equity interests in entities affiliated with Hines from which we may buy properties. These individuals may make substantial profits in connection with such transactions, which could result in conflicts of interest. Likewise, such individuals could make substantial profits as the result of investment opportunities allocated to entities affiliated with Hines other than us. As a result of these interests, they could pursue transactions that may not be in our best interest.
Hines may face conflicts of interest if it sells properties it acquires or develops to us.
We may in the future acquire properties from Hines and affiliates of Hines. We may acquire properties Hines currently owns or hereafter acquires from third parties. Hines may also develop properties and then sell the completed properties to us. Similarly, we may provide development loans to Hines in connection with these developments. Hines, its affiliates and its employees (including our officers and directors) may make substantial profits in connection with such transactions. We must follow certain procedures when purchasing assets from Hines and its affiliates. Hines may owe fiduciary and/or other duties to the selling entity in these transactions and conflicts of interest between us and the selling entities could exist in such transactions. Because we are relying on Hines, these conflicts could result in transactions based on terms that are less favorable to us than we would receive from a third party.
Our Advisor faces a conflict of interest because the fees it receives for services performed are based in part on our NAV, which our Advisor is ultimately responsible for determining.
Our Advisor is paid an asset management fee for its services based on our NAV, which is calculated based in part on information provided by our Advisor. In addition, the distributions to be received by our Advisor with respect to its performance participation interest in the Operating Partnership will be based in part upon the Operating Partnership’s net assets (which is a component of our NAV). The calculation of our NAV includes certain subjective judgments with respect to estimating, for example, the value of our portfolio and our accrued expenses, net portfolio income and liabilities, and therefore, our NAV may not correspond to realizable value upon a sale of those assets. Our Advisor may benefit by us retaining ownership of our assets at times when our stockholders may be better served by the sale or disposition of our assets in order to avoid a reduction in our NAV. If our NAV is calculated in a way that is not reflective of our actual NAV, then the purchase price of shares of our common stock or the price paid for the redemption of your shares of common stock on a given date may not accurately reflect the value of our portfolio, and your shares may be worth less than the purchase price or more than the redemption price.
Our Advisor’s asset management fee and the performance participation allocation may not create proper incentives or may induce our Advisor and its affiliates to make certain investments, including speculative investments, that increase the risk of our real estate portfolio.
We pay our Advisor an asset management fee regardless of the performance of our portfolio. Our Advisor’s entitlement to an asset management fee, which is not based upon performance metrics or goals, might reduce its incentive to devote its time and effort to seeking investments that provide attractive risk-adjusted returns for our portfolio. We may be required to pay our Advisor an asset management fee in a particular period despite experiencing a net loss or a decline in the value of our portfolio during that period.
The existence of the 12.5% performance participation interest in our Operating Partnership to which our Advisor is entitled, which is based on our total distributions plus the change in NAV per share, may create an incentive for our Advisor to make riskier or more speculative investments on our behalf than it would otherwise make in the absence of such performance-based compensation. For example, our Advisor may be incentivized to recommend a riskier hedging or derivative transaction than it would otherwise recommend because it may materially increase the probability that our Advisor will receive the performance participation allocation or our Advisor may oppose a hedging or derivative transaction that may otherwise benefit the Company because executing the transaction may make it more likely that our Advisor will not earn the performance participation allocation. In addition, the change in NAV per share will be based on the value of our investments on the applicable measurement dates and not on realized gains or losses. As a result, our Advisor may receive distributions based on unrealized gains in certain assets at the time of such distributions and such gains ultimately may not be realized when those assets are eventually disposed of.
Our Dealer Manager may face conflicts of interest caused by compensation arrangements with us, which could result in actions that are not in our stockholders’ best interest.
Our Dealer Manager will be paid ongoing distribution and stockholder servicing fees with respect to Class T shares, Class S shares and Class D shares until the earliest to occur of several events, including a listing of our common shares and a merger or consolidation with or into another entity, or the sale or other disposition of all or substantially all of our assets, which may incentivize our Advisor not to recommend a listing, sale, merger or other liquidity event until our Dealer Manager has been paid all distribution and stockholder servicing fees, because the completion of such transactions would cause the payment of such fees to our Dealer Manager to cease.
Hines may face conflicts of interest in connection with the management of our day-to-day operations and in the enforcement of agreements between Hines and its affiliates.
Hines and our Advisor manage our day-to-day operations and properties pursuant to an advisory agreement. This agreement was not negotiated at arm’s length and certain fees payable by us under such agreement are paid regardless of our performance. Hines and its affiliates may encounter conflicts of interest with respect to position as to matters relating to this agreement. Areas of potential conflict include the computation of fees and reimbursements under such agreements, the enforcement, renewal and/or termination of the agreements and the priority of payments to third parties as opposed to amounts paid to affiliates of Hines. These fees may be higher than fees charged by third parties in an arm’s-length transaction as a result of these conflicts.
Certain of our officers and directors face conflicts of interest relating to the positions they hold with other entities.
All of our officers and non-independent directors are also officers and directors of our Advisor and/or other entities controlled by Hines. Some of these entities, including Hines Global REIT, may compete with us for investment and leasing opportunities. These personnel owe fiduciary duties to these other entities and their security holders and these duties may from time to time conflict with the fiduciary duties such individuals owe to us and our stockholders. For example, conflicts of interest adversely affecting our investment decisions could arise in decisions or activities related to:
| |
| • | the allocation of new investments among us and other entities operated by Hines; |
| |
| • | the allocation of time and resources among us and other entities operated by Hines; |
| |
| • | the timing and terms of the investment in or sale of an asset; |
| |
| • | investments with Hines and affiliates of Hines; |
| |
| • | the compensation paid to our Advisor; and |
| |
| • | our relationship with Hines in the management of our properties. |
These conflicts of interest may also be impacted by the fact that such individuals may have compensation structures tied to the performance of such other entities controlled by Hines and these compensation structures may potentially provide for greater remuneration in the event an investment opportunity is presented to a Hines affiliate rather than us.
Our officers and directors have limited liability.
Generally, we are obligated under our charter to indemnify our officers and directors against certain liabilities incurred in connection with their services. We enter into indemnification agreements with each of our officers and directors pursuant to which we generally agree to indemnify our officers and directors for any such liabilities that they incur. These indemnification agreements, as well as the indemnification provisions in our charter, could limit our ability and the ability of our stockholders to effectively take action against our officers and directors arising from their service to us. In addition, there could be a potential reduction in distributions resulting from our payment of premiums associated with insurance or payments of a defense, settlement or claim.
Our UPREIT structure may result in potential conflicts of interest.
Persons holding OP Units have the right to vote on certain amendments to the Agreement of Limited Partnership of the Operating Partnership, as well as on certain other matters. Persons holding such voting rights may exercise them in a manner that conflicts with the interests of our stockholders. As general partner of the Operating Partnership, we will be obligated to act in a manner that is in the best interest of all partners of the Operating Partnership. Circumstances may arise in the future when the interests of limited partners in the Operating Partnership may conflict with the interests of our stockholders.
Risks Related to Taxes
If we fail to qualify as a REIT, our operations and our ability to pay distributions to our stockholders would be adversely impacted.
We believe that we qualify as a REIT under the Code. A REIT generally is not taxed at the corporate level on income that it currently distributes to its stockholders. Qualification as a REIT involves the application of highly technical and complex rules for which there are only limited judicial or administrative interpretations. The determination of various factual matters and circumstances not entirely within our control may affect our ability to continue to qualify as a REIT. In addition, new legislation, regulations, administrative interpretations or court decisions could significantly change the tax laws with respect to qualification as a REIT or the U.S. federal income tax consequences of such qualification.
If we were to fail to qualify as a REIT in any taxable year:
| |
| • | we would not be allowed to deduct our distributions to our stockholders when computing our taxable income; |
| |
| • | we would be subject to federal income tax on our taxable income at regular corporate rates; |
| |
| • | we would be disqualified from being taxed as a REIT for the four taxable years following the year during which qualification was lost, unless entitled to relief under certain statutory provisions; |
| |
| • | our cash available for distribution would be reduced and we would have less cash to distribute to our stockholders; and |
| |
| • | we might be required to borrow additional funds or sell some of our assets in order to pay corporate tax obligations we may incur as a result of our disqualification. |
We may be required to defer repatriation of cash from foreign jurisdictions in order to qualify as a REIT.
Investments in foreign real property may be subject to foreign currency gains and losses. Certain foreign currency gains will generally be excluded from income for purposes of determining our compliance with one or both of the REIT gross income tests; however, under certain circumstances (for example, if we regularly trade in foreign securities) such gains will be treated as non-qualifying income. To reduce the risk of foreign currency gains adversely affecting our REIT qualification, we may be required to defer the repatriation of cash from foreign jurisdictions or to employ other structures that could affect the timing, character or amount of income we receive from our foreign investments. No assurance can be given that we will be able to manage our foreign currency gains in a manner that enables us to qualify as a REIT or to avoid U.S. federal income and other taxes on our income as a result of foreign currency gains.
If the Operating Partnership is classified as a “publicly traded partnership” under the Code, our operations and our ability to pay distributions to our stockholders could be adversely affected.
We believe that the Operating Partnership will be treated as a partnership, and not as an association or a publicly traded partnership for U.S. federal income tax purposes. In this regard, the Code generally classifies “publicly traded partnerships” (as defined in Section 7704 of the Code) as associations taxable as corporations (rather than as partnerships), unless substantially all of their taxable income consists of specified types of passive income. In order to minimize the risk that the Code would classify the Operating Partnership as a “publicly traded partnership” for tax purposes, we placed certain restrictions on the transfer and/or repurchase of partnership units in the Operating Partnership. However, if the IRS successfully determines that the Operating Partnership should be taxed as a corporation, the Operating Partnership would be required to pay U.S. federal income tax at corporate rates on its net income, its partners would be treated as stockholders of the Operating Partnership and distributions to partners would constitute non-deductible distributions in computing the Operating Partnership’s taxable income. In addition, we could fail to qualify as a REIT and the imposition of a corporate tax on the Operating Partnership would reduce the amount of cash available for distribution to our stockholders.
Distributions to tax-exempt investors may be classified as unrelated business taxable income.
Neither ordinary nor capital gain distributions with respect to our common shares nor gain from the sale of common shares should generally constitute unrelated business taxable income to a tax-exempt investor. However, there are certain exceptions to this rule. In particular:
| |
| • | part of the income and gain recognized by certain qualified employee pension trusts with respect to our common shares may be treated as unrelated business taxable income if our stock is predominately held by qualified employee pension trusts, we are required to rely on a special look through rule for purposes of meeting the REIT stock ownership tests, and we are not operated in such a manner as to otherwise avoid treatment of such income or gain as unrelated business taxable income; |
| |
| • | part of the income and gain recognized by a tax exempt investor with respect to our common shares would constitute unrelated business taxable income if such investor incurs debt in order to acquire the common shares; and |
| |
| • | part or all of the income or gain recognized with respect to our common shares by social clubs, voluntary employee benefit associations and supplemental unemployment benefit trusts and qualified group legal services plans which are exempt from federal income taxation under Sections 501(c)(7), (9), or (17) of the Code may be treated as unrelated business taxable income. |
Stockholders who participate in the distribution reinvestment plan may realize taxable income without receiving cash distributions.
If our stockholders participate in the distribution reinvestment plan, they will be required to take into account, in computing their taxable income, ordinary and capital gain dividends allocable to shares that they own, even though they receive no cash because such distributions are reinvested. In addition, the difference between the public offering price of our shares and the transaction price paid for shares purchased pursuant to the distribution reinvestment plan may be deemed to be taxable as income to participants in the plan.
Foreign investors may be subject to the Foreign Investment in Real Property Tax Act (“FIRPTA”) on sale of common shares if we are unable to qualify as a “domestically controlled” REIT.
A foreign person disposing of a U.S. real property interest, including shares of a U.S. corporation whose assets consist principally of U.S. real property interests, is generally subject to tax under FIRPTA on the gain recognized on such disposition. FIRPTA does not apply, however, to the disposition of stock in a REIT if the REIT is “domestically controlled.” In addition, FIRPTA will apply if we make a distribution that is attributable to gain recognized by us on a disposition of a U.S. real property interest, even if we are domestically controlled, except with respect to “qualified foreign pension plans”. A REIT is “domestically controlled” if less than 50% of the REIT’s capital stock, by value, has been owned, directly and indirectly, by persons who are not U.S. persons during a continuous five-year period ending on the date of disposition or, if shorter, during the entire period of the REIT’s existence.
We cannot assure our stockholders that we will qualify as a “domestically controlled” REIT. If we were to fail to so qualify, gains realized by foreign investors other than “qualified foreign pension plans” and foreign governments on a sale of our common shares would be subject to tax under FIRPTA (unless our common shares were traded on an established securities market and the foreign investor did not at any time during a specified testing period directly or indirectly own more than 10% of the value of our outstanding common shares). Our common shares are not currently traded on an established securities market.
In certain circumstances, we may be subject to federal, state, and local or foreign income or other taxes, which would reduce our cash available to pay distributions to our stockholders.
Even if we qualify and maintain our status as a REIT, we may be subject to certain federal, state, local or foreign, income or other taxes. For example, if we have net income from a “prohibited transaction,” such income will be subject to a 100% tax. We may not be able to make sufficient distributions to avoid paying federal income tax and/or the 4% excise tax that applies to certain income retained by a REIT. We may also decide to retain gain that we recognize from the sale or other disposition of our properties and pay income tax directly on such gain. In that event, our stockholders would be treated as if they earned that gain and paid the tax on it directly. However, stockholders that are tax-exempt, such as charities or qualified pension plans, would have no benefit from their deemed payment of such tax liability. We may also be subject to state and local taxes on our income or property, either directly or at the level of the Operating Partnership or of other entities through which we indirectly own our assets. Any taxes that we pay will reduce our cash available for distribution to our stockholders.
We have entered, and may continue to enter into, certain hedging transactions which may have a potential impact on our REIT status.
We have entered into hedging transactions with respect to certain of our activities and may continue to enter into similar transactions in the future. Our hedging activities may include entering into interest rate and/or foreign currency swaps, caps and floors, options to purchase these items, and futures and forward contracts. The gross income tests applicable to REITs generally exclude any income or gain from a hedging or similar transaction entered into by the REIT primarily to manage the risk of interest rate, price changes or currency fluctuations with respect to borrowings made or to be made to acquire or carry real estate assets or to manage the risk of currency fluctuations with respect to an item of income or gain that would be qualifying income under the 75% or 95% gross income test (or any property which generates such income or gain), provided that we properly identify such hedges and other transactions in the manner required by the Code and regulations. To the extent that we do not properly identify such transactions as hedges or we hedge with other types of financial instruments, or hedge asset values or other types of indebtedness, the income from those transactions is likely to be treated as non-qualifying income for purposes of the gross income tests and may affect our ability to qualify as a REIT. In addition, to the extent that our position in a hedging transaction has positive value, the instrument may be treated as a non-qualifying asset that does not qualify for purposes of the gross asset tests to which REITs are subject.
Entities through which we hold foreign real estate investments may be subject to foreign taxes, notwithstanding our status as a REIT.
Even if we maintain our status as a REIT, entities through which we hold investments in assets located outside the United States may be subject to income taxation by jurisdictions in which such assets are located. Our cash available for distribution to our stockholders will be reduced by any such foreign income taxes.
Dividends payable by REITs do not qualify for the reduced tax rates available for some dividends.
The maximum tax rate applicable to income from “qualified dividends” payable to U.S. stockholders that are individuals, trusts or estates is currently 20%. Dividends payable by REITs, however, generally are not eligible for the reduced rates. The more favorable rates applicable to regular corporate qualified dividends could cause investors who are individuals, trusts or estates to perceive investments in our common shares to be relatively less attractive than investments in the stock of non-REIT corporations that pay dividends, which could adversely affect the value of our common shares.
Recharacterization of sale-leaseback transactions may cause us to lose our REIT status.
We may purchase real properties and lease them back to the sellers of such properties. We will use commercially reasonable efforts to structure any such sale-leaseback transaction such that the lease will be characterized as a “true lease,” thereby allowing us to be treated as the owner of the property for U.S. federal income tax purposes, but cannot assure our stockholders that the IRS will not challenge such characterization. In the event that any such sale-leaseback transaction is challenged and recharacterized as a financing transaction or loan for U.S. federal income tax purposes, deductions for depreciation relating to such property would be disallowed. We might fail to satisfy the REIT qualification “asset tests” or the “income tests” and, consequently, lose our REIT status effective with the year of recharacterization if a sale-leaseback transaction were so recharacterized. Alternatively, the amount of our REIT taxable income could be recalculated which might also cause us to fail to meet the distribution requirement for a taxable year.
Investments in other REITs and real estate partnerships could subject us to the tax risks associated with the tax status of such entities.
We may invest in the securities of other REITs and real estate partnerships. Such investments are subject to the risk that any such REIT or partnership may fail to satisfy the requirements to qualify as a REIT or a partnership, as the case may be, in any given taxable year. In the case of a REIT, such failure would subject such entity to taxation as a corporation. Failure to qualify as a REIT may require such REIT to incur indebtedness to pay its tax liabilities, may reduce its ability to make distributions to us, and may render it ineligible to elect REIT status prior to the fifth taxable year following the year in which it fails to so qualify. In the case of a partnership, such failure could subject such partnership to an entity level tax and reduce the entity’s ability to make distributions to us. In addition, such failures could, depending on the circumstances, jeopardize our ability to qualify as a REIT.
Complying with the REIT requirements may cause us to forgo otherwise attractive opportunities.
To qualify as a REIT for U.S. federal income tax purposes, we must continually satisfy tests concerning, among other things, the sources of our income, the nature and diversification of our assets, the amounts we distribute to our stockholders and the ownership of shares of our common stock. We may be required to forgo otherwise attractive investments or make distributions to stockholders at disadvantageous times or when we do not have funds readily available for distribution. Thus, compliance with the REIT requirements may hinder our ability to operate solely on the basis of maximizing profits.
Complying with the REIT requirements may force us to liquidate otherwise attractive investments.
We must ensure that at the end of each calendar quarter, at least 75% of the value of our assets consists of cash, cash items, government securities and qualified real estate assets in order to ensure our qualification as a REIT. The remainder of our investments (other than governmental securities and qualified real estate assets) generally cannot include more than 10% of the outstanding voting securities of any one issuer or more than 10% of the total value of the outstanding securities of any one issuer. In addition, in general, no more than 5% of the value of our assets (other than government securities and qualified real estate assets) can consist of the securities of any one issuer, and no more than 20% (the limit was 25% prior to January 1, 2018) of the value of our total assets can be represented by securities of one or more taxable REIT subsidiaries. If we fail to comply with these requirements at the end of any calendar quarter, we must correct such failure within 30 days after the end of the calendar quarter in order to avoid losing our REIT status and suffering adverse tax consequences. As a result, we may be required to liquidate otherwise attractive investments.
The failure of a mezzanine loan or any other loan which is not secured by a mortgage on real property to qualify as a real estate asset could adversely affect our ability to qualify as a REIT.
The IRS has issued Revenue Procedure 2003-65, which provides a safe harbor pursuant to which a mezzanine loan that is secured by interests in a pass-through entity will be treated by the IRS as a real estate asset for purposes of the REIT tests, and interest derived from such loan will be treated as qualifying mortgage interest for purposes of the REIT 75% income test.
Although the Revenue Procedure provides a safe harbor on which taxpayers may rely, it does not prescribe rules of substantive tax law. We may make investments in loans secured by interests in pass-through entities in a manner that complies with the various requirements applicable to our qualification as a REIT. To the extent, however, that any such loans do not satisfy all of the requirements for reliance on the safe harbor set forth in the Revenue Procedure, there can be no assurance that the IRS will not challenge the tax treatment of such loans, which could jeopardize our ability to qualify as a REIT. Similarly, any other loan which we make which is not secured by a mortgage on real property may fail to qualify as a real estate asset for purposes of the REIT qualification tests and therefore could adversely affect our ability to qualify as a REIT.
Legislative or regulatory action could adversely affect us and/or our investors.
Legislative or regulatory action could adversely affect investors. In recent years, numerous legislative, judicial and administrative changes have been made in the provisions of U.S. federal income tax laws applicable to investments similar to an investment in shares of our common stock. Additional changes to the tax laws are likely to continue to occur, and we cannot assure you that any such changes will not adversely affect our taxation and our ability to continue to qualify as a REIT or the taxation of a stockholder. Any such changes could have an adverse effect on an investment in our shares or on the market value or the resale potential of our assets. You are urged to consult with your own tax advisor with respect to the impact of recent legislation on their years investment in our shares and the status of legislative, regulatory or administrative developments and proposals and their potential effect on an investment in our shares.
Although REITs generally receive better tax treatment than entities taxed as regular corporations, it is possible that future legislation would result in a REIT having fewer tax advantages, and it could become more advantageous for a company that invests in real estate to elect to be treated for U.S. federal income tax purposes as a regular corporation. As a result, our charter provides our board of directors with the power, under certain circumstances, to revoke or otherwise terminate our REIT election and cause us to be taxed as a regular corporation, without your vote or the vote of our other stockholders.
In addition, the Tax Cuts and Jobs Act, or the Tax Act, made significant changes to the U.S. federal income tax rules for taxation of individuals and businesses. In addition to reducing corporate and individual tax rates, the Tax Act eliminates or restricts various deductions. Most of the changes applicable to individuals are temporary and apply only to taxable years beginning after December 31, 2017, and before January 1, 2026. The Tax Act made numerous large and small changes to the tax rules that do not affect the REIT qualification rules directly, but may otherwise affect us or you. While the changes in the Tax Act generally appear to be favorable with respect to REITs, the extensive changes to non-REIT provisions in the Internal Revenue Code may have unanticipated effects on us or you.
We urge you to consult with your own tax advisor with respect to the status of the Tax Act and other legislative, regulatory or administrative developments and proposals and their potential effect on an investment in shares of our common stock.
Risks Related to ERISA
If our assets are deemed to be plan assets under ERISA, we, our Advisor and the fiduciaries of investing ERISA plans may be exposed to liabilities under Title I of ERISA and the Internal Revenue Code.
In some circumstances where an ERISA plan holds an interest in an entity, an undivided interest in the assets of the entity attributable to that interest are deemed to be ERISA plan assets unless an exception applies. This is known as the “look-through rule.” Under those circumstances, the obligations and other responsibilities of plan sponsors, plan fiduciaries and plan administrators, and of parties in interest and disqualified persons, under Title I of ERISA and Section 4975 of the Code, as applicable, may be applicable, and there may be liability under these and other provisions of ERISA and the Code. We believe that our assets should not be treated as plan assets because the shares should qualify as “publicly-offered securities” that are exempt from the look-through rules under applicable regulations of the U.S. Department of the Treasury, because we have 100 stockholders that are independent of us and one another. We note, however, that because certain limitations are imposed upon the transferability of shares so that we may qualify as a REIT, and perhaps for other reasons, it is possible that this exemption may not apply. If that is the case, and if our Advisor or we are exposed to liability under ERISA or the Code, our performance and results of operations could be adversely affected. In addition, if that were the case, an investment in our common shares might constitute an ineffective delegation of fiduciary responsibility to our Advisor, and expose the fiduciary of the benefit plan to co-fiduciary liability under ERISA for any breach by our Advisor of the fiduciary duties mandated under ERISA. If our Advisor or we are exposed to liability under ERISA or the Code, our performance and results of operations could be adversely affected. Prior to making an investment in us, potential investors should consult with their legal and other advisors concerning the impact of ERISA and the Code on such investors’ investment and our performance.
There are special considerations that apply to pension or profit sharing trusts or individual retirement accounts, or IRAs, investing in our common stock.
If a stockholder is investing the assets of an IRA, pension, profit sharing, 401(k), Keogh or other qualified retirement plan, they should satisfy themselves that:
| |
| • | their investment is consistent with their fiduciary obligations under ERISA and the Code; |
| |
| • | their investment is made in accordance with the documents and instruments governing their plan or IRA, including their plan’s investment policy; |
| |
| • | their investment satisfies the prudence and diversification requirements of Sections 404(a)(1)(B) and 404(a)(1)(C) of ERISA; |
| |
| • | their investment will not impair the liquidity of the plan or IRA; |
| |
| • | their investment will not produce “unrelated business taxable income” for the plan or IRA; |
| |
| • | they will be able to value the assets of the plan annually in accordance with ERISA requirements; and |
| |
| • | their investment will not constitute a prohibited transaction under Section 406 of ERISA or Section 4975 of the Code. |
Item 1B. Unresolved Staff Comments
Not applicable.
Item 2. Properties
As of December 31, 2019, we owned nineteen real estate investments. The following table provides additional information regarding each of these properties, and is presented as of December 31, 2019.
|
| | | | | | | | | | | | | | |
Property (1) |
| Location |
| Investment Type |
| Date Acquired/ Net Purchase Price (in millions) (2) |
| Estimated Going-in Capitalization Rate (3) |
| Leasable Square Feet |
| Percent Leased |
| Bishop’s Square | | Dublin, Ireland | | Office | | 3/2015; $103.2 | | 6.1% | | 182,370 |
| | 100 | % |
Domain Apartments (4) | | Las Vegas, Nevada | | Residential/Living | | 1/2016; $58.1 | | 5.5% | | 331,038 |
| | 96 | % |
| Cottonwood Corporate Center | | Salt Lake City, Utah | | Office | | 7/2016; $139.2 | | 6.9% | | 487,492 |
| | 94 | % |
Goodyear Crossing II (10) | | Phoenix, Arizona | | Industrial | | 8/2016; $56.2 | | 8.5% | | 820,384 |
| | 100 | % |
| Rookwood | | Cincinnati, Ohio | | Retail | | 1/2017; $193.7 | | 6.0% | | 600,973 |
| | 97 | % |
Montrose Student Residences (5) | | Dublin, Ireland | | Residential/Living | | 3/2017; $40.6 | | 5.5% | | 53,835 |
| | 100 | % |
Queen’s Court Student Residences (6) | | Reading, United Kingdom | | Residential/Living | | 10/2017; $65.3 | | 6.2% | | 79,115 |
| | 100 | % |
Venue Museum District (7) | | Houston, Texas | | Residential/Living | | 9/2018; $72.9 | | 3.9% | | 294,964 |
| | 95 | % |
| Fresh Park Venlo | | Venlo, Netherlands | | Industrial | | 10/2018; $136.3 | | 6.7% | | 2,863,565 |
| | 96 | % |
| Maintal Logistics | | Frankfurt, Germany | | Industrial | | 12/2018; $43.8 | | 5.7% | | 387,253 |
| | 96 | % |
| ABC Westland | | The Hague, Netherlands | | Industrial | | 5/2019; $130.3 | | 6.2% | | 1,283,975 |
| | 91 | % |
| Promenade Shops at Briargate | | Colorado Springs, Colorado | | Retail | | 9/2019; $93.2 | | 7.7% | | 236,539 |
| | 91 | % |
| Gdańsk PL II | | Gdańsk, Poland | | Industrial | | 9/2019; $29.9 | | 6.7% | | 346,996 |
| | 100 | % |
| Łódź Urban Logistics | | Łódź, Poland | | Industrial | | 9/2019; $25.2 | | 6.6% | | 389,233 |
| | 100 | % |
Glasgow West End (8) | | Glasgow, United Kingdom | | Residential/Living | | 9/2019; $89.5 | | 5.5% | | 232,425 |
| | 99 | % |
The Alloy (9) | | College Park, Maryland | | Residential/Living | | 11/2019; $98.0 | | 5.0% | | 228,581 |
| | 96 | % |
| Charles Tyrwhitt DC | | Milton Keynes, United Kingdom | | Industrial | | 11/2019; $19.9 | | 5.7% | | 140,106 |
| | 100 | % |
| DSG Bristol | | Bristol, United Kingdom | | Industrial | | 11/2019; $47.0 | | 5.0% | | 265,000 |
| | 100 | % |
| Royal Mail | | Edinburgh, United Kingdom | | Industrial | | 12/2019; $33.4 | | 5.3% | | 212,028 |
| | 100 | % |
| Total for All Investments |
|
|
| |
|
|
| 9,435,872 |
|
| 96 | % |
| |
| (1) | On December 31, 2019, we effectively owned a 99.97% interest in the nineteen properties acquired prior to December 31, 2019 through our ownership interest in the Operating Partnership as its sole general partner. Hines Global REIT II Associates Limited Partnership (“HALP II”), an affiliate of Hines, owned the remaining 0.03% interest in the Operating Partnership. |
| |
| (2) | For acquisitions denominated in a foreign currency, amounts have been translated to U.S. dollars at a rate based on the exchange rate in effect on the acquisition date. Additionally, these net purchase price amounts exclude any acquisition costs which may have been incurred related to each acquisition. Upon our adoption of Accounting Standards Update 2017-01 in 2018, we capitalized acquisition-related costs for our property acquisitions. |
| |
| (3) | The estimated going-in capitalization rate is determined as of the date of acquisition by dividing the projected property revenues in excess of expenses for the first fiscal year by the net purchase price (excluding closing costs and taxes). Property revenues in excess of expenses includes all projected operating revenues (rental income, tenant reimbursements, parking and any other property-related income) less all projected operating expenses (property operating and maintenance expenses, property taxes, insurance and property management fees). The projected property revenues in excess of expenses includes assumptions which may not be indicative of the actual future performance of the property, including the assumption that the tenants will perform under their lease agreements during the 12 months following our acquisition of the properties and assumptions concerning estimates of timing and rental rates related to re-leasing vacant space. |
| |
| (4) | The Domain Apartments consist of 308 units with an average effective monthly rental rate of $1,257 per unit as of December 31, 2019. In January 2020 we sold the Domain Apartments for a contract price of $80.1 million. |
| |
| (5) | The Montrose Student Residences consists of 210 beds with an average effective weekly rental rate of €236 (approximately $264 assuming a rate of $1.12 per EUR as of December 31, 2019) per bed. |
| |
| (6) | The Queen’s Court Student Residences consists of 395 beds with an average effective weekly rental rate of £201 (approximately $265 assuming a rate of $1.32 per GBP as of December 31, 2019) per bed. |
| |
| (7) | Venue Museum District consists of 224 units with an average effective monthly rental rate of $2,595 per unit as of December 31, 2019. |
| |
| (8) | Glasgow West End consists of 607 beds with an average effective weekly rental rate of £177 (approximately $233 assuming a rate of $1.32 per GBP as of December 31, 2019) per bed. |
| |
| (9) | The Alloy consists of 399 beds with an average effective monthly rental rate of $2,181 per unit as of December 31, 2019. |
(10) In February 2020, we sold Goodyear Crossing II for a contract price of $72.0 million.
Investment Type
Our portfolio is comprised of investments in a variety of real estate asset classes, including retail, office, industrial, and residential/living which includes multi-family and student housing properties. The following chart depicts the percentage of our portfolio’s investment types based on the estimated value of each real estate investment as of December 31, 2019 (the “Estimated Values”), which are consistent with the values used to determine our NAV per share as of that date.
Lease Expirations
The following table lists the scheduled lease expirations and related expiring base rents of our commercial properties for each of the years ending December 31, 2020 through December 31, 2029 and the period thereafter for the commercial properties we owned as of December 31, 2019. It does not include the effect of our residential/living or student housing properties due to the short term nature of these leases. The table also shows the approximate leasable square feet represented by the applicable lease expirations.
|
| | | | | | | | | | | | | | | | |
| | | | | Leasable Area | | | | |
| Year | | Number of Leases | | Approximate Square Feet | | Percent of Total Leasable Area | | Annual Base Rental Income of Expiring Leases (in thousands) | | Percent of Total Annual Base Rental Income |
| 2020 | | 60 |
| | 1,618,113 |
| | 20.4 | % | | $ | 10,493 |
| | 13.2 | % |
| 2021 | | 52 |
| | 1,075,294 |
| | 13.6 | % | | $ | 13,812 |
| | 17.4 | % |
| 2022 | | 28 |
| | 422,025 |
| | 5.3 | % | | $ | 4,480 |
| | 5.6 | % |
| 2023 | | 40 |
| | 704,861 |
| | 8.9 | % | | $ | 8,233 |
| | 10.4 | % |
| 2024 | | 27 |
| | 590,137 |
| | 7.5 | % | | $ | 7,879 |
| | 9.9 | % |
| 2025 | | 15 |
| | 959,305 |
| | 12.1 | % | | $ | 6,374 |
| | 8.0 | % |
| 2026 | | 13 |
| | 337,639 |
| | 4.3 | % | | $ | 4,001 |
| | 5.0 | % |
| 2027 | | 6 |
| | 127,320 |
| | 1.6 | % | | $ | 667 |
| | 0.8 | % |
| 2028 | | 9 |
| | 409,603 |
| | 5.2 | % | | $ | 8,795 |
| | 11.1 | % |
| 2029 | | 10 |
| | 91,586 |
| | 1.1 | % | | $ | 1,564 |
| | 2.0 | % |
| Thereafter | | 29 |
| | 1,580,036 |
| | 20.0 | % | | $ | 13,148 |
| | 16.6 | % |
Market Concentration
The following charts depict the location of our real estate investments as of December 31, 2019. Approximately 45% of our portfolio is located throughout the United States and approximately 55% is located internationally (based on our pro rata share of the Estimated Value of each of the real estate investments).
Industry Concentration
The following table provides a summary of the industry concentration of the tenants in our commercial properties based on their leased square footage as of December 31, 2019:
| |
| * | Other is made up of industries which individually comprise less than 2% of our portfolio and includes: Finance and Insurance, Administrative and Support Services, Oil and Gas, Construction, Hospitality, Other Services and Government. |
Same-Store Gross Asset Value (“GAV”) vs Investment to Date
The following chart summarizes changes in the cost of our properties that were owned throughout all of 2019 compared to their valuations. As indicated by the chart, the valuations of such properties exceeded their cost by 5.8% as of January 2019 and 9.0% as of December 2019.
Item 3. Legal Proceedings
From time to time in the ordinary course of business, we or our subsidiaries may become subject to legal proceedings, claims or disputes. As of March 30, 2020, neither we nor any of our subsidiaries were a party to any material pending legal proceedings.
Item 4. Mine Safety Disclosures
Not applicable.
PART II
Item 5. Market for Registrant’s Common Equity, Related Stockholder Matters and Issuer Purchases of Equity Securities
Market Information
The table below discloses each class of shares of our common stock outstanding as of December 31, 2019, which were in the aggregate held by a total of 17,635 stockholders. The number of stockholders is based on the records of our registrar and transfer agent. There is no established public trading market for our common stock. Therefore, there is a risk that a stockholder may not be able to sell our stock at a time or price acceptable to the stockholder.
|
| | | | | | | | |
| | Class T | Class S | Class D | Class I | Class AX | Class TX | Class IX | Class JX |
| Shares outstanding | 28,837 | — | 6,927 | 7,206 | 18,885 | 19,901 | 91 | — |
To assist the Financial Industry Regulatory Authority (“FINRA”) members and their associated persons that participate in our public offerings in their effort to comply with National Association of Securities Dealers (“NASD”) Rule 2340, we disclose in each Annual Report on Form 10-K a per share estimated value of the shares, the method by which it was developed and the date of the data used to develop the estimated value. In addition, we prepare annual statements of estimated share values to assist fiduciaries of retirement plans subject to the annual reporting requirements of ERISA in the preparation of their reports relating to an investment in our shares and such statements should not be used for any other purpose. On January 16, 2020, we announced a new net asset value (“NAV”) per share of our common stock of $10.10 as of December 31, 2019. The NAV was determined by us and our Advisor and was approved by our valuation committee and the board of directors. The new NAV per share was determined in accordance with our valuation policy in effect prior to the Restructuring and utilizing guidelines established by the Investment Program Association Practice Guideline 2013-01 — “Valuation of Publicly Registered, Non-Listed REITs” issued on April 29, 2013.
We are offering the shares related to our Follow-On Offering (“Follow-On Offering Shares”) at the “transaction price,” plus applicable upfront selling commissions and dealer manager fees. The “transaction price” generally will be equal to the most recently determined NAV per share as of the end of the prior month. We began determining an NAV per share on a monthly basis as of the end of January 2018. However, we may offer shares at a price that we believe reflects the NAV per share of such stock more appropriately than the prior month’s NAV per share, including by updating a previously disclosed transaction price, in cases where we believe there has been a material change (positive or negative) to our NAV per share since the end of the prior month. Subsequent to December 31, 2019, we have determined NAVs per share as of January 31, 2020 and February 29, 2020 of $10.29 per share and $10.24 per share, respectively. These NAVs per share as of January 31, 2020 and February 29, 2020 were determined in accordance with our valuation policy adopted in connection with the Restructuring and utilizing guidelines established by the Investment Program Association Practice Guideline 2013-01 — “Valuation of Publicly Registered, Non-Listed REITs” issued on April 29, 2013. See Item 7. “Management’s Discussion and Analysis of Financial Condition and Results of Operations — NAV History” for additional information regarding changes in our NAV.
For additional information regarding the valuation methodologies and assumptions used to determine our NAV as of January 31, 2020 and February 29, 2020, please refer to our Current Reports on Form 8-K filed on January 16, 2020 and February 13, 2020, respectively, with the SEC. The below information describes the valuation methodologies, assumptions and limitations used in determining our most recent NAV as of February 29, 2020. We cannot assure you that this NAV per share, or the method used to establish it, complies with the ERISA or IRS requirements.
Our board of directors has appointed a valuation committee comprised of independent directors, which we refer to herein as the valuation committee, to be responsible for the oversight of the valuation process. The valuation committee has adopted a valuation policy, as approved by our board of directors, and as amended from time to time, that contains a comprehensive set of methodologies to be used in connection with the calculation of our NAV. Our most recent NAV per share for each share class, which is updated as of the last calendar day of each month, is posted on our website at www.hinessecurities.com/current-offerings/hgit and is also available on our toll-free information line at (888) 220-6121. See our Valuation Policy and Procedures incorporated by reference into this Annual Report on Form 10-K for a more detailed description of our valuation procedures, including important disclosure regarding interim real property valuations provided by our Advisor and reviewed by Altus Group U.S., Inc., or Altus. Altus is the independent valuation firm we have engaged to assist in the determination of our NAV per share and to provide us with a conclusion with respect to the reasonableness of our NAV per share for each class of shares of our common stock. All parties engaged by us in the calculation of our NAV, including the Advisor, are subject to the oversight of our valuation committee. Generally, all of our real properties are appraised once each calendar year by third party
appraisal firms in accordance with our valuation guidelines and such appraisals are reviewed by Altus. Altus concluded that the new NAV per share of our common stock as of February 29, 2020 set forth below is reasonable.
The table below sets forth the calculation of our NAV per share of each class of shares of our common stock as of February 29, 2020 and January 31, 2020 (the NAV per share is the same for each class of shares of our common stock):
|
| | | | | | | | | | | | | | | |
| | February 29, 2020 | | January 31, 2020 |
| | Gross Amount | | Per Share | | Gross Amount | | Per Share |
| | (in thousands) | | | (in thousands) | |
| Real estate investments | $ | 1,633,973 |
| | $ | 18.53 |
| | $ | 1,708,475 |
| | $ | 20.21 |
|
| Other assets | 136,653 |
| | 1.55 |
| | 113,861 |
| | 1.35 |
|
| Debt obligations, other liabilities and noncontrolling interests | (867,651 | ) | | (9.84 | ) | | (952,870 | ) | | (11.27 | ) |
| NAV | $ | 902,975 |
| | $ | 10.24 |
| | $ | 869,466 |
| | $ | 10.29 |
|
| Shares outstanding | 88,199 |
| | | | 84,525 |
| | |
The valuations of our real properties as of February 29, 2020 were reviewed by Altus in accordance with our valuation procedures. Certain key assumptions that were used in the discounted cash flow analysis, which were determined by our Advisor and reviewed by Altus, are set forth in the following table based on weighted-averages by property type.
|
| | | | | | | | | | |
| | | Office | | Industrial | | Retail | | Multi-Family (1) | | Weighted-Average Basis |
| Exit capitalization rate | | 5.55% | | 5.83% | | 6.50% | | 5.48% | | 5.78% |
| Discount rate / internal rate of return (“IRR”) | | 6.43% | | 5.84% | | 6.98% | | 6.34% | | 6.40% |
| Average holding period (years) | | 8.7 | | 10.0 | | 10.0 | | 10.0 | | 9.5 |
(1) Includes student-housing properties
A change in the rates used would impact the calculation of the value of our real properties. For example, assuming all other factors remain constant, the changes listed below would result in the following effects on the value of our real properties:
|
| | | | | | | | | | | | |
| Input | | Hypothetical
Change | | Office | | Industrial | | Retail | | Multi-Family | | Weighted-Average Values |
| Exit capitalization rate (weighted-average) | | 0.25% decrease | | 3.35% | | 2.88% | | 2.27% | | 2.55% | | 2.86% |
| | | 0.25% increase | | (3.26)% | | (2.64)% | | (2.10)% | | (3.16)% | | (2.88)% |
| Discount rate (weighted-average) | | 0.25% decrease | | 1.77% | | 1.95% | | 1.85% | | 1.59% | | 1.78% |
| | | 0.25% increase | | (1.73)% | | (1.91)% | | (1.81)% | | (2.24)% | | (1.89)% |
Limitations of NAV Per Share
As with any valuation methodology, the methodology used to determine the NAV per share was based upon a number of assumptions, estimates and judgments that may not be accurate or complete. Further, different parties using different property-specific and general real estate and capital market assumptions, estimates, judgments and standards could derive an estimated NAV per share that could be significantly different from the NAV per share. The NAV per share is not intended to represent the fair value of our assets less liabilities in accordance with U.S. generally accepted accounting principles, and such estimated NAV per share is not a representation, warranty or guarantee that (i) a stockholder would be able to realize the NAV per share if such stockholder attempts to sell his or her shares; (ii) a stockholder would ultimately realize distributions per share equal to the NAV per share upon our liquidation or sale; (iii) shares of our common stock would trade at the NAV per share on a national securities exchange; (iv) a third party would offer the NAV per share in an arm’s-length transaction to purchase all or substantially all of our shares of common stock; or (v) the methodologies used to determine the NAV per share would be acceptable to FINRA. In addition, we can make no claim as to whether the NAV per share will or will not satisfy the applicable annual valuation requirements under ERISA and the Code with respect to employee benefit plans subject to ERISA and other retirement plans or accounts subject to Section 4975 of the Code that are investing in shares of our common stock.
Further, the NAV per share was calculated as of a moment in time, and, although the value of shares of our common stock will fluctuate over time as a result of, among other things, developments related to individual assets, changes in the real estate and capital markets, acquisitions or dispositions of assets, the distribution of proceeds from the sale of real estate to our stockholders and changes in corporate policies such as our distribution level relative to earnings, we do not expect to update the NAV per share more regular than on a monthly basis. As a result, stockholders should not rely on the NAV per share as an accurate measure of the then-current value of shares of our common stock in making a decision to buy or sell shares of our common stock, including whether to invest in the offering, whether to reinvest distributions by participating in our distribution reinvestment plan and whether to request redemption under our share redemption program.
Prior Engagement of Independent Valuation Firms
Altus and/or certain other independent third-party appraisers have provided, and are expected to continue to provide, real estate appraisal, appraisal management and real estate valuation advisory services to us and our affiliates and have received, and are expected to continue to receive, fees in connection with such services. Altus and certain of the independent third-party appraisers and their respective affiliates may from time to time in the future perform other commercial real estate and financial advisory services for us and our affiliates, or in transactions related to the properties that are the subjects of the valuations being performed for us, or otherwise, so long as such other services do not adversely affect the independence of Altus or the applicable appraiser as certified in the applicable appraisal report.
Distributions
With the authorization of the Company’s board of directors, the Company declared distributions monthly from January 2019 through March 31, 2020 at a gross distribution rate of $0.05208 per month, for each share class, less any applicable distribution and stockholder servicing fees. Distributions are made on all classes of the Company’s common stock at the same time. All distributions were paid in cash or reinvested in shares of the Company’s common stock for those participating in the Company’s distribution reinvestment plan and have been paid or issued, respectively, on the first business day following the completion of the month to which they relate. Distributions reinvested pursuant to the Company’s distribution reinvestment plan were reinvested in shares of the same class as the shares on which the distributions were made. Some or all of the cash distributions may be paid from sources other than cash flows from operations.
The table below outlines the net cash distributions declared for each class of shares for the years ended December 31, 2019, 2018 and 2017. The net distributions presented below are representative of the gross distribution rate declared by our board of directors less any applicable ongoing distribution and stockholder servicing fees. See Item 7. “Management’s Discussion and Analysis of Financial Condition and Results of Operations — Distribution History” for additional information regarding our distributions.
|
| | | | | | | | | | | |
| | Year Ended December 31, |
| | 2019 | | 2018 | | 2017 |
| Distributions declared per Class AX share, net | $ | 0.63 |
| | $ | 0.61 |
| | $ | 0.60 |
|
| Distributions declared per Class TX share, net | $ | 0.52 |
| | $ | 0.51 |
| | $ | 0.50 |
|
| Distributions declared per Class IX share, net | $ | 0.60 |
| | $ | 0.59 |
| | $ | 0.39 |
|
| Distributions declared per Class T share, net | $ | 0.52 |
| | $ | 0.51 |
| | $ | — |
|
| Distributions declared per Class S share, net | $ | 0.52 |
| | $ | 0.51 |
| | $ | — |
|
| Distributions declared per Class D share, net | $ | 0.60 |
| | $ | 0.59 |
| | $ | — |
|
| Distributions declared per Class I share, net | $ | 0.63 |
| | $ | 0.61 |
| | $ | — |
|
We have not generated and we may continue to be unable to generate sufficient cash flows from operations to fully fund distributions paid. Therefore, some or all of our distributions have been and may continue to be paid and during the offering phase, are likely to be paid at least partially from other sources, such as proceeds from the sales of assets, proceeds from our debt financings, proceeds from our public offerings, cash advances by our Advisor and/or cash resulting from a waiver or deferral of fees. We have not placed a cap on the amount of distributions that may be paid from any of these sources. For example, we funded 42%, 32% and 56% of total distributions for the years ended December 31, 2019, 2018 and 2017, respectively, with cash flows from other sources such as cash flows from investing activities, which may include proceeds from the sale of real estate and/or cash flows from financing activities, which may include offering proceeds.
Generally, distributions to stockholders are characterized for federal income tax purposes as ordinary income, capital gains, non-taxable return of capital or a combination of the three. Distributions that exceed our current and accumulated earnings and profits (calculated for tax purposes) constitute a return of capital for tax purposes rather than a distribution and reduce the stockholders’ basis in our common shares. To the extent that a distribution exceeds both current and accumulated earnings and profits and the stockholders’ basis in the common shares, it will generally be treated as a capital gain. We annually notify stockholders of the taxability of distributions paid during the preceding year.
For the years ended December 31, 2019 and 2018, respectively, approximately 6% and 22% of the distributions paid were taxable as ordinary income and approximately 94% and 36% were treated as a return of capital for federal income tax purposes. The remaining 42% in 2018 was treated as capital gains. The amount of distributions paid and taxable portion are not indicative or predictive of amounts anticipated in future periods.
Recent Sales of Unregistered Securities
On September 25, 2019, 2,967.359 restricted common shares were granted to each of our independent directors, Messrs. Humberto “Burt” Cabañas, Dougal A. Cameron, and John O. Niemann, Jr. Such restricted shares were granted pursuant to Restricted Share Award Agreements between us and each of our independent directors, as part of the independent directors’ annual compensation for service on our board of directors and without registration under the Securities Act of 1933, as amended (the “Securities Act”), in reliance upon the exemption from registration contained in Section 4(a)(2) of the Securities Act.
Share Redemption Program
Our share redemption program may allow stockholders who have purchased shares from us or received their shares through a non-cash transaction, not in the secondary market, to have their shares redeemed subject to certain limitations and restrictions. Redemptions under our share redemption program will be made on a monthly basis. Subject to the limitations of and restrictions on our share redemption program, and subject to funds being available as described below, shares redeemed under our share redemption program will be redeemed at the transaction price in effect on the date of redemption, which generally will be a price equal to the most recently determined NAV per share applicable to the class of shares being redeemed and most recently disclosed by us in a public filing with the SEC (subject to the 5% holding discount described below).
Under our share redemption program, we may redeem during any calendar month shares whose aggregate value (based on the redemption price per share in effect when the redemption is effected) is 2% of our aggregate NAV as of the last calendar day of the previous month (the “2% Monthly Limitation”) and during any calendar quarter whose aggregate value (based on the redemption price per share in effect when the redemption is effected) is up to 5% of our aggregate NAV as of the last calendar day of the prior calendar quarter (the “5% Quarterly Limitation”). During a given quarter, if in each of the first two months of such quarter the 2% Monthly Limitation is reached and stockholders’ redemptions are reduced pro rata for such months, then in the third and final month of that quarter, the applicable limit for such month will likely be less than 2% of our aggregate NAV as of the last calendar day of the previous month because the redemptions for that month, combined with the redemptions in the previous two months, cannot exceed the 5% Quarterly Limitation.
There is no minimum holding period for shares under our share redemption program and stockholders may request that we redeem their shares at any time. However, shares that have not been outstanding for at least one year will be redeemed at 95% of the transaction price (the “5% holding discount”) that would otherwise apply; provided, that, the period that a share was held prior to being converted into a share of another class pursuant to our charter will count toward the total hold period for such share, as converted. Upon request, we may waive the 5% holding discount in the case of death or disability of a stockholder. The 5% holding discount also will be waived with respect to shares issued pursuant to our distribution reinvestment plan and any shares that we issue as stock dividends.
Unless our board of directors determines otherwise, we intend to fund redemptions pursuant to our share redemption program from any available cash sources at our disposal, including available cash, cash flow from operations, the sale of real estate-related securities and other assets, borrowings or offering proceeds, without any limitation on the amounts we may pay from such sources. If during any consecutive 24-month period, we do not have at least one month in which we fully satisfy 100% of properly submitted redemption requests or accept all properly submitted tenders in a self-tender offer for our shares, we will not make any new investments (excluding short-term cash management investments under 30 days in duration) and we will use all available investable assets to satisfy redemption requests (subject to the limitations under this program) until all outstanding redemption requests, or “Unfulfilled Redemptions,” have been satisfied. For purposes of this policy, investable assets include net proceeds from new subscription agreements, unrestricted cash, working capital, proceeds from marketable securities, proceeds from our distribution reinvestment plan, and net operating cash flows. Notwithstanding this policy, investable assets may be used at any time to fund any of our operating cash needs (as well as to establish reserves to meet such needs), including, without limitation, the following: property operating expenses, taxes and insurance, debt service and repayment or refinancing of debt, debt financing expenses, funding commitments related to real estate, including without limitation, commitments to acquire new real estate investments (provided such commitments were made at least twelve (12) months prior to the end of such 24-consecutive-month period), obligations imposed by law, courts, or arbitration, necessary capital improvements, lease-related expenditures, customary general and administrative expenses, asset management fees and other fees payable to our Advisor as described in the prospectus, or shareholder distributions. Our Advisor also will defer payment of the performance participation allocation until all Unfulfilled Redemptions are satisfied. Furthermore, our board of directors and management will consider additional ways to improve shareholder liquidity through our share redemption program or otherwise. Exceptions to the limitations of this paragraph may be made to complete like-kind exchanges under Section 1031 of the Code necessary to avoid adverse tax consequences, or to take actions necessary to maintain our qualification as a REIT under the Code.
Our board of directors has complete discretion to determine whether all available cash sources at our disposal will be applied to redemptions pursuant to the program, whether such funds are needed for other purposes or whether additional funds from other sources may be used for redemptions pursuant to the program.
If redemption requests, in the business judgment of our board of directors, place an undue burden on our liquidity, adversely affect our operations or risk having an adverse impact on stockholders whose shares are not redeemed, then our board of directors may terminate, suspend or amend the share redemption program at any time without stockholder approval, if it deems such action to be in the best interest of our stockholders. Further, our share redemption program will be terminated in the event that our shares ever become listed on a national securities exchange or in the event a secondary market for our common shares develops. In addition, our board of directors may determine to suspend the share redemption program due to regulatory changes, changes in
law or if our board of directors becomes aware of undisclosed material information that it believes should be publicly disclosed before shares are redeemed. Material modifications, including any reduction to the monthly or quarterly limitations on redemptions, and suspensions of the program will be promptly disclosed to stockholders in a prospectus supplement (or post-effective amendment if required by the Securities Act) or current report on Form 8-K filed with the SEC. Any material modifications will also be disclosed on our website.
Any new transaction price may be higher or lower than the most recently disclosed transaction price. The transaction price is not a representation, warranty or guarantee that (i) a stockholder would be able to realize such per share amount if such stockholder attempts to sell his or her shares; (ii) a stockholder would ultimately realize distributions per share equal to such per share amount upon our liquidation or sale; (iii) shares of our common stock would trade at such per share amount on a national securities exchange; or (iv) a third party would offer such per share amount in an arm’s-length transaction to purchase all or substantially all of our shares of common stock.
Issuer Redemptions of Equity Securities
The following table lists shares we redeemed under our share redemption program during the quarter ended December 31, 2019, including the average price paid per share, which represents all of the share repurchase requests received for the same period.
|
| | | | | | | | | | | | | |
| Period | | Total Number of Shares Redeemed | | Average Price Paid Per Share | | Total Number of Shares Purchased as Part of Publicly Announced Plans of Programs | | Maximum Number of Shares that May Yet be Redeemed Under the Plans or Programs(1) |
| October 1, 2019 to October 31, 2019 | | 123,504 |
| | $ | 10.11 |
| | 123,504 |
| | 1,327,309 |
|
| November 1, 2019 to November 30, 2019 | | 245,255 |
| | $ | 10.11 |
| | 245,255 |
| | 1,282,143 |
|
| December 1, 2019 to December 31, 2019 | | 126,127 |
| | $ | 10.21 |
| | 126,127 |
| | 1,589,461 |
|
| Total | | 494,886 |
| | | | 494,886 |
| | |
| |
| (1) | Amount provided represents the 2% Monthly Limitation which can be further limited by the 5% Quarterly Limitation. See the description of our share redemption program above for a description of the limitations on the number of shares that may be redeemed pursuant to our share redemption program. |
Item 6. Selected Financial Data
The following selected consolidated financial data is qualified by reference to and should be read in conjunction with our consolidated financial statements and Notes thereto and “Item 7. Management’s Discussion and Analysis of Financial Condition and Results of Operations” below.
We owned nineteen properties that were 96% leased as of December 31, 2019 compared to ten properties that were 94% leased as of December 31, 2018 and eight properties that were 97% leased as of December 31, 2017. Because we are currently in the acquisition phase of our life cycle, changes in our results of operations related to our properties are primarily due to the acquisition of properties.
|
| | | | | | | | | | | | | | | | | | | |
| | 2019 | | 2018 | | 2017 | | 2016 | | 2015 |
| | (in thousands, except per share amounts) |
| Operating Data: | | | | | | | | | |
| Total revenues | $ | 103,883 |
| | $ | 69,069 |
| | $ | 59,724 |
| | $ | 24,349 |
| | $ | 9,410 |
|
| Total expenses | $ | 106,691 |
| | $ | 70,931 |
| | $ | 67,745 |
| | $ | 32,595 |
| | $ | 13,655 |
|
| Gain on sale of real estate | $ | — |
| | $ | 14,491 |
| | $ | — |
| | $ | — |
| | $ | — |
|
| Interest expense | $ | 18,608 |
| | $ | 12,649 |
| | $ | 9,453 |
| | $ | 3,154 |
| | $ | 1,345 |
|
| Net income (loss) | $ | (19,548 | ) | | $ | (879 | ) | | $ | (17,186 | ) | | $ | (11,341 | ) | | $ | (5,638 | ) |
| Net (income) loss attributable to noncontrolling interests | $ | (13 | ) | | $ | (13 | ) | | $ | (12 | ) | | $ | (12 | ) | | $ | (12 | ) |
| Net income (loss) attributable to common stockholders | $ | (19,561 | ) | | $ | (892 | ) | | $ | (17,198 | ) | | $ | (11,353 | ) | | $ | (5,650 | ) |
| Basic and diluted income (loss) per common share | $ | (0.31 | ) | | $ | (0.02 | ) | | $ | (0.48 | ) | | $ | (0.62 | ) | | $ | (1.06 | ) |
| Cash distributions declared per Class AX share, net | $ | 0.63 |
| | $ | 0.61 |
| | $ | 0.60 |
| | $ | 0.58 |
| | $ | 0.57 |
|
| Cash distributions declared per Class TX share, net | $ | 0.52 |
| | $ | 0.51 |
| | $ | 0.50 |
| | $ | 0.49 |
| | $ | 0.17 |
|
| Cash distributions declared per Class IX share, net | $ | 0.60 |
| | $ | 0.59 |
| | $ | 0.39 |
| | $ | — |
| | $ | — |
|
| Cash distributions declared per Class T share, net | $ | 0.52 |
| | $ | 0.51 |
| | $ | — |
| | $ | — |
| | $ | — |
|
| Cash distributions declared per Class S share, net | $ | 0.52 |
| | $ | 0.51 |
| | $ | — |
| | $ | — |
| | $ | — |
|
| Cash distributions declared per Class D share, net | $ | 0.60 |
| | $ | 0.59 |
| | $ | — |
| | $ | — |
| | $ | — |
|
| Cash distributions declared per Class I share, net | $ | 0.63 |
| | $ | 0.61 |
| | $ | — |
| | $ | — |
| | $ | — |
|
| Weighted average common shares outstanding - basic and diluted | 63,039 |
| | 40,468 |
| | 35,808 |
| | 18,191 |
| | 5,308 |
|
| | | | | | | | | | |
| Balance Sheet Data: | | | | | | | | | |
| Total investment property | $ | 1,254,304 |
| (2) | $ | 787,189 |
| | $ | 572,833 |
| | $ | 283,875 |
| | $ | 72,426 |
|
| Cash and cash equivalents | $ | 45,875 |
| | $ | 27,138 |
| | $ | 18,170 |
| | $ | 98,137 |
| | $ | 17,224 |
|
| Total assets | $ | 1,573,545 |
| | $ | 948,829 |
| | $ | 709,017 |
| | $ | 470,345 |
| | $ | 149,054 |
|
Long-term obligations (1) | $ | 782,373 |
| (2) | $ | 504,772 |
| | $ | 379,629 |
| | $ | 258,451 |
| | $ | 59,700 |
|
| |
| (1) | Includes notes payable, inclusive of our credit facility with JPMorgan, organization and offering costs reimbursable to our Advisor, and the distribution and stockholder servicing fees payable to our Dealer Manager with respect to certain share classes, some of which may be coming due within the next twelve months. |
| |
| (2) | Excludes amounts relating to the Domain Apartments, which have been classified as assets held for sale and liabilities associated with assets held for sale on the consolidated balance sheet. The Domain Apartments were sold in January 2020. |
Item 7. Management’s Discussion and Analysis of Financial Condition and Results of Operations
You should read the following discussion and analysis together with our consolidated financial statements and notes thereto included in this Annual Report on Form 10-K. The following information contains forward-looking statements, which are subject to risks and uncertainties. Should one or more of these risks or uncertainties materialize, actual results may differ materially from those expressed or implied by the forward-looking statements. Please see “Special Note Regarding Forward-Looking Statements” above for a description of these risks and uncertainties.
This section of this Form 10-K generally discusses 2019 and 2018 items and year-to-year comparisons between 2019 and 2018. Discussions of 2017 items and year-to-year comparisons between 2018 and 2017 that are not included in this Form 10-K can be found in “Management’s Discussion and Analysis of Financial Results of Operations” in Part II, Item 7 of the Company’s Annual Report on Form 10-K for the fiscal year ended December 31, 2018.
Executive Summary
Hines Global Income Trust, Inc. (“Hines Global”) is a Maryland corporation formed to invest in a diversified portfolio of quality commercial real estate properties and other real estate investments located throughout the United States and internationally. Hines Global is sponsored by Hines Interests Limited Partnership (“Hines”), a fully integrated global real estate investment and management firm that has acquired, developed, owned, operated and sold real estate for over 60 years.
We raise capital for our investments through public offerings of our common stock. We commenced our initial public offering of up to $2.5 billion in shares of our common stock (the “Initial Offering”) in August 2014 and commenced our second public offering of up to $2.5 billion in shares of common stock including $500,000,000 of shares offered under our distribution reinvestment plan (the “Follow-on Offering”) in December 2017. Our Follow-on Offering reflects a restructuring (the “Restructuring”) that our board of directors believes is in the best interests of our stockholders.
As of March 30, 2020, we had received aggregate gross offering proceeds of $985.7 million from the sale of 97.6 million shares through our public offerings, including shares issued pursuant to our distribution reinvestment plan.
We intend to continue to meet our primary investment objectives by investing in a portfolio of quality commercial real estate properties and other real estate investments that relate to properties that are generally diversified by property type, geographic area, lease expirations and tenant industries. We acquired nine properties during the year ended December 31, 2019 for a total net purchase price of $566.4 million, using proceeds from our public offerings and debt financing. As of December 31, 2019, we owned interests in nineteen real estate investments consisting of 9.4 million square feet of leasable space that were 96% leased. See “Item 2. Properties” for additional information regarding our real estate investments.
NAV History
We began determining a net asset value (“NAV”) per share on a monthly basis in January 2018. Since that time, our NAV per share has increased from $9.78 as of January 31, 2018 to $10.24 as of February 29, 2020 as illustrated in the chart below. Set forth below is additional historical information regarding our NAV per share since February 29, 2016 (the date as of which our board of directors first determined an NAV per share).
| |
| 1. | Please see Item 5 — Market for Registrant’s Common Equity, Related Stockholder Matters and Issuer Purchases of Equity Securities as well as our Current Reports on Form 8-K for additional information concerning the methodology used to determine, and the limitations of, the NAV per share. |
| |
| 2. | Our board of directors determined an NAV per share of $9.03 as of February 29, 2016. Prior to that time, $8.92 was considered to be the “net investment value” of our shares, which was equal to the offering price per share of $10.00 in effect at that time, as arbitrarily determined by our board of directors, net of the applicable selling commissions, dealer manager fees and issuer costs. |
Distribution History
As described elsewhere in this Annual Report on Form 10-K, we declare distributions monthly with the authorization of our board of directors. Set forth below is information regarding our historical gross annualized distribution rates, excluding any applicable distribution and stockholder servicing fees, since October 1, 2014 (the date our board first authorized distributions to be declared).
| |
| 1. | With the authorization of our board of directors, we declared distributions as of daily record dates and paid them on a monthly basis through December 31, 2017. Beginning in January 2018, we began declaring, and intend to continue to declare, distributions as of monthly record dates and pay them on a monthly basis. |
| |
| 2. | We have not generated and we may continue to be unable to generate sufficient cash flows from operations to fully fund distributions. Therefore, some or all of our distributions have been and may continue to be paid, and during the offering phase, are likely to be paid at least partially from other sources, such as proceeds from the sales of assets, proceeds from our debt financings, proceeds from our public offerings, cash advances by our Advisor and/or cash resulting from a waiver or deferral of fees. See “— Financial Condition, Liquidity and Capital Resources” for additional information concerning our distributions. |
Performance Summary of Share Classes
The tables presented below disclose the total returns for each of our share classes. The total returns shown reflect the percent change in the NAV per share from the beginning of the applicable period, plus the amount of any distribution per share declared during the period. The total returns shown are calculated assuming reinvestment of distributions pursuant to our distribution reinvestment plan, are derived from unaudited financial information, and are net of all Hines Global expenses, including general and administrative expenses, transaction-related expenses, management fees, the performance participation allocation, and share class specific fees, but exclude the impact of early redemption deductions on the redemption of shares that have been outstanding for less than one year. The returns have been prepared using unaudited data and valuations of the underlying investments in our portfolio, which are estimates of fair value and form the basis for our NAV per share. Valuations based upon unaudited reports from the underlying investments may be subject to later adjustments, may not correspond to realized value and may not accurately reflect the price at which assets could be liquidated.
The table below discloses the total returns for the classes of shares that are available for investment in the Follow-On Offering:
|
| | | | | | |
| As of February 29, 2020 | | | | |
Shares Class (1) | | 1-Year | | ITD |
Class I Shares (2) | | 7.70 | % | | 9.48 | % |
Class D Shares (2) | | 7.43 | % | | 9.19 | % |
Class S Shares (No Sales Load) (3) | | 6.63 | % | | 8.35 | % |
Class S Shares (With Sales Load) (4) | | 2.90 | % | | 6.51 | % |
Class T Shares (No Sales Load) (3) | | 6.63 | % | | 8.35 | % |
Class T Shares (With Sales Load) (4) | | 2.90 | % | | 6.51 | % |
| |
| (1) | The inception date for Class I, Class D, Class S and Class T Shares is December 6, 2017. |
| |
| (2) | Class I Shares and Class D Shares are sold without an upfront sales load. |
| |
| (3) | Class S Shares and Class T Shares listed as (No Sales Load) exclude up-front selling commissions and dealer manager fees. |
| |
| (4) | Class S Shares and Class T Shares listed as (With Sales Load) reflect the returns after the maximum up-front selling commission and dealer manager fees, which total 3.5% for both share classes. |
The table below discloses the total returns for the classes of shares that were sold in the Initial Offering, but are no longer available for investment in the Follow-On Offering:
|
| | | | | | | | | |
| As of February 29, 2020 | | | | | | |
Shares Class (1) | | 1-Year | | 3-Year | | ITD |
| Class AX Shares (No Sales Load) | | 7.70 | % | | 10.93 | % | | 9.09 | % |
| Class AX Shares (With Sales Load) | | N/A |
| | 7.37 | % | | 6.81 | % |
| Class TX Shares (No Sales Load) | | 6.63 | % | | 9.83 | % | | 8.83 | % |
| Class TX Shares (With Sales Load) | | N/A |
| | 8.33 | % | | 7.42 | % |
| Class IX Shares (No Sales Load) | | 7.43 | % | | N/A |
| | 8.36 | % |
| Class IX Shares (With Sales Load) | | N/A |
| | N/A |
| | 8.05 | % |
| |
| (1) | The inception date for Class AX Shares, Class TX Shares, and Class IX Shares are October 1, 2014, September 1, 2015, and May 1, 2017, respectively. |
Critical Accounting Policies
Our discussion and analysis of financial condition and results of operations is based on our consolidated financial statements, which have been prepared in accordance with GAAP. The preparation of the consolidated financial statements requires us to make estimates and judgments that affect the reported amounts of assets, liabilities and contingencies as of the date of the financial statements and the reported amounts of revenues and expenses during the reporting periods. We evaluate our assumptions and estimates on an ongoing basis. We base our estimates on historical experience and on various other assumptions that we believe to be reasonable under the circumstances. Additionally, application of our accounting policies involves exercising judgments regarding assumptions as to future uncertainties. Actual results may differ from these estimates under different assumptions or conditions. The following is a discussion of our critical accounting policies. For a discussion of all of our significant accounting policies, see Note 2 — Summary of Significant Accounting Policies, to the accompanying consolidated financial statements.
Investment Property and Lease Intangibles
When we acquire a property, we allocate the purchase price of the acquisition based upon our assessment of the fair value of various components, including to land, building and improvements, and intangible lease assets and liabilities. Fair value determinations are subjective based on estimated cash flow projections that utilize discount and/or capitalization rates, as well as certain available market information, which may include comparable land sales, market-based rental revenues, and the replacement cost of the building, in addition to other factors. The fair value of building and improvements considers the value of the property as if it were vacant. The fair value of intangible lease assets is based on our evaluation of the specific characteristics of each lease. Factors considered include estimates of carrying costs during hypothetical expected lease-up periods, current market conditions and market rates, the customer’s credit quality and costs to execute similar leases. The fair value of out-of-market leases is calculated as the present value (using a discount rate that reflects the risks associated with the leases) of the difference between the contractual amounts to be paid pursuant to each in-place lease and our estimate of fair market lease rates for each corresponding in-place lease. In estimating carrying costs, we include estimates of lost rentals at market rates during the expected lease-up periods, depending on local market conditions. In estimating costs to execute similar leases, we consider customer improvements, leasing commissions and legal and other related expenses.
Real estate assets are reviewed for impairment each reporting period if events or changes in circumstances indicate that the carrying amount of the individual property may not be recoverable. In such an event, a comparison will be made of the current and projected operating cash flows and expected proceeds from the eventual disposition of each property on an undiscounted basis to the carrying amount of such property. If the carrying amount exceeds the undiscounted cash flows, it would be written down to the estimated fair value to reflect impairment in the value of the asset. The determination of whether investment property is impaired requires a significant amount of judgment by management and is based on the best information available to management at the time of the evaluation. No impairment charges have been recorded for any period through December 31, 2019.
Deferred Leasing Costs
Direct leasing costs, primarily consisting of third-party leasing commissions and tenant inducements, are capitalized and amortized over the life of the related lease. Tenant inducement amortization is recorded as an offset to rental revenue and the amortization of other direct leasing costs is recorded in amortization expense. We consider a number of different factors to evaluate whether we or the lessee is the owner of the tenant improvements for accounting purposes. These factors include: (i) whether the lease stipulates how and on what a tenant improvement allowance may be spent; (ii) whether the tenant or landlord retains legal title to the improvements; (iii) the uniqueness of the improvements; (iv) the expected economic life of the tenant improvements relative to the term of the lease; and (v) who constructs or directs the construction of the improvements. The determination of who owns the tenant improvements for accounting purposes is subject to significant judgment. In making that determination, we consider all of the above factors. No one factor, however, necessarily establishes any determination.
Revenue Recognition and Valuation of Receivables
We are required to recognize minimum rent revenues on a straight-line basis over the terms of tenant leases, including rent holidays and bargain renewal options, if any. Revenues associated with tenant reimbursements are recognized in the period in which the expenses are incurred based upon the tenant’s lease provision. Leases are not uniform in dealing with such cost reimbursements and there are many variations in the computation. We make quarterly accrual adjustments, positive or negative, to tenant reimbursement revenue to adjust the recorded amounts to our best estimate of the final amounts to be billed and collected with respect to the cost reimbursements. Revenues relating to lease termination fees are recognized on a straight-line basis amortized from the time that a tenant’s right to occupy the leased space is modified through the end of the revised
lease term and are included in other revenue in the accompanying consolidated statements of operations. To the extent our leases provide for rental increases at specified intervals, we will record a receivable for rent not yet due under the lease terms. Accordingly, our management must determine, in its judgment, to what extent the unbilled rent receivable applicable to each specific tenant is collectible. Revenue from leases where collection is deemed to be less than probable is recorded on a cash basis until collectability is determined to be probable. Further, we assess whether operating lease receivables, at a portfolio level, are appropriately valued based upon an analysis of balances outstanding, historical bad debt levels and current economic trends. The uncollectible portion of the portfolio is recorded as an adjustment to rental revenues. Prior to the adoption of ASU 2016-02, an allowance for the uncollectible portion of tenant and other receivables was determined and recognized based upon an analysis of the tenant’s payment history, the financial condition of the tenant, business conditions in the industry in which the tenant operates and economic conditions in the area in which the property is located.
Recent Accounting Pronouncements
See Note 2 — Summary of Significant Accounting Policies for a discussion regarding recent accounting pronouncements and the potential impact, if any, on our financial statements.
Financial Condition, Liquidity and Capital Resources
Our principal demands for funds are to make real estate investments, including investments in real estate-related securities and capital expenditures, for the payment of operating expenses and distributions, and for the payment of principal and interest on any indebtedness we incur. Generally, we expect to meet operating cash needs from our cash flows from operating activities, and we expect to fund our investments using proceeds from our public offerings, debt proceeds and proceeds from the sales of real estate investments.
As of December 31, 2019, our portfolio was approximately 50% leveraged (based on the most recent valuations of our real estate investments) with a weighted average interest rate of 2.54%. We expect that once we have fully invested the proceeds of our public offerings and other potential subsequent offerings, our debt financing, including our pro rata share of the debt financing of entities in which we invest, will be in the range of approximately 40% to 60% of the aggregate value of our real estate investments and other assets. Financing for acquisitions and investments may be obtained at the time an asset is acquired or an investment is made or at such later time as determined to be appropriate. In addition, debt financing may be used from time to time for property improvements, lease inducements, tenant improvements, purchase of real estate-related securities and other working capital needs, including the payment of distributions and redemptions. Our real estate-related securities portfolio may have embedded leverage, including through the use of reverse repurchase agreements and derivatives, including, but not limited to, total return swaps, securities lending arrangements and credit default swaps. Additionally, the amount of debt placed on an individual property or related to a particular investment, including our pro rata share of the amount of debt incurred by an individual entity in which we invest, may be less than 40% or more than 60% of the value of such property/investment or the value of the assets owned by such entity, depending on market conditions and other factors. Our aggregate borrowings, secured and unsecured, must be reasonable in relation to our net assets and must be reviewed by our board of directors at least quarterly. Further, our charter limits our borrowing to 300% of our net assets (which approximates 75% of the cost of our assets) unless any excess borrowing is approved by a majority of our independent directors and is disclosed to our stockholders in our next quarterly report along with justification for the excess.
Notwithstanding the above, depending on market conditions and other factors, we may choose not to place debt on our portfolio or our assets and may choose not to borrow to finance our operations or to acquire properties. Any indebtedness we do incur will likely be subject to continuing covenants, and we will likely be required to make continuing representations and warranties about our company in connection with such debt. Moreover, some or all of our debt may be secured by some or all of our assets. If we default in the payment of interest or principal on any such debt, breach any representation or warranty in connection with any borrowing or violate any covenant in any loan document, our lender may accelerate the maturity of such debt requiring us to immediately repay all outstanding principal. If we are unable to make such payment, our lender could foreclose on our assets that are pledged as collateral to such lender. The lender could also sue us or force us into bankruptcy. Any such event would have a material adverse effect on the value of an investment in our common shares. See Note 5 — Debt Financing for a discussion of our outstanding debt arrangement.
The discussions below provide additional details regarding our cash flows.
Cash Flows from Operating Activities
Our real estate properties generate cash flow in the form of rental revenues, which are used to pay direct leasing costs, property-level operating expenses and interest payments. Additionally, we incur corporate level costs and expenses such as
general and administrative expenses, acquisition expenses and acquisition fees (for periods prior to January 2018), asset management fees, and the performance participation allocation.
Net cash provided by operating activities for the years ended December 31, 2019 and 2018 was $17.4 million and $19.2 million, respectively. Generally, net cash provided by operating activities increased as a result of our acquisitions of nine properties during the year ended December 31, 2019 and the operations of our 2018 acquisitions for the year ended December 31, 2019. However, the increase in net cash provided by operating activities was offset by the payment of the $6.0 million performance participation allocation related to 2018, which was paid to the Advisor in 2019. Additionally, we experienced an increase in costs associated with leasing activities, including tenant inducement payouts, during the year ended December 31, 2019 as compared to the same period in the prior year.
Cash Flows from Investing Activities
Net cash used in investing activities for the years ended December 31, 2019 and 2018 were primarily due to the following:
2019
| |
| • | Payments of $621.0 million primarily related to the acquisitions of nine real estate investments during the year ended December 31, 2019. |
| |
| • | Capital expenditures of approximately $8.5 million at our real estate properties. |
| |
| • | Payments of $45.2 million to purchase real estate-related securities. We also received proceeds of $20.6 million from the sale of real estate-related securities. |
2018
| |
| • | Payments of $206.8 million primarily related to the acquisition of Venue Museum District and Fresh Park Venlo. |
| |
| • | Capital expenditures of approximately $15.0 million primarily related to development work at Bishop’s Square, which was completed in July 2019, and various capital improvements at our other properties. |
| |
| • | Proceeds of $37.1 million from the sale of 2819 Loker Avenue East, a Class–A industrial property located in Carlsbad, California, on March 30, 2018. We sold 2819 Loker Avenue East for a contract sales price of $38.3 million, and we acquired 2819 Loker Avenue East in December 2014 for a net purchase price of $25.4 million. |
| |
| • | Payments of $11.3 million to purchase real estate-related securities. We also received proceeds of $1.3 million from the sales of real estate-related securities. |
Cash Flows from Financing Activities
Public Offerings
We commenced the Initial Offering in August 2014 and terminated our offering in December 2017, except for shares issued pursuant to our distribution reinvestment plan. We commenced our Follow-on Offering in December 2017, but did not begin raising proceeds related to the Follow-on Offering until 2018. We received gross proceeds of $392.9 million, $44.3 million and $138.2 million, respectively, during the years ended December 31, 2019, 2018 and 2017, respectively, through our public offerings, excluding proceeds from our distribution reinvestment plan. Please see Executive Summary for additional information regarding our public offerings.
During the year ended December 31, 2019 and 2018, we redeemed $15.5 million and $12.5 million, respectively, in shares of common stock pursuant to our share redemption program. Prior to the commencement of our Follow-on Offering, in October 2017, we commenced a self-tender offer for up to $200.0 million in IPO Shares at a price of $9.69 per share. We redeemed a total of 1.9 million IPO Shares for an aggregate cost of $18.7 million in November 2017 in connection with our self-tender offer. In addition, during the year ended December 31, 2017, we redeemed $1.6 million in shares of common stock pursuant to our share redemption programs in effect prior to the Restructuring.
In addition to the investing activities described previously, we use proceeds from our public offerings to make certain payments to our Advisor, our Dealer Manager and Hines and its affiliates during the various phases of our organization and operation which include, without limitation, payments to our Dealer Manager for selling commissions, dealer manager fees, distribution and stockholder servicing fees and payments to our Advisor for reimbursement of organization and offering costs. During the years ended December 31, 2019, 2018 and 2017, we made payments of $12.4 million, $3.3 million and $7.2 million, respectively, for selling commissions, dealer manager fees and distribution and stockholder servicing fees related to
our public offerings. Selling commissions, dealer manager fees and distribution and stockholder servicing fees vary for each share class as described more fully in Note 8 — Related Party Transactions. The increase in selling commissions, dealer manager fees and distribution and stockholder servicing fees for the year ended December 31, 2019 as compared to the year ended December 31, 2018 is due to the increase in capital raised since our restructuring and related modifications in our Follow-on Offering, which commenced in December 2017. The decrease in the payment of these fees and commissions during the year ended December 31, 2018 as compared to the year ended December 31, 2017 is primarily a result of a reduction in gross offering proceeds raised.
Through December 5, 2017, we also used proceeds from the Initial Offering to make payments to our Advisor for the reimbursement of organization and offering costs that were deemed issuer costs. During the year ended December 31, 2017, we made payments of $3.8 million for organization and offering costs. Beginning December 6, 2017, the Advisor agreed to advance all of our unpaid organization and offering costs, consisting of issuer costs and certain underwriting costs (but excluding selling commissions, dealer manager fees and distribution and stockholder servicing fees) related to our public offerings, through December 31, 2018. In January 2019, we began reimbursing the Advisor in ratable amounts over 60 months for all such advanced expenses, as well as any organization and offering costs incurred subsequent to December 31, 2018, to the extent cumulative organization and offering costs paid by us do not exceed an amount equal to 2.5% of gross offering proceeds from our public offerings. The total reimbursement related to organization and offering costs, selling commissions, dealer manager fees and distribution and stockholder servicing fees may not exceed 15.0% of gross proceeds from our public offerings. During the year ended December 31, 2019, we reimbursed the Advisor $5.7 million for organization and offering costs.
Distributions
With the authorization of our board of directors, we declared distributions as of daily record dates and paid them on a monthly basis through December 31, 2017. Beginning in January 2018, we have and intend to continue to declare distributions as of monthly record dates and pay them on a monthly basis. With the authorization of our board of directors, we declared distributions monthly from January 2019 through March 31, 2020 at a gross distribution rate of $0.05208 per month, for each share class, less any applicable distribution and stockholder servicing fees. Distributions are made on all classes of the Company’s common stock at the same time. All distributions were or will be paid in cash or reinvested in shares of the Company’s common stock for those participating in the Company’s distribution reinvestment plan and have been or will be paid or issued, respectively, on the first business day following the completion of the month to which they relate. Distributions reinvested pursuant to our distribution reinvestment plan were or will be reinvested in shares of the same class as the shares on which the distributions are made. Some or all of the cash distributions may be paid from sources other than cash flows from operations, as described below.
Distributions paid to stockholders during the years ended December 31, 2019, 2018, and 2017 were $33.7 million, $22.5 million and $19.1 million, respectively, including those reinvested in shares of our common stock pursuant to our distribution reinvestment plan. We have not generated and we may continue to be unable to generate sufficient cash flows from operations to fully fund distributions paid. Therefore, some or all of our distributions have been and may continue to be paid and during the offering phase, are likely to be paid at least partially from other sources, such as proceeds from the sales of assets, proceeds from our debt financings, proceeds from our public offerings, cash advances by our Advisor and/or cash resulting from a waiver or deferral of fees. We have not placed a cap on the amount of distributions that may be paid from any of these sources. For example, we funded 42%, 32% and 56% of total distributions for the years ended December 31, 2019, 2018 and 2017, respectively, with cash flows from other sources such as cash flows from investing activities, which may include proceeds from the sale of real estate and/or cash flows from financing activities, which may include offering proceeds. As described previously, we paid acquisition fees and acquisition-related expenses of $11.5 million during the year ended December 31, 2017. Acquisition fees and acquisition-related expenses were expensed prior to our adoption of ASU 2017-01 on January 1, 2018 and therefore reduced cash flows from operating activities for that period. However, we funded such acquisition fees and acquisition-related expenses with proceeds from our public offerings and/or acquisition-related indebtedness.
The following table outlines our total distributions declared to stockholders for the years ended December 31, 2019, 2018 and 2017, including the breakout between the distributions declared in cash and those reinvested pursuant to our distribution reinvestment plan (in thousands).
|
| | | | | | | | | | | | | | | | | | | |
| | | Stockholders | | Sources |
| Distributions for the Years Ended | | Cash Distributions | | Distributions Reinvested | | Total Declared | | Cash Flows From Operating Activities |
| December 31, 2019 | | $ | 16,112 |
| | $ | 19,446 |
| | $ | 35,558 |
| | $ | 20,798 |
| | 58 | % |
| December 31, 2018 | | $ | 10,480 |
| | $ | 12,146 |
| | $ | 22,626 |
| | $ | 15,484 |
| | 68 | % |
| December 31, 2017 | | $ | 9,226 |
| | $ | 10,547 |
| | $ | 19,773 |
| | $ | 8,662 |
| | 44 | % |
Debt Financings
As mentioned previously, our portfolio was 50% leveraged as of December 31, 2019 (based on the most recent valuations of our real estate investments) with a weighted average interest rate of 2.54%. Below is additional information regarding our loan activity for the years ended December 31, 2019, 2018 and 2017. See Note 5 — Debt Financing for additional information regarding our outstanding debt.
2019
| |
| • | We received proceeds of $327.1 million in permanent mortgage financing as well as draws on our revolving credit facility with JPMorgan. Use of these proceeds was primarily to provide cash for the acquisitions of real estate investments during the year ended December 31, 2019. We made draws of approximately $131.5 million and payments of approximately $27.5 million on the Revolving Credit Facility with JPMorgan during the year ended December 31, 2019, resulting in an outstanding balance of $104.0 million as of December 31, 2019. |
| |
| • | We made payments of $3.7 million in financing costs primarily related to our mortgage loans. |
| |
| • | We made payments of principal totaling $31.0 million on the Revolving Credit Facility with JPMorgan as well as permanent mortgage financing relating to our real estate investments. |
| |
| • | We borrowed $134.0 million under the Hines Credit Facility primarily to provide cash for the acquisitions of real estate investments during the year ended December 31, 2019, and made payments of $114.0 million on this facility. We had an outstanding balance of $75.0 million under this facility as of December 31, 2019. |
2018
| |
| • | We entered into $131.3 million of permanent mortgage financing related to the acquisitions of Venue Museum District and Fresh Park Venlo. |
| |
| • | We made payments of $1.7 million in financing costs primarily related to the mortgage loans at Venue Museum District and Fresh Park Venlo. |
| |
| • | We made payments of principal of $1.7 million on the permanent mortgage financing related to Cottonwood Corporate Center. |
| |
| • | We borrowed $90.5 million under the Hines Credit Facility primarily to provide cash for the acquisitions of Venue Museum District and Fresh Park Venlo and made payments of $46.7 million on this facility. We had an outstanding balance of $55.0 million under this facility as of December 31, 2018. |
Results of Operations
Year ended December 31, 2019 compared to the year ended December 31, 2018
The table below includes information regarding changes in our results of operations for the year ended December 31, 2019 compared to the year ended December 31, 2018, including explanations for significant changes and any significant or unusual activity. As described more completely below, most amounts increased in 2019 compared to 2018 as a result of significant additional capital raised and invested in real estate. All amounts are in thousands, except for percentages:
|
| | | | | | | | | | | | | | |
| | Year Ended December 31, | | Change |
| | 2019 | | 2018 | | $ | | % |
| Revenues: | | | | | | | |
| Rental revenue | $ | 101,762 |
| | $ | 68,006 |
| | $ | 33,756 |
| | 50 | % |
| Other revenue | 2,121 |
| | 1,063 |
| | 1,058 |
| | 100 | % |
| Total revenues | 103,883 |
| | 69,069 |
| | 34,814 |
| | 50 | % |
| Expenses: | | | | |
|
| | |
| Property operating expenses | 25,198 |
| | 13,774 |
| | 11,424 |
| | 83 | % |
| Real property taxes | 11,753 |
| | 8,601 |
| | 3,152 |
| | 37 | % |
| Property management fees | 4,036 |
| | 1,845 |
| | 2,191 |
| | 119 | % |
| Depreciation and amortization | 46,193 |
| | 32,478 |
| | 13,715 |
| | 42 | % |
| Acquisition related expenses | 161 |
| | 144 |
| | 17 |
| | 12 | % |
| Asset management and acquisition fees | 7,985 |
| | 5,004 |
| | 2,981 |
| | 60 | % |
| Performance participation allocation | 7,713 |
| | 5,954 |
| | 1,759 |
| | 30 | % |
| General and administrative expenses | 3,652 |
| | 3,131 |
| | 521 |
| | 17 | % |
| Total expenses | 106,691 |
| | 70,931 |
| | 35,760 |
| | 50 | % |
| Other income (expenses): | | | | |
|
| | |
| Gain (loss) on derivative instruments | (2,292 | ) | | (272 | ) | | (2,020 | ) | | 743 | % |
| Gain (loss) on investments in real estate-related securities | 2,317 |
| | (401 | ) | | 2,718 |
| | 678 | % |
| Gain on sale of real estate | — |
| | 14,491 |
| | (14,491 | ) | | N/A* |
|
| Foreign currency gains (losses) | (617 | ) | | (438 | ) | | (179 | ) | | 41 | % |
| Interest expense | (18,608 | ) | | (12,649 | ) | | (5,959 | ) | | (47 | )% |
| Interest and other income | 1,480 |
| | 261 |
| | 1,219 |
| | 467 | % |
| Income (loss) before benefit (provision) for income taxes | (20,528 | ) | | (870 | ) | | (19,658 | ) | | N/A* |
|
| Benefit (provision) for income taxes | 980 |
| | (9 | ) | | 989 |
| | N/A* |
|
| Net income (loss) | (19,548 | ) | | (879 | ) | | (18,669 | ) | | N/A* |
|
* Not a meaningful percentage
Total revenues: The increase in total revenue is primarily due to the additional real estate investments acquired during 2019. We acquired nine real estate investments during 2019 and had a portfolio of nineteen real estate investments as of December 31, 2019 that contained 9.4 million leasable square feet, of which 96% was leased. We also acquired 3 real estate investments during 2018 which also contributed to the increases in these amounts since the properties were owned for the entire year in 2019. Total revenues decreased $0.4 million related to our same-store properties. Please refer to our “Same Store Analysis” below for additional discussion on the results of operations of our portfolio.
Property operating expenses: The increase in property operating expenses is primarily due to our significant acquisition activity during late 2018 and throughout 2019. Property operating expenses increased $0.7 million related to our same-store properties. Please refer to our “Same Store Analysis” below for additional discussion on the results of operations of our portfolio.
Real property taxes: The increase in real property taxes is primarily due to our significant acquisition activity during late 2018 and throughout 2019. Real property taxes increased $0.3 million related to our same-store properties. Please refer to our “Same Store Analysis” below for additional discussion on the results of operations of our portfolio.
Property management fees: The increase in property management fees is primarily due to our significant acquisition activity during late 2018 and throughout 2019. Property management fees increased $0.1 million related to our same-store properties. Please refer to our “Same Store Analysis” below for additional discussion on the results of operations of our portfolio.
Depreciation and amortization: The increase in depreciation and amortization expense is primarily due to the additional real estate investments acquired during 2018 and 2019, as previously described.
Asset management fees: Asset management fees are charged based on the aggregate valuation of our real estate investments, our NAV. The increase in these fees is primarily due to the additional real estate investments made during 2018 and 2019.
Performance participation allocation: Performance participation allocation increased primarily due to additional capital raised and changes in our NAV per share as well as the increase in our distribution rate per share, which occurred in January 2019. Please see Item 7 — Management’s Discussion and Analysis—NAV and Distribution for additional information concerning the change in NAV per share during the year ended December 31, 2019. General and administrative expenses: General and administrative expenses increased primarily due to increased legal costs and shareholder costs. We generally expect our general and administrative expenses to continue to increase as we continue raising capital from our Follow-On Offering.
Gain (loss) on derivative instruments: We enter into interest rate contracts in order to limit our exposure against the variability of future interest rates on our variable interest rate borrowings as well as foreign currency forward contracts as economic hedges against the variability of foreign exchange rates. During the year ended December 31, 2019, losses were primarily related to the position of our foreign currency forward contracts.
Gain (loss) on investments in real estate-related securities: In the fourth quarter of 2018 and throughout 2019, the Company made its initial investments in real estate-related securities, which consist of common equities, preferred equities and debt investments of publicly traded REITs. These amounts include realized gains (losses) related to securities sold during the year and unrealized gains (losses) based on values determined on a recurring basis. For information about the valuation of our investments in real-estate related securities, see Note 9—Fair Value Measurements in the notes to the accompanying financial statements. Gain on sale of real estate: We acquired 2819 Loker Avenue East in December 2014 for a net purchase price of $25.4 million and we sold 2819 Loker Avenue East for a contract sales price of $38.3 million on March 30, 2018 and we recognized a gain of $14.5 million related to this sale. We had no property dispositions during the year ended December 31, 2019.
Foreign currency gains (losses): Foreign currency gains (losses) primarily reflects the effect of changes in foreign currency exchange rates on transactions that were denominated in currencies other than U.S. dollars. During the year ended December 31, 2019 and 2018, these losses were primarily related to the effect of remeasuring cash held in foreign currencies into U.S. dollars and the changes in exchange rates.
Interest expense: Interest expense increased due to an increase in our principal amount of indebtedness outstanding during the period resulting from additional real estate investments acquired in 2018 and 2019.
Interest and other income: Primarily relates to interest and dividend income associated with our investments in real-estate related securities. We made our initial investment in real estate-related securities in the fourth quarter of 2018 and have continued to invest additional amounts since that time. The increase in interest and dividend income earned during the year ended December 31, 2019 compared to 2018 is due to our continued investing in real estate-related securities throughout 2019.
Benefit (provision) for income taxes: Provision for income taxes changed from a $9,000 provision for the year ended December 31, 2018 to a $1.0 million benefit for the year ended December 31, 2019 as a result of changes in our deferred tax assets and liabilities related to book / tax timing differences at our international subsidiaries.
Same-Store Analysis
We evaluate our consolidated results of operations on a same-store basis, which allows us to analyze our property operating results excluding the effects of acquisitions and dispositions during the periods under comparison. Properties in our portfolio are considered same-store if they were owned for the full periods presented. Same-store properties for the year ended December 31, 2019 includes seven properties that were 98% leased as of December 31, 2019 compared to 97% leased as of December 31, 2018. In total, property revenues in excess of expenses of the same-store properties decreased 4% for the year ended December 31, 2019 as compared to the year ended December 31, 2018.
The following table presents the property-level revenues in excess of expenses for the year ended December 31, 2019, as compared to the year ended December 31, 2018, by reportable segment. Excluding leases in our residential/living segments, most of our leases are net leases, which provide for the recovery of most operating expenses, property taxes and management fees at our properties. As a result, we believe it is beneficial to analyze our same-store results on a net basis, as shown below. All amounts are in thousands, except for percentages: |
| | | | | | | | | | | | | | |
| | Year Ended December 31, | | Change |
| | 2019 | | 2018 | | $ | | % |
Property revenues in excess of expenses(1) | | | | | | | |
| Same-store properties | | | | | | | |
| Domestic office investments | $ | 11,022 |
| | $ | 11,076 |
| | $ | (54 | ) | | — | % |
| Domestic residential/living investments | 3,389 |
| | 3,263 |
| | 126 |
| | 4 | % |
| Domestic retail investments | 11,371 |
| | 12,400 |
| | (1,029 | ) | (2) | (8 | )% |
| Domestic industrial investments | 3,300 |
| | 3,886 |
| | (586 | ) | (3) | (15 | )% |
| International office investments | 6,235 |
| | 5,919 |
| | 316 |
| | 5 | % |
| International residential/living investments | 5,133 |
| | 5,438 |
| | (305 | ) | | (6 | )% |
| Total same-store properties | $ | 40,450 |
| | $ | 41,982 |
| | $ | (1,532 | ) | | (4 | )% |
| Recent acquisitions | 22,446 |
| | 2,383 |
| | 20,063 |
| | 842 | % |
| Disposed properties | — |
| | 484 |
| | (484 | ) | | (100 | )% |
| Total property revenues in excess of expenses | $ | 62,896 |
| | $ | 44,849 |
| | $ | 18,047 |
| | 40 | % |
| |
| (1) | Property revenues in excess of expenses include total revenues less property operating expenses, real property taxes and property management fees. |
| |
| (2) | The decrease is primarily due to a $457,000 decline in rental revenue resulting from the early move-out of two tenants, as well as $370,000 in various increases in property operating expenses as explained above. |
| |
| (3) | The decrease is primarily related to a $619,000 decrease in rental revenues driven by the lease renewal at Goodyear, which commenced during the fourth quarter of 2018 at a lower rental rate than the preceding lease. The base rental rate of the renewed lease is 24.6% lower than the base rental rate of the preceding lease. However, this lease was with a high credit-quality tenant and enabled us to sell the property at a substantial gain in February 2020. |
Funds from Operations
We believe funds from operations (“FFO”) is a meaningful supplemental non-GAAP operating metric. FFO is a non-GAAP financial performance measure defined by the National Association of Real Estate Investment Trusts (“NAREIT”) and is widely recognized by investors and analysts as one measure of operating performance of a real estate company. FFO excludes items such as real estate depreciation and amortization. Depreciation and amortization, as applied in accordance with GAAP, implicitly assumes that the value of real estate assets diminishes predictably over time and also assumes that such assets are adequately maintained and renovated as required in order to maintain their value. Since real estate values have historically risen or fallen with market conditions such as occupancy rates, rental rates, inflation, interest rates, the business cycle, unemployment and consumer spending, it is management’s view, and we believe the view of many industry investors and analysts, that the presentation of operating results for real estate companies using historical cost accounting alone is insufficient. In addition, FFO excludes gains and losses from the sale of real estate and impairment charges related to depreciable real estate assets and in-substance real estate equity investments, which we believe provides management and investors with a helpful additional measure of the historical performance of our real estate portfolio, as it allows for comparisons, year to year, that reflect the impact on operations from trends in items such as occupancy rates, rental rates, operating costs, general and administrative expenses and interest costs. A property will be evaluated for impairment if events or circumstances indicate that the carrying amount may not be recoverable (i.e. the carrying amount exceeds the total estimated undiscounted future cash flows from the property). Undiscounted future cash flows are based on anticipated operating performance, including estimated future net rental and lease revenues, net proceeds on the sale of the property, and certain other ancillary cash flows. While impairment charges are excluded from the calculation of FFO as described above, stockholders are cautioned that we may not recover any impairment charges.
FFO should not be construed to be more relevant or accurate than the current GAAP methodology in calculating net income or in its applicability in evaluating our operating performance. In addition, FFO should not be considered as an alternative to net income (loss) or income (loss) from continuing operations as an indication of our performance or as an alternative to cash flows from operating activities as an indication of our liquidity, but rather should be reviewed in conjunction with these and other GAAP measurements. Further, FFO is not intended to be used as a liquidity measure indicative of cash flow available to fund our cash needs, including our ability to make distributions to our stockholders. Please see the limitations listed below associated with the use of FFO:
| |
| • | Prior to January 1, 2018, FFO included costs related to our acquisitions, including acquisition fees payable to our Advisor. Although these amounts reduced net income for periods prior to January 1, 2018, we generally funded such costs with proceeds from our public offerings and/or acquisition-related indebtedness and did not consider these fees and expenses in the evaluation of our operating performance. In January 2018, we adopted ASU 2017-01 which clarified the definition of a business and added guidance to assist entities with evaluating whether transactions should be accounted for as acquisitions (or disposals) of assets or businesses. We expect that most of our real estate transactions completed after that date will be accounted for using the asset acquisition guidance and, accordingly, the related acquisition-related expenses incurred will be capitalized and included in the allocated purchase price and will not be expensed. Prior to ASU 2017-01, real estate acquisitions were generally considered business combinations and the acquisition-related expenses and acquisition fees were treated as operating expenses under GAAP. Additionally, effective as of December 6, 2017, we no longer pay acquisition fees to our Advisor. |
| |
| • | We utilize the definition of FFO as set forth by NAREIT. Our FFO may not be comparable to amounts calculated by other REITs, if they use different approaches. |
| |
| • | Our business is subject to volatility in the real estate markets and general economic conditions, and adverse changes in those conditions could have a material adverse impact on our business, results of operations and FFO. Accordingly, the predictive nature of FFO is uncertain and past performance may not be indicative of future results. |
Neither the SEC, NAREIT nor any regulatory body has passed judgment on the acceptability of the adjustments that we use to calculate FFO. In the future, the SEC, NAREIT or a regulatory body may decide to standardize the allowable adjustments across the non-listed REIT industry and we would have to adjust our calculation and characterization of FFO.
The following section presents our calculation of FFO attributable to common stockholders and provides additional information related to our operations for the years ended December 31, 2019, 2018 and 2017 and the period from inception through December 31, 2019 (in thousands, except per share amounts). As we are in the capital raising and acquisition phase of our operations, FFO may not be useful in comparing operations for the periods presented below. We expect revenues and expenses to increase in future periods as we raise additional offering proceeds and use them to make additional real estate investments.
|
| | | | | | | | | | | | | | | |
| | Years ended December 31, | | Period from July 31, 2013 (date of inception) through December 31, 2019 |
| | 2019 | | 2018 | | 2017 | |
| Net income (loss) | $ | (19,548 | ) | | $ | (879 | ) | | $ | (17,186 | ) | | $ | (55,920 | ) |
Depreciation and amortization (1) | 46,193 |
| | 32,478 |
| | 29,687 |
| | 127,986 |
|
| Gain on sale of real estate | — |
| | (14,491 | ) | | — |
| �� | (14,491 | ) |
Adjustments for noncontrolling interests (2) | (29 | ) | | (22 | ) | | (30 | ) | | 117 |
|
| Funds From Operations attributable to common stockholders | $ | 26,616 |
| | $ | 17,086 |
| | $ | 12,471 |
| | $ | 57,692 |
|
| Basic and diluted income (loss) per common share | $ | (0.31 | ) | | $ | (0.02 | ) | | $ | (0.48 | ) | | $ | (2.17 | ) |
| Funds From Operations attributable to common stockholders per common share | $ | 0.42 |
| | $ | 0.42 |
| | $ | 0.35 |
| | $ | 2.24 |
|
| Weighted average shares outstanding | 63,039 |
| | 40,468 |
| | 35,808 |
| | 25,746 |
|
Notes to the table:
| |
| (1) | Represents the depreciation and amortization of real estate assets. Historical cost accounting for real estate assets in accordance with GAAP implicitly assumes that the value of real estate assets diminishes predictably over time. Since real estate values have historically risen or fallen with market conditions, we believe that such depreciation and amortization may be of limited relevance in evaluating current operating performance and, as such, these items are excluded from our determination of FFO. |
| |
| (2) | Includes income attributable to noncontrolling interests and all adjustments to eliminate the noncontrolling interests’ share of the adjustments to convert our net loss to FFO. |
Set forth below is additional information, which may be helpful in assessing our operating results:
| |
| • | For the years ended December 31, 2019, 2018 and 2017, the Dealer Manager earned distribution and stockholder servicing fees of $3.8 million, $2.0 million and $1.6 million, respectively, which are paid by Hines Global. Total distribution and stockholder servicing fees earned by the Dealer Manager from inception through December 31, 2019 were $7.9 million. |
| |
| • | For the year ended December 31, 2017, we incurred $10.0 million in acquisition-related costs and fees. Total acquisition-related costs and fees included in net income were $23.3 million from inception through December 31, 2019. |
| |
| • | As of December 6, 2017, through its ownership of the special limited partner interest in the Operating Partnership, our Advisor is entitled to an annual performance participation allocation of 12.5% of the Operating Partnership’s total return subject to the Company earning a 5% total return annually, after considering the effect of any losses carried forward from the prior year. The performance participation allocation accrues monthly and is payable after the completion of each calendar year. See Note 7—Related Party Transactions, for additional information regarding the performance participation allocation. We do not consider the performance participation allocation in evaluating our operating performance. For the years ended December 31, 2019 and 2018, we incurred $7.7 million and $6.0 million, respectively, in performance participation allocation fees. Total performance participation allocation fees incurred were $13.9 million from inception through December 31, 2019. |
| |
| • | For the years ended December 31, 2019, 2018 and 2017, we recorded adjustments primarily related to amortization of out-of-market lease intangibles and lease incentives and straight-line rent adjustments, which resulted in a net increase to rental revenue of $4.4 million, $2.3 million and $2.1 million, respectively. |
| |
| • | We recorded non-cash adjustments related to gains/losses on derivative instruments and/or foreign currencies and certain amounts related to deferred taxes, which reduced net income by approximately $2.9 million and $93,000 for the years ended December 31, 2019 and 2018, respectively. Such amounts were insignificant in prior periods. |
As noted previously, our cash flows from operations have been and may continue to be insufficient to fund distributions to stockholders. We may continue to choose to use proceeds from the sales of assets, proceeds from our debt financings, proceeds from our public offerings, cash advances by our Advisor and/or cash resulting from a waiver or deferral of fees to fund distributions to our stockholders. For example, we funded 42%, 32% and 56% of total distributions for the years ended December 31, 2019, 2018 and 2017, respectively, with cash flows from other sources such as cash flows from investing activities, which may include proceeds from the sale of real estate and/or cash flows from financing activities, which may include offering proceeds. We have not placed a cap on the amount of our distributions that may be paid from sources other than cash flows from operations, including proceeds from our debt financings, proceeds from our public offerings, cash advances by our Advisor and cash resulting from a waiver or deferral of fees.
From inception through December 31, 2019, we declared $91.0 million of distributions to our stockholders, compared to our total aggregate FFO of $57.7 million and our total aggregate net loss of $55.9 million for that period. We incurred acquisition fees and expenses of $23.3 million from inception through December 31, 2017 in connection with our real estate investments, which were recorded as reductions to net income (loss) and FFO. We adopted ASU 2017-01 on January 1, 2018, which allows us to capitalize acquisition-related costs and fees instead of treating them as operating expenses under GAAP. For the year ended December 31, 2017, we incurred $10.0 million in acquisition-related costs and fees. For the year ended December 31, 2019, we declared $35.6 million of distributions to our stockholders compared to our total aggregate FFO of $26.6 million. For the years ended December 2018 and 2017, we declared $22.6 million and $19.8 million, respectively, of distributions to our stockholders compared to our total aggregate FFO of $17.1 million and $12.5 million, respectively.
Related Party Transactions and Agreements
We have entered into agreements with our Advisor, our Dealer Manager and Hines and its affiliates, whereby we pay certain fees and reimbursements to these entities during the various phases of our organization and operation. During the organization and offering stage, these include payments to our Dealer Manager for selling commissions, the dealer manager fee, distribution and stockholder servicing fees, and payments to our Advisor for reimbursement of organization and offering costs. During the acquisition and operational stages, these include payments for certain services related to the management and performance of our investments and operations provided to us by our Advisor and Hines and its affiliates pursuant to various agreements we have entered into with these entities. See Note 8 — Related Party Transactions in the Notes to the consolidated financial statements contained elsewhere in this Annual Report on Form 10-K for additional information concerning our related party transactions and agreements.
Off-Balance Sheet Arrangements
As of December 31, 2019 and 2018, we had no off-balance sheet arrangements that have or are reasonably likely to have a current or future effect on our financial condition, changes in financial condition, revenues or expenses, results of operations, liquidity, capital expenditures or capital resources.
Contractual Obligations
The following table lists our known contractual obligations as of December 31, 2019.
|
| | | | | | | | | | | | | | | | | | | |
| | Payments due by Period |
| Contractual Obligations | Less Than 1 Year | | 1-3 Years | | 3-5 Years | | More Than 5 Years | | Total (2) |
Notes payable (1) | $ | 186,835 |
| | $ | 274,005 |
| | $ | 68,096 |
| | $ | — |
| | $ | 528,936 |
|
Hines Credit Facility(1) | 77,468 |
| | — |
| | — |
| | — |
| | 77,468 |
|
Organization and Offering Costs(2) | 2,362 |
| | 3,600 |
| | 1,800 |
| | — |
| | 7,762 |
|
Total contractual obligations(3) | $ | 266,665 |
| | $ | 277,605 |
| | $ | 69,896 |
| | $ | — |
| | $ | 614,166 |
|
| |
| (1) | Includes all future principal outstanding as of December 31, 2019 and future interest payments. |
| |
| (2) | See Note 8 — Related Party Transactions for additional information regarding the reimbursement of organization and offering costs to our Advisor. |
| |
| (3) | Excluded from the table above is the $22.5 million distribution and stockholder servicing fee liability payable to our Dealer Manager with respect to certain classes of shares of our common stock as of December 31, 2019. We cannot predict the length of time over which this fee will be paid due to potential changes in the NAV per share of the Company's common stock and future redemptions of shares of our common stock. If we assumed a constant NAV per share, the distribution and stockholder servicing fee would be paid over a range of 5-6 years from the date of purchase for certain classes of shares of our common stock, and over 35 years from the date of purchase with respect to Class T shares. See Note 8 — Related Party Transactions for additional information regarding the distribution and stockholder servicing fees. |
Recent Developments and Subsequent Events
Domain Apartments
In January 2020, we sold the Domain Apartments for a contract price of $80.1 million and repaid the associated mortgage loan in full. We acquired the Domain Apartments in January 2016 for a purchase price of $58.2 million, excluding transaction costs and working capital reserves. The purchaser is not affiliated with us or our affiliates.
The Emerson
In January 2020, we acquired The Emerson. The net purchase price was $117.0 million, exclusive of transaction costs and closing prorations. The Emerson is an apartment property located in Centreville, Virginia consisting of 355 units. The newly constructed property currently has a 64% occupancy rate and is expected to stabilize in the next six months. The seller is not affiliated with us or our affiliates.
Goodyear Crossing
In February 2020, we sold Goodyear Crossing II for a contract price of $72.0 million and repaid the associated mortgage loan in full. We acquired Goodyear Crossing II in August 2016 for a purchase price of $56.2 million, excluding transaction costs and working capital reserves. The purchaser is not affiliated with us or our affiliates.
Bratzler ABC Westland
In February 2020, we acquired Bratzler ABC Westland for a contract price of €11.5 million (approximately $12.5 million assuming a rate of $1.09 per Euro as of the acquisition date), excluding transaction costs and working capital reserves. Bratzler ABC Westland is an addition to our existing ownership interest in ABC Westland, an industrial logistics property located in The Hague, Netherlands, previously acquired in May 2019. The seller is not affiliated with us or our affiliates.
Coronavirus Outbreak
Subsequent to December 31, 2019, there was a global outbreak of COVID-19 (more commonly referred to as the Coronavirus), which continues to adversely impact global commercial activity and has contributed to significant volatility in financial markets. It has already disrupted global travel and supply chains, adversely impacted global commercial activity, and
its long-term economic impact remains uncertain. Considerable uncertainty still surrounds the Coronavirus and its potential effects on the population, as well as the effectiveness of any responses taken on a national and local level by government authorities and businesses. The travel restrictions, limits on hours of operations and/or closures of non-essential businesses and other efforts to curb the spread of the Coronavirus have significantly disrupted business activity globally, including in the markets where we invest, and could have an adverse impact on the performance of certain of our investments. Many of our tenants are subject to shelter in place and other quarantine restrictions, and the restrictions could be in place for an extended period of time. These restrictions are particularly adversely impacting many of our retail tenants (other than grocery tenants), as government instructions regarding social distancing and mandated closures have reduced and, in some cases, eliminated customer foot traffic, causing many of our retail tenants to temporarily close their brick and mortar stores. As of December 31, 2019, we owned two retail properties in the U.S., which comprised 17% of our portfolio, based on the estimated value of our real estate investments as of that date. The outbreak could have a continued adverse impact on economic and market conditions and trigger a period of global economic slowdown. In addition, the rapidly evolving nature of the pandemic makes it difficult to ascertain the long term impact it will have on commercial real estate markets and our investments. Nevertheless, the Coronavirus presents material uncertainty and risk with respect to the performance of our real estate investments and our financial results, such as the potential negative impact to occupancy at our properties, the potential closure of certain of our assets for an extended period, the potential for increased difficulty in obtaining financing, increased costs of operations, decrease in values of our real estate investments, changes in law and/or regulation, and uncertainty regarding government and regulatory policy. We are unable to estimate the impact the Coronavirus will have on our financial results at this time.
Item 7A. Quantitative and Qualitative Disclosures About Market Risk
Market risk includes risks that arise from changes in interest rates, foreign currency exchange rates, commodity prices, equity prices and other market changes that affect market-sensitive instruments. In pursuing our business plan, we believe that interest rate risk and currency risk are the primary market risks to which we are exposed. As of December 31, 2019, we were exposed to the market risks listed below.
Interest Rate Risk
We are exposed to the effects of interest rate changes primarily as a result of debt used to maintain liquidity and fund expansion of our real estate investment portfolio and operations. As of December 31, 2019, we had $663.3 million of variable-rate debt outstanding. If interest rates were to increase by 1%, we would incur an additional $6.6 million in interest expense. Additionally, we entered into interest rate swap and cap agreements to limit our exposure to rising interest rates related to our mortgage loans secured by our investment properties. See Note 5 — Debt Financing in the Notes to the consolidated financial statements for more information concerning our outstanding debt and our interest rate exposure.
Foreign Currency Risk
We currently have real estate investments located in countries outside of the U.S. that are subject to the effects of exchange rate movements between the foreign currency of each real estate investment and the U.S. dollar, which may affect future costs and cash flows as well as amounts translated into U.S. dollars for inclusion in our consolidated financial statements. We have entered into mortgage loans denominated in foreign currencies for these investments, which provide natural hedges with regard to changes in exchange rates between the foreign currencies and U.S. dollar and reduce our exposure to exchange rate differences. Additionally, we are typically a net receiver of these foreign currencies, and, as a result, our foreign operations benefit from a weaker U.S. dollar and are adversely affected by a stronger U.S. dollar. The table below identifies the effect that a 10% immediate, unfavorable change in the exchange rates would have on the net book value of our international real estate investments, including any foreign currency mortgage loans and their year-to-date net income (loss), by foreign currency (in thousands)(1):
|
| | | | |
| | | Reduction in Book Value as of December 31, 2019 | | Reduction in Net Income (Loss) for the Year Ended December 31, 2019 |
| EUR | | $15,029 | | $276 |
| GBP | | $15,814 | | $48 |
(1) Our real estate assets in Poland were purchased in Euros and we expect that when we dispose of these assets, the sale transactions will also be denominated in Euros. Accordingly, we do not expect to have Polish zloty exposure upon disposition.
Item 8. Financial Statements and Supplementary Data
REPORT OF INDEPENDENT REGISTERED PUBLIC ACCOUNTING FIRM
To the Stockholders and Board of Directors of Hines Global Income Trust, Inc.
Opinion on the Financial Statements
We have audited the accompanying consolidated balance sheets of Hines Global Income Trust, Inc., and subsidiaries (the “Company”) as of December 31, 2019 and 2018, the related consolidated statements of operations and comprehensive income (loss), equity, and cash flows, for each of the three years in the period ended December 31, 2019, and the related notes and the schedules listed in the Index at Item 15 (collectively referred to as the “financial statements”). In our opinion, the financial statements present fairly, in all material respects, the financial position of the Company as of December 31, 2019 and 2018, and the results of its operations and its cash flows for each of the three years in the period ended December 31, 2019, in conformity with accounting principles generally accepted in the United States of America.
Change in Accounting Principle
As discussed in Note 2 to the financial statements, effective January 1, 2019, the Company adopted ASC 842, Leases, using the modified retrospective approach.
Basis for Opinion
These financial statements are the responsibility of the Company's management. Our responsibility is to express an opinion on the Company's financial statements based on our audits. We are a public accounting firm registered with the Public Company Accounting Oversight Board (United States) (PCAOB) and are required to be independent with respect to the Company in accordance with the U.S. federal securities laws and the applicable rules and regulations of the Securities and Exchange Commission and the PCAOB.
We conducted our audits in accordance with the standards of the PCAOB. Those standards require that we plan and perform the audit to obtain reasonable assurance about whether the financial statements are free of material misstatement, whether due to error or fraud. The Company is not required to have, nor were we engaged to perform, an audit of its internal control over financial reporting. As part of our audits, we are required to obtain an understanding of internal control over financial reporting but not for the purpose of expressing an opinion on the effectiveness of the Company’s internal control over financial reporting. Accordingly, we express no such opinion.
Our audits included performing procedures to assess the risks of material misstatement of the financial statements, whether due to error or fraud, and performing procedures that respond to those risks. Such procedures included examining, on a test basis, evidence regarding the amounts and disclosures in the financial statements. Our audits also included evaluating the accounting principles used and significant estimates made by management, as well as evaluating the overall presentation of the financial statements. We believe that our audits provide a reasonable basis for our opinion.
/s/ Deloitte & Touche LLP
Houston, Texas
March 30, 2020
We have served as the Company’s auditor since 2013.
HINES GLOBAL INCOME TRUST, INC.
CONSOLIDATED BALANCE SHEETS
As of December 31, 2019 and 2018
|
| | | | | | | |
| | 2019 | | 2018 |
| | (in thousands, except per share amounts) |
| ASSETS | | | |
| Investment property, net | $ | 1,254,304 |
| | $ | 787,189 |
|
| Investments in real estate-related securities | 36,491 |
| | 9,599 |
|
| Cash and cash equivalents | 45,875 |
| | 27,138 |
|
| Restricted cash | 10,563 |
| | 9,848 |
|
| Derivative instruments | 163 |
| | 174 |
|
| Tenant and other receivables, net | 14,160 |
| | 8,995 |
|
| Intangible lease assets, net | 98,537 |
| | 90,697 |
|
| Right-of-use asset, net | 37,606 |
| | — |
|
| Deferred leasing costs, net | 18,418 |
| | 13,282 |
|
| Deferred financing costs, net | 2,311 |
| | — |
|
| Other assets | 5,129 |
| | 1,907 |
|
| Assets held for sale | 49,988 |
| | — |
|
| Total assets | $ | 1,573,545 |
| | $ | 948,829 |
|
| LIABILITIES AND EQUITY | | | |
| Liabilities: | | | |
| Accounts payable and accrued expenses | $ | 29,838 |
| | $ | 26,186 |
|
| Due to affiliates | 42,782 |
| | 26,022 |
|
| Intangible lease liabilities, net | 19,633 |
| | 18,034 |
|
| Other liabilities | 21,428 |
| | 55,391 |
|
| Operating lease liability | 1,583 |
| | — |
|
| Derivative instruments | 1,079 |
| | — |
|
| Distributions payable | 3,837 |
| | 2,024 |
|
| Note payable to affiliate | 75,000 |
| | 55,000 |
|
| Notes payable, net | 752,131 |
| | 487,439 |
|
| Liabilities associated with assets held for sale | 34,713 |
| | — |
|
| Total liabilities | $ | 982,024 |
| | $ | 670,096 |
|
| | | | |
Commitments and contingencies (Note 12) | — |
| | — |
|
| | | | |
| Equity: | | | |
| Stockholders’ equity: | | | |
| Preferred shares, $0.001 par value per share; 500,000 preferred shares authorized, none issued or outstanding as of December 31, 2019 and December 31, 2018 | — |
| | — |
|
| 83 |
| | 44 |
|
| Additional paid-in capital | 735,545 |
| | 371,274 |
|
| Accumulated distributions in excess of earnings | (146,830 | ) | | (91,711 | ) |
| Accumulated other comprehensive income (loss) | 2,723 |
| | (874 | ) |
| Total stockholders’ equity | 591,521 |
| | 278,733 |
|
| Noncontrolling interests | — |
| | — |
|
| Total equity | 591,521 |
| | 278,733 |
|
| Total liabilities and equity | $ | 1,573,545 |
| | $ | 948,829 |
|
See notes to the consolidated financial statements.
HINES GLOBAL INCOME TRUST, INC.
CONSOLIDATED STATEMENTS OF OPERATIONS AND COMPREHENSIVE INCOME (LOSS)
For the Years Ended December 31, 2019, 2018 and 2017
|
| | | | | | | | | | | |
| | 2019 | | 2018 | | 2017 |
| | (in thousands, except per share amounts) |
| Revenues: | | | | | |
| Rental revenue | $ | 101,762 |
|
| $ | 68,006 |
| | $ | 58,824 |
|
| Other revenue | 2,121 |
|
| 1,063 |
| | 900 |
|
| Total revenues | 103,883 |
|
| 69,069 |
| | 59,724 |
|
| Expenses: |
|
|
| | | |
| Property operating expenses | 25,198 |
|
| 13,774 |
| | 9,663 |
|
| Real property taxes | 11,753 |
|
| 8,601 |
| | 9,387 |
|
| Property management fees | 4,036 |
|
| 1,845 |
| | 1,061 |
|
| Depreciation and amortization | 46,193 |
|
| 32,478 |
| | 29,687 |
|
| Acquisition related expenses | 161 |
|
| 144 |
| | 3,212 |
|
| Asset management and acquisition fees | 7,985 |
|
| 5,004 |
| | 11,681 |
|
| Performance participation allocation | 7,713 |
|
| 5,954 |
| | 251 |
|
| General and administrative expenses | 3,652 |
|
| 3,131 |
| | 2,803 |
|
| Total expenses | 106,691 |
|
| 70,931 |
| | 67,745 |
|
| Other income (expenses): |
|
|
| | | |
| Gain (loss) on derivative instruments | (2,292 | ) |
| (272 | ) | | (372 | ) |
| Gain (loss) on investments in real estate-related securities | 2,317 |
|
| (401 | ) | | — |
|
| Gain on sale of real estate | — |
|
| 14,491 |
| | — |
|
| Foreign currency gains (losses) | (617 | ) |
| (438 | ) | | 494 |
|
| Interest expense | (18,608 | ) |
| (12,649 | ) | | (9,453 | ) |
| Interest and other income | 1,480 |
|
| 261 |
| | 83 |
|
| Income (loss) before benefit (provision) for income taxes | (20,528 | ) |
| (870 | ) | | (17,269 | ) |
| Benefit (provision) for income taxes | 980 |
|
| (9 | ) | | 83 |
|
| Net income (loss) | (19,548 | ) |
| (879 | ) | | (17,186 | ) |
| Net (income) loss attributable to noncontrolling interests | (13 | ) | | (13 | ) | | (12 | ) |
| Net income (loss) attributable to common stockholders | $ | (19,561 | ) | | $ | (892 | ) | | $ | (17,198 | ) |
| Basic and diluted income (loss) per common share | $ | (0.31 | ) | | $ | (0.02 | ) | | $ | (0.48 | ) |
| Weighted average number of common shares outstanding | 63,039 |
| | 40,468 |
| | 35,808 |
|
| | | | | | |
| Comprehensive income (loss): | | | | | |
| Net income (loss) | $ | (19,548 | ) | | $ | (879 | ) | | $ | (17,186 | ) |
| Other comprehensive income (loss): | | | | | |
| Foreign currency translation adjustment | 3,597 |
| | (5,812 | ) | | 7,693 |
|
| Comprehensive income (loss) | $ | (15,951 | ) | | $ | (6,691 | ) | | $ | (9,493 | ) |
| Comprehensive (income) loss attributable to noncontrolling interests | (13 | ) | | (13 | ) | | (12 | ) |
| Comprehensive income (loss) attributable to common stockholders | $ | (15,964 | ) | | $ | (6,704 | ) | | $ | (9,505 | ) |
See notes to the consolidated financial statements.
HINES GLOBAL INCOME TRUST, INC.
CONSOLIDATED STATEMENTS OF EQUITY
For the Years Ended December 31, 2019, 2018 and 2017
(in thousands)
|
| | | | | | | | | | | | | | | | | | | | | | | | | | |
| Hines Global Income Trust, Inc. Stockholders |
| | Common Shares | | Additional Paid-in Capital | | Accumulated Distributions in Excess of Earnings | | Accumulated Other Comprehensive Income (Loss) | | Total Stockholders’ Equity | | Noncontrolling Interests |
| | Shares | | Amount | | | | | |
| Balance as of January 1, 2017 | 26,543 |
| | $ | 26 |
| | $ | 224,134 |
| | $ | (31,222 | ) | | $ | (2,755 | ) | | $ | 190,183 |
| | $ | — |
|
| Issuance of common shares | 14,807 |
| | 15 |
| | 146,710 |
| | — |
| | — |
| | 146,725 |
| | — |
|
| Distributions declared | — |
| | — |
| | — |
| | (19,773 | ) | | — |
| | (19,773 | ) | | (12 | ) |
| Redemption of common shares | (2,094 | ) | | (2 | ) | | (20,143 | ) | | — |
| | — |
| | (20,145 | ) | | — |
|
| Selling commissions, dealer manager fees and distribution and stockholder servicing fees | — |
| | — |
| | (10,712 | ) | | — |
| | — |
| | (10,712 | ) | | — |
|
| Offering costs | — |
| | — |
| | (3,228 | ) | | — |
| | — |
| | (3,228 | ) | | — |
|
| Net income (loss) | — |
| | — |
| | — |
| | (17,198 | ) | | — |
| | (17,198 | ) | | 12 |
|
| Foreign currency translation adjustment | — |
| | — |
| | — |
| | — |
| | 7,693 |
| | 7,693 |
| | — |
|
| Balance as of December 31, 2017 | 39,256 |
| | $ | 39 |
| | $ | 336,761 |
| | $ | (68,193 | ) | | $ | 4,938 |
| | $ | 273,545 |
| | $ | — |
|
| | | | | | | | | | | | | | |
| Hines Global Income Trust, Inc. Stockholders |
| | Common Shares | | Additional Paid-in Capital | | Accumulated Distributions in Excess of Earnings | | Accumulated Other Comprehensive Income (Loss) | | Total Stockholders’ Equity | | Noncontrolling Interests |
| | Shares | | Amount | | | | | |
| Balance as of January 1, 2018 | 39,256 |
| | $ | 39 |
| | $ | 336,761 |
| | $ | (68,193 | ) | | $ | 4,938 |
| | $ | 273,545 |
| | $ | — |
|
| Issuance of common shares | 5,601 |
| | 7 |
| | 56,391 |
| | — |
| | — |
| | 56,398 |
| | — |
|
| Distributions declared | — |
| | — |
| | — |
| | (22,626 | ) | | — |
| | (22,626 | ) | | (13 | ) |
| Redemption of common shares | (1,273 | ) | | (2 | ) | | (13,686 | ) | | — |
| | — |
| | (13,688 | ) | | — |
|
| Selling commissions, dealer manager fees and distribution and stockholder servicing fees | — |
| | — |
| | (3,394 | ) | | — |
| | — |
| | (3,394 | ) | | — |
|
| Offering costs | — |
| | — |
| | (4,798 | ) | | — |
| | — |
| | (4,798 | ) | | — |
|
| Net income (loss) | — |
| | — |
| | — |
| | (892 | ) | | — |
| | (892 | ) | | 13 |
|
| Foreign currency translation adjustment | — |
| | — |
| | — |
| | — |
| | (5,812 | ) | | (5,812 | ) | | — |
|
| Balance as of December 31, 2018 | 43,584 |
| | $ | 44 |
| | $ | 371,274 |
| | $ | (91,711 | ) | | $ | (874 | ) | | $ | 278,733 |
| | $ | — |
|
| | | | | | | | | | | | | | |
| Hines Global Income Trust, Inc. Stockholders |
| | Common Shares | | Additional Paid-in Capital | | Accumulated Distributions in Excess of Earnings | | Accumulated Other Comprehensive Income (Loss) | | Total Stockholders’ Equity | | Noncontrolling Interests |
| | Shares | | Amount | | | | | |
| Balance as of January 1, 2019 | 43,584 |
| | $ | 44 |
| | $ | 371,274 |
| | $ | (91,711 | ) | | $ | (874 | ) | | $ | 278,733 |
| | $ | — |
|
| Issuance of common shares | 39,805 |
| | 41 |
| | 411,280 |
| | — |
| | — |
| | 411,321 |
| | — |
|
| Distributions declared | — |
| | — |
| | — |
| | (35,558 | ) | | — |
| | (35,558 | ) | | (13 | ) |
| Redemption of common shares | (1,542 | ) | | (2 | ) | | (16,050 | ) | | — |
| | — |
| | (16,052 | ) | | — |
|
| Selling commissions, dealer manager fees and distribution and stockholder servicing fees | — |
| | — |
| | (26,514 | ) | | — |
| | — |
| | (26,514 | ) | | — |
|
| Offering costs | — |
| | — |
| | (4,445 | ) | | — |
| | — |
| | (4,445 | ) | | — |
|
| Net income (loss) | — |
| | — |
| | — |
| | (19,561 | ) | | — |
| | (19,561 | ) | | 13 |
|
| Foreign currency translation adjustment | — |
| | — |
| | — |
| | — |
| | 3,597 |
| | 3,597 |
| | — |
|
| Balance as of December 31, 2019 | 81,847 |
| | $ | 83 |
| | $ | 735,545 |
| | $ | (146,830 | ) | | $ | 2,723 |
| | $ | 591,521 |
| | $ | — |
|
See notes to the consolidated financial statements.
HINES GLOBAL INCOME TRUST, INC.
CONSOLIDATED STATEMENTS OF CASH FLOWS
For the Years Ended December 31, 2019, 2018 and 2017
|
| | | | | | | | | | | |
| | 2019 | | 2018 | | 2017 |
| | (in thousands) |
| CASH FLOWS FROM OPERATING ACTIVITIES: | | | | | |
| Net income (loss) | $ | (19,548 | ) | | $ | (879 | ) | | $ | (17,186 | ) |
| Adjustments to reconcile net income (loss) to net cash from (used in) operating activities: | | | | | |
| Depreciation and amortization | 47,341 |
| | 32,614 |
| | 29,220 |
|
| Gain on sale of real estate | — |
| | (14,491 | ) | | — |
|
| Foreign currency (gains) losses | 617 |
| | 438 |
| | (494 | ) |
| (Gain) loss on derivative instruments | 2,292 |
| | 272 |
| | 372 |
|
| (Gain) loss on investments in real estate-related securities | (2,317 | ) | | 401 |
| | — |
|
| Changes in assets and liabilities: | | | | | |
| Change in other assets | (1,827 | ) | | 1,167 |
| | (1,190 | ) |
| Change in tenant and other receivables | (2,982 | ) | | (737 | ) | | (4,479 | ) |
| Change in deferred leasing costs | (7,199 | ) | | (12,460 | ) | | (4,415 | ) |
| Change in accounts payable and accrued expenses | 90 |
| | 7,432 |
| | 4,964 |
|
| Change in other liabilities | (2,946 | ) | | (519 | ) | | (9 | ) |
| Change in due to affiliates | 3,890 |
| | 6,004 |
| | (92 | ) |
| Net cash from (used in) operating activities | 17,411 |
| | 19,242 |
| | 6,691 |
|
| CASH FLOWS FROM INVESTING ACTIVITIES: | | | | | |
| Investments in acquired properties and lease intangibles | (620,974 | ) | | (206,782 | ) | | (192,867 | ) |
| Capital expenditures at operating properties | (8,487 | ) | | (14,977 | ) | | (4,204 | ) |
| Proceeds from sale of real estate | — |
| | 37,087 |
| | — |
|
| Purchases of real estate-related securities | (45,200 | ) | | (11,307 | ) | | — |
|
| Proceeds from settlement of real estate-related securities | 20,625 |
| | 1,306 |
| | — |
|
| Net cash used in investing activities | (654,036 | ) | | (194,673 | ) | | (197,071 | ) |
| CASH FLOWS FROM FINANCING ACTIVITIES: | | | | | |
| Proceeds from issuance of common stock | 392,897 |
| | 44,324 |
| | 138,192 |
|
| Redemption of common shares | (15,545 | ) | | (12,533 | ) | | (20,270 | ) |
| Payment of offering costs | (5,684 | ) | | — |
| | (3,810 | ) |
| Payment of selling commissions, dealer manager fees and distribution and stockholder servicing fees | (12,373 | ) | | (3,306 | ) | | (7,154 | ) |
| Distributions paid to stockholders and noncontrolling interests | (15,335 | ) | | (10,410 | ) | | (8,951 | ) |
| Proceeds from notes payable | 327,114 |
| | 131,312 |
| | 63,572 |
|
| Payments on notes payable | (30,996 | ) | | (1,700 | ) | | (1,650 | ) |
| Proceeds from related party note payable | 134,000 |
| | 90,500 |
| | 58,200 |
|
| Payments on related party note payable | (114,000 | ) | | (46,700 | ) | | (103,000 | ) |
| Change in security deposit liability | 167 |
| | (6 | ) | | (63 | ) |
| Deferred financing costs paid | (3,692 | ) | | (1,674 | ) | | (1,028 | ) |
| Payments related to interest rate contracts | (209 | ) | | (283 | ) | | (233 | ) |
| Net cash from financing activities | 656,344 |
| | 189,524 |
| | 113,805 |
|
| Effect of exchange rate changes on cash, restricted cash and cash equivalents | (267 | ) | | (1,660 | ) | | 1,415 |
|
| Net change in cash, restricted cash and cash equivalents | 19,452 |
| | 12,433 |
|
| (75,160 | ) |
| Cash, restricted cash and cash equivalents, beginning of year | 36,986 |
| | 24,553 |
| | 99,713 |
|
| Cash, restricted cash and cash equivalents, end of year | $ | 56,438 |
| | $ | 36,986 |
| | $ | 24,553 |
|
See notes to the consolidated financial statements.
HINES GLOBAL INCOME TRUST, INC.
NOTES TO THE CONSOLIDATED FINANCIAL STATEMENTS
1. ORGANIZATION
Hines Global Income Trust, Inc. (“the Company” or “Hines Global”), is a Maryland corporation formed to invest in a diversified portfolio of quality commercial real estate properties and other real estate investments throughout the United States and internationally, and to a lesser extent, invest in real-estate related securities. The Company is sponsored by Hines Interests Limited Partnership (“Hines”), a fully integrated global real estate investment and management firm that has acquired, developed, owned, operated and sold real estate for 60 years. The Company is managed by Hines Global REIT II Advisors LP (the “Advisor”), an affiliate of Hines. The Company intends to conduct substantially all of its operations through Hines Global REIT II Properties, LP (the “Operating Partnership”). An affiliate of the Advisor, Hines Global REIT II Associates LP, owns less than a 1% limited partner interest in the Operating Partnership as of December 31, 2019 and the Advisor also owns the special limited partnership interest in the Operating Partnership. The Company has elected to be taxed as a real estate investment trust, or REIT, for U.S. federal income tax purposes beginning with its taxable year ended December 31, 2015.
The Company raises capital for its investments through public offerings of its common stock and engaged Hines Securities, Inc. (the “Dealer Manager”), an affiliate of the Advisor, to serve as the dealer manager for its offerings and to market its shares. On August 20, 2014, the Company commenced its initial public offering of up to $2.5 billion of its common stock (the “Initial Offering”). On September 30, 2017, the Company suspended the sale of shares in the primary portion of the Initial Offering, while continuing to offer up to $150.0 million of its common stock pursuant to its distribution reinvestment plan. On December 6, 2017, the Company commenced a second public offering of up to $2.5 billion in shares of common stock including $500.0 million of shares offered under our distribution reinvestment plan (the “Follow-on Offering”). As a result of the changing landscape in the non-traded REIT industry, the Follow-on Offering reflects a restructuring (the “Restructuring”), which resulted in a reduction of many of the fees payable to the Advisor and the Dealer Manager. For additional information regarding these fees, please see Note 8 — Related Party Transactions.
The Company received gross offering proceeds of approximately $985.7 million from the sale of 97.6 million shares through its public offerings from inception through March 30, 2020, including shares issued pursuant to its distribution reinvestment plan. As of December 31, 2019, the Company owned direct investments in 19 real estate properties totaling 9.4 million square feet that were 96% leased.
2. SUMMARY OF SIGNIFICANT ACCOUNTING POLICIES
Use of Estimates
The Company’s consolidated financial statements have been prepared in accordance with accounting principles generally accepted in the United States of America (“GAAP”). The preparation of the consolidated financial statements requires the Company to make estimates and judgments that affect the reported amounts of assets, liabilities and contingencies as of the date of the financial statements and the reported amounts of revenues and expenses during the reporting periods. The Company evaluates its assumptions and estimates on an ongoing basis. The Company bases its estimates on historical experience and on various other assumptions that the Company believes to be reasonable under the circumstances. Additionally, application of the Company’s accounting policies involves exercising judgments regarding assumptions as to future uncertainties. Actual results may differ from these estimates under different assumptions or conditions.
Basis of Presentation
The consolidated financial statements of the Company include the accounts of Hines Global Income Trust, Inc. and the Operating Partnership (over which the Company exercises financial and operating control). All intercompany balances and transactions have been eliminated in consolidation. The Company has determined that the Operating Partnership is considered a variable interest entity (“VIE”). However, the Company meets the disclosure exemption criteria, as the Company is the primary beneficiary of the VIE and the Company’s partnership interest is considered a majority voting interest.
Investment Property and Lease Intangibles
Acquisitions of properties are evaluated to determine whether they qualify as a business combination or an asset acquisition. An acquisition is classified as an asset acquisition if substantially all of the fair value of the assets acquired are concentrated in a single identifiable asset or group of similar assets and the amounts recorded are inclusive of acquisitions costs and therefore recorded using their relative fair values. If the acquisition meets the definition of a business combination, the Company records the fair value of the assets acquired and liabilities assumed and will evaluate the existence of goodwill or a bargain purchase gain. Acquisition costs are expensed for business combinations. Since January 1, 2018, all of our acquisitions were concluded to be assets acquisitions. The results of operations of acquired properties are included in the Company’s results of operations from their respective dates of acquisition. Estimates of fair values were based upon estimates a variety of valuation methodologies and assumptions that the Company believes are similar to those used by market participants. These include, but are not limited to, estimates for future cash flows that utilize discount and/or capitalization rates assuming the building was vacant, determination of market-based rental revenues, comparable land sales, and replacement costs on building, and are subsequently used to record the purchase of identifiable assets acquired, such as land, buildings and improvements, and identifiable intangible assets related to in-place leases and liabilities assumed, such as amounts related to acquired out-of-market leases, asset retirement obligations, and mortgage notes payable.
The estimated fair value of acquired in-place leases are the costs the Company would have incurred to lease the properties to the occupancy level of the properties at the date of acquisition. Such estimates include the fair value of leasing commissions, legal costs and other direct costs that would be incurred to lease the properties to such occupancy levels. Additionally, the Company evaluates the time period over which such occupancy levels would be achieved. Such evaluation will include an estimate of the net market-based rental revenues and net operating costs (primarily consisting of real estate taxes, insurance and utilities) that would be incurred during the lease-up period. Acquired in-place leases as of the date of acquisition are amortized over the remaining lease terms. Should a tenant terminate its lease, the unamortized portion of the in-place lease value is charged to amortization expense.
Acquired out-of-market lease values (including ground leases) are recorded based on the present value (using a discount rate that reflects the risks associated with the lease acquired) of the difference between the contractual amounts paid pursuant to the in-place leases and management’s estimate of fair market value lease rates for the corresponding in-place leases. The capitalized out-of-market lease values are amortized as adjustments to rental revenue (or ground lease expense, as applicable) over the remaining terms of the respective leases, which include periods covered by bargain renewal options. Should a tenant terminate its lease, the unamortized portion of the out-of-market lease value is charged to rental revenue.
Management estimates the fair value of assumed mortgage notes payable based upon indications of then-current market pricing for similar types of debt with similar maturities. Assumed mortgage notes payable are initially recorded at their estimated fair value as of the assumption date, and the difference between such estimated fair value and the outstanding principal balance of the note will be amortized over the life of the mortgage note payable.
Real estate assets acquired are recorded at the date of acquisition less accumulated depreciation. Depreciation is computed using the straight-line method. The estimated useful lives for computing depreciation are generally 10 years for furniture and fixtures, 15-20 years for electrical and mechanical installations and 40 years for buildings. Major replacements that extend the useful life of the assets are capitalized and maintenance and repair costs are expensed as incurred.
Impairment of Investment Property
Real estate assets are reviewed for impairment each reporting period if events or changes in circumstances indicate that the carrying amount of the individual property may not be recoverable. In such an event, a comparison will be made of the current and projected operating cash flows and expected proceeds from the eventual disposition of each property on an undiscounted basis to the carrying amount of such property. If the carrying amount exceeds the undiscounted cash flows, it would be written down to the estimated fair value to reflect impairment in the value of the asset. The determination of whether investment property is impaired requires a significant amount of judgment by management and is based on the best information available to management at the time of the evaluation. NaN impairment charges were recorded during the years ended December 31, 2019, 2018, and 2017.
Assets and Liabilities Held for Sale
Properties that are intended to be sold are to be designated as “held for sale” on the consolidated balance sheets at the lesser of carrying amount or fair value less estimated selling costs when they meet specific criteria to be presented as held for sale, most significantly that the sale is probable within one year. The Company evaluates probability of sale based on specific facts including whether a sales agreement is in place and the buyer has made significant non-refundable deposits. Properties are no longer depreciated when they are classified as held for sale. As of December 31, 2019, the Company designated 1 property, the Domain Apartments, as held for sale.
As the Financial Accounting Standards Board (“FASB”) Accounting Standards Codification (“ASC”) 360-10 requires the separate presentation of assets and liabilities classified as held for sale, we have aggregated and presented these assets and liabilities as one line on the balance sheet (“assets held for sale” and “liabilities associated with assets held for sale”, respectively), which are described further in the tables below. These assets did not qualify to be classified as discontinued operations, because the sale of these assets does not represent a strategic shift in the Company’s operations. As of December 31, 2019, assets held for sale consisted of the following amounts (in thousands):
|
| | | |
| | December 31, 2019 |
| Investment property, net | $ | 49,823 |
|
| Tenant and other receivables, net | 74 |
|
| Other assets | 91 |
|
| Total assets held for sale | $ | 49,988 |
|
As of December 31, 2019, liabilities associated with assets held for sale consisted of the following (in thousands):
|
| | | |
| | December 31, 2019 |
| Accounts payable and accrued expenses | $ | 192 |
|
| Other liabilities | 225 |
|
| Notes payable, net | 34,296 |
|
| Total liabilities associated with assets held for sale | $ | 34,713 |
|
Investments in Real Estate-Related Securities
In the fourth quarter of 2018, the Company made its initial investments in real estate-related securities, which consist of common equities, preferred equities and debt investments of publicly traded REITs. Since that time, the Company has continued to make additional investments in real estate-related securities. The Company has elected to classify these investments as trading securities and carry such investments at fair value. These assets are valued on a recurring basis, which resulted in a realized gain of $1.0 million and an unrealized gain of $1.3 million for the year ended December 31, 2019, both of which are recorded in “gain (loss) on investments in real estate-related securities” in the Consolidated Statements of Operations and Comprehensive Income (Loss). The Company has also earned $1.0 million in interest and dividend income for the year ended December 31, 2019 relating to its investments in these securities, which are recorded in “Interest and other income” in the Consolidated Statements of Operations and Comprehensive Income (Loss).
Cash and Cash Equivalents
The Company considers all short-term, highly liquid investments that are readily convertible to cash with a maturity of three months or less at the time of purchase to be cash equivalents.
Concentration of Credit Risk
As of December 31, 2019, the Company had cash and cash equivalents deposited in certain financial institutions in excess of federally insured levels. Management regularly monitors the financial stability of these financial institutions in an effort to manage the Company’s exposure to any significant credit risk in cash and cash equivalents.
In addition, as of December 31, 2019, the Company had $27.6 million of cash and cash equivalents, including restricted cash, deposited in certain financial institutions located in the United Kingdom, Ireland, the Netherlands, Germany, and Poland.
Management regularly monitors the financial stability of these financial institutions in an effort to manage its exposure to any significant credit risk in cash and cash equivalents.
As of December 31, 2019, the Company owned $36.5 million in real estate-related securities. These securities consist of common equities, preferred equities and debt securities of publicly traded REITs.
International Operations
The Euro (“EUR”) is the functional currency for the Company’s subsidiaries operating in Ireland, the Netherlands and Germany, the British pound (“GBP”) is the functional currency for the Company’s subsidiaries operating in the United Kingdom, and the Polish zloty is the functional currency for the Company’s subsidiaries operating in Poland. These subsidiaries have translated their financial statements into U.S. dollars for reporting purposes. Assets and liabilities are translated at the exchange rate in effect as of the balance sheet date. Income statement accounts are generally translated using the average exchange rate for the period and significant nonrecurring transactions using the rate on the transaction date. Gains or losses resulting from translation are included in accumulated other comprehensive income (loss) within stockholders’ equity. Upon disposal of this subsidiary, the Company will remove the accumulated translation adjustment from stockholders’ equity and include it in the gain or loss on disposal in its consolidated statement of operations.
The Company and its subsidiaries may have transactions denominated in currencies other than their functional currencies. In these instances, assets and liabilities are remeasured into the functional currency at the exchange rate in effect at the end of the period and income statement accounts are remeasured at the average exchange rate for the period. These gains or losses are included in the Company’s consolidated statement of operations.
The Company and its subsidiaries also record gains or losses in the income statement when a transaction with a third party, denominated in a currency other than the functional currency, is settled and the functional currency cash flows realized are more or less than expected based upon the exchange rate in effect when the transaction was initiated.
Restricted Cash
The Company has restricted cash primarily related to certain escrow accounts required by several of the Company’s mortgage agreements.
Tenant and Other Receivables
Tenant and other receivables balances consist primarily of base rents, tenant reimbursements and receivables attributable to straight-line rent. Straight-line rent receivables were $8.6 million and $5.8 million as of December 31, 2019 and 2018, respectively. Straight-line rent receivables consist of the difference between the tenants’ rents calculated on a straight-line basis from the date of acquisition or lease commencement over the remaining terms of the related leases and the tenants’ actual rents due under the lease agreements and is included in tenant and other receivables in the accompanying consolidated balance sheets. Upon the adoption of Accounting Standards Update (“ASU”) 2016-02, individual leases are assessed for collectability and upon the determination that the collection of rents is not probable, accrued rent and accounts receivables are reduced as an adjustment to rental revenues. Revenue from leases where collection is deemed to be less than probable is recorded on a cash basis until collectability is determined to be probable. Further, we assess whether operating lease receivables, at a portfolio level, are appropriately valued based upon an analysis of balances outstanding, historical collection levels and current economic trends. The uncollectible portion of the portfolio is recorded as an adjustment to rental revenues. Prior to the adoption of ASU 2016-02, an allowance for the uncollectible portion of tenant and other receivables was determined and recognized based upon an analysis of the tenant’s payment history, the financial condition of the tenant, business conditions in the industry in which the tenant operates and economic conditions in the area in which the property is located. Tenant and other receivables are shown at cost in the consolidated balance sheets, net of allowance for doubtful accounts of $0.3 million at December 31, 2018.
Deferred Leasing Costs
Direct leasing costs, primarily consisting of third-party leasing commissions and tenant inducements are capitalized and amortized over the life of the related lease. Tenant inducement amortization is recorded as an offset to rental revenue and the amortization of other direct leasing costs is recorded in amortization expense.
Other Assets
Other assets included the following (in thousands):
|
| | | | | | | | |
| | | December 31, 2019 | | December 31, 2018 |
| Prepaid insurance | | 726 |
| | 493 |
|
| Prepaid property taxes | | 589 |
| | 80 |
|
Deferred tax assets (1) | | 2,973 |
| | 844 |
|
| Other | | 932 |
| | 490 |
|
| Other assets | | $ | 5,220 |
| (2) | $ | 1,907 |
|
| |
| (1) | Includes the effects of a valuation allowance of $1.8 million and $0.8 million as of December 31, 2019 and 2018, respectively. |
| |
| (2) | Includes $0.1 million classified as other assets within assets held for sale as of December 31, 2019. |
Revenue Recognition
The Financial Accounting Standards Board ("FASB") issued accounting standards update ("ASU") 2014-09 which superseded the revenue recognition requirements under previous guidance. We adopted ASU 2014-09 on January 1, 2018. ASU 2014-09 requires the use of a new five-step model to recognize revenue from contracts with customers. The five-step model requires that the Company identify the contract with the customer, identify the performance obligations in the contract, determine the transaction price, allocate the transaction price to the performance obligations in the contract and recognize revenue when it satisfies the performance obligations. Management has concluded that the majority of the Company’s total revenue, with the exception of gains and losses from the sale of real estate, consist of rental income from leasing arrangements, which is specifically excluded from the standard. Excluding gains and losses on the sale of real estate (as discussed further below), the Company concluded that its remaining revenue streams were immaterial and, as such, the adoption of ASU 2014-09 did not have a material impact on the Company’s consolidated financial statements.
As of January 1, 2018, the Company began accounting for the sale of real estate properties under ASU 2017-05 and provides for revenue recognition based on completed performance obligations, which typically occurs upon the transfer of ownership of a real estate asset.
The Company recognizes rental revenue on a straight-line basis over the life of the lease including rent holidays, if any. Revenues associated with operating expense recoveries are recognized in the period in which the expenses are incurred based upon the tenant lease provisions. Revenues relating to lease termination fees are recognized on a straight-line basis amortized from the time that a tenant’s right to occupy the leased space is modified through the end of the revised lease term.
Other revenues consist primarily of parking revenue, administrative fees, and tenant reimbursements related to utilities, insurance, and other operating expenses. Parking revenue represents amounts generated from contractual and transient parking and is recognized in accordance with contractual terms or as services are rendered. Other revenues relating to tenant reimbursements are recognized at the time when the performance obligation is met.
Income Taxes
The Company has elected to be treated as a REIT under Sections 856 through 860 of the Internal Revenue Code of 1986, as amended (the “Code”), beginning with its taxable year ended December 31, 2015. The Company’s management believes that it operates in such a manner as to qualify for treatment as a REIT and intends to operate in the foreseeable future in such a manner so that it will remain qualified as a REIT for federal income tax purposes. Accordingly, no provision has been made for U.S. federal income taxes for the years ended December 31, 2019, 2018 and 2017 in the accompanying consolidated financial statements. In 2019, income tax expense/benefit recorded by the Company was primarily comprised of foreign income taxes related to the operation of its international properties. All periods from December 31, 2015 through December 31, 2019 are open for examination by the IRS. The Company does not believe it has any uncertain tax positions or unrecognized tax benefits requiring disclosure. The Company adopted ASU 2016-16 “Income Taxes” beginning January 1, 2018 and recorded deferred tax assets, along with a full valuation allowance, related to its subsidiaries in Ireland.
Distribution and Stockholder Servicing Fees
The Company records distribution and stockholder servicing fees as a reduction to additional paid-in capital and the related liability in an amount equal to the maximum fees payable in relation to the applicable class of shares on the date the shares are issued. The liability will be relieved over time, as the fees are paid to the Dealer Manager, or it will be adjusted if the fees are no longer payable. For the years ended December 31, 2019 and 2018, the Company recorded a liability of $22.5 million and $8.3 million, respectively. See Note 8 — Related Party Transactions for additional information regarding the Company’s distribution and stockholder servicing fees.
Per Share Data
Net income (loss) per common share is calculated by dividing the net income (loss) attributable to common stockholders for each period by the weighted average number of common shares outstanding during such period. Net income (loss) per common share on a basic and diluted basis is the same because the Company has no potentially dilutive common shares outstanding. All classes of common stock are allocated net income (loss) at the same rate per share and receive the same gross distribution per share.
Recently Adopted Accounting Pronouncements
In February 2016, the FASB issued ASU 2016-02 which requires companies that lease assets to recognize on the balance sheet the right-of-use assets and related lease liabilities (“ASC 842”). The accounting by companies that own the assets leased by the lessee (the lessor) remains largely unchanged from the adoption of ASC 842. The Company adopted ASC 842 beginning January 1, 2019 and is using the modified retrospective approach. No adjustment to opening retained earnings was required.
In July 2018, the FASB issued ASU 2018-11, which allows lessors to account for lease and non-lease components by class of underlying assets, as a single lease component if certain criteria are met. The new standard permits companies to recognize a cumulative-effect adjustment to the opening balance of retained earnings in the period of adoption in lieu of restating prior periods and provides other optional practical expedients.
On January 1, 2019, the Company elected the following practical expedients:
| |
| • | The transition method in which the application date of January 1, 2019 is the beginning of the reporting period that the Company first applied the new guidance. |
| |
| • | The practical expedient package which allows an entity not to reassess (1) whether any expired or existing contracts are or contain leases; (2) the lease classification for any expired or existing leases; (3) initial direct costs for any existing leases. |
| |
| • | As an accounting policy election, a lessor may choose not to separate the non-lease components, by class of underlying assets, from the lease components and instead account for both types of components as a single component under certain conditions. |
| |
| • | As an accounting policy election, a lessee may choose not to separate the non-lease components, by class of underlying assets, from the lease components and instead account for both types of components as a single component. The Company elected to apply the practical expedient for all of its leases to account for the lease and non-lease components as a single, combined operating lease component. |
Based on the Company’s analysis, the Company identified the following changes to result from its adoption of ASC 842:
Lessor Accounting
| |
| • | The Company is entitled to receive tenant reimbursements for operating expenses for common area maintenance. Based on guidance in these ASUs, such revenue is defined as a non-lease component, which would be accounted for in accordance with ASC 606. However, the Company elected to apply the practical expedient for all of its leases to account for the lease and non-lease components as a single, combined operating lease component. |
| |
| • | Capitalization of leasing costs is limited to initial direct costs. Initial direct costs have been defined as incremental costs of a lease that would not have been incurred if the lease had not been obtained. Legal costs are no longer |
capitalized, but expensed as incurred. There is no change in the Company’s accounting for lease inducements and commissions.
| |
| • | The Company’s existing leases continue to be classified as operating leases, however, leases entered into or modified after January 1, 2019 may be classified as either operating or sales-type leases, based on specific classification criteria. The Company believes all of its leases will continue to be classified as operating leases, and all operating leases will continue to have a similar pattern of recognition as under prior GAAP. |
| |
| • | The Company believes there is low risk of inadequate residual values of its leased assets upon the termination of these leases due to the Company’s ability to re-lease the spaces for the assets, the long-lived nature of its real estate assets and the nature of real estate assets to hold their value over a long periods of time. |
Lessee Accounting
| |
| • | The Company has ground lease agreements in which the Company is the lessee for land underneath Bishop’s Square that the Company accounts for as an operating lease. The Company previously recognized an amount related to this ground lease as part of the allocation of the purchase price of Bishop’s Square, which was recorded to intangible lease assets, net. The lease has a remaining term of 763 years. Upon adoption of ASC 842 on January 1, 2019, the Company determined the lease liability is immaterial and reclassified approximately €29.7 million (approximately $33.9 million assuming a rate of $1.14 per EUR as of January 1, 2019, the date of adoption) from intangible lease assets, net to right-of-use asset, net in the Company’s Consolidated Balance Sheets. |
| |
| • | The Company has a ground lease agreement in which the Company is the lessee for land underneath Łódź Urban Logistics that the Company is currently accounted for as an operating lease. The lease currently ends in December 2089 and has fixed payments. The rental expense associated with this lease was $24,000 and $0 for the year ended December 31, 2019, and 2018, respectively. The Company recorded a right-of-use asset of approximately $4.4 million in right-of-use asset, net, and recorded a lease liability of approximately $1.6 million in operating lease liability, respectively, in the Company’s Consolidated Balance Sheets. |
The Company’s estimate of the amount of the right-of-use asset and lease liability included assumptions for the discount rate, which is based on the incremental borrowing rate of the lease contract. The incremental borrowing rate is the rate of interest that a lessee would have to pay to borrow on a collateralized basis over a term similar to the lease. Since the term of the Łódź Urban Logistics ground lease is much longer than a typical borrowing, the Company derived the incremental borrowing rate of 5.6%, as the spread in a current financing quote for the property plus the applicable base rate corresponding to the longest term available in the base rate market. A reconciliation of the Company’s lease liabilities on an undiscounted cash flow basis for the ground lease at Łódź Urban Logistics for each of the years ending December 31, 2020 through December 31, 2024 are as follows (in thousands):
|
| | | |
| | Lease Payments |
| 2020 | $ | 93 |
|
| 2021 | 93 |
|
| 2022 | 93 |
|
| 2023 | 93 |
|
| 2024 | 93 |
|
| Thereafter | 6,024 |
|
| Total | $ | 6,489 |
|
| Operating lease liability | $ | 1,583 |
|
| Undiscounted excess amount | $ | 4,906 |
|
New Accounting Pronouncements
In August 2018, the FASB issued ASU No. 2018-13, "Changes to the Disclosure Requirements for Fair Value Measurement." This ASU amends and removes several disclosure requirements including the valuation processes for Level 3 fair value measurements. The ASU also modifies some disclosure requirements and requires additional disclosures for changes in unrealized gains and losses included in other comprehensive income for recurring Level 3 fair value measurements and requires the range and weighted average of significant unobservable inputs used to develop Level 3 fair value measurements.
The ASU is effective for fiscal years beginning after December 15, 2019, including interim periods therein. Early adoption is permitted for any eliminated or modified disclosures upon issuance of this ASU. The Company does not expect this new guidance to have a material impact on its financial statements upon adoption.
3. INVESTMENT PROPERTY
Investment property consisted of the following amounts as of December 31, 2019 and December 31, 2018 (in thousands):
|
| | | | | | | | |
| | December 31, 2019 | | December 31, 2018 | |
| Buildings and improvements | $ | 1,077,207 |
| | $ | 693,834 |
| (1) |
| Less: accumulated depreciation | (51,719 | ) | | (30,574 | ) | |
| Buildings and improvements, net | 1,025,488 |
| | 663,260 |
| |
| Land | 278,639 |
| | 123,929 |
| |
| Investment property, net | $ | 1,304,127 |
| (2) | $ | 787,189 |
| |
| |
| (1) | Included in buildings and improvements as of December 31, 2018 is approximately $14.5 million of construction-in-progress related to the expansion at Bishop's Square. The Company commenced construction in October 2017 to add an additional floor and make various upgrades to the property. The construction was completed in July 2019. |
| |
| (2) | Includes $49.8 million classified within assets held for sale as of December 31, 2019. |
Recent Acquisitions of Investment Property
In May 2019, the Company acquired ABC Westland, an industrial property located in The Hague, Netherlands. The net purchase price for ABC Westland was €116.4 million (approximately $130.3 million assuming a rate of $1.12 per EUR as of the acquisition date), exclusive of transaction costs and working capital reserves. The Company funded the purchase in part by obtaining secured mortgage debt at closing.
In September 2019, the Company acquired The Promenade Shops at Briargate, an outdoor retail center located in Colorado Springs, Colorado. The net purchase price of The Promenade Shops at Briargate was $93.2 million exclusive of transaction costs and working capital reserves.
In September 2019, the Company acquired Gdańsk PL II, an industrial logistics property located in Gdańsk, Poland. The net purchase price was €26.9 million (approximately $29.9 million assuming rate of $1.11 per EUR as of the acquisition date), exclusive of transaction costs and working capital reserves.
In September 2019, the Company acquired Łódź Urban Logistics, an industrial logistics property located in Łódź, Poland. The net purchase price was €22.6 million (approximately $25.2 million assuming a rate of $1.11 per EUR as of the acquisition date), exclusive of transaction costs and working capital reserves. The Company funded the purchase in part by obtaining secured mortgage debt at closing.
In September 2019, the Company acquired Glasgow West End, a student housing property located in Glasgow, United Kingdom. The net purchase price was £72.0 million (approximately $89.5 million assuming a rate of $1.24 per GBP as of acquisition date), exclusive of transaction costs and working capital reserves. The Company funded the purchase in part by obtaining secured mortgage debt at closing.
In November 2019, the Company acquired Charles Tyrwhitt DC, an industrial logistics property located in Milton Keynes, United Kingdom. The net purchase price was £15.5 million (approximately $19.9 million assuming a rate of $1.29 per GBP as of the acquisition date), exclusive of transaction costs and working capital reserves.
In November 2019, the Company acquired DSG Bristol, an industrial logistics property located in Bristol, United Kingdom. The net purchase price was £36.6 million (approximately $47.0 million assuming a rate of $1.29 per GBP as of the acquisition date), exclusive of transaction costs and working capital reserves.
In November 2019, the Company acquired The Alloy, a student-dominated apartment property located in College Park, Maryland. The net purchase price was $98.0 million, exclusive of transaction costs and working capital reserves.
In December 2019, the Company acquired Royal Mail Edinburgh, a sorting warehouse industrial property located in Edinburgh, United Kingdom. The net purchase price was £25.4 million (approximately $33.4 million assuming a rate of $1.31 per GBP as of the acquisition date), exclusive of transaction costs and working capital reserves.
See Note 4 — Recent Acquisitions of Real Estate for additional information regarding the Company’s real estate portfolio.
As of December 31, 2019, the cost basis and accumulated amortization related to lease intangibles were as follows (in thousands):
|
| | | | | | | | | | | |
| | Lease Intangibles |
| | In-Place Leases (1) | | Out-of-Market Lease Assets | | Out-of-Market Lease Liabilities |
| | | |
| Cost | $ | 136,215 |
| | $ | 8,957 |
| | $ | (25,579 | ) |
| Less: accumulated amortization | (43,808 | ) | | (2,827 | ) | | 5,946 |
|
| Net | $ | 92,407 |
| | $ | 6,130 |
| | $ | (19,633 | ) |
| |
| (1) | The Company adopted ASC 842 beginning January 1, 2019 and reclassified certain assets from Intangible lease assets, net to Right-of-use asset, net in the Company’s Consolidated Balance Sheets. See Note 2—Summary of Significant Accounting Policies for more information on the adoption of ASC 842. |
As of December 31, 2018, the cost basis and accumulated amortization related to lease intangibles were as follows (in thousands):
|
| | | | | | | | | | | |
| | Lease Intangibles |
| | In-Place Leases | | Out-of-Market Lease Assets | | Out-of-Market Lease Liabilities |
| | | |
| Cost | $ | 118,585 |
| | $ | 5,558 |
| | $ | (22,318 | ) |
| Less: accumulated amortization | (31,320 | ) | | (2,126 | ) | | 4,284 |
|
| Net | $ | 87,265 |
| | $ | 3,432 |
| | $ | (18,034 | ) |
Amortization expense of in-place leases was $20.6 million, $18.3 million and $18.3 million for the years ended December 31, 2019, 2018 and 2017, respectively. Net amortization of out-of-market leases resulted in an increase to rental revenue of $1.8 million, $1.1 million and $1.1 million for the years ended December 31, 2019, 2018 and 2017, respectively.
Anticipated amortization of the Company’s in-place leases and out-of-market lease liabilities, net, for each of the years ending December 31, 2020 through December 31, 2024 are as follows (in thousands):
|
| | | | | | | |
| | In-Place Lease | | Out-of-Market Leases, Net |
| 2020 | $ | 24,879 |
| | $ | (1,588 | ) |
| 2021 | $ | 14,845 |
| | $ | (1,515 | ) |
| 2022 | $ | 11,852 |
| | $ | (1,377 | ) |
| 2023 | $ | 9,734 |
| | $ | (1,114 | ) |
| 2024 | $ | 6,431 |
| | $ | (702 | ) |
Leases
The Company’s commercial leases are generally for terms of 15 years or less and may include multiple options to extend the lease term upon tenant election. The Company’s leases typically do not include an option to purchase. Generally, the Company does not expect the value of its real estate assets to be impacted materially at the end of any individual lease term, as the Company is typically able to re-lease the space and real estate assets tend to hold their value over a long period of time.
Tenant terminations prior to the lease end date occasionally result in a one-time termination fee based on the remaining unpaid lease payments including variable payments and could be material to the tenant. Many of the Company’s leases have increasing minimum rental rates during the terms of the leases through escalation provisions. In addition, the majority of the Company’s leases provide for separate billings for variable rent, such as, reimbursements of real estate taxes, maintenance and insurance and may include an amount based on a percentage of the tenants’ sales. Total billings related to expense reimbursements from tenants for the year ended December 31, 2019, was $15.4 million, which is included in Rental revenue on the Consolidated Statements of Operations and Comprehensive Income (Loss).
The Company has entered into non-cancelable lease agreements with tenants for space. As of December 31, 2019, the approximate fixed future minimum rentals for each of the years ending December 31, 2020 through 2024 and thereafter for the Company’s commercial properties are as follows (in thousands):
|
| | | |
| | Fixed Future Minimum Rentals |
| 2020 | $ | 77,536 |
|
| 2021 | 70,760 |
|
| 2022 | 60,455 |
|
| 2023 | 54,638 |
|
| 2024 | 46,700 |
|
| Thereafter | 216,049 |
|
| Total | $ | 526,138 |
|
As of December 31, 2018, prior to the adoption of ASU 2016-02, the approximate fixed future minimum rentals for each of the years ending December 31, 2019 through 2023 and thereafter for the Company’s commercial properties are as follows (in thousands):
|
| | | |
| | Fixed Future Minimum Rentals |
| 2019 | $ | 52,357 |
|
| 2020 | 48,343 |
|
| 2021 | 40,847 |
|
| 2022 | 32,881 |
|
| 2023 | 30,951 |
|
| Thereafter | 148,329 |
|
| Total | $ | 353,708 |
|
During the years ended December 31, 2019, 2018 and 2017, the Company did not earn more than 10% of its revenue from any individual tenant.
The Company also enters into leases with tenants at its student housing properties and multi-family properties. These leases generally have terms less than one year and do not contain options to extend, terminate or purchase, escalation clauses, or other such terms, which are common in the Company’s commercial leases.
4. RECENT ACQUISITIONS OF REAL ESTATE
The Company acquired 9 properties during the year ended December 31, 2019, and 3 properties during each of the years ended December 31, 2018 and 2017. The amounts recognized for major assets acquired as of the acquisition date were determined by allocating the purchase price, which includes transaction costs beginning January 1, 2018 as further described below, of each property acquired in 2019, 2018 and 2017 as follows (in thousands):
|
| | | | | | | | | | | | | | | | | | | | | | | | | | | | | | |
| Property Name | | Acquisition
Date | | Building and
Improvements (2) | | Land (2) | | In-place Lease Intangibles (2) | | Out-of-
Market Lease
Intangibles, Net (2) | | Right of Use Asset, net | | Discount (premium) on assumed mortgage loan (2) | | Total (2) |
2019 (1) | | | | | | | | | | | | | | | | |
| ABC Westland | | 5/3/2019 | | $ | 74,054 |
| (3) | $ | 59,664 |
| | $ | 6,902 |
| | $ | (1,124 | ) | | $ | — |
| | $ | — |
| | $ | 139,496 |
|
| Promenade Shops at Briargate | | 9/13/2019 | | $ | 55,425 |
| | $ | 19,199 |
| | $ | 20,017 |
| | $ | (1,047 | ) | | $ | — |
| | $ | — |
| | $ | 93,594 |
|
| Gdańsk PL II | | 9/24/2019 | | $ | 18,707 |
| | $ | 6,174 |
| | $ | 5,013 |
| | $ | 449 |
| | $ | — |
| | $ | — |
| | $ | 30,343 |
|
| Łódź Urban Logistics | | 9/26/2019 | | $ | 19,298 |
| | $ | — |
| | $ | 3,684 |
| | $ | (134 | ) | | $ | 2,777 |
| (5) | $ | — |
| | $ | 25,625 |
|
| Glasgow West End | | 9/27/2019 | | $ | 66,255 |
| | $ | 22,276 |
| | $ | 3,170 |
| | $ | — |
| | $ | — |
| | $ | — |
| | $ | 91,701 |
|
| Charles Tyrwhitt DC | | 11/8/2019 | | $ | 11,207 |
| | $ | 7,013 |
| | $ | 3,587 |
| | $ | (489 | ) | | $ | — |
| | $ | — |
| | $ | 21,318 |
|
| The Alloy | | 11/12/2019 | | $ | 81,956 |
| | $ | 14,194 |
| | $ | 3,291 |
| | $ | — |
| | $ | — |
| | $ | — |
| | $ | 99,441 |
|
| DSG Bristol | | 11/18/2019 | | $ | 22,503 |
| | $ | 17,713 |
| | $ | 8,319 |
| | $ | 1,507 |
| | $ | — |
| | $ | — |
| | $ | 50,042 |
|
| Royal Mail | | 12/12/2019 | | $ | 23,735 |
| | $ | 6,170 |
| | $ | 5,536 |
| | $ | — |
| | $ | — |
| | $ | — |
| | $ | 35,441 |
|
| | | | | | | | | | | | | | | | |
|
| 2018 | | | | | | | | | | | | | | | | |
| Venue Museum District | | 9/21/2018 | | $ | 52,538 |
| | $ | 17,409 |
| | $ | 3,240 |
| | $ | — |
| | $ | — |
| | $ | — |
| | $ | 73,187 |
|
| Fresh Park Venlo | | 10/5/2018 | | $ | 128,977 |
| | $ | — |
| | $ | 11,880 |
| | $ | (2,583 | ) | | $ | — |
| | $ | — |
| | $ | 138,274 |
|
| Maintal Logistics | | 12/31/2018 | | $ | 30,175 |
| | $ | 15,031 |
| | $ | 2,287 |
| | $ | (691 | ) | | $ | — |
| | $ | — |
| | $ | 46,802 |
|
| | | | | | | | | | | | | | | | | |
| 2017 | | | | | | | | | | | | | | | | |
| Rookwood | | 1/6/2017 | | $ | 132,466 |
| | $ | 45,320 |
| | $ | 27,477 |
| | $ | (12,275 | ) | | $ | — |
| | $ | 740 |
| | $ | 193,728 |
|
| Montrose Student Residences | | 3/24/2017 | | $ | 33,705 |
| | $ | 5,691 |
| | $ | 1,282 |
| (4) | $ | (56 | ) | | $ | — |
| | $ | — |
| | $ | 40,622 |
|
| Queen’s Court Student Residences | | 10/11/2017 | | $ | 50,894 |
| | $ | 14,086 |
| | $ | 1,819 |
| | $ | (1,513 | ) | | $ | — |
| | $ | — |
| | $ | 65,286 |
|
| |
| (1) | For more information on acquisitions completed during the year ended December 31, 2019, refer to Note 3 — Investment Property. |
| |
| (2) | For acquisitions denominated in a foreign currency, amounts have been translated to U.S. dollars at a rate based on the exchange rate in effect on the acquisition date. |
| |
| (3) | Amount includes approximately €14.1 million (approximately $15.8 million assuming a rate of $1.12 per EUR as of the acquisition date) of solar panels at date of acquisition, which are to be depreciated using the straight-line method assuming a useful life of 25 years. |
| |
| (4) | Includes $0.6 million related to the retail areas of the Montrose Student Residences that have lease terms between two years and 19 years. |
| |
| (5) | Amount is net of a $1.6 million right of use lease liability. |
Prior to January 1, 2018, acquisitions of properties were accounted for utilizing the acquisition method and, accordingly, were recorded at the estimated fair values of the assets acquired and liabilities assumed. For acquisitions completed prior to January 1, 2018, estimates of fair values were based upon inputs and assumptions summarized below. In January 2017, the FASB issued ASU 2017-01 to clarify the definition of a business with the objective of adding guidance to assist entities with evaluating whether transactions should be accounted for as acquisitions (or disposals) of assets or businesses. The amendments to the FASB Accounting Standards Codification were effective for public entities for annual and interim periods in fiscal years beginning after December 15, 2017. On January 1, 2018, the Company adopted ASU 2017-01, pursuant to which the Company determined its acquisitions completed since adoption to be accounted for using the asset acquisition guidance, and are not included in the summary of inputs and assumptions below.
The weighted average amortization period for the intangible assets and liabilities acquired in connection with the 2017 acquisitions, as of the date of the respective acquisition, was as follows (in years):
|
| | | | | | |
| | | In-Place Leases | | Above-Market Lease Assets | | Below-Market Lease Liabilities |
| 2017 Acquisitions: | | | | | | |
| Rookwood | | 8.3 | | 15.7 | | 13.7 |
| Montrose Student Residences | | 6.5 | | — | | 18.9 |
Queen’s Court Student Residences(1) | | 0.9 | | — | | — |
| |
| (1) | Excludes the effect of any 999-year leases, which significantly increases the weighted average useful life for these intangibles. |
The table below includes the amounts of revenue and net income (loss) of the acquisitions completed during the year ended December 31, 2017, which are included in the Company’s consolidated statements of operations and comprehensive income (loss) for the year ended December 31, 2017 (in thousands):
|
| | | | | | |
| | | | | For the Year Ended |
| 2017 Acquisitions | | | | 12/31/2017 |
| Rookwood | | Revenue | | $ | 19,507 |
|
| | | Net income (loss) | | $ | (7,041 | ) |
| Montrose Student Residences | | Revenue | | $ | 2,579 |
|
| | | Net income (loss) | | $ | (3,049 | ) |
| Queen’s Court Student Residences | | Revenue | | $ | 1,200 |
|
| | | Net income (loss) | | $ | (1,415 | ) |
The following unaudited consolidated information is presented to give effect to the acquisitions completed during the year ended December 31, 2017 as if the acquisitions had occurred on January 1, 2016. The pro forma net loss was adjusted to exclude acquisition-related fees and expenses of $10.0 million for the year ended December 31, 2017. For the year ended December 31, 2016, the pro forma net loss was adjusted to include acquisition fees and expenses of $10.0 million, relating to the 2017 acquisitions, as if these fees and expenses had been incurred as of January 1, 2016.
The information below is not necessarily indicative of what the actual results of operations would have been had the Company completed these acquisitions on January 1, 2016, nor does it purport to represent the Company’s future operations (in thousands):
|
| | | | | | | | |
| | | For the Years Ended |
| | | December 31, |
| | | Pro Forma 2017 | | Pro Forma 2016 |
| Revenues | | $ | 64,883 |
| | $ | 52,794 |
|
| Net income (loss) attributable to common stockholders | | $ | (10,237 | ) | | $ | (16,833 | ) |
5. DEBT FINANCING
As of December 31, 2019 and 2018, the Company had approximately $865.7 million and $545.8 million of debt outstanding, respectively, with a weighted average years to maturity of 2.6 years and 2.9 years, and a weighted average interest rate of 2.54% and 2.85%, respectively. The following table describes the Company’s debt outstanding at December 31, 2019 and 2018 (in thousands, except interest rates):
|
| | | | | | | | | | | | | | | | | | | | |
| Description | | Origination or Assumption Date | | Maturity Date | | Maximum Capacity in Functional Currency | | Interest Rate Description | | Interest Rate as of December 31, 2019 | | Principal Outstanding at December 31, 2019 | | Principal Outstanding at December 31, 2018 |
| Secured Mortgage Debt | | | | | | | | | | | | | | |
| Bishop's Square | | 3/3/2015 | | 3/2/2022 | | € | 55,200 |
| | Euribor + 1.30% (1) | | 1.30% | | $ | 61,907 |
| | $ | 63,171 |
|
| Domain Apartments | | 1/29/2016 | | 1/29/2020 | | $ | 34,300 |
| | Libor + 1.60% (1) | | 3.36% | | 34,300 |
| (2) | 34,300 |
|
| Cottonwood Corporate Center | | 7/5/2016 | | 8/1/2023 | | $ | 78,000 |
| | Fixed | | 2.98% | | 72,359 |
| | 74,110 |
|
| Goodyear Crossing II | | 8/18/2016 | | 8/18/2021 | | $ | 29,000 |
| | Libor + 2.00% | | 3.71% | | 29,000 |
| (3) | 29,000 |
|
| Rookwood Commons | | 1/6/2017 | | 7/1/2020 | | $ | 67,000 |
| | Fixed | | 3.13% | | 67,000 |
| | 67,000 |
|
| Rookwood Pavilion | | 1/6/2017 | | 7/1/2020 | | $ | 29,000 |
| | Fixed | | 2.87% | | 29,000 |
| | 29,000 |
|
| Montrose Student Residences | | 3/24/2017 | | 3/23/2022 | | € | 22,605 |
| | Euribor + 1.85% (1) | | 1.85% | | 25,352 |
| | 25,869 |
|
| Queen's Court Student Residences | | 12/18/2017 | | 12/18/2022 | | £ | 29,500 |
| | Libor + 2.00%(1) | | 2.75% | | 38,896 |
| | 37,565 |
|
| Venue Museum District | | 9/21/2018 | | 10/9/2020 | | $ | 45,000 |
| | Libor + 1.95% (1) | | 4.02% | | 45,000 |
| | 45,000 |
|
| Fresh Park Venlo | | 10/3/2018 | | 8/15/2023 | | € | 75,000 |
| | Euribor + 1.50% (1) | | 1.50% | | 84,092 |
| | 85,809 |
|
| Maintal Logistics | | 2/21/2019 | | 2/28/2024 | | € | 23,500 |
| | Euribor + 1.10% (1) | | 1.10% | | 26,136 |
| | — |
|
| ABC Westland | | 5/3/2019 | | 2/15/2024 | | € | 75,000 |
| | Euribor + 1.50% (1) | | 1.50% | | 82,655 |
| | — |
|
| Łódź Urban Logistics | | 9/20/2019 | | 9/20/2024 | | € | 13,600 |
| | Fixed (3) | | 1.05% | | 15,211 |
| | — |
|
| Glasgow West End | | 9/26/2019 | | 9/26/2024 | | £ | 43,200 |
| | Libor + 1.80% (1) | | 2.55% | | 56,959 |
| | — |
|
| Gdańsk PL II | | 10/4/2019 | | 9/20/2024 | | € | 16,800 |
| | Fixed (4) | | 1.05% | | 18,790 |
| | — |
|
| Other Notes Payable | | | | | | | | | | | | | | |
| JPMorgan Chase Revolving Credit Facility | | 9/13/2019 | | 11/15/2022 | | $ | 275,000 |
| | Variable | | 3.34% | | $ | 104,000 |
| | $ | — |
|
| Notes Payable | | | | | | | | | | $ | 790,657 |
| | $ | 490,824 |
|
| Affiliate Note Payable | | | | | | | | | | | | | | |
| Credit Facility with Hines | | 10/2/2017 | | 12/31/2020 | | $ | 75,000 |
| | Variable | | 3.29% | | 75,000 |
| | 55,000 |
|
| Total Note Payable to Affiliate | | | | | | | | | | $ | 75,000 |
| | $ | 55,000 |
|
| Total Principal Outstanding | | | | | | | | | | $ | 865,657 |
| | $ | 545,824 |
|
Unamortized discount (5) | | | | | | | | | | (104 | ) | | (316 | ) |
Unamortized financing fees (6) | | | | | | | | | | (4,126 | ) | | (3,069 | ) |
| Total | | | | | | | | | | $ | 861,427 |
| | $ | 542,439 |
|
| |
| (1) | On the loan origination date, the Company entered into an interest rate cap agreement as an economic hedge against the variability of future interest rates on this borrowing. See Note 6 — Derivative Instruments for further details. |
| |
| (2) | As of December 31, 2019, this amount was included in liabilities associated with assets held for sale. In January 2020 the Company paid off the outstanding balance using proceeds from the sale of the Domain Apartments, which occurred in January 2020. See Note 14 — Subsequent Events for further details on the disposition of Domain Apartments. |
| |
| (3) | In February 2020 the Company paid off the outstanding balance using proceeds from the sale of Goodyear Crossing, which occurred in February 2020. See Note 14 — Subsequent Events for further details on the disposition of Goodyear Crossing. |
| |
| (4) | On the loan origination date, the Company entered into an interest rate swap contract effectively fixing the interest rate for the full term of the facility. See Note 6 — Derivative Instruments for further details. |
| |
| (5) | The Company assumed notes payable in connection with its acquisition of Rookwood, which were recorded at the estimated fair value as of the date of acquisition. The difference between the fair value at acquisition and the principal outstanding is amortized over the term of the related notes. |
| |
| (6) | Deferred financing costs consist of direct costs incurred in obtaining debt financing. These costs are presented as a direct |
reduction from the related debt liability for permanent mortgages and presented as an asset for revolving credit arrangements. In total, deferred financing costs had a carrying value of $6.4 million and $3.1 million for the years ended December 31, 2019 and 2018. These costs are amortized into interest expense on a straight-line basis, which approximates the effective interest method, over the terms of the obligations. For the years ended December 31, 2019, 2018 and 2017, $1.4 million, $0.6 million and $0.3 million of deferred financing costs were amortized into interest expense in the accompanying consolidated statement of operations, respectively.
The Company often enters into mortgage agreements to provide secured financing for its acquisitions of real estate investments. These mortgage agreements are subject to certain conditions and contain customary covenants and events of default. Refer below for additional discussion on Financial Covenants relating to the Company’s mortgage-level debt.
JPMorgan Chase Revolving Credit Facility
On September 13, 2019 (as amended on November 15, 2019), the Operating Partnership entered into a credit agreement, which we refer to as the “Credit Agreement”, with JPMorgan Chase Bank, N.A. (“Chase”), as administrative agent for itself and various lenders named in the Credit Agreement, which provides for borrowings up to a maximum aggregate principal amount of $425.0 million denominated in U.S. dollars, British pound sterling, Euros, Australian dollars or Canadian dollars with aggregate foreign currency commitments constituting up to $137.5 million of that amount. The Credit Agreement has a maturity date of November 15, 2022, subject to 2 one-year extensions at our option.
On November 15, 2019, we made borrowings of $104.0 million at closing under the Credit Agreement. From November 15, 2019 through December 31, 2019, we made 0 additional borrowing or payments on the facility, resulting in an outstanding balance of $104.0 million as of December 31, 2019. From January 1, 2020 through March 30, 2020, the Company made $59.0 million in additional draws and made 0 additional payments under the Credit Agreement, which resulted in the Company having a $163.0 million outstanding balance under the Credit Agreement as of March 30, 2020.
Interest on our borrowings under the Credit Agreement will be payable based on either (a) the Alternate Base Rate plus the Applicable Rate or (b) the Adjusted LIBO Rate plus the Applicable Rate, subject to our election; provided, however, for revolving loans denominated in Australian dollars, Canadian dollars, Euros, or Japanese Yen, the Australian Bill Rate, the CDOR Rate, the EURIBOR Screen Rate or the Yen Rate, respectively, will be referred to in lieu of the Adjusted LIBO Rate. The Alternate Base Rate is equal to the greater of: (a) the Prime Rate, (b) Federal Funds Effective Rate plus 0.5%, or (c) an adjusted LIBOR rate for a one month period plus 1.0%. The Adjusted LIBO Rate is equal to the LIBO rate, which is derived from the London interbank offered rate (“LIBOR”), for the applicable interest period, as determined by JPMorgan, multiplied by the Statutory Reserve Rate determined by the Board of Governors of the Federal Reserve System of the United States of America, provided that, with respect to borrowings denominated in a foreign currency, the Adjusted LIBO Rate will be equal to the LIBO Rate. Customary fall-back provisions apply if LIBOR is unavailable. The Applicable Rate is based on our ratio of indebtedness to total asset value and will be determined as set forth in the Credit Agreement. The Applicable Rate for loans bearing interest determined by reference to the Alternative Base Rate will range from 0.35% to 1.05%, and the Applicable Rate for loans bearing interest determined by reference to the Adjusted LIBO Rate will range from 1.35% to 2.05%, in each case depending on the ratio and whether it is a revolving loan or a term loan.
Hines Credit Facility
On October 2, 2017, the Operating Partnership entered into an uncommitted loan agreement (as amended the “Hines Credit Facility”) with Hines for a maximum principal amount of $240.0 million. On November 30, 2017, the Operating Partnership amended the Hines Credit Facility to reduce the maximum principal amount to $75.0 million and further amended it in December 2018 to extend the maturity date as described below. Interest on each advance under the Hines Credit Facility is charged monthly at a variable rate, which is (i) Hines’ then-current borrowing rate under its revolving credit facility or (ii) if the Operating Partnership enters into a revolving credit facility (“the OP Facility”), the rate under such facility. Each advance under the Hines Credit Facility must be repaid within six months, subject to 1 six-month extension at the option of the Operating Partnership and subject to the satisfaction of certain conditions. Effective as of December 11, 2019, the Hines Credit Facility will terminate on the earlier of (a) the termination of the availability period as determined by Hines at its discretion (which will not impact the maturity date of any outstanding or previously approved advance under the loan agreement); (b) December 31, 2020; and (c) the date Hines accelerates the repayment of the loan agreement pursuant to any event of default.
Notwithstanding that each advance under the Hines Credit Facility matures six months after it is made, the Operating Partnership is required to repay each advance with any capital raised, unless the Operating Partnership enters into a revolving credit facility, at which point the Operating Partnership may use such proceeds from its public offering to repay the OP Facility, if any, prior to repaying any advances under the Hines Credit Facility. The Hines Credit Facility also permits voluntary prepayment of principal and accrued interest.
The Hines Credit Facility requires the maintenance of certain financial covenants beginning the earlier of (a) September 30, 2018 or (b) the effective date of the OP Facility, if any, which includes covenants concerning indebtedness to total asset value. In addition, the Hines Credit Facility contains customary affirmative and negative covenants, which, among other things, prohibit the Company and the Operating Partnership from: (i) merging with other companies or changing ownership interest; (ii) selling all or substantially all of the Company’s assets or properties; and (iii) if in default under the loan agreement, paying distributions to the Company’s stockholders other than as required to maintain the Company’s status as a real estate investment trust. The Hines Credit Facility also requires the Company to deliver to Hines certain quarterly and annual financial information.
For the year ended December 31, 2019, the Company made draws of $134.0 million and made payments of $114.0 million under the Hines Credit Facility. The Company had $75.0 million outstanding on December 31, 2019. From January 1, 2020 through March 30, 2020, the Company made 0 additional draws and made $64.0 million in additional payments under the Hines Credit Facility, which resulted in the Company having a $11.0 million outstanding balance under the Hines Credit Facility as of March 30, 2020.
Financial Covenants
The Company’s mortgage and other loan documents for the debt described in the table above contain customary events of default, with corresponding grace periods, including payment defaults, bankruptcy-related defaults, and customary covenants, including limitations on liens and indebtedness and maintenance of certain financial ratios. The Company is not aware of any instances of noncompliance with financial covenants on any of its loans as of December 31, 2019.
Principal Payments on Debt
The Company is required to make the following principal payments on its outstanding notes payable for each of the years ending December 31, 2020 through December 31, 2024 and for the period thereafter (in thousands).
|
| | | | | | | | | | | | | | | | | | | | | | | |
| | Payments Due by Year |
| | 2020 | | 2021 | | 2022 | | 2023 | | 2024 | | Thereafter |
| Principal payments | $ | 255,625 |
| (1) | $ | 34,379 |
| (2) | $ | 235,589 |
| | $ | 154,393 |
| | $ | 185,671 |
| | $ | — |
|
| |
| (1) | Includes Domain Apartments debt of $34.3 million that was paid off in January 2020 using proceeds from the sale of the Domain Apartments, which occurred in January 2020. See Note 14 — Subsequent Events for further details on the disposition of Domain Apartments. |
| |
| (2) | Includes Goodyear Crossing II debt of $29.0 million that was paid off in February 2020 using proceeds from the sale of Goodyear Crossing II, which occurred in February 2020. See Note 14 — Subsequent Events for further details on the disposition of Goodyear Crossing II. |
As of March 30, 2020, the Company is required to make $152.0 million in principal payments on its outstanding notes payable that mature through March 2021, $11.0 million of which relates to the Company’s credit facility with Hines. Although the mortgage loans are non–recourse, which would allow the Company to provide a deed in–lieu of payment, the Company expects to be able to repay all principal payments with cash on hand or proceeds raised from its current offering, utilize additional capacity on the Credit Agreement, or to be able to refinance the debt terms on the principal outstanding.
LIBOR is expected to be discontinued after 2021. As of December 31, 2019 the Company has three loans with a variable interest rate tied to LIBOR with maturities beyond 2021. The loan agreements provide procedures for determining a replacement or alternative rate in the event that LIBOR is unavailable. However, there can be no assurances as to whether such replacement or alternative rate will be more or less favorable than LIBOR. The Company intends to monitor the developments with respect to the potential phasing out of LIBOR after 2021 and work with its lenders to ensure any transition away from LIBOR will have minimal impact on its financial condition, but can provide no assurances regarding the impact of the discontinuation of LIBOR.
6. DERIVATIVE INSTRUMENTS
The Company has entered into several interest rate swap contracts and interest rate cap contracts in connection with certain of its secured mortgage loans in order to limit its exposure against the variability of future interest rates on its variable interest rate borrowings. The Company’s interest rate swaps economically fixed the interest rates on each of the loans to which they relate and the interest rate cap agreements have economically limited the interest rate on each of the loans to which they relate. The Company has not designated any of these derivatives as hedges for accounting purposes. The Company has not entered into a master netting arrangement with its third-party counterparty and does not offset on its consolidated balance sheets the fair value amount recorded for its derivative instruments.
The Company has also entered into foreign currency forward contracts as economic hedges against the variability of foreign exchange rates related to certain cash flows of some of its international investments. These forward contracts fixed the currency exchange rates on each of the investments to which they related. The Company did not designate any of these contracts as fair value or cash flow hedges for accounting purposes. In December 2018, the Company entered into a €15.0 million foreign currency forward contract with an effective date of December 20, 2018 and a trade date of February 25, 2019, in connection with the funding of the Maintal Logistics acquisition. Additionally, in March 2019, the Company entered into an initial €46.0 million foreign currency forward contract with an effective date of March 1, 2019 and a trade date of March 20, 2019, in connection with the acquisition of ABC Westland. Upon settlement of the initial forward contract in March 2019, the Company entered into a new €46.0 million foreign currency forward contract in connection with the acquisition of ABC Westland with an effective date of March 31, 2019 and a trade date of April 3, 2019. In October 2019, the Company entered into 2 foreign currency forward contracts for £33.4 million and £18.6 million, each with an effective date of October 24, 2019 and a trade date of October 28, 2019 in connection with the acquisitions of Charles Tyrwhitt Distribution Centre and DSG Bristol. In December 2019, the Company entered into a £26.0 million foreign currency forward contract with an effective date of December 9, 2019 and a trade date of December 10, 2019 in connection with the acquisition of Royal Mail Edinburgh. See Note 3—Investment Property for additional information regarding the acquisition of these properties. The Company also entered into 2 foreign currency forward contracts in October 2019 and December 2019 in order to buy U.S. dollars using future proceeds received on debt denominated in British pounds in the amounts of £31.0 million and £15.0 million, respectively, each with a trade date of February 28, 2020. In February 2020, these foreign currency contracts were extended to a trade date of May 29, 2020. See Foreign Currency Forward Contracts table below for additional information on these foreign currency contracts as of December 31, 2019.
The table below provides additional information regarding the Company’s interest rate derivative contracts (in thousands, except percentages).
|
| | | | | | | | | | | | | | | | | | | |
| Interest Rate Contracts | | | | | | | | | | | | |
| Type | | Property | | Effective Date | | Expiration Date | | Maximum Capacity of Debt in Functional Currency | | Notional Amount | | Interest Rate Received | | Pay Rate /Strike Rate |
| Interest rate cap | | Bishop’s Square | | March 3, 2015 | | April 25, 2020 | | € | 55,200 |
| | € | 55,200 |
| | Euribor | | 2.00 % |
|
Interest rate cap
| | Montrose Student Residences | | March 24, 2017 | | March 23, 2022 | | € | 22,605 |
| | € | 16,954 |
| | Euribor | | 1.25 % |
|
Interest rate cap
| | Queen’s Court Student Residences | | December 20, 2017 | | December 20, 2020 | | £ | 29,500 |
| | £ | 22,125 |
| | LIBOR | | 2.00 % |
|
Interest rate cap
| | Venue Museum District | | September 21, 2018 | | October 9, 2020 | | $ | 45,000 |
| | $ | 45,000 |
| | LIBOR | | 3.50 % |
|
| Interest rate cap | | Fresh Park Venlo | | October 8, 2018 | | August 15, 2023 | | € | 75,000 |
| | € | 52,487 |
| | Euribor | | 2.00 % |
|
| Interest rate cap | | Maintal Logistics | | February 28, 2019 | | February 28, 2024 | | € | 23,500 |
| | € | 16,450 |
| | Euribor | | 2.00 % |
|
| Interest rate cap | | ABC Westland | | May 3, 2019 | | February 15, 2024 | | € | 75,000 |
| | € | 52,500 |
| | Euribor | | 1.00 % |
|
| Interest rate cap | | Glasgow West End | | September 27, 2019 | | September 24, 2024 | | £ | 43,200 |
| | £ | 32,400 |
| | LIBOR | | 2.00 % |
|
| Interest rate swap | | Gdańsk PL II | | October 10, 2019 | | September 20, 2019 | | € | 16,800 |
| | € | 16,800 |
| | Euribor | | (0.36 | )% |
| Interest rate swap | | Łódź Urban Logistics
| | October 10, 2019 | | September 20, 2024 | | € | 13,600 |
| | € | 13,600 |
| | Euribor | | (0.36 | )% |
The table below provides additional information regarding the Company’s foreign currency forward contracts that were outstanding as of December 31, 2019 (in thousands).
|
| | | | | | | | | | | | |
| Foreign Currency Forward Contracts | | | | | | |
| Effective Date | | Expiration Date | | Notional Amount | | Buy/Sell | | Traded Currency Rate |
| October 24, 2019 | | February 28, 2020 | | £ | 31,000 |
| | GBP/USD | | $ | 1.29 |
|
| December 9, 2019 | | February 28, 2020 | | £ | 15,000 |
| | GBP/USD | | $ | 1.32 |
|
The table below presents the effects of the changes in fair value of the Company’s derivative instrument in the Company’s consolidated statements of operations and comprehensive income (loss) for the years ended December 31, 2019 and 2018 (in thousands):
|
| | | | | | | | | | | | |
| | | Gain (Loss) Recorded on Derivative Instruments |
| | | Year Ended |
| | | 12/31/2019 | | 12/31/2018 | | 12/31/2017 |
| Derivatives not designated as hedging instruments: | | | | | | |
| Interest rate swaps | | $ | (149 | ) | | $ | — |
| | $ | — |
|
| Interest rate caps | | (454 | ) | | (236 | ) | | (134 | ) |
| Foreign currency forward contracts | | (1,689 | ) | | (36 | ) | | (238 | ) |
| Total gain (loss) on derivatives | | $ | (2,292 | ) | | $ | (272 | ) | | $ | (372 | ) |
7. STOCKHOLDERS’ EQUITY
The Company raises capital for its investments primarily through public offerings of its common stock. In connection with the Restructuring and the Follow-On Offering, on November 30, 2017, the Company (i) redesignated its issued and outstanding Class A shares of common stock, Class T shares of common stock, Class I shares of common stock and Class J shares of common stock as “Class AX shares,” “Class TX shares,” “Class IX shares” and “Class JX shares,” (collectively, the “IPO Shares”) respectively, and (ii) reclassified the authorized but unissued portion of its common stock into 4 additional classes of shares of common stock: “Class T shares,” “Class S shares,” “Class D shares,” and “Class I shares.” The Company is offering its shares of common stock in the Follow-on Offering in any combination of Class T shares, Class S shares, Class D shares and Class I shares (collectively, the “Follow-on Offering Shares”). All shares of the Company’s common stock have the same voting rights and rights upon liquidation, although distributions received by the Company’s stockholders are expected to differ due to the distribution and stockholder servicing fees payable with respect to the applicable share classes, which reduce distributions.
The Company complies with the FASB ASC 480 “Distinguishing Liabilities from Equity” which requires, among other things, that financial instruments that represent a mandatory obligation of the Company to repurchase shares be classified as liabilities and reported at settlement value. When shares are tendered for redemption and approved by the board of directors, the Company will reclassify such obligations from equity to an accrued liability based upon their respective settlement values and redeem those shares in the subsequent month pursuant to the Company’s current share redemption program.
Common Stock
As of December 31, 2019 and 2018, the Company had the following classes of shares of common stock authorized, issued and outstanding (in thousands): |
| | | | | | | |
| | December 31, 2019 | | December 31, 2018 |
| | Shares Authorized | | Shares Issued and Outstanding | | Shares Authorized | | Shares Issued and Outstanding |
| Class AX common stock, $0.001 par value per share | 40,000 | | 18,885 | | 40,000 | | 19,123 |
| Class TX common stock, $0.001 par value per share | 40,000 | | 19,901 | | 40,000 | | 19,969 |
| Class IX common stock, $0.001 par value per share | 10,000 | | 91 | | 10,000 | | 96 |
| Class JX common stock, $0.001 par value per share | 10,000 | | — | | 10,000 | | — |
| Class T common stock, $0.001 par value per share | 350,000 | | 28,837 | | 350,000 | | 2,858 |
| Class S common stock, $0.001 par value per share | 350,000 | | — | | 350,000 | | — |
| Class D common stock, $0.001 par value per share | 350,000 | | 6,927 | | 350,000 | | 1,479 |
| Class I common stock, $0.001 par value per share | 350,000 | | 7,206 | | 350,000 | | 59 |
The tables below provide information regarding the issuances and redemptions of each class of shares of the Company’s common stock during the year ended December 31, 2019, 2018 and 2017 (in thousands). There were no Class JX and S shares issued, redeemed or outstanding during the year ended December 31, 2019.
|
| | | | | | | | | | | | | | | | | | | | | | | | | | | | | | | | | | | | | | | | | | | | | | | | |
| | Class AX | | Class TX | | Class IX | | Class T | | Class D | | Class I | | Total |
| | Shares | | Amount | | Shares | | Amount | | Shares | | Amount | | Shares | | Amount | | Shares | | Amount | | Shares | | Amount | | Shares | | Amount |
| Balance as of January 1, 2019 | 19,123 |
| | $ | 19 |
| | 19,969 |
| | $ | 21 |
| | 96 |
| | $ | — |
| | 2,858 |
| | $ | 3 |
| | 1,479 |
| | $ | 1 |
| | 59 |
| | $ | — |
| | 43,584 |
| | $ | 44 |
|
| Issuance of common shares | 532 |
| | 1 |
| | 611 |
| | 2 |
| | 4 |
| | — |
| | 26,008 |
| | 26 |
| | 5,471 |
| | 5 |
| | 7,179 |
| | 7 |
| | 39,805 |
| | 41 |
|
| Redemption of common shares | (770 | ) | | (1 | ) | | (679 | ) | | (1 | ) | | (9 | ) | | — |
| | (29 | ) | | — |
| | (23 | ) | | — |
| | (32 | ) | | — |
| | (1,542 | ) | | (2 | ) |
| Balance as of December 31, 2019 | 18,885 |
| | $ | 19 |
| | 19,901 |
| | $ | 22 |
| | 91 |
| | $ | — |
| | 28,837 |
| | $ | 29 |
| | 6,927 |
| | $ | 6 |
| | 7,206 |
| | $ | 7 |
| | 81,847 |
| | $ | 83 |
|
|
| | | | | | | | | | | | | | | | | | | | | | | | | | | | | | | | | | | | | | | | | | | | | | | | |
| | Class AX | | Class TX | | Class IX | | Class T | | Class D | | Class I | | Total |
| | Shares | | Amount | | Shares | | Amount | | Shares | | Amount | | Shares | | Amount | | Shares | | Amount | | Shares | | Amount | | Shares | | Amount |
| Balance as of January 1, 2018 | 19,206 |
| | $ | 19 |
| | 19,958 |
| | $ | 20 |
| | 92 |
| | $ | — |
| | — |
| | $ | — |
| | — |
| | $ | — |
| | — |
| | $ | — |
| | 39,256 |
| | $ | 39 |
|
| Issuance of common shares | 566 |
| | 1 |
| | 635 |
| | 2 |
| | 4 |
| | — |
| | 2,858 |
| | 3 |
| | 1,479 |
| | 1 |
| | 59 |
| | — |
| | 5,601 |
| | 7 |
|
| Redemption of common shares | (649 | ) | | (1 | ) | | (624 | ) | | (1 | ) | | — |
| | — |
| | — |
| | — |
| | — |
| | — |
| | — |
| | — |
| | (1,273 | ) | | (2 | ) |
| Balance as of December 31, 2018 | 19,123 |
| | $ | 19 |
| | 19,969 |
| | $ | 21 |
| | 96 |
| | $ | — |
| | 2,858 |
| | $ | 3 |
| | 1,479 |
| | $ | 1 |
| | 59 |
| | $ | — |
| | 43,584 |
| | $ | 44 |
|
|
| | | | | | | | | | | | | | | | | | | | | | | | | | | |
| | Class AX | | Class TX | | Class IX | | Total |
| | Shares | | Amount | | Shares | | Amount | | Shares | | Amount | | Shares | | Amount |
| Balance as of January 1, 2017 | 16,469 |
| | $ | 16 |
| | 10,074 |
| | $ | 10 |
| | — |
| | $ | — |
| | 26,543 |
| | $ | 26 |
|
| Issuance of common shares | 3,874 |
| | 4 |
| | 10,841 |
| | 11 |
| | 92 |
| | — |
| | 14,807 |
| | 15 |
|
Redemption of common shares (1) | (1,137 | ) | | (1 | ) | | (957 | ) | | (1 | ) | | — |
| | — |
| | (2,094 | ) | | (2 | ) |
| Balance as of December 31, 2017 | 19,206 |
| | $ | 19 |
| | 19,958 |
| | $ | 20 |
| | 92 |
| | $ | — |
| | 39,256 |
| | $ | 39 |
|
| |
| (1) | Prior to the commencement of our Follow-on Offering, in October 2017, the Company commenced a self-tender offer for up to $200.0 million in IPO Shares at a price of $9.69 per share. The Company redeemed a total of 1.9 million IPO Shares for an aggregate cost of $18.7 million in November 2017 in connection with the Company’s self-tender offer. |
Distributions
With the authorization of the Company’s board of directors, the Company declared distributions monthly from January 2019 through March 31, 2020 at a gross distribution rate of $0.05208 per month, for each share class, less any applicable distribution and stockholder servicing fees. Distributions will be made on all classes of the Company’s common stock at the same time. All distributions were paid in cash or reinvested in shares of the Company’s common stock for those participating in the Company’s distribution reinvestment plan and have been paid or issued, respectively, on the first business day following the completion of the month to which they relate. Distributions reinvested pursuant to the Company’s distribution reinvestment plan were reinvested in shares of the same class as the shares on which the distributions were made. Some or all of the cash distributions may be paid from sources other than cash flows from operations.
The following table outlines the Company’s total distributions declared to stockholders for the years ended December 31, 2019, 2018 and 2017, including the breakout between the distributions declared in cash and those reinvested pursuant to the Company’s distribution reinvestment plan (in thousands).
|
| | | | | | | | | | | | |
| | | Stockholders |
| Distributions for the Years Ended | | Cash Distributions | | Distributions Reinvested | | Total Declared |
| December 31, 2019 | | $ | 16,112 |
| | $ | 19,446 |
| | $ | 35,558 |
|
| December 31, 2018 | | $ | 10,480 |
| | $ | 12,146 |
| | $ | 22,626 |
|
| December 31, 2017 | | $ | 9,226 |
| | $ | 10,547 |
| | $ | 19,773 |
|
The table below outlines the net distributions declared for each class of shares for the years ended December 31, 2019, 2018 and 2017. The net distributions presented below are representative of the gross distribution rate declared by the Company’s board of directors less any applicable ongoing distribution and stockholder servicing fees, which is more fully described in Note 8 — Related Party Transactions. |
| | | | | | | | | | | | |
| | | 2019 | | 2018 | | 2017 |
| Distributions declared per Class AX share, net | | $ | 0.63 |
| | $ | 0.61 |
| | $ | 0.60 |
|
| Distributions declared per Class TX share, net | | $ | 0.52 |
| | $ | 0.51 |
| | $ | 0.50 |
|
| Distributions declared per Class IX share, net | | $ | 0.60 |
| | $ | 0.59 |
| | $ | 0.39 |
|
| Distributions declared per Class T share, net | | $ | 0.52 |
| | $ | 0.51 |
| | $ | — |
|
| Distributions declared per Class S share, net | | $ | 0.52 |
| | $ | 0.51 |
| | $ | — |
|
| Distributions declared per Class D share, net | | $ | 0.60 |
| | $ | 0.59 |
| | $ | — |
|
| Distributions declared per Class I share, net | | $ | 0.63 |
| | $ | 0.61 |
| | $ | — |
|
8. RELATED PARTY TRANSACTIONS
The table below outlines fees and expense reimbursements incurred that are payable by the Company to the Advisor and the Dealer Manager, Hines and its affiliates for the years ended December 31, 2019, 2018 and 2017 and amounts unpaid as of December 31, 2019 and 2018 (in thousands):
|
| | | | | | | | | | | | | | | | | | | | |
| | | Incurred During the Years Ended December 31, | | Unpaid as of |
| Type and Recipient | | 2019 | | 2018 | | 2017 | | 12/31/2019 | | 12/31/2018 |
| Selling Commissions- Dealer Manager | | $ | 7,481 |
| | $ | 837 |
| | $ | 4,021 |
| | $ | — |
| | $ | 4 |
|
| Dealer Manager Fee- Dealer Manager | | 1,337 |
| | 146 |
| | 1,744 |
| | — |
| | 3 |
|
| Distribution & Stockholder Servicing Fees- Dealer Manager | | 17,696 |
| | 2,411 |
| | 4,947 |
| | 22,479 |
| | 8,332 |
|
| Organization and Offering Costs- the Advisor | | 4,445 |
| | 3,273 |
| | 4,753 |
| | 7,763 |
| | 9,001 |
|
| Acquisition Fees- the Advisor | | — |
| | — |
| | 6,741 |
| | — |
| | — |
|
| Asset Management Fees- the Advisor | | 7,985 |
| | 5,004 |
| | 4,940 |
| | 2,353 |
| | 1,317 |
|
Other- the Advisor (1) | | 2,846 |
| | 2,316 |
| | 1,827 |
| | 1,106 |
| | 691 |
|
| Performance Participation Allocation- the Advisor | | 7,713 |
| | 5,954 |
| | 251 |
| | 7,713 |
| | 5,954 |
|
Interest Expense- Hines and its affiliates (2) | | 1,288 |
| | 926 |
| | 676 |
| | 443 |
| | 151 |
|
| Property Management Fees- Hines and its affiliates | | 1,866 |
| | 1,093 |
| | 858 |
| | 287 |
| | 78 |
|
| Development and Construction Management Fees- Hines and its affiliates | | 413 |
| | 472 |
| | 236 |
| | 30 |
| | 28 |
|
| Leasing Fees- Hines and its affiliates | | 601 |
| | 388 |
| | 263 |
| | 344 |
| | 228 |
|
| Expense Reimbursements- Hines and its affiliates (with respect to management and operations of the Company's properties) | | 4,506 |
| | 2,168 |
| | 1,599 |
| | 264 |
| | 235 |
|
| Total | | $ | 58,177 |
| | $ | 24,988 |
| | $ | 32,856 |
| | $ | 42,782 |
| | $ | 26,022 |
|
| |
| (1) | Includes amounts the Advisor paid on behalf of the Company such as general and administrative expenses and acquisition-related expenses. These amounts are generally reimbursed to the Advisor during the month following the period in which they are incurred. |
| |
| (2) | Includes amounts paid related to the Hines Credit Facility. |
As described more fully in Note 1 — Organization, the Company commenced its Initial Offering in August 2014 and commenced the Follow-on Offering in December 2017. Described below are the fees payable to Hines and its affiliates in connection with the Initial Offering the Follow-on Offering.
Dealer Manager Agreement
Initial Offering
The table below summarizes the fees paid to the Dealer Manager with respect to the sale of IPO Shares in the Initial Offering. The upfront selling commissions and dealer manager fees were a percentage of the gross offering proceeds of the shares sold in the primary offering. No upfront selling commissions or dealer manager fees were paid with respect to shares issued under the Company’s distribution reinvestment plan.
|
| | | | | |
| | Class AX Shares | | Class TX Shares | | Class IX Shares |
| Selling Commissions | 7.00% | | 2.00% | | None |
| Dealer Manager Fee Paid by the Company from Offering Proceeds | 1.50% | | 1.25% | | None |
Advisor Payment of a Portion of the Dealer Manager Fee(1) | 1.50% | | 1.50% | | 1.50% |
Annual Distribution and Stockholder Servicing Fee(2) | None | | 1.00% | | 0.25% |
| |
| (1) | Pursuant to the Dealer Manager Agreement for the Initial Offering, the Advisor paid a portion of the dealer manager fees payable to the Dealer Manager in an amount equal to 1.5% of the gross offering proceeds with respect to Class AX shares, Class TX shares, and Class IX shares sold in the primary portion of the Initial Offering on and after August 2, 2016. The Advisor was not reimbursed by the Company in any way for the payment of such dealer manager fees. |
| |
| (2) | In addition, the Dealer Manager received annual distribution and stockholder servicing fees of 1.0% or 0.25% of the gross offering price per share through October 2, 2017 and now, since we are no longer offering IPO shares, continues to receive 1.0% or 0.25% of the most recently determined NAV per share for the Class TX shares and Class IX shares purchased and outstanding. The Company will cease paying the distribution and stockholder servicing fees with respect to any particular Class TX share or Class IX share and that Class TX share or Class IX share will convert into a number of Class AX shares or Class JX shares, respectively, on the occurrence of earlier of: (i) a listing of the Class A shares on a national securities exchange; (ii) a merger or consolidation of the Company with or into another entity, or the sale or other disposition of all or substantially all of the Company’s assets; (iii) the end of the month in which the Dealer Manager determines that total underwriting compensation paid in the Initial Offering including the distribution and stockholder servicing fees paid on all IPO Shares sold in the Initial Offering is equal to 10.0% of the gross proceeds of the Offering from the sale of the IPO Shares; (iv) the end of the month in which the transfer agent, on behalf of the Company, determines that underwriting compensation paid in the primary offering including the distribution and stockholder servicing fee paid with respect to the Class TX shares or Class IX shares held by a stockholder within his or her particular account equals 10.0% of the gross offering price at the time of investment of the Class TX shares or Class IX shares held in such account; and (v) on any Class TX share or Class IX share that is redeemed or repurchased. |
Follow-On Offering
The table below summarizes the fees payable to the Dealer Manager effective as of December 6, 2017, the effective date of the Restructuring with respect to the sale of Follow-On Offering Shares. The upfront selling commissions and dealer manager fees are based on a percentage of the gross offering proceeds of the shares sold in the primary offering. No upfront selling commissions or dealer manager fees are payable with respect to shares issued under the Company’s distribution reinvestment plan.
|
| | | | | | | |
| | Class T shares (1) | | Class S shares (1) | | Class D shares | | Class I shares |
| Upfront Selling Commission and Dealer Manager Fee | 3.5% | | 3.5% | | None | | None |
Ongoing Distribution and Stockholder Servicing Fee (as a percentage of NAV)(2) | 1.0% | | 1.0% | | 0.25% | | None |
(1) With respect to Class T Shares, there is a maximum upfront sales load of up to 3.5% of the gross offering proceeds from the sale of such shares in the primary offering, consisting of any combination of selling commissions and dealer manager fees. With respect to Class S shares, the upfront sales load of up to 3.5% of the gross proceeds from the sale of such shares in the primary offering consists solely of selling commissions.
| |
| (2) | The Company records distribution and stockholder servicing fees as a reduction to additional paid-in capital and the related liability in an amount equal to the maximum fees payable on the date the shares are issued. The liability will be relieved over time, as the fees are paid to the Dealer Manager, or it will be adjusted if the fees are no longer payable. For the years ended December 31, 2019 and 2018, the Company has recorded a liability of $22.5 million and $8.3 million, respectively, related to these fees, which is included in due to affiliates on the consolidated balance sheets. |
The Company will cease paying distribution and stockholder servicing fees with respect to any Class T share, Class S share or Class D share at the end of the month in which the transfer agent, on the Company’s behalf, determines that the total upfront selling commissions, dealer manager fees and distribution and stockholder servicing fees paid with respect to such Class T shares, Class S shares or Class D shares, as applicable, held by a stockholder within his or her particular account equals 8.75% (or, in the case of shares sold through certain participating broker dealers, a lower limit as set forth in any applicable agreement between our Dealer Manager and a participating broker dealer) of the gross proceeds from the sale of such Class T shares, Class S shares or Class D shares (including the gross proceeds of any shares issued under the Company’s distribution reinvestment plan with respect thereto).
In addition, the Company will cease paying distribution and stockholder servicing fees with respect to Class T shares, Class S shares and Class D shares on the earlier to occur of the following: (i) a listing of the Company’s common shares, (ii) the Company’s merger or consolidation with or into another entity, or the sale or other disposition of all or substantially all of
our assets or (iii) the date following the completion of the primary portion of the Follow-On Offering on which, in the aggregate, underwriting compensation from all sources in connection with the Follow-On Offering, including upfront selling commissions, dealer manager fees, distribution and stockholder servicing fees and other underwriting compensation, is equal to 10% of the gross proceeds from our Follow-On Offering.
Advisory Agreement
Pursuant to the Advisory Agreement and the Operating Partnership Agreement (as amended and restated on March 6, 2018), the Company is required to pay the following fees and expense reimbursements:
Acquisition Fee
Prior to December 6, 2017, the effective date of the Restructuring, the Advisor received acquisition fees of 2.25% of (i) the purchase price of real estate investments acquired, including any debt attributable to such investments, or the total principal amounts borrowed under any loans made or acquired directly by the Company, or (ii) when the Company made an investment or made or acquired a loan indirectly through another entity, such investment’s pro rata share of the gross asset value of real estate investments held by that entity, including any debt attributable to such investments, or the total principal amount borrowed under any loans made or acquired by that entity. As of the effective date of the Restructuring, we will no longer pay acquisition fees to the Advisor.
Asset Management Fee
The Advisor also receives asset management fees of 0.0625% per month of the cost of the Company’s real estate investments at the end of each month; provided that, with respect to real estate investments included in the Company’s board of director’s most recent determination of the Company’s NAV per share, the asset management fees will be equal 0.0625% per month of the most recently determined value of such real estate investments at the end of each month. As of the effective date of the Restructuring, the asset management fee cannot exceed an amount equal to 1/12th of 1.25% of the Company’s NAV at the end of each applicable month. Additionally, as of the effective date of the Restructuring, the asset management fee can be paid, at the Advisor’s election, in cash, Class I shares or Class I OP units of the Operating Partnership.
Performance Participation Allocation
As of the effective date of the Restructuring, the Advisor is also entitled to an annual performance participation allocation of 12.5% of the total return earned on an investment in the Company’s shares each year. This performance participation allocation is subject to investors earning a 5% annual return, after considering the effect of any losses carried forward from the prior year (as defined in the Operating Partnership agreement). The performance participation allocation accrues monthly and is payable after the completion of each calendar year.
Acquisition Expense Reimbursements
The Company reimburses the Advisor and its affiliates for out-of-pocket expenses in connection with the selection, evaluation, structuring, acquisition, origination, financing and development of properties and real estate-related securities, whether or not such investments are acquired.
Expense Reimbursements
The Company reimburses the Advisor for all expenses paid or incurred by the Advisor in connection with the services provided to the Company, subject to the limitation that the Company will not reimburse the Advisor for any amount by which its operating expenses (including the asset management fee and the performance participation allocation) at the end of the 4 preceding fiscal quarters exceeds the greater of: (A) 2.0% of its average invested assets, or (B) 25.0% of its net income determined without reduction for any additions to reserves for depreciation, bad debts or other similar non-cash reserves and excluding any gain from the sale of the Company’s assets for that period (the “2%/25% Limitation”). Notwithstanding the above, the Company may reimburse the Advisor for expenses in excess of this limitation if a majority of the independent directors determines that such excess expenses are justified based on unusual and non-recurring factors. For the four fiscal quarters ended December 31, 2019, the Company’s total operating expenses did not exceed the 2%/25% Limitation.
Organization and Offering Costs
Organization and offering costs consist of, among other costs, expenses of the Company’s organization, actual legal, accounting, bona fide out-of-pocket itemized and detailed due diligence costs, printing, filing fees, transfer agent costs, postage, escrow fees, data processing fees, advertising and sales literature and other offering-related costs. Organization and offering costs include expenses that are deemed issuer costs and certain expenses that are deemed underwriting compensation, but exclude selling commissions, dealer manager fees and distribution and stockholder servicing fees. Organizational costs, such as expenses associated with the formation of the Company and its board of directors, are expensed as incurred, and offering-related costs are recorded as an offset to additional paid-in capital. Prior to the Restructuring, the Company reimbursed the Advisor and its affiliates for any organization and offering costs deemed issuer costs related to the Initial Offering that it paid on the Company’s behalf. Further, the Advisory Agreement was amended, effective February 29, 2016, to reflect that the Company would not reimburse the Advisor for the cumulative organization and offering costs incurred in connection with the Company’s organization and public offerings, in excess of 2.5% of gross offering proceeds from the Company’s public offerings. On April 14, 2016, the Advisor reimbursed the Company for $4.0 million in organization and offering costs that the Company had previously reimbursed to the Advisor in excess of this 2.5% cap.
Effective as of December 6, 2017, the Advisor agreed to advance all of the Company’s organization and offering costs related to the Follow-On Offering through December 31, 2018. In January 2019, the Company began reimbursing the Advisor for all such advanced expenses as well as any organization and offering costs incurred by the Advisor related to the Initial Offering, and expects to continue to reimburse the Advisor for such expenses ratably through December 31, 2023 to the extent cumulative organization and offering costs do not exceed an amount equal to 2.5% of gross offering proceeds from the Company’s public offerings. Following December 31, 2023, the Company will reimburse the Advisor for any organization and offering costs that it incurs on its behalf, as and when incurred, to the extent that aggregate reimbursements to the Advisor for cumulative organization and offering costs do not exceed an amount equal to 2.5% of the gross offering proceeds from the Company’s public offerings. The total reimbursement related to organization and offering costs, selling commissions, dealer manager fees and the distribution and stockholder servicing fees may not exceed 15.0% of gross proceeds from the Offering.
From inception to December 31, 2019, organization and offering costs incurred by the Advisor on the Company’s behalf totaled $23.6 million. The Company has recorded a liability equal to all unreimbursed organization and offering costs that have been incurred to date to reflect its expectation that all of these amounts will be reimbursed to the Advisor in the future.
Property Management and Leasing Agreements
The Company pays Hines fees for the management and leasing of the Company’s properties. Property management fees will be paid in an amount equal to a market-based percentage of the gross revenues of the properties managed by Hines. In addition, if Hines provides leasing services with respect to a property, the Company will pay Hines leasing fees in an amount equal to the leasing fees charged by unaffiliated persons rendering comparable services in the same geographic area of the applicable property. The Company generally will be required to reimburse Hines for certain operating costs incurred in providing property management and leasing services pursuant to the property management and leasing agreements. Included in this reimbursement of operating costs will be the cost of personnel and overhead expenses related to such personnel located at the property as well as off-site personnel located in Hines’ headquarters and regional offices, to the extent the same relate to or support the performance of Hines’ duties under the agreement.
Hines may perform construction management services for the Company for both re-development activities and tenant construction. These fees are considered incremental to the construction effort and will be capitalized to the associated real estate project as incurred. Costs related to tenant construction will be depreciated over the estimated useful life. Costs related to redevelopment activities will be depreciated over the estimated useful life of the associated project. Leasing activities will generally be performed by Hines on the Company’s behalf. Leasing fees will be capitalized and amortized over the life of the related lease.
Fees for Other Services
The Company retains certain of the Advisor’s affiliates, from time to time, for services relating to the Company’s investments or operations, which may include corporate services, statutory services, transaction support services (including but not limited to coordinating with brokers, lawyers, accountants and other advisors, assembling relevant information, conducting financial and market analyses, and coordinating closing procedures) and loan management and servicing, and within one or more such categories, providing services in respect of asset and/or investment administration, accounting, technology, tax preparation, finance (including but not limited to budget preparation and preparation and maintenance of corporate models), treasury, operational coordination, risk management, insurance placement, human resources, legal and compliance, valuation and reporting-related services, as well as services related to mortgage servicing, group purchasing, healthcare, consulting/brokerage, capital markets/credit origination, property, title and/or other types of insurance, management consulting and other similar operational matters. Any fees paid to the Advisor’s affiliates for any such services will not reduce the asset management fee otherwise payable to the Advisor. Any such arrangements will be at market rates.
9. FAIR VALUE MEASUREMENTS
Fair values determined by Level 1 inputs utilize quoted prices (unadjusted) in active markets for identical assets or liabilities the Company has the ability to access. Fair values determined by Level 2 inputs utilize inputs other than quoted prices included in Level 1 that are observable for the asset or liability, either directly or indirectly. Level 2 inputs include quoted prices for similar assets and liabilities in active markets and inputs other than quoted prices observable for the asset or liability, such as interest rates and yield curves observable at commonly quoted intervals. Level 3 inputs are unobservable inputs for the asset or liability, and include situations where there is little, if any, market activity for the asset or liability. In instances in which the inputs used to measure fair value may fall into different levels of the fair value hierarchy, the level in the fair value hierarchy within which the fair value measurement in its entirety has been determined is based on the lowest level input significant to the fair value measurement in its entirety. The Company’s assessment of the significance of a particular input to the fair value measurement in its entirety requires judgment, and considers factors specific to the asset or liability.
Financial Instruments Measured on a Recurring Basis
As described in Note 6 — Derivative Instruments, the Company entered into several interest rate contracts as economic hedges against the variability of future interest rates on its variable interest rate borrowings. The valuation of these derivative instruments is determined based on assumptions that management believes market participants would use in pricing, using widely accepted valuation techniques including discounted cash flow analysis on the expected cash flows of each derivative. This analysis reflects the contractual terms of the derivatives, including the period to maturity, and uses observable market-based inputs, including interest rate curves and implied volatilities. The fair values of interest rate contracts have been determined using the market standard methodology of netting the discounted future fixed cash receipts (or payments) and the discounted expected variable cash payments (or receipts). The variable cash payments (or receipts) are based on an expectation of future interest rates (forward curves) derived from observable market interest rate curves.
Although the Company has determined the majority of the inputs used to value its interest rate contracts fall within Level 2 of the fair value hierarchy, the credit valuation adjustments associated with its derivatives utilize Level 3 inputs, such as estimates of current credit spreads to evaluate the likelihood of default by the Company and its counterparties. In adjusting the fair values of its derivative contracts for the effect of nonperformance risk, the Company has considered the impact of netting and any applicable credit enhancements, such as collateral postings, thresholds and guarantees. However, as of December 31, 2019 and 2018, the Company has assessed the significance of the impact of the credit valuation adjustments on the overall valuation of its derivative positions and has determined that the credit valuation adjustments are not significant to the overall valuations of its derivatives. As a result, the Company has determined its derivative valuations are classified in Level 2 of the fair value hierarchy.
Additionally, as described in Note 6 — Derivative Instruments, the Company has entered into foreign currency forward contracts as economic hedges against the variability of foreign exchange rates. The valuation of these forward contracts is determined based on assumptions that management believes market participants would use in pricing, using widely accepted valuation techniques, including discounted cash flow analysis on the expected cash flows of each derivative. This analysis reflects the contractual terms of the derivatives, including the period to maturity, and uses observable market-based inputs, including currency exchange rate curves and implied volatilities. The Company has determined its foreign currency forward contracts valuations are classified in Level 2 of the fair value hierarchy, as they are based on observable inputs but are not traded in active markets.
In the fourth quarter of 2018, the Company made its initial investments in real estate-related securities, which consist of common equities, preferred equities and debt investments of publicly traded REITs. Since that time, the Company has continued to make additional investments in real estate-related securities. The Company has elected to classify these investments as trading securities and carry such investments at fair value. The following table summarizes activity for the Company’s real estate-related securities measured at fair value on a recurring basis.
|
| | | | | | | | | | | | | | | | | | |
| | | Basis of Fair Value Measurements |
| During the year ended | | Description | | Fair Value of Assets | | Quoted Prices in Active Markets for Identical Items (Level 1) | | Significant
Other
Observable
Inputs (Level 2) | | Significant
Unobservable
Inputs (Level 3) |
| December 31, 2019 | | Investments in real estate-related securities | | $ | 36,491 |
| | $ | 36,491 |
| | $ | — |
| | $ | — |
|
| December 31, 2018 | | Investments in real estate-related securities | | $ | 9,599 |
| | $ | 9,599 |
| | $ | — |
| | $ | — |
|
Financial Instruments Fair Value Disclosures
As of December 31, 2019, the Company estimated that the fair value of its notes payable, excluding deferred financing costs, which had a book value of $865.7 million, was $864.1 million. As of December 31, 2018, the Company estimated that the fair value of its notes payable, excluding deferred financing costs, which had a book value of $545.8 million, was $540.3 million. Management has utilized available market information such as interest rate and spread assumptions of notes payable with similar terms and remaining maturities, to estimate the amounts required to be disclosed. Although the Company has determined that the majority of the inputs used to value its notes payable fall within Level 2 of the fair value hierarchy, the credit quality adjustments associated with its fair value of notes payable utilize Level 3 inputs. However, the Company has assessed the significance of the impact of the credit quality adjustments on the overall valuations of the fair market value of its notes payable and has determined they are not significant. Other financial instruments not measured at fair value on a recurring basis include cash and cash equivalents, restricted cash, tenant and other receivables, accounts payable and accrued expenses, other liabilities, due to affiliates and distributions payable. The carrying value of these items reasonably approximates their fair value based on their highly-liquid nature and/or short-term maturities. Due to the short-term nature of these instruments, Level 1 inputs are utilized to estimate the fair value of the cash and cash equivalents and restricted cash and Level 2 inputs are utilized to estimate the fair value of the remaining financial instruments.
10. REPORTABLE SEGMENTS
As described previously, the Company invests the net proceeds from its public offerings into its portfolio of quality commercial real estate properties and other real estate investments throughout the United States and internationally. The Company’s current business consists of owning, operating, acquiring, developing, investing in, and disposing of real estate assets, and all of the Company’s consolidated revenues and property operating expenses are from these real estate properties.
Management evaluates the operating performance of each of its real estate properties at an individual investment level and considers each investment to be an operating segment. The Company has aggregated its operating segments into 7 reportable segments: domestic office investments, domestic residential/living investments, domestic retail investments, domestic industrial investments, international industrial investments, international office investments and international residential/living investments.
The tables below provide additional information related to each of the Company’s segments (in thousands) and a reconciliation to the Company’s net income (loss), as applicable. “Corporate-Level Accounts” includes amounts incurred by the corporate-level entities which are not allocated to any of the reportable segments.
|
| | | | | | | | | | | |
| | Years Ended December 31, |
| | 2019 | | 2018 | | 2017 |
| Total Revenue | | | | | |
| Domestic office investments | $ | 16,538 |
| | $ | 16,398 |
| | $ | 15,437 |
|
| Domestic residential/living investments | 12,050 |
| | 6,637 |
| | 4,671 |
|
| Domestic retail investments | 23,142 |
| | 20,235 |
| | 19,507 |
|
| Domestic industrial investments | 4,408 |
| | 5,698 |
| | 7,619 |
|
| International industrial investments | 28,997 |
| | 3,630 |
| | — |
|
| International office investments | 8,931 |
| | 7,731 |
| | 8,711 |
|
| International residential/living investments | 9,817 |
| | 8,740 |
| | 3,779 |
|
| Total Revenue | $ | 103,883 |
| | $ | 69,069 |
| | $ | 59,724 |
|
For the years ended December 31, 2019, 2018 and 2017, the Company’s total revenue was attributable to the following countries:
|
| | | | | | | | |
| | Years Ended December 31, |
| | 2019 | | 2018 | | 2017 |
| Total Revenue | | | | | |
| United States | 55 | % | | 71 | % | | 79 | % |
| The Netherlands | 21 | % | | 5 | % | | — | % |
| Ireland | 12 | % | | 17 | % | | 19 | % |
| United Kingdom | 7 | % | | 7 | % | | 2 | % |
| Germany | 3 | % | | — | % | | — | % |
| Poland | 2 | % | | — | % | | — | % |
For the years ended December 31, 2019, 2018 and 2017, the Company’s property revenues in excess of expenses by segment were as follows (in thousands):
|
| | | | | | | | | | | |
| | Years Ended December 31, |
| | 2019 | | 2018 | | 2017 |
Property revenues in excess of expenses (1) | | | | | |
| Domestic office investments | $ | 11,022 |
| | $ | 11,076 |
| | $ | 10,497 |
|
| Domestic residential/living investments | 6,151 |
| | 4,008 |
| | 2,977 |
|
| Domestic retail investments | 13,405 |
| | 12,400 |
| | 10,889 |
|
| Domestic industrial investments | 3,300 |
| | 4,363 |
| | 5,862 |
|
| International industrial investments | 16,261 |
| | 1,645 |
| | — |
|
| International office investments | 6,235 |
| | 5,919 |
| | 6,922 |
|
| International residential/living investments | 6,522 |
| | 5,438 |
| | 2,466 |
|
| Property revenues in excess of expenses | $ | 62,896 |
| | $ | 44,849 |
| | $ | 39,613 |
|
| |
| (1) | Revenues less property operating expenses, real property taxes and property management fees. |
For the years ended December 31, 2019 and 2018, the Company’s total assets by segment were as follows (in thousands):
|
| | | | | | | |
| | December 31, 2019 | | December 31, 2018 |
| Total Assets | | | |
| Domestic office investments | $ | 124,144 |
| | $ | 130,021 |
|
| Domestic residential/living investments | 220,988 |
| | 126,175 |
|
| Domestic retail investments | 292,526 |
| | 199,819 |
|
| Domestic industrial investments | 51,520 |
| | 51,103 |
|
| International industrial investments | 494,268 |
| | 190,001 |
|
| International office investments | 122,342 |
| | 122,471 |
|
| International residential/living investments | 211,785 |
| | 111,803 |
|
| Corporate-level accounts | 55,972 |
| | 17,436 |
|
| Total Assets | $ | 1,573,545 |
| | $ | 948,829 |
|
For the years ended December 31, 2019 and 2018, the Company’s total assets were attributable to the following countries:
|
| | | | | |
| | December 31, 2019 | | December 31, 2018 |
| Total Assets | | | |
| United States | 47 | % | | 55 | % |
| United Kingdom | 18 | % | | 7 | % |
| The Netherlands | 17 | % | | 15 | % |
| Ireland | 11 | % | | 18 | % |
| Poland | 4 | % | | — | % |
| Germany | 3 | % | | 5 | % |
For the years ended December 31, 2019, 2018 and 2017, the Company’s reconciliation to the Company’s property revenue in excess of expenses is as follows (in thousands):
|
| | | | | | | | | | | |
| | Years Ended December 31, |
| | 2019 | | 2018 | | 2017 |
| Reconciliation to property revenue in excess of expenses | | | | | |
| Net income (loss) | $ | (19,548 | ) | | $ | (879 | ) | | $ | (17,186 | ) |
| Depreciation and amortization | 46,193 |
| | 32,478 |
| | 29,687 |
|
| Acquisition related expenses | 161 |
| | 144 |
| | 3,212 |
|
| Asset management and acquisition fees | 7,985 |
| | 5,004 |
| | 11,681 |
|
| Performance participation allocation | 7,713 |
| | 5,954 |
| | 251 |
|
| General and administrative expenses | 3,652 |
| | 3,131 |
| | 2,803 |
|
| (Gain) loss on derivative instruments | 2,292 |
| | 272 |
| | 372 |
|
| (Gain) loss on real estate-related securities | (2,317 | ) | | 401 |
| | — |
|
| Gain on sale of real estate | — |
| | (14,491 | ) | | — |
|
| Foreign currency (gains) losses | 617 |
| | 438 |
| | (494 | ) |
| Interest expense | 18,608 |
| | 12,649 |
| | 9,453 |
|
| Interest and other income | (1,480 | ) | | (261 | ) | | (83 | ) |
| (Benefit) provision for income taxes | (980 | ) | | 9 |
| | (83 | ) |
| Total property revenues in excess of expenses | $ | 62,896 |
| | $ | 44,849 |
| | $ | 39,613 |
|
11. SUPPLEMENTAL CASH FLOW DISCLOSURES
Supplemental cash flow disclosures for the years ended December 31, 2019, 2018 and 2017 are as follows (in thousands):
|
| | | | | | | | | | | | |
| | | 2019 | | 2018 | | 2017 |
| Supplemental Disclosure of Cash Flow Information | | | | | | |
| Cash paid for interest | | $ | 15,966 |
| | $ | 11,074 |
| | $ | 8,577 |
|
| Supplemental Schedule of Non-Cash Investing and Financing Activities | | | | | | |
| Distributions declared and unpaid | | $ | 3,837 |
| | $ | 2,024 |
| | $ | 1,868 |
|
| Distributions reinvested | | $ | 18,426 |
| | $ | 12,072 |
| | $ | 10,162 |
|
| Shares tendered for redemption | | $ | 1,680 |
| | $ | 1,174 |
| | $ | 20 |
|
| Non-cash net liabilities assumed | | $ | 11,412 |
| | $ | 4,011 |
| | $ | 5,946 |
|
| Assumption of mortgage upon acquisition of property | | $ | — |
| | $ | — |
| | $ | 95,260 |
|
| Offering costs payable to the Advisor | | $ | 4,445 |
| | $ | 3,273 |
| | $ | 943 |
|
| Selling commissions, dealer manager fees and distribution and stockholder servicing fees payable to the Dealer Manager | | $ | 17,696 |
| | $ | 88 |
| | $ | 3,614 |
|
| Accrued capital additions | | $ | 2,615 |
| | $ | 1,678 |
| | $ | 2,015 |
|
| Accrued acquisition costs | | $ | 2,256 |
| | $ | 3,185 |
| | $ | — |
|
Maintal Logistics acquisition liability (1) | | $ | — |
| | $ | 43,793 |
| | $ | — |
|
| Right of Use Lease Liability | | $ | 1,583 |
| | $ | — |
| | $ | — |
|
| |
| (1) | The acquisition of Maintal Logistics occurred in December 2018, and the funding for the purchase was not required at the time of the acquisition. The acquisition was funded in February 2019. |
12. COMMITMENTS AND CONTINGENCIES
The Company may be subject to various legal proceedings and claims that arise in the ordinary course of business. These matters are generally covered by insurance. While the resolution of these matters cannot be predicted with certainty, management believes the final outcome of such matters will not have a material adverse effect on the Company’s consolidated financial statements.
13. QUARTERLY FINANCIAL DATA (UNAUDITED)
The following table presents selected unaudited quarterly financial data for each quarter during the years ended December 31, 2019 and 2018 (in thousands, except per share information):
|
| | | | | | | | | | | | | | | |
| | Quarters Ended |
| | March 31, 2019 | | June 30, 2019 | | September 30, 2019 | | December 31, 2019 |
| Revenues | $ | 21,738 |
| | $ | 23,554 |
| | $ | 25,508 |
| | $ | 33,083 |
|
| Net income (loss) | $ | (3,999 | ) | | $ | (3,450 | ) | | $ | (1,773 | ) | | $ | (10,326 | ) |
| Net income (loss) attributable to common stockholders | $ | (4,002 | ) | | $ | (3,454 | ) | | $ | (1,776 | ) | | $ | (10,329 | ) |
| Income (loss) per common share, basic and diluted | $ | (0.09 | ) | | $ | (0.06 | ) | | $ | (0.03 | ) | | $ | (0.13 | ) |
| | | | | | | | |
| | Quarters Ended |
| | March 31, 2018 | | June 30, 2018 | | September 30, 2018 | | December 31, 2018 |
| Revenues | $ | 16,731 |
| | $ | 15,974 |
| | $ | 15,878 |
| | $ | 20,486 |
|
| Net income (loss) | $ | 11,376 |
| | $ | (1,408 | ) | | $ | (2,782 | ) | | $ | (8,065 | ) |
| Net income (loss) attributable to common stockholders | $ | 11,373 |
| | $ | (1,411 | ) | | $ | (2,785 | ) | | $ | (8,069 | ) |
| Income (loss) per common share, basic and diluted | $ | 0.29 |
| | $ | (0.04 | ) | | $ | (0.07 | ) | | $ | (0.19 | ) |
14. SUBSEQUENT EVENTS
Domain Apartments
In January 2020, the Company sold the Domain Apartments for a contract price of $80.1 million and repaid the associated mortgage loan in full. The Company acquired the Domain Apartments in January 2016 for a purchase price of $58.2 million, excluding transaction costs and working capital reserves. The purchaser is not affiliated with the Company or their affiliates.
The Emerson
In January 2020, the Company acquired The Emerson. The net purchase price was $117.0 million, exclusive of transaction costs and closing prorations. The Emerson is an apartment property located in Centreville, Virginia consisting of 355 units. The newly constructed property currently has a 64% occupancy rate and is expected to stabilize in the next six months. The seller is not affiliated with the Company or their affiliates.
Goodyear Crossing
In February 2020, the Company sold Goodyear Crossing II for a contract price of $72.0 million and repaid the associated mortgage loan in full. The Company acquired Goodyear Crossing II in August 2016 for a purchase price of $56.2 million, excluding transaction costs and working capital reserves. The purchaser is not affiliated with the Company or their affiliates.
Bratzler ABC Westland
In February 2020, the Company acquired Bratzler ABC Westland for a contract price of €11.5 million (approximately $12.5 million assuming a rate of $1.09 per Euro as of the acquisition date), excluding transaction costs and working capital
reserves. Bratzler ABC Westland in an industrial logistics property located in The Hague, Netherlands. Bratzler ABC Westland is an addition to the Company’s existing ownership interest in ABC Westland, an industrial logistics property located in The Hague, Netherlands, previously acquired in May 2019. The seller is not affiliated with the Company or their affiliates.
Coronavirus Outbreak
Subsequent to December 31, 2019, there was a global outbreak of COVID-19 (more commonly referred to as the
Coronavirus), which continues to adversely impact global commercial activity and has contributed to significant volatility in financial markets. It has already disrupted global travel and supply chains, adversely impacted global commercial activity, and its long-term economic impact remains uncertain. Considerable uncertainty still surrounds the Coronavirus and its potential effects on the population, as well as the effectiveness of any responses taken on a national and local level by government authorities and businesses. The travel restrictions, limits on hours of operations and/or closures of non-essential businesses and other efforts to curb the spread of the Coronavirus have significantly disrupted business activity globally, including in the markets where the Company invests, and could have an adverse impact on the performance of certain of the Company’s investments. Many of the Company’s tenants are subject to shelter in place and other quarantine restrictions, and the restrictions could be in place for an extended period of time. These restrictions are particularly adversely impacting many of the Company’s retail tenants (other than grocery tenants), as government instructions regarding social distancing and mandated closures have reduced and, in some cases, eliminated customer foot traffic, causing many of the Company’s retail tenants to temporarily close their brick and mortar stores. As of December 31, 2019, the Company owned 2 retail properties in the U.S., which comprised 17% of the Company’s portfolio, based on the estimated value of its real estate investments as of that date. The outbreak could have a continued adverse impact on economic and market conditions and trigger a period of global economic slowdown. In addition, the rapidly evolving nature of the pandemic makes it difficult to ascertain the long term impact it will have on commercial real estate markets and the Company’s investments. Nevertheless, the Coronavirus presents material uncertainty and risk with respect to the Company’s performance and financial results, such as the potential negative impact to occupancy at its properties, the potential closure of certain of its assets for an extended period, the potential for increased difficulty in obtaining financing, increased costs of operations, decrease in values of its real estate investments, changes in law and/or regulation, and uncertainty regarding government and regulatory policy. The Company is unable to estimate the impact the Coronavirus will have on its financial results at this time.
*****
Item 9. Changes in and Disagreements With Accountants on Accounting and Financial Disclosure
None.
Item 9A. Controls and Procedures
Disclosure Controls and Procedures
In accordance with Exchange Act Rules 13a-15 and 15d-15, we carried out an evaluation, under the supervision and with the participation of management, including our Chief Executive Officer and Chief Financial Officer, of the effectiveness of our disclosure controls and procedures as of the end of the period covered by this report. Based on that evaluation, our Chief Executive Officer and Chief Financial Officer concluded that our disclosure controls and procedures were effective as of December 31, 2019, to provide reasonable assurance that information required to be disclosed in our reports filed or submitted under the Exchange Act is (i) recorded, processed, summarized and reported within the time periods specified in the Securities and Exchange Commission’s rules and forms, and (ii) accumulated and communicated to our management, including our Chief Executive Officer and Chief Financial Officer, as appropriate to allow timely decisions regarding required disclosure.
Management’s Report on Internal Control Over Financial Reporting
Our management is responsible for establishing and maintaining adequate internal control over financial reporting. Our system of internal control over financial reporting is designed to provide reasonable assurance regarding the reliability of financial reporting and the preparation of consolidated financial statements for external purposes in accordance with generally accepted accounting principles. Our internal control over financial reporting includes those policies and procedures that:
| |
| (i) | pertain to the maintenance of records that, in reasonable detail, accurately and fairly reflect the transactions and dispositions of our assets; |
| |
| (ii) | provide reasonable assurance that transactions are recorded as necessary to permit preparation of financial statements in accordance with generally accepted accounting principles, and that our receipts and expenditures are being made only in accordance with authorizations of our management and directors; and |
| |
| (iii) | provide reasonable assurance regarding prevention or timely detection of unauthorized acquisition, use or disposition of our assets that could have a material effect on the financial statements. |
Because of its inherent limitations, internal control over financial reporting may not prevent or detect misstatements. Also, projections of any evaluation of effectiveness to future periods are subject to the risk that controls may become inadequate because of changes in conditions, or that the degree of compliance with the policies or procedures may deteriorate.
Our management’s assessment of the effectiveness of our internal control system as of December 31, 2019 was based on the framework for effective internal control over financial reporting described in the 2013 Internal Control — Integrated Framework issued by the Committee of Sponsoring Organizations of the Treadway Commission (COSO). Based on our assessment, as of December 31, 2019, our system of internal control over financial reporting was effective at the reasonable assurance level.
This annual report does not include an attestation report of our independent registered public accounting firm regarding control over financial reporting. Management’s report was not subject to attestation by our independent registered public accounting firm pursuant to Item 308(b) of Regulation S-K, which only requires such an attestation when the filer is an accelerated filer or a large accelerated filer.
March 30, 2020
Change in Internal Controls
No changes have occurred in our internal controls over financial reporting (as defined in Rule 13a-15(f) of the Exchange Act) during the three months ended December 31, 2019 that have materially affected, or are reasonably likely to materially affect, our internal controls over financial reporting.
Item 9B. Other Information
None.
PART III
Item 10. Directors, Executive Officers and Corporate Governance
As of the date of this report, our directors, their ages, their year first elected, their business experience and principal occupation, their directorships in public corporations and investment companies are as follows:
|
| | | | | | |
| Name | | Age | | Year First Elected | | Business Experience and Principal Occupation; Directorships in Public Corporations and Investment Companies |
| Jeffrey C. Hines | | 64 | | 2013 | | Mr. Hines joined Hines in 1982. Mr. Hines is the co-owner, President and CEO of Hines and has served as Chairman of our Board and Chairman of the managers of the general partner of our Advisor since July 2013. Mr. Hines has served as our CEO and as the CEO of the general partner of our Advisor since December 31, 2019. Mr. Hines has also served as the Chairman of the Board of Hines Global REIT and Chairman of the managers of the general partner of Hines Global Advisors, LP since December 2008. Additionally, Mr. Hines served as the Chairman of the Board of Hines REIT and the Chairman of the managers of the general partner of Hines Advisors Limited Partnership, the advisor to Hines REIT, from August 2003 through the liquidation and dissolution of Hines REIT in August 2018. He also served as a member of the management board of Core Fund, from August 2003 through the liquidation and dissolution of the Core Fund in December 2018. As the President and CEO of Hines, he is responsible for overseeing all firm policies and procedures as well as day-to-day operations and is a member of Hines’ Executive and Investment Committees. He became President of the general partner of Hines in 1990 and Chief Executive Officer of the general partner of Hines in January 2008 and has overseen a major expansion of the firm’s personnel, financial resources, domestic and foreign market penetration, products and services. He has been a major participant in the development of Hines’ domestic and international acquisition program and currently oversees a portfolio of $124.3 billion in assets under management. Mr. Hines graduated from Williams College with a B.A. in Economics and holds a M.B.A. from Harvard Business School.
We believe that Mr. Hines’ career, spanning more than 35 years in the commercial real estate industry, and the depth of his knowledge of Hines and its affiliates qualify him to serve as Chairman of our board of directors.
|
| | | | | | | |
|
| | | | | | |
| Name | | Age | | Year First Elected | | Business Experience and Principal Occupation; Directorships in Public Corporations and Investment Companies |
| David L. Steinbach | | 43 | | 2019 | | Mr. Steinbach joined Hines in 1999 and is a Senior Managing Director - Investment Management, Co-Head of Investment Management and the Global Chief Investment Officer for Hines. He has served as the Chief Investment Officer for the general partner of our Advisor, Hines Global REIT and the general partner of its advisor, Hines Global Advisors, LP (“HGALP”) since July 2014. Additionally, Mr. Steinbach has served as a manager of the general partner of our Advisor since December 31, 2019. In these roles, he is responsible for management of the real estate acquisition program in the U.S. and internationally. He is a member of Hines’ Executive and Investment Committees. He previously served as our Chief Investment Officer from July 2014 to June 2019. Mr. Steinbach also served as a Managing Director - Investment Management from February 2011 to February 2017 and was responsible for the acquisition of over $4 billion in assets for various Hines affiliates in the U.S. and internationally. Prior to these roles, he served in various roles in which he was responsible for acquisitions, asset management and property dispositions on behalf of Hines Global, Hines Global REIT, Hines REIT, and the Core Fund both in the U.S. and internationally. He graduated from Texas A&M University with a B.B.A. and a M.B.A. in Business Administration.
We believe that Mr. Steinbach’s significant experience as an executive at our Company and at Hines qualifies him to serve as one of our directors. Mr. Steinbach’s extensive knowledge of the U.S. and international real estate markets, as well as his considerable institutional knowledge, allow him to provide valuable insight as a potential future director.
|
| | | | | | | |
| Humberto “Burt” Cabañas | | 72 | | 2014 | | Mr. Cabañas has served as one of our independent directors since July 2014. Mr. Cabañas is the Founder and Chairman of Benchmark Hospitality International, where he oversees Benchmark’s diverse portfolio, a position he has held since 1987. He also served as Chief Executive Officer at Benchmark from 1987 to 2013. Prior to his current position, he served as a Senior Vice President and in various other positions at The Woodlands Corporation, where he oversaw all hospitality operations. He presently serves as director on the Foundation Board of Florida International University and previously served as Chairman of the Industry Advisory Board for the Chaplin School of Hospitality & Tourism Management at Florida International University. Mr. Cabañas is also a founding board member and was the president of the International Association of Conference Centers (IACC). He is a graduate of Florida International University with a Bachelor’s degree in Hotel and Restaurant Management.
We believe Mr. Cabañas’ significant and deep experience in the hotel and hospitality industry and the real estate aspects of that industry makes him well-qualified to serve as one of our directors.
|
| | | | | | | |
|
| | | | | | |
| Name | | Age | | Year First Elected | | Business Experience and Principal Occupation; Directorships in Public Corporations and Investment Companies |
| Dougal A. Cameron | | 62 | | 2014 | | Mr. Cameron has served as one of our independent directors since July 2014. Mr. Cameron is President and Owner of Cameron Management, a position he has held since his founding of the firm in 1995. Cameron Management is a firm that owns, finances, leases, and manages all of its office buildings in an integrated fashion. From 1991-1994, Mr. Cameron was an owner and investment manager of VNSM Inc., an investment management firm with over $1 billion in assets under management. Prior to this time, he was an accountant with Arthur Young & Company (now Ernst & Young), and he worked as an asset and project manager for Hines from 1985 to 1991. Additionally, he was on the board of Mosher Inc., a private, closed-end mutual fund from 1992 to 1997. Mr. Cameron holds a bachelor’s degree in Accounting from Texas Tech University and an M.B.A. from Harvard Business School. He previously taught economics at Harvard University and currently teaches at the Acton School of Business in Austin.
We believe that Mr. Cameron is well-qualified to serve as one of our directors due to his background in running a real estate firm since 1995 and his extensive experience in owning, leasing and managing office buildings as the company intends to make investments in office buildings along with other real estate product types.
|
| | | | | | | |
John O. Niemann, Jr.
| | 63 | | 2014 | | Mr. Niemann has served as one of our independent directors since July 2014, and as our lead independent director since May 2019. In addition, he has served as an independent director of HMS, which is a non-listed public business development company that is co-sponsored by Hines, since May 2012 and currently serves as the Chairman of the Audit Committee. He previously served as a director and Chairman of the Audit Committee of Gateway Energy Corporation from June 2010 until December 2013 (when the company went private). Since May 2019, he has also served as a director and a member of the Audit and Compensation Committees of Adams Resources & Energy, Inc. Since June 2013, he has served as a Managing Director of Andersen Tax LLC (formerly known as WTAS LLC). He is also the president and chief operating officer of Arthur Andersen LLP, and has been since 2003. He previously served on the administrative board of Arthur Andersen LLP and on the board of partners of Andersen Worldwide. He began his career at Arthur Andersen LLP in 1978 and has served in increasing responsibilities in senior management positions, since 1992. Mr. Niemann has served on the board of directors of many Houston area non-profit organizations, including Strake Jesuit College Preparatory School (past chair of the board), The Regis School of the Sacred Heart (past chair of the board), The Houston Symphony, The University of St. Thomas, The Alley Theatre and Taping for the Blind, Inc. He graduated with a Bachelor of Arts in managerial studies (magna cum laude) and a Masters in Accounting from Rice University, received a Juris Doctor (summa cum laude) from the South Texas College of Law, and a Masters of Law in taxation (summa cum laude) from the University of San Francisco School of Law.
We believe Mr. Niemann’s significant experience in the public accounting industry, including over 40 years in various capacities at Arthur Andersen LLP makes him well qualified to serve as one of our directors and as the audit committee financial expert. Drawing on this experience, Mr. Niemann is able to provide valuable insights regarding our investment strategies, internal controls, and financial reporting. In addition, through his experience serving on the board of directors of other public companies, Mr. Niemann has previous experience in the requirements of serving on a public company board.
|
As of the date of this report, our executive officers (other than Mr. Hines, who serves on our board and is included in the earlier list of our directors), their ages and their experiences are as follows:
|
| | | | |
| Name and Title | | Age | | Experience |
Alfonso J. Munk, President and Chief Investment Officer—Americas | | 46 | | Mr. Munk joined Hines in October 2019 as Chief Investment Officer-Americas. Mr. Munk has served as our President and Chief Investment Officer - Americas and as the President and Chief Investment Officer - Americas of the general partner of our Advisor since December 31, 2019. Prior to joining Hines, Mr. Munk was the Managing Director, Americas Chief Investment Officer and head of Latin America for PGIM Real Estate, Prudential Financial’s global real estate investment arm, from 2012 to October 2019. As Managing Director, Mr. Munk was responsible for overseeing PGIM Real Estate’s Americas transaction activities, real estate debt strategies and the management of operations in Latin America. Mr. Munk’s responsibilities as Americas Chief Investment Officer and head of Latin America included overseeing all Americas transaction activities (acquisitions and dispositions of more than $8 billion annually), developing and implementing PGIM Real Estate Latin America’s strategy and overseeing PGIM Real Estate Debt Strategies. Mr. Munk graduated from Cornell University with a B.S. in Business and Hospitality Administration and received his M.B.A. from The Wharton School, University of Pennsylvania, with a concentration in Finance and Real Estate.
|
| | | | | |
Alex Knapp, Chief Investment Officer—Europe
| | 42 | | Mr. Knapp joined Hines in September 2008 and has served as our Chief Investment Officer - Europe and as the Chief Investment Officer - Europe of the general partner of our Advisor since December 31, 2019. Since April 2019, Mr. Knapp has served as Chief Investment Officer - Europe for Hines. Previously, Mr. Knapp served as Senior Managing Director of Hines from February 2018 to March 2019 and Managing Director of Hines UK from December 2013 to February 2018. During his time at Hines, Mr. Knapp has had lead roles on more than £1 billion of commercial transactions ranging from core acquisition to ground up development. Mr. Knapp has overseen the expansion of the Hines student housing program under the aparto operating brand, which comprises 14 developments in the UK, Ireland and Italy, with a GDV of more than £600 million. Mr. Knapp also led Hines’ efforts in the living sector - including residential for rent, student and hotels on a pan-European basis. Prior to joining Hines in 2008, Mr. Knapp spent five years at the Renzo Piano Building Workshop working in Paris, France and Genova, Italy. Mr. Knapp graduated from Rice University with a Bachelor of Architecture and holds a Masters in Real Estate Development from Massachusetts Institute of Technology.
|
| | | | | |
|
| | | | |
| Name and Title | | Age | | Experience |
Janice E. Walker, Chief Operating Officer
| | 47 | | Ms. Walker joined Hines in February 2005 and has served as COO for us and the general partner of our Advisor since June 2019. Ms. Walker also serves as a Senior Managing Director - Investment Management at Hines, a position she has held since June 2018. Prior to that she served as a Managing Director - Investment Management at Hines since July 2012. In her positions, Ms. Walker is responsible for the execution of our business plan and operations, including real estate investments and portfolio strategy. Since June 2019, Ms. Walker has served as President of HMS Income Fund, a public specialty finance company sponsored by Hines and organized as a business development company. Since July 2017, Ms. Walker has served as the CEO and President of Hines Realty Income Fund LLC, a commingled discretionary closed-end fund with a real estate debt investment strategy. Ms. Walker has been responsible for portfolio management for us since July 2013 and for Hines Global REIT since December 2008. Ms. Walker was previously responsible for portfolio management for Hines REIT and the Core Fund from 2005 through the liquidation and dissolution of Hines REIT and the Core Fund in August 2018 and December 2018, respectively. She has also been responsible for the procurement of debt for asset acquisitions, as well as corporate financing, and has originated over $5 billion for the benefit of the previously mentioned funds. Prior to joining Hines, Ms. Walker had extensive acquisitions and asset management experience at a global hospitality firm. She began her career at Arthur Andersen LLP where she was a manager in the audit practice. Ms. Walker received a B.B.A. and M.S.A. in Accounting from Texas Tech University.
|
| | | | | |
J. Shea Morgenroth, Chief Financial Officer | | 44 | | Mr. Morgenroth joined Hines in October 2003 and has served as CFO for us and the general partner of our Advisor since June 2019. Mr. Morgenroth also serves as a Senior Vice President - Controller and the CFO of Investment Management at Hines, a position he has held since April 2019. Prior to that, he was a Vice President - Controller for Hines since July 2012. Mr. Morgenroth has also served as the CFO of Hines Global REIT and the general partner of HGALP, since June 2019. Prior to his appointment as our CFO, Mr. Morgenroth served as CAO and Treasurer for us and the general partner of our Advisor from July 2013 until June 2019 and for Hines Global REIT and the general partner of HGALP from November 2011 to June 2019. Mr. Morgenroth also served as CAO and Treasurer of Hines REIT and the general partner of HALP from November 2011 through the liquidation and dissolution of Hines REIT in August 2018. In these roles, Mr. Morgenroth has been responsible for the oversight of the treasury, accounting, financial reporting and SEC reporting functions, as well as the Sarbanes-Oxley compliance program in the U.S. and internationally. Prior to his appointment as CAO and Treasurer for Hines Global REIT, Mr. Morgenroth served as a Senior Controller for Hines Global REIT and the general partner of HGALP from December 2008 until November 2011 and for Hines REIT and the general partner of HALP from January 2008 until November 2011 and as a Controller for Hines REIT and the general partner of HALP from October 2003 to January 2008. In these roles, he was responsible for the management of the accounting, financial reporting and SEC reporting functions. Prior to joining Hines, Mr. Morgenroth was a manager in the audit practices of Arthur Andersen LLP and Deloitte & Touche LLP, serving clients primarily in the real estate industry. He holds a B.B.A. in Accounting from Texas A&M University and is a Certified Public Accountant.
|
| | | | | |
|
| | | | |
| Name and Title | | Age | | Experience |
A. Gordon Findlay, Chief Accounting Officer and Treasurer | | 44 | | Mr. Findlay joined Hines in November 2006 and has served as CAO and Treasurer for us and the general partner of our Advisor since June 2019. Mr. Findlay has served as a Vice President - Controller for Hines since October 2016 and as a Senior Controller for Hines from 2012 until October 2016. In these roles, he has been involved with managing the accounting, financial reporting and SEC reporting functions related to Hines Global, Hines Global REIT, and Hines REIT. Mr. Findlay has also served as CAO and Treasurer of Hines Global REIT and the general partner of HGALP since June 2019. Prior to joining Hines, Mr. Findlay spent six years in the audit practice of Ernst & Young LLP, serving public and private clients in various industries. He holds a B.B.A. in Accounting from University of Houston - Downtown and is a Certified Public Accountant.
|
| | | | | |
Jason P. Maxwell, General Counsel and Secretary | | 46 | | Mr. Maxwell joined Hines in June 2006 and has served as General Counsel and Secretary for us and the general partner of our Advisor since June 2019. Mr. Maxwell has also served as Senior Vice President - Legal and Co-Head of Legal at Hines since May 2019. Prior to that, he was a Vice President - Legal for Hines since September 2016 and is also the General Counsel of HALP, a position he has held since January 2014 (prior to that, he held the title of Corporate Counsel of Hines and HALP from May 2006 through December 2013). In his role at Hines, Mr. Maxwell created and leads the internal legal function for HALP and provides legal services to Hines Global, Hines Global REIT, HMS Income Fund and many of their affiliated entities as well as serving as Assistant or Corporate Secretary to several of such entities. Mr. Maxwell has served as the General Counsel and Secretary of Hines Global REIT, the general partner of HGALP and HMS Income Fund, since June 2019. Since August 2015, he has also served as the Chief Compliance Officer of HMS Income Fund, and its registered investment adviser, HMS Adviser LP. Among his other responsibilities, he provides corporate governance and general compliance guidance for the previously mentioned funds’ boards of directors. Prior to joining Hines, Mr. Maxwell was a partner in the law firm of Locke Liddell & Sapp LLP (n/k/a Locke Lord) where he practiced corporate and securities law. He graduated from the University of Miami with a B.B.A. in Finance and holds a J.D. from Georgetown University Law Center. He is a member of the State Bar of Texas.
|
Audit Committee
Our board of directors has determined that each member of our Audit Committee is independent within the meaning of the applicable requirements set forth in or promulgated under the Exchange Act, as well as in the NYSE rules. In addition, our board of directors has determined that John O. Niemann, Jr. is an “audit committee financial expert” within the meaning of the applicable rules promulgated by the SEC. Unless otherwise determined by the board of directors, no member of the committee may serve as a member of the Audit Committee of more than two other public companies.
Code of Business Conduct and Ethics
Our board of directors has adopted a Code of Business Conduct and Ethics, which is applicable to our directors and officers, including our principal executive officer, principal financial officer, principal accounting officer or controller and other persons performing similar functions, whether acting in their capacities as our officers or in their capacities as officers of our Advisor or its general partner. The Code of Business Conduct and Ethics covers topics including conflicts of interest, confidentiality of information, full and fair disclosure, reporting of violations and compliance with laws and regulations. Our Code of Business Conduct and Ethics is available, free of charge, on the Corporate Governance section of our website, www.hinessecurities.com/current-offerings/hgit/corporate-governance/. You may also obtain a copy of this code by writing to: Hines Global Income Trust Investor Relations, 2800 Post Oak Boulevard, Suite 5000, Houston, Texas 77056-6118. Waivers from our Code of Business Conduct and Ethics are discouraged, but any waivers from the Code of Business Conduct and Ethics that relate to any executive officer or director must be approved by our Nominating and Corporate Governance Committee and will be posted on our website at www.hinessecurities.com/current-offerings/hgit/corporate-governance/ within four business days of any such waiver.
Item 11. Executive Compensation
Director Compensation
Our Compensation Committee designs our director compensation with the goals of attracting and retaining highly qualified individuals to serve as independent directors and to fairly compensate them for their time and efforts. Because of our unique attributes as an externally-managed REIT, service as an independent director on our board requires a substantial time commitment. The Compensation Committee balances these considerations with the principles that our independent director compensation program should be transparent and, in part, should align directors’ interests with those of our stockholders.
The following table sets forth information regarding compensation of our directors during 2019.
2019 Director Compensation
|
| | | | | | | | | | | | | | | | | | | | | |
| Name | Fees Earned or Paid in Cash | Aggregate Stock Awards(1)(2) | Option Awards | Non-Equity Incentive Plan Compensation | Change in Pension Value and Non-Qualified Deferred Compensation Earnings | All Other Compensation | Total Compensation |
| Humberto “Burt” Cabañas | $ | 113,294 |
| $ | 30,000 |
| $ | — |
| $ | — |
| $ | — |
| $ | — |
| $ | 143,294 |
|
| Dougal A. Cameron | $ | 110,794 |
| $ | 30,000 |
| $ | — |
| $ | — |
| $ | — |
| $ | — |
| $ | 140,794 |
|
| John O. Niemann, Jr. | $ | 114,544 |
| $ | 30,000 |
| $ | — |
| $ | — |
| $ | — |
| $ | — |
| $ | 144,544 |
|
Jeffery C. Hines, Charles M. Baughn and David L. Steinbach (3) | $ | — |
| $ | — |
| $ | — |
| $ | — |
| $ | — |
| $ | — |
| $ | — |
|
| |
| (1) | Each of Messrs. Cabañas, Cameron and Niemann received 2,967.359 restricted Shares of Common Stock upon his re-election to our board of directors following our 2019 annual meeting. The shares were issued without registration under the Securities Act of 1933, as amended (the “Securities Act”), in reliance upon the exemption from registration contained in Section 4(a)(2) of the Securities Act for transactions not involving any public offering. |
| |
| (2) | The value of the common stock awards was calculated based on the estimated net asset value, or NAV, of $10.11 per share determined as of July 31, 2019, which was the estimated NAV per share in effect on the grant date of the awards. |
| |
| (3) | Messrs. Hines, Baughn and Steinbach, who are employees of Hines, receive no compensation for serving as members of our board of directors. |
From January through May 22, 2019, we paid our independent directors an annual fee of $40,000, and a fee of $2,000 for each meeting of the board (or any committee thereof) attended in person. If a committee meeting was held on the same day as a meeting of our board of directors, each independent director received $1,500 for each committee meeting attended in person on such day. From January through May 22, 2019, we also paid each of our independent directors a fee of $750 for each board or committee meeting attended via teleconference. Effective May 23, 2019, we began paying our independent directors an annual fee of $50,000, which was prorated for the remainder of 2019 and each of our independent directors were paid a fee of $1,000 for each board or committee meeting attended via teleconference for the remainder of 2019.
We paid the following annual retainers (prorated for a partial term) to the Chairpersons of our board committees for 2019:
| |
| • | $7,500 to Mr. Cabañas, as the Chairperson of the Conflicts Committee; |
| |
| • | $10,000 to Mr. Niemann, as the Chairperson of the Audit Committee; |
| |
| • | $5,000 to Mr. Cameron, as the Chairperson of the Compensation Committee; |
| |
| • | $5,000 to Mr. Cameron, as the Chairperson of the Nominating and Corporate Governance Committee; and |
| |
| • | $5,000 to Mr. Cabañas, as the Chairperson of the Valuation Committee. |
Effective May 23, 2019, the lead independent director, a role currently held by Mr. Niemann, will be paid an annual retainer of $5,000 (prorated for a partial term).
All directors are reimbursed by us for reasonable out-of-pocket expenses incurred in connection with attendance at board or committee meetings.
Each independent director elected or reelected to the board (whether through a stockholder meeting or by directors to fill a vacancy on the board) will be granted $30,000 in restricted Class I shares on or about the date of election or reelection. These restricted Class I shares will fully vest on the earlier to occur of: (i) the first anniversary of the applicable grant date, subject to the independent director serving continuously as an independent director through and until the first anniversary of the applicable grant date; (ii) the termination of service as an independent director due to the independent director’s death or disability; or (iii) a change in control of the Company, subject to the independent director serving continuously through and until the date of the change in control of the Company.
Executive Compensation
We have no employees. Our day-to-day management functions are performed by our Advisor and its affiliates. All of our executive officers are employed by and receive compensation from our Advisor or its affiliates, for all of their services to the Hines organization, including their service as our executive officers. The compensation received by our executive officers is not paid or determined by us, but rather by our Advisor or affiliates of our Advisor based on all the services provided by these individuals to the Hines organization, including us. As a result, we do not have and our compensation committee has not considered, a compensation policy or program for our executive officers and have not included a “Compensation Discussion and Analysis,” or “Compensation Committee Report” in this Annual Report on Form 10-K. See “Item 13. Certain Relationships and Related Transactions, and Director Independence” below for a discussion of fees and expenses payable to our Advisor and its affiliates.
Compensation Committee Interlocks and Insider Participation
During 2019, our Compensation Committee consisted of Messrs. Cabañas, Cameron and Niemann, our three independent directors. None of our executive officers served as a director or member of the compensation committee of an entity whose executive officers included a member of our board of directors or Compensation Committee.
Item 12. Security Ownership of Certain Beneficial Owners and Management and Related Stockholder Matters
Ownership
The following table shows, as of March 1, 2020, the amount of our common stock beneficially owned (unless otherwise indicated) by (1) any person who is known by us to be the beneficial owner of more than 5% of our outstanding common stock, (2) our directors, (3) our executive officers, and (4) all of our directors and executive officers as a group. Except as otherwise indicated, all shares are owned directly, and the owner of such shares has the sole voting and investment power with respect thereto.
|
| | | | | | | |
| | | | | Common Stock Beneficially Owned (2) |
Name of Beneficial Owner (1) | | Position | | Number of Shares of Common Stock | | Percentage of Class |
| Jeffrey C. Hines | | Chief Executive Officer, Director and Chairman of the Board of Directors | | 225,008 |
| (3)(4) | * |
| Humberto “Burt” Cabañas | | Independent Director | | 24,679 |
| | * |
| Dougal A. Cameron | | Independent Director | | 3,990 |
| | * |
| John O. Niemann, Jr. | | Independent Director | | 25,241 |
| | * |
| Alfonso J. Munk | | President and Chief Investment Officer - Americas | | — |
| | * |
| Alex Knapp | | Chief Investment Officer - Europe | | — |
| | * |
| A. Gordon Findlay | | Chief Accounting Officer and Treasurer | | — |
| | * |
| David L. Steinbach | | Chief Investment Officer and Director | | 5,536 |
| | * |
| Jason P. Maxwell | | General Counsel and Secretary | | — |
| | * |
| J. Shea Morgenroth | | Chief Financial Officer | | 4,870 |
| | * |
| Janice E. Walker | | Chief Operating Officer | | 5,539 |
| | * |
| All directors and executive officers as a group | | 294,863 |
| | 0.3% |
* Amount represents less than 1%
| |
| (1) | The address of each person listed is c/o Hines Global Income Trust, Inc., 2800 Post Oak Boulevard, Suite 5000, Houston, Texas 77056-6618. |
| |
| (2) | For purposes of this table, “beneficial ownership” is determined in accordance with Rule 13d-3 under the Exchange Act, pursuant to which a person is deemed to have “beneficial ownership” of shares of our stock that the person has the right to acquire within 60 days. For purposes of computing the percentage of outstanding shares of the Company’s stock held by each person or group of persons named in the table, any shares that such person or persons have the right to acquire within 60 days of March 1, 2020 are deemed to be outstanding, but are not deemed to be outstanding for the purpose of computing the percentage ownership of any other persons. |
| |
| (3) | Includes all common shares owned directly by Hines Global REIT II Investor Limited Partnership. Mr. Hines is deemed to be the beneficial owner of the shares owned by Hines Global REIT II Investor Limited Partnership. |
| |
| (4) | This amount does not include the (i) 21,111 OP Units in the Operating Partnership owned by Hines Global REIT II Associates Limited Partnership and (ii) the Special OP Units owned by Hines Global REIT II Advisors LP. Mr. Hines and Gerald D. Hines indirectly own and/or control Hines Global REIT II Associates Limited Partnership and Hines Global REIT II Advisors LP. Limited partners in the Operating Partnership may request repurchase of their OP Units for cash or, at our option, shares of common stock. The holder of the Special OP Units is entitled to the performance participation allocation described in “Item 13. Certain Relationships and Related Party Transactions, and Director Independence.” |
Item 13. Certain Relationships and Related Transactions, and Director Independence
Our Advisor
We do not have employees. Subject to the supervision of our board of directors, our day-to-day operations are conducted by our Advisor in accordance with the Advisory Agreement. Our Advisor is an affiliate of Hines and is wholly-owned, indirectly, by, or for the benefit of, the Chairman of our board of directors and Chief Executive Officer, Jeffrey C. Hines, and his father, Gerald D. Hines. All of our executive officers are employed by, and all of our executive officers actively participate in, the management of our Advisor and its affiliates. Jeffrey C. Hines serves as the Chairman of the Managers of the general partner of our Advisor and Charles M. Baughn serves as a Manager of the general partner of our Advisor.
Our executive officers have control and primary responsibility for the management decisions of our Advisor, including the selection of investment properties to be recommended to our board of directors, the negotiations for these investments, and the property management and leasing of properties we acquire directly. The Advisory Agreement had an initial term of one year, and may be renewed for an unlimited number of successive one-year terms upon the mutual consent of the parties. On December 11, 2019, the Company’s board of directors, including the independent directors, approved the renewal of the Advisory Agreement for an additional one-year term, extending the termination date of the agreement from December 21, 2019 to December 31, 2020. Renewals of the agreement must be approved by the Conflicts Committee. The Advisory Agreement may be terminated:
| |
| • | immediately by us (i) in the event our Advisor commits fraud, criminal conduct, willful misconduct or negligent breach of fiduciary duty, (ii) upon the bankruptcy of our Advisor or its involvement in similar insolvency proceedings or (iii) in the event of a material breach of the Advisory Agreement by our Advisor that remains uncured after 10 days’ written notice; |
| |
| • | without cause or penalty by us or by our Advisor upon 60 days’ written notice; or |
| |
| • | immediately by our Advisor upon our bankruptcy or involvement in similar insolvency proceedings or any material breach of the Advisory Agreement by us that remains uncured after 10 days’ written notice. |
Our Advisor and its affiliates receive compensation and are reimbursed for certain expenses in connection with services provided to us. These payments are summarized below. In the event the Advisory Agreement is terminated, our Advisor will be paid all earned, accrued and unpaid compensation and expense reimbursements within 30 days. Upon termination, we may also be obligated to purchase certain ownership interests in the Operating Partnership owned by our Advisor or other affiliates of Hines under certain circumstances.
The following summarizes the fees payable to our Advisor:
| |
| • | Effective as of December 6, 2017, our Advisor agreed to advance all of our organization and offering costs related to the Follow-On Offering through December 31, 2018. In January 2019, we began reimbursing our Advisor for all such advanced expenses as well as any organization and offering costs incurred by our Advisor related to our Initial Offering, and will continue to reimburse the Advisor ratably through December 31, 2023, to the extent cumulative organization and offering costs do not exceed an amount equal to 2.5% of gross offering proceeds from our public offerings. Following December 31, 2023, we will reimburse our Advisor for any organization and offering costs that it incurs on our behalf as and when incurred, to the extent that aggregate reimbursements to our Advisor for cumulative organization and offering costs do not exceed an amount equal to 2.5% of the gross offering proceeds from our public offerings. The total reimbursement related to organization and offering costs, selling commissions, dealer manager fees and the distribution and stockholder servicing fees related to a particular public offering may not exceed 15.0% of gross proceeds from the offering. During the year ended December 31, 2019, we reimbursed the Advisor $5.7 million in organization and offering costs. |
| |
| • | Our Advisor also receives asset management fees of 0.0625% per month of the cost of our real estate investments at the end of each month; provided that, with respect to real estate investments included in the most recent determination of our NAV per share, the asset management fees will be equal to 0.0625% per month of the most recently determined value of such real estate investments at the end of each month. The asset management fee cannot exceed an amount equal to 1/12th of 1.25% of our NAV at the end of each applicable month. Additionally, the asset management fee can be paid, at our Advisor’s election, in cash, Class I shares or Class I OP Units in the Operating Partnership. Our Advisor earned $8.0 million in asset management fees during the year ended December 31, 2019. |
| |
| • | We will reimburse our Advisor for all expenses paid or incurred by our Advisor in connection with the services provided to us, subject to the limitation that we will not reimburse our Advisor for any amount by which our operating expenses (including the asset management fee and the performance participation allocation) at the end of the four preceding fiscal quarters exceeds the greater of: (A) 2.0% of our average invested assets, or (B) 25.0% of our net income determined without reduction for any additions to reserves for depreciation, bad debts or other similar non-cash reserves and excluding any gain from the sale of our assets for that period (the “2%/25% Limitation”). In 2019, these limits were not exceeded. In 2019, our Advisor incurred $2.8 million in expenses, such as general and administrative expenses, on our behalf, which were reimbursed by us. See “Hines – Property Management and Leasing Agreements” below for additional information concerning expense reimbursements to Hines. |
We also agreed to indemnify our Advisor against losses it incurs in connection with its performance of its obligations under the Advisory Agreement, subject to terms and conditions in the Advisory Agreement.
Through its ownership of the Special OP Units of the Operating Partnership, our Advisor also holds a performance participation interest in the Operating Partnership that entitles it to receive an allocation of the Operating Partnership’s total return to its capital account. Total return is defined as distributions paid or accrued plus the change in NAV for the applicable period. Under the limited partnership agreement of the Operating Partnership, the annual total return will be allocated solely to our Advisor after the other unit holders have received a total return of 5% (after recouping any loss carryforward amount) and such allocation will continue until the allocation between our Advisor and all other unit holders is equal to 12.5% and 87.5% respectively. Thereafter, our Advisor will receive an allocation of 12.5% of the annual total return. The allocation of the performance participation interest is ultimately determined at the end of each calendar year, so long as the Advisory Agreement has not been terminated, and will be paid in cash or Class I OP Units of the Operating Partnership, at the election of our Advisor. For the year ended December 31, 2019, our Advisor earned a performance participation allocation of $7.7 million.
The Dealer Manager
The table below summarizes the fees payable to the Dealer Manager, effective as of December 6, 2017, the effective date of the Restructuring, with respect to the sale of Follow-On Offering Shares. The upfront selling commissions and dealer manager fees are each a percentage of the gross offering proceeds of the shares sold in the primary offering. No upfront selling commissions or dealer manager fees are payable with respect to shares issued under our distribution reinvestment plan.
|
| | | | | | | |
| | Class T Shares (1) | | Class S Shares (1) | | Class D Shares | | Class I Shares |
| Upfront Selling Commission and Dealer Manager Fee | 3.5% | | 3.5% | | None | | None |
Ongoing Distribution and Stockholder Servicing Fees (as a percentage of the aggregate NAV of the outstanding shares of each class of common stock) | 1.0% | | 1.0% | | 0.25% | | None |
| |
| (1) | With respect to Class T shares, there is a maximum upfront sales load of up to 3.5% of the gross offering proceeds from the sale of such shares in the primary offering, consisting of any combination of selling commissions and dealer manager fees. With respect to Class S shares, the upfront sales load of up to 3.5% of the gross proceeds from the sale of such shares in the primary offering consists solely of selling commissions. |
During the year ended December 31, 2019:
| |
| • | the Dealer Manager earned approximately $1.3 million in dealer manager fees, which excludes the amount paid to the Dealer Manager by our Advisor, a portion of which the Dealer Manager re-allowed to participating broker dealers; |
| |
| • | the Dealer Manager earned approximately $7.5 million in selling commissions, all of which the Dealer Manager re-allowed to participating broker dealers; and |
| |
| • | the Dealer Manager earned approximately $3.8 million in distribution and stockholder servicing fees, all of which the Dealer Manager re-allowed to participating broker dealers. |
Hines
Property Management and Leasing Agreements
Hines or its affiliates manage the properties in which we invest. When we acquire properties directly, we expect that we will pay Hines property management fees, leasing fees, tenant construction fees and other fees customarily paid to a property manager. Hines is wholly-owned by Jeffrey C. Hines and his father, Gerald D. Hines.
During the year ended December 31, 2019, Hines earned the following approximate amounts pursuant to property management agreements under which Hines manages some of our properties:
| |
| • | $1.9 million in property management fees; |
| |
| • | $1.0 million in leasing commissions and construction management fees; and |
| |
| • | $4.5 million for all costs Hines incurred in providing property management and leasing services pursuant to the property management and leasing agreements. Included in this reimbursement of operating costs are the cost of personnel and overhead expenses related to such personnel located at the property as well as off-site personnel located in Hines’ headquarters and regional offices, to the extent the same relate to or support the performance of Hines’ duties under the agreements. |
Credit Facilities with Hines
On October 2, 2017, the Operating Partnership entered into an uncommitted loan agreement (as amended, the “Hines Credit Facility”) with Hines for a maximum principal amount of $240.0 million. On November 30, 2017, the Operating Partnership amended the Hines Credit Facility to reduce the maximum principal amount to $75.0 million and further amended it in December 2018 to extend the maturity date as described below. Interest on each advance under the Hines Credit Facility is charged monthly at a variable rate, which is (i) Hines’ then-current borrowing rate under its revolving credit facility or (ii) if the Operating Partnership enters into a revolving credit facility (“the OP Facility”), the rate under such facility. Each advance under the Hines Credit Facility must be repaid within six months, subject to one six-month extension at the option of the Operating Partnership and subject to the satisfaction of certain conditions. Effective as of December 11, 2019, the Hines Credit Facility will terminate on the earlier of (a) the termination of the availability period as determined by Hines at its discretion (which will not impact the maturity date of any outstanding or previously approved advance under the loan agreement); (b) December 31, 2020; and (c) the date Hines accelerates the repayment of the loan agreement pursuant to any event of default.
Notwithstanding that each advance under the Hines Credit Facility matures six months after it is made, the Operating Partnership is required to repay each advance with any capital raised, unless the Operating Partnership enters into a revolving credit facility, at which point the Operating Partnership may use such proceeds from its public offering to repay the OP Facility, if any, prior to repaying any advances under the Hines Credit Facility. The Hines Credit Facility also permits voluntary prepayment of principal and accrued interest.
The Hines Credit Facility requires the maintenance of certain financial covenants beginning the earlier of (a) September 30, 2018 or (b) the effective date of the OP Facility, if any, which includes covenants concerning indebtedness to total asset value. In addition, the Hines Credit Facility contains customary affirmative and negative covenants, which, among other things, prohibit us and the Operating Partnership from: (i) merging with other companies or changing ownership interest; (ii) selling all or substantially all of our assets or properties; and (iii) if in default under the loan agreement, paying distributions to our stockholders other than as required to maintain our status as a real estate investment trust. The Hines Credit Facility also requires we deliver to Hines certain quarterly and annual financial information.
For the year ended December 31, 2019, we made draws of $134.0 million and made payments of $114.0 million under the Hines Credit Facility. The Company had $75.0 million outstanding on December 31, 2019. Additionally, we incurred an aggregate of $1.3 million in interest expense for the year ended December 31, 2019 under the Restated Hines Credit Facility.
Ownership Interests
The Operating Partnership
On July 31, 2013, we formed the Operating Partnership. Hines Global REIT II Associates Limited Partnership made an initial investment of $190,000 in limited partnership interests of the Operating Partnership and owned less than a 0.1% limited partnership interest in the Operating Partnership as of December 31, 2019. Our Advisor owns the Special OP Units in the Operating Partnership, as described in Item 13. Certain Relationships and Related Transactions, and Director Independence.
Policies and Procedures for Review of Related Party Transactions
Potential conflicts of interest exist among us, Hines, our Advisor and other affiliates of Hines in relation to our existing agreements and how we will operate. Currently, three of our five directors are independent directors, and each of our independent directors, serve on the Conflicts Committee of our board of directors. The Conflicts Committee reviews and approves all matters that our board of directors believes may involve conflicts of interest.
In order to reduce the effect of certain potential conflicts of interest, our Charter contains a number of restrictions relating to transactions we enter into with Hines, our Advisor, any of our directors and their respective affiliates. These restrictions include, among others, the following:
| |
| • | Except as otherwise permitted in our Charter, we will not engage in transactions with Hines, our Advisor, any of our directors or their respective affiliates unless a majority of our directors, including a majority of our independent directors, not otherwise interested in the transaction approve such transactions as fair and reasonable to us and on terms and conditions not less favorable to us than those available from unaffiliated third parties. |
| |
| • | We will not purchase a property from Hines, our Advisor, any of our directors or their respective affiliates without a determination by a majority of our directors, including a majority of our independent directors, not otherwise interested in the transaction that the transaction is fair and reasonable to us and at a price no greater than the cost of the property to Hines, our Advisor, any of our directors or their respective affiliates, unless there is substantial justification for any amount that exceeds such cost and such excess amount is determined to be reasonable. In all cases where assets are acquired from Hines, our Advisor, any of our directors or their respective affiliates, the fair market value of such assets will be determined by an independent expert selected by our independent directors. In no event will we acquire any property from Hines, our Advisor, any of our directors or their respective affiliates at a price that exceeds the appraised value of the property; provided that in the case of a development, redevelopment or refurbishment project that we agree to acquire prior to completion of the project, the appraised value will be based upon the completed value of the project as determined at the time the agreement to purchase the property is entered into. We will not sell or lease a property to Hines, our Advisor, any of our directors or their respective affiliates unless a majority of our directors, including a majority of the independent directors, not otherwise interested in the transaction determine the transaction is fair and reasonable to us. Even following these procedures, Hines and its affiliates (including our officers and directors) may make substantial profits in connection with the acquisition or sale of properties from other investment vehicles sponsored by Hines, our Advisor, any of our directors or their respective affiliates. |
| |
| • | We will not enter into joint ventures with Hines, our Advisor, any of our directors or their respective affiliates, unless a majority of our directors, including a majority of our independent directors, not otherwise interested in the transaction approves such transaction as being fair and reasonable to us and determines that our investment is on terms substantially similar to the terms of third parties making comparable investments. |
| |
| • | We will not make any loan to Hines, our Advisor, any of our directors or their respective affiliates except in the case of loans to our wholly owned subsidiaries and loans in which an independent expert has appraised the underlying asset. Any loans to us by Hines, our Advisor, any of our directors or their respective affiliates must be approved by a majority of our directors, including a majority of the independent directors, not otherwise interested in the transaction as fair, competitive and commercially reasonable, and on terms no less favorable to us than loans between unaffiliated parties under the same circumstances. |
Item 14. Principal Accounting Fees and Services
Deloitte & Touche LLP, the member firms of Deloitte Touche Tohmatsu, and their respective affiliates (collectively “Deloitte & Touche”) serve as our principal accounting firm. Deloitte & Touche audited our financial statements for the years ended December 31, 2019 and 2018. Deloitte & Touche reports directly to our Audit Committee.
Fees
Deloitte & Touche’s aggregate fees billed to us for the fiscal years ended December 31, 2019 and 2018 are as follows:
|
| | | | | | | | |
| | | 2019 | | 2018 |
| Audit Fees | | $ | 875,700 |
| | $ | 678,000 |
|
Audit-Related Fees (1) | | $ | 35,000 |
| | $ | 68,400 |
|
| Tax Fees | | $ | — |
| | $ | — |
|
| All Other Fees | | $ | — |
| | $ | — |
|
| Total Fees | | $ | 910,700 |
| | $ | 746,400 |
|
(1) These fees primarily relate to internal control attestation consultations, accounting consultations and other attestation services.
Pre-approval Policies and Procedures
Our Audit Committee has adopted a pre-approval policy requiring the Audit Committee to pre-approve all audit and permissible non-audit services to be performed by Deloitte & Touche. In determining whether or not to pre-approve services, the Audit Committee will consider whether the service is a permissible service under the rules and regulations promulgated by the SEC, and, if permissible, the potential effect of such services on the independence of Deloitte & Touche. All services performed for us in 2019 were pre-approved or ratified by our Audit Committee.
PART IV
Item 15. Exhibits, Financial Statement Schedules
(a)(1) Financial Statements
Hines Global Income Trust, Inc.
Consolidated Financial Statements — as of December 31, 2019 and 2018 and for the Years Ended December 31, 2019, 2018 and 2017.
|
| |
| Report of Independent Registered Public Accounting Firm | |
| Audited Consolidated Financial Statements | |
| Consolidated Balance Sheets | |
| Consolidated Statements of Operations and Comprehensive Income (Loss) | |
| Consolidated Statements of Equity | |
| Consolidated Statements of Cash Flows | |
| Notes to the Consolidated Financial Statements | |
(2) Financial Statement Schedules
Schedule II — Valuation and Qualifying Accounts is set forth beginning on page 132 hereof.
Schedule III — Real Estate Assets and Accumulated Depreciation is set forth beginning on page 133 hereof.
All other schedules for which provision is made in the applicable accounting regulations of the SEC are not required under the related instructions or are not applicable and therefore have been omitted.
(b) Exhibits
Reference is made to the Index beginning on page 135 for a list of all exhibits filed as a part of this report.
Item 16. Form 10-K Summary
The Company has elected not to include a summary.
* * * * * *
Hines Global Income Trust, Inc.
Schedule II — Valuation and Qualifying Accounts
|
| | | | | | | | | | | | | | | | |
| Description | | Balance at the Beginning of the Period | | Charged to Costs and Expenses | | Deductions | | Balance at the End of the Period |
| | | (amounts in thousands) |
| Deferred Tax Asset Valuation Allowance as of December 31, 2019 | | $ | 820 |
| | $ | 1,442 |
| | $ | (510 | ) | | $ | 1,752 |
|
| Deferred Tax Asset Valuation Allowance as of December 31, 2018 | | $ | 205 |
| | $ | 1,368 |
| | $ | (753 | ) | | $ | 820 |
|
Allowance for Doubtful Accounts as of December 31, 2018 (1) | | $ | 81 |
| | $ | 229 |
| | $ | — |
| | $ | 310 |
|
| |
| (1) | With the implementation of ASU 2016-02 as of January 1, 2019, the current guidance clarified that uncollectible lease payments were to be recognized as a reduction in revenues and were not considered an allowance. With this implementation, the Allowance for Doubtful Accounts was re-characterized to be appropriately reflected as reductions in Revenues for uncollectible amounts. See Note 2—Summary of Significant Accounting Policies for more information on the adoption of ASU 2016-02. |
Schedule III — Real Estate Assets and Accumulated Depreciation
December 31, 2019
|
| | | | | | | | | | | | | | | | | | | | | | | | | | | | | | | | | | | | | | | | | | |
| | | | | | | Initial Cost (b) | | | | Gross Amount at Which Carried at 12/31/2019 | | | | | | |
Description (a) | | Location | | Encumbrances | | Land | | Buildings and Improvements | | Total | | Costs Capitalized Subsequent to Acquisition (c) | | Land | | Buildings and Improvements | | Total (d) | | Accumulated Depreciation (e) | | Date of Construction | | Date Acquired |
| (In thousands) |
| Bishop’s Square | | Dublin, Ireland | | $ | 61,907 |
| | $ | — |
| | $ | 53,653 |
| | $ | 53,653 |
| | $ | 21,771 |
| | $ | — |
| | $ | 75,424 |
| | $ | 75,424 |
| | $ | (7,039 | ) | | 2001 | | March-15 |
| Domain Apartments | | Las Vegas, Nevada | | 34,300 |
| | 5,690 |
| | 50,790 |
| | 56,480 |
| | 291 |
| | 5,690 |
| | 51,081 |
| | 56,771 |
| | (6,947 | ) | | 2014 | | January-16 |
| Cottonwood Corporate Center | | Salt Lake City, Utah | | 72,359 |
| | 13,600 |
| | 98,758 |
| | 112,358 |
| | 2,114 |
| | 13,600 |
| | 100,872 |
| | 114,472 |
| | (8,903 | ) | | 1997, 2000 | | July-16 |
| Goodyear Crossing II | | Phoenix, Arizona | | 29,000 |
| | 7,270 |
| | 41,620 |
| | 48,890 |
| | 1,425 |
| | 7,270 |
| | 43,045 |
| | 50,315 |
| | (3,574 | ) | | 2008, 2009 | | August-16 |
| Rookwood | | Cincinnati, Ohio | | 96,000 |
| | 45,320 |
| | 132,466 |
| | 177,786 |
| | 534 |
| | 45,319 |
| | 133,001 |
| | 178,320 |
| | (9,971 | ) | | 1993, 2000 | | January-17 |
| Montrose Student Residences | | Dublin, Ireland | | 25,352 |
| | 5,919 |
| | 35,058 |
| | 40,977 |
| | 774 |
| | 5,919 |
| | 35,832 |
| | 41,751 |
| | (2,610 | ) | | 1964, 2013-2015 | | March-17 |
| Queen's Court Student Residences | | Reading, United Kingdom | | 38,896 |
| | 13,989 |
| | 50,392 |
| | 64,381 |
| | 2,806 |
| | 13,989 |
| | 53,198 |
| | 67,187 |
| | (3,123 | ) | | 2016 | | October-17 |
| Venue Museum District | | Houston, Texas | | 45,000 |
| | 17,409 |
| | 52,538 |
| | 69,947 |
| | 42 |
| | 17,409 |
| | 52,580 |
| | 69,989 |
| | (1,778 | ) | | 2009 | | September-18 |
| Fresh Park Venlo | | Venlo, The Netherlands | | 84,092 |
| | — |
| | 124,696 |
| | 124,696 |
| | 1,050 |
| | — |
| | 125,746 |
| | 125,746 |
| | (4,024 | ) | | 1960-2018 | | October-18 |
| Maintal Logistics | | Maintal, Germany | | 26,136 |
| | 14,787 |
| | 29,685 |
| | 44,472 |
| | 741 |
| | 14,787 |
| | 30,426 |
| | 45,213 |
| | (752 | ) | | 1974, 2001-2002 | | December-18 |
| ABC Westland | | The Hague, Netherlands | | 82,655 |
| | 59,744 |
| | 74,153 |
| | 133,897 |
| | (3,021 | ) | | 59,744 |
| | 71,132 |
| | 130,876 |
| | (1,409 | ) | | 1969-2018 | | May-19 |
| Promenade Shops at Briargate | | Colorado Springs, Colorado | | — |
| | 19,199 |
| | 55,425 |
| | 74,624 |
| | — |
| | 19,199 |
| | 55,425 |
| | 74,624 |
| | (418 | ) | | 2003 | | September-19 |
Gdańsk PL II
| | Gdańsk, Poland | | 18,790 |
| | 6,350 |
| | 19,236 |
| | 25,586 |
| | — |
| | 6,350 |
| | 19,236 |
| | 25,586 |
| | (130 | ) | | 2013, 2015 | | September-19 |
Łódź Urban Logistics
| | Łódź , Poland | | 15,211 |
| | — |
| | 19,588 |
| | 19,588 |
| | — |
| | — |
| | 19,588 |
| | 19,588 |
| | (132 | ) | | 2018-2019 | | September-19 |
| Glasgow West End | | Glasgow, United Kingdom | | 56,959 |
| | 23,627 |
| | 70,273 |
| | 93,900 |
| | — |
| | 23,627 |
| | 70,273 |
| | 93,900 |
| | (493 | ) | | 2017 | | September-19 |
| The Alloy | | College Park, Maryland | | — |
| | 14,194 |
| | 81,971 |
| | 96,165 |
| | — |
| | 14,194 |
| | 81,971 |
| | 96,165 |
| | (275 | ) | | 2019 | | November-19 |
| Charles Tyrwhitt Distribution Centre | | Milton Keynes, United Kingdom | | — |
| | 7,190 |
| | 11,490 |
| | 18,680 |
| | — |
| | 7,190 |
| | 11,490 |
| | 18,680 |
| | (42 | ) | | 2010 | | November-19 |
| DSG Bristol | | Bristol, United Kingdom | | — |
| | 18,163 |
| | 23,069 |
| | 41,232 |
| | — |
| | 18,161 |
| | 23,071 |
| | 41,232 |
| | (69 | ) | | 2006 | | November-19 |
| Royal Mail | | Edinburgh, United Kingdom | | — |
| | 6,187 |
| | 23,820 |
| | 30,007 |
| | — |
| | 6,191 |
| | 23,816 |
| | 30,007 |
| | (30 | ) | | 1995 | | December-19 |
| | | | | $ | 686,657 |
| | $ | 278,638 |
| | $ | 1,048,681 |
| | $ | 1,327,319 |
| | $ | 28,527 |
| | $ | 278,639 |
| | $ | 1,077,207 |
| | $ | 1,355,846 |
| | $ | (51,719 | ) | | | | |
| |
| (a) | Assets consist of quality office, retail, industrial and residential/living properties. |
| |
| (b) | Components of initial cost for the property acquired using a foreign currency were converted using the December 31, 2019 balance sheet rate. |
| |
| (c) | Costs capitalized subsequent to addition are presented net of any write-offs. |
| |
| (d) | The aggregate cost for federal income tax purposes is $1.4 billion as of December 31, 2019. |
| |
| (e) | Real estate assets are depreciated or amortized using the straight-line method over the useful lives of the assets by class. The estimated useful lives for computing depreciation are generally 10 years for furniture and fixtures, 15-20 years for electrical and mechanical installations and 40 years for buildings. |
The changes in total real estate assets for the years ended December 31,
|
| | | | | | | | | | | |
| | 2019 | | 2018 | | 2017 |
| Gross real estate assets | | | | | |
| Balance, beginning of period | $ | 817,763 |
| | $ | 591,005 |
| | $ | 290,212 |
|
| Additions during the period: | |
| | | | |
| Acquisitions | 524,638 |
| | 244,132 |
| | 282,162 |
|
| Other additions | 11,257 |
| | 14,653 |
| | 5,561 |
|
| Write-Offs/Cost of real estate sold | (3,766 | ) | | (21,370 | ) | | — |
|
| Effect of changes in foreign currency exchange rates | 5,954 |
| | (10,657 | ) | | 13,070 |
|
| Balance, end of period | $ | 1,355,846 |
|
| $ | 817,763 |
| | $ | 591,005 |
|
| Accumulated Depreciation | |
| | | | |
| Balance, beginning of period | $ | (30,574 | ) | | $ | (18,172 | ) | | $ | (6,337 | ) |
| Depreciation | (24,873 | ) | | (13,938 | ) | | (11,393 | ) |
| Effect of changes in foreign currency exchange rates | (38 | ) | | 459 |
| | (442 | ) |
| Retirement or sales of assets | 3,766 |
| | 1,077 |
| | — |
|
| Balance, end of period | $ | (51,719 | ) |
| $ | (30,574 | ) | | $ | (18,172 | ) |
INDEX TO EXHIBITS
|
| | |
Exhibit
No. | | Description |
| 3.1 | | |
| 3.2 | | |
| 3.3 | | |
| 3.4 | | |
| 3.5 | | |
| 3.6 | | |
| 3.7 | | |
| 3.8 | | |
| 3.9 | | |
| 3.10 | | |
| 3.11 | | |
| 4.1 | | |
| 4.2 | | |
| 4.3* | | |
| 10.1 | | |
| 10.2 | | Form of Indemnification Agreement entered into between Hines Global Income Trust, Inc. (formerly known as Hines Global REIT II, Inc.) and each of the following persons as of August 15, 2014: Jeffrey C. Hines, Charles M. Baughn, Humberto Cabañas, Dougal A. Cameron, John O. Niemann, Jr., Sherri W. Schugart, Ryan T. Sims, David L. Steinbach, Kevin L. McMeans and J. Shea Morgenroth (filed as Exhibit 10.4 to the IPO Registration Statement on September 11, 2013 and incorporated by reference herein) |
| 10.3 | | |
| 10.4 | | |
| 10.5 | | |
| 10.6 | | |
| 10.7 | | |
|
| | |
Exhibit
No. | | Description |
| 10.8 | | |
| 10.9 | | |
| 10.10 | | |
| 10.11 | | |
| 10.12 | | |
| 10.13 | | |
| 10.14 | | |
| 10.15 | | |
| 10.16 | | |
| 10.17 | | |
| 10.18 | | |
| 10.19 | | |
| 10.20 | | |
| 10.21 | |
|
| 10.22 | | |
| 10.23 | | Credit Agreement dated as of November 15, 2019 among Hines Global REIT II Properties LP, the Lenders party thereto, and JPMorgan Chase Bank, National Association, as Administrative Agent, Bank of America, National Association, as Syndication Agent, U.S. Bank, National Association, Wells Fargo Bank, National Association, Citizens Bank, National Association and Regions Bank, as Co-Documentation Agents. (filed as Exhibit 10.1 to the Registrant’s Current Report on Form 8-K on November 21, 2019 and incorporated by reference herein) |
| 10.24 | |
|
| 21.1* | | |
| 23.1* | | |
| 31.1* | | |
| 31.2* | | |
| 32.1* | | |
|
| | |
Exhibit
No. | | Description |
| 99.1 | | |
| 99.2 | | |
| 99.3* | | |
| 101.INS* | | Instance Document—The instance document does not appear in the interactive data file because its XBRL tags are embedded within the inline XBRL document. |
| 101.SCH* | | XBRL Taxonomy Extension Schema Documemt |
| 101.CAL* | | XBRL Taxonomy Extension Calculation Linkbase Document |
| 101.DEF* | | XBRL Taxonomy Extension Definition Linkbase Document |
| 101.LAB* | | XBRL Taxonomy Extension Labels Linkbase Document |
| 101.PRE* | | XBRL Taxonomy Extension Presentation Linkbase Document |
| * | | Filed herewith |
SIGNATURES
Pursuant to the requirements of Section 13 or 15(d) of the Securities Exchange Act of 1934, the Registrant has duly caused this Annual Report to be signed on its behalf by the undersigned, thereunto duly authorized representative.
|
| | |
| | | HINES GLOBAL INCOME TRUST, INC. (registrant) |
| | | |
| March 30, 2020 | By: | /s/ Jeffrey C. Hines |
| | | Jeffrey C. Hines |
| | | Chief Executive Officer |
Pursuant to the requirements of the Securities Exchange Act of 1934, this Report has been signed below by the following persons on behalf of the Registrant and in the capacities indicated on March 30, 2020.
|
| | |
| Signature | Title | Date |
| | | |
| /s/ Jeffrey C. Hines | Chief Executive Officer and Chairman of the Board of Directors | March 30, 2020 |
| Jeffrey C. Hines | (Principal Executive Officer) | |
| | | |
| /s/ J. Shea Morgenroth | Chief Financial Officer | March 30, 2020 |
| J. Shea Morgenroth | (Principal Financial Officer) | |
| | | |
| /s/ A. Gordon Findlay | Chief Accounting Officer and Treasurer | March 30, 2020 |
| A. Gordon Findlay | (Principal Accounting Officer) | |
| | | |
| /s/ Humberto “Burt” Cabañas | Director | March 30, 2020 |
| Humberto “Burt” Cabañas | | |
| | | |
| /s/ Dougal A. Cameron | Director | March 30, 2020 |
| Dougal A. Cameron | | |
| | | |
| /s/ John O. Niemann, Jr. | Director | March 30, 2020 |
| John O. Niemann, Jr. | | |
| | | |
| /s/ David L. Steinbach | Director | March 30, 2020 |
| David L. Steinbach | | |