Exhibit 99.1 NAREIT Presentation June 2021Exhibit 99.1 NAREIT Presentation June 2021
Disclaimer & Risk Factors Certain of the matters discussed in this investor presentation constitute forward-looking statements within the meaning of the safe harbor provisions of the Private Securities Litigation Reform Act of 1995. Such forward-looking statements can generally be identified by our use of forward-looking terminology such as “may,” “will,” “expect,” “intend,” “anticipate,” “estimate,” “believe,” “continue,” or other similar words. Readers are cautioned not to place undue reliance on these forward-looking statements and any such forward-looking statements are qualified in their entirety by reference to the following cautionary statements. All forward-looking statements speak only as of the date hereof and are based on current expectations and involve a number of assumptions, risks and uncertainties that could cause the actual results to differ materially from such forward-looking statements. Such forward-looking statements include, but are not limited to, statements about the expected effects and benefits of the merger with Strategic Storage Growth Trust, Inc. ( SSGT ), the merger with Strategic Storage Trust IV, Inc. (“SST IV”) and the Series A Preferred equity investment, including anticipated future financial and operating results and synergies, as well as all other statements in this investor presentation, other than historical facts. There are several factors which could cause actual plans and results to differ materially from those expressed or implied in forward-looking statements, including, without limitation, the following: (i) risks related to disruption of management’s attention from SmartStop’s ongoing business operations due to the SSGT merger, the SST IV merger, or other business matters; (ii) significant transaction costs, including financing costs, and unknown liabilities; (iii) failure to realize the expected benefits and synergies of the SSGT merger, the SST IV merger or the self administration transaction in the expected timeframes or at all; (iv) costs or difficulties related to the integration of acquired self storage facilities and operations, including facilities acquired through the SSGT merger, the SST IV merger and operations acquired through the self administration transaction; (v) changes in the political and economic climate, economic conditions and fiscal imbalances in the United States, and other major developments, including wars, natural disasters, epidemics and pandemics, including the outbreak of novel coronavirus (COVID-19), military actions, and terrorist attacks; (vi) changes in tax and other laws and regulations; or (vii) difficulties in SmartStop’s ability to attract and retain qualified personnel and management. Actual results may differ materially from those indicated by such forward-looking statements. In addition, the forward-looking statements represent SmartStop’s views as of the date on which such statements were made. SmartStop anticipates that subsequent events and developments may cause its views to change. These forward-looking statements should not be relied upon as representing SmartStop’s views as of any date subsequent to the date hereof. Additional factors that may affect the business or financial results of SmartStop are described in the risk factors included in SmartStop’s filings with the SEC, including SmartStop’s Annual Report on Form 10-K for the fiscal year ended December 31, 2020 and subsequent Quarterly Reports on Form 10-Q, which factors are incorporated herein by reference, all of which are filed with the SEC and available at www.sec.gov. SmartStop expressly disclaims a duty to provide updates to forward-looking statements, whether as a result of new information, future events or other occurrences. This is neither an offer nor a solicitation to purchase securities. See our Form 10-K and recent Form 10-Q for specific risks associated with an investment in SmartStop Self Storage REIT, Inc. • As of March 31, 2021, our accumulated deficit was approximately $155 million and it is possible that our operations may not be profitable in 2021. • We have paid distributions from sources other than our cash flows from operations, including from the net proceeds of our public offering and our distribution reinvestment plan (DRP offering). We are not prohibited from undertaking such activities by our charter, bylaws or investment policies, and we may use an unlimited amount from any source to pay our distributions. For the twelve months ended December 31, 2020, we funded 54% of our distributions using cash flow from operations, 14% from cash provided by financing activities, and 32% using proceeds from our DRP offering. For the three months ended March 31, 2021, we funded 36% of our distributions using cash flow from operations, 35% from cash on hand, and 29% using proceeds from our DRP offering. If we continue to pay distributions from sources other than cash flows from operations, we will have fewer funds available for acquiring properties, which may reduce our stockholders’ overall returns. Additionally, to the extent distributions exceed cash flows from operations, a stockholder’s basis in our stock may be reduced and, to the extent distributions exceed a stockholder’s basis, the stockholder may recognize a capital gain. • No public market currently exists for shares of our common stock and there may never be one. Therefore, it will be difficult for our stockholders to sell their shares. Our charter does not require us to pursue a liquidity transaction at anytime. If you sell your shares, it will likely be at a substantial discount. • We may only calculate the value per share for our shares annually and, therefore, you may not be able to determine the net asset value of your shares on an ongoing basis. • We cannot assure our stockholders that we will be successful in the marketplace. • Revenues and earnings from Strategic Storage Trust VI, Inc. and Strategic Storage Growth Trust II, Inc. (the “Managed REITs”) are uncertain. • Because the revenue streams from the advisory agreements with the managed REITs are subject to limitation or cancellation, any such termination could adversely affect our financial condition, cash flow and the amount available for distributions to you. • We will face conflicts of interest relating to the purchase of properties, including conflicts with Strategic Storage Trust VI, Inc. and Strategic Storage Growth Trust II, Inc., and such conflicts may not be resolved in our favor, which could adversely affect our investment opportunities. • Our trademarks are important to the value of our business, and the ability to protect, and costs associated with protecting, our intellectual property could adversely affect our business and results of operations. • We may incur substantial debt, which could hinder our ability to pay distributions to our stockholders or could decrease the value of your investment. • Our Series A Preferred Shares rank senior to our common stock, and therefore, any cash we have to pay distributions will be used to pay distributions to the holders of Series A Preferred Shares first, which could have a negative impact on our ability to pay distributions to our common stockholders. • We may fail to qualify as a REIT, which could adversely affect our operations and our ability to make distributions. • Our board of directors may change any of our investment objectives without your consent. NAREIT Presentation 2Disclaimer & Risk Factors Certain of the matters discussed in this investor presentation constitute forward-looking statements within the meaning of the safe harbor provisions of the Private Securities Litigation Reform Act of 1995. Such forward-looking statements can generally be identified by our use of forward-looking terminology such as “may,” “will,” “expect,” “intend,” “anticipate,” “estimate,” “believe,” “continue,” or other similar words. Readers are cautioned not to place undue reliance on these forward-looking statements and any such forward-looking statements are qualified in their entirety by reference to the following cautionary statements. All forward-looking statements speak only as of the date hereof and are based on current expectations and involve a number of assumptions, risks and uncertainties that could cause the actual results to differ materially from such forward-looking statements. Such forward-looking statements include, but are not limited to, statements about the expected effects and benefits of the merger with Strategic Storage Growth Trust, Inc. ( SSGT ), the merger with Strategic Storage Trust IV, Inc. (“SST IV”) and the Series A Preferred equity investment, including anticipated future financial and operating results and synergies, as well as all other statements in this investor presentation, other than historical facts. There are several factors which could cause actual plans and results to differ materially from those expressed or implied in forward-looking statements, including, without limitation, the following: (i) risks related to disruption of management’s attention from SmartStop’s ongoing business operations due to the SSGT merger, the SST IV merger, or other business matters; (ii) significant transaction costs, including financing costs, and unknown liabilities; (iii) failure to realize the expected benefits and synergies of the SSGT merger, the SST IV merger or the self administration transaction in the expected timeframes or at all; (iv) costs or difficulties related to the integration of acquired self storage facilities and operations, including facilities acquired through the SSGT merger, the SST IV merger and operations acquired through the self administration transaction; (v) changes in the political and economic climate, economic conditions and fiscal imbalances in the United States, and other major developments, including wars, natural disasters, epidemics and pandemics, including the outbreak of novel coronavirus (COVID-19), military actions, and terrorist attacks; (vi) changes in tax and other laws and regulations; or (vii) difficulties in SmartStop’s ability to attract and retain qualified personnel and management. Actual results may differ materially from those indicated by such forward-looking statements. In addition, the forward-looking statements represent SmartStop’s views as of the date on which such statements were made. SmartStop anticipates that subsequent events and developments may cause its views to change. These forward-looking statements should not be relied upon as representing SmartStop’s views as of any date subsequent to the date hereof. Additional factors that may affect the business or financial results of SmartStop are described in the risk factors included in SmartStop’s filings with the SEC, including SmartStop’s Annual Report on Form 10-K for the fiscal year ended December 31, 2020 and subsequent Quarterly Reports on Form 10-Q, which factors are incorporated herein by reference, all of which are filed with the SEC and available at www.sec.gov. SmartStop expressly disclaims a duty to provide updates to forward-looking statements, whether as a result of new information, future events or other occurrences. This is neither an offer nor a solicitation to purchase securities. See our Form 10-K and recent Form 10-Q for specific risks associated with an investment in SmartStop Self Storage REIT, Inc. • As of March 31, 2021, our accumulated deficit was approximately $155 million and it is possible that our operations may not be profitable in 2021. • We have paid distributions from sources other than our cash flows from operations, including from the net proceeds of our public offering and our distribution reinvestment plan (DRP offering). We are not prohibited from undertaking such activities by our charter, bylaws or investment policies, and we may use an unlimited amount from any source to pay our distributions. For the twelve months ended December 31, 2020, we funded 54% of our distributions using cash flow from operations, 14% from cash provided by financing activities, and 32% using proceeds from our DRP offering. For the three months ended March 31, 2021, we funded 36% of our distributions using cash flow from operations, 35% from cash on hand, and 29% using proceeds from our DRP offering. If we continue to pay distributions from sources other than cash flows from operations, we will have fewer funds available for acquiring properties, which may reduce our stockholders’ overall returns. Additionally, to the extent distributions exceed cash flows from operations, a stockholder’s basis in our stock may be reduced and, to the extent distributions exceed a stockholder’s basis, the stockholder may recognize a capital gain. • No public market currently exists for shares of our common stock and there may never be one. Therefore, it will be difficult for our stockholders to sell their shares. Our charter does not require us to pursue a liquidity transaction at anytime. If you sell your shares, it will likely be at a substantial discount. • We may only calculate the value per share for our shares annually and, therefore, you may not be able to determine the net asset value of your shares on an ongoing basis. • We cannot assure our stockholders that we will be successful in the marketplace. • Revenues and earnings from Strategic Storage Trust VI, Inc. and Strategic Storage Growth Trust II, Inc. (the “Managed REITs”) are uncertain. • Because the revenue streams from the advisory agreements with the managed REITs are subject to limitation or cancellation, any such termination could adversely affect our financial condition, cash flow and the amount available for distributions to you. • We will face conflicts of interest relating to the purchase of properties, including conflicts with Strategic Storage Trust VI, Inc. and Strategic Storage Growth Trust II, Inc., and such conflicts may not be resolved in our favor, which could adversely affect our investment opportunities. • Our trademarks are important to the value of our business, and the ability to protect, and costs associated with protecting, our intellectual property could adversely affect our business and results of operations. • We may incur substantial debt, which could hinder our ability to pay distributions to our stockholders or could decrease the value of your investment. • Our Series A Preferred Shares rank senior to our common stock, and therefore, any cash we have to pay distributions will be used to pay distributions to the holders of Series A Preferred Shares first, which could have a negative impact on our ability to pay distributions to our common stockholders. • We may fail to qualify as a REIT, which could adversely affect our operations and our ability to make distributions. • Our board of directors may change any of our investment objectives without your consent. NAREIT Presentation 2

Today’s Presenters • Chairman since March 2013 H. Michael Schwartz ® • Founder and creator of SmartStop Self Storage brand and platform Founder, CEO & Executive • 30+ years of real estate, securities and corporate financial management experience Chairman • CFO and Treasurer since June 2019 James Barry • With SmartStop companies since 2012, previously SVP of Finance CFO & Treasurer • 10+ years of real estate and finance experience • 8+ years of self storage experience David Corak, CFA • Former sell side analyst covering the self storage sector for 6+ years VP, Corporate Finance • Previously the SVP of Corporate Finance at Jernigan Capital (NYSE: JCAP) prior to the company’s sale in November 2020 NAREIT Presentation 3Today’s Presenters • Chairman since March 2013 H. Michael Schwartz ® • Founder and creator of SmartStop Self Storage brand and platform Founder, CEO & Executive • 30+ years of real estate, securities and corporate financial management experience Chairman • CFO and Treasurer since June 2019 James Barry • With SmartStop companies since 2012, previously SVP of Finance CFO & Treasurer • 10+ years of real estate and finance experience • 8+ years of self storage experience David Corak, CFA • Former sell side analyst covering the self storage sector for 6+ years VP, Corporate Finance • Previously the SVP of Corporate Finance at Jernigan Capital (NYSE: JCAP) prior to the company’s sale in November 2020 NAREIT Presentation 3

SmartStop Platform at a Glance SmartStop Self Storage REIT is the largest public non-traded self storage REIT in the U.S. Initially started raising equity capital in 2014 through the broker dealer network th (1) (1) 10 Largest 11.8 Million 154 Self Storage Company in Owned and Managed Owned and Managed Self the U.S. Rentable Square Feet Storage Facilities $1.7 Billion $4.0 Billion 400+ Self Storage Assets Historical Self Storage Employees (2) Under Management Transaction Activity 11% 94.1% 14.2% Management Ownership Q1 2021 Quarter End Q1 2021 Same Store (3) In The Company Same Store Occupancy NOI Growth Note: Portfolio as of 3/31/2021 and includes all operational properties owned by SmartStop unless otherwise noted (1) As of 5/31/2021 (2) Includes affiliated companies NAREIT Presentation 4 (3) Same-store NOI is a non-GAAP measure. See Appendix for a reconciliation of this measure to the most directly comparable GAAP financial measure.SmartStop Platform at a Glance SmartStop Self Storage REIT is the largest public non-traded self storage REIT in the U.S. Initially started raising equity capital in 2014 through the broker dealer network th (1) (1) 10 Largest 11.8 Million 154 Self Storage Company in Owned and Managed Owned and Managed Self the U.S. Rentable Square Feet Storage Facilities $1.7 Billion $4.0 Billion 400+ Self Storage Assets Historical Self Storage Employees (2) Under Management Transaction Activity 11% 94.1% 14.2% Management Ownership Q1 2021 Quarter End Q1 2021 Same Store (3) In The Company Same Store Occupancy NOI Growth Note: Portfolio as of 3/31/2021 and includes all operational properties owned by SmartStop unless otherwise noted (1) As of 5/31/2021 (2) Includes affiliated companies NAREIT Presentation 4 (3) Same-store NOI is a non-GAAP measure. See Appendix for a reconciliation of this measure to the most directly comparable GAAP financial measure.
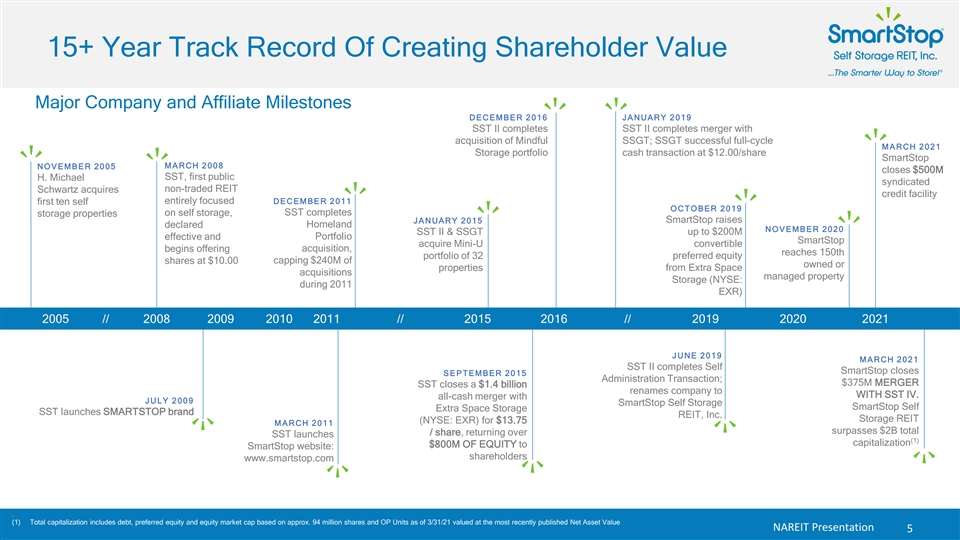
15+ Year Track Record Of Creating Shareholder Value Major Company and Affiliate Milestones DECEMBER 2016 JANUARY 2019 SST II completes SST II completes merger with acquisition of Mindful SSGT; SSGT successful full-cycle MARCH 2021 Storage portfolio cash transaction at $12.00/share SmartStop MARCH 2008 NOVEMBER 2005 closes $500M SST, first public H. Michael syndicated non-traded REIT Schwartz acquires credit facility entirely focused DECEMBER 2011 first ten self OCTOBER 2019 on self storage, SST completes storage properties SmartStop raises JANUARY 2015 declared Homeland NOVEMBER 2020 SST II & SSGT up to $200M effective and Portfolio SmartStop acquire Mini-U convertible begins offering acquisition, reaches 150th portfolio of 32 preferred equity shares at $10.00 capping $240M of owned or properties from Extra Space acquisitions managed property Storage (NYSE: during 2011 EXR) 2005 // 2008 2009 2010 2011 // 2015 2016 // 2019 2020 2021 JUNE 2019 MARCH 2021 SST II completes Self SmartStop closes SEPTEMBER 2015 Administration Transaction; $375M MERGER SST closes a $1.4 billion renames company to WITH SST IV. all-cash merger with JULY 2009 SmartStop Self Storage SmartStop Self Extra Space Storage SST launches SMARTSTOP brand REIT, Inc. Storage REIT (NYSE: EXR) for $13.75 MARCH 2011 surpasses $2B total / share, returning over SST launches (1) capitalization $800M OF EQUITY to SmartStop website: shareholders www.smartstop.com . (1) Total capitalization includes debt, preferred equity and equity market cap based on approx. 94 million shares and OP Units as of 3/31/21 valued at the most recently published Net Asset Value NAREIT Presentation 515+ Year Track Record Of Creating Shareholder Value Major Company and Affiliate Milestones DECEMBER 2016 JANUARY 2019 SST II completes SST II completes merger with acquisition of Mindful SSGT; SSGT successful full-cycle MARCH 2021 Storage portfolio cash transaction at $12.00/share SmartStop MARCH 2008 NOVEMBER 2005 closes $500M SST, first public H. Michael syndicated non-traded REIT Schwartz acquires credit facility entirely focused DECEMBER 2011 first ten self OCTOBER 2019 on self storage, SST completes storage properties SmartStop raises JANUARY 2015 declared Homeland NOVEMBER 2020 SST II & SSGT up to $200M effective and Portfolio SmartStop acquire Mini-U convertible begins offering acquisition, reaches 150th portfolio of 32 preferred equity shares at $10.00 capping $240M of owned or properties from Extra Space acquisitions managed property Storage (NYSE: during 2011 EXR) 2005 // 2008 2009 2010 2011 // 2015 2016 // 2019 2020 2021 JUNE 2019 MARCH 2021 SST II completes Self SmartStop closes SEPTEMBER 2015 Administration Transaction; $375M MERGER SST closes a $1.4 billion renames company to WITH SST IV. all-cash merger with JULY 2009 SmartStop Self Storage SmartStop Self Extra Space Storage SST launches SMARTSTOP brand REIT, Inc. Storage REIT (NYSE: EXR) for $13.75 MARCH 2011 surpasses $2B total / share, returning over SST launches (1) capitalization $800M OF EQUITY to SmartStop website: shareholders www.smartstop.com . (1) Total capitalization includes debt, preferred equity and equity market cap based on approx. 94 million shares and OP Units as of 3/31/21 valued at the most recently published Net Asset Value NAREIT Presentation 5
Investment Highlights NAREIT Presentation 6Investment Highlights NAREIT Presentation 6
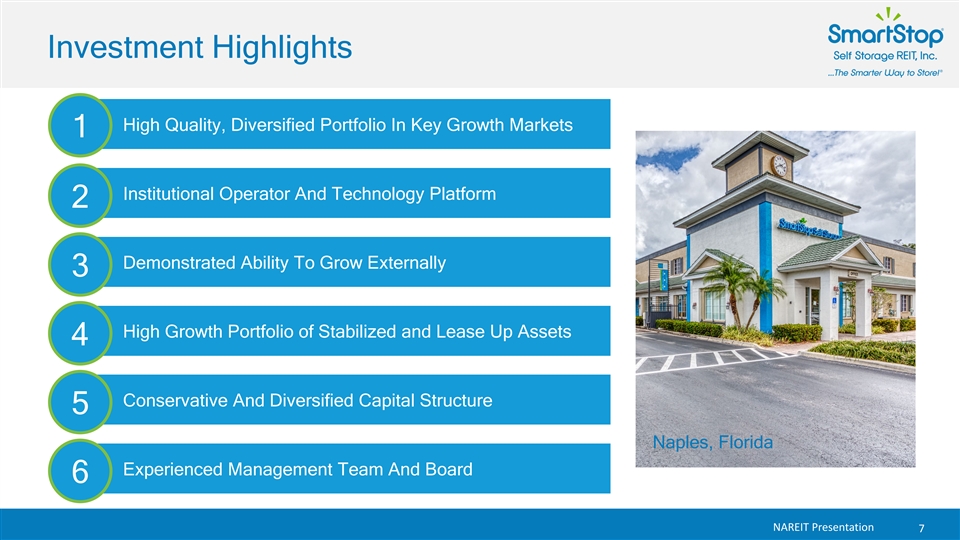
Investment Highlights High Quality, Diversified Portfolio In Key Growth Markets 1 Institutional Operator And Technology Platform 2 Demonstrated Ability To Grow Externally 3 High Growth Portfolio of Stabilized and Lease Up Assets 4 Conservative And Diversified Capital Structure 5 Naples, Florida Experienced Management Team And Board 6 NAREIT Presentation 7Investment Highlights High Quality, Diversified Portfolio In Key Growth Markets 1 Institutional Operator And Technology Platform 2 Demonstrated Ability To Grow Externally 3 High Growth Portfolio of Stabilized and Lease Up Assets 4 Conservative And Diversified Capital Structure 5 Naples, Florida Experienced Management Team And Board 6 NAREIT Presentation 7

Owned Operating Portfolio 141 104K 63.3% 10.7 million Operating Properties Average 3 Mile Radius Concentration In Top Net Rentable Square Feet (2) (1) Owned In US & Canada Population MSAs Miami - Fort 3 Lauderdale 9.6% 16 1 Toronto % of NRSF 4 12.9% Asheville 8.0% >10% 2 Portfolio 5 8 5 2 5-10% Diversification 6 2 1 27 (2,3) by NRSF 2-5% 19 SFO - Oak Las Vegas 2.5% 3 7.0% 3 <2% Dayton 3.6% 1 11 Los Angeles Houston 5.5% 6.0% 22 Note: Portfolio as of 5/31/2021 and includes all operational properties owned by SmartStop. (1) Determined based on largest US MSAs and Toronto. Includes all SmartStop owned properties, including JV ownership. Greater Toronto Area included as a top 25 MSA, ranked 8th, with a population of 6.1 million. (2) Weighted by net rentable square feet across total owned portfolio as of 5/31/21. Per Company internal data. NAREIT Presentation 8 (3) MSA’s represented equate to 55.3% of total portfolio. Other markets include: Chicago, Denver, Detroit, Port St.. Lucie, Seattle, Myrtle Beach, Riverside – SB, Charlotte, San Diego amongst others.Owned Operating Portfolio 141 104K 63.3% 10.7 million Operating Properties Average 3 Mile Radius Concentration In Top Net Rentable Square Feet (2) (1) Owned In US & Canada Population MSAs Miami - Fort 3 Lauderdale 9.6% 16 1 Toronto % of NRSF 4 12.9% Asheville 8.0% >10% 2 Portfolio 5 8 5 2 5-10% Diversification 6 2 1 27 (2,3) by NRSF 2-5% 19 SFO - Oak Las Vegas 2.5% 3 7.0% 3 <2% Dayton 3.6% 1 11 Los Angeles Houston 5.5% 6.0% 22 Note: Portfolio as of 5/31/2021 and includes all operational properties owned by SmartStop. (1) Determined based on largest US MSAs and Toronto. Includes all SmartStop owned properties, including JV ownership. Greater Toronto Area included as a top 25 MSA, ranked 8th, with a population of 6.1 million. (2) Weighted by net rentable square feet across total owned portfolio as of 5/31/21. Per Company internal data. NAREIT Presentation 8 (3) MSA’s represented equate to 55.3% of total portfolio. Other markets include: Chicago, Denver, Detroit, Port St.. Lucie, Seattle, Myrtle Beach, Riverside – SB, Charlotte, San Diego amongst others.
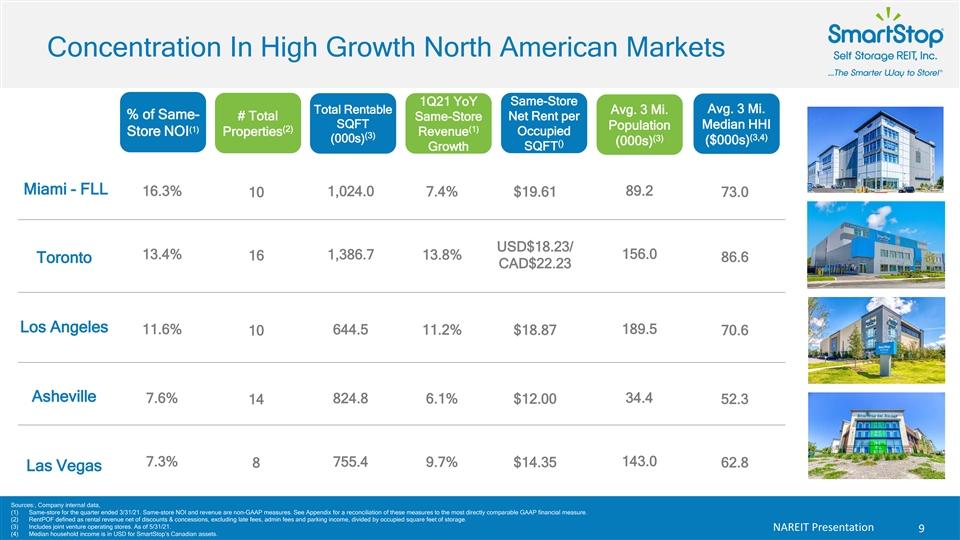
Concentration In High Growth North American Markets Same-Store 1Q21 YoY Avg. 3 Mi. Total Rentable Avg. 3 Mi. % of Same- # Total Net Rent per Same-Store SQFT Median HHI Population (1) (2) (1) Occupied Store NOI Properties Revenue (3) (3,4) (3) (000s) ($000s) (000s) () SQFT Growth Miami - FLL 16.3% 1,024.0 7.4% 89.2 10 $19.61 73.0 USD$18.23/ 13.4% 1,386.7 156.0 16 13.8% 86.6 Toronto CAD$22.23 Los Angeles 11.6% 644.5 189.5 10 11.2% $18.87 70.6 Asheville 7.6% 824.8 6.1% 34.4 14 $12.00 52.3 7.3% 143.0 755.4 9.7% $14.35 62.8 8 Las Vegas Sources:, Company internal data, (1) Same-store for the quarter ended 3/31/21. Same-store NOI and revenue are non-GAAP measures. See Appendix for a reconciliation of these measures to the most directly comparable GAAP financial measure. (2) RentPOF defined as rental revenue net of discounts & concessions, excluding late fees, admin fees and parking income, divided by occupied square feet of storage. (3) Includes joint venture operating stores. As of 5/31/21. NAREIT Presentation 9 (4) Median household income is in USD for SmartStop’s Canadian assets.Concentration In High Growth North American Markets Same-Store 1Q21 YoY Avg. 3 Mi. Total Rentable Avg. 3 Mi. % of Same- # Total Net Rent per Same-Store SQFT Median HHI Population (1) (2) (1) Occupied Store NOI Properties Revenue (3) (3,4) (3) (000s) ($000s) (000s) () SQFT Growth Miami - FLL 16.3% 1,024.0 7.4% 89.2 10 $19.61 73.0 USD$18.23/ 13.4% 1,386.7 156.0 16 13.8% 86.6 Toronto CAD$22.23 Los Angeles 11.6% 644.5 189.5 10 11.2% $18.87 70.6 Asheville 7.6% 824.8 6.1% 34.4 14 $12.00 52.3 7.3% 143.0 755.4 9.7% $14.35 62.8 8 Las Vegas Sources:, Company internal data, (1) Same-store for the quarter ended 3/31/21. Same-store NOI and revenue are non-GAAP measures. See Appendix for a reconciliation of these measures to the most directly comparable GAAP financial measure. (2) RentPOF defined as rental revenue net of discounts & concessions, excluding late fees, admin fees and parking income, divided by occupied square feet of storage. (3) Includes joint venture operating stores. As of 5/31/21. NAREIT Presentation 9 (4) Median household income is in USD for SmartStop’s Canadian assets.
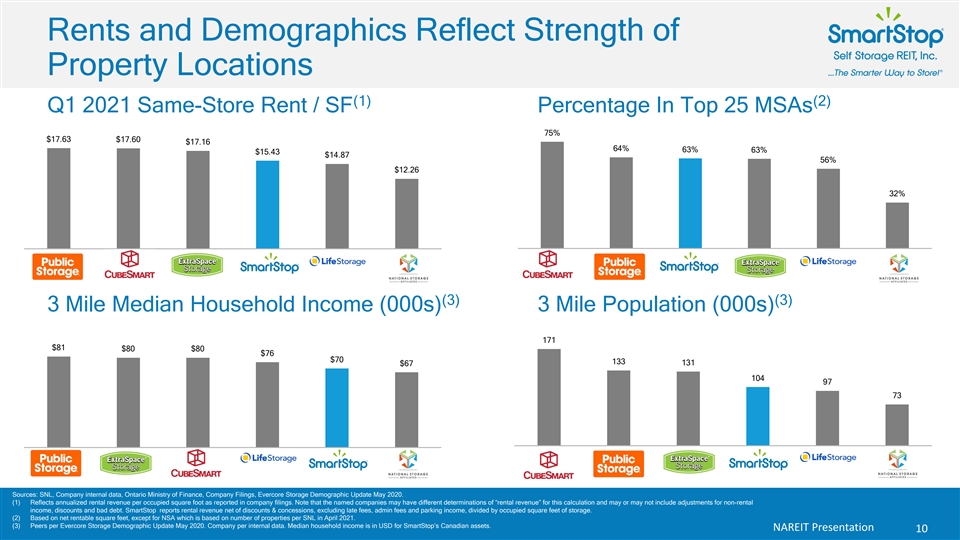
Rents and Demographics Reflect Strength of Property Locations (1) (2) Q1 2021 Same-Store Rent / SF Percentage In Top 25 MSAs 75% $17.63 $17.60 $17.16 64% 63% 63% $15.43 $14.87 56% $12.26 32% PSA CUBE EXR SMRT LSI NSA CUBE PSA SMRT EXR LSI NSA (3) (3) 3 Mile Median Household Income (000s) 3 Mile Population (000s) 171 $81 $80 $80 $76 $70 133 131 $67 104 97 73 CUBE PSA EXR SMRT LSI NSA PSA EXR CUBE LSI SMRT NSA Sources: SNL, Company internal data, Ontario Ministry of Finance, Company Filings, Evercore Storage Demographic Update May 2020. (1) Reflects annualized rental revenue per occupied square foot as reported in company filings. Note that the named companies may have different determinations of “rental revenue” for this calculation and may or may not include adjustments for non-rental income, discounts and bad debt. SmartStop reports rental revenue net of discounts & concessions, excluding late fees, admin fees and parking income, divided by occupied square feet of storage. (2) Based on net rentable square feet, except for NSA which is based on number of properties per SNL in April 2021. (3) Peers per Evercore Storage Demographic Update May 2020. Company per internal data. Median household income is in USD for SmartStop’s Canadian assets. NAREIT Presentation 10Rents and Demographics Reflect Strength of Property Locations (1) (2) Q1 2021 Same-Store Rent / SF Percentage In Top 25 MSAs 75% $17.63 $17.60 $17.16 64% 63% 63% $15.43 $14.87 56% $12.26 32% PSA CUBE EXR SMRT LSI NSA CUBE PSA SMRT EXR LSI NSA (3) (3) 3 Mile Median Household Income (000s) 3 Mile Population (000s) 171 $81 $80 $80 $76 $70 133 131 $67 104 97 73 CUBE PSA EXR SMRT LSI NSA PSA EXR CUBE LSI SMRT NSA Sources: SNL, Company internal data, Ontario Ministry of Finance, Company Filings, Evercore Storage Demographic Update May 2020. (1) Reflects annualized rental revenue per occupied square foot as reported in company filings. Note that the named companies may have different determinations of “rental revenue” for this calculation and may or may not include adjustments for non-rental income, discounts and bad debt. SmartStop reports rental revenue net of discounts & concessions, excluding late fees, admin fees and parking income, divided by occupied square feet of storage. (2) Based on net rentable square feet, except for NSA which is based on number of properties per SNL in April 2021. (3) Peers per Evercore Storage Demographic Update May 2020. Company per internal data. Median household income is in USD for SmartStop’s Canadian assets. NAREIT Presentation 10
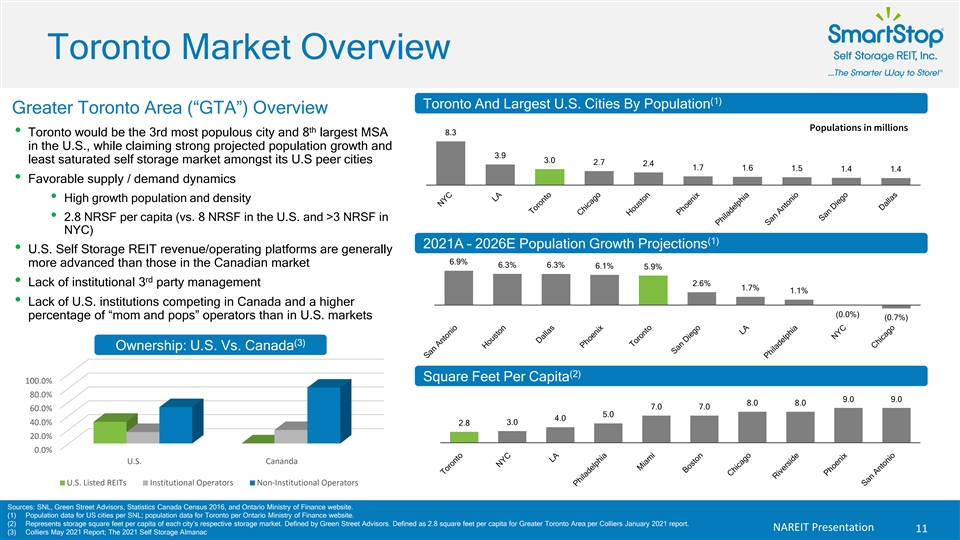
Toronto Market Overview (1) Toronto And Largest U.S. Cities By Population Greater Toronto Area (“GTA”) Overview (Populations in millions) th 8.3 • Toronto would be the 3rd most populous city and 8 largest MSA in the U.S., while claiming strong projected population growth and 3.9 least saturated self storage market amongst its U.S peer cities 3.0 2.7 2.4 1.7 1.6 1.5 1.4 1.4 • Favorable supply / demand dynamics • High growth population and density • 2.8 NRSF per capita (vs. 8 NRSF in the U.S. and >3 NRSF in NYC) (1) 2021A – 2026E Population Growth Projections • U.S. Self Storage REIT revenue/operating platforms are generally 6.9% more advanced than those in the Canadian market 6.3% 6.3% 6.1% 5.9% rd • Lack of institutional 3 party management 2.6% 1.7% 1.1% • Lack of U.S. institutions competing in Canada and a higher (0.0%) percentage of “mom and pops” operators than in U.S. markets (0.7%) (3) Ownership: U.S. Vs. Canada (2) Square Feet Per Capita 100.0% 80.0% 9.0 9.0 8.0 8.0 7.0 7.0 60.0% 5.0 4.0 40.0% 3.0 2.8 20.0% 0.0% U.S. Cananda U.S. Listed REITs Institutional Operators Non-Institutional Operators Sources: SNL, Green Street Advisors, Statistics Canada Census 2016, and Ontario Ministry of Finance website. (1) Population data for US cities per SNL; population data for Toronto per Ontario Ministry of Finance website. (2) Represents storage square feet per capita of each city’s respective storage market. Defined by Green Street Advisors. Defined as 2.8 square feet per capita for Greater Toronto Area per Colliers January 2021 report. NAREIT Presentation 11 (3) Colliers May 2021 Report; The 2021 Self Storage AlmanacToronto Market Overview (1) Toronto And Largest U.S. Cities By Population Greater Toronto Area (“GTA”) Overview (Populations in millions) th 8.3 • Toronto would be the 3rd most populous city and 8 largest MSA in the U.S., while claiming strong projected population growth and 3.9 least saturated self storage market amongst its U.S peer cities 3.0 2.7 2.4 1.7 1.6 1.5 1.4 1.4 • Favorable supply / demand dynamics • High growth population and density • 2.8 NRSF per capita (vs. 8 NRSF in the U.S. and >3 NRSF in NYC) (1) 2021A – 2026E Population Growth Projections • U.S. Self Storage REIT revenue/operating platforms are generally 6.9% more advanced than those in the Canadian market 6.3% 6.3% 6.1% 5.9% rd • Lack of institutional 3 party management 2.6% 1.7% 1.1% • Lack of U.S. institutions competing in Canada and a higher (0.0%) percentage of “mom and pops” operators than in U.S. markets (0.7%) (3) Ownership: U.S. Vs. Canada (2) Square Feet Per Capita 100.0% 80.0% 9.0 9.0 8.0 8.0 7.0 7.0 60.0% 5.0 4.0 40.0% 3.0 2.8 20.0% 0.0% U.S. Cananda U.S. Listed REITs Institutional Operators Non-Institutional Operators Sources: SNL, Green Street Advisors, Statistics Canada Census 2016, and Ontario Ministry of Finance website. (1) Population data for US cities per SNL; population data for Toronto per Ontario Ministry of Finance website. (2) Represents storage square feet per capita of each city’s respective storage market. Defined by Green Street Advisors. Defined as 2.8 square feet per capita for Greater Toronto Area per Colliers January 2021 report. NAREIT Presentation 11 (3) Colliers May 2021 Report; The 2021 Self Storage Almanac

SmartStop Leading the Way in the GTA SmartStop GTA Platform SmartStop GTA Portfolio • 10+ years of experience in the market • Toronto represents 12.9% of SmartStop’s (1) total owned portfolio • Significant brand presence • 21 self storage facilities • Dedicated website, smartstop.ca, helps to promote customer sentiment to buy and use • 16 owned operating assets (incl. 3 JV) services from other Canadians • 3 JV developments under construction • 40+ employees based in Canada • 2 managed assets (3) • 17.1% same store NOI growth in FY2020 • 1.4 million Sq. Ft. owned in operation (3) • 24.1% same store NOI growth in 1Q21 (2) • Approx. 8.5% market share of GTA and growing • 93.1% same store occupied with USD$18.23 • 1.7 million Sq. Ft. pipeline expected to be (4) or CAD$22.23 RentPOF in 1Q21 delivered by 2023 SmartStop Stores vs. LSI Stores in Toronto 17 9 4 2 SMRT LSI Operating Under Development North York, ONT Oakville, ONT (1) As measured by Net Rentable Square Feet at 5/31/21; Includes joint venture square footage. (2) Colliers January and May 2021 reports (3) Denominated in USD. Same-store NOI is a non-GAAP measures. See Appendix for a reconciliation of these measures to the most directly comparable GAAP financial measure. (4) RentPOF defined as rental revenue net of discounts & concessions, excluding late fees, admin fees and parking income, divided by occupied square feet of storage. NAREIT Presentation 12SmartStop Leading the Way in the GTA SmartStop GTA Platform SmartStop GTA Portfolio • 10+ years of experience in the market • Toronto represents 12.9% of SmartStop’s (1) total owned portfolio • Significant brand presence • 21 self storage facilities • Dedicated website, smartstop.ca, helps to promote customer sentiment to buy and use • 16 owned operating assets (incl. 3 JV) services from other Canadians • 3 JV developments under construction • 40+ employees based in Canada • 2 managed assets (3) • 17.1% same store NOI growth in FY2020 • 1.4 million Sq. Ft. owned in operation (3) • 24.1% same store NOI growth in 1Q21 (2) • Approx. 8.5% market share of GTA and growing • 93.1% same store occupied with USD$18.23 • 1.7 million Sq. Ft. pipeline expected to be (4) or CAD$22.23 RentPOF in 1Q21 delivered by 2023 SmartStop Stores vs. LSI Stores in Toronto 17 9 4 2 SMRT LSI Operating Under Development North York, ONT Oakville, ONT (1) As measured by Net Rentable Square Feet at 5/31/21; Includes joint venture square footage. (2) Colliers January and May 2021 reports (3) Denominated in USD. Same-store NOI is a non-GAAP measures. See Appendix for a reconciliation of these measures to the most directly comparable GAAP financial measure. (4) RentPOF defined as rental revenue net of discounts & concessions, excluding late fees, admin fees and parking income, divided by occupied square feet of storage. NAREIT Presentation 12

SmartCentres Joint Venture Joint Venture Summary Case Study: Vaughan • Ground up four story development opened in February 2021 • 50/50 joint venture with SmartCentres (TSX: SUR.UN), one of Canada’s largest fully-integrated REITs • Built on a 1.6 acre lot adjacent to the SmartCentres Vaughan shopping center, The Home Depot and the Walmart Supercenter • Provides exclusive right in certain markets to develop self storage facilities at numerous SmartCentres shopping centers • 103,000 rentable square feet and 1,050 climate controlled units • Sets foundation to significantly grow in strategically located Canadian • Quickly gained occupancy given strong Toronto storage fundamentals, markets including markets outside of Toronto strong asset quality and desirable location (1) • Current portfolio • 17.8% physically occupied as of April 30, 2021 • 4 operational facilities in JV with a total JV investment of USD $136 (2) million • Currently 3 projects under development • 8 projects in planning Dupont St, ONT Vaughan, ONT Toronto, ONT 50 Cityview Blvd, Vaughan, ONT (1) Joint Venture properties are held in various entities, including through SmartStop’s managed REITs (SST VI and SSGT II). (2) Represents estimated investment upon completion of properties, in USD $. One of the four operational joint ventures assets is owned by SSGT II. NAREIT Presentation 13SmartCentres Joint Venture Joint Venture Summary Case Study: Vaughan • Ground up four story development opened in February 2021 • 50/50 joint venture with SmartCentres (TSX: SUR.UN), one of Canada’s largest fully-integrated REITs • Built on a 1.6 acre lot adjacent to the SmartCentres Vaughan shopping center, The Home Depot and the Walmart Supercenter • Provides exclusive right in certain markets to develop self storage facilities at numerous SmartCentres shopping centers • 103,000 rentable square feet and 1,050 climate controlled units • Sets foundation to significantly grow in strategically located Canadian • Quickly gained occupancy given strong Toronto storage fundamentals, markets including markets outside of Toronto strong asset quality and desirable location (1) • Current portfolio • 17.8% physically occupied as of April 30, 2021 • 4 operational facilities in JV with a total JV investment of USD $136 (2) million • Currently 3 projects under development • 8 projects in planning Dupont St, ONT Vaughan, ONT Toronto, ONT 50 Cityview Blvd, Vaughan, ONT (1) Joint Venture properties are held in various entities, including through SmartStop’s managed REITs (SST VI and SSGT II). (2) Represents estimated investment upon completion of properties, in USD $. One of the four operational joint ventures assets is owned by SSGT II. NAREIT Presentation 13
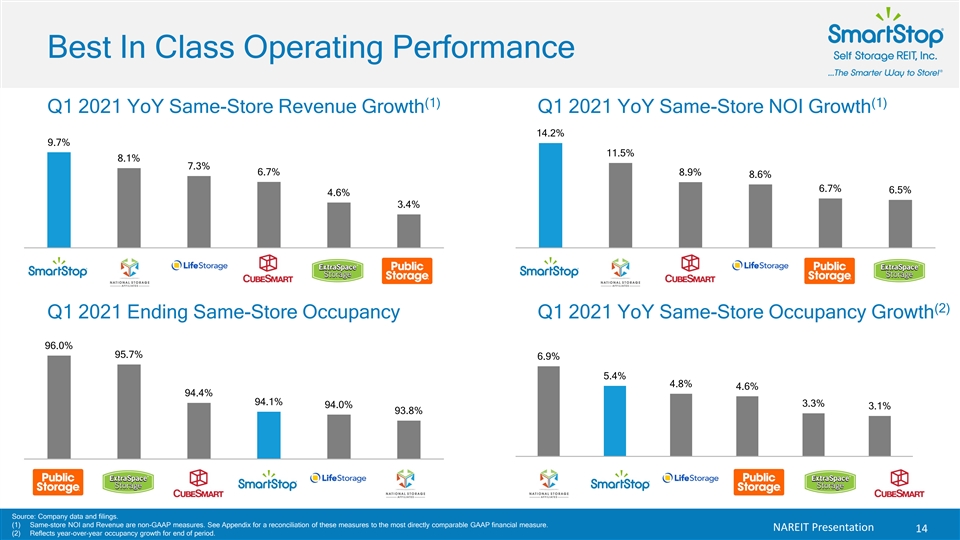
Best In Class Operating Performance (1) (1) Q1 2021 YoY Same-Store Revenue Growth Q1 2021 YoY Same-Store NOI Growth 14.2% 9.7% 11.5% 8.1% 7.3% 6.7% 8.9% 8.6% 6.7% 6.5% 4.6% 3.4% SMRT NSA LSI CUBE EXR PSA SMRT NSA CUBE LSI PSA EXR (2) Q1 2021 Ending Same-Store Occupancy Q1 2021 YoY Same-Store Occupancy Growth 96.0% 95.7% 6.9% 5.4% 4.8% 4.6% 94.4% 94.1% 3.3% 94.0% 3.1% 93.8% NSA SMRT EXR LSI PSA CUBE PSA EXR CUBE SMRT LSI NSA Source: Company data and filings. (1) Same-store NOI and Revenue are non-GAAP measures. See Appendix for a reconciliation of these measures to the most directly comparable GAAP financial measure. NAREIT Presentation 14 (2) Reflects year-over-year occupancy growth for end of period.Best In Class Operating Performance (1) (1) Q1 2021 YoY Same-Store Revenue Growth Q1 2021 YoY Same-Store NOI Growth 14.2% 9.7% 11.5% 8.1% 7.3% 6.7% 8.9% 8.6% 6.7% 6.5% 4.6% 3.4% SMRT NSA LSI CUBE EXR PSA SMRT NSA CUBE LSI PSA EXR (2) Q1 2021 Ending Same-Store Occupancy Q1 2021 YoY Same-Store Occupancy Growth 96.0% 95.7% 6.9% 5.4% 4.8% 4.6% 94.4% 94.1% 3.3% 94.0% 3.1% 93.8% NSA SMRT EXR LSI PSA CUBE PSA EXR CUBE SMRT LSI NSA Source: Company data and filings. (1) Same-store NOI and Revenue are non-GAAP measures. See Appendix for a reconciliation of these measures to the most directly comparable GAAP financial measure. NAREIT Presentation 14 (2) Reflects year-over-year occupancy growth for end of period.
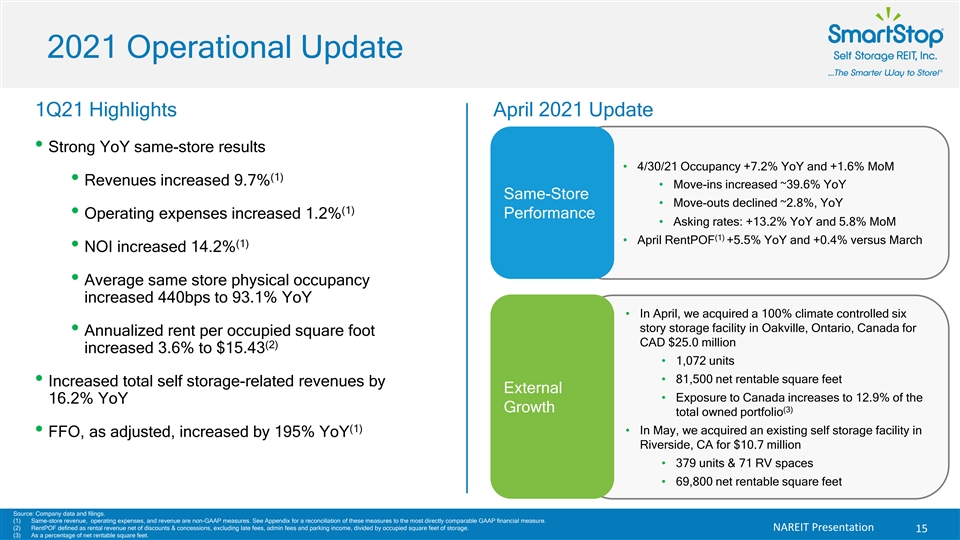
2021 Operational Update 1Q21 Highlights April 2021 Update • Strong YoY same-store results • 4/30/21 Occupancy +7.2% YoY and +1.6% MoM (1) • Revenues increased 9.7% • Move-ins increased ~39.6% YoY Same-Store • Move-outs declined ~2.8%, YoY (1) Performance • Operating expenses increased 1.2% • Asking rates: +13.2% YoY and 5.8% MoM (1) • April RentPOF +5.5% YoY and +0.4% versus March (1) • NOI increased 14.2% • Average same store physical occupancy increased 440bps to 93.1% YoY • In April, we acquired a 100% climate controlled six story storage facility in Oakville, Ontario, Canada for • Annualized rent per occupied square foot CAD $25.0 million (2) increased 3.6% to $15.43 • 1,072 units • 81,500 net rentable square feet • Increased total self storage-related revenues by External • Exposure to Canada increases to 12.9% of the 16.2% YoY Growth (3) total owned portfolio (1) • In May, we acquired an existing self storage facility in • FFO, as adjusted, increased by 195% YoY Riverside, CA for $10.7 million • 379 units & 71 RV spaces • 69,800 net rentable square feet Source: Company data and filings. (1) Same-store revenue, operating expenses, and revenue are non-GAAP measures. See Appendix for a reconciliation of these measures to the most directly comparable GAAP financial measure. (2) RentPOF defined as rental revenue net of discounts & concessions, excluding late fees, admin fees and parking income, divided by occupied square feet of storage. NAREIT Presentation 15 (3) As a percentage of net rentable square feet.2021 Operational Update 1Q21 Highlights April 2021 Update • Strong YoY same-store results • 4/30/21 Occupancy +7.2% YoY and +1.6% MoM (1) • Revenues increased 9.7% • Move-ins increased ~39.6% YoY Same-Store • Move-outs declined ~2.8%, YoY (1) Performance • Operating expenses increased 1.2% • Asking rates: +13.2% YoY and 5.8% MoM (1) • April RentPOF +5.5% YoY and +0.4% versus March (1) • NOI increased 14.2% • Average same store physical occupancy increased 440bps to 93.1% YoY • In April, we acquired a 100% climate controlled six story storage facility in Oakville, Ontario, Canada for • Annualized rent per occupied square foot CAD $25.0 million (2) increased 3.6% to $15.43 • 1,072 units • 81,500 net rentable square feet • Increased total self storage-related revenues by External • Exposure to Canada increases to 12.9% of the 16.2% YoY Growth (3) total owned portfolio (1) • In May, we acquired an existing self storage facility in • FFO, as adjusted, increased by 195% YoY Riverside, CA for $10.7 million • 379 units & 71 RV spaces • 69,800 net rentable square feet Source: Company data and filings. (1) Same-store revenue, operating expenses, and revenue are non-GAAP measures. See Appendix for a reconciliation of these measures to the most directly comparable GAAP financial measure. (2) RentPOF defined as rental revenue net of discounts & concessions, excluding late fees, admin fees and parking income, divided by occupied square feet of storage. NAREIT Presentation 15 (3) As a percentage of net rentable square feet.

External Growth: Strategic Storage Trust IV Merger (1) SST IV Combined SmartStop SST IV SmartStop Portfolio Impacts: (2) Self Storage Properties 114 30 144 Largest MSAs • On March 17, 2021 SmartStop closed the (2) Rentable SQFT (millions) 8.4 2.7 11.1 1) Miami - FLL Houston acquisition of Strategic Storage Trust IV, Inc. (2) States / Provinces 18 10 19 2) Toronto Toronto (“SST IV”) (3) Occupancy 93.5% 92.6% 93.3% 3) Los Angeles Charlotte • $375 million, 100% stock-for-stock deal • Added SST IV’s high quality assets to SmartStop • 24 wholly owned storage assets across 9 states • 6 JV assets in Toronto • New Market: New York City/Newark MSA • Market Scale / Clustering: Houston & Toronto • Expense efficiencies and additional size/scale (5) • Accretive to FFO, as adjusted per share • SST IV facilities were already managed by and branded as SmartStop: the transition was seamless from a customer experience perspective and required no rebranding costs (1) Amounts include joint venture assets. (2) As of 5/31/21 NAREIT Presentation 16 (3) Occupancy for wholly owned assets as of 3/31/21External Growth: Strategic Storage Trust IV Merger (1) SST IV Combined SmartStop SST IV SmartStop Portfolio Impacts: (2) Self Storage Properties 114 30 144 Largest MSAs • On March 17, 2021 SmartStop closed the (2) Rentable SQFT (millions) 8.4 2.7 11.1 1) Miami - FLL Houston acquisition of Strategic Storage Trust IV, Inc. (2) States / Provinces 18 10 19 2) Toronto Toronto (“SST IV”) (3) Occupancy 93.5% 92.6% 93.3% 3) Los Angeles Charlotte • $375 million, 100% stock-for-stock deal • Added SST IV’s high quality assets to SmartStop • 24 wholly owned storage assets across 9 states • 6 JV assets in Toronto • New Market: New York City/Newark MSA • Market Scale / Clustering: Houston & Toronto • Expense efficiencies and additional size/scale (5) • Accretive to FFO, as adjusted per share • SST IV facilities were already managed by and branded as SmartStop: the transition was seamless from a customer experience perspective and required no rebranding costs (1) Amounts include joint venture assets. (2) As of 5/31/21 NAREIT Presentation 16 (3) Occupancy for wholly owned assets as of 3/31/21
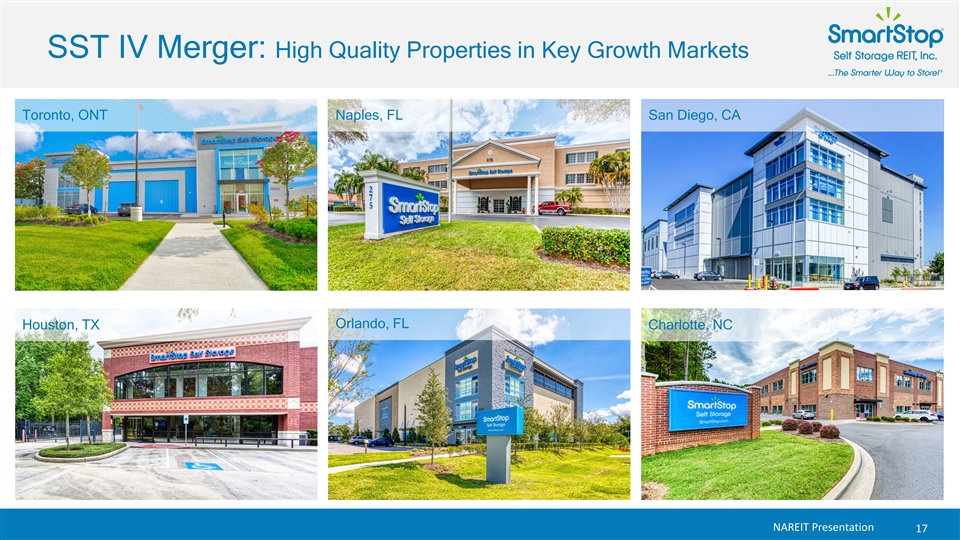
SST IV Merger: High Quality Properties in Key Growth Markets Toronto, ONT Naples, FL San Diego, CA Orlando, FL Houston, TX Charlotte, NC NAREIT Presentation 17SST IV Merger: High Quality Properties in Key Growth Markets Toronto, ONT Naples, FL San Diego, CA Orlando, FL Houston, TX Charlotte, NC NAREIT Presentation 17
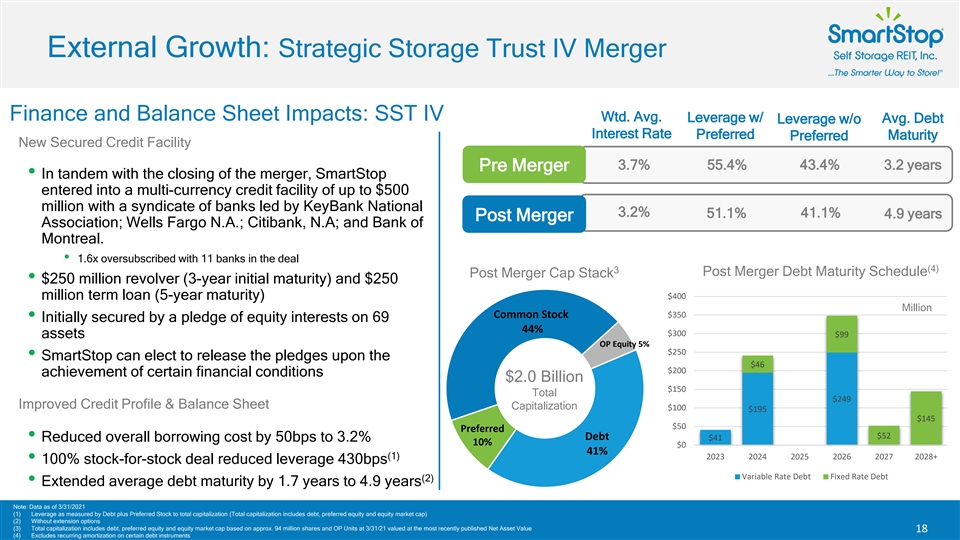
External Growth: Strategic Storage Trust IV Merger Finance and Balance Sheet Impacts: SST IV Wtd. Avg. Leverage w/ Avg. Debt Leverage w/o Interest Rate Preferred Preferred Maturity New Secured Credit Facility 3.7% 55.4% 43.4% 3.2 years Pre Merger • In tandem with the closing of the merger, SmartStop entered into a multi-currency credit facility of up to $500 million with a syndicate of banks led by KeyBank National 3.2% 51.1% 41.1% 4.9 years Post Merger Association; Wells Fargo N.A.; Citibank, N.A; and Bank of Montreal. • 1.6x oversubscribed with 11 banks in the deal (4) 3 Post Merger Debt Maturity Schedule Post Merger Cap Stack • $250 million revolver (3-year initial maturity) and $250 $400 million term loan (5-year maturity) Million Common Stock $350 • Initially secured by a pledge of equity interests on 69 44% $300 $99 assets OP Equity 5% $250 • SmartStop can elect to release the pledges upon the $46 $200 achievement of certain financial conditions $2.0 Billion $150 Total $249 Improved Credit Profile & Balance Sheet Capitalization $100 $195 $145 $50 Preferred $52 Debt $41 • Reduced overall borrowing cost by 50bps to 3.2% 10% $0 41% (1) 2023 2024 2025 2026 2027 2028+ • 100% stock-for-stock deal reduced leverage 430bps Variable Rate Debt Fixed Rate Debt (2) • Extended average debt maturity by 1.7 years to 4.9 years Note: Data as of 3/31/2021 (1) Leverage as measured by Debt plus Preferred Stock to total capitalization (Total capitalization includes debt, preferred equity and equity market cap) (2) Without extension options (3) Total capitalization includes debt, preferred equity and equity market cap based on approx. 94 million shares and OP Units at 3/31/21 valued at the most recently published Net Asset Value NAREIT Presentation 18 (4) Excludes recurring amortization on certain debt instrumentsExternal Growth: Strategic Storage Trust IV Merger Finance and Balance Sheet Impacts: SST IV Wtd. Avg. Leverage w/ Avg. Debt Leverage w/o Interest Rate Preferred Preferred Maturity New Secured Credit Facility 3.7% 55.4% 43.4% 3.2 years Pre Merger • In tandem with the closing of the merger, SmartStop entered into a multi-currency credit facility of up to $500 million with a syndicate of banks led by KeyBank National 3.2% 51.1% 41.1% 4.9 years Post Merger Association; Wells Fargo N.A.; Citibank, N.A; and Bank of Montreal. • 1.6x oversubscribed with 11 banks in the deal (4) 3 Post Merger Debt Maturity Schedule Post Merger Cap Stack • $250 million revolver (3-year initial maturity) and $250 $400 million term loan (5-year maturity) Million Common Stock $350 • Initially secured by a pledge of equity interests on 69 44% $300 $99 assets OP Equity 5% $250 • SmartStop can elect to release the pledges upon the $46 $200 achievement of certain financial conditions $2.0 Billion $150 Total $249 Improved Credit Profile & Balance Sheet Capitalization $100 $195 $145 $50 Preferred $52 Debt $41 • Reduced overall borrowing cost by 50bps to 3.2% 10% $0 41% (1) 2023 2024 2025 2026 2027 2028+ • 100% stock-for-stock deal reduced leverage 430bps Variable Rate Debt Fixed Rate Debt (2) • Extended average debt maturity by 1.7 years to 4.9 years Note: Data as of 3/31/2021 (1) Leverage as measured by Debt plus Preferred Stock to total capitalization (Total capitalization includes debt, preferred equity and equity market cap) (2) Without extension options (3) Total capitalization includes debt, preferred equity and equity market cap based on approx. 94 million shares and OP Units at 3/31/21 valued at the most recently published Net Asset Value NAREIT Presentation 18 (4) Excludes recurring amortization on certain debt instruments
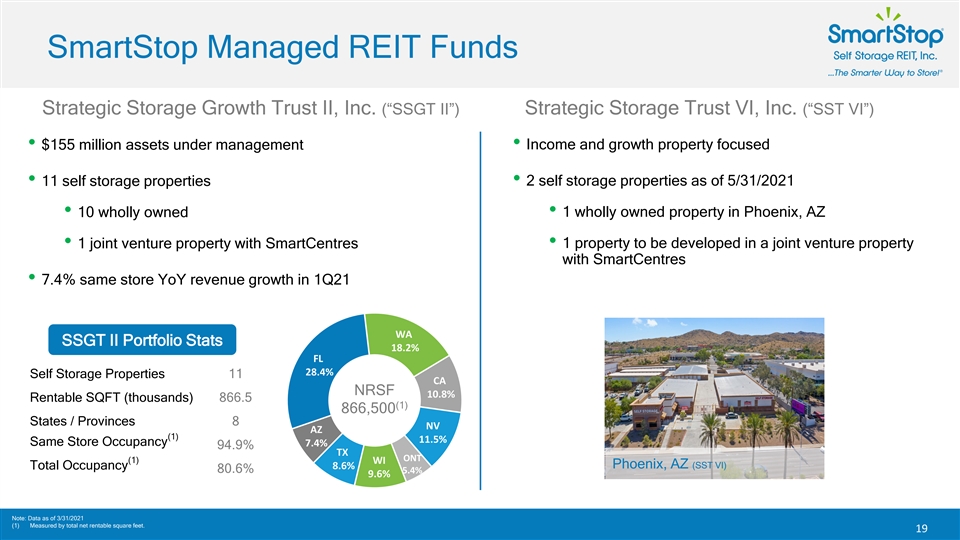
SmartStop Managed REIT Funds Strategic Storage Growth Trust II, Inc. (“SSGT II”) Strategic Storage Trust VI, Inc. (“SST VI”) • Income and growth property focused • $155 million assets under management • 11 self storage properties • 2 self storage properties as of 5/31/2021 • 10 wholly owned • 1 wholly owned property in Phoenix, AZ • 1 joint venture property with SmartCentres • 1 property to be developed in a joint venture property with SmartCentres • 7.4% same store YoY revenue growth in 1Q21 WA SSGT II Portfolio Stats 18.2% FL 28.4% Self Storage Properties 11 CA (5) NRSF 10.8% Rentable SQFT (thousands) 866.5 (1) 866,500 States / Provinces 8 NV AZ (1) 11.5% Same Store Occupancy 7.4% 94.9% TX ONT (1) WI 8.6% Phoenix, AZ (SST VI) Total Occupancy 80.6% 5.4% 9.6% Note: Data as of 3/31/2021 (1) Measured by total net rentable square feet. NAREIT Presentation 19SmartStop Managed REIT Funds Strategic Storage Growth Trust II, Inc. (“SSGT II”) Strategic Storage Trust VI, Inc. (“SST VI”) • Income and growth property focused • $155 million assets under management • 11 self storage properties • 2 self storage properties as of 5/31/2021 • 10 wholly owned • 1 wholly owned property in Phoenix, AZ • 1 joint venture property with SmartCentres • 1 property to be developed in a joint venture property with SmartCentres • 7.4% same store YoY revenue growth in 1Q21 WA SSGT II Portfolio Stats 18.2% FL 28.4% Self Storage Properties 11 CA (5) NRSF 10.8% Rentable SQFT (thousands) 866.5 (1) 866,500 States / Provinces 8 NV AZ (1) 11.5% Same Store Occupancy 7.4% 94.9% TX ONT (1) WI 8.6% Phoenix, AZ (SST VI) Total Occupancy 80.6% 5.4% 9.6% Note: Data as of 3/31/2021 (1) Measured by total net rentable square feet. NAREIT Presentation 19
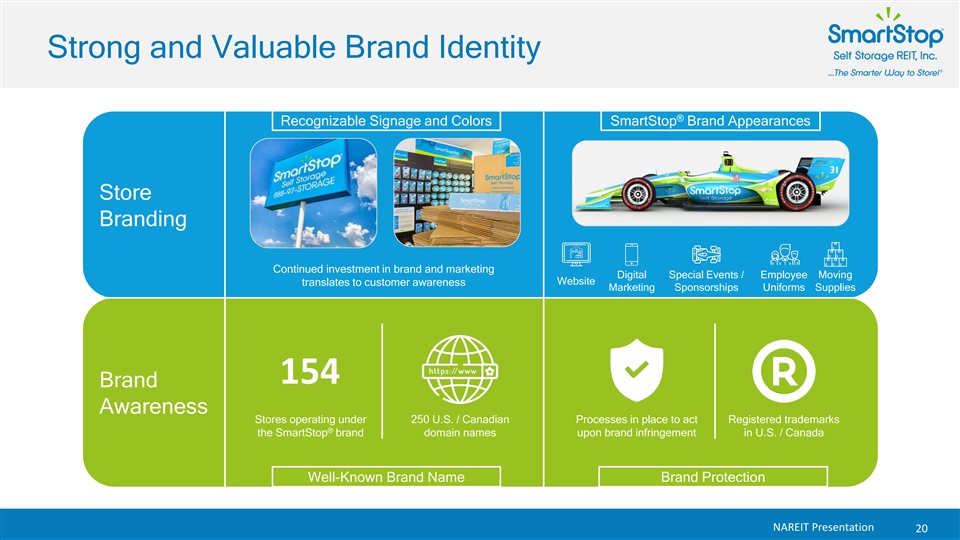
Strong and Valuable Brand Identity ® Recognizable Signage and Colors SmartStop Brand Appearances Store Branding Continued investment in brand and marketing Digital Special Events / Employee Moving Website translates to customer awareness Marketing Sponsorships Uniforms Supplies 154 Brand Awareness Stores operating under 250 U.S. / Canadian Processes in place to act Registered trademarks ® the SmartStop brand domain names upon brand infringement in U.S. / Canada Well-Known Brand Name Brand Protection NAREIT Presentation 20Strong and Valuable Brand Identity ® Recognizable Signage and Colors SmartStop Brand Appearances Store Branding Continued investment in brand and marketing Digital Special Events / Employee Moving Website translates to customer awareness Marketing Sponsorships Uniforms Supplies 154 Brand Awareness Stores operating under 250 U.S. / Canadian Processes in place to act Registered trademarks ® the SmartStop brand domain names upon brand infringement in U.S. / Canada Well-Known Brand Name Brand Protection NAREIT Presentation 20

Industry Leader In Customer Experience Technology-driven platform gives SmartStop the ability to meet customers’ unique service needs Winner - Best Customer Service 2021 Award for Storage Companies Dedicated In- Online Online Rentals Walk-Ins House Call Center Reservations • Dedicated call center • Ability to search for and • Highly-trained SmartStop • Convenient online access employees streamline the reserve units at one of employees on facility allowing customers to customer experience SmartStop’s 140+ locations premises to accommodate seamlessly browse walk-ins available units and rent • Agents able to use web- • Integrated into revenue units on the web based or SMS text features management system to • Staff trained to utilize to complete leasing update pricing and SmartStop’s management • SmartStop’s state-of-the- process to meet customer occupancy real time technology and tools to art website is optimized to needs provide high-quality in- reduce barriers in the person sales experience shopping experience and fast loading times NAREIT Presentation 21Industry Leader In Customer Experience Technology-driven platform gives SmartStop the ability to meet customers’ unique service needs Winner - Best Customer Service 2021 Award for Storage Companies Dedicated In- Online Online Rentals Walk-Ins House Call Center Reservations • Dedicated call center • Ability to search for and • Highly-trained SmartStop • Convenient online access employees streamline the reserve units at one of employees on facility allowing customers to customer experience SmartStop’s 140+ locations premises to accommodate seamlessly browse walk-ins available units and rent • Agents able to use web- • Integrated into revenue units on the web based or SMS text features management system to • Staff trained to utilize to complete leasing update pricing and SmartStop’s management • SmartStop’s state-of-the- process to meet customer occupancy real time technology and tools to art website is optimized to needs provide high-quality in- reduce barriers in the person sales experience shopping experience and fast loading times NAREIT Presentation 21
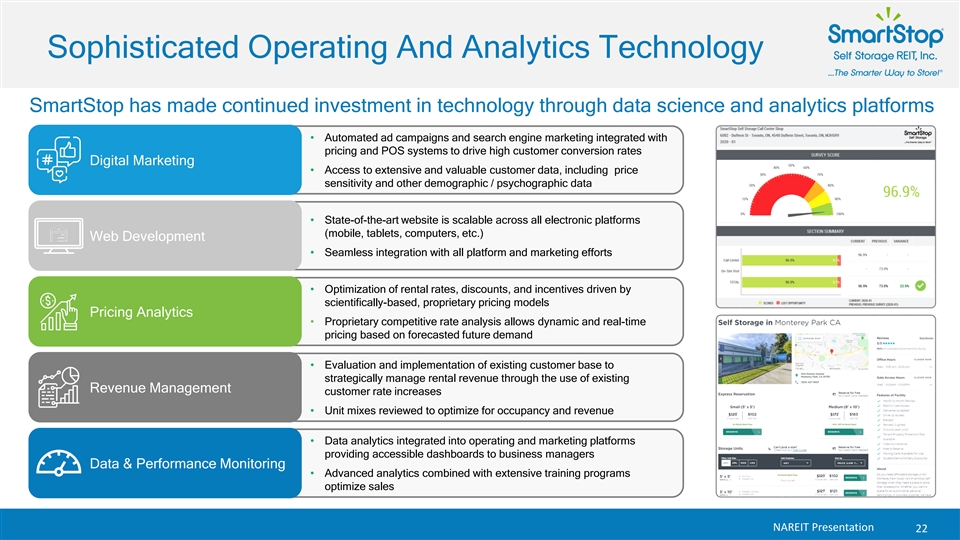
Sophisticated Operating And Analytics Technology SmartStop has made continued investment in technology through data science and analytics platforms • Automated ad campaigns and search engine marketing integrated with pricing and POS systems to drive high customer conversion rates Digital Marketing • Access to extensive and valuable customer data, including price sensitivity and other demographic / psychographic data • State-of-the-art website is scalable across all electronic platforms (mobile, tablets, computers, etc.) Web Development • Seamless integration with all platform and marketing efforts • Optimization of rental rates, discounts, and incentives driven by scientifically-based, proprietary pricing models Pricing Analytics • Proprietary competitive rate analysis allows dynamic and real-time pricing based on forecasted future demand • Evaluation and implementation of existing customer base to strategically manage rental revenue through the use of existing Revenue Management customer rate increases • Unit mixes reviewed to optimize for occupancy and revenue • Data analytics integrated into operating and marketing platforms providing accessible dashboards to business managers Data & Performance Monitoring • Advanced analytics combined with extensive training programs optimize sales NAREIT Presentation 22Sophisticated Operating And Analytics Technology SmartStop has made continued investment in technology through data science and analytics platforms • Automated ad campaigns and search engine marketing integrated with pricing and POS systems to drive high customer conversion rates Digital Marketing • Access to extensive and valuable customer data, including price sensitivity and other demographic / psychographic data • State-of-the-art website is scalable across all electronic platforms (mobile, tablets, computers, etc.) Web Development • Seamless integration with all platform and marketing efforts • Optimization of rental rates, discounts, and incentives driven by scientifically-based, proprietary pricing models Pricing Analytics • Proprietary competitive rate analysis allows dynamic and real-time pricing based on forecasted future demand • Evaluation and implementation of existing customer base to strategically manage rental revenue through the use of existing Revenue Management customer rate increases • Unit mixes reviewed to optimize for occupancy and revenue • Data analytics integrated into operating and marketing platforms providing accessible dashboards to business managers Data & Performance Monitoring • Advanced analytics combined with extensive training programs optimize sales NAREIT Presentation 22
Appendix NAREIT Presentation 23Appendix NAREIT Presentation 23
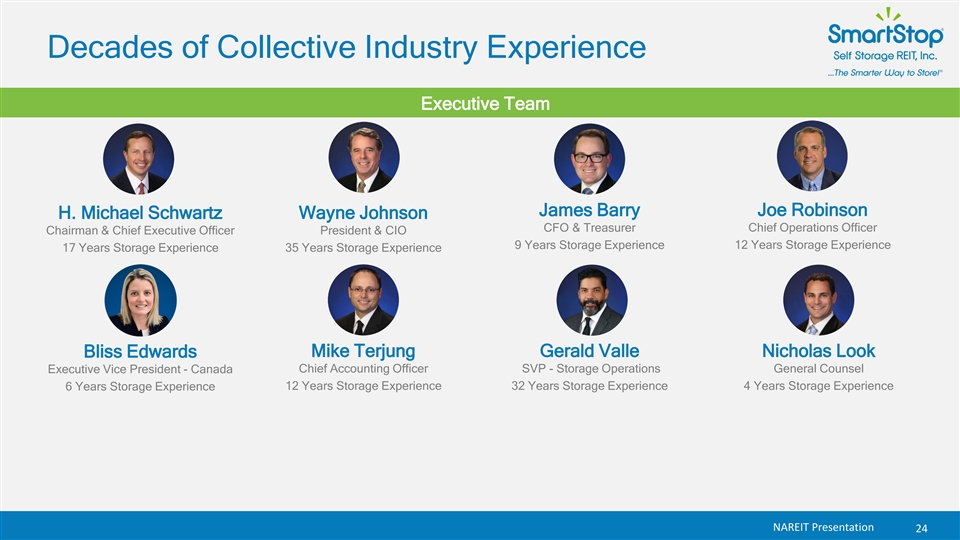
Decades of Collective Industry Experience BE oar xec du of tiv D ei T rec eam tors James Barry Joe Robinson H. Michael Schwartz Wayne Johnson CFO & Treasurer Chief Operations Officer Chairman & Chief Executive Officer President & CIO 9 Years Storage Experience 12 Years Storage Experience 17 Years Storage Experience 35 Years Storage Experience Mike Terjung Gerald Valle Nicholas Look Bliss Edwards Executive Vice President - Canada Chief Accounting Officer SVP - Storage Operations General Counsel 12 Years Storage Experience 32 Years Storage Experience 4 Years Storage Experience 6 Years Storage Experience NAREIT Presentation 24Decades of Collective Industry Experience BE oar xec du of tiv D ei T rec eam tors James Barry Joe Robinson H. Michael Schwartz Wayne Johnson CFO & Treasurer Chief Operations Officer Chairman & Chief Executive Officer President & CIO 9 Years Storage Experience 12 Years Storage Experience 17 Years Storage Experience 35 Years Storage Experience Mike Terjung Gerald Valle Nicholas Look Bliss Edwards Executive Vice President - Canada Chief Accounting Officer SVP - Storage Operations General Counsel 12 Years Storage Experience 32 Years Storage Experience 4 Years Storage Experience 6 Years Storage Experience NAREIT Presentation 24
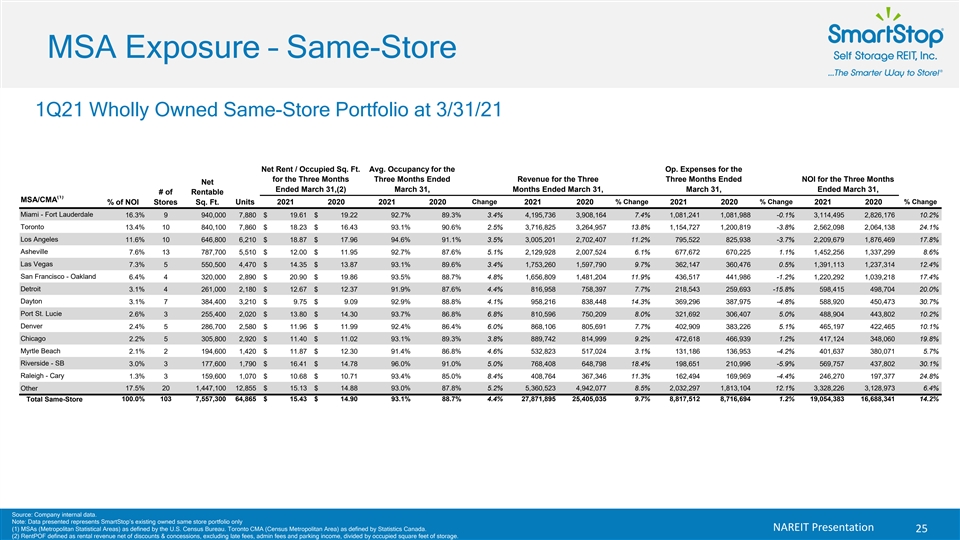
MSA Exposure – Same-Store 1Q21 Wholly Owned Same-Store Portfolio at 3/31/21 Net Rent / Occupied Sq. Ft. Avg. Occupancy for the Op. Expenses for the for the Three Months Three Months Ended Revenue for the Three Three Months Ended NOI for the Three Months Net Ended March 31,(2) March 31, Months Ended March 31, March 31, Ended March 31, # of Rentable (1) MSA/CMA Change % Change % Change % Change % of NOI Stores Sq. Ft. Units 2021 2020 2021 2020 2021 2020 2021 2020 2021 2020 Miami - Fort Lauderdale 16.3% 9 940,000 7, 880 $ 19.61 $ 19.22 92.7% 89.3% 3.4% 4,195,736 3,908,164 7.4% 1,081,241 1,081,988 -0.1% 3,114,495 2,826,176 10.2% Toronto 13.4% 10 840,100 7, 860 $ 18.23 $ 16.43 93.1% 90.6% 2.5% 3,716,825 3,264,957 13.8% 1,154,727 1,200,819 -3.8% 2,562,098 2,064,138 24.1% Los Angeles 11.6% 10 646,800 6, 210 $ 18.87 $ 17.96 94.6% 91.1% 3.5% 3,005,201 2,702,407 11.2% 795,522 825,938 -3.7% 2,209,679 1,876,469 17.8% Asheville 7.6% 13 787,700 5, 510 $ 12.00 $ 11.95 92.7% 87.6% 5.1% 2,129,928 2,007,524 6.1% 677,672 670,225 1.1% 1,452,256 1,337,299 8.6% Las Vegas 7.3% 5 550,500 4, 470 $ 14.35 $ 13.87 93.1% 89.6% 3.4% 1,753,260 1,597,790 9.7% 362,147 360,476 0.5% 1,391,113 1,237,314 12.4% San Francisco - Oakland 6.4% 4 320,000 2, 890 $ 20.90 $ 19.86 93.5% 88.7% 4.8% 1,656,809 1,481,204 11.9% 436,517 441,986 -1.2% 1,220,292 1,039,218 17.4% Detroit 3.1% 4 261,000 2, 180 $ 12.67 $ 12.37 91.9% 87.6% 4.4% 816,958 758,397 7.7% 218,543 259,693 -15.8% 598,415 498,704 20.0% Dayton 3.1% 7 384,400 3, 210 $ 9.75 $ 9.09 92.9% 88.8% 4.1% 958,216 838,448 14.3% 369,296 387,975 -4.8% 588,920 450,473 30.7% Port St. Lucie 2.6% 3 255,400 2, 020 $ 13.80 $ 14.30 93.7% 86.8% 6.8% 810,596 750,209 8.0% 321,692 306,407 5.0% 488,904 443,802 10.2% Source: Compa Denver 2.4% 5 286,700 2, 580 $ 11.96 $ 11.99 92.4% 86.4% 6.0% 868,106 805,691 7.7% 402,909 383,226 5.1% 465,197 422,465 Not10. e: 1% Data pres MSAs (Metropo Chicago 2.2% 5 305,800 2, 920 $ 11.40 $ 11.02 93.1% 89.3% 3.8% 889,742 814,999 9.2% 472,618 466,939 1.2% 417,124 348,060 19.8% Myrtle Beach 2.1% 2 194,600 1, 420 $ 11.87 $ 12.30 91.4% 86.8% 4.6% 532,823 517,024 3.1% 131,186 136,953 -4.2% 401,637 380,071 5.7% Riverside - SB 3.0% 3 177,600 1, 790 $ 16.41 $ 14.78 96.0% 91.0% 5.0% 768,408 648,798 18.4% 198,651 210,996 -5.9% 569,757 437,802 30.1% Raleigh - Cary 1.3% 3 159,600 1, 070 $ 10.68 $ 10.71 93.4% 85.0% 8.4% 408,764 367,346 11.3% 162,494 169,969 -4.4% 246,270 197,377 24.8% Other 17.5% 20 1,447,100 12, 855 $ 15.13 $ 14.88 93.0% 87.8% 5.2% 5,360,523 4,942,077 8.5% 2,032,297 1,813,104 12.1% 3,328,226 3,128,973 6.4% 100.0% 103 7,557,300 64, 865 $ 15.43 $ 14.90 93.1% 88.7% 4.4% 27,871,895 25,405,035 9.7% 8,817,512 8,716,694 1.2% 19,054,383 16,688,341 14.2% Total Same-Store Source: Company internal data. Note: Data presented represents SmartStop’s existing owned same store portfolio only (1) MSAs (Metropolitan Statistical Areas) as defined by the U.S. Census Bureau. Toronto CMA (Census Metropolitan Area) as defined by Statistics Canada. NAREIT Presentation 25 (2) RentPOF defined as rental revenue net of discounts & concessions, excluding late fees, admin fees and parking income, divided by occupied square feet of storage.MSA Exposure – Same-Store 1Q21 Wholly Owned Same-Store Portfolio at 3/31/21 Net Rent / Occupied Sq. Ft. Avg. Occupancy for the Op. Expenses for the for the Three Months Three Months Ended Revenue for the Three Three Months Ended NOI for the Three Months Net Ended March 31,(2) March 31, Months Ended March 31, March 31, Ended March 31, # of Rentable (1) MSA/CMA Change % Change % Change % Change % of NOI Stores Sq. Ft. Units 2021 2020 2021 2020 2021 2020 2021 2020 2021 2020 Miami - Fort Lauderdale 16.3% 9 940,000 7, 880 $ 19.61 $ 19.22 92.7% 89.3% 3.4% 4,195,736 3,908,164 7.4% 1,081,241 1,081,988 -0.1% 3,114,495 2,826,176 10.2% Toronto 13.4% 10 840,100 7, 860 $ 18.23 $ 16.43 93.1% 90.6% 2.5% 3,716,825 3,264,957 13.8% 1,154,727 1,200,819 -3.8% 2,562,098 2,064,138 24.1% Los Angeles 11.6% 10 646,800 6, 210 $ 18.87 $ 17.96 94.6% 91.1% 3.5% 3,005,201 2,702,407 11.2% 795,522 825,938 -3.7% 2,209,679 1,876,469 17.8% Asheville 7.6% 13 787,700 5, 510 $ 12.00 $ 11.95 92.7% 87.6% 5.1% 2,129,928 2,007,524 6.1% 677,672 670,225 1.1% 1,452,256 1,337,299 8.6% Las Vegas 7.3% 5 550,500 4, 470 $ 14.35 $ 13.87 93.1% 89.6% 3.4% 1,753,260 1,597,790 9.7% 362,147 360,476 0.5% 1,391,113 1,237,314 12.4% San Francisco - Oakland 6.4% 4 320,000 2, 890 $ 20.90 $ 19.86 93.5% 88.7% 4.8% 1,656,809 1,481,204 11.9% 436,517 441,986 -1.2% 1,220,292 1,039,218 17.4% Detroit 3.1% 4 261,000 2, 180 $ 12.67 $ 12.37 91.9% 87.6% 4.4% 816,958 758,397 7.7% 218,543 259,693 -15.8% 598,415 498,704 20.0% Dayton 3.1% 7 384,400 3, 210 $ 9.75 $ 9.09 92.9% 88.8% 4.1% 958,216 838,448 14.3% 369,296 387,975 -4.8% 588,920 450,473 30.7% Port St. Lucie 2.6% 3 255,400 2, 020 $ 13.80 $ 14.30 93.7% 86.8% 6.8% 810,596 750,209 8.0% 321,692 306,407 5.0% 488,904 443,802 10.2% Source: Compa Denver 2.4% 5 286,700 2, 580 $ 11.96 $ 11.99 92.4% 86.4% 6.0% 868,106 805,691 7.7% 402,909 383,226 5.1% 465,197 422,465 Not10. e: 1% Data pres MSAs (Metropo Chicago 2.2% 5 305,800 2, 920 $ 11.40 $ 11.02 93.1% 89.3% 3.8% 889,742 814,999 9.2% 472,618 466,939 1.2% 417,124 348,060 19.8% Myrtle Beach 2.1% 2 194,600 1, 420 $ 11.87 $ 12.30 91.4% 86.8% 4.6% 532,823 517,024 3.1% 131,186 136,953 -4.2% 401,637 380,071 5.7% Riverside - SB 3.0% 3 177,600 1, 790 $ 16.41 $ 14.78 96.0% 91.0% 5.0% 768,408 648,798 18.4% 198,651 210,996 -5.9% 569,757 437,802 30.1% Raleigh - Cary 1.3% 3 159,600 1, 070 $ 10.68 $ 10.71 93.4% 85.0% 8.4% 408,764 367,346 11.3% 162,494 169,969 -4.4% 246,270 197,377 24.8% Other 17.5% 20 1,447,100 12, 855 $ 15.13 $ 14.88 93.0% 87.8% 5.2% 5,360,523 4,942,077 8.5% 2,032,297 1,813,104 12.1% 3,328,226 3,128,973 6.4% 100.0% 103 7,557,300 64, 865 $ 15.43 $ 14.90 93.1% 88.7% 4.4% 27,871,895 25,405,035 9.7% 8,817,512 8,716,694 1.2% 19,054,383 16,688,341 14.2% Total Same-Store Source: Company internal data. Note: Data presented represents SmartStop’s existing owned same store portfolio only (1) MSAs (Metropolitan Statistical Areas) as defined by the U.S. Census Bureau. Toronto CMA (Census Metropolitan Area) as defined by Statistics Canada. NAREIT Presentation 25 (2) RentPOF defined as rental revenue net of discounts & concessions, excluding late fees, admin fees and parking income, divided by occupied square feet of storage.
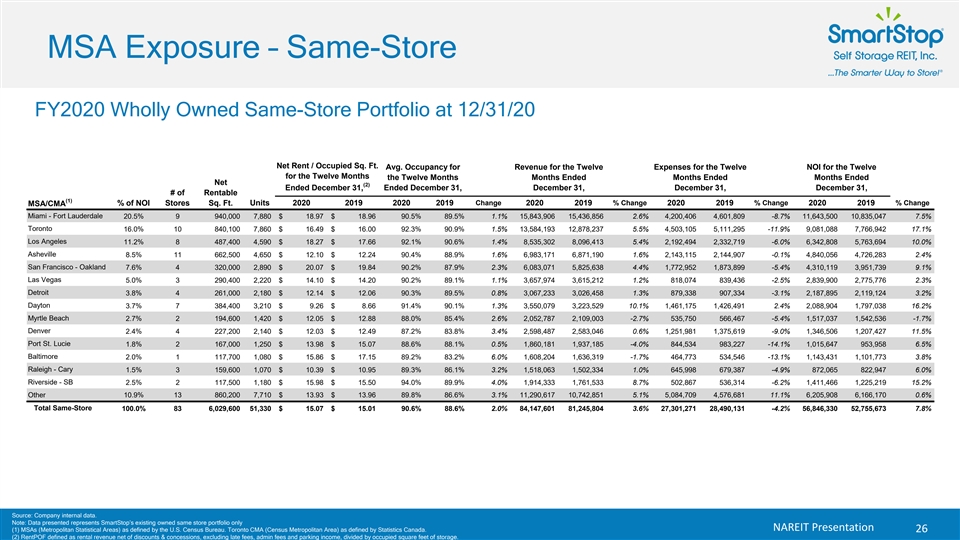
MSA Exposure – Same-Store FY2020 Wholly Owned Same-Store Portfolio at 12/31/20 Net Rent / Occupied Sq. Ft. Avg. Occupancy for Revenue for the Twelve Expenses for the Twelve NOI for the Twelve for the Twelve Months the Twelve Months Months Ended Months Ended Months Ended Net (2) Ended December 31, Ended December 31, December 31, December 31, December 31, # of Rentable (1) Change % Change % Change % Change MSA/CMA % of NOI Stores Sq. Ft. Units 2020 2019 2020 2019 2020 2019 2020 2019 2020 2019 Miami - Fort Lauderdale 20.5% 9 940, 000 7, 880 $ 18.97 $ 18.96 90.5% 89.5% 1.1% 15, 843,906 15, 436,856 2.6% 4, 200,406 4, 601,809 -8.7% 11, 643,500 10, 835,047 7.5% Toronto 16.0% 10 840, 100 7, 860 $ 16.49 $ 16.00 92.3% 90.9% 1.5% 13, 584,193 12, 878,237 5.5% 4, 503,105 5, 111,295 -11.9% 9, 081,088 7, 766,942 17.1% Los Angeles 11.2% 8 487, 400 4, 590 $ 18.27 $ 17.66 92.1% 90.6% 1.4% 8, 535,302 8, 096,413 5.4% 2, 192,494 2, 332,719 -6.0% 6, 342,808 5, 763,694 10.0% Asheville 8.5% 11 662, 500 4, 650 $ 12.10 $ 12.24 90.4% 88.9% 1.6% 6, 983,171 6, 871,190 1.6% 2, 143,115 2, 144,907 -0.1% 4, 840,056 4, 726,283 2.4% San Francisco - Oakland 7.6% 4 320, 000 2, 890 $ 20.07 $ 19.84 90.2% 87.9% 2.3% 6, 083,071 5, 825,638 4.4% 1, 772,952 1, 873,899 -5.4% 4, 310,119 3, 951,739 9.1% Las Vegas 5.0% 3 290, 400 2, 220 $ 14.10 $ 14.20 90.2% 89.1% 1.1% 3, 657,974 3, 615,212 1.2% 818, 074 839, 436 -2.5% 2, 839,900 2, 775,776 2.3% Detroit 3.8% 4 261, 000 2, 180 $ 12.14 $ 12.06 90.3% 89.5% 0.8% 3, 067,233 3, 026,458 1.3% 879, 338 907, 334 -3.1% 2, 187,895 2, 119,124 3.2% Dayton 3.7% 7 384, 400 3, 210 $ 9.26 $ 8.66 91.4% 90.1% 1.3% 3, 550,079 3, 223,529 10.1% 1, 461,175 1, 426,491 2.4% 2, 088,904 1, 797,038 16.2% Source: Compa Myrtle Beach 2.7% 2 194, 600 1, 420 $ 12.05 $ 12.88 88.0% 85.4% 2.6% 2, 052,787 2, 109,003 -2.7% 535, 750 566, 467 -5.4% 1, 517,037 1, 542,536 -1.7% Note: Data pres Denver 2.4% 4 227, 200 2, 140 $ 12.03 $ 12.49 87.2% 83.8% 3.4% 2, 598,487 2, 583,046 0.6% 1, 251,981 1, 375,619 -9.0% 1, 346,506 1, 207,427 11.5% MSAs (Metropo Port St. Lucie 1.8% 2 167, 000 1, 250 $ 13.98 $ 15.07 88.6% 88.1% 0.5% 1, 860,181 1, 937,185 -4.0% 844, 534 983, 227 -14.1% 1, 015,647 953, 958 6.5% Baltimore 2.0% 1 117, 700 1, 080 $ 15.86 $ 17.15 89.2% 83.2% 6.0% 1, 608,204 1, 636,319 -1.7% 464, 773 534, 546 -13.1% 1, 143,431 1, 101,773 3.8% Raleigh - Cary 1.5% 3 159, 600 1, 070 $ 10.39 $ 10.95 89.3% 86.1% 3.2% 1, 518,063 1, 502,334 1.0% 645, 998 679, 387 -4.9% 872, 065 822, 947 6.0% Riverside - SB 2.5% 2 117, 500 1, 180 $ 15.98 $ 15.50 94.0% 89.9% 4.0% 1, 914,333 1, 761,533 8.7% 502, 867 536, 314 -6.2% 1, 411,466 1, 225,219 15.2% 10.9% 13 860, 200 7, 710 $ 13.93 $ 13.96 89.8% 86.6% 3.1% 11, 290,617 10, 742,851 5.1% 5, 084,709 4, 576,681 11.1% 6, 205,908 6, 166,170 0.6% Other Total Same-Store 100.0% 83 6, 029,600 51, 330 $ 15.07 $ 15.01 90.6% 88.6% 2.0% 84, 147,601 81, 245,804 3.6% 27, 301,271 28, 490,131 -4.2% 56, 846,330 52, 755,673 7.8% Source: Company internal data. Note: Data presented represents SmartStop’s existing owned same store portfolio only NAREIT Presentation (1) MSAs (Metropolitan Statistical Areas) as defined by the U.S. Census Bureau. Toronto CMA (Census Metropolitan Area) as defined by Statistics Canada. 26 (2) RentPOF defined as rental revenue net of discounts & concessions, excluding late fees, admin fees and parking income, divided by occupied square feet of storage.MSA Exposure – Same-Store FY2020 Wholly Owned Same-Store Portfolio at 12/31/20 Net Rent / Occupied Sq. Ft. Avg. Occupancy for Revenue for the Twelve Expenses for the Twelve NOI for the Twelve for the Twelve Months the Twelve Months Months Ended Months Ended Months Ended Net (2) Ended December 31, Ended December 31, December 31, December 31, December 31, # of Rentable (1) Change % Change % Change % Change MSA/CMA % of NOI Stores Sq. Ft. Units 2020 2019 2020 2019 2020 2019 2020 2019 2020 2019 Miami - Fort Lauderdale 20.5% 9 940, 000 7, 880 $ 18.97 $ 18.96 90.5% 89.5% 1.1% 15, 843,906 15, 436,856 2.6% 4, 200,406 4, 601,809 -8.7% 11, 643,500 10, 835,047 7.5% Toronto 16.0% 10 840, 100 7, 860 $ 16.49 $ 16.00 92.3% 90.9% 1.5% 13, 584,193 12, 878,237 5.5% 4, 503,105 5, 111,295 -11.9% 9, 081,088 7, 766,942 17.1% Los Angeles 11.2% 8 487, 400 4, 590 $ 18.27 $ 17.66 92.1% 90.6% 1.4% 8, 535,302 8, 096,413 5.4% 2, 192,494 2, 332,719 -6.0% 6, 342,808 5, 763,694 10.0% Asheville 8.5% 11 662, 500 4, 650 $ 12.10 $ 12.24 90.4% 88.9% 1.6% 6, 983,171 6, 871,190 1.6% 2, 143,115 2, 144,907 -0.1% 4, 840,056 4, 726,283 2.4% San Francisco - Oakland 7.6% 4 320, 000 2, 890 $ 20.07 $ 19.84 90.2% 87.9% 2.3% 6, 083,071 5, 825,638 4.4% 1, 772,952 1, 873,899 -5.4% 4, 310,119 3, 951,739 9.1% Las Vegas 5.0% 3 290, 400 2, 220 $ 14.10 $ 14.20 90.2% 89.1% 1.1% 3, 657,974 3, 615,212 1.2% 818, 074 839, 436 -2.5% 2, 839,900 2, 775,776 2.3% Detroit 3.8% 4 261, 000 2, 180 $ 12.14 $ 12.06 90.3% 89.5% 0.8% 3, 067,233 3, 026,458 1.3% 879, 338 907, 334 -3.1% 2, 187,895 2, 119,124 3.2% Dayton 3.7% 7 384, 400 3, 210 $ 9.26 $ 8.66 91.4% 90.1% 1.3% 3, 550,079 3, 223,529 10.1% 1, 461,175 1, 426,491 2.4% 2, 088,904 1, 797,038 16.2% Source: Compa Myrtle Beach 2.7% 2 194, 600 1, 420 $ 12.05 $ 12.88 88.0% 85.4% 2.6% 2, 052,787 2, 109,003 -2.7% 535, 750 566, 467 -5.4% 1, 517,037 1, 542,536 -1.7% Note: Data pres Denver 2.4% 4 227, 200 2, 140 $ 12.03 $ 12.49 87.2% 83.8% 3.4% 2, 598,487 2, 583,046 0.6% 1, 251,981 1, 375,619 -9.0% 1, 346,506 1, 207,427 11.5% MSAs (Metropo Port St. Lucie 1.8% 2 167, 000 1, 250 $ 13.98 $ 15.07 88.6% 88.1% 0.5% 1, 860,181 1, 937,185 -4.0% 844, 534 983, 227 -14.1% 1, 015,647 953, 958 6.5% Baltimore 2.0% 1 117, 700 1, 080 $ 15.86 $ 17.15 89.2% 83.2% 6.0% 1, 608,204 1, 636,319 -1.7% 464, 773 534, 546 -13.1% 1, 143,431 1, 101,773 3.8% Raleigh - Cary 1.5% 3 159, 600 1, 070 $ 10.39 $ 10.95 89.3% 86.1% 3.2% 1, 518,063 1, 502,334 1.0% 645, 998 679, 387 -4.9% 872, 065 822, 947 6.0% Riverside - SB 2.5% 2 117, 500 1, 180 $ 15.98 $ 15.50 94.0% 89.9% 4.0% 1, 914,333 1, 761,533 8.7% 502, 867 536, 314 -6.2% 1, 411,466 1, 225,219 15.2% 10.9% 13 860, 200 7, 710 $ 13.93 $ 13.96 89.8% 86.6% 3.1% 11, 290,617 10, 742,851 5.1% 5, 084,709 4, 576,681 11.1% 6, 205,908 6, 166,170 0.6% Other Total Same-Store 100.0% 83 6, 029,600 51, 330 $ 15.07 $ 15.01 90.6% 88.6% 2.0% 84, 147,601 81, 245,804 3.6% 27, 301,271 28, 490,131 -4.2% 56, 846,330 52, 755,673 7.8% Source: Company internal data. Note: Data presented represents SmartStop’s existing owned same store portfolio only NAREIT Presentation (1) MSAs (Metropolitan Statistical Areas) as defined by the U.S. Census Bureau. Toronto CMA (Census Metropolitan Area) as defined by Statistics Canada. 26 (2) RentPOF defined as rental revenue net of discounts & concessions, excluding late fees, admin fees and parking income, divided by occupied square feet of storage.
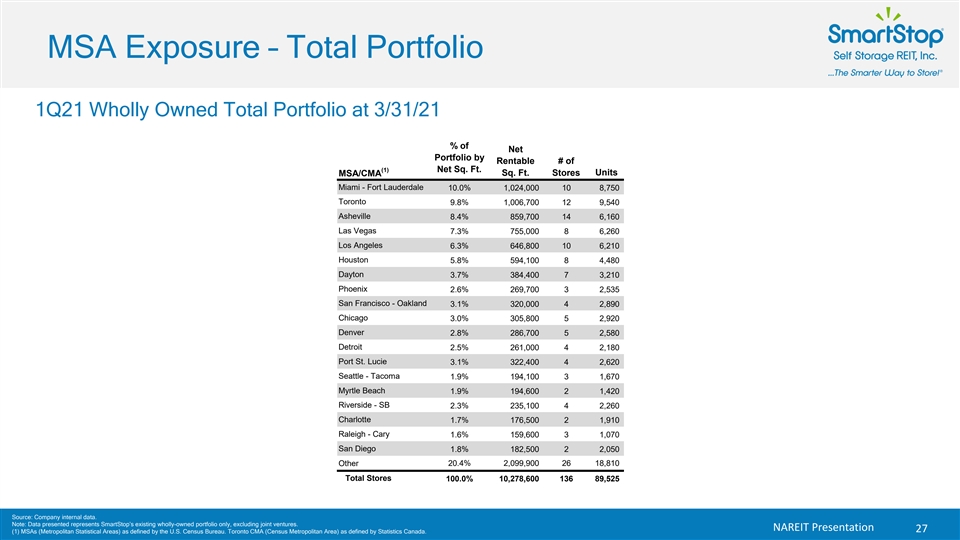
MSA Exposure – Total Portfolio 1Q21 Wholly Owned Total Portfolio at 3/31/21 % of Net Portfolio by Rentable # of (1) Net Sq. Ft. MSA/CMA Sq. Ft. Stores Units Miami - Fort Lauderdale 10.0% 1, 024,000 10 8, 750 Toronto 9.8% 1, 006,700 12 9, 540 Asheville 8.4% 859, 700 14 6, 160 Las Vegas 7.3% 755, 000 8 6, 260 Los Angeles 6.3% 646, 800 10 6, 210 Houston 5.8% 594, 100 8 4, 480 Dayton 3.7% 384, 400 7 3, 210 Phoenix 2.6% 269, 700 3 2, 535 San Francisco - Oakland 3.1% 320, 000 4 2, 890 Chicago 3.0% 305, 800 5 2, 920 Denver 2.8% 286, 700 5 2, 580 Detroit 2.5% 261, 000 4 2, 180 Port St. Lucie 3.1% 322, 400 4 2, 620 Seattle - Tacoma 1.9% 194, 100 3 1, 670 Myrtle Beach 1.9% 194, 600 2 1, 420 Riverside - SB 2.3% 235, 100 4 2, 260 Charlotte 1.7% 176, 500 2 1, 910 Raleigh - Cary 1.6% 159, 600 3 1, 070 San Diego 1.8% 182, 500 2 2, 050 Other 20.4% 2, 099,900 26 18, 810 Total Stores 100.0% 10, 278,600 136 89, 525 Source: Company internal data. Note: Data presented represents SmartStop’s existing wholly-owned portfolio only, excluding joint ventures. NAREIT Presentation 27 (1) MSAs (Metropolitan Statistical Areas) as defined by the U.S. Census Bureau. Toronto CMA (Census Metropolitan Area) as defined by Statistics Canada.MSA Exposure – Total Portfolio 1Q21 Wholly Owned Total Portfolio at 3/31/21 % of Net Portfolio by Rentable # of (1) Net Sq. Ft. MSA/CMA Sq. Ft. Stores Units Miami - Fort Lauderdale 10.0% 1, 024,000 10 8, 750 Toronto 9.8% 1, 006,700 12 9, 540 Asheville 8.4% 859, 700 14 6, 160 Las Vegas 7.3% 755, 000 8 6, 260 Los Angeles 6.3% 646, 800 10 6, 210 Houston 5.8% 594, 100 8 4, 480 Dayton 3.7% 384, 400 7 3, 210 Phoenix 2.6% 269, 700 3 2, 535 San Francisco - Oakland 3.1% 320, 000 4 2, 890 Chicago 3.0% 305, 800 5 2, 920 Denver 2.8% 286, 700 5 2, 580 Detroit 2.5% 261, 000 4 2, 180 Port St. Lucie 3.1% 322, 400 4 2, 620 Seattle - Tacoma 1.9% 194, 100 3 1, 670 Myrtle Beach 1.9% 194, 600 2 1, 420 Riverside - SB 2.3% 235, 100 4 2, 260 Charlotte 1.7% 176, 500 2 1, 910 Raleigh - Cary 1.6% 159, 600 3 1, 070 San Diego 1.8% 182, 500 2 2, 050 Other 20.4% 2, 099,900 26 18, 810 Total Stores 100.0% 10, 278,600 136 89, 525 Source: Company internal data. Note: Data presented represents SmartStop’s existing wholly-owned portfolio only, excluding joint ventures. NAREIT Presentation 27 (1) MSAs (Metropolitan Statistical Areas) as defined by the U.S. Census Bureau. Toronto CMA (Census Metropolitan Area) as defined by Statistics Canada.
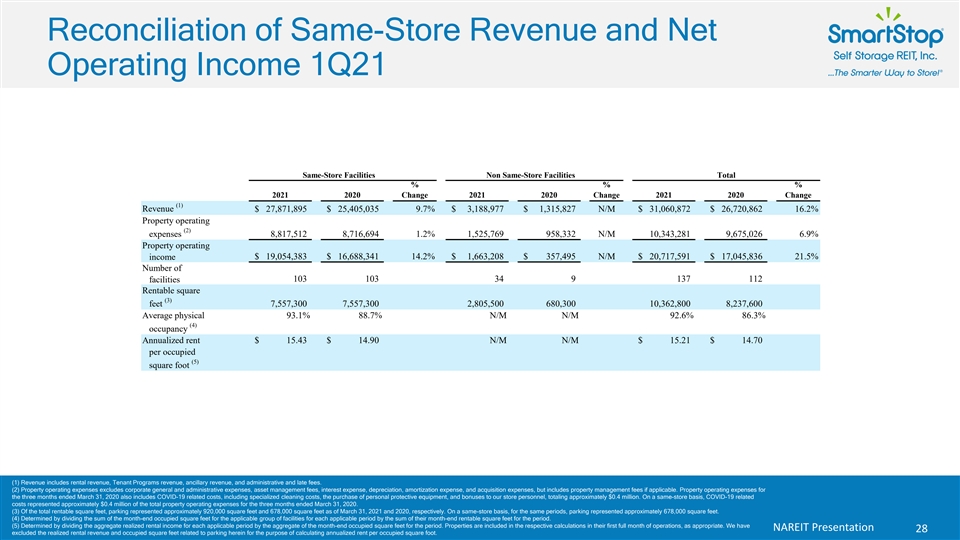
Reconciliation of Same-Store Revenue and Net Operating Income 1Q21 Same-Store Facilities Non Same-Store Facilities Total % % % 2021 2020 Change 2021 2020 Change 2021 2020 Change (1) Revenue $ 27,871,895 $ 25,405,035 9.7% $ 3,188,977 $ 1,315,827 N/M $ 31,060,872 $ 26,720,862 16.2% Property operating (2) expenses 8,817,512 8,716,694 1.2% 1,525,769 958,332 N/M 10,343,281 9,675,026 6.9% Property operating $ 19,054,383 $ 16,688,341 14.2% $ 1,663,208 $ 357,495 N/M $ 20,717,591 $ 17,045,836 21.5% income Number of 103 103 34 9 137 112 facilities Rentable square (3) feet 7,557,300 7,557,300 2,805,500 680,300 10,362,800 8,237,600 Average physical 93.1% 88.7% N/M N/M 92.6% 86.3% (4) occupancy Annualized rent $ 15.43 $ 14.90 N/M N/M $ 15.21 $ 14.70 per occupied (5) square foot (1) Revenue includes rental revenue, Tenant Programs revenue, ancillary revenue, and administrative and late fees. (2) Property operating expenses excludes corporate general and administrative expenses, asset management fees, interest expense, depreciation, amortization expense, and acquisition expenses, but includes property management fees if applicable. Property operating expenses for the three months ended March 31, 2020 also includes COVID-19 related costs, including specialized cleaning costs, the purchase of personal protective equipment, and bonuses to our store personnel, totaling approximately $0.4 million. On a same-store basis, COVID-19 related costs represented approximately $0.4 million of the total property operating expenses for the three months ended March 31, 2020. (3) Of the total rentable square feet, parking represented approximately 920,000 square feet and 678,000 square feet as of March 31, 2021 and 2020, respectively. On a same-store basis, for the same periods, parking represented approximately 678,000 square feet. (4) Determined by dividing the sum of the month-end occupied square feet for the applicable group of facilities for each applicable period by the sum of their month-end rentable square feet for the period. (5) Determined by dividing the aggregate realized rental income for each applicable period by the aggregate of the month-end occupied square feet for the period. Properties are included in the respective calculations in their first full month of operations, as appropriate. We have NAREIT Presentation 28 excluded the realized rental revenue and occupied square feet related to parking herein for the purpose of calculating annualized rent per occupied square foot. Reconciliation of Same-Store Revenue and Net Operating Income 1Q21 Same-Store Facilities Non Same-Store Facilities Total % % % 2021 2020 Change 2021 2020 Change 2021 2020 Change (1) Revenue $ 27,871,895 $ 25,405,035 9.7% $ 3,188,977 $ 1,315,827 N/M $ 31,060,872 $ 26,720,862 16.2% Property operating (2) expenses 8,817,512 8,716,694 1.2% 1,525,769 958,332 N/M 10,343,281 9,675,026 6.9% Property operating $ 19,054,383 $ 16,688,341 14.2% $ 1,663,208 $ 357,495 N/M $ 20,717,591 $ 17,045,836 21.5% income Number of 103 103 34 9 137 112 facilities Rentable square (3) feet 7,557,300 7,557,300 2,805,500 680,300 10,362,800 8,237,600 Average physical 93.1% 88.7% N/M N/M 92.6% 86.3% (4) occupancy Annualized rent $ 15.43 $ 14.90 N/M N/M $ 15.21 $ 14.70 per occupied (5) square foot (1) Revenue includes rental revenue, Tenant Programs revenue, ancillary revenue, and administrative and late fees. (2) Property operating expenses excludes corporate general and administrative expenses, asset management fees, interest expense, depreciation, amortization expense, and acquisition expenses, but includes property management fees if applicable. Property operating expenses for the three months ended March 31, 2020 also includes COVID-19 related costs, including specialized cleaning costs, the purchase of personal protective equipment, and bonuses to our store personnel, totaling approximately $0.4 million. On a same-store basis, COVID-19 related costs represented approximately $0.4 million of the total property operating expenses for the three months ended March 31, 2020. (3) Of the total rentable square feet, parking represented approximately 920,000 square feet and 678,000 square feet as of March 31, 2021 and 2020, respectively. On a same-store basis, for the same periods, parking represented approximately 678,000 square feet. (4) Determined by dividing the sum of the month-end occupied square feet for the applicable group of facilities for each applicable period by the sum of their month-end rentable square feet for the period. (5) Determined by dividing the aggregate realized rental income for each applicable period by the aggregate of the month-end occupied square feet for the period. Properties are included in the respective calculations in their first full month of operations, as appropriate. We have NAREIT Presentation 28 excluded the realized rental revenue and occupied square feet related to parking herein for the purpose of calculating annualized rent per occupied square foot.
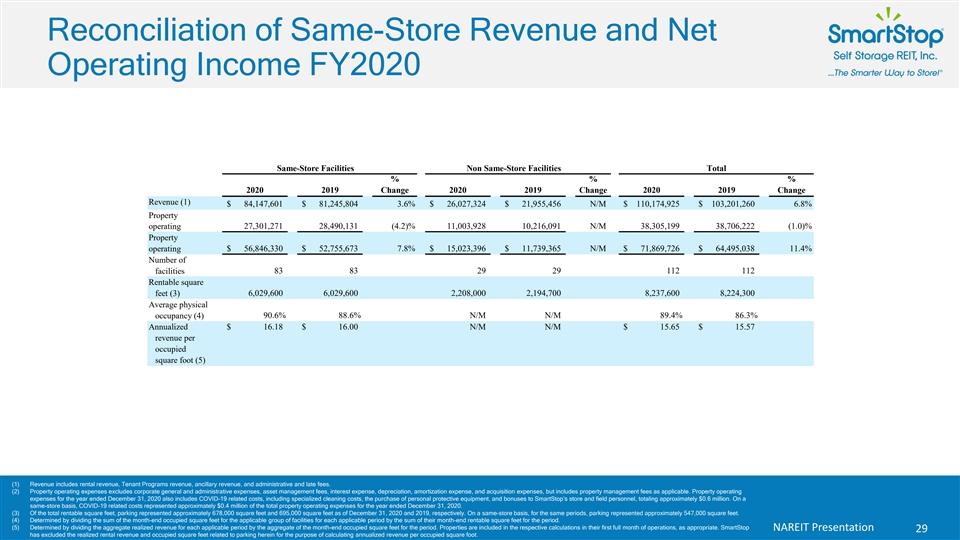
Reconciliation of Same-Store Revenue and Net Operating Income FY2020 Same-Store Facilities Non Same-Store Facilities Total % % % 2020 2019 Change 2020 2019 Change 2020 2019 Change Revenue (1) $ 84,147,601 $ 8 1,245,804 3.6% $ 2 6,027,324 $ 2 1,955,456 N/M $ 1 10,174,925 $ 1 03,201,260 6.8% Property operating 2 7,301,271 28,490,131 (4.2)% 11,003,928 1 0,216,091 N/M 3 8,305,199 3 8,706,222 (1.0)% P roperty $ 5 6,846,330 $ 52,755,673 7.8% $ 15,023,396 $ 1 1,739,365 N/M $ 7 1,869,726 $ 6 4,495,038 11.4% operating Number of facilities 8 3 8 3 2 9 2 9 1 12 1 12 Rentable square feet (3) 6,029,600 6 ,029,600 2,208,000 2 ,194,700 8 ,237,600 8 ,224,300 Average physical 90.6% 88.6% N/M N/M 89.4% 86.3% occupancy (4) Annualized $ 16.18 $ 16.00 N/M N/M $ 1 5.65 $ 1 5.57 revenue per occupied square foot (5) (1) Revenue includes rental revenue, Tenant Programs revenue, ancillary revenue, and administrative and late fees. (2) Property operating expenses excludes corporate general and administrative expenses, asset management fees, interest expense, depreciation, amortization expense, and acquisition expenses, but includes property management fees as applicable. Property operating expenses for the year ended December 31, 2020 also includes COVID-19 related costs, including specialized cleaning costs, the purchase of personal protective equipment, and bonuses to SmartStop’s store and field personnel, totaling approximately $0.6 million. On a same-store basis, COVID-19 related costs represented approximately $0.4 million of the total property operating expenses for the year ended December 31, 2020. (3) Of the total rentable square feet, parking represented approximately 678,000 square feet and 695,000 square feet as of December 31, 2020 and 2019, respectively. On a same-store basis, for the same periods, parking represented approximately 547,000 square feet. (4) Determined by dividing the sum of the month-end occupied square feet for the applicable group of facilities for each applicable period by the sum of their month-end rentable square feet for the period. (5) Determined by dividing the aggregate realized revenue for each applicable period by the aggregate of the month-end occupied square feet for the period. Properties are included in the respective calculations in their first full month of operations, as appropriate. SmartStop NAREIT Presentation 29 has excluded the realized rental revenue and occupied square feet related to parking herein for the purpose of calculating annualized revenue per occupied square foot.Reconciliation of Same-Store Revenue and Net Operating Income FY2020 Same-Store Facilities Non Same-Store Facilities Total % % % 2020 2019 Change 2020 2019 Change 2020 2019 Change Revenue (1) $ 84,147,601 $ 8 1,245,804 3.6% $ 2 6,027,324 $ 2 1,955,456 N/M $ 1 10,174,925 $ 1 03,201,260 6.8% Property operating 2 7,301,271 28,490,131 (4.2)% 11,003,928 1 0,216,091 N/M 3 8,305,199 3 8,706,222 (1.0)% P roperty $ 5 6,846,330 $ 52,755,673 7.8% $ 15,023,396 $ 1 1,739,365 N/M $ 7 1,869,726 $ 6 4,495,038 11.4% operating Number of facilities 8 3 8 3 2 9 2 9 1 12 1 12 Rentable square feet (3) 6,029,600 6 ,029,600 2,208,000 2 ,194,700 8 ,237,600 8 ,224,300 Average physical 90.6% 88.6% N/M N/M 89.4% 86.3% occupancy (4) Annualized $ 16.18 $ 16.00 N/M N/M $ 1 5.65 $ 1 5.57 revenue per occupied square foot (5) (1) Revenue includes rental revenue, Tenant Programs revenue, ancillary revenue, and administrative and late fees. (2) Property operating expenses excludes corporate general and administrative expenses, asset management fees, interest expense, depreciation, amortization expense, and acquisition expenses, but includes property management fees as applicable. Property operating expenses for the year ended December 31, 2020 also includes COVID-19 related costs, including specialized cleaning costs, the purchase of personal protective equipment, and bonuses to SmartStop’s store and field personnel, totaling approximately $0.6 million. On a same-store basis, COVID-19 related costs represented approximately $0.4 million of the total property operating expenses for the year ended December 31, 2020. (3) Of the total rentable square feet, parking represented approximately 678,000 square feet and 695,000 square feet as of December 31, 2020 and 2019, respectively. On a same-store basis, for the same periods, parking represented approximately 547,000 square feet. (4) Determined by dividing the sum of the month-end occupied square feet for the applicable group of facilities for each applicable period by the sum of their month-end rentable square feet for the period. (5) Determined by dividing the aggregate realized revenue for each applicable period by the aggregate of the month-end occupied square feet for the period. Properties are included in the respective calculations in their first full month of operations, as appropriate. SmartStop NAREIT Presentation 29 has excluded the realized rental revenue and occupied square feet related to parking herein for the purpose of calculating annualized revenue per occupied square foot.
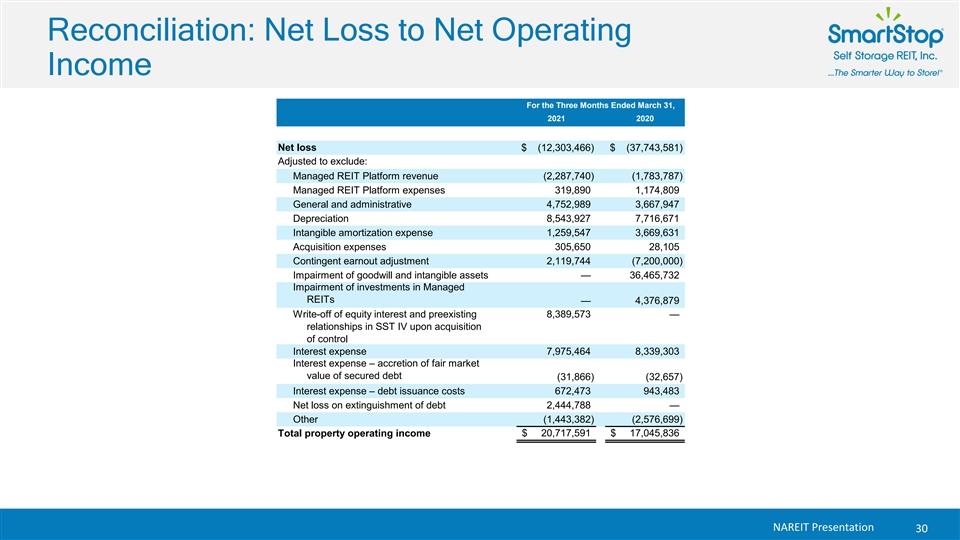
Reconciliation: Net Loss to Net Operating Income For the Three Months Ended March 31, 2021 2020 Net loss $ (12,303,466) $ (37,743,581) Adjusted to exclude: Managed REIT Platform revenue (2,287,740) (1,783,787) Managed REIT Platform expenses 319,890 1,174,809 General and administrative 4,752,989 3,667,947 Depreciation 8,543,927 7,716,671 Intangible amortization expense 1,259,547 3,669,631 Acquisition expenses 305,650 28,105 Contingent earnout adjustment 2,119,744 (7,200,000) Impairment of goodwill and intangible assets — 36,465,732 Impairment of investments in Managed REITs — 4,376,879 Write-off of equity interest and preexisting 8,389,573 — relationships in SST IV upon acquisition of control Interest expense 7,975,464 8,339,303 Interest expense – accretion of fair market value of secured debt (31,866) (32,657) Interest expense – debt issuance costs 672,473 943,483 Net loss on extinguishment of debt 2,444,788 — Other (1,443,382) (2,576,699) $ 20,717,591 $ 17,045,836 Total property operating income Total revenue $ 31,060,872 $ 26,720,862 Total property operating expenses 10,343,281 9,675,026 Total property operating income $ 20,717,591 $ 17,045,836 NAREIT Presentation 30Reconciliation: Net Loss to Net Operating Income For the Three Months Ended March 31, 2021 2020 Net loss $ (12,303,466) $ (37,743,581) Adjusted to exclude: Managed REIT Platform revenue (2,287,740) (1,783,787) Managed REIT Platform expenses 319,890 1,174,809 General and administrative 4,752,989 3,667,947 Depreciation 8,543,927 7,716,671 Intangible amortization expense 1,259,547 3,669,631 Acquisition expenses 305,650 28,105 Contingent earnout adjustment 2,119,744 (7,200,000) Impairment of goodwill and intangible assets — 36,465,732 Impairment of investments in Managed REITs — 4,376,879 Write-off of equity interest and preexisting 8,389,573 — relationships in SST IV upon acquisition of control Interest expense 7,975,464 8,339,303 Interest expense – accretion of fair market value of secured debt (31,866) (32,657) Interest expense – debt issuance costs 672,473 943,483 Net loss on extinguishment of debt 2,444,788 — Other (1,443,382) (2,576,699) $ 20,717,591 $ 17,045,836 Total property operating income Total revenue $ 31,060,872 $ 26,720,862 Total property operating expenses 10,343,281 9,675,026 Total property operating income $ 20,717,591 $ 17,045,836 NAREIT Presentation 30
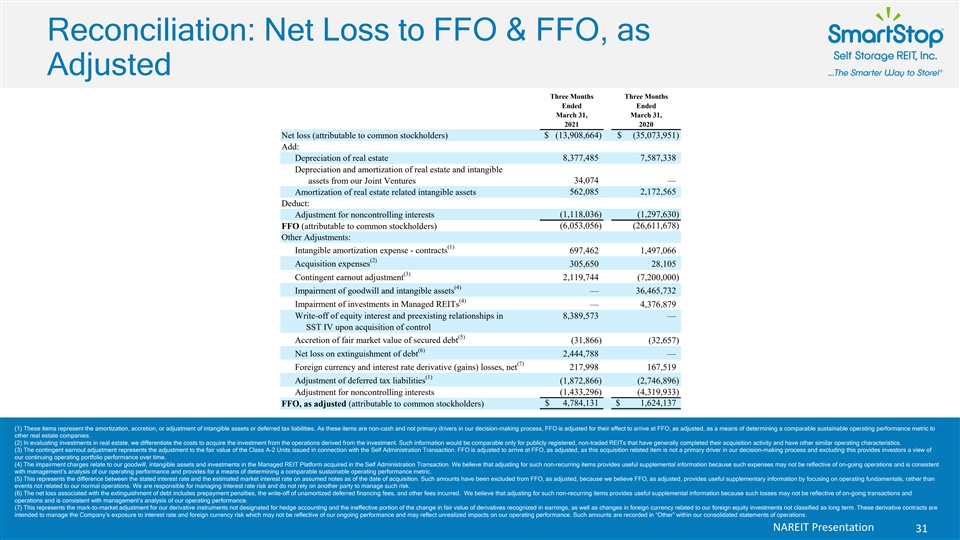
Reconciliation: Net Loss to FFO & FFO, as Adjusted Three Months Three Months Ended Ended March 31, March 31, 2021 2020 Net loss (attributable to common stockholders) $ (13,908,664) $ ( 35,073,951) Add: Depreciation of real estate 8, 377,485 7,587,338 Depreciation and amortization of real estate and intangible 34, 074 — assets from our Joint Ventures Amortization of real estate related intangible assets 562, 085 2,172,565 Deduct: ( 1,118,036) ( 1,297,630) Adjustment for noncontrolling interests FFO (attributable to common stockholders) (6,053,056) ( 26,611,678) Other Adjustments: (1) Intangible amortization expense - contracts 697, 462 1,497,066 (2) Acquisition expenses 305, 650 28, 105 (3) Contingent earnout adjustment 2,119,744 ( 7,200,000) (4) Impairment of goodwill and intangible assets — 36,465,732 (4) Impairment of investments in Managed REITs — 4, 376,879 Write-off of equity interest and preexisting relationships in 8,389,573 — SST IV upon acquisition of control (5) Accretion of fair market value of secured debt ( 31,866) (32,657) (6) Net loss on extinguishment of debt 2,444,788 — (7) Foreign currency and interest rate derivative (gains) losses, net 217, 998 167, 519 (1) Adjustment of deferred tax liabilities (1,872,866) ( 2,746,896) Adjustment for noncontrolling interests (1,433,296) (4,319,933) $ 4, 784,131 $ 1, 624,137 FFO, as adjusted (attributable to common stockholders) (1) These items represent the amortization, accretion, or adjustment of intangible assets or deferred tax liabilities. As these items are non-cash and not primary drivers in our decision-making process, FFO is adjusted for their effect to arrive at FFO, as adjusted, as a means of determining a comparable sustainable operating performance metric to other real estate companies. (2) In evaluating investments in real estate, we differentiate the costs to acquire the investment from the operations derived from the investment. Such information would be comparable only for publicly registered, non-traded REITs that have generally completed their acquisition activity and have other similar operating characteristics. (3) The contingent earnout adjustment represents the adjustment to the fair value of the Class A-2 Units issued in connection with the Self Administration Transaction. FFO is adjusted to arrive at FFO, as adjusted, as this acquisition related item is not a primary driver in our decision-making process and excluding this provides investors a view of our continuing operating portfolio performance over time. (4) The impairment charges relate to our goodwill, intangible assets and investments in the Managed REIT Platform acquired in the Self Administration Transaction. We believe that adjusting for such non-recurring items provides useful supplemental information because such expenses may not be reflective of on-going operations and is consistent with management’s analysis of our operating performance and provides for a means of determining a comparable sustainable operating performance metric. (5) This represents the difference between the stated interest rate and the estimated market interest rate on assumed notes as of the date of acquisition. Such amounts have been excluded from FFO, as adjusted, because we believe FFO, as adjusted, provides useful supplementary information by focusing on operating fundamentals, rather than events not related to our normal operations. We are responsible for managing interest rate risk and do not rely on another party to manage such risk. (6) The net loss associated with the extinguishment of debt includes prepayment penalties, the write-off of unamortized deferred financing fees, and other fees incurred. We believe that adjusting for such non-recurring items provides useful supplemental information because such losses may not be reflective of on-going transactions and operations and is consistent with management’s analysis of our operating performance. (7) This represents the mark-to-market adjustment for our derivative instruments not designated for hedge accounting and the ineffective portion of the change in fair value of derivatives recognized in earnings, as well as changes in foreign currency related to our foreign equity investments not classified as long term. These derivative contracts are intended to manage the Company’s exposure to interest rate and foreign currency risk which may not be reflective of our ongoing performance and may reflect unrealized impacts on our operating performance. Such amounts are recorded in “Other” within our consolidated statements of operations. NAREIT Presentation 31Reconciliation: Net Loss to FFO & FFO, as Adjusted Three Months Three Months Ended Ended March 31, March 31, 2021 2020 Net loss (attributable to common stockholders) $ (13,908,664) $ ( 35,073,951) Add: Depreciation of real estate 8, 377,485 7,587,338 Depreciation and amortization of real estate and intangible 34, 074 — assets from our Joint Ventures Amortization of real estate related intangible assets 562, 085 2,172,565 Deduct: ( 1,118,036) ( 1,297,630) Adjustment for noncontrolling interests FFO (attributable to common stockholders) (6,053,056) ( 26,611,678) Other Adjustments: (1) Intangible amortization expense - contracts 697, 462 1,497,066 (2) Acquisition expenses 305, 650 28, 105 (3) Contingent earnout adjustment 2,119,744 ( 7,200,000) (4) Impairment of goodwill and intangible assets — 36,465,732 (4) Impairment of investments in Managed REITs — 4, 376,879 Write-off of equity interest and preexisting relationships in 8,389,573 — SST IV upon acquisition of control (5) Accretion of fair market value of secured debt ( 31,866) (32,657) (6) Net loss on extinguishment of debt 2,444,788 — (7) Foreign currency and interest rate derivative (gains) losses, net 217, 998 167, 519 (1) Adjustment of deferred tax liabilities (1,872,866) ( 2,746,896) Adjustment for noncontrolling interests (1,433,296) (4,319,933) $ 4, 784,131 $ 1, 624,137 FFO, as adjusted (attributable to common stockholders) (1) These items represent the amortization, accretion, or adjustment of intangible assets or deferred tax liabilities. As these items are non-cash and not primary drivers in our decision-making process, FFO is adjusted for their effect to arrive at FFO, as adjusted, as a means of determining a comparable sustainable operating performance metric to other real estate companies. (2) In evaluating investments in real estate, we differentiate the costs to acquire the investment from the operations derived from the investment. Such information would be comparable only for publicly registered, non-traded REITs that have generally completed their acquisition activity and have other similar operating characteristics. (3) The contingent earnout adjustment represents the adjustment to the fair value of the Class A-2 Units issued in connection with the Self Administration Transaction. FFO is adjusted to arrive at FFO, as adjusted, as this acquisition related item is not a primary driver in our decision-making process and excluding this provides investors a view of our continuing operating portfolio performance over time. (4) The impairment charges relate to our goodwill, intangible assets and investments in the Managed REIT Platform acquired in the Self Administration Transaction. We believe that adjusting for such non-recurring items provides useful supplemental information because such expenses may not be reflective of on-going operations and is consistent with management’s analysis of our operating performance and provides for a means of determining a comparable sustainable operating performance metric. (5) This represents the difference between the stated interest rate and the estimated market interest rate on assumed notes as of the date of acquisition. Such amounts have been excluded from FFO, as adjusted, because we believe FFO, as adjusted, provides useful supplementary information by focusing on operating fundamentals, rather than events not related to our normal operations. We are responsible for managing interest rate risk and do not rely on another party to manage such risk. (6) The net loss associated with the extinguishment of debt includes prepayment penalties, the write-off of unamortized deferred financing fees, and other fees incurred. We believe that adjusting for such non-recurring items provides useful supplemental information because such losses may not be reflective of on-going transactions and operations and is consistent with management’s analysis of our operating performance. (7) This represents the mark-to-market adjustment for our derivative instruments not designated for hedge accounting and the ineffective portion of the change in fair value of derivatives recognized in earnings, as well as changes in foreign currency related to our foreign equity investments not classified as long term. These derivative contracts are intended to manage the Company’s exposure to interest rate and foreign currency risk which may not be reflective of our ongoing performance and may reflect unrealized impacts on our operating performance. Such amounts are recorded in “Other” within our consolidated statements of operations. NAREIT Presentation 31
Additional Information Regarding NOI, FFO & FFO, as adjusted Funds from Operations (“FFO”) and FFO, as adjusted Funds from operations (“FFO”) is an industry wide metric promulgated by the National Association of Real Estate Investment Trusts, or NAREIT, which SmartStop believes to be an appropriate supplemental measure to reflect the operating performance of a REIT. The use of FFO is recommended by the REIT industry as a supplemental performance measure. SmartStop defines FFO, a non-GAAP measure, consistent with the standards established by the White Paper on FFO approved by the Board of Governors of NAREIT, or the White Paper. The White Paper defines FFO as net income (loss) computed in accordance with GAAP, excluding gains or losses from sales of property and asset impairment write downs, plus depreciation and amortization, and after adjustments for unconsolidated partnerships and joint ventures. Additionally, gains and losses from change in control are excluded from the determination of FFO. Adjustments for unconsolidated partnerships and joint ventures are calculated to reflect FFO on the same basis. SmartStop’s FFO calculation complies with NAREIT’s policy described above. SmartStop uses FFO, as adjusted, as an additional non-GAAP financial measure to evaluate its operating performance. SmartStop previously used Modified Funds from Operations (“MFFO”) (as defined by the Institute for Portfolio Alternatives) as a non-GAAP measure of operating performance. Management replaced the MFFO measure with FFO, as adjusted, because FFO, as adjusted, provides investors with supplemental performance information that is consistent with the performance models and analysis used by management. In addition, FFO, as adjusted, is a measure used among SmartStop’s peer group, which includes publicly traded REITs. Further, SmartStop believes FFO, as adjusted, is useful in comparing the sustainability of its operating performance with the sustainability of the operating performance of other real estate companies. In determining FFO, as adjusted, SmartStop makes further adjustments to the NAREIT computation of FFO to exclude the effects of non-real estate related asset impairments and intangible amortization, acquisition related costs, other write-offs incurred in connection with acquisitions, contingent earnout expenses, adjustments of fair value of debt adjustments, gains or losses from extinguishment of debt, accretion of deferred tax liabilities, realized and unrealized gains/losses on foreign exchange transactions, and gains/losses on foreign exchange and interest rate derivatives not designated for hedge accounting, which SmartStop believes are not indicative of the Company’s overall long-term operating performance. SmartStop excludes these items from GAAP net income to arrive at FFO, as adjusted, as they are not the primary drivers in its decision-making process and excluding these items provides investors a view of its continuing operating portfolio performance over time and makes its results more comparable period to period and to other REITs, which in any respective period may experience fluctuations in such acquisition, merger or other similar activities that are not of a long-term operating performance nature. FFO, as adjusted, also reflects adjustments for unconsolidated partnerships and jointly owned investments. SmartStop uses FFO, as adjusted, as one measure of operating performance when SmartStop formulates corporate goals and evaluate the effectiveness of its strategies. Presentation of FFO and FFO, as adjusted, is intended to provide useful information to investors as they compare the operating performance of different REITs, although it should be noted that not all REITs calculate FFO and FFO, as adjusted, the same way, so comparisons with other REITs may not be meaningful. Furthermore, FFO and FFO, as adjusted, are not necessarily indicative of cash flow available to fund cash needs and should not be considered as an alternative to net income (loss) or income (loss) from continuing operations as an indication of SmartStop’s performance, as an alternative to cash flows from operations, which is an indication of liquidity, or indicative of funds available to fund SmartStop’s cash needs including SmartStop’s ability to make distributions to its stockholders. FFO and FFO, as adjusted, should not be considered as an alternative to net income (determined in accordance with GAAP) and should be reviewed in conjunction with other measurements as an indication of SmartStop’s performance. Neither the SEC, NAREIT, nor any other regulatory body has passed judgment on the acceptability of the adjustments that SmartStop uses to calculate FFO or FFO, as adjusted. In the future, the SEC, NAREIT or another regulatory body may decide to standardize the allowable adjustments across the publicly registered, non-traded REIT industry and SmartStop would have to adjust its calculation and characterization of FFO or FFO, as adjusted. NAREIT Presentation 32Additional Information Regarding NOI, FFO & FFO, as adjusted Funds from Operations (“FFO”) and FFO, as adjusted Funds from operations (“FFO”) is an industry wide metric promulgated by the National Association of Real Estate Investment Trusts, or NAREIT, which SmartStop believes to be an appropriate supplemental measure to reflect the operating performance of a REIT. The use of FFO is recommended by the REIT industry as a supplemental performance measure. SmartStop defines FFO, a non-GAAP measure, consistent with the standards established by the White Paper on FFO approved by the Board of Governors of NAREIT, or the White Paper. The White Paper defines FFO as net income (loss) computed in accordance with GAAP, excluding gains or losses from sales of property and asset impairment write downs, plus depreciation and amortization, and after adjustments for unconsolidated partnerships and joint ventures. Additionally, gains and losses from change in control are excluded from the determination of FFO. Adjustments for unconsolidated partnerships and joint ventures are calculated to reflect FFO on the same basis. SmartStop’s FFO calculation complies with NAREIT’s policy described above. SmartStop uses FFO, as adjusted, as an additional non-GAAP financial measure to evaluate its operating performance. SmartStop previously used Modified Funds from Operations (“MFFO”) (as defined by the Institute for Portfolio Alternatives) as a non-GAAP measure of operating performance. Management replaced the MFFO measure with FFO, as adjusted, because FFO, as adjusted, provides investors with supplemental performance information that is consistent with the performance models and analysis used by management. In addition, FFO, as adjusted, is a measure used among SmartStop’s peer group, which includes publicly traded REITs. Further, SmartStop believes FFO, as adjusted, is useful in comparing the sustainability of its operating performance with the sustainability of the operating performance of other real estate companies. In determining FFO, as adjusted, SmartStop makes further adjustments to the NAREIT computation of FFO to exclude the effects of non-real estate related asset impairments and intangible amortization, acquisition related costs, other write-offs incurred in connection with acquisitions, contingent earnout expenses, adjustments of fair value of debt adjustments, gains or losses from extinguishment of debt, accretion of deferred tax liabilities, realized and unrealized gains/losses on foreign exchange transactions, and gains/losses on foreign exchange and interest rate derivatives not designated for hedge accounting, which SmartStop believes are not indicative of the Company’s overall long-term operating performance. SmartStop excludes these items from GAAP net income to arrive at FFO, as adjusted, as they are not the primary drivers in its decision-making process and excluding these items provides investors a view of its continuing operating portfolio performance over time and makes its results more comparable period to period and to other REITs, which in any respective period may experience fluctuations in such acquisition, merger or other similar activities that are not of a long-term operating performance nature. FFO, as adjusted, also reflects adjustments for unconsolidated partnerships and jointly owned investments. SmartStop uses FFO, as adjusted, as one measure of operating performance when SmartStop formulates corporate goals and evaluate the effectiveness of its strategies. Presentation of FFO and FFO, as adjusted, is intended to provide useful information to investors as they compare the operating performance of different REITs, although it should be noted that not all REITs calculate FFO and FFO, as adjusted, the same way, so comparisons with other REITs may not be meaningful. Furthermore, FFO and FFO, as adjusted, are not necessarily indicative of cash flow available to fund cash needs and should not be considered as an alternative to net income (loss) or income (loss) from continuing operations as an indication of SmartStop’s performance, as an alternative to cash flows from operations, which is an indication of liquidity, or indicative of funds available to fund SmartStop’s cash needs including SmartStop’s ability to make distributions to its stockholders. FFO and FFO, as adjusted, should not be considered as an alternative to net income (determined in accordance with GAAP) and should be reviewed in conjunction with other measurements as an indication of SmartStop’s performance. Neither the SEC, NAREIT, nor any other regulatory body has passed judgment on the acceptability of the adjustments that SmartStop uses to calculate FFO or FFO, as adjusted. In the future, the SEC, NAREIT or another regulatory body may decide to standardize the allowable adjustments across the publicly registered, non-traded REIT industry and SmartStop would have to adjust its calculation and characterization of FFO or FFO, as adjusted. NAREIT Presentation 32
Additional Information Regarding NOI, FFO & FFO, as adjusted Net Operating Income or (“NOI”) NOI is a non-GAAP measure that SmartStop defines as net income (loss), computed in accordance with GAAP, generated from properties before corporate general and administrative expenses, asset management fees, interest expense, depreciation, amortization, acquisition expenses and other non-property related expenses. SmartStop believes that NOI is useful for investors as it provides a measure of the operating performance of its operating assets because NOI excludes certain items that are not associated with the ongoing operation of the properties. Additionally, SmartStop believes that NOI (also referred to as property operating income) is a widely accepted measure of comparative operating performance in the real estate community. However, SmartStop’s use of the term NOI may not be comparable to that of other real estate companies as they may have different methodologies for computing this amount. NAREIT Presentation 33Additional Information Regarding NOI, FFO & FFO, as adjusted Net Operating Income or (“NOI”) NOI is a non-GAAP measure that SmartStop defines as net income (loss), computed in accordance with GAAP, generated from properties before corporate general and administrative expenses, asset management fees, interest expense, depreciation, amortization, acquisition expenses and other non-property related expenses. SmartStop believes that NOI is useful for investors as it provides a measure of the operating performance of its operating assets because NOI excludes certain items that are not associated with the ongoing operation of the properties. Additionally, SmartStop believes that NOI (also referred to as property operating income) is a widely accepted measure of comparative operating performance in the real estate community. However, SmartStop’s use of the term NOI may not be comparable to that of other real estate companies as they may have different methodologies for computing this amount. NAREIT Presentation 33