UNITED STATES
SECURITIES AND EXCHANGE COMMISSION
Washington, D.C. 20549
FORM N-CSR
CERTIFIED SHAREHOLDER REPORT OF REGISTERED MANAGEMENT
INVESTMENT COMPANIES
Investment Company Act File Number 811-22888
Wildermuth Fund
(Exact name of registrant as specified in charter)
818 A1A Hwy, Suite 301
Ponte Vedra Beach, Florida 32082
(Address of principal executive offices) (Zip code)
Daniel Wildermuth
Wildermuth Advisory, LLC
818 A1A Hwy, Suite 301
Ponte Vedra Beach, Florida 32082
(Name and address of agent for service)
COPIES TO:
Karen A. Aspinall
Practus, LLP
3857 Birch St. PMB 2241
Newport Beach, CA 92660
Registrant's telephone number, including area code: (678) 222-1100
Date of fiscal year end: March 31
Date of reporting period: March 31, 2022
Item 1. Reports to Stockholders.
(a) The following is a copy of the report transmitted to shareholders pursuant to Rule 30e-1 under the Investment Company Act of 1940, as amended.
ANNUAL REPORT
March 31, 2022
WWW.WILDERMUTHFUND.COM ● 1-888-445-6032 ●
DISTRIBUTED BY WILDERMUTH SECURITIES, LLC AND
UMB DISTRIBUTION SERVICES, LLC (MEMBERS OF FINRA)
Table of Contents | |
Letter to Shareholders | 2 |
Portfolio Review | 5 |
Portfolio Composition | 7 |
Schedule of Investments | 8 |
Statement of Assets and Liabilities | 12 |
Statements of Operations | 13 |
Statements of Changes in Net Assets | 15 |
Statement of Cash Flows | 17 |
Financial Highlights | 19 |
Notes to Financial Statements | 22 |
Report of Independent Registered Public Accounting Firm | 39 |
Trustees and Officers | 40 |
Additional Information | 43 |
Privacy Policy | 44 |
Wildermuth Fund Letter to Shareholders March 31, 2022 |
Dear Investor:
The Board of Trustees of the Wildermuth Fund (the “Fund”) has approved a change in the Fund’s fiscal year to March 31st. To meet regulatory requirements the Fund must do a short-term audit, called a “stub audit.” Therefore, we are pleased to present this interim annual report for the Wildermuth Fund covering the three months from January 1, 2022, to March 31, 2022. For the three-month period ended March 31, 2022, fee-waived returns were 1.43% for the Fund Class A-shares, 1.35% for the Fund Class C-shares and 1.56% for the Fund Class I-shares.
The Fund’s performance for the same period compared favorably to returns of –5.13% generated by a 60% stock and 40% bond portfolio (as represented by a 60% S&P 500® Index and 40% Barclays U.S Aggregate Bond Index) or –5.74% represented by a 60% S&P SmallCap 600® Index and 40% Barclays U.S. Aggregate Bond Index. The Fund’s overall Alpha and Sortino Ratio since inception are still number one within its Morningstar Multi-Strategy category despite the lingering challenges of COVID-19 which continue to mute the Fund’s performance.1
The overall return of the Fund was flat for the quarter as the economy continued its exit from the ongoing COVID-19 shutdowns. Ongoing company growth and development continued essentially across all companies during the quarter, but revenue targets have either been small enough to not have made material differences in valuations or fallen short resulting in revaluations down. The result was essentially no net forward progress across the portfolio.
The Fund has successfully made the transition to being an early-stage private equity focused portfolio. The transition was smooth, and we believe the resulting portfolio is well-positioned to excel regardless of the larger economic environment.
Looking forward, we are increasingly enthusiastic about the coming quarters as we are seeing many of the Fund’s companies make strong progress in revenue generation while executing their growth plans. Our focus on private equity has created a portfolio that seems to have excellent upside potential that is mostly independent of public market performance. We intend to continue to act opportunistically within private equity markets, when possible, to secure and maintain exposure to what we believe are attractive investments. We believe the Fund is uniquely positioned to potentially benefit from the current investment environment, particularly over the next 18 to 24 months.
Thank you for your continued confidence and support.
Sincerely,

Daniel Wildermuth
President and Chief Executive Officer, and
Chairman and Trustee of the Fund
May 2022
1 | Source: Morningstar Direct; data from 12/31/2014-3/31/2022. Using Morningstar data compiled by Wildermuth Advisory, LLC. The Fund ranked for Alpha 1/86 since inception, 1/109 for the 5-year period, 19/129 for the 3-year period, and 14/146 for the 1-year period; for Sortino Ratio 1/86 since inception, 4/109 for the 5-year period, 32/129 for the 3-year period and 13/144 for the 1-year period, for open and closed end funds in the Multi-Strategy category. Funds compared within the Multi-Strategy category have multiple share classes that receive various rankings. The category includes open and closed end funds and share classes with load and without loads these were compared to the WESFX A-Shares; no load. WEFCX C-Share and WEIFX I-Share have limited operating history, thus Morningstar metrics reflect WESFX A-Share, no load. |
2
Wildermuth Fund Letter to Shareholders - Continued
March 31, 2022 |
The Wildermuth Fund is a closed-end interval Fund. The Fund is considered illiquid and not suitable for all investors.
Past performance is not a guarantee of future results. Investors should carefully consider the investment objectives, risks, charges, and expenses of the Fund before investing. This and other important information is contained within the Fund’s Prospectus, which can be obtained by calling (888) 445-6032 or by visiting our website www.wildermuthfund.com. The Fund’s Prospectus should be read carefully before investing.
Investing in the Fund involves risk, including those summarized below. Endowments have a long-term investment time horizon with low liquidity needs that can take advantage of all of many different asset classes. Investors should consider how closely their investment goals and needs match those of endowments. An investment in the Fund is generally subject to market risk, including the possible loss of the entire principal amount invested. An investment in the Fund represents an indirect investment in the securities owned by the Fund.
● | You should consider the shares to be an illiquid investment. Even though the Fund will make periodic repurchase offers to repurchase a portion of the shares to provide some liquidity to shareholders, only a limited number of shares will be eligible for repurchase by us. Once each quarter, the Fund will offer to repurchase at net asset value (NAV) per share no less than 5% of the outstanding shares of the Fund, unless such offer is suspended or postponed in accordance with regulatory requirements. The Fund may increase the size of these offerings up to a maximum of 25% of the Fund’s outstanding shares, at the sole discretion of the Board, but it is not expected that the Board will do so. |
● | You should consider that you may not have immediate access to the money you invest for an indefinite period of time. An investment in our shares is not suitable for you if you need immediate access to the money you invest. There is no guarantee that you will be able to tender all or any of the requested Fund shares in periodic repurchase offer. |
● | Certain investments in the Fund are illiquid making it difficult to sell these securities and possibly requiring the Fund to sell at an unfavorable time or price. The value of certain Fund investments, in particular, non-traded investment vehicles, will be difficult to determine and the valuations provided will likely vary from the amounts the Fund would receive upon sale or disposition of its investments. |
● | Investors should understand that valuation issues involving the Fund’s investments in the early stages and other private companies have led to delays in the completion of the Fund’s annual audit and the quarterly share repurchase program. A recurrence of this issue would further impact the liquidity of an investor’s shares. |
● | Like all financial instruments, the value of these securities may move up or down, sometimes rapidly and unpredictably. The value of your investment in the Fund at any point in time may be worth less than the value of your original investment, even after taking into account any reinvestment of dividends and distributions. |
● | When the Fund invests in equity securities, the Fund’s investments in those securities are subject to price fluctuations based on a number of reasons for issuer-specific and broader economic or international considerations. They may also decline due to factors which affect a particular industry or industries. In addition, equity securities prices may be particularly sensitive to rising interest rates, as the cost of capital rises and borrowing costs increase. |
● | The Fund may invest in publicly-traded and non-traded REITs or privately offered pooled investment vehicles that hold real estate as well as invest in real estate directly through entities owned or controlled directly or indirectly by the Fund. As a result, the Fund’s portfolio may be significantly impacted by the performance of the real estate market and may experience more volatility and be exposed to greater risk than a more diversified portfolio. |
● | REIT share prices may decline because of adverse developments affecting the real estate industry and real property values. In general, real estate values can be affected by a variety of factors, including supply and demand for properties, the economic health of the country or of different regions, and the strength of specific industries that rent properties. |
● | Exposure to the commodities markets may subject the Fund to greater volatility than investments in more traditional securities. The value of commodity-linked investments may be affected by changes in overall market movements, commodity index volatility, changes in interest rates, or factors affecting a particular industry or commodity, such as weather, and international economic, political and regulatory developments. |
3
Wildermuth Fund Letter to Shareholders - Continued
March 31, 2022 |
● | The Fund may invest in medium- and small-capitalization companies, which may be newly formed or have limited product lines, distribution channels and financial or managerial resources. The risks associated with these investments are generally greater than those associated with investments in the securities of larger, more-established companies. This may cause the Fund’s net asset value to be more volatile when compared to investment companies that focus only on large-capitalization companies. |
● | The Fund is classified as a non-diversified management investment company under the Investment Company Act of 1940, as amended. This means that the Fund may invest a greater portion of its assets in a limited number of issuers than would be the case if the Fund were classified as a diversified management investment company. Accordingly, the Fund may be more sensitive to any single economic, business, political or regulatory occurrence than the value of shares of a diversified investment company. |
● | The shares have no history of public trading, nor is it intended that the shares will be listed on a public exchange at this time. |
● | We do not expect a secondary market in the shares to develop. Even if any such market were to develop, closed-end fund shares trade frequently at a discount from net asset value, which creates a risk of loss for investors purchasing shares in the initial public offering. |
©2022 Morningstar, Inc. All Rights Reserved. The information contained herein: (1) is proprietary to Morningstar and/or its content providers; (2) may not be copied or distributed; and (3) is not warranted to be accurate, complete or timely. Neither Morningstar nor its content providers are responsible for any damages or losses arising from any use of this information.
Wildermuth Fund’s principal underwriters and co-distributors are Wildermuth Securities, LLC and UMB Distribution Services, LLC. The co-distributors are not affiliated.
4
Wildermuth Fund Portfolio Review March 31, 2022 (Unaudited) |
The Fund’s performance figures* for each of the periods ended March 31, 2022, compared to its benchmarks:
| Five
Years | Three
Years | One
Year | Annualized
Since Inception1 |
Class A | 5.68% | 4.14% | 7.84% | 7.17% |
Class A with Load2 | 4.38% | 2.11% | 1.67% | 6.26% |
S&P SmallCap 600® Index ** | 10.89% | 13.58% | 1.23% | 10.80% |
S&P 500® Total Return Index*** | 15.99% | 18.92% | 15.65% | 13.65% |
Bloomberg Barclays U.S. Aggregate Bond Index**** | 2.14% | 1.69% | (4.15)% | 2.03% |
| Five
Years | Three
Years | One
Year | Annualized
Since Inception3 |
Class C | 4.86% | 3.35% | 7.07% | 6.26% |
Class C with Sales Charge4 | 4.86% | 3.35% | 6.07% | 6.26% |
S&P SmallCap 600® Index ** | 10.89% | 13.58% | 1.23% | 13.56% |
S&P 500® Total Return Index*** | 15.99% | 18.92% | 15.65% | 16.44% |
Bloomberg Barclays U.S. Aggregate Bond Index**** | 2.14% | 1.69% | (4.15)% | 2.04% |
| Three
Years | One
Year | Annualized
Since Inception5 |
Class I | 4.26% | 8.17% | 5.68% |
S&P SmallCap 600® Index ** | 13.58% | 1.23% | 10.87% |
S&P 500® Total Return Index*** | 18.92% | 15.65% | 16.02% |
Bloomberg Barclays U.S. Aggregate Bond Index**** | 1.69% | (4.15)% | 2.02% |
1 | The Class A inception date was December 31, 2014. |
2 | Calculated using a maximum sales load. The maximum sales load was 6.00% from the Class A inception date through October 19, 2017. Effective October 20, 2017 the maximum sales load is 5.75%. |
3 | The Class C inception date was March 14, 2016. |
4 | Class C shares are subject to a Contingent Deferred Sales Charge of 1.00% on any shares redeemed within 365 days of purchase. |
5 | The Class I inception date was April 28, 2017. |
* | The performance data quoted here represents past performance. Current performance may be lower or higher than the performance data quoted above. Investment return and principal value will fluctuate, so that shares, when redeemed, may be worth more or less than their original cost. The returns shown do not reflect the deduction of taxes that a shareholder would pay on Fund distributions or on the redemptions of Fund shares. Past performance is no guarantee of future results. Class A has a total annual operating expense of 3.57%, Class C has a total annual operating expense of 4.32%, and Class I has a total annual operating expense of 3.32%, per the prospectus dated April 30, 2021. |
** | The S&P SmallCap 600® is an index of small-cap stocks managed by Standard & Poor’s. It tracks a broad range of small-sized companies that meet specific liquidity and stability requirements. Investors cannot invest directly in an index. |
*** | The S&P 500® Total Return Index is an unmanaged market capitalization-weighted index of 500 widely held common stocks. Investors cannot invest directly in an index. |
**** | The Bloomberg Barclays U.S. Aggregate Bond Index is a broad-based benchmark that measures the investment grade, U.S. dollar-denominated, fixed-rate taxable bond market, including Treasuries, government-related and corporate securities, MBS (agency fixed-rate and hybrid ARM pass-through securities), ABS, and CMBS. Investors cannot invest directly in an index. |
5
Wildermuth Fund Portfolio Review - Continued
March 31, 2022 (Unaudited) |
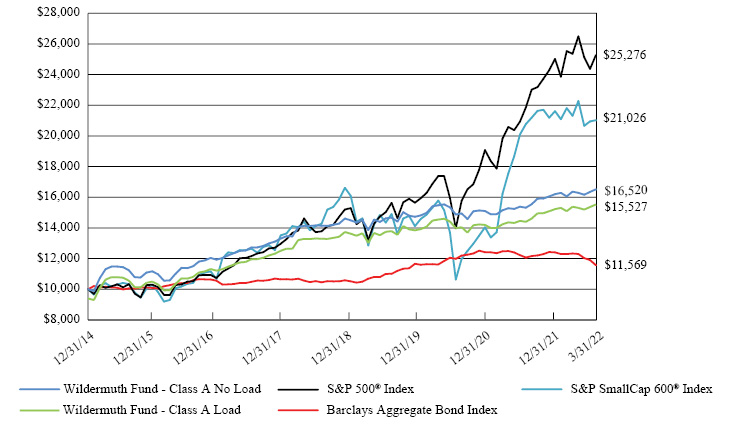
Growth of a $10,000 Investment
Holdings by type of Investment | % of
Net Assets | 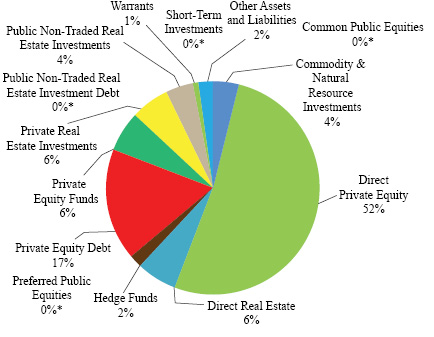
* Represents less than 0.5% of net assets. |
Common Public Equities | 0.3% |
Commodity & Natural Resource Investments | 3.9 |
Direct Private Equity | 51.6 |
Direct Real Estate | 5.7 |
Hedge Funds | 1.8 |
Preferred Public Equities | 0.3 |
Private Equity Debt | 16.9 |
Private Equity Funds | 6.5 |
Private Real Estate Investments | 6.1 |
Public Non-Traded Real Estate Investment Debt | 0.1 |
Public Non-Traded Real Estate Investments | 4.5 |
Warrants | 0.5 |
Short-Term Investments | 0.1 |
Other Assets and Liabilities | 1.7 |
| | 100.0% |
Please refer to the Schedule of Investments in this Annual Report for detailed analysis of the Fund’s Holdings.
6
Wildermuth Fund Portfolio Composition March 31, 2022 |
Country of Investment | | Value | | | % of
Net Assets | |
France | | $ | 1,592,298 | | | | 1.1% | |
Ireland | | | 15,514,872 | | | | 11.1 | |
Luxembourg | | | 2,468,312 | | | | 1.8 | |
New Zealand | | | 2,096,541 | | | | 1.5 | |
United States | | | 115,666,566 | | | | 82.8 | |
Other Assets & Liabilities, net | | | 2,339,191 | | | | 1.7 | |
| | $ | 139,677,780 | | | | 100.0% | |
7
Wildermuth Fund Schedule of Investments March 31, 2022 |
| | Interests,
Shares,
Principal
Amount,
or Units | | | | Fair
Value | |
| | | | | COMMON PUBLIC EQUITIES — 0.3% | | | | |
| | | | | REITS — 0.3% | | | | |
| | | 15,329 | | InvenTrust Properties Corp. | | $ | 471,827 | |
| | | | | TOTAL COMMON PUBLIC EQUITIES (Cost $ 379,312) | | | 471,827 | |
| | | | | | | | | |
| | | | | COMMODITY & NATURAL RESOURCE INVESTMENTS — 3.9% | | | | |
| | | 1,000 | | Casillas Petroleum Resource Partners, LLC(a)(b)(c)(e) | | | 863,738 | |
| | | 1,976,034 | | CM Funding, LLC(a)(b)(c)(d)(e)(f) | | | 1,577,560 | |
| | | — | | Kayne Anderson Energy Fund VII LP(a)(b)(c)(g) | | | 1,041,444 | |
| | | 182 | | Midcon Holdco Partners, LLC(a)(b)(c) | | | 272,787 | |
| | | 2,080,000 | | Thunder Investment Partners, LLC(a)(c)(d)(e)(f) | | | 1,722,394 | |
| | | | | TOTAL COMMODITY & NATURAL RESOURCE INVESTMENTS (Cost $7,156,122) | | | 5,477,923 | |
| | | | | | | | | |
| | | | | DIRECT PRIVATE EQUITY — 51.6% | | | | |
| | | 41,751 | | Affinity Beverages, LLC(a)(b)(c)(e) | | | 174,999 | |
| | | 684 | | Atlas Fintech Holdings Corp. - Class A Share Interests(a)(b)(c)(e)(f) | | | 3,141,446 | |
| | | 2,500 | | Clear Guide Medical, Inc. - Series A Preferred Stock(a)(b)(c)(d)(e)(f) | | | 3,731,385 | |
| | | 134,898 | | Clear Guide Medical, Inc. - Series A-2 Preferred Stock(a)(b)(c)(d)(e)(f) | | | 728,465 | |
| | | 838,423 | | Clear Guide Medical, Inc. - Series A-3 Preferred Stock(a)(b)(c)(d)(e)(f) | | | 4,222,021 | |
| | | 1,543,074 | | Clearsense, LLC - Class C Preferred Shares(a)(b)(c)(d)(e)(f) | | | 11,531,511 | |
| | | 835,814 | | Clearsense, LLC - Class D Preferred Shares(a)(b)(c)(d)(e)(f) | | | 5,716,834 | |
| | | 298,200 | | Content Management Live, LLC(a)(b)(c)(d)(e)(f) | | | 60,000 | |
| | | 2,074,115 | | DSI Digital, LLC - Common Units(a)(b)(c)(d)(e)(f) | | | 3,169,466 | |
| | | 5,791,621 | | DSI Digital, LLC - Series A Convertible Preferred Units(a)(b)(c)(d)(e)(f) | | | 10,554,178 | |
| | | — | | Level ATI HoldCo, LLC - Class A(a)(b)(c)(d)(e)(f) | | | 3,102,526 | |
| | | 3,500,000 | | Metro Diner, LLC - Series B Units(a)(b)(c)(e)(f) | | | 2,345,745 | |
| | | 1,880,968 | | Metro Diner, LLC - Series II Common Units(a)(b)(c)(e)(f) | | | 1,116,265 | |
| | | 8,800,000 | | Reach Enterprises, Inc. - Common Units(a)(b)(c)(d)(e)(f) | | | 6,083,101 | |
| | | 309,150 | | Reach Enterprises, Inc. - Series Seed-1 Preferred Units(a)(b)(c)(d)(e)(f) | | | 316,982 | |
| | | 1,288,103 | | Reach Enterprises, Inc. - Series Seed-2 Preferred Units(a)(b)(c)(d)(e)(f) | | | 1,320,735 | |
| | | 7,627,254 | | Waratek, Ltd. - Common Shares(a)(b)(c)(d)(e)(f) | | | 8,590,687 | |
| | | 635,838 | | Waratek, Ltd. - Series B-1(a)(b)(c)(d)(e)(f) | | | 2,691,274 | |
| | | 756,826 | | Waratek, Ltd. - Series B-2(a)(b)(c)(d)(e)(f) | | | 3,510,838 | |
| | | — | | WG Pitts Caribbean, LLC - Common Units(a)(b)(c)(d)(e)(f) | | | — | |
| | | | | TOTAL DIRECT PRIVATE EQUITY (Cost $ 49,033,159) | | | 72,108,458 | |
| | | | | | | | | |
| | | | | DIRECT REAL ESTATE — 5.7% | | | | |
| | | — | | Brookwood SFL Investor Co-Investment Vehicle, LLC(a)(b)(c) | | | 1,699,510 | |
| | | 439,716 | | Dog Wood Park of Northeast Florida, LLC(a)(b)(c)(d)(e)(f) | | | 350,078 | |
| | | 1,800,000 | | LaGrange Senior Living, LLC - Class A Interests(a)(c)(d)(e)(f) | | | 2,109,116 | |
| | | — | | Polara Builder II, LLC(a)(c)(d)(e)(f) | | | 3,800,146 | |
| | | | | TOTAL DIRECT REAL ESTATE (Cost $ 4,473,739) | | | 7,958,850 | |
See accompanying notes to financial statements.
8
Wildermuth Fund Schedule of Investments - Continued
March 31, 2022 |
| | Interests,
Shares,
Principal
Amount,
or Units | | | | Fair
Value | |
| | | | | HEDGE FUNDS — 1.8% | | | | |
| | | — | | EJF Trust Preferred Fund LP(a)(c)(g)(h) | | $ | 27,207 | |
| | | — | | iCapital Millennium Fund LP(a)(b)(c)(g)(h) | | | 1,588,861 | |
| | | — | | Rosebrook Opportunities Fund LP(a)(b)(c)(d)(g)(h) | | | 877,332 | |
| | | | | TOTAL HEDGE FUNDS (Cost $2,083,242) | | | 2,493,400 | |
| | | | | | | | | |
| | | | | PREFERRED PUBLIC EQUITIES — 0.3% | | | | |
| | | | | REITS — 0.3% | | | | |
| | | 3,564 | | AG Mortgage Investment Trust, Inc. - Series C | | | 82,364 | |
| | | 932 | | Ashford Hospitality Trust, Inc. - Series F | | | 21,138 | |
| | | 4,085 | | Chimera Investment Corp. - Series C | | | 99,429 | |
| | | 6,839 | | Hersha Hospitality Trust - Series E | | | 153,205 | |
| | | | | TOTAL PREFERRED PUBLIC EQUITIES (Cost $23,552) | | | 356,136 | |
| | | | | | | | | |
| | | | | PRIVATE EQUITY DEBT — 16.9% | | | | |
| | | 250,000 | | Clear Guide Medical, Inc. - Convertible Note, 6.00%, 11/6/2023(a)(c)(d)(e)(i) | | | 250,000 | |
| | | 2,930,000 | | DSI Digital, LLC - Convertible Note, 8.00%, 3/23/2023(a)(b)(c)(d)(e)(f)(i) | | | 3,377,503 | |
| | | 2,820,000 | | Reach Enterprises, Inc. - Convertible Note, 8.00%, 4/29/2023(a)(b)(c)(d)(e)(f)(i) | | | 3,001,272 | |
| | | 2,500,000 | | Reach Enterprises, Inc. - Convertible Note, 12.00%, 10/1/2022(a)(b)(c)(d)(e)(f)(i) | | | 3,084,744 | |
| | | 125,000 | | Reach Enterprises, Inc. - Convertible Note, 12.00%, 10/1/2022(a)(b)(c)(d)(e)(f) | | | 125,000 | |
| | | 7,174 | | Reef Capital Partners, LLC - Series A Preferred Units, 8.00%, 12/28/2022 (a)(c)(e) | | | 7,173,809 | |
| | | 2,098,889 | | Sequin, Inc. - Convertible Note, 8.00%, 7/20/2023(a)(b)(c)(e)(f)(i) | | | 2,480,245 | |
| | | 250,000 | | Sequin, Inc. - Promissory Note, 12.00%, 3/20/2024(a)(c)(e) | | | 250,000 | |
| | | 2,033,611 | | The Work Shop Limited T/A RIP Global - Convertible Note, 12.00%, 1/20/2023(a)(b)(c)(e)(f)(i) | | | 2,096,541 | |
| | | 2,623,158 | | WG Pitts Caribbean, LLC - Promissory Note, 12.00%, 3/31/2023(a)(c)(d)(e)(f)(j) | | | 1,763,130 | |
| | | | | TOTAL PRIVATE EQUITY DEBT (Cost $22,017,541) | | | 23,602,244 | |
| | | | | | | | | |
| | | | | PRIVATE EQUITY FUNDS — 6.5% | | | | |
| | | — | | Abbott Secondary Opportunities LP(a)(b)(c)(e)(g)(h) | | | 1,005,283 | |
| | | — | | Auda Capital SCS SICAV SIF - Auda Asia Secondary Fund(a)(b)(c)(g)(h) | | | 2,468,312 | |
| | | — | | Committed Advisors Secondary Fund III(a)(b)(c)(g)(h) | | | 1,592,298 | |
| | | — | | EJF Sidecar Fund, Series LLC - Small Financial Equities Series(a)(b)(c)(g)(h) | | | 996,432 | |
| | | 10 | | GPB Automotive Portfolio LP(a)(b)(c)(e)(g) | | | 324,751 | |
| | | — | | Gravity Ranch Fund I LP(a)(b)(c)(e)(f)(g)(h) | | | 67,065 | |
| | | — | | Greenspring Opportunities V LP(a)(b)(c)(g)(h) | | | 1,162,865 | |
| | | — | | PineBridge Secondary Partners IV SLP(a)(b)(c)(g)(h) | | | 1,511,659 | |
| | | | | TOTAL PRIVATE EQUITY FUNDS (Cost $5,845,243) | | | 9,128,665 | |
| | | | | | | | | |
| | | | | PRIVATE REAL ESTATE INVESTMENTS — 6.1% | | | | |
| | | 95,075 | | ARCTRUST, Inc.(a)(c)(g) | | | 1,052,485 | |
| | | — | | Cygnus Property Fund V, LLC(a)(b)(c)(g) | | | 1,661,805 | |
| | | — | | Harbert Seniors Housing Fund I LP(a)(b)(c)(g) | | | 1,581,297 | |
See accompanying notes to financial statements.
9
Wildermuth Fund Schedule of Investments - Continued
March 31, 2022 |
| | Interests,
Shares,
Principal
Amount,
or Units | | | | Fair
Value | |
| | | | | PRIVATE REAL ESTATE INVESTMENTS (CONTINUED) | | | | |
| | | — | | Harbert Seniors Housing Fund II LP(a)(b)(c)(g) | | $ | 2,125,878 | |
| | | — | | RRA Credit Opportunity Fund LP(a)(b)(c)(d)(g) | | | 612,091 | |
| | | 56 | | Shopoff Land Fund III LP(a)(b)(c)(g) | | | 29,138 | |
| | | 277,892 | | Stonehill Strategic Hotel Credit Opportunity Fund II LP(a)(b)(c)(g) | | | 729,823 | |
| | | — | | Walton Street Real Estate Fund VIII LP(a)(b)(c)(g) | | | 663,487 | |
| | | | | TOTAL PRIVATE REAL ESTATE INVESTMENTS (Cost $5,810,021) | | | 8,456,004 | |
| | | | | | | | | |
| | | | | PUBLIC NON-TRADED REAL ESTATE INVESTMENT DEBT — 0.1% | | | | |
| | | 128,406 | | Cottonwood Communities, Inc. - Promissory Note, 7.00%, 1/1/2031(a)(c)(e) | | | 126,031 | |
| | | | | TOTAL PUBLIC NON-TRADED REAL ESTATE INVESTMENT DEBT (Cost $126,030) | | | 126,031 | |
| | | | | | | | | |
| | | | | PUBLIC NON-TRADED REAL ESTATE INVESTMENTS — 4.5% | | | | |
| | | 317,991 | | Cottonwood Communities, Inc. - Class A Common Stock(a)(c) | | | 6,242,926 | |
| | | | | TOTAL PUBLIC NON-TRADED REAL ESTATE INVESTMENTS (Cost $2,710,433) | | | 6,242,926 | |
| | | | | | | | | |
| | | | | WARRANTS — 0.5% | | | | |
| | | 44 | | Atlas Fintech Holdings Corp., Exercise Price $14,950, Expiration Date 12/30/2022(a)(b)(c)(e)(f) | | | — | |
| | | 1,442 | | Schweizer RSG, LLC, Exercise Price $112.50, Expiration Date 1/21/2028(a)(b)(c)(e)(f) | | | 1,846 | |
| | | 6,410 | | Sequin, Inc., Exercise Price $0.001, Expiration Date 3/30/2026(a)(b)(c)(e)(f) | | | — | |
| | | 646,328 | | Waratek, Ltd., Exercise Price 0.01 Euro, Expiration Date 1/22/2028(a)(b)(c)(d)(e)(f) | | | 722,073 | |
| | | | | TOTAL WARRANTS (Cost $0) | | | 723,919 | |
See accompanying notes to financial statements.
10
Wildermuth Fund Schedule of Investments - Continued
March 31, 2022 |
| | Interests,
Shares,
Principal
Amount,
or Units | | | | Fair
Value | |
| | | | | SHORT-TERM INVESTMENTS — 0.1% | | | | |
| | | 192,206 | | Fidelity Institutional Government Portfolio - Institutional Class, 0.12%(k) | | $ | 192,206 | |
| | | | | TOTAL SHORT-TERM INVESTMENTS (Cost $192,206) | | | 192,206 | |
| | | | | | | | | |
| | | | | TOTAL INVESTMENTS — 98.3% (Cost $99,850,600) | | | 137,338,589 | |
| | | | | Other assets less liabilities — 1.7% | | | 2,339,191 | |
| | | | | TOTAL NET ASSETS — 100.0% | | $ | 139,677,780 | |
LLC – Limited Liability Company
LP – Limited Partnership
REIT – Real Estate Investment Trust
SLP – Special Limited Partnership
(a) | Illiquid Security. As of March 31, 2022 these securities amounted to $136,318,420 representing 97.59% of total net assets. |
(c) | Restricted Security. As of March 31, 2022 these securities amounted to $136,318,420 representing 97.59% of total net assets. Please refer to Note 7, Investments in Restricted Securities, in the Notes to the Financial Statements. |
(d) | Denotes an investment in an affiliated entity. Please refer to Note 8, Investments in Affiliated Issuers, in the Notes to the Financial Statements. |
(e) | Level 3 security in accordance with fair value hierarchy. |
(f) | Security fair valued using method determined in good faith by the Fair Value Committee designated by the Board of Trustees. As of March 31, 2022 these securities amounted to $98,212,172 representing 70.31% of total net assets. |
(g) | Private Fund. As of March 31, 2022 these securities amounted to $21,119,513 representing 15.12% of total net assets. |
(h) | Private Investment Company. As of March 31, 2022 these securities amounted to $11,297,314 representing 8.09% of total net assets. |
(i) | Payment-in-kind (PIK) security in which the issuer makes interest payments in the form of additional securities, as opposed to cash payouts. These additional securities generally have the same terms as the original holdings. |
(j) | Security is in default. |
(k) | Represents the current rate as of March 31, 2022. |
See accompanying notes to financial statements.
11
Wildermuth Fund Statement of Assets and Liabilities As of March 31, 2022 |
Assets: | | | | |
Investments in unaffiliated issuers at fair value (cost $37,749,604) | | $ | 48,636,147 | |
Investments in affiliated issuers at fair value (cost $62,100,996) | | | 88,702,442 | |
Cash deposited with broker for written options contracts | | | 37,073 | |
Receivables: | | | | |
Investment securities sold | | | 667,750 | |
Dividends and interest | | | 1,652,556 | |
Fund shares sold | | | 44,145 | |
Return of capital | | | 274,216 | |
Prepaid expenses | | | 51,262 | |
Other assets | | | 80,000 | |
Total assets | | | 140,145,591 | |
| | | | | |
Liabilities: | | | | |
Payables: | | | | |
Investment Advisory fees | | | 94,249 | |
Professional fees | | | 138,130 | |
Shareholder servicing fees | | | 23,192 | |
Transfer agent fees and expenses | | | 13,988 | |
Fund accounting and administration fees | | | 46,858 | |
Custody fees | | | 4,940 | |
Distribution fees | | | 32,464 | |
Interest expense | | | 12,540 | |
Accrued other liabilities | | | 101,450 | |
Total liabilities | | | 467,811 | |
Commitments and contingencies (Note 10) | | | | |
Net Assets | | $ | 139,677,780 | |
| | | | | |
Net Assets Consist of: | | | | |
Paid in capital (unlimited shares authorized, 25,000,000 shares registered, no par value) | | | 94,542,595 | |
Total distributable earnings (loss) | | | 45,135,185 | |
Net Assets | | | 139,677,780 | |
| | | | | |
Net Assets: | | | | |
Class A | | | 59,090,789 | |
Class C | | | 51,627,231 | |
Class I | | | 28,959,760 | |
Net Assets | | $ | 139,677,780 | |
| | | | | |
Shares of Beneficial Interest Issued and Outstanding: | | | | |
Class A shares | | | 4,321,644 | |
Class C shares | | | 3,970,262 | |
Class I shares | | | 2,098,544 | |
Total Shares Outstanding | | | 10,390,450 | |
| | | | | |
Net Asset Value, Offering Price and Redemption Proceeds Per Share:(1) | | | | |
Class A | | $ | 13.67 | |
Class C(2) | | | 13.00 | |
Class I | | | 13.80 | |
Class A - Maximum offering price per share (Net asset value per share divided by 0.9425)(3) | | | 14.50 | |
(1) | Redemptions made within 90 days of purchase may be assessed a redemption fee of 2.00%. |
(2) | Class C Shares of the Fund are subject to a Contingent Deferred Sales Chare (“CDSC”) of 1.00% on any shares sold within 365 days of purchase. |
(3) | Reflects a maximum sales charge of 5.75%. |
See accompanying notes to financial statements.
12
Wildermuth Fund Statements of Operations |
| | | For the
period ended
March 31,
20221 | | | For the
year ended
December 31,
2021 | |
Investment Income: | | | | | | | | |
Dividends from unaffiliated issuers (net of foreign withholding taxes of $0 and $3,483, respectively) | | $ | 216,162 | | | $ | 2,067,228 | |
Dividends from affiliated issuers | | | 188,496 | | | | 640,187 | |
Interest from affiliated issuers | | | 112,974 | | | | 358,142 | |
Interest from unaffiliated issuers | | | 9,653 | | | | 373,081 | |
Total investment income | | | 527,285 | | | | 3,438,638 | |
| | | | | | | | | |
Expenses: | | | | | | | | |
Investment Advisory fees (see Note 4) | | | 518,713 | | | | 2,302,277 | |
Distribution fees - Class C | | | 95,284 | | | | 410,466 | |
Interest expense | | | 84,502 | | | | — | |
Legal fees | | | 71,511 | | | | 261,061 | |
Shareholder servicing fees - Class A & Class C | | | 68,754 | | | | 313,313 | |
Accounting and administration servicing fees | | | 65,998 | | | | 281,634 | |
Audit fees | | | 65,375 | | | | 127,000 | |
Printing and postage expenses | | | 49,620 | | | | 134,466 | |
Transfer agent fees | | | 41,807 | | | | 169,075 | |
Trustees’ fees | | | 40,000 | | | | 98,000 | |
Pricing and valuation service fees | | | 38,280 | | | | 143,106 | |
Registration fees | | | 18,215 | | | | 57,176 | |
Chief compliance officer fees | | | 17,872 | | | | 73,868 | |
Chief financial officer fees | | | 16,972 | | | | 65,912 | |
Insurance expense | | | 8,060 | | | | 29,350 | |
Miscellaneous expenses | | | 4,936 | | | | 27,042 | |
Custodian fees | | | 4,228 | | | | 19,515 | |
Total expenses | | | 1,210,127 | | | | 4,513,261 | |
Expenses waived by Adviser (see Note 4) | | | (183,517 | ) | | | (336,068 | ) |
Net expenses | | | 1,026,610 | | | | 4,177,193 | |
Net investment loss | | | (499,325 | ) | | | (738,555 | ) |
| | | | | | | | | |
| | | | | | | | | |
See accompanying notes to financial statements.
13
Wildermuth Fund Statements of Operations - Continued |
| | | For the
period ended
March 31,
20221 | | | For the
year ended
December 31,
2021 | |
Realized and Unrealized Gain (Loss) on Investments and foreign currency: | | | | | | | | |
Net realized gain (loss) on: | | | | | | | | |
Investments in unaffiliated issuers | | $ | 626,830 | | | $ | 7,105,294 | |
Investments in affiliated issuers | | | 0 | | | | 685,247 | |
Foreign currency transactions | | | (133,403 | ) | | | 771 | |
Distributions of realized gains by underlying unaffiliated investment companies | | | 0 | | | | 28 | |
Total net realized gain | | | 493,427 | | | | 7,791,340 | |
Net change in unrealized appreciation (depreciation) on: | | | | | | | | |
Investments in unaffiliated issuers | | | 1,033,369 | | | | 1,808,831 | |
Investments in affiliated issuers | | | 906,899 | | | | 391,744 | |
Foreign currency translations | | | (144 | ) | | | (663 | ) |
Total net change in unrealized appreciation | | | 1,940,124 | | | | 2,199,912 | |
Net realized and unrealized gain on investments and foreign currency | | | 2,433,551 | | | | 9,991,252 | |
| | | | | | | | | |
Net Increase (Decrease) in Net Assets Resulting from Operations | | $ | 1,934,226 | | | $ | 9,252,697 | |
1 | Reflects operations for the period from January 1, 2022 to March 31, 2022. On August 25, 2021 the Board of Trustees approved the change in fiscal year end from December 31st to March 31st. |
See accompanying notes to financial statements.
14
Wildermuth Fund Statements of Changes in Net Assets |
| | | For the
period ended
March 31,
20221 | | | For the
year ended
December 31,
2021 | | | For the
year ended
December 31,
2020 | |
Increase/(Decrease) in Net Assets From: | | | | | | | | | | | | |
Operations: | | | | | | | | | | | | |
Net investment loss | | $ | (499,325 | ) | | $ | (738,555 | ) | | $ | (1,803,230 | ) |
Net realized gain on investments and foreign currency | | | 493,427 | | | | 7,791,340 | | | | 65,478 | |
Net change in unrealized appreciation (depreciation) on investments and foreign currency | | | 1,940,124 | | | | 2,199,912 | | | | (285,211 | ) |
Net increase (decrease) in net assets resulting from operations | | | 1,934,226 | | | | 9,252,697 | | | | (2,022,963 | ) |
| | | | | | | | | | | | | |
Distributions to Shareholders: | | | | | | | | | | | | |
Distributions: | | | | | | | | | | | | |
Class A | | | — | | | | (3,522,460 | ) | | | (548,704 | ) |
Class C | | | — | | | | (3,033,245 | ) | | | (367,569 | ) |
Class I | | | — | | | | (1,628,440 | ) | | | (259,509 | ) |
Total: | | | — | | | | (8,184,145 | ) | | | (1,175,782 | ) |
From other sources (tax return of capital): | | | | | | | | | | | | |
Class A | | | (141,427 | ) | | | (578,043 | ) | | | — | |
Class C | | | (129,994 | ) | | | (460,119 | ) | | | — | |
Class I | | | (68,706 | ) | | | (225,185 | ) | | | — | |
Total: | | | (340,127 | ) | | | (1,263,347 | ) | | | — | |
Total distributions to shareholders | | | (340,127 | ) | | | (9,447,492 | ) | | | (1,175,782 | ) |
See accompanying notes to financial statements.
15
Wildermuth Fund Statements of Changes in Net Assets - Continued |
| | | For the
period ended
March 31,
20221 | | | For the
year ended
December 31,
2021 | | | For the
year ended
December 31,
2020 | |
Capital Share Transactions: | | | | | | | | | | | | |
Net proceeds from Class A shares sold | | $ | 581,475 | | | $ | 2,932,277 | | | $ | 9,432,390 | |
Net proceeds from Class C shares sold | | | 202,281 | | | | 1,280,866 | | | | 7,073,200 | |
Net proceeds from Class I shares sold | | | 1,472,908 | | | | 8,468,573 | | | | 6,223,460 | |
Reinvestment of distributions from Class A shares | | | 67,180 | | | | 1,980,231 | | | | — | |
Reinvestment of distributions from Class C shares | | | 100,945 | | | | 2,957,523 | | | | — | |
Reinvestment of distributions from Class I shares | | | 31,419 | | | | 1,114,740 | | | | — | |
Cost of Class A shares redeemed | | | (4,795,945 | ) | | | (19,119,406 | ) | | | (12,559,239 | ) |
Cost of Class C shares redeemed | | | (1,539,118 | ) | | | (7,927,337 | ) | | | (4,075,284 | ) |
Cost of Class I shares redeemed | | | (2,146,299 | ) | | | (9,218,101 | ) | | | (14,857,991 | ) |
Redemption fees | | | — | | | | — | | | | 7,243 | |
Capital contribution from affiliate | | | — | | | | — | | | | 280,320 | |
Net decrease from capital share transactions | | | (6,025,154 | ) | | | (17,530,634 | ) | | | (8,475,901 | ) |
| | | | | | | | | | | | | |
Net change in net assets | | | (4,431,055 | ) | | | (17,725,429 | ) | | | (11,674,646 | ) |
| | | | | | | | | | | | | |
Net Assets: | | | | | | | | | | | | |
Beginning of year | | | 144,108,835 | | | | 161,834,264 | | | | 173,508,910 | |
End of year | | $ | 139,677,780 | | | $ | 144,108,835 | | | $ | 161,834,264 | |
| | | | | | | | | | | | | |
Share Activity: | | | | | | | | | | | | |
Issuance of Class A shares | | | 42,792 | | | | 210,279 | | | | 731,889 | |
Issuance of Class C shares | | | 15,726 | | | | 96,546 | | | | 568,061 | |
Issuance of Class I shares | | | 107,835 | | | | 599,900 | | | | 482,244 | |
Class A shares reinvested | | | 4,965 | | | | 145,494 | | | | — | |
Class C shares reinvested | | | 7,850 | | | | 227,942 | | | | — | |
Class I shares reinvested | | | 2,300 | | | | 81,216 | | | | — | |
Class A shares redeemed | | | (357,327 | ) | | | (1,377,266 | ) | | | (935,430 | ) |
Class C shares redeemed | | | (120,032 | ) | | | (595,391 | ) | | | (314,287 | ) |
Class I shares redeemed | | | (158,750 | ) | | | (664,405 | ) | | | (1,099,207 | ) |
Net decrease in shares of beneficial interest outstanding | | | (454,641 | ) | | | (1,275,685 | ) | | | (566,730 | ) |
(1) | Reflects operations for the period from January 1, 2022 to March 31, 2022. On August 25, 2021 the Board of Trustees approved the change in fiscal year end from December 31st to March 31st. |
See accompanying notes to financial statements.
16
Wildermuth Fund Statement of Cash Flows |
| | | For the
period ended
March 31,
20221 | |
Cash flows from operating activities: | | | | |
Net increase in net assets from operations | | $ | 1,934,226 | |
Adjustments to reconcile net decrease in net assets resulting from operations to net cash used in operating activities: | | | | |
Purchases of investments | | | (2,124,019 | ) |
Sales of short term investments, net | | | 1,818,785 | |
Proceeds from sales of investments | | | 6,604,050 | |
Net realized gain from investments | | | (626,830 | ) |
Net realized loss from foreign currency transactions | | | 133,403 | |
Net unrealized appreciation on investments | | | (1,940,268 | ) |
Net unrealized depreciation on foreign currency translations | | | 144 | |
Return of capital and non-income distributions | | | 1,597,958 | |
| | | | | |
Changes in assets and liabilities | | | | |
(Increase)/Decrease in assets: | | | | |
Dividend and interest receivable | | | (198,914 | ) |
Return of capital receivable | | | (34,559 | ) |
Receivable for investment securities sold | | | (557,500 | ) |
Prepaid expenses | | | (29,569 | ) |
Increase/(Decrease) in liabilities: | | | | |
Payable to Investment Adviser | | | (47,903 | ) |
Payable for professional fees | | | 5,374 | |
Payable for shareholder servicing fees | | | (1,563 | ) |
Payable for fund accounting and administration fees | | | (754 | ) |
Payable for custody fees | | | (3,661 | ) |
Payables for transfer agent fees and expenses | | | (155 | ) |
Payable for distribution fees | | | (1,133 | ) |
Payable for interest expense | | | 12,540 | |
Accrued other liabilities | | | 3,321 | |
Net cash provided from operating activities | | | 6,542,973 | |
| | | | | |
Cash flows from financing activities: | | | | |
Proceeds from shares sold | | | 2,212,519 | |
Cost of shares redeemed, net of redemption fees | | | (8,481,362 | ) |
Cash distributions paid, net of reinvestment | | | (140,583 | ) |
Net cash used by financing activities | | | (6,409,426 | ) |
| | | | | |
Effects of foreign currency exchange rate changes in cash | | | (133,547 | ) |
| | | | | |
Net change in cash | | | — | |
| | | | | |
See accompanying notes to financial statements.
17
Wildermuth Fund Statement of Cash Flows - Continued |
| | | For the
period ended
March 31,
20221 | |
Cash and cash equivalents | | | | |
Cash at beginning of period | | $ | — | |
Foreign cash at beginning of period | | | — | |
Cash held at brokers at beginning of period | | | 37,073 | |
Total cash and cash equivalents at beginning of period | | | 37,073 | |
| | | | | |
Cash held at end of period | | | — | |
Foreign cash at end of period | | | — | |
Cash held at brokers at end of period | | | 37,073 | |
Total ending cash and cash equivalents at end of period | | $ | 37,073 | |
| | | | | |
Supplemental disclosure of non-cash activity: | | | | |
Reinvestment of distributions | | $ | 199,544 | |
1 | Reflects operations for the period from January 1, 2022 to March 31, 2022. On August 25, 2021 the Board of Trustees approved the change in fiscal year end from December 31st to March 31st. |
See accompanying notes to financial statements.
18
Wildermuth Fund Financial Highlights – Class A |
Per share income and capital changes for a share outstanding throughout each period.
| | For the
period ended
March 31,
2022(1) | | | For the
year ended
December 31,
2021 | | | For the
year ended
December 31,
2020(2) | | | For the
year ended
December 31,
2019(2) | | | For the
year ended
December 31,
2018(2) | | | For the
year ended
December 31,
2017(2) | |
Net asset value, beginning of period | | $ | 13.51 | | | $ | 13.52 | | | $ | 13.78 | | | $ | 12.69 | | | $ | 13.21 | | | $ | 11.81 | |
| | | | | | | | | | | | | | | | | | | | | | | | | |
Income from Investment Operations: | | | | | | | | | | | | | | | | | | | | | | | | |
Net investment income (loss)(3) | | | (0.04 | ) | | | (0.04 | ) | | | (0.12 | ) | | | (0.08 | ) | | | 0.06 | | | | (0.04 | ) |
Net realized and unrealized gain (loss) on investments | | | 0.23 | | | | 0.92 | | | | (0.05 | ) | | | 1.55 | | | | (0.23 | ) | | | 1.80 | |
Total from investment operations | | | 0.19 | | | | 0.88 | | | | (0.17 | ) | | | 1.47 | | | | (0.17 | ) | | | 1.76 | |
Less Distributions: | | | | | | | | | | | | | | | | | | | | | | | | |
From return of capital | | | (0.03 | ) | | | (0.11 | ) | | | — | | | | (0.38 | ) | | | (0.32 | ) | | | (0.18 | ) |
From net realized gains | | | — | | | | (0.78 | ) | | | (0.09 | ) | | | — | | | | (0.03 | ) | | | (0.18 | ) |
Total distributions | | | (0.03 | ) | | | (0.89 | ) | | | (0.09 | ) | | | (0.38 | ) | | | (0.35 | ) | | | (0.36 | ) |
Net asset value, end of period | | $ | 13.67 | | | $ | 13.51 | | | $ | 13.52 | | | $ | 13.78 | | | $ | 12.69 | | | $ | 13.21 | |
| | | | | | | | | | | | | | | | | | | | | | | | | |
Total return(4) | | | 1.43 | %(5) | | | 6.56 | % | | | (1.24 | )%(6) | | | 11.65 | %(7) | | | (1.38 | )% | | | 15.07 | % |
| | | | | | | | | | | | | | | | | | | | | | | | | |
Ratios and Supplemental Data: | | | | | | | | | | | | | | | | | | | | | | | | |
Net assets, end of period (in thousands) | | $ | 59,091 | | | $ | 62,555 | | | $ | 76,418 | | | $ | 80,692 | | | $ | 69,143 | | | $ | 61,568 | |
Gross expenses inclusive of interest expense(8)(9) | | | 3.27 | %(10) | | | 2.72 | % | | | 3.12 | % | | | 2.97 | % | | | 3.21 | % | | | 3.32 | % |
Net expenses inclusive of interest expense(8)(11) | | | 2.74 | %(10) | | | 2.50 | % | | | 2.50 | % | | | 2.50 | % | | | 2.50 | % | | | 2.50 | % |
Gross expenses exclusive of interest expense(8)(9) | | | 3.03 | %(10) | | | — | % | | | — | % | | | — | % | | | — | % | | | — | % |
Net expenses exclusive of interest expense(8)(11) | | | 2.50 | %(10) | | | — | % | | | — | % | | | — | % | | | — | % | | | — | % |
Ratio of net investment income (loss) to average net assets(8)(12) | | | (1.22 | )%(10) | | | (0.30 | )% | | | (0.85 | )% | | | (0.63 | )% | | | 0.45 | % | | | (0.35 | )% |
Portfolio turnover rate | | | 2 | %(5) | | | 11 | % | | | 32 | % | | | 29 | % | | | 31 | % | | | 51 | % |
(1) | Reflects operations for the period from January 1, 2022 to March 31, 2022. On August 25, 2021 the Board of Trustees approved the change in fiscal year end from December 31st to March 31st. |
(2) | Redemption fees consisted of per share amounts of less than $0.01. |
(3) | Per share amounts calculated using the average shares method. |
(4) | Total returns would have been lower had certain expenses not been waived or absorbed by the Adviser. Returns shown do not include payment of a maximum sales load of offering price. If the sales charge was included, total returns would be lower. In 2017, the maximum sales load was 6.00% through October 19, 2017. Effective October 20, 2017, the maximum sales load was changed to 5.75% of offering price. |
(6) | Total return would have been (1.39%) absent the Capital Contribution from the Adviser (see Note 4 in the annual report to shareholders dated December 31, 2020). |
(7) | Total return would have been 11.24% absent the Capital Contribution from the Adviser (see Note 4 in the annual report to shareholders dated December 31, 2019). |
(8) | The ratios of expenses and net investment income to average net assets do not reflect the Fund’s proportionate share of income and expenses of underlying investment companies in which the Fund invests. |
(9) | Represents the ratio of expenses to average net assets absent fee waivers and/or expense reimbursements. |
(11) | Represents the ratio of expenses to average net assets inclusive of fee waivers and/or expense reimbursements by the Adviser. |
(12) | Recognition of net investment income by the Fund is affected by the timing of the declaration of dividends by the underlying investment companies in which the Fund invests. |
See accompanying notes to financial statements.
19
Wildermuth Fund Financial Highlights – Class C |
Per share income and capital changes for a share outstanding throughout each period.
| | For the
period ended
March 31,
2022(1) | | | For the
year ended
December 31,
2021 | | | For the
year ended
December 31,
2020 | | | For the
year ended
December 31,
2019(2) | | | For the
year ended
December 31,
2018(2) | | | For the
year ended
December 31,
2017 | |
Net asset value, beginning of period | | $ | 12.86 | | | $ | 13.01 | | | $ | 13.37 | | | $ | 12.40 | | | $ | 13.02 | | | $ | 11.73 | |
| | | | | | | | | | | | | | | | | | | | | | | | | |
Income from Investment Operations: | | | | | | | | | | | | | | | | | | | | | | | | |
Net investment loss(3) | | | (0.06 | ) | | | (0.13 | ) | | | (0.21 | ) | | | (0.18 | ) | | | (0.02 | ) | | | (0.13 | ) |
Net realized and unrealized gain (loss) on investments | | | 0.23 | | | | 0.87 | | | | (0.06 | ) | | | 1.50 | | | | (0.25 | ) | | | 1.78 | |
Total from investment operations | | | 0.17 | | | | 0.74 | | | | (0.27 | ) | | | 1.32 | | | | (0.27 | ) | | | 1.65 | |
Less Distributions: | | | | | | | | | | | | | | | | | | | | | | | | |
From return of capital | | | (0.03 | ) | | | (0.11 | ) | | | — | | | | (0.35 | ) | | | (0.32 | ) | | | (0.18 | ) |
From net realized gains | | | — | | | | (0.78 | ) | | | (0.09 | ) | | | — | | | | (0.03 | ) | | | (0.18 | ) |
Total distributions | | | (0.03 | ) | | | (0.89 | ) | | | (0.09 | ) | | | (0.35 | ) | | | (0.35 | ) | | | (0.36 | ) |
Net asset value, end of period | | $ | 13.00 | | | $ | 12.86 | | | $ | 13.01 | | | $ | 13.37 | | | $ | 12.40 | | | $ | 13.02 | |
| | | | | | | | | | | | | | | | | | | | | | | | | |
Total return(4) | | | 1.35 | %(5) | | | 5.73 | % | | | (2.03 | )%(6) | | | 10.74 | %(7) | | | (2.18 | )% | | | 14.23 | % |
| | | | | | | | | | | | | | | | | | | | | | | | | |
Ratios and Supplemental Data: | | | | | | | | | | | | | | | | | | | | | | | | |
Net assets, end of period (in thousands) | | $ | 51,627 | | | $ | 52,299 | | | $ | 56,451 | | | $ | 54,614 | | | $ | 35,888 | | | $ | 18,435 | |
Gross expenses inclusive of interest expense(8)(9) | | | 4.02 | %(10) | | | 3.47 | % | | | 3.87 | % | | | 3.72 | % | | | 3.96 | % | | | 4.07 | % |
Net expenses inclusive of interest expense(8)(11) | | | 3.49 | %(10) | | | 3.25 | % | | | 3.25 | % | | | 3.25 | % | | | 3.25 | % | | | 3.25 | % |
Gross expenses exclusive of interest expense(8)(9) | | | 3.78 | %(10) | | | — | % | | | — | % | | | — | % | | | — | % | | | — | % |
Net expenses exclusive of interest expense(8)(11) | | | 3.25 | %(10) | | | — | % | | | — | % | | | — | % | | | — | % | | | — | % |
Ratio of net investment loss to average net assets(8)(12) | | | (1.97 | )%(10) | | | (1.00 | )% | | | (1.59 | )% | | | (1.40 | )% | | | (0.20 | )% | | | (1.08 | )% |
Portfolio turnover rate | | | 2 | %(5) | | | 11 | % | | | 32 | % | | | 29 | % | | | 31 | % | | | 51 | % |
(1) | Reflects operations for the period from January 1, 2022 to March 31, 2022. On August 25, 2021 the Board of Trustees approved the change in fiscal year end from December 31st to March 31st. |
(2) | Redemption fees consisted of per share amounts of less than $0.01. |
(3) | Per share amounts calculated using the average shares method. |
(4) | Total returns would have been lower had certain expenses not been waived or absorbed by the Adviser. Returns shown do not include payment of a Contingent Deferred Sales Charge (“CDSC”) of 1.00% on any shares sold within 365 days of purchase. If the sales charge was included, total returns would be lower. |
(6) | Total return would have been (2.18)% absent the Capital Contribution from the Adviser (see Note 4 in the annual report to shareholders dated December 31, 2020). |
(7) | Total return would have been 10.33% absent the Capital Contribution from the Adviser (see Note 4 in the annual report to shareholders dated December 31, 2019). |
(8) | The ratios of expenses and net investment income to average net assets do not reflect the Fund’s proportionate share of income and expenses of underlying investment companies in which the Fund invests. |
(9) | Represents the ratio of expenses to average net assets absent fee waivers and/or expense reimbursements. |
(11) | Represents the ratio of expenses to average net assets inclusive of fee waivers and/or expense reimbursements by the Adviser. |
(12) | Recognition of net investment income by the Fund is affected by the timing of the declaration of dividends by the underlying investment companies in which the Fund invests. |
See accompanying notes to financial statements.
20
Wildermuth Fund Financial Highlights – Class I |
Per share income and capital changes for a share outstanding throughout each period.
| | | For the
period ended
March 31,
2022(1) | | | For the
year ended
December 31,
2021 | | | For the
year ended
December 31,
2020(2) | | | For the
year ended
December 31,
2019 | | | For the
year ended
December 31,
2018 | | | For the
period ended
December 31,
2017(3) | |
Net asset value, beginning of period | | $ | 13.62 | | | $ | 13.60 | | | $ | 13.91 | | | $ | 12.79 | | | $ | 13.27 | | | $ | 12.26 | |
| | | | | | | | | | | | | | | | | | | | | | | | | |
Income from Investment Operations: | | | | | | | | | | | | | | | | | | | | | | | | |
Net investment income (loss)(4) | | | (0.03 | ) | | | 0.01 | | | | (0.09 | ) | | | (0.06 | ) | | | 0.17 | | | | 0.02 | |
Net realized and unrealized gain (loss) on investments | | | 0.24 | | | | 0.90 | | | | (0.13 | ) | | | 1.58 | | | | (0.31 | ) | | | 1.30 | |
Total from investment operations | | | 0.21 | | | | 0.91 | | | | (0.22 | ) | | | 1.52 | | | | (0.14 | ) | | | 1.32 | |
Less Distributions: | | | | | | | | | | | | | | | | | | | | | | | | |
From return of capital | | | (0.03 | ) | | | (0.11 | ) | | | — | | | | (0.41 | ) | | | (0.32 | ) | | | (0.13 | ) |
From net realized gains | | | — | | | | (0.78 | ) | | | (0.09 | ) | | | — | | | | (0.03 | ) | | | (0.18 | ) |
Total distributions | | | (0.03 | ) | | | (0.89 | ) | | | (0.09 | ) | | | (0.41 | ) | | | (0.35 | ) | | | (0.31 | ) |
Redemption Fees: | | | — | | | | — | | | | — | | | | 0.01 | | | | 0.01 | | | | — | |
Net asset value, end of period | | $ | 13.80 | | | $ | 13.62 | | | $ | 13.60 | | | $ | 13.91 | | | $ | 12.79 | | | $ | 13.27 | |
| | | | | | | | | | | | | | | | | | | | | | | | | |
Total return | | | 1.56 | %(5) | | | 6.74 | % | | | (1.58 | )%(6) | | | 12.06 | %(7) | | | (1.07 | )% | | | 10.87 | %(5) |
| | | | | | | | | | | | | | | | | | | | | | | | | |
Ratios and Supplemental Data: | | | | | | | | | | | | | | | | | | | | | | | | |
Net assets, end of period (in thousands) | | $ | 28,960 | | | $ | 29,255 | | | $ | 28,965 | | | $ | 38,203 | | | $ | 12,084 | | | $ | 283 | |
Gross expenses inclusive of interest expense(8)(9) | | | 3.02 | %(10) | | | 2.47 | % | | | 2.87 | % | | | 2.72 | % | | | 2.96 | % | | | 3.24 | %(10) |
Net expenses inclusive of interest expense(8)(11) | | | 2.49 | %(10) | | | 2.25 | % | | | 2.25 | % | | | 2.25 | % | | | 2.25 | % | | | 2.25 | %(10) |
Gross expenses exclusive of interest expense(8)(9) | | | 2.78 | %(10) | | | — | % | | | — | % | | | — | % | | | — | % | | | — | % |
Net expenses exclusive of interest expense(8)(11) | | | 2.25 | %(10) | | | — | % | | | — | % | | | — | % | | | — | % | | | — | % |
Ratio of net investment income (loss) to average net assets(8)(12) | | | (0.97 | )%(10) | | | 0.07 | % | | | (0.63 | )% | | | (0.42 | )% | | | 1.27 | % | | | 0.26 | %(10) |
Portfolio turnover rate | | | 2 | %(5) | | | 11 | % | | | 32 | % | | | 29 | % | | | 31 | % | | | 51 | %(5) |
(1) | Reflects operations for the period from January 1, 2022 to March 31, 2022. On August 25, 2021 the Board of Trustees approved the change in fiscal year end from December 31st to March 31st. |
(2) | Redemption fees consisted of per share amounts of less than $0.01. |
(3) | Reflects operations for the period from April 28, 2017 (inception date) to December 31, 2017. |
(4) | Per share amounts calculated using the average shares method. |
(6) | Total return would have been (1.80)% absent the Capital Contribution from the Adviser (see Note 4 in the annual report to shareholders dated December 31, 2020). |
(7) | Total return would have been 11.58% absent the Capital Contribution from the Adviser (see Note 4 in the annual report to shareholders dated December 31, 2019). |
(8) | The ratios of expenses and net investment income to average net assets do not reflect the Fund’s proportionate share of income and expenses of underlying investment companies in which the Fund invests. |
(9) | Represents the ratio of expenses to average net assets absent fee waivers and/or expense reimbursements. |
(11) | Represents the ratio of expenses to average net assets inclusive of fee waivers and/or expense reimbursements by the Adviser. |
(12) | Recognition of net investment income by the Fund is affected by the timing of the declaration of dividends by the underlying investment companies in which the Fund invests. |
See accompanying notes to financial statements.
21
Wildermuth Fund Notes to Financial Statements March 31, 2022 |
1. ORGANIZATION
Wildermuth Fund (the “Fund”) is registered under the Investment Company Act of 1940, as amended (the “1940 Act”), as a non-diversified, closed-end management investment company that is operated as an interval fund. The Fund was organized as a Delaware statutory trust on August 28, 2013 and did not have any operations from that date until December 31, 2014, other than those relating to organizational matters and registration of its shares under applicable securities law. The Fund commenced operations on January 2, 2015. The Fund’s investment objective is to seek total return through a combination of long-term capital appreciation and income generation. The Fund will pursue its objective by investing in assets that Wildermuth Advisory, LLC (the “Adviser”) believes will provide long-term capital appreciation and favorable risk-adjusted returns, as well as in income-producing assets that the Adviser believes will provide consistent income and, to an extent, liquidity.
The Fund is engaged in a continuous offering of shares of beneficial interest and operates as an interval fund that makes quarterly repurchase offers of shares at net asset value (“NAV”). The Fund currently offers three different classes of shares: Class A, Class C, and Class I shares. On August 25, 2021 the Board of Trustees (the “Board”) approved a change in the Fund’s fiscal year end from December 31st to March 31st.
2. SUMMARY OF SIGNIFICANT ACCOUNTING POLICIES
The following is a summary of significant accounting policies followed by the Fund in the preparation of its financial statements. These policies are in conformity with accounting principles generally accepted in the United States of America (“US GAAP”). The preparation of financial statements requires management to make estimates and assumptions that affect the reported amounts of assets and liabilities and disclosure of contingent assets and liabilities at the date of the financial statements and the reported amounts of income and expenses for the period. Actual results could differ from those estimates. The Fund is an investment company and follows the accounting and reporting requirements under Financial Accounting Standards Board (“FASB”) Accounting Standards (“ASC”) Topic 946, Financials Services – Investment Companies.
Investment Valuation – For purposes of determining the NAV of the Fund, and as applicable, readily marketable portfolio securities listed on the NYSE are valued, except as indicated below, at the last sale price reflected on the consolidated tape at the close of the NYSE on the business day as of which such value is being determined. If there has been no sale on such day, the securities are valued at the mean of the closing bid and asked prices on such day. If no bid or asked prices are quoted on such day or if market prices may be unreliable because of events occurring after the close of trading, then the security is valued by such method as the Fair Value Committee shall determine in good faith to reflect its fair market value. Readily marketable securities not listed on the NYSE but listed on other domestic or foreign securities exchanges are valued in a like manner. Portfolio securities traded on more than one securities exchange are valued at the last sale price on the business day as of which such value is being determined as reflected on the consolidated tape at the close of the exchange representing the principal market for such securities. Securities trading on NASDAQ are valued at the closing price, or, in the case of securities not reported by NASDAQ, a comparable source, as the Fair Value Committee deems appropriate to reflect their fair market value. If there has been no sale on such day, the securities are valued at the mean of the closing bid and asked prices for the day, or if no asked price is available, at the bid price. However, certain debt securities may be valued on the basis of prices provided by a pricing service based on broker or dealer supplied valuations or matrix pricing, a method of valuing securities by reference to the value of other securities with similar characteristics, such as rating, interest rate and maturity.
The “last reported” trade price or sale price or “closing” bid price of a security on any trading day shall be deemed to be: (a) with respect to securities traded primarily on the NYSE, the American Stock Exchange or NASDAQ, the last reported trade price or sale price, as the case may be, as of 4:00 p.m., Eastern Time, on that day, and (b) for securities listed, traded or quoted on any other exchange, market, system or service, the market price as of the end of the “regular hours” trading period that is generally accepted as such by such exchange, market, system or service. If, in the future, the benchmark times generally accepted in the securities industry for determining the market price of a stock as of a given trading day shall change from those set forth above, the fair market value of a security shall be determined as of such other generally accepted benchmark times.
Non-U.S. dollar denominated securities, if any, are valued as of the close of the NYSE at the closing price of such securities in their principal trading market, but may be valued at fair value if subsequent events occurring before the computation of NAV have materially affected the value of the securities. Trading may take place in foreign issues held by the Fund, if any, at times when the Fund is not open for business. As a result, the Fund’s NAV may change at times when it is not possible to purchase or sell shares of the Fund.
22
Wildermuth Fund Notes to Financial Statements - Continued
March 31, 2022 |
If market quotations are not readily available, securities are valued at fair values as determined in good faith by the Board . The Board has delegated the day-to-day responsibility for determining these fair values, in accordance with the policies it has approved, to the Fair Value Committee, subject to Valuation Committee and ultimately Board oversight. The Fair Value Committee will provide the Board with periodic reports, no less frequently than quarterly, that discuss the functioning of the valuation process, if applicable, to that period, and that identify issues and valuation problems that have arisen, if any. As appropriate, the Valuation Committee and the Board will review any securities valued by the Fair Value Committee in accordance with the Fund’s valuation policies during these periodic reports.
As a general matter, the fair value of the Fund’s interest in Investment Funds that are Commodity and Natural Resource Investments, Direct Real Estate, Hedge Funds, Private Equity Funds, and Private Real Estate Investments (“Non-Traded Funds”), will represent the amount that the Fund could reasonably expect to receive from the Non-Traded Fund if the Fund’s interest was redeemed at the time of valuation, based on information reasonably available at the time the valuation is made and that the Fund believes to be reliable. Investments in Non-Traded Funds are recorded at fair value, using the Non-Traded Fund’s net asset value as a practical expedient. Based on guidance provided by FASB, investments for which fair value is measured using the net asset value practical expedient are not required to be categorized in the fair value hierarchy. In the event a Non-Traded Fund does not report a value to the Fund on a timely basis, the Fair Value Committee, acting under the Valuation Committee and ultimately the Board’s supervision and pursuant to policies implemented by the Board, will determine the fair value of the Fund’s investment based on the most recent value reported by the Non-Traded Fund, as well as any other relevant information available at the time the Fund values its investments. Following procedures adopted by the Board, in the absence of specific transaction activity in a particular investment fund, the Fair Value Committee will consider whether it is appropriate, in light of all relevant circumstances, to value the Fund’s investment at the NAV reported by the Non-Traded Fund at the time of valuation or to adjust the value to reflect a fair value.
Public Non-Traded Real Estate Investments are valued at their most recent NAV, subject to review by the Fund’s Fair Value Committee. Generally, these investments are categorized as Level 2 investments in the fair value hierarchy, using the most recent NAV as an observable input. If the Fund’s Fair Value Committee adjusts the valuation from the NAV based on other unobservable inputs, the investment is categorized as a Level 3 investment in the fair value hierarchy.
Securities for which market quotations are not readily available (including restricted securities and private placements, if any) are valued at their fair value as determined in good faith under consistently applied procedures approved by the Board. Methodologies and factors used to fair value securities may include, but are not limited to, the analysis of current debt to cash flow, information of any recent sales, the analysis of the company’s financial statements, quotations or evaluated prices from broker-dealers, information obtained from the issuer or analysts and the nature of the existing market for securities with characteristics similar to such obligations. Valuations may be derived following a review of pertinent data (EBITDA, Revenue, etc.) from company financial statements, relevant market valuation multiples for comparable companies in comparable industries, recent transactions, and management assumptions. Investments in private equity debt instruments initially will be valued at cost (purchase price plus all related acquisition costs and expenses, such as legal fees and closing costs) and thereafter will be revalued quarterly at fair value based on payment history, market conditions, collateral of underlying debt and credit quality of borrower. The Fund may use fair value pricing for foreign securities if a material event occurs that may affect the price of a security after the close of the foreign market or exchange (or on days the foreign market is closed) but before the Fund prices its portfolio, generally at 4:00 p.m. Eastern Time. Fair value pricing may also be used for securities acquired as a result of corporate restructurings or reorganizations, as reliable market quotations for such issues may not be readily available. For securities valued in good faith, the value of an investment used to determine the Fund’s net asset value may differ from published or quoted prices for the same investment. The valuations for these good faith securities are monitored and reviewed in accordance with the methodologies described above by the Fund’s Fair Value Committee on an ongoing basis as information becomes available but are evaluated at least quarterly. The good faith security valuations and fair value methodologies are reviewed and approved by the Fund’s Board on a quarterly basis. There can be no assurance that the Fund could obtain the fair value assigned to an investment if it were to sell the investment at the same time which the Fund determines its net asset value per share.
US GAAP defines fair value, establishes a three-tier framework for measuring fair value based on a hierarchy of inputs, and expands disclosure about fair value measurements. It also provides guidance on determining when there has been a significant decrease in the volume and level of activity for an asset or liability, when a transaction is not orderly and how that information must be incorporated into a fair value measurement. The hierarchy distinguishes between market data obtained from independent sources (observable inputs) and the Fund’s own market assumptions (unobservable inputs). These inputs are used in determining the fair value of the Fund’s investments. These inputs are summarized in the three broad levels listed below:
| | ● | Level 1 – unadjusted quoted prices in active markets for identical securities. An active market for the security is a market in |
23
Wildermuth Fund Notes to Financial Statements - Continued
March 31, 2022 |
which transactions occur with sufficient frequency and volume to provide pricing information on an ongoing basis. A quoted price in an active market provides the most reliable evidence of fair value.
| | ● | Level 2 – other significant observable inputs (including quoted prices for similar securities, interest rates, prepayment speeds, credit risk, etc. and quoted prices for identical or similar assets in markets that are not active.) Inputs that are derived principally from or corroborated by observable market data. An adjustment to any observable input that is significant to the fair value may render the measurement a Level 3 measurement. |
| | ● | Level 3 – significant unobservable inputs, including the Fund’s own assumptions in determining the fair value of investments. |
The availability of observable inputs can vary from security to security and is affected by a wide variety of factors, including, for example, the type of security, whether the security is new and not yet established in the marketplace, the liquidity of markets, and other characteristics particular to the security. To the extent that valuation is based on models or inputs that are less observable or unobservable in the market, the determination of fair value requires more judgment. Accordingly, the degree of judgment exercised in determining fair value is greatest for instruments categorized in Level 3.
The inputs used to measure fair value may fall into different levels of the fair value hierarchy. In such cases, for disclosure purposes, the level in the fair value hierarchy within which the fair value measurement falls in its entirety is determined based on the lowest level input that is significant to the fair value measurement in its entirety.
The inputs or methodology used for valuing securities are not necessarily an indication of the risk associated with investing in those securities. The following is a summary of the valuation inputs, representing 100% of the Fund’s investments, used to value the Fund’s assets and liabilities as of March 31, 2022:
| | | | | | | Fair Value Measurements at the
End of the Reporting Period Using | | | | | |
Investment in Securities | | Practical
Expedient* | | | Level 1
Quoted Prices | | | Level 2
Other Significant
Observable Inputs | | | Level 3
Significant
Unobservable
Inputs | | | Total | |
Security Type | | | | | | | | | | | | | | | | | | | | |
Common Public Equities | | $ | — | | | $ | 471,827 | | | $ | — | | | $ | — | | | $ | 471,827 | |
Commodity & Natural Resource Investments | | | 1,314,231 | (1)(6)(7) | | | — | | | | — | | | | 4,163,692 | | | | 5,477,923 | |
Direct Private Equity | | | — | | | | — | | | | — | | | | 72,108,458 | | | | 72,108,458 | |
Direct Real Estate | | | 1,699,510 | (2)(6)(7) | | | — | | | | — | | | | 6,259,340 | | | | 7,958,850 | |
Hedge Funds | | | 2,493,400 | (3)(6)(7) | | | — | | | | — | | | | — | | | | 2,493,400 | |
Preferred Public Equities | | | — | | | | 356,136 | | | | — | | | | — | | | | 356,136 | |
Private Equity Debt | | | — | | | | — | | | | — | | | | 23,602,244 | | | | 23,602,244 | |
Private Equity Funds | | | 6,268,537 | (4)(6)(7) | | | — | | | | — | | | | 2,860,128 | | | | 9,128,665 | |
Private Real Estate Investments | | | 8,456,004 | (5)(6)(7) | | | — | | | | — | | | | — | | | | 8,456,004 | |
Public Non-Traded Real Estate Investment Debt | | | — | | | | — | | | | — | | | | 126,031 | | | | 126,031 | |
Public Non-Traded Real Estate Investments | | | — | | | | — | | | | 6,242,926 | | | | — | | | | 6,242,926 | |
Warrants | | | — | | | | — | | | | — | | | | 723,919 | | | | 723,919 | |
Short Term Investments | | | — | | | | 192,206 | | | | — | | | | — | | | | 192,206 | |
Total | | $ | 20,231,682 | | | $ | 1,020,169 | | | $ | 6,242,926 | | | $ | 109,843,812 | | | $ | 137,338,589 | |
* | Certain investments that are measured at fair value using the net asset value per share (or its equivalent) practical expedient have not been categorized in the fair value hierarchy. The fair value amounts presented in this table are intended to permit reconciliation of the fair value hierarchy to the amounts presented in the schedule of investments. |
24
Wildermuth Fund Notes to Financial Statements - Continued
March 31, 2022 |
The following footnotes represent the Fund’s investments, valued using net asset value as a practical expedient, and their attributes as of March 31, 2022. The investments listed are grouped by security type.
(1) | Security | Value | Unfunded Commitments | Withdrawals Permitted | Redemption Notice Period | Investment Objective | Investment Strategy | Lock Up Period | Remaining Life | Redemption Terms and Restrictions |
| | Kayne Anderson Energy Fund VII LP | 1,041,444 | 266,984 | Not Applicable | Not Applicable | Capital Gains | Purchase oil and gas companies; extraction and production companies. | N/A | Up to 7 years | Up to 7 years |
| | Midcon Holdco Partners, LLC | 272,787 | — | Not Applicable | Not Applicable | Capital Gains | Operating oil and gas company | N/A | Until Asset is Sold | No redemption rights |
| | | | | | | | | | | |
(2) | Security | Value | Unfunded Commitments | Withdrawals Permitted | Redemption Notice Period | Investment Objective | Investment Strategy | Lock Up Period | Remaining Life | Redemption Terms and Restrictions |
| | Brookwood SFL Investor Co-Investment Vehicle, LLC | 1,699,510 | — | Not Applicable | Not Applicable | Capital Gains and Current Income | Real Estate | N/A | Until Asset is Sold | No redemption rights |
| | | | | | | | | | | |
(3) | Security | Value | Unfunded Commitments | Withdrawals Permitted | Redemption Notice Period | Investment Objective | Investment Strategy | Lock Up Period | Remaining Life | Redemption Terms and Restrictions |
| | EJF Trust Preferred Fund LP | 27,207 | — | Not Applicable | Not Applicable | Capital Gains and Income | Event driven with focus on financials | 3 years | Up to 2 years | Up to 2 years |
| | iCapital Millennium Fund LP | 1,588,861 | — | Quarterly | Not Applicable | Capital Gains and Income | Multistrategy hedge fund | N/A | Open Ended | 5% quarterly tenders at the fund level with 90 days notice |
| | Rosebrook Opportunities Fund LP | 877,332 | 747,568 | Quarterly | Not Applicable | Capital Appreciation | Buying distressed hedge fund assets | N/A | Up to 4 years | Up to 4 years |
| | | | | | | | | | | |
(4) | Security | Value | Unfunded Commitments | Withdrawals Permitted | Redemption Notice Period | Investment Objective | Investment Strategy | Lock Up Period | Remaining Life | Redemption Terms and Restrictions |
| | Abbott Secondary Opportunities LP | 1,005,283 | 43,596 | Not Applicable | Not Applicable | Capital Gains | Purchase private equity funds on secondary market | Not Applicable | Up to 5 years | Up to 5 years |
| | Committed Advisors Secondary Fund III | 1,592,298 | 422,191 | Not Applicable | Not Applicable | Capital Gains | Private equity fund with a global focus | Not Applicable | Up to 7 years | Up to 7 years |
| | EJF Sidecar Fund, Series LLC - Small Financial Equities Series | 996,432 | — | Not Applicable | Not Applicable | Capital Gains and Dividends | Invests in equity of small depository institutions, including without limitation financial institutions that are impacted directly or indirectly by: (1) bank and thrift recapitalizations and/or restructurings; (2) merger and acquisition activity; and (3) government financial reform related policies. | Not Applicable | Up to 4 years | Up to 4 years |
25
Wildermuth Fund Notes to Financial Statements - Continued
March 31, 2022 |
(4) | Security | Value | Unfunded Commitments | Withdrawals Permitted | Redemption Notice Period | Investment Objective | Investment Strategy | Lock Up Period | Remaining Life | Redemption Terms and Restrictions |
| | Greenspring Opportunities V LP | 1,162,865 | 45,500 | Not Applicable | Not Applicable | Capital Appreciation | Direct investments in growth stage companies | Not Applicable | Up to 8 years | Up to 8 years |
| | PineBridge Secondary Partners IV SLP | 1,511,659 | 864,667 | Not Applicable | Not Applicable | Capital Appreciation | Private equity fund of funds | Not Applicable | Up to 8 years | Up to 8 years |
| | | | | | | | | | | |
(5) | Security | Value | Unfunded Commitments | Withdrawals Permitted | Redemption Notice Period | Investment Objective | Investment Strategy | Lock Up Period | Remaining Life | Redemption Terms and Restrictions |
| | ARCTRUST, Inc. | 1,052,485 | — | Annual | 30 days | Capital Appreciation and Income | Development, acquisition and financing of commercial properties | 3 years | Until Assets Are Sold | No redemption rights |
| | Cygnus Property Fund V, LLC | 1,661,805 | — | Not Applicable | Not Applicable | Capital Appreciation and Income | Distressed debt/special situation and opportunistic real estate investments. | Not Applicable | Up to 3 years | Up to 3 years |
| | Harbert Seniors Housing Fund I LP | 1,581,297 | 97,669 | Quarterly | Not Applicable | Capital Appreciation and Income | Real estate | Not Applicable | Up to 7 years | Up to 7 years |
| | Harbert Seniors Housing Fund II LP | 2,125,878 | 2,623,117 | Quarterly | Not Applicable | Capital Appreciation and Income | Real estate | Not Applicable | Up to 10 years | Up to 10 years |
| | RRA Credit Opportunity Fund LP | 612,091 | 1,571,694 | Not Applicable | Not Applicable | Current Income | Real estate backed lending | Not Applicable | Up to 2 years | Up to 2 years |
| | Shopoff Land Fund III LP | 29,138 | — | Not Applicable | Not Applicable | Capital Gains | Value added Real Estate | Not Applicable | Up to 2 years | Up to 2 years |
| | | | | | | | | | | |
(5) | Security | Value | Unfunded Commitments | Withdrawals Permitted | Redemption Notice Period | Investment Objective | Investment Strategy | Lock Up Period | Remaining Life | Redemption Terms and Restrictions |
| | Stonehill Strategic Hotel Credit Opportunity Fund II LP | 729,823 | — | Not Applicable | Not Applicable | Capital Appreciation and Income | Value added lending to hospitality assets | Not Applicable | Up to 5 years | Up to 5 years |
| | Walton Street Real Estate Fund VIII LP | 663,487 | 576,906 | Not Applicable | Not Applicable | Capital Gains | Value added Real Estate | Not Applicable | Up to 8 years | Up to 8 years |
(6) | Redemption frequency and redemption notice period reflect general redemption terms, and exclude liquidity restrictions. Different tranches may have different liquidity terms and may be subject to investor level gates. |
(7) | These investments are domiciled in the United States. |
26
Wildermuth Fund Notes to Financial Statements - Continued
March 31, 2022 |
The following is a roll forward of the activity in investments in which significant unobservable inputs (Level 3) were used in determining fair value on a recurring basis:
| | | Beginning
balance
January 1,
2022 | | | Transfers
into
Level 3
during the
period | | | Transfers
out of
Level 3
during the
period | | | Purchases or
Conversions | | | Sales or
Conversions | | | Net
realized
gain (loss) | | | Return of
Capital | | | Change
in net
unrealized
appreciation
(depreciation) | | | Ending
balance
March 31,
2022 | |
Commodity & Natural Resource Investments | | $ | 3,222,580 | | | $ | 863,738 | | | $ | — | | | $ | — | | | $ | — | | | $ | — | | | $ | — | | | $ | 77,374 | | | $ | 4,163,692 | |
Direct Private Equity | | | 72,106,889 | | | | — | | | | — | | | | — | | | | — | | | | — | | | | — | | | | 1,569 | | | | 72,108,458 | |
Direct Real Estate | | | 5,963,641 | | | | — | | | | — | | | | — | | | | — | | | | — | | | | — | | | | 295,699 | | | | 6,259,340 | |
Private Equity Debt | | | 22,659,171 | | | | — | | | | — | | | | 1,838,250 | | | | (872,500 | ) | | | — | | | | — | | | | (22,677 | ) | | | 23,602,244 | |
Private Equity Funds | | | 270,283 | | | | 2,468,312 | | | | — | | | | — | | | | — | | | | — | | | | — | | | | 121,533 | | | | 2,860,128 | |
Public Non-Traded Real Estate Investment Debt | | | 126,873 | | | | — | | | | — | | | | — | | | | (2,333 | ) | | | — | | | | (2,374 | ) | | | 3,865 | | | | 126,031 | |
Warrants | | | 727,253 | | | | — | | | | — | | | | — | | | | — | | | | — | | | | — | | | | (3,334 | ) | | | 723,919 | |
| | | $ | 105,076,690 | | | $ | 3,332,050 | | | $ | — | | | $ | 1,838,250 | | | $ | (874,833 | ) | | $ | — | | | $ | (2,374 | ) | | $ | 474,029 | | | $ | 109,843,812 | |
The change in net unrealized appreciation (depreciation) included in the Statement of Operations attributable to Level 3 investments that were held as of March 31, 2022 is $474,030.
The following is a summary of quantative information about significant unobservable valuation inputs determined by management for Level 3 Fair Value Measurements for investments held as of March 31, 2022:
Type of Level 3 Investment | | Fair Value as of March 31, 2022 | | | Valuation Technique | | | Unobservable Inputs | | | Range | | | Weighted Average | | | Impact to Valuation from an Increase in Input | |
Commodity & Natural Resource Investments | | $ | 3,299,954 | | | | Income Approach | | | | Discount Rate | | | | 15%-25% | | | | 20.00% | | | | Decrease | |
| | | | | | | | | | | | | | | | | | | | | | | | | |
Direct Real Estate | | | 350,078 | | | | Income Approach | | | | Discount Rate | | | | 18% | | | | 18.00% | | | | Decrease | |
| | | | 5,909,262 | | | | Market Approach | | | | Cap Rate | | | | 5.25-6.5 | | | | 6.05 | | | | Decrease | |
| | | | | | | | | | | | | | | | | | | | | | | | | |
Private Equity | | | | | | | | | | | | | | | | | | | | | | | | |
Direct Private Equity | | | 7,780,818 | | | | Guideline company comparison | | | | Projected revenue mulitple | | | | 0.38x | | | | 0.38x | | | | Increase | |
| | | | 17,248,345 | | | | | | | | CFY Revenue multiple | | | | 3.25x | | | | 3.25x | | | | Increase | |
| | | | 3,102,526 | | | | | | | | LTM Revenue multiple | | | | 4.25x | | | | 4.25x | | | | Increase | |
| | | | 3,141,446 | | | | | | | | Book Multiple | | | | 1.1x | | | | 1.1x | | | | Increase | |
| | | | 22,405,515 | | | | Probability-Weighted Expected Return Model | | | | Time to Liquidity | | | | 1.75-2.75 year | | | | 2.5 | | | | Decrease | |
| | | | | | | | | | | | Exit Multiple | | | | 8x-12x | | | | 10.0 | | | | Increase | |
| | | | | | | | | | | | Discount Rate | | | | 40% | | | | 40% | | | | Decrease | |
| | | | | | | | | | | | | | | | | | | | | | | | | |
| | | | 18,254,809 | | | | Guideline company comparison & Option pricing method | | | | Projected revenue mulitple | | | | 1.9x-6.5x | | | | 5.4 | | | | Increase | |
| | | | | | | | | | | | Time to Liquidity | | | | 2-3 | | | | 2.2 | | | | Decrease | |
| | | | | | | | | | | | Volatility | | | | 70% | | | | 70.0% | | | | Increase | |
| | | | | | | | | | | | Risk Free Rate | | | | .97%-2.28% | | | | 2.03% | | | | Decrease | |
| | | | | | | | | | | | | | | | | | | | | | | | | |
Private Equity Debt | | | 15,928,435 | | | | Income Approach | | | | Discount Rate | | | | 27.5% | | | | 27.50% | | | | Decrease | |
| | | | | | | | | | | | | | | | | | | | | | | | | |
27
Wildermuth Fund Notes to Financial Statements - Continued
March 31, 2022 |
Type of Level 3 Investment | | Fair Value as of March 31, 2022 | | | Valuation Technique | | | Unobservable Inputs | | | Range | | | Weighted Average | | | Impact to Valuation from an Increase in Input | |
Private Equity Funds | | $ | 67,065 | | | | Market Approach | | | | Discount Rate | | | | 45.00% | | | | 45.00% | | | | Decrease | |
| | | | | | | | | | | | | | | | | | | | | | | | | |
Warrants | | | 723,919 | | | | Guideline company comparison | | | | Projected revenue mulitple | | | | 6.5x | | | | 6.5x | | | | Increase | |
| | | | | | | | | | | | | | | | | | | | | | | | | |
| | | | | | | | Option pricing method | | | | Time to Liquidity | | | | 2.0 | | | | 2.0 | | | | Decrease | |
| | | | | | | | | | | | Volatility | | | | 70% | | | | 70% | | | | Increase | |
| | | | | | | | | | | | Risk Free Rate | | | | 2.28% | | | | 2.28% | | | | Decrease | |
The following is a summary of quantative information about significant unobservable valuation inputs not determined by management for Level 3 Fair Measurements for investments held as of March 31, 2022:
Type of Level 3 Investment | Fair Value as of March 31, 2022 | Valuation Technique |
Commodity & Natural Resource Investments | $ 863,738 | Quarterly Statements |
Direct Private Equity | 174,999 | Recent Transaction Value |
Private Equity Debt | 7,673,809 | Recent Transaction Value |
Private Equity Funds | 2,860,128 | Audited Financial Statements, Quarterly Statements |
Public Non-Traded Real Estate Investment Debt | 126,031 | Face Value |
Portfolio Investment Classification – The Company classifies its investments in accordance with the requirements of the 1940 Act. Under the 1940 Act, “Control Investments” are defined as investments in companies in which the Company owns more than 25% of the voting securities or maintains greater than 50% of the board representation. Under the 1940 Act, “Affiliated Investments” are defined as those non-control investments in companies in which the Company owns between 5% and 25% of the voting securities. Under the 1940 Act, “Non-affiliated Investments” are defined as investments that are neither Control Investments nor Affiliated Investments.
Security Transactions and Related Income – Security transactions are accounted for on trade date basis. Interest income is recognized on an accrual basis. Discounts are accreted and premiums are amortized on securities purchased over the lives of the respective securities. Dividend income is recorded on the ex-dividend date. Distributions from underlying investment companies are classified as investment income or realized gains based on the U.S. income tax characteristics of the distribution. Realized gains or losses from sales of securities are determined by comparing the identified cost of the security lot sold with the net sales proceeds.
Dividends and Distributions to Shareholders – Dividends from gross investment income are declared and distributed quarterly. Distributable net realized capital gains are declared and distributed annually. Dividends from gross investment income and distributions from net realized gains are recorded on ex- dividend date and determined in accordance with federal income tax regulations, which may differ from US GAAP. These “book/tax” differences are considered either temporary (i.e., deferred losses, capital loss carry forwards) or permanent in nature. To the extent these differences are permanent in nature, such amounts are reclassified within the composition of net assets based on their federal tax-basis treatment; temporary differences do not require reclassification.
Distributions received from investments in securities that represent a return of capital or capital gains are recorded as a reduction of cost of investment or as a realized gain, respectively. The calendar year-end amounts of ordinary income, capital gains, and return of capital included in distributions received from the Fund’s investments in real estate investment trusts (“REITs”) are reported to the Fund after the end of the calendar year; accordingly, the Fund estimates these amounts for accounting purposes until the characterization of REIT distributions is reported to the Fund after the end of the calendar year. Estimates are based on the most recent REIT distribution information available.
LIBOR Transition Risk – Certain of the Fund’s investments, payment obligations and financing terms may be based on floating rates, such as LIBOR, Euro Interbank Offered Rate and other similar types of reference rates (each, a “Reference Rate”). On July 27, 2017, the Chief Executive of the UK Financial Conduct Authority (“FCA”), which regulates LIBOR, announced that the FCA will no longer
28
Wildermuth Fund Notes to Financial Statements - Continued
March 31, 2022 |
persuade nor compel banks to submit rates for the calculation of LIBOR and certain other Reference Rates after 2021. Such announcement indicates that the continuation of LIBOR and other Reference Rates on the current basis cannot and will not be guaranteed after 2021. The transition away from Reference Rates may lead to increased volatility and illiquidity in markets that are tied to such Reference Rates and reduced values of Reference Rate-related instruments. This announcement and any additional regulatory or market changes that occur as a result of the transition away from Reference Rates may have an adverse impact on the Fund’s investments, performance or financial condition.
To the extent a Fund invests in securities that use the London Interbank Offer Rate (“LIBOR”) as the reference rate or benchmark, the full impact of the expected transition away from LIBOR is not certain. At the end of 2021, certain LIBORs were discontinued, but the most widely used LIBORs may continue to be provided on a representative basis until June 30, 2023. There remains uncertainty regarding the future use of LIBOR and the nature of any replacement or alternative rate. Certain debt securities and other instruments that reference LIBOR in which the Fund invests contain fallback provisions that could result in their reference rate becoming fixed at the last published LIBOR rate (effectively transforming to a fixed rate), which negatively impacts their value given the low interest rate environment. Furthermore, it is more difficult for issuers of asset-backed securities (or other securities issued by special purpose vehicles) to amend the terms of their securities to address the transition risk due to their structure.
Investment Companies – The Fund may obtain investment exposure to various asset classes by investing in other investment companies, including registered investment companies, such as exchange-traded funds, mutual funds and closed-end funds, as well as hedge funds, private equity funds or other privately offered pooled investment vehicles that are not registered under the 1940 Act (collectively “Investment Funds”). Each Investment Fund is subject to specific risks, depending on the nature of the fund. These risks could include liquidity risk, sector risk, and foreign currency risk, as well as risks associated with fixed income securities and commodities among others. Also, the Fund’s performance depends in part upon the performance of the Investment Fund managers and selected strategies, the adherence by such Investment Fund managers to such selected strategies, the instruments used by such Investment Fund managers and the Adviser’s ability to select Investment Funds and strategies and effectively allocate Fund assets among them. By investing in Investment Funds indirectly through the Fund, the investor bears asset-based fees at the Fund level, in addition to any asset-based fees and/or performance-based fees and allocations at the Investment Fund level. Moreover, an investor in the Fund bears a proportionate share of the fees and expenses of the Fund (including organizational and offering expenses, operating costs, sales charges, brokerage transaction expenses, and administrative fees) and, indirectly, similar expenses of the Investment Funds. Thus, an investor in the Fund may be subject to higher fees and operating expenses than if he or she invested in an Investment Fund directly.
Federal Income Taxes – It is the Fund’s policy to qualify as a regulated investment company by complying with the provisions of the Internal Revenue Code that are applicable to regulated investment companies and to distribute substantially all of its taxable income and net realized gains to shareholders. Therefore, no federal income tax provision has been recorded.
The Fund recognizes the tax benefits of uncertain tax positions only where the position is “more likely than not” to be sustained assuming examination by tax authorities. Management has analyzed the Fund’s tax positions, and has concluded that no liability for unrecognized tax benefits should be recorded related to uncertain tax positions taken or expected to be taken on returns filed for tax years open for the current and prior three years. The Fund identifies its major tax jurisdictions as U.S. federal, and foreign jurisdictions where the Fund makes significant investments; however, the Fund is not aware of any tax positions for which it is reasonably possible that the total amounts of unrecognized tax benefits will change materially in the next twelve months.
Redemption Fee – For shares held for 90 days or less, the Fund will deduct a 2% redemption fee from the redemption amount if the shares are sold pursuant to the Fund’s quarterly repurchase program. Shares held longest will be treated as being repurchased first and shares held shortest as being repurchased last. The redemption fee does not apply to shares that were acquired through reinvestment of distributions. Shares held for more than 90 days are not subject to the 2% fee. Redemption fees are paid to the Fund directly and are designed to offset costs associated with fluctuations in Fund asset levels and cash flow caused by short-term shareholder trading. For the period ended March 31, 2022, the Fund did not have any contributions to capital due to redemption fees.
Indemnification – The Fund indemnifies its officers and trustees for certain liabilities that may arise from the performance of their duties to the Fund. Additionally, in the normal course of business, the Fund enters into contracts that contain a variety of representations and warranties and which provide general indemnities. The Fund’s maximum exposure under these arrangements is unknown, as this would involve future claims that may be made against the Fund that have not yet occurred. However, based on industry experience, the risk of loss due to these warranties and indemnities appears to be remote.
29
Wildermuth Fund Notes to Financial Statements - Continued
March 31, 2022 |
Foreign Currency Translations – The accounting records of the Fund are maintained in U.S. dollars. All assets and liabilities denominated in foreign currencies are translated into U.S. dollars based on the rate of exchange of such currencies against U.S. dollars on the date of valuation. Purchases and sales of securities, income, and expenses are translated at the rate of exchange quoted on the respective date that such transactions are recorded. The Fund does not isolate that portion of the results of operations resulting from changes in foreign exchange rates on investments from the fluctuations arising from changes in market prices of securities held. Such fluctuations are included with the net realized and unrealized gain or loss from investments.
Reported net realized foreign exchange gains or losses arise from sales of portfolio securities, sales and maturities of short-term securities, sales of foreign currencies, currency gains or losses realized between the trade and settlement dates on securities transactions, and the difference between the amounts of dividends, interest, and foreign withholding taxes recorded on the Fund’s books and the U.S. dollar equivalent of the amounts actually received or paid. Net unrealized foreign exchange gains and losses arise from changes in the value of assets and liabilities other than investments in securities at each reporting period, resulting from changes in the exchange rate.
3. INVESTMENT TRANSACTIONS
The cost of purchases and proceeds from the sale of securities, other than short-term investments, for the period ended March 31, 2022, amounted to $2,124,019 and $6,604,050, respectively.
4. ADVISORY FEE AND FUND TRANSACTIONS
Advisory Fees – The Adviser is entitled to receive a monthly fee equal to the annual rate of 1.50% of the Fund’s average daily net assets. For the period ended March 31, 2022, the Adviser earned $518,713 in advisory fees.
Expense limitation agreement – The Adviser and the Fund have entered into an expense limitation and reimbursement agreement (the “Expense Limitation Agreement”) under which the Adviser has agreed contractually to waive its fees and to pay or absorb the direct, ordinary operating expenses of the Fund (including offering and organizational expenses but excluding front-end or contingent deferred loads, brokerage fees and commissions, acquired fund fees and expenses, borrowing costs (such as interest and dividend expenses on securities sold short), taxes and extraordinary expenses such as litigation), to the extent that they exceed 2.50%, 3.25%, and 2.25% per annum of the Fund’s average daily net assets attributable to Class A, Class C, and Class I shares (the “Expense Limitation”), respectively, through July 31, 2023. In consideration of the Adviser’s agreement to limit the Fund’s expenses, the Fund has agreed to repay the Adviser in the amount of any fees waived and Fund expenses paid or absorbed. Any waiver or reimbursement of fees by the Adviser is subject to repayment by the Fund within three years following such waiver or reimbursement; provided, however, that (i) the Fund is able to make such repayment without exceeding the expense limitation in place at the time the fees being repaid were waived or the Fund’s current expense limitation, whichever is lower, and (ii) such repayment is approved by the Fund’s Board of Trustees. The Expense Limitation Agreement will remain in effect for successive twelve-month periods provided that such continuance is specifically approved at least annually by the Board of Trustees. The Expense Limitation Agreement may be terminated only by the Fund’s Board on 60 days’ written notice to the Adviser. During the period ended March 31, 2022, the Adviser did not recoup any expenses. As of March 31, 2022, $560,478 is subject to recoupment through December 31, 2022, $925,074 through December 31, 2023, $336,068 through December 31, 2024, and $183,517 through March 31, 2025.
Distribution Agreement – The Board has approved a Co-Distribution Agreement (the “Agreement”). The Agreement provides that a monthly distribution fee is calculated at an annual rate equal to 0.75% of the Fund’s average daily net assets attributable to Class C. Class A and Class I shares are not currently subject to a distribution fee. For the period ended March 31, 2022, $95,284 had been incurred for Class C distribution fees.
Shareholder Services Plan – The Fund has adopted a Shareholder Services Plan and Agreement (the “Plan). The Plan provides that a monthly service fee is calculated at an annual rate equal to 0.25% of average daily net assets separately attributable to Class A and Class C shares. Class I shares are not included under the Plan and are not subject to a 0.25% average daily net asset fee. For the period ended March 31, 2022, Class A had incurred $36,993 in shareholder service fees and Class C had incurred $31,761.
30
Wildermuth Fund Notes to Financial Statements - Continued
March 31, 2022 |
Trustees – Each Independent Trustee receives an annual cash retainer of $30,000. The chairperson of the Valuation Committee and the chairperson of the Audit Committee each receives $1,250 additional compensation for each Committee meeting for which such person serves as chair of the meeting. Each independent trustee also receives a payment of $10,000 in Fund shares as part of the trustee’s total annual compensation. Mr. Wildermuth, Ms. Wildermuth or any of the executive officers will not receive compensation from the Fund.
5. FEDERAL TAX INFORMATION
At March 31, 2022, gross unrealized appreciation and depreciation on investments based on cost for federal income tax purposes were as follows:
Cost of investments | | $ | 97,162,478 | |
Gross unrealized appreciation | | $ | 50,513,944 | |
Gross unrealized depreciation | | | (10,337,833 | ) |
Net unrealized appreciation on investments | | $ | 40,176,111 | |
The difference between cost amounts for financial statement and federal income tax purposes is due primarily to timing differences in recognizing certain gains and losses in security transactions and investments in partnerships. GAAP requires that certain components of net assets be reclassified between financial and tax reporting. These reclassifications have no effect on net assets or net asset value per share. For the year ended December 31, 2021, permanent differences in book and tax accounting have been reclassified to paid-in capital and distributable earnings. These reclassifications relate primarily to the differing tax treatment of income from paydowns, net operating losses, distributions and income from partnership investments, and foreign currency gains and losses.
| | Increase (Decrease) | |
| | Paid in
Capital | | | Distributable
Earnings | |
| | $ | (4,964,985 | ) | | $ | 4,964,985 | |
The tax basis of distributable earnings as of December 31, 2021, the Fund’s last tax year, with unrealized appreciation on investments adjusted for activity through the Fund’s fiscal year ended March 31, 2022, shown below represent distribution requirements met by the Fund subsequent to the fiscal tax year end in order to satisfy income tax regulations and losses the Fund may be able to offset against income and gains realized in future years.
Undistributed ordinary income | | $ | — | |
Undistributed long-term capital gains | | | — | |
Accumulated earnings | | $ | — | |
| | | | | |
Accumulated capital and other losses | | | — | |
Net unrealized appreciation on investments | | | 38,235,843 | |
Net unrealized appreciation on foreign currency translations | | | 131 | |
| | | | | |
Total accumulated earnings/(deficit) | | $ | 38,235,974 | |
31
Wildermuth Fund Notes to Financial Statements - Continued
March 31, 2022 |
The tax character of distributions paid during the fiscal years ended December 31, 2021 and December 31, 2020 were as follows:
| | | 2021 | | | 2020 | |
Distributions paid from: | | | | | | | | |
Ordinary income | | $ | — | | | $ | — | |
Long-term capital gains | | | 8,184,145 | | | | 1,175,782 | |
Return of capital | | | 1,263,347 | | | | — | |
Total distributions paid | | $ | 9,447,492 | | | $ | 1,175,782 | |
6. REPURCHASE OFFERS
Pursuant to Rule 23c-3 under the Investment Company Act of 1940, as amended, the Fund offers shareholders on a quarterly basis the option of redeeming shares, at net asset value, of no less than 5% of the shares outstanding. There is no guarantee that shareholders will be able to sell all of the shares they desire in a quarterly repurchase offer, although each shareholder will have the right to require the Fund to purchase up to and including 5% of such shareholder’s shares in each quarterly repurchase. Limited liquidity will be provided to shareholders only through the Fund’s quarterly repurchases.
During the period ended March 31, 2022, the Fund completed one quarterly repurchase offers. The results of that repurchase offer were as follows:
Repurchase Pricing Date | | January 31, 2022 | |
% of Shares Offered - Total Fund | | | 5.00 | % |
Number of Shares Offered - Total Fund | | | 544,437 | |
Pricing Date Net Asset Value - Class A | | $ | 13.41 | |
Pricing Date Net Asset Value - Class C | | $ | 12.76 | |
Pricing Date Net Asset Value - Class I | | $ | 13.52 | |
Number of Shares Tendered - Class A | | | 1,480,876 | |
Number of Shares Tendered - Class C | | | 331,076 | |
Number of Shares Tendered - Class I | | | 735,136 | |
Number of Shares Repurchased - Class A | | | 315,386 | |
Number of Shares Repurchased - Class C | | | 70,301 | |
Number of Shares Repurchased - Class I | | | 158,750 | |
% of Shares Tendered - Total Fund | | | 23.39 | % |
% of Shares Repurchased - Total Fund | | | 5.00 | %* |
* | Repurchases were made on a pro-rata basis. |
32
Wildermuth Fund Notes to Financial Statements - Continued
March 31, 2022 |
7. INVESTMENTS IN RESTRICTED SECURITIES
Restricted securities include securities that have not been registered under the Securities Act of 1933, as amended, and securities that are subject to restrictions on resale. The Fund may invest in restricted securities that are consistent with the Fund’s investment objectives and investment strategies. Investments in restricted securities are valued at fair value as determined in good faith in accordance with procedures adopted by the Board of Trustees. It is possible that the estimated value may differ significantly from the amount that might ultimately be realized in the near term, and the difference could be material.
Additional information on each restricted security held by the Fund on March 31, 2022 is as follows:
Security | | Initial
Acquisition Date | | | Shares,
Principal Amount,
or Units | | | Cost | | | Fair
Value | | | % of
Net Assets | |
Abbott Secondary Opportunities LP | April 13, 2017 | | | — | | | $ | 1,040,056 | | | $ | 1,005,283 | | | | 0.72% | |
Affinity Beverages, LLC | February 21, 2020 | | | 41,751 | | | | 175,000 | | | | 174,999 | | | | 0.13% | |
ARCTRUST, Inc. | June 30, 2016 | | | 95,075 | | | | 874,935 | | | | 1,052,485 | | | | 0.74% | |
Atlas Fintech Holdings Corp. - Class A Share Interests | December 20, 2016 | | | 684 | | | | 3,126,329 | | | | 3,141,446 | | | | 2.25% | |
Atlas Fintech Holdings Corp., Exercise Price $14,950, Expiration Date 12/30/2022 | December 20, 2016 | | | 44 | | | | — | | | | — | | | | 0.00% | |
Auda Capital SCS SICAV SIF - Auda Asia Secondary Fund | April 2, 2018 | | | — | | | | 936,154 | | | | 2,468,312 | | | | 1.77% | |
Brookwood SFL Investor Co-Investment Vehicle, LLC | November 3, 2017 | | | — | | | | 580,181 | | | | 1,699,510 | | | | 1.22% | |
Casillas Petroleum Resource Partners, LLC | October 11, 2016 | | | 1,000 | | | | 1,000,000 | | | | 863,738 | | | | 0.62% | |
Clear Guide Medical, Inc. - Convertible Note, 6.00%, 11/6/2023 | January 6, 2022 | | | 250,000 | | | | 250,000 | | | | 250,000 | | | | 0.18% | |
Clear Guide Medical, Inc. - Series A Preferred Stock | April 19, 2016 | | | 2,500 | | | | 2,250,000 | | | | 3,731,385 | | | | 2.67% | |
Clear Guide Medical, Inc. - Series A-2 Preferred Stock | March 6, 2018 | | | 134,898 | | | | 500,000 | | | | 728,465 | | | | 0.52% | |
Clear Guide Medical, Inc. - Series A-3 Preferred Stock | July 16, 2018 | | | 838,423 | | | | 3,085,394 | | | | 4,222,021 | | | | 3.02% | |
Clearsense, LLC - Class C Preferred Shares | February 20, 2019 | | | 1,543,074 | | | | 6,799,865 | | | | 11,531,511 | | | | 8.26% | |
Clearsense, LLC - Class D Preferred Shares | April 28, 2021 | | | 835,814 | | | | 3,000,000 | | | | 5,716,834 | | | | 4.09% | |
CM Funding, LLC | December 14, 2018 | | | 1,976,034 | | | | 1,976,034 | | | | 1,577,560 | | | | 1.13% | |
Committed Advisors Secondary Fund III | March 30, 2017 | | | — | | | | 793,754 | | | | 1,592,298 | | | | 1.14% | |
Content Management Live, LLC | December 17, 2019 | | | 298,200 | | | | 298,200 | | | | 60,000 | | | | 0.04% | |
Cottonwood Communities, Inc. - Class A Common Stock | June 2, 2021 | | | 317,991 | | | | 2,710,433 | | | | 6,242,926 | | | | 4.47% | |
Cottonwood Communities, Inc. - Promissory Note, 7.00%, 1/1/2031 | June 22, 2021 | | | 128,406 | | | | 126,030 | | | | 126,031 | | | | 0.09% | |
33
Wildermuth Fund Notes to Financial Statements - Continued
March 31, 2022 |
Security | | Initial
Acquisition Date | | | Shares,
Principal Amount,
or Units | | | Cost | | | Fair
Value | | | % of
Net Assets | |
Cygnus Property Fund V, LLC | October 30, 2018 | | | — | | | $ | 668,648 | | | $ | 1,661,805 | | | | 1.19% | |
Dog Wood Park of Northeast Florida, LLC | March 21, 2017 | | | 439,716 | | | | 382,000 | | | | 350,078 | | | | 0.25% | |
DSI Digital, LLC - Common Units | April 26, 2021 | | | 2,074,115 | | | | 1,000,000 | | | | 3,169,466 | | | | 2.27% | |
DSI Digital, LLC - Convertible Note, 8.00%, 3/23/2023 | March 24, 2021 | | | 2,930,000 | | | | 2,930,000 | | | | 3,377,503 | | | | 2.42% | |
DSI Digital, LLC - Series A Convertible Preferred Units | November 29, 2017 | | | 5,791,621 | | | | 8,560,000 | | | | 10,554,178 | | | | 7.55% | |
EJF Sidecar Fund, Series LLC - Small Financial Equities Series | October 25, 2017 | | | — | | | | 614,376 | | | | 996,432 | | | | 0.71% | |
EJF Trust Preferred Fund LP | August 23, 2017 | | | — | | | | — | | | | 27,207 | | | | 0.02% | |
GPB Automotive Portfolio LP | March 13, 2015 | | | 10 | | | | 500,000 | | | | 324,751 | | | | 0.23% | |
Gravity Ranch Fund I LP | June 13, 2017 | | | — | | | | 500,000 | | | | 67,065 | | | | 0.05% | |
Greenspring Opportunities V LP | January 18, 2018 | | | — | | | | 520,000 | | | | 1,162,865 | | | | 0.83% | |
Harbert Seniors Housing Fund I LP | February 24, 2017 | | | — | | | | 1,202,197 | | | | 1,581,297 | | | | 1.13% | |
Harbert Seniors Housing Fund II LP | September 10, 2019 | | | — | | | | 2,350,556 | | | | 2,125,878 | | | | 1.52% | |
iCapital Millennium Fund LP | December 20, 2018 | | | — | | | | 1,000,000 | | | | 1,588,861 | | | | 1.14% | |
Kayne Anderson Energy Fund VII LP | September 12, 2016 | | | — | | | | 1,918,230 | | | | 1,041,444 | | | | 0.74% | |
LaGrange Senior Living, LLC - Class A Interests | September 11, 2019 | | | 1,800,000 | | | | 1,800,000 | | | | 2,109,116 | | | | 1.51% | |
Level ATI HoldCo, LLC - Class A | September 10, 2018 | | | — | | | | 1,690,000 | | | | 3,102,526 | | | | 2.22% | |
Metro Diner, LLC - Series B Units | November 16, 2017 | | | 3,500,000 | | | | 2,276,542 | | | | 2,345,745 | | | | 1.68% | |
Metro Diner, LLC - Series II Common Units | November 16, 2017 | | | 1,880,968 | | | | 1,223,458 | | | | 1,116,265 | | | | 0.80% | |
Midcon Holdco Partners, LLC | December 29, 2020 | | | 182 | | | | 181,858 | | | | 272,787 | | | | 0.20% | |
PineBridge Secondary Partners IV SLP | September 19, 2017 | | | — | | | | 940,903 | | | | 1,511,659 | | | | 1.08% | |
Polara Builder II, LLC | December 26, 2019 | | | — | | | | 1,711,558 | | | | 3,800,146 | | | | 2.72% | |
Reach Enterprises, Inc. - Common Units | August 8, 2019 | | | 8,800,000 | | | | 2,758,800 | | | | 6,083,101 | | | | 4.36% | |
Reach Enterprises, Inc. - Convertible Note, 8.00%, 4/29/2023 | April 30, 2021 | | | 2,820,000 | | | | 2,820,000 | | | | 3,001,272 | | | | 2.15% | |
Reach Enterprises, Inc. - Convertible Note, 12.00%, 10/1/2022 | October 2, 2020 | | | 2,500,000 | | | | 2,500,000 | | | | 3,084,744 | | | | 2.21% | |
Reach Enterprises, Inc. - Convertible Note, 12.00%, 10/1/2022 | March 29, 2022 | | | 125,000 | | | | 125,000 | | | | 125,000 | | | | 0.09% | |
Reach Enterprises, Inc. - Series Seed-1 Preferred Units | August 5, 2020 | | | 309,150 | | | | 458,001 | | | | 316,982 | | | | 0.23% | |
34
Wildermuth Fund Notes to Financial Statements - Continued
March 31, 2022 |
Security | | Initial
Acquisition Date | | | Shares,
Principal Amount,
or Units | | | Cost | | | Fair
Value | | | % of
Net Assets | |
Reach Enterprises, Inc. - Series Seed-2 Preferred Units | July 15, 2020 | | | 1,288,103 | | | $ | 1,526,647 | | | $ | 1,320,735 | | | | 0.95% | |
Reef Capital Partners, LLC - Series A Preferred Units, 8.00%, 12/28/2022 | December 28, 2020 | | | 7,174 | | | | 6,812,923 | | | | 7,173,809 | | | | 5.14% | |
Rosebrook Opportunities Fund LP | February 2, 2017 | | | — | | | | 1,083,242 | | | | 877,332 | | | | 0.63% | |
RRA Credit Opportunity Fund LP | December 12, 2017 | | | — | | | | 14,214 | | | | 612,091 | | | | 0.44% | |
Schweizer RSG, LLC, Exercise Price $112.50, Expiration Date 1/21/2028 | February 6, 2018 | | | 1,442 | | | | — | | | | 1,846 | | | | 0.00% | |
Sequin, Inc. - Convertible Note, 8.00%, 7/20/2023 | July 22, 2020 | | | 2,098,889 | | | | 2,098,889 | | | | 2,480,245 | | | | 1.78% | |
Sequin, Inc. - Promissory Note, 12.00%, 3/20/2024 | March 31, 2021 | | | 250,000 | | | | 250,000 | | | | 250,000 | | | | 0.18% | |
Sequin, Inc., Exercise Price $0.001, Expiration Date 3/30/2026 | March 31, 2021 | | | 6,410 | | | | — | | | | — | | | | 0.00% | |
Shopoff Land Fund III LP | April 28, 2015 | | | 56 | | | | 40,203 | | | | 29,138 | | | | 0.02% | |
Stonehill Strategic Hotel Credit Opportunity Fund II LP | July 18, 2016 | | | 277,892 | | | | 277,892 | | | | 729,823 | | | | 0.52% | |
The Work Shop Limited T/A RIP Global - Convertible Note, 12.00%, 1/20/2023 | July 22, 2020 | | | 2,033,611 | | | | 2,033,611 | | | | 2,096,541 | | | | 1.50% | |
Thunder Investment Partners, LLC | November 2, 2018 | | | 2,080,000 | | | | 2,080,000 | | | | 1,722,394 | | | | 1.23% | |
Walton Street Real Estate Fund VIII LP | May 24, 2017 | | | — | | | | 381,376 | | | | 663,487 | | | | 0.47% | |
Waratek, Ltd. - Common Shares | November 24, 2021 | | | 7,627,254 | | | | 3,191,374 | | | | 8,590,687 | | | | 6.15% | |
Waratek, Ltd. - Series B-1 | June 5, 2018 | | | 635,838 | | | | 2,990,569 | | | | 2,691,274 | | | | 1.93% | |
Waratek, Ltd. - Series B-2 | December 28, 2017 | | | 756,826 | | | | 3,696,940 | | | | 3,510,838 | | | | 2.51% | |
Waratek, Ltd., Exercise Price 0.01 Euro, Expiration Date 1/22/2028 | June 5, 2018 | | | 646,328 | | | | — | | | | 722,073 | | | | 0.52% | |
WG Pitts Caribbean, LLC - Common Units | October 12, 2018 | | | — | | | | 426,040 | | | | — | | | | 0.00% | |
WG Pitts Caribbean, LLC - Promissory Note, 12.00%, 3/31/2023 | August 14, 2020 | | | 2,623,158 | | | | 2,197,118 | | | | 1,763,130 | | | | 1.26% | |
| | | | | | | | | | | $ | 99,255,530 | | | $ | 136,318,420 | | | | | |
35
Wildermuth Fund Notes to Financial Statements - Continued
March 31, 2022 |
8. INVESTMENTS IN AFFILIATED ISSUERS
Issuers that are considered affiliates, as defined in Section 2(a)(3) of the 1940 Act, of the Fund at period-end are noted in the Fund’s Schedule of Investments. The table below reflects transactions during the period with entities that are affiliates as of March 31, 2022 and may include acquisitions of new investments, prior year holdings that became affiliated during the period, and prior period affiliated holdings that are no longer affiliated as of period-end.
Security Description | | Beginning
balance
January 1,
2022 | | | Purchases or
Conversions | | | Sales or
Conversions | | | Change in
Unrealized
Appreciation
(Depreciation) | | | Net Realized
Gain (Loss) | | | Tax Basis
or Return
of Capital
Adjustments | | | Ending Value
March 31,
2022 | | | Investment
Income | |
| | | | | | | | | | | | | | | | | | | | | | | | | | | | | | | | | |
Clear Guide Medical, Inc. - Convertible Note, 6.00%, 11/6/2023(1) | | $ | — | | | $ | 250,000 | | | $ | — | | | $ | — | | | $ | — | | | $ | — | | | $ | 250,000 | | | $ | 3,452 | |
Clear Guide Medical, Inc.- Series A Preferred Stock(1) | | | 3,511,445 | | | | — | | | | — | | | | 219,940 | | | | — | | | | — | | | | 3,731,385 | | | | — | |
Clear Guide Medical, Inc. - Series A-2 Preferred Stock(1) | | | 688,795 | | | | — | | | | — | | | | 39,670 | | | | — | | | | — | | | | 728,465 | | | | — | |
Clear Guide Medical, Inc. - Series A-3 Preferred Stock(1) | | | 3,989,009 | | | | — | | | | — | | | | 233,012 | | | | — | | | | — | | | | 4,222,021 | | | | — | |
Clearsense, LLC - Class C Preferred Shares | | $ | 11,811,728 | | | | — | | | | — | | | | (280,217 | ) | | | — | | | | — | | | | 11,531,511 | | | | — | |
Clearsense, LLC - Class D Preferred Shares | | | 5,479,692 | | | | — | | | | — | | | | 237,142 | | | | — | | | | — | | | | 5,716,834 | | | | — | |
CM Funding, LLC(1) | | | 1,499,040 | | | | — | | | | — | | | | 78,520 | | | | — | | | | — | | | | 1,577,560 | | | | — | |
Content Management Live, LLC(1) | | | 60,000 | | | | — | | | | — | | | | — | | | | — | | | | — | | | | 60,000 | | | | — | |
Dog Wood Park of Northeast Florida, LLC | | | 430,899 | | | | — | | | | — | | | | (80,821 | ) | | | — | | | | — | | | | 350,078 | | | | — | |
DSI Digital, LLC - Common Units(1) | | | 3,038,110 | | | | — | | | | — | | | | 131,356 | | | | — | | | | — | | | | 3,169,466 | | | | — | |
DSI Digital, LLC - Convertible Note, 8.00%, 3/23/2023(1) | | | 2,583,350 | | | | 750,000 | | | | — | | | | 44,153 | | | | — | | | | — | | | | 3,377,503 | | | | — | |
DSI Digital, LLC - Series A Convertible Preferred Units(1) | | $ | 10,243,242 | | | | — | | | | — | | | | 310,936 | | | | — | | | | — | | | | 10,554,178 | | | | — | |
LaGrange Senior Living, LLC - Class A Interests(1) | | | 2,136,116 | | | | — | | | | — | | | | (27,000 | ) | | | — | | | | — | | | | 2,109,116 | | | | 53,260 | |
Level ATI HoldCo, LLC - Class A(1) | | | 3,102,526 | | | | — | | | | — | | | | — | | | | — | | | | — | | | | 3,102,526 | | | | — | |
Polara Builder II, LLC(1) | | | 3,396,626 | | | | — | | | | — | | | | 403,520 | | | | — | | | | — | | | | 3,800,146 | | | | 42,203 | |
Reach Enterprises, Inc. - Convertible Note, 8.00%, 4/29/2023(1) | | | 2,499,500 | | | | 395,000 | | | | — | | | | 106,772 | | | | — | | | | — | | | | 3,001,272 | | | | — | |
Reach Enterprises, Inc. - Convertible Note, 12.00%, 10/1/2022(1) | | | 2,962,500 | | | | — | | | | — | | | | 122,244 | | | | — | | | | — | | | | 3,084,744 | | | | — | |
Reach Enterprises, Inc. - Convertible Note, 12.00%, 10/1/2022(1) | | | — | | | | 125,000 | | | | — | | | | — | | | | — | | | | — | | | | 125,000 | | | | — | |
Reach Enterprises, Inc. - Common Units(1) | | | 6,542,106 | | | | — | | | | — | | | | (459,005 | ) | | | — | | | | — | | | | 6,083,101 | | | | — | |
Reach Enterprises, Inc. - Series Seed-1 Preferred Units (1) | | | 336,618 | | | | — | | | | — | | | | (19,636 | ) | | | — | | | | — | | | | 316,982 | | | | — | |
Reach Enterprises, Inc. - Series Seed-2 Preferred Units (1) | | | 1,402,551 | | | | — | | | | — | | | | (81,816 | ) | | | — | | | | — | | | | 1,320,735 | | | | — | |
Rosebrook Opportunities Fund LP(1) | | | 823,417 | | | | — | | | | — | | | | 53,915 | | | | — | | | | — | | | | 877,332 | | | | — | |
RRA Credit Opportunity Fund LP | | | 1,033,996 | | | | — | | | | — | | | | 36,848 | | | | — | | | | (458,753 | ) | | | 612,091 | | | | — | |
Thunder Investment Partners, LLC(1) | | | 1,723,540 | | | | — | | | | — | | | | (1,146 | ) | | | — | | | | — | | | | 1,722,394 | | | | 93,033 | |
Waratek, Ltd. - Common Shares(1) | | | 8,630,170 | | | | — | | | | — | | | | (39,483 | ) | | | — | | | | — | | | | 8,590,687 | | | | — | |
Waratek, Ltd. - Series B-1(1) | | | 2,805,116 | | | | — | | | | — | | | | (113,842 | ) | | | — | | | | — | | | | 2,691,274 | | | | — | |
Waratek, Ltd. - Series B-2(1) | | | 3,564,728 | | | | — | | | | — | | | | (53,890 | ) | | | — | | | | — | | | | 3,510,838 | | | | — | |
Waratek, Ltd., Exercise Price 0.01 Euro, Expiration Date 1/22/2028(1) | | | 725,407 | | | | — | | | | — | | | | (3,334 | ) | | | — | | | | — | | | | 722,073 | | | | — | |
WG Pitts Caribbean, LLC - Common Units(1) | | | — | | | | — | | | | — | | | | — | | | | — | | | | — | | | | — | | | | — | |
WG Pitts Caribbean, LLC - Promissory Note, 12.00%, 3/31/2023(1) | | | 1,714,069 | | | | — | | | | — | | | | 49,061 | | | | — | | | | — | | | | 1,763,130 | | | | 77,617 | |
WG Pitts Caribbean, LLC - Promissory Note, 14.00%, 3/31/2022(1) | | | 400,000 | | | | — | | | | (400,000 | ) | | | — | | | | — | | | | — | | | | — | | | | 13,655 | |
36
Wildermuth Fund Notes to Financial Statements - Continued
March 31, 2022 |
Security Description | | Beginning
balance
January 1,
2022 | | | Purchases or
Conversions | | | Sales or
Conversions | | | Change in
Unrealized
Appreciation
(Depreciation) | | | Net Realized
Gain (Loss) | | | Tax Basis
or Return
of Capital
Adjustments | | | Ending Value
March 31,
2022 | | | Investment
Income | |
WG Pitts Caribbean, LLC - Promissory Note, 0.00%, 1/14/2022(1) | | $ | 154,250 | | | $ | 300,000 | | | $ | (472,500 | ) | | $ | — | | | $ | — | | | $ | 18,250 | | | $ | — | | | $ | 18,250 | |
| | | $ | 87,288,546 | | | $ | 1,820,000 | | | $ | (872,500 | ) | | $ | 906,899 | | | $ | — | | | $ | (440,503 | ) | | $ | 88,702,442 | | | $ | 301,470 | |
(1) | Affiliated investments for which ownership exceeds 25% of the Investee’s Capital. |
9. OFFERING PRICE PER SHARE
Class A shares are offered subject to a maximum sales charge of 5.75% of the offering price, while Class C shares and Class I shares are not subject to a sales charge. Class C shares are subject to a 1% contingent deferred sales charges on shares redeemed during the first 365 days after purchase, while Class A shares and Class I shares are not subject to a contingent deferred sales charge. For the period ended March 31, 2022, the various broker dealers received $179,117 in underwriting commissions for sales of shares. For the period ended March 31, 2022, contingent deferred sales charges in the amount of $18,029 were applied to Class C shareholders.
10. COMMITMENTS
The Fund is required to provide financial support in the form of investment commitments to certain investees as part of the conditions for entering into such investments. As of March 31, 2022, the Fund had unfunded commitments in the amount of $7,629,616. The Adviser monitors capital call activity and regularly reviews the Fund’s cash position. In the event the Fund receives a capital call in excess of the Fund’s cash position and the Fund has not received enough incoming shareholder subscriptions to meet the capital call requirement, the Adviser would liquidate public security positions held in the Fund’s portfolio to satisfy the capital commitment. Below is a summary of unfunded commitments per security.
Investment | | Total Commitment | | | Unfunded
Commitment | |
Abbott Secondary Opportunities LP | | | 2,000,000 | | | | 43,596 | |
Auda Capital SCS SICAV SIF - Auda Asia Secondary Fund | | | 3,000,000 | | | | 369,724 | |
Committed Advisors Secondary Fund III | | | 2,000,000 | | | | 422,191 | * |
Greenspring Opportunities V LP | | | 650,000 | | | | 45,500 | |
Harbert Seniors Housing Fund I LP | | | 1,500,000 | | | | 97,669 | |
Harbert Seniors Housing Fund II LP | | | 5,000,000 | | | | 2,623,117 | |
Kayne Anderson Energy Fund VII LP | | | 2,500,000 | | | | 266,984 | |
Pinebridge Secondary Partners IV SLP | | | 2,000,000 | | | | 864,667 | |
Rosebrook Opportunities Fund LP | | | 3,000,000 | | | | 747,568 | |
RRA Credit Opportunity Fund LP | | | 2,200,000 | | | | 1,571,694 | |
Walton Street Real Estate Fund VIII LP | | | 1,000,000 | | | | 576,906 | |
* | Foreign Security Denominated in Euros (EUR) and converted to US Dollars (USD) based on the March 31, 2022 foreign exchange rate. |
11. REVOLVING CREDIT AGREEMENT
On January 26, 2022, the Wildermuth Fund entered into a revolving line of credit (“LOC”) with a bank, which provides for maximum borrowings of $6,000,000. The Fund pays interest on the LOC, which is charged at the floating Wall Street Journal Prime Rate, with a rate floor of 3.50% and a setup fee 0.50% of the initial loan amount. On January 26, 2022, the Fund borrowed $4,250,000 to fund certain short-term portfolio cash needs and fully repaid the balance of the LOC on April 1, 2022. During the time the loan was outstanding, the average principal balance and average interest rate were approximately $4,288,449 and 3.51% per annum, respectively. Expenses for the loan are paid by the Fund. During the period ended March 31, 2022, the Fund paid $84,502 in interest and borrowing costs.
37
Wildermuth Fund Notes to Financial Statements - Continued
March 31, 2022 |
12. RECENT MARKET AND ECONOMIC DEVELOPMENTS
Certain impacts to public health conditions particular to the coronavirus (COVID-19) may have a significant negative impact on the operations and profitability of the Fund’s investments. The extent of the impact to the financial performance of the Fund will depend on future developments, including (i) the duration and spread of the outbreak, (ii) the restrictions and advisories, (iii) the effects on the financial markets, and (iv) the effects on the economy overall, all of which are highly uncertain and cannot be predicted.
Russia’s recent military interventions in Ukraine have led to and may lead to additional sanctions being levied by the United States, European Union and other countries against Russia. Russia’s military incursion and the resulting sanctions could adversely affect global energy and financial markets and thus could affect the value of the Fund’s investments, even beyond any direct exposure the Fund may have to Russian issuers or the adjoining geographic regions. The extent and duration of the military action, sanctions and resulting market disruptions are impossible to predict, but could be substantial. Any such disruptions caused by Russian military action or resulting sanctions may magnify the impact of other risks of the Fund and Fund Investments.
13. SUBSEQUENT EVENTS
Subsequent events after the balance sheet date have been evaluated through the date the financial statements were issued.
On May 19, 2022, the Fund increased its bank line of credit to $10,000,000. On April 29, 2022, the Fund drew $6,000,000 from its bank of line of credit to fund certain short-term portfolio cash needs. The Fund expects to repay the loan within 60 days from the date the Fund received the loan proceeds.
The Fund completed a quarterly repurchase offer on April 29, 2022. 1,596,323 shares of Class A, 511,028 shares of Class C, and 744,129 shares of Class I were tendered. The shares tendered represented 27.36% of the Fund’s outstanding shares on the Repurchase Pricing Date. 290,819 shares of Class A, 92,094 shares of Class C, and 137,986 shares of Class I were repurchased. The shares repurchased were made on a pro-rata basis and represented 5.00% of the Fund’s outstanding shares on the Repurchase Pricing Date.
38
Wildermuth Fund Report of Independent Registered Public Accounting Firm |
To the Shareholders and Board of Trustees of Wildermuth Fund
Opinion on the Financial Statements
We have audited the accompanying statement of assets and liabilities of Wildermuth Fund (the “Fund”), including the schedule of investments, as of March 31, 2022 and the related statements of operations for the period from January 1, 2022 to March 31, 2022 and the year ended December 31, 2021, the statements of changes in net assets and financial highlights for the period from January 1, 2022 to March 31, 2022, and for the years ended December 31, 2021 and December 31, 2020, and the statement of cash flows for the period from January 1, 2022 to March 31, 2022, including the related notes (collectively, the “financial statements”). In our opinion, the financial statements and financial highlights present fairly, in all material respects, the financial position of the Fund as of March 31, 2022 and the results of its operations for the period from January 1, 2022 to March 31, 2022 and the year ended December 31, 2021 and statements of changes in net assets and financial highlights for the period from January 1, 2022 to March 31, 2022, and for the years ended December 31, 2021 and December 31, 2020 in conformity with accounting principles generally accepted in the United States of America.
The financial highlights for the years ended December 31, 2019, December 31, 2018 and December 31, 2017 were audited by another independent registered public accounting firm whose report dated June 29, 2020, expressed an unqualified opinion on those financial highlights.
Basis for Opinion
These financial statements and financial highlights are the responsibility of the Fund’s management. Our responsibility is to express an opinion on these financial statements and financial highlights based on our audits. We are a public accounting firm registered with the Public Company Accounting Oversight Board (United States) (“PCAOB”) and are required to be independent with respect to the Fund in accordance with the U.S. federal securities laws and the applicable rules and regulations of the Securities and Exchange Commission and the PCAOB.
We conducted our audits in accordance with the standards of the PCAOB. Those standards require that we plan and perform the audit to obtain reasonable assurance about whether the financial statements and financial highlights are free of material misstatement, whether due to error or fraud. The Fund is not required to have, nor were we engaged to perform, an audit of its internal control over financial reporting. As part of our audits we are required to obtain an understanding of internal control over financial reporting but not for the purpose of expressing an opinion on the effectiveness of the Fund’s internal control over financial reporting. Accordingly, we express no such opinion.
Our audits included performing procedures to assess the risks of material misstatement of the financial statements and financial highlights, whether due to error or fraud, and performing procedures that respond to those risks. Such procedures included examining, on a test basis, evidence regarding the amounts and disclosures in the financial statements and financial highlights. Our procedures included confirmation of securities owned as of March 31, 2022, by correspondence with the custodian, counterparties, underlying fund advisors or by other audit procedures, where replies were not received. Our audits also included evaluating the accounting principles used and significant estimates made by management, as well as evaluating the overall presentation of the financial statements and financial highlights. We believe that our audits provide a reasonable basis for our opinion.
We have served as the Fund’s auditor since 2020.
WithumSmith+Brown, PC
Orlando, Florida
May 31, 2022
39
Wildermuth Fund Trustees and Officers March 31, 2022 (Unaudited) |
Trustees
Following is a list of the trustees of the Trust and their principal occupation over the last five years.
Independent Trustees |
Name, Age,
Address* | Position/Term
of Office** | Principal Occupation(s)
During Past 5 Years | Number of
Portfolios
Overseen
in Fund
Complex*** | Other Directorships Held by
Trustee During Last 5 Years |
Anthony Lewis, Age 75 | Trustee, Since December 2013 | Chairman and CEO of The Lewis Group USA (executive consulting firm) | 1 | Director, Torotel Inc. (Magnetics, Aerospace and Defense); Member of Special Committee, Risk committee, Past Chairman of the Compensation Committee, and Past member of the audit committee: Trustee, and Alternate Lead Trustee, Northern Lights Fund Trust II (mutual fund complex) |
Donald R. Henry, Age 61 | Trustee, Since October 2021 | Self-employed real estate consultant (2018-present); Gemini Rosemont Commercial Real Estate, CEO (2017) and COO/CIO (2013-2017) | 1 | None |
Randall D. Fretz, Age 69 | Trustee, Since December 2013 | Principal, Aperio Advisory Services, LLC (since 2017); Consultant/Chief of Staff, Kids II (design/manufacture children’s products)(2014-2016) | 1 | None |
40
Wildermuth Fund Trustees and Officers - Continued
March 31, 2022 (Unaudited) |
Interested Trustees and Officers |
Name, Age,
Address* | Position/Term
of Office** | Principal Occupation(s)
During Past 5 Years | Number of
Portfolios
Overseen
in Fund
Complex*** | Other Directorships Held by
Trustee During Last 5 Years |
Daniel Wildermuth^,
Age 59 | Trustee, Chairman of the Board, President and Chief Executive Officer | President and CEO, Wildermuth Advisory, LLC from 2013 to present; CEO, Kalos Capital and associated Kalos companies from 2001 to present; CEO, Asteria Wealth, LLC (Wildermuth Executive Officer Asset Management) from 2016 to present; CEO, Wildermuth Securities from 2017 to 2021; Owner Wildermuth Securities from 2017 to present; CEO VirTeca 2021 to present. | 1 | Director, Waratek Inc, 2018 to present; Chairman and Director, ClearGuide Medical, Inc. 2016 to present; Director, Institutional Real Estate, 2016 to 2021; Director, DSI Digital, 2017 to present; Director, Reach, 2019 to present; Director, Kingdom Investments, 2018 to 2021; Director, VirTeca, 2018 to 2021; Director, Clearsense, 2019 to present. |
Carol Wildermuth^,
Age 58 | Trustee and Executive Vice President | CFO, Wildermuth Advisory 2013 to present; President, Wildermuth Securities 2017 to present; CEO Wildermuth Securities from 2021 to present, President, Kalos Companies, 2016 to 2019; CFO, Kalos Companies, 2019 to present. | 1 | Director, Kingdom Investments, 2019 to 2021. Director, Impact Poland, 2021 to present. |
Gerard Scarpati, Age 66 | Treasurer and Chief Financial Officer | Director, Vigilant Compliance, LLC (an investment management services company) from February 2010 to present. | N/A | N/A |
Bernadette Murphy,
Age 58 | Chief Compliance Officer | Director, Vigilant Compliance, LLC from July 2018 to present; Director of Compliance and Operations, B. Riley Dialectic Capital Management, LLC from April 2017 to July 2018; Chief Compliance Officer, Dialectic Capital Management, LP from October 2015 to April 2017; Vice President Administration/Compliance Manager from 2013-2015, Dialectic Capital Management, LLC | N/A | N/A |
Candice Lightfoot^,
Age 40 | Secretary and Vice President | COO, Wildermuth Advisory, LLC from Dec 2016 to present; Vice President of Operations from 2015 to 2016 | N/A | Director, ClearGuide Medical, Inc., 2018 to present |
41
Wildermuth Fund Trustees and Officers - Continued
March 31, 2022 (Unaudited) |
Interested Trustees and Officers (continued) |
Name, Age,
Address* | Position/Term
of Office** | Principal Occupation(s)
During Past 5 Years | Number of
Portfolios
Overseen
in Fund
Complex*** | Other Directorships Held by
Trustee During Last 5 Years |
Amanda Coetzee^, Age 61 | Assistant Secretary | Chief Compliance Officer, Wildermuth Advisory, LLC from 2013 to present. | N/A | N/A |
* | The address for the trustee and officer listed is 818 A1A Hwy N, Suite 301, Ponte Vedra Beach, FL 32082. |
** | The term of office for each trustee and officer listed above will continue indefinitely. The Fund’s Statement of Additional Information includes additional information about the Fund’s Trustees and is available, without charge, upon request, by calling 1-888-445-6032. |
*** | The term “Fund Complex” refers to all present and future funds advised by Wildermuth Advisory, LLC. |
^ | “Interested persons” of the Trust as that term is defined under the 1940 Act because of their affiliation with Wildermuth Advisory, LLC, the Fund’s Adviser. |
42
Wildermuth Fund Additional Information March, 2022 (Unaudited) |
Proxy Voting Policy — Information regarding how the Fund votes proxies relating to portfolio securities for the most recent period ended June 30, as well as a description of the policies and procedures that the Fund used to determine how to vote proxies is available without charge, upon request, by calling 1-888-445-6032 or by referring to the Securities and Exchange Commission’s (“SEC”) website at http://www.sec.gov. A description of the policies and procedures is also included in the Fund’s Statement of Additional Information, which is available on the SEC’s website at http://www.sec.gov.
Tax Information — For federal income tax purposes, the Fund designates $8,184,145 as a 20% rate gain distribution for purposes of the dividends paid deduction for the fiscal year ended December 31, 2021.
Portfolio Holdings — The Fund files its complete schedule of portfolio holdings with the SEC for the first and third quarters of each fiscal year on Form N-PORT. Form N-PORT is available on the SEC’s website at http://www.sec.gov. The information on Form N-PORT is available without charge, upon request, by calling 1-888-445-6032.
43
Wildermuth Fund Privacy Policy |
Wildermuth Fund (the “Fund”) is committed to protecting your privacy. This privacy notice, which is required by state and federal law, explains the Fund’s privacy policy (the “Policy”). This Policy’s terms apply both to our current shareholders and to former shareholders as well.
2. | HOW WE PROTECT YOUR INFORMATION |
We are committed to maintaining the privacy of our shareholders and to safeguarding their non-public personal information. The following information is provided to help you understand what personal information we collect, how we protect that information and why, in certain cases, we may share information with select other parties.
3. | WHAT KIND OF INFORMATION WE COLLECT |
The Fund may collect nonpublic personal information regarding investors from sources such as the following:
| | ● | Account Applications and other forms, which may include a shareholder’s name, address, social security number and/or personally identifiable financial information; |
| | ● | Account History, including information about a shareholder’s losses or gains; and |
| | ● | Correspondence and Communication, with the Fund’s representatives and their affiliates. |
4. | WHO HAS ACCESS TO SHAREHOLDER INFORMATION |
We do not disclose any non-public personal information about our shareholders or former shareholders to anyone, except as permitted by law or as is necessary in order to provide services to shareholders (for example, to a transfer agent, investment adviser or third party administrator). We restrict access to non-public personal information about our shareholders to Fund personnel and employees of Fund service providers with a legitimate business need for the information. We will maintain physical, electronic and procedural safeguards designed to protect the non-public personal information of our shareholders.
Third parties that handle this information shall agree to follow the standards the Fund has established.
5. | UPDATING YOUR INFORMATION |
To help us keep your information up-to-date and accurate, please contact the Fund if there is any change in your personal information.
Adopted December 2013
44
THIS PAGE INTENTIONALLY LEFT BLANK
Investment Adviser
Wildermuth Advisory, LLC
818 A1A Hwy N, Suite 301
Ponte Vedra Beach, Florida 32082
Co-Distributors
Wildermuth Securities, LLC
818 A1A Hwy N, Suite 301
Ponte Vedra Beach, Florida 32082
UMB Distribution Services, LLC
235 West Galena Street
Milwaukee, Wisconsin 53212
This material must be preceded or accompanied by a prospectus. Investors should carefully consider the investment objectives, risks, charges and expenses of the Fund. This and other important information is contained within the Fund’s Prospectus, which can be obtained by calling (888) 445-6032, or by visiting our website www.wildermuthfund.com. The Fund’s Prospectus should be read carefully before investing.
Wildermuth Fund’s principal underwriters and co-distributors are: Wildermuth Securities, LLC 818 A1A Hwy N, Suite 301, Ponte Vedra Beach, FL 32082 and UMB Distribution Services, LLC 235 W Galena St Milwaukee, WI 53212
Principal underwriters and co-distributors are
Wildermuth Securities, LLC and UMB Distribution Services, LLC
Members of FINRA
(b) There were no notices transmitted to stockholders in reliance on Rule 30e-3 under the Investment Company Act of 1940, as amended, that contained disclosures specified by paragraph (c)(3) of that rule.
Item 2. Code of Ethics.
(a) The Registrant has adopted a code of ethics (the “Code”), as that term is defined in Item 2 of Form N-CSR, that applies to the Registrant’s principal executive officer, principal financial officer, principal accounting officer, or controller, or persons performing similar functions, regardless of whether these individuals are employed by the Registrant or a third party. A copy of the Code is attached as an exhibit.
(c) There have been no substantive amendments during the period covered by this report, to a provision of the code of ethics that applies to Registrant’s principal executive officer, principal financial offer, principal accounting officer, or controller, or persons performing similar functions, regardless of whether these individuals are employed by the Registrant or a third party.
(d) The Registrant has not granted any waivers, including an implicit waiver, from a provision of the code of ethics that applies to Registrant’s principal executive officer, principal financial offer, principal accounting officer, or controller, or persons performing similar functions, regardless of whether these individuals are employed by the Registrant or a third party.
Item 3. Audit Committee Financial Expert.
(a) (1) The Board of Trustees of the Registrant (the “Board”) has determined that the Registrant has at least one Board member serving on the Audit Committee that possesses the attributes identified in Instruction 2(b) of Item 3 to Form N-CSR to qualify as an “audit committee financial expert.”
(2) Randall D. Fretz is the Registrant’s audit committee financial expert and is “independent” for purposes of Item 3(a)(2) to Form N-CSR.
Item 4. Principal Accountant Fees and Services.
The aggregate fees for professional services by the principal accountant during the Registrant’s last three fiscal years are as follows:
(a) Audit Fees.
| Fiscal year ended March 31, 2022: | $65,000 |
| Fiscal year ended December 31, 2021: | $99,000 |
| Fiscal year ended December 31, 2020: | $78,090 |
(b) Audit-Related Fees. These are fees by the Registrant’s independent auditors for assurance and related services that were reasonably related to the performance of the audit of the Registrant’s financial statements that are not reported under “Audit Fees”.
| Fiscal year ended March 31, 2022: | $0 |
| Fiscal year ended December 31, 2021: | $0 |
| Fiscal year ended December 31, 2020: | $0 |
(c) Tax Fees. These are fees billed for professional services rendered by the Registrant’s independent auditors for tax compliance, tax advice, and tax planning.
| Fiscal year ended March 31, 2022 | $0 |
| Fiscal year ended December 31, 2021 | $27,500 |
| Fiscal year ended December 31, 2020 | $25,000 |
(d) All Other Fees.
| Fiscal year ended March 31, 2022 | $0 |
| Fiscal year ended December 31, 2021 | $0 |
| Fiscal year ended December 31, 2020 | $0 |
(e) Audit Committee’s pre-approval policies and procedures.
| | (1) | The Registrant’s Audit Committee has adopted, and the Registrant’s Board has approved an Audit and Non-Audit Services Preapproval Policy (the “Policy”), which is intended to comply with Regulation S-X Rule 2-01, and sets forth guidelines and procedures to be followed by the Registrant when retaining the Auditor to perform audit-related services, tax services and other non-audit services. The Policy permits such services to be pre-approved in one of two ways: (1) pursuant to a general pre-approval (“General Pre-Approval”), or (2) pursuant to specific pre-approval (“Specific Pre- Approval”). Unless a type of service provided by the Auditor and the maximum estimated fees therefor has received General Pre-Approval, it will require Specific Pre-Approval by the Audit Committee. |
| | (2) | None of the services described in paragraphs (b) through (d) of this Item 4 were approved by the audit committee pursuant to paragraph (c)(7)(i)(C) of Rule 2-01 of Regulation S-X. |
(f) None.
(g) During the last two fiscal years, there were no other non-audit services rendered by the Registrant’s independent auditors to the Registrant, its investment adviser or any entity controlling, controlled by or under the common control with the investment adviser that provides ongoing services to the Registrant.
(h) Not applicable.
Item 5. Audit Committee of Listed Registrants.
Not applicable.
Item 6. Schedule of Investments.
Included as part of the report to shareholders filed under Item 1 of this Form N-CSR.
Item 7. Disclosure of Proxy Voting Policies and Procedures for Closed-End Management Investment Companies.
The Registrant’s Proxy Voting Policies and Procedures is attached hereto as Exhibit 13(c).
Item 8. Portfolio Managers of Closed-End Management Investment Companies.
(a)(1) Identification of Portfolio Manager(s) or Management Team Members and Description of Role of Portfolio Manager(s) or Management Team Members
The following tables provide biographical information about the portfolio managers who are primarily responsible for the day-to-day portfolio management of the Registrant as of March 31, 2022:
| Portfolio Manager | Title | Length of Time of Service to Registrant | Business Experience During the Past 5 Years | Role of Portfolio Manager |
| Daniel Wildermuth | Trustee, Chairman of the Board, President and Chief Executive Officer. | Since September 2013 | Mr. Wildermuth has over 25 years of experience in the financial services industry. As a Chief Investment Officer (“CIO”) for over 20 years, Mr. Wildermuth has created and managed multiple domestic and international equity and fixed income investment portfolios. As CIO of an advisory firm and Chief Executive Officer of a brokerage firm, Mr. Wildermuth has analyzed and invested in securities and has also completed due diligence and made investment recommendations on various alternative investments, but he has no prior experience managing a publicly registered, closed-end fund. Mr. Wildermuth received a B.S. in engineering from Stanford University and an M.B.A. in Finance from the Anderson School at the University of California, Los Angeles. | Daniel Wildermuth serves as the Portfolio Manager of the Fund, with primary responsibility for overseeing the overall allocation of the Fund’s portfolio. |
(a)(2) Other Accounts Managed by Portfolio Manager(s) or Management Team Member and Potential Conflicts of Interest
The following tables provide information about portfolios and accounts, other than the Registrant, for which the portfolio managers are primarily responsible for the day-to-day portfolio management as of March 31, 2022:
| Name | Type of Accounts | Total Number of Accounts Managed | Total Assets | Number of Accounts Managed for Which Advisory Fees is Based on Performance | Total Assets for Which Advisory Fees is Based on Performance |
| Daniel Wildermuth | Registered Investment Companies | Zero | Zero | Zero | Zero |
| | Other Pooled Investment Vehicles | Zero | Zero | Zero | Zero |
| | Other Accounts | 586 | $132,492,210.48 | Zero | Zero |
Potential Conflicts of Interests
Daniel Wildermuth is responsible for managing other accounts, including registered investment companies, separate accounts and other pooled investment vehicles. He may manage separate accounts and other pooled investment vehicles that may have materially higher, lower or different fee arrangements than the Registrant and may in the future also be subject to performance-based fees. The side-by-side management of these separate accounts and/or pooled investment vehicles may raise potential conflicts of interest relating to cross trading and the allocation of investment opportunities. The investment adviser has a fiduciary responsibility to manage all client accounts in a fair and equitable manner. The investment adviser seeks to provide best execution of all securities transactions and to allocate investments to client accounts in a fair and timely manner. To this end, the investment adviser has developed policies and procedures designed to mitigate and manage the potential conflicts of interest that may arise from side-by-side management.
(a)(3) Compensation Structure of Portfolio Manager(s) or Management Team Members
The portfolio managers receive a salary, retirement plan benefits and discretionary bonuses from the investment adviser and/or the sub-adviser, as applicable.
(a)(4) Disclosure of Securities Ownership
The following tables set forth the dollar range of equity securities beneficially owned by each of the portfolio managers in the Registrant as of March 31, 2022:
| Portfolio Manager | Dollar Range of Registrant Shares Beneficially Owned |
| Daniel Wildermuth* | $0 |
| * | Mr. Wildermuth does not directly own shares of the Fund. However, Mr. Wildermuth acts as power of attorney for investment accounts of two immediate family members that own shares in the Fund. As of fiscal year end, the accounts in total own $32,925. |
(b) Not applicable.
Item 9. Purchases of Equity Securities by Closed-End Management Investment Company and Affiliated Purchasers.
| Class A: | | (a) Total Number of Shares (or Units) Purchased | | | (b) Average Price Paid per Share (of Unit) | | | (c) Total Number of Shares (or Units) Purchased as Part of Publicly Announced Plans or Programs | | | (d) Maximum Number (or Approximate Dollar Value) of Shares (or Units) that May Yet Be Purchased Under the Plans or Programs | |
| Period | | | | | | | | | | | | |
| Jan. 1-31, 2022 (1) | | | 315,386 | | | $ | 13.41 | | | | 0 | | | | 0 | |
| Feb. 1-28, 2022 | | | 0 | | | | 0 | | | | 0 | | | | 0 | |
| Mar. 1-31, 2022 | | | 0 | | | | 0 | | | | 0 | | | | 0 | |
| Total | | | 315,386 | | | $ | 13.41 | | | | 0 | | | | 0 | |
| Class C: | | (a) Total Number of Shares (or Units) Purchased | | | (b) Average Price Paid per Share (of Unit) | | | (c) Total Number of Shares (or Units) Purchased as Part of Publicly Announced Plans or Programs | | | (d) Maximum Number (or Approximate Dollar Value) of Shares (or Units) that May Yet Be Purchased Under the Plans or Programs | |
| Period | | | | | | | | | | | | |
| Jan. 1-31, 2022 (1) | | | 70,301 | | | $ | 12.76 | | | | 0 | | | | 0 | |
| Feb. 1-28, 2022 | | | 0 | | | | 0 | | | | 0 | | | | 0 | |
| Mar. 1-31, 2022 | | | 0 | | | | 0 | | | | 0 | | | | 0 | |
| Total | | | 70,301 | | | $ | 12.76 | | | | 0 | | | | 0 | |
| Class I: | | (a) Total Number of Shares (or Units) Purchased | | | (b) Average Price Paid per Share (of Unit) | | | (c) Total Number of Shares (or Units) Purchased as Part of Publicly Announced Plans or Programs | | | (d) Maximum Number (or Approximate Dollar Value) of Shares (or Units) that May Yet Be Purchased Under the Plans or Programs | |
| Period | | | | | | | | | | | | |
| Jan. 1-31, 2022 (1) | | | 158,750 | | | $ | 13.52 | | | | 0 | | | | 0 | |
| Feb. 1-28, 2022 | | | 0 | | | | 0 | | | | 0 | | | | 0 | |
| Mar. 1-31, 2022 | | | 0 | | | | 0 | | | | 0 | | | | 0 | |
| Total | | | 158,750 | | | $ | 13.52 | | | | 0 | | | | 0 | |
| (1) | On December 30, 2021 the Registrant offered to repurchase up to 5% of the Registrant’s total outstanding shares as of January 31, 2022 ( the "Repurchase Request Deadline"). On the Repurchase Request Deadline, 544,437 shares represented 5% of the Registrant's total outstanding shares. |
Item 10. Submission of Matters to a Vote of Security Holders.
Not applicable.
Item 11. Controls and Procedures.
| (a) | The Registrant’s principal executive officer and principal financial officer have reviewed the Registrant's disclosure controls and procedures (as defined in Rule 30a-3(c) under the Investment Company Act of 1940, as amended, (the “Act”)) as of a date within 90 days of the filing of this report, as required by Rule 30a-3(b) under the Act. Based on their review, such officers have concluded that the disclosure controls and procedures were effective in ensuring that information required to be disclosed in this report was appropriately recorded, processed, summarized and reported and made known to them by others within the Registrant and by the Registrant’s service providers. |
| (b) | There were no changes in the Registrant’s internal control over financial reporting (as defined in Rule 30a-3(d) under the Act (17 CFR 270.30a-3(d)) that occurred during the period covered by this report that materially affected, or were reasonably likely to materially affect, the Registrant’s internal control over financial reporting. |
Item 12. Disclosure of Securities Lending Activities for Closed-End Management Investment Companies.
The Fund has not engaged in Security Lending Activities.
Item 13. Exhibits.
| (a) | (4) | Change in the registrant’s independent public accountant. Not applicable. |
SIGNATURES
Pursuant to the requirements of the Securities Exchange Act of 1934 and the Investment Company Act of 1940, the Registrant has duly caused this report to be signed on its behalf by the undersigned, thereunto duly authorized.
Wildermuth Fund
| /s/ Daniel Wildermuth | |
| By: Daniel Wildermuth | |
| Trustee, Chairman of the Board, President and Chief Executive Officer | |
| June 9, 2022 | |
Pursuant to the requirements of the Securities Exchange Act of 1934 and the Investment Company Act of 1940, this report has been signed below by the following persons on behalf of the Registrant and in the capacities and on the dates indicated.
| /s/ Daniel Wildermuth | |
| By: Daniel Wildermuth | |
| Trustee, Chairman of the Board, President and Chief Executive Officer | |
| (Principal Executive Officer) | |
| June 9, 2022 | |
| /s/ Gerard Scarpati | |
| By: Gerard Scarpati | |
| Treasurer and Chief Financial Officer | |
| (Principal Financial Officer) | |
| June 9, 2022 | |