| FREE WRITING PROSPECTUS | ||
| FILED PURSUANT TO RULE 433 | ||
| REGISTRATION FILE NO.: 333-180779-05 | ||
 |  |
MSBAM 2013-C12
Free Writing Prospectus
Structural and Collateral Term Sheet
$1,276,316,957
(Approximate Total Mortgage Pool Balance)
$1,126,349,000
(Approximate Offered Certificates)
Morgan Stanley Capital I Inc.
as Depositor
Morgan Stanley Mortgage Capital Holdings LLC
Bank of America, National Association
CIBC Inc.
as Sponsors and Mortgage Loan Sellers
Commercial Mortgage Pass-Through Certificates
Series 2013-C12
October 1, 2013
| MORGAN STANLEY | BofA MERRILL LYNCH |
| Co-Lead Bookrunning Manager | Co-Lead Bookrunning Manager |
CIBC World Markets Co-Manager | |
STATEMENT REGARDING THIS FREE WRITING PROSPECTUS
The depositor has filed a registration statement (including a prospectus) with the SEC (File Number 333-180779) for the offering to which this communication relates. Before you invest, you should read the prospectus in that registration statement and other documents the depositor has filed with the SEC for more complete information about the depositor, the issuing entity and this offering. You may get these documents for free by visiting EDGAR on the SEC web site at www.sec.gov. Alternatively, the depositor or any underwriter or any dealer participating in the offering will arrange to send you the prospectus if you request it by calling toll free 1-866-718-1649 or by email to prospectus@ms.com.
| This is not a research report and was not prepared by any Underwriter’s research departments. It was prepared by the Underwriters’ sales, trading, banking or other non-research personnel. This Term Sheet was not intended or written to be used, and it cannot be used by any taxpayer, for the purpose of avoiding penalties that may be imposed on the taxpayer under U.S. federal tax laws. Each taxpayer should seek advice based on the taxpayer’s particular circumstances from an independent tax advisor. Please see additional important information and qualifications at the end of this Term Sheet. |
IMPORTANT NOTICE RELATING TO AUTOMATICALLY GENERATED EMAIL DISCLAIMERS
Any legends, disclaimers or other notices that may appear at the bottom of, or attached to, the email communication to which this material may have been attached are not applicable to these materials and should be disregarded. Such legends, disclaimers or other notices have been automatically generated as a result of these materials having been sent via Bloomberg or another email system.
IMPORTANT NOTICE REGARDING THE CONDITIONS FOR THIS OFFERING OF ASSET-BACKED SECURITIES
THE ASSET-BACKED SECURITIES REFERRED TO IN THESE MATERIALS ARE BEING OFFERED WHEN, AS AND IF ISSUED. IN PARTICULAR, YOU ARE ADVISED THAT THE ASSET-BACKED SECURITIES, AND THE ASSET POOL BACKING THEM, ARE SUBJECT TO MODIFICATION OR REVISION (INCLUDING, AMONG OTHER THINGS, THE POSSIBILITY THAT ONE OR MORE CLASSES OF SECURITIES MAY BE SPLIT, COMBINED OR ELIMINATED), AT ANY TIME PRIOR TO ISSUANCE OR AVAILABILITY OF A FINAL PROSPECTUS. AS A RESULT, YOU MAY COMMIT TO PURCHASE SECURITIES THAT HAVE CHARACTERISTICS THAT MAY CHANGE, AND YOU ARE ADVISED THAT ALL OR A PORTION OF THE SECURITIES MAY NOT BE ISSUED THAT HAVE THE CHARACTERISTICS DESCRIBED IN THESE MATERIALS. OUR OBLIGATION TO SELL SECURITIES TO YOU IS CONDITIONED ON THE SECURITIES AND THE UNDERLYING TRANSACTION HAVING THE CHARACTERISTICS DESCRIBED IN THESE MATERIALS. IF WE DETERMINE THAT THE FOREGOING CONDITION IS NOT SATISFIED IN ANY MATERIAL RESPECT, WE WILL NOTIFY YOU, AND NEITHER THE ISSUING ENTITY NOR ANY UNDERWRITER WILL HAVE ANY OBLIGATION TO YOU TO DELIVER ALL OR ANY PORTION OF THE SECURITIES WHICH YOU HAVE COMMITTED TO PURCHASE, AND THERE WILL BE NO LIABILITY BETWEEN US AS A CONSEQUENCE OF THE NON-DELIVERY.
IMPORTANT INFORMATION AND IRS CIRCULAR 230 NOTICE
THIS MATERIAL HAS BEEN PREPARED FOR INFORMATION PURPOSES TO SUPPORT THE PROMOTION OR MARKETING OF THE TRANSACTION OR MATTERS ADDRESSED HEREIN. THIS IS NOT A RESEARCH REPORT AND WAS NOT PREPARED BY THE UNDERWRITERS’ RESEARCH DEPARTMENTS. IT WAS PREPARED BY UNDERWRITER SALES, TRADING, BANKING OR OTHER NON-RESEARCH PERSONNEL. THIS TERM SHEET WAS NOT INTENDED OR WRITTEN TO BE USED, AND IT CANNOT BE USED BY ANY TAXPAYER, FOR THE PURPOSE OF AVOIDING PENALTIES THAT MAY BE IMPOSED ON THE TAXPAYER UNDER U.S. FEDERAL TAX LAWS. EACH TAXPAYER SHOULD SEEK ADVICE BASED ON THE TAXPAYER’S PARTICULAR CIRCUMSTANCES FROM AN INDEPENDENT TAX ADVISOR. PLEASE SEE ADDITIONAL IMPORTANT INFORMATION AND QUALIFICATIONS AT THE END OF THIS TERM SHEET.
| This is not a research report and was not prepared by any Underwriter’s research departments. It was prepared by the Underwriters’ sales, trading, banking or other non-research personnel. This Term Sheet was not intended or written to be used, and it cannot be used by any taxpayer, for the purpose of avoiding penalties that may be imposed on the taxpayer under U.S. federal tax laws. Each taxpayer should seek advice based on the taxpayer’s particular circumstances from an independent tax advisor. Please see additional important information and qualifications at the end of this Term Sheet. |
T-1
| MSBAM 2013-C12 | Structural Overview |
Offered Certificates
| Class | Expected Ratings (Fitch/KBRA/Moody’s)(1) | Approximate Initial Certificate Principal Balance or Notional Amount(2) | Approximate Initial Credit Support(3) | Pass-Through Rate Description(4) | Expected Weighted Average Life (Years)(5) | Principal Window (Months)(5) | Certificate Principal UW NOI Debt Yield(6)(8) | Certificate Principal to Value Ratio(7)(8) | |
| Class A-1 | AAA(sf)/AAA(sf)/Aaa(sf) | $80,300,000 | 30.000% | (4) | 2.67 | 1-58 | 15.3% | 44.2% | |
| Class A-2 | AAA(sf)/AAA(sf)/Aaa(sf) | $161,200,000 | 30.000% | (4) | 4.93 | 58-60 | 15.3% | 44.2% | |
| Class A-SB | AAA(sf)/AAA(sf)/Aaa(sf) | $107,200,000 | 30.000% | (4) | 7.27 | 60-113 | 15.3% | 44.2% | |
| Class A-3 | AAA(sf)/AAA(sf)/Aaa(sf) | $260,000,000 | 30.000% | (4) | 9.67 | 113-117 | 15.3% | 44.2% | |
| Class A-4 | AAA(sf)/AAA(sf)/Aaa(sf) | $284,721,000 | 30.000% | (4) | 9.81 | 117-119 | 15.3% | 44.2% | |
| Class X-A | AAA(sf)/AAA(sf)/Aaa(sf) | $998,718,000(9) | NAP | Variable(10) | NAP | NAP | NAP | NAP | |
Class A-S(11) | AAA(sf)/AAA(sf)/Aaa(sf) | $105,297,000 | 21.750% | (4) | 9.89 | 119-119 | 13.7% | 49.5% | |
Class B(11) | AA-(sf)/AA(sf)/Aa3(sf) | $74,983,000 | 15.875% | (4) | 9.89 | 119-119 | 12.7% | 53.2% | |
Class PST(11) | A-(sf)/A(sf)/A3(sf) | $232,928,000 | 11.750% | (4) | 9.89 | 119-119 | 12.1% | 55.8% | |
Class C(11) | A-(sf)/A(sf)/A3(sf) | $52,648,000 | 11.750% | (4) | 9.89 | 119-119 | 12.1% | 55.8% |
Privately Offered Certificates(12)
| Class | Expected Ratings (Fitch/KBRA/Moody’s)(1) | Approximate Initial Certificate Principal Balance or Notional Amount(2) | Approximate Initial Credit Support(3) | Pass-Through Rate Description(4) | Expected Weighted Average Life (Years)(5) | Principal Window (Months)(5) | Certificate Principal UW NOI Debt Yield(6) | Certificate Principal to Value Ratio(7) | |
| Class X-C | NR/NR/NR | $78,174,957(9) | NAP | Variable(10) | NAP | NAP | NAP | NAP | |
| Class D | BBB-(sf)/BBB(sf)/Baa3(sf) | $52,648,000 | 7.625% | (4) | 9.94 | 119-120 | 11.6% | 58.4% | |
| Class E | BB+(sf)/BBB-(sf)/Ba2(sf) | $19,145,000 | 6.125% | (4) | 9.98 | 120-120 | 11.4% | 59.3% | |
| Class F | BB-(sf)/BB(sf)/B1(sf) | $20,740,000 | 4.500% | (4) | 9.98 | 120-120 | 11.2% | 60.4% | |
| Class G | B-(sf)/B(sf)/NR | $14,359,000 | 3.375% | (4) | 9.98 | 120-120 | 11.1% | 61.1% | |
Class H(13) | NR/NR/NR | $43,075,957 | 0.000% | (4) | 10.36 | 120-240 | 10.7% | 63.2% |
| (1) | Ratings shown are those of Fitch Ratings, Inc., Kroll Bond Ratings Inc. and Moody’s Investors Service, Inc. Certain nationally recognized statistical rating organizations that were not hired by the depositor may use information they receive pursuant to Rule 17g-5 under the Securities Exchange Act of 1934, as amended, or otherwise to rate the certificates. There can be no assurance as to what ratings a non-hired nationally recognized statistical rating organization would assign. See “Risk Factors—Risks Related to the Offered Certificates—Ratings of the Offered Certificates Do Not Represent Any Assessment of the Yield to Maturity That a Certificateholder May Experience and Such Ratings May Be Reviewed, Revised, Suspended, Downgraded, Qualified or Withdrawn By the Applicable Rating Agency” and “Ratings” in the other free writing prospectus which is expected to be dated October 2, 2013 (the “Free Writing Prospectus”) to which the prospectus dated October 1, 2013 (the “Prospectus”) is attached as Exhibit A. Capitalized terms used but not defined herein have the meanings assigned to such terms in the Free Writing Prospectus. |
| (2) | The certificate principal balances and notional amounts are approximate and on the closing date may vary by up to 5%. Mortgage loans may be removed from or added to the mortgage pool prior to the closing date within the same maximum permitted variance. Any reduction or increase in the aggregate principal balance of mortgage loans within these parameters will result in changes to the initial certificate principal balance or notional amount of each class of certificates and to the other statistical data contained herein and in the Free Writing Prospectus. |
| (3) | The percentages indicated under the column “Approximate Initial Credit Support” with respect to the Class A-1, Class A-2, Class A-SB, Class A-3 and Class A-4 Certificates represent the approximate credit support for the Class A-1, Class A-2, Class A-SB, Class A-3 and Class A-4 Certificates in the aggregate. The percentage indicated under the column “Approximate Initial Credit Support” with respect to the Class C Certificates and the Class PST Certificates represents the approximate credit support for the underlying Class C trust component which will have an initial outstanding balance on the closing date of $52,648,000. |
| (4) | The Class A-1, Class A-2, Class A-SB, Class A-3, Class A-4, Class A-S, Class B, Class C, Class D, Class E, Class F, Class G and Class H Certificates will, at all times, accrue interest at a per annum rate equal to (i) a fixed rate, (ii) a fixed rate subject to a cap equal to the weighted average of the net interest rates on the mortgage loans (in each case adjusted, if necessary, to accrue on the basis of a 360-day year consisting of twelve (12) 30-day months) or (iii) a rate equal to the weighted average of the net interest rates on the mortgage loans (in each case adjusted, if necessary, to accrue on the basis of a 360-day year consisting of twelve (12) 30-day months) less a specified percentage, which percentage may be zero. The Class PST Certificates will not have a pass-through rate, but will be entitled to receive the sum of the interest distributable on the Class PST components. The pass-through rate for the Class A-S Certificates, the Class A-S trust component and the Class PST Component A-S will, at all times, be the same. The pass-through rate for the Class B Certificates, the Class B trust component and the Class PST Component B will, at all times, be the same. The pass-through rate for the Class C Certificates, the Class C trust component and the Class PST Component C will, at all times, be the same. |
| (5) | The principal window is expressed in months following the closing date and reflects the period during which distributions of principal would be received under the assumptions set forth in the following sentence. The expected weighted average life and principal window figures set forth above are based on the following assumptions, among others: (i) no defaults or subsequent losses on the mortgage loans; (ii) no extensions of maturity dates of mortgage loans that do not have “anticipated repayment dates”; (iii) payment in full on the stated maturity date or, in the case of each mortgage loan having an anticipated repayment date, on the anticipated repayment date; and (iv) no prepayments of the mortgage loans prior to maturity or, in the case of a mortgage loan having an anticipated repayment date, prior to such anticipated repayment date. See the structuring assumptions set forth under “Yield, Prepayment and Maturity Considerations—Weighted Average Life” in the Free Writing Prospectus. |
| (6) | Certificate Principal UW NOI Debt Yield for any class of principal balance certificates (other than the Exchangeable Certificates) is calculated as the product of (a) the weighted average UW NOI Debt Yield for the mortgage pool, multiplied by (b) a fraction, the numerator of which is the total initial principal balance of all the principal balance certificates (other than the Exchangeable Certificates) and the trust components, and the denominator of which is the total initial principal balance of the subject class of principal balance certificates and all other classes of principal balance certificates (other than the Exchangeable Certificates) and trust components, if any, that are senior to such class. The Certificate Principal UW NOI Debt Yields of the Class A-1, Class A-2, Class A-SB, Class A-3 and Class A-4 Certificates are calculated in the aggregate for those classes as if they were a single class. |
(Footnotes continued on next page)
| This is not a research report and was not prepared by the Underwriters’ research departments. Please see additional important information and qualifications at the end of this Term Sheet. |
T-2
| MSBAM 2013-C12 | Structural Overview |
| (7) | Certificate Principal to Value Ratio for any class of principal balance certificates (other than the Exchangeable Certificates) is calculated as the product of (a) the weighted average Cut-off Date LTV Ratio of the mortgage pool, multiplied by (b) a fraction, the numerator of which is the total initial principal balance of the subject class of principal balance certificates and all other classes of principal balance certificates (other than the Exchangeable Certificates) and trust components, if any, that are senior to such class, and the denominator of which is the total initial principal balance of all the principal balance certificates (other than the Exchangeable Certificates) and the trust components. The Certificate Principal to Value Ratios of the Class A-1, Class A-2, Class A-SB, Class A-3 and Class A-4 Certificates are calculated in the aggregate for those classes as if they were a single class. |
| (8) | Certificate Principal UW NOI Debt Yield for the Class A-S, Class B and Class C Certificates is calculated as the product of (a) the weighted average UW NOI Debt Yield for the mortgage pool, multiplied by (b) a fraction, the numerator of which is the total initial principal balance of all the principal balance certificates (other than the Exchangeable Certificates) and the trust components, and the denominator of which is the total initial principal balance of the Class A-S trust component, the Class B trust component or the Class C trust component, as applicable, and all other classes of principal balance certificates (other than the Exchangeable Certificates) and trust components that are senior to such class. The Certificate Principal UW NOI Debt Yield of the Class PST Certificates is equal to the Certificate Principal UW NOI Debt Yield for the Class C Certificates. Certificate Principal to Value Ratio for the Class A-S, Class B and Class C Certificates is calculated as the product of (a) the weighted average Cut-off Date LTV Ratio of the mortgage pool, multiplied by (b) a fraction, the numerator of which is the total initial principal balance of the Class A-S trust component, the Class B trust component or the Class C trust component, as applicable, and all other classes of principal balance certificates (other than the Exchangeable Certificates) and trust components that are senior to such class, and denominator of which is the total initial principal balance of all the principal balance certificates (other than the Exchangeable Certificates) and the trust components. The Certificate Principal to Value Ratio of the Class PST Certificates is equal to the Certificate Principal to Value Ratio of the Class C Certificates. |
| (9) | The Class X-A and Class X-C Certificates will not have certificate principal balances and will not be entitled to receive distributions of principal. Interest will accrue on the Class X-A and Class X-C Certificates at their respective pass-through rates based upon their respective notional amounts. The notional amount of the Class X-A Certificates will equal the aggregate certificate principal balance of the Class A-1, Class A-2, Class A-SB, Class A-3, Class A-4 and Class A-S Certificates outstanding from time to time (without regard to any exchange of Class A-S, Class B and Class C Certificates for Class PST Certificates). The notional amount of the Class X-C Certificates will equal the aggregate certificate principal balance of the Class F, Class G and Class H Certificates outstanding from time to time. |
| (10) | The pass-through rate on the Class X-A Certificates will generally be equal to the excess, if any, of (a) the weighted average of the net interest rates on the mortgage loans (in each case adjusted, if necessary, to accrue on the basis of a 360-day year consisting of twelve (12) 30-day months), over (b) the weighted average of the pass-through rates of the Class A-1, Class A-2, Class A-SB, Class A-3, Class A-4 and Class A-S Certificates (without regard to any exchange of Class A-S, Class B and Class C Certificates for Class PST Certificates) as described in the Free Writing Prospectus. The pass-through rate on the Class X-C Certificates will generally be equal to the excess, if any, of (a) the weighted average of the net interest rates on the mortgage loans (in each case adjusted, if necessary, to accrue on the basis of a 360-day year consisting of twelve (12) 30-day months), over (b) the weighted average of the pass-through rates of the Class F, Class G and Class H Certificates as described in the Free Writing Prospectus. |
| (11) | The Class A-S, Class B, Class PST and Class C Certificates are “Exchangeable Certificates.” On the closing date, the upper-tier REMIC of the issuing entity will issue the Class A-S, Class B and Class C trust components (each a “trust component”) which will have outstanding principal balances on the closing dates of $105,297,000, $74,983,000, $52,648,000, respectively. The trust components will be held in the grantor trust for the benefit of the holders of the Class A-S, Class B, Class PST and Class C Certificates. The Class A-S, Class B, Class PST and Class C Certificates will, at all times, represent undivided beneficial ownership interests, held through the grantor trust, in one or more of such trust components. Each class of the Class A-S, Class B and Class C Certificates will, at all times, represent an undivided beneficial ownership interest in a percentage of the outstanding certificate principal balance of the trust component with the same alphabetical class designation. The Class PST Certificates will, at all times, represent an undivided beneficial ownership interest in the remaining percentages of the outstanding certificate principal balances of the Class A-S, Class B and Class C trust components and which portions of those trust components are respectively referred to in this Term Sheet as the Class PST Component A-S, Class PST Component B and Class PST Component C (collectively, the “Class PST Components”). Following any exchange of Class A-S, Class B and Class C Certificates for Class PST Certificates or any exchange of Class PST Certificates for Class A-S, Class B and Class C Certificates as described in the Free Writing Prospectus, the percentage interest of the outstanding certificate principal balances of the Class A-S, Class B and Class C trust components that is represented by the Class A-S, Class B, Class PST and Class C Certificates will be increased or decreased accordingly. The initial certificate principal balance of each class of the Class A-S, Class B and Class C Certificates shown in the table represents the maximum certificate principal balance of such class without giving effect to any exchange. The initial certificate principal balance of the Class PST Certificates shown in the table is equal to the aggregate of the initial certificate principal balances of the Class A-S, Class B and Class C Certificates shown in the table and represents the maximum certificate principal balance of the Class PST Certificates that could be issued in an exchange. The certificate principal balances of the Class A-S, Class B and Class C Certificates to be issued on the closing date will be reduced, in required proportions, by an amount equal to the certificate principal balance of the Class PST Certificates issued on the closing date. Distributions and allocations of payments and losses with respect to the Exchangeable Certificates are described in this Term Sheet under “Allocations and Distributions on the Class A-S, Class B, Class PST and Class C Certificates” and under “Description of the Offered Certificates—Distributions” in the Free Writing Prospectus. The maximum certificate principal balance of the Class PST Certificates is set forth in the table but is not included in the aggregate certificate principal balance of the offered certificates set forth on the cover page of this Term Sheet or on the top of the cover page of the Free Writing Prospectus. |
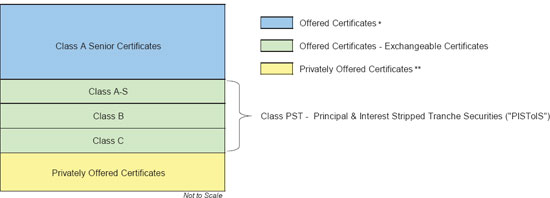
* For purposes of the foregoing chart, the Class A Senior Certificates includes the Class X-A Certificates, which are also offered certificates, in regards to payments of interest. ** For purposes of the foregoing chart, the Class X-C Certificates have the same payment priority as the Class A Senior Certificates in regards payments of interest. |
| (12) | Not offered pursuant to the Prospectus, the Free Writing Prospectus or this Term Sheet. Information provided in this Term Sheet regarding the characteristics of these certificates is provided only to enhance your understanding of the offered certificates. The privately offered certificates also include the Class R Certificates, which do not have a certificate principal balance, notional amount, pass-through rate, rating or rated final distribution date, and which are not shown in the chart. |
| (13) | Each Class H Certificate is an investment unit consisting of a REMIC regular interest and an undivided beneficial ownership interest held through the grantor trust that holds, among other things, an interest in certain excess interest in respect of mortgage loans having an anticipated repayment date. |
| This is not a research report and was not prepared by the Underwriters’ research departments. Please see additional important information and qualifications at the end of this Term Sheet. |
T-3
| MSBAM 2013-C12 | Structural Overview |
Issue Characteristics
| Offered Certificates: | $1,126,349,000 (approximate) monthly pay, multi-class, commercial mortgage Pass-Through Certificates, consisting of nine principal balance classes (Class A-1, Class A-2, Class A-SB, Class A-3, Class A-4, Class A-S, Class B, Class PST and Class C Certificates) and one interest only class (Class X-A), offered pursuant to a registration statement filed with the SEC (File Number 333-180779) |
| Co-Lead Bookrunning Managers: | Morgan Stanley & Co. LLC and Merrill Lynch, Pierce, Fenner & Smith Incorporated |
| Co-Manager: | CIBC World Markets Corp. |
| Mortgage Loan Sellers: | Morgan Stanley Mortgage Capital Holdings LLC, Bank of America, National Association and CIBC Inc. |
| Rating Agencies: | Fitch Ratings, Inc., Kroll Bond Rating Agency, Inc. and Moody’s Investors Service, Inc. |
| Master Servicer: | Wells Fargo Bank, National Association |
| Special Servicer: | Midland Loan Services, a Division of PNC Bank, National Association |
Certificate Administrator/ Certificate Registrar/Custodian: | Wells Fargo Bank, National Association |
| Trustee: | U.S. Bank National Association |
| Trust Advisor: | Trimont Real Estate Advisors, Inc. |
Initial Controlling Class Representative: | Blackrock Financial Management, Inc. |
| Cut-off Date: | October 1, 2013. For purposes of the information contained in this term sheet (this “Term Sheet”), scheduled payments due in October 2013 with respect to mortgage loans not having payment dates on the first day of each month have been deemed received on October 1, 2013, not the actual day on which such scheduled payments were due. |
| Expected Pricing Date: | Week of October 7, 2013 |
| Expected Closing Date: | On or about October 23, 2013 |
| Determination Dates: | The 11th calendar day of each month (if the 11th calendar day is not a business day, the next succeeding business day), commencing in November 2013 |
| Distribution Dates: | The 4th business day following the Determination Date in each month, commencing in November 2013 |
| Rated Final Distribution Date: | The Distribution Date in October 2046 |
| Interest Accrual Period: | Preceding calendar month |
| Payment Structure: | Sequential pay |
| Tax Treatment: | REMIC, except that the Class A-S, Class B, Class PST and Class C Certificates will evidence an interest in the grantor trust and the Class H Certificates will evidence a REMIC interest and an interest in the grantor trust |
| Optional Termination: | 1.00% clean-up call |
| Minimum Denominations: | $10,000 for each class of Offered Certificates (other than Class X-A); $100,000 for the Class X-A Certificates |
| Settlement Terms: | DTC, Euroclear and Clearstream |
| Legal/Regulatory Status: | Each class of Offered Certificates is expected to be eligible for exemptive relief under ERISA. No class of certificates is SMMEA eligible. |
| Analytics: | The certificate administrator is expected to make available all distribution date statements, CREFC reports and supplemental notices received by it to certain modeling financial services (i.e., BlackRock Financial Management, Inc., Bloomberg, L.P., Intex Solutions, Inc., Markit, CMBS.com, Inc. and Trepp LLC). |
| Bloomberg Ticker: | MSBAM 2013-C12 <MTGE><GO> |
| Risk Factors: | THE CERTIFICATES INVOLVE CERTAIN RISKS AND MAY NOT BE SUITABLE FOR ALL INVESTORS. SEE THE “RISK FACTORS” SECTION OF THE FREE WRITING PROSPECTUS AND THE “RISK FACTORS” SECTION OF THE PROSPECTUS. |
| This is not a research report and was not prepared by the Underwriters’ research departments. Please see additional important information and qualifications at the end of this Term Sheet. |
T-4
| MSBAM 2013-C12 | Structural Overview |
Structural Overview
| Accrual: | Each class of Offered Certificates will accrue interest on a 30/360 basis. |
Amount and Order of Distributions: | On each distribution date, certificateholders will be entitled to receive distributions of interest and principal from funds received with respect to the mortgage loans and available for distribution. Funds available for distribution on the certificates will be net of excess interest, excess liquidation proceeds and specified trust expenses, including, without limitation, all advance reimbursements (with interest) and all servicing fees and expenses, certificate administrator fees (including trustee fees and custodian fees) and expenses, special servicer compensation, trust advisor fees, CREFC® License Fees and expenses as set forth below. Distributions to certificateholders on each distribution date out of payments (or advances in lieu thereof) and other collections on the mortgage loans will be in an amount equal to each class’s interest and principal entitlement, subject to: (i) payment of the respective interest entitlement for any other class of certificates bearing an earlier alphanumeric designation (except (x) in respect of the distribution of interest among the Class A-1, Class A-2, Class A-SB, Class A-3, Class A-4, Class X-A and Class X-C Certificates, which will have the same senior priority and be distributed pro rata and (y) in respect of the distribution of interest among the Class A-S, Class B, Class PST and Class C Certificates as described below under “Allocations and Distributions on the Class A-S, Class B, Class PST and Class C Certificates”); (ii) if applicable, payment of the respective principal entitlement for the distribution date to the outstanding classes of principal balance certificates, first, to the Class A-SB Certificates, until the principal balance of such class has been reduced to the planned principal balance for the related distribution date set forth on Appendix VII to the Free Writing Prospectus, then, to the Class A-1 Certificates, then to the Class A-2 Certificates, then to the Class A-3 Certificates, then, to the Class A-4 Certificates and then to the Class A-SB Certificates, until the principal balance of each such class has been reduced to zero (provided that, if the principal balance of each class of principal balance certificates other than the Class A-1, Class A-2, Class A-SB, Class A-3 and Class A-4 Certificates has been reduced to zero as a result of the allocation of mortgage loan losses or trust advisor expenses to those certificates, or if the aggregate appraisal reduction equals or exceeds the aggregate principal balance of the Class A-S through Class H Certificates (including the Class PST Certificates), then on a pro rata basis among the holders of the Class A-1, Class A-2, Class A-SB, Class A-3 and Class A-4 Certificates), then, to the Class A-S, Class B, Class PST and Class C Certificates as described below under “Allocations and Distributions on the Class A-S, Class B, Class PST and Class C Certificates” until the principal balance of each such class has been reduced to zero, and then to the Class D, Class E, Class F, Class G and Class H Certificates, in that order, until the principal balance of each such class has been reduced to zero; and (iii) the allocation of trust advisor expenses, (a) first, to reduce payments of interest on the Class E Certificates, the Class D Certificates, the Class C trust component and the Class B trust component in that order, (b) second, to reduce payments of principal on the Class E Certificates, the Class D Certificates, the Class C trust component, the Class B trust component and the Class A-S trust component in that order, and (c) third, to reduce payments of principal on the Class A-1, Class A-2, Class A-SB, Class A-3 and Class A-4 Certificates on a pro rata basis. No trust advisor expenses (other than the trust advisor fee) will be allocated to or otherwise borne by the Control Eligible Certificates. As a result, none of the classes of Control Eligible Certificates will provide protection to the more senior classes of certificates for the purposes of allocating losses based on trust advisor expenses. Trust advisor expenses allocated to the Class A-S trust component, the Class B trust component and the Class C trust component will be allocated to the Class A-S, Class B, Class PST and Class C Certificates as described below under “Allocations and Distributions on the Class A-S, Class B, Class PST and Class C Certificates.” |
Interest and Principal Entitlements: | Interest distributable on any class of certificates (other than the Exchangeable Certificates and the Class R Certificates) or trust component on any distribution date, with various adjustments described under “Description of the Offered Certificates—Distributions” in the Free Writing Prospectus, represents all unpaid interest accrued with respect to that class of certificates or trust component through the end of the interest accrual period that corresponds to that distribution date. Interest accrues with respect to the interest-bearing certificates and the trust components (and correspondingly on the Exchangeable Certificates) on the basis of a 360-day year consisting of twelve (12) 30-day months. Interest accrues with respect to each interest-bearing certificate and each trust component during each interest accrual period at the applicable pass-through rate for, and on the principal balance or notional amount, as applicable, of that certificate or trust component outstanding immediately prior to, the distribution date that corresponds to that interest accrual period. However, as described in “Description of the Offered Certificates—Distributions” in the Free Writing Prospectus, there are circumstances relating to the timing of prepayments in which the interest entitlement with respect to any certificate or trust component for a distribution date could be less than one full month’s interest at the pass-through rate on the certificate’s or trust component’s principal balance or notional amount. In addition, certain specified trust fund expenses, the right of the master servicer, the special servicer and the trustee to reimbursement for payment of advances (with interest thereon), and the rights of such parties and of the certificate administrator, the custodian and, subject to certain limitations, the trust advisor to the payments of compensation and reimbursement of certain costs and expenses will be prior to a certificateholder’s right to receive distributions of principal or interest. In addition, the right of the trust advisor to receive reimbursement of trust advisor expenses will be prior to the right of the holders of the Class B, Class PST, Class C, Class D and Class E Certificates to receive payments of interest, and to the holders of the Class A-1, Class A-2, Class |
| This is not a research report and was not prepared by the Underwriters’ research departments. Please see additional important information and qualifications at the end of this Term Sheet. |
T-5
| MSBAM 2013-C12 | Structural Overview |
| A-SB, Class A-3, Class A-4, Class A-S, Class B, Class PST, Class C, Class D and Class E Certificates to receive payments of principal. The amount of principal available to be distributed on the classes entitled to principal on a particular distribution date will, in general, be equal to the sum of: (i) the principal portion of all scheduled payments, other than balloon payments, to the extent received during the related collection period or advanced by the master servicer or other party (in accordance with the pooling and servicing agreement) in respect of such distribution date; (ii) all principal prepayments and the principal portion of balloon payments received during the related collection period; (iii) the principal portion of other collections on the mortgage loans received during the related collection period, for example liquidation proceeds, condemnation proceeds, insurance proceeds and income on other “real estate owned” (“REO”); and (iv) the principal portion of proceeds of mortgage loan repurchases received during the related collection period; subject, to certain adjustments described in the Free Writing Prospectus relating to the payment or reimbursement of nonrecoverable advances, workout-delayed reimbursement amounts and trust advisor expenses, and exclusive of any late collections of principal received during the related collection period for which there is an outstanding advance. The Class R, Class X-A and Class X-C Certificates will not be entitled to principal distributions. | |
Allocations and Distributions on the Class A-S, Class B, Class PST and Class C Certificates: | On the closing date, the upper-tier REMIC of the issuing entity will issue the Class A-S, Class B and Class C trust components (each a “trust component”) which will have outstanding principal balances on the closing date of $105,297,000, $74,983,000 and $52,648,000, respectively. The trust components will be held in the grantor trust for the benefit of the holders of the Class A-S, Class B, Class PST and Class C Certificates. The Class A-S, Class B, Class PST and Class C Certificates will, at all times, represent undivided beneficial ownership interests, held through the grantor trust, in one or more of such trust components. Each class of the Class A-S, Class B and Class C Certificates will, at all times, represent an undivided beneficial ownership interest in a percentage of the outstanding principal balance of the trust component with the same alphabetical class designation. The Class PST Certificates will, at all times, represent an undivided beneficial ownership interest in the remaining percentages of the outstanding principal balances of the Class A-S, Class B and Class C trust components and which portions of these trust components are respectively referred to in this Term Sheet as the “Class PST Component A-S, Class PST Component B and Class PST Component C” (collectively, the “Class PST Components”). Interest, principal, prepayment premiums, yield maintenance charges and voting rights that are allocated to the Class A-S, Class B or Class C trust component will be distributed or allocated, as applicable, as between the Class A-S, Class B or Class C Certificates, as applicable, on the one hand, and Class PST Component A-S, Class PST Component B or Class PST Component C, as applicable (and correspondingly, the Class PST Certificates), on the other hand, pro rata, based on their respective percentage interests in the Class A-S, Class B or Class C trust component, as applicable. In addition, any losses (including, without limitation, as a result of trust advisor expenses) or collateral support deficit that are allocated to the Class A-S, Class B or Class C trust component will correspondingly be allocated as between the Class A-S, Class B or Class C Certificates, as applicable, on the one hand, and Class PST Component A-S, Class PST Component B or Class PST Component C, as applicable (and correspondingly, the Class PST Certificates), on the other hand, pro rata, based on their respective percentage interests in the Class A-S, Class B or Class C trust component, as applicable. For a complete description of the allocations and distributions with respect to the Class A-S trust component, the Class B trust component and the Class C trust component (and correspondingly the Class A-S, Class B, Class PST and Class C Certificates and the Class PST Component A-S, Class PST Component B and Class PST Component C), see “Description of the Offered Certificates” in the Free Writing Prospectus. See “Material Federal Income Tax Consequences” in the Free Writing Prospectus for a discussion of the tax treatment of the Exchangeable Certificates. |
Exchanges of Exchangeable Certificates: | If you own Class A-S, Class B and Class C Certificates, you will be able to exchange them for a proportionate interest in the Class PST Certificates, and vice versa, as described in the Free Writing Prospectus. You can exchange your Exchangeable Certificates by notifying the certificate administrator. If Exchangeable Certificates are outstanding and held by certificateholders, those certificates will receive principal and interest that would otherwise have been payable on the same proportion of certificates exchanged therefor if those certificates were outstanding and held by certificateholders. Any such allocations of principal and interest as between classes of Exchangeable Certificates will have no effect on the principal or interest entitlements of any other class of certificates. The Free Writing Prospectus describes the available combinations of Exchangeable Certificates eligible for exchange. |
| This is not a research report and was not prepared by the Underwriters’ research departments. Please see additional important information and qualifications at the end of this Term Sheet. |
T-6
| MSBAM 2013-C12 | Structural Overview |
| Special Servicer Compensation: | The special servicer is entitled to a special servicing fee payable from general collections on the mortgage loans. The special servicing fee for each distribution date is calculated based on the outstanding principal balance of each mortgage loan that is a specially serviced mortgage loan or as to which the related mortgaged property has become an REO property at the special servicing fee rate, which will be approximately 0.25% per annum. Any primary servicing fee or sub-servicing fee will be paid by the special servicer out of the fees described above. The special servicer is also entitled to additional fees and amounts, including, without limitation, income on the amounts held in permitted investments. The special servicer will also be entitled to (i) liquidation fees generally equal to 1.0% of liquidation proceeds in respect of a specially serviced mortgage loan or REO property and (ii) workout fees generally equal to 1.0% of interest and principal payments made in respect of a rehabilitated mortgage loan, subject to a cap with respect to each such fee of $1,000,000 with respect to any mortgage loan or REO property and subject to certain adjustments and exceptions as described in the Free Writing Prospectus under “Servicing of the Mortgage Loans—The Special Servicer—Special Servicer Compensation.” With respect to any non-serviced mortgage loan, the related special servicer under the related other pooling and servicing agreement pursuant to which such mortgage loan is being serviced will be entitled to similar compensation as that described above with respect to such non-serviced mortgage loan under such other pooling and servicing agreement as further described in the Free Writing Prospectus. |
Prepayment Premiums/Yield Maintenance Charges: | On any distribution date, prepayment premiums or yield maintenance charges collected in respect of each mortgage loan during the related collection period will be distributed by the certificate administrator on the classes of certificates or trust components as follows: to each class of principal balance certificates (other than the Exchangeable Certificates and the Class E, Class F, Class G and Class H Certificates) and each trust component then entitled to distributions of principal on such distribution date, an amount equal to the product of (a) a fraction, the numerator of which is the amount distributed as principal to that class or trust component on that distribution date, and the denominator of which is the total amount distributed as principal to all classes of principal balance certificates and, without duplication, trust components on that distribution date, (b) the Base Interest Fraction for the related principal prepayment and that class or trust component and (c) the amount of the prepayment premium or yield maintenance charge collected in respect of such principal prepayment during the one month period ending on the related determination date. Any prepayment premiums or yield maintenance charges relating to the mortgage loans collected during the related collection period and remaining after those distributions described above (as to the applicable distribution date, the “Class X YM Distribution Amount”) will be distributed to the holders of the Class X Certificates, as follows: first, to holders of the Class X-A Certificates in an amount equal to the product of (a) a fraction, the numerator of which is the total amount of principal distributed with respect to the Class A-1, Class A-2, Class A-SB, Class A-3 and Class A-4 Certificates and the Class A-S trust component on the applicable distribution date, and the denominator of which is the total principal distributed with respect to the principal balance certificates on the applicable distribution date, multiplied by (b) the Class X YM Distribution Amount for the applicable distribution date; and second, to the holders of the Class X-C Certificates in an amount equal to the portion of the Class X YM Distribution Amount remaining after the distributions to the holders of the Class X-A Certificates. Distributions of prepayment premiums and yield maintenance charges made on the Class A-S trust component, the Class B trust component and the Class C trust component will be distributed to the Class A-S, Class B and Class C Certificates and the Class PST Components (and correspondingly the Class PST Certificates) as described above in “Allocations and Distributions on the Class A-S, Class B, Class PST and Class C Certificates.” No prepayment premiums or yield maintenance charges will be distributed to holders of the Class E, Class F, Class G or Class H Certificates or the Class R Certificates. The “Base Interest Fraction,” with respect to any principal prepayment of any mortgage loan that provides for payment of a prepayment premium or yield maintenance charge, and with respect to any class of principal balance certificates (other than the Class E Certificates, the Exchangeable Certificates and the Control Eligible Certificates) or trust component, is a fraction (A) whose numerator is the greater of (x) zero and (y) the difference between (i) the pass-through rate on that class of certificates or trust component, as applicable, and (ii) the applicable discount rate and (B) whose denominator is the difference between (i) the mortgage interest rate on the related mortgage loan and (ii) the applicable discount rate; provided, that under no circumstances will the Base Interest Fraction be greater than one. If the discount rate referred to above is greater than or equal to the mortgage interest rate on the related mortgage loan, then the Base Interest Fraction will equal zero; provided, that if the discount rate referred to above is greater than or equal to the mortgage interest rate on the related mortgage loan, but is less than the pass-through rate on the subject class of certificates or trust component, then the Base Interest Fraction shall be equal to 1.0. Consistent with the foregoing, the Base Interest Fraction is equal to: |
| (Pass-Through Rate – Discount Rate) | |||
(Mortgage Rate – Discount Rate) |
| This is not a research report and was not prepared by the Underwriters’ research departments. Please see additional important information and qualifications at the end of this Term Sheet. |
T-7
| MSBAM 2013-C12 | Structural Overview |
Collateral Support Deficits: | On each distribution date, immediately following the distributions made to the certificateholders on that date, the certificate administrator will be required to calculate the amount, if any, by which (1) the aggregate stated principal balance of the mortgage loans, including any mortgage loans as to which the related mortgaged properties have become REO properties, expected to be outstanding immediately following that distribution date, is less than (2) the aggregate principal balance of the principal balance certificates after giving effect to distributions of principal on that distribution date and the allocation of any excess trust advisor expenses to reduce the principal balances of the principal balance certificates that are not Control Eligible Certificates on that distribution date (any such deficit, a “Collateral Support Deficit”). On each distribution date, the certificate administrator will be required to allocate any Collateral Support Deficit to the respective classes of principal balance certificates (other than the Exchangeable Certificates) and the trust components in the following order: to the Class H Certificates, the Class G Certificates, the Class F Certificates, the Class E Certificates, the Class D Certificates, the Class C trust component, the Class B trust component, and the Class A-S trust component, in that order, in each case in reduction of and until the remaining principal balance of that class of certificates or trust components has been reduced to zero. Following the reduction of the principal balances of all such classes of subordinate certificates to zero, the certificate administrator will be required to allocate the Collateral Support Deficit to the Class A-1, Class A-2, Class A-SB, Class A-3 and Class A-4 Certificates, pro rata (based upon their respective principal balances), until the remaining principal balances of those classes of certificates have been reduced to zero. Any Collateral Support Deficit allocated to a class of certificates will be allocated to the respective certificates of such class in proportion to the percentage interests evidenced by the respective certificates. Collateral Support Deficit allocated to the Class A-S, Class B and Class C trust components will, in turn, be allocated to the Class A-S, Class B, Class PST and Class C Certificates as described above in “Allocations and Distributions on the Class A-S, Class B, Class PST and Class C Certificates.” |
| Appraisal Reductions: | The occurrence of certain adverse events affecting a mortgage loan (other than a non-serviced mortgage loan) (“Appraisal Events”)) will require the special servicer to obtain a new appraisal or other valuation of the related mortgaged property. In general, if the principal amount of a mortgage loan plus all other amounts due under the mortgage loan and interest on advances made with respect to the mortgage loan exceeds 90% of the value of the mortgaged property determined by an appraisal or other valuation, an appraisal reduction may be created in the amount of the excess as described in the Free Writing Prospectus. Notwithstanding the foregoing, if an appraisal is required to be obtained in accordance with the pooling and servicing agreement but is not obtained within one hundred twenty (120) days following the applicable Appraisal Event, then, until such appraisal is obtained and solely for purposes of determining the amounts of P&I advances, the appraisal reduction will equal 25% of the stated principal balance of the related mortgage loan; provided that, upon receipt of an appraisal, the appraisal reduction for such mortgage loan will be recalculated generally in accordance with the preceding sentence. Notwithstanding the foregoing, any appraisal reduction in respect of any non-serviced mortgage loan generally will be calculated in accordance with the related non-serviced mortgage loan pooling and servicing agreement, which calculations are generally similar to those provided for in the pooling and servicing agreement for this transaction. The non-serviced mortgage loans in this mortgage pool are the Westfield Countryside mortgage loan and the Burnham Center mortgage loan. If any mortgage loan is part of an A/B whole loan or loan pair or non-serviced loan combination, any appraisal reduction will be calculated in respect of such A/B whole loan or loan pair or non-serviced loan combination taken as a whole. With respect to an A/B whole loan, any such appraisal reduction will be allocated first to the related B note and then to the related A note. With respect to a loan pair or non-serviced loan combination, any such appraisal reduction will be allocated between the mortgage loan and the related serviced companion loan or non-serviced companion loan, respectively, on a pro rata basis by unpaid principal balance. The loan pairs related to this mortgage pool are the 15 MetroTech Center Loan Pair and the Marriott Chicago River North Hotel Loan Pair. There are no mortgage loans that are part of an A/B whole loan included in this mortgage pool. If an appraisal reduction exists for or is allocable to any mortgage loan, the interest portion of the amount required to be advanced on that mortgage loan will be reduced in the same proportion that the appraisal reduction bears to the stated principal balance of that mortgage loan. This will reduce the funds available to pay interest on the certificates or trust components, as applicable, then outstanding. For a discussion of how Appraisal Reductions are calculated and allocated, see “Description of the Offered Certificates—Appraisal Reductions” in the Free Writing Prospectus. |
| Loan Pairs: | The mortgaged property identified on Appendix I to the Free Writing Prospectus as 15 MetroTech Center secures a mortgage loan (the “15 MetroTech Center Mortgage Loan”) with an outstanding principal balance as of the Cut-off Date of $89,857,812, representing approximately 7.0% of the initial pool balance. The 15 MetroTech Center Mortgage Loan is secured on a pari passu basis with a serviced companion loan that has an outstanding principal balance as of the Cut-off Date of $79,873,611 and that is not part of the mortgage pool and is currently held by the COMM 2013-LC13 Mortgage Trust. The 15 MetroTech Center Mortgage Loan and the related serviced companion loan are pari passu in right of payment and collectively are referred to herein as the “15 MetroTech Center Loan Pair.” The mortgaged property identified on Appendix I to the Free Writing Prospectus as Marriott Chicago River North Hotel secures a mortgage loan (the “Marriott Chicago River North Hotel Mortgage Loan”) with an outstanding principal balance as of the Cut-off Date of $64,797,112, representing approximately 5.1% of the initial pool balance. The Marriott Chicago River North Hotel Mortgage Loan is secured on a pari passu basis with a serviced companion loan that has an outstanding principal balance as of the Cut-off Date of |
| This is not a research report and was not prepared by the Underwriters’ research departments. Please see additional important information and qualifications at the end of this Term Sheet. |
T-8
| MSBAM 2013-C12 | Structural Overview |
| $54,828,325, is not part of the mortgage pool and is currently held by Morgan Stanley Bank of America Merrill Lynch Trust 2013-C11. The Marriott Chicago River North Hotel Mortgage Loan and the related serviced companion loan are pari passu in right of payment and collectively are referred to herein as the “Marriott Chicago River North Hotel Loan Pair.” The 15 MetroTech Center Loan Pair and the Marriott Chicago River North Hotel Loan Pair are expected to be serviced pursuant to the related intercreditor agreement and the pooling and servicing agreement related to this transaction. For additional information regarding the 15 MetroTech Center Loan Pair and the Marriott Chicago River North Hotel Loan Pair, see “Description of the Mortgage Pool—The A/B Whole Loans and the Loan Pairs” in the Free Writing Prospectus. | |
| Non-Serviced Mortgage Loans: | The mortgaged property identified on Appendix I to the Free Writing Prospectus as Westfield Countryside secures a mortgage loan (the “Westfield Countryside Mortgage Loan”) with an outstanding principal balance as of the Cut-off Date of $55,000,000, representing approximately 4.3% of the initial pool balance. The Westfield Countryside Mortgage Loan is secured on a pari passu basis with another mortgage loan (the “Westfield Countryside Non-Serviced Companion Loan,” and together with the Westfield Countryside Mortgage Loan, the “Westfield Countryside Non-Serviced Loan Combination”) that has an aggregate outstanding principal balance as of the Cut-off Date of $100,000,000, is not part of the mortgage pool and is currently held by Morgan Stanley Bank of America Merrill Lynch Trust 2013-C11. The Westfield Countryside Mortgage Loan and the Westfield Countryside Non-Serviced Companion Loan are pari passu in right of payment. The Westfield Countryside Mortgage Loan is a “non-serviced mortgage loan” and the Westfield Countryside Non-Serviced Companion Loan is a “non-serviced companion loan.” The Westfield Countryside Non-Serviced Loan Combination is currently being serviced pursuant to the pooling and servicing agreement related to Morgan Stanley Bank of America Merrill Lynch Trust 2013-C11 and the related intercreditor agreement. Accordingly, in the case of such non-serviced mortgage loan and non-serviced companion loan, various servicing actions described in this Term Sheet are actually being performed by the master servicer and/or special servicer under, and in accordance with, the Morgan Stanley Bank of America Merrill Lynch Trust 2013-C11 pooling and servicing agreement. The mortgaged property identified on Appendix I to the Free Writing Prospectus as Burnham Center secures a mortgage loan (the “Burnham Center Mortgage Loan”) with an outstanding principal balance as of the Cut-off Date of $15,368,778, representing approximately 1.2% of the initial pool balance. The Burnham Center Mortgage Loan is secured on a pari passu basis with another mortgage loan (the “Burnham Center Non-Serviced Companion Loan,” and together with the Burnham Center Mortgage Loan, the “Burnham Center Non-Serviced Loan Combination”) that has an aggregate outstanding principal balance as of the Cut-off Date of $31,233,323, is not part of the mortgage pool and is currently held by Morgan Stanley Bank of America Merrill Lynch Trust 2013-C10. The Burnham Center Mortgage Loan and the Burnham Center Non-Serviced Companion Loan are pari passu in right of payment. The Burnham Center Mortgage Loan is a “non-serviced mortgage loan” and the Burnham Center Non-Serviced Companion Loan is a “non-serviced companion loan.” The Burnham Center Non-Serviced Loan Combination is currently being serviced pursuant to the pooling and servicing agreement related to Morgan Stanley Bank of America Merrill Lynch Trust 2013-C10 and the related intercreditor agreement. Accordingly, in the case of such non-serviced mortgage loan and non-serviced companion loan, various servicing actions described in this Term Sheet are actually being performed by the master servicer and/or special servicer under, and in accordance with, the Morgan Stanley Bank of America Merrill Lynch Trust 2013-C10 pooling and servicing agreement. For additional information regarding the non-serviced loan combinations related to this transaction, see “Description of the Mortgage Pool—The Non-Serviced Loan Combinations” in the Free Writing Prospectus. |
| Control Rights: | Subject to the limitations described below under “A/B Whole Loan, Loan Pair and Non-Serviced Mortgage Loan Control Rights” in respect of any A/B whole loans, loan pairs or non-serviced mortgage loans, during any Subordinate Control Period, the controlling class representative will have certain consent and consultation rights under the pooling and servicing agreement with respect to certain major decisions and other matters. A “Subordinate Control Period” means any period when the aggregate principal balance of the Class F Certificates (taking into account the application of appraisal reductions to notionally reduce the aggregate principal balance of such class) is at least 25% of the initial aggregate principal balance of that class. During any Collective Consultation Period, the controlling class representative will not have any consent rights, but the controlling class representative and the trust advisor will each have certain non-binding consultation rights under the pooling and servicing agreement with respect to certain major decisions and other matters. A “Collective Consultation Period” means any period when both (i) the aggregate principal balance of the Class F Certificates (taking into account the application of appraisal reductions to notionally reduce the aggregate principal balance of such class), is less than 25% of the initial aggregate principal balance of the Class F Certificates and (ii) the aggregate principal balance of that class (without regard to any appraisal reductions allocable to such class), is at least 25% of the initial aggregate principal balance of that class. During any Senior Consultation Period, the controlling class representative will not have any consent or consultation rights, except with respect to any rights expressly set forth in the pooling and servicing agreement, and the trust advisor will retain certain non-binding consultation rights under the pooling and servicing agreement with respect to certain major decisions and other matters. A “Senior Consultation Period” means a period when the aggregate principal balance of the Class F Certificates (without regard to any appraisal reductions allocable to such class) is less than 25% of the initial aggregate principal balance of that class. See “Servicing of the Mortgage Loans—The Controlling Class Representative” in the Free Writing Prospectus. |
| This is not a research report and was not prepared by the Underwriters’ research departments. Please see additional important information and qualifications at the end of this Term Sheet. |
T-9
| MSBAM 2013-C12 | Structural Overview |
A/B Whole Loan, Loan Pair and Non-Serviced Mortgage Loan Control Rights: | If any mortgage loan is part of an A/B whole loan or loan pair or is a non-serviced mortgage loan, the controlling class representative’s consent and/or consultation rights with respect thereto may be limited as described in the Free Writing Prospectus. There are no mortgage loans that are part of an A/B whole loan included in the mortgage pool. The controlling class representative under the pooling and servicing agreement related to Morgan Stanley Bank of America Merrill Lynch Trust 2013-C11 will generally be the controlling holder of the Westfield Countryside Non-Serviced Loan Combination and, subject to the terms of that pooling and servicing agreement, will generally have consent rights with respect to certain major decisions and other matters related to the Westfield Countryside Non-Serviced Loan Combination. The controlling class representative under the pooling and servicing agreement related to Morgan Stanley Bank of America Merrill Lynch Trust 2013-C10 will generally be the controlling holder of the Burnham Center Non-Serviced Loan Combination and, subject to the terms of that pooling and servicing agreement, will generally have consent rights with respect to certain major decisions and other matters related to the Burnham Center Non-Serviced Loan Combination. The controlling class representative under the pooling and servicing agreement for this transaction will only have certain consultation rights with respect to certain major decisions and other matters related to the Westfield Countryside Non-Serviced Loan Combination and Burnham Center Non-Serviced Loan Combination, and only during a Subordinate Control Period and a Collective Consultation Period. Each holder of the 15 MetroTech Center serviced companion loan and the Marriott Chicago River North Hotel serviced companion loan will have certain consultation rights under the pooling and servicing agreement with respect to certain major decisions and other matters related to the 15 MetroTech Center Loan Pair and the Marriott Chicago River North Hotel Loan Pair, respectively. See “Risk Factors—Realization on a Mortgage Loan That Is Part of an A/B Whole Loan or Loan Pair May Be Adversely Affected by the Rights of the Related Directing Holder” and “Description of the Mortgage Pool—The A/B Whole Loans and the Loan Pairs” and “Description of the Mortgage Pool—The Non-Serviced Loan Combinations” in the Free Writing Prospectus. |
| Control Eligible Certificates: | The “Control Eligible Certificates” will be the Class F, Class G and Class H Certificates. |
Controlling Class Representative/ Controlling Class: | The controlling class representative will be the representative appointed by more than 50% of the Controlling Class (by principal balance). The “Controlling Class” will be the most subordinate class of Control Eligible Certificates then outstanding that has an aggregate principal balance (taking into account the application of any appraisal reductions to notionally reduce the aggregate principal balance of such class) at least equal to 25% of the initial aggregate principal balance of such class; provided that if no class of Control Eligible Certificates has an aggregate principal balance (taking into account the application of any appraisal reductions to notionally reduce the aggregate principal balance of such class) at least equal to 25% of the initial aggregate principal balance of such class, then the Controlling Class will be the most senior class of Control Eligible Certificates. A summary of the consent and consultation rights of the controlling class representative, and the limitations thereon, is set forth above under “Control Rights.” The Controlling Class on the closing date will be the Class H Certificates. The initial controlling class representative will be Blackrock Financial Management, Inc., on behalf of one of its managed funds or accounts. |
| Appraised-Out Class: | Any class of Control Eligible Certificates, the aggregate principal balance of which (taking into account the application of any appraisal reductions to notionally reduce the aggregate principal balance of such class) has been reduced to less than 25% of its initial aggregate principal balance, is referred to as an “Appraised-Out Class.” |
| Appraisal Remedy: | The holders of the majority (by principal balance) of an Appraised-Out Class will have the right, at their sole expense, to present to the special servicer a second appraisal for any mortgage loan (other than with respect to any non-serviced mortgage loan) for which an Appraisal Event has occurred prepared by an MAI appraiser on an “as-is” basis acceptable to the special servicer in accordance with the Servicing Standard. Upon receipt of such second appraisal, the special servicer will be required to determine, in accordance with the Servicing Standard, whether, based on its assessment of such second appraisal, any recalculation of the applicable appraisal reduction is warranted and, if so warranted, will recalculate such appraisal reduction based upon such second appraisal. If required by any such recalculation, any applicable Appraised-Out Class will have its related principal balance notionally restored to the extent required by such recalculation of the appraisal reduction, and there will be a redetermination of whether a Subordinate Control Period, a Collective Consultation Period or a Senior Consultation Period is then in effect. However, until an Appraised-Out Class is restored as the Controlling Class, the next most senior class of Control Eligible Certificates that is not an Appraised-Out Class (or, if all classes of Control Eligible Certificates are Appraised-Out Classes, the most senior class of Control Eligible Certificates), if any, will be the Controlling Class. The right of any Appraised-Out Class to present a second appraisal of any mortgage loan for which an Appraisal Event has occurred is limited to one appraisal with respect to each mortgaged property relating to the affected mortgage loan, subject to certain exceptions regarding a material change in circumstance. No certificateholders of an Appraised-Out Class will have appraisal remedies in respect of a non-serviced mortgage loan under the pooling and servicing agreement for this transaction. |
| Sale of Defaulted Loans: | Defaulted loans will be sold in a process similar to the sale process for REO property, as described under “Servicing of the Mortgage Loans—Sale of Defaulted Mortgage Loans and REO Properties” in the Free Writing Prospectus. There will be no “fair market value purchase option” and the controlling class representative will have no right of first refusal with respect to the sale of defaulted loans. |
| This is not a research report and was not prepared by the Underwriters’ research departments. Please see additional important information and qualifications at the end of this Term Sheet. |
T-10
| MSBAM 2013-C12 | Structural Overview |
Appointment and Termination of Special Servicer: | The controlling class representative will appoint the initial special servicer (but not with respect to any non-serviced mortgage loan). During any Subordinate Control Period, the special servicer (other than with respect to any non-serviced mortgage loan) may be replaced at any time by the controlling class representative. During any Collective Consultation Period and any Senior Consultation Period, the special servicer (other than with respect to any non-serviced mortgage loan) will be subject to termination without cause if certificateholders evidencing not less than 25% of voting rights request a vote of certificateholders to replace the special servicer. The certificate administrator would present the proposal to all certificateholders and replacement would be conditioned on receipt, within one hundred eighty (180) days thereafter, of approval of the termination from holders of 75% of the voting rights of the certificates. The holders initiating such vote will be responsible for the fees and expenses of the issuing entity in connection with the replacement. During any Senior Consultation Period, if the trust advisor determines that the special servicer is not performing its duties in accordance with the Servicing Standard, the trust advisor will have the right to recommend the replacement of the special servicer. The trust advisor’s recommendation to replace the special servicer must be confirmed by an affirmative vote of holders of a majority of the voting rights of the principal balance certificates. For purposes of the voting rights described above, the Class A-S, Class B, Class PST and Class C Certificates will be allocated voting rights in accordance with their respective percentage interests in the applicable Class A-S, Class B and Class C trust components as described in the Free Writing Prospectus. In addition, if any mortgage loan is part of an A/B whole loan or loan pair or is a non-serviced mortgage loan, to the extent set forth in the related intercreditor agreement, the related directing holder may have the right to replace the special servicer, with respect to the related A/B whole loan or loan pair or non-serviced mortgage loan to the extent set forth in the related intercreditor agreement. See “Description of the Mortgage Pool—The A/B Whole Loans and the Loan Pairs” in the Free Writing Prospectus. There are no mortgage loans that are part of an A/B whole loan included in the mortgage pool. |
| Servicing Standard: | Each of the master servicer and the special servicer is obligated to service and administer the mortgage loans (and, if applicable, the related B notes and serviced companion loans but not any non-serviced mortgage loans) in accordance with the definition of the “Servicing Standard” described in the Free Writing Prospectus and the terms of the pooling and servicing agreement. |
Defaulted Mortgage Loan Waterfall: | Amounts received by the issuing entity in respect of defaulted mortgage loans in connection with liquidation of any mortgage loan, net of unreimbursed advances and interest thereon, servicing compensation, and other amounts payable or reimbursable therefrom, will be applied so that amounts allocated as a recovery of accrued and unpaid interest will not, in the first instance, include any amount by which the interest portion of P&I advances previously made was reduced as a result of appraisal reductions. After the adjusted interest amount is so allocated, any remaining net proceeds will be allocated to pay principal on the mortgage loan until the unpaid principal amount of the mortgage loan has been reduced to zero. Any remaining proceeds would then be allocated as a recovery of accrued and unpaid interest corresponding to the amount by which the interest portion of P&I advances previously made was reduced as a result of appraisal reductions. |
| Trust Advisor: | The trust advisor will be required to promptly review all information available to certain privileged persons on the certificate administrator’s website related to any specially serviced mortgage loan or REO property and each asset status report with respect to specially serviced mortgage loans (provided that during any Subordinate Control Period, the trust advisor may only review final asset status reports). During any Collective Consultation Period and any Senior Consultation Period, within sixty (60) days after the end of each calendar year during which any mortgage loan was a specially serviced mortgage loan or any mortgaged property was an REO property, the trust advisor will be required to meet with representatives of the special servicer to review certain operational practices of the special servicer related to specially serviced mortgage loans and REO properties. In addition, during any Collective Consultation Period and any Senior Consultation Period, based on (i) the trust advisor’s annual meeting with the special servicer and (ii) the trust advisor’s review of any asset status reports and other information delivered to the trust advisor by the special servicer and any other information available to certain privileged persons on the certificate administrator’s website, the trust advisor will be required to prepare an annual report to be provided to the certificate administrator (and to be made available through the certificate administrator’s website) setting forth its assessment of the special servicer’s performance of its duties under the pooling and servicing agreement during the prior calendar year on a platform-level basis with respect to the resolution and liquidation of specially serviced mortgage loans and REO properties. No such annual report will be required to be prepared or delivered in any calendar year during which no annual meeting occurred or with respect to any calendar year during which no asset status reports have been prepared in connection with a specially serviced mortgage loan or REO property. Furthermore, during any Collective Consultation Period and any Senior Consultation Period, the special servicer will be required to consult (on a non-binding basis) the trust advisor in connection with certain major decisions involving any serviced mortgage loan, A/B whole loan, loan pair or any related REO property to the extent described in this Term Sheet, the Free Writing Prospectus and as set forth in the pooling and servicing agreement; provided that, with respect to matters relating to any A/B whole loan or loan pair, the special servicer will only be required to consult the trust advisor with regard to such matters if the holder of the related B note or serviced companion loan, as applicable, is not (or is no longer) the directing holder with respect to such A/B whole loan or loan pair pursuant to the terms of the applicable intercreditor agreement. The trust advisor will have no consultation rights with respect to any non-serviced mortgage loan or any related non-serviced companion loan. |
| This is not a research report and was not prepared by the Underwriters’ research departments. Please see additional important information and qualifications at the end of this Term Sheet. |
T-11
| MSBAM 2013-C12 | Structural Overview |
| During any Subordinate Control Period, there will be no annual meeting between the trust advisor and the special servicer or any annual report prepared by the trust advisor, the trust advisor will not be permitted to consult or consent with regard to any particular servicing actions, and the trust advisor will not distribute any report based on any review of the special servicer’s actions or otherwise opine on the actions of the special servicer with respect to any transaction. | |
| Trust Advisor Expenses: | The trust advisor will be entitled, on each distribution date, to reimbursement for any trust advisor expenses, including unreimbursed indemnification amounts and other expenses (other than trust advisor fees) payable to the trust advisor pursuant to the terms of the pooling and servicing agreement. No trust advisor expenses will be allocated to or otherwise borne by the Control Eligible Certificates, and all trust advisor expenses will be allocated to reduce amounts due and owing to certain classes of the non-Control Eligible Certificates as described in the Free Writing Prospectus and above in this Term Sheet. |
Termination and Replacement of Trust Advisor: | If the holders of at least 25% of the voting rights of the certificates request a vote to terminate and/or replace the trust advisor, then the holders of at least 75% of the voting rights of the certificates may either (i) terminate all rights and obligations of the trust advisor under the pooling and servicing agreement and replace the trust advisor, or (ii) terminate all rights and obligations of the trust advisor and not appoint a replacement trust advisor, until such time as the holders of at least 75% of the voting rights of the certificates agree to the appointment of a replacement trust advisor. During any Subordinate Control Period and any Collective Consultation Period, the controlling class representative will have the right to consent, such consent not to be unreasonably withheld, to any replacement trust advisor; provided, that such consent will be deemed granted if no objection is made within ten (10) business days following the controlling class representative’s receipt of the request for consent. Any such consent will be required to be solicited from the controlling class representative before any related vote. For purposes of the voting rights described above, the Class A-S, Class B, Class PST, and Class C Certificates will be allocated voting rights in accordance with their respective percentage interests in the applicable Class A-S, Class B and Class C trust components as described in the Free Writing Prospectus. See “Servicing of the Mortgage Loans—The Trust Advisor—Termination of the Trust Advisor Without Cause” in the Free Writing Prospectus. |
| Deal Website: | The certificate administrator will be required to maintain a deal website which will include, among other items, (i) distribution date statements, (ii) CREFC reports, (iii) summaries of final asset status reports, (iv) inspection reports, (v) appraisals, (vi) various special notices described in the Free Writing Prospectus, (vii) the “Investor Q&A Forum” and (viii) a voluntary “Investor Registry.” Investors may access the deal website following execution of an investor certification as described in the Free Writing Prospectus. |
| This is not a research report and was not prepared by the Underwriters’ research departments. Please see additional important information and qualifications at the end of this Term Sheet. |
T-12
(THIS PAGE INTENTIONALLY LEFT BLANK)
| This is not a research report and was not prepared by the Underwriters’ research departments. Please see additional important information and qualifications at the end of this Term Sheet. |
T-13
| MSBAM 2013-C12 | Collateral Overview |
| Mortgage Loan Sellers | No. of Mortgage Loans | No. of Mortgaged Properties | Aggregate Cut-off Date Balance | % of Pool(1) | |
| Morgan Stanley Mortgage Capital Holdings LLC | 42 | 43 | $755,240,060 | 59.2% | |
| Bank of America, National Association | 23 | 34 | $389,428,956 | 30.5% | |
| CIBC Inc. | 7 | 16 | $131,647,941 | 10.3% | |
| Total: | 72 | 93 | $1,276,316,957 | 100.0% |
Pool Statistics
| Aggregate Cut-off Date Balance: | $1,276,316,957 |
| Number of Mortgage Loans: | 72 |
| Average Cut-off Date Balance per Mortgage Loan: | $17,726,624 |
| Number of Mortgaged Properties: | 93 |
| Average Cut-off Date Balance per Mortgaged Property: | $13,723,838 |
| Weighted Average Mortgage Rate: | 4.796% |
| % of Pool Secured by 5 Largest Mortgage Loans: | 33.3% |
| % of Pool Secured by 10 Largest Mortgage Loans: | 48.7% |
| % of Pool Secured by ARD Loans: | 6.6% |
| Weighted Average Original Term to Maturity/ARD (months): | 112 |
| Weighted Average Remaining Term to Maturity/ARD (months): | 111 |
| Weighted Average Seasoning (months): | 2 |
| % of Pool Secured by Single Tenant Mortgaged Properties: | 1.7% |
Additional Debt
% of Pool with Pari Passu Mortgage Debt: | 17.6% |
| % of Pool with Subordinate Mortgage Debt: | 0.0% |
| % of Pool with Mezzanine Debt: | 3.4% |
Credit Statistics(2)
| Weighted Average UW NOI DSCR: | 1.73x |
| Weighted Average UW NOI Debt Yield: | 10.7% |
| Weighted Average UW NCF DSCR: | 1.60x |
| Weighted Average UW NCF Debt Yield: | 9.9% |
| Weighted Average Cut-off Date LTV Ratio: | 63.2% |
| Weighted Average LTV Ratio at Maturity/ARD: | 53.5% |
| (1) | Unless otherwise indicated, all references to “% of Pool” in this Term Sheet reflect a percentage of the aggregate principal balance of the mortgage pool as of the Cut-off Date, after application of all payments of principal due during or prior to October 2013. |
| (2) | With respect to the 15 MetroTech Center Mortgage Loan, the Marriott Chicago River North Hotel Mortgage Loan, the Westfield Countryside Mortgage Loan, and the Burnham Center Mortgage Loan, unless otherwise indicated, all LTV, DSCR and Debt Yield calculations include the related pari passu companion loan. |
| This is not a research report and was not prepared by the Underwriters’ research departments. Please see additional important information and qualifications at the end of this Term Sheet. |
T-14
| MSBAM 2013-C12 | Collateral Overview |
Amortization
| Weighted Average Original Amortization Term (months): | 343 |
| Weighted Average Remaining Amortization Term (months): | 342 |
| % of Pool Amortizing Balloon: | 58.9% |
| % of Pool Fully Amortizing: | 0.4% |
| % of Pool Interest Only followed by Amortizing Balloon: | 30.4% |
| % of Pool Interest Only through Maturity/ARD: | 10.4% |
Lockboxes
| % of Pool with Hard Lockboxes: | 58.3% |
| % of Pool with Soft Lockboxes: | 13.1% |
| % of Pool with Springing Lockboxes: | 24.0% |
| % of Pool with No Lockboxes: | 4.7% |
Reserves
| % of Pool Requiring Tax Reserves: | 72.8% |
| % of Pool Requiring Insurance Reserves: | 20.2% |
| % of Pool Requiring Replacement Reserves: | 70.4% |
% of Pool Requiring TI/LC Reserves(3): | 56.3% |
Call Protection
| % of Pool with lockout period, followed by defeasance until open period: | 69.5% |
| % of Pool with lockout period, followed by the greater of a prepayment premium and yield maintenance until open period: | 11.2% |
| % of Pool with the greater of a prepayment premium and yield maintenance, followed by defeasance or the greater of a prepayment premium and yield maintenance until open period: | 13.7% |
| % of Pool with lockout period, followed by defeasance or the greater of a prepayment premium and yield maintenance until open period: | 5.0% |
| % of Pool with the greater of a prepayment premium and yield maintenance, until open period: | 0.6% |
| (3) | Based only on mortgage loans secured by retail, office, mixed use, and industrial properties. |
| This is not a research report and was not prepared by the Underwriters’ research departments. Please see additional important information and qualifications at the end of this Term Sheet. |
T-15
MSBAM 2013-C12 | Characteristics of the Mortgage Loans |
| Top 10 Mortgage Loans | |||||||||||||
Loan No. | Mortgage Loan Seller | Property Name | City | State | Property Type | Cut-off Date Balance | % of Pool | NSF/Units | Cut-off Date Balance PSF/Unit | UW NCF DSCR | UW NOI Debt Yield | Cut-off Date LTV | Balloon LTV(1) |
| 1 | MSMCH | Merrimack Premium Outlets | Merrimack | NH | Retail | $130,000,000 | 10.2% | 408,996 | $317.85 | 1.64x | 9.8% | 59.1% | 49.6% |
| 2 | BANA | 15 MetroTech Center(2) | Brooklyn | NY | Office | $89,857,812 | 7.0% | 649,492 | $261.33 | 1.42x | 11.1% | 62.2% | 47.4% |
| 3 | MSMCH | City Creek Center | Salt Lake City | UT | Retail | $84,780,738 | 6.6% | 348,537 | $243.25 | 1.82x | 11.8% | 52.3% | 42.3% |
| 4 | BANA | Marriott Chicago River North Hotel(3) | Chicago | IL | Hospitality | $64,797,112 | 5.1% | 523 | $228,729.33 | 1.50x | 11.8% | 62.6% | 47.5% |
| 5 | MSMCH | Westfield Countryside(4) | Clearwater | FL | Retail | $55,000,000 | 4.3% | 464,836 | $333.45 | 1.66x | 10.1% | 57.4% | 52.1% |
| 6 | MSMCH | Point at Las Colinas | Irving | TX | Office | $43,500,000 | 3.4% | 398,771 | $109.09 | 1.93x | 9.4% | 72.5% | 72.5% |
| 7 | CIBC | Westland Retail Portfolio | Various | Various | Retail/Office | $40,357,805 | 3.2% | 300,124 | $134.47 | 1.42x | 11.0% | 55.1% | 41.9% |
| 8 | MSMCH | Rolling Valley Mall | Burke | VA | Retail | $40,200,000 | 3.1% | 237,214 | $169.47 | 1.31x | 9.2% | 72.4% | 63.0% |
| 9 | MSMCH | Florida Hotel & Conference Center | Orlando | FL | Hospitality | $37,250,000 | 2.9% | 511 | $72,896.28 | 1.49x | 12.9% | 59.1% | 53.0% |
| 10 | MSMCH | 385 Fifth Avenue | New York | NY | Office | $36,100,000 | 2.8% | 102,219 | $353.16 | 1.31x | 8.8% | 65.6% | 60.1% |
| Total/Wtd. Avg. | $621,843,467 | 48.7% | 1.58x | 10.6% | 60.8% | 51.1% | |||||||
| (1) | For any mortgage loan with an anticipated repayment date, the balloon LTV is calculated as of such anticipated repayment date and not the final maturity date. |
| (2) | The 15 MetroTech Center Mortgage Loan is part of a $170,000,000 (original principal balance) pari passu loan pair evidenced by four pari passu promissory notes. The 15 MetroTech Center Mortgage Loan is evidenced by two such pari passu notes (Note A-1A and Note A-1B) with an aggregate outstanding principal balance as of the Cut-off Date of $89,857,812. The two pari passu notes not included in the Issuing Entity (Note A-2A and Note A-2B) evidence the related companion loan, which has an outstanding principal balance as of the Cut-off Date of $79,873,611. Unless otherwise indicated, all LTV, DSCR, Debt Yield and Cut-off Date Balance PSF/Unit calculations include the related pari passu companion loan. |
| (3) | The Marriott Chicago River North Hotel Mortgage Loan is part of a $120,000,000 (original principal balance) pari passu loan pair evidenced by two pari passu promissory notes. The Marriott Chicago River North Hotel Mortgage Loan is evidenced by one such pari passu note (Note A-2) with an outstanding principal balance as of the Cut-off Date of $64,797,112. The pari passu note not included in the Issuing Entity (Note A-1) evidences the related companion loan, which has an outstanding principal balance as of the Cut-off Date of $54,828,325. Unless otherwise indicated, all LTV, DSCR, Debt Yield and Cut-off Date Balance PSF/Unit calculations include the related pari passu companion loan. |
| (4) | The Westfield Countryside Mortgage Loan is part of a $155,000,000 pari passu non-serviced loan combination evidenced by 10 pari passu promissory notes. The Westfield Countryside Mortgage Loan is evidenced by five such pari passu notes (Note A-1-2, Note A-2-2, Note A-3-2, Note B-1-2 and Note B-2-2) with an aggregate outstanding principal balance as of the Cut-off Date of $55,000,000. The pari passu notes not included in the Issuing Entity (Note A-1-1, Note A-2-1, Note A-3-1, Note B-1-1 and Note B-2-1) evidence the related non-serviced companion loan, which has an outstanding principle balance as of the Cut-off Date of $100,000,000. Unless otherwise indicated, all LTV, DSCR, Debt Yield and Cut-off Date Balance PSF/Unit calculations include the related pari passu non-serviced companion loan. |
| This is not a research report and was not prepared by the Underwriters’ research departments. Please see additional important information and qualifications at the end of this Term Sheet. |
T-16
MSBAM 2013-C12 | Characteristics of the Mortgage Loans |
Mortgage Loans with Pari Passu Companion Loans(1) | ||||||||||||
Loan No. | Mortgage Loan Seller | Property Name | Mortgage Loan Cut-off Date Balance | Companion Loan Cut-off Date Balance | Loan Combination Cut-off Date Balance | Controlling Pooling and Servicing Agreement | Master Servicer | Special Servicer | Voting Rights | Total Mortgage Debt UW NCF DSCR | Total Mortgage Debt UW NOI Debt Yield | Total Mortgage Debt Cut-off Date LTV Ratio |
| 2 | BANA | 15 MetroTech Center | $89,857,812 | $79,873,611 | $169,731,423 | MSBAM 2013-C12 | Wells Fargo | Midland | MSBAM 2013-C12 | 1.42x | 11.1% | 62.2% |
| 4 | BANA | Marriott Chicago River North Hotel | $64,797,112 | $54,828,325 | $119,625,437 | MSBAM 2013-C12 | Wells Fargo | Midland | MSBAM 2013-C12 | 1.50x | 11.8% | 62.6% |
| 5 | MSMCH | Westfield Countryside | $55,000,000 | $100,000,000 | $155,000,000 | MSBAM 2013-C11 | Wells Fargo | Midland | MSBAM 2013-C11 | 1.66x | 10.1% | 57.4% |
| 22 | MSMCH | Burnham Center | $15,368,778 | $31,233,323 | $46,602,101 | MSBAM 2013-C10 | Midland | Midland | MSBAM 2013-C10 | 1.23x | 11.1% | 66.6% |
| (1) | With respect to the 15 MetroTech Center Mortgage Loan, the Marriott Chicago River North Hotel Mortgage Loan, the Westfield Countryside Mortgage Loan and the Burnham Center Mortgage Loan, unless otherwise indicated, all LTV, DSCR and Debt Yield calculations include the related pari passu companion loan. |
| Mortgage Loans with Mezzanine Debt | ||||||||||||||||||||||||
Loan No. | Mortgage Loan Seller | Property Name | Mortgage Loan Cut-off Date Balance | Cut-off Date Loan per Unit/SF | Mezzanine Debt Cut-off Date Balance | UW NCF DSCR | UW NOI Debt Yield | Cut-off Date LTV Ratio | Total Debt UW NCF DSCR | Total Debt UW NOI Debt Yield | Total Debt Cut-off Date LTV Ratio | |||||||||||||
| 6 | MSMCH | Point at Las Colinas | $43,500,000 | $109.09 | $9,187,000 | 1.93x | 9.4% | 72.5% | 1.35x | 7.7% | 87.8% | |||||||||||||
| This is not a research report and was not prepared by the Underwriters’ research departments. Please see additional important information and qualifications at the end of this Term Sheet. |
T-17
MSBAM 2013-C12 | Characteristics of the Mortgage Loans |
Prior Securitization History(1) | |||||||||||||||
Loan No. | Mortgage Loan Seller | Property Name | City | State | Property Type | Cut-off Date Balance | % of Pool | NSF/ Units | Cut-off Date Balance PSF/Unit | UW NCF DSCR | UW NOI Debt Yield | Cut-off Date LTV | Maturity/ ARD LTV | Prior Securitization | |
| 6 | MSMCH | Point at Las Colinas | Irving | TX | Office | $43,500,000 | 3.4% | 398,771 | $109.09 | 1.93x | 9.4% | 72.5% | 72.5% | JPMCC 2011-FL1 | |
| 7 | CIBC | Westland Retail Portfolio | Various | CA | Retail | $40,357,805 | 3.2% | 300,124 | $134.47 | 1.42x | 11.0% | 55.1% | 41.9% | JPMCC 2003-CB6 | |
| 8 | MSMCH | Rolling Valley Mall | Burke | VA | Retail | $40,200,000 | 3.1% | 237,214 | $169.47 | 1.31x | 9.2% | 72.4% | 63.0% | GCCFC 2004-GG1 | |
| 10 | MSMCH | 385 Fifth Avenue | New York | NY | Office | $36,100,000 | 2.8% | 102,219 | $353.16 | 1.31x | 8.8% | 65.6% | 60.1% | CCMSC 1998-2 | |
| 13 | BANA | ADG 5 Portfolio | Various | WI | Manufactured Housing | $26,618,825 | 2.1% | 1,139 | $23,370.35 | 1.53x | 9.4% | 74.2% | 60.2% | MEZZ 2004-C2 WBCMT 2005-C16 | |
| 16 | MSMCH | Avon Marketplace | Avon | CT | Retail | $24,000,000 | 1.9% | 79,362 | $302.41 | 1.38x | 9.2% | 67.0% | 61.8% | MLMT 2004-BPC1 | |
| 20 | MSMCH | Best Western - Sherman Oaks | Sherman Oaks | CA | Hospitality | $17,500,000 | 1.4% | 181 | $96,685.08 | 1.86x | 13.4% | 64.1% | 54.4% | GSMS 2005-GG4 | |
| MSMCH | Burnham Center(2) | Chicago | IL | Office | $15,368,778 | 1.2% | 584,962 | $79.67 | 1.23x | 11.1% | 66.6% | 54.8% | GSMS 2005-GG4 | ||
| 25 | BANA | Deerfield Estates | Flat Rock | MI | Manufactured Housing | $13,483,928 | 1.1% | 820 | $16,443.82 | 2.23x | 15.0% | 51.2% | 42.3% | BSCMS 2003-T12 | |
| 28 | CIBC | Place at Green Trails | Katy | TX | Multifamily | $12,260,000 | 1.0% | 275 | $44,581.82 | 1.34x | 9.7% | 73.0% | 61.1% | CSMC 2007-C2 | |
| 30 | MSMCH | Garden Plaza - Santa Barbara | Santa Barbara | CA | Retail | $11,300,000 | 0.9% | 50,000 | $226.00 | 1.25x | 8.7% | 64.2% | 59.5% | JPMCC 2004-LN2 | |
| 36 | MSMCH | Sheldon Place | Plymouth | MI | Retail | $9,288,990 | 0.7% | 98,354 | $94.44 | 1.54x | 11.0% | 71.5% | 59.1% | GMACC 2003-C2 | |
| 38 | MSMCH | Lakeview Terrace | Haltom City | TX | Multifamily | $8,664,924 | 0.7% | 224 | $38,682.70 | 1.72x | 10.6% | 69.8% | 56.0% | GMACC 2003-C3 | |
| 41 | MSMCH | Cedar Pointe Plaza | Fresno | CA | Retail | $8,000,000 | 0.6% | 51,437 | $155.53 | 1.50x | 10.8% | 71.4% | 63.8% | DLJMA 1997-CF1 | |
| 43 | BANA | ADG 2 Portfolio | Various | WI | Manufactured Housing | $7,904,954 | 0.6% | 315 | $25,095.09 | 1.66x | 10.3% | 74.7% | 60.6% | WBCMT 2005-C16 | |
| 45 | BANA | Patchen Place Apartments | Lexington | KY | Multifamily | $7,715,000 | 0.6% | 202 | $38,193.07 | 1.40x | 10.1% | 73.5% | 61.1% | JPMCC 2004-PNC1 | |
| 46 | BANA | Laurel Canyon Self Storage | Los Angeles | CA | Self Storage | $7,691,607 | 0.6% | 946 | $8,130.66 | 1.44x | 10.0% | 60.6% | 50.8% | BACM 2004-4 | |
| 49 | BANA | Sentry Self Storage - Coral Springs, FL | Coral Springs | FL | Self Storage | $6,992,171 | 0.5% | 732 | $9,552.15 | 1.45x | 10.0% | 74.4% | 62.1% | GECMC 2004-C3 | |
| 52 | MSMCH | Monte Carlo at Wilcrest | Houston | TX | Multifamily | $6,420,000 | 0.5% | 197 | $32,588.83 | 1.41x | 9.2% | 74.9% | 62.2% | MLCFC 2007-8 | |
| 54 | MSMCH | Breckenridge Apartments | Fairborn | OH | Multifamily | $6,220,578 | 0.5% | 208 | $29,906.63 | 1.77x | 11.3% | 73.6% | 59.4% | BACM 2004-4 | |
| 55 | BANA | Cypress Self Storage - Naples, FL | Naples | FL | Self Storage | $6,200,000 | 0.5% | 738 | $8,401.08 | 2.61x | 13.4% | 57.4% | 57.4% | BACM 2004-5 | |
| 56 | BANA | Coldwater Self Storage - North Hollywood, CA | North Hollywood | CA | Self Storage | $5,993,460 | 0.5% | 863 | $6,944.91 | 1.43x | 10.0% | 68.9% | 57.8% | BACM 2004-6 | |
| 58 | BANA | Norcal Self Storage Portfolio | Various | CA | Self Storage | $5,635,000 | 0.4% | 1,046 | $5,387.19 | 3.27x | 16.0% | 44.5% | 44.5% | GECMC 2004-C1 | |
| 60 | BANA | Country Sunset | Bend | OR | Manufactured Housing | $5,150,000 | 0.4% | 148 | $34,797.30 | 1.41x | 9.7% | 65.9% | 55.1% | MLMT 2003-KEY1 | |
| 61 | CIBC | The Friendly Village of Lockport | Lockport | NY | Manufactured Housing | $4,600,000 | 0.4% | 448 | $10,267.86 | 2.36x | 16.9% | 42.6% | 35.3% | JPMCC 2003-CB7 | |
| 69 | CIBC | Laurel Pointe | Livonia | MI | Mixed Use | $3,694,315 | 0.3% | 28,089 | $131.52 | 1.58x | 13.0% | 73.9% | 56.7% | MLMT 2004-KEY2 | |
| Total | $380,860,335 | 29.9% | |||||||||||||
| Includes mortgaged properties securing mortgage loans for which the most recent prior financing of all or a significant portion of such property was included in a securitization. The table above describes the most recent securitization with respect to the mortgaged property securing the related mortgage loan, based on information provided by the related borrower or obtained through searches of a third-party database. The information has not otherwise been confirmed by the mortgage loan sellers. |
| (2) | With respect to the Burnham Center Mortgage Loan, unless otherwise indicated, all LTV, DSCR, Debt Yield and Cut-off Date Balance PSF/Unit calculations include the related pari passu companion loan. |
| This is not a research report and was not prepared by the Underwriters’ research departments. Please see additional important information and qualifications at the end of this Term Sheet. |
T-18
MSBAM 2013-C12 | Characteristics of the Mortgage Loans |
Mortgage Loans with Scheduled Balloon Payments and Related Classes(1)
| Class A-2 ($161,200,000) | ||||||||||||||||
Loan No. | Mortgage Loan Seller | Property Name | State | Property Type | Cut-off Date Balance | % of Pool | Balance at Maturity | % of Class A-2 Certificate Principal Balance | NSF/ Units | Cut-off Date Balance PSF/Unit | UW NCF DSCR | UW NOI Debt Yield | Cut-off Date LTV Ratio | LTV Ratio at Maturity/ ARD | Rem. IO Period (mos.) | Rem. Term to Maturity /ARD (mos.) |
| 6 | MSMCH | Point at Las Colinas | TX | Office | $43,500,000 | 3.4% | $43,500,000 | 27.0% | 398,771 | $109.09 | 1.93x | 9.4% | 72.5% | 72.5% | 59 | 59 |
| 9 | MSMCH | Florida Hotel & Conference Center | FL | Hospitality | $37,250,000 | 2.9% | $33,383,956 | 20.7% | 511 | $72,896.28 | 1.49x | 12.9% | 59.1% | 53.0% | 0 | 60 |
| 14 | MSMCH | Nitro Marketplace | WV | Retail | $24,500,000 | 1.9% | $24,500,000 | 15.2% | 440,949 | $55.56 | 2.71x | 12.0% | 59.2% | 59.2% | 60 | 60 |
| 17 | BANA | Shops at Val Vista | AZ | Retail | $22,971,798 | 1.8% | $21,208,068 | 13.2% | 170,489 | $134.74 | 1.35x | 9.5% | 67.8% | 62.6% | 0 | 59 |
| 18 | BANA | Hilton Garden Inn - Toledo Perrysburg | OH | Hospitality | $22,400,000 | 1.8% | $20,761,947 | 12.9% | 184 | $121,739.13 | 1.88x | 14.1% | 70.0% | 64.9% | 0 | 60 |
| 21 | CIBC | Doubletree Raleigh Brownstone - University | NC | Hospitality | $15,562,963 | 1.2% | $14,361,098 | 8.9% | 190 | $81,910.33 | 1.61x | 12.1% | 61.0% | 56.3% | 0 | 58 |
| Total/Wtd. Avg. | $166,184,761 | 13.0% | $157,715,069 | 97.8% | 1.83x | 11.4% | 65.5% | 62.2% | 24 | 59 | ||||||
| (1) | The table above reflects the mortgage loans whose balloon payments will be applied to pay down the Class A-2 Certificates, assuming (i) that none of the mortgage loans experience prepayments, defaults or losses; (ii) there are no extensions of maturity dates; and (iii) each mortgage loan is paid in full on its stated maturity date or, in the case of the mortgage loan with an anticipated repayment date, on such anticipated repayment date. The table above is otherwise based on the Structuring Assumptions set forth under “Yield, Prepayment and Maturity Considerations” in the Free Writing Prospectus. |
T-19
MSBAM 2013-C12 | Characteristics of the Mortgage Loans |
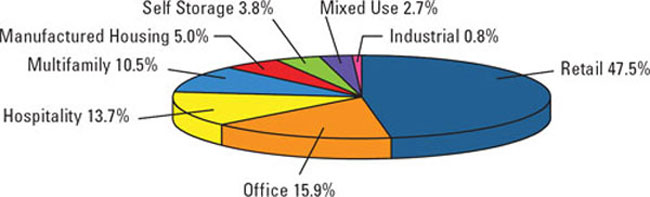
Property Type Distribution(1)(2) | ||||||||||
| Property Type | Number of Mortgaged Properties | Aggregate Cut-off Date Balance | % of Pool | Wtd. Avg. Mortgage Rate | Wtd. Avg. UW NCF DSCR | Wtd. Avg. UW NOI Debt Yield | Wtd. Avg. Cut-off Date LTV Ratio | Wtd. Avg. LTV Ratio at Maturity/ARD | ||
| Retail | 34 | $606,405,114 | 47.5% | 4.550% | 1.62x | 10.3% | 60.8% | 51.9% | ||
| Anchored | 17 | $271,944,482 | 21.3% | 4.935% | 1.58x | 9.9% | 65.4% | 57.2% | ||
| Regional Mall | 2 | $139,780,738 | 11.0% | 4.190% | 1.76x | 11.1% | 54.3% | 46.2% | ||
| Outlet Center | 1 | $130,000,000 | 10.2% | 3.775% | 1.64x | 9.8% | 59.1% | 49.6% | ||
| Unanchored | 14 | $64,679,893 | 5.1% | 5.267% | 1.49x | 11.3% | 58.9% | 46.7% | ||
| Office | 8 | $203,371,059 | 15.9% | 4.993% | 1.49x | 10.2% | 65.6% | 56.4% | ||
| CBD | 3 | $141,326,590 | 11.1% | 5.075% | 1.37x | 10.5% | 63.5% | 51.4% | ||
| Suburban | 3 | $55,320,969 | 4.3% | 4.804% | 1.81x | 9.6% | 71.6% | 69.8% | ||
| Urban | 1 | $4,400,000 | 0.3% | 4.570% | 1.32x | 9.1% | 62.4% | 54.8% | ||
| Medical Office | 1 | $2,323,500 | 0.2% | 5.310% | 1.42x | 11.0% | 55.1% | 41.9% | ||
| Hospitality | 7 | $174,958,561 | 13.7% | 5.202% | 1.61x | 12.8% | 62.8% | 52.2% | ||
| Extended Stay | 1 | $64,797,112 | 5.1% | 5.200% | 1.50x | 11.8% | 62.6% | 47.5% | ||
| Full Service | 3 | $62,270,222 | 4.9% | 5.187% | 1.51x | 12.8% | 60.2% | 52.0% | ||
| Limited Service | 3 | $47,891,227 | 3.8% | 5.226% | 1.89x | 14.0% | 66.3% | 58.7% | ||
| Multifamily | 16 | $134,049,160 | 10.5% | 4.834% | 1.53x | 10.4% | 68.3% | 56.8% | ||
| Garden | 13 | $111,174,160 | 8.7% | 4.784% | 1.57x | 10.6% | 67.9% | 56.0% | ||
| Student Housing | 3 | $22,875,000 | 1.8% | 5.078% | 1.36x | 9.3% | 70.0% | 60.8% | ||
| Manufactured Housing | 17 | $63,526,511 | 5.0% | 4.795% | 1.76x | 11.5% | 65.6% | 53.7% | ||
| Self Storage | 8 | $48,912,237 | 3.8% | 5.230% | 1.96x | 11.4% | 62.9% | 56.3% | ||
| Mixed Use | 2 | $34,694,315 | 2.7% | 5.286% | 1.42x | 11.3% | 68.7% | 52.1% | ||
| Industrial/Office | 1 | $31,000,000 | 2.4% | 5.250% | 1.40x | 11.1% | 68.1% | 51.6% | ||
| Office/Retail | 1 | $3,694,315 | 0.3% | 5.590% | 1.58x | 13.0% | 73.9% | 56.7% | ||
| Industrial | 1 | $10,400,000 | 0.8% | 4.310% | 1.38x | 9.0% | 68.4% | 59.7% | ||
| Warehouse | 1 | $10,400,000 | 0.8% | 4.310% | 1.38x | 9.0% | 68.4% | 59.7% | ||
| Total/Wtd. Avg. | 93 | $1,276,316,957 | 100.0% | 4.796% | 1.60x | 10.7% | 63.2% | 53.5% | ||
| (1) | All numerical information concerning the mortgage loans is approximate. All weighted average information regarding the mortgage loans reflects the weighting of the mortgage loans based on their outstanding principal balances as of the Cut-off Date. State and Property Type tables reflect allocated loan amounts in the case of mortgage loans secured by multiple properties. The sum of numbers and percentages in columns may not match the “Total” due to rounding. Additionally, loan-to-value ratios and debt service coverage ratios are calculated for mortgage loans without regard to any additional indebtedness that may be incurred at a future date. |
| (2) | With respect to the 15 MetroTech Center Mortgage Loan, the Marriott Chicago River North Hotel Mortgage Loan, the Westfield Countryside Mortgage Loan and the Burnham Center Mortgage Loan, unless otherwise indicated, all LTV, DSCR and Debt Yield calculations include the related pari passu companion loan. |
| This is not a research report and was not prepared by the Underwriters’ research departments. Please see additional important information and qualifications at the end of this Term Sheet. |
T-20
MSBAM 2013-C12 | Characteristics of the Mortgage Loans |
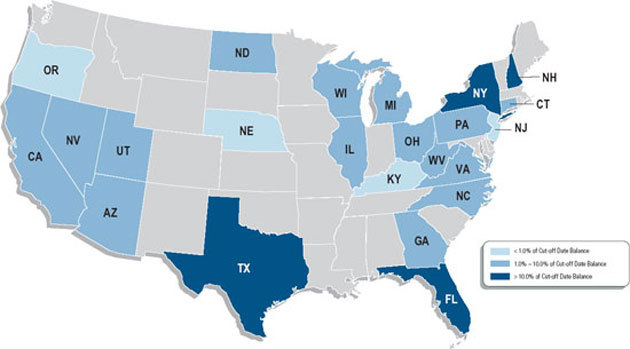
Geographic Distribution(1)(2) | ||||||||
| State | Number of Mortgaged Properties | Aggregate Cut-off Date Balance | % of Pool | Wtd. Avg. Mortgage Rate | Wtd. Avg. UW NCF DSCR | Wtd. Avg. UW NOI Debt Yield | Wtd. Avg. Cut-off Date LTV Ratio | Wtd. Avg. LTV Ratio at Maturity/ARD |
| Texas | 17 | $171,582,466 | 13.4% | 4.805% | 1.63x | 10.5% | 68.6% | 57.4% |
| New York | 5 | $145,002,969 | 11.4% | 5.131% | 1.45x | 10.6% | 61.3% | 50.2% |
| Florida | 8 | $139,722,171 | 10.9% | 4.675% | 1.66x | 11.1% | 60.9% | 54.7% |
| New Hampshire | 1 | $130,000,000 | 10.2% | 3.775% | 1.64x | 9.8% | 59.1% | 49.6% |
| California | 19 | $120,677,872 | 9.5% | 5.249% | 1.62x | 11.1% | 57.7% | 49.5% |
California – Southern(3) | 15 | $87,242,872 | 6.8% | 5.259% | 1.48x | 10.9% | 59.9% | 49.2% |
California – Northern(3) | 4 | $33,435,000 | 2.6% | 5.225% | 1.98x | 11.4% | 51.9% | 50.1% |
| Illinois | 3 | $94,665,890 | 7.4% | 4.930% | 1.58x | 11.4% | 62.0% | 49.7% |
| Utah | 1 | $84,780,738 | 6.6% | 4.370% | 1.82x | 11.8% | 52.3% | 42.3% |
| Virginia | 1 | $40,200,000 | 3.1% | 5.140% | 1.31x | 9.2% | 72.4% | 63.0% |
| Georgia | 2 | $38,991,227 | 3.1% | 5.299% | 1.52x | 12.0% | 66.7% | 51.5% |
| Pennsylvania | 3 | $37,150,649 | 2.9% | 5.252% | 1.35x | 9.9% | 76.4% | 62.6% |
| Wisconsin | 12 | $34,523,780 | 2.7% | 4.407% | 1.56x | 9.6% | 74.3% | 60.3% |
| Nevada | 2 | $33,795,485 | 2.6% | 5.442% | 1.32x | 9.4% | 66.0% | 55.2% |
| Michigan | 5 | $32,236,037 | 2.5% | 5.220% | 1.87x | 13.1% | 62.2% | 51.0% |
| Ohio | 2 | $28,620,578 | 2.2% | 5.017% | 1.85x | 13.5% | 70.8% | 63.7% |
| West Virginia | 1 | $24,500,000 | 1.9% | 4.030% | 2.71x | 12.0% | 59.2% | 59.2% |
| Connecticut | 1 | $24,000,000 | 1.9% | 4.820% | 1.38x | 9.2% | 67.0% | 61.8% |
| Arizona | 1 | $22,971,798 | 1.8% | 4.890% | 1.35x | 9.5% | 67.8% | 62.6% |
| North Dakota | 3 | $22,875,000 | 1.8% | 5.078% | 1.36x | 9.3% | 70.0% | 60.8% |
| North Carolina | 1 | $15,562,963 | 1.2% | 4.780% | 1.61x | 12.1% | 61.0% | 56.3% |
| New Jersey | 1 | $10,400,000 | 0.8% | 4.310% | 1.38x | 9.0% | 68.4% | 59.7% |
| Nebraska | 1 | $8,400,000 | 0.7% | 4.750% | 1.65x | 11.3% | 57.5% | 49.6% |
| Oregon | 2 | $7,942,336 | 0.6% | 4.979% | 1.64x | 10.5% | 59.1% | 48.8% |
| Kentucky | 1 | $7,715,000 | 0.6% | 5.260% | 1.40x | 10.1% | 73.5% | 61.1% |
| Total/Wtd. Avg. | 93 | $1,276,316,957 | 100.0% | 4.796% | 1.60x | 10.7% | 63.2% | 53.5% |
| (1) | All numerical information concerning the mortgage loans is approximate. All weighted average information regarding the mortgage loans reflects the weighting of the mortgage loans based on their outstanding principal balances as of the Cut-off Date. State and Property Type tables reflect allocated loan amounts in the case of mortgage loans secured by multiple properties. The sum of numbers and percentages in columns may not match the “Total” due to rounding. Additionally, loan-to-value ratios and debt service coverage ratios are calculated for mortgage loans without regard to any additional indebtedness that may be incurred at a future date. |
| (2) | With respect to the 15 MetroTech Center Mortgage Loan, the Marriott Chicago River North Hotel Mortgage Loan, the Westfield Countryside Mortgage Loan and the Burnham Center Mortgage Loan, unless otherwise indicated, all LTV, DSCR and Debt Yield calculations include the related pari passu companion loan. |
| (3) | “California – Northern” includes zip codes above 93600, and “California – Southern” includes zip codes at or below 93600. |
| This is not a research report and was not prepared by the Underwriters’ research departments. Please see additional important information and qualifications at the end of this Term Sheet. |
T-21
| MSBAM 2013-C12 | Collateral Statistics |
Collateral Statistics(1)(3)
| Cut-off Date Balance ($) | Mortgage Rate (%) | Cut-off Date LTV Ratio (%) | ||||||||||||||||||||
No. of Mortgage Loans | Aggregate Cut-off Date Balance ($) | % of Pool | No. of Mortgage Loans | Aggregate Cut-off Date Balance ($) | % of Pool | No. of Mortgage Loans | Aggregate Cut-off Date Balance ($) | % of Poo | l | |||||||||||||
| 1 - 10,000,000 | 40 | 255,150,657 | 20.0 | 3.501 - 4.000 | 3 | 199,500,000 | 15.6 | 40.1 - 50.0 | 6 | 46,597,439 | 3.7 | |||||||||||
| 10,000,001 - 20,000,000 | 14 | 193,659,352 | 15.2 | 4.001 - 4.500 | 11 | 218,172,459 | 17.1 | 50.1 - 60.0 | 13 | 431,213,113 | 33.8 | |||||||||||
| 20,000,001 - 30,000,000 | 7 | 174,663,480 | 13.7 | 4.501 - 5.000 | 20 | 246,007,356 | 19.3 | 60.1 - 70.0 | 33 | 541,706,096 | 42.4 | |||||||||||
| 30,000,001 - 40,000,000 | 3 | 104,350,000 | 8.2 | 5.001 - 5.500 | 31 | 580,563,800 | 45.5 | 70.1 - 80.0 | 20 | 256,800,310 | 20.1 | |||||||||||
| 40,000,001 - 50,000,000 | 3 | 124,057,805 | 9.7 | 5.501 - 6.000 | 7 | 32,073,341 | 2.5 | Total: | 72 | $1,276,316,957 | 100.0 | % | ||||||||||
| 50,000,001 - 60,000,000 | 1 | 55,000,000 | 4.3 | Total: | 72 | $1,276,316,957 | 100.0 | % | Min: 40.5% | Max: 78.0 | % | Wtd Avg: 63.2 | % | |||||||||
| 60,000,001 - 70,000,000 | 1 | 64,797,112 | 5.1 | Min: 3.775% | Max: 5.623 | % | Wtd Avg: 4.796% | |||||||||||||||
| 80,000,001 - 90,000,000 | 2 | 174,638,550 | 13.7 | LTV Ratio at Maturity/ARD (%) | ||||||||||||||||||
| 120,000,001 - 130,000,000 | 1 | 130,000,000 | 10.2 | Original Term to Maturity/ARD (mos.) | ||||||||||||||||||
| Total: | 72 | $1,276,316,957 | 100.0 | % | No. of | Aggregate | ||||||||||||||||
Min: $2,397,412 Max: $130,000,000 | Avg: $17,726,624 | No. of | Aggregate | Mortgage | Cut-off Date | % of | ||||||||||||||||
| Mortgage | Cut-off Date | % of | Loans | Balance ($) | Pool | |||||||||||||||||
| State | Loans | Balance ($) | Pool | 0.1 - 10.0 | 1 | 4,500,000 | 0.4 | |||||||||||||||
| 60 | 6 | 166,184,761 | 13.0 | 20.1 - 30.0 | 1 | 3,770,103 | 0.3 | |||||||||||||||
| No. of | Aggregate | 84 | 1 | 7,375,813 | 0.6 | 30.1 - 40.0 | 2 | 7,392,336 | 0.6 | |||||||||||||
| Mortgaged | Cut-off Date | % of | 120 | 64 | 1,098,256,384 | 86.0 | 40.1 - 50.0 | 13 | 484,810,296 | 38.0 | ||||||||||||
| Properties | Balance ($) | Pool | 240 | 1 | 4,500,000 | 0.4 | 50.1 - 60.0 | 36 | 449,351,159 | 35.2 | ||||||||||||
| Texas | 17 | 171,582,466 | 13.4 | Total: | 72 | $1,276,316,957 | 100.0 | % | 60.1 - 70.0 | 18 | 282,993,064 | 22.2 | ||||||||||
| New York | 5 | 145,002,969 | 11.4 | Min: 60 | Max: 240 | Wtd Avg: 112 | 70.1 - 80.0 | 1 | 43,500,000 | 3.4 | ||||||||||||
| Florida | 8 | 139,722,171 | 10.9 | Total: | 72 | $1,276,316,957 | 100.0 | % | ||||||||||||||
| New Hampshire | 1 | 130,000,000 | 10.2 | Remaining Term to Maturity/ARD (mos.) | Min: 1.6% | Max: 72.5% | Wtd Avg: 53.5% | |||||||||||||||
| California | 19 | 120,677,872 | 9.5 | |||||||||||||||||||
California – Southern(2) | 15 | 87,242,872 | 6.8 | No. of Mortgage Loans | Aggregate Cut-off Date Balance ($) | % of Pool | UW DSCR (x) | |||||||||||||||
California – Northern(2) | 4 | 33,435,000 | 2.6 | |||||||||||||||||||
| Illinois | 3 | 94,665,890 | 7.4 | 55 - 60 | 6 | 166,184,761 | 13.0 | No. of | Aggregate | |||||||||||||
| Utah | 1 | 84,780,738 | 6.6 | 79 - 84 | 1 | 7,375,813 | 0.6 | Mortgage | Cut-off Date | % of | ||||||||||||
| Virginia | 1 | 40,200,000 | 3.1 | 109 - 114 | 1 | 15,368,778 | 1.2 | Loans | Balance ($) | Pool | ||||||||||||
| Georgia | 2 | 38,991,227 | 3.1 | 115 - 120 | 63 | 1,082,887,605 | 84.8 | 1.21 - 1.30 | 7 | 96,660,790 | 7.6 | |||||||||||
| Pennsylvania | 3 | 37,150,649 | 2.9 | 181 - 240 | 1 | 4,500,000 | 0.4 | 1.31 - 1.40 | 14 | 230,901,798 | 18.1 | |||||||||||
| Wisconsin | 12 | 34,523,780 | 2.7 | Total: | 72 | $1,276,316,957 | 100.0 | % | 1.41 - 1.50 | 13 | 296,609,751 | 23.2 | ||||||||||
| Nevada | 2 | 33,795,485 | 2.6 | Min: 58 | Max: 240 | Wtd Avg: 111 | 1.51 - 1.60 | 11 | 115,261,934 | 9.0 | ||||||||||||
| Michigan | 5 | 32,236,037 | 2.5 | 1.61 - 1.70 | 6 | 220,239,308 | 17.3 | |||||||||||||||
| Ohio | 2 | 28,620,578 | 2.2 | Original Amortization Term (mos.) | 1.71 - 1.80 | 3 | 34,685,502 | 2.7 | ||||||||||||||
| West Virginia | 1 | 24,500,000 | 1.9 | 1.81 - 1.90 | 7 | 146,485,280 | 11.5 | |||||||||||||||
| Connecticut | 1 | 24,000,000 | 1.9 | No. of | Aggregate | 1.91 - 2.00 | 2 | 51,491,227 | 4.0 | |||||||||||||
| Arizona | 1 | 22,971,798 | 1.8 | Mortgage | Cut-off Date | % of | 2.01 - 2.10 | 1 | 2,792,336 | 0.2 | ||||||||||||
| North Dakota | 3 | 22,875,000 | 1.8 | Loans | Balance ($) | Pool | 2.11 - 2.20 | 1 | 3,770,103 | 0.3 | ||||||||||||
| North Carolina | 1 | 15,562,963 | 1.2 | Interest Only | 8 | $132,635,000 | 10.4 | 2.21 - 2.30 | 2 | 27,983,928 | 2.2 | |||||||||||
| New Jersey | 1 | 10,400,000 | 0.8 | 240 | 3 | $17,727,361 | 1.4 | 2.31 - 2.40 | 1 | 4,600,000 | 0.4 | |||||||||||
| Nebraska | 1 | 8,400,000 | 0.7 | 300 | 8 | $283,532,205 | 22.2 | 2.41 - 2.50 | 1 | 8,500,000 | 0.7 | |||||||||||
| Oregon | 2 | 7,942,336 | 0.6 | 324 | 1 | $3,943,341 | 0.3 | 2.61 - 2.70 | 1 | 6,200,000 | 0.5 | |||||||||||
| Kentucky | 1 | 7,715,000 | 0.6 | 360 | 52 | $838,479,049 | 65.7 | 2.71 - 2.80 | 1 | 24,500,000 | 1.9 | |||||||||||
| Total: | 93 | $1,276,316,957 | 100.0 | % | Total: | 72 | $1,276,316,957 | 100.0 | % | 3.01 - 3.30 | 1 | 5,635,000 | 0.4 | |||||||||
| Min: 240 | Max: 360 | Non-Zero Wtd Avg: 343 | Total: | 72 | $1,276,316,957 | 100.0 | % | |||||||||||||||
| Property Type | Min: 1.23x | Max: 3.27x | Wtd Avg: 1.60x | |||||||||||||||||||
| Remaining Amortization Term (mos.) | ||||||||||||||||||||||
| No. of | Aggregate | UW NOI Debt Yield (%) | ||||||||||||||||||||
| Mortgaged | Cut-off Date | % of | No. of | Aggregate | ||||||||||||||||||
| Properties | Balance ($) | Pool | Mortgage | Cut-off Date | % of | No. of | Aggregate | |||||||||||||||
| Loans | Balance ($) | Pool | Mortgage | Cut-off Date | % of | |||||||||||||||||
| Retail | Interest Only | 8 | 132,635,000 | 10.4 | Loans | Balance ($) | Pool | |||||||||||||||
| Anchored | 17 | 271,944,482 | 21.3 | 237 - 300 | 11 | 301,259,567 | 23.6 | 8.6 - 9.0 | 5 | 91,743,341 | 7.2 | |||||||||||
| Regional Mall | 2 | 139,780,738 | 11.0 | 301 - 350 | 1 | 3,943,341 | 0.3 | 9.1 - 9.5 | 12 | 233,058,480 | 18.3 | |||||||||||
| Outlet Center | 1 | 130,000,000 | 10.2 | 351 - 360 | 52 | 838,479,049 | 65.7 | 9.6 - 10.0 | 8 | 189,963,050 | 14.9 | |||||||||||
| Unanchored | 14 | 64,679,893 | 5.1 | Total: | 72 | $1,276,316,957 | 100.0 | % | 10.1 - 10.5 | 10 | 146,161,268 | 11.5 | ||||||||||
| Office | Min:237 | Max: 360 | Non-Zero Wtd Avg: 342 | 10.6 - 11.0 | 9 | 105,629,787 | 8.3 | |||||||||||||||
| CBD | 3 | 141,326,590 | 11.1 | 11.1 - 11.5 | 8 | 165,041,507 | 12.9 | |||||||||||||||
| Suburban | 3 | 55,320,969 | 4.3 | Mortgage Loan Sellers | 11.6 - 12.0 | 3 | 174,077,850 | 13.6 | ||||||||||||||
| Urban | 1 | 4,400,000 | 0.3 | 12.1 - 12.5 | 2 | 18,355,299 | 1.4 | |||||||||||||||
| Medical Office | 1 | 2,323,500 | 0.2 | No. of | Aggregate | 12.6 - 13.0 | 5 | 58,851,445 | 4.6 | |||||||||||||
| Hospitality | Mortgage | Cut-off Date | % of | 13.1 - 13.5 | 3 | 26,097,412 | 2.0 | |||||||||||||||
| Extended Stay | 1 | 64,797,112 | 5.1 | Loans | Balance ($) | Pool | 13.6 - 14.0 | 1 | 9,457,258 | 0.7 | ||||||||||||
| Full Service | 3 | 62,270,222 | 4.9 | Morgan Stanley | 14.1 - 14.5 | 1 | 22,400,000 | 1.8 | ||||||||||||||
| Limited Service | 3 | 47,891,227 | 3.8 | Mortgage Capital | 14.6 - 15.0 | 1 | 13,483,928 | 1.1 | ||||||||||||||
| Multifamily | Holdings LLC | 42 | 755,240,060 | 59.2 | 15.1 - 17.5 | 4 | 21,996,330 | 1.7 | ||||||||||||||
| Garden | 13 | 111,174,160 | 8.7 | Bank of America, | Total: | 72 | $1,276,316,957 | 100.0% | ||||||||||||||
| Student Housing | 3 | 22,875,000 | 1.8 | National Association | 23 | 389,428,956 | 30.5 | Min: 8.7% | Max: 17.5 | % | Wtd Avg: 10.7% | |||||||||||
| Manufactured Housing | CIBC Inc. | 7 | 131,647,941 | 10.3 | ||||||||||||||||||
| Manufactured Housing | 17 | 63,526,511 | 5.0 | Total: | 72 | $1,276,316,957 | 100.0 | % | ||||||||||||||
| Self Storage | ||||||||||||||||||||||
| Self Storage | 8 | 48,912,237 | 3.8 | Amortization Type | ||||||||||||||||||
| Mixed Use | ||||||||||||||||||||||
| Industrial/Office | 1 | 31,000,000 | 2.4 | No. of | Aggregate | |||||||||||||||||
| Office/Retail | 1 | 3,694,315 | 0.3 | Mortgage | Cut-off Date | % of | ||||||||||||||||
| Industrial | Loans | Balance ($) | Pool | |||||||||||||||||||
| Warehouse | 1 | 10,400,000 | 0.8 | Amortizing Balloon | 48 | 751,186,957 | 58.9 | |||||||||||||||
| Total: | 93 | $1,276,316,957 | 100.0 | % | Partial Interest Only | 15 | 387,995,000 | 30.4 | ||||||||||||||
| Interest Only | 8 | 132,635,000 | 10.4 | |||||||||||||||||||
| Fully Amortizing | 1 | 4,500,000 | 0.4 | |||||||||||||||||||
| Total: | 72 | $1,276,316,957 | 100.0 | % | ||||||||||||||||||
| (1) | All numerical information concerning the mortgage loans is approximate. All weighted average information regarding the mortgage loans reflects the weighting of the mortgage loans based on their outstanding principal balances as of the Cut-off Date. State and Property Type tables reflect allocated loan amounts in the case of mortgage loans secured by multiple properties. The sum of numbers and percentages in columns may not match the “Total” due to rounding. Additionally, loan-to-value ratios and debt service coverage ratios are calculated for mortgage loans without regard to any additional indebtedness that may be incurred at a future date. |
| (2) | “California – Northern” includes zip codes above 93600, and “California – Southern” includes zip codes at or below 93600. |
| (3) | With respect to the15 MetroTech Center Mortgage Loan, the Marriott Chicago River North Hotel Mortgage Loan, the Westfield Countryside Mortgage Loan and the Burnham Center Mortgage Loan, unless otherwise indicated, all LTV, DSCR and Debt Yield calculations include the related pari passu companion loan. |
| This is not a research report and was not prepared by the Underwriters’ research departments. Please see additional important information and qualifications at the end of this Term Sheet. |
T-22
| MSBAM 2013-C12 | Collateral Statistics |
Prepayment Restrictions
Percentage of Collateral by Prepayment Restrictions (%)(1)(2)(3)
| Prepayment Restrictions | October 2013 | October 2014 | October 2015 | October 2016 | October 2017 |
| Locked Out | 85.7% | 84.7% | 69.7% | 69.7% | 69.7% |
| Yield Maintenance Total | 14.3% | 15.3% | 30.3% | 30.3% | 30.3% |
| Open | 0.0% | 0.0% | 0.0% | 0.0% | 0.0% |
| TOTAL | 100.0% | 100.0% | 100.0% | 100.0% | 100.0% |
| Pool Balance Outstanding | $1,276,316,957 | $1,263,732,644 | $1,249,516,151 | $1,231,811,355 | $1,212,783,660 |
| % Initial Pool Balance | 100.0% | 99.0% | 97.9% | 96.5% | 95.0% |
| Prepayment Restrictions | October 2018 | October 2019 | October 2020 | October 2021 | October 2022 |
| Locked Out | 65.1% | 65.1% | 65.6% | 65.6% | 64.3% |
| Yield Maintenance Total | 34.2% | 34.2% | 34.4% | 34.4% | 34.4% |
| Open | 0.7% | 0.7% | 0.0% | 0.0% | 1.4% |
| TOTAL | 100.0% | 100.0% | 100.0% | 100.0% | 100.0% |
| Pool Balance Outstanding | $1,034,786,095 | $1,013,771,777 | $985,308,490 | $962,301,125 | $938,145,945 |
| % Initial Pool Balance | 81.1% | 79.4% | 77.2% | 75.4% | 73.5% |
| Prepayment Restrictions | October 2023 | October 2024 | October 2025 | October 2026 | October 2027 |
| Locked Out | 100.0% | 100.0% | 100.0% | 100.0% | 100.0% |
| Yield Maintenance Total | 0.0% | 0.0% | 0.0% | 0.0% | 0.0% |
| Open | 0.0% | 0.0% | 0.0% | 0.0% | 0.0% |
| TOTAL | 100.0% | 100.0% | 100.0% | 100.0% | 100.0% |
| Pool Balance Outstanding | $2,892,993 | $2,677,846 | $2,449,946 | $2,209,007 | $1,954,283 |
| % Initial Pool Balance | 0.2% | 0.2% | 0.2% | 0.2% | 0.2% |
| Prepayment Restrictions | October 2028 | October 2029 | October 2030 | October 2031 | October 2032 |
| Locked Out | 100.0% | 100.0% | 100.0% | 100.0% | 100.0% |
| Yield Maintenance Total | 0.0% | 0.0% | 0.0% | 0.0% | 0.0% |
| Open | 0.0% | 0.0% | 0.0% | 0.0% | 0.0% |
| TOTAL | 100.0% | 100.0% | 100.0% | 100.0% | 100.0% |
| Pool Balance Outstanding | $1,685,281 | $1,400,594 | $1,099,620 | $781,427 | $445,135 |
| % Initial Pool Balance | 0.1% | 0.1% | 0.1% | 0.1% | 0.0% |
| (1) | The analysis is based on Structuring Assumptions and a 0% CPR as discussed in the Free Writing Prospectus. |
| (2) | See description of Yield Maintenance under “Description of the Offered Certificates—Distributions of Prepayment Premiums and Yield Maintenance Charges” in the Free Writing Prospectus. |
| (3) | Mortgage loans modeled as Yield Maintenance include mortgage loans characterized by YM0.5, YM1, DEF/YM0.5 and DEF/YM1 on Appendix I to the Free Writing Prospectus. |
| This is not a research report and was not prepared by the Underwriters’ research departments. Please see additional important information and qualifications at the end of this Term Sheet. |
T-23
| MSBAM 2013-C12 | Merrimack Premium Outlets |
Mortgage Loan No. 1 – Merrimack Premium Outlets
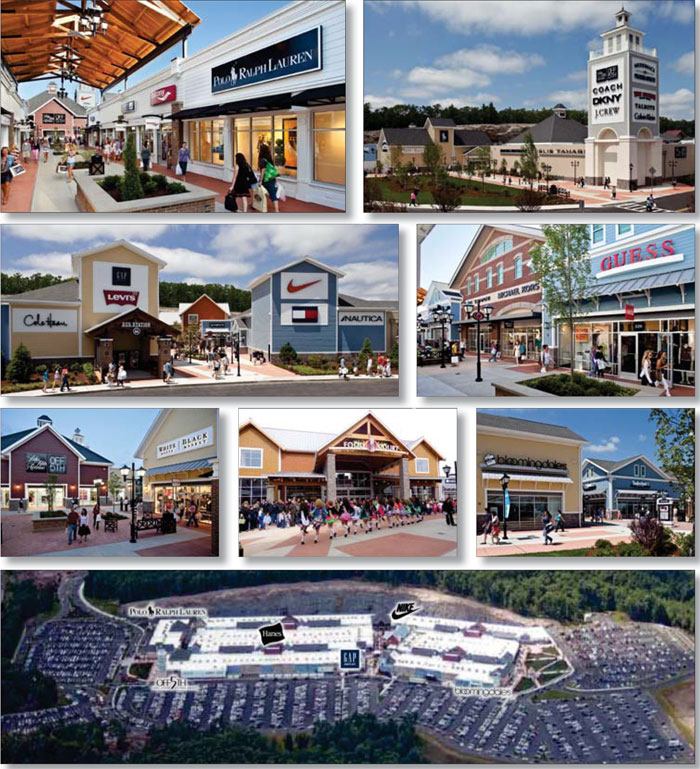
| This is not a research report and was not prepared by the Underwriters’ research departments. Please see additional important information and qualifications at the end of this Term Sheet. |
T-24
| MSBAM 2013-C12 | Merrimack Premium Outlets |
Mortgage Loan No. 1 – Merrimack Premium Outlets
| This is not a research report and was not prepared by the Underwriters’ research departments. Please see additional important information and qualifications at the end of this Term Sheet. |
T-25
| MSBAM 2013-C12 | Merrimack Premium Outlets |
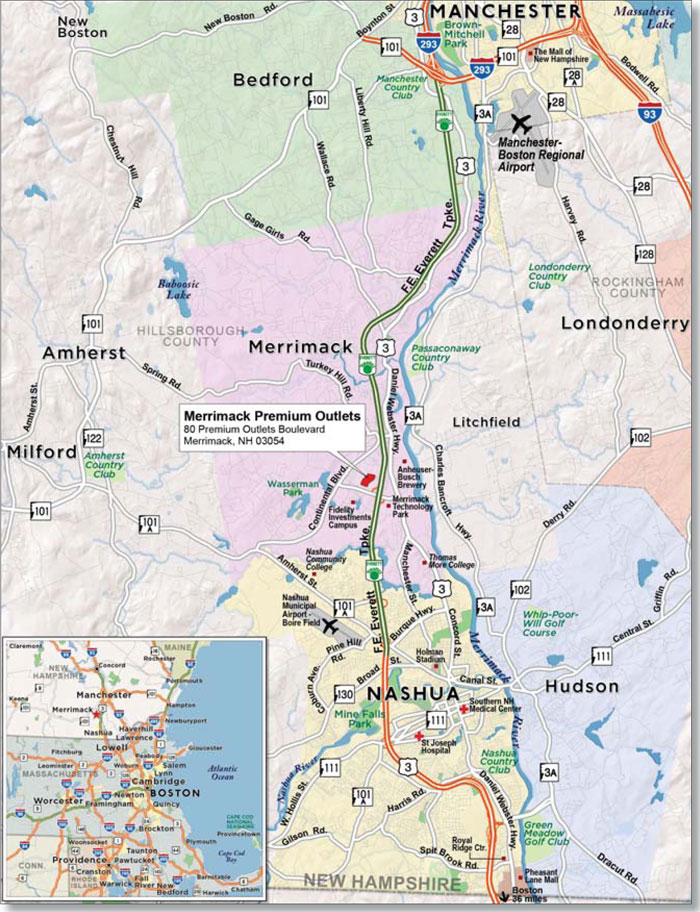
| This is not a research report and was not prepared by the Underwriters’ research departments. Please see additional important information and qualifications at the end of this Term Sheet. |
T-26
| MSBAM 2013-C12 | Merrimack Premium Outlets |
| Mortgage Loan Information | Mortgaged Property Information | ||||||
| Mortgage Loan Seller: | MSMCH | Single Asset/Portfolio: | |||||
Credit Assessment: (Fitch/KBRA/Moody’s) | NR/NR/NR | Property Address: | Merrimack, NH 03054 | ||||
| Original Balance: | General Property Type: | ||||||
| Cut-off Date Balance: | Detailed Property Type: | ||||||
| % of Initial Pool Balance: | 10.2 % | Net Rentable Area: | |||||
| Loan Purpose: | Cut-off Date Balance Per Unit/SF: | ||||||
| Borrower Name(s): | Balloon/ARD Balance Per Unit/SF: | ||||||
| Year Built/Year Renovated: | 2012/NAP | ||||||
| Sponsor: | Title Vesting(2): | ||||||
| Mortgage Rate: | Property Manager: | ||||||
| Note Date: | |||||||
| First Payment Date: | |||||||
| Anticipated Repayment Date: | Underwriting and Financial Information | ||||||
| Maturity Date: | UW Revenues: | ||||||
| IO Period: | UW Expenses: | ||||||
| Original Term to Maturity or ARD: | UW NOI: | ||||||
| Seasoning: | UW NCF: | ||||||
| Original Amortization Term: | UW NOI DSCR: | ||||||
| Loan Amortization Type: | UW NCF DSCR: | ||||||
| Interest Accrual Basis: | UW NOI Debt Yield: | ||||||
| Prepayment Provisions: | UW NCF Debt Yield: | ||||||
| Lockbox/Cash Management: | UW NCF Debt Yield at Maturity: | ||||||
Pari Passu Mortgage Debt: | Most Recent NOI (As of): | ||||||
| Subordinate Mortgage Debt: | Second Most Recent NOI (As of)(3): | ||||||
| Mezzanine Debt: | Third Most Recent NOI (As of)(3): | ||||||
Reserves(1) | Appraised Value: | ||||||
| Type | Initial | Monthly | Cap | Appraisal As-of Date: | |||
| RE Tax: | Cut-off Date LTV Ratio: | ||||||
| Insurance: | LTV Ratio at Maturity/ARD: | ||||||
| Recurring Replacements: | Occupancy Rate: | ||||||
| TI/LC: | 2nd Most Recent Occupancy: | ||||||
Occupancy 2008-2012(3): | NAP | ||||||
| (1) | See “—Escrows and Reserves” below for further discussion of reserve requirements. |
| (2) | The Merrimack Premium Outlets Borrower owns a leasehold interest in the Merrimack Premium Outlets Property; however, the fee owner, which is a borrower-related entity, has joined the mortgage and provided its fee interest as collateral for the Merrimack Premium Outlets Mortgage Loan. |
| (3) | The Merrimack Premium Outlets Property is new construction with occupancy taking place in 2012 and 2013. The Merrimack Premium Outlets Property opened in June 2012. |
The Merrimack Premium Outlets Mortgage Loan
The Mortgage Loan. The largest mortgage loan (the “Merrimack Premium Outlets Mortgage Loan”) is evidenced by a note in the original principal amount of $130,000,000 and is secured by a first priority fee mortgage encumbering an outlet shopping center known as Merrimack Premium Outlets located in Merrimack, New Hampshire (the “Merrimack Premium Outlets Property”).
The Merrimack Premium Outlets Mortgage Loan had an initial term of 120 months and has a remaining term of 117 months, with a maturity date of July 1, 2023. The Merrimack Premium Outlets Mortgage Loan requires payments of interest only for its initial two years and principal and interest thereafter. Defeasance with direct, non-callable obligations of the United States of America (or other non-callable government securities or other non-callable instruments that will not cause the trust to lose its REMIC status and, in each case, will not result in a downgrade or withdrawal of the ratings for the MSBAM Series 2013-C12 Certificates) is permitted at any time on or after the first due date following the second anniversary of the securitization closing date. The Merrimack Premium Outlets Mortgage Loan is open to prepayment in full (without prepayment consideration) during the final six months of the loan term.
The Borrower and the Sponsor. The borrower is Merrimack Premium Outlets Center, LLC (the “Merrimack Premium Outlets Borrower”), a single-purpose Delaware limited liability company with two independent directors. The Merrimack Premium Outlets Borrower is indirectly 100% owned and
| This is not a research report and was not prepared by the Underwriters’ research departments. Please see additional important information and qualifications at the end of this Term Sheet. |
T-27
| MSBAM 2013-C12 | Merrimack Premium Outlets |
controlled by Simon Property Group, L.P., a majority owned operating subsidiary of Simon Property Group, Inc. (NYSE: SPG) (“Simon”). Simon Property Group L.P. is the non-recourse carve-out guarantor. Total liability under the non-recourse carve-out guaranty is capped at $13,000,000.
Simon is a real estate investment trust that engages in the ownership, operation, leasing, management, acquisition, expansion and development of real estate properties consisting primarily of regional malls, premium outlet centers and community shopping centers. Simon is the largest public real estate company in the United States and owns or has an interest in 326 retail real estate properties comprising approximately 241 million SF of gross leasable area in North America, Europe and Asia. Simon was founded in 1960 and is headquartered in Indianapolis, Indiana. As of the fiscal year ended December 31, 2012, Simon reported revenue of approximately $4.9 billion and net income of approximately $1.7 billion. Simon is currently rated “A-” by Fitch, “A3” by Moody’s and “A” by S&P.
The Mortgaged Property. The Merrimack Premium Outlets Property is a newly developed 408,996 SF outlet mall in Merrimack, New Hampshire, approximately 51 miles northwest of Boston. The Merrimack Premium Outlets Property consists of approximately 101,768 SF of anchor/major retail space, 303,978 SF of in-line space and 3,250 SF of food court space in seven single-story buildings, with a total of approximately 2,952 surface parking spaces, or a current parking ratio of 7.2 per 1,000 SF of GLA. It was developed by Premium Outlets, a division of Simon Property Group, Inc., and opened in June 2012. As of December 2012, the Merrimack Premium Outlets Property was 98.4% leased. Anchor and major tenants include Off 5th Saks Fifth Avenue, Bloomingdales the Outlet Store, Polo Ralph Lauren, a Nike Factory Store, a Hanesbrands store and Gap Outlet. In addition, there are 91 in-line tenants and 5 food court tenants.
The Merrimack Premium Outlets Property represents the first phase of two planned development phases at the approximately 162 acre subject site. The second retail development phase parcel, which is a designated parcel of land currently a part of the Merrimack Premium Outlets Property and adjacent to the existing improvements, may be released from the Merrimack Premium Outlets Property upon certain conditions. Please see “—Expansion, Release and Substitution of Property” below for further details. An affiliate of the Merrimack Premium Outlets Borrower is currently seeking entitlements for construction of phase II and currently plans for a 2015 completion and opening of an additional approximately 148,531 SF of retail space, which will not be collateral for the Merrimack Premium Outlets Mortgage Loan.
As of August 7, 2013, the Merrimack Premium Outlets property was 100% leased. Average in-line sales for the trailing 12-month period ending August 31, 2013, representing approximately 288,433 of in-line tenants, excluding anchor and major tenants, food court tenants, and approximately 15,545 SF of in-line tenants which do not have a full year of sales results, were approximately $441 PSF. The trailing 12-month average occupancy cost for these tenants was approximately 11.1%.
Anchor/Major Tenants.
Off 5th Saks Fifth Avenue (28,000 SF, 7% of NRA, 4% of underwritten base rent). Saks Fifth Avenue, Inc. (NYSE: SKS) (“Saks”) leases 28,000 SF at the Merrimack Premium Outlets Property and operates the space as an Off 5th Saks Fifth Avenue outlet store. The lease began on June 14, 2012, and has a current expiration date of June 30, 2022, with three 5-year lease renewal options. The tenant has a lease termination option effective at the end of the 5th year if gross sales are less than $4,200,000 during the 5th lease year, subject to a $1,110,700 early termination fee. If, however, gross sales for lease years 3 or 4 exceed the cancellation threshold, then the termination option is void. As of February 2, 2013, Saks operated 108 stores, including 65 “Off 5th” locations. On July 29, 2013, the company announced a definitive merger agreement whereby Hudson Bay Company will acquire Saks in an all-cash transaction.
Bloomingdale’s The Outlet Store (23,920 SF, 6% of NRA, 5% of underwritten base rent). Bloomingdale’s The Outlet Store, with Bloomingdale’s, Inc., (“Bloomindales”) as lease guarantor, leases 23,920 SF at the Merrimack Premium Outlets Property and operates the space as a Bloomingdale’s Outlet store. The lease began on June 14, 2012, and has a current expiration date of January 31, 2023, with two 5-year lease renewal options. The tenant has a lease termination option effective at the end of the 5th year if gross sales are less than $3,994,560 during the 5th lease year, subject to a $393,200 early termination fee. If, however, gross sales for any three of the first five lease years satisfy the cancellation threshold, then the termination option is void. Bloomingdales is a subsidiary of Macy’s Inc. (NYSE: M), which, as of August 23, 2013, operated approximately 850 stores, including 36 Bloomindale’s stores, plus 13 Bloomindale’s Outlet stores.
Polo Ralph Lauren (15,800 SF, 4% of NRA, 0% of underwritten base rent). Ralph Lauren Retail, Inc. (“Ralph Lauren”), an affiliate of Ralph Lauren Corporation (NYSE: RL), leases 15,800 SF at the Merrimack Premium Outlets Property and operates the space as a factory outlet store. The lease began on June 14, 2012, and has a current expiration date of June 30, 2022, with four 5-year lease renewal options. The tenant has the right to terminate the lease any time after the second lease year if gross sales for any 12 month period after the first lease year through the end of the seventh lease year do not exceed $650 PSF. The lease does not require payment of any base rent; however, percentage rent equal to 3% of gross sales up to and including $750 PSF and 2% of sales above $750 PSF is payable, in addition to applicable expense recoveries. Underwritten percentage rent applicable to this tenant is $192,624.
| This is not a research report and was not prepared by the Underwriters’ research departments. Please see additional important information and qualifications at the end of this Term Sheet. |
T-28
| MSBAM 2013-C12 | Merrimack Premium Outlets |
The following table presents a summary regarding anchor and major tenants at the Merrimack Premium Outlets Property:
| Tenant Summary | |||||||||||
| Tenant Name | Credit Rating (Fitch/Moody’s/S&P)(1) | Tenant NRSF | Approximate % of NRSF | Annualized Underwritten Base Rent) | % of Total Annualized UW Rent | Total Annual Underwritten Base Rent (PSF)(3) | Lease Expiration | TTM August 2013 Sales PSF | UW Occupancy Cost as a % of Sales | ||
| Anchor/Major Tenants | |||||||||||
Off 5th Saks Fifth Avenue | BB/Ba3/BB | 28,000 | 7% | $532,000 | 4% | $19.00 | 6/30/2022 | $166 | 11.7% | ||
| Bloomingdales The Outlet Store | BBB/Baa3/BBB | 23,920 | 6% | $598,000 | 5% | $25.00 | 1/31/2023 | $166 | 15.0% | ||
| Polo Ralph Lauren | NR/A3/A | 15,800 | 4% | $0 | (2) | 0% | $0.00 | 6/30/2022 | $406 | 3.2% | (2) |
| Nike Factory Store | NR/A1/A+ | 13,012 | 3% | $234,216 | 2% | $18.00 | 6/30/2017 | $619 | 5.1% | ||
| Hanesbrands | NR/Ba3/BB | 10,536 | 3% | $325,562 | 3% | $30.90 | 6/30/2022(4) | $160 | 30.4% | ||
| Gap Outlet | BBB-/Baa3/BBB- | 10,500 | 3% | $246,330 | 2% | $23.46 | 6/30/2017 | $678 | 5.5% | ||
| Subtotal/Wtd. Avg. | 101,768 | 25% | $1,936,108 | 16% | $22.52 | ||||||
| In-line and Food Court Tenants | 307,228 | 75% | $10,495,284 | 84% | $34.16 | ||||||
| Vacant Space | 0 | 0% | $0 | 0% | $0.00 | ||||||
| Total | 408,996 | 100% | $12,431,392 | 100% | $31.62 | ||||||
| (1) | Certain ratings are those of the parent company whether or not the parent guarantees the lease. On July 29, 2013, Saks Fifth Avenue, Inc. announced a definitive merger whereby Hudson Bay Company will acquire the company in an all-cash transaction. |
| (2) | Polo Ralph Lauren does not pay base rent. The tenant pays percentage rent equal to 3% of gross sales up to $750 PSF and 2% of gross sales above $750 PSF, plus applicable expense recoveries. $192,624 of percentage rent is underwritten for this tenant in lieu of base rent. |
| (3) | Total Annualized Underwritten Base Rent (PSF) excludes vacant space and the Polo Ralph Lauren space, which is not subject to a base rental payment. |
| (4) | In addition to certain lease termination rights described above for Off 5th Saks Fifth Avenue, Bloomingdale’s The Outlet Store, and Polo Ralph Lauren, the Hanesbrands tenant has the right to terminate its lease if it does not achieve sales of at least $175 PSF during the 3rd and 4th years of its lease term, subject to a $150,081 termination payment. |
The following table presents certain information relating to the lease rollover at the Merrimack Premium Outlets Property:
Lease Rollover Schedule(1)(2) | |||||||||
| Year | # of Leases Rolling | SF Rolling | Average Underwritten Base Rent PSF Rolling(3) | Approx. % of Total SF Rolling | Approx. Cumulative % of SF Rolling | Total Underwritten Base Rent Rolling | Approx. % of Total Base Rent Rolling | Approx. Cumulative % of Total Base Rent Rolling | |
| MTM | 0 | 0 | $0.00 | 0% | 0% | $0 | 0% | 0% | |
| 2013 | 0 | 0 | $0.00 | 0% | 0% | $0 | 0% | 0% | |
| 2014 | 0 | 0 | $0.00 | 0% | 0% | $0 | 0% | 0% | |
| 2015 | 1 | 1,266 | $61.80 | 0% | 0% | $78,239 | 1% | 1% | |
| 2016 | 0 | 0 | $0.00 | 0% | 0% | $0 | 0% | 1% | |
| 2017 | 16 | 80,085 | $27.49 | 20% | 20% | $2,201,432 | 18% | 18% | |
| 2018 | 0 | 0 | $0.00 | 0% | 20% | $0 | 0% | 18% | |
| 2019 | 1 | 1,182 | $61.80 | 0% | 20% | $73,048 | 1% | 19% | |
| 2020 | 0 | 0 | $0.00 | 0% | 20% | $0 | 0% | 19% | |
| 2021 | 0 | 0 | $0.00 | 0% | 20% | $0 | 0% | 19% | |
| 2022 | 56 | 198,113 | $33.78 | 48% | 69% | $6,159,325 | 50% | 68% | |
| 2023 | 27 | 127,084 | $30.14 | 31% | 100% | $3,830,730 | 31% | 99% | |
| 2024 | 1 | 1,266 | $70.00 | 0% | 100% | $88,620 | 1% | 100% | |
| 2025 | 0 | 0 | $0.00 | 0% | 100% | $0 | 0% | 100% | |
| 2026 & Beyond | 0 | 0 | $0.00 | 0% | 100% | $0 | 0% | 100% | |
| Vacant | 0 | 0 | $0.00 | 0% | 100% | $0 | 0% | 100% | |
| Total/Wtd. Avg. | 102 | 408,996 | $31.62 | 100% | $12,431,392 | 100% | |||
| (1) | The information in the lease rollover schedule is based on the underwritten rent roll. |
| (2) | Certain tenants may have lease termination options that are exercisable prior to the originally stated expiration date of the related lease and that are not considered in the lease rollover schedule. Various tenants at the Merrimack Premium Outlets Property have lease termination options associated with minimum gross sales thresholds. |
| (3) | The Average Underwritten Base Rent PSF Rolling calculations for 2022 and the Total/Wtd. Avg. exclude the Polo Ralph Lauren space, which is not subject to base rent but which pays percentage rent plus applicable expense recoveries. |
| This is not a research report and was not prepared by the Underwriters’ research departments. Please see additional important information and qualifications at the end of this Term Sheet. |
T-29
| MSBAM 2013-C12 | Merrimack Premium Outlets |
The Market. The Merrimack Premium Outlets Property is located in Merrimack, Hillsborough County, New Hampshire, at Exit 10 of the Frederick E. Everett Turnpike, within the northern portion of the Boston MSA. The turnpike is a four to eight lane highway that runs from Interstate 95 and the Burlington, Massachusetts market from the south, through southern New Hampshire to Manchester to the north. The Manchester Airport is located approximately 8 miles north of the Merrimack Premium Outlets Property and the 500,000 SF Anheuser-Busch brewery and the 1 million SF Fidelity Investments corporate campus are both nearby. According to the appraiser, the Merrimack Premium Outlets Property benefits from the tax free shopping policy of New Hampshire and draws consumers from the greater Boston market as well as from Canada. The Boston CBSA had an estimated 2012 population of over 5 million people and an average annual household income of $88,933. Below is a chart of local and outlet competitive shopping centers.
Competitive Property Summary | |||||||||
| Property | Center Type | Year Built | Year Renovated/ Expanded | Total GLA (SF) | Anchor Tenants | Sales PSF | Occupancy | Proximity | |
The Mall at Rockingham Park (Local Competition) 99 Rockingham Park Boulevard Salem, NH | Super-Regional Mall | 1991 | 1993/2000 | 1,019,955 | JC Penney Lord & Taylor Macy’s Sears | $470 | 98% | 14.0 miles southeast | |
Pheasant Lane Mall (Local Competition) 310 Daniel Webster Highway Nashua, NH | Super-Regional Mall | 1986 | 2011/1999 | 972,249 | Dick’s Sporting Goods JC Penney Macy’s Sears | $500 | 98% | 8.0 miles south | |
Mall of New Hampshire (Local Competition) 1500 South Willow StreetManchester, NH | Super-Regional Mall | 1977 | 1998/1996-1998 | 811,310 | JC Penney Macy’s Sears | $360 | 97% | 10.0 miles north | |
Tanger Outlets - Tilton (Outlet Competition) 120 Laconia Road Tilton, NH | Outlet Center | 1994 | NA | 245,698 | Old Navy | $330 | 100% | 44.0 miles north | |
Settlers Green Outlet Village (Outlet Competition) 2 Common Court North Conway, NH | Outlet Center | 1988 | 1997/NA | 287,556 | NA | $360 | 100% | 85.0 miles northeast | |
Tanger Outlets – Kittery (Outlet Competition) 283 US Route 1 Kittery, ME | Outlet Center | 1989 | NA | 82,286 | NA | $340 | 100% | 44.0 miles northeast | |
Kittery Premium Outlets (Outlet Competition) 375 US Route 1 Kittery, ME | Outlet Center | 1985 | NA | 264,951 | NA | $480 | 99% | 44.0 miles northeast | |
Wrentham Premium Outlets (Outlet Competition) 1 Premium Outlet Boulevard Wrentham, MA | Outlet Center | 1997 | NA | 660,096 | Bloomingdale’s Outlet Off 5th Avenue | $770 | 100% | 54.0 miles south | |
Source: Appraisal
| This is not a research report and was not prepared by the Underwriters’ research departments. Please see additional important information and qualifications at the end of this Term Sheet. |
T-30
| MSBAM 2013-C12 | Merrimack Premium Outlets |
Operating History and Underwritten Net Cash Flow. The following table presents certain information relating to the historical operating performance and the Underwritten Net Cash Flow at the Merrimack Premium Outlets Property:
| Cash Flow Analysis(1) | ||||||||||||
| 2010 | 2011 | 2012 | 8/31/2013 TTM | UW | UW PSF | |||||||
Base Rent(2) | $0 | $0 | $0 | $12,291,184 | $12,431,392 | $30.39 | ||||||
Percentage Rent in Lieu(3) | $0 | $0 | $0 | $0 | $192,624 | $0.47 | ||||||
| Overage Rent | $0 | $0 | $0 | $694,822 | $745,000 | $1.82 | ||||||
Other Income(4) | $0 | $0 | $0 | $459,402 | $498,000 | $1.22 | ||||||
| Total Recoveries | $0 | $0 | $0 | $6,552,075 | $7,370,000 | $18.02 | ||||||
Less Vacancy & Credit Loss(5) | $0 | $0 | $0 | $0 | ($971,165) | ($2.37) | ||||||
| Effective Gross Income | $0 | $0 | $0 | $19,997,483 | $20,265,851 | $49.55 | ||||||
| Total Operating Expenses | $0 | $0 | $0 | $7,143,940 | $7,581,051 | $18.54 | ||||||
| Net Operating Income | $0 | $0 | $0 | $12,853,543 | $12,684,800 | $31.01 | ||||||
| TI/LC | $0 | $0 | $0 | $0 | $717,967 | $1.76 | ||||||
| Capital Expenditures | $0 | $0 | $0 | $0 | $81,799 | $0.20 | ||||||
| Net Cash Flow | $0 | $0 | $0 | $12,853,543 | $11,885,035 | $29.06 | ||||||
| Occupancy % | NAP | NAP | NAP | 100.0% | 95.0% | |||||||
| NOI DSCR | NAP | NAP | NAP | 1.77x | 1.75x | |||||||
| NCF DSCR | NAP | NAP | NAP | 1.77x | 1.64x | |||||||
| NOI Debt Yield | NAP | NAP | NAP | 9.9% | 9.8% | |||||||
| NCF Debt Yield | NAP | NAP | NAP | 9.9% | 9.1% | |||||||
Average Annual Base Rent PSF(6) | NAP | NAP | NAP | $31.26 | $31.62 | |||||||
| (1) | The Merrimack Premium Outlets Property is a new development that opened in June 2012. |
| (2) | Historical Base Rent includes actual property vacancy. Underwritten Base Rent includes approximately $241,883 of contractual rent increases through January 31, 2014. |
| (3) | Percentage Rent in Lieu represents the underwritten percentage rent applicable to the Polo Ralph Lauren tenant. This tenant does not pay a base rental rate, but instead pays 3% of its gross sales on all sales up to $750 PSF and 2% of its gross sales on all sales above $750 PSF. |
| (4) | Underwritten Other Income includes specialty leasing, other rental income, and miscellaneous income. |
| (5) | A 5% vacancy rate is applied to major and inline tenants. The Merrimack Premium Outlets Property was 100% leased as of 8/7/2013. |
| (6) | The Underwritten Average Annual Base Rent PSF includes certain contractual rent steps as described in note 2 above. The TTM (8/31/2013) and Underwritten Average Annual Base Rent PSF both exclude the 15,800 SF leased by the Polo Ralph Lauren tenant on a percentage rent basis. The property opened in June 2012 – historical Average Annual Base Rent PSF before the TTM period is not available. |
Escrows and Reserves. During a Trigger Period (as defined below), the Merrimack Premium Outlets Borrower is required to escrow 1/12th of the annual estimated tax payments monthly and 1/12th of the annual estimated insurance premiums monthly (unless the Merrimack Premium Outlets Borrower maintains insurance under an acceptable blanket insurance policy). The Merrimack Premium Outlets Borrower is also required, during the continuance of a Trigger Period, to make monthly deposits of $6,817 for replacement reserves and $34,083 for TI/LC reserves, provided that such deposits are not required at any time that the amount then on deposit in the replacement reserve exceeds $163,598 or in the TI/LC reserve exceeds $817,992.
Lockbox and Cash Management. A hard lockbox is in place with respect to the Merrimack Premium Outlets Mortgage Loan. The Merrimack Premium Outlets Mortgage Loan has springing cash management. Provided neither a Trigger Period nor a Cash Sweep Period has commenced, funds in the lockbox account are swept each Wednesday to an account designated by the Merrimack Premium Outlets Borrower. During the continuance of a Trigger Period, funds in the lockbox account are applied on each monthly payment date to pay debt service on the Merrimack Premium Outlets Mortgage Loan, to fund the required reserves deposits as described above under “—Escrows and Reserves,” and to disburse any excess to Merrimack Premium Outlets Borrower; provided, that if a Cash Sweep Period exists, then a portion of the funds in the lockbox account will be applied to fund an operating expense subaccount up to the amount of lender approved budgeted operating expenses for the next month and the excess funds will be applied first, to fund an extraordinary expense subaccount up to the amount of extraordinary expenses approved by lender for the next month and then, to remit the remainder to an account to be held by the mortgagee as additional security for the Merrimack Premium Outlets Mortgage Loan.
A “Trigger Period” will commence upon the debt service coverage ratio for two consecutive quarters being less than 1.30x for the immediately preceding four calendar quarters and continue until the debt service coverage ratio for the immediately preceding four calendar quarters is equal to or greater than 1.30x for two consecutive quarters.
A “Cash Sweep Period” will commence upon (a) the occurrence of an event of default or (b) the debt service coverage ratio for two consecutive quarters being less than 1.20x for the immediately preceding four calendar quarters and continue until either (1) the event of default is cured or waived or (2) the debt service coverage ratio for the immediately preceding four calendar quarters is equal to or greater than 1.20x for two consecutive quarters.
Property Management. The Merrimack Premium Outlets Property is managed by Simon Management Associates II, LLC, an affiliate of the Merrimack Premium Outlets Borrower.
Mezzanine Loan and Preferred Equity. Not permitted.
Additional Secured Indebtedness (not including trade debts). Not permitted.
Release of Property. Not permitted, except as described in “—Expansion, Release and Substitution of Property” below.
| This is not a research report and was not prepared by the Underwriters’ research departments. Please see additional important information and qualifications at the end of this Term Sheet. |
T-31
| MSBAM 2013-C12 | Merrimack Premium Outlets |
Terrorism Insurance. Generally, the insurance policies maintained by the Merrimack Premium Outlets Borrower are not permitted to contain an exclusion for acts of terrorism with respect to the Merrimack Premium Outlets Property or if the Terrorism Risk Insurance Program Reauthorization Act of 2007 (as amended or restated) is not in effect and such insurance policies contain an exclusion for acts of terrorism, Merrimack Premium Outlets Borrower will obtain, to the extent available, a stand-alone policy that provides the same coverage as the insurance policies would have if such exclusion did not exist, provided that such stand-alone policy may have a deductible that is reasonable for such stand-alone policy with respect to properties similar to the Merrimack Premium Outlets Property and reasonable for the geographic region where the Merrimack Premium Outlets Property is located, so long as in no event shall such deductible exceed $5,000,000.
Expansion, Release and Substitution of Property. Provided no event of default shall have occurred and is continuing, prior to the opening of business of retail stores on a portion of the Merrimack Premium Outlets Property designated on a schedule to the loan agreement and to which no value was attributed in the appraisal delivered at Merrimack Premium Outlets Mortgage Loan closing and no underwritten cash flow was attributed (such portion, the “Merrimack Premium Outlets Release Parcel”), the Merrimack Premium Outlets Borrower may obtain a release of the Merrimack Premium Outlets Release Parcel and in connection therewith legally subdivide the Merrimack Premium Outlets Release Parcel and separate it from the remainder of the Merrimack Premium Outlets Property, provided that, among other conditions, (i) the Merrimack Premium Outlets Release Parcel is transferred by the Merrimack Premium Outlets Borrower to a third party (which may be an affiliate of the Merrimack Premium Outlets Borrower), (ii) the Merrimack Premium Outlets Release Parcel is not necessary for the Merrimack Premium Outlets Property to comply with all applicable legal requirements, and (iii) if the Merrimack Premium Outlets Borrower is relocating existing tenants at the Merrimack Premium Outlets Property to the Merrimack Premium Outlets Release Parcel, the Merrimack Premium Outlets Borrower certifies to lender that such relocation will not cause a material diminution in the annual gross revenue generated from the operation of the Merrimack Premium Outlets Property (which certification must be accompanied by a copy of the then current leasing plan for the Merrimack Premium Outlets Property and the Merrimack Premium Outlets Release Parcel).
| This is not a research report and was not prepared by the Underwriters’ research departments. Please see additional important information and qualifications at the end of this Term Sheet. |
T-32
(THIS PAGE INTENTIONALLY LEFT BLANK)
| This is not a research report and was not prepared by the Underwriters’ research departments. Please see additional important information and qualifications at the end of this Term Sheet. |
T-33
| MSBAM 2013-C12 | 15 MetroTech Center |
Mortgage Loan No. 2 – 15 MetroTech Center
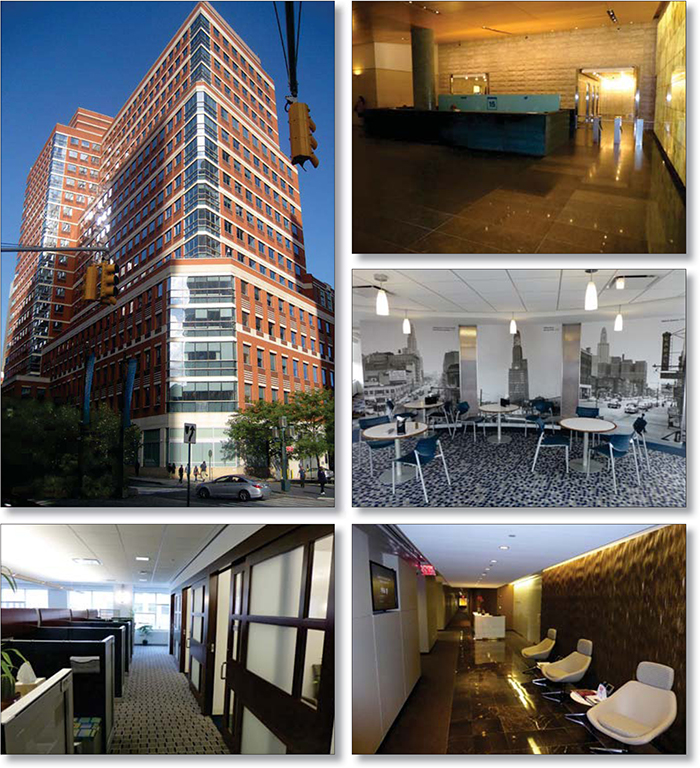
| This is not a research report and was not prepared by the Underwriters’ research departments. Please see additional important information and qualifications at the end of this Term Sheet. |
T-34
| MSBAM 2013-C12 | 15 MetroTech Center |
Mortgage Loan No. 2 – 15 MetroTech Center
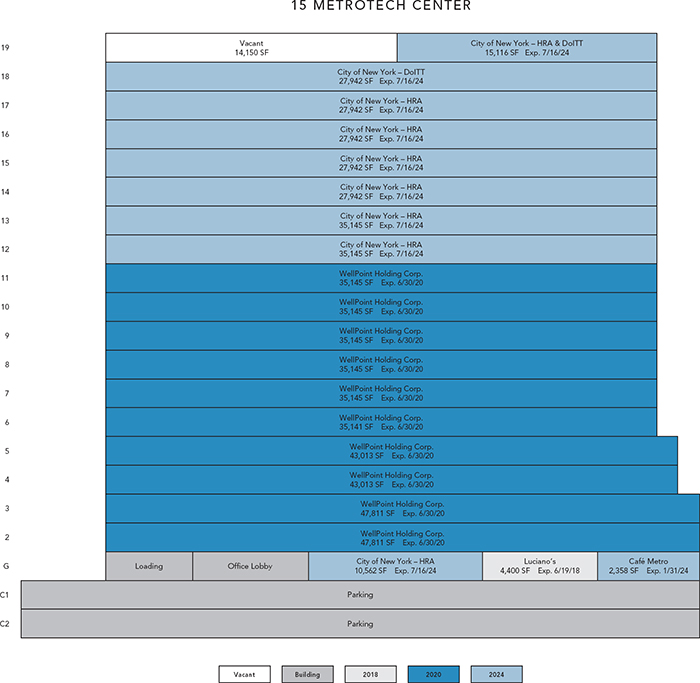
| This is not a research report and was not prepared by the Underwriters’ research departments. Please see additional important information and qualifications at the end of this Term Sheet. |
T-35
| MSBAM 2013-C12 | 15 MetroTech Center |
Mortgage Loan No. 2 – 15 MetroTech Center
| This is not a research report and was not prepared by the Underwriters’ research departments. Please see additional important information and qualifications at the end of this Term Sheet. |
T-36
| MSBAM 2013-C12 | 15 MetroTech Center |
| Mortgage Loan No. 2 – 15 MetroTech Center |
| Mortgage Loan Information | Mortgaged Property Information | ||||||
| Mortgage Loan Seller: | BANA | Single Asset/Portfolio: | Single Asset | ||||
Credit Assessment: (Fitch/KBRA/Moody’s) | NR/NR/NR | Property Address: | 15 MetroTech Center Brooklyn, NY 11201 | ||||
Original Balance(1): | $90,000,000 | General Property Type: | Office | ||||
Cut-off Date Balance(1): | $89,857,812 | Detailed Property Type: | CBD | ||||
% of Initial Pool Balance(1): | 7.0% | Net Rentable Area: | 649,492 SF | ||||
| Loan Purpose: | Refinance | Cut-off Date Balance Per Unit/SF(1): | $261 | ||||
| Borrower Name(s): | Forest City Myrtle Associates, LLC | Balloon/ARD Balance Per Unit/SF(1): | $199 | ||||
| Sponsor(s): | Forest City Enterprises, Inc. | Year Built/Year Renovated: | 2003/NAP | ||||
| Mortgage Rate: | 5.406% | Title Vesting: | Leasehold | ||||
| Note Date: | 8/2/2013 | Property Manager: | First New York Partners Management, LLC | ||||
| First Payment Date: | 10/1/2013 | ||||||
| Anticipated Repayment Date: | NAP | Underwriting and Financial Information | |||||
| Maturity Date: | 9/1/2023 | UW Revenues: | $29,193,307 | ||||
| IO Period: | None | UW Expenses: | $10,388,785 | ||||
| Original Term to Maturity or ARD: | 120 months | UW NOI: | $18,804,522 | ||||
| Seasoning: | 1 month | UW NCF: | $17,667,149 | ||||
| Original Amortization Term: | 300 months | UW NOI DSCR(1): | 1.51x | ||||
| Loan Amortization Type: | Amortizing | UW NCF DSCR(1): | 1.42x | ||||
| Interest Accrual Basis: | Actual/360 | UW NOI Debt Yield(1): | 11.1% | ||||
| Prepayment Provisions: | YM1 (25); DEF/YM1 (91); O (4) | UW NCF Debt Yield(1): | 10.4% | ||||
| Lockbox/Cash Management: | Hard/In Place | UW NCF Debt Yield at Maturity(1): | 13.7% | ||||
Pari Passu Mortgage Debt(1): | $80,000,000 | Most Recent NOI (As of): | $20,400,186 (5/31/2013 TTM) | ||||
| Subordinate Mortgage Debt: | None | 2nd Most Recent NOI (As of): | $20,631,997 (12/31/2012) | ||||
| Mezzanine Debt: | None | 3rd Most Recent NOI (As of): | $20,454,454 (12/31/2011) | ||||
Reserves(2) | Appraised Value: | $273,000,000 | |||||
| Type | Initial | Monthly | Cap | Appraisal As-of Date: | 7/19/2013 | ||
| RE Tax: | $148,798 | $49,599 | NAP | Cut-off Date LTV Ratio(1): | 62.2% | ||
| Insurance: | $0 | Springing | NAP | LTV Ratio at Maturity/ARD(1): | 47.4% | ||
| Recurring Replacements: | $0 | $10,825 | NAP | Occupancy Rate (As of): | 97.8% (7/31/2013) | ||
| TI/LC: | $0 | $81,250 | NAP | 2nd Most Recent Occupancy (As of): | 97.8% (12/31/2012) | ||
| Ground Rent: | $198,362 | $99,181 | NAP | 3rd Most Recent Occupancy (As of): | 99.9% (12/31/2011) | ||
| Additional Tax: | $90,000 | $0 | NAP | ||||
Other(3): | NAP | Excess Cash Flow | $4,400,000 | ||||
| (1) | The 15 MetroTech Center Mortgage Loan is part of the 15 MetroTech Center Loan Pair evidenced by four pari passu notes with an aggregate original principal balance of $170,000,000. The Cutoff Date Balance Per Unit/SF, Balloon/ARD Balance Per Unit/SF, UW NOI DSCR, UW NCF DSCR, UW NOI Debt Yield, UW NCF Debt Yield, UW NCF Debt Yield at Maturity, Cut-off Date LTV Ratio and LTV Ratio at Maturity/ARD numbers presented above are based on the entire $170,000,000 15 MetroTech Center Loan Pair balance. |
| (2) | See “—Escrows and Reserves” below for further discussion of reserve requirements. |
| (3) | The 15 MetroTech Center Borrower is required to deposit all excess cash (subject to an annual cap of $4,400,000) into escrow on each payment date through and including the June 2020 payment date related to re-tenanting the WellPoint tenant space as described in the 15 MetroTech Center Mortgage Loan documents. |
The 15 MetroTech Center Mortgage Loan.
The Mortgage Loan. The second largest mortgage loan (the “15 MetroTech Center Mortgage Loan”) is a refinance loan evidenced by four pari passu notes (the “15 MetroTech Center Loan Pair”), in the aggregate original principal amount of $170,000,000, all of which are secured by the same first priority leasehold mortgage encumbering an office property known as 15 MetroTech Center located in Brooklyn, New York (the “15 MetroTech Center Property”). The 15 MetroTech Center pari passu notes A-1A and A-1B, with a combined original principal amount of $90,000,000, are being contributed to the issuing entity. The pari passu notes A-2A and A-2B, which are not included in the issuing entity, evidences the related companion loan (the “15 MetroTech Center Serviced Companion Loan”), and has a combined original principal amount of $80,000,000. The 15 MetroTech Center Serviced Companion Loan has similar loan features and terms as the 15 MetroTech Center Mortgage Loan and was contributed to the COMM 2013-LC13 transaction. See “—Secured Indebtedness” below for further details. The proceeds of the 15 MetroTech Center Mortgage Loan were used to refinance the previous loan secured by the 15 MetroTech Center Property, which had an existing balance of approximately $251.3 million.
| This is not a research report and was not prepared by the Underwriters’ research departments. Please see additional important information and qualifications at the end of this Term Sheet. |
T-37
| MSBAM 2013-C12 | 15 MetroTech Center |
The 15 MetroTech Center Mortgage Loan had an initial term of 120 months and has a remaining term of 119 months, with a maturity date of September 1, 2023. The 15 MetroTech Center Mortgage Loan requires payments of principal and interest for the entire term. The 15 MetroTech Center Mortgage Loan may be prepaid in whole on any date together with, prior to the open prepayment period, payment of the greater of a yield maintenance premium and 1% of the prepayment amount, and, if the prepayment is made other than on the payment date, interest that would have accrued through the next payment date. Defeasance with direct, non-callable obligations of the United States of America (or other non-callable government securities or other non-callable instruments that will not cause the trust to lose its REMIC status and, in each case, will not result in a downgrade or withdrawal of the ratings for the MSBAM Series 2013-C12 Certificates) is also permitted at any time on or after the first due date following the second anniversary of the securitization closing date. The 15 MetroTech Center Mortgage Loan is open to prepayment in full (without prepayment consideration) during the final three months of the loan term.
The Borrower and the Sponsor. The 15 MetroTech Center Borrower is Forest City Myrtle Associates, LLC, a special purpose bankruptcy remote entity with two independent directors (the “15 MetroTech Center Borrower”). Forest City Myrtle Associates, LLC is wholly owned by Forest City Myrtle Mezzanine, LLC, an affiliate of Forest City Enterprises, Inc., the sponsor and recourse carve-out guarantor (provided that the coverage of the non-recourse carve-out guaranty is limited to certain events of bankruptcy of the borrower and capped at $50 million).
The 15 MetroTech Center Mortgage Loan sponsor is Forest City Enterprises, Inc. (NYSE: FCE.A), an owner, developer and manager of a diverse portfolio of real estate property located throughout the United States. The Forest City Enterprises, Inc. operates primarily in Boston, Chicago, Dallas, Denver, Los Angeles, New York, Philadelphia, the Greater San Francisco metropolitan area, and the Greater Washington D.C. metropolitan area. Founded in 1920 and headquartered in Cleveland, Ohio, Forest City Enterprises, Inc. has assets of approximately $10.7 billion as of July 31, 2013, which include ownership interest in 47 office properties of approximately 13 million SF, 115 apartment communities contained within 32,564 units and 44 retail centers of approximately 15.2 million total SF. Forest City Enterprises, Inc. is currently rated “BB-” by Fitch, “B3” by Moody’s and “B+” by S&P.
The Mortgaged Property. The 15 MetroTech Center Property is a 19-story class “A” office building complex containing 649,492 SF located in Brooklyn, Kings County, New York. The 15 MetroTech Center Property is bounded by Flatbush Avenue to the east, Myrtle Avenue to the south, Bridge Street to the west and Tech Place to the north. The 15 MetroTech Center Property is located within Metrotech Center, a major employment and educational center, and in close proximity to the A, C, F and R subway lines at the Jay Street subway station and the No. 2 and 3 subway lines at the Hoyt-Street – Fulton Street station.
As of July 31, 2013, the 15 MetroTech Center Property was 97.8% leased by four tenants. The historical occupancy at the 15 MetroTech Center Property was 97.8% as of December 31, 2012, 99.9% as of December 31, 2011 and 99.9% as of December 31, 2010. The 15 MetroTech Center Property contains a below grade parking garage with 243 parking spaces.
The 15 MetroTech Center Property is subject to a long term ground lease. The lessor on the ground lease is the City of New York. The lease commenced on December 31, 2001 and expires on December 31, 2100. The base rent for the first period (July 1, 2003 through June 30, 2023) is $855,000, which is also during the 15 MetroTech Center Loan term. For the remainder of the ground lease term (July 1, 2023 through December 31, 2100) the base rent will be 10% of the appraised fair market value of the land with reappraisals occurring every 10th anniversary thereafter. From July 1, 2010 through June 30, 2015, the annual supplemental rent is $335,173. From July 1, 2015 through June 30, 2040, the annual supplemental rent is $494,708. Additionally, commencing in 2025, the borrower is required to begin repaying $3,762,000 related to the original condemnation of the land by the City of New York, which is labeled as a surplus payment, with annual payments of $609,106 through 2039.
The borrower is obligated to pay the City of New York semi-annually (January and June) a payment in lieu of taxes (PILOT) in the amount of real property taxes assessed against the 15 MetroTech Center Property less 100% of the exemption base for the initial 16 years beginning July 1, 2001. Beginning in the 2018/2019 tax year the exemption base will be reduced by 10% per year until the PILOT amount is equal to the real property taxes assessed. The PILOT payment was underwritten based on the average payment during the 15 MetroTech Center Loan term.
Major Tenants.
WellPoint Holding Corp. (392,514 SF, 60.4% of NRA, 63.5% of underwritten base rent). WellPoint Holding Corp. (NYSE: WLP) leases 392,514 SF at the 15 MetroTech Center Property under a 17-year lease expiring on June 30, 2020, with two, ten-year renewal options. The lease provides for a rental rate of $39.31 PSF. WellPoint Holding Corp. currently subleases approximately 92% (360,360 SF) of its space to several tenants, including: The State of NY Office of General Services (133,387 SF), Tough Mudder LLC (70,290 SF), Visiting Nurse Regional Health Care System (70,290 SF), Weil, Gotshal & Manges LLP (35,145 SF), NYC Polytechnic (35,145 SF) and The Brooklyn Hospital Center (15,653 SF). Visiting Nurse sub-subleases one floor to New Jersey Basketball, LLC. All of the subleases expire on June 29, 2020, one day prior to the WellPoint Inc.’s lease expiration. WellPoint Holding Corp. is a health benefits company that offers network-based managed care plans to large and small employer, individual, Medicaid and senior markets in the United States. WellPoint Holding Corp. is an independent licensee of the Blue Cross and Blue Shield Association serving members in California, Colorado, Connecticut, Georgia, Indiana, Kentucky, Maine, Missouri, Nevada, New Hampshire, New York, Ohio, Virginia and Wisconsin and specialty plan members in other states through UniCare. Headquartered in Indianapolis, Indiana, WellPoint Holding Corp. was formed when WellPoint Health Networks Inc. and Anthem, Inc. merged in 2004 to become the nation’s leading health benefits company. As of the fiscal year end 2012, WellPoint Holding Corp.reported revenue of approximately $61.7 billion and net income of approximately $2.7 billion. WellPoint Holding Corp. is currently rated “A-“ by Fitch,”Baa2” by Moody’s and “A-“ by S&P.
City of New York (235,678 SF, 36.3% of NRA, 34.8% of underwritten base rent). City of New York agencies New York City Human Resources Administration (“HRA/DSS”) and Department of Information Technology and Telecommunications (“DoITT”) occupy 235,678 SF at the 15 MetroTech Center Property under a 21-year lease expiring on July 16, 2024, with two, ten-year renewal options. The lease provides for a rental rate of $35.91 PSF. The HRA provides temporary help to residents with social service and economic needs. The HRA serves more than 3.0 million New Yorkers through the following programs: adult protective services, cash assistance, child support enforcement, domestic violence support, energy assistance, fraud prevention, health insurance coverage, HIV/AIDS services administration, long term care, SNAP benefits and food programs, and the WeCare program. The DoITT provides IT services, infrastructure and telecommunications to residents, businesses and visitors of the city. DoITT is responsible for maintaining the foundational IT infrastructure and systems throughout the city and employs over 1,200 people. The agency was created in 1966 by Executive Order 28 under Mayor John Lindsay, and now employs approximately 15,000 people. The City of New York is currently rated “AA” by Fitch, “Aa2” by Moody’s and “AA” by S&P.
| This is not a research report and was not prepared by the Underwriters’ research departments. Please see additional important information and qualifications at the end of this Term Sheet. |
T-38
| MSBAM 2013-C12 | 15 MetroTech Center |
The following table presents a summary regarding major tenants at the 15 MetroTech Center Property:
Tenant Summary(1) | ||||||||
| Tenant Name | Tenant Type | Credit Rating (Fitch/Moody’s /S&P)(2) | Tenant SF | Approx. % of Collateral SF | Annualized Underwritten Base Rent ($) | % of Total Annualized Underwritten Base Rent | Annualized Underwritten Base Rent ($ Per NRSF)(3) | Lease Expiration |
| Major Tenants | ||||||||
Wellpoint Holding Corp.(4) | Office | A-/Baa2/A- | 392,514 | 60% | $15,429,725 | 63% | $39.31 | 6/30/2020 |
| City of New York (HRA & DoITT) | Office | AA/Aa2/AA | 235,678 | 36% | $8,462,955 | 35% | $35.91 | 7/16/2024 |
| Luciano’s | Retail | NR/NR/NR | 4,400 | 1% | $261,855 | 1% | $59.51 | 6/19/2018 |
| Café Metro | Retail | NR/NR/NR | 2,358 | 0% | $145,943 | 1% | $61.89 | 1/31/2024 |
| Subtotal/Wtd. Avg. | 634,950 | 98% | $24,300,478 | 100% | $38.27 | |||
| Vacant Space | 14,542 | 2% | $0 | 0% | $0.00 | |||
| Total/Wtd. Avg. | 649,492 | 100% | $24,300,478 | 100% | $38.27 | |||
| (1) | Information is based on the underwritten rent roll. |
| (2) | Certain ratings are those of the parent company whether or not the parent guarantees the lease. |
| (3) | Total Annualized Underwritten Base Rent ($ per NRSF) excludes vacant space. |
| (4) | Wellpoint Holding Corp. currently subleases 360,360 SF (approximately 92%) of its space to six subtenants. |
The following table presents certain information relating to the lease rollover at the 15 MetroTech Center Property:
Lease Rollover Schedule(1)(2) | |||||||||
| Year | # of Leases Rolling | SF Rolling | Avg. Underwritten Base Rent PSF Rolling(3) | Approx. % of Total SF Rolling | Approx. Cumulative % of SF Rolling | Total Underwritten Base Rent Rolling | Approx. % of Total Base Rent Rolling | Approx. Cumulative % of Total Base Rent Rolling | |
| MTM | 0 | 0 | $0.00 | 0% | 0% | $0 | 0% | 0% | |
| 2013 | 0 | 0 | $0.00 | 0% | 0% | $0 | 0% | 0% | |
| 2014 | 0 | 0 | $0.00 | 0% | 0% | $0 | 0% | 0% | |
| 2015 | 0 | 0 | $0.00 | 0% | 0% | $0 | 0% | 0% | |
| 2016 | 0 | 0 | $0.00 | 0% | 0% | $0 | 0% | 0% | |
| 2017 | 0 | 0 | $0.00 | 0% | 0% | $0 | 0% | 0% | |
| 2018 | 1 | 4,400 | $59.51 | 1% | 1% | $261,855 | 1% | 1% | |
| 2019 | 0 | 0 | $0.00 | 0% | 1% | $0 | 0% | 1% | |
| 2020 | 1 | 392,514 | $39.31 | 60% | 61% | $15,429,725 | 63% | 65% | |
| 2021 | 0 | 0 | $0.00 | 0% | 61% | $0 | 0% | 65% | |
| 2022 | 0 | 0 | $0.00 | 0% | 61% | $0 | 0% | 65% | |
| 2023 & Beyond | 2 | 238,036 | $36.17 | 37% | 98% | $8,608,898 | 35% | 100% | |
| Vacant | 0 | 14,542 | $0.00 | 2% | 100% | $0 | 0% | 100% | |
| Total/Wtd. Avg. | 4 | 649,492 | $38.27 | 100% | $24,300,478 | 100% | |||
(1) | Information is based on the underwritten rent roll. |
| (2) | Certain tenants may have lease termination options that are exercisable prior to the originally stated expiration date of the subject lease and that are not considered in the lease rollover schedule. |
| (3) | Weighted Average Underwritten Base Rent PSF Rolling excludes vacant space. |
| This is not a research report and was not prepared by the Underwriters’ research departments. Please see additional important information and qualifications at the end of this Term Sheet. |
T-39
| MSBAM 2013-C12 | 15 MetroTech Center |
The Market. The 15 MetroTech Center Property is located in Brooklyn, Kings County, New York. The 15 MetroTech Center Property is situated on the north side of Myrtle Promenade between Bridge and Gold Streets within Metrotech Center in the center of the downtown Brooklyn submarket commercial corridor that is convenient to public transportation, office buildings, residential accommodations and retail service establishments. Downtown Brooklyn is generally delineated by Atlantic Avenue on the south, Clinton Street on the west, Tillary Street on the north and Flatbush Avenue to the east. Downtown Brooklyn is surrounded by the neighborhoods of Brooklyn Heights, Cobble Hill, Boerum Hill and Fort Greene.
The immediate area around The 15 MetroTech Center Property is primarily made up of a mixture of commercial, residential and hospitality buildings generally located within the MetroTech Center Business Improvement District (“BID”). The Metrotech Center BID is a non-profit initiative comprising a 25-square block district that is designated to promote businesses, residences, universities and government agencies. The BID’s general boundaries are Tillary Street to the north, Adams Street to the west, Flatbush Avenue to the south and Gold Street/Ashland Place to the east.
Downtown Brooklyn is the city’s third largest central business district after Midtown and Downtown Manhattan with just over 21.0 million SF of inventory contained within 101 buildings. As of the second quarter in 2013, the Downtown Brooklyn Class A office market had an vacancy rate of 5.4%, with a weighted average asking rental rate of $35.80 PSF.
The following table presents certain rental comparable information to the 15 MetroTech Center Property:
Summary of Comparable Office Rentals | ||||||||||||
Property (Cross Streets) | Office Area (NRA) | Year Built | Stories | Minimum Floor Size | Maximum Floor Size | Direct SF Available | Sublease SF Available | % Occupied (Direct) | Direct Asking Rent | |||
Low | High | |||||||||||
1 MetroTech Center Entire block bounded by Willoughby, Jay, Myrtle & Lawrence Sts | 887,000 | 1991 | 24 | 22,956 | 69,980 | 38,559 | 215,379 | 95.65% | $36.00 | $37.00 | ||
2 MetroTech Center Between Lawrence & Bridge Streets, & Myrtle Avenue | 525,000 | 1990 | 10 | 31,242 | 64,182 | 0 | 0 | 100.00% | N/A | N/A | ||
9 MetroTech Center North Bounded by Flatbush Ave., Johnson & Bridge Sts. | 316,946 | 1998 | 19 | 34,000 | 42,000 | 0 | 0 | 100.00% | N/A | N/A | ||
3 MetroTech Center Between Bridge & Duffield Streets, & Myrtle Avenue | 398,921 | 1992 | 9 | 31,226 | 47,291 | 0 | 0 | 100.00% | N/A | N/A | ||
4 MetroTech Center B/w Duffield & Gold Sts. | 1,332,891 | 1992 | 25 | 28,224 | 108,344 | 0 | 0 | 100.00% | N/A | N/A | ||
11 MetroTech Center Block Bounded By Flatbush Avenue, Johnson, Bridge & Tillary | 216,000 | 1996 | 6 | 33,000 | 52,000 | 0 | 0 | 100.00% | N/A | N/A | ||
12 MetroTech Center S/W/C Jay Street and Johnson Street (Tech Place) | 950,000 | 2004 | 30 | 24,000 | 88,000 | 0 | 0 | 100.00% | N/A | N/A | ||
One Pierrepont Plaza Bound By Cadman Plaza West, Clinton, & Pierrepont Streets | 655,598 | 1988 | 19 | 32,788 | 44,027 | 315,318 | 0 | 51.90% | $36.00 | $36.00 | ||
Renaissance Plaza Bounded By Adams St, Johnson St, and Jay St, and Myrtle Avenue | 827,485 | 1998 | 32 | 9,100 | 33,285 | 0 | 49,535 | 100.00% | N/A | N/A | ||
| Total | 6,109,841 | 353,877 | 264,914 | |||||||||
| Average | 678,871 | 1996 | 19 | 27,393 | 61,012 | 39,320 | 29,435 | 94.21% | $36.00 | $37.00 | ||
Source: Appraisal
| This is not a research report and was not prepared by the Underwriters’ research departments. Please see additional important information and qualifications at the end of this Term Sheet. |
T-40
| MSBAM 2013-C12 | 15 MetroTech Center |
Operating History and Underwritten Net Cash Flow. The following table presents certain information relating to the historical operating performance and the Underwritten Net Cash Flow at the 15 MetroTech Center Property:
| Cash Flow Analysis | |||||||||||||||
| 2011 | 2012 | 5/31/2013 TTM | UW | UW PSF | |||||||||||
| Gross Potential Rental Income | $23,891,100 | $23,832,842 | $23,548,122 | $24,823,990 | $38.22 | ||||||||||
| Expense Reimbursements | $4,846,740 | $4,912,178 | $5,064,241 | $6,477,408 | $9.97 | ||||||||||
| Other Income | $631,923 | $692,714 | $955,258 | $691,240 | $1.06 | ||||||||||
| Mark To Market | $0 | $0 | $0 | ($1,299,221) | ($2.00) | ||||||||||
| Less Vacancy & Credit Loss | $0 | $0 | $0 | ($1,500,109) | ($2.31) | ||||||||||
| Effective Gross Income | $29,369,763 | $29,437,734 | $29,567,621 | $29,193,307 | $44.95 | ||||||||||
Total Operating Expenses(1) | $8,915,310 | $8,805,738 | $9,167,435 | $10,388,785 | $16.00 | ||||||||||
| Net Operating Income | $20,454,454 | $20,631,997 | $20,400,186 | $18,804,522 | $28.95 | ||||||||||
| TI/LC | $0 | $0 | $0 | $975,000 | $1.50 | ||||||||||
| Capital Expenditures | $0 | $0 | $0 | $162,373 | $0.25 | ||||||||||
| Net Cash Flow | $20,454,454 | $20,631,997 | $20,400,186 | $17,667,149 | $27.20 | ||||||||||
| Occupancy % | 99.9% | �� | 97.8% | 97.8% | (2) | 95.0% | |||||||||
| NOI DSCR | 1.65x | 1.66x | 1.64x | 1.51x | |||||||||||
| NCF DSCR | 1.65x | 1.66x | 1.64x | 1.42x | |||||||||||
| NOI Debt Yield | 12.1% | 12.2% | 12.0% | 11.1% | |||||||||||
| NCF Debt Yield | 12.1% | 12.2% | 12.0% | 10.4% | |||||||||||
| (1) | Total Operating Expenses were underwritten based on the average PILOT payment during the loan term and the average ground rent expense during the loan term. |
| (2) | Occupancy as of July 31, 2013 |
Escrows and Reserves. The 15 MetroTech Center Borrower deposited $148,798 in escrow for annual real estate taxes at loan origination and is required to escrow $49,599 monthly. The 15 MetroTech Center Borrower is required to deposit 1/12 of the estimated insurance premiums monthly (if the 15 MetroTech Center Property is no longer part of a “blanket policy” acceptable to the lender). The 15 MetroTech Center Borrower deposited $198,362 in escrow for ground rent payments at loan origination and is required to escrow $99,181 monthly. Additionally, the 15 MetroTech Center Borrower deposited $90,000 in escrow for potential real estate taxes on partial lots. The 15 MetroTech Center Borrower is required to deposit $81,250 for TI/LC reserves monthly and $10,825 for replacement reserves monthly. The 15 MetroTech Center Borrower is also required to deposit all excess cash flow in escrow (“WellPoint Reserve”) on each monthly payment date through and including June 1, 2020 to be utilized for re-tenanting the spaces leased to WellPoint Holding Corp. (the total WellPoint Reserve is capped at $4,400,000 per year). If there are funds remaining in the WellPoint Reserve after the entire Wellpoint Holding Corp. space has been re-leased (or extension of the Wellpoint lease), the lender is required to transfer such balance to the TI/LC reserves.
Lockbox and Cash Management. A hard lockbox is in place with respect to the 15 MetroTech Center Mortgage Loan. The 15 MetroTech Center Mortgage Loan has in place cash management. The 15 MetroTech Center Borrower will be required to deposit all excess cash into a lockbox account held by the mortgagee as additional security for the 15 MetroTech Center Mortgage Loan during a Cash Sweep Period.
A “Cash Sweep Period” will generally commence on the earlier of (i) the occurrence of an event of default; (ii) the date upon which the debt service coverage ratio for the immediately preceding two quarters is less than 1.10x; and (iii) occurrence of the date on which WellPoint or the City of New York becomes insolvent, files for bankruptcy or has its senior unsecured debt rating fall below “BBB-” by Standard & Poor’s ratings services (or the equivalent of such rating by Moody’s).
A Cash Sweep Period will generally end upon as applicable, the date on which (i) of the mortgagee accepts the event of default cure in its sole and absolute discretion; or (ii) the date on which the debt service coverage ratio for the immediately preceding two quarters equals or exceeds 1.20x.
Property Management. The 15 MetroTech Center Property is managed by First New York Partners Management, LLC, an affiliate of the 15 MetroTech Center Borrower.
Mezzanine Loan and Preferred Equity. Not permitted.
Secured Indebtedness (not including trade debts). The 15 MetroTech Center Serviced Companion Loan was originated by Bank of America, National Association (in conjunction with Ladder Capital Finance LLC) on August 2, 2013 and is evidenced by two pari passu notes (A-2A and A-2B) with a combined original principal amount of $80,000,000. Bank of America, National Association was the original holder of the A-2B note and will acquire the A-2A note from Ladder Capital Finance LLC or an affiliate thereof on or prior to the Closing Date. The current holder of the 15 MetroTech Center Serviced Companion Loan is the COMM 2013-LC13 Mortgage Trust. The pari passu notes A-2A and A-2B, evidencing the 15 MetroTech Serviced Center Companion Loan accrues interest at the same rate as the 15 MetroTech Center Mortgage Loan. The 15 MetroTech Center Mortgage Loan is entitled to payments of principal and interest on a pro rata and pari passu basis with 15 MetroTech Center Serviced Companion Loan, as and to the extent described under “Description of the Mortgage Pool—The A/B Whole Loans and the Loan Pairs—The 15 MetroTech Center Loan Pair,” and the holders of the 15 MetroTech Center Mortgage Loan and the 15 MetroTech Center Serviced Companion Loan have entered into a co-lender agreement which sets forth the allocation of collections on the 15 MetroTech Center Loan Pair. The 15 MetroTech Center Mortgage Loan will generally represent the controlling interest in the 15 MetroTech Center Loan Pair and the 15 MetroTech Center Loan Pair will be serviced pursuant to terms of the pooling and servicing agreement for this transaction. See “Description of the Mortgage Pool —The A/B Whole Loans and the Loan Pairs—The 15 MetroTech Center Loan Pair” in the Free Writing Prospectus.
| This is not a research report and was not prepared by the Underwriters’ research departments. Please see additional important information and qualifications at the end of this Term Sheet. |
T-41
| MSBAM 2013-C12 | 15 MetroTech Center |
Release of Property. Not permitted.
Terrorism Insurance. The 15 MetroTech Center Borrower is required pursuant to the 15 MetroTech Center Mortgage Loan documents to maintain (or cause to be maintained) insurance against loss for acts of terrorism with respect to the 15 MetroTech Center Property provided that the 15 MetroTech Center Borrower will not be required to pay annual terrorism insurance premiums in excess of two times the previous year’s annual insurance premium (exclusive of the costs attributable to terrorism insurance) (provided the 15 MetroTech Center Borrower will be obligated to purchase the maximum amount of terrorism coverage available with funds equal to such cap to the extent available).
| This is not a research report and was not prepared by the Underwriters’ research departments. Please see additional important information and qualifications at the end of this Term Sheet. |
T-42
(THIS PAGE INTENTIONALLY LEFT BLANK)
| This is not a research report and was not prepared by the Underwriters’ research departments. Please see additional important information and qualifications at the end of this Term Sheet. |
T-43
| MSBAM 2013-C12 | City Creek Center |
Mortgage Loan No. 3 – City Creek Center

| This is not a research report and was not prepared by the Underwriters’ research departments. Please see additional important information and qualifications at the end of this Term Sheet. |
T-44
| MSBAM 2013-C12 | City Creek Center |
Mortgage Loan No. 3 – City Creek Center
| This is not a research report and was not prepared by the Underwriters’ research departments. Please see additional important information and qualifications at the end of this Term Sheet. |
T-45
| MSBAM 2013-C12 | City Creek Center |
Mortgage Loan No. 3 – City Creek Center
| This is not a research report and was not prepared by the Underwriters’ research departments. Please see additional important information and qualifications at the end of this Term Sheet. |
T-46
| MSBAM 2013-C12 | City Creek Center |
Mortgage Loan No. 3 – City Creek Center
| This is not a research report and was not prepared by the Underwriters’ research departments. Please see additional important information and qualifications at the end of this Term Sheet. |
T-47
| MSBAM 2013-C12 | City Creek Center |
| Mortgage Loan No. 3 – City Creek Center |
| Mortgage Loan Information | Mortgaged Property Information | ||||||
| Mortgage Loan Seller: | MSMCH | Single Asset/Portfolio: | Single Asset | ||||
Credit Assessment: (Fitch/KBRA/Moody’s) | NR/NR/NR | Property Address: | 50 South Main Street Salt Lake City, UT 84101 | ||||
| Original Balance: | $85,000,000 | General Property Type: | Retail | ||||
| Cut-off Date Balance: | $84,780,738 | Detailed Property Type: | Regional Mall | ||||
| % of Initial Pool Balance: | 6.6 % | Net Rentable Area: | 348,537 SF | ||||
| Loan Purpose: | Refinance | Cut-off Date Balance Per Unit/SF: | $243 | ||||
| Borrower Name(s): | City Creek Center Associates LLC | Balloon/ARD Balance Per Unit/SF: | $197 | ||||
| Sponsor: | The Taubman Realty Group Limited Partnership | Year Built/Year Renovated: | 2012/NAP | ||||
Mortgage Rate(1): | 4.370% | Title Vesting(3): | Fee/Leasehold | ||||
| Note Date: | 7/9/2013 | Property Manager: | The Taubman Company LLC | ||||
| First Payment Date: | 9/1/2013 | ||||||
Anticipated Repayment Date(1): | 8/1/2023 | Underwriting and Financial Information | |||||
Maturity Date(1): | 4/1/2024 | UW Revenues: | $26,767,581 | ||||
| IO Period: | None | UW Expenses: | $16,795,337 | ||||
| Original Term to Maturity or ARD: | 120 months | UW NOI: | $9,972,244 | ||||
| Seasoning: | 2 months | UW NCF: | $9,267,981 | ||||
| Original Amortization Term: | 360 months | UW NOI DSCR: | 1.96x | ||||
| Loan Amortization Type: | Amortizing | UW NCF DSCR: | 1.82x | ||||
| Interest Accrual Basis: | Actual/360 | UW NOI Debt Yield: | 11.8% | ||||
| Prepayment Provisions: | YM0.5 (26); DEF/YM0.5 (90); O (4) | UW NCF Debt Yield: | 10.9% | ||||
| Lockbox/Cash Management: | Hard/Springing | UW NCF Debt Yield at Maturity: | 13.5% | ||||
Pari Passu Mortgage Debt: | None | Most Recent NOI (As of): | $10,014,600 (7/31/2013 TTM) | ||||
| Subordinate Mortgage Debt: | None | Second Most Recent NOI (As of)(4): | NAP | ||||
| Mezzanine Debt: | None | Third Most Recent NOI (As of)(4): | NAP | ||||
Reserves(2) | Appraised Value: | $162,100,000 | |||||
| Type | Initial | Monthly | Cap | Appraisal As-of Date: | 5/3/2013 | ||
| RE Tax: | $0 | Springing | NAP | Cut-off Date LTV Ratio: | 52.3% | ||
| Insurance: | $0 | Springing | NAP | LTV Ratio at Maturity/ARD: | 42.3% | ||
| Recurring Replacements: | $0 | Springing | $69,732 | Occupancy Rate: | 96.7% (9/17/2013) | ||
| TI/LC: | $0 | Springing | $348,636 | Occupancy 2008-2012(4): | NAP | ||
| Debt Service: | $0 | Springing | NAP | ||||
| (1) | The City Creek Center Mortgage Loan contains a hyper-amortization feature whereby if the City Creek Mortgage Loan is not repaid in full on or before the anticipated repayment date, the interest rate is adjusted to the greater of (i) 9.37% and the then current 10-year U.S. treasury rate plus 5%. After such date all excess cash flow will be applied to mandatory amortization. This hyper-amortization period is limited to the approximately 8 months between the anticipated repayment date and the maturity date. |
| (2) | See “—Escrows and Reserves” below for further discussion of reserve requirements. |
| (3) | The City Creek Center Borrower owns a leasehold interest in the majority of the City Creek Center Property and a fee interest in the remainder. There are currently three restaurant tenant spaces, totaling approximately 27,685 SF, which the City Creek Center Borrower owns in fee. |
| (4) | The City Creek Center Property is new construction with occupancy taking place in 2012 and 2013. The City Creek Center Property opened in March 2012. |
The City Creek Center Mortgage Loan
The Mortgage Loan. The third largest mortgage loan (the “City Creek Center Mortgage Loan”) is evidenced by a note in the original principal amount of $85,000,000 and is secured by a first priority fee and leasehold mortgage encumbering a portion of the shopping center known as City Creek Center located in Salt Lake City, Utah (the “City Creek Center Property”).
The City Creek Center Mortgage Loan had an initial term of 120 months and has a remaining term of 118 months, with an anticipated repayment date of August 1, 2023 and a maturity date of April 1, 2024. The City Creek Center Mortgage Loan requires payments of principal and interest for its entire term. The City Creek Center Mortgage Loan may be prepaid in whole on any payment date together with, prior to the open prepayment period, the greater of a yield maintenance premium and 0.5% of the prepayment amount. Defeasance with direct, non-callable obligations of the United States of America (or other non-callable government securities or other non-callable instruments that will not cause the trust to lose its REMIC status and, in each case, will not result in a downgrade or withdrawal of the ratings for the MSBAM Series 2013-C12 Certificates) is permitted at any time on or after the first due date following the second anniversary of the securitization closing date. The City Creek Center Mortgage Loan is open to prepayment in full (without prepayment consideration) during the final three months of the loan term.
| This is not a research report and was not prepared by the Underwriters’ research departments. Please see additional important information and qualifications at the end of this Term Sheet. |
T-48
| MSBAM 2013-C12 | City Creek Center |
The Borrower and the Sponsor. The borrower is City Creek Center Associates, LLC (the “City Creek Center Borrower”), a single-purpose Delaware limited liability company with two independent directors. The City Creek Center Borrower is 100% owned by the Taubman Realty Group Limited Partnership, a majority owned operating subsidiary of Taubman Centers, Inc. (NYSE: TCO) (“Taubman”). Taubman Realty Group Limited Partnership is the non-recourse carve-out guarantor.
Taubman is a real estate investment trust that engaged in the ownership, management and/or leasing of 27 regional, super-regional and outlet shopping centers in the U.S. and Asia. Taubman was founded in 1950 and is headquartered in Bloomfield Hills, Michigan. As of the fiscal year ended December 31, 2012, Taubman reported revenue of approximately $748 million and net income of approximately $158 million. Taubman is currently rated “Ba2” by Moody’s.
The Mortgaged Property. The City Creek Center Property consists of 348,537 SF of major, in-line, food court and kiosk space within the two-story, approximately 628,934 SF City Creek Shopping Center, a regional mall located in the Salt Lake City Utah CBD. Two anchor stores, Macy’s and Nordstrom, totaling approximately 280,397 SF, own their own stores constructed on land subleased from the City Creek Center Borrower, and are therefore not primary collateral for the City Creek Center Mortgage Loan. These two tenants are generally referenced herein as the non-collateral anchors. The Macy’s tenant pays a base rental rate to the City Creek Center Borrower, which then pays such base rent to the ground lessor as part of its ground rent payment. Nordstrom pays no base rent for its store. Both non-collateral anchor tenants pay applicable CAM charges to the City Creek Center Borrower. The City Creek Center Property together, with the two anchor tenants, is known as The City Creek Shopping Center and is part of a mixed-use retail, office (approximately 2,100,000 SF) and residential (approximately 800 units) development known as City Creek Center, all of which opened in 2012. No portion of the City Creek Center office or residential components is collateral for the City Creek Center Mortgage Loan.
The City Creek Center Property contains 76 major and in-line tenants (not including the two non-collateral anchor stores), 12 food court tenants and 3 kiosk tenants. Parking is available by an easement to approximately 2,500 spaces (approximately 4 spaces per 1,000 SF of GLA) within a 4,000 space subterranean parking garage, which is shared with the adjacent office and residential components of the City Creek Center development.
As of September 17, 2013, the City Creek Center Property was 96.7% leased. The City Creek Center Mall, including both collateral and non-collateral space, was 98.2% leased or otherwise occupied. Comparable in-line store sales, representing approximately 170,557 SF, as of the trailing 12 months ending 7/31/2013, were approximately $619 PSF, including the sales at the 7,655 SF Apple store. Excluding the Apple store, the average sales for the period were approximately $432 PSF over 162,902 SF. The trailing 12 average occupancy cost for these tenants was approximately 17.0%, excluding the Apple Store.
The City Creek Center Property is generally (with the exception of 3 restaurant spaces owned in fee by the City Creek Center Borrower) subject to an unsubordinated airspace lease (generally referenced as the ground lease herein) covering five separate parcels between the City Creek Center Borrower, as lessee, and City Creek Reserve, Inc., an affiliate of The Church of Jesus Christ of Latter-Day Saints, as lessor. Annual ground rent is equal to a base rent of $1,000,000, plus the base rent paid by the Macy’s tenant to the City Creek Center Borrower (currently $575,000), plus, beginning on January 1 immediately following the second anniversary of the center opening date, 50% of actual NOI above $9,000,000. The initial ground lease is for 30 years, expiring on March 21, 2042, with four 10-year lease extension options. The lessor maintains purchase options for the leasehold interest (i) on the 12th anniversary of the center opening and every 5 years thereafter and (ii) at any time the occupancy of the center falls below 50% (exclusive of the anchor stores), at a purchase price equal to the lesser of (x) 95% of fair market value plus the present value of the lessor’s percentage rent and (y) 100% of fair market value. The purchase options are not subordinate to the City Creek Center Mortgage Loan; however, the lessor may, at its option, assume the City Creek Center Mortgage Loan upon exercise of any such purchase option.
Major Collateral Tenants.
Forever 21 (38,225 SF, 11% of NRA, 8% of underwritten base rent). Forever 21 Retail, Inc. leases 38,225 SF at the City Creek Center Property. The lease began on March 22, 2012 and has a current expiration date of January 31, 2022. The tenant has a lease termination option effective at the end of 7th year if gross sales are less than $200 PSF during the preceding year. Forever 21, Inc, was founded in 1984 and, according to Forbes, as of the end of November 2012, the apparel retailer was the 121st largest private company in the United States with estimated annual sales of $3.4 billion at over 480 stores under various brand names, including Forever 21, XXI Forever, For Love 21, Heritage 1981 and Reference.
H&M (26,392 SF, 8% of NRA, 3% of underwritten base rent). H&M Hennes & Mauritz L.P. (“H&M”) leases 26,392 SF at the City Creek Center Property. The lease began on March 22, 2012 and has a current expiration date of January 1, 2023, with one 5-year lease renewal option. The tenant has a lease termination option effective at the end of the 4th year if gross sales are less than $189.45 PSF during the preceding year. At the end of its 2012 financial year, H&M operated 2,776 stores in 48 countries. The company is traded on the OXM Nordic Exchange in Stockholm under the symbol HMB.
The Gap (12,641 SF, 4% of NRA, 2% of underwritten base rent). The Gap, Inc. (“Gap”) leases 12,641 SF at the City Creek Center Property. The lease began on March 22, 2012 and has a current expiration date of January 31, 2022. The tenant has a lease termination option effective at the end of the 60th month if gross sales are less than $4,000,000 ($316.43 PSF) during the preceding year. Gap (NYSE: GPS) offers apparel, accessories, and personal care products under the Gap, Old Navy, Banana Republic, Piperlime, Athleta and Intermix brands. As of February 2, 2013, the company operated 3,407 stores under its various brand names.
| This is not a research report and was not prepared by the Underwriters’ research departments. Please see additional important information and qualifications at the end of this Term Sheet. |
T-49
| MSBAM 2013-C12 | City Creek Center |
The following table presents a summary regarding major tenants and the non-collateral anchors at the City Creek Center Property:
| Tenant Summary | |||||||||||
| Tenant Name | Credit Rating (Fitch/Moody’s/S&P)(1) | Tenant NRSF | Approximate % of NRSF(2) | Annual Underwritten Base Rent | % of Total Annual UW Rent | Total Annual Underwritten Base Rent (PSF)(5) | Lease Expiration(6) | TTM July 2013 Sales PSF | UW Occupancy Cost as a % of Sales | ||
| Non-Collateral Anchors | |||||||||||
| Macy’s | BBB/Baa3/BBB | 154,952 | NAP | $575,000 | (3) | 4% | $3.71 | 2/28/2033 | $194 | (7) | 3.4% |
| Nordstrom | A-/Baa1/A- | 125,445 | NAP | $0 | NAP | NAP | 2/28/2028 | $299 | (7) | NAP | |
| Subtotal/Wtd. Avg. | 280,397 | NAP | $575,000 | ||||||||
| Tenants > 10,000 SF | |||||||||||
| Forever 21 | NR/NR/NR | 38,225 | 11% | $1,000,000 | 8% | $26.16 | 1/31/2022 | $166 | 16.5% | ||
| H&M | NR/NR/NR | 26,392 | 8% | $406,247 | 3% | $15.39 | 1/31/2023 | $329 | 10.4% | ||
| The Gap | BBB-/Baa3/BBB- | 12,641 | 4% | $257,876 | 2% | $20.40 | 1/31/2022 | $312 | 16.4% | ||
| Anthropologie | NR/NR/NR | 12,041 | 3% | $0 | (4) | 0% | $0.00 | 9/30/2022 | $301 | 6.4% | |
| Cheesecake Factory | NR/NR/NR | 11,971 | 3% | $334,625 | 3% | $27.95 | 1/31/2033 | $747 | 6.7% | ||
| Love Culture | NR/NR/NR | 11,949 | 3% | $438,994 | 3% | $36.74 | 1/31/2022 | $152 | 45.6% | ||
| Restoration Hardware | NR/NR/NR | 11,522 | 3% | $262,181 | 2% | $22.75 | 1/31/2022 | $525 | 11.6% | ||
| Subtotal/Wtd. Avg. | 124,741 | 36% | $2,699,923 | 20% | $23.96 | ||||||
| Other Tenants | 212,316 | 61% | $9,962,892 | 75% | $46.92 | ||||||
| Vacant Space | 11,480 | 3% | $0 | 0% | $0.00 | ||||||
| Total | 348,537 | $13,237,815 | $38.96 | (5) | |||||||
| (1) | Certain ratings are those of the parent company whether or not the parent guarantees the lease. |
| (2) | Approximate % of NRSF is based on total collateral NRSF of 348, 537 SF. It does not include the Macy’s or Nordstrom stores, which are not collateral for the City Creek Center Mortgage Loan. |
| (3) | Macy’s is not collateral for the City Creek Center Mortgage Loan; however, the tenant does pay a base rent to the City Creek Center Borrower, in addition to its applicable CAM charges. The City Creek Center Borrower passes this base rent to the fee owner as additional ground rent. |
| (4) | Anthropologie does not pay base rent for its initial three years of occupancy. The tenant pays percentage rent equal to 7% of gross sales for these three years. If the tenant’s gross sales for any of the initial 3 year lease periods are less than $4,000,000, then for that period or periods, the percentage rent will be reduced to 6% of gross sales. Beginning in month 37 of the lease term, a base rent equal to the percentage rent paid for months 25 to 36 will be established. If the tenant’s gross sales for the lease period beginning with month 25 of the lease and ending with month 36 are less than $6,000,000, the tenant may terminate its lease at any time during the period commencing with month 37 and ending with month 42. |
| (5) | Total Annual Underwritten Base Rent (PSF) excludes vacant space, the non-collateral Macy’s and Nordstrom spaces, and the Anthropology space, which is not subject to base rental payments. The calculation removes the $575,000 of base rent paid by the Macy’s tenant, which is passed to the fee owner as additional ground rent payable by the City Creek Center Borrower. |
| (6) | The lease expiration dates for Macy’s and Nordstrom represent the sub-ground leases between each respective tenant and the City Creek Center Borrower. The Macy’s tenant has four 10-year lease extension options and the Nordstrom tenant has five 10-year lease renewal options. In addition to the above mentioned tenant lease termination rights for Forever 21, H&M and The Gap, the following tenants greater than 10,000 SF in size have certain lease termination rights. The Anthropology tenant has the right to terminate its lease during the first 6 months of its 4th lease year if the tenant’s gross sales during its 3rd lease year are less than $6,000,000. The Cheesecake Factory tenant has the right to terminate its lease with 12 months of notice if its gross sales do not exceed $5,250,000 during its 6th lease year. The Love Culture tenant has the right to terminate its lease if its gross sales are less than $2,800,000 during its 3rd lease year or less than $3,500,000 during its 6th lease year. The Restoration Hardware tenant has the right to terminate its lease at the end of its 5th lease year if its gross sales are not at least $3,500,000 during its 5th lease year or any lease year prior with 60 days of notice. |
| (7) | The Macy’s and Nordstrom stores do not report sales for this location. The above sales are City Creek Center Borrower estimates. |
| This is not a research report and was not prepared by the Underwriters’ research departments. Please see additional important information and qualifications at the end of this Term Sheet. |
T-50
| MSBAM 2013-C12 | City Creek Center |
The following table presents certain information relating to the lease rollover at the City Creek Center Property:
Lease Rollover Schedule(1)(2) | ||||||||||||
| Year | # of Leases Rolling | SF Rolling | Average Underwritten Base Rent PSF Rolling(3) | Approx. % of Total SF Rolling | Approx. Cumulative % of SF Rolling | Total Underwritten Base Rent Rolling | Approx. % of Total Base Rent Rolling | Approx. Cumulative % of Total Base Rent Rolling | ||||
| MTM | 0 | 0 | $0.00 | 0% | 0% | $0 | 0% | 0% | ||||
| 2013 | 0 | 0 | $0.00 | 0% | 0% | $0 | 0% | 0% | ||||
| 2014 | 1 | 3,716 | $12.07 | 1% | 1% | $44,836 | 0% | 0% | ||||
| 2015 | 2 | 1,639 | $136.39 | 0% | 2% | $223,542 | 2% | 2% | ||||
| 2016 | 1 | 6 | $1,100.00 | 0% | 2% | $6,600 | 0% | 2% | ||||
| 2017 | 5 | 7,564 | $61.82 | 2% | 4% | $467,643 | 4% | 6% | ||||
| 2018 | 1 | 1,348 | $95.51 | 0% | 4% | $128,750 | 1% | 7% | ||||
| 2019 | 2 | 968 | $144.13 | 0% | 4% | $139,522 | 1% | 8% | ||||
| 2020 | 7 | 6,296 | $103.70 | 2% | 6% | $652,872 | 5% | 13% | ||||
| 2021 | 2 | 2,600 | $64.71 | 1% | 7% | $168,240 | 1% | 14% | ||||
| 2022 | 52 | 201,795 | $37.54 | 58% | 65% | $7,123,442 | 54% | 68% | ||||
| 2023 | 14 | 88,870 | $33.65 | 25% | 90% | $2,990,860 | 23% | 90% | ||||
| 2024 | 2 | 10,284 | $37.13 | 3% | 93% | $381,883 | 3% | 93% | ||||
| 2025 | 0 | 0 | $0.00 | 0% | 93% | $0 | 0% | 93% | ||||
| 2026 & Beyond | 1 | 11,971 | (4) | $27.95 | (4) | 3% | 97% | $909,625 | (4) | 7% | 100% | |
| Vacant | 0 | 11,480 | $0.00 | 3% | 100% | $0 | 0% | 100% | ||||
| Total/Wtd. Avg. | 90 | 348,537 | $38.96 | (4) | 100% | $13,237,815 | 100% | |||||
| (1) | The information in the lease rollover schedule is based on the underwritten rent roll. |
| (2) | Certain tenants may have lease termination options that are exercisable prior to the originally stated expiration date of the related lease and that are not considered in the lease rollover schedule. Certain tenants, including Apple, H&M, Gap, Restoration Hardware, Cheesecake Factory, Anthropologie, Forever 21 and Love Culture, have lease termination options associated with minimum gross sales thresholds. |
| (3) | The Average Underwritten Base Rent PSF Rolling calculations for 2022 and the Total/Wtd. Avg. exclude the Anthropologie space, which is not subject to base rent but which pays percentage rent plus applicable expense recoveries. |
| (4) | The 2026 & Beyond SF Rolling and Average Underwritten Base Rent PSF Rolling, excludes the Macy’s space and the Nordstrom space and the Macy’s underwritten base rent of $575,000. The 11,971 SF Rolling and Average Underwritten Base Rent PSF Rolling in 2026 & Beyond reflects the Cheesecake Factory tenant only. The Total Underwritten Base Rent Rolling for that year includes the Macy’s base rent of $575,000, which is paid by the tenant to the City Creek Center Borrower and then paid by the City Creek Center Borrower to the fee owner as additional ground rent. |
| This is not a research report and was not prepared by the Underwriters’ research departments. Please see additional important information and qualifications at the end of this Term Sheet. |
T-51
| MSBAM 2013-C12 | City Creek Center |
The Market. The City Creek Center Property is located on a portion of 2 city blocks in the Salt Lake City, Utah CBD. It is near the Salt Lake City government office buildings, the State of Utah Court Complex and adjacent to the Mormon Temple Square. According to the appraiser, Mormon Square is the most popular tourist attraction in Utah, with an estimated 3.0 to 5.0 million visits annually. There is approximately 7.5 million SF of office space in the Salt Lake City CBD, the 515,000 SF Salt Palace Convention Center is located to the west of the City Creek Center Property and the 745,000 SF Energy Solution Arena is located two blocks west. Interstates 15 and 80 are both located approximately one mile to the west.
Estimated 2013 population and average household income within a three- and five-mile radius are 129,109 and $51,202, and 218,053 and $57,551, respectively. Within a 10-mile radius, estimated population and average household income are 637,233 and $63,738, respectively. Salt Lake County has a 2013 estimated total population and average household income of 1,071,687 and $69,695, respectively. The overall Salt Lake City submarket retail vacancy rate as of March 31, 2013, was 12.2%, while competitive regional malls had an average vacancy rate of 4.0% for the same period. Below is a chart of primary and secondary competitive centers.
| Competitive Property Summary | |||||||||||
| Property | Center Type | Year Built | Year Renovated/ Expanded | Total GLA (SF) | Anchor Tenants | Rent/SF | Sales PSF | Occupancy | Proximity | ||
Fashion Place (Primary Competition) 6191 S. State Street Salt Lake City, UT | Super-Regional Center/Mall | 1971 | 2003, 2009, 2011/2009 and 2011 | 1,029,033 | Nordstrom Sears Macy’s Dillard’s | $35 - $40 | $500-550 | 98% | 5.0 miles South | ||
The Gateway Primary Competition) 90 S. Rio Grande Street Salt Lake City, UT | Regional Center | 2001 | NAP/NAP | 825,349 | Dick’s Sporting Goods Gateway Theaters Barnes & Noble | $23 - $30 | $365 | 93% | 0.5 miles West | ||
South Towne Center (Primary Competition) 10450 South State Street Sandy, UT | Super-Regional Center/Mall | 1987 | 1997/2000 | 1,275,940 | Dillard’s JC Penney Macy’s REI | $25 - $35 | $375 | 97% | 10.0 miles South | ||
Family Center Fort Union (Primary Competition) 7250 Union Park Avenue Midvale, UT | Power Center | 1974 | NAP/NAP | 797,847 | Bed Bath & Beyond Wal-Mart Ross, Office Max, FYE, Petco, more | $17 - $25 | NAV | 95% | 5.0 miles Southeast | ||
Park Center SC (Primary Competition) 6905 S. 1300 E Salt Lake City, UT | Power Center | 1985 | 1998 | 562,672 | Target Home Depot Office Depot TJ Maxx, Cost Plus | $15 - $25 | NAV | 92% | 5.0 miles Southeast | ||
Valley Fair Mall (Secondary Competition) 3601 S 2700 W West Valley, UT | Regional Center | 1970 | 1986/2009 | 825,100 | JC Penney Macy’s Vacant Costco | $20 - $25 | $270 | 86% | 3.0 miles Southwest | ||
Jordan Landing SC (Secondary Competition) 3751 W Center Park Drive West Jordan, UT | Power Center | 1999 | 2004/NAP | 1,616,297 | Kohl’s, Lowe’s, Office Max, Old Navy, Ross, Sam’s Club, Sears, Target, Wal-Mart | $18 - $25 | NAV | 97% | 7.0 miles Southwest | ||
District at South Jordan (Secondary Competition) 11400 S. Bangerter Highway South Jordan, UT | Power Center | 2005 | NAP/NAP | 804,645 | JC Penney, Target, Sports Authority, Larry Miller Megaplex, Hobby Lobby | NAV | NAV | 100% | 15.0 miles Southwest | ||
Trolley Square (Secondary Competition) 600 S 700 E Salt Lake City, UT | Fashion/Specialty Center | 1986 | 1987/2004 | 317,959 | Whole Foods Pottery Barn American Apparel | $15 - $30 | $310 | 96% | 1.0 mile Southeast | ||
Source: Appraisal
| This is not a research report and was not prepared by the Underwriters’ research departments. Please see additional important information and qualifications at the end of this Term Sheet. |
T-52
| MSBAM 2013-C12 | City Creek Center |
Operating History and Underwritten Net Cash Flow. The following table presents certain information relating to the historical operating performance and the Underwritten Net Cash Flow at the City Creek Center Property:
Cash Flow Analysis(1) | ||||||||||||
| 2010 | 2011 | 2012 | 7/31/2013 TTM | UW | UW PSF | |||||||
Base Rent(2) | $0 | $0 | $0 | $12,942,603 | $13,237,815 | $37.98 | ||||||
Percentage Rent(3) | $0 | $0 | $0 | $694,002 | $948,500 | $2.72 | ||||||
| Other Income | $0 | $0 | $0 | $231,409 | $232,028 | $0.67 | ||||||
Total Recoveries(4) | $0 | $0 | $0 | $12,463,612 | $12,554,936 | $36.02 | ||||||
Less Vacancy & Credit Loss(5) | $0 | $0 | $0 | ($228,161) | ($205,698) | ($0.59) | ||||||
| Effective Gross Income | $0 | $0 | $0 | $26,103,465 | $26,767,581 | $76.80 | ||||||
Total Operating Expenses(6) | $0 | $0 | $0 | $16,088,865 | $16,795,337 | $48.19 | ||||||
| Net Operating Income | $0 | $0 | $0 | $10,014,600 | $9,972,244 | $28.61 | ||||||
| TI/LC | $0 | $0 | $0 | $0 | $634,519 | $1.82 | ||||||
| Capital Expenditures | $0 | $0 | $0 | $0 | $69,744 | $0.20 | ||||||
| Net Cash Flow | $0 | $0 | $0 | $10,014,600 | $9,267,981 | $26.59 | ||||||
Occupancy %(7) | NAP | NAP | NAP | 96.7% | 95.0% | |||||||
| NOI DSCR | NAP | NAP | NAP | 1.97x | 1.96x | |||||||
| NCF DSCR | NAP | NAP | NAP | 1.97x | 1.82x | |||||||
| NOI Debt Yield | NAP | NAP | NAP | 11.8% | 11.8% | |||||||
| NCF Debt Yield | NAP | NAP | NAP | 11.8% | 10.9% | |||||||
Average Annual Rent PSF(8) | NAP | NAP | NAP | $38.05 | $38.96 | |||||||
| (1) | The City Creek Center Property is a new development that opened in March 2012. |
| (2) | Historical Base Rent includes actual property vacancy. |
| (3) | Percentage Rent represents the underwritten percentage rent applicable to several tenants, including $217,800 applicable to the Anthropologie tenant. This tenant does not pay a base rental rate, but instead pays 7% of its gross sales. Underwriting is based on the City Creek Center Borrower’s budget. |
| (4) | Total Recoveries includes a $1,581,608 CAM shortfall payment from the ground lessor to effectively subsidize certain operating expenses associated with the City Creek Center Property that are considered by the City Creek Center Borrower above typical for a standard regional mall property. This payment may change depending on average mall tenant sales during the calendar year 2014 and associated tenant CAM recoveries based on certain average occupancy cost targets. |
| (5) | The underwritten occupancy is 95%. |
| (6) | Total Operating Expenses includes $3,001,483 of underwritten ground rent. The ground rent expense includes $1,000,000 of base rent; $575,000 of Macy’s base rent, $1,402,439 of percentage rent based on 50% of actual NOI over a $9 million threshold and $24,044 of outdoor patio seating leases. Underwriting is based on the City Creek Center Borrower’s budget. |
| (7) | Occupancy % for the TTM (7/31/2013) period represents a rent roll as of 7/2/2013. |
| (8) | The TTM (7/31/2013) and Underwritten Average Annual Rent PSF excludes the Macy’s (and the base rent associated with that tenant) and Nordstrom non-collateral anchor spaces, vacant space, and the 12,041 SF leased by the Anthropologie tenant on a percentage rent basis. |
Escrows and Reserves. During a Trigger Period (as defined below), the City Creek Center Borrower is required to escrow 1/12th of the annual estimated tax payments monthly and 1/12th of the annual estimated insurance premiums monthly (unless the City Creek Center Borrower maintains insurance under an acceptable blanket insurance policy). The City Creek Center Borrower is also required, during the continuance of a Trigger Period, to make monthly deposits of $5,811 for replacement reserves, $29,053 for TI/LC reserves, capped at $69,732 and $348,636, respectively, and an amount equal to “basic annual rent” payable under the ground lease for the succeeding month plus monthly budgeted “percentage rent” (as defined in the ground lease) for ground rent reserves.
A “Trigger Period” commences upon the occurrence of a Lockbox Event and ends when such Lockbox Event terminates.
Lockbox and Cash Management. A hard lockbox is in place with respect to the City Creek Center Mortgage Loan. The City Creek Center Mortgage Loan has springing cash management. Provided a Lockbox Event has not occurred and is not continuing, funds in the lockbox account are swept daily to an account designated by the City Creek Center Borrower. During the continuance of a Lockbox Event (other than an event of default), funds in the lockbox account are applied on each monthly payment date to pay debt service on the City Creek Center Mortgage Loan, to fund the required reserves deposits as described above under “—Escrows and Reserves,” and to disburse any excess to City Creek Center Borrower; provided, that if the Lockbox Event that has occurred is the occurrence of the anticipated repayment date, then the excess will be disbursed to pay the outstanding principal balance of the City Creek Center Mortgage Loan, after funding an operating expense subaccount up to the amount of lender approved budgeted operating expenses for the next month; provided, further, that if the Lockbox Event is the occurrence of an event of default, then funds in the lockbox account are applied to pay the City Creek Center Mortgage Loan (except the tax, insurance and ground rent reserves must be applied for the purposes for which they are held).
A “Lockbox Event” will (i) commence upon the occurrence of an event of default and conclude upon the cure of such event of default, (ii) commence upon the debt service coverage ratio, tested quarterly, being less than 1.20x and conclude upon the debt service coverage ratio increasing to 1.25x for two consecutive calendar quarters, (iii) commence upon the ground lessor having notified the City Creek Center Borrower of the exercise of its purchase option for the City Creek Center Property pursuant to the ground lease and the lender having reasonably determined that the net proceeds to be received will not be sufficient to repay the City Creek Center Mortgage Loan in full upon acquisition of the City Creek Center Property and conclude upon repayment of the City Creek Center Mortgage Loan in full or the ground lessor either assuming the City Creek Center Mortgage Loan in accordance with the loan agreement or revoking in writing any exercise of the purchase option, or (iv) commence upon the occurrence of the anticipated repayment date and conclude upon repayment of the City Creek Center Mortgage Loan in full.
Property Management. The City Creek Center Property is managed by The Taubman Company LLC, an affiliate of the City Creek Center Borrower.
Mezzanine Loan and Preferred Equity. Not permitted.
| This is not a research report and was not prepared by the Underwriters’ research departments. Please see additional important information and qualifications at the end of this Term Sheet. |
T-53
| MSBAM 2013-C12 | City Creek Center |
Additional Secured Indebtedness (not including trade debts). Not permitted.
Release of Property. Not permitted.
Terrorism Insurance. Generally, the insurance policies maintained by the City Creek Center Borrower are required to cover losses resulting from acts of terrorism or other similar acts or events (or “fire following”). Notwithstanding the foregoing, for so long as the Terrorism Risk Insurance Program Reauthorization Act of 2007 (or any extension thereof or other federal government program with substantially similar protection) is in effect, the City Creek Center Borrower is required to maintain, and lender will accept, terrorism insurance as described above which covers “covered acts,” but in such event the City Creek Center Borrower will not be required to pay annual insurance premiums in excess of two times the then current premium for comprehensive “special perils” insurance on the City Creek Center Mortgaged Property and business income insurance (without giving effect to the cost of the earthquake insurance or terrorism insurance components of such policies), provided the City Creek Center Borrower will be obligated to purchase the maximum amount of terrorism coverage available with funds equal to such cap.
Expansion, Release and Substitution of Property. Not permitted.
| This is not a research report and was not prepared by the Underwriters’ research departments. Please see additional important information and qualifications at the end of this Term Sheet. |
T-54
(THIS PAGE INTENTIONALLY LEFT BLANK)
| This is not a research report and was not prepared by the Underwriters’ research departments. Please see additional important information and qualifications at the end of this Term Sheet. |
T-55
| MSBAM 2013-C12 | Marriott Chicago River North Hotel |
| Mortgage Loan No. 4 – Marriott Chicago River North Hotel |

| This is not a research report and was not prepared by the Underwriters’ research departments. Please see additional important information and qualifications at the end of this Term Sheet. |
T-56
| MSBAM 2013-C12 | Marriott Chicago River North Hotel |
| Mortgage Loan No. 4 – Marriott Chicago River North Hotel |
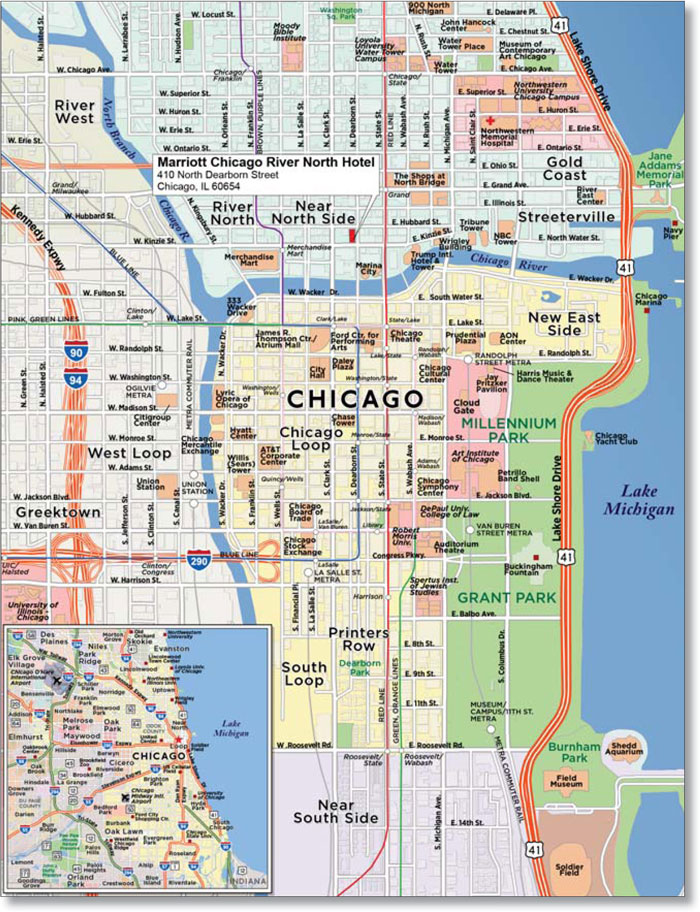
| This is not a research report and was not prepared by the Underwriters’ research departments. Please see additional important information and qualifications at the end of this Term Sheet. |
T-57
| MSBAM 2013-C12 | Marriott Chicago River North Hotel |
| Mortgage Loan No. 4 – Marriott Chicago River North Hotel |
| Mortgage Loan Information | Mortgaged Property Information | ||||||
| Mortgage Loan Seller: | BANA | Single Asset/Portfolio: | Single Asset | ||||
| Credit Assessment:(Fitch/Moody’s/KBRA) | NR/NR/NR | Property Address: | 410 North Dearborn Street Chicago, IL 60654 | ||||
Original Balance(1): | $65,000,000 | General Property Type: | Hospitality | ||||
Cut-off Date Balance(1): | $64,797,112 | Detailed Property Type: | Extended Stay | ||||
% of Initial Pool Balance(1): | 5.1% | Number of Rooms: | 523 Rooms | ||||
| Loan Purpose: | Refinance | Cut-off Date Balance Per Room(1): | $228,729 | ||||
| Borrower Name(s): | Dearkin RES (DE) LLC | Balloon/ARD Balance Per Room(1): | $173,380 | ||||
| Sponsor(s): | River North Historic District Holdings, LLC; White Lodging Services Corporation | Year Built/Year Renovated: | 2008/NAP | ||||
| Title Vesting: | Fee/Leasehold | ||||||
| Mortgage Rate: | 5.200% | Property Manager: | White Lodging Services Corporation | ||||
| Note Date: | 7/18/2013 | ||||||
| First Payment Date: | 9/1/2013 | ||||||
| Anticipated Repayment Date: | NAP | Underwriting and Financial Information | |||||
| Maturity Date: | 8/1/2023 | UW Revenues: | $30,160,936 | ||||
| IO Period: | None | UW Expenses: | $16,024,333 | ||||
| Original Term to Maturity or ARD: | 120 months | UW NOI: | $14,136,603 | ||||
| Seasoning: | 2 months | UW NCF: | $12,858,889 | ||||
| Original Amortization Term: | 300 months | UW NOI DSCR(1): | 1.65x | ||||
| Loan Amortization Type: | Amortizing | UW NCF DSCR(1): | 1.50x | ||||
| Interest Accrual Basis: | Actual/360 | UW NOI Debt Yield(1): | 11.8% | ||||
| Prepayment Provisions: | LO (26); DEF (90); O (4) | UW NCF Debt Yield(1): | 10.7% | ||||
| Lockbox/Cash Management: | Soft/In Place | UW NCF Debt Yield at Maturity(1): | 14.2% | ||||
Pari Passu Mortgage Debt(1): | $55,000,000 | Most Recent NOI (As of): | $14,143,594 (7/31/2013 TTM) | ||||
| Subordinate Mortgage Debt: | None | 2nd Most Recent NOI (As of): | $13,680,244 (12/31/2012) | ||||
| Mezzanine Debt: | None | 3rd Most Recent NOI (As of): | $11,062,273 (12/31/2011) | ||||
Reserves(2) | Appraised Value: | $191,000,000 | |||||
| Type | Initial | Monthly | Cap | Appraisal As-of Date: | 5/1/2013 | ||
| RE Tax: | $163,834 | $163,834 | NAP | Cut-off Date LTV Ratio(1): | 62.6% | ||
| Insurance: | $0 | Springing | NAP | LTV Ratio at Maturity/ARD(1): | 47.5% | ||
| FF&E: | $0 | $100,536 | NAP | Occupancy Rate (As of): | 84.4% (7/31/2013) | ||
| Other: | $1,610,000 | $3,750 | $1,610,000 | 2nd Most Recent Occupancy (As of): | 84.1% (12/31/2012) | ||
3rd Most Recent Occupancy (As of): | 77.7% (12/31/2011) | ||||||
| (1) | The Marriott Chicago River North Hotel Mortgage Loan is part of the Marriott Chicago River North Hotel Loan Pair evidenced by two pari passu notes with an aggregate original principal balance of $120,000,000. The Cut-off Date Balance Per Room, Balloon/ARD Balance Per Room, UW NOI DSCR, UW NCF DSCR, UW NOI Debt Yield, UW NCF Debt Yield, UW NCF Debt Yield at Maturity, Cut-off Date LTV Ratio and LTV Ratio at Maturity/ARD numbers presented above are based on the Marriott Chicago River North Hotel Loan Pair Cut-off Date Balance of $119,625,437. |
| (2) | See “—Escrows and Reserves” below for further discussion of reserve requirements. See also “—Lockbox and Cash Management” below for further discussion of the lockbox and cash management provisions. |
The Marriott Chicago River North Hotel Mortgage Loan
The Mortgage Loan. The fourth largest mortgage loan (the “Marriott Chicago River North Hotel Mortgage Loan”) is part of a pari passu loan pair (the “Marriott Chicago River North Hotel Loan Pair”) evidenced by two pari passu promissory notes in the aggregate original principal amount of $120,000,000, both of which are secured by the same first priority fee and leasehold mortgage encumbering an extended stay hospitality property known as the Marriott Chicago River North Hotel in Chicago, Illinois (“Marriott Chicago River North Hotel Property”). The Marriott Chicago River North Hotel Mortgage Loan is evidenced by one pari passu note (Note A-2) with an outstanding principal balance as of the Cut-off Date of $64,797,112. The pari passu note not included in the issuing entity (Note A-1) evidences a related companion loan (the “Marriott Chicago River North Hotel Companion Loan”), which has an outstanding principal balance as of the Cut-off Date of $54,828,325. The Marriott Chicago River North Hotel Companion Loan has similar features and terms as the Marriott Chicago River North Hotel Mortgage Loan and was contributed to the MSBAM 2013-C11 transaction. See “—Additional Secured Indebtedness” below for further details. The proceeds of the Marriott Chicago River North Hotel Loan Pair were used to refinance a previous loan of approximately $63.4 million secured by the Marriott Chicago River North Hotel Property.
The Marriott Chicago River North Hotel Mortgage Loan had an initial term of 120 months and has a remaining term of 118 months. The Marriott Chicago River North Hotel Mortgage Loan requires payments of principal and interest for its entire term with a scheduled maturity date of August 1, 2023. Defeasance with direct, non-callable obligations of the United States of America (or other non-callable government securities or other non-callable
| This is not a research report and was not prepared by the Underwriters’ research departments. Please see additional important information and qualifications at the end of this Term Sheet. |
T-58
| MSBAM 2013-C12 | Marriott Chicago River North Hotel |
instruments that will not cause the trust to lose its REMIC status and, in each case, will not result in a downgrade or withdrawal of the ratings for the MSBAM Series 2013-C12 Certificates) is permitted at any time on or after the first due date following the second anniversary of the securitization closing date. The Marriott Chicago River North Hotel Mortgage Loan is open to prepayment in full (without prepayment consideration) during the final three months of the loan term.
The Borrower and the Sponsor. The borrower is Dearkin RES (DE) LLC, a single-purpose Delaware limited liability company (the “Marriott Chicago River North Hotel Borrower”) with two independent directors. Equity ownership in the Marriott Chicago River North Hotel Borrower is held by Friedman SSRI, LLC (50%) and White CRN, LLC (50%). The Marriott Chicago River North Hotel sponsors and recourse carve-out guarantors are River North Historic District Holdings, LLC and White Lodging Services Corporation.
River North Historic District Holdings, LLC is controlled by Albert M. Friedman, the CEO and Chairman of Friedman Properties. Friedman Properties is a full-service real estate company that owns and/or manages over 4 million SF of commercial and residential space in over 50 properties throughout River North and the Chicago metropolitan area. White Lodging Services Corporation is a hotel ownership, development and management company founded in 1985 that owns and manages 168 premium-branded, select and full service hotels and more than 30 restaurants in 21 states.
The Mortgaged Property. The Marriott Chicago River North Hotel Property is a 27-story, 523-room, extended stay hospitality property located in Chicago, Illinois that was built in 2008. The Marriott Chicago River North Hotel Property is dual-flagged as a 270-suite Residence Inn and a 253-suite SpringHill Suites. Both flags are brands of Marriott International (NYSE: MAR) under franchise agreements expiring in March 2033 each with one, 10-year renewal option.
The guest room configuration at the Residence Inn consists of 195 studios, 69 one bedroom suites and six two bedroom suites. The guest room configuration at the SpringHill Suites consists of 161 king suites and 92 double suites. The Marriott Chicago River North Hotel Property features the HUB 51 restaurant, which occupies 10,900 SF under a lease expiring on May 14, 2018 with two, 5-year extension options and Einstein Bagels, which occupies 3,850 SF under a lease expiring on March 31, 2018 with two, five-year extension options. The Marriott Chicago River North Hotel Property is subject to a 99-year ground lease in connection with a 3,200 SF land parcel supporting the Einstein Bagels leased retail area and certain back office space on the 2nd floor of the Marriott Chicago River North Hotel Property. Other amenities at the Marriott Chicago River North Property include a fitness center, swimming pool, two breakfast rooms, two lounges, business center and sundries shop. Parking is currently available through an adjacent parking garage owned by an affiliate of the Marriott Chicago River North Hotel Borrower that connects to the Marriott Chicago River North Hotel Property via an interior walkway. The Marriott Chicago River North Hotel Borrower has collaterally assigned its interest in the agreement with the adjacent parking lot operator with respect to the operation of the adjacent parking lot and the Marriott Chicago River North Hotel Property’s use thereof.
More specific information about the Marriott Chicago River North Hotel Property is set forth in the tables below:
Residence Inn and Market Historical Occupancy, ADR, RevPAR | |||||||||
| Competitive Set | Residence Inn | Penetration Factor | |||||||
| Year | Occupancy | ADR | RevPAR | Occupancy | ADR | RevPAR | Occupancy | ADR | RevPAR |
| 2011 | 78.1% | $158.14 | $123.47 | 78.5% | $168.11 | $131.91 | 100.5% | 106.3% | 106.8% |
| 2012 | 82.1% | $165.96 | $136.20 | 84.6% | $176.74 | $149.49 | 103.1% | 106.5% | 109.8% |
| TTM 6/30/2013 | 83.4% | $169.26 | $141.13 | 83.9% | $185.88 | $155.91 | 100.6% | 109.8% | 110.5% |
Source: Industry Report
| SpringHill Suites and Market Historical Occupancy, ADR, RevPAR | |||||||||
| Competitive Set | SpringHill Suites | Penetration Factor | |||||||
| Year | Occupancy | ADR | RevPAR | Occupancy | ADR | RevPAR | Occupancy | ADR | RevPAR |
| 2011 | 79.0% | $157.10 | $124.06 | 76.9% | $162.51 | $124.90 | 97.3% | 103.4% | 100.7% |
| 2012 | 83.4% | $165.30 | $137.81 | 83.5% | $171.36 | $143.13 | 100.2% | 103.7% | 103.9% |
| TTM 6/30/2013 | 84.8% | $169.39 | $143.63 | 84.1% | $176.75 | $148.56 | 99.1% | 104.3% | 103.4% |
Source: Industry Report
| This is not a research report and was not prepared by the Underwriters’ research departments. Please see additional important information and qualifications at the end of this Term Sheet. |
T-59
| MSBAM 2013-C12 | Marriott Chicago River North Hotel |
The Market. The Marriott Chicago River North Hotel Property is located in the River North submarket of downtown Chicago, Cook Country, Illinois. The Marriott Chicago River North Hotel Property is located at the intersection of West Kinzie Street and North Dearborn Street, less than one mile east of Interstate 94 and approximately one mile northeast of Union Station and Northwestern Station.
Competing properties to the Marriott Chicago River North Hotel Property are shown in the table below:
| Competitive Property Summary | |||||||||
| Property | Rooms | Commercial % | Meeting & Group % | Leisure % | Extended Stay % | 2012E Occupancy | 2012E ADR | 2012E RevPAR | |
| Marriott Chicago River North Hotel | 523 | 25% | 7% | 30% | 38% | 84.3% | $174.16 | $146.82 | |
| Courtyard Chicago Downtown River North | 337 | 40% | 15% | 40% | 5% | 80.0% | $162.00 | $129.60 | |
| Hampton Inn Suites Chicago Downtown | 230 | 45% | 10% | 40% | 5% | 75.0% | $152.00 | $114.00 | |
| Hilton Garden Inn Chicago Magnificent Mile | 357 | 40% | 15% | 40% | 5% | 88.0% | $178.00 | $156.64 | |
| Fairfield Inn & Suites Chicago Downtown | 185 | 35% | 5% | 50% | 10% | 83.0% | $168.00 | $139.44 | |
| Four Points Chicago Magnificent Mile | 226 | 35% | 15% | 45% | 5% | 79.0% | $160.00 | $126.40 | |
| Hampton Inn Chicago Theatre District | 135 | 40% | 5% | 50% | 5% | 89.0% | $180.00 | $160.20 | |
| Total/Wtd. Avg. | 1,993 | 37% | 10% | 42% | 10% | 82.8% | $168.90 | $139.78 | |
Source: Appraisal
Operating History and Underwritten Net Cash Flow. The following table presents certain information relating to the historical operating performance and the Underwritten Net Cash Flow at the Marriott Chicago River North Hotel Property:
| Cash Flow Analysis | |||||||||||
| 2011 | 2012 | 7/31/2013 TTM | UW | UW per Room | |||||||
| Occupancy | 77.7% | 84.1% | 84.4% | 84.7% | |||||||
| Average Daily Rate | $165.43 | $174.16 | $182.96 | $175.96 | |||||||
| RevPAR | $128.52 | $146.42 | $154.34 | $148.97 | |||||||
| Rooms Revenue | $24,533,865 | $28,026,362 | $29,462,229 | $28,436,021 | $54,371 | ||||||
| Food & Beverage Revenue | $55,915 | $70,326 | $123,505 | $95,195 | $182 | ||||||
| Other Income | $1,344,701 | $1,591,286 | $1,593,945 | $1,629,720 | $3,116 | ||||||
| Total Revenue | $25,934,481 | $29,687,974 | $31,179,678 | $30,160,936 | $57,669 | ||||||
| Total Expenses | $14,872,208 | $16,007,730 | $17,036,084 | $16,024,333 | $30,639 | ||||||
| Net Operating Income | $11,062,273 | $13,680,244 | $14,143,594 | $14,136,603 | $27,030 | ||||||
| FF&E | $1,037,380 | $1,484,399 | $1,560,226 | $1,206,437 | $2,307 | ||||||
| Ground Lease Payment | $48,074 | $62,199 | $70,145 | $71,277 | $136 | ||||||
| Net Cash Flow | $9,976,819 | $12,133,646 | $12,513,224 | $12,858,889 | $24,587 | ||||||
| NOI DSCR | 1.29x | 1.59x | 1.65x | 1.65x | |||||||
| NCF DSCR | 1.16x | 1.41x | 1.46x | 1.50x | |||||||
| NOI Debt Yield | 9.2% | 11.4% | 11.8% | 11.8% | |||||||
| NCF Debt Yield | 8.3% | 10.1% | 10.5% | 10.7% | |||||||
Escrows and Reserves. The Marriott Chicago River North Hotel Borrower deposited $163,834 in escrow for annual real estate taxes at loan origination and is required to escrow $163,834 monthly. The Marriott Chicago River North Hotel Borrower is required to escrow 1/12th of the annual estimated insurance premiums monthly (unless the Marriott Chicago River North Hotel Borrower maintains insurance under a satisfactory blanket insurance policy). The Marriott Chicago River North Hotel Borrower deposited $1,610,000 at loan origination into a seasonality reserve account. The lender will adjust the amount required to be on deposit in the seasonality reserve account annually (subject to a cap of $1,610,000). The Marriott Chicago River North Hotel Borrower is required to deposit 1/12th of the rent (including both base and additional rents) and other charges due under the ground lease monthly that is estimated to be payable during the next ensuing 12 months.
Lockbox and Cash Management. A soft lockbox is in place with respect to the Marriott Chicago River North Hotel Mortgage Loan. The Marriott Chicago River North Hotel Mortgage Loan has in-place cash management. All rents and revenues from the Marriott Chicago River North Hotel Property are deposited into an account controlled by the manager. As long as no event of default under the Marriott Chicago River North Hotel Mortgage Loan, or under the management agreement, and no Cash Sweep Period (as defined below) has occurred, the manager will deposit monthly, all net remittances (after the payment of all expenses and fees for the Marriott Chicago River North Hotel Property) to the Marriott Chicago River North Hotel Borrower per the terms of the management agreement (the “Manager Remittances”) into the lockbox account. If an event of default occurs under the Marriott Chicago River North Hotel Mortgage Loan, or the management agreement, or a Cash Sweep Period has otherwise occurred, the Manager Remittances are to be deposited on each business day into the lockbox account. The Marriott Chicago River North Hotel Borrower will be required to deposit all excess cash with respect to the Marriott Chicago River North Hotel Mortgage Loan to be held by the lender as additional security for the Marriott Chicago River North Hotel Mortgage Loan during a Cash Sweep Period.
| This is not a research report and was not prepared by the Underwriters’ research departments. Please see additional important information and qualifications at the end of this Term Sheet. |
T-60
| MSBAM 2013-C12 | Marriott Chicago River North Hotel |
A “Cash Sweep Period” means the period commencing on the date upon which the debt service coverage ratio for the Marriott Chicago River North Property for the immediately preceding four quarters is less than 1.25x. A Cash Sweep Period will generally end upon (i) the date the debt service coverage ratio equals or exceeds 1.30x for four consecutive quarters or (ii) the date upon which the debt service coverage ratio has equaled or exceeded 1.10 for four consecutive quarters and the amount on deposit in the excess cash reserve account is equal to $8,586,742.
Property Management. The Marriott Chicago River North Hotel Property is managed by White Lodging Services Corporation, an affiliate of the Marriott Chicago River North Hotel Borrower.
Mezzanine Loan and Preferred Equity. Not permitted.
Additional Secured Indebtedness (not including trade debts). The Marriott Chicago River North Hotel Companion Loan was originated on July 18, 2013 by or on behalf by Bank of America, National Association and is evidenced by one note (Note A-1) with an original balance of $55,000,000 and a Cut-off Date Balance of $54,828,325. The current holder of the Marriott Chicago River North Hotel Companion Loan is Morgan Stanley Bank of America Merrill Lynch Trust 2013-C11. The note evidencing the Marriott Chicago River North Hotel Companion Loan accrues interest at the same rate as the Marriott Chicago River North Hotel Mortgage Loan. The Marriott Chicago River North Hotel Mortgage Loan is entitled to payments of principal and interest on a pro rata and pari passu basis with the Marriott Chicago River North Hotel Companion Loan, as and to the extent described under “Description of the Mortgage Pool—The A/B Whole Loans and the Loan Pairs—The Marriott Chicago River North Hotel Loan Pair” in the Free Writing Prospectus. The holders of the Marriott Chicago River North Hotel Mortgage Loan and the Marriott Chicago River North Hotel Companion Loan have entered into an agreement between note holders which sets forth the allocation of collections on the Marriott Chicago River North Hotel Loan Pair. The Marriott Chicago River North Hotel Mortgage Loan will generally represent the controlling interest in the Marriott Chicago River North Hotel Loan Pair and the Marriott Chicago River North Hotel Loan Pair will be serviced pursuant to terms the pooling and servicing agreement for this transaction. See “Description of the Mortgage Pool —The A/B Whole Loans and the Loan Pairs—The Marriott Chicago River North Hotel Loan Pair” in the Free Writing Prospectus.
Expansion, Release and Substitution of Property. Not permitted.
Terrorism Insurance. Generally, the Marriott Chicago River North Hotel Borrower is required to maintain (or cause to be maintained) insurance against loss for acts of terrorism with respect to the Marriott Chicago River North Hotel Property.
| This is not a research report and was not prepared by the Underwriters’ research departments. Please see additional important information and qualifications at the end of this Term Sheet. |
T-61
| MSBAM 2013-C12 | Westfield Countryside |
Mortgage Loan No. 5 – Westfield Countryside
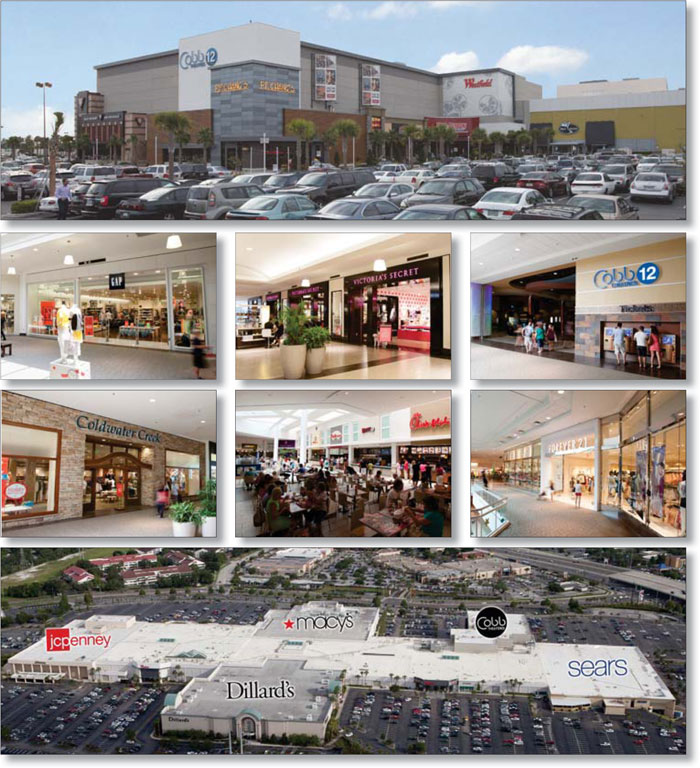
| This is not a research report and was not prepared by the Underwriters’ research departments. Please see additional important information and qualifications at the end of this Term Sheet. |
T-62
| MSBAM 2013-C12 | Westfield Countryside |
Mortgage Loan No. 5 – Westfield Countryside
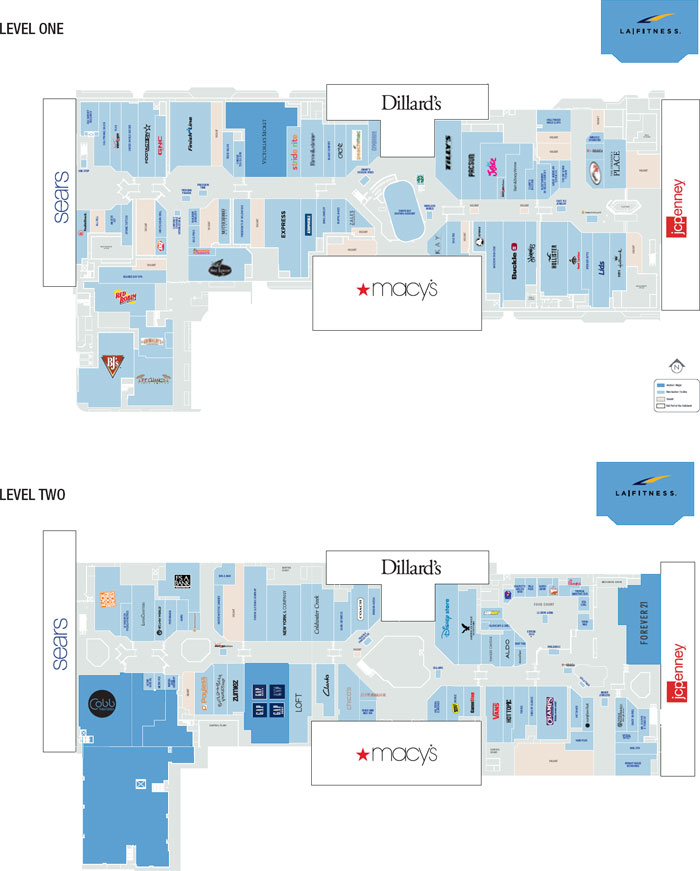
| This is not a research report and was not prepared by the Underwriters’ research departments. Please see additional important information and qualifications at the end of this Term Sheet. |
T-63
| MSBAM 2013-C12 | Westfield Countryside |
Mortgage Loan No. 5 – Westfield Countryside

| This is not a research report and was not prepared by the Underwriters’ research departments. Please see additional important information and qualifications at the end of this Term Sheet. |
T-64
| MSBAM 2013-C12 | Westfield Countryside |
Mortgage Loan No. 5 – Westfield Countryside |
| Mortgage Loan Information | Mortgaged Property Information | ||||||
| Mortgage Loan Seller: | MSMCH | Single Asset/Portfolio: | Single Asset | ||||
Credit Assessment: (Fitch/KBRA/Moody’s) | NR/NR/NR | Property Address: | 27001 U.S. Highway 19 North Clearwater, FL 33761 | ||||
Original Balance(1): | $55,000,000 | General Property Type: | Retail | ||||
Cut-off Date Balance(1): | $55,000,000 | Detailed Property Type: | Regional Mall | ||||
| % of Initial Pool Balance: | 4.3% | Net Rentable Area(4): | 464,836 SF | ||||
Loan Purpose(2): | Acquisition | Cut-off Date Balance Per Unit/SF(1): | $333 | ||||
| Borrower Name(s): | Countryside Mall LLC | Balloon/ARD Balance Per Unit/SF(1): | $303 | ||||
| Sponsor(s): | Westfield Group; O’Connor Capital Partners | Year Built/Year Renovated: | 1975/1988, 1989, 2009, 2011 | ||||
| Title Vesting: | Fee | ||||||
| Mortgage Rate: | 3.912% | Property Manager: | Westfield Property Management LLC | ||||
| Note Date: | 5/30/2013 | ||||||
| First Payment Date: | 7/1/2013 | ||||||
| Anticipated Repayment Date: | NAP | Underwriting and Financial Information | |||||
| Maturity Date: | 6/1/2023 | UW Revenues: | $25,324,035 | ||||
| IO Period: | 60 months | UW Expenses: | $9,698,281 | ||||
| Original Term to Maturity or ARD: | 120 months | UW NOI: | $15,625,754 | ||||
| Seasoning: | 4 months | UW NCF: | $14,586,182 | ||||
| Original Amortization Term: | 360 months | UW NOI DSCR(1): | 1.78x | ||||
| Loan Amortization Type: | Partial IO | UW NCF DSCR(1): | 1.66x | ||||
| Interest Accrual Basis: | Actual/360 | UW NOI Debt Yield(1): | 10.1% | ||||
| Prepayment Provisions: | LO (28); DEF/YM1 (85); O (7) | UW NCF Debt Yield(1): | 9.4% | ||||
| Lockbox/Cash Management: | Hard/Springing | UW NCF Debt Yield at Maturity(1): | 10.4% | ||||
Pari Passu Mortgage Debt(1): | $100,000,000 | Most Recent NOI (As of): | $16,066,085 (TTM 4/30/2013) | ||||
| Subordinate Mortgage Debt: | None | 2nd Most Recent NOI (As of): | $15,760,000 (12/31/2012) | ||||
| Mezzanine Debt: | None | 3rd Most Recent NOI (As of): | $13,384,000 (12/31/2011) | ||||
Reserves(3) | Appraised Value: | $270,000,000 | |||||
| Type | Initial | Monthly | Cap | Appraisal As-of Date: | 4/10/2013 | ||
| RE Tax: | $0 | Springing | NAP | Cut-off Date LTV Ratio(1): | 57.4% | ||
| Insurance: | $0 | Springing | NAP | LTV Ratio at Maturity/ARD(1): | 52.1% | ||
| Recurring Replacements: | $0 | Springing | $92,880 | Occupancy Rate (As of): | 91.7% (7/31/2013) | ||
| TI/LC: | $0 | Springing | $464,398 | 2nd Most Recent Occupancy (As of): | 82.4% (12/31/2012) | ||
3rd Most Recent Occupancy (As of): | |||||||
4th Most Recent Occupancy (As of): | |||||||
5th Most Recent Occupancy (As of): | 88.6% (12/31/2009) | ||||||
6th Most Recent Occupancy (As of): | 88.6% (12/31/2008) | ||||||
| (1) | The Westfield Countryside Mortgage Loan is part of the Westfield Countryside Loan Combination evidenced by multiple pari passu notes with an aggregate original principal balance of $155,000,000. The Cut-off Date Balance Per Unit/SF, Balloon/ARD Balance Per Unit/SF, UW NOI DSCR, UW NCF DSCR, UW NOI Debt Yield, UW NCF Debt Yield, UW NCF Debt Yield at Maturity, Cut-off Date LTV Ratio and LTV Ratio at Maturity/ARD numbers presented above are based on the entire $155,000,000 Westfield Countryside Loan Combination balance. |
| (2) | The proceeds of the Westfield Countryside Loan Combination were used to partially finance a joint venture purchase of 6 regional malls. An affiliate or affiliates of Westfield America, Inc., one of the current loan sponsors, previously owned a majority interest in the Westfield Countryside Property. |
| (3) | See “—Escrows and Reserves” below for further discussion of reserve requirements. The reserves, if any, are applicable to the entire Westfield Countryside Loan Combination. |
| (4) | The Net Rentable Area includes improvements owned by the Westfield Countryside Borrower and excludes four non-collateral anchor tenant stores totaling approximately 795,151 SF, which are tenant owned. |
The Westfield Countryside Mortgage Loan
The Mortgage Loan. The fifth largest mortgage loan (the “Westfield Countryside Mortgage Loan”) is part of a pari passu loan combination (the “Westfield Countryside Non-Serviced Loan Combination”) evidenced by multiple pari passu notes in the aggregate principal amount of $155,000,000, all of which are secured by the same first priority fee mortgage encumbering a portion of the regional mall known as Westfield Countryside Mall in Clearwater, Florida (the “Westfield Countryside Property”). The Westfield Countryside Mortgage Loan is evidenced by five pari passu notes (Notes A-1-2, A-2-2, A-3-2, B-1-2 and B-2-2) with a combined outstanding principal balance as of the Cut-off Date of $55,000,000. The five pari passu notes not included in the issuing entity (Notes A-1-1, A-2-1, A-3-1, B-1-1 and B-2-1) evidence a related companion loan (the “Westfield Countryside Non-Serviced Companion Loan”)and have an aggregate outstanding balance as of the Cut-off Date of $100,000,000. The Westfield Countryside Non-Serviced
| This is not a research report and was not prepared by the Underwriters’ research departments. Please see additional important information and qualifications at the end of this Term Sheet. |
T-65
| MSBAM 2013-C12 | Westfield Countryside |
Companion Loan has similar features and terms as the Westfield Countryside Mortgage Loan and was contributed to the MSBAM 2013-C11 transaction. See “—Secured Indebtedness” below for further details. The “A” notes are pari passu with each other and the “B” notes are all pari passu with each other. The “B” notes are subordinate to the “A” notes.
The Westfield Countryside Mortgage Loan had an initial term of 120 months and has a remaining term of 116 months, with a maturity date of June 1, 2023. The Westfield Countryside Mortgage Loan requires payments of interest only for the initial 60 months and payments of principal and interest thereafter. The Westfield Countryside Mortgage Loan may be prepaid in whole on any payment date after the first due date following the second anniversary of the closing date of this transaction, together with (prior to the open prepayment period) the greater of a yield maintenance premium and 1% of the prepayment amount. Defeasance with non-callable obligations of the United States of America (or other non-callable government securities or other non-callable instruments that will not cause the trust to lose its REMIC status and which, in each case, will not result in a downgrade or withdrawal of the ratings for the MSBAM Series 2013-C11 Certificates or the MSBAM 2013-C12 Certificates) is permitted at any time on or after the first due date following the second anniversary of the closing date of this transaction. The Westfield Countryside Mortgage Loan is open to prepayment in full (without prepayment consideration) during the final six months of the loan term.
The Borrower and the Sponsor. The borrower is Countryside Mall LLC (the “Westfield Countryside Borrower”), a single-purpose Delaware limited liability company. The Westfield Countryside Borrower is indirectly owned and controlled by Westfield America, Inc., a subsidiary of Westfield Group (“Westfield”) (ASX: WDC), a Sydney Australia based shopping center owner and manager and by an affiliate of O’Connor Capital Partners (“O’Connor”). Westfield currently has investment interests in 99 shopping centers in Australia, New Zealand, the United States and the United Kingdom. Westfield America, Inc. is the non-recourse carve-out guarantor. O’Connor is a privately held New York City based real estate investment firm. On March 29, 2013, Westfield and O’Connor announced a joint venture investment in a portfolio comprising six regional malls located in Florida, including the Westfield Countryside Property, with a gross total value of $1.283 billion.
The Mortgaged Property. The Westfield Countryside Property consists of 464,836 SF of major, in-line, food court, and kiosk space within the 2-story, approximately 1,259,987 SF Westfield Countryside Mall, a regional mall in Clearwater, Florida. The Westfield Countryside Property is located within the Tampa – St. Petersburg - Clearwater MSA. The Westfield Countryside Mall is anchored by Sears, Macy’s, Dillard’s, and JC Penney, and includes a 12 screen Cobb Theater Cinema, as well as a 20,000 SF XXI Forever store and a free-standing 18,466 SF L.A. Fitness. The four anchor stores, Sears, Macy’s, Dillard’s, and JC Penney, which total approximately 795,151 SF, are tenant owned and are not collateral for the Westfield Countryside Mortgage Loan. The Westfield Countryside Mall opened in 1975, was expanded in 1988 and 1989, and was fully renovated in 2009 and expanded in 2011, with the addition of the new 12- screen Cobb Theater and the reconfiguration of approximately 33,626 SF of previously existing shop space to restaurant space. The new theater and restaurant area was leased in 2011, 2012, and 2013. There are currently no plans for renovation, improvement or development of the Westfield Countryside Property.
In addition to the XXI Forever store, the L.A. Fitness Club, a Victoria’s Secret store, a Gap/Gap Body store and the Cobb Theater, the Westfield Countryside Property contains approximately 115 occupied in-line stores, 17 kiosks and 10 food court tenants. There is currently approximately 38,780 SF of in-line and kiosk vacancy. The Westfield Countryside Mall in its entirety has 5,586 surface and garage parking spaces, for a total parking ratio of 4.44 spaces per 1,000 SF of total GLA, including the non-collateral anchor tenant spaces.
As of the July 31, 2013 rent roll, the Westfield Countryside Property is 91.7% leased. The Westfield Countryside Mall, including both collateral and non-collateral space, was 96.9% leased or otherwise occupied as of the July 31, 2013 rent roll. Comparable in-line store sales, representing 177,728 SF, as of the trailing 12 months ended May 31, 2013, were approximately $396 PSF. The trailing 12 month average occupancy cost as a percentage of sales for these tenants was 17.2%. The reported year end 2012 in-line comparable sales were approximately $392 PSF. The 2011 and 2010 in-line comparable sales were approximately $353 and $334 PSF, respectively. For the trailing 12 months ended May 31, 2013, total mall sales, including sales estimates for the non-collateral anchor tenants and reported sales for comparable and non-comparable major, in-line, food court and kiosk tenants, totaled approximately $243,176,000.
Major Collateral Tenants.
Cobb Theaters (53,729 SF, 12% of NRA, 11% of underwritten base rent). Cobb Theaters III, LLC (“Cobb”) leases 53,729 SF at the Westfield Countryside Property and operates the space as a 12-screen movie-theater. The lease began on December 16, 2011 and has a current expiration date of December 31, 2026, with four 5-year lease renewal options. Cobb Theaters, L.L.C., which was established in Alabama in 1921, currently operates 253 screens at 21 locations in 5 states.
XXI Forever (20,000 SF, 4% of NRA, 4% of underwritten base rent). Forever 21 Retail, Inc. leases 20,000 SF at the Westfield Countryside Property. The lease began on June 29, 2012 and has a current expiration date of January 31, 2023. Forever 21, Inc., was founded in 1984 and, according to Forbes, as of November 2012, the apparel retailer was the 121st largest private company in the United States with estimated annual sales of $3.4 billion at over 480 stores under various brand names, including Forever 21, XXI Forever, For Love 21, Heritage 1981 and Reference.
L.A. Fitness (18,466 SF, 4% of NRA, 1% of underwritten base rent). L.A. Fitness International, LLC leases 18,466 SF at the Westfield Countryside Property. The lease began on February 16, 2003 and has a current expiration date of March 31, 2018, with three 5-year lease renewal options. L.A. Fitness is a health club chain that was founded in 1984 and currently operates more than 500 locations in 24 states and Canada.
| This is not a research report and was not prepared by the Underwriters’ research departments. Please see additional important information and qualifications at the end of this Term Sheet. |
T-66
| MSBAM 2013-C12 | Westfield Countryside |
The following table presents a summary regarding major tenants and the non-collateral anchors at the Westfield Countryside Property:
| Tenant Summary | |||||||||
| Tenant Name | Credit Rating (Fitch/Moody’s/S&P)(1) | Tenant NRSF | Approximate % of NRSF(2) | Annual Underwritten Base Rent | % of Total Annual UW Rent | Total Annual Underwritten Base Rent (PSF)(3) | Lease Expiration(4) | TTM May 2013 Sales PSF/ Screen(5) | UW Occupancy Cost as a % of Sales |
| Non-Collateral Anchors | |||||||||
| Sears | CCC/B3/CCC+ | 220,833 | NAP | NAP | NAP | NAP | 9/06/2030 | $103 | NAP |
| Macy’s | BBB/Baa3/BBB | 214,965 | NAP | NAP | NAP | NAP | 7/23/2030 | $202 | NAP |
| Dillard’s | BBB-/Ba3/BB+ | 209,214 | NAP | NAP | NAP | NAP | 3/30/2031 | $128 | NAP |
| J.C. Penney | B-/Caa1/CCC+ | 150,139 | NAP | NAP | NAP | NAP | 1/20/2031 | $121 | NAP |
| Subtotal / Wtd. Avg. | 795,151 | ||||||||
| Tenants > 10,000 SF | |||||||||
| Cobb Theaters | NR/NR/NR | 53,729 | 12% | $1,682,389 | 11% | $31.31 | 12/31/2026 | $587,583 | 23.9% |
| XXI Forever | NR/NR/NR | 20,000 | 4% | $574,464 | 4% | $28.72 | 1/31/2023 | $210 | 12.7% |
| L.A. Fitness | NR/NR/NR | 18,466 | 4% | $203,126 | 1% | $11.00 | 3/31/2018 | $52 | 30.0% |
| Victoria’s Secret | NR/NR/NR | 12,411 | 3% | $372,330 | 3% | $30.00 | 1/31/2018 | $542 | 10.1% |
| Gap/Gap Body | BBB-/Baa3/BBB- | 11,168 | 2% | $223,360 | 2% | $20.00 | 1/31/2017 | $199 | 24.3% |
| Subtotal / Wtd. Avg. | 115,774 | 25% | $3,055,669 | 21% | $26.39 | ||||
| Other Tenants | 310,282 | 67% | $11,751,680 | 79% | $37.87 | ||||
| Vacant Space | 38,780 | 8% | $0 | 0% | $0.00 | ||||
| Total | 464,836 | 100% | $14,807,349 | 100% | $34.75 | ||||
| (1) | Certain ratings are those of the parent company whether or not the parent guarantees the lease. |
| (2) | Approximate % of NRSF is based on total collateral NRSF of 464,836 SF. It does not include the Sears, Macy’s, Dillard’s or J.C. Penney stores, which are not collateral for the Westfield Countryside Mortgage Loan. |
| (3) | Total Annual Underwritten Base Rent (PSF) excludes vacant space. |
| (4) | The lease expiration dates for Sears, Macy’s, Dillard’s and J.C. Penney represent the current reciprocal easement agreement expiration dates for each respective store. These anchor stores are not collateral for the Westfield Countryside Mortgage Loan. |
| (5) | The Sears, Macy’s, Dillard’s and J.C. Penney stores do not report sales for this location. The above Sales PSF attributed to these non-collateral stores are based only on estimates by Westfield for the 2012 calendar year. TTM May 2013 Sales PSF attributed to “Other Tenants” includes only 177,728 SF of comparable in-line and 2,613 SF of comparable food court tenants. (Non-comparable in-line, food court and kiosk tenants are excluded from this calculation.) Excluding the comparable food court tenants, which had TTM average sales of $887 PSF, the average sales PSF for comparable in-line tenants was approximately $396. |
| This is not a research report and was not prepared by the Underwriters’ research departments. Please see additional important information and qualifications at the end of this Term Sheet. |
T-67
| MSBAM 2013-C12 | Westfield Countryside |
The following table presents certain information relating to the lease rollover at the Westfield Countryside Property:
Lease Rollover Schedule(1)(2) | |||||||||
| Year | # of Leases Rolling | SF Rolling | Average Underwritten Base Rent PSF Rolling(3) | Approx. % of Total SF Rolling | Approx. Cumulative % of SF Rolling | Total Underwritten Base Rent Rolling | Approx. % of Total Base Rent Rolling | Approx. Cumulative % of Total Base Rent Rolling | |
| MTM | 0 | 0 | $0.00 | 0% | 0% | $0 | 0% | 0% | |
| 2013 | 3 | 2,532 | $73.42 | 1% | 1% | $185,896 | 1% | 1% | |
| 2014 | 27 | 47,501 | $36.98 | 10% | 11% | $1,756,727 | 12% | 13% | |
| 2015 | 13 | 19,525 | $46.64 | 4% | 15% | $910,640 | 6% | 19% | |
| 2016 | 24 | 55,306 | $39.38 | 12% | 27% | $2,178,065 | 15% | 34% | |
| 2017 | 14 | 22,655 | $46.92 | 5% | 32% | $1,062,962 | 7% | 41% | |
| 2018 | 24 | 77,274 | $29.46 | 17% | 48% | $2,276,371 | 15% | 57% | |
| 2019 | 9 | 25,179 | $30.55 | 5% | 54% | $769,170 | 5% | 62% | |
| 2020 | 7 | 15,615 | $49.54 | 3% | 57% | $775,514 | 5% | 67% | |
| 2021 | 6 | 15,079 | $32.21 | 3% | 60% | $485,729 | 3% | 70% | |
| 2022 | 8 | 22,096 | $33.87 | 5% | 65% | $748,402 | 5% | 75% | |
| 2023 | 10 | 49,345 | $27.58 | 11% | 76% | $1,360,903 | 9% | 85% | |
| 2024 | 1 | 3,500 | $10.00 | 1% | 77% | $35,000 | 0% | 84% | |
| 2025 | 0 | 0 | $0.00 | 0% | 77% | $0 | 0% | 85% | |
| 2026 & Beyond | 3 | 70,449 | $32.14 | 15% | 92% | $2,263,969 | 15% | 100% | |
| Vacant | 0 | 38,780 | $0.00 | 8% | 100% | $0 | 0% | 100% | |
| Total / Wtd. Avg. | 149 | 464,836 | $34.75 | 100% | $14,807,349 | 100% | |||
| (1) | The information in the lease rollover schedule is based on the underwritten rent roll. The July 31, 2013 rent roll indicates 5 tenant expirations in 2013; however, as of a September 30, 2013 rent roll, two of those tenants have renewed and have 2023 and 2024 lease expiration dates. |
| (2) | Certain tenants may have lease termination options that are exercisable prior to the originally stated expiration date of the subject lease and that are not considered in the lease rollover schedule. |
| (3) | Average Underwritten Base Rent PSF Rolling excludes vacant space. |
| This is not a research report and was not prepared by the Underwriters’ research departments. Please see additional important information and qualifications at the end of this Term Sheet. |
T-68
| MSBAM 2013-C12 | Westfield Countryside |
The Market. The Westfield Countryside Property is located in Tampa MSA, approximately 3.5 miles east of the Gulf of Mexico, within the city of Clearwater. The Tampa CBSA has a population of approximately 2.8 million people. The Westfield Countryside Property is located within the Clearwater/North Pinellas submarket, which contains approximately 8.9 million SF of retail space, which is 22.2% of the market inventory. As of March 31, 2013, the submarket retail vacancy averaged 13.7%, with an average asking rent of $14.51 PSF for general retail space. Competitive regional mall average in-line rental rates are included in the chart below. The estimated current population within a five-mile radius is 224,591 people. The average household income within a five-mile radius is estimated at $59,168 per annum, while the average household income within the Westfield Countryside Property trade area is approximately $60,746. Below is a chart of primary and secondary competitive shopping centers.
| Competitive Property Summary | ||||||||||
| Property | Center Type | Year Built | Year Renovated | Total GLA (SF) | Anchor Tenants | Inline Avg. Rent PSF | Sales PSF | Occupancy | Proximity | |
Citrus Park (Primary Competition) NEQ Sheldon Rd. & Citrus Park Dr., Tampa | Super-Regional | 1999 | 2004 | 1,143,377 | Dillard’s JC Penney Macy’s Sears Dick’s Sporting Goods | $30.62 | $370 | 88% | 10.2 miles NE | |
International Plaza (Primary Competitor) 2223 N Westshore Boulevard Tampa | Super-Regional | 2001 | 2005 | 1,174,565 | Dillard’s Neiman Marcus Nordstrom Forever XXI | $49.00 | $500 | 95% | 14.3 miles SE | |
Westshore Plaza (Primary Competitor) 250 Westshore Plaza Tampa | Super-Regional | 1967 | 2001 | 1,036,322 | JC Penney Macy’s Saks Fifth Avenue Sears | $29.00 | $375 | 93% | 14.4 miles SE | |
Tyrone Square (Secondary Competitor) 1050 58th St. N St. Petersburg | Super-Regional | 1972 | 1998 | 1,124,606 | Dillard’s JC Penney Macy’s Sears | $28.00 | $350 | 91% | 15.6 miles S | |
Source: Appraisal
| This is not a research report and was not prepared by the Underwriters’ research departments. Please see additional important information and qualifications at the end of this Term Sheet. |
T-69
| MSBAM 2013-C12 | Westfield Countryside |
Operating History and Underwritten Net Cash Flow. The following table presents certain information relating to the historical operating performance and the Underwritten Net Cash Flow at the Westfield Countryside Property:
| Cash Flow Analysis | |||||||||||||
| 2009 | 2010 | 2011 | 2012 | UW | UW PSF | ||||||||
Base Rent(1) | $11,651,000 | $10,261,000 | $10,004,000 | $12,335,000 | $14,807,349 | $31.85 | |||||||
| Overage Rent | $52,000 | $71,000 | $128,000 | $182,000 | $235,225 | $0.51 | |||||||
Other Income(2) | $3,426,000 | $2,913,000 | $2,723,000 | $3,135,000 | $1,511,000 | $3.25 | |||||||
| Total Recoveries | $8,157,000 | $7,800,000 | $8,669,000 | $9,114,000 | $10,117,000 | $21.76 | |||||||
Mark to Market(3) | $0 | $0 | $0 | $0 | ($1,346,538) | ($2.90) | |||||||
| Less Vacancy & Credit Loss | ($119,000) | $27,000 | ($1,000) | ($71,000) | $0 | $0 | |||||||
| Effective Gross Income | $23,167,000 | $21,072,000 | $21,523,000 | $24,695,000 | $25,324,035 | $54.48 | |||||||
| Total Operating Expenses | $7,891,000 | $7,618,000 | $8,139,000 | $8,935,000 | $9,698,281 | $20.86 | |||||||
| Net Operating Income | $15,276,000 | $13,454,000 | $13,384,000 | $15,760,000(4) | $15,625,754 | $33.62 | |||||||
| TI/LC | $0 | $0 | $0 | $0 | $946,604 | $2.04 | |||||||
| Capital Expenditures | $0 | $0 | $0 | $0 | $92,967 | $0.20 | |||||||
| Net Cash Flow | $15,276,000 | $13,454,000 | $13,384,000 | $15,760,000 | $14,586,182 | $31.38 | |||||||
| Occupancy % | 88.6% | 89.5% | 84.4% | 82.4% | 91.7% | ||||||||
| NOI DSCR | 1.74x | 1.53x | 1.52x | 1.79x | 1.78x | ||||||||
| NCF DSCR | 1.74x | 1.53x | 1.52x | 1.79x | 1.66x | ||||||||
| NOI Debt Yield | 9.9% | 8.7% | 8.6% | 10.2% | 10.1% | ||||||||
| NCF Debt Yield | 9.9% | 8.7% | 8.6% | 10.2% | 9.4% | ||||||||
Average Annual Rent PSF(5) | $31.99 | $27.87 | $28.84 | $32.20 | $34.75 | ||||||||
| (1) | Historical and Underwritten Base Rent includes actual property vacancy. Underwritten Base Rent includes approximately $250,047 of contractual rent increases through December 31, 2013. In 2011, 2012 and 2013, a new theater and 5 restaurants were added to the Westfield Countryside Property, which account for approximately $2,828,519 of total additional underwritten base rents, plus associated recoveries. |
| (2) | Underwritten Other Income includes specialty leasing, partnership marketing and additional income. |
| (3) | Inline tenants with occupancy costs exceeding 20% are marked down to a 20% occupancy cost total rental rate. |
| (4) | The Westfield Countryside sponsor reported trailing twelve months ended April 30, 2013 NOI of $16,066,085 at the Westfield Countryside Property. |
| (5) | Average Annual Rent PSF is based on historical financials and end of year occupancy rates. Vacant space is excluded from the calculation. The Underwritten Average Annual Rent PSF includes certain contractual rent steps as described in note 1 above. The assumed SF for the calculation is approximately 411,107 (the current SF less the recently constructed Cobb Theater space, which lease began on December 16, 2011) for the years 2009, 2010 and 2011 and 464,836 SF for 2012 and the underwritten period, net of vacancy. |
Escrows and Reserves. On each monthly payment date on which the debt service coverage ratio fails to satisfy the DSC Threshold (as defined below), the Westfield Countryside Borrower is required to escrow 1/12th of the annual estimated tax payments monthly and 1/12th of the annual estimated insurance premiums monthly (unless the Westfield Countryside Borrower maintains insurance under an acceptable blanket insurance policy). The Westfield Countryside Borrower is also required, on each monthly payment date on which the debt service coverage ratio fails to satisfy the DSC Threshold, to make monthly deposits of $7,739 for replacement reserves and $38,669 for TI/LC reserves, provided that such deposits are not required at any time that the amount then on deposit in the replacement reserve exceeds $92,880 or in the TI/LC reserve exceeds $464,398.
“DSC Threshold” means a debt service coverage ratio of at least 1.80x, calculated based on the previous twelve months and tested on the first day of each calendar quarter. The calculation will be based on the current interest only debt service payment throughout the Westfield Countryside Mortgage Loan term and on the actual Westfield Countryside Property operating results.
Lockbox and Cash Management. A hard lockbox is in place with respect to the Westfield Countryside Mortgage Loan. The Westfield Countryside Mortgage Loan has springing cash management. Provided a Cash Sweep Period has not commenced, funds in the lockbox account are swept daily to an account designated by the Westfield Countryside Borrower. During the continuance of a Cash Sweep Period, funds in the lockbox account are swept daily to the cash management account and applied on each monthly payment date to pay debt service on the Westfield Countryside Mortgage Loan, to fund the required reserves deposits as described above under “—Escrows and Reserves,” to fund an operating expense subaccount up to the amount of lender approved operating expenses and budgeted capital expenses for the next month and an extraordinary expense subaccount up to the amount of extraordinary expenses approved by lender for the next month and to remit the remainder to an account to be held by the mortgagee as additional security for the Westfield Countryside Mortgage Loan.
A “Cash Sweep Period” will commence upon the occurrence of an event of default and end on the date upon which the event of default has been cured as determined by Lender in its sole good faith discretion.
Property Management. The Westfield Countryside Property is managed by Westfield Property Management LLC, an affiliate of the Westfield Countryside Borrower.
Secured Indebtedness. The Westfield Countryside Non-Serviced Companion Loan was originated by MSMCH on May 30, 2013 and is evidenced by five notes with a combined original and Cut-off Date Balance of $100,000,000. The current holder of the Westfield Countryside Non-Serviced Companion Loan is Morgan Stanley Bank of America Merrill Lynch Trust 2013-C11. The notes evidencing the Westfield Countryside Non-Serviced Companion Loan accrue interest at the same rate as the Westfield Countryside Mortgage Loan. The Westfield Countryside Mortgage Loan is entitled to payments of principal and interest on a pro rata and pari passu basis with the Westfield Countryside Non-Serviced Companion Loan, as and to the extent described under “DESCRIPTION OF THE MORTGAGE POOL–The Non-Serviced Loan Combinations–The Westfield Countryside Non-Serviced Loan Combination” in the Free Writing Prospectus. The holders of the Westfield Countryside Mortgage Loan and the Westfield Countryside Non-
| This is not a research report and was not prepared by the Underwriters’ research departments. Please see additional important information and qualifications at the end of this Term Sheet. |
T-70
| MSBAM 2013-C12 | Westfield Countryside |
Serviced Companion Loan have entered into a co-lender agreement which sets forth the allocation of collections on the Westfield Countryside Non-Serviced Loan Combination. The Westfield Countryside Non-Serviced Companion Loan will generally represent the controlling interest in the Westfield Countryside Non-Serviced Loan Combination and the Westfield Countryside Non-Serviced Loan Combination will be serviced pursuant to terms of the pooling and servicing agreement for the MSBAM 2013-C11 transaction. See “DESCRIPTION OF THE MORTGAGE POOL–The Non-Serviced Loan Combinations–The Westfield Countryside Non-Serviced Loan Combination” in the Free Writing Prospectus.
Mezzanine Loan and Preferred Equity. Not permitted.
Future Secured Indebtedness (not including trade debts). Not permitted.
Release of Property. Not permitted.
Terrorism Insurance. Generally, the insurance policies maintained by the Westfield Countryside Borrower are required to cover losses resulting from perils and acts of terrorism. Notwithstanding the foregoing, if the Terrorism Risk Insurance Program Reauthorization Act of 2007 (or any subsequent statute, extension or reauthorization) is not in effect, Westfield Countryside Borrower is required to maintain terrorism insurance as described above, but in such event, the Westfield Countryside Borrower will not be required to pay annual premiums in excess of two times the then current premium for a separate “special causes of loss” (or similar) policy insuring only the Westfield Countryside Property on a stand-alone basis, provided the Westfield Countryside Borrower will be obligated to purchase the maximum amount of terrorism coverage available with funds equal to such cap to the extent available.
Expansion, Release and Substitution of Property. Provided no event of default has occurred and is continuing, the Westfield Countryside Borrower may obtain a release of certain non-income producing, non-material portions of the Westfield Countryside Property, and in connection therewith subdivide the Westfield Countryside Property, including parking areas, provided that, among other conditions, the Westfield Countryside Borrower has certified that (i) fee simple title to the release parcel is being conveyed to a third party and (ii) the subdivision in connection with such release will not materially adversely affect the use, value, utility or operation of the remaining Westfield Countryside Property as it was operated immediately prior to the release and lender has received evidence demonstrating that the remaining Westfield Countryside Property will comply in all material respects with all applicable legal requirements after the release and constitute one or more separate legal tax lots (as reflected in a tax lot endorsement to the title policy).
| This is not a research report and was not prepared by the Underwriters’ research departments. Please see additional important information and qualifications at the end of this Term Sheet. |
T-71
| MSBAM 2013-C12 | Point at Las Colinas |
Mortgage Loan No. 6 – Point at Las Colinas
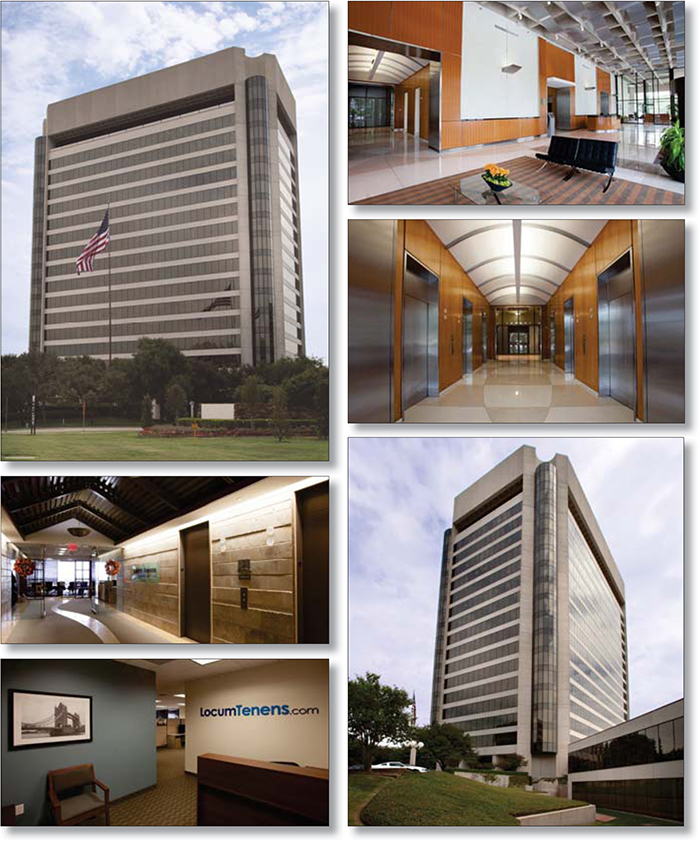
| This is not a research report and was not prepared by the Underwriters’ research departments. Please see additional important information and qualifications at the end of this Term Sheet. |
T-72
| MSBAM 2013-C12 | Point at Las Colinas |
Mortgage Loan No. 6 – Point at Las Colinas

| This is not a research report and was not prepared by the Underwriters’ research departments. Please see additional important information and qualifications at the end of this Term Sheet. |
T-73
| MSBAM 2013-C12 | Point at Las Colinas |
| Mortgage Loan No. 6 – Point at Las Colinas |
| Mortgage Loan Information | Mortgaged Property Information | ||||||
| Mortgage Loan Seller: | MSMCH | Single Asset/Portfolio: | Single Asset | ||||
Credit Assessment: (Fitch/KBRA/Moody’s) | NR/NR/NR | Property Address: | 300 East John W. Carpenter Freeway Irving, TX 75062 | ||||
| Original Balance: | $43,500,000 | General Property Type: | Office | ||||
| Cut-off Date Balance: | $43,500,000 | Detailed Property Type: | Suburban | ||||
| % of Initial Pool Balance: | 3.4 % | Net Rentable Area: | 398,771 SF | ||||
| Loan Purpose: | Acquisition | Cut-off Date Balance Per Unit/SF: | $109 | ||||
| Borrower Name(s): | FPG The Point, LP | Balloon/ARD Balance Per Unit/SF: | $109 | ||||
| Sponsor: | Fortis Property Group, LLC | Year Built/Year Renovated: | 1983/2007 | ||||
| Mortgage Rate: | 4.680% | Title Vesting: | Fee | ||||
| Note Date: | 8/12/2013 | Property Manager: | FPG Texas Management, LP | ||||
| First Payment Date: | 10/1/2013 | ||||||
| Anticipated Repayment Date: | NAP | Underwriting and Financial Information | |||||
| Maturity Date: | 9/1/2018 | UW Revenues: | $8,045,079 | ||||
| IO Period: | 60 months | UW Expenses: | $3,973,480 | ||||
| Original Term to Maturity or ARD: | 60 months | UW NOI: | $4,071,599 | ||||
| Seasoning: | 1 month | UW NCF: | $3,991,849 | ||||
| Original Amortization Term: | 0 months | UW NOI DSCR: | 1.97x | ||||
| Loan Amortization Type: | Full IO | UW NCF DSCR: | 1.93x | ||||
| Interest Accrual Basis: | Actual/360 | UW NOI Debt Yield: | 9.4% | ||||
| Prepayment Provisions: | LO (25); DEF (31); O (4) | UW NCF Debt Yield: | 9.2% | ||||
| Lockbox/Cash Management: | Hard/In Place | UW NCF Debt Yield at Maturity: | 9.2% | ||||
Pari Passu Mortgage Debt: | None | Most Recent NOI (As of): | $3,043,470 (6/30/2013 TTM) | ||||
| Subordinate Mortgage Debt: | None | Second Most Recent NOI (As of): | $5,088,849 (12/31/2012) | ||||
Mezzanine Debt(1): | $9,187,000 | Third Most Recent NOI (As of): | $4,251,150 (12/31/2011) | ||||
Reserves(2) | Appraised Value: | $60,000,000 | |||||
| Type | Initial | Monthly | Cap | Appraisal As-of Date: | 7/12/2012 | ||
| RE Tax: | $665,180 | $90,714 | NAP | Cut-off Date LTV Ratio: | 72.5% | ||
| Insurance: | $8,150 | $8,150 | NAP | LTV Ratio at Maturity/ARD: | 72.5% | ||
| Recurring Replacements: | $310,000 | $6,646 | NAP | Occupancy Rate: | 98.3% (8/12/2013) | ||
| TI/LC: | $5,000,000 | $0 | NAP | 2nd Most Recent Occupancy: | 91.1% (12/31/2012) | ||
| Rent Abatements: | $653,922 | $0 | NAP | 3rd Most Recent Occupancy: | |||
| Outstanding TI Funds: | $3,370,543 | $0 | NAP | ||||
| (1) | See “—Mezzanine Loan and Preferred Equity” below. |
| (2) | See “—Escrows and Reserves” below for further discussion of reserve requirements. The initial recurring replacement, rent abatements and outstanding TI funds escrows were provided as a credit to the Point at Las Colinas Borrower from the property seller. |
| The Point at Las Colinas Mortgage Loan |
The Mortgage Loan. The sixth largest mortgage loan (the “Point at Las Colinas Mortgage Loan”) is evidenced by a promissory note in the principal amount of $43,500,000, secured by a first priority fee mortgage encumbering the property known as the Point at Las Colinas, Irving, Texas (the “Point at Las Colinas Property”). The proceeds of the Point at Las Colinas Mortgage Loan were used to finance the acquisition of the Point at Las Colinas Property for a purchase price of approximately $55,000,000.
The Point at Las Colinas Mortgage Loan had an original term of 60 months and has a remaining term of 59 months with a maturity date of September 1, 2018. The Point at Las Colinas Mortgage Loan requires payments of interest only for its entire term. Defeasance with direct, non-callable obligations of the United States of America (or other non-callable government securities or other non-callable instruments that will not cause the trust to lose its REMIC status and, in each case, will not result in a downgrade or withdrawal of the ratings for the MSBAM Series 2013-C12 Certificates) is permitted at any time on or after the first due date following the second anniversary of the closing date of this transaction. The Point at Las Colinas Mortgage Loan is open to prepayment in full (without prepayment consideration) during the final three months of the loan term.
The Borrower and the Sponsor. The borrower is FPG The Point, LP (the “Point at Las Colinas Borrower”), a single-purpose Delaware limited partnership with 2 independent directors. The Point at Las Colinas Borrower is partially owned and controlled by Louis and Joel Kestenbaum, founding members of the Fortis Property Group, LLC (“Fortis”). Fortis is the recourse carve-out guarantor. Fortis is a New York based real estate investment,
| This is not a research report and was not prepared by the Underwriters’ research departments. Please see additional important information and qualifications at the end of this Term Sheet. |
T-74
| MSBAM 2013-C12 | Point at Las Colinas |
operating and development company. As of December 31, 2012, Fortis reported total assets of approximately $491.7 million and an equity value of approximately $112.7 million.
The Mortgaged Property. The Point at Las Colinas Property is a Class A, 18- story, multi-tenant office building within the Las Colinas Development master planned community in Irving, Texas. The approximately 398,749 SF building was constructed in 1983 and renovated in 2007. There are approximately 1,390 garage and surface parking spaces at the Point at Las Colinas Property, primarily within a six story parking structure.
The Point at Las Colinas Property was purchased by CBREI in 2006 after a previous lease, which occupied most of the building, expired in 2005 leaving the property approximately 75% vacant. CBREI then invested approximately $5 million in capital improvements to upgrade the lobby, and other interior and exterior common areas, create a conference and fitness center and obtain a LEED Silver certification. An additional approximately $7 million in tenant improvements was spent to re-tenant the formerly vacant space, primarily by leasing approximately 111,365 SF to Lehigh Hanson, Inc. (“Lehigh”) beginning in September 2006, with an additional 45,902 SF as of July 2008. Lehigh recently renewed its previously existing lease for approximately 157,267 SF from 2006 and 2008 and expanded its space by approximately 53,854 SF, for a total of 211,121 SF, or approximately 53% of total building SF. Please see “—Major Tenants” below for further discussion of Lehigh lease terms, including certain lease termination options.
The Las Colinas Development, in which the Point at Las Colinas Property is located, encompasses over 20,000 acres and includes Class A office towers, two hotels, luxury residential developments and a monorail system. The Urban Center of Las Colinas contains the highest concentration of office space in the market outside the Dallas and Fort Worth CBDs, with over 5 million SF.
Major Tenants.
Lehigh Hanson, Inc. (211,121 SF, 53% of NRA, 54% of underwritten base rent). Lehigh leases 211,121 SF at the Point at Las Colinas Property. The lease is guaranteed by HBMA Holdings, Inc., and Lehigh Hanson Materials Limited. The original lease began on September 1, 2006, was expanded on July 1, 2008, then renewed and expanded again on August 7, 2013. The lease has a current expiration date of August 7, 2025 for the entire Lehigh space, with one 10-year lease extension option followed by one 5-year lease extension option. The tenant has a lease termination option effective at the end of the 96th lease month of the current lease term (August 31, 2021) with 12 months of notice and payment of an early termination fee equal to all unamortized leasing costs. If Lehigh does not exercise this early lease termination option it is entitled to rent abatement on its entire space for the 97-99th lease months, totaling approximately $1,189,202, plus a refurbishment allowance not to exceed $1,000,000. Lehigh is, since 2007, part of the HeidelbergCement Group (HEI:Xetra), a German based building materials manufacturer with approximately 52,000 employees at 2,500 locations in more than 40 countries. Lehigh has production sites across the U.S. and Canada that produce cement, aggregates, ready mixed concrete, asphalt, precast concrete products, pressure and gravity pipes, tiles and clay bricks.
GE Capital Corporation (109,936 SF, 28% of NRA, 28% of underwritten base rent). General Electric Capital Corporation (“GECC”) leases 109,936 SF at the Point at Las Colinas Property. The lease began on July 15, 2005, was expanded by 1,706 SF for a fitness center on August 1, 2013, and has a current expiration date of September 30, 2015, with one 5-year lease renewal option. The tenant has a lease termination option applicable to the top floor of its space with 12 months of notice and payment of a termination fee equal to any unamortized leasing costs. GECC is a subsidiary of General Electric Company (NYSE: GE). The company is the financial services unit of GE. As of 2012, GECC had 50,000+ employees worldwide, operating in more than 50 countries, with total assets of $538 billion.
Interstate Operating LP (22,880 SF, 6% of NRA, 6% of underwritten base rent). Interstate Operating Company, L.P. (“Interstate”) leases 22,880 SF at the Point at Las Colinas Property. The lease began on March 1, 2008 and has a current expiration date of December 31, 2014, with one 5-year lease renewal option. Interstate is a private company that operates as a subsidiary of Interstate Hotels & Resorts Inc. Interstate Hotels & Resorts is a global hotel management company. The company and its affiliates managed 380 hotels with more than 73,000 rooms globally.
The following table presents a summary regarding anchor and major tenants at the Point at Las Colinas Property:
| Tenant Summary | |||||||
| Tenant Name | Credit Rating (Fitch/Moody’s/S&P)(1) | Tenant NRSF | Approximate % of NRSF | Annualized Underwritten Base Rent | % of Total Annualized UW Rent | Total Annual Underwritten Base Rent (PSF) | Lease Expiration |
| Major Tenants | |||||||
| Lehigh Hanson, Inc. | NR/NR/NR | 211,121 | 53% | $4,367,445 | 54% | $20.69 | 8/31/2025(2) |
| GE Capital Corporation | NR/Aa3/AA+ | 109,936 | 28% | $2,234,226 | 28% | $20.32 | 9/30/2015 |
| Interstate Operating Company, LP | NR/NR/NR | 22,880 | 6% | $480,480 | 6% | $21.00 | 12/31/2014 |
| Subtotal/Wtd. Avg. | 343,937 | 86% | $7,082,151 | 88% | $20.59 | ||
| Other tenants | 47,900 | 12% | $999,836 | 12% | $20.87 | ||
| Vacant Space | 6.934 | 2% | $0 | 0% | $0.00 | ||
| Total/Wtd. Avg. | 398,771 | 100% | $8,081,987 | 100% | $20.63 | ||
| (1) | Certain ratings are those of the parent company whether or not the parent guarantees the lease. |
| (2) | Lehigh Hanson has a lease termination option effective August 31, 2021 with 12 months of notice and payment of an early termination fee equal to all unamortized leasing costs. |
| This is not a research report and was not prepared by the Underwriters’ research departments. Please see additional important information and qualifications at the end of this Term Sheet. |
T-75
| MSBAM 2013-C12 | Point at Las Colinas |
The following table presents certain information relating to the lease rollover at the Points at Las Colinas Property:
Lease Rollover Schedule(1)(2) | |||||||||
| Year | # of Leases Rolling | SF Rolling | Average Underwritten Base Rent PSF Rolling(3) | Approx. % of Total SF Rolling | Approx. Cumulative % of SF Rolling | Total Underwritten Base Rent Rolling | Approx. % of Total Base Rent Rolling | Approx. Cumulative % of Total Base Rent Rolling | |
| MTM | 0 | 0 | $0.00 | 0% | 0% | $0 | 0% | 0% | |
| 2013 | 1 | 1,459 | $21.00 | 0% | 0% | $30,639 | 0% | 0% | |
| 2014 | 2 | 25,888 | $21.12 | 6% | 7% | $546,656 | 7% | 7% | |
| 2015 | 8 | 117,566 | $20.43 | 29% | 36% | $2,402,086 | 30% | 37% | |
| 2016 | 1 | 2,982 | $19.93 | 1% | 37% | $59,440 | 1% | 38% | |
| 2017 | 3 | 29,512 | $20.54 | 7% | 44% | $606,332 | 8% | 45% | |
| 2018 | 1 | 3,309 | $21.00 | 1% | 45% | $69,489 | 1% | 46% | |
| 2019 | 0 | 0 | $0.00 | 0% | 45% | $0 | 0% | 46% | |
| 2020 | 0 | 0 | $0.00 | 0% | 45% | $0 | 0% | 46% | |
| 2021 | 0 | 0 | $0.00 | 0% | 45% | $0 | 0% | 46% | |
| 2022 | 0 | 0 | $0.00 | 0% | 45% | $0 | 0% | 46% | |
| 2023 | 0 | 0 | $0.00 | 0% | 45% | $0 | 0% | 46% | |
| 2024 | 0 | 0 | $0.00 | 0% | 45% | $0 | 0% | 46% | |
| 2025 | 11 | 211,121 | $20.69 | 53% | 98% | $4,367,445 | 54% | 100% | |
| 2026 & Beyond | 0 | 0 | $0.00 | 0% | 98% | $0 | 0% | 100% | |
| Vacant | 0 | 6,934 | $0.00 | 2% | 100% | $0 | 0% | 100% | |
| Total/Wtd. Avg. | 27 | 398,771 | $20.63 | 100% | $8,081,987 | 100% | |||
| (1) | The information in the lease rollover schedule is based on the underwritten rent roll. |
| (2) | Certain tenants may have lease termination options that are exercisable prior to the originally stated expiration date of the related lease and that are not considered in the lease rollover schedule. |
| (3) | Average Underwritten Base Rent PSF Rolling excludes vacant space. |
The Market. The Point at Las Colinas Property is located within the Las Colinas Development master planned community in the northwest portion of Dallas County between Dallas and Fort Worth. The area is within the Las Colinas/DFW Airport submarket of Dallas, with approximately 28 million SF of office space. As of March 31, 2013, overall submarket vacancy was 18.3% and overall weighted average rents were $20.75 PSF. As of June 30, 2013, the submarket direct vacancy rate was 16.3%, down 4.7% from the same period a year earlier. For the first half of 2013, approximately 1.3 million SF was leased in the submarket. The 10 direct comparable buildings, totaling approximately 3.8 million SF were approximately 87% leased with asking rental rates between $22.45 PSF and $23.30 PSF. The following table presents the comparable office property subset.
| Competitive Property Summary | |||||||
| Property and Address | Year Built (Renovated) | RBS (SF) | % Leased | Ask Rate/SF Low | Ask Rate/SF High | Expenses | |
| Urban Towers, 222 West Las Colinas Boulevard | 1982 (2007) | 844,113 | 90.00% | $26.50 | $26.50 | Plus Electric | |
| The Summitt in Las Colinas, 545 East John Carpenter Freeway | 1984 | 375,706 | 90.00% | $23.00 | $24.00 | Plus Electric | |
| Tower 909, 909 Lake Carolyn Parkway | 1988 (2007) | 364,336 | 84.00% | $27.50 | $27.50 | Plus Electric | |
| Las Colinas Towers I, 201 East John Carpenter Freeway | 1979 (2007) | 134,592 | 85.00% | $19.50 | $21.50 | Plus Electric | |
| Las Colinas Towers II, 225 East John Carpenter Freeway | 1979 (2007) | 393,725 | 86.00% | $19.50 | $21.50 | Plus Electric | |
| Canal Centre, 400 East Las Colinas Boulevard | 1983 (2008) | 237,219 | 64.00% | $19.50 | $22.00 | Plus Electric | |
| Waterway Tower, 433 East Las Colinas Boulevard | 1982 (2012) | 223,120 | 83.00% | $22.00 | $23.00 | Plus Electric | |
| 220 East Las Colinas Boulevard, 220 East Las Colinas Boulevard | 1982 | 325,219 | 93.50% | $21.00 | $21.00 | Plus Electric | |
| 600 East Las Colinas Boulevard, 600 East Las Colinas Boulevard | 1982 | 510,841 | 82.60% | $24.00 | $24.00 | Plus Electric | |
Source: Appraisal
| This is not a research report and was not prepared by the Underwriters’ research departments. Please see additional important information and qualifications at the end of this Term Sheet. |
T-76
| MSBAM 2013-C12 | Point at Las Colinas |
Operating History and Underwritten Net Cash Flow. The following table presents certain information relating to the historical operating performance and the Underwritten Net Cash Flow at the Point at Las Colinas Property:
| Cash Flow Analysis | ||||||||||||
| 2010 | 2011 | 2012 | 6/30/2013 TTM | UW | UW PSF | |||||||
Base Rent(1) | $6,684,911 | $7,207,175 | $7,364,099 | $7,194,928 | $8,220,012 | $20.61 | ||||||
| Other Income | $89,164 | $126,629 | $105,000 | $151,024 | $165,000 | $0.41 | ||||||
| Total Recoveries | $661,202 | $660,883 | $866,135 | $1,050,669 | $1,050,669 | $2.63 | ||||||
Discounts/ Concessions(2) | ($262,586) | ($568,758) | ($9,774) | ($1,793,905) | $0 | $0 | ||||||
| Less Vacancy & Credit Loss | $0 | $0 | $0 | $0 | ($1,390,602) | ($3.49) | ||||||
| Effective Gross Income | $7,172,691 | $7,425,929 | $8,325,459 | $6,602,716 | $8,045,079 | $20.17 | ||||||
| Total Expenses | $2,885,443 | $3,174,779 | $3,236,610 | $3,559,246 | $3,973,480 | $9.96 | ||||||
| Net Operating Income | $4,287,248 | $4,251,150 | $5,088,849 | $3,043,470 | $4,071,599 | $10.21 | ||||||
| TI/LC | $0 | $0 | $0 | $0 | $913,186 | $2.29 | ||||||
| Capital Expenditures | $0 | $0 | $0 | $0 | $79,750 | $0.20 | ||||||
Upfront TI/LC Escrow Offset(3) | $0 | $0 | $0 | $0 | ($913,186) | ($2.29) | ||||||
| Net Cash Flow | $4,287,248 | $4,251,150 | $5,088,849 | $3,043,470 | $3,991,849 | $10.01 | ||||||
Occupancy %(4) | 91.0% | 93.5% | 91.1% | 98.1% | 85.0% | |||||||
| NOI DSCR | 2.08x | 2.06x | 2.47x | 1.47x | 1.97x | |||||||
| NCF DSCR | 2.08x | 2.06x | 2.47x | 1.47x | 1.93x | |||||||
| NOI Debt Yield | 9.9% | 9.8% | 11.7% | 7.0% | 9.4% | |||||||
| NCF Debt Yield | 9.9% | 9.8% | 11.7% | 7.0% | 9.2% | |||||||
| (1) | Historical Base Rent includes actual property vacancy. |
| (2) | Discounts/ Concessions reflect rent abatements. The TTM (6/30/2013) abatement reflects fee rent associated with the Lehigh Hanson, Inc. renewal effective 1/1/2013. $653,922 was collected at loan closing to fund all remaining fee rent for the Lehigh Hanson, Biltmore and SEI of America Corp. tenants. |
| (3) | The lender collected a $5,000,000 upfront TI/LC escrow for future re-tenanting costs. This upfront escrow is utilized as an offset to underwritten TI/LCs over the five year loan term, constrained to the underwritten TI/LC expense of $913,186. |
| (4) | Occupancy % numbers are as of each respective year end, except the TTM (6/30/2013) period, which reflects a rent roll dated 5/14/2013. The underwritten occupancy is 85.0%. |
Escrows and Reserves. The Point at Las Colinas Borrower deposited $665,180 in escrow for annual real estate taxes at loan origination and is required to escrow 1/12th of the annual estimated tax payments monthly. The Point at Las Colinas Borrower is required to escrow 1/12th of the annual estimated insurance premiums monthly (unless the Point at Las Colinas Borrower maintains insurance under an acceptable blanket insurance policy). The Point at Las Colinas Borrower deposited $310,000 in escrow at loan origination for replacement of an emergency generator at the Point at Las Colinas Property and is required to make monthly deposits of $6,646 for replacement reserves. The Point at Las Colinas Borrower deposited in escrow at loan origination (x) $3,370,543 for tenant improvement costs and leasing commissions outstanding as of closing and set forth on a schedule attached to the loan agreement and (y) $5,000,000 for tenant improvements and leasing commissions that may be incurred following closing (including reasonable and market costs of the Point at Las Colinas Borrower in preparing or building out vacant space prior to any lease being executed for such space where the Point at Las Colinas Borrower reasonably believes such work will attract an acceptable tenant, but in no event more than 22,000 rentable square feet at any one time of such vacant space and not more than $30 per rentable SF (such costs referred to in this parenthetical, “Prebuild Costs”) (all such costs referred to in clause (y), “Future TI/LCs”). The Point at Las Colinas Borrower deposited $653,922 in escrow at loan origination for future rent credits or abatements under existing leases, which amount is disbursed monthly to the lockbox account pursuant to a schedule attached to the loan agreement. $634,049 of this escrow is associated with the outstanding rent abatement due to Lehigh Hanson, Inc., pursuant to its most recent lease extension.
With respect to requests for disbursements for Future TI/LCs (other than Prebuild Costs), such requests shall not exceed (i) with respect to tenant improvements (a) relating to a new lease (or expansion space demised pursuant to an existing lease or an amendment thereto), $35 per rentable SF, (b) relating to a renewal lease of less than ten years, $15 per rentable SF, (c) relating to a renewal lease of ten years or more, $30 per rentable SF, and (d) relating to any expansion or renewal of that certain office lease agreement, dated June 27, 2005, as amended, with General Electric Capital Corporation, $40 per rentable SF and (ii) with respect to leasing commissions, market leasing commissions for class A office buildings in the Dallas, Texas area. Notwithstanding the foregoing, the loan agreement permits the Point at Las Colinas Borrower to receive disbursements from the escrow referred to in clause (y) of the preceding paragraph on a lease by lease basis in an amount equal to the positive difference between the applicable tenant improvement allowance (excluding the amount allocable to leasing commissions) expressly granted to the tenant and the actual tenant improvement costs; provided (x) such amount disbursed may not exceed the applicable maximum amount referred to in the preceding sentence minus the aggregate actual tenant improvement costs and leasing commissions previously disbursed to the Point at Las Colinas Borrower with respect to such lease and (y) the Point at Las Colinas Borrower has delivered an estoppel acceptable to lender from the tenant certifying the lease is in full force and effect and neither the Point at Las Colinas Borrower nor the tenant is in default, all work required under the lease has been completed in a satisfactory manner and all tenant allowances required to be paid have been paid in full and the tenant claims no offset rights or rent credits with respect to such work, all conditions to the occupancy of such space and the payment of rent have been satisfied, and the tenant is in actual occupancy of and open for business in the space.
Lockbox and Cash Management. A hard lockbox is in place with respect to the Point at Las Colinas Mortgage Loan. The Point at Las Colinas Mortgage Loan has in place cash management. Funds in the lockbox account are applied on each monthly payment date to pay debt service on the Point at Las Colinas Mortgage Loan, to fund the required reserves deposits as described above under “—Escrows and Reserves,” and to remit the excess as follows and in the following priority provided an event of default on the Point at Las Colinas Mortgage Loan has not occurred: (i) to disburse to the Point at Las Colinas Borrower the amount of monthly operating expenses not otherwise paid or reserved for and referenced in an annual budget
| This is not a research report and was not prepared by the Underwriters’ research departments. Please see additional important information and qualifications at the end of this Term Sheet. |
T-77
| MSBAM 2013-C12 | Point at Las Colinas |
approved by lender together with other amounts incurred by the Point at Las Colinas Borrower in connection with the operation and maintenance of The Point at Las Colinas Property approved by lender; (ii) to pay regularly scheduled monthly debt service on the Point at Las Colinas Mezzanine Loan (as defined below); (iii) if a Cash Sweep Period exists, to remit the remainder to an account to be held by the mortgagee as additional security for The Point at Las Colinas Mortgage Loan; (iv) if a Cash Sweep Period does not exist, but a Mezzanine Cash Sweep Period does exist, to remit the remainder to an account to be held as additional security for the Point at Las Colinas Mezzanine Loan; and (v) if no Cash Sweep Period or Mezzanine Cash Sweep Period exists, to disburse any excess to The Point at Las Colinas Borrower.
A “Cash Sweep Period” will commence upon (a) the occurrence of an event of default or (b) Lehigh (as successor in interest to Hanson Pipe and Products, Inc., as tenant under that certain office lease agreement dated January 4, 2006, as amended) (i) becomes the subject of a proceeding under any bankruptcy or insolvency law, or (ii) vacates or abandons the demised premises under its lease or otherwise terminates its lease or (iii) fails to exercise its renewal option under its lease or extend its lease at least twelve months prior to the expiration of the lease’s then current term, and continue until either (1) the event of default is cured or (2) (x) with regards to the event referenced in clause (b) (i), Lehigh and the Point at Las Colinas Borrower deliver an estoppel certificate reasonably acceptable to lender certifying Lehigh has affirmed its lease in such bankruptcy proceeding (and attaching a copy of the court order reflecting such affirmation), the lease is in full force and effect and neither Lehigh nor the Point at Las Colinas Borrower is in default thereunder, Lehigh is in occupancy of the demised premises, is operating its business therein and is paying full unabated rent in accordance with its lease without any offset rights or rent credits or abatements or (y) with regards to the event referenced in clause (b) (i) where Lehigh does not affirm its lease or with regard to the events referenced in clause (b) (ii) or (b) (iii), the entire demised premises under such lease has been re-let or renewed or extended, as applicable, to a tenant acceptable to lender in its sole discretion pursuant to a lease acceptable to lender in is sole discretion, as evidenced by estoppels acceptable to lender in its sole discretion from such replacement tenant and the Point at Las Colinas Borrower.
A “Mezzanine Cash Sweep Period” will commence upon (a) the occurrence of an event of default under the Point at Las Colinas Mezzanine Loan or (b) the debt service coverage ratio (as defined in the loan agreement for the Point at Las Colinas Mezzanine Loan) being less than 1.05x for six consecutive calendar months and continue until either (1) the event of default is cured or (2) the debt service coverage ratio (as defined in the loan agreement for the Point at Las Colinas Mezzanine Loan) is equal to or greater than 1.05x for two consecutive calendar quarters.
Property Management: The Point at Las Colinas Property is managed by FPG Texas Management, LP, an affiliate of the Point at Las Colinas Borrower.
Mezzanine Loan and Preferred Equity. The “Point at Las Colinas Mezzanine Loan” refers to a loan in the principal amount of $9,187,000 made by Annaly CRE Holdings LLC to FPG The Point Mezz, LLC secured by 100% of the direct or indirect equity interest in the Point at Las Colinas Borrower and put in place simultaneously with the origination of the Point at Las Colinas Mortgage Loan.
Additional Secured Indebtedness (not including trade debts). Not permitted.
Release of Property. Not permitted.
Terrorism Insurance. Generally, the Point at Las Colinas Borrower is required to obtain insurance against acts of terrorism or other similar acts or events (or “fire following”) to the extent such policy is available in an amount determined by lender (but not more than 100% of replacement costs and twelve months of business interruption insurance).
Expansion, Release and Substitution of Property. Not permitted.
| This is not a research report and was not prepared by the Underwriters’ research departments. Please see additional important information and qualifications at the end of this Term Sheet. |
T-78
(THIS PAGE INTENTIONALLY LEFT BLANK)
| This is not a research report and was not prepared by the Underwriters’ research departments. Please see additional important information and qualifications at the end of this Term Sheet. |
T-79
| MSBAM 2013-C12 | Westland Retail Portfolio |
Mortgage Loan No. 7 – Westland Retail Portfolio
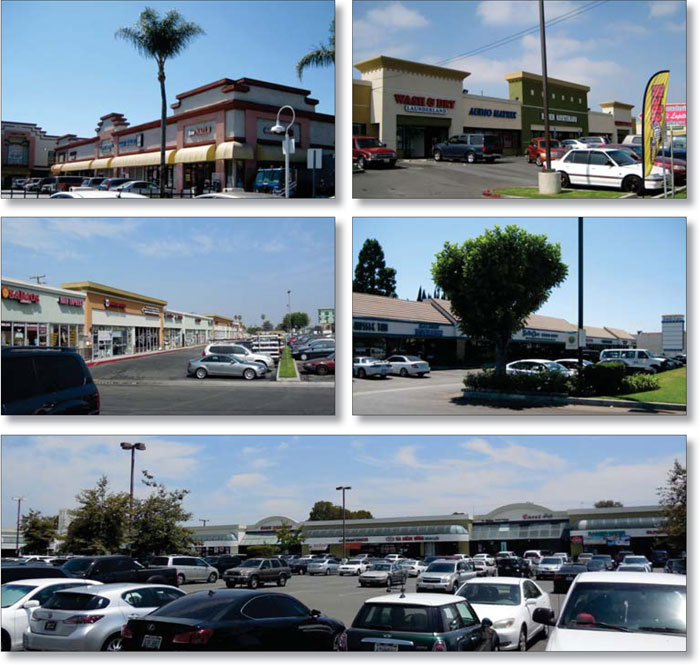
| This is not a research report and was not prepared by the Underwriters’ research departments. Please see additional important information and qualifications at the end of this Term Sheet. |
T-80
| MSBAM 2013-C12 | Westland Retail Portfolio |
Mortgage Loan No. 7 – Westland Retail Portfolio
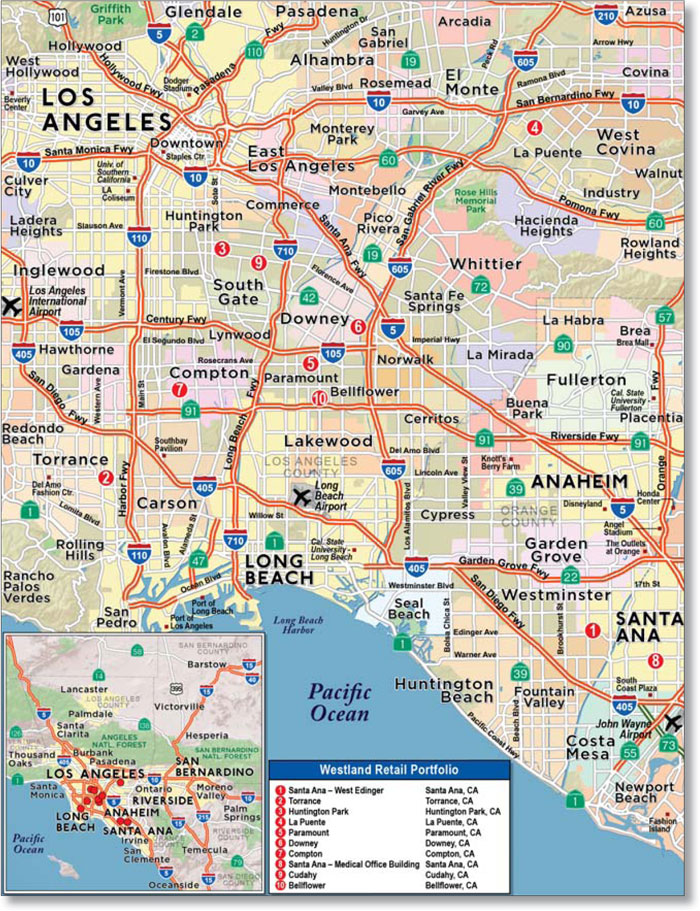
| This is not a research report and was not prepared by the Underwriters’ research departments. Please see additional important information and qualifications at the end of this Term Sheet. |
T-81
| MSBAM 2013-C12 | Westland Retail Portfolio |
| Mortgage Loan No. 7 – Westland Retail Portfolio |
| Mortgage Loan Information | Mortgaged Property Information | ||||||
| Mortgage Loan Seller: | CIBC | Single Asset/Portfolio: | Portfolio | ||||
Credit Assessment: (Fitch/KBRA/Moody’s) | NR/NR/NR | Property Address: | Various | ||||
| Original Balance: | $40,422,600 | General Property Type(2): | Various | ||||
| Cut-off Date Balance: | $40,357,805 | Detailed Property Type(2): | Various | ||||
| % of Initial Pool Balance: | 3.2% | Net Rentable Area: | 300,124 SF | ||||
| Loan Purpose: | Refinance | Cut-off Date Balance Per Unit/SF: | $134 | ||||
| Borrower Name(s): | Amusement Industry C-VII LLC, Alevy Family Trust C-V LLC | Balloon/ARD Balance Per Unit/SF: | $102 | ||||
| Sponsor: | Allen Alevy | Year Built/Year Renovated(2): | Various/Various | ||||
| Mortgage Rate: | 5.310% | Title Vesting: | Fee | ||||
| Note Date: | 8/30/2013 | Property Manager: | Amusement Industry, Inc. | ||||
| First Payment Date: | 10/1/2013 | ||||||
| Anticipated Repayment Date: | NAP | Underwriting and Financial Information | |||||
| Maturity Date: | 9/1/2023 | UW Revenues: | $6,725,167 | ||||
| IO Period: | None | UW Expenses: | $2,281,803 | ||||
| Original Term to Maturity or ARD: | 120 months | UW NOI: | $4,443,365 | ||||
| Seasoning: | 1 month | UW NCF: | $4,145,275 | ||||
| Original Amortization Term: | 300 months | UW NOI DSCR: | 1.52x | ||||
| Loan Amortization Type: | Amortizing | UW NCF DSCR: | 1.42x | ||||
| Interest Accrual Basis: | Actual/360 | UW NOI Debt Yield: | 11.0% | ||||
| Prepayment Provisions: | LO (25); DEF (91); O (4) | UW NCF Debt Yield: | 10.3% | ||||
| Lockbox/Cash Management: | Soft/Springing | UW NCF Debt Yield at Maturity: | 13.5% | ||||
Pari Passu Mortgage Debt: | None | Most Recent NOI (As of): | $4,823,969 (12/31/2012) | ||||
| Subordinate Mortgage Debt: | None | Second Most Recent NOI (As of): | $4,857,537 (12/31/2011) | ||||
| Mezzanine Debt: | None | Third Most Recent NOI (As of): | $4,915,222 (12/31/2010) | ||||
Reserves(1) | Appraised Value: | $73,200,000 | |||||
| Type | Initial | Monthly | Cap | Appraisal As-of Date: | 7/12/2013 | ||
| RE Tax: | $294,052 | $36,757 | NAP | Cut-off Date LTV Ratio: | 55.1% | ||
| Insurance: | $25,759 | $8,586 | NAP | LTV Ratio at Maturity/ARD: | 41.9% | ||
| Recurring Replacements: | $0 | $5,205 | $124,910 | Occupancy Rate: | 89.2% (7/30/2013) | ||
| TI/LC: | $300,000 | $19,636 | $353,453 | 2nd Most Recent Occupancy: | 91.8% (12/31/2012) | ||
| Deferred Maintenance: | $19,750 | $0 | NAP | 3rd Most Recent Occupancy: | 90.7% (12/31/2011) | ||
4th Most Recent Occupancy: | 90.0% (12/31/2010) | ||||||
| (1) | See “—Escrows and Reserves” below for further discussion of reserve requirements. |
| (2) | See table below. |
The Westland Retail Portfolio Mortgage Loan
The Mortgage Loan. The seventh largest mortgage loan (the “Westland Retail Portfolio Mortgage Loan”) is evidenced by a promissory note in the original principal amount of $40,422,600, secured by a first priority fee mortgage encumbering 1 office and 9 retail properties collectively known as the Westland Retail Portfolio, in the Greater Los Angeles, California area (the “Westland Retail Portfolio Property”). The proceeds of the Westland Retail Portfolio Mortgage Loan were used to pay off existing debt of $22 million and return approximately $18 million of equity to the sponsor after closing costs.
The Westland Retail Portfolio Mortgage Loan had an initial term of 120 months and has a remaining term of 119 months, with a maturity date of September 1, 2023. The Westland Retail Portfolio Mortgage Loan requires payments of principal and interest for its entire term. Defeasance with non-callable obligations of the United States of America (or other non-callable government securities or other non-callable instruments that will not cause the trust to lose its REMIC status and which, in each case, will not result in a downgrade or withdrawal of the ratings for the MSBAM Series 2013-C12 Certificates) is permitted at any time on or after the first due date following the second anniversary of the securitization closing date. The Westland Retail Portfolio Mortgage Loan is open to prepayment in full (without prepayment consideration) during the final three months of the loan term.
The Borrower and the Sponsor. The borrowers are Amusement Industry C-VII LLC and Alevy Family Trust C-V LLC, two single-purpose Delaware limited liability companies with one independent director each (the “Westland Retail Portfolio Borrowers”). The Westland Retail Portfolio Borrowers are controlled by Allen Alevy (the “Westland Retail Portfolio Loan Sponsor”) and Yaakov Greenspan, Mr. Alevy’s grandson, and are indirectly owned by
| This is not a research report and was not prepared by the Underwriters’ research departments. Please see additional important information and qualifications at the end of this Term Sheet. |
T-82
| MSBAM 2013-C12 | Westland Retail Portfolio |
trusts of which Mr. Alevy and Mr. Greenspan are trustees. Mr. Greenspan controls six of the properties through Amusement Industry C-VII LLC while Mr. Alevy controls four through Alevy Family Trust C-V LLC. Through his subsidiaries, Mr. Alevy currently has an ownership interest in a diverse portfolio of 97 commercial properties including 40 neighborhood/community shopping centers, 45 multifamily apartments, and 12 mobile home communities. In addition to his extensive real estate portfolio, Mr. Alevy has ownership interests in companies across several industries including banking, finance, construction, and retail. He has also built and operated amusement parks and is one of the original founders of Circus Circus Casino in Las Vegas.
The Mortgaged Property. The Westland Retail Portfolio Property consists of one office and nine retail properties totaling 300,124 SF all in the Greater Los Angeles, California area. All ten properties are unanchored with one property in Santa Ana, California having a medical office component. As of July 30, 2013, the portfolio was 89.2% leased at an average NNN rent of $17.29 per square foot. The Westland Retail Portfolio Loan Sponsor and his affiliates purchased the properties separately over a 5-year period from 1994-1999.
The following table sets forth further information regarding the Westland Retail Portfolio Property:
| Property Summary | |||||||||
| Property | Location | Allocated Cut-off Date Loan Amount | Title Vesting | % of Allocated Loan Amount | Appraised Value | Year Built/ Renovated | Percent Leased | Net Rentable Area (SF) | |
| Santa Ana - West Edinger | Santa Ana, CA | $10,782,688 | Fee | 27% | $19,200,000 | 1952/2010 | 100.0% | 79,389 | |
| Torrance | Torrance, CA | $5,241,585 | Fee | 13% | $7,900,000 | 1957/2011 | 89.9% | 33,300 | |
| Huntington Park | Huntington Park, CA | $5,037,013 | Fee | 12% | $7,600,000 | 1989/2008 | 100.0% | 15,045 | |
| La Puente | La Puente, CA | $4,333,542 | Fee | 11% | $7,000,000 | 1958/2011 | 91.2% | 28,656 | |
| Downey | Downey, CA | $3,347,905 | Fee | 8% | $5,300,000 | 1984/NAP | 93.9% | 19,119 | |
| Paramount | Paramount, CA | $3,417,114 | Fee | 8% | $6,300,000 | 1980/2012 | 96.2% | 26,591 | |
| Compton | Compton, CA | $2,460,470 | Fee | 6% | $4,300,000 | 1956/2012 | 85.7% | 21,923 | |
Santa Ana - Medical Office Building | Santa Ana, CA | $2,323,500 | Fee | 6% | $5,000,000 | 1973/2010 | 74.2% | 27,674 | |
| Cudahy | Cudahy, CA | $1,833,476 | Fee | 5% | $4,600,000 | 1987/2010 | 80.4% | 19,216 | |
| Bellflower | Bellflower, CA | $1,580,512 | Fee | 4% | $6,000,000 | 1989/NAP | 65.1% | 29,211 | |
| Total/Wtd. Avg. | $40,357,805 | 100% | $73,200,000 | 89.2% | 300,124 | ||||
Major Collateral Tenants.
The Westland Retail Portfolio Property benefits from an occupancy history that has ranged from approximately 89.2% to 91.8% over the past three years and a well-established tenant base. The tenant base primarily consists of long term local retailers and service providers who have been in occupancy for an average of 9 years. Furthermore, the Westland Retail Portfolio Property has a diversified rent roll comprised of over 150 tenants with no single tenant accounting for more than 7% of the NRA, reducing the risk that any one tenant’s departure will have a significant impact on the Westland Retail Portfolio Property in any given year.
The following table presents a summary regarding major tenants at the Westland Retail Portfolio Property:
| Tenant Summary | ||||||||
| Tenant Name | Credit Rating (Fitch/Moody’s/S&P) | Tenant NRSF(1) | Approximate % of NRSF | Annualized Underwritten Base Rent | % of Total Annualized UW Rent(2) | Total Annual Underwritten Base Rent (PSF) | Lease Expiration | |
| Mom’s Market | NR/NR/NR | 20,500 | 6.8% | $133,088 | 2.6% | $6.49 | 5/31/2025 | |
| Emerald Bay Restaurant | NR/NR/NR | 7,940 | 2.6% | $130,144 | 2.5% | $16.39 | 1/31/2015 | |
| Hot N Juicy Craw Fish | NR/NR/NR | 5,846 | 1.9% | $105,228 | 2.0% | $18.00 | 6/30/2017 | |
| SmileCare Dental | NR/NR/NR | 5,445 | 1.8% | $106,069 | 2.0% | $19.48 | 12/31/2013 | |
| Torrance Discount Store | NR/NR/NR | 5,424 | 1.8% | $120,404 | 2.3% | $22.20 | MTM | |
| Other Tenants | 222,694 | 74.2% | $4,592,994 | 88.5% | $20.62 | |||
| Vacant Space | 32,275 | 10.8% | $0 | 0% | $0.00 | |||
| Total/Wtd. Avg. | 300,124 | 100% | $5,187,926 | 100% | $19.37 | |||
| (1) | Information is based on the underwritten rent roll. |
| (2) | Total Annualized Underwritten Base Rent (PSF) excludes vacant space. |
| This is not a research report and was not prepared by the Underwriters’ research departments. Please see additional important information and qualifications at the end of this Term Sheet. |
T-83
| MSBAM 2013-C12 | Westland Retail Portfolio |
The following table presents certain information relating to the lease rollover at the Westland Retail Portfolio Property:
Lease Rollover Schedule(1)(2) | |||||||||
| Year | # of Leases Rolling | SF Rolling | Average Underwritten Base Rent PSF Rolling(2) | Approx. % of Total SF Rolling | Approx. Cumulative % of SF Rolling | Total Underwritten Base Rent Rolling | Approx. % of Total Base Rent Rolling | Approx. Cumulative % of Total Base Rent Rolling | |
| MTM | 34 | 51,456 | $21.33 | 17% | 17% | $1,097,512 | 21% | 21% | |
| 2013 | 13 | 25,141 | $21.09 | 8% | 26% | $530,197 | 10% | 31% | |
| 2014 | 26 | 28,083 | $20.55 | 9% | 35% | $577,035 | 11% | 42% | |
| 2015 | 20 | 37,101 | $18.68 | 12% | 47% | $693,134 | 13% | 56% | |
| 2016 | 25 | 37,403 | $21.54 | 12% | 60% | $805,582 | 16% | 71% | |
| 2017 | 15 | 26,420 | $19.01 | 9% | 69% | $502,141 | 10% | 81% | |
| 2018 | 13 | 19,575 | $20.23 | 7% | 75% | $396,011 | 8% | 89% | |
| 2019 | 1 | 1,279 | $19.86 | 0% | 75% | $25,397 | 0% | 89% | |
| 2020 | 2 | 1,163 | $25.93 | 0% | 76% | $30,159 | 1% | 90% | |
| 2021 | 0 | 0 | $0.00 | 0% | 76% | $0 | 0% | 90% | |
| 2022 | 0 | 0 | $0.00 | 0% | 76% | $0 | 0% | 90% | |
| 2023 & Beyond | 10 | 40,228 | $13.19 | 13% | 89% | $530,758 | 10% | 100% | |
| Vacant | 0 | 32,275 | $0.00 | 11% | 100% | $0 | 0% | ||
| Total/Wtd. Avg. | 159 | 300,124 | $19.37 | 100.0% | $5,187,926 | 100.0% | |||
| (1) | The information in the lease rollover schedule is based on the underwritten rent roll. |
| (2) | Certain tenants may have lease termination options that are exercisable prior to the originally stated expiration date of the subject lease and that are not considered in the lease rollover schedule. |
| (3) | Average Underwritten Base Rent PSF Rolling excludes vacant space. |
The Market. The Westland Retail Portfolio Property consists of ten properties in the Greater Los Angeles, California area. Certain market information is contained in the table below.
| Market Summary | ||||||
| Property | Location | Property Occupancy | Submarket Occupancy | Competitive Set Asking/Actual Rents (NNN) | Submarket Average Asking Rents (NNN) | |
| Santa Ana - West Edinger | Santa Ana, CA | 100.0% | 92.3% | $12.96/SF - $32.40/SF | $26.97/SF | |
| Torrance | Torrance, CA | 89.9% | 94.9% | $12.00/SF - $32.40/SF | $28.83/SF | |
| Huntington Park | Huntington Park, CA | 100.0% | 95.0% | $18.00/SF - $42.00/SF | $27.16/SF | |
| La Puente | La Puente, CA | 91.2% | 91.5% | $12.00/SF - $24.00/SF | $25.03/SF | |
| Downey | Downey, CA | 93.9% | 93.6% | $15.00/SF - $37.80/SF | $25.66/SF | |
| Paramount | Paramount, CA | 96.2% | 93.6% | $13.20/SF - $33.00/SF | $25.66/SF | |
| Compton | Compton, CA | 85.7% | 95.0% | $15.00/SF - $33.00/SF | $27.16/SF | |
| Santa Ana - Medical Office Building | Santa Ana, CA | 74.2% | 92.3% | $15.00/SF - $24.00/SF | $26.97/SF | |
| Cudahy | Cudahy, CA | 80.4% | 95.0% | $12.00/SF - $33.00/SF | $27.16/SF | |
| Bellflower | Bellflower, CA | 65.1% | 93.6% | $13.20/SF - $33.00/SF | $25.66/SF | |
Source: Appraisal
| This is not a research report and was not prepared by the Underwriters’ research departments. Please see additional important information and qualifications at the end of this Term Sheet. |
T-84
| MSBAM 2013-C12 | Westland Retail Portfolio |
Operating History and Underwritten Net Cash Flow. The following table presents certain information relating to the historical operating performance and the Underwritten Net Cash Flow at the Westland Retail Portfolio Property:
| Cash Flow Analysis | |||||||||||
| 2010 | 2011 | 2012 | UW | UW PSF | |||||||
Base Rent(1) | $5,063,127 | $5,041,481 | $5,076,372 | $5,187,926 | $17.29 | ||||||
| Vacant Income | $0 | $0 | $0 | $425,256 | $1.42 | ||||||
| Other Income | ($550) | ($4,857) | $970 | $0 | $0.00 | ||||||
| Total Recoveries | $1,200,683 | $1,154,605 | $1,181,728 | $1,823,359 | $6.08 | ||||||
| Less Vacancy & Credit Loss | $0 | $0 | $0 | ($711,374) | ($2.37) | ||||||
| Effective Gross Income | $6,263,260 | $6,191,230 | $6,259,070 | $6,725,167 | $22.41 | ||||||
| Total Operating Expenses | $1,348,038 | $1,333,693 | $1,435,101 | $2,281,803 | $7.60 | ||||||
| Net Operating Income | $4,915,222 | $4,857,537 | $4,823,969 | $4,443,365 | $14.81 | ||||||
| TI/LC | $0 | $0 | $0 | $235,635 | $0.79 | ||||||
| Capital Expenditures | $0 | $0 | $0 | $62,455 | $0.21 | ||||||
| Net Cash Flow | $4,915,222 | $4,857,537 | $4,823,969 | $4,145,275 | $13.81 | ||||||
| Occupancy % | 90.0% | 90.7% | 91.8% | 89.2% | |||||||
| NOI DSCR | 1.68x | 1.66x | 1.65x | 1.52x | |||||||
| NCF DSCR | 1.68x | 1.66x | 1.65x | 1.42x | |||||||
| NOI Debt Yield | 12.2% | 12.0% | 12.0% | 11.0% | |||||||
| NCF Debt Yield | 12.2% | 12.0% | 12.0% | 10.3% | |||||||
| (1) | Historical Base Rent includes actual property vacancy. |
| (2) | Average Annual Rent PSF is based on historical financials and end of year occupancy rates. Vacant space is excluded from the calculation. |
Escrows and Reserves. The Westland Retail Portfolio Borrowers deposited at loan origination $294,052 for annual real estate taxes and are required to make deposits of $36,757 for real estate taxes monthly. The Westland Retail Portfolio Borrowers deposited at loan origination $25,759 for annual insurance premiums and are required to make deposits of $8,586 for insurance premiums monthly. The Westland Retail Portfolio Borrowers are required to make deposits of $5,205 for recurring repairs and replacements monthly, up to a cap of $124,910. The Westland Retail Portfolio Borrowers deposited at loan origination $300,000 for tenant improvements and leasing commissions and are required to make deposits of $19,636 for tenant improvements and leasing commissions monthly, up to a cap of $353,453. The Westland Retail Portfolio Borrowers deposited at loan origination $19,750 for deferred maintenance.
Lockbox and Cash Management. A soft lockbox is in place with respect to the Westland Retail Portfolio Mortgage Loan. The Westland Retail Portfolio Mortgage Loan has springing cash management. Provided a Cash Management Period has not commenced, funds in the lockbox account are swept daily to an account designated by the Westland Retail Portfolio Borrowers. During the continuance of a Cash Management Period, funds in the lockbox account are applied on each monthly payment date in accordance with terms of the related loan agreement.
A “Cash Management Period” will:
| (i) | commence upon the occurrence of an event of default and continue until the event of default is cured and no other event of default is then continuing, |
| (ii) | commence if, on the last date of a calendar quarter, the debt service coverage ratio is below 1.20x and continue until the debt service coverage ratio is at least 1.20x for two consecutive calendar quarters. |
Property Management. The Westland Retail Portfolio Property is managed by Amusement Industry, Inc., an affiliate of the Westland Retail Portfolio Loan Sponsor.
Mezzanine Loan and Preferred Equity. Not permitted.
Additional Secured Indebtedness (not including trade debts). Not permitted.
Release of Property. Not permitted.
Terrorism Insurance. Generally, the Westland Retail Portfolio Borrowers are required to maintain (or cause to be maintained) insurance against loss for acts of terrorism with respect to the Westland Retail Portfolio Property.
| This is not a research report and was not prepared by the Underwriters’ research departments. Please see additional important information and qualifications at the end of this Term Sheet. |
T-85
| MSBAM 2013-C12 | Rolling Valley Mall |
Mortgage Loan No. 8 – Rolling Valley Mall

| This is not a research report and was not prepared by the Underwriters’ research departments. Please see additional important information and qualifications at the end of this Term Sheet. |
T-86
| MSBAM 2013-C12 | Rolling Valley Mall |
Mortgage Loan No. 8 – Rolling Valley Mall
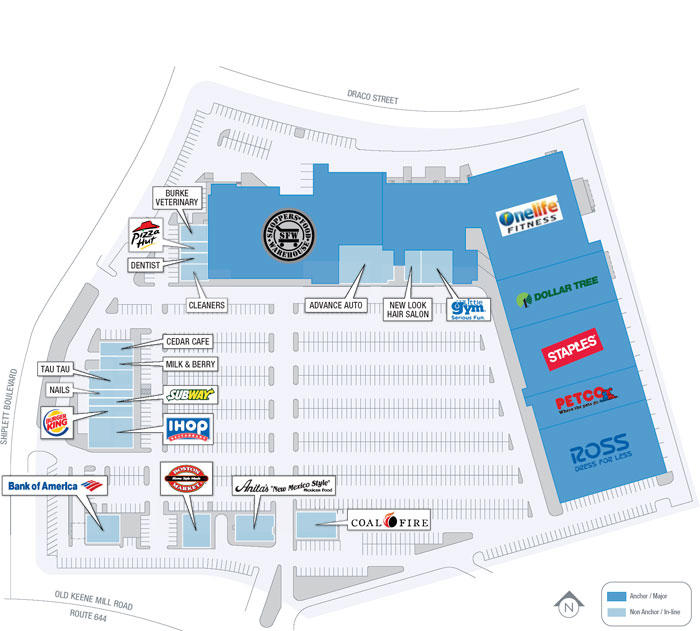
| This is not a research report and was not prepared by the Underwriters’ research departments. Please see additional important information and qualifications at the end of this Term Sheet. |
T-87
| MSBAM 2013-C12 | Rolling Valley Mall |
Mortgage Loan No. 8 – Rolling Valley Mall
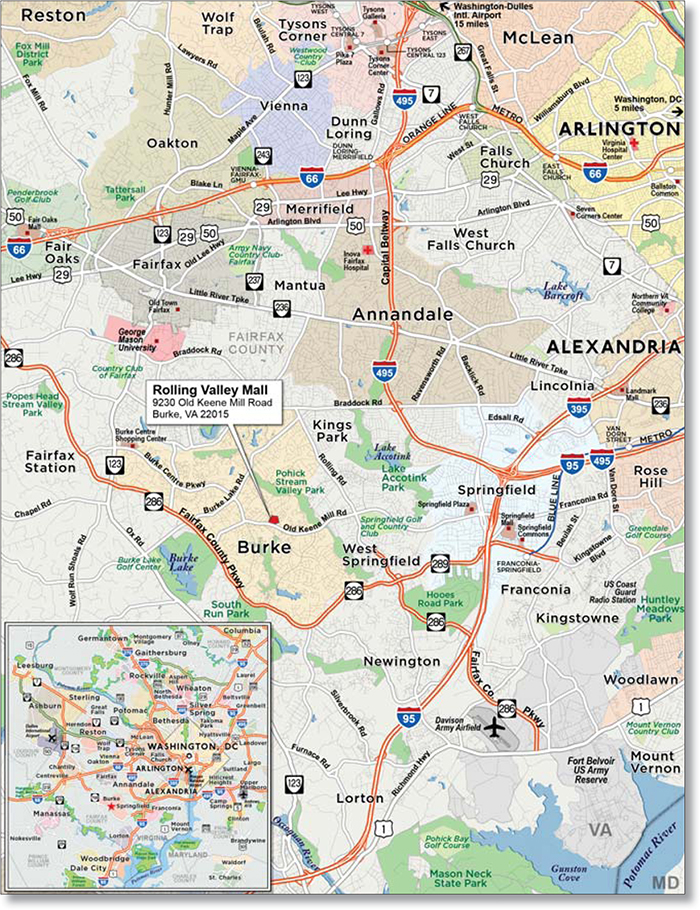
| This is not a research report and was not prepared by the Underwriters’ research departments. Please see additional important information and qualifications at the end of this Term Sheet. |
T-88
| MSBAM 2013-C12 | Rolling Valley Mall |
| Mortgage Loan No. 8 – Rolling Valley Mall |
| Mortgage Loan Information | Mortgaged Property Information | ||||||
| Mortgage Loan Seller: | MSMCH | Single Asset/Portfolio: | Single Asset | ||||
Credit Assessment: (Fitch/KBRA/Moody’s) | NR/NR/NR | Property Address: | 9230 Old Keene Mill Road Burke, VA 22015 | ||||
| Original Balance: | $40,200,000 | General Property Type: | Retail | ||||
| Cut-off Date Balance: | $40,200,000 | Detailed Property Type: | Anchored | ||||
| % of Initial Pool Balance: | 3.1 % | Net Rentable Area: | 237,214 SF | ||||
| Loan Purpose: | Refinance | Cut-off Date Balance Per Unit/SF: | $169 | ||||
| Borrower Name(s): | Rolling Valley Mall LLC | Balloon/ARD Balance Per Unit/SF: | $147 | ||||
| Sponsor: | Combined Properties, Incorporated | Year Built/Year Renovated: | 1974/1994 | ||||
| Mortgage Rate: | 5.140% | Title Vesting: | Fee | ||||
| Note Date: | 8/30/2013 | Property Manager: | Combined Properties, Incorporated | ||||
| First Payment Date: | 10/1/2013 | ||||||
| Anticipated Repayment Date: | NAP | Underwriting and Financial Information | |||||
| Maturity Date: | 9/1/2023 | UW Revenues: | $4,902,997 | ||||
| IO Period: | 24 months | UW Expenses: | $1,203,354 | ||||
| Original Term to Maturity or ARD: | 120 months | UW NOI: | $3,699,643 | ||||
| Seasoning: | 1 month | UW NCF: | $3,439,534 | ||||
| Original Amortization Term: | 360 months | UW NOI DSCR: | 1.41x | ||||
| Loan Amortization Type: | Partial IO | UW NCF DSCR: | 1.31x | ||||
| Interest Accrual Basis: | Actual/360 | UW NOI Debt Yield: | 9.2% | ||||
| Prepayment Provisions: | LO (25); DEF (91); O (4) | UW NCF Debt Yield: | 8.6% | ||||
| Lockbox/Cash Management: | Hard/Springing | UW NCF Debt Yield at Maturity: | 9.8% | ||||
Pari Passu Mortgage Debt: | None | Most Recent NOI (As of): | $2,901,854 (5/31/2013 TTM) | ||||
| Subordinate Mortgage Debt: | None | Second Most Recent NOI (As of): | $2,873,176 (12/31/2012) | ||||
| Mezzanine Debt: | None | Third Most Recent NOI (As of): | $2,830,245 (12/31/2011) | ||||
Reserves(1) | Appraised Value: | $55,500,000 | |||||
| Type | Initial | Monthly | Cap | Appraisal As-of Date: | 7/25/2013 | ||
| RE Tax: | $171,260 | $42,815 | NAP | Cut-off Date LTV Ratio: | 72.4% | ||
| Insurance: | $0 | Springing | NAP | LTV Ratio at Maturity/ARD: | 63.0% | ||
| Recurring Replacements: | $0 | Springing | NAP | Occupancy Rate: | 98.6% (8/29/2013) | ||
| TI/LC: | $0 | $10,572 | NAP | 2nd Most Recent Occupancy: | 94.2% (12/31/2012) | ||
| Deferred Maintenance: | $274,691 | $0 | NAP | 3rd Most Recent Occupancy: | 92.1% (12/31/2011) | ||
| Free Rent: | $293,761 | $0 | NAP | ||||
| Outstanding TI/LC Obligations: | $1,132,802 | $0 | NAP | ||||
| (1) | See “—Escrows and Reserves” below for further discussion of reserve requirements. |
The Rolling Valley Mall Mortgage Loan
The Mortgage Loan. The eighth largest mortgage loan (the “Rolling Valley Mall Mortgage Loan”) is evidenced by a note in the original principal amount of $40,200,000 and is secured by a first priority fee mortgage encumbering a portion of the outlet shopping center known as Rolling Valley Mall located in Burke, Virginia (the “Rolling Valley Mall Property”). The proceeds of the Rolling Valley Mall Mortgage Loan were used to refinance a previous loan of approximately $24,282,863, which was included in the GCCFC 2004-GG1 securitization.
The Rolling Valley Mall Mortgage Loan had an initial term of 120 months and has a remaining term of 119 months, with a maturity date of September 1, 2023. The Rolling Valley Mall Mortgage Loan requires payments of interest only for its initial two years and principal and interest thereafter. Defeasance with direct, non-callable obligations of the United States of America (or other non-callable government securities or other non-callable instruments that will not cause the trust to lose its REMIC status and, in each case, will not result in a downgrade or withdrawal of the ratings for the MSBAM Series 2013-C12 Certificates) is permitted at any time on or after the first due date following the second anniversary of the securitization closing date. The Rolling Valley Mall Mortgage Loan is open to prepayment in full (without prepayment consideration) during the final three months of the loan term.
The Borrower and the Sponsor. The borrower, Rolling Valley Mall LLC (the “Rolling Valley Mall Borrower”) is a single-purpose Delaware limited liability company with two independent directors. The Rolling Valley Mall Borrower is 100% indirectly owned by Ronald S. Haft, the founder and Chairman of Combined Properties, Incorporated (“Combined”). Combined currently manages 43 properties, including the Rolling Valley Mall, totaling approximately 5 million SF. Mr. Haft directly or indirectly owns 100% of 36 of the properties. Mr. Haft previously served as President of Dart Group
| This is not a research report and was not prepared by the Underwriters’ research departments. Please see additional important information and qualifications at the end of this Term Sheet. |
T-89
| MSBAM 2013-C12 | Rolling Valley Mall |
Corporation. Combined Holding Company LLC, an affiliate of Combined, is the recourse carve-out guarantor and, as of October 2012, reported a net worth of approximately $38 million.
The Mortgaged Property. The Rolling Valley Mall Property consists of a 237,214 SF single-story, grocery-anchored, community shopping center in six buildings that was constructed in 1974 and renovated in 1994. In 2012, a portion of the Rolling Valley Mall Property within the main “L” shaped building was redeveloped from an enclosed shopping area to a fitness club. Preparation for this redevelopment took several years and included moving two tenants, Advance Auto and D New Look hair salon, to new locations in the center and vacating five other tenants, including two temporary tenants. The interior space was then reconstructed and a new façade was placed over the redeveloped area. Prior to this redevelopment of the previously enclosed space, the center had approximately 194,130 SF of rentable space. The new fitness center tenant took occupancy of a portion of its space in October 2012 and the remainder in July 2013.
The Rolling Valley Mall Property, which is located in Fairfax County, Virginia, within the Washington D.C. CBSA, is anchored by a 49,284 SF Shoppers Food Warehouse and the newly constructed 61,345 SF OneLife Fitness club. Other major tenants include Staples, Ross, Petco, and a Dollar Tree store. There are 1,002 surface parking spaces for a ratio of approximately 4.22 spaces for 1,000 SF of GLA.
Anchor and Major Tenants.
OneLife Fitness (61,345 SF, 26% of NRA, 15% of underwritten base rent). Rolling Valley Fitness LLC leases 61,345 SF at the Rolling Valley Mall Property and operates the space as a OneLife Fitness health club (“OneLife”). The lease for the first phase (18,500 SF) began on October 11, 2012 and for the second phase (42,845 SF) on July 12, 2013, and has a current expiration date for the total leased space of July 31, 2023, with three 5-year lease renewal options. OneLife is a privately-held health club chain with nine locations in Virginia. Typical amenities include a OneLife Cinema, locker rooms, aquatics center, racquetball, volleyball, and basketball courts, resistance training, cardio equipment and group exercise classes.
Shoppers Food Warehouse (49,284 SF, 21% of NRA, 19% of underwritten base rent). Shoppers Food Warehouse Corp. leases 49,284 SF at the Rolling Valley Mall Property and operates the space as a Shoppers Food Warehouse grocery store. The lease began on November 1, 1983, was renewed on February 5, 2010, and has a current expiration date of May 31, 2026, with two 5-year lease renewal options. The lease has a guaranty from Jumbo Food Stores, Inc. Shoppers Food Warehouse Corp. is a wholly owned subsidiary of SUPERVALU Inc. (NYSE: SVU), which, as of June 15, 2013 operated or supplied approximately 1,900 independent stores, 1,332 SAVE-A-LOT stores, and 191 traditional retail grocery stores.
Ross Dress for Less (27,000 SF, 11% of NRA, 11% of underwritten base rent). Ross Dress for Less, Inc. leases 27,000 SF at the Rolling Valley Mall Property. The lease began on August 1, 1986, was most recently renewed on February 1, 2012, and has a current expiration date of January 31, 2017, with two remaining 5-year lease renewal options. The tenant is a subsidiary of Ross Stores, Inc. (NASDAQ: ROST), which, as of May 4, 2013, operated 1,112 stores in 33 states, the District of Columbia and Guam. The company also operates 115 dd’s DISCOUNTS in nine states.
The following table presents a summary regarding anchor and major tenants at the Rolling Valley Mall Property:
| Tenant Summary | ||||||||||
| Tenant Name | Credit Rating (Fitch/Moody’s/S&P)(1) | Tenant NRSF | Approximate % of NRSF | Annualized Underwritten Base Rent | % of Total Annualized UW Rent | Total Annual Underwritten Base Rent (PSF)(2) | Lease Expiration | 2012 Sales PSF | UW Occupancy Cost as a % of Sales | |
| Anchor/Major Tenants | ||||||||||
| OneLife Fitness | NR/NR/NR | 61,345 | 26% | $578,028 | 15% | $9.42 | 7/31/2023 | NAV | NAV | |
| Shoppers Food Warehouse | CCC+/Caa1/B+ | 49,284 | 21% | $739,260 | 19% | $15.00 | 5/31/2026 | NAV | NAV | |
| Ross Dress for Less | NR/NR/A- | 27,000 | 11% | $432,000 | 11% | $16.00 | 1/31/2017 | $453 | 4.6% | |
| Staples | BBB/Baa2/BBB | 26,232 | 11% | $362,002 | 9% | $13.80 | 1/31/2015 | $262 | 6.8% | |
| Dollar Tree | NR/NR/NR | 16,345 | 7% | $204,312 | 5% | $12.50 | 1/31/2022 | NAV | NAV | |
| Petco | NR/NR/NR | 13,296 | 6% | $226,032 | 6% | $17.00 | 1/31/2022 | NAV | NAV | |
| Sub Total/Wtd. Avg. | 193,502 | 82% | $2,541,634 | 64% | $13.13 | |||||
| In-line and Pad Tenants | 40,412 | 17% | $1,424,112 | 36% | $35.24 | |||||
| Vacant Space | 3,300 | 1% | $0 | 0% | $0.00 | |||||
| Total | 237,214 | 100% | $3,965,745 | 100% | $16.95 | |||||
| (1) | Certain ratings are those of the parent company whether or not the parent guarantees the lease. |
| (2) | Total Annualized Underwritten Base Rent (PSF) excludes vacant space. |
| This is not a research report and was not prepared by the Underwriters’ research departments. Please see additional important information and qualifications at the end of this Term Sheet. |
T-90
| MSBAM 2013-C12 | Rolling Valley Mall |
The following table presents certain information relating to the lease rollover at the Rolling Valley Mall Property:
Lease Rollover Schedule(1)(2) | |||||||||
| Year | # of Leases Rolling | SF Rolling | Average Underwritten Base Rent PSF Rolling(3) | Approx. % of Total SF Rolling | Approx. Cumulative % of SF Rolling | Total Underwritten Base Rent Rolling | Approx. % of Total Base Rent Rolling | Approx. Cumulative % of Total Base Rent Rolling | |
| MTM | 0 | 0 | $0.00 | 0% | 0% | $0 | 0% | 0% | |
| 2013 | 0 | 0 | $0.00 | 0% | 0% | $0 | 0% | 0% | |
| 2014 | 4 | 7,950 | $36.74 | 3% | 3% | $292,075 | 7% | 7% | |
| 2015 | 4 | 33,790 | $24.12 | 14% | 18% | $814,970 | 21% | 28% | |
| 2016 | 1 | 1,000 | 38.50 | 0% | 18% | $38,500 | 1% | 29% | |
| 2017 | 3 | 29,900 | $17.42 | 13% | 31% | $520,709 | 13% | 42% | |
| 2018 | 0 | 0 | $0.00 | 0% | 31% | $0 | 0% | 42% | |
| 2019 | 2 | 4,264 | $36.21 | 2% | 32% | $154,414 | 4% | 46% | |
| 2020 | 2 | 7,340 | $14.69 | 3% | 36% | $107,846 | 3% | 49% | |
| 2021 | 1 | 1,600 | $30.00 | 1% | 36% | $48,000 | 1% | 50% | |
| 2022 | 2 | 29,641 | $14.52 | 12% | 49% | $430,344 | 11% | 61% | |
| 2023 | 2 | 64,745 | $11.03 | 27% | 76% | $714,028 | 18% | 79% | |
| 2024 | 0 | 0 | $0.00 | 0% | 76% | $0 | 0% | 79% | |
| 2025 | 0 | 0 | $0.00 | 0% | 76% | $0 | 0% | 79% | |
| 2026 & Beyond | 2 | 53,684 | $15.74 | 23% | 99% | $844,860 | 21% | 100% | |
| Vacant | 0 | 3,300 | $0.00 | 1% | 100% | $0 | 0% | 100% | |
| Total/Wtd. Avg. | 23 | 237,214 | $16.95 | 100% | $3,965,745 | 100% | |||
| (1) | The information in the lease rollover schedule is based on the underwritten rent roll. |
| (2) | Certain tenants may have lease termination options that are exercisable prior to the originally stated expiration date of the related lease and that are not considered in the lease rollover schedule. |
The Market. The Rolling Valley Mall Property is located at the intersection of Old Keene Mill Road and Shiplett Boulevard in Burke, Fairfax County, Virginia, approximately 2 miles from I-495 and 4.5 miles from I-95. It is within the Suburban Fairfax County submarket of the Washington D.C CBSA, the largest within the Suburban Virginia Retail market, with approximately 12.9 million SF of retail space. As of March 31, 2013, the submarket had a 5.9% vacancy rate and average asking rent of $31.83 PSF. 2013 estimated population within a three- and five-mile radius is 107,680 and 236,372, respectively, while average household income is $152,690 and $150,901, respectively. Below is a chart of primary competitive retail centers, which average 98% occupancy rates.
| Competitive Property Summary | ||||||||||||||
| Property | Center Type | Year Built | Year Renovated | Total GLA (SF) | Anchor Tenants | Occupancy | Proximity | |||||||
Burke Towne Plaza 9568 Old Keene Mill Road Burke, VA | Neighborhood Center | 1973 | 2000 | 160,690 | Safeway CVS Pharmacy | 100% | 0.50 mile west | |||||||
Old Keene Mill Shopping Center 8402 Old Keene Mill Road Springfield, VA | Neighborhood Center | 1968 | 1984 | 98,728 | Whole Foods Walgreens Washington Sports Club | 100% | 2.0 miles east | |||||||
West Springfield Shopping Center 6230 Rolling Road Springfield, VA | Neighborhood Center | 1979 | 1990 | 83,733 | Merchant Tires Panera Bread Tuesday Morning | 97% | 2.0 miles east | |||||||
Cardinal Forest Plaza 8316 Old Keene Mill Road Springfield, VA | Neighborhood Center | 1969 | 1992 | 84,884 | Giant Food CVS Pharmacy | 100% | 2.0 miles east | |||||||
Burke Village Center 9520 Burke Road Burke, VA | Neighborhood Center | 1989 | N/A | 80,678 | Giant Food | 100% | 2.0 miles north | |||||||
Huntsman Square 7475 Huntsman Boulevard Springfield, VA | Neighborhood Center | 1990 | N/A | 90,832 | Giant Food | 94% | 2.0 miles south | |||||||
Burke Town Center 6030 Burke Commons Road Burke, VA | Community Center | 1983 | N/A | 184,523 | Wal-Mart | 100% | 2.5 miles west | |||||||
Source: Appraisal
| This is not a research report and was not prepared by the Underwriters’ research departments. Please see additional important information and qualifications at the end of this Term Sheet. |
T-91
| MSBAM 2013-C12 | Rolling Valley Mall |
Operating History and Underwritten Net Cash Flow. The following table presents certain information relating to the historical operating performance and the Underwritten Net Cash Flow at the Rolling Valley Mall Property:
| Cash Flow Analysis | ||||||||||||
| 2010 | 2011 | 2012 | 5/31/2013 TTM | UW(2) | UW PSF | |||||||
Base Rent(1) | $3,274,046 | $3,137,129 | $3,255,653 | $3,312,193 | $4,081,245 | $17.20 | ||||||
| Discounts/Concessions | ($6,730) | ($61,782) | ($163,705) | ($128,824) | $0 | $0.00 | ||||||
| Other Income | $127,545 | $45,018 | $58,731 | $135,518 | $8,000 | $0.03 | ||||||
| Total Recoveries | $956,796 | $776,165 | $847,919 | $875,425 | $1,071,380 | $4.52 | ||||||
| Less Vacancy & Credit Loss | $0 | $0 | $0 | $0 | ($257,628) | ($1.09) | ||||||
| Effective Gross Income | $4,351,657 | $3,896,530 | $3,998,598 | $4,194,311 | $4,902,997 | $20.67 | ||||||
| Total Operating Expenses | $1,220,660 | $1,066,285 | $1,125,422 | $1,292,457 | $1,203,354 | $5.07 | ||||||
| Net Operating Income | $3,130,997 | $2,830,245 | $2,873,176 | $2,901,854 | $3,699,643 | $15.60 | ||||||
| TI/LC | $0 | $0 | $0 | $0 | $222,981 | $0.94 | ||||||
| Capital Expenditures | $155,245 | $313,083 | $52,227 | $52,227 | $37,128 | $0.16 | ||||||
| Net Cash Flow | $2,975,752 | $2,517,162 | $2,820,949 | $2,849,627 | $3,439,534 | $14.50 | ||||||
Occupancy %(3) | 82.9% | 92.1% | 94.2% | 96.5% | 95.0% | |||||||
| NOI DSCR | 1.19x | 1.08x | 1.09x | 1.10x | 1.41x | |||||||
| NCF DSCR | 1.13x | 0.96x | 1.07x | 1.08x | 1.31x | |||||||
| NOI Debt Yield | 7.8% | 7.0% | 7.1% | 7.2% | 9.2% | |||||||
| NCF Debt Yield | 7.4% | 6.3% | 7.0% | 7.1% | 8.6% | |||||||
| (1) | Historical Base Rent includes actual property vacancy. |
| (2) | In 2012, the Rolling Valley Mall Borrower finished a redevelopment project at the Rolling Valley Mall Property which converted existing interior shop space to a new health club space. This process took several years and required moving two existing tenants to new space at the property and vacating 5 tenants, including two temporary tenants. |
| (3) | Prior to the redevelopment of the previously interior shop space, the Rolling Valley Mall Property contained approximately 194,130 SF of space. The Occupancy % represents end of year occupancies for each historical year, except for the TTM 5/31/2013 occupancy, which reflects a rent roll dated June 19, 2013. |
Escrows and Reserves. The Rolling Valley Mall Borrower deposited $171,260 in escrow for annual real estate taxes at loan origination and is required to escrow 1/12th of the annual estimated tax payments monthly. The Rolling Valley Mall Borrower is required to escrow 1/12th of the annual estimated insurance premiums monthly (unless the Rolling Valley Mall Borrower maintains insurance under an acceptable blanket insurance policy). During a Cash Sweep Period, the Rolling Valley Mall Borrower is required to make monthly deposits of $2,965 for replacement reserves. The Rolling Valley Mall Borrower is also required to make monthly deposits of $10,572 for TI/LC reserves. The Rolling Valley Mall Borrower deposited in escrow at loan origination $1,132,802 for tenant improvement costs and leasing commissions outstanding as of closing and set forth on a schedule attached to the loan agreement. The Rolling Valley Mall Borrower deposited $293,761 in escrow at loan origination for tenants with outstanding rent credits, concessions and/or abatements under existing leases, which amount is disbursed to the Rolling Valley Mall Borrower in accordance with a schedule attached to the loan agreement upon delivery to lender of an executed estoppel certificate acceptable to lender from such tenant stating that the free rent period has expired and the tenant is in occupancy of its entire premises, open for business and paying full contractual rent under its lease.
Lockbox and Cash Management. A hard lockbox is in place with respect to the Rolling Valley Mall Mortgage Loan. The Rolling Valley Mall Mortgage Loan has springing cash management. Provided a Cash Sweep Period (as defined below) has not commenced, funds in the lockbox account are swept daily to an account designated by the Rolling Valley Mall Borrower. During the continuance of a Cash Sweep Period, funds in the lockbox account are applied on each monthly payment date to pay debt service on the Rolling Valley Mall Mortgage Loan, to fund the required reserves deposits as described above under “—Escrows and Reserves,” to disburse, so long as no event of default has occurred and is continuing, to the Rolling Valley Mall Borrower the amount of monthly operating expenses not otherwise paid or reserved for and referenced in an annual budget approved by lender together with other amounts incurred by the Rolling Valley Mall Borrower in connection with the operation and maintenance of the Rolling Valley Mall Property approved by lender and to remit the remainder to an account to be held by the mortgagee as additional security for the Rolling Valley Mall Mortgage Loan.
A “Cash Sweep Period” will
| (i) | commence upon the occurrence of an event of default and conclude upon the cure or waiver of such event of default, |
| (ii) | commence upon the debt service coverage ratio (calculated excluding for this purpose rent payable by any tenant having the right with the passage of time and/or notice to terminate its lease as a result of a then-existing co-tenancy violation triggered by an Anchor Tenant (as defined below)) being less than 1.15x and conclude upon the debt service coverage ratio increasing to 1.15x, |
| (iii) | commence upon earlier to occur of (a) the 179th day before the leases with either Shoppers Food Warehouse Corp. or Rolling Valley Fitness LLC (d/b/a One Life Fitness) or their respective permitted subtenants and/or assigns (each, an “Anchor Tenant”) expire or (b) the day after the last lease renewal or extension notice date by an Anchor Tenant pursuant to its lease if such tenant fails to review and/or extend its lease, and conclude upon either (1) such Anchor Tenant is open for business either pursuant to a lease extension for at least five years from the immediately preceding expiration date or a replacement lease approved by the lender is entered into in accordance with the Rolling Valley Mall Mortgage Loan agreement with such Anchor Tenant as evidenced by a tenant estoppel certificate from such Anchor Tenant reasonably acceptable to the lender stating that such Anchor Tenant is in occupancy of its space, open for business and paying full contractual rent or (2) such Anchor Tenant’s space has been re-let to one or more replacement tenants pursuant to replacement lease(s) approved by the lender and entered into in accordance with the Rolling Valley Mall Mortgage Loan agreement, as evidenced by tenant estoppel certificates(s) from such replace tenant(s) reasonably acceptable to the lender stating that such replacement tenant(s) is/are in occupancy of such space, open for business and paying full contractual rent; provided, that |
| This is not a research report and was not prepared by the Underwriters’ research departments. Please see additional important information and qualifications at the end of this Term Sheet. |
T-92
| MSBAM 2013-C12 | Rolling Valley Mall |
| if the Cash Sweep Period is triggered by this clause (iii), then any replacement lease required in order to conclude the Cash Sweep Period need only cover 50% or more of the Anchor Tenant’s premises, and/or |
(iv) | commence upon (x) an Anchor Tenant making a bankruptcy filing or being the subject of a bankruptcy filing, (y) an Anchor Tenant (or its respective subtenant(s) or assignee(s)) for all or substantially all of its premises “going dark,” vacating its space, not opening for business or terminating its lease (excluding temporary closures in connection with casualty, condemnation, or remodeling not exceeding 180 days) or (z) the occurrence of an uncured material monetary default (beyond applicable notice and cure periods) by an Anchor Tenant under its lease, and conclude upon (a) with respect to the event described in clause (iv)(x) above, such Anchor Tenant’s lease has been affirmed in bankruptcy (as evidence by delivery of a copy of the court order by which such lease was affirmed) and such Anchor Tenant is in occupancy of its space, open for business and paying full contractual rent or such Anchor Tenant’s space has been re-let to one or more replacement tenants pursuant to replacement lease(s) approved by lender and entered into in accordance with the related loan agreement, as evidenced by tenant estoppel certificates(s) from such replace tenant(s) reasonably acceptable to the lender stating that such replacement tenant(s) is/are in occupancy of such space, open for business and paying full contractual rent (b) with respect to the event described in clause (iv)(y) above, such Anchor Tenant is open for business either pursuant to its lease or a replacement lease approved by the lender and entered into in accordance with the Rolling Valley Mall Mortgage Loan agreement for occupancy of all or a portion of its space as evidenced by a tenant estoppel certificate from such Anchor Tenant reasonably acceptable to the lender stating that such Anchor Tenant is in occupancy of its space, open for business and paying full contractual rent or such Anchor Tenant’s space has been re-let to one or more replacement tenants pursuant to replacement lease(s) approved by lender and entered into in accordance with the Rolling Valley Mall Mortgage Loan agreement, as evidenced by tenant estoppel certificates(s) from such replace tenant(s) reasonably acceptable to the lender stating that such replacement tenant(s) is/are in occupancy of such space, open for business and paying full contractual rent and (c) with respect to the event described in clause (iv)(z) above, delivery by the Rolling Valley Mall Borrower of a certification reasonably acceptable to the lender stating that the default has been cured (or delivery by the Rolling Valley Mall Borrower to lender of a letter of credit in accordance with the loan agreement for the Rolling Valley Mall Mortgage Loan); provided, that if the Cash Sweep Period is triggered by this clause (iv), then any replacement lease required in order to conclude the Cash Sweep Period need only cover 50% or more of the Anchor Tenant’s premises. |
Property Management. The Rolling Valley Mall Property is managed by Combined Properties, Incorporated, an affiliate of the Rolling Valley Mall Borrower.
Mezzanine Loan and Preferred Equity. Not permitted.
Additional Secured Indebtedness (not including trade debts). Not permitted.
Release of Property. Not permitted.
Terrorism Insurance. Generally, the Rolling Valley Mall Borrower is required to obtain insurance against acts of terrorism or other similar acts or events (or “fire following”) to the extent such policy is available, and provided that the Rolling Valley Mall Borrower will only be required to maintain as much coverage as may be obtained by paying a premium for such insurance not in excess of five times the rate as of loan origination for such coverage (but in no event more than 100% of replacement costs and twelve months of business interruption insurance).
Expansion, Release and Substitution of Property. Not permitted.
| This is not a research report and was not prepared by the Underwriters’ research departments. Please see additional important information and qualifications at the end of this Term Sheet. |
T-93
| MSBAM 2013-C12 | Florida Hotel & Conference Center |
Mortgage Loan No. 9 – Florida Hotel & Conference Center
| This is not a research report and was not prepared by the Underwriters’ research departments. Please see additional important information and qualifications at the end of this Term Sheet. |
T-94
| MSBAM 2013-C12 | Florida Hotel & Conference Center |
Mortgage Loan No. 9 – Florida Hotel & Conference Center

| This is not a research report and was not prepared by the Underwriters’ research departments. Please see additional important information and qualifications at the end of this Term Sheet. |
T-95
| MSBAM 2013-C12 | Florida Hotel & Conference Center |
| Mortgage Loan No. 9 – Florida Hotel & Conference Center |
| Mortgage Loan Information | Mortgaged Property Information | ||||||
| Mortgage Loan Seller: | MSMCH | Single Asset/Portfolio: | Single Asset | ||||
Credit Assessment: (Fitch/KBRA/Moody’s) | NR/NR/NR | Property Address: | 1500 Sand Lake Road Orlando, FL 32809 | ||||
| Original Balance: | $37,250,000 | General Property Type: | Hospitality | ||||
| Cut-off Date Balance: | $37,250,000 | Detailed Property Type: | Full Service | ||||
| % of Initial Pool Balance: | 2.9% | Number of Rooms: | 511 Rooms | ||||
| Loan Purpose: | Refinance | Cut-off Date Balance Per Room: | $72,896 | ||||
| Borrower Name(s): | Tantallon Orlando, LLC | Balloon/ARD Balance Per Room: | $65,331 | ||||
| Sponsor: | Tantallon, LLC | Year Built/Year Renovated: | 1986/2004 and 2012 | ||||
| Mortgage Rate: | 5.300% | Title Vesting: | Fee | ||||
| Note Date: | 9/3/2013 | Property Manager: | Edinburgh Management, LLC | ||||
| First Payment Date: | 11/1/2013 | ||||||
| Anticipated Repayment Date: | NAP | Underwriting and Financial Information | |||||
| Maturity Date: | 10/1/2018 | UW Revenues: | $20,116,377 | ||||
| IO Period: | None | UW Expenses: | $15,305,910 | ||||
| Original Term to Maturity or ARD: | 60 months | UW NOI: | $4,810,467 | ||||
| Seasoning: | 0 months | UW NCF: | $4,005,812 | ||||
| Original Amortization Term: | 300 months | UW NOI DSCR: | 1.79x | ||||
| Loan Amortization Type: | Amortizing | UW NCF DSCR: | 1.49x | ||||
| Interest Accrual Basis: | Actual/360 | UW NOI Debt Yield: | 12.9% | ||||
| Prepayment Provisions: | LO (24); DEF (31); O (5) | UW NCF Debt Yield: | 10.8% | ||||
| Lockbox/Cash Management: | Soft /In Place | UW NCF Debt Yield at Maturity: | 12.0% | ||||
Pari Passu Mortgage Debt: | None | Most Recent NOI (As of): | $4,842,985 (6/30/2013 TTM) | ||||
| Subordinate Mortgage Debt: | None | Second Most Recent NOI (As of): | $4,474,744 (12/31/2012) | ||||
| Mezzanine Debt: | None | Third Most Recent NOI (As of): | $3,591,041 (12/31/2011) | ||||
Reserves(1) | Appraised Value: | $63,000,000 | |||||
| Type | Initial | Monthly | Cap | Appraisal As-of Date: | 7/18/2013 | ||
| RE Tax: | $225,832 | $25,092 | NAP | Cut-off Date LTV Ratio: | 59.1% | ||
| Insurance: | $0 | Springing | NAP | LTV Ratio at Maturity/ARD: | 53.0% | ||
| Recurring FF&E: | $0 | $67,053 | NAP | Occupancy Rate: | 72.5% (6/30/2013) | ||
2nd Most Recent Occupancy: | 70.9% (12/31/2012) | ||||||
3rd Most Recent Occupancy: | 69.3% (12/31/2011) | ||||||
| (1) | See “—Escrows and Reserves” below for further discussion of reserve requirements. |
The Florida Hotel & Conference Center Mortgage Loan
The Mortgage Loan. The ninth largest mortgage loan (the “Florida Hotel & Conference Center Mortgage Loan”) is evidenced by a note in the original principal amount of $37,250,000 and is secured by a first priority fee mortgage encumbering a full service hospitality property known as the Florida Hotel & Conference Center in Orlando, Florida (the “Florida Hotel & Conference Center Property”). The proceeds of the Florida Hotel & Conference Center Mortgage Loan were used to refinance a previous loan of approximately $34,778,995 secured by the Florida Hotel & Conference Center Property.
The Florida Hotel & Conference Center Mortgage Loan has an initial and remaining term of 60 months. The Florida Hotel & Conference Center Mortgage Loan requires payments of principal and interest for its entire term with a scheduled maturity date of October 1, 2018. Defeasance with direct, non-callable obligations of the United States of America (or other non-callable government securities or other non-callable instruments that will not cause the trust to lose its REMIC status and, in each case, will not result in a downgrade or withdrawal of the ratings for the MSBAM Series 2013-C12 Certificates) is permitted at any time on or after the first due date following the second anniversary of the securitization closing date. The Florida Hotel & Conference Center Mortgage Loan is open to prepayment in full (without prepayment consideration) during the final 4 months of the loan term.
The Borrower and the Sponsor. The borrower is Tantallon Orlando, LLC (the “Florida Hotel & Conference Center Borrower”), a single purpose Delaware limited liability company with two independent directors. The Florida Hotel & Conference Center Borrower is 100% indirectly owned, through Tantallon, LLC, the loan sponsor, which is owned by (a) Tantallon Investments, Inc. (75%) and (b) Edinburgh Fund LLC, (25%). Tantallon Investments, Inc. is 100% owned by Uberior Investments, a UK PLC that is wholly owned by the Bank of Scotland. Edinburgh Fund LLC is wholly owned by Terry Shaikh. In 2003, Terry Shaikh and the Bank of Scotland formed Tantallon, LLC as a joint venture to buy, sell, manage and finance hotel assets. The non-recourse carve-out guarantor is Tantallon, LLC, which, combined with its subsidiaries, reported total assets of approximately $170.3 million, total liabilities of approximately $117.0 million, and total equity/retained earnings of approximately $53.3 million, as of June 30, 2013.
| This is not a research report and was not prepared by the Underwriters’ research departments. Please see additional important information and qualifications at the end of this Term Sheet. |
T-96
| MSBAM 2013-C12 | Florida Hotel & Conference Center |
The Mortgaged Property. The Florida Hotel & Conference Center Property is a 511-room, full service, 11-story hospitality property located in Orlando, Florida, adjacent and with direct access to a shopping mall known as the Florida Mall. The room mix includes 227 King Rooms, 278 Double/Double Rooms, 1 One-Bedroom Suite, 3 Parlor Rooms and 2 Presidential Suites. The Florida Hotel & Conference Center Property was constructed in 1986 as a Sheraton Hotel, at the same time as the adjacent mall. It was later rebranded a Crowne Plaza, then, in 1996, an Adams Mark Hotel. In 2004, when the current sponsorship purchased the hotel, it was substantially renovated at a cost of approximately $27 million, including the addition of approximately 20,000 SF of meeting space, and rebranded the Florida Hotel & Conference Center. It has undergone periodic improvements since then, with approximately $5.3 million of additional capital in the years 2008-2012, including the 2012 lobby, restaurant and bar renovations and installation of two new lobby escalators. In addition to its guest rooms, the Florida Hotel & Conference Center Property contains approximately 50,000 SF of meeting space in 9 meeting rooms and 2 board rooms, a restaurant (Marcelo’s) and lounge, a Starbucks coffee shop, an outdoor pool and whirlpool, a fitness center, and a business center. There are 631 surface parking spaces. The Florida Hotel & Conference Center Property is not franchised. It is a member of Worldhotels, a group of 500 independent properties in 250 destination cities in 65 countries.
The adjacent Florida Mall was developed in 1986 by DeBartolo Realty and is currently operated by Simon Property Group. The mall, which is anchored by Dillard’s, JC Penney, Macy’s, Nordstrom, Saks Fifth Avenue, and Sears, has approximately 1.9 million SF with over 250 retailers.
Demand at the Florida Hotel & Conference Center Property is approximately 40% commercial-driven, 40% meeting and group-driven and 20% leisure- driven.
More specific occupancy and rate information about the Florida Hotel & Conference Center Property is set forth in the table below:
| The Florida Hotel & Conference Center Market Historical Occupancy, ADR, RevPAR | ||||||||||
| Competitive Set | Florida Hotel & Conference Center | Penetration Factor | ||||||||
| Year | Occupancy | ADR | RevPAR | Occupancy | ADR | RevPAR | Occupancy | ADR | RevPAR | |
| 2011 | 70.7% | $85.80 | $60.68 | 71.3% | $89.31 | $63.66 | 100.8% | 104.1% | 104.9% | |
| 2012 | 68.8% | $88.07 | $60.58 | 71.3% | $98.05 | $69.93 | 103.7% | 111.3% | 115.4% | |
| TTM 7/31/2013 | 67.4% | $90.51 | $60.97 | 72.7% | $100.33 | $72.97 | 108.0% | 110.9% | 119.7% | |
Source: Industry Report
The Market. The Florida Hotel & Conference Center Property is located in Orlando, within Orange County, Florida, approximately 8 miles south of downtown Orlando and approximately 8 miles west of the Orlando International Airport, within the Orlando-Deltona-Dayton Beach CSA. It is located on the south side and adjacent to the Florida Mall, which attracts more than 15 million visitors per year. The Orange County Convention Center has over 2.5 million SF. Overall market RevPAR was approximately $76.94 in 2008, $61.22 in 2009, $59.88 in 2010, $63.19 in 2011 and $63.04 in 2012.
Competing properties to the Florida Hotel & Conference Center Property are shown in the table below:
| Primary Competitive Hotels | |||||||||||||
| Property | Rooms | Commercial | Meeting and Group | Leisure | 2012 Occupancy | 2012 Average Rate | 2012 RevPAR | 2012 Occupancy Penetration | 2012 Yield Penetration | ||||
| Florida Hotel & Conference Center (subject) | 511 | 40% | 40% | 20% | 71% | $98.50 | $69.99 | 103.8% | 111.0% | ||||
| Double Tree by Hilton Universal Orlando | 742 | 34% | 31% | 35% | 76% | $88.00 | $66.88 | 111.0% | 106.1% | ||||
| Renaissance Orlando Airport Hotel | 297 | 50% | 40% | 10% | 80% | $92.00 | $73.60 | 116.9% | 116.7% | ||||
| Marriott Orlando Airport | 485 | 60% | 30% | 10% | 72% | $104.00 | $74.88 | 105.2% | 118.8% | ||||
| DoubleTree by Hilton Orlando Airport | 353 | 50% | 20% | 30% | 65% | $78.00 | $50.70 | 94.9% | 80.4% | ||||
Wyndham Orlando Resort(1) | 1,052 | 40% | 25% | 35% | 51% | $71.00 | $36.21 | 74.5% | 57.4% | ||||
| Totals/Averages | 3,440 | 44% | 31% | 26% | 66.3 | % | $87.53 | $58.01 | 96.8% | 92.0% | |||
Source: Appraisal
| (1) | The Wyndham Orlando Resort is currently undergoing an extensive renovation of its public area and guestrooms. The hotel closed 439 of its rooms in April 2013 in order to expand its ballroom and meeting facilities. |
| This is not a research report and was not prepared by the Underwriters’ research departments. Please see additional important information and qualifications at the end of this Term Sheet. |
T-97
| MSBAM 2013-C12 | Florida Hotel & Conference Center |
Operating History and Underwritten Net Cash Flow. The following table presents certain information relating to the historical operating performance and the Underwritten Net Cash Flow at the Florida Hotel & Conference Center Property:
| Cash Flow Analysis | ||||||||||
| 2009 | 2010 | 2011 | 2012 | 6/30/2013 TTM | UW | UW per Room | ||||
Occupancy(1) | 67.7% | 68.1% | 69.3% | 70.9% | 72.5% | 72.5% | ||||
ADR(1) | $93.33 | $88.52 | $91.49 | $98.50 | $100.17 | $100.17 | ||||
RevPAR(1) | $63.22 | $60.30 | $63.40 | $69.79 | $72.59 | $72.59 | ||||
| Rooms Revenue | $11,790,641 | $11,246,385 | $11,824,539 | $13,053,371 | $13,538,541 | $13,538,541 | $26,494 | |||
| Food & Beverage | $5,273,984 | $4,520,598 | $5,102,991 | $5,822,685 | $6,052,860 | $6,052,860 | $11,845 | |||
Other Income(2) | $592,348 | $492,269 | $482,096 | $505,238 | $524,976 | $524,976 | $1,027 | |||
| Total Revenue | $17,656,973 | $16,259,252 | $17,409,626 | $19,381,294 | $20,116,377 | $20,116,377 | $39,367 | |||
| Total Expenses | $14,454,299 | $13,341,335 | $13,818,585 | $14,906,550 | $15,273,392 | $15,305,910 | $29,953 | |||
| NOI | $3,202,674 | $2,917,917 | $3,591,041 | $4,474,744 | $4,842,985 | $4,810,467 | $9,414 | |||
| FF&E | $706,286 | $650,408 | $696,401 | 775,241 | $804,635 | $804,655 | $1,575 | |||
| NCF | $2,496,388 | $2,267,509 | $2,894,640 | $3,699,503 | $4,038,350 | $4,005,812 | $7,839 | |||
| NOI DSCR | 1.19x | 1.08x | 1.33x | 1.66x | 1.80x | 1.79x | ||||
| NCF DSCR | 0.93x | 0.84x | 1.08x | 1.37x | 1.50x | 1.49x | ||||
| NOI Debt Yield | 8.6% | 7.8% | 9.6% | 12.0% | 13.0% | 12.9% | ||||
| NCF Debt Yield | 6.7% | 6.1% | 7.8% | 9.9% | 10.8% | 10.8% | ||||
| (1) | The underwritten Occupancy, ASR and RevPAR are based on the TTM 6/30/2013 results without adjustments. |
| (2) | Other Income includes telecommunications income, parking income, and income from the “Grab & Go” food kiosk. |
Escrows and Reserves. The Florida Hotel & Conference Center Borrower deposited $225,832 in escrow for annual real estate taxes at loan origination and is required to escrow 1/12th of the annual estimated tax payments monthly. The Florida Hotel & Conference Center Borrower is required to escrow 1/12th of the annual estimated insurance premiums monthly (unless the Florida Hotel & Conference Center Borrower maintains insurance under an acceptable blanket insurance policy). The Florida Hotel & Conference Center Borrower is required to make monthly deposits for FF&E reserves equal to 1/12th of 4.00% of the Florida Hotel & Conference Center Borrower’s gross revenues, to the extent a similar reserve is not retained by the manager under the Edinburgh Management Agreement (as defined below).
Lockbox and Cash Management. A soft lockbox is in place with respect to the Florida Hotel & Conference Center Mortgage Loan (i.e. for so long as the management agreement dated October 1, 2004, as amended, with Edinburgh Management, LLC (the “Edinburgh Management Agreement”) is in place, Florida Hotel & Conference Center Borrower directs manager to disburse all sums payable to Florida Hotel & Conference Center Borrower under the Edinburgh Management Agreement directly to the lockbox account; if the Edinburgh Management Agreement is no longer in effect, Florida Hotel & Conference Center Borrower is required to put in place a hard lockbox). The Florida Hotel & Conference Center Mortgage Loan has in place cash management. Funds in the lockbox account are applied on each monthly payment date to pay debt service on the Florida Hotel & Conference Center Mortgage Loan, to fund the required reserves deposits as described above under “Escrows and Reserves,” to disburse to the Florida Hotel & Conference Center Borrower the amount of operating expenses payable by Florida Hotel & Conference Center Borrower in connection with the ownership and operation of the Florida Hotel & Conference Center Mortgaged Property which are not paid by the manager pursuant to the Edinburgh Management Agreement and to disburse any excess to Florida Hotel & Conference Center Borrower; provided, that if a Cash Sweep Period (as defined below) exists, then the remainder will be held by the mortgagee as additional security for the Florida Hotel & Conference Center Mortgage Loan.
A “Cash Sweep Period” will commence upon (a) the occurrence of an event of default or (b) the debt service coverage ratio being less than 1.25x on a trailing twelve month basis or (c) the Edinburgh Management Agreement being cancelled or terminated. Such Cash Flow Sweep Period will continue until either (1) the event of default is cured or no longer exists or (2) the debt service coverage ratio is equal to or greater than 1.35x on a trailing twelve month basis for the six calendar months preceding the calculation date or (3) a replacement management agreement acceptable to the lender is in full force and effect.
Property Management. The Florida Hotel & Conference Center Property is managed by Edinburgh Management, LLC, an affiliate of the Florida Hotel & Conference Center Borrower.
Mezzanine Loan and Preferred Equity. Not permitted.
Additional Secured Indebtedness (not including trade debts). Not permitted.
Release of Property. Not permitted.
Terrorism Insurance. Generally, the Florida Hotel & Conference Center Borrower is required to obtain insurance against acts of terrorism or other similar acts or events (or “fire following”) to the extent such policy is available in an amount determined by lender (but not more than 100% of replacement costs and twelve months of business interruption insurance).
Expansion, Release and Substitution of Property. Not permitted.
| This is not a research report and was not prepared by the Underwriters’ research departments. Please see additional important information and qualifications at the end of this Term Sheet. |
T-98
(THIS PAGE INTENTIONALLY LEFT BLANK)
| This is not a research report and was not prepared by the Underwriters’ research departments. Please see additional important information and qualifications at the end of this Term Sheet. |
T-99
| MSBAM 2013-C12 | 385 Fifth Avenue |
Mortgage Loan No. 10 – 385 Fifth Avenue
| This is not a research report and was not prepared by the Underwriters’ research departments. Please see additional important information and qualifications at the end of this Term Sheet. |
T-100
| MSBAM 2013-C12 | 385 Fifth Avenue |
Mortgage Loan No. 10 – 385 Fifth Avenue
| This is not a research report and was not prepared by the Underwriters’ research departments. Please see additional important information and qualifications at the end of this Term Sheet. |
T-101
| MSBAM 2013-C12 | 385 Fifth Avenue |
| Mortgage Loan No. 10 – 385 Fifth Avenue |
| Mortgage Loan Information | Mortgaged Property Information | ||||||
| Mortgage Loan Seller: | MSMCH | Single Asset/Portfolio: | Single Asset | ||||
| Credit Assessment:(Fitch/KBRA/Moody’s) | NR/NR/NR | Property Address: | 385 Fifth Avenue New York, NY 10016 | ||||
| Original Balance: | $36,100,000 | General Property Type: | Office | ||||
| Cut-off Date Balance: | $36,100,000 | Detailed Property Type: | CBD | ||||
| % of Initial Pool Balance: | 2.8 % | Net Rentable Area: | 102,219 SF | ||||
| Loan Purpose: | Refinance | Cut-off Date Balance Per Unit/SF: | $353 | ||||
| Borrower Name(s): | 385 Fifth Avenue, LLC | Balloon/ARD Balance Per Unit/SF: | $323 | ||||
| Sponsor: | Peter Schwalbe; Robert Schwalbe; Fred Schwalbe | Year Built/Year Renovated: | 1929/2012 | ||||
| Mortgage Rate: | 4.410% | Title Vesting: | Fee | ||||
| Note Date: | 5/30/2013 | Property Manager: | Hilson Management Corp. | ||||
| First Payment Date: | 7/5/2013 | ||||||
| Anticipated Repayment Date: | NAP | Underwriting and Financial Information | |||||
| Maturity Date: | 6/5/2023 | UW Revenues: | $5,769,832 | ||||
| IO Period: | 60 months | UW Expenses: | $2,577,648 | ||||
| Original Term to Maturity or ARD: | 120 months | UW NOI: | $3,192,184 | ||||
| Seasoning: | 4 months | UW NCF: | $2,837,112 | ||||
| Original Amortization Term: | 360 months | UW NOI DSCR: | 1.47x | ||||
| Loan Amortization Type: | Partial IO | UW NCF DSCR: | 1.31x | ||||
| Interest Accrual Basis: | Actual/360 | UW NOI Debt Yield: | 8.8% | ||||
| Prepayment Provisions: | LO (28); DEF (88); O (4) | UW NCF Debt Yield: | 7.9% | ||||
| Lockbox/Cash Management: | Springing/Springing | UW NCF Debt Yield at Maturity: | 8.6% | ||||
Pari Passu Mortgage Debt: | None | Most Recent NOI (As of): | $3,775,793 (12/31/2012) | ||||
| Subordinate Mortgage Debt: | None | Second Most Recent NOI (As of): | $3,075,620 (12/31/2011) | ||||
| Mezzanine Debt: | None | Third Most Recent NOI (As of): | $3,633,060 (12/31/2010) | ||||
Reserves(1) | Appraised Value: | $55,000,000 | |||||
| Type | Initial | Monthly | Cap | Appraisal As-of Date: | 5/1/2013 | ||
| RE Tax: | $650,927 | $108,488 | NAP | Cut-off Date LTV Ratio: | 65.6% | ||
| Insurance: | $0 | Springing | NAP | LTV Ratio at Maturity/ARD: | 60.1% | ||
| Recurring Replacements: | $0 | $1,718 | $103,080 | Occupancy Rate: | 99.4% (9/10/2013) | ||
| TI/LC: | $0 | Springing | $500,000 | 2nd Most Recent Occupancy: | NAV | ||
| Deferred Maintenance: | $37,500 | $0 | NAP | 3rd Most Recent Occupancy: | NAV | ||
| (1) | See “—Escrows and Reserves” below for further discussion of reserve requirements. |
The 385 Fifth Avenue Mortgage Loan
The Mortgage Loan. The tenth largest mortgage loan (the “385 Fifth Avenue Mortgage Loan”) is evidenced by a promissory note in the principal amount of $36,100,000, secured by first priority fee mortgage encumbering the property known as the 385 Fifth Avenue, New York, New York (the “385 Fifth Avenue Property”). The proceeds of the 385 Fifth Avenue Mortgage Loan were used to refinance a previous loan of approximately $34,758,652 secured by the 385 Fifth Avenue Property.
The 385 Fifth Avenue Mortgage Loan had an original term of 120 months and has a remaining term of 116 months with a maturity date of June 5, 2023. The 385 Fifth Avenue Mortgage Loan requires payments of interest only for its initial 60 months and principal and interest thereafter. Defeasance with direct, non-callable obligations of the United States of America (or other non-callable government securities or other non-callable instruments that will not cause the trust to lose its REMIC status and, in each case, will not result in a downgrade or withdrawal of the ratings for the MSBAM Series 2013-C12 Certificates) is permitted at any time on or after the first due date following the second anniversary of the closing date of this transaction. The 385 Fifth Avenue Mortgage Loan is open to prepayment in full (without prepayment consideration) during the final three months of the loan term.
The Borrower and the Sponsor. The borrower is 385 Fifth Avenue, LLC (the “385 Fifth Avenue Borrower”), a single-purpose New York limited liability company. The 385 Fifth Avenue Borrower is majority owned and controlled by Fred Schwalbe, Peter Schwalbe and Robert Schwalbe. Fred Schwalbe, Peter Schwalbe and Robert Schwalbe are the joint and several non-recourse carve-out guarantors.
The Mortgaged Property. The 385 Fifth Avenue Property is a Class B, 15-story, multi-tenant office building with retail and storage space on the corner of Fifth Avenue and East 36th Street in New York, New York. The retail space includes a Vitamin Shoppe store and a Cohen’s Fashion Optical on Fifth
| This is not a research report and was not prepared by the Underwriters’ research departments. Please see additional important information and qualifications at the end of this Term Sheet. |
T-102
| MSBAM 2013-C12 | 385 Fifth Avenue |
Avenue, and a Peter Dillons bar and restaurant along East 36th Street. The 385 Fifth Avenue Property is located within the Murray Hill submarket in the Midtown East Office District of Manhattan. The approximately 102,219 SF building was constructed in 1929 and substantially renovated in 2012, including replacement of the central air-conditioning and related systems, replacement of all exterior windows, façade repairs and power washing. The 385 Fifth Avenue Property operates primarily as an accessories and showroom building catering to buyers in the ladies accessories and jewelry industries. General floor plates range from 3,830 SF to 7,775 SF, with a 2,600 SF penthouse floor. Ceiling heights are generally 11 feet slab to slab, with finished ceiling heights of 8.5 feet in office areas.
Major Tenants.
Victoria Creations (25,900 SF, 25% of NRA, 25% of underwritten base rent). Victoria Creations, Inc. (“Victoria”) leases 25,900 SF at the 385 Fifth Avenue Property. The lease began on August 1, 1993 and has a current expiration date of July 31, 2016. Victoria currently subleases all of its space at the 385 Fifth Avenue Property to several subtenants, including Fantas-eyes, Inc., which, not including this subleased space, is the second largest tenant at the 385 Fifth Avenue Property. Victoria was purchased by the Jones Apparel Group (NYSE: JNY) in 2000 and is now known as the Jones Jewelry Group. Jones Jewelry Group designs and markets costume jewelry catering to departmental and specialty stores.
Fantas-eyes (10,315 SF, 10% of NRA, 8% of underwritten base rent). Fantas-eyes, Inc. (“Fantas-eyes”) leases 10,315 SF at the 385 Fifth Avenue Property under a direct lease with the 385 Fifth Avenue Borrower. The lease began on January 1, 2012 for 4,125 SF, was expanded by 6,190 SF effective April 1, 2013, and has a current expiration date of July 31, 2019. In addition to its direct lease for 10,315 SF, Fantas-eyes subleases approximately 5,300 SF from Victoria through July 31, 2016, at which time the sublease will expire and convert to a direct lease for the entire 9th floor of the 385 Fifth Avenue Property, totaling approximately 7,700 SF, with a lease expiration date of July 31, 2019. Fantas-eyes is a private company founded in 1989, which manufactures and distributes sunglasses in the United States.
Esquire Footwear (7,650 SF, 8% of NRA, 5% of underwritten base rent). Esquire Footwear, Inc. (“Esquire”) leases 7,650 SF at the 385 Fifth Avenue Property. The lease began on March 1, 2013 and has a current lease expiration date of February 28, 2023, with one 5-year lease renewal option. Esquire is a private designer and manufacturer of fashion footwear. The company was founded in 2005.
The following table presents a summary regarding anchor and major tenants at the 385 Fifth Avenue Property:
| Tenant Summary | |||||||
| Tenant Name | Credit Rating (Fitch/Moody’s/S&P)(1) | Tenant NRSF | Approximate % of NRSF | Annualized Underwritten Base Rent | % of Total Annualized UW Rent | Total Annual Underwritten Base Rent (PSF) | Lease Expiration |
| Major Tenants | |||||||
Victoria Creations, Inc.(2) | NR/B1/BB- | 25,900 | 25% | $1,244,831 | 25% | $48.06 | 7/31/2016 |
Fantas-eyes, Inc.(3) | NR/NR/NR | 10,315 | 10% | $423,837 | 8% | $41.09 | 7/31/2019 |
| Esquire Footwear | NR/NR/NR | 7,650 | 7% | $263,725 | 5% | $34.47 | 9/1/2022 |
| Carolee/Brooks Brothers | NR/NR/NR | 5,825 | 6% | $234,806 | 5% | $40.31 | 4/30/2021 |
| Roman Company | NR/NR/NR | 5,240 | 5% | $180,000 | 4% | $34.35 | 12/1/2016 |
| Subtotal/Wtd. Avg. | 54,930 | 54% | $2,347,199 | 47% | $42.73 | ||
Other tenants(4) | 46,714 | 46% | $2,673,174 | 53% | $57.22 | ||
| Vacant Space | 575 | 1% | $0 | 0% | $0.00 | ||
| Total/Wtd. Avg. | 102,219 | 100% | $5,020,373 | 100% | $49.39 | ||
| (1) | Certain ratings are those of the parent company whether or not the parent guarantees the lease. The ratings for Victoria Creations represent current credit ratings for The Jones Group Inc., which owns the tenant. |
| (2) | The Victoria Creations tenant subleases all of its space at the 385 Fifth Avenue Property. |
| (3) | The Fantas-eyes, Inc. tenant subleases approximately 5,300 SF from the Victoria Creations, Inc. tenant, for a total current occupancy of approximately 15,615 SF at the 385 Fifth Avenue Property. |
| (4) | Other tenants includes Vitamin Shoppe, which, while occupying only 2% of the property SF, contributes approximately 10% of the Annualized Underwritten Base Rent. Vitamin Shoppe leases approximately 2,000 SF of ground floor retail space in the 385 Fifth Avenue Property. |
| This is not a research report and was not prepared by the Underwriters’ research departments. Please see additional important information and qualifications at the end of this Term Sheet. |
T-103
| MSBAM 2013-C12 | 385 Fifth Avenue |
The following table presents certain information relating to the lease rollover at the 385 Fifth Avenue Property:
Lease Rollover Schedule(1)(2) | |||||||||
| Year | # of Leases Rolling | SF Rolling | Average Underwritten Base Rent PSF Rolling(3) | Approx. % of Total SF Rolling | Approx. Cumulative % of SF Rolling | Total Underwritten Base Rent Rolling | Approx. % of Total Base Rent Rolling | Approx. Cumulative % of Total Base Rent Rolling | |
| MTM | 4 | 2,775 | $26.54 | 3% | 3% | $73,652 | 1% | 1% | |
| 2013 | 0 | 0 | $0.00 | 0% | 3% | $0 | 0% | 1% | |
| 2014 | 11 | 10,595 | $43.07 | 10% | 13% | $456,340 | 9% | 11% | |
| 2015 | 0 | 0 | $0.00 | 0% | 13% | $0 | 0% | 11% | |
2016(4) | 15 | 45,649 | $46.72 | 45% | 58% | $2,132,676 | 42% | 53% | |
| 2017 | 5 | 9,235 | $79.81 | 9% | 67% | $737,038 | 15% | 68% | |
| 2018 | 2 | 3,700 | $46.31 | 4% | 70% | $171,329 | 3% | 71% | |
| 2019 | 1 | 4,125 | $39.88 | 4% | 74% | $164,512 | 3% | 74% | |
| 2020 | 1 | 6,190 | $41.89 | 6% | 80% | $259,325 | 5% | 80% | |
| 2021 | 1 | 5,825 | $40.31 | 6% | 86% | $234,806 | 5% | 84% | |
| 2022 | 2 | 11,300 | $36.46 | 11% | 97% | $412,045 | 8% | 92% | |
| 2023 | 0 | 0 | $0.00 | 0% | 97% | $0 | 0% | 92% | |
| 2024 | 0 | 0 | $0.00 | 0% | 97% | $0 | 0% | 92% | |
| 2025 | 0 | 0 | $0.00 | 0% | 97% | $0 | 0% | 92% | |
| 2026 & Beyond | 2 | 2,250 | $168.29 | (5) | 2% | 99% | $378,650 | 8% | 100% |
| Vacant | 0 | 575 | $0.00 | 1% | 100% | $0 | 0% | 100% | |
| Total/Wtd. Avg. | 44 | 102,219 | $49.39 | 100% | $5,020,373 | 100% | |||
| (1) | The information in the lease rollover schedule is based on the underwritten rent roll. |
| (2) | Certain tenants may have lease termination options that are exercisable prior to the originally stated expiration date of the related lease and that are not considered in the lease rollover schedule. |
| (3) | Average Underwritten Base Rent PSF Rolling excludes vacant space. |
| (4) | The Victoria Creations, Inc. space rolls in 2016; however, the Fantas-eyes, Inc. tenant subleases 5,300 SF of the Victoria Creations space through July 31, 2016, after which the Fantas-eyes tenant has a direct lease for the sublease space, plus an additional approximately 2,400 SF, through July 31, 2019. |
| (5) | The Average Underwritten Base Rent PSF Rolling in 2026 & Beyond includes two of the three 385 Fifth Avenue Property retail tenants, Cohen’s Optical and Peter Dillons, which tenants pay $272.22 and $99.00 PSF annually, respectively. The Cohen’s Optical tenant has direct Fifth Avenue exposure and the Peter Dillons tenant is located on East 36th Street. |
The Market. The 385 Fifth Avenue Property is located within the Murray Hill submarket in the Midtown East Office District of Manhattan on the corner of Fifth Avenue and East 36th Street. As of March 31, 2013, the Midtown East Office District contained approximately 15,587,657 SF of Class B office space in 144 buildings. The total vacancy rate (direct and indirect) for the district was 8.2% and the average direct rental rate was $48.56. The Murray Hill submarket had an overall vacancy rate of 6.4% and a direct weighted average Class B gross rental rate of $43.02 PSF. There are approximately 31 generally competitive buildings with the 385 Fifth Avenue Property, totaling approximately 4.2 million SF with an average occupancy of 82.7%. Two of the competitive buildings, 475 Fifth Avenue and 31 West 34th Street are undergoing renovations and are largely vacant. Excluding these two buildings the average direct occupancy for the competitive set is approximately 91.1%. The following table presents the eight most directly competitive office properties, with a total occupancy of approximately 94.9%
| Competitive Property Summary | ||||||
| Property and Address | Office Area (NRA) | Direct Avail. SF | Sublease Avail. SF | Occupied (Direct) | Occupied (Total) | Direct Asking Rent Low to High |
| 358 Fifth Avenue | 83,733 | 0 | 0 | 100.00% | 100.00% | N/A |
| 366 Fifth Avenue | 137,500 | 14,400 | 0 | 89.53% | 89.53% | $48.00 |
| 389 Fifth Avenue | 105,000 | 0 | 0 | 100.00% | 100.00% | N/A |
| 390 Fifth Avenue | 104,000 | 3,595 | 425 | 96.54% | 96.13% | $39.00 |
| 411 Fifth Avenue | 71,500 | 1,485 | 0 | 97.92% | 97.92% | $39.00 |
| 437 Fifth Avenue | 59,400 | 14,324 | 0 | 75.89% | 75.89% | $42.00-$52.00 |
| 183 Madison Avenue | 170,000 | 648 | 6,097 | 99.62% | 96.03% | $40.00-$55.00 |
| 185 Madison Avenue | 75,800 | 0 | 0 | 100.00% | 100.00% | N/A |
TOTAL AVERAGE | 806,933 100,867 | 34,452 4,307 | 6,522 815 | 95.73% | 94.92% | $39.00-$55.00 |
Source: Appraisal
| This is not a research report and was not prepared by the Underwriters’ research departments. Please see additional important information and qualifications at the end of this Term Sheet. |
T-104
| MSBAM 2013-C12 | 385 Fifth Avenue |
Operating History and Underwritten Net Cash Flow. The following table presents certain information relating to the historical operating performance and the Underwritten Net Cash Flow at the 385 Fifth Avenue Property:
| Cash Flow Analysis | |||||||||||
| 2010 | 2011 | 2012 | UW | UW PSF | |||||||
Base Rent(1) | $4,628,187 | $4,278,130 | $5,041,580 | $5,037,623 | $49.28 | ||||||
| Total Recoveries | $1,213,032 | $1,008,833 | $1,047,383 | $984,090 | $9.63 | ||||||
| Less Vacancy & Credit Loss | $0 | $0 | $0 | ($251,881) | ($2.46) | ||||||
| Effective Gross Income | $5,841,219 | $5,286,963 | $6,088,963 | $5,769,832 | $56.45 | ||||||
| Total Operating Expenses | $2,208,159 | $2,211,343 | $2,313,170 | $2,577,648 | $25.22 | ||||||
| Net Operating Income | $3,633,060 | $3,075,620 | $3,775,793 | $3,192,184 | $31.23 | ||||||
| TI/LC | $0 | $0 | $0 | $334,458 | $3.27 | ||||||
| Capital Expenditures | $0 | $0 | $0 | $20,614 | $0.20 | ||||||
| Net Cash Flow | $3,633,060 | $3,075,620 | $3,775,793 | $2,837,112 | $27.76 | ||||||
| Occupancy % | NAV | NAV | NAV | 95.0% | |||||||
| NOI DSCR | 1.67x | 1.42x | 1.74x | 1.47x | |||||||
| NCF DSCR | 1.67x | 1.42x | 1.74x | 1.31x | |||||||
| NOI Debt Yield | 10.1% | 8.5% | 10.5% | 8.8% | |||||||
| NCF Debt Yield | 10.1% | 8.5% | 10.5% | 7.9% | |||||||
| (1) | Historical Base Rent includes actual property vacancy. |
Escrows and Reserves. The 385 Fifth Avenue Borrower deposited $650,927 in escrow for annual real estate taxes at loan origination and is required to escrow 1/12th of the annual estimated tax payments monthly. The 385 Fifth Avenue Borrower is required to escrow 1/12th of the annual estimated insurance premiums monthly (unless the 385 Fifth Avenue Borrower maintains insurance under an acceptable blanket insurance policy). The 385 Fifth Avenue Borrower is also required to make monthly deposits of $1,718 for replacement reserves, provided that such deposits are not required at any time that the amount then on deposit in the replacement reserve exceeds $103,080. Upon the occurrence of a Victoria Creations Event (as defined below), the 385 Fifth Avenue Borrower is also required to make monthly deposits, commencing in August 2015 through and including July 2016, of $42,000 for TI/LC reserves used solely to pay for tenant improvement and leasing commission expenses incurred in re-tenanting the space leased to Victoria Acquisitions Group, Inc. (“Victoria”) (such space, the “Victoria Space”) pursuant to that certain lease dated August 1, 1993, as amended, with Victoria Creations, Inc. (predecessor in interest to Victoria Creations); provided, that such deposit will not be required once the aggregate amount of such deposits equals $500,000 and the amount of such deposits will be reduced by the product of $42,000 multiplied by a fraction, the numerator of which is the aggregate amount of SF of Victoria Creations Space leased pursuant to the loan agreement for the 385 Fifth Avenue Mortgage Loan and the denominator of which is 18,200.
A “Victoria Creations Event” means (a) Victoria Creations has not renewed its lease pursuant to the renewal provisions thereof on or before July 31, 2015 or (b) (i) the subtenants in the Victoria Creations Space have not entered into direct leases with the 385 Fifth Avenue Borrower or (ii) lease(s) are not entered into pursuant to the loan agreement for the 385 Fifth Avenue Mortgage Loan for the entirety of the Victoria Creations Space on or before July 31, 2015 (which entry must be evidenced by a tenant estoppel certificate from each tenant reasonably acceptable to lender stating that such tenant is in occupancy, open for business and paying full contractual rent under its lease).
Lockbox and Cash Management. A springing hard lockbox is in place with respect to the 385 Fifth Avenue Mortgage Loan (i.e. upon the occurrence of a Cash Sweep Trigger Event (as defined below), the 385 Fifth Avenue Borrower has agreed to establish a lockbox). The 385 Fifth Avenue Mortgage Loan has springing cash management. Provided a Cash Sweep Trigger Event has not occurred, the 385 Fifth Avenue Mortgage Loan has neither a lockbox nor cash management. During the continuance of a Cash Sweep Period (as defined below), funds in the lockbox account are applied on each monthly payment date to pay debt service on the 385 Fifth Avenue Mortgage Loan, to fund the required reserves deposits as described above under “Escrows and Reserves,” to disburse, so long as no event of default has occurred and is continuing, to the 385 Fifth Avenue Borrower the amount of monthly operating expenses not otherwise paid or reserved for and referenced in an annual budget approved by lender together with other amounts incurred by the 385 Fifth Avenue Borrower in connection with the operation and maintenance of the 385 Fifth Avenue Property (including any extraordinary operating expense or capital expenditure not set forth in the annual budget) approved by lender and to remit the remainder to an account to be held by the mortgagee as additional security for the 385 Fifth Avenue Mortgage Loan.
A “Cash Sweep Trigger Event” means (a) the occurrence of an event of default or (b) lender’s determination that the debt service coverage ratio falls below 1.10x for six consecutive calendar months.
A “Cash Sweep Period” commences upon the occurrence of a Cash Sweep Trigger Event and continues until no event of default exists and, if the Cash Sweep Trigger Event was the debt service coverage ratio falling below the required level, the debt service coverage ratio as calculated by lender is at least 1.15x for the immediately preceding six calendar months.
Property Management. The 385 Fifth Avenue Property is managed by Hilson Management Corp., an affiliate of the 385 Fifth Avenue Borrower.
Mezzanine Loan and Preferred Equity. Not permitted.
Additional Secured Indebtedness (not including trade debts). Not permitted.
Release of Property. Not permitted.
| This is not a research report and was not prepared by the Underwriters’ research departments. Please see additional important information and qualifications at the end of this Term Sheet. |
T-105
| MSBAM 2013-C12 | 385 Fifth Avenue |
Terrorism Insurance. Generally, the 385 Fifth Avenue Borrower is required to obtain insurance against acts of terrorism or other similar acts or events (or “fire following”) to the extent such policy is available in an amount determined by lender (but not more than the sum of 100% of replacement costs and twelve months of business interruption insurance).
Expansion, Release and Substitution of Property. Not permitted.
| This is not a research report and was not prepared by the Underwriters’ research departments. Please see additional important information and qualifications at the end of this Term Sheet. |
T-106
(THIS PAGE INTENTIONALLY LEFT BLANK)
| This is not a research report and was not prepared by the Underwriters’ research departments. Please see additional important information and qualifications at the end of this Term Sheet. |
T-107
| MSBAM 2013-C12 | Gwinnett Park |
| Mortgage Loan No. 11 – Gwinnett Park |
| Mortgage Loan Information | Mortgaged Property Information | ||||||
| Mortgage Loan Seller: | CIBC | Single Asset/Portfolio: | Single Asset | ||||
Credit Assessment: (Fitch/KBRA/Moody’s) | NR/NR/NR | Property Address: | 4405 International Boulevard, Norcross, GA 30093 | ||||
| Original Balance: | $31,000,000 | General Property Type: | Mixed Use | ||||
| Cut-off Date Balance: | $31,000,000 | Detailed Property Type: | Industrial/Office | ||||
| % of Initial Pool Balance: | 2.4% | Net Rentable Area: | 981,720 SF | ||||
| Loan Purpose: | Refinance | Cut-off Date Balance Per Unit/SF: | $32 | ||||
| Borrower Name(s): | Gwinnett Park SPE, LLC | Balloon/ARD Balance Per Unit/SF: | $24 | ||||
| Sponsor: | Sperry Equities, LLC | Year Built/Year Renovated: | 1973/1997 | ||||
| Mortgage Rate: | 5.250% | Title Vesting: | Fee | ||||
| Note Date: | 9/27/13 | Property Manager: | Sperry Commercial, Inc. | ||||
| First Payment Date: | 11/1/2013 | ||||||
| Anticipated Repayment Date: | NAP | Underwriting and Financial Information | |||||
| Maturity Date: | 10/1/2023 | UW Revenues: | $5,038,691 | ||||
| IO Period: | NAP | UW Expenses: | $1,582,548 | ||||
| Original Term to Maturity or ARD: | 120 months | UW NOI: | $3,456,144 | ||||
| Seasoning: | 0 months | UW NCF: | $3,112,542 | ||||
| Original Amortization Term: | 300 months | UW NOI DSCR: | 1.55x | ||||
| Loan Amortization Type: | Amortizing | UW NCF DSCR: | 1.40x | ||||
| Interest Accrual Basis: | Actual/360 | UW NOI Debt Yield: | 11.1% | ||||
| Prepayment Provisions: | LO (24); DEF (92); O (4) | UW NCF Debt Yield: | 10.0% | ||||
| Lockbox/Cash Management: | Hard/Springing | UW NCF Debt Yield at Maturity: | 13.3% | ||||
Pari Passu Mortgage Debt: | None | Most Recent NOI (As of): | $4,012,230 (12/31/2012) | ||||
| Subordinate Mortgage Debt: | None | Second Most Recent NOI (As of): | $3,880,818 (12/31/2011) | ||||
| Mezzanine Debt: | None | Third Most Recent NOI (As of): | $3,878,490 (12/31/2010) | ||||
| Reserves | Appraised Value: | $45,500,000 | |||||
| Type | Initial | Monthly | Cap | Appraisal As-of Date: | 6/20/2013 | ||
| RE Tax: | $48,201 | $48,401 | NAP | Cut-off Date LTV Ratio: | 68.1% | ||
| Insurance: | $23,425 | $5,856 | NAP | LTV Ratio at Maturity/ARD: | 51.6% | ||
| Repair and Remediation: | $50,625 | $0 | NAP | Occupancy Rate (As of): | 73.1% (9/3/2013) | ||
| Recurring Replacements: | $275,000 | $12,272 | NAP | 2nd Most Recent Occupancy (As of): | 80.8% (12/31/12) | ||
| TI/LC: | $1,000,000 | $16,362 | $1,500,000 | 3rd Most Recent Occupancy (As of): | 78.6% (12/31/11) | ||
4th Most Recent Occupancy (As of): | 80.8% (12/31/10) | ||||||
The Gwinnett Park mortgage loan is secured by a fee interest in an 18-building suburban industrial/office park located in Norcross, Georgia, a suburb of Atlanta. The Gwinnett Park property is a 981,720 square foot industrial/office complex built between 1973 and 1997 and is situated on 75.15 acres. As of September 3, 2013, the Gwinnett Park property was 73.1% leased. 51% of the square footage at the Gwinnett Park property is built out as office space, and the clear heights of the industrial portion range from 14 feet to 22 feet. The largest tenant is MDI Creative (“MDI”) (5% of the NRA), an office furniture manufacturing company. MDI designs and builds custom furniture for museums, offices, and retail. MDI has been a tenant at the property since May 2009. MDI’s current lease term runs through July 2020. The space is 29% office build out, with the remainder of the space used primarily as show room. No other tenant represents more than 5% of the NRA.
The Gwinnett Park property is located adjacent to Interstate 85 in Norcross, Georgia, approximately eight miles northeast of the Atlanta beltway (Interstate 285) and 15 miles northeast of the Atlanta central business district. This strategic location along a major interstate allows for access to all parts of Atlanta. The surrounding neighborhood consists of a number of commercial uses, primarily office and industrial development, generally located along the major roadways and arterials. There are also shopping centers, automobile dealerships, bank branch facilities, franchise restaurants, and hotels in the surrounding neighborhood.
The sponsor, Sperry Equities, LLC (“Sperry”), acquired the Gwinnett Park property for $60.6 million in 2007 and recapitalized the Gwinnett Park property with the Gwinnett Park mortgage loan and approximately $8 million of new equity. Sperry is a California based full-service commercial real estate investment and management company, specializing in the repositioning of underperforming real estate throughout the nation.
| This is not a research report and was not prepared by the Underwriters’ research departments. Please see additional important information and qualifications at the end of this Term Sheet. |
T-108
| MSBAM 2013-C12 | Deer Springs Town Center |
| Mortgage Loan No. 12 – Deer Springs Town Center |
| Mortgage Loan Information | Mortgaged Property Information | ||||||
| Mortgage Loan Seller: | BANA | Single Asset/Portfolio: | Single Asset | ||||
| Credit Assessment: (Fitch/KBRA/Moody’s) | NR/NR/NR | Property Address: | 6980 N. 5th Street North Las Vegas, NV 89084 | ||||
| Original Balance: | $30,000,000 | General Property Type: | Retail | ||||
| Cut-off Date Balance: | $30,000,000 | Detailed Property Type: | Anchored | ||||
| % of Initial Pool Balance: | 2.4% | Net Rentable Area: | 194,603 SF | ||||
| Loan Purpose: | Refinance | Cut-off Date Balance Per Unit/SF: | $154 | ||||
| Borrower Name: | DSVEGAS II, LLC | Balloon/ARD Balance Per Unit/SF: | $129 | ||||
| Sponsor: | Stolz Real Estate Funds IV, L.P. | Year Built/Year Renovated: | 2009/NAP | ||||
| Mortgage Rate: | 5.490% | Title Vesting: | Fee | ||||
| Note Date: | 9/6/2013 | Property Manager: | Stoltz Management of Delaware, Inc. | ||||
| First Payment Date: | 11/1/2013 | ||||||
| Anticipated Repayment Date: | NAP | Underwriting and Financial Information | |||||
| Maturity Date: | 10/1/2023 | UW Revenues: | $3,188,862 | ||||
| IO Period: | 0 months | UW Expenses: | $495,039 | ||||
| Original Term to Maturity or ARD: | 120 months | UW NOI: | $2,693,823 | ||||
| Seasoning: | 0 months | UW NCF: | $2,560,095 | ||||
| Original Amortization Term: | 360 months | UW NOI DSCR: | 1.32x | ||||
| Loan Amortization Type: | Amortizing | UW NCF DSCR: | 1.25x | ||||
| Interest Accrual Basis: | Actual/360 | UW NOI Debt Yield: | 9.0% | ||||
| Prepayment Provisions: | LO (24); DEF (92); O (4) | UW NCF Debt Yield: | 8.5% | ||||
| Lockbox/Cash Management: | Hard/Springing | UW NCF Debt Yield at Maturity: | 10.2% | ||||
Pari Passu Mortgage Debt: | None | Most Recent NOI (As of): | NAV | ||||
| Subordinate Mortgage Debt: | None | 2nd Most Recent NOI (As of): | NAV | ||||
| Mezzanine Debt: | None | 3rd Most Recent NOI (As of): | NAV | ||||
| Reserves | Appraised Value: | $44,300,000 | |||||
| Type | Initial | Monthly | Cap | Appraisal As-of Date: | 7/24/2013 | ||
| RE Tax: | $22,847 | $11,423 | NAP | Cut-off Date LTV Ratio: | 67.7% | ||
Insurance(1): | $0 | Springing | NAP | LTV Ratio at Maturity/ARD: | 56.7% | ||
| Recurring Replacements: | $0 | $2,305 | $100,000 | Occupancy Rate: | 91.3% (9/4/2013) | ||
| TI/LC: | $0 | $7,683 | NAP | 2nd Most Recent Occupancy: | 96.3% (12/31/2012) | ||
3rd Most Recent Occupancy: | 94.6% (12/31/2011) | ||||||
| (1) | Springing upon the Deer Springs Tower Center borrower’s failure to maintain blanket policy. |
The Deer Springs Town Center mortgage loan is secured by 194,603 SF of a 477,565 SF retail power center built in 2009 in North Las Vegas, NV, approximately nine miles north of the Las Vegas CBD. Deer Springs Town Center is anchored by five national credit tenants occupying 90% of the property, including Toys R Us/Babies R Us (65,705 SF), Michael’s (30,605 SF), Ross Dress for Less (30,168 SF), PetSmart (27,489 SF) and Staples (20,436 SF), and is shadow anchored by Home Depot, Target and Kohl’s. Deer Springs Town Center includes two finished pad sites for future development of up to 10,200 SF of leasable area. As of September 4, 2013, Deer Springs Town Center was 91.3% occupied by seven tenants.
Deer Springs Town Center is located at the intersection of the 215 Beltway and N. 5th Street, two commercial thoroughfares through North Las Vegas. The 215 Beltway is a 53-mile roadway encircling three quarters of the Las Vegas valley and connecting to I-15 and US Highway 95. The expansion of the 215 Beltway has spurred residential growth in the area. Major employers in the immediate area of Deer Springs Town Center are Nellis Air Force Base, Centennial Auto Mall, Centennial Hills Hospital and Medical Center and the Aliante Station casino. The estimated 2013 population within a one-, three- and five-mile radius of Deer Springs Town Center was 7,609, 83,144 and 199,192, respectively. The 2013 average household income within a one-, three- and five-mile radius of Deer Springs Town Center was $62,372, $68,105 and $67,003, respectively.
The Deer Springs Town Center sponsor is Stoltz Real Estate Fund IV, L.P., a fund sponsored by Stoltz Real Estate Partners (“Stoltz”). Stoltz is a real estate investment, management and development company that currently owns and manages properties of approximately $1.4 billion in asset value comprised of approximately 9 million SF of retail, office, residential, mixed use, industrial and land assets nationwide.
| This is not a research report and was not prepared by the Underwriters’ research departments. Please see additional important information and qualifications at the end of this Term Sheet. |
T-109
| MSBAM 2013-C12 | ADG 5 Portfolio |
| Mortgage Loan Information | Mortgaged Property Information | ||||||
| Mortgage Loan Seller: | BANA | Single Asset/Portfolio: | Portfolio | ||||
Credit Assessment: (Fitch/KBRA/Morningstar) | NR/NR/NR | Property Address(1): | Various | ||||
| Original Balance: | $26,720,000 | General Property Type: | Manufactured Housing | ||||
| Cut-off Date Balance: | $26,618,825 | Detailed Property Type: | Manufactured Housing | ||||
| % of Initial Pool Balance: | 2.1% | Number of Pads(1): | 1,139 Pads | ||||
| Loan Purpose: | Refinance | Cut-off Date Balance Per Unit/SF: | $23,370 | ||||
| Borrower Name: | Great Lakes Communities Wisconsin, LLC; Reeseville Associates, LLC | Balloon/ARD Balance Per Unit/SF: | $18,954 | ||||
Year Built/Year Renovated(1): | Various | ||||||
| Sponsor: | Bruce Arbit; Jerry Benjamin; M. Nichol Padway; James Reitzner | Title Vesting: | Fee | ||||
| Property Manager: | Asset Development Group, Inc. | ||||||
| Mortgage Rate: | 4.407% | ||||||
| Note Date: | 6/11/2013 | ||||||
| First Payment Date: | 8/1/2013 | ||||||
| Anticipated Repayment Date: | NAP | Underwriting and Financial Information | |||||
| Maturity Date: | 7/1/2023 | UW Revenues: | $3,929,587 | ||||
| IO Period: | 0 months | UW Expenses: | $1,420,429 | ||||
| Original Term to Maturity or ARD: | 120 months | UW NOI: | $2,509,158 | ||||
| Seasoning: | 3 months | UW NCF: | $2,452,208 | ||||
| Original Amortization Term: | 360 months | UW NOI DSCR: | 1.56x | ||||
| Loan Amortization Type: | Amortizing | UW NCF DSCR: | 1.53x | ||||
| Interest Accrual Basis: | Actual/360 | UW NOI Debt Yield: | 9.4% | ||||
| Prepayment Provisions: | LO (27); DEF (89); O (4) | UW NCF Debt Yield: | 9.2% | ||||
| Lockbox/Cash Management: | Springing/Springing | UW NCF Debt Yield at Maturity: | 11.4% | ||||
Pari Passu Mortgage Debt: | None | Most Recent NOI (As of): | $2,497,242 (3/31/2013 TTM) | ||||
| Subordinate Mortgage Debt: | None | 2nd Most Recent NOI (As of): | $2,583,456 (12/31/2012) | ||||
| Mezzanine Debt: | None | 3rd Most Recent NOI (As of): | $2,381,461 (12/31/2011) | ||||
| Reserves | Appraised Value(1): | $35,870,000 | |||||
| Type | Initial | Monthly | Cap | Appraisal As-of Date(1): | Various | ||
| RE Tax: | $17,134 | $17,134 | NAP | Cut-off Date LTV Ratio: | 74.2% | ||
Insurance(2): | $0 | Springing | NAP | LTV Ratio at Maturity/ARD: | 60.2% | ||
| Deferred Maintenance: | $339,589 | $0 | NAP | Occupancy Rate: | 88.1% (6/5/2013) | ||
| Recurring Replacements: | $0 | $4,746 | NAP | 2nd Most Recent Occupancy: | 85.6% (12/31/2012) | ||
3rd Most Recent Occupancy: | 83.3% (12/31/2011) | ||||||
| (1) | Individual property details are shown on the table below. |
| (2) | Springing upon the ADG 5 Portfolio borrower’s failure to maintain blanket policy. |
The ADG 5 Portfolio mortgage loan is secured by the fee interests in nine manufactured housing communities across Wisconsin. The properties range between 53 and 192 units and were built between 1965 and 1985. As of June 5, 2013, the weighted average occupancy for the portfolio was 88.1%.
The properties are managed by Asset Development Group, Inc. (“ADG”), an affiliate of the ADG 5 Portfolio borrower. ADG is the largest owner/manager of land lease or manufactured housing communities in Wisconsin and the 29th largest in the country. Currently ADG manages 54 manufactured housing communities and three multi-family buildings, with a total of 5,699 units in Wisconsin, Minnesota, Michigan, Iowa, Ohio and Maryland.
The ADG 5 Portfolio sponsor is Bruce Arbit, Jerry Benjamin, M. Nichol Padway and James Reitzner, each a partner in ADG. The ADG 5 Portfolio sponsor is the same as the sponsor for the ADG 2 Portfolio mortgage loan, which is also included in the MSBAM 2013-C12 transaction. ADG currently manages all twelve manufactured housing communities financed between the two loans, which have a total of 1,454 units across Wisconsin, and a weighted average occupancy as of June 5, 2013 of 87.3%.
Releases of individual properties are permitted through partial defeasance subject to various conditions, including but not limited to, delivery of defeasance collateral equal to 125% of the related allocated loan amount and a debt service coverage test.
| This is not a research report and was not prepared by the Underwriters’ research departments. Please see additional important information and qualifications at the end of this Term Sheet. |
T-110
| MSBAM 2013-C12 | ADG 5 Portfolio |
| Property/Location | Address | City, State | Allocated Original Loan Amount | % of Allocated Loan Amount | No. of Units | Year Built | Year Reno-vated | Appraised Value | Appraised Value as of Date | % Leased as of 6/5/13 | |
| Spacious Acres | W1211 Lakeview Drive | Sullivan, WI | $6,825,000 | 25.5% | 182 | 1970 | NAP | $9,100,000 | 4/26/2013 | 93.4% | |
| Bridgeview Gardens | 888 East Shady Lane | Neenah, WI | $5,602,500 | 21.0% | 192 | 1974 | NAP | $7,470,000 | 5/3/2013 | 92.2% | |
| Majestic Hills | 1217 Madison Street | Beaver Dam, WI | $4,500,000 | 16.8% | 168 | 1985 | NAP | $6,000,000 | 4/26/2013 | 98.2% | |
| Monroe Estates | 560 West 21st Street | Monroe, WI | $2,272,500 | 8.5% | 100 | 1970 | NAP | $3,030,000 | 4/26/2013 | 92.0% | |
| Lakeshore Terrace | 2136 20 1/8th Avenue | Rice Lake, WI | $2,147,500 | 8.0% | 135 | 1970 | NAP | $3,100,000 | 5/3/2013 | 74.8% | |
| Springbrook Village | 2601 Colley Road | Beloit, WI | $2,130,000 | 8.0% | 136 | 1972 | 2004 | $2,840,000 | 4/26/2013 | 89.7% | |
| Camelot Terrace | 1140 Arthur Blvd | Pulaski, WI | $1,552,500 | 5.8% | 90 | 1970 | NAP | $2,070,000 | 4/26/2013 | 92.2% | |
| Reeseville Acres | 404 Lincoln Avenue | Reeseville, WI | $975,000 | 3.6% | 53 | 1975 | NAP | $1,300,000 | 4/26/2013 | 77.4% | |
| Forest Junction | Highway 57 & Highway 10 | Forest Junction, WI | $715,000 | 2.7% | 83 | 1965 | NAP | $960,000 | 4/26/2013 | 62.7% | |
| Total | $26,720,000 | 100.0% | 1139 | $35,870,000 |
| This is not a research report and was not prepared by the Underwriters’ research departments. Please see additional important information and qualifications at the end of this Term Sheet. |
T-111
| MSBAM 2013-C12 | Nitro Marketplace |
| Mortgage Loan Information | Mortgaged Property Information | ||||||
| Mortgage Loan Seller: | MSMCH | Single Asset/Portfolio: | Single Asset | ||||
Credit Assessment: (Fitch/KBRA/Moody’s) | NR/NR/NR | Property Address: | 100-300 Nitro Boulevard Nitro, WV 25143 | ||||
| Original Balance: | $24,500,000 | General Property Type: | Retail | ||||
| Cut-off Date Balance: | $24,500,000 | Detailed Property Type: | Anchored | ||||
| % of Initial Pool Balance: | 1.9% | Net Rentable Area: | 440,949 SF | ||||
| Loan Purpose: | Refinance | Cut-off Date Balance Per Unit/SF: | $56 | ||||
| Borrower Name(s): | THF Nitro Development Limited Liability Company | Balloon/ARD Balance Per Unit/SF: | $56 | ||||
| Year Built/Year Renovated: | 1998/NAP | ||||||
| Sponsor: | E. Stanley Kroenke | Title Vesting: | Fee | ||||
| Mortgage Rate: | 4.030% | Property Manager: | TKG Management, Inc. | ||||
| Note Date: | 9/25/2013 | ||||||
| First Payment Date: | 11/1/2013 | ||||||
| Anticipated Repayment Date: | NAP | Underwriting and Financial Information | |||||
| Maturity Date: | 10/1/2018 | UW Revenues: | $3,723,988 | ||||
| IO Period: | 60 months | UW Expenses: | $789,638 | ||||
| Original Term to Maturity or ARD: | 60 months | UW NOI: | $2,934,350 | ||||
| Seasoning: | 0 months | UW NCF: | $2,716,854 | ||||
| Original Amortization Term: | 0 months | UW NOI DSCR: | 2.93x | ||||
| Loan Amortization Type: | Full IO | UW NCF DSCR: | 2.71x | ||||
| Interest Accrual Basis: | Actual/360 | UW NOI Debt Yield: | 12.0% | ||||
| Prepayment Provisions: | LO (24); DEF (32); O (4) | UW NCF Debt Yield: | 11.1% | ||||
| Lockbox/Cash Management: | Springing/Springing | UW NCF Debt Yield at Maturity: | 11.1% | ||||
Pari Passu Mortgage Debt: | None | Most Recent NOI (As of): | $2,989,100 (12/31/2012) | ||||
| Subordinate Mortgage Debt: | None | Second Most Recent NOI (As of): | $3,033,901 (12/31/2011) | ||||
| Mezzanine Debt: | None | Third Most Recent NOI (As of): | $3,241,130 (12/31/2010) | ||||
| Reserves | Appraised Value: | $41,400,000 | |||||
| Type | Initial | Monthly | Cap | Appraisal As-of Date: | 6/5/2013 | ||
| RE Tax: | $0 | $0 | NAP | Cut-off Date LTV Ratio: | 59.2% | ||
| Insurance: | $0 | $0 | NAP | LTV Ratio at Maturity/ARD: | 59.2% | ||
| Recurring Replacements: | $0 | $0 | NAP | Occupancy Rate: | 98.9% (8/22/2013) | ||
| TI/LC: | $0 | $0 | NAP | 2nd Most Recent Occupancy: | 93.4% (12/31/2012) | ||
3rd Most Recent Occupancy: | 98.8% (12/31/2011) | ||||||
The Nitro Marketplace mortgage loan is secured by a 440,949 SF Wal-Mart (NYSE: WMT) (200,084 SF) and Lowe’s (NYSE: LOW) (131,575 SF) anchored shopping center in Nitro, West Virginia, approximately 10 miles from downtown Charleston, West Virginia, the state’s capitol. The mortgaged property has 25 tenants and two vacant in-line spaces. Other major tenants include Burke’s Outlet (25,000 SF), and Staples (NASDAQ: SPLS) (24,000 SF). The Wal-Mart lease began in 1997 and has a current expiration of August 31, 2026, with six 5-year lease renewal options. The Lowe’s lease began in 1997 and has a current expiration of November 30, 2028, with six 5-year lease renewal options. Wal-Mart does not report sales at this location. Lowe’s reported annual sales of $290 PSF for the 12 month period ending May 31, 2012. The mortgaged property has 2,414 surface parking spaces.
According to the appraisal, the estimated 2013 population within a 5 mile radius is 55,679, with an estimated average household income of $57,490. As of March 31, 2013, the greater Charleston market contained approximately 15.7 million SF of retail space and was 97.1% occupied with an average rental rate of $12.53 PSF. The average occupancy of the five comparable properties was 99%. The mortgaged property is located approximately one-quarter mile west of I-64.
| This is not a research report and was not prepared by the Underwriters’ research departments. Please see additional important information and qualifications at the end of this Term Sheet. |
T-112
| MSBAM 2013-C12 | Water Tower Square |
| Mortgage Loan No. 15 – Water Tower Square |
| Mortgage Loan Information | Mortgaged Property Information | ||||||
| Mortgage Loan Seller: | CIBC | Single Asset/Portfolio: | Single Asset | ||||
Credit Assessment: (Fitch/KBRA/Moody’s) | NR/NR/NR | Property Address: | 751 Horsham Road, Lansdale, PA 19446 | ||||
| Original Balance: | $24,200,000 | General Property Type: | Retail | ||||
| Cut-off Date Balance: | $24,172,857 | Detailed Property Type: | Anchored | ||||
| % of Initial Pool Balance: | 1.9% | Net Rentable Area: | 262,788 SF | ||||
| Loan Purpose: | Refinance | Cut-off Date Balance Per Unit/SF: | $92 | ||||
| Borrower Name(s): | Water Tower Square Associates | Balloon/ARD Balance Per Unit/SF: | $77 | ||||
| Sponsor: | Kenneth N. Goldenberg | Year Built/Year Renovated: | 1993/NAP | ||||
| Mortgage Rate: | 5.370% | Title Vesting: | Fee | ||||
| Note Date: | 8/22/2013 | Property Manager: | Goldenberg Management, Inc. | ||||
| First Payment Date: | 10/1/2013 | ||||||
| Anticipated Repayment Date: | NAP | Underwriting and Financial Information | |||||
| Maturity Date: | 9/1/2023 | UW Revenues: | $3,159,361 | ||||
| IO Period: | NAP | UW Expenses: | $866,464 | ||||
| Original Term to Maturity or ARD: | 120 months | UW NOI: | $2,292,897 | ||||
| Seasoning: | 1 month | UW NCF: | $2,106,318 | ||||
| Original Amortization Term: | 360 months | UW NOI DSCR: | 1.41x | ||||
| Loan Amortization Type: | Amortizing | UW NCF DSCR: | 1.30x | ||||
| Interest Accrual Basis: | Actual/360 | UW NOI Debt Yield: | 9.5% | ||||
| Prepayment Provisions: | LO (25); DEF (91); O (4) | UW NCF Debt Yield: | 8.7% | ||||
| Lockbox/Cash Management: | Hard/Springing | UW NCF Debt Yield at Maturity: | 10.4% | ||||
Pari Passu Mortgage Debt: | None | Most Recent NOI (As of): | $2,542,373 (12/31/2012) | ||||
| Subordinate Mortgage Debt: | None | Second Most Recent NOI (As of): | $2,399,842 (12/31/2011) | ||||
Mezzanine Debt(1): | Future Permitted | Third Most Recent NOI (As of): | $2,623,302 (12/31/2010) | ||||
| Reserves | Appraised Value(5): | $31,000,000 | |||||
| Type | Initial | Monthly | Cap | Appraisal As-of Date: | 5/2/2013 | ||
| RE Tax: | $80,932 | $48,203 | NAP | Cut-off Date LTV Ratio: | 78.0% | ||
| Insurance: | $35,613 | $4,460 | NAP | LTV Ratio at Maturity/ARD: | 65.1% | ||
| Recurring Replacements: | $350,000 | $3,285 | NAP | Occupancy Rate (As of): | 84.3% (7/2/2013) | ||
| TI/LC: | $0 | $12,263 | $375,000 | 2nd Most Recent Occupancy (As of): | 90.5% (12/31/2012) | ||
Other(2): | $200,000 | $0 | NAP | 3rd Most Recent Occupancy (As of): | 90.5% (12/31/2011) | ||
Other(3): | $1,750,000 | $0 | NAP | 4th Most Recent Occupancy (As of): | 100% (12/31/2010) | ||
Other(4): | $0 | Springing | NAP | ||||
| (1) | Permitted future mezzanine loan: Provided that (i) the Water Tower Square mortgage loan lender and each rating agency approves all terms of the mezzanine financing, (ii) the aggregate principal amount of the mezzanine financing and the Water Tower Square mortgage loan is less than or equal to 80% of the appraised value, iii) the debt service coverage ratio for the Water Tower Square property is at least 1.15x, (iv) the debt yield for the Water Tower Square property is at least 8.25% and (v) the mezzanine financing is not secured by the Water Tower Square property |
| (2) | The Planet Fitness rent reserve shall be disbursed to the related borrower upon the delivery of an estoppel to the Water Tower Square mortgage loan lender to evidence that Planet Fitness is in actual possession of and conducting business with the public from the space and is paying full unabated rent and all CAM charges pursuant to the Planet Fitness lease. |
| (3) | The Achievement Reserve or portions thereof shall be released to the related borrower in amounts equal to the lesser of (i) an amount of funds that, after giving effect to the disbursement, the debt yield shall be equal to or greater than 9% based on existing underwritten NOI divided by the outstanding Water Tower Square mortgage loan amount, and (ii) $1,750,000 times the percentage of rentable square footage leased in the space previously leased to Sports Authority. The disbursement of each advance shall be at least $250,000 except for the final distribution. |
| (4) | In the event that Home Depot does not give notice to exercise their renewal option, the related borrower shall make deposits to the Home Depot cash sweep reserve for the payment of leasing costs in connection with releasing the space demised under the Home Depot lease. |
| (5) | The as-is value is $31.0MM and the as-stabilized value is $34.3MM. The Water Tower Square mortgage loan amount excluding the achievement reserve is $22.45MM, resulting in an as-is LTV of 72.4%, while the full the Water Tower Square mortgage loan amount results in an as-stabilized LTV of 70.6% which would occur if the conditions of the Achievement Reserve release are met. |
The Water Tower Square mortgage loan is secured by a fee interest in a 262,788 square foot retail property located in Lansdale, Pennsylvania, a suburb of Philadelphia. The Water Tower Square property is a Home Depot anchored power center built in 1993. As of July 2, 2013, the Water Tower Square property was 84.3% leased. The largest tenant is Home Depot which currently occupies 142,888 square feet (54.4% of NRA). Home Depot’s original lease started in 1993 for a total of 127,550 square feet and was expanded by 15,338 square feet in March of 2004. The Home Depot lease runs through January 2019 and has four 5-year extension options. Other tenants include Frank’s Theaters (33,761 SF/12.9% of NRA), Planet Fitness (24,907 SF/9.5% of NRA) and OfficeMax (20,087 SF/7.6% of NRA).
The Water Tower Square property is located approximately 24-miles north of Philadelphia and adjacent to Route 309, a major retail corridor in the area that includes a diverse group of retail properties including the Montgomery Mall. The sponsor, Kenneth N. Goldenberg, is the principal of The Goldenberg Group. The Goldenberg Group currently owns and manages approximately 6 million square feet of retail space throughout the greater Philadelphia area. The sponsor is the original developer of the Water Tower Square property and has managed it since it was constructed in 1993.
| This is not a research report and was not prepared by the Underwriters’ research departments. Please see additional important information and qualifications at the end of this Term Sheet. |
T-113
| MSBAM 2013-C12 | Avon Marketplace |
| Mortgage Loan No. 16 – Avon Marketplace |
| Mortgage Loan Information | Mortgaged Property Information | ||||||
| Mortgage Loan Seller: | MSMCH | Single Asset/Portfolio: | Single Asset | ||||
Credit Assessment: (Fitch/KBRA/Moody’s) | Property Address: | 380 West Main Street Avon, CT 06001 | |||||
| NR/NR/NR | |||||||
| Original Balance: | $24,000,000 | General Property Type: | Retail | ||||
| Cut-off Date Balance: | $24,000,000 | Detailed Property Type: | Anchored | ||||
| % of Initial Pool Balance: | 1.9% | Net Rentable Area: | 79,362 SF | ||||
| Loan Purpose: | Refinance | Cut-off Date Balance Per Unit/SF: | $302 | ||||
| Borrower Name(s): | Avon Marketplace Investors LLC | Balloon/ARD Balance Per Unit/SF: | $279 | ||||
| Sponsor: | Waldman Associates Limited Partnership | Year Built/Year Renovated: | 1994/2009 | ||||
| Mortgage Rate: | 4.820% | Title Vesting: | Fee | ||||
| Note Date: | 8/8/2013 | Property Manager: | David Adam Realty, Inc. | ||||
| First Payment Date: | 10/1/2013 | ||||||
| Anticipated Repayment Date: | NAP | Underwriting and Financial Information | |||||
| Maturity Date: | 9/1/2023 | UW Revenues: | $3,028,793 | ||||
| IO Period: | 60 months | UW Expenses: | $810,631 | ||||
| Original Term to Maturity or ARD: | 120 months | UW NOI: | $2,218,162 | ||||
| Seasoning: | 1 month | UW NCF: | $2,094,754 | ||||
| Original Amortization Term: | 360 months | UW NOI DSCR: | 1.46x | ||||
| Loan Amortization Type: | Partial IO | UW NCF DSCR: | 1.38x | ||||
| Interest Accrual Basis: | Actual/360 | UW NOI Debt Yield: | 9.2% | ||||
| Prepayment Provisions: | LO (25); DEF (91); O (4) | UW NCF Debt Yield: | 8.7% | ||||
| Lockbox/Cash Management: | Hard/Springing | UW NCF Debt Yield at Maturity: | 9.5% | ||||
Pari Passu Mortgage Debt: | None | Most Recent NOI (As of): | $2,293,993 (12/31/2012) | ||||
| Subordinate Mortgage Debt: | None | Second Most Recent NOI (As of): | $1,897,302 (12/31/2011) | ||||
| Mezzanine Debt: | None | Third Most Recent NOI (As of): | $1,533,366 (12/31/2010) | ||||
| Reserves | Appraised Value: | $35,800,000 | |||||
| Type | Initial | Monthly | Cap | Appraisal As-of Date: | 7/7/2013 | ||
| RE Tax: | $63,500 | $31,750 | NAP | Cut-off Date LTV Ratio: | 67.0% | ||
| Insurance: | $0 | Springing | NAP | LTV Ratio at Maturity/ARD: | 61.8% | ||
| Recurring Replacements: | $0 | $1,653 | NAP | Occupancy Rate: | 100.0% (9/1/2013) | ||
| TI/LC: | $250,000 | $10,714 | $250,000 | 2nd Most Recent Occupancy: | 96.0% (12/31/2012) | ||
| Deferred Maintenance: | $1,300 | $0 | NAP | 3rd Most Recent Occupancy: | 95.6% (12/31/2011) | ||
The Avon Marketplace mortgage loan is secured by a 79,362 SF, two-building lifestyle retail center in Avon, Connecticut, approximately 9 miles west of the Hartford CBD. The property is surrounded by several other community and neighborhood centers occupied by national retailers such as Wal-Mart, Best Buy, Staples, Stop & Shop, Kohl’s, Dick’s Sporting Goods, The Gap, Victoria Secret, Bed Bath & Beyond and Old Navy. It shares an entrance from US Route 44 with the Simsbury Commons, a 256,000 SF community shopping center. The property is 100% leased, as of a September 1, 2013 rent roll, to 17 tenants, the largest 5 of which are Eastern Mountain Sports (“EMS”) (14,436 SF), The Gap/Gap Body (“The Gap”) (11,730 SF), Ulta Salon (11,270 SF), Bertucci’s Restaurant (6,495 SF), and The Orvis Company (5,000 SF). EMS reported 2012 sales of $204 PSF, Gap reported sales of $293 PSF, Bertucci’s reported sales of $327 PSF and Orvis reported sales of $196 PSF.
Estimated 2013 population and average household income within a 5 mile radius of the property are 51,210 and $141,165, respectively. The property is within the North Hartford submarket. As of March 2013, the combined submarket community and neighborhood retail vacancy was approximately 4.3%, with average asking rents of $19.71 PSF. The five most competitive retail centers averaged approximately 95% occupancy, with the adjacent Simsbury Commons at 97% occupancy.
| This is not a research report and was not prepared by the Underwriters’ research departments. Please see additional important information and qualifications at the end of this Term Sheet. |
T-114
| MSBAM 2013-C12 | Shops at Val Vista |
| Mortgage Loan Information | Mortgaged Property Information | ||||||
| Mortgage Loan Seller: | BANA | Single Asset/Portfolio: | Single Asset | ||||
| Credit Assessment: (Fitch/KBRA/Moody’s) | NR/NR/NR | Property Address: | 2470-2586 South Val Vista Drive; 1397-1451 East Williams Field, Gilbert, AZ 85295 | ||||
| Original Balance: | $23,000,000 | General Property Type: | Retail | ||||
| Cut-off Date Balance: | $22,971,798 | Detailed Property Type: | Anchored | ||||
| % of Initial Pool Balance: | 1.8% | Net Rentable Area: | 170,489 SF | ||||
| Loan Purpose: | Refinance | Cut-off Date Balance Per Unit/SF: | $135 | ||||
| Borrower Name: | Gilbert Center Holdings, LLC | Balloon/ARD Balance Per Unit/SF: | $124 | ||||
| Sponsor: | Sean Leoni | Year Built/Year Renovated: | 2006/NAP | ||||
| Mortgage Rate: | 4.890% | Title Vesting: | Fee | ||||
| Note Date: | 8/27/2013 | Property Manager: | Capital Asset Management, LLC | ||||
| First Payment Date: | 10/1/2013 | ||||||
| Anticipated Repayment Date: | NAP | Underwriting and Financial Information | |||||
| Maturity Date: | 9/1/2018 | UW Revenues: | $2,955,171 | ||||
| IO Period: | 0 months | UW Expenses: | $780,070 | ||||
| Original Term to Maturity or ARD: | 60 months | UW NOI: | $2,175,101 | ||||
| Seasoning: | 1 month | UW NCF: | $1,978,721 | ||||
| Original Amortization Term: | 360 months | UW NOI DSCR: | 1.49x | ||||
| Loan Amortization Type: | Amortizing | UW NCF DSCR: | 1.35x | ||||
| Interest Accrual Basis: | Actual/360 | UW NOI Debt Yield: | 9.5% | ||||
| Prepayment Provisions: | LO (25); DEF (31);O (4) | UW NCF Debt Yield: | 8.6% | ||||
| Lockbox/Cash Management: | Hard/Springing | UW NCF Debt Yield at Maturity: | 9.3% | ||||
Pari Passu Mortgage Debt: | None | Most Recent NOI (As of): | $1,998,119 (12/31/2012) | ||||
| Subordinate Mortgage Debt: | None | 2nd Most Recent NOI (As of): | $2,003,246 (12/31/2011) | ||||
| Mezzanine Debt: | None | 3rd Most Recent NOI (As of): | NAV | ||||
| Reserves | Appraised Value: | $33,900,000 | |||||
| Type | Initial | Monthly | Cap | Appraisal As-of Date: | 5/8/2013 | ||
| RE Tax: | $28,880 | $28,880 | NAP | Cut-off Date LTV Ratio: | 67.8% | ||
Insurance(1): | $0 | Springing | NAP | LTV Ratio at Maturity/ARD: | 62.6% | ||
| Recurring Replacements: | $0 | $2,131 | NAP | Occupancy Rate: | 88.2% (7/31/2013) | ||
| TI/LC: | $0 | $15,000 | $540,000 | 2nd Most Recent Occupancy: | 83.0% (12/31/2012) | ||
Other(2): | $1,032,873 | $0 | NAP | 3rd Most Recent Occupancy: | 84.9% (12/31/2011) | ||
| (1) | Springing upon the Shops at Val Vista borrower’s failure to maintain blanket policy. |
| (2) | At loan closing, the Shops at Val Vista borrower deposited $1,000,000 in a holdback reserve pending receipt of an estoppel relating to the High Tide expansion space and $32,873 in a rent reserve pending receipt of estoppels from five separate tenants. The Shops at Val Vista borrower has a future requirement to deposit all excess cash as additional collateral for the loan should Sprouts vacate, go dark or be involved in any bankruptcy. |
The Shops at Val Vista mortgage loan is secured by a 170,489 SF retail center built in 2006 in Gilbert, AZ, approximately 22 miles southeast of downtown Phoenix. Shops at Val Vista is anchored by Sprouts (30,497 SF), a credit rated specialty grocery chain based in Arizona, under a lease expiring March, 2022 with four five-year renewal options. Shops at Val Vista is junior anchored by Fitness Evolution, LLC (30,099 SF), Dollar Tree (14,845 SF), Salon Boutique (10,702 SF) and Tuesday Morning (10,617 SF), and is shadow anchored by Kohl’s. As of July 31, 2013, Shops at Val Vista was 88.2% occupied by 26 tenants.
Shops at Val Vista is situated approximately one mile from the San Tan Freeway, six miles from the Superstition Springs Freeway and thirteen miles from Interstate 10 in the town of Gilbert, a residential neighborhood and developing employment center for the East Valley portion of Phoenix. Within three miles of Shops at Val Vista, there are 2,372 apartment units and daytime employment includes approximately 1,839 businesses and 11,536 employees. Major employers in the area include Banner Health System, Wells Fargo, Bank of America and Intel Corp. The estimated 2013 population within a one-, three- and five-mile radius of Shops at Val Vista was 11,116, 91,264 and 252,091, respectively. The 2013 average household income within a one-, three- and five-mile radius of Shops at Val Vista was $95,282, $87,276 and $79,974, respectively.
The Shops at Val Vista sponsor is Sean Leoni. Mr. Leoni has been involved in real estate investing for over 18 years, primarily acquiring and developing single tenant free standing buildings with national credit tenants. The Shops at Val Vista is managed by Capital Asset Management, who currently manages over 1.6 million SF of commercial space throughout Arizona.
| This is not a research report and was not prepared by the Underwriters’ research departments. Please see additional important information and qualifications at the end of this Term Sheet. |
T-115
| MSBAM 2013-C12 | Hilton Garden Inn – Toledo Perrysburg |
| Mortgage Loan Information | Mortgaged Property Information | ||||||
| Mortgage Loan Seller: | BANA | Single Asset/Portfolio: | Single Asset | ||||
| Credit Assessment: (Fitch/Kroll/Moody’s) | NR/NR/NR | Property Address: | 6165 Levis Commons Boulevard Perrysburg, OH 43551 | ||||
| Original Balance: | $22,400,000 | General Property Type: | Hospitality | ||||
| Cut-off Date Balance: | $22,400,000 | Detailed Property Type: | Limited Service | ||||
| % of Initial Pool Balance: | 1.8% | Number of Rooms: | 184 Rooms | ||||
| Loan Purpose: | Refinance | Cut-off Date Balance Per Room: | $121,739 | ||||
| Borrower Name: | LC Hotel SPE LLC | Balloon/ARD Balance Per Room: | $112,837 | ||||
| Sponsor: | Robert F. Voelker | Year Built/Year Renovated: | 2008/NAP | ||||
| Mortgage Rate: | 5.230% | Title Vesting: | Leasehold | ||||
| Note Date: | 9/20/2013 | Property Manager: | Gateway Hospitality Group, Inc. | ||||
| First Payment Date: | 11/1/2013 | ||||||
| Anticipated Repayment Date: | NAP | Underwriting and Financial Information | |||||
| Maturity Date: | 10/1/2018 | UW Revenues: | $9,551,333 | ||||
| IO Period: | 0 months | UW Expenses: | $6,392,395 | ||||
| Original Term to Maturity or ARD: | 60 months | UW NOI: | $3,158,938 | ||||
| Seasoning: | 0 months | UW NCF: | $2,776,885 | ||||
| Original Amortization Term: | 360 months | UW NOI DSCR: | 2.13x | ||||
| Loan Amortization Type: | Amortizing | UW NCF DSCR: | 1.88x | ||||
| Interest Accrual Basis: | Actual/360 | UW NOI Debt Yield: | 14.1% | ||||
| Prepayment Provisions: | LO (24); DEF (32); O (4) | UW NCF Debt Yield: | 12.4% | ||||
| Lockbox/Cash Management: | Hard/Springing | UW NCF Debt Yield at Maturity: | 13.4% | ||||
Pari Passu Mortgage Debt: | None | Most Recent NOI (As of): | $3,314,163 (6/30/2013 TTM) | ||||
| Subordinate Mortgage Debt: | None | 2nd Most Recent NOI (As of): | $3,114,696 (12/31/2012) | ||||
| Mezzanine Debt: | None | 3rd Most Recent NOI (As of): | $2,624,070 (12/31/2011) | ||||
| Reserves | Appraised Value: | $32,000,000 | |||||
| Type | Initial | Monthly | Cap | Appraisal As-of Date: | 4/24/2013 | ||
| RE Tax: | $190,439 | $42,295 | NAP | Cut-off Date LTV Ratio: | 70.0% | ||
Insurance(1): | $0 | Springing | NAP | LTV Ratio at Maturity/ARD: | 64.9% | ||
| Immediate Repairs: | $0 | $0 | NAP | Occupancy Rate: | 79.3% (4/30/2013) | ||
| Recurring Replacements: | $0 | $31,838 | NAP | 2nd Most Recent Occupancy: | 78.4% (12/31/2012) | ||
3rd Most Recent Occupancy: | 77.1% (12/31/2011) | ||||||
| (1) | Springing upon event of default or the Hilton Garden Inn – Toledo Perrysburg borrower’s failure to maintain blanket policy. |
The Hilton Garden Inn - Toledo Perrysburg mortgage loan is secured by the leasehold interest in a seven-story, 184-room limited service hotel, constructed in 2008 as a part of a mixed use development known as Levis Commons which provides upscale retailers and restaurants, a 12-screen movie theater, and office and residential developments (which are not included in this collateral for the Hilton Garden Inn – Toledo Perrysburg mortgage loan) in the immediate vicinity to the hotel. The Hilton Garden Inn – Toledo Perrysburg is situated within one mile of Interstate 475, which is the beltway that travels around the Toledo metropolitan area, in Perrysburg, OH, 11 miles southwest of the Toledo CBD. Within one mile of the hotel are the world headquarters for Owens-Illinois, Inc., a Fortune 500 company which develops glass products, ProMedica, a nonprofit healthcare organization, and Bowling Green State University, with a current enrollment of 21,000 students. Demand segmentation at the hotel is approximately 55% commercial, 35% meeting and group, and 10% leisure.
The Hilton Garden Inn - Toledo Perrysburg includes 99 king rooms, 75 double-double rooms and ten king suites, and offers a restaurant, lounge, 15,876 SF of meeting space, a 9,856 SF flexible space ballroom, an indoor swimming pool, business center and fitness center. The hotel is operating under a franchise agreement with Hilton Inns, Inc. that runs through June 11, 2028. The ground lease securing the Hilton Garden Inn – Toledo Perrysburg mortgage loan runs through September 20, 2112.
The Hilton Garden Inn - Toledo Perrysburg property had trailing twelve months ended April 30, 2013 ADR of $120.81, average occupancy of 79.3% and RevPAR of $95.78. Its 2012 ADR, occupancy and RevPAR penetration were 130.5%, 135.1% and 176.2% respectively. The hotel’s primary competitive set, consisting of six hotels with 1,042 rooms, including the Hilton Garden Inn - Toledo Perrysburg, had a trailing twelve months ended April 30, 2013 estimated ADR of $91.54, average occupancy of 58.4% and RevPAR of $53.50. There is no known new supply either proposed or under construction which would compete with the Hilton Garden Inn – Toledo Perrysburg property.
The Hilton Garden Inn - Toledo Perrysburg sponsor is Robert F. Voelker, the President and CEO of Gateway Hospitality Group (“GHG”) which manages and/or owns 14 hotels, including the Hilton Garden Inn – Toledo Perrysburg. Prior to working with GHG, Mr. Voelker held several senior positions within the Hilton Hotels Corporation and the Renaissance Stouffer Hotels and Resorts Corporation.
| This is not a research report and was not prepared by the Underwriters’ research departments. Please see additional important information and qualifications at the end of this Term Sheet. |
T-116
| MSBAM 2013-C12 | Peninsula Boardwalk |
| Mortgage Loan Information | Mortgaged Property Information | ||||||
| Mortgage Loan Seller: | BANA | Single Asset/Portfolio: | Single Asset | ||||
| Credit Assessment: (Fitch/KBRA/Moody’s) | NR/NR/NR | Property Address: | 202-500 Walnut Street Redwood City, CA 94063 | ||||
| Original Balance: | $19,800,000 | General Property Type: | Retail | ||||
| Cut-off Date Balance: | $19,800,000 | Detailed Property Type: | Anchored | ||||
| % of Initial Pool Balance: | 1.6% | Net Rentable Area: | 145,131 SF | ||||
| Loan Purpose: | Refinance | Cut-off Date Balance Per Unit/SF: | $136 | ||||
| Borrower Name: | PBA II, LLC | Balloon/ARD Balance Per Unit/SF: | $136 | ||||
| Sponsor: | Martin Friedman | Year Built/Year Renovated: | 1979/1994 | ||||
| Mortgage Rate: | 5.305% | Title Vesting: | Fee | ||||
| Note Date: | 9/13/2013 | Property Manager: | Crosspoint Realty Services, Inc. | ||||
| First Payment Date: | 11/1/2013 | ||||||
| Anticipated Repayment Date: | NAP | Underwriting and Financial Information | |||||
| Maturity Date: | 10/1/2023 | UW Revenues: | $2,912,195 | ||||
| IO Period: | 120 months | UW Expenses: | $857,991 | ||||
| Original Term to Maturity or ARD: | 120 months | UW NOI: | $2,054,204 | ||||
| Seasoning: | 0 months | UW NCF: | $1,920,529 | ||||
| Original Amortization Term: | 0 months | UW NOI DSCR: | 1.93x | ||||
| Loan Amortization Type: | Full IO | UW NCF DSCR: | 1.80x | ||||
| Interest Accrual Basis: | Actual/360 | UW NOI Debt Yield: | 10.4% | ||||
| Prepayment Provisions: | LO (24); DEF (92); O (4) | UW NCF Debt Yield: | 9.7% | ||||
| Lockbox/Cash Management: | Hard/Springing | UW NCF Debt Yield at Maturity: | 9.7% | ||||
Pari Passu Mortgage Debt: | None | Most Recent NOI (As of): | $2,511,355 (12/31/2012) | ||||
| Subordinate Mortgage Debt: | None | 2nd Most Recent NOI (As of): | $2,584,466 (12/31/2011) | ||||
| Mezzanine Debt: | None | 3rd Most Recent NOI (As of): | $2,364,513 (12/31/2010) | ||||
| Reserves | Appraised Value: | $42,900,000 | |||||
| Type | Initial | Monthly | Cap | Appraisal As-of Date: | 5/1/2013 | ||
RE Tax(1): | $0 | $0 | NAP | Cut-off Date LTV Ratio: | 46.2% | ||
Insurance(2): | $0 | Springing | NAP | LTV Ratio at Maturity/ARD: | 46.2% | ||
| Recurring Replacements: | $0 | $1,814 | NAP | Occupancy Rate: | 98.9% (9/1/2013) | ||
| TI/LC: | $11,150 | $8,350 | $500,000 | 2nd Most Recent Occupancy: | 98.5% (12/31/2012) | ||
Other(3): | $0 | Springing | (3) | 3rd Most Recent Occupancy: | 100.0% (12/31/2011) | ||
| (1) | The Peninsula Boardwalk borrower prepaid 2013/2014 real estate taxes at loan closing. The Peninsula Boardwalk borrower is required to deposit $7,391 monthly for real estate taxes beginning November 1, 2014. |
| (2) | Springing upon the Peninsula Boardwalk borrower’s failure to maintain blanket policy. |
| (3) | The Peninsula Boardwalk borrower is required to deposit all excess cash in an amount up to $585,000 for a reserve related to Babies R Us, up to $275,000 for a reserve related to Toys R Us and up to $543,496 for a reserve related to Pacific Sales during certain trigger events related to these tenants as described in the Peninsula Boardwalk mortgage loan documents. |
The Peninsula Boardwalk mortgage loan is secured by a 145,131 SF retail center located in Redwood City, California. As of September 1, 2013, the Peninsula Boardwalk property was 98.9% occupied by 12 tenants. Anchor tenants include: Toys R Us (42,787 SF, 8.3% of the underwritten base rent), Babies R Us (23,272 SF, 23.3% of the underwritten base rent), Pacific Sales (21,863 SF, 19.8% of the underwritten base rent) and Jo-Ann Stores (16,336 SF, 11.8% of the underwritten base rent). The Peninsula Boardwalk is also shadow anchored by a Kohl’s (79,683 SF).
The Peninsula Boardwalk property is located approximately 23 miles south of the San Francisco CBD and 12 miles south of the San Francisco International Airport, just south of U.S. Highway 101. The estimated 2013 population within a one-, three- and five-mile radius was 18,547, 116,447 and 265,733, respectively. The estimated 2013 median household income within a one-, three- and five-mile radius was $49,126, $79,214 and $93,028, respectively.
The Peninsula Boardwalk sponsor is Martin Friedman, the CEO of Friedman Investment Management Corp., a private real estate owner/operator based in San Francisco. Friedman Investment Management Corp. manages a portfolio of eight properties consisting of 122 multifamily units, 236,900 SF of retail and 110,608 SF of office.
| This is not a research report and was not prepared by the Underwriters’ research departments. Please see additional important information and qualifications at the end of this Term Sheet. |
T-117
| MSBAM 2013-C12 | Best Western - Sherman Oaks |
| Mortgage Loan Information | Mortgaged Property Information | ||||||
| Mortgage Loan Seller: | MSMCH | Single Asset/Portfolio: | |||||
Credit Assessment: Fitch/KBRA/Moody’s) | NR/NR/NR | Property Address: | Sherman Oaks, CA 91411 | ||||
| Original Balance: | General Property Type: | ||||||
| Cut-off Date Balance: | Detailed Property Type: | ||||||
| % of Initial Pool Balance: | 1.4% | Number of Rooms: | |||||
| Loan Purpose: | Cut-off Date Balance Per Unit/SF: | ||||||
| Borrower Name(s): | Balloon/ARD Balance Per Unit/SF: | ||||||
| Sponsor: | Year Built/Year Renovated: | ||||||
| Mortgage Rate: | Title Vesting: | ||||||
| Note Date: | Property Manager: | ||||||
| First Payment Date: | |||||||
| Anticipated Repayment Date: | Underwriting and Financial Information | ||||||
| Maturity Date: | UW Revenues: | ||||||
| IO Period: | UW Expenses: | ||||||
| Original Term to Maturity or ARD: | UW NOI: | ||||||
| Seasoning: | UW NCF: | ||||||
| Original Amortization Term: | UW NOI DSCR: | ||||||
| Loan Amortization Type: | UW NCF DSCR: | ||||||
| Interest Accrual Basis: | UW NOI Debt Yield: | ||||||
| Prepayment Provisions: | UW NCF Debt Yield: | ||||||
| Lockbox/Cash Management: | UW NCF Debt Yield at Maturity: | ||||||
Pari Passu Mortgage Debt: | Most Recent NOI (As of): | ||||||
| Subordinate Mortgage Debt: | Second Most Recent NOI (As of): | ||||||
Mezzanine Debt(1): | Third Most Recent NOI (As of): | ||||||
| Reserves | Appraised Value: | ||||||
| Type | Initial | Monthly | Cap | Appraisal As-of Date: | |||
| RE Tax: | Cut-off Date LTV Ratio: | ||||||
| Insurance: | LTV Ratio at Maturity/ARD: | ||||||
| Recurring Replacements: | Occupancy Rate: | ||||||
2nd Most Recent Occupancy: | |||||||
3rd Most Recent Occupancy: | 81.7% (12/31/2011) | ||||||
| (1) | Future mezzanine financing is permitted upon the sale or transfer of the mortgaged property subject to a maximum combined LTV of 65% and a minimum combined DSCR of 1.70x. |
The Best Western – Sherman Oaks mortgage loan is secured by a two-building, 3-story, 181 room, Best Western Plus branded limited service hotel located on the southwest corner of Burbank Boulevard and N. Sepulveda Boulevard in Sherman Oaks, California. Van Nuys is approximately 17 miles northwest of downtown Los Angeles. The mortgaged property is approximately one block east of the San Diego Freeway (I-405), which has exit ramps to Burbank Boulevard, and one mile north of the I-101/I-405 freeway interchange. The hotel was constructed in 1964 and 1972 and renovated several times. Most recently, approximately $1.4 million was invested from 2010 through 2012.
Room configurations include 86 double queen rooms, 68 king rooms, 25 king exclusive rooms and 2 suites. One of the rooms is currently used as meeting space and the borrower intends to convert 3 more guest rooms to meeting space. The hotel also has an outdoor swimming pool and whirlpool, and an exercise room. There is also an on-site Denny’s restaurant, which space is leased from the borrower, and parking for 160 cars. Demand generators include theme parks, movie studios, health care facilities and colleges and universities. The hotel had a trailing 12 months ending July 31, 2013 ADR of $92.53, average occupancy of 88.9%, and RevPAR of $82.51. The eight hotel primary competitive set had an estimated 2012 average occupancy of 67.4%, an average rate of $109.92 and an average RevPAR of $74.04.
The hotel operates under a membership with Best Western International, Inc, which is subject to annual renewal.
| This is not a research report and was not prepared by the Underwriters’ research departments. Please see additional important information and qualifications at the end of this Term Sheet. |
T-118
(THIS PAGE INTENTIONALLY LEFT BLANK)
| This is not a research report and was not prepared by the Underwriters’ research departments. Please see additional important information and qualifications at the end of this Term Sheet. |
T-119
| MSBAM 2013-C12 |
This Term Sheet was prepared by sales, trading, banking or other non-research personnel of one of the following: Morgan Stanley & Co. LLC, Morgan Stanley & Co. International Limited, Morgan Stanley Japan Limited and/or Morgan Stanley Dean Witter Asia Limited (together with their affiliates, hereinafter “Morgan Stanley”), Merrill Lynch, Pierce, Fenner & Smith Incorporated (together with its affiliates, “BofA Merrill Lynch”) or CIBC World Markets Corp. (together with its affiliates, “CIBC” and, collectively with Morgan Stanley and BofA Merrill Lynch, the “Underwriters”). This Term Sheet was not produced by a Morgan Stanley, BofA Merrill Lynch or CIBC research analyst, although it may refer to a Morgan Stanley, BofA Merrill Lynch or CIBC research analyst or research report. Unless otherwise indicated, these views (if any) are the author’s and may differ from those of the fixed income or equity research departments of Morgan Stanley, BofA Merrill Lynch or CIBC or others in those firms.
This Term Sheet may have been prepared by or in conjunction with the respective trading desks of the Underwriters that may deal as principal in or own or act as market maker or liquidity provider for the securities/instruments (or related derivatives) mentioned herein. The trading desk may have accumulated a position in the subject securities/instruments based on the information contained herein. Trading desk materials are not independent of the proprietary interests of Morgan Stanley, BofA Merrill Lynch or CIBC, which may conflict with your interests. Each of the Underwriters may also perform or seek to perform investment banking services for the issuers of the securities and instruments mentioned herein.
The information contained in this Term Sheet is subject to change, completion or amendment from time to time, and the information in this term sheet supersedes information in any other communication other than in any other free writing prospectus relating to the securities referred to in this term sheet. This Term Sheet is not a solicitation to participate in any trading strategy, and is not an offer to sell any security or instrument or a solicitation of an offer to buy or sell any security or instrument in any jurisdiction where the offer, solicitation or sale is not permitted. Unless otherwise set forth in this material, any securities referred to in this material may not have been registered under the U.S. Securities Act of 1933, as amended, and, if not, may not be offered or sold absent an exemption therefrom. Recipients are required to comply with any legal or contractual restrictions on their purchase, holding, sale, exercise of rights or performance of obligations under any securities/instruments transaction.
The securities/instruments discussed in this Term Sheet may not be suitable for all investors. This Term Sheet has been prepared and issued by the Underwriters for intended distribution to market professionals and institutional investor clients. Other recipients should seek independent investment advice prior to making any investment decision based on this Term Sheet. This Term Sheet does not provide individually tailored investment advice or offer tax, regulatory, accounting or legal advice. Prior to entering into any proposed transaction, recipients should determine, in consultation with their own investment, legal, tax, regulatory and accounting advisors, the economic risks and merits, as well as the legal, tax, regulatory and accounting characteristics and consequences, of the transaction. You should consider this Term Sheet as only a single factor in making an investment decision.
The value of and income from investments may vary because of changes in interest rates, foreign exchange rates, default rates, prepayment rates, securities/instruments prices, market indexes, operational or financial conditions of companies or other factors. There may be time limitations on the exercise of options or other rights in securities/instruments transactions. Past performance is not necessarily a guide to future performance. Estimates of future performance are based on assumptions that may not be realized. Actual events may differ from those assumed and changes to any assumptions may have a material impact on any projections or estimates. Other events not taken into account may occur and may significantly affect the projections or estimates. Certain assumptions may have been made for modeling purposes only to simplify the presentation and/or calculation of any projections or estimates, and the Underwriters do not represent that any such assumptions will reflect actual future events. Accordingly, there can be no assurance that estimated returns or projections will be realized or that actual returns or performance results will not materially differ from those estimated herein. Some of the information contained in this document may be aggregated data of transactions in securities or other financial instruments executed by Morgan Stanley, BofA Merrill Lynch or CIBC that has been compiled so as not to identify the underlying transactions of any particular customer.
Notwithstanding anything herein to the contrary, the Underwriters and each recipient hereof (and their employees, representatives, and other agents) may disclose to any and all persons, without limitation of any kind from the commencement of discussions, the U.S. federal and state income tax treatment and tax structure of the transaction and all materials of any kind (including opinions or other tax analyses) that are provided to it relating to the tax treatment and tax structure (as such terms are defined in Treasury Regulation 1.60 91-4). For this purpose, “tax structure” is limited to facts relevant to the U.S. federal and state income tax treatment of the transaction and does not include information relating to the identity of the parties, their affiliates, agents or advisors. This authorization of tax disclosure is retroactively effective to the commencement of discussions with prospective investors regarding the transactions contemplated herein.
In the United Kingdom, this free writing prospectus is directed only at persons who (i) have professional experience in matters relating to investments and who qualify as investment professionals in accordance with Article 19(5) or (ii) are persons falling within Article 49(2)(a) to (d) (“high net worth companies, unincorporated associations etc.”) of the Financial Services and Markets Act 2000 (Financial Promotion) Order 2005 (all such persons together being referred to as “relevant persons”). This free writing prospectus must not be acted on or relied on by persons who are not relevant persons. Any investment or investment activity to which this free writing prospectus relates is available only to relevant persons and will be engaged in only with relevant persons.
THE OFFERED CERTIFICATES HAVE NOT BEEN AND WILL NOT BE REGISTERED UNDER THE FINANCIAL INSTRUMENTS EXCHANGE ACT OF JAPAN (LAW NO. 25 OF 1948, AS AMENDED (THE “FIEL”)), AND EACH UNDERWRITER HAS AGREED THAT IT WILL NOT OFFER OR SELL ANY OFFERED CERTIFICATES, DIRECTLY OR INDIRECTLY, IN JAPAN OR TO, OR FOR THE BENEFIT OF, ANY JAPANESE PERSON, OR TO OTHERS FOR RE-OFFERING OR RESALE, DIRECTLY OR INDIRECTLY, IN JAPAN OR TO ANY JAPANESE PERSON, EXCEPT PURSUANT TO AN EXEMPTION FROM THE REGISTRATION REQUIREMENTS OF, AND OTHERWISE IN COMPLIANCE WITH, THE FIEL AND ANY OTHER APPLICABLE LAWS AND REGULATIONS. FOR THE PURPOSES OF THIS PARAGRAPH, “JAPANESE PERSON” SHALL MEAN ANY PERSON RESIDENT IN JAPAN, INCLUDING ANY CORPORATION OR OTHER ENTITY ORGANIZED UNDER THE LAWS AND REGULATIONS OF JAPAN.
© 2013 Morgan Stanley