October 24, 2016 Q3 ’16 Supplemental Information

Non-GAAP Disclaimer 2 The financial results disclosed in this presentation include certain measures calculated and presented in accordance with GAAP. In addition to the GAAP results included in this presentation, Knowles has presented supplemental, non-GAAP gross profit, earnings before interest and income taxes, adjusted earnings before interest and income taxes and non- GAAP diluted earnings per share to facilitate evaluation of Knowles’ operating performance. These non-GAAP financial measures exclude certain amounts that are included in the most directly comparable GAAP measure. In addition, these non-GAAP financial measures do not have standard meanings and may vary from similarly titled non-GAAP financial measures used by other companies. Knowles uses non-GAAP measures as supplements to its GAAP results of operations in evaluating certain aspects of its business, and its Board of Directors and executive management team focus on non-GAAP items as key measures of Knowles’ performance for business planning purposes. These measures assist Knowles in comparing its performance between various reporting periods on a consistent basis, as these measures remove from operating results the impact of items that, in Knowles’ opinion, do not reflect its core operating performance. Knowles believes that its presentation of these non-GAAP financial measures is useful because it provides investors and securities analysts with the same information that Knowles uses internally for purposes of assessing its core operating performance. For a reconciliation of these non-GAAP financial measures to the most directly comparable GAAP financial measures, see the reconciliation tables included in the third quarter 2016 earnings release.

Q3 ‘16 Financial Results (continuing operations) 3 Quarter over year ago period Q3FY16 Q3FY15 Revenue $243.1 million $246.7 million Gross Profit $94.9 million $97.3 million Non-GAAP Gross Profit $95.7 million $102.1 million Diluted Earnings Per Share $0.24 $0.05 Non-GAAP Diluted Earnings Per Share $0.37 $0.29

Revenue (Cont. Ops.) 4 $246.7 $223.5 $185.3 $190.3 $243.1 $0 $50 $100 $150 $200 $250 $300 Q3FY15 Q4FY15 Q1FY16 Q2FY16 Q3FY16

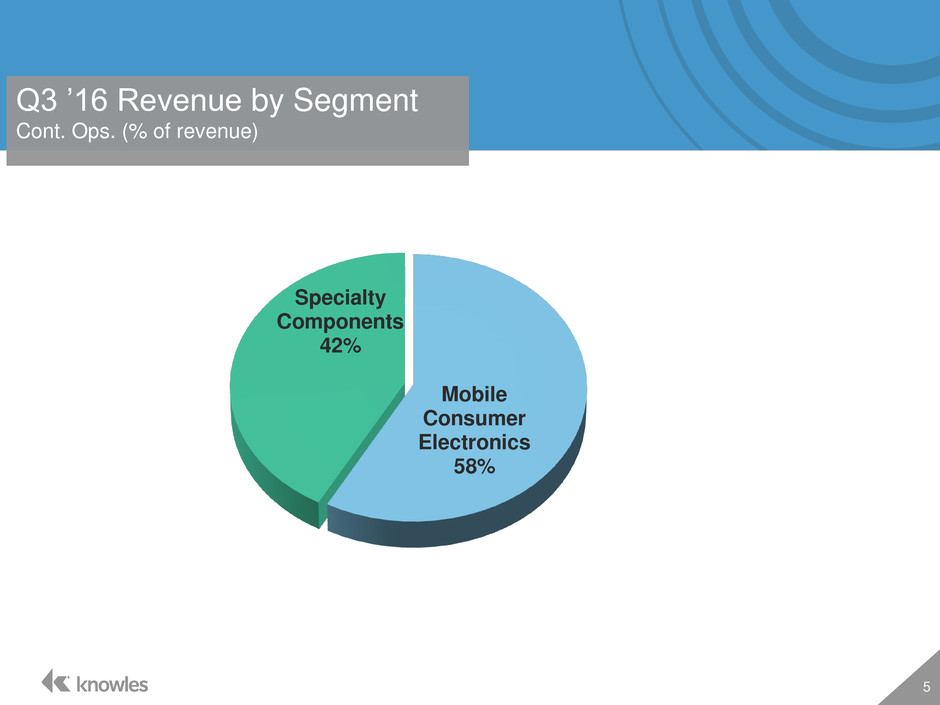
Q3 ’16 Revenue by Segment Cont. Ops. (% of revenue) 5 Mobile Consumer Electronics 58% Specialty Components 42%

Q4 ‘16 Projections (non-GAAP, cont. ops.)* 6 Q4FY16E Revenue $225 million - $245 million Gross Margin 38 percent - 41 percent EPS (diluted) $0.29 - $0.35 *Projections as of 10/24/16; Q4 2016 GAAP results for continuing operations are expected to include approximately $0.05 per share in stock- based compensation, $0.03 per share in amortization of intangibles, $0.01 per share in amortization of debt discount, $0.01 per share in production transfer costs. Expected Q4 2016 GAAP results exclude potential restructuring items.

Historical Segment Data 7 (Cont. Ops.; in $ millions) September 30, 2016 June 30, 2016 March 31, 2016 December 31, 2015 September 30, 2015 September 30, 2016 June 30, 2016 March 31, 2016 December 31, 2015 September 30, 2015 Revenues 140.4$ 82.2$ 83.3$ 113.5$ 141.3$ 102.7$ 108.1$ 102.0$ 110.0$ 105.4$ Gross Profit 55.6$ 32.7$ 29.1$ 44.4$ 57.6$ 40.3$ 40.8$ 38.4$ 37.3$ 40.2$ Stock-Based Compensation Expense 0.1 0.1 0.1 0.1 0.1 0.2 0.2 0.2 0.2 0.1 Fixed Asset, Inventory and Other Charges - 0.3 - 1.2 - - - - 2.1 - Restructuring Charges - 0.1 0.2 0.2 0.2 - 0.2 0.8 2.4 0.1 Production Transfers Costs - - 0.1 0.3 0.2 0.4 1.2 1.2 3.6 3.0 Other - - - 1.2 0.8 - - - - - Non-GAAP Gross Profit 55.7$ 33.2$ 29.5$ 47.4$ 58.9$ 40.9$ 42.4$ 40.6$ 45.6$ 43.4$ Non-GAAP Gross Profit as % of Revenues 39.7% 40.4% 35.4% 41.8% 41.7% 39.8% 39.2% 39.8% 41.5% 41.2% Research and Development Expenses 16.3$ 18.9$ 19.1$ 22.4$ 21.7$ 7.0$ 6.9$ 7.0$ 7.5$ 6.7$ Stock-Based Compensation Expense (1.2) (1.2) (0.9) (1.0) (0.8) (0.1) (0.1) - - 0.1 Fixed Asset, Inventory and Other Charges - (0.1) (0.1) (0.8) - - - - - - Non-GAAP Research and Development Expenses 15.1$ 17.6$ 18.1$ 20.6$ 20.9$ 6.9$ 6.8$ 7.0$ 7.5$ 6.8$ Non-GAAP Research and Development Expenses as % of Revenues 10.8% 21.4% 21.7% 18.1% 14.8% 6.7% 6.3% 6.9% 6.8% 6.5% Selling and Administrative Expenses 16.5$ 16.8$ 15.9$ 19.7$ 20.0$ 13.7$ 15.7$ 15.5$ 15.8$ 15.5$ Stock-Based Compensation Expense (0.9) (0.8) (0.9) (0.6) (0.9) 0.1 (0.3) (0.6) (0.5) (0.4) Intangibles Amortization Expense (2.8) (2.8) (2.8) (2.7) (2.7) (2.8) (2.8) (2.8) (2.8) (2.8) Fixed Asset, Inventory and Other Charges - - - (0.1) - - - - - - Other - - - (0.2) (0.7) - - (0.1) - - Non-GAAP Selling and Administrative Expenses 12.8$ 13.2$ 12.2$ 16.1$ 15.7$ 11.0$ 12.6$ 12.0$ 12.5$ 12.3$ Non-GAAP Selling and Administrative Expenses as % of Revenues 9.1% 16.1% 14.6% 14.2% 11.1% 10.7% 11.7% 11.8% 11.4% 11.7% Operating Expenses 33.7$ 38.8$ 37.8$ 44.8$ 49.9$ 20.7$ 23.2$ 23.0$ 23.3$ 22.4$ Stock-Based Compensation Expense (2.1) (2.0) (1.8) (1.6) (1.7) - (0.4) (0.6) (0.5) (0.3) Intangibles Amortization Expense (2.8) (2.8) (2.8) (2.7) (2.7) (2.8) (2.8) (2.8) (2.8) (2.8) Fixed Asset, Inventory and Other Charges - (0.1) (0.1) (0.9) - - - - - - Restructuring Charges (0.9) (3.1) (2.8) (2.7) (8.2) - (0.6) (0.5) - (0.2) Impairment of Intangible Assets - - (1.0) (0.4) - - - - - Other - - - (0.2) (0.7) - - (0.1) - - Non-GAAP Operating Expenses 27.9$ 30.8$ 30.3$ 35.7$ 36.2$ 17.9$ 19.4$ 19.0$ 20.0$ 19.1$ Non-GAAP Operating Expenses as % of Revenues 19.9% 37.5% 36.4% 31.4% 25.6% 17.4% 17.9% 18.6% 18.2% 18.1% Operating Earnings (Loss) 21.9$ (6.1)$ (8.7)$ (0.4)$ 7.7$ 19.6$ 17.6$ 15.4$ 14.0$ 17.8$ Other (Income) Expense, net (0.1) (0.2) (0.1) (0.1) 0.7 (0.2) (0.4) (0.2) (0.3) 0.1 Earnings (Loss) Before Interest and Income Taxes 22.0 (5.9) (8.6) (0.3) 7.0 19.8 18.0 15.6 14.3 17.7 Stock-Based Compensation Expense 2.2 2.1 1.9 1.7 1.8 0.2 0.6 0.8 0.7 0.4 Intangibles Amortization Expense 2.8 2.8 2.8 2.7 2.7 2.8 2.8 2.8 2.8 2.8 Fixed Asset, Inventory and Other Charges - 0.4 0.1 2.1 - - - - 2.1 - Restructuring Charges 0.9 3.2 3.0 2.9 8.4 - 0.8 1.3 2.4 0.3 Impairme t of Intangible Assets - - - 1.0 0.4 - - - - - Production Transfers Costs - - 0.1 0.3 0.2 0.4 1.2 1.2 3.6 3.0 Other (gain) loss - - - 1.4 1.5 - - 0.1 - - Adjusted Earnings Before Interest and Income Taxes 27.9$ 2.6$ (0.7)$ 11.8$ 22.0$ 23.2$ 23.4$ 21.8$ 25.9$ 24.2$ Adjusted Earnings Before Interest and Income Taxes as % of Revenues 19.9% 3.2% -0.8% 10.4% 15.6% 22.6% 21.6% 21.4% 23.5% 23.0% Mobile Consumer Electronics Specialty Components Quarter Ended Quarter Ended

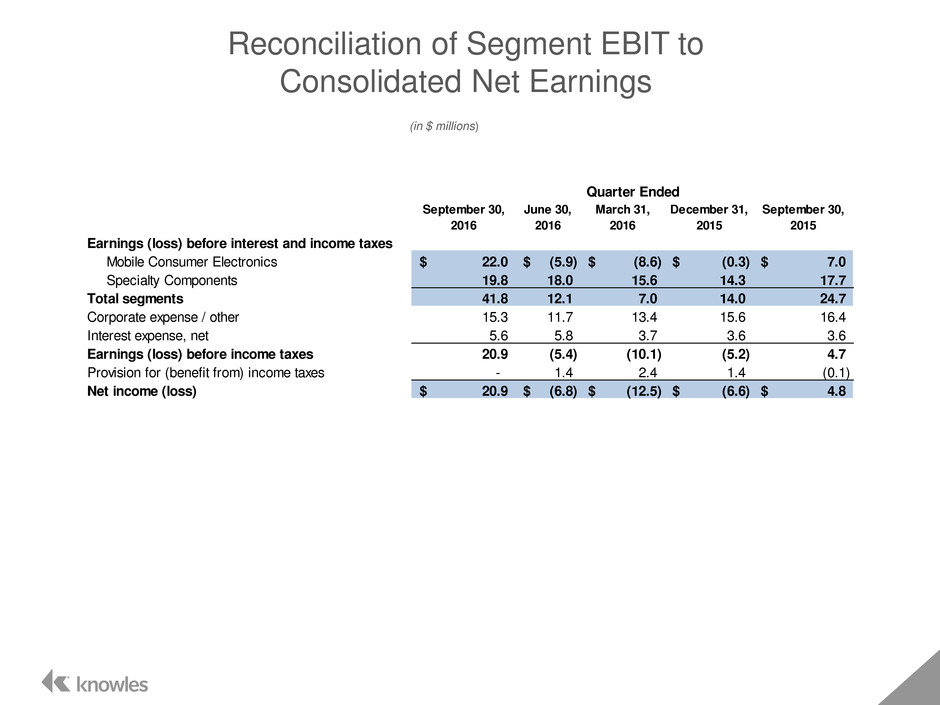
Reconciliation of Segment EBIT to Consolidated Net Earnings 8 (in $ millions) September 30, 2016 June 30, 2016 March 31, 2016 December 31, 2015 September 30, 2015 Earn ngs (loss) before interest and income taxes M bil Consumer Electronics 22.0$ (5.9)$ (8.6)$ (0.3)$ 7.0$ Specialty Components 19.8 18.0 15.6 14.3 17.7 Total segments 41.8 12.1 7.0 14.0 24.7 Corporate expense / other 15.3 11.7 13.4 15.6 16.4 Interest expense, net 5.6 5.8 3.7 3.6 3.6 Earnings (loss) before income taxes 20.9 (5.4) (10.1) (5.2) 4.7 Provision for (benefit from) income taxes - 1.4 2.4 1.4 (0.1) Net income (loss) 20.9$ (6.8)$ (12.5)$ (6.6)$ 4.8$ Quarter Ended