UNITED STATES
SECURITIES AND EXCHANGE COMMISSION
Washington, D.C. 20549
FORM N-CSR
CERTIFIED SHAREHOLDER REPORT OF REGISTERED
MANAGEMENT INVESTMENT COMPANIES
Investment Company Act file number: 811-22895
Capitol Series Trust
(Exact name of registrant as specified in charter)
Huntington Asset Services, Inc.
2960 North Meridian Street, Suite 300
Indianapolis, IN 46208
(Address of principal executive offices) (Zip code)
Zachary P. Richmond
Huntington Asset Services, Inc.
2960 N. Meridian St. Suite 300
Indianapolis, IN 46208
(Name and address of agent for service)
Registrant’s telephone number, including area code: 317-917-7000
Date of fiscal year end: August 31
Date of reporting period: August 31, 2014
Item 1. Reports to Stockholders.


Where discipline meets common sense.
Annual Report
August 31, 2014
Meritage Yield-Focus Equity Fund MPYEX/MPYIX
Meritage Growth Equity Fund MPGEX/MPGIX
Meritage Value Equity Fund MPVEX/MVEBX
| | | | |
| 913.345.7000 | | www.meritageportfoliofunds.com | | 7500 College Blvd., Suite 1212, Overland Park, KS 66210 |
MESSAGE FROM THE CHIEF INVESTMENT OFFICER – (Unaudited)
At Meritage, we are value-driven investors. We buy stock in businesses when they i) score well in our comprehensive stock-ranking process (universe is global, all-cap and about 7,000 securities), and ii) are selling for less than we believe they are worth. Our value discipline is intended to provide a margin of safety and is one of our primary risk management tools, along with managing position sizes and diversification.
Dear Fellow Shareholders:
In our inaugural letter written for the Semi-Annual Report earlier this year, we shared our rationale for launching the Meritage mutual funds and provided a basic overview of our investment process. In this letter we will build on that foundation by providing an answer to two questions many investors are asking now, with the hope that by doing so you will develop a broader understanding of our firm and our approach to investing your money. A specific discussion of each Fund and its performance is included in Management’s Discussion of Fund Performance.
Given that the market has gone up so much the last five years, are you still able to find attractive investment opportunities?
Yes. While there are not the bargains today that there were five years ago, our investment process continues to identify stocks that we believe are undervalued. And with this in mind, while we don’t know what will happen to stock prices over the course of the next quarter or next year, we do believe our mutual fund portfolios should provide attractive returns over full investment cycles.
There are three related points that we would like to emphasize:
| | 1) | We do not attempt to “time the market.” We believe the best way to compound your capital and ours is to invest in companies that are likely to become much more valuable over time, and we focus our efforts accordingly. |
| | 2) | The price at which a security is bought is an important factor in the ultimate return that is realized. In our opinion, many people confuse “quality” with “safety.” As an example, Cisco is a quality company in the minds of many investors. Yet those who bought it at its peak during the dot.com bubble, when internet stocks were hyped, experienced a permanent loss of capital – investors still have not recouped their investment more than 14 years later. So quality did not provide safety. In contrast, those who invested in “old economy” stocks such as United Technologies Corp. and 3M, good companies which were not nearly as highly regarded at the time but were undervalued in our work, saw their investments grow. |
| | 3) | We are often asked about individual positions in our portfolios, and we have a rationale for each one. We cannot predict, however, which of the companies in our portfolios will produce the best or worst returns. Instead we rely on a portfolio of what we believe are 45 – 60 good decisions – a decision to own each security in a portfolio with a total of 45 – 60 positions – to achieve the desired results. In other words it’s the combination of what we believe are a number of very good decisions, as opposed to one or two great decisions, that we think is most important. |
Where are you finding good opportunities now?
The run-up of U.S. stock prices has exceeded that of many other developed nations, particularly those in Europe. There are a variety of reasons for this including the Russian-Ukraine conflict and concerns about Europe’s slow economic growth. The net result, however, is we are now finding more attractive investment opportunities in that region than we had previously. Up to 35% of our Growth and Value funds can be invested in companies outside the United States, and up to 40% of our Yield-Focus Equity fund.
1
MESSAGE FROM THE CHIEF INVESTMENT OFFICER – (Unaudited) (continued)
This highlights what we believe is one of the most important strengths of our investment process: the ability to search much of the world for what we believe are the best equity investments at any given time. There is an old saying that “If all you are holding is a hammer, everything is likely to look like a nail,” and we believe this is very much the case when it comes to investing.
In this sense we believe we have a structural advantage compared to U.S.-only funds. Our opportunity to add value is larger because of our bigger universe, and there is a natural diversification that occurs in each of the portfolios by adding companies from different regions that should reduce risk.
In closing, we would like to thank you again for your support and entrusting us with your investment dollars. We recognize that you have many options, and we are committed to being good stewards of your capital.
Sincerely,
Mark Eveans, CFA
President and Chief Investment Officer
2
MANAGEMENT’S DISCUSSION OF FUND PERFORMANCE – (Unaudited)
Meritage Growth Equity Fund
For the period beginning December 23, 2013, the fund’s inception, through August 31, 2014, the Meritage Growth Equity Fund Institutional Class and Investors Class returned 9.50% and 9.20% respectively. These returns compared to the Russell 1000 Growth Index benchmark of 11.45% for the same time frame. Additionally, the Lipper Large Cap Growth Average(1) (a mutual fund peer comparison) returned 9.23% for the same time frame.
Compared to the Russell 1000 Growth Index benchmark, the Growth portfolio lagged somewhat primarily due to four factors. First, the fund was substantially underweight in the Materials sector, a strong performer during the period. Second, the fund was significantly underweight the Energy sector, another strongly performing sector. Third, the Fund experienced “selection drag” in the Consumer Discretionary sector, a large sector where the Fund was equivalently weighted. Fourth, average cash was somewhat in excess of day-to-day needs during the fund’s start-up phase.
On the positive side, compared to the Russell 1000 Growth Index benchmark, three factors stood out. First, the Fund had strong selection performance in the portfolio’s largest sector, Information Technology. Second, the Fund benefited from both an overweight and positive selection in it’s second largest weighted sector, Industrials. Third, Healthcare, another sizable sector, produced positive selection.
Regarding specific issues, our strongest gainers were Southwest Airlines, up 70.7%, NetScout Systems, ahead 58.0%, International Rectifier, ahead 55.2%, and Edwards Life Sciences up 52.3%. International Rectifier received a bid to be acquired by Infineon Technologies, strongly influencing the gain.
Poorest performers were Destination Maturity Corporation, down 38.8%, and Masimo Corp, which declined 21.9%.
As a value-centric and process driven manager, most sector differences compared to benchmark, are the result of either an under or overweight of specific bottom-up valuation opportunities identified by our process, within that particular sector.
We expect a continuation of abnormally low interest rates and below average economic growth for the world’s leading economies. We believe many investors share our view and have correspondingly been willing to pay a premium for well-known growth stocks. This is where we part company with the crowd, however, as we expect the value discipline imbedded in our growth approach will yield better results over full market cycles.
Meritage Value Equity Fund
For the period beginning December 23, 2013, the fund’s inception, through August 31, 2014, the Meritage Value Equity Fund Institutional Class and Investors Class returned 10.00%, and 9.80%, respectively. These returns compared to the Russell 1000 Value Index Benchmark of 12.19% for the same time frame. Additionally, the Lipper Large Cap Value Average(1) (a mutual fund peer comparison) returned 10.96% for the same time frame.
Compared to the Russell 1000 Value Index Benchmark, the Value portfolio lagged due primarily to four factors. First, the Fund was substantially underweight in the Financial sector, which is the largest sector in the Index at just under 30%- our company selection here was good, but the underweight was a subtraction. Second, the Fund experienced “selection drag” in the Industrial sector, a large sector where the fund was equivalently weighted. Third, we had underperforming selections in the Consumer Discretionary sector, a smaller, equal weighted index. Fourth, average cash was in excess of day-to-day needs during the fund’s start-up phase.
| (1) | Lipper figures represent the average of total returns reported by all of the mutual funds designated by the Lipper, Inc. as falling in the category indicated. They do not reflect sales charges. |
3
MANAGEMENT’S DISCUSSION OF FUND PERFORMANCE – (Unaudited) (continued)
On the positive side, compared to the Russell 1000 Value benchmark, four factors stood out. First, while underweight the Consumer Staples sector, a smaller area, we substantially outperformed this sector with our selections resulting in a net positive impact. Second, in the significantly larger Energy sector, we were equivalently weighted, and our selections performed better than the overall sector. Third, another large sector, Healthcare, produced strong selection, within the context of an approximately matched sector influence. Fourth, we were significantly overweight a strongly performing Information Technology sector.
Regarding specific issues, our strongest gainers were Skyworks Solutions, up 105.6%, Foot Locker, ahead 38.5%, Teva Pharmaceuticals, up 35.3%, and Halliburton, ahead by 34.7%.
Poorest performers were AGCO Corp, down 14.7% and Deutsche Telekom AG ADR, which declined 8.9%.
As a value-centric and process driven manager, most sector differences compared to the benchmark are the result of either an under or overweight of specific bottom-up valuation opportunities identified by our process, within that particular sector.
We expect a continuation of abnormally low interest rates and below average economic growth for the world’s leading economies. We believe many investors share our view and have correspondingly been willing to pay a premium for well-known stocks. This is where we part company with the crowd, however, as we expect the discipline imbedded in our value approach will yield better results over full market cycles.
Meritage Yield-Focus Equity Fund
For the period beginning December 23, 2013, the fund’s inception, through August 31, 2014, the Meritage Yield-Focus Equity Fund Institutional Class and Investors Class returned 12.70% and 12.50%, respectively. These returns compare to the 11.49% total return for the Russell 3000 Value Index benchmark during this same time frame. Additionally, the Lipper Equity Income Average(1) (a mutual fund peer comparison) returned 10.22% for the same time frame.
A founding premise of the Yield-Focus Equity Fund is to earn between 50-75% of the expected long-term equity return in the form of cash dividends and distributions. The strategy invests in six key types of equity asset classes – common stocks, master limited partnerships, real estate investment trusts, business development companies, convertible preferred stocks, and, in rare situations, straight preferred stocks. The Meritage comprehensive security selection process searches globally for attractive yield franchises.
Regarding equity asset class performance, higher yield common stocks, MLPs, and REITs were the strongest positive contributors during the December-August period.
Compared to the Russell 3000 Value Index benchmark, the portfolio’s outperformance during this time frame was helped by five primary factors. First, the Energy sector was a significant overweight compared to the benchmark, and selection was positive also. Second, a smaller sector, Consumer Staples, was overweight versus the benchmark, and the Fund also achieved a strong selection return within the sector. Third, the smaller Consumer Discretionary sector was underweighted, but selection was very strong, resulting in a net positive. Fourth, the Fund’s allocation to the largest sector in the benchmark, Financials, was also significantly underweight. However, selection was superior in this sector, resulting in a net positive impact. Fifth, a smaller category, Information Technology was also underweight, but strong selection resulted in a net positive to the Fund.
| (1) | Lipper figures represent the average of total returns reported by all of the mutual funds designated by the Lipper, Inc. as falling in the category indicated. They do not reflect sales charges. |
4
MANAGEMENT’S DISCUSSION OF FUND PERFORMANCE – (Unaudited) (continued)
On the negative side, the Utility sector was overweight but selection was negative compared to the benchmark. Second, the Healthcare sector was significantly underweight and despite positive selection, produced a net negative to the fund. Third, the small Materials sector was approximately matched in weight, but selection was poor. Last, average cash was in excess of day-to-day needs in the fund’s start-up phase.
Regarding specific issues, the strongest gainers included Silicon Motion Technology Corp., ahead by 93.41%, Targa Resources Corp., gaining 67.5%, Targa Resources Partners LP, up 56.8%, and Century Link, Inc. gaining 38.1%.
Two of the poorest performers were CTC Media and VimpelCom (both Russian), down 30.7% and 27.0% respectively. Also negative was Norbord Inc. off 27.1%.
As a value-centric and process driven manager, most sector differences compared to the benchmark are the result of either an under or overweight of specific bottom-up valuation opportunities identified by our process, within that particular sector.
We expect a continuation of abnormally low interest rates and below average economic growth for the world’s leading economies. We believe many investors share our view and have correspondingly been willing to pay a premium for well-known stocks. This is where we part company with the crowd, however, as we expect the discipline imbedded in our value-centric approach will yield better results over full market cycles.
Funds distributed by Unified Financial Securities, Inc., 2960 North Meridian Street, Suite 300, Indianapolis, IN 46208. (Member FINRA).
Diversification does not ensure a profit or guarantee against loss.
Past performance is no guarantee of future results. The investment return and principal value of an investment in the Funds will fluctuate so that an investor’s shares, when redeemed, may be worth more or less than their original cost.
This material must be preceded or accompanied by a prospectus.
5
INVESTMENT RESULTS – (Unaudited)
Total Return*
(For the period ended August 31, 2014)
| | | | |
| | | Since Inception
(December 23, 2013) | |
Meritage Growth Equity Fund, Institutional Class | | | 9.50 | % |
Russell 1000 Growth Index** | | | 11.45 | % |
Total annual operating expenses, as disclosed in the Fund’s prospectus dated December 19, 2013, were 1.84% of average daily net assets (1.00% after fee waivers/expense reimbursements by the Adviser). The Adviser has contractually agreed to waive or limit its fees and assume other expenses of the Fund through December 31, 2015, so that total annual fund operating expenses do not exceed 1.00% of the Fund’s average daily net assets. This operating expense limitation does not apply to brokerage fees and commissions, borrowing costs (such as interest and dividend expenses on securities sold short), taxes, 12b-1 fees, extraordinary expenses and indirect expenses (such as “acquired fund fees and expenses”). This contractual arrangement may only be terminated by mutual consent of the Adviser and the Board of Trustees of the Fund, and it will automatically terminate upon the termination of the investment advisory agreement between the Fund and the Adviser.
Total Return*
(For the period ended August 31, 2014)
| | | | |
| | | Since Inception
(December 23, 2013) | |
Meritage Growth Equity Fund,
Investor Class | | | 9.20 | % |
Russell 1000 Growth Index** | | | 11.45 | % |
Total annual operating expenses, as disclosed in the Fund’s prospectus dated December 19, 2013, were 2.09% of average daily net assets (1.25% after fee waivers/expense reimbursements by the Adviser). The Adviser has contractually agreed to waive or limit its fees and assume other expenses of the Fund through December 31, 2015, so that total annual fund operating expenses do not exceed 1.00% of the Fund’s average daily net assets. This operating expense limitation does not apply to brokerage fees and commissions, borrowing costs (such as interest and dividend expenses on securities sold short), taxes, 12b-1 fees, extraordinary expenses and indirect expenses (such as “acquired fund fees and expenses”). This contractual arrangement may only be terminated by mutual consent of the Adviser and the Board of Trustees of the Fund, and it will automatically terminate upon the termination of the investment advisory agreement between the Fund and the Adviser.
The performance quoted represents past performance, which does not guarantee future results. The investment return and principal value of an investment will fluctuate so that an investor’s shares, when redeemed, may be worth more or less than their original cost. The returns shown do not reflect deduction of taxes that a shareholder would pay on Fund distributions or the redemption of Fund shares. The Fund’s investment objectives, risks, charges and expenses must be considered carefully before investing. Current performance of a Fund may be lower or higher than the performance quoted. Performance data current to the most recent month end may be obtained by calling 1-855-261-0104.
6
INVESTMENT RESULTS – (Unaudited) (continued)
The performance above reflects any fee reductions during the applicable period. If such fee reductions had not occurred, the quoted performance would be lower.
| * | Return figures reflect any change in price per share and assume the reinvestment of all distributions. |
| ** | The Russell 1000 Growth Index is a widely recognized unmanaged index of equity securities and is representative of a broader domestic equity market and range of securities than is found in the Fund’s portfolio. Individuals cannot invest directly in an Index; however, an individual can invest in exchange traded funds or other investment vehicles that attempt to track the performance of a benchmark index. |
The Fund’s investment objective, strategies, risks, charges and expenses must be considered carefully before investing. The prospectus contains this and other important information about the investment company and may be obtained by calling
1-855-261-0104. Please read it carefully before investing.
The Fund is distributed by Unified Financial Securities, Inc., Member FINRA.
7
INVESTMENT RESULTS – (Unaudited) (continued)
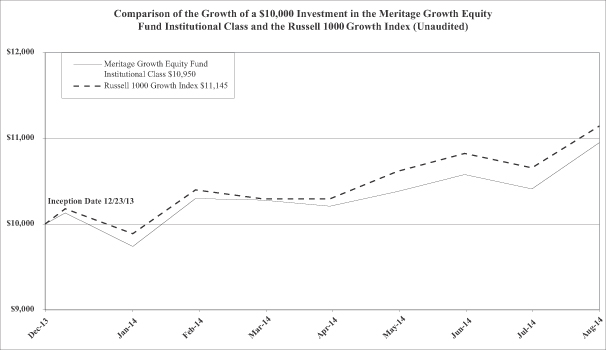
The chart above assumes an initial investment of $10,000 made on December 23, 2013 (commencement of operations) and held through August 31, 2014. THE FUND’S RETURNS REPRESENT PAST PERFORMANCE AND DO NOT GUARANTEE FUTURE RESULTS. The returns shown do not reflect deduction of taxes that a shareholder would pay on the Fund’s distributions or the redemption of the Fund’s shares. Investment returns and principal values will fluctuate so that your shares, when redeemed, may be worth more or less than their original purchase price.
The Russell 1000 Growth Index is a widely recognized unmanaged index of equity securities and is representative of a broader domestic equity market and range of securities than is found in the Fund’s portfolio. Individuals cannot invest directly in an Index; however, an individual can invest in exchange traded funds or other investment vehicles that attempt to track the performance of a benchmark index. The Index returns do not include expenses, which have been deducted from the Fund’s return. These performance figures include the change in value of the stocks in the index plus the reinvestment of dividends and are not annualized. The returns shown do not reflect deduction of taxes that a shareholder would pay on Fund distributions or the redemption of Fund shares.
Current performance may be lower or higher than the performance data quoted. For more information on the Fund, and to obtain performance data current to the most recent month-end, or to request a prospectus, please call 1-855-261-0104. You should carefully consider the investment objectives, potential risks, management fees, and charges and expenses of the Fund before investing. The Fund’s prospectus contains this and other information about the Fund, and should be read carefully before investing.
The Fund is distributed by Unified Financial Securities, Inc., member FINRA.
8
INVESTMENT RESULTS – (Unaudited) (continued)
Total Return*
(For the period ended August 31, 2014)
| | | | |
| | | Since Inception
(December 23, 2013) | |
Meritage Value Equity Fund,
Institutional Class | | | 10.00 | % |
Russell 1000 Value Index** | | | 12.19 | % |
Total annual operating expenses, as disclosed in the Fund’s prospectus dated December 19, 2013, were 1.84% of average daily net assets (1.00% after fee waivers/expense reimbursements by the Adviser). The Adviser has contractually agreed to waive or limit its fees and assume other expenses of the Fund through December 31, 2015, so that total annual fund operating expenses do not exceed 1.00% of the Fund’s average daily net assets. This operating expense limitation does not apply to brokerage fees and commissions, borrowing costs (such as interest and dividend expenses on securities sold short), taxes, 12b-1 fees, extraordinary expenses and indirect expenses (such as “acquired fund fees and expenses”). This contractual arrangement may only be terminated by mutual consent of the Adviser and the Board of Trustees of the Fund, and it will automatically terminate upon the termination of the investment advisory agreement between the Fund and the Adviser.
Total Return*
(For the period ended August 31, 2014)
| | | | |
| | | Since Inception
(December 23, 2013) | |
Meritage Value Equity Fund,
Investor Class | | | 9.80 | % |
Russell 1000 Value Index** | | | 12.19 | % |
Total annual operating expenses, as disclosed in the Fund’s prospectus dated December 19, 2013, were 2.09% of average daily net assets (1.25% after fee waivers/expense reimbursements by the Adviser). The Adviser has contractually agreed to waive or limit its fees and assume other expenses of the Fund through December 31, 2015, so that total annual fund operating expenses do not exceed 1.00% of the Fund’s average daily net assets. This operating expense limitation does not apply to brokerage fees and commissions, borrowing costs (such as interest and dividend expenses on securities sold short), taxes, 12b-1 fees, extraordinary expenses and indirect expenses (such as “acquired fund fees and expenses”). This contractual arrangement may only be terminated by mutual consent of the Adviser and the Board of Trustees of the Fund, and it will automatically terminate upon the termination of the investment advisory agreement between the Fund and the Adviser.
The performance quoted represents past performance, which does not guarantee future results. The investment return and principal value of an investment will fluctuate so that an investor’s shares, when redeemed, may be worth more or less than their original cost. The returns shown do not reflect deduction of taxes that a shareholder would pay on Fund distributions or the redemption of Fund shares. The Fund’s investment objectives, risks, charges and expenses must be considered carefully before investing. Current performance of a Fund may be lower or higher than the performance quoted. Performance data current to the most recent month end may be obtained by calling 1-855-261-0104.
9
INVESTMENT RESULTS – (Unaudited) (continued)
The performance above reflects any fee reductions during the applicable period. If such fee reductions had not occurred, the quoted performance would be lower.
| * | Return figures reflect any change in price per share and assume the reinvestment of all distributions. |
| ** | The Russell 1000 Value Index is a widely recognized unmanaged index of equity securities and is representative of a broader domestic equity market and range of securities than is found in the Fund’s portfolio. Individuals cannot invest directly in an Index; however, an individual can invest in exchange traded funds or other investment vehicles that attempt to track the performance of a benchmark index. |
The Fund’s investment objective, strategies, risks, charges and expenses must be considered carefully before investing. The prospectus contains this and other important information about the investment company and may be obtained by calling 1-855-261-0104. Please read it carefully before investing.
The Fund is distributed by Unified Financial Securities, Inc., Member FINRA.
10
INVESTMENT RESULTS – (Unaudited) (continued)
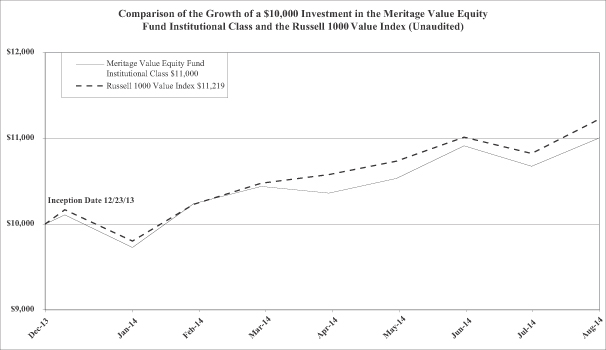
The chart above assumes an initial investment of $10,000 made on December 23, 2013 (commencement of operations) and held through August 31, 2014. THE FUND’S RETURNS REPRESENT PAST PERFORMANCE AND DO NOT GUARANTEE FUTURE RESULTS. The returns shown do not reflect deduction of taxes that a shareholder would pay on the Fund’s distributions or the redemption of the Fund’s shares. Investment returns and principal values will fluctuate so that your shares, when redeemed, may be worth more or less than their original purchase price.
The Russell 1000 Value Index is a widely recognized unmanaged index of equity securities and is representative of a broader domestic equity market and range of securities than is found in the Fund’s portfolio. Individuals cannot invest directly in an Index; however, an individual can invest in exchange traded funds or other investment vehicles that attempt to track the performance of a benchmark index. The Index returns do not include expenses, which have been deducted from the Fund’s return. These performance figures include the change in value of the stocks in the index plus the reinvestment of dividends and are not annualized. The returns shown do not reflect deduction of taxes that a shareholder would pay on Fund distributions or the redemption of Fund shares.
Current performance may be lower or higher than the performance data quoted. For more information on the Fund, and to obtain performance data current to the most recent month-end, or to request a prospectus, please call 1-855-261-0104. You should carefully consider the investment objectives, potential risks, management fees, and charges and expenses of the Fund before investing. The Fund’s prospectus contains this and other information about the Fund, and should be read carefully before investing.
The Fund is distributed by Unified Financial Securities, Inc., member FINRA.
11
INVESTMENT RESULTS – (Unaudited) (continued)
Total Return*
(For the period ended August 31, 2014)
| | | | |
| | | Since Inception
(December 23, 2013) | |
Meritage Yield-Focus Equity Fund, Institutional Class | | | 12.70 | % |
Russell 3000 Value Index** | | | 11.49 | % |
Total annual operating expenses, as disclosed in the Fund’s prospectus dated December 19, 2013, were 1.48% of average daily net assets (1.00% after fee waivers/expense reimbursements by the Adviser). The Adviser has contractually agreed to waive or limit its fees and assume other expenses of the Fund through December 31, 2015, so that total annual fund operating expenses do not exceed 1.00% of the Fund’s average daily net assets. This operating expense limitation does not apply to brokerage fees and commissions, borrowing costs (such as interest and dividend expenses on securities sold short), taxes, 12b-1 fees, extraordinary expenses and indirect expenses (such as “acquired fund fees and expenses”). This contractual arrangement may only be terminated by mutual consent of the Adviser and the Board of Trustees of the Fund, and it will automatically terminate upon the termination of the investment advisory agreement between the Fund and the Adviser.
Total Return*
(For the period ended August 31, 2014)
| | | | |
| | | Since Inception
(December 23, 2013) | |
Meritage Yield-Focus Equity Fund, Investor Class | | | 12.50 | % |
Russell 3000 Value Index** | | | 11.49 | % |
Total annual operating expenses, as disclosed in the Fund’s prospectus dated December 19, 2013, were 1.73% of average daily net assets (1.25% after fee waivers/expense reimbursements by the Adviser). The Adviser has contractually agreed to waive or limit its fees and assume other expenses of the Fund through December 31, 2015, so that total annual fund operating expenses do not exceed 1.00% of the Fund’s average daily net assets. This operating expense limitation does not apply to brokerage fees and commissions, borrowing costs (such as interest and dividend expenses on securities sold short), taxes, 12b-1 fees, extraordinary expenses and indirect expenses (such as “acquired fund fees and expenses”). This contractual arrangement may only be terminated by mutual consent of the Adviser and the Board of Trustees of the Fund, and it will automatically terminate upon the termination of the investment advisory agreement between the Fund and the Adviser.
The performance quoted represents past performance, which does not guarantee future results. The investment return and principal value of an investment will fluctuate so that an investor’s shares, when redeemed, may be worth more or less than their original cost. The returns shown do not reflect deduction of taxes that a shareholder would pay on Fund distributions or the redemption of Fund shares. The Fund’s investment objectives, risks, charges and expenses must be considered carefully before investing. Current performance of a Fund may be lower or higher than the performance quoted. Performance data current to the most recent month end may be obtained by calling 1-855-261-0104.
12
INVESTMENT RESULTS – (Unaudited) (continued)
The performance above reflects any fee reductions during the applicable period. If such fee reductions had not occurred, the quoted performance would be lower.
| * | Return figures reflect any change in price per share and assume the reinvestment of all distributions. |
| ** | The Russell 3000 Value Index is a widely recognized unmanaged index of equity securities and is representative of a broader domestic equity market and range of securities than is found in the Fund’s portfolio. Individuals cannot invest directly in an Index; however, an individual can invest in exchange traded funds or other investment vehicles that attempt to track the performance of a benchmark index. |
The Fund’s investment objective, strategies, risks, charges and expenses must be considered carefully before investing. The prospectus contains this and other important information about the investment company and may be obtained by calling
1-855-261-0104. Please read it carefully before investing.
The Fund is distributed by Unified Financial Securities, Inc., Member FINRA.
13
INVESTMENT RESULTS – (Unaudited) (continued)

The chart above assumes an initial investment of $10,000 made on December 23, 2013 (commencement of operations) and held through August 31, 2014. THE FUND’S RETURNS REPRESENT PAST PERFORMANCE AND DO NOT GUARANTEE FUTURE RESULTS. The returns shown do not reflect deduction of taxes that a shareholder would pay on the Fund’s distributions or the redemption of the Fund’s shares. Investment returns and principal values will fluctuate so that your shares, when redeemed, may be worth more or less than their original purchase price.
The Russell 3000 Value Index is a widely recognized unmanaged index of equity securities and is representative of a broader domestic equity market and range of securities than is found in the Fund’s portfolio. Individuals cannot invest directly in an Index; however, an individual can invest in exchange traded funds or other investment vehicles that attempt to track the performance of a benchmark index. The Index returns do not include expenses, which have been deducted from the Fund’s return. These performance figures include the change in value of the stocks in the index plus the reinvestment of dividends and are not annualized. The returns shown do not reflect deduction of taxes that a shareholder would pay on Fund distributions or the redemption of Fund shares.
Current performance may be lower or higher than the performance data quoted. For more information on the Fund, and to obtain performance data current to the most recent month-end, or to request a prospectus, please call 1-855-261-0104. You should carefully consider the investment objectives, potential risks, management fees, and charges and expenses of the Fund before investing. The Fund’s prospectus contains this and other information about the Fund, and should be read carefully before investing.
The Fund is distributed by Unified Financial Securities, Inc., member FINRA.
14
FUND HOLDINGS – (Unaudited)
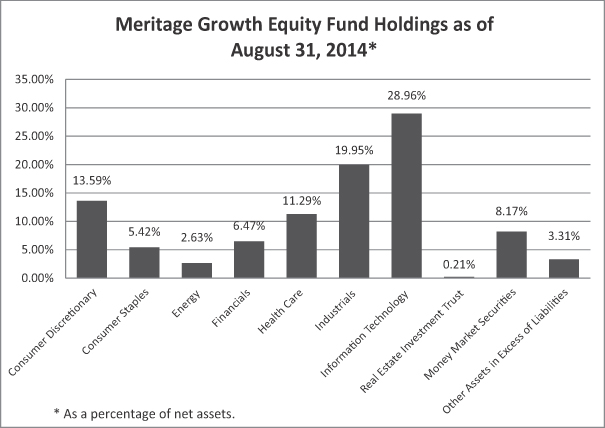
The investment objective of the Meritage Growth Equity Fund is to seek growth of capital.
15
FUND HOLDINGS – (Unaudited) (continued)
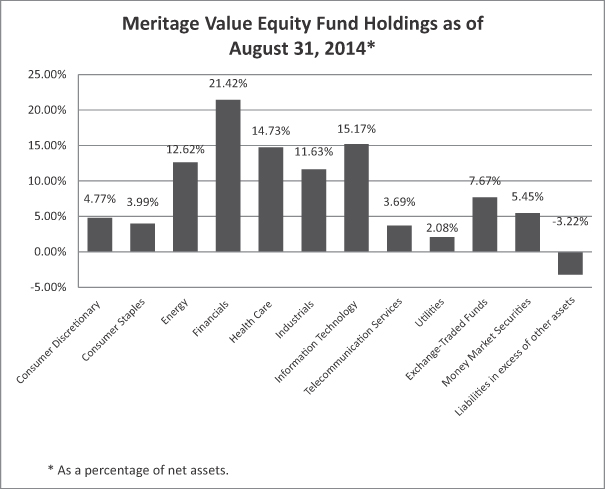
The investment objective of the Meritage Value Equity Fund is to seek growth of capital. Income is a secondary objective.
16
FUND HOLDINGS – (Unaudited) (continued)
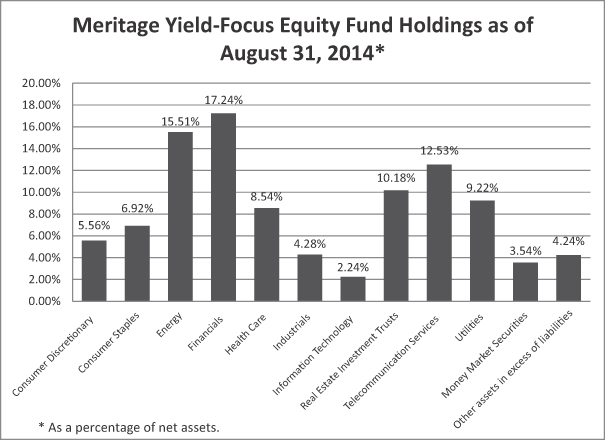
The investment objective of the Meritage Yield-Focus Equity Fund is to seek long-term growth of capital with an emphasis on high current income.
AVAILABILITY OF PORTFOLIO SCHEDULE – (Unaudited)
The Funds will file their complete schedule of portfolio holdings with the Securities and Exchange Commission (“SEC”) for the first and third quarter of each fiscal year on Form N-Q. The Funds’ Forms N-Q will be available at the SEC’s website at www.sec.gov. The Form N-Q may be reviewed and copied at the Public Reference Room in Washington, DC. Information on the operation of the Public Reference Room may be obtained by calling 1-800-SEC-0330.
SUMMARY OF FUND EXPENSES – (Unaudited)
As a shareholder of a Fund, you incur ongoing costs, including management fees and other Fund expenses. This Example is intended to help you understand your ongoing costs (in dollars) of investing in the Fund and to compare these costs with the ongoing costs of investing in other mutual funds. The Example is based on an investment of $1,000 invested at the beginning of the period, and held for the entire period from March 1, 2014 to August 31, 2014.
17
SUMMARY OF FUND EXPENSES – (Unaudited) (continued)
Actual Expenses
The first line of the table below provides information about actual account values and actual expenses. You may use the information in this line, together with the amount you invested, to estimate the expenses that you paid over the period. Simply divide your account value by $1,000 (for example, an $8,600 account value divided by $1,000 = $8.60), then multiply the result by the number in the first line under the heading entitled “Expenses Paid During the Period” to estimate the expenses you paid on your account during this period.
Hypothetical Example for Comparison Purposes
The second line of the table below provides information about hypothetical account values and hypothetical expenses based on the Fund’s actual expense ratio and an assumed rate of return of 5% per year before expenses, which is not the Fund’s actual return. The hypothetical account values and expenses may not be used to estimate the actual ending account balance or expenses you paid for the period. You may use this information to compare the ongoing costs of investing in the Fund and other funds. To do so, compare this 5% hypothetical example with the 5% hypothetical examples that appear in the shareholder reports of the other funds.
Please note that the expenses shown in the table are meant to highlight your ongoing costs only. Therefore, the second line of the table below is useful in comparing ongoing costs only and will not help you determine the relative costs of owning different funds.
| | | | | | | | | | | | | | | | |
| | | Beginning
Account Value
March 1, 2014 | | | Ending
Account Value
August 31, 2014 | | | Expenses Paid
During Period* | | | Annualized
Expense
Ratio | |
Meritage Growth Equity Fund | | | | | | | | | | | | | | | | |
Institutional Class | | | | | | | | | | | | | | | | |
Actual | | $ | 1,000.00 | | | $ | 1,063.10 | | | $ | 5.20 | | | | 1.00 | % |
Hypothetical** | | $ | 1,000.00 | | | $ | 1,020.16 | | | $ | 5.09 | | | | 1.00 | % |
Investor Class | | | | | | | | | | | | | | | | |
Actual | | $ | 1,000.00 | | | $ | 1,061.20 | | | $ | 6.49 | | | | 1.25 | % |
Hypothetical** | | $ | 1,000.00 | | | $ | 1,018.90 | | | $ | 6.36 | | | | 1.25 | % |
Meritage Value Equity Fund | | | | | | | | | | | | | | | | |
Institutional Class | | | | | | | | | | | | | | | | |
Actual | | $ | 1,000.00 | | | $ | 1,074.20 | | | $ | 5.23 | | | | 1.00 | % |
Hypothetical** | | $ | 1,000.00 | | | $ | 1,020.16 | | | $ | 5.09 | | | | 1.00 | % |
Investor Class | | | | | | | | | | | | | | | | |
Actual | | $ | 1,000.00 | | | $ | 1,073.30 | | | $ | 6.53 | | | | 1.25 | % |
Hypothetical** | | $ | 1,000.00 | | | $ | 1,018.90 | | | $ | 6.36 | | | | 1.25 | % |
Meritage Yield-Focus Equity Fund | | | | | | | | | | | | | | | | |
Institutional Class | | | | | | | | | | | | | | | | |
Actual | | $ | 1,000.00 | | | $ | 1,089.90 | | | $ | 5.27 | | | | 1.00 | % |
Hypothetical** | | $ | 1,000.00 | | | $ | 1,020.16 | | | $ | 5.09 | | | | 1.00 | % |
Investor Class | | | | | | | | | | | | | | | | |
Actual | | $ | 1,000.00 | | | $ | 1,089.10 | | | $ | 6.58 | | | | 1.25 | % |
Hypothetical** | | $ | 1,000.00 | | | $ | 1,018.90 | | | $ | 6.36 | | | | 1.25 | % |
| * | Expenses are equal to the Fund’s annualized expense ratio multiplied by the average account value over the period, multiplied by 184/365. |
| ** | Assumes 5% return before expenses. |
18
MERITAGE GROWTH EQUITY FUND
SCHEDULE OF INVESTMENTS
August 31, 2014
| | | | | | | | |
| COMMON STOCKS – 88.52% | | Shares | | | Fair Value | |
Consumer Discretionary – 13.59% | | | | | | | | |
Bed Bath & Beyond, Inc. * | | | 2,260 | | | $ | 145,228 | |
CBS Corp. – Class B | | | 1,513 | | | | 89,706 | |
Continental AG ADR | | | 3,055 | | | | 130,204 | |
Gentex Corp. | | | 4,410 | | | | 130,316 | |
Home Depot, Inc./The | | | 2,580 | | | | 241,230 | |
Scripps Networks Interactive, Inc. – Class A | | | 2,925 | | | | 233,152 | |
TJX Cos., Inc./The | | | 2,265 | | | | 135,017 | |
Walt Disney Co./The | | | 2,535 | | | | 227,846 | |
Yum! Brands, Inc. | | | 1,820 | | | | 131,823 | |
| | | | | | | | |
| | | | | | | 1,464,522 | |
| | | | | | | | |
Consumer Staples – 5.42% | |
Colgate-Palmolive Co. | | | 3,125 | | | | 202,281 | |
Dr. Pepper Snapple Group, Inc. | | | 2,145 | | | | 134,963 | |
Henkel AG & Co. KGaA ADR | | | 2,600 | | | | 246,935 | |
| | | | | | | | |
| | | | | | | 584,179 | |
| | | | | | | | |
Energy – 2.63% | |
FMC Technologies, Inc. * | | | 2,105 | | | | 130,173 | |
Schlumberger Ltd. | | | 1,400 | | | | 153,496 | |
| | | | | | | | |
| | | | | | | 283,669 | |
| | | | | | | | |
Financials – 6.47% | |
ACE Ltd. | | | 1,685 | | | | 179,166 | |
Allstate Corp./The | | | 3,670 | | | | 225,668 | |
Aon PLC | | | 1,525 | | | | 132,919 | |
Everest Re Group Ltd. | | | 976 | | | | 159,908 | |
| | | | | | | | |
| | | | | | | 697,661 | |
| | | | | | | | |
Health Care – 11.29% | |
Align Technology, Inc. * | | | 1,895 | | | | 103,202 | |
Amgen, Inc. | | | 805 | | | | 112,201 | |
Biogen Idec, Inc. * | | | 347 | | | | 119,035 | |
Edwards LifeSciences Corp. * | | | 2,880 | | | | 285,869 | |
Greatbatch, Inc. * | | | 2,345 | | | | 106,862 | |
Johnson & Johnson | | | 1,260 | | | | 130,700 | |
McKesson Corp. | | | 1,040 | | | | 202,831 | |
WuXi PharmaTech Cayman, Inc. ADR * | | | 4,210 | | | | 155,854 | |
| | | | | | | | |
| | | | | | | 1,216,554 | |
| | | | | | | | |
Industrials – 19.95% | |
AMETEK, Inc. | | | 3,165 | | | | 167,555 | |
Danaher Corp. | | | 4,445 | | | | 340,531 | |
Deluxe Corp. | | | 2,225 | | | | 132,499 | |
Equifax, Inc. | | | 2,075 | | | | 163,427 | |
Hubbell, Inc. – Class B | | | 1,540 | | | | 186,186 | |
See accompanying notes which are an integral part of these financial statements.
19
MERITAGE GROWTH EQUITY FUND
SCHEDULE OF INVESTMENTS – (continued)
August 31, 2014
| | | | | | | | |
| COMMON STOCKS – 88.52% – continued | | Shares | | | Fair Value | |
Industrials – 19.95% – continued | |
Lincoln Electric Holdings, Inc. | | | 2,165 | | | $ | 153,932 | |
Rockwell Automation, Inc. | | | 1,080 | | | | 125,939 | |
Southwest Airlines Co. | | | 5,825 | | | | 186,458 | |
Textron, Inc. | | | 3,470 | | | | 131,860 | |
TrueBlue, Inc. * | | | 4,860 | | | | 131,900 | |
UniFirst Corp. | | | 1,155 | | | | 111,977 | |
Union Pacific Corp. | | | 3,020 | | | | 317,915 | |
| | | | | | | | |
| | | | | | | 2,150,179 | |
| | | | | | | | |
Information Technology – 28.96% | | | | | | | | |
Activision Blizzard, Inc. | | | 5,725 | | | | 134,767 | |
Akamai Technologies, Inc. * | | | 1,905 | | | | 115,100 | |
Apple, Inc. | | | 2,704 | | | | 277,160 | |
F5 Networks, Inc. * | | | 1,090 | | | | 135,367 | |
Fiserv, Inc. * | | | 2,700 | | | | 174,069 | |
Google, Inc. – Class A * | | | 328 | | | | 191,014 | |
International Business Machines Corp. | | | 825 | | | | 158,648 | |
MasterCard, Inc. – Class A | | | 3,140 | | | | 238,043 | |
NetApp, Inc. | | | 3,615 | | | | 152,408 | |
Netscout Systems, Inc. * | | | 3,620 | | | | 166,773 | |
Oracle Corp. | | | 4,950 | | | | 205,573 | |
PTC, Inc. * | | | 3,710 | | | | 143,540 | |
QUALCOMM, Inc. | | | 2,635 | | | | 200,523 | |
SanDisk Corp. | | | 2,210 | | | | 216,492 | |
Sanmina Corp. * | | | 10,465 | | | | 245,718 | |
Sapient Corp. * | | | 7,620 | | | | 110,566 | |
Seagate Technology PLC | | | 1,960 | | | | 122,657 | |
Take-Two Interactive Software, Inc. * | | | 5,635 | | | | 132,479 | |
| | | | | | | | |
| | | | | | | 3,120,897 | |
| | | | | | | | |
Real Estate Investment Trusts – 0.21% | |
CBS Outdoor Americas, Inc. | | | 663 | | | | 22,787 | |
| | | | | | | | |
TOTAL COMMON STOCKS (Cost $8,817,839) | | | | | | | 9,540,448 | |
| | | | | | | | |
MONEY MARKET SECURITIES – 8.17% | | | | | | | | |
Fidelity Institutional Money Market Treasury Portfolio – Class I, 0.01% (a) | | | 880,957 | | | | 880,957 | |
| | | | | | | | |
| | |
TOTAL MONEY MARKET SECURITIES (Cost $880,957) | | | | | | | 880,957 | |
| | | | | | | | |
TOTAL INVESTMENTS – 96.69% (Cost $9,698,796) | | | | | | | 10,421,405 | |
| | | | | | | | |
Other Assets in Excess of Liabilities – 3.31% | | | | | | | 356,207 | |
| | | | | | | | |
TOTAL NET ASSETS – 100.00% | | | | | | $ | 10,777,612 | |
| | | | | | | | |
| | * | Non-income producing security. |
| | (a) | Rate disclosed is the seven day yield as of August 31, 2014. |
ADR – American Depositary Receipt
See accompanying notes which are an integral part of these financial statements.
20
MERITAGE VALUE EQUITY FUND
SCHEDULE OF INVESTMENTS
August 31, 2014
| | | | | | | | |
| COMMON STOCKS – 90.10% | | Shares | | | Fair Value | |
Consumer Discretionary – 4.77% | | | | | | | | |
Ford Motor Co. | | | 8,135 | | | $ | 141,630 | |
Gannett Co., Inc. | | | 4,600 | | | | 155,296 | |
TRW Automotive Holdings Corp. * | | | 1,715 | | | | 165,137 | |
| | | | | | | | |
| | | | | | | 462,063 | |
| | | | | | | | |
Consumer Staples – 3.99% | | | | | | | | |
Archer-Daniels-Midland Co. | | | 4,185 | | | | 208,664 | |
CVS Caremark Corp. | | | 2,240 | | | | 177,968 | |
| | | | | | | | |
| | | | | | | 386,632 | |
| | | | | | | | |
Energy – 12.62% | | | | | | | | |
Baker Hughes, Inc. | | | 2,455 | | | | 169,739 | |
Chevron Corp. | | | 1,345 | | | | 174,110 | |
ConocoPhillips | | | 2,415 | | | | 196,146 | |
Exxon Mobil Corp. | | | 1,625 | | | | 161,623 | |
National Oilwell Varco, Inc. | | | 2,315 | | | | 200,086 | |
Occidental Petroleum Corp. | | | 1,695 | | | | 175,822 | |
Royal Dutch Shell PLC ADR | | | 1,790 | | | | 144,936 | |
| | | | | | | | |
| | | | | | | 1,222,462 | |
| | | | | | | | |
Financials – 21.42% | | | | | | | | |
Axis Capital Holdings Ltd. | | | 4,200 | | | | 202,524 | |
Fidelity & Guaranty Life | | | 3,865 | | | | 87,194 | |
Horace Mann Educators Corp. | | | 5,195 | | | | 154,811 | |
KeyCorp | | | 13,520 | | | | 184,007 | |
MetLife, Inc. | | | 3,860 | | | | 211,296 | |
Prudential Financial, Inc. | | | 2,540 | | | | 227,838 | |
Reinsurance Group of America, Inc. | | | 2,390 | | | | 198,322 | |
Torchmark Corp. | | | 4,477 | | | | 244,220 | |
Voya Financial, Inc. | | | 5,315 | | | | 207,763 | |
W.R. Berkley Corp. | | | 3,110 | | | | 150,369 | |
Wells Fargo & Co. | | | 3,990 | | | | 205,246 | |
| | | | | | | | |
| | | | | | | 2,073,590 | |
| | | | | | | | |
Health Care – 14.73% | | | | | | | | |
Aetna, Inc. | | | 1,840 | | | | 151,119 | |
CIGNA Corp. | | | 1,495 | | | | 141,427 | |
Computer Programs & Systems, Inc. | | | 1,545 | | | | 94,925 | |
Eli Lilly & Co. | | | 2,670 | | | | 169,705 | |
ICON PLC * | | | 3,305 | | | | 163,730 | |
Magellan Health Services, Inc. * | | | 3,645 | | | | 203,610 | |
Mednax, Inc. * | | | 2,470 | | | | 141,408 | |
Teva Pharmaceutical Industries Ltd. ADR | | | 3,780 | | | | 198,526 | |
UnitedHealth Group, Inc. | | | 1,865 | | | | 161,658 | |
| | | | | | | | |
| | | | | | | 1,426,108 | |
| | | | | | | | |
See accompanying notes which are an integral part of these financial statements.
21
MERITAGE VALUE EQUITY FUND
SCHEDULE OF INVESTMENTS – (continued)
August 31, 2014
| | | | | | | | |
| COMMON STOCKS – 90.10% – continued | | Shares | | | Fair Value | |
Industrials – 11.63% | | | | | | | | |
EnerSys | | | 3,400 | | | $ | 218,586 | |
Huron Consulting Group, Inc. * | | | 1,795 | | | | 108,562 | |
Moog, Inc. – Class A * | | | 2,720 | | | | 192,848 | |
Northrop Grumman Corp. | | | 2,055 | | | | 261,437 | |
Raytheon Co. | | | 2,060 | | | | 198,460 | |
Valmont Industries, Inc. | | | 1,040 | | | | 146,380 | |
| | | | | | | | |
| | | | | | | 1,126,273 | |
| | | | | | | | |
Information Technology – 15.17% | | | | | | | | |
Arrow Electronics, Inc. * | | | 2,465 | | | | 153,446 | |
Brocade Communications Systems, Inc. | | | 16,920 | | | | 178,506 | |
Check Point Software Technologies Ltd. * | | | 2,230 | | | | 158,375 | |
CSG Systems International, Inc. | | | 5,290 | | | | 146,639 | |
Diodes, Inc. * | | | 3,600 | | | | 91,620 | |
Hewlett-Packard Co. | | | 4,515 | | | | 171,570 | |
Marvell Technology Group Ltd. | | | 10,785 | | | | 150,019 | |
Skyworks Solutions, Inc. | | | 4,115 | | | | 233,156 | |
Synopsys, Inc. * | | | 4,530 | | | | 185,277 | |
| | | | | | | | |
| | | | | | | 1,468,608 | |
| | | | | | | | |
Telecommunication Services – 3.69% | | | | | | | | |
Deutsche Telekom AG ADR | | | 12,725 | | | | 189,603 | |
Nippon Telegraph & Telephone Corp. ADR | | | 4,985 | | | | 167,695 | |
| | | | | | | | |
| | | | | | | 357,298 | |
| | | | | | | | |
Utilities – 2.08% | | | | | | | | |
Entergy Corp. | | | 2,600 | | | | 201,266 | |
| | | | | | | | |
TOTAL COMMON STOCKS (Cost $8,104,430) | | | | | | | 8,724,300 | |
| | | | | | | | |
EXCHANGE-TRADED FUNDS – 7.67% | | | | | | | | |
iShares Russell 1000 Value Index Fund | | | 2,835 | | | | 290,985 | |
Utilities Select Sector SPDR Fund | | | 10,425 | | | | 451,194 | |
| | | | | | | | |
TOTAL EXCHANGE-TRADED FUNDS (Cost $696,676) | | | | | | | 742,179 | |
| | | | | | | | |
MONEY MARKET SECURITIES – 5.45% | | | | | | | | |
Fidelity Institutional Money Market Treasury Portfolio – Class I, 0.01% (a) | | | 527,811 | | | | 527,811 | |
| | | | | | | | |
TOTAL MONEY MARKET SECURITIES (Cost $527,811) | | | | | | | 527,811 | |
| | | | | | | | |
TOTAL INVESTMENTS – 103.22% (Cost $9,328,917) | | | | | | | 9,994,290 | |
| | | | | | | | |
Liabilities in Excess of Other Assets – (3.22)% | | | | | | | (311,916 | ) |
| | | | | | | | |
TOTAL NET ASSETS – 100.00% | | | | | | $ | 9,682,374 | |
| | | | | | | | |
| | * | Non-income producing security. |
| | (a) | Rate disclosed is the seven day yield as of August 31, 2014. |
ADR – American Depositary Receipt
See accompanying notes which are an integral part of these financial statements.
22
MERITAGE YIELD-FOCUS EQUITY FUND
SCHEDULE OF INVESTMENTS
August 31, 2014
| | | | | | | | |
| COMMON STOCKS – 90.58% | | Shares | | | Fair Value | |
Consumer Discretionary – 5.56% | | | | | | | | |
Cato Corp./The – Class A | | | 12,980 | | | $ | 450,017 | |
CTC Media, Inc. | | | 47,180 | | | | 428,394 | |
Garmin Ltd. | | | 9,080 | | | | 493,317 | |
Superior Industries International, Inc. | | | 12,615 | | | | 245,362 | |
| | | | | | | | |
| | | | | | | 1,617,090 | |
| | | | | | | | |
Consumer Staples – 6.92% | |
Altria Group, Inc. | | | 16,440 | | | | 708,235 | |
Lorillard, Inc. | | | 10,195 | | | | 608,642 | |
Reynolds American, Inc. | | | 11,890 | | | | 695,208 | |
| | | | | | | | |
| | | | | | | 2,012,085 | |
| | | | | | | | |
Energy – 15.51% | |
BP PLC ADR | | | 9,575 | | | | 458,068 | |
Energy Transfer Partners LP (a) | | | 9,575 | | | | 550,084 | |
Eni SpA ADR | | | 9,040 | | | | 450,734 | |
Ensco PLC – Class A | | | 5,355 | | | | 270,320 | |
Enterprise Products Partners LP (a) | | | 16,240 | | | | 659,831 | |
Plains All American Pipeline LP (a) | | | 11,390 | | | | 682,603 | |
Seadrill Partners LLC (a) | | | 13,225 | | | | 456,659 | |
Targa Resources Partners LP (a) | | | 6,670 | | | | 496,248 | |
Williams Partners LP (a) | | | 9,100 | | | | 482,391 | |
| | | | | | | | |
| | | | | | | 4,506,938 | |
| | | | | | | | |
Financials – 17.24% | |
Ares Capital Corp. | | | 26,155 | | | | 448,558 | |
Australia & New Zealand Banking Group Ltd. ADR | | | 12,800 | | | | 397,952 | |
Bank of Montreal | | | 6,550 | | | | 504,088 | |
BGC Partners, Inc. | | | 56,385 | | | | 426,835 | |
Canadian Imperial Bank of Commerce | | | 4,585 | | | | 438,280 | |
Fifth Street Finance Corp. | | | 45,780 | | | | 450,017 | |
KKR & Co. LP (a) | | | 28,708 | | | | 674,351 | |
National Australia Bank Ltd. ADR | | | 24,580 | | | | 404,341 | |
Old Republic International Corp. | | | 25,840 | | | | 396,644 | |
Power Financial Corp. | | | 10,970 | | | | 355,099 | |
Zurich Insurance Group AG ADR | | | 16,965 | | | | 513,191 | |
| | | | | | | | |
| | | | | | | 5,009,356 | |
| | | | | | | | |
Health Care – 8.54% | |
AstraZeneca PLC ADR | | | 7,790 | | | | 592,118 | |
Eli Lilly & Co. | | | 7,705 | | | | 489,730 | |
GlaxoSmithKline PLC ADR | | | 12,840 | | | | 630,444 | |
Pfizer, Inc. | | | 16,870 | | | | 495,809 | |
See accompanying notes which are an integral part of these financial statements.
23
MERITAGE YIELD-FOCUS EQUITY FUND
SCHEDULE OF INVESTMENTS – (continued)
August 31, 2014
| | | | | | | | |
| COMMON STOCKS – 90.58% – continued | | Shares | | | Fair Value | |
Health Care – 8.54% – continued | |
Quality Systems, Inc. | | | 17,420 | | | $ | 272,797 | |
| | | | | | | | |
| | | | | | | 2,480,898 | |
| | | | | | | | |
Industrials – 4.28% | |
Ennis, Inc. | | | 14,175 | | | | 204,545 | |
Golar LNG Partners LP (a) | | | 13,580 | | | | 517,127 | |
Lockheed Martin Corp. | | | 3,000 | | | | 522,000 | |
| | | | | | | | |
| | | | | | | 1,243,672 | |
| | | | | | | | |
Information Technology – 2.24% | |
Electro Rent Corp. | | | 13,265 | | | | 200,700 | |
Intersil Corp. – Class A | | | 29,960 | | | | 450,748 | |
| | | | | | | | |
| | | | | | | 651,448 | |
| | | | | | | | |
Real Estate Investment Trusts – 8.54% | | | | | | | | |
American Realty Capital Properties, Inc. | | | 45,825 | | | | 603,057 | |
Campus Crest Communities, Inc. | | | 29,380 | | | | 241,504 | |
EPR Properties | | | 9,455 | | | | 538,084 | |
Lexington Realty Trust | | | 35,570 | | | | 387,002 | |
Medical Properties Trust, Inc. | | | 32,020 | | | | 451,162 | |
STAG Industrial, Inc. | | | 11,170 | | | | 261,713 | |
| | | | | | | | |
| | | | | | | 2,482,522 | |
| | | | | | | | |
Telecommunication Services – 12.53% | |
AT&T, Inc. | | | 12,395 | | | | 433,329 | |
BCE, Inc. ADR | | | 10,165 | | | | 457,628 | |
CenturyLink, Inc. | | | 12,125 | | | | 497,004 | |
Rogers Communications, Inc. | | | 10,185 | | | | 415,446 | |
Spark New Zealand Ltd. ADR | | | 30,570 | | | | 375,705 | |
Telefonica Brasil SA ADR | | | 23,900 | | | | 511,460 | |
Telstra Corp. Ltd. ADR | | | 17,930 | | | | 466,897 | |
Verizon Communications, Inc. | | | 9,732 | | | | 484,848 | |
| | | | | | | | |
| | | | | | | 3,642,317 | |
| | | | | | | | |
Utilities – 9.22% | |
Centrica PLC ADR | | | 21,630 | | | | 463,531 | |
E.ON AG ADR | | | 25,045 | | | | 453,565 | |
Entergy Corp. | | | 5,530 | | | | 428,077 | |
PPL Corp. | | | 15,025 | | | | 520,316 | |
Public Service Enterprise Group, Inc. | | | 10,970 | | | | 410,168 | |
Westar Energy, Inc. | | | 10,955 | | | | 404,568 | |
| | | | | | | | |
| | | | | | | 2,680,225 | |
| | | | | | | | |
See accompanying notes which are an integral part of these financial statements.
24
MERITAGE YIELD-FOCUS EQUITY FUND
SCHEDULE OF INVESTMENTS – (continued)
August 31, 2014
| | | | | | | | |
| COMMON STOCKS – 90.58% – continued | | Shares | | | Fair Value | |
| | |
TOTAL COMMON STOCKS (Cost $25,104,169) | | | | | | $ | 26,326,551 | |
| | | | | | | | |
PREFERRED STOCKS – 1.64% | | | | | | | | |
Real Estate Investment Trusts – 1.64% | | | | | | | | |
Weyerhaeuser Co., Series A, 6.375% | | | 8,265 | | | | 477,387 | |
| | | | | | | | |
TOTAL PREFERRED STOCKS (Cost $455,524) | | | | | | | 477,387 | |
| | | | | | | | |
MONEY MARKET SECURITIES – 3.54% | | | | | | | | |
Fidelity Institutional Money Market Treasury Portfolio – Class I, 0.01% (b) | | | 1,027,307 | | | | 1,027,307 | |
| | | | | | | | |
TOTAL MONEY MARKET SECURITIES (Cost $1,027,307) | | | | | | | 1,027,307 | |
| | | | | | | | |
TOTAL INVESTMENTS – 95.76% (Cost $26,587,000) | | | | | | | 27,831,245 | |
| | | | | | | | |
Other Assets in Excess of Liabilities – 4.24% | | | | | | | 1,231,655 | |
| | | | | | | | |
TOTAL NET ASSETS – 100.00% | | | | | | | $29,062,900 | |
| | | | | | | | |
| | (a) | Master Limited Partnership. |
| | (b) | Rate disclosed is the seven day yield as of August 31, 2014. |
ADR – American Depositary Receipt
See accompanying notes which are an integral part of these financial statements.
25
STATEMENTS OF ASSETS AND LIABILITIES
August 31, 2014
| | | | | | | | | | | | |
| | | Meritage Growth
Equity Fund | | | Meritage Value
Equity Fund | | | Meritage Yield-
Focus Equity Fund | |
Assets | | | | | | | | | | | | |
Investments in securities at value
(cost $9,698,796, $9,328,917 and $26,587,000) | | $ | 10,421,405 | | | $ | 9,994,290 | | | $ | 27,831,245 | |
Receivable for fund shares sold | | | – | | | | – | | | | 1,834,463 | |
Receivable for investments sold | | | 692,282 | | | | – | | | | 592,653 | |
Dividends receivable | | | 14,635 | | | | 17,908 | | | | 69,399 | |
Tax reclaims receivable | | | 703 | | | | – | | | | 2,442 | |
Receivable from Adviser | | | – | | | | 1,512 | | | | – | |
Prepaid offering costs | | | 1,774 | | | | 1,812 | | | | 1,920 | |
Prepaid expenses | | | 3,574 | | | | 550 | | | | 2,251 | |
| | | | | | | | | | | | |
Total Assets | | | 11,134,373 | | | | 10,016,072 | | | | 30,334,373 | |
| | | | | | | | | | | | |
| | | |
Liabilities | | | | | | | | | | | | |
Payable for investments purchased | | | 333,017 | | | | 311,751 | | | | 1,230,410 | |
Payable to Adviser | | | 862 | | | | – | | | | 2,975 | |
Accrued 12b-1 fees – Investor class | | | 23 | | | | 2 | | | | 163 | |
Payable to administrator, fund accountant, and transfer agent | | | 6,992 | | | | 7,075 | | | | 15,469 | |
Payable to custodian | | | 3,395 | | | | 2,681 | | | | 4,408 | |
Payable to trustees | | | 638 | | | | 619 | | | | 1,262 | |
Other accrued expenses | | | 11,834 | | | | 11,570 | | | | 16,786 | |
| | | | | | | | | | | | |
Total Liabilities | | | 356,761 | | | | 333,698 | | | | 1,271,473 | |
| | | | | | | | | | | | |
| | | |
Net Assets | | $ | 10,777,612 | | | $ | 9,682,374 | | | $ | 29,062,900 | |
| | | | | | | | | | | | |
| | | |
Net Assets consist of: | | | | | | | | | | | | |
Paid-in capital | | $ | 9,932,292 | | | $ | 8,920,503 | | | $ | 27,484,042 | |
Accumulated undistributed net investment income | | | 9,663 | | | | 34,383 | | | | 240,260 | |
Accumulated undistributed net realized gain from investment transactions | | | 113,048 | | | | 62,115 | | | | 94,353 | |
Net unrealized appreciation on investments | | | 722,609 | | | | 665,373 | | | | 1,244,245 | |
| | | | | | | | | | | | |
| | | |
Net Assets | | $ | 10,777,612 | | | $ | 9,682,374 | | | $ | 29,062,900 | |
| | | | | | | | | | | | |
| | | |
Net Assets: Institutional Class | | $ | 10,641,846 | | | $ | 9,673,493 | | | $ | 26,436,101 | |
| | | | | | | | | | | | |
Shares outstanding
(unlimited number of shares authorized, no par value) | | | 972,113 | | | | 879,598 | | | | 2,345,843 | |
| | | | | | | | | | | | |
Net asset value, offering and redemption price per share | | $ | 10.95 | | | $ | 11.00 | | | $ | 11.27 | |
| | | | | | | | | | | | |
| | | |
Net Assets: Investor Class | | $ | 135,766 | | | $ | 8,881 | | | $ | 2,626,799 | |
| | | | | | | | | | | | |
Shares outstanding
(unlimited number of shares authorized, no par value) | | | 12,429 | | | | 809 | | | | 233,525 | |
| | | | | | | | | | | | |
Net asset value, offering and redemption price per share | | $ | 10.92 | | | $ | 10.98 | | | $ | 11.25 | |
| | | | | | | | | | | | |
See accompanying notes which are an integral part of these financial statements.
26
STATEMENTS OF OPERATIONS
For the period ended August 31, 2014 (a)
| | | | | | | | | | | | |
| | | Meritage Growth
Equity Fund | | | Meritage Value
Equity Fund | | | Meritage Yield-
Focus Equity Fund | |
Investment Income | | | | | | | | | | | | |
Dividend income
(net of foreign taxes withheld of $2,623, $2,113 and $9,325) | | $ | 53,605 | | | $ | 74,598 | | | $ | 331,168 | |
| | | | | | | | | | | | |
Total investment income | | | 53,605 | | | | 74,598 | | | | 331,168 | |
| | | | | | | | | | | | |
| | | |
Expenses | | | | | | | | | | | | |
Investment Adviser fee | | | 32,903 | | | | 30,141 | | | | 67,095 | |
12b-1 fee – Investor class | | | 49 | | | | 7 | | | | 358 | |
Administration expenses | | | 22,649 | | | | 21,505 | | | | 34,567 | |
Fund accounting expenses | | | 15,266 | | | | 14,503 | | | | 23,545 | |
Transfer agent expenses | | | 19,182 | | | | 18,291 | | | | 28,682 | |
Legal expenses | | | 8,399 | | | | 8,004 | | | | 15,321 | |
Registration expenses | | | 2,560 | | | | 377 | | | | 1,198 | |
Custodian expenses | | | 7,929 | | | | 7,206 | | | | 12,859 | |
Audit expenses | | | 21,625 | | | | 21,625 | | | | 21,625 | |
Trustee expenses | | | 1,840 | | | | 1,739 | | | | 2,940 | |
Pricing expenses | | | 1,424 | | | | 1,348 | | | | 1,704 | |
Report printing expense | | | 5,368 | | | | 5,236 | | | | 8,379 | |
Offering expense | | | 2,574 | | | | 2,536 | | | | 2,428 | |
Organizational expense | | | 6,302 | | | | 6,342 | | | | 6,295 | |
24f-2 expense | | | 1,587 | | | | 1,510 | | | | 3,281 | |
Miscellaneous expenses | | | 3,601 | | | | 3,594 | | | | 3,755 | |
| | | | | | | | | | | | |
Total expenses | | | 153,258 | | | | 143,964 | | | | 234,032 | |
Fees waived and expenses reimbursed by Adviser | | | (109,316 | ) | | | (103,749 | ) | | | (144,170 | ) |
| | | | | | | | | | | | |
Net operating expenses | | | 43,942 | | | | 40,215 | | | | 89,862 | |
| | | | | | | | | | | | |
Net investment income | | | 9,663 | | | | 34,383 | | | | 241,306 | |
| | | | | | | | | | | | |
| |
Net Realized and Unrealized Gain on Investments | | | | | |
Net realized gain on investment securities transactions | | | 113,048 | | | | 59,455 | | | | 93,307 | |
Net realized gain on investment transactions of affiliates | | | – | | | | 2,660 | (b) | | | – | |
Net change in unrealized appreciation of investment securities | | | 722,609 | | | | 665,373 | | | | 1,244,245 | |
| | | | | | | | | | | | |
Net realized and unrealized gain on investments | | | 835,657 | | | | 727,488 | | | | 1,337,552 | |
| | | | | | | | | | | | |
Net increase in net assets resulting from operations | | $ | 845,320 | | | $ | 761,871 | | | $ | 1,578,858 | |
| | | | | | | | | | | | |
| (a) | For the period December 23, 2013 (commencement of operations) to August 31, 2014. |
| (b) | See Note 5 in the Notes to the Financial Statements. |
See accompanying notes which are an integral part of these financial statements.
27
STATEMENTS OF CHANGES IN NET ASSETS
For the period ended August 31, 2014 (a)
| | | | | | | | | | | | |
| | | Meritage Growth
Equity Fund | | | Meritage Value
Equity Fund | | | Meritage Yield-
Focus Equity Fund | |
Increase in Net Assets due to: | | | | | | | | | | | | |
Operations | | | | | | | | | | | | |
Net investment income | | $ | 9,663 | | | $ | 34,383 | | | $ | 241,306 | |
Net realized gain on investment securities transactions | | | 113,048 | | | | 62,115 | (b) | | | 93,307 | |
Net change in unrealized appreciation
of investment securities | | | 722,609 | | | | 665,373 | | | | 1,244,245 | |
| | | | | | | | | | | | |
Net increase in net assets resulting from operations | | | 845,320 | | | | 761,871 | | | | 1,578,858 | |
| | | | | | | | | | | | |
| | | |
Capital Transactions – Institutional Class | | | | | | | | | | | | |
Proceeds from shares sold | | | 10,257,514 | | | | 9,145,370 | | | | 25,639,887 | |
Amount paid for shares redeemed | | | (455,731 | ) | | | (233,367 | ) | | | (764,516 | ) |
| | | | | | | | | | | | |
Total Institutional Class | | | 9,801,783 | | | | 8,912,003 | | | | 24,875,371 | |
| | | | | | | | | | | | |
| | | |
Capital Transactions – Investor Class | | | | | | | | | | | | |
Proceeds from shares sold | | | 147,660 | | | | 8,500 | | | | 2,690,658 | |
Amount paid for shares redeemed | | | (17,151 | ) | | | – | | | | (81,987 | ) |
| | | | | | | | | | | | |
Total Investor Class | | | 130,509 | | | | 8,500 | | | | 2,608,671 | |
| | | | | | | | | | | | |
Net increase in net assets resulting from capital transactions | | | 9,932,292 | | | | 8,920,503 | | | | 27,484,042 | |
| | | | | | | | | | | | |
Total Increase in Net Assets | | | 10,777,612 | | | | 9,682,374 | | | | 29,062,900 | |
| | | | | | | | | | | | |
| | | |
Net Assets | | | | | | | | | | | | |
Beginning of period | | | – | | | | – | | | | – | |
| | | | | | | | | | | | |
End of period | | $ | 10,777,612 | | | $ | 9,682,374 | | | $ | 29,062,900 | |
| | | | | | | | | | | | |
Accumulated undistributed net investment income included in net assets at end of period | | $ | 9,663 | | | $ | 34,383 | | | $ | 240,260 | |
| | | | | | | | | | | | |
| | | |
Share Transactions – Institutional Class | | | | | | | | | | | | |
Shares sold | | | 1,016,399 | | | | 901,873 | | | | 2,416,290 | |
Shares redeemed | | | (44,286 | ) | | | (22,275 | ) | | | (70,447 | ) |
| | | | | | | | | | | | |
Total Institutional Class | | | 972,113 | | | | 879,598 | | | | 2,345,843 | |
| | | | | | | | | | | | |
| | | |
Share Transactions – Investor Class | | | | | | | | | | | | |
Shares sold | | | 14,083 | | | | 809 | | | | 240,941 | |
Shares redeemed | | | (1,654 | ) | | | – | | | | (7,416 | ) |
| | | | | | | | | | | | |
Total Investor Class | | | 12,429 | | | | 809 | | | | 233,525 | |
| | | | | | | | | | | | |
Net increase in shares outstanding | | | 984,542 | | | | 880,407 | | | | 2,579,368 | |
| (a) | For the period December 23, 2013 (commencement of operations) to August 31, 2014. |
| (b) | Includes gain of $2,660 due to an investment transaction with an affiliate. See Note 5 in the Notes to the Financial Statements. |
See accompanying notes which are an integral part of these financial statements.
28
MERITAGE GROWTH EQUITY FUND – INSTITUTIONAL CLASS
FINANCIAL HIGHLIGHTS
(For a share outstanding during the period)
| | | | |
| | | For the
Period Ended
August 31, 2014 (a) | |
Selected Per Share Data: | | | | |
Net asset value, beginning of period | | $ | 10.00 | |
| | | | |
Income from investment operations: | | | | |
Net investment income | | | 0.01 | |
Net realized and unrealized gain on investments | | | 0.94 | |
| | | | |
Total from investment operations | | | 0.95 | |
| | | | |
Net asset value, end of period | | $ | 10.95 | |
| | | | |
| |
Total Return (b) | | | 9.50 | %(c) |
| |
Ratios and Supplemental Data: | | | | |
Net assets, end of period (000 omitted) | | $ | 10,642 | |
Ratio of net expenses to average net assets | | | 1.00 | %(d) |
Ratio of expenses to average net assets before waiver and reimbursement | | | 3.49 | %(d) |
Ratio of net investment income to average net assets | | | 0.22 | %(d) |
Portfolio turnover rate | | | 94 | %(c) |
| (a) | For the period December 23, 2013 (commencement of operations) to August 31, 2014. |
| (b) | Total return in the above table represents the rate that the investor would have earned or lost on an investment in the Fund, assuming reinvestment of dividends. |
See accompanying notes which are an integral part of these financial statements.
29
MERITAGE GROWTH EQUITY FUND – INVESTOR CLASS
FINANCIAL HIGHLIGHTS
(For a share outstanding during the period)
| | | | |
| | | For the
Period Ended
August 31, 2014 (a) | |
Selected Per Share Data: | | | | |
Net asset value, beginning of period | | $ | 10.00 | |
| | | | |
Income from investment operations: | | | | |
Net investment income | | | – | (b) |
Net realized and unrealized gain on investments | | | 0.92 | |
| | | | |
Total from investment operations | | | 0.92 | |
| | | | |
Net asset value, end of period | | $ | 10.92 | |
| | | | |
| |
Total Return (c) | | | 9.20 | %(d) |
| |
Ratios and Supplemental Data: | | | | |
Net assets, end of period (000 omitted) | | $ | 136 | |
Ratio of net expenses to average net assets | | | 1.25 | %(e) |
Ratio of expenses to average net assets before waiver and reimbursement | | | 3.32 | %(e) |
Ratio of net investment income to average net assets | | | 0.01 | %(e) |
Portfolio turnover rate | | | 94 | %(d) |
| (a) | For the period December 23, 2013 (commencement of operations) to August 31, 2014. |
| (b) | Amount is less than $0.01. |
| (c) | Total return in the above table represents the rate that the investor would have earned or lost on an investment in the Fund, assuming reinvestment of dividends. |
See accompanying notes which are an integral part of these financial statements.
30
MERITAGE VALUE EQUITY FUND – INSTITUTIONAL CLASS
FINANCIAL HIGHLIGHTS
(For a share outstanding during the period)
| | | | |
| | | For the
Period Ended
August 31, 2014 (a) | |
Selected Per Share Data: | | | | |
Net asset value, beginning of period | | $ | 10.00 | |
| | | | |
Income from investment operations: | | | | |
Net investment income | | | 0.04 | |
Net realized and unrealized gain on investments | | | 0.96 | |
| | | | |
Total from investment operations | | | 1.00 | |
| | | | |
Net asset value, end of period | | $ | 11.00 | |
| | | | |
| |
Total Return (b) | | | 10.00 | %(c) |
| |
Ratios and Supplemental Data: | | | | |
Net assets, end of period (000 omitted) | | $ | 9,673 | |
Ratio of net expenses to average net assets | | | 1.00 | %(d) |
Ratio of expenses to average net assets before waiver and reimbursement | | | 3.58 | %(d) |
Ratio of net investment income to average net assets | | | 0.86 | %(d) |
Portfolio turnover rate | | | 50 | %(c) |
| (a) | For the period December 23, 2013 (commencement of operations) to August 31, 2014. |
| (b) | Total return in the above table represents the rate that the investor would have earned or lost on an investment in the Fund, assuming reinvestment of dividends. |
See accompanying notes which are an integral part of these financial statements.
31
MERITAGE VALUE EQUITY FUND – INVESTOR CLASS
FINANCIAL HIGHLIGHTS
(For a share outstanding during the period)
| | | | |
| | | For the
Period Ended
August 31, 2014 (a) | |
Selected Per Share Data: | | | | |
Net asset value, beginning of period | | $ | 10.00 | |
| | | | |
Income from investment operations: | | | | |
Net investment income | | | 0.02 | |
Net realized and unrealized gain on investments | | | 0.96 | |
| | | | |
Total from investment operations | | | 0.98 | |
| | | | |
Net asset value, end of period | | $ | 10.98 | |
| | | | |
| |
Total Return (b) | | | 9.80 | %(c) |
| |
Ratios and Supplemental Data: | | | | |
Net assets, end of period (000 omitted) | | $ | 9 | |
Ratio of net expenses to average net assets | | | 1.25 | %(d) |
Ratio of expenses to average net assets before waiver and reimbursement | | | 9.87 | %(d) |
Ratio of net investment income to average net assets | | | 0.64 | %(d) |
Portfolio turnover rate | | | 50 | %(c) |
| (a) | For the period December 23, 2013 (commencement of operations) to August 31, 2014. |
| (b) | Total return in the above table represents the rate that the investor would have earned or lost on an investment in the Fund, assuming reinvestment of dividends. |
See accompanying notes which are an integral part of these financial statements.
32
MERITAGE YIELD-FOCUS EQUITY FUND – INSTITUTIONAL CLASS
FINANCIAL HIGHLIGHTS
(For a share outstanding during the period)
| | | | |
| | | For the
Period Ended
August 31, 2014 (a) | |
Selected Per Share Data: | | | | |
Net asset value, beginning of period | | $ | 10.00 | |
| | | | |
Income from investment operations: | | | | |
Net investment income | | | 0.10 | |
Net realized and unrealized gain on investments | | | 1.17 | |
| | | | |
Total from investment operations | | | 1.27 | |
| | | | |
Net asset value, end of period | | $ | 11.27 | |
| | | | |
| |
Total Return (b) | | | 12.70 | %(c) |
| |
Ratios and Supplemental Data: | | | | |
Net assets, end of period (000 omitted) | | $ | 26,436 | |
Ratio of net expenses to average net assets | | | 1.00 | %(d) |
Ratio of expenses to average net assets before waiver and reimbursement | | | 2.62 | %(d) |
Ratio of net investment income to average net assets | | | 2.70 | %(d) |
Portfolio turnover rate | | | 63 | %(c) |
| (a) | For the period December 23, 2013 (commencement of operations) to August 31, 2014. |
| (b) | Total return in the above table represents the rate that the investor would have earned or lost on an investment in the Fund, assuming reinvestment of dividends. |
See accompanying notes which are an integral part of these financial statements.
33
MERITAGE YIELD-FOCUS EQUITY FUND – INVESTOR CLASS
FINANCIAL HIGHLIGHTS
(For a share outstanding during the period)
| | | | |
| | | For the
Period Ended
August 31, 2014 (a) | |
Selected Per Share Data: | | | | |
Net asset value, beginning of period | | $ | 10.00 | |
| | | | |
Income from investment operations: | | | | |
Net investment income | | | 0.01 | |
Net realized and unrealized gain on investments | | | 1.24 | |
| | | | |
Total from investment operations | | | 1.25 | |
| | | | |
Net asset value, end of period | | $ | 11.25 | |
| | | | |
| |
Total Return (b) | | | 12.50 | %(c) |
| |
Ratios and Supplemental Data: | | | | |
Net assets, end of period (000 omitted) | | $ | 2,627 | |
Ratio of net expenses to average net assets | | | 1.25 | %(d) |
Ratio of expenses to average net assets before waiver and reimbursement | | | 2.46 | %(d) |
Ratio of net investment income to average net assets | | | 2.26 | %(d) |
Portfolio turnover rate | | | 63 | %(c) |
| (a) | For the period December 23, 2013 (commencement of operations) to August 31, 2014. |
| (b) | Total return in the above table represents the rate that the investor would have earned or lost on an investment in the Fund, assuming reinvestment of dividends. |
See accompanying notes which are an integral part of these financial statements.
34
MERITAGE FUNDS
NOTES TO THE FINANCIAL STATEMENTS
August 31, 2014
NOTE 1. ORGANIZATION
The Meritage Growth Equity Fund (the “Growth Equity Fund”), the Meritage Value Equity Fund (the “Value Equity Fund”), the Meritage Yield-Focus Equity Fund (the “Yield-Focus Equity Fund”) (each a “Fund” and, collectively the “Funds”) were organized as a diversified series of the Capitol Series Trust (the “Trust”). The Trust is an open-end investment company established under the laws of Ohio by an Agreement and Declaration of Trust dated September 18, 2013 (the “Trust Agreement”). The Trust Agreement permits the Trust’s Board of Trustees (the “Board”) to issue an unlimited number of shares of beneficial interest of separate series without par value. The Funds each offer two share classes, Institutional Class Shares and Investor Class Shares. The Funds commenced operations on December 23, 2013. The Funds’ investment adviser is Meritage Portfolio Management, Inc. (the “Adviser”). The investment objective of the Growth Equity Fund is to seek growth of capital. The investment objective of the Value Equity Fund is to seek growth of capital. Income is a secondary objective for the Value Equity Fund. The investment objective of the Yield-Focus Equity Fund is to seek long-term growth of capital with an emphasis on high current income.
Each Fund’s prospectus provides a description of the investment objective, policies and strategies, along with information on the classes of shares currently being offered.
NOTE 2. SIGNIFICANT ACCOUNTING POLICIES
The Funds are investment companies and follow accounting and reporting guidance under Financial Accounting Standards Board (“FASB”) Accounting Standards Codification (“ASC”) Topic 946, “Financial Services-Investment Companies”. The following is a summary of significant accounting policies consistently followed by each Fund in the preparation of its financial statements.
Securities Valuation – All investments in securities are recorded at their estimated fair value as described in Note 3.
Federal Income Taxes – The Funds make no provision for federal income or excise tax. Each Fund intends to continue to qualify each year as a regulated investment company (“RIC”) under subchapter M of the Internal Revenue Code of 1986, as amended, by complying with the requirements applicable to RICs and by distributing substantially all of its taxable income. Each Fund also intends to distribute sufficient net investment income and net capital gains, if any, so that it will not be subject to excise tax on undistributed income and gains. If the required amount of net investment income or gains is not distributed, the Funds could incur a tax expense.
As of and during the period ended August 31, 2014, the Funds did not have a liability for any unrecognized tax benefits. The Funds recognize interest and penalties, if any, related to unrecognized tax benefits as income tax expense in the statement of operations. During the period, the Funds did not incur any interest or penalties. The Funds are subject to examination by U.S. federal tax authorities for all tax years since inception.
Expenses – Expenses incurred by the Trust that do not relate to a specific fund of the Trust are allocated to the individual funds based on each Fund’s relative net assets or another appropriate basis (as determined by the Board).
Security Transactions and Related Income – The Funds follow industry practice and record security transactions on the trade date for financial reporting purposes. The Specific Identification method is used for determining gains or losses for financial statements and income tax purposes. Dividend income is recorded on the ex-dividend date and interest income is recorded on an accrual basis. Discounts and premiums on securities purchased are
35
MERITAGE FUNDS
NOTES TO THE FINANCIAL STATEMENTS – (continued)
August 31, 2014
NOTE 2. SIGNIFICANT ACCOUNTING POLICIES – continued
accreted or amortized using the effective interest method. Withholding taxes on foreign dividends have been provided for in accordance with the Funds’ understanding of the applicable country’s tax rules and rates. The ability of issuers of debt securities held by the Funds to meet their obligations may be affected by economic and political developments in a specific country or region.
Dividends and Distributions – Each Fund intends to distribute substantially all of its net investment income, if any, as dividends to its shareholders on at least an annual basis. Each Fund intends to distribute its net realized long term capital gains and its net realized short term capital gains, if any, at least once a year. Dividends to shareholders, which are determined in accordance with income tax regulations, are recorded on the ex-dividend date. The treatment for financial reporting purposes of distributions made to shareholders during the period from net investment income or net realized capital gains may differ from their ultimate treatment for federal income tax purposes. These differences are caused primarily by differences in the timing of the recognition of certain components of income, expense or realized capital gains for federal income tax purposes. Where such differences are permanent in nature, they are reclassified in the components of the net assets based on their ultimate characterization for federal income tax purposes. Any such reclassifications will have no effects on net assets, results of operations or net asset values per share of the Funds. For the period ended August 31, 2014, the Funds made the following reclassifications to increase (decrease) the components of net assets:
| | | | | | | | | | | | |
| | | Paid in Capital | | | Accumulated Undistributed
Net Investment Loss | | | Accumulated Net Realized
Gain from Investments | |
Growth Equity Fund | | $ | – | | | $ | – | | | $ | – | |
Value Equity Fund | | | – | | | | – | | | | – | |
Yield-Focus Equity Fund | | | – | | | | (1,046 | ) | | | 1,046 | |
NOTE 3. SECURITIES VALUATION AND FAIR VALUE MEASUREMENTS
Fair value is defined as the price that a Fund would receive upon selling an investment in an orderly transaction to an independent buyer in the principal or most advantageous market of the investment. Generally Accepted Accounting Principles in the United States of America (“GAAP”) establish a three-tier hierarchy to maximize the use of observable market data and minimize the use of unobservable inputs and to establish classification of fair value measurements for disclosure purposes.
Inputs refer broadly to the assumptions that market participants would use in pricing the asset or liability, including assumptions about risk (the risk inherent in a particular valuation technique used to measure fair value such as pricing model and/or the risk inherent in the inputs to the valuation technique). Inputs may be observable or unobservable. Observable inputs are inputs that reflect the assumptions market participants would use in pricing the asset or liability developed based on market data obtained from sources independent of the reporting entity. Unobservable inputs are inputs that reflect the reporting entity’s own assumptions about the assumptions market participants would use in pricing the asset or liability developed based on the best information available in the circumstances.
Various inputs are used in determining the value of each Fund’s investments. These inputs are summarized in the three broad levels listed below.
| | • | | Level 1 – quoted prices in active markets for identical securities |
36
MERITAGE FUNDS
NOTES TO THE FINANCIAL STATEMENTS – (continued)
August 31, 2014
NOTE 3. SECURITIES VALUATION AND FAIR VALUE MEASUREMENTS – continued
| | • | | Level 2 – other significant observable inputs (including, but not limited to, quoted prices for an identical security in an inactive market, quoted prices for similar securities, interest rates, prepayment speeds, credit risk, etc.) |
| | • | | Level 3 – significant unobservable inputs (including the Funds’ own assumptions in determining fair value of investments based on the best information available) |
The inputs used to measure fair value may fall into different levels of the fair value hierarchy. In such cases, for disclosure purposes, the level in the fair value hierarchy within which the fair value measurement falls in its entirety, is determined based on the lowest level input that is significant to the fair value measurement in its entirety.
In computing the NAV of the Funds, fair value is based on market valuations with respect to portfolio securities for which market quotations are readily available. Pursuant to Trustee-approved policies, the Trust relies on independent third-party pricing services to provide the current market value of securities. Those pricing services value equity securities traded on a securities exchange at the last reported sales price on the principal exchange. Equity securities quoted by NASDAQ are valued at the NASDAQ Official Closing Price. If there is no reported sale on the principal exchange, equity securities are valued at the mean between the most recent quoted bid and asked price. If a non-exchange traded security does not trade on a particular day, then the mean between the last quoted closing bid and asked price will be used. In each of these situations, valuations are typically categorized as Level 1 in the fair value hierarchy.
Sometimes, an equity security owned by the Fund will be valued by the pricing service with factors other than market quotations or when the market is considered inactive. When this happens, the security may be classified as a Level 2 security. When market quotations are not readily available, when the Fund determines that the market quotation or the price provided by the pricing service does not accurately reflect the current fair value, or when certain restricted or illiquid securities are being valued, such securities are valued as determined in good faith by the Fund, in conformity with guidelines adopted by and subject to review by the Board. These securities are generally categorized as Level 3 securities.
Investments in open-end mutual funds, including money market mutual funds, are generally priced at the ending net asset value (NAV) provided by the service agent of the funds. These securities are categorized as Level 1 securities.
In accordance with the Trust’s good faith pricing guidelines, each Fund is required to consider all appropriate factors relevant to the value of securities for which it has determined pricing sources are not available or reliable as described above. No single standard exists for determining fair value, because fair value depends upon the circumstances of each individual case. As a general principle, the current fair value of an issue of securities being valued by the Fund would appear to be the amount which the owner might reasonably expect to receive for them upon their current sale. Methods which are in accordance with this principle may, for example, be based on (i) a multiple of earnings; (ii) a discount from market of a similar freely traded security (including a derivative security or a basket of securities traded on other markets, exchanges or among dealers); or (iii) yield to maturity with respect to debt issues, or a combination of these and other methods. Good faith pricing is permitted if, in the Fund’s opinion, the validity of market quotations appears to be questionable based on factors such as evidence of a thin market in the security based on a small number of quotations, a significant event occurs after the close of a market but before the Fund’s NAV calculation that may affect a security’s value, or the Fund is aware of any other data that calls into question the reliability of market quotations. Good faith pricing may also be used in instances when the bonds the Fund invests in may default or otherwise cease to have market quotations readily available. Any fair valuation pricing done outside the Fund’s approved pricing methods must be approved by the Pricing Committee of the Board.
37
MERITAGE FUNDS
NOTES TO THE FINANCIAL STATEMENTS – (continued)
August 31, 2014
NOTE 3. SECURITIES VALUATION AND FAIR VALUE MEASUREMENTS – continued
The following is a summary of the inputs used to value the Funds’ investments as of August 31, 2014:
| | | | | | | | | | | | | | | | |
| | | Valuation Inputs | |
| Growth Equity Fund | | Level 1 –
Quoted Prices in
Active Markets | | | Level 2 –
Other
Significant
Observable
Inputs | | | Level 3 –
Significant
Unobservable
Inputs | | | Total | |
Common Stocks* | | $ | 9,540,448 | | | $ | – | | | $ | – | | | $ | 9,540,448 | |
Money Market Securities | | | 880,957 | | | | – | | | | – | | | | 880,957 | |
Total | | $ | 10,421,405 | | | $ | – | | | $ | – | | | $ | 10,421,405 | |
Value Equity Fund | | | | | | | | | | | | | | | | |
Common Stocks* | | $ | 8,724,300 | | | $ | – | | | $ | – | | | $ | 8,724,300 | |
Exchange-Traded Funds | | | 742,179 | | | | – | | | | – | | | | 742,179 | |
Money Market Securities | | | 527,811 | | | | – | | | | – | | | | 527,811 | |
Total | | $ | 9,994,290 | | | $ | – | | | $ | – | | | $ | 9,994,290 | |
Yield-Focus Equity Fund | | | | | | | | | | | | | | | | |
Common Stocks* | | $ | 26,326,551 | | | $ | – | | | $ | – | | | $ | 26,326,551 | |
Preferred Stocks | | | 477,387 | | | | | | | | | | | | 477,387 | |
Money Market Securities | | | 1,027,307 | | | | – | | | | – | | | | 1,027,307 | |
Total | | $ | 27,831,245 | | | $ | – | | | $ | – | | | $ | 27,831,245 | |
| * | Refer to Schedule of Investments for Industry classifications. |
The Funds did not hold any investments at any time during the reporting period in which significant unobservable inputs were used in determining fair value; therefore, no reconciliation of Level 3 securities is included for this reporting period. The Funds did not hold any derivative instruments during the reporting period.
The Trust recognizes transfers between fair value hierarchy levels at the end of the reporting period. There were no transfers between any levels for the period ended August 31, 2014.
NOTE 4. FEES AND OTHER TRANSACTIONS WITH AFFILIATES
Under the terms of the management agreement, on behalf of the Funds (the “Agreement”), the Adviser manages each Fund’s investments subject to oversight of the Board. As compensation for its management services each Fund is obligated to pay the Adviser a fee computed and accrued daily and paid monthly at an annual rate of 0.75% of the average daily net assets of each Fund. For the period ended August 31, 2014, the Adviser earned fees of $32,903 from the Growth Equity Fund, $30,141 from the Value Equity Fund and $67,095 from the Yield-Focus Equity Fund before the reimbursements described below.
The Adviser has contractually agreed to waive or limit its fees and to assume other expenses of each Fund until December 31, 2015, so that total annual fund operating expenses do not exceed 1.00%. This operating expense
38
MERITAGE FUNDS
NOTES TO THE FINANCIAL STATEMENTS – (continued)
August 31, 2014
NOTE 4. FEES AND OTHER TRANSACTIONS WITH AFFILIATES – continued
limitation does not apply to borrowing costs (such as interest and dividend expenses on securities sold short), taxes, extraordinary expenses, brokerage fees and commissions, and expenses incurred under a plan of distribution adopted pursuant to Rule 12b-1 under the Investment Company Act of 1940 (“Excluded Expenses”). This limitation also excludes any “acquired fund fees and expenses” as that term is described in each Fund’s prospectus.
The waiver and/or reimbursement by the Adviser with respect to the Funds are subject to repayment by the Funds within the three fiscal years following the fiscal year in which that particular waiver and/or reimbursement occurred, provided that the Funds are able to make the repayment without exceeding the expense limitations that were in effect at the time of the waiver or reimbursement.
The amounts subject to repayment by the Funds, pursuant to the aforementioned conditions are as follows:
| | | | | | | | |
| | | Amount
Waived or
Reimbursed | | | Recoverable
through
August 31, | |
Growth Equity Fund | | $ | 109,316 | | | | 2017 | |
Value Equity Fund | | | 103,749 | | | | 2017 | |
Yield-Focus Equity Fund | | | 144,170 | | | | 2017 | |
The Trust retains Huntington Asset Services, Inc. (“HASI”) to supply non-investment related administrative and compliance services for each Fund. For the period ended August 31, 2014, HASI earned fees of $22,649 for the Growth Equity Fund, $21,505 for the Value Equity Fund and $34,567 for the Yield-Focus Equity Fund. At August 31, 2014, HASI was owed $2,385 for the Growth Equity Fund, $2,413 for the Value Equity Fund and $5,577 for the Yield-Focus Equity Fund for administrative services.
The Trust also retains HASI to act as the Fund’s transfer agent and to provide fund accounting services. For the period ended August 31, 2014, HASI earned fees of $19,182 for the Growth Equity Fund, $18,291 for the Value Equity Fund and $28,682 for the Yield-Focus Equity Fund for transfer agent services and reimbursement for out-of-pocket expenses incurred in providing transfer agent services. At August 31, 2014, HASI was owed $2,850 for the Growth Equity Fund, $2,888 for the Value Equity Fund and $5,674 for the Yield-Focus Equity Fund for transfer agent services and out-of-pocket expenses. For the period ended August 31, 2014, HASI earned fees of $15,266 for the Growth Equity Fund, $14,503 for the Value Equity Fund and $23,545 for the Yield-Focus Equity Fund for fund accounting services. At August 31, 2014, HASI was owed $1,757 for the Growth Equity Fund, $1,774 Value Equity Fund and $4,218 for the Yield-Focus Equity Fund for fund accounting services.
Certain officers of the Trust are members of management and/or employees of HASI. HASI is a wholly-owned subsidiary of Huntington Bancshares, Inc., the parent company of Unified Financial Securities, Inc. (the “Distributor”).
The Funds have adopted a Distribution Plan (the “Plan”) pursuant to Rule 12b-1 under the 1940 Act. The Plan provides that the Funds will pay the Distributor and/or any registered securities dealer, financial institution or any other person (the “Recipient”) a fee of 0.25% of the average daily net assets of each Fund’s Investor Shares in connection with the promotion and distribution of Fund’s shares or the provision of personal services to shareholders, including, but not necessarily limited to, advertising, compensation to underwriters, dealers and selling personnel, the printing and mailing of prospectuses to other than current Fund shareholders, the printing
39
MERITAGE FUNDS
NOTES TO THE FINANCIAL STATEMENTS – (continued)
August 31, 2014
NOTE 4. FEES AND OTHER TRANSACTIONS WITH AFFILIATES – continued
and mailing of sales literature and servicing shareholder accounts. The Funds may pay all or a portion of these fees to any Recipient who renders assistance in distributing or promoting the sale of shares, or who provides certain shareholder services, pursuant to a written agreement. The Plan is a compensation plan, which means that compensation is provided regardless of 12b-1 expenses actually incurred. The Trustees believe that the Plan will significantly enhance the Trust’s ability to expand distribution of Investor Shares of each Fund. It is also anticipated that an increase in the size of a Fund will facilitate more efficient portfolio management and assist the Fund in seeking to achieve its investment objective.
Unified Financial Securities, Inc. (“Unified”) acts as the principal distributor of the Funds’ shares. An officer of the Trust is an officer of the Distributor and such person may be deemed to be an affiliate of the Distributor.
NOTE 5. INVESTMENT TRANSACTIONS
For the period ended August 31, 2014, purchases and sales of investment securities, excluding short-term securities were as follows:
| | | | | | | | |
Fund | | Purchases | | | Sales | |
Growth Equity Fund | | $ | 14,299,965 | | | $ | 5,595,175 | |
Value Equity Fund | | | 11,587,529 | | | | 2,848,537 | |
Yield-Focus Equity Fund | | | 33,607,262 | | | | 8,024,277 | |
During the period ended August 31, 2014, the Adviser of the Value Equity Fund purchased shares of Huntington Bancshares, Inc. (“HBAN”), of which Huntington National Bank, Inc. is a subsidiary. Due to the affiliation of Huntington National Bank, Inc. as the parent company of Unified Financial Securities, Inc. (the Fund’s Distributor), the Fund is not permitted to invest in HBAN. Upon notification of this error, the Adviser closed the Fund’s position in HBAN, resulting in a gain of $2,660. As the transaction resulted in a gain, no further action was necessary.
NOTE 6. ESTIMATES
The preparation of financial statements in conformity with GAAP requires management to make estimates and assumptions that affect the reported amounts of assets and liabilities and disclosure of contingent assets and liabilities at the date of the financial statements and the reported amounts of increases and decreases in net assets from operations during the reporting period. Actual results could differ from those estimates.
NOTE 7. BENEFICIAL OWNERSHIP
The beneficial ownership, either directly or indirectly, of 25% or more of the voting securities of a fund creates a presumption of control of a fund, under Section 2(a)(9) of the Investment Company Act of 1940. At August 31, 2014, National Financial Services LLC (“NFS”) and Charles Schwab & Co. Inc. (“Schwab”) owned, as record shareholder, 60.67% and 37.98%, respectively, of the outstanding shares of the Growth Equity Fund. At August 31, 2014, NFS and Schwab owned, as record shareholder, 65.31% and 33.17%, respectively, of the outstanding shares of the Value Equity Fund. At August 31, 2014, NFS and Schwab owned, as record shareholder, 59.95% and 24.71%, respectively, of the outstanding shares of the Yield-Focus Equity Fund. It is not known whether NFS or Schwab or any of the underlying beneficial owners owned or controlled 25% or more of the voting securities of the Funds.
40
MERITAGE FUNDS
NOTES TO THE FINANCIAL STATEMENTS – (continued)
August 31, 2014
NOTE 8. FEDERAL TAX INFORMATION
At August 31, 2014, the net unrealized appreciation (depreciation) of investments for tax purposes was as follows:
| | | | | | | | | | | | | | | | |
| | | Tax Cost of
Securities | | | Unrealized
Appreciation | | | Unrealized
Depreciation | | | Net Unrealized
Appreciation/
(Depreciation) | |
Growth Equity Fund | | $ | 9,705,239 | | | $ | 769,089 | | | $ | (52,923 | ) | | $ | 716,166 | |
Value Equity Fund | | | 9,333,018 | | | | 734,822 | | | | (73,550 | ) | | | 661,272 | |
Yield-Focus Equity Fund | | | 26,588,733 | | | | 1,456,584 | | | | (214,072 | ) | | | 1,242,512 | |
At August 31, 2014, the components of distributable earnings (accumulated losses) on a tax basis were as follows:
| | | | | | | | | | | | | | | | |
| | | Ordinary
Income | | | Undistributed
Long-Term
Capital Gains | | | Unrealized
Appreciation/
(Depreciation) | | | Total
Accumulated
Earnings | |
Growth Equity Fund | | $ | 129,154 | | | $ | – | | | $ | 716,166 | | | $ | 845,320 | |
Value Equity Fund | | | 100,599 | | | | – | | | | 661,272 | | | | 761,871 | |
Yield-Focus Equity Fund | | | 336,039 | | | | 307 | | | | 1,242,512 | | | | 1,578,858 | |
The difference between book basis and tax basis unrealized appreciation is attributable to the tax deferral of wash losses.
NOTE 9. COMMITMENTS AND CONTINGENCIES
The Funds indemnify their officers and trustees for certain liabilities that may arise from the performance of their duties to the Funds. Additionally, in the normal course of business, the Funds enter into contracts that contain a variety of representations and warranties which provide general indemnifications. The Funds’ maximum exposure under these arrangements is unknown, as this would involve future claims that may be made against the Funds that have not yet occurred.
NOTE 10. SUBSEQUENT EVENTS
Management has evaluated events or transactions that may have occurred since August 31, 2014 through the date the financial statements were issued, that would merit recognition or disclosure in the financial statements. There were no items requiring adjustment of the financial statements or additional disclosure.
41
REPORT OF INDEPENDENT REGISTERED PUBLIC ACCOUNTING FIRM
The Board of Trustees and Shareholders
Capitol Series Trust:
We have audited the accompanying statements of assets and liabilities of the Capitol Series Trust (the Funds) (comprised of the Meritage Growth Equity Fund, Meritage Value Equity Fund, and Meritage Yield-Focus Equity Fund), including the schedules of investments, as of August 31, 2014, and the related statements of operations and changes in net assets, and the financial highlights for the period December 23, 2013 (commencement of operations) to August 31, 2014. These financial statements and financial highlights are the responsibility of the Funds’ management. Our responsibility is to express an opinion on these financial statements and financial highlights based on our audits.
We conducted our audits in accordance with the standards of the Public Company Accounting Oversight Board (United States). Those standards require that we plan and perform the audits to obtain reasonable assurance about whether the financial statements and financial highlights are free of material misstatement. An audit includes examining, on a test basis, evidence supporting the amounts and disclosures in the financial statements. Our procedures included confirmation of securities owned as of August 31, 2014, by correspondence with custodians and brokers or by other appropriate auditing procedures. An audit also includes assessing the accounting principles used and significant estimates made by management, as well as evaluating the overall financial statement presentation. We believe that our audits provide a reasonable basis for our opinion.
In our opinion, the financial statements and financial highlights referred to above present fairly, in all material respects, the financial position of the Funds as of August 31, 2014, the results of their operations, the changes in their net assets, and the financial highlights for the period December 23, 2013 to August 31, 2014, in conformity with U.S. generally accepted accounting principles.
/s/ KPMG LLP
Columbus, Ohio
October 28, 2014
42
TRUSTEES AND OFFICERS – (Unaudited)
The Board of Trustees supervises the business activities of the Trust. Each Trustee serves as a Trustee for the lifetime of the Trust or until the earlier of his or her retirement as a Trustee at age 75, death, resignation or removal.
The following tables provide information regarding the Trustees and Officers.
| | |
| Independent Trustees | | |
Name, Address*, Age, Position with Trust**, Term of Position with Trust | | Principal Occupation During Past 5 Years and Other Directorships |
Walter B. Grimm Age: 68 Trustee Began Serving: November 2013 | | Principal Occupations(s): President, Leigh Management Group, LLC (consulting firm) (October 2005 to present); Chief Financial Officer, East West Private, LLC (consulting firm) (March 2009 to present). |
Mary M. Morrow Age: 55 Trustee Began Serving: November 2013 | | Principal Occupations(s): Consulting Practice Manager, DST Health Solutions (August 2010 to present); Previous Position(s): Director, Service and Client Relations, EBDS (August 2008 – May 2009); Independent Consultant, Healthcare Servicing May 2009 – August 2010). |
| * | The address for each trustee is 2960 N. Meridian St., Suite 300, Indianapolis, IN 46208. |
| ** | The Trust currently consists of 3 series. |
| | |
| Interested Trustees & Officers | | |
Name, Address*, Age, Position with Trust**, Term of Position with Trust | | Principal Occupation During Past 5 Years and Other Directorships |
R. Jeffrey Young*** Age: 49 Chairman of the Board and Trustee Began Serving: September 2013 | | Principal Occupation(s): Senior Vice President, Huntington Asset Services, Inc. (Trust administrator, fund accountant and transfer agent) (January 2010 to present); Chief Executive Officer, The Huntington Funds (February 2010 to present); Chief Executive Officer, Huntington Strategy Shares (November 2010 to present); Chairman of the Board, Valued Advisers Trust (June 2010 to present); Chief Executive Officer and President, Valued Advisers Trust (January 2010 to present); Previous Position(s): President and Chief Executive Officer, Dreman Contrarian Funds (March 2011 to February 2013); Independent Chair, Valued Advisers Trust (August 2008 to January 2010); Managing Director, WealthStone (investment adviser) (2007 to 2009); Senior Vice President, Operations, BISYS Fund Services (2006 to 2007); Senior Vice President/Vice President, Client Services, BISYS Fund Services (1994 to 2006). |
Matthew J. Miller Age: 37 Chief Executive Officer and President Began Serving: September 2013 | | Principal Occupation(s): Vice President, Relationship Management, Huntington Asset Services, Inc. (2008 to present). Previous Position(s): Vice President, Transfer Agency Operations, Huntington Asset Services, Inc. (2002 to 2008); Employed in various positions with Huntington Asset Services, Inc. (July 1998 to 2002). |
43
| | |
| Interested Trustees & Officers – continued | | |
Name, Address*, Age, Position with Trust**, Term of Position with Trust | | Principal Occupation During Past 5 Years and Other Directorships |
Zachary P. Richmond Age: 34 Treasurer and Chief Financial Officer Began Serving: August 2014 | | Principal Occupation(s): Assistant Vice President, Fund Administration, Huntington Asset Services, Inc. (January 2011 to present); Interim Treasurer and Chief Financial Officer, Unified Series Trust (August 2014 to present). Previous Position(s): Assistant Treasurer, Unified Series Trust (2011 to August 2014); Supervisor, Citi Fund Services Ohio, Inc. (2007 to 2011). |
John C. Swhear Age: 52 Chief Compliance Officer and Anti-Money Laundering Officer Began Serving: September 2013 | | Principal Occupation(s): Vice President of Legal Administration and Compliance, Huntington Asset Services, Inc. (April 2007 to present); Chief Compliance Officer of Unified Financial Securities, Inc. (the “Distributor”) (May 2007 to present); Interim President of the Unified Series Trust (March 2012 to present). Previous Position(s): Secretary, The Huntington Funds (April 2010 to February 2012); President and Chief Executive Officer of Dreman Contrarian Funds (March 2010 to March 2011); Vice President and Acting Chief Executive Officer (2007 to March 2010), Transfer Agency Operations, Huntington Asset Services, Inc. (2002 to 2008). |
Stacey Havens Age: 48 Vice President Began Serving: September 2013 | | Principal Occupation(s): Vice President, Huntington Asset Services, Inc. (July 1993 to present). |
Jay S. Fitton Age: 44 Secretary Began Serving: September 2013 | | Principal Occupation(s): Vice President of Legal Administration, Huntington Asset Services, Inc. (November 2011 to present); Secretary, The Huntington Funds (February 2012 to present); Secretary, Huntington Strategy Shares (October 2012 to present) Previous Position(s): Vice President and Senior Counsel, J.P. Morgan Chase (April 2007 to November 2011). |
| * | The address for each trustee and officer is 2960 N. Meridian St., Suite 300, Indianapolis, IN 46208. |
| ** | The Trust currently consists of 3 series. |
| *** | Mr. Young is deemed an interested trustee because he is an officer of an entity that is under common control with Unified Financial Securities, Inc., the Trust’s distributor. |
44
CAPITOL SERIES TRUST
Privacy Policy
(Unaudited)
Capitol Series Trust (the “Trust”) on behalf of each of its series (each a “Fund,” collectively the “Funds”) adopts the following privacy policy in order to safeguard the personal information of its consumers and customers that are individuals in accordance with Securities and Exchange Commission Regulation S-P,17 CFR 284.30.
We collect only relevant information about a Fund’s shareholders that the law allows or requires us to have in order to conduct our business and properly service you. We collect financial and personal information about you (“Personal Information”) directly (e.g., information on account applications and other forms, such as your name, address, and social security number, and information provided to access account information or conduct account transactions online, such as password, account number, e-mail address, and alternate telephone number), and indirectly (e.g., information about your transactions with us, such as transaction amounts, account balance and account holdings).
The Trust does not disclose any non-public personal information about its shareholders or former shareholders other than for everyday business purposes such as to process a transaction, service an account, to respond to court orders and legal investigations or as otherwise permitted by law. Third parties that may receive this information include companies that provide transfer agency, technology and administrative services to a Fund, as well as the Fund’s investment adviser who is an affiliate of the Fund. If you maintain a retirement/educational custodial account directly with a Fund, we may also disclose your Personal Information to the custodian for that account for shareholder servicing purposes. We limit access to your Personal Information provided to unaffiliated third parties to information necessary to carry out their assigned responsibilities to a Fund. All shareholder records will be disposed of in accordance with applicable law.
The Trust maintains physical, electronic and procedural safeguards to protect Personal Information and requires its third parties service provides with access to such information to treat the Personal Information with the same high degree of confidentiality.
In the event that a shareholder holds shares of a Fund through a financial intermediary, including, but not limited to, a broker-dealer, bank, credit union or trust company, the privacy policy of the shareholders’ financial intermediary would govern how their non-public personal information would be shared with unaffiliated third parties.
45
OTHER INFORMATION – (Unaudited)
The Funds’ Statement of Additional Information (“SAI”) includes additional information about the trustees and is available without charge, upon request. You may call toll-free at (855) 261-0104 to request a copy of the SAI or to make shareholder inquiries.
PROXY VOTING – (Unaudited)
A description of the policies and procedures that the Funds use to determine how to vote proxies relating to portfolio securities and information regarding how each Fund voted those proxies during the most recent twelve month period ended June 30, is available without charge upon request by (1) calling the Funds at (855) 261-0104 and (2) from Fund documents filed with the Securities and Exchange Commission (“SEC”) on the SEC’s website at www.sec.gov.
TRUSTEES
R. Jeffrey Young, Chairman
Walter B. Grimm
Mary M. Morrow
OFFICERS
| Matthew | J. Miller, Chief Executive Officer and President |
| John | C. Swhear, Chief Compliance Officer, AML Officer and Vice-President |
Stacey Havens, Vice President
| Zachary | P. Richmond, Treasurer and Chief Financial Officer |
Jay S. Fitton, Secretary
INVESTMENT ADVISER
Meritage Portfolio Management, Inc.
7500 College Boulevard, Suite 1212
Overland Park, KS 66210
DISTRIBUTOR
Unified Financial Securities, Inc.
2960 North Meridian Street, Suite 300
Indianapolis, IN 46208
INDEPENDENT REGISTERED PUBLIC ACCOUNTING FIRM
KPMG LLP
191 West Nationwide Boulevard, Suite 500
Columbus, OH 43215
LEGAL COUNSEL
Bernstein Shur
100 Middle Street, 6th Floor
Portland, ME 04104
CUSTODIAN
Huntington National Bank
41 South High Street
Columbus, OH 43215
ADMINISTRATOR, TRANSFER AGENT AND FUND ACCOUNTANT
Huntington Asset Services, Inc.
2960 North Meridian Street, Suite 300
Indianapolis, IN 46208
This report is intended only for the information of shareholders or those who have received the Funds’ prospectus which contains information about the Funds’ management fee and expenses. Please read the prospectus carefully before investing.
Distributed by Unified Financial Securities, Inc.
Member FINRA/SIPC
46
Item 2. Code of Ethics.
As of the end of the period covered by this report, the registrant has adopted a code of ethics that applies to the registrant’s principal executive officer, principal financial officer, principal accounting officer or controller, or persons performing similar functions, regardless of whether these individuals are employed by the registrant or a third party. Pursuant to Item 12(a)(1), a copy of registrant’s code of ethics is filed as an exhibit to this Form N-CSR. During the period covered by this report, the code of ethics has not been amended, and the registrant has not granted any waivers, including implicit waivers, from the provisions of the code of ethics.
Item 3. Audit Committee Financial Expert.
(a) The registrant’s board of trustees has determined that the registrant does not have an audit committee financial expert. The committee members and the full Board considered a possibility of adding a member that would qualify as an expert. The audit committee determined that, although none of its members meet the technical definition of an audit committee expert, the committee has sufficient financial expertise to adequately perform its duties under the Audit Committee Charter without the addition of a qualified expert.
Item 4. Principal Accountant Fees and Services.
(a) Audit Fees billed to the registrant by its principal accountants for the two most recent fiscal years:
Fiscal year ended 2014: $45,750
(b) Audit-Related Fees billed to the registrant by its principal accountants for the two most recent fiscal years:
Fiscal year ended 2014: $2,000
c) Tax Fees billed to the registrant by its principal accountants for the two most recent fiscal years:
Fiscal year ended 2014: $15,000
Nature of the fees: Preparation of the 1120 RIC and Excise review
(d) All other fees billed to the registrant by its principal accountants for the two most recent fiscal years:
Fiscal year ended 2014: $0
(e) (1) Audit Committee’s Pre-Approval Policies
The Audit Committee Charter requires the Audit Committee to be responsible for the selection, retention or termination of auditors and, in connection therewith, to (i) evaluate the proposed fees and other compensation, if any, to be paid to the auditors, (ii) evaluate the independence of the auditors, (iii) pre-approve all audit services and, when appropriate, any non-audit services provided by the independent auditors to the Trust, (iv) pre-approve, when appropriate, any non-audit services provided by the independent auditors to the Trust’s investment adviser, or any entity controlling, controlled by, or under common control with the investment adviser and that provides ongoing services to the Trust if the engagement relates directly to the operations and financial reporting of the Trust, and (v) receive the auditors’ specific representations as to their independence;
(2) Percentages of Services Approved by the Audit Committee
| | | | |
| Registrant | | | |
| |
Audit-Related Fees: | | | 0 | % |
Tax Fees: | | | 0 | % |
All Other Fees: | | | 0 | % |
(f) During audit of registrant’s financial statements for the most recent fiscal year, less than 50 percent of the hours expended on the principal accountant’s engagement were attributed to work performed by persons other than the principal accountant’s full-time, permanent employees.
(g) The aggregate non-audit fees billed by the registrant’s accountant for services rendered to the registrant, and rendered to the registrant’s investment adviser (not including any sub-adviser whose role is primarily portfolio management and is subcontracted with or overseen by another investment adviser), and any entity controlling, controlled by, or under common control with the adviser that provides ongoing services to the registrant:
| | | | |
| | | Registrant | | Adviser |
| FY 2014 | | $0 | | $0 |
(h) Not applicable. The auditor performed no services for the registrant’s investment adviser or any entity controlling, controlled by, or under common control with the investment adviser that provides ongoing services to the registrant.
Item 5. Audit Committee of Listed Registrants.
NOT APPLICABLE – applies to listed companies only
Item 6. Schedule of Investments. Schedule filed with Item 1.
Item 7. Disclosure of Proxy Voting Policies and Procedures for Closed-End Management Investment Companies.
NOT APPLICABLE – applies to closed-end funds only
Item 8. Portfolio Managers of Closed-End Management Investment Companies.
NOT APPLICABLE – applies to closed-end funds only
Item 9. Purchases of Equity Securities by Closed-End Management Investment Company and Affiliated Purchasers.
NOT APPLICABLE – applies to closed-end funds only
Item 10. Submission of Matters to a Vote of Security Holders.
The guidelines applicable to shareholders desiring to submit recommendations for nominees to the Registrant’s board of trustees are contained in the statement of additional information of the Trust with respect to the Fund(s) for which this Form N-CSR is being filed.
Item 11. Controls and Procedures.
(a) Based on their evaluation of the registrant’s disclosure controls and procedures (as defined in Rule 30a-3(c) under the Investment Company Act of 1940, as amended (the “Act”)) as of a date within 90 days of the filing date of this report, the registrant’s principal executive officer and principal financial officer have concluded that such disclosure controls and procedures are reasonably designed and are operating effectively to ensure that material information relating to the registrant is made known to them by others within those entities, particularly during the period in which this report is being prepared, and that the information required in filings on Form N-CSR is recorded, processed, summarized, and reported on a timely basis.
(b) There were no changes in the registrant’s internal control over financial reporting (as defined in Rule 30a-3(d) under the Investment Company Act of 1940) that occurred during the second fiscal quarter of the period covered by this report that have materially affected, or are reasonably likely to materially affect, the registrant’s internal control over financial reporting.
Item 12. Exhibits.
(a)(1) Code is filed herewith.
(a)(2) Certifications by the registrant’s principal executive officer and principal financial officer, pursuant to Section 302 of the Sarbanes- Oxley Act of 2002 and required by Rule 30a-2under the Investment Company Act of 1940 are filed herewith.
(a)(3) Not applicable.
(b) Certifications pursuant to Rule 30a-2(b) are furnished herewith.
SIGNATURES
Pursuant to the requirements of the Securities Exchange Act of 1934 and the Investment Company Act of 1940, the registrant has duly caused this report to be signed on its behalf by the undersigned, thereunto duly authorized.
| | |
| (Registrant) | | Capitol Series Trust |
| | | | |
| | |
| By (Signature and Title) | | /s/ Matthew J. Miller | | |
| | Matthew J. Miller, Chief Executive Officer and President | | |
Date 10/28/2014
Pursuant to the requirements of the Securities Exchange Act of 1934 and the Investment Company Act of 1940, this report has been signed below by the following persons on behalf of the registrant and in the capacities and on the dates indicated.
| | | | |
| | |
| By (Signature and Title) | | /s/ Matthew J. Miller | | |
| | Matthew J. Miller, Chief Executive Officer and President | | |
Date 10/28/2014
| | | | |
| | |
| By (Signature and Title) | | /s/ Zachary P. Richmond | | |
| | Zachary P. Richmond, Treasurer and Chief Financial Officer | | |
Date 10/28/2014