UNITED STATES
SECURITIES AND EXCHANGE COMMISSION
Washington, D.C. 20549
FORM N-CSR
CERTIFIED SHAREHOLDER REPORT OF REGISTERED
MANAGEMENT INVESTMENT COMPANIES
| Investment Company Act file number: |
| 811-22895 |
| Capitol Series Trust |
| (Exact name of registrant as specified in charter) |
| Ultimus Asset Services, LLC |
| 225 Pictoria Drive, Suite 450 |
| Cincinnati, OH 45246 |
| (Address of principal executive offices) |
| (Zip code) |
| Zachary P. Richmond |
| Ultimus Asset Services, LLC |
| 225 Pictoria Drive, Suite 450 |
| Cincinnati, OH 45246 |
| (Name and address of agent for service) |
Registrant’s telephone number, including area code:513-587-3400
Date of fiscal year end:September 30
Date of reporting period:March 31, 2019
Item 1. Reports to Stockholders.
Fuller & Thaler Behavioral Small-Cap Equity Fund
Fuller & Thaler Behavioral Small-Cap Growth Fund
Fuller & Thaler Behavioral Mid-Cap Value Fund
Fuller & Thaler Behavioral Unconstrained Equity Fund
Fuller & Thaler Behavioral Small-Mid Core Equity Fund
Fuller & Thaler Behavioral Micro-Cap Equity Fund
Semi-Annual Report
March 31, 2019
Beginning on January 1, 2021, as permitted by regulations adopted by the Securities and Exchange Commission, paper copies of the Fund’s shareholder reports like this one will no longer be sent by mail, unless you specifically request paper copies of the reports from the Fund or from your financial intermediary such as a broker-dealer or bank. Instead, the reports will be made available on a website, and you will be notified by mail each time a report is posted and provided with a website link to access the report.
If you already elected to receive shareholder reports electronically, you will not be affected by this change and you need not take any action. You may elect to receive shareholder reports and other communications from the Fund electronically by contacting the Fund at (888) 912-4562 or, if you own these shares through a financial intermediary, you may contact your financial intermediary.
You may elect to receive all future reports in paper free of charge. You can inform the Fund that you wish to continue receiving paper copies of your shareholder reports by contacting the Fund at (888) 912-4562. If you own shares through a financial intermediary, you may contact your financial intermediary or follow instructions included with this document to elect to continue to receive paper copies of your shareholder reports. Your election to receive reports in paper will apply to all funds held with the fund complex or at your financial intermediary.

411 Borel Avenue, Suite 300
San Mateo, CA 94402
(888) 912-4562
Investment Results (Unaudited)
Average Annual Total Returns* as of March 31, 2019
| | Six
Months | One
Year | Three
Year | Five
Year | Since
Inception
(9/8/11) | Since
Inception
(12/19/18) |
Fuller & Thaler Behavioral Small-Cap Equity Fund | | | | |
R6 Shares | -9.24% | 0.16% | 13.16% | 9.54% | 14.59% | |
Institutional Shares | -9.27% | 0.07% | 13.05% | 9.39% | 14.45% | |
Investor Shares | -9.37% | -0.17% | 12.84% | 9.21% | 14.24% | |
A Shares | | | | | | 13.63% |
C Shares | | | | | | 13.39% |
Russell 2000® Index(a) | -8.56% | 2.05% | 12.92% | 7.05% | 12.65% | 14.63% |
| | R6 Shares | Institutional
Shares | Investor
Shares | A Shares | C Shares |
Expense Ratios(b) | 0.75% | 0.85% | 1.14% | 1.25% | 1.75% |
The performance quoted represents past performance, which does not guarantee future results. The investment return and principal value of an investment will fluctuate so that an investor’s shares, when redeemed, may be worth more or less than their original cost. The returns shown do not reflect the deduction of taxes that a shareholder would pay on Fuller & Thaler Behavioral Small-Cap Equity Fund (the “Small-Cap Equity Fund”) distributions or the redemption of Small-Cap Equity Fund shares. Current performance of the Small-Cap Equity Fund may be lower or higher than the performance quoted. The Small-Cap Equity Fund’s investment objectives, risks, charges and expenses must be considered carefully before investing. Performance data current to the most recent month end may be obtained by calling (888) 912-4562.
* Return figures reflect any change in price per share and assume the reinvestment of all distributions. The Small-Cap Equity Fund’s returns reflect any fee waivers during the applicable periods. If such fee waivers had not occurred, the quoted performance would have been lower. Total returns for periods less than 1 year are not annualized. A Shares and C Shares performance have not been adjusted to include sales charges that may apply. If sales charges were reflected, the performance quoted would be lower. Prior to October 26, 2015, the performance reflected represents that of a series of Allianz Funds Multi-Strategy Trust for which Fuller & Thaler Asset Management, Inc. (the “Adviser”) served as the sole sub-adviser (“the Predecessor Fund”) (see Note 1).
(a) The Russell 2000® Index (“Russell 2000”) is a widely recognized unmanaged index of equity securities and is representative of a broader domestic equity market and range of securities than is found in the Small-Cap Equity Fund’s portfolio. The Russell 2000 measures the performance of the small cap segment of the U.S. equity universe. The Russell 2000 is a subset of the Russell 3000® Index and represents approximately 10% of total market capitalization of that index. Individuals cannot invest directly in an index; however, an individual can invest in exchange traded funds or other investment vehicles that attempt to track the performance of a benchmark index.
(b) The expense ratios are from the Small-Cap Equity Fund’s most recent prospectus dated December 19, 2018. The Adviser has contractually agreed to waive its management fee and/or reimburse Small-Cap Equity Fund expenses so that total annual operating expenses do not exceed 1.30%, 1.80%, 1.25%, 0.99% and 0.80% for A Shares, C Shares, Investor Shares, Institutional Shares and R6 Shares, respectively, of the average daily net assets for each class through January 31, 2020. Previously, effective February 1, 2018 through the effective date of this prospectus, the Adviser had contractually agreed to waive its management fee and/or reimburse Small-Cap Equity Fund expenses so that total annual operating expenses do not exceed 1.25%, 0.97% and 0.80% for Investor Shares, Institutional Shares and R6 Shares, respectively, of the Small-Cap Equity Fund’s average daily net assets. Previously, effective February 1, 2017 to January 1, 2018, the Adviser had contractually agreed to waive its management fee and/or reimburse Small-Cap Equity Fund Expenses so that total annual operating expenses to not exceed 1.05%, 0.90%, and 0.80% for Investor Shares, Institutional Shares and R6 Shares, respectively, of the Small-Cap Equity Fund’s average daily net
1
Investment Results (Unaudited) (continued)
assets. The expense limitation does not apply to (i) interest; (ii) taxes; (iii) brokerage fees and commissions; (iv) other extraordinary expenses not incurred in the ordinary course of the Small-Cap Equity Fund’s business; and (v) indirect expenses such as acquired fund fees and expenses. During any fiscal year that the Investment Advisory Agreement between the Adviser and Capitol Series Trust (the “Trust”) is in effect, the Adviser may recoup the sum of all fees previously waived or expenses reimbursed, less any reimbursement previously paid, provided that the Adviser is only permitted to recoup fees or expenses within 36 months from the date the fee waiver or expense reimbursement occurred and provided further that such recoupment can be achieved within the Expense Limitation Agreement currently in effect and the Expense Limitation Agreement in place when the waiver/reimbursement occurred. The Expense Limitation Agreement may not be terminated by the Adviser prior to its expiration date, but the Board of Trustees of the Trust (the “Board”) may terminate such agreement at any time. The Expense Limitation Agreement shall terminate automatically upon the termination of the Advisory Agreement. Additional information pertaining to the Small-Cap Equity Fund’s expense ratios as of March 31, 2019 can be found on the financial highlights.
The Small-Cap Equity Fund’s investment objectives, strategies, risks, charges and expenses must be considered carefully before investing. The Small-Cap Equity Fund’s prospectus contains this and other important information about the Small-Cap Equity Fund and may be obtained by calling (888) 912-4562. Please read it carefully before investing.
The Small-Cap Equity Fund is distributed by Unified Financial Securities, LLC, member FINRA/SIPC.
2
Investment Results (Unaudited) (continued)
Average Annual Total Returns* as of March 31, 2019
| | Six
Months | One
Year | Since
Inception
(12/21/17) | Since
Inception
(12/19/18) |
Fuller & Thaler Behavioral Small-Cap Growth Fund | | | | |
R6 Shares | -16.77% | 9.79% | 9.42% | |
Institutional Shares | -16.78% | 9.75% | 9.34% | |
Investor Shares | -16.89% | 9.46% | 9.07% | |
A Shares | | | | 14.04% |
C Shares | | | | 13.88% |
Russell 2000® Growth Index(a) | -8.22% | 3.85% | 4.47% | 17.70% |
| | Expense Ratios(b) |
| | R6 Shares | Institutional
Shares | Investor
Shares | A Shares | C Shares |
Gross | 4.42% | 4.55% | 4.77% | 4.92% | 5.42% |
With Applicable Waivers | 0.90% | 0.99% | 1.25% | 1.30% | 1.80% |
The performance quoted represents past performance, which does not guarantee future results. The investment return and principal value of an investment will fluctuate so that an investor’s shares, when redeemed, may be worth more or less than their original cost. The returns shown do not reflect the deduction of taxes that a shareholder would pay on Fuller & Thaler Behavioral Small-Cap Growth Fund (the “Small-Cap Growth Fund”) distributions or the redemption of Small-Cap Growth Fund shares. Current performance of the Small-Cap Growth Fund may be lower or higher than the performance quoted. The Small-Cap Growth Fund’s investment objectives, risks, charges and expenses must be considered carefully before investing. Performance data current to the most recent month end may be obtained by calling (888) 912-4562.
* Return figures reflect any change in price per share and assume the reinvestment of all distributions. The Small-Cap Growth Fund’s returns reflect any fee waivers during the applicable periods. If such fee waivers had not occurred, the quoted performance would have been lower. Total returns for periods less than 1 year are not annualized. A Shares and C Shares performance have not been adjusted to include sales charges that may apply. If sales charges were reflected, the performance quoted would be lower.
(a) The Russell 2000® Growth Index (“Russell 2000 Growth”) is a widely recognized unmanaged index of equity securities and is representative of a broader domestic equity market and range of securities than is found in the Small-Cap Growth Fund’s portfolio. Russell 2000 Growth measures the performance of those Russell 2000 companies with higher price/book ratios and higher forecasted growth values. Individuals cannot invest directly in an index; however, an individual can invest in exchange traded funds or other investment vehicles that attempt to track the performance of a benchmark index.
(b) The expense ratios are from the Small-Cap Growth Fund’s most recent prospectus dated December 19, 2018. The Adviser has contractually agreed to waive its management fee and/or reimburse Small-Cap Growth Fund expenses so that total annual operating expenses do not exceed 1.30%, 1.80% 1.25%, 0.99%, and 0.90% for A Shares, C Shares, Investor Shares, Institutional Shares and R6 Shares, respectively, of the average daily net assets for each class through January 31, 2020. Previously, effective December 20, 2017 through the effective date of this prospectus, the Adviser had contractually agreed to waive its management fee and/or reimburse Small-Cap Growth Fund expenses so that total annual operating expenses do not exceed 1.24%, 0.99% and 0.90% for Investor Shares, Institutional Shares and R6 Shares, respectively, of the Fund’s average daily net assets. The expense limitation does not apply to (i) interest; (ii) taxes; (iii) brokerage fees and commissions; (iv) other extraordinary expenses not incurred in the ordinary course of the Small-Cap Growth Fund’s business; and (v) indirect expenses such as acquired fund fees and expenses. During any fiscal year that the Investment Advisory Agreement between the Adviser and the Trust is in effect, the
3
Investment Results (Unaudited) (continued)
Adviser may recoup the sum of all fees previously waived or expenses reimbursed, less any reimbursement previously paid, provided that the Adviser is only permitted to recoup fees or expenses within 36 months from the date the fee waiver or expense reimbursement occurred and provided further that such recoupment can be achieved within the Expense Limitation Agreement currently in effect and the Expense Limitation Agreement in place when the waiver/reimbursement occurred. The Expense Limitation Agreement may not be terminated by the Adviser prior to its expiration date, but the Board may terminate such agreement at any time. The Expense Limitation Agreement shall terminate automatically upon the termination of the Advisory Agreement. Additional information pertaining to the Small-Cap Growth Fund’s expense ratios as of March 31, 2019 can be found on the financial highlights.
The Small-Cap Growth Fund’s investment objectives, strategies, risks, charges and expenses must be considered carefully before investing. The prospectus contains this and other important information about the Small-Cap Growth Fund and may be obtained by calling (888) 912-4562. Please read it carefully before investing.
The Small-Cap Growth Fund is distributed by Unified Financial Securities, LLC, member FINRA/SIPC.
4
Investment Results (Unaudited) (continued)
Average Annual Total Returns* as of March 31, 2019
| | Six
Months | One
Year | Since
Inception
(12/21/17) |
Fuller & Thaler Behavioral Mid-Cap Value Fund | | | |
R6 Shares | -1.87% | 4.05% | 0.69% |
Institutional Shares | -1.91% | 3.95% | 0.65% |
Investor Shares | -2.02% | 3.70% | 0.34% |
Russell Midcap® Value Index(a) | -2.73% | 2.89% | 0.48% |
| | Expense Ratios(b) |
| | R6 Shares | Institutional
Shares | Investor
Shares |
Gross | 4.29% | 4.41% | 4.65% |
With Applicable Waivers | 0.80% | 0.90% | 1.15% |
The performance quoted represents past performance, which does not guarantee future results. The investment return and principal value of an investment will fluctuate so that an investor’s shares, when redeemed, may be worth more or less than their original cost. The returns shown do not reflect the deduction of taxes that a shareholder would pay on Fuller & Thaler Behavioral Mid-Cap Value Fund (the “Mid-Cap Value Fund”) distributions or the redemption of Mid-Cap Value Fund shares. Current performance of the Mid-Cap Value Fund may be lower or higher than the performance quoted. The Mid-Cap Value Fund’s investment objectives, risks, charges and expenses must be considered carefully before investing. Performance data current to the most recent month end may be obtained by calling (888) 912-4562.
* Return figures reflect any change in price per share and assume the reinvestment of all distributions. The Mid-Cap Value Fund’s returns reflect any fee waivers during the applicable periods. If such fee waivers had not occurred, the quoted performance would have been lower. Total returns for periods less than 1 year are not annualized.
(a) The Russell Midcap® Value Index (“Russell Midcap Value”) is a widely recognized unmanaged index of equity securities and is representative of a broader domestic equity market and range of securities than is found in the Mid-Cap Value Fund’s portfolio. The Russell Midcap Value measures the performance of those Russell Midcap companies with lower price/book ratios and lower forecasted growth values. Individuals cannot invest directly in an index; however, an individual can invest in exchange traded funds or other investment vehicles that attempt to track the performance of a benchmark index.
(b) The expense ratios are from the Mid-Cap Value Fund’s most recent prospectus dated December 19, 2018. The Adviser has contractually agreed to waive its management fee and/or reimburse Mid-Cap Value Fund expenses so that total annual operating expenses do not exceed 1.15%, 0.90%, and 0.80% for Investor Shares, Institutional Shares and R6 Shares, respectively, of the average daily net assets for each class through January 31, 2020. Previously, effective December 20, 2017 through the effective date of this prospectus, the Adviser had contractually agreed to waive its management fee and/or reimburse Mid-Cap Value Fund expenses so that total annual operating expenses do not exceed 1.14%, 0.89% and 0.80% for Investor Shares, Institutional Shares and R6 Shares, respectively, of the Mid-Cap Value Fund’s average daily net assets. The expense limitation does not apply to: (i) interest; (ii) taxes; (iii) brokerage fees and commissions; (iv) other extraordinary expenses not incurred in the ordinary course of the Mid-Cap Value Fund’s business; and (v) indirect expenses such as acquired fund fees and expenses. During any fiscal year that the Investment Advisory Agreement between the Adviser and the Trust is in effect, the Adviser may recoup the sum of all fees previously waived or expenses reimbursed, less any reimbursement previously paid, provided that the Adviser is only permitted to recoup fees or expenses within 36 months from the date the fee waiver or expense reimbursement occurred and provided further that such recoupment can be achieved within the Expense Limitation Agreement currently in effect and the Expense Limitation Agreement in place when the waiver/reimbursement occurred. This Expense Limitation Agreement may not be terminated by the Adviser prior to its expiration date, but the Board may
5
Investment Results (Unaudited) (continued)
terminate such agreement at any time. The Expense Limitation Agreement shall terminate automatically upon the termination of the Advisory Agreement. Additional information pertaining to the Mid-Cap Value Fund’s expense ratios as of March 31, 2019 can be found on the financial highlights.
The Mid-Cap Value Fund’s investment objectives, strategies, risks, charges and expenses must be considered carefully before investing. The prospectus contains this and other important information about the Mid-Cap Value Fund and may be obtained by calling (888) 912-4562. Please read it carefully before investing.
The Mid-Cap Value Fund is distributed by Unified Financial Securities, LLC, member FINRA/SIPC.
6
Investment Results (Unaudited) (continued)
Total Returns* as of March 31, 2019
| | Since
Inception
(12/26/18) |
Fuller & Thaler Behavioral Unconstrained Equity Fund | |
R6 Shares | 21.05% |
Institutional Shares | 21.00% |
Russell 3000® Index(a) | 15.91% |
| | Expense Ratios(b) |
| | R6 Shares | Institutional
Shares |
Gross | 2.22% | 2.42% |
With Applicable Waivers | 0.90% | 0.99% |
The performance quoted represents past performance, which does not guarantee future results. The investment return and principal value of an investment will fluctuate so that an investor’s shares, when redeemed, may be worth more or less than their original cost. The returns shown do not reflect the deduction of taxes that a shareholder would pay on Fuller & Thaler Behavioral Unconstrained Equity Fund (the “Unconstrained Equity Fund”) distributions or the redemption of Unconstrained Equity Fund shares. Current performance of the Unconstrained Equity Fund may be lower or higher than the performance quoted. The Unconstrained Equity Fund’s investment objectives, risks, charges and expenses must be considered carefully before investing. Performance data current to the most recent month end may be obtained by calling (888) 912-4562.
* Return figures reflect any change in price per share and assume the reinvestment of all distributions. The Unconstrained Equity Fund’s returns reflect any fee waivers during the applicable periods. If such fee waivers had not occurred, the quoted performance would have been lower. Total returns for periods less than 1 year are not annualized.
(a) The Russell 3000® Index (“Russell 3000”) measures the performance of the broad U.S. equity market. The index represents the 3000 largest U.S. publicly traded companies as measured by market capitalization. Individuals cannot invest directly in an index; however, an individual can invest in exchange traded funds or other investment vehicles that attempt to track the performance of a benchmark index.
(b) The expense ratios are from the Unconstrained Equity Fund’s most recent prospectus dated December 19, 2018. The Adviser has contractually agreed to waive its management fee and/or reimburse Unconstrained Equity Fund expenses so that total annual operating expenses do not exceed 0.99% and 0.90% for Institutional Shares and R6 Shares, respectively, of the average daily net assets for each class through January 31, 2020. The expense limitation does not apply to: (i) interest; (ii) taxes; (iii) brokerage fees and commissions; (iv) other extraordinary expenses not incurred in the ordinary course of the Unconstrained Equity Fund’s business; and (v) indirect expenses such as acquired fund fees and expenses. During any fiscal year that the Investment Advisory Agreement between the Adviser and the Trust is in effect, the Adviser may recoup the sum of all fees previously waived or expenses reimbursed, less any reimbursement previously paid, provided that the Adviser is only permitted to recoup fees or expenses within 36 months from the date the fee waiver or expense reimbursement occurred and provided further that such recoupment can be achieved within the Expense Limitation Agreement currently in effect and the Expense Limitation Agreement in place when the waiver/reimbursement occurred. This Expense Limitation Agreement may not be terminated by the Adviser prior to its expiration date, but the Board may terminate such agreement at any time. The Expense Limitation Agreement shall terminate automatically upon the termination of the Advisory Agreement. Additional information pertaining to the Unconstrained Equity Fund’s expense ratios as of March 31, 2019 can be found on the financial highlights.
The Unconstrained Equity Fund’s investment objectives, strategies, risks, charges and expenses must be considered carefully before investing. The prospectus contains this and other important information about the Unconstrained Equity Fund and may be obtained by calling (888) 912-4562. Please read it carefully before investing.
The Unconstrained Equity Fund is distributed by Unified Financial Securities, LLC, member FINRA/SIPC.
7
Investment Results (Unaudited) (continued)
Total Returns* as of March 31, 2019
| | Since
Inception
(12/26/18) |
Fuller & Thaler Behavioral Small-Mid Core Equity Fund | |
Institutional Shares | 15.95% |
Russell 2500® Index(a) | 17.67% |
| | Expense
Ratios(b) |
| | Institutional
Shares |
Gross | 2.37% |
With Applicable Waivers | 0.95% |
The performance quoted represents past performance, which does not guarantee future results. The investment return and principal value of an investment will fluctuate so that an investor’s shares, when redeemed, may be worth more or less than their original cost. The returns shown do not reflect the deduction of taxes that a shareholder would pay on Fuller & Thaler Behavioral Small-Mid Core Equity Fund (the “Small-Mid Core Equity Fund”) distributions or the redemption of Small-Mid Core Equity Fund shares. Current performance of the Small-Mid Core Equity Fund may be lower or higher than the performance quoted. The Small-Mid Core Equity Fund’s investment objectives, risks, charges and expenses must be considered carefully before investing. Performance data current to the most recent month end may be obtained by calling (888) 912-4562.
* Return figures reflect any change in price per share and assume the reinvestment of all distributions. The Small-Mid Core Equity Fund’s returns reflect any fee waivers during the applicable periods. If such fee waivers had not occurred, the quoted performance would have been lower. Total returns for periods less than 1 year are not annualized.
(a) The Russell 2500® Index (“Russell 2500”) is a widely recognized unmanaged index of equity securities and is representative of a broader domestic equity market and range of securities than is found in the Small-Mid Core Equity Fund’s portfolio. The Russell 2500 measures the performance of those Russell 2500 companies with lower price/book ratios and lower forecasted growth values. Individuals cannot invest directly in an index; however, an individual can invest in exchange traded funds or other investment vehicles that attempt to track the performance of a benchmark index.
(b) The expense ratios are from the Small-Mid Core Equity Fund’s most recent prospectus dated December 19, 2018. The Adviser has contractually agreed to waive its management fee and/or reimburse Small-Mid Core Equity Fund expenses so that total annual operating expenses do not exceed 0.95% of the Small-Mid Core Equity Fund’s Institutional Shares average daily net assets through January 31, 2020. The expense limitation does not apply to: (i) interest; (ii) taxes; (iii) brokerage fees and commissions; (iv) other extraordinary expenses not incurred in the ordinary course of the Small-Mid Core Equity Fund’s business; and (v) indirect expenses such as acquired fund fees and expenses. During any fiscal year that the Investment Advisory Agreement between the Adviser and the Trust is in effect, the Adviser may recoup the sum of all fees previously waived or expenses reimbursed, less any reimbursement previously paid, provided that the Adviser is only permitted to recoup fees or expenses within 36 months from the date the fee waiver or expense reimbursement occurred and provided further that such recoupment can be achieved within the Expense Limitation Agreement currently in effect and the Expense Limitation Agreement in place when the waiver/reimbursement occurred. This Expense Limitation Agreement may not be terminated by the Adviser prior to its expiration date, but the Board may terminate such agreement at any time. The Expense Limitation Agreement shall terminate automatically upon the termination of the Advisory Agreement. Additional information pertaining to the Small-Mid Core Equity Fund’s expense ratios as of March 31, 2019 can be found on the financial highlights.
The Small-Mid Core Equity Fund’s investment objectives, strategies, risks, charges and expenses must be considered carefully before investing. The prospectus contains this and other important information about the Small-Mid Core Equity Fund and may be obtained by calling (888) 912-4562. Please read it carefully before investing.
The Small-Mid Core Equity Fund is distributed by Unified Financial Securities, LLC, member FINRA/SIPC.
8
Investment Results (Unaudited) (continued)
Total Returns* as of March 31, 2019
| | Since
Inception
(12/28/18) |
Fuller & Thaler Behavioral Micro-Cap Equity Fund | |
Institutional Shares | 21.55% |
Russell Microcap® Index(a) | 14.01% |
| | Expense
Ratios(b) |
| | Institutional
Shares |
Gross | 3.07% |
With Applicable Waivers | 1.75% |
The performance quoted represents past performance, which does not guarantee future results. The investment return and principal value of an investment will fluctuate so that an investor’s shares, when redeemed, may be worth more or less than their original cost. The returns shown do not reflect the deduction of taxes that a shareholder would pay on Fuller & Thaler Behavioral Micro-Cap Equity Fund (the “Micro-Cap Equity Fund”) distributions or the redemption of Micro-Cap Equity Fund shares. Current performance of the Micro-Cap Equity Fund may be lower or higher than the performance quoted. The Micro-Cap Equity Fund’s investment objectives, risks, charges and expenses must be considered carefully before investing. Performance data current to the most recent month end may be obtained by calling (888) 912-4562.
* Return figures reflect any change in price per share and assume the reinvestment of all distributions. The Micro-Cap Equity Fund’s returns reflect any fee waivers during the applicable periods. If such fee waivers had not occurred, the quoted performance would have been lower. Total returns for periods less than 1 year are not annualized.
(a) The Russell Microcap® Index (“Russell Microcap”) measures the performance of the microcap segment of the U.S. equity market. Microcap stocks make up less than 3% of the U.S. equity market (by market cap) and consist of the smallest 1,000 securities in the small cap Russell 2000® Index, plus the next smallest eligible securities by market cap. Individuals cannot invest directly in an index; however, an individual can invest in exchange traded funds or other investment vehicles that attempt to track the performance of a benchmark index.
(b) The expense ratios are from the Micro-Cap Equity Fund’s most recent prospectus dated December 19, 2018. The Adviser has contractually agreed to waive its management fee and/or reimburse Micro-Cap Equity Fund expenses so that total annual operating expenses do not exceed 1.75% of the Micro-Cap Equity Fund’s Institutional Shares average daily net assets through January 31, 2020. The expense limitation does not apply to: (i) interest; (ii) taxes; (iii) brokerage fees and commissions; (iv) other extraordinary expenses not incurred in the ordinary course of the Micro-Cap Equity Fund’s business; and (v) indirect expenses such as acquired fund fees and expenses. During any fiscal year that the Investment Advisory Agreement between the Adviser and the Trust is in effect, the Adviser may recoup the sum of all fees previously waived or expenses reimbursed, less any reimbursement previously paid, provided that the Adviser is only permitted to recoup fees or expenses within 36 months from the date the fee waiver or expense reimbursement occurred and provided further that such recoupment can be achieved within the Expense Limitation Agreement currently in effect and the Expense Limitation Agreement in place when the waiver/reimbursement occurred. This Expense Limitation Agreement may not be terminated by the Adviser prior to its expiration date, but the Board may terminate such agreement at any time. The Expense Limitation Agreement shall terminate automatically upon the termination of the Advisory Agreement. Additional information pertaining to the Micro-Cap Equity Fund’s expense ratios as of March 31, 2019 can be found on the financial highlights.
The Micro-Cap Equity Fund’s investment objectives, strategies, risks, charges and expenses must be considered carefully before investing. The prospectus contains this and other important information about the Micro-Cap Equity Fund and may be obtained by calling (888) 912-4562. Please read it carefully before investing.
The Micro-Cap Equity Fund is distributed by Unified Financial Securities, LLC, member FINRA/SIPC.
9
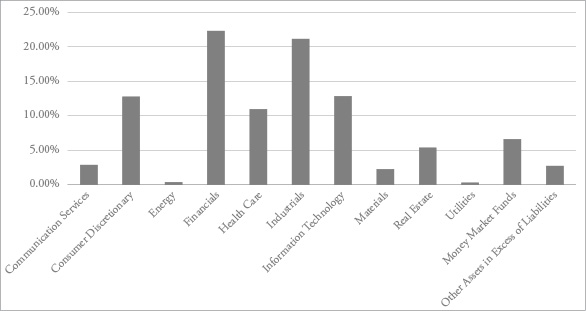
Portfolio Illustration (Unaudited)
March 31, 2019
Fuller & Thaler Behavioral Small-Cap Equity Fund Sector Holdings as of March 31, 2019.*
Fuller & Thaler Behavioral Small-Cap Growth Fund Sector Holdings as of March 31, 2019.*
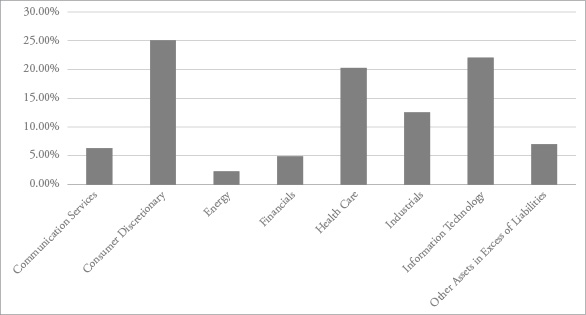
* | As a percentage of net assets. |
10
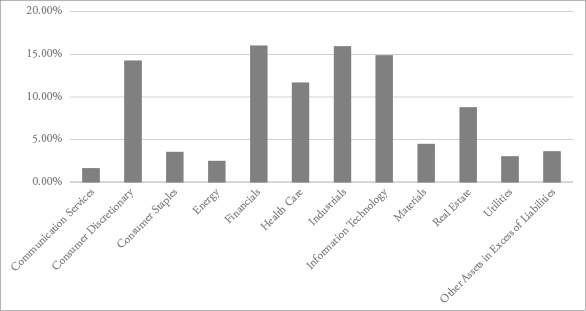
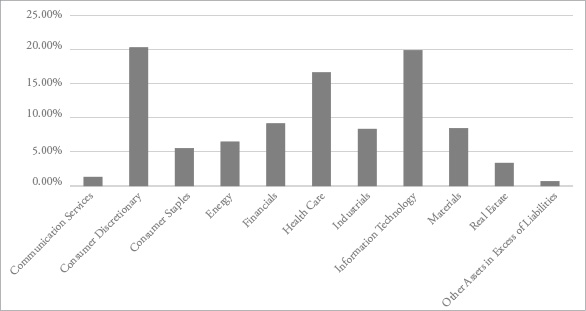
Portfolio Illustration (Unaudited)
March 31, 2019
Fuller & Thaler Behavioral Mid-Cap Value Fund Sector Holdings as of March 31, 2019.*

Fuller & Thaler Behavioral Unconstrained Equity Fund Sector Holdings as of March 31, 2019.*

* | As a percentage of net assets. |
11
Portfolio Illustration (Unaudited)
March 31, 2019
Fuller & Thaler Behavioral Small-Mid Core Equity Fund Sector Holdings as of March 31, 2019.*
Fuller & Thaler Behavioral Micro-Cap Equity Fund Sector Holdings as of March 31, 2019.*
* | As a percentage of net assets. |
Availability of Portfolio Schedules (Unaudited)
The Funds file their complete schedule of portfolio holdings with the Securities and Exchange Commission (“SEC”) for the first and third quarters of each fiscal year within sixty days after the end of the period. The Funds’ portfolio holdings are available on the SEC’s website at http://www.sec.gov.
12
Fuller & Thaler Behavioral Small-Cap Equity Fund
Schedule of Investments
March 31, 2019 (Unaudited)
Shares | | | | Fair Value | |
COMMON STOCKS — 90.77% | | | | |
| | | | | | | | | |
| | | | | Auto Components — 0.85% | | | | |
| | | 489,600 | | Tenneco, Inc., Class A | | $ | 10,849,536 | |
| | | | | | | | | |
| | | | | Banks — 14.06% | | | | |
| | | 386,200 | | BancorpSouth Bank | | | 10,898,564 | |
| | | 1,819,000 | | F.N.B. Corporation | | | 19,281,400 | |
| | | 82,336 | | Farmers National Banc Corporation | | | 1,135,413 | |
| | | 140,679 | | Financial Institutions, Inc. | | | 3,823,655 | |
| | | 88,794 | | First Citizens BancShares, Inc., Class A | | | 36,156,917 | |
| | | 2,415,097 | | Fulton Financial Corporation | | | 37,385,702 | |
| | | 881,798 | | Hancock Whitney Corporation | | | 35,624,639 | |
| | | 443,513 | | Lakeland Financial Corporation | | | 20,055,658 | |
| | | 119,300 | | TowneBank | | | 2,952,675 | |
| | | 555,492 | | TriState Capital Holdings, Inc.(a) | | | 11,348,702 | |
| | | | | | | | 178,663,325 | |
| | | | | Building Products — 3.57% | | | | |
| | | 306,100 | | Advanced Drainage Systems, Inc. | | | 7,888,197 | |
| | | 675,134 | | Continental Building Products, Inc.(a) | | | 16,736,571 | |
| | | 231,076 | | Masonite International Corporation(a) | | | 11,528,382 | |
| | | 771,042 | | NCI Building Systems, Inc.(a) | | | 4,749,619 | |
| | | 72,107 | | Trex Company, Inc.(a) | | | 4,436,023 | |
| | | | | | | | 45,338,792 | |
| | | | | Capital Markets — 3.36% | | | | |
| | | 1,090,723 | | Blucora, Inc.(a) | | | 36,408,334 | |
| | | 142,838 | | Hamilton Lane, Inc., Class A | | | 6,224,880 | |
| | | | | | | | 42,633,214 | |
| | | | | Chemicals — 0.65% | | | | |
| | | 41,600 | | Koppers Holdings, Inc.(a) | | | 1,080,768 | |
| | | 158,700 | | Trinseo S.A. | | | 7,189,110 | |
| | | | | | | | 8,269,878 | |
| | | | | Commercial Services & Supplies — 1.11% |
| | | 128,800 | | Deluxe Corporation | | | 5,631,136 | |
| | | 248,556 | | SP Plus Corporation(a) | | | 8,480,731 | |
| | | | | | | | 14,111,867 | |
| | | | | Construction & Engineering — 5.03% |
| | | 638,900 | | Comfort Systems USA, Inc. | | | 33,471,971 | |
| | | 804,000 | | Quanta Services, Inc. | | | 30,342,960 | |
| | | | | | | | 63,814,931 | |
| | | | | Electric Utilities — 0.15% | | | | |
| | | 36,690 | | Portland General Electric Company | | | 1,902,010 | |
| | | | | | | | | |
| | | | | Electrical Equipment — 0.78% |
| | | 193,236 | | Generac Holdings, Inc.(a) | | | 9,899,480 | |
| | | | | | | | | |
| | | | | Electronic Equipment, Instruments & Components — 5.15% |
| | | 1,670,452 | | Jabil, Inc. | | | 44,417,318 | |
| | | 187,000 | | Sanmina Corporation(a) | | | 5,394,950 | |
| | | 55,270 | | SYNNEX Corporation | | | 5,272,205 | |
| | | 618,900 | | TTM Technologies, Inc.(a) | | | 7,259,697 | |
| | | 88,898 | | Vishay Precision Group, Inc.(a) | | | 3,041,201 | |
| | | | | | | | 65,385,371 | |
| | | | | Equity Real Estate Investment Trusts (REITs) — 4.31% |
| | | 553,000 | | Armada Hoffler Properties, Inc. | | | 8,621,270 | |
| | | 121,700 | | City Office REIT, Inc. | | | 1,376,427 | |
| | | 170,200 | | CorEnergy Infrastructure Trust, Inc. | | | 6,254,850 | |
| | | 167,421 | | Industrial Logistics Properties Trust | | | 3,376,882 | |
| | | 192,600 | | InfraREIT, Inc. | | | 4,038,822 | |
| | | 61,854 | | Office Properties Income Trust | | | 1,709,645 | |
| | | 297,900 | | OUTFRONT Media, Inc. | | | 6,970,860 | |
| | | 1,024,014 | | Xenia Hotel & Resorts, Inc. | | | 22,436,146 | |
| | | | | | | | 54,784,902 | |
| | | | | Health Care Equipment & Supplies — 0.87% |
| | | 363,313 | | Lantheus Holdings, Inc.(a) | | | 8,893,902 | |
| | | 15,700 | | Masimo Corporation(a) | | | 2,170,996 | |
| | | | | | | | 11,064,898 | |
| | | | | Health Care Providers & Services — 4.19% |
| | | 205,500 | | Amedisys, Inc.(a) | | | 25,329,930 | |
| | | 86,900 | | Chemed Corporation | | | 27,814,083 | |
| | | | | | | | 53,144,013 | |
| | | | | Hotels, Restaurants & Leisure — 1.73% |
| | | 855,929 | | Ruth's Hospitality Group, Inc. | | | 21,903,223 | |
| | See accompanying notes which are an integral part of these financial statements. | 13 |
Fuller & Thaler Behavioral Small-Cap Equity Fund
Schedule of Investments (continued)
March 31, 2019 (Unaudited)
Shares | | | | Fair Value | |
COMMON STOCKS — (continued) | | | | |
| | | | | | | | | |
| | | | | Household Durables — 3.15% |
| | | 344,791 | | Helen of Troy Ltd.(a) | | $ | 39,981,964 | |
| | | | | | | | | |
| | | | | Industrial Conglomerates — 0.88% |
| | | 289,709 | | Raven Industries, Inc. | | | 11,116,134 | |
| | | | | | | | | |
| | | | | Insurance — 3.45% | | | | |
| | | 113,800 | | James River Group Holdings Ltd. | | | 4,561,104 | |
| | | 182,789 | | Kemper Corporation | | | 13,917,554 | |
| | | 206,908 | | Primerica, Inc. | | | 25,273,813 | |
| | | | | | | | 43,752,471 | |
| | | | | IT Services — 3.86% | | | | |
| | | 178,500 | | CoreLogic, Inc.(a) | | | 6,650,910 | |
| | | 490,024 | | CSG Systems International, Inc. | | | 20,728,015 | |
| | | 777,671 | | EVERTEC, Inc. | | | 21,627,031 | |
| | | | | | | | 49,005,956 | |
| | | | | Leisure Products — 0.22% | | | | |
| | | 39,610 | | Johnson Outdoors, Inc., Class A | | | 2,826,570 | |
| | | | | | | | | |
| | | | | Life Sciences Tools & Services — 5.03% |
| | | 1,103,556 | | Bruker Corporation | | | 42,420,693 | |
| | | 310,100 | | Medpace Holdings, Inc.(a) | | | 18,286,597 | |
| | | 28,800 | | PRA Health Sciences, Inc.(a) | | | 3,176,352 | |
| | | | | | | | 63,883,642 | |
| | | | | Machinery — 0.96% | | | | |
| | | 252,456 | | Meritor, Inc.(a) | | | 5,137,480 | |
| | | 219,300 | | Terex Corporation | | | 7,046,109 | |
| | | | | | | | 12,183,589 | |
| | | | | Marine — 0.47% | | | | |
| | | 1,149,721 | | Costamare, Inc. | | | 5,978,549 | |
| | | | | | | | | |
| | | | | Media — 2.82% | | | | |
| | | 55,600 | | AMC Networks, Inc., Class A(a) | | | 3,155,856 | |
| | | 328,600 | | MSG Networks, Inc., Class A(a) | | | 7,147,050 | |
| | | 661,294 | | Sinclair Broadcast Group, Inc., Class A | | | 25,446,593 | |
| | | | | | | | 35,749,499 | |
| | | | | Metals & Mining — 0.29% | | | | |
| | | 946,800 | | Gold Resource Corporation | | | 3,720,924 | |
| | | | | | | | | |
| | | | | Mortgage Real Estate Investment Trusts (REITs) — 0.33% |
| | | 266,700 | | Invesco Mortgage Capital, Inc. | | | 4,213,860 | |
| | | | | | | | | |
| | | | | Multi-Utilities — 0.11% | | | | |
| | | 26,100 | | Unitil Corporation | | | 1,413,837 | |
| | | | | | | | | |
| | | | | Oil, Gas & Consumable Fuels — 0.31% |
| | | 569,000 | | W&T Offshore, Inc.(a) | | | 3,926,100 | |
| | | | | | | | | |
| | | | | Paper & Forest Products — 1.27% |
| | | 658,646 | | Louisiana-Pacific Corporation | | | 16,057,789 | |
| | | | | | | | | |
| | | | | Pharmaceuticals — 0.84% | | | | |
| | | 322,250 | | Phibro Animal Health Corporation, Class A | | | 10,634,250 | |
| | | | | | | | | |
| | | | | Professional Services — 3.45% |
| | | 80,327 | | CRA International, Inc. | | | 4,059,727 | |
| | | 304,888 | | FTI Consulting, Inc.(a) | | | 23,421,495 | |
| | | 464,772 | | Kforce, Inc. | | | 16,322,793 | |
| | | | | | | | 43,804,015 | |
| | | | | Real Estate Management & Development — 1.02% |
| | | 263,705 | | Marcus & Millichap, Inc.(a) | | | 10,740,704 | |
| | | 35,825 | | RMR Group, Inc. (The), Class A | | | 2,184,609 | |
| | | | | | | | 12,925,313 | |
| | | | | Road & Rail — 3.07% | | | | |
| | | 356,900 | | Landstar System, Inc. | | | 39,041,291 | |
| | | | | | | | | |
| | | | | Semiconductors & Semiconductor Equipment — 0.73% |
| | | 43,700 | | Cabot Microelectronics Corporation | | | 4,892,652 | |
| | | 229,700 | | SMART Global Holdings, Inc.(a) | | | 4,410,240 | |
| | | | | | | | 9,302,892 | |
| | | | | Software — 3.05% | | | | |
| | | 251,200 | | j2 Global, Inc. | | | 21,753,920 | |
| | | 381,300 | | Progress Software Corporation | | | 16,918,281 | |
| | | | | | | | 38,672,201 | |
14 | See accompanying notes which are an integral part of these financial statements. | |
Fuller & Thaler Behavioral Small-Cap Equity Fund
Schedule of Investments (continued)
March 31, 2019 (Unaudited)
Shares | | | | Fair Value | |
COMMON STOCKS — (continued) | | | | |
| | | | | | | | | |
| | | | | Specialty Retail — 5.12% | | | | |
| | | 555,050 | | DSW, Inc., Class A | | $ | 12,333,211 | |
| | | 518,100 | | Murphy USA, Inc.(a) | | | 44,359,722 | |
| | | 204,100 | | Sally Beauty Holdings, Inc.(a) | | | 3,757,481 | |
| | | 99,100 | | Sleep Number Corporation(a) | | | 4,657,700 | |
| | | | | | | | 65,108,114 | |
| | | | | Textiles, Apparel & Luxury Goods — 1.67% |
| | | 143,900 | | Deckers Outdoor Corporation(a) | | | 21,151,861 | |
| | | | | | | | | |
| | | | | Thrifts & Mortgage Finance — 1.06% |
| | | 103,201 | | Federal Agricultural Mortgage Corporation, Class C | | | 7,474,848 | |
| | | 208,500 | | Washington Federal, Inc. | | | 6,023,565 | |
| | | | | | | | 13,498,413 | |
| | | | | Trading Companies & Distributors — 1.80% |
| | | 257,170 | | Applied Industrial Technologies, Inc. | | | 15,293,900 | |
| | | 181,800 | | Rush Enterprises, Inc., Class A | | | 7,601,058 | |
| | | | | | | | 22,894,958 | |
| | | | | Total Common Stocks (Cost $1,157,067,842) | | | 1,152,609,632 | |
MONEY MARKET FUNDS — 6.56% |
| | | 83,285,549 | | Fidelity Investments Money Market Government Portfolio, Institutional Class, 2.35%(b) | | $ | 83,285,549 | |
| | | | | Total Money Market Funds (Cost $83,285,549) | | | 83,285,549 | |
| | | | | Total Investments — 97.33% (Cost $1,240,353,391) | | | 1,235,895,181 | |
| | | | | Other Assets in Excess of Liabilities — 2.67% | | | 33,842,916 | |
| | | | | NET ASSETS — 100.00% | | $ | 1,269,738,097 | |
(a) | Non-income producing security. |
(b) | Rate disclosed is the seven day effective yield as of March 31, 2019. |
| | See accompanying notes which are an integral part of these financial statements. | 15 |
Fuller & Thaler Behavioral Small-Cap Growth Fund
Schedule of Investments
March 31, 2019 (Unaudited)
Shares | | | | Fair Value | |
COMMON STOCKS — 93.03% | | | | |
| | | | | | | | | |
| | | | | Airlines — 3.62% | | | | |
| | | 5,171 | | SkyWest, Inc. | | $ | 280,734 | |
| | | 4,585 | | Spirit Airlines, Inc.(a) | | | 242,363 | |
| | | | | | | | 523,097 | |
| | | | | Biotechnology — 7.93% | | | | |
| | | 7,470 | | Emergent BioSolutions, Inc.(a) | | | 377,384 | |
| | | 3,860 | | Genomic Health, Inc.(a) | | | 270,393 | |
| | | 4,160 | | Sarepta Therapeutics, Inc.(a) | | | 495,831 | |
| | | | | | | | 1,143,608 | |
| | | | | Commercial Services & Supplies — 1.77% |
| | | 17,575 | | Steelcase, Inc., Class A | | | 255,716 | |
| | | | | | | | | |
| | | | | Communications Equipment — 4.44% |
| | | 6,620 | | Acacia Communications, Inc.(a) | | | 379,657 | |
| | | 5,650 | | Plantronics, Inc. | | | 260,522 | |
| | | | | | | | 640,179 | |
| | | | | Consumer Finance — 4.83% | | | | |
| | | 9,130 | | Enova International, Inc.(a) | | | 208,347 | |
| | | 19,230 | | EZCORP, Inc., Class A(a) | | | 179,224 | |
| | | 5,090 | | Green Dot Corporation, Class A(a) | | | 308,708 | |
| | | | | | | | 696,279 | |
| | | | | Diversified Consumer Services — 3.40% |
| | | 4,290 | | Grand Canyon Education, Inc.(a) | | | 491,248 | |
| | | | | | | | | |
| | | | | Electronic Equipment, Instruments & Components — 1.66% |
| | | 8,280 | | Sanmina Corporation(a) | | | 238,878 | |
| | | | | | | | | |
| | | | | Energy Equipment & Services — 2.21% |
| | | 6,960 | | Dril-Quip, Inc.(a) | | | 319,116 | |
| | | | | | | | | |
| | | | | Entertainment — 6.53% | | | | |
| | | 18,550 | | AMC Entertainment Holdings, Inc., Class A | | | 275,468 | |
| | | 7,685 | | World Wrestling Entertainment, Inc., Class A | | | 666,904 | |
| | | | | | | | 942,372 | |
| | | | | Health Care Equipment & Supplies — 7.27% |
| | | 12,740 | | STAAR Surgical Company(a) | | | 435,581 | |
| | | 4,840 | | Tandem Diabetes Care, Inc.(a) | | | 307,340 | |
| | | 9,725 | | Wright Medical Group N.V.(a) | | | 305,851 | |
| | | | | | | | 1,048,772 | |
| | | | | Health Care Providers & Services — 5.02% |
| | | 2,925 | | Amedisys, Inc.(a) | | | 360,536 | |
| | | 5,820 | | BioTelemetry, Inc.(a) | | | 364,448 | |
| | | | | | | | 724,984 | |
| | | | | Hotels, Restaurants & Leisure — 8.83% |
| | | 5,650 | | Dave & Buster's Entertainment, Inc. | | | 281,766 | |
| | | 9,980 | | Eldorado Resorts, Inc.(a) | | | 465,965 | |
| | | 10,660 | | PlayAGS, Inc.(a) | | | 255,094 | |
| | | 10,600 | | SeaWorld Entertainment, Inc.(a) | | | 273,056 | |
| | | | | | | | 1,275,881 | |
| | | | | Household Durables — 4.18% |
| | | 5,090 | | Roku, Inc.(a) | | | 328,356 | |
| | | 14,430 | | Skyline Corporation(a) | | | 274,170 | |
| | | | | | | | 602,526 | |
| | | | | Interactive Media & Services — 1.62% |
| | | 5,820 | | CarGurus, Inc.(a) | | | 233,149 | |
| | | | | | | | | |
| | | | | Internet & Direct Marketing Retail — 4.69% |
| | | 10,060 | | Etsy, Inc.(a) | | | 676,233 | |
| | | | | | | | | |
| | | | | IT Services — 3.87% | | | | |
| | | 4,321 | | Twilio, Inc., Class A(a) | | | 558,187 | |
| | | | | | | | | |
| | | | | Machinery — 2.79% | | | | |
| | | 4,455 | | Chart Industries, Inc.(a) | | | 403,267 | |
| | | | | | | | | |
| | | | | Professional Services — 4.29% |
| | | 4,545 | | FTI Consulting, Inc.(a) | | | 349,147 | |
| | | 2,170 | | Insperity, Inc. | | | 268,342 | |
| | | | | | | | 617,489 | |
| | | | | Semiconductors & Semiconductor Equipment — 3.31% |
| | | 18,720 | | Advanced Micro Devices, Inc.(a) | | | 477,734 | |
16 | See accompanying notes which are an integral part of these financial statements. | |
Fuller & Thaler Behavioral Small-Cap Growth Fund
Schedule of Investments (continued)
March 31, 2019 (Unaudited)
Shares | | | | Fair Value | |
COMMON STOCKS — (continued) | | | | |
| | | | | | | | | |
| | | | | Software — 8.75% | | | | |
| | | 7,260 | | Five9, Inc.(a) | | $ | 383,545 | |
| | | 5,810 | | Mimecast Ltd.(a) | | | 275,104 | |
| | | 1,505 | | Trade Desk, Inc. (The), Class A(a) | | | 297,915 | |
| | | 6,070 | | Workiva, Inc.(a) | | | 307,748 | |
| | | | | | | | 1,264,312 | |
| | | | | Textiles, Apparel & Luxury Goods — 2.02% |
| | | 8,660 | | Skechers U.S.A., Inc., Class A(a) | | | 291,063 | |
| | | | | Total Investments — 93.03% (Cost $12,152,890) | | | 13,424,090 | |
| | | | | Other Assets in Excess of Liabilities — 6.97% | | | 1,006,316 | |
| | | | | NET ASSETS — 100.00% | | $ | 14,430,406 | |
(a) | Non-income producing security. |
| | See accompanying notes which are an integral part of these financial statements. | 17 |
Fuller & Thaler Behavioral Mid-Cap Value Fund
Schedule of Investments
March 31, 2019 (Unaudited)
Shares | | | | Fair Value | |
COMMON STOCKS — 88.23% | | | | |
| | | | | | | | | |
| | | | | Aerospace & Defense — 1.93% |
| | | 15,750 | | Arconic, Inc. | | $ | 300,983 | |
| | | | | | | | | |
| | | | | Banks — 7.66% | | | | |
| | | 4,042 | | Commerce Bancshares, Inc. | | | 234,679 | |
| | | 22,915 | | First Horizon National Corporation | | | 320,351 | |
| | | 19,565 | | KeyCorp | | | 308,149 | |
| | | 2,110 | | M&T Bank Corporation | | | 331,311 | |
| | | | | | | | 1,194,490 | |
| | | | | Building Products — 1.66% | | | | |
| | | 7,000 | | Johnson Controls International plc | | | 258,580 | |
| | | | | | | | | |
| | | | | Chemicals — 3.76% | | | | |
| | | 1,825 | | Celanese Corporation | | | 179,963 | |
| | | 370 | | Sherwin-Williams Company (The) | | | 159,363 | |
| | | 3,150 | | W.R. Grace & Company | | | 245,826 | |
| | | | | | | | 585,152 | |
| | | | | Commercial Services & Supplies — 1.63% |
| | | 3,150 | | Republic Services, Inc. | | | 253,197 | |
| | | | | | | | | |
| | | | | Communications Equipment — 1.60% |
| | | 11,445 | | CommScope Holding Company, Inc.(a) | | | 248,699 | |
| | | | | | | | | |
| | | | | Consumer Finance — 2.28% | | | | |
| | | 11,125 | | Synchrony Financial | | | 354,888 | |
| | | | | | | | | |
| | | | | Containers & Packaging — 7.82% |
| | | 3,400 | | Berry Global Group, Inc.(a) | | | 183,158 | |
| | | 7,130 | | Crown Holdings, Inc.(a) | | | 389,084 | |
| | | 25,655 | | Graphic Packaging Holding Company | | | 324,023 | |
| | | 8,400 | | WestRock Company | | | 322,140 | |
| | | | | | | | 1,218,405 | |
| | | | | Electric Utilities — 4.18% | | | | |
| | | 4,950 | | Alliant Energy Corporation | | | 233,294 | |
| | | 2,750 | | Edison International | | | 170,280 | |
| | | 2,575 | | Pinnacle West Capital Corporation | | | 246,118 | |
| | | | | | | | 649,692 | |
| | | | | Electrical Equipment — 1.20% |
| | | 2,250 | | AMETEK, Inc. | | | 186,683 | |
| | | | | | | | | |
| | | | | Energy Equipment & Services — 1.50% |
| | | 16,630 | | Patterson-UTI Energy, Inc. | | | 233,153 | |
| | | | | | | | | |
| | | | | Equity Real Estate Investment Trusts (REITs) — 6.88% |
| | | 1,140 | | American Tower Corporation, Class A | | | 224,648 | |
| | | 15,550 | | Brixmor Property Group, Inc. | | | 285,653 | |
| | | 36,600 | | Colony Capital, Inc., Class A | | | 194,712 | |
| | | 1,000 | | Public Storage | | | 217,780 | |
| | | 12,250 | | Retail Properties of America, Inc., Class A | | | 149,328 | |
| | | | | | | | 1,072,121 | |
| | | | | Food Products — 3.32% | | | | |
| | | 2,685 | | Ingredion, Inc. | | | 254,243 | |
| | | 2,250 | | J.M. Smucker Company (The) | | | 262,125 | |
| | | | | | | | 516,368 | |
| | | | | Health Care Providers & Services �� 3.65% |
| | | 2,700 | | Centene Corporation(a) | | | 143,370 | |
| | | 1,200 | | Covetrus, Inc.(a) | | | 38,220 | |
| | | 3,000 | | Henry Schein, Inc.(a) | | | 180,330 | |
| | | 1,350 | | Laboratory Corporation of America Holdings(a) | | | 206,523 | |
| | | | | | | | 568,443 | |
| | | | | Hotels, Restaurants & Leisure — 1.56% |
| | | 8,215 | | Aramark | | | 242,753 | |
| | | | | | | | | |
| | | | | Household Durables — 4.66% |
| | | 1,820 | | Mohawk Industries, Inc.(a) | | | 229,593 | |
| | | 16,031 | | Newell Brands, Inc. | | | 245,916 | |
| | | 1,880 | | Whirlpool Corporation | | | 249,833 | |
| | | | | | | | 725,342 | |
| | | | | Industrial Conglomerates — 0.89% |
| | | 405 | | Roper Technologies, Inc. | | | 138,498 | |
| | | | | | | | | |
| | | | | Insurance — 5.41% | | | | |
| | | 4,250 | | Assured Guaranty Ltd. | | | 188,828 | |
| | | 1,185 | | Everest Re Group Ltd. | | | 255,912 | |
| | | 230 | | Markel Corporation(a) | | | 229,135 | |
| | | 2,050 | | Torchmark Corporation | | | 167,998 | |
| | | | | | | | 841,873 | |
18 | See accompanying notes which are an integral part of these financial statements. | |
Fuller & Thaler Behavioral Mid-Cap Value Fund
Schedule of Investments (continued)
March 31, 2019 (Unaudited)
Shares | | | | Fair Value | |
COMMON STOCKS — (continued) | | | | |
| | | | | | | | | |
| | | | | IT Services — 1.42% | | | | |
| | | 4,100 | | Amdocs Ltd. | | $ | 221,851 | |
| | | | | | | | | |
| | | | | Machinery — 2.43% | | | | |
| | | 3,850 | | Donaldson Company, Inc. | | | 192,730 | |
| | | 1,190 | | Snap-on, Inc. | | | 186,259 | |
| | | | | | | | 378,989 | |
| | | | | Multi-Line Retail — 4.10% | | | | |
| | | 2,625 | | Dollar General Corporation | | | 313,163 | |
| | | 3,090 | | Dollar Tree, Inc.(a) | | | 324,573 | |
| | | | | | | | 637,736 | |
| | | | | Multi-Utilities — 1.60% | | | | |
| | | 4,500 | | CMS Energy Corporation | | | 249,930 | |
| | | | | | | | | |
| | | | | Oil, Gas & Consumable Fuels — 3.50% |
| | | 5,275 | | Anadarko Petroleum Corporation | | | 239,907 | |
| | | 8,900 | | Antero Resources Corporation(a) | | | 78,587 | |
| | | 1,490 | | Pioneer Natural Resources Company | | | 226,897 | |
| | | | | | | | 545,391 | |
| | | | | Professional Services — 2.39% |
| | | 6,150 | | Nielsen Holdings plc | | | 145,571 | |
| | | 1,700 | | Verisk Analytics, Inc. | | | 226,099 | |
| | | | | | | | 371,670 | |
| | | | | Road & Rail — 1.75% | | | | |
| | | 2,345 | | Kansas City Southern | | | 271,973 | |
| | | | | | | | | |
| | | | | Software — 1.48% | | | | |
| | | 3,850 | | Verint Systems, Inc.(a) | | | 230,461 | |
| | | | | | | | | |
| | | | | Specialty Retail — 5.78% | | | | |
| | | 1,000 | | Advance Auto Parts, Inc. | | | 170,530 | |
| | | 5,660 | | CarMax, Inc.(a) | | | 395,068 | |
| | | 865 | | O'Reilly Automotive, Inc.(a) | | | 335,880 | |
| | | | | | | | 901,478 | |
| | | | | Technology Hardware, Storage & Peripherals — 0.69% |
| | | 3,950 | | NCR Corporation(a) | | | 107,796 | |
| | | | | | | | | |
| | | | | Trading Companies & Distributors — 1.50% |
| | | 5,400 | | HD Supply Holdings, Inc.(a) | | | 234,090 | |
| | | | | Total Investments — 88.23% (Cost $13,730,616) | | | 13,740,685 | |
| | | | | Other Assets in Excess of Liabilities — 11.77% | | | 1,832,703 | |
| | | | | NET ASSETS — 100.00% | | $ | 15,573,388 | |
(a) | Non-income producing security. |
| | See accompanying notes which are an integral part of these financial statements. | 19 |
Fuller & Thaler Behavioral Unconstrained Equity Fund
Schedule of Investments
March 31, 2019 (Unaudited)
Shares | | | | Fair Value | |
COMMON STOCKS — 98.84% | | | | |
| | | | | | | | | |
| | | | | Airlines — 3.94% | | | | |
| | | 2,725 | | Southwest Airlines Company | | $ | 141,455 | |
| | | | | | | | | |
| | | | | Auto Components — 2.98% | | | | |
| | | 2,280 | | Cooper-Standard Holdings, Inc.(a) | | | 107,069 | |
| | | | | | | | | |
| | | | | Chemicals — 8.99% | | | | |
| | | 870 | | Ecolab, Inc. | | | 153,590 | |
| | | 390 | | NewMarket Corporation | | | 169,088 | |
| | | | | | | | 322,678 | |
| | | | | Commercial Services & Supplies — 4.65% |
| | | 825 | | Cintas Corporation | | | 166,740 | |
| | | | | | | | | |
| | | | | Consumer Finance — 5.47% | | | | |
| | | 6,150 | | Synchrony Financial | | | 196,185 | |
| | | | | | | | | |
| | | | | Electrical Equipment — 4.08% |
| | | 2,860 | | Generac Holdings, Inc.(a) | | | 146,518 | |
| | | | | | | | | |
| | | | | Equity Real Estate Investment Trusts (REITs) — 3.22% |
| | | 2,995 | | Gaming and Leisure Properties, Inc. | | | 115,517 | |
| | | | | | | | | |
| | | | | Hotels, Restaurants & Leisure — 6.11% |
| | | 4,880 | | Yum China Holdings, Inc. | | | 219,161 | |
| | | | | | | | | |
| | | | | Household Products — 3.40% |
| | | 760 | | Clorox Company (The) | | | 121,950 | |
| | | | | | | | | |
| | | | | Internet & Direct Marketing Retail — 10.09% |
| | | 77 | | Booking Holdings, Inc.(a) | | | 134,358 | |
| | | 6,125 | | eBay, Inc. | | | 227,483 | |
| | | | | | | | 361,841 | |
| | | | | IT Services — 8.00% | | | | |
| | | 1,845 | | Paychex, Inc. | | | 147,969 | |
| | | 765 | | VeriSign, Inc.(a) | | | 138,893 | |
| | | | | | | | 286,862 | |
| | | | | Life Sciences Tools & Services — 4.14% |
| | | 590 | | Waters Corporation(a) | | | 148,509 | |
| | | | | | | | | |
| | | | | Machinery — 3.71% | | | | |
| | | 775 | | Parker-Hannifin Corporation | | | 133,006 | |
| | | | | | | | | |
| | | | | Media — 3.84% | | | | |
| | | 3,605 | | Liberty Media Corporation - Liberty SiriusXM, Series C(a) | | | 137,855 | |
| | | | | | | | | |
| | | | | Road & Rail — 4.43% | | | | |
| | | 950 | | Union Pacific Corporation | | | 158,840 | |
| | | | | | | | | |
| | | | | Semiconductors & Semiconductor Equipment — 9.29% |
| | | 1,200 | | Cabot Microelectronics Corporation | | | 134,352 | |
| | | 1,570 | | Xilinx, Inc. | | | 199,061 | |
| | | | | | | | 333,413 | |
| | | | | Specialty Retail — 12.50% | | | | |
| | | 345 | | O'Reilly Automotive, Inc.(a) | | | 133,964 | |
| | | 1,600 | | Ross Stores, Inc. | | | 148,959 | |
| | | 1,570 | | Tiffany & Company | | | 165,713 | |
| | | | | | | | 448,636 | |
| | | | | Total Investments — 98.84% (Cost $3,157,515) | | | 3,546,235 | |
| | | | | Other Assets in Excess of Liabilities — 1.16% | | | 41,618 | |
| | | | | NET ASSETS — 100.00% | | $ | 3,587,853 | |
(a) | Non-income producing security. |
20 | See accompanying notes which are an integral part of these financial statements. | |
Fuller & Thaler Behavioral Small-Mid Core Equity Fund
Schedule of Investments
March 31, 2019 (Unaudited)
Shares | | | | Fair Value | |
COMMON STOCKS — 96.43% | | | | |
| | | | | | | | | |
| | | | | Airlines — 3.09% | | | | |
| | | 650 | | Alaska Air Group, Inc. | | $ | 36,478 | |
| | | 2,335 | | JetBlue Airways Corporation(a) | | | 38,200 | |
| | | | | | | | 74,678 | |
| | | | | Auto Components — 1.90% | | | | |
| | | 975 | | Cooper-Standard Holdings, Inc.(a) | | | 45,786 | |
| | | | | | | | | |
| | | | | Banks — 10.45% | | | | |
| | | 6,030 | | Investors Bancorp, Inc. | | | 71,455 | |
| | | 2,810 | | Live Oak Bancshares, Inc. | | | 41,054 | |
| | | 1,055 | | PacWest Bancorp | | | 39,679 | |
| | | 1,620 | | Synovus Financial Corporation | | | 55,663 | |
| | | 1,085 | | Western Alliance Bancorporation(a) | | | 44,528 | |
| | | | | | | | 252,379 | |
| | | | | Chemicals — 4.45% | | | | |
| | | 248 | | NewMarket Corporation | | | 107,523 | |
| | | | | | | | | |
| | | | | Communications Equipment — 1.49% |
| | | 780 | | Plantronics, Inc. | | | 35,966 | |
| | | | | | | | | |
| | | | | Diversified Financial Services — 3.43% |
| | | 1,655 | | Voya Financial, Inc. | | | 82,683 | |
| | | | | | | | | |
| | | | | Electrical Equipment — 2.74% |
| | | 1,290 | | Generac Holdings, Inc.(a) | | | 66,087 | |
| | | | | | | | | |
| | | | | Electronic Equipment, Instruments & Components — 0.94% |
| | | 260 | | Keysight Technologies, Inc.(a) | | | 22,672 | |
| | | | | | | | | |
| | | | | Equity Real Estate Investment Trusts (REITs) — 8.73% |
| | | 2,010 | | Gaming and Leisure Properties, Inc. | | | 77,526 | |
| | | 2,365 | | Site Centers Corporation | | | 32,211 | |
| | | 3,015 | | STORE Capital Corporation | | | 101,003 | |
| | | | | | | | 210,740 | |
| | | | | Food Products — 3.51% |
| | | 540 | | Lancaster Colony Corporation | | | 84,613 | |
| | | | | | | | | |
| | | | | Gas Utilities — 2.99% | | | | |
| | | 1,300 | | UGI Corporation | | | 72,046 | |
| | | | | | | | | |
| | | | | Health Care Equipment & Supplies — 10.36% |
| | | 4,405 | | AngioDynamics, Inc.(a) | | | 100,698 | |
| | | 1,380 | | DENTSPLY SIRONA, Inc. | | | 68,434 | |
| | | 247 | | ICU Medical, Inc.(a) | | | 59,115 | |
| | | 640 | | STAAR Surgical Company(a) | | | 21,882 | |
| | | | | | | | 250,129 | |
| | | | | Hotels, Restaurants & Leisure — 5.57% |
| | | 2,830 | | Ruth's Hospitality Group, Inc. | | | 72,419 | |
| | | 1,380 | | Yum China Holdings, Inc. | | | 61,976 | |
| | | | | | | | 134,395 | |
| | | | | Household Durables — 1.80% |
| | | 345 | | Mohawk Industries, Inc.(a) | | | 43,522 | |
| | | | | | | | | |
| | | | | Insurance — 2.11% | | | | |
| | | 1,725 | | Brown & Brown, Inc. | | | 50,905 | |
| | | | | | | | | |
| | | | | Machinery — 6.34% | | | | |
| | | 1,665 | | Altra Industrial Motion Corporation | | | 51,698 | |
| | | 1,060 | | Graco, Inc. | | | 52,490 | |
| | | 650 | | Oshkosh Corporation | | | 48,835 | |
| | | | | | | | 153,023 | |
| | | | | Media — 1.62% | | | | |
| | | 2,010 | | Liberty Latin America Ltd., Class C(a) | | | 39,095 | |
| | | | | | | | | |
| | | | | Oil, Gas & Consumable Fuels — 2.46% |
| | | 4,520 | | WPX Energy, Inc.(a) | | | 59,257 | |
| | | | | | | | | |
| | | | | Pharmaceuticals — 1.30% | | | | |
| | | 650 | | Perrigo Company plc | | | 31,304 | |
| | | | | | | | | |
| | | | | Road & Rail — 2.09% | | | | |
| | | 435 | | Kansas City Southern | | | 50,451 | |
| | See accompanying notes which are an integral part of these financial statements. | 21 |
Fuller & Thaler Behavioral Small-Mid Core Equity Fund
Schedule of Investments (continued)
March 31, 2019 (Unaudited)
Shares | | | | Fair Value | |
COMMON STOCKS — (continued) | | | | |
| | | | | | | | | |
| | | | | Semiconductors & Semiconductor Equipment — 8.50% |
| | | 1,015 | | Advanced Energy Industries, Inc.(a) | | $ | 50,425 | |
| | | 650 | | Cabot Microelectronics Corporation | | | 72,774 | |
| | | 1,120 | | Entegris, Inc. | | | 39,973 | |
| | | 600 | | Power Integrations, Inc. | | | 41,964 | |
| | | | | | | | 205,136 | |
| | | | | Software — 1.94% | | | | |
| | | 450 | | Aspen Technology, Inc.(a) | | | 46,917 | |
| | | | | | | | | |
| | | | | Specialty Retail — 2.84% | | | | |
| | | 650 | | Tiffany & Company | | | 68,608 | |
| | | | | | | | | |
| | | | | Technology Hardware, Storage & Peripherals — 1.99% |
| | | 1,500 | | Xerox Corporation | | $ | 47,970 | |
| | | | | | | | | |
| | | | | Textiles, Apparel & Luxury Goods — 2.13% |
| | | 510 | | Carter's, Inc. | | | 51,403 | |
| | | | | | | | | |
| | | | | Trading Companies & Distributors — 1.66% |
| | | 925 | | HD Supply Holdings, Inc.(a) | | | 40,099 | |
| | | | | Total Investments — 96.43% (Cost $2,169,760) | | | 2,327,387 | |
| | | | | Other Assets in Excess of Liabilities — 3.57% | | | 86,173 | |
| | | | | NET ASSETS — 100.00% | | $ | 2,413,560 | |
(a) | Non-income producing security. |
22 | See accompanying notes which are an integral part of these financial statements. | |
Fuller & Thaler Behavioral Micro-Cap Equity Fund
Schedule of Investments
March 31, 2019 (Unaudited)
Shares | | | | Fair Value | |
COMMON STOCKS — 99.35% | | | | |
| | | | | | | | | |
| | | | | Aerospace & Defense — 1.64% |
| | | 5,860 | | KEYW Holding Corporation (The)(a) | | $ | 50,513 | |
| | | | | | | | | |
| | | | | Biotechnology — 9.58% | | | | |
| | | 5,500 | | Corbus Pharamceuticals Holdings, Inc.(a) | | | 38,225 | |
| | | 3,161 | | Kindred Biosciences, Inc.(a) | | | 28,986 | |
| | | 25,470 | | PDL BioPharma, Inc.(a) | | | 94,748 | |
| | | 14,900 | | Rigel Pharmaceuticals, Inc.(a) | | | 38,293 | |
| | | 6,363 | | T2 Biosystems, Inc.(a) | | | 16,735 | |
| | | 3,140 | | Veracyte, Inc.(a) | | | 78,563 | |
| | | | | | | | 295,550 | |
| | | | | Capital Markets — 1.46% | | | | |
| | | 2,700 | | B. Riley Financial, Inc. | | | 45,063 | |
| | | | | | | | | |
| | | | | Chemicals — 4.03% | | | | |
| | | 14,880 | | Flotek Industries, Inc.(a) | | | 48,211 | |
| | | 20,070 | | Intrepid Potash, Inc.(a) | | | 76,066 | |
| | | | | | | | 124,277 | |
| | | | | Communications Equipment — 1.15% |
| | | 1,530 | | Comtech Telecommunications Corporation | | | 35,527 | |
| | | | | | | | | |
| | | | | Construction & Engineering — 1.79% |
| | | 5,100 | | Great Lakes Dredge & Dock Corporation(a) | | | 45,441 | |
| | | 3,900 | | HC2 Holdings, Inc.(a) | | | 9,555 | |
| | | | | | | | 54,996 | |
| | | | | Consumer Finance — 1.27% | | | | |
| | | 4,208 | | EZCORP, Inc., Class A(a) | | | 39,219 | |
| | | | | | | | | |
| | | | | Diversified Consumer Services — 2.69% |
| | | 5,200 | | Bridgepoint Education, Inc.(a) | | | 31,772 | |
| | | 2,650 | | Carriage Services, Inc. | | | 51,013 | |
| | | | | | | | 82,785 | |
| | | | | Diversified Financial Services — 3.16% |
| | | 6,900 | | GAIN Capital Holdings, Inc. | | | 43,332 | |
| | | 17,600 | | Global Eagle Entertainment, Inc.(a) | | | 12,485 | |
| | | 7,600 | | On Deck Capital, Inc.(a) | | | 41,192 | |
| | | | | | | | 97,009 | |
| | | | | Electronic Equipment, Instruments & Components — 1.39% |
| | | 10,400 | | Arlo Technologies, Inc.(a) | | | 42,952 | |
| | | | | | | | | |
| | | | | Equity Real Estate Investment Trusts (REITs) — 3.34% |
| | | 4,700 | | CatchMark Timber Trust, Inc., Class A | | | 46,154 | |
| | | 950 | | Investors Real Estate Trust | | | 56,915 | |
| | | | | | | | 103,069 | |
| | | | | Food & Staples Retailing — 2.19% |
| | | 5,640 | | Natural Grocers by Vitamin Cottage, Inc.(a) | | | 67,398 | |
| | | | | | | | | |
| | | | | Food Products — 3.33% | | | | |
| | | 1,600 | | Freshpet, Inc.(a) | | | 67,664 | |
| | | 1,490 | | Limoneira Company | | | 35,060 | |
| | | | | | | | 102,724 | |
| | | | | Health Care Equipment & Supplies — 3.86% |
| | | 10,100 | | Accuray, Inc.(a) | | | 48,177 | |
| | | 10,900 | | Antares Pharma, Inc.(a) | | | 33,027 | |
| | | 4,500 | | Invacare Corporation | | | 37,665 | |
| | | | | | | | 118,869 | |
| | | | | Health Care Providers & Services — 1.19% |
| | | 5,200 | | Cross Country Healthcare, Inc.(a) | | | 36,556 | |
| | | | | | | | | |
| | | | | Hotels, Restaurants & Leisure — 2.84% |
| | | 10,020 | | Drive Shack, Inc.(a) | | | 44,990 | |
| | | 2,800 | | Lindblad Expeditions Holdings, Inc.(a) | | | 42,700 | |
| | | | | | | | 87,690 | |
| | | | | Household Durables — 1.49% |
| | | 1,650 | | Lovesac Company (The)(a) | | | 45,887 | |
| | | | | | | | | |
| | | | | Insurance — 1.88% | | | | |
| | | 3,980 | | Heritage Insurance Holdings, Inc. | | | 58,108 | |
| | | | | | | | | |
| | | | | Internet & Direct Marketing Retail — 1.51% |
| | | 3,800 | | Waitr Holdings, Inc.(a) | | | 46,702 | |
| | See accompanying notes which are an integral part of these financial statements. | 23 |
Fuller & Thaler Behavioral Micro-Cap Equity Fund
Schedule of Investments (continued)
March 31, 2019 (Unaudited)
Shares | | | | Fair Value | |
COMMON STOCKS — (continued) | | | | |
| | | | | | | | | |
| | | | | IT Services — 4.43% | | | | |
| | | 8,970 | | Everi Holdings, Inc.(a) | | $ | 94,364 | |
| | | 13,090 | | Limelight Networks, Inc.(a) | | | 42,281 | |
| | | | | | | | 136,645 | |
| | | | | Life Sciences Tools & Services — 1.98% |
| | | 4,600 | | Fluidigm Corporation(a) | | | 61,134 | |
| | | | | | | | | |
| | | | | Machinery — 1.38% | | | | |
| | | 7,130 | | Titan International, Inc. | | | 42,566 | |
| | | | | | | | | |
| | | | | Media — 1.30% | | | | |
| | | 2,430 | | Cardlytics, Inc.(a) | | | 40,192 | |
| | | | | | | | | |
| | | | | Mortgage Real Estate Investment Trusts (REITs) — 1.78% |
| | | 5,170 | | Exantas Capital Corporation | | | 54,957 | |
| | | | | | | | | |
| | | | | Multi-Line Retail — 0.88% | | | | |
| | | 12,800 | | Tuesday Morning Corporation(a) | | | 27,136 | |
| | | | | | | | | |
| | | | | Oil, Gas & Consumable Fuels — 6.45% |
| | | 14,500 | | Clean Energy Fuels Corporation(a) | | | 44,805 | |
| | | 5,600 | | Comstock Resources, Inc.(a) | | | 38,808 | |
| | | 19,700 | | Pacific Ethanol, Inc.(a) | | | 19,306 | |
| | | 13,900 | | W&T Offshore, Inc.(a) | | | 95,910 | |
| | | | | | | | 198,829 | |
| | | | | Paper & Forest Products — 4.42% |
| | | 6,360 | | Verso Corporation, Class A(a) | | | 136,231 | |
| | | | | | | | | |
| | | | | Professional Services — 0.95% |
| | | 9,000 | | Acacia Research Corporation(a) | | | 29,340 | |
| | | | | | | | | |
| | | | | Road & Rail — 1.19% | | | | |
| | | 2,550 | | USA Truck, Inc.(a) | | | 36,822 | |
| | | | | | | | | |
| | | | | Software — 9.58% | | | | |
| | | 2,647 | | eGain Corporation(a) | | | 27,661 | |
| | | 5,360 | | Mitek Systems, Inc.(a) | | | 65,606 | |
| | | 8,800 | | RealNetworks, Inc.(a) | | | 27,368 | |
| | | 15,210 | | Rubicon Project, Inc. (The)(a) | | | 92,477 | |
| | | 5,730 | | Telaria, Inc.(a) | | | 36,328 | |
| | | 7,500 | | Telenav, Inc.(a) | | | 45,525 | |
| | | | | | | | 294,965 | |
| | | | | Specialty Retail — 7.12% | | | | |
| | | 9,800 | | Barnes & Noble, Inc. | | | 53,214 | |
| | | 4,300 | | Boot Barn Holdings, Inc.(a) | | | 126,591 | |
| | | 6,950 | | Tile Shop Holdings, Inc. | | | 39,337 | |
| | | | | | | | 219,142 | |
| | | | | Technology Hardware, Storage & Peripherals — 3.35% |
| | | 5,980 | | Diebold Nixdorf, Inc.(a) | | | 66,199 | |
| | | 4,400 | | Immersion Corporation(a) | | | 37,092 | |
| | | | | | | | 103,291 | |
| | | | | Textiles, Apparel & Luxury Goods — 3.36% |
| | | 1,975 | | Unifi, Inc.(a) | | | 38,216 | |
| | | 4,940 | | Vera Bradley, Inc.(a) | | | 65,455 | |
| | | | | | | | 103,671 | |
| | | | | Trading Companies & Distributors — 1.39% |
| | | 1,850 | | CAI International, Inc.(a) | | | 42,920 | |
| | | | | Total Investments — 99.35% (Cost $2,581,272) | | | 3,062,735 | |
| | | | | Other Assets in Excess of Liabilities — 0.65% | | | 20,010 | |
| | | | | NET ASSETS — 100.00% | | $ | 3,082,745 | |
(a) | Non-income producing security. |
The industries shown on the schedules of investments are based on the Global Industry Classification Standard, or GICS®(“GICS”). The GICS was developed by and/or is the exclusive property of MSCI, Inc. and Standard & Poor’s Financial Services LLC (“S&P”). GICS is a service mark of MSCI, Inc. and S&P and has been licensed for use by Ultimus Fund Solutions, LLC
24 | See accompanying notes which are an integral part of these financial statements. | |
Fuller & Thaler Funds
Statements of Assets and Liabilities
March 31, 2019 (Unaudited)
| | | Fuller & Thaler
Behavioral
Small-Cap
Equity Fund | | | Fuller & Thaler
Behavioral
Small-Cap
Growth Fund | | | Fuller & Thaler
Behavioral
Mid-Cap
Value Fund | | | Fuller & Thaler
Behavioral
Unconstrained
Equity Fund | |
Assets | | | | |
Investments in securities at fair value (cost $1,240,353,391, $12,152,890, $13,730,616 and $3,157,515) | | $ | 1,235,895,181 | | | $ | 13,424,090 | | | $ | 13,740,685 | | | $ | 3,546,235 | |
Cash and cash equivalents | | | 35,000,000 | | | | 692,598 | | | | 1,775,442 | | | | 37,097 | |
Receivable for fund shares sold | | | 1,465,126 | | | | 84,064 | | | | 36,170 | | | | 250 | |
Receivable for investments sold | | | 3,870,035 | | | | 217,506 | | | | — | | | | — | |
Dividends and interest receivable | | | 1,483,149 | | | | 5,524 | | | | 21,769 | | | | 2,578 | |
Deferred offering costs | | | — | | | | — | | | | — | | | | 7,076 | |
Receivable from Adviser | | | — | | | | — | | | | 495 | | | | 8,273 | |
Prepaid expenses | | | 104,502 | | | | 25,785 | | | | 18,104 | | | | — | |
Total Assets | | | 1,277,817,993 | | | | 14,449,567 | | | | 15,592,665 | | | | 3,601,509 | |
Liabilities | | | | | | | | | | | | | | | | |
Payable for investments purchased | | | 6,592,187 | | | | — | | | | — | | | | — | |
Payable for fund shares redeemed | | | 554,647 | | | | 504 | | | | 294 | | | | — | |
Payable to Adviser | | | 639,738 | | | | 1,240 | | | | — | | | | — | |
Accrued 12b-1 fees | | | 45,308 | | | | 89 | | | | 381 | | | | — | |
Accrued administrative service fees | | | 143,886 | | | | 1,210 | | | | 1,129 | | | | — | |
Payable to Administrator | | | 64,526 | | | | 4,781 | | | | 5,412 | | | | 1,613 | |
Other accrued expenses | | | 39,604 | | | | 11,337 | | | | 12,061 | | | | 12,043 | |
Total Liabilities | | | 8,079,896 | | | | 19,161 | | | | 19,277 | | | | 13,656 | |
Net Assets | | $ | 1,269,738,097 | | | $ | 14,430,406 | | | $ | 15,573,388 | | | $ | 3,587,853 | |
| | See accompanying notes which are an integral part of these financial statements. | 25 |
Fuller & Thaler Funds
Statements of Assets and Liabilities (continued)
March 31, 2019 (Unaudited)
| | | Fuller & Thaler
Behavioral
Small-Cap
Equity Fund | | | Fuller & Thaler
Behavioral
Small-Cap
Growth Fund | | | Fuller & Thaler
Behavioral
Mid-Cap
Value Fund | | | Fuller & Thaler
Behavioral
Unconstrained
Equity Fund | |
Net Assets consist of: | | | | | | | | | | | | | | | | |
Paid-in capital | | $ | 1,300,346,969 | | | $ | 14,236,070 | | | $ | 15,552,331 | | | $ | 3,194,717 | |
Accumulated earnings (deficit) | | | (30,608,872 | ) | | | 194,336 | | | | 21,057 | | | | 393,136 | |
Net Assets | | $ | 1,269,738,097 | | | $ | 14,430,406 | | | $ | 15,573,388 | | | $ | 3,587,853 | |
R6 Shares: | | | | | | | | | | | | | | | | |
Net Assets | | $ | 105,868,151 | | | $ | 2,262,660 | | | $ | 2,234,673 | | | $ | 1,873,109 | |
Shares outstanding (unlimited number of shares authorized, no par value) | | | 4,385,260 | | | | 100,861 | | | | 111,484 | | | | 77,360 | |
Net asset value, offering and redemption price per share | | $ | 24.14 | | | $ | 22.43 | | | $ | 20.04 | | | $ | 24.21 | |
Institutional Shares: | | | | | | | | | | | | | | | | |
Net Assets | | $ | 1,046,054,536 | | | $ | 11,936,896 | | | $ | 12,262,026 | | | $ | 1,714,744 | |
Shares outstanding (unlimited number of shares authorized, no par value) | | | 43,660,379 | | | | 532,672 | | | | 611,917 | | | | 70,850 | |
Net asset value, offering and redemption price per share | | $ | 23.96 | | | $ | 22.41 | | | $ | 20.04 | | | $ | 24.20 | |
Investor Shares: | | | | | | | | | | | | | | | | |
Net Assets | | $ | 117,623,807 | | | $ | 223,751 | | | $ | 1,076,689 | | | $ | — | |
Shares outstanding (unlimited number of shares authorized, no par value) | | | 4,934,680 | | | | 10,018 | | | | 53,869 | | | | — | |
Net asset value, offering and redemption price per share | | $ | 23.84 | | | $ | 22.34 | (a) | | $ | 19.99 | | | $ | — | |
A Shares: | | | | | | | | | | | | | | | | |
Net Assets | | $ | 44,062 | | | $ | 4,295 | | | $ | — | | | $ | — | |
Shares outstanding (unlimited number of shares authorized, no par value) | | | 1,848 | | | | 192 | | | | — | | | | — | |
Net asset value and redemption price per share | | $ | 23.85 | (a) | | $ | 22.34 | (a) | | $ | — | | | $ | — | |
Maximum offering price per share (Note 1) | | $ | 25.31 | | | $ | 23.70 | | | $ | — | | | $ | — | |
C Shares: | | | | | | | | | | | | | | | | |
Net Assets | | $ | 147,541 | | | $ | 2,804 | | | $ | — | | | $ | — | |
Shares outstanding (unlimited number of shares authorized, no par value) | | | 6,199 | | | | 126 | | | | — | | | | — | |
Net asset value, offering and redemption price per share (Note 1) | | $ | 23.80 | | | $ | 22.31 | (a) | | $ | — | | | $ | — | |
(a) | per share amounts may not recalculate due to rounding of net assets and/or shares outstanding. |
26 | See accompanying notes which are an integral part of these financial statements. | |
Fuller & Thaler Funds
Statements of Assets and Liabilities (continued)
March 31, 2019 (Unaudited)
| | | Fuller & Thaler
Behavioral
Small–Mid Core
Equity Fund | | | Fuller & Thaler
Behavioral
Micro-Cap
Equity Fund | |
Assets | | | | |
Investments in securities at fair value (cost $2,169,760 and $2,581,272) | | $ | 2,327,387 | | | $ | 3,062,735 | |
Cash and cash equivalents | | | 79,755 | | | | 19,212 | |
Receivable for fund shares sold | | | — | | | | 250 | |
Receivable for investments sold | | | — | | | | 16,826 | |
Dividends and interest receivable | | | 4,444 | | | | 1,756 | |
Deferred offering costs | | | 7,066 | | | | 7,180 | |
Receivable from Adviser | | | 9,026 | | | | 6,596 | |
Total Assets | | | 2,427,678 | | | | 3,114,555 | |
Liabilities | | | | | | | | |
Payable for investments purchased | | | — | | | | 17,944 | |
Accrued administrative service fees | | | — | | | | 7 | |
Payable to Administrator | | | 1,613 | | | | 1,484 | |
Other accrued expenses | | | 12,505 | | | | 12,375 | |
Total Liabilities | | | 14,118 | | | | 31,810 | |
Net Assets | | $ | 2,413,560 | | | $ | 3,082,745 | |
Net Assets consist of: | | | | | | | | |
Paid-in capital | | $ | 2,230,593 | | | $ | 2,536,269 | |
Accumulated earnings | | | 182,967 | | | | 546,476 | |
Net Assets | | $ | 2,413,560 | | | $ | 3,082,745 | |
Institutional Shares: | | | | | | | | |
Net Assets | | $ | 2,413,560 | | | $ | 3,082,745 | |
Shares outstanding (unlimited number of shares authorized, no par value) | | | 104,062 | | | | 126,805 | |
Net asset value, offering and redemption price per share | | $ | 23.19 | | | $ | 24.31 | |
| | See accompanying notes which are an integral part of these financial statements. | 27 |
Fuller & Thaler Funds
Statements of Operations
For the six months ended March 31, 2019 (Unaudited)
| | | Fuller & Thaler
Behavioral
Small-Cap
Equity Fund | | | Fuller & Thaler
Behavioral
Small-Cap
Growth Fund | | | Fuller & Thaler
Behavioral
Mid-Cap
Value Fund | |
Investment Income: | | | | | | | | | | | | |
Dividend income | | $ | 10,922,736 | | | $ | 17,787 | | | $ | 125,409 | |
Interest income | | | 210,736 | | | | 5,710 | | | | 4,202 | |
Total investment income | | | 11,133,472 | | | | 23,497 | | | | 129,611 | |
Expenses: | | | | | | | | | | | | |
Investment Adviser | | | 3,192,870 | | | | 45,527 | | | | 50,462 | |
Administrative Services - Institutional Shares | | | 438,348 | | | | 1,926 | | | | 4,906 | |
Administration | | | 230,472 | | | | 10,681 | | | | 10,392 | |
12b-1 fees- Investor Shares | | | 149,623 | | | | 421 | | | | 851 | |
Registration | | | 91,663 | | | | 13,326 | | | | 14,191 | |
Administrative Services - Investor Shares | | | 79,317 | | | | 214 | | | | 417 | |
Fund accounting | | | 77,869 | | | | 6,205 | | | | 6,205 | |
Transfer agent | | | 49,467 | | | | 6,497 | | | | 8,161 | |
Custodian | | | 33,989 | | | | 3,264 | | | | 2,197 | |
Report printing | | | 33,527 | | | | 1,020 | | | | 1,192 | |
Audit and tax preparation | | | 10,961 | | | | 10,875 | | | | 10,875 | |
Trustee | | | 8,459 | | | | 8,458 | | | | 8,459 | |
Interest | | | 8,188 | | | | 1,254 | | | | — | |
Legal | | | 7,207 | | | | 7,206 | | | | 6,523 | |
Pricing | | | 1,403 | | | | 557 | | | | 740 | |
12b-1 fees- C Shares(a) | | | 93 | | | | 7 | | | | — | |
12b-1 fees- A Shares(a) | | | 23 | | | | 2 | | | | — | |
Offering | | | — | | | | 2,551 | | | | 2,551 | |
Miscellaneous | | | 33,590 | | | | 9,603 | | | | 8,896 | |
Total expenses | | | 4,447,069 | | | | 129,594 | | | | 137,018 | |
Fees contractually waived and expenses reimbursed by Adviser | | | — | | | | (76,017 | ) | | | (77,286 | ) |
Net operating expenses | | | 4,447,069 | | | | 53,577 | | | | 59,732 | |
Net investment income (loss) | | | 6,686,403 | | | | (30,080 | ) | | | 69,879 | |
Net Realized and Change in Unrealized Gain (Loss) on Investments | | | | | | | | | | | | |
Net realized loss on investment securities transactions | | | (25,326,422 | ) | | | (783,893 | ) | | | (27,543 | ) |
Net change in unrealized depreciation of investment securities | | | (91,222,785 | ) | | | (712,210 | ) | | | (242,760 | ) |
Net realized and change in unrealized loss on investments | | | (116,549,207 | ) | | | (1,496,103 | ) | | | (270,303 | ) |
Net decrease in net assets resulting from operations | | $ | (109,862,804 | ) | | $ | (1,526,183 | ) | | $ | (200,424 | ) |
(a) | For the period December 19, 2018 (commencement of operations) to March 31, 2019. |
28 | See accompanying notes which are an integral part of these financial statements. | |
Fuller & Thaler Funds
Statements of Operations (continued)
For the period ended March 31, 2019 (Unaudited)
| | | Fuller & Thaler
Behavioral
Unconstrained
Equity Fund(a) | | | Fuller & Thaler
Behavioral
Small–Mid Core
Equity Fund(a) | | | Fuller & Thaler
Behavioral
Micro-Cap
Equity Fund(b) | |
Investment Income: | | | | | | | | | | | | |
Dividend income | | $ | 9,880 | | | $ | 8,994 | | | $ | 4,944 | |
Interest income | | | 785 | | | | 761 | | | | 599 | |
Total investment income | | | 10,665 | | | | 9,755 | | | | 5,543 | |
Expenses: | | | | | | | | | | | | |
Organizational | | | 8,500 | | | | 8,500 | | | | 8,500 | |
Audit and tax preparation | | | 6,886 | | | | 6,886 | | | | 6,692 | |
Investment Adviser | | | 5,753 | | | | 3,589 | | | | 11,080 | |
Trustee | | | 4,242 | | | | 4,242 | | | | 4,117 | |
Administration | | | 3,304 | | | | 3,302 | | | | 3,297 | |
Legal | | | 3,234 | | | | 3,234 | | | | 3,105 | |
Offering | | | 3,164 | | | | 3,163 | | | | 3,020 | |
Report printing | | | 712 | | | | 712 | | | | 660 | |
Transfer agent | | | 657 | | | | 660 | | | | 539 | |
Fund accounting | | | 652 | | | | 651 | | | | 648 | |
Custodian | | | 648 | | | | 630 | | | | 539 | |
Registration | | | 389 | | | | 389 | | | | 367 | |
Pricing | | | 317 | | | | 317 | | | | 178 | |
Administrative Services - Institutional Shares | | | 5 | | | | 6 | | | | 7 | |
Miscellaneous | | | 3,753 | | | | 3,499 | | | | 3,296 | |
Total expenses | | | 42,216 | | | | 39,780 | | | | 46,045 | |
Fees contractually waived and expenses reimbursed by Adviser | | | (35,967 | ) | | | (35,514 | ) | | | (33,092 | ) |
Net operating expenses | | | 6,249 | | | | 4,266 | | | | 12,953 | |
Net investment income (loss) | | | 4,416 | | | | 5,489 | | | | (7,410 | ) |
Net Realized and Change in Unrealized Gain (Loss) on Investments | | | | | | | | | | | | |
Net realized gain on investment securities transactions | | | — | | | | 19,851 | | | | 72,423 | |
Net change in unrealized appreciation of investment securities | | | 388,720 | | | | 157,627 | | | | 481,463 | |
Net realized and change in unrealized gain on investments | | | 388,720 | | | | 177,478 | | | | 553,886 | |
Net increase in net assets resulting from operations | | $ | 393,136 | | | $ | 182,967 | | | $ | 546,476 | |
(a) | For the period December 26, 2018 (commencement of operations) to March 31, 2019. |
(b) | For the period December 28, 2018 (commencement of operations) to March 31, 2019. |
| | See accompanying notes which are an integral part of these financial statements. | 29 |
Fuller & Thaler Funds
Statements of Changes in Net Assets
| | | Fuller & Thaler Behavioral
Small-Cap Equity Fund | |
| | For the Six
Months Ended
March 31, 2019
(Unaudited) | | | For the
Year Ended
September 30,
2018 | |
Increase (Decrease) in Net Assets due to: | | | | | | | | |
Operations | | | | | | | | |
Net investment income | | $ | 6,686,403 | | | $ | 3,527,469 | |
Net realized loss on investment securities transactions | | | (25,326,422 | ) | | | (4,567,832 | ) |
Net change in unrealized appreciation (depreciation) of investment securities | | | (91,222,785 | ) | | | 65,964,173 | |
Net increase (decrease) in net assets resulting from operations | | | (109,862,804 | ) | | | 64,923,810 | |
Distributions to Shareholders from Earnings: | | | | | | | | |
R6 Shares | | | (345,172 | ) | | | (14,523 | ) |
Institutional Shares | | | (4,169,332 | ) | | | (689,675 | ) |
Investor Shares | | | (240,135 | ) | | | (79,066 | ) |
Total distributions | | | (4,754,639 | ) | | | (783,264 | ) |
Capital Transactions: | | | | | | | | |
R6 Shares: | | | | | | | | |
Proceeds from shares sold | | | 78,561,583 | | | | 52,389,519 | |
Reinvestment of distributions | | | 82,247 | | | | 14,523 | |
Amount paid for shares redeemed | | | (24,863,841 | ) | | | (3,549,671 | ) |
Total R6 Shares | | | 53,779,989 | | | | 48,854,371 | |
Institutional Shares: | | | | | | | | |
Proceeds from shares sold | | | 492,210,101 | | | | 793,552,447 | |
Reinvestment of distributions | | | 3,701,007 | | | | 580,420 | |
Amount paid for shares redeemed | | | (269,493,946 | ) | | | (100,901,596 | ) |
Total Institutional Shares | | | 226,417,162 | | | | 693,231,271 | |
Investor Shares: | | | | | | | | |
Proceeds from shares sold | | | 25,737,023 | | | | 118,880,389 | |
Reinvestment of distributions | | | 209,986 | | | | 66,724 | |
Amount paid for shares redeemed | | | (37,885,886 | ) | | | (41,736,564 | ) |
Total Investor Shares | | | (11,938,877 | ) | | | 77,210,549 | |
A Shares(a): | | | | | | | | |
Proceeds from shares sold | | | 40,025 | | | | | |
Reinvestment of distributions | | | — | | | | | |
Amount paid for shares redeemed | | | — | | | | | |
Total A Shares | | | 40,025 | | | | | |
C Shares(a): | | | | | | | | |
Proceeds from shares sold | | | 143,513 | | | | | |
Reinvestment of distributions | | | — | | | | | |
Amount paid for shares redeemed | | | — | | | | | |
Total C Shares | | | 143,513 | | | | | |
Net increase in net assets resulting from capital transactions | | | 268,441,812 | | | | 819,296,191 | |
Total Increase in Net Assets | | | 153,824,369 | | | | 883,436,737 | |
30 | See accompanying notes which are an integral part of these financial statements. | |
Fuller & Thaler Funds
Statements of Changes in Net Assets (continued)
| | | Fuller & Thaler Behavioral
Small-Cap Equity Fund | |
| | For the Six
Months Ended
March 31, 2019
(Unaudited) | | | For the
Year Ended
September 30,
2018 | |
Net Assets | | | | | | | | |
Beginning of period | | $ | 1,115,913,728 | | | $ | 232,476,991 | |
End of period | | $ | 1,269,738,097 | | | $ | 1,115,913,728 | |
Share Transactions: | | | | | | | | |
R6 Shares: | | | | | | | | |
Shares sold | | | 3,418,349 | | | | 2,040,985 | |
Shares issued in reinvestment of distributions | | | 3,706 | | | | 588 | |
Shares redeemed | | | (1,098,276 | ) | | | (134,335 | ) |
Total R6 Shares | | | 2,323,779 | | | | 1,907,238 | |
Institutional Shares: | | | | | | | | |
Shares sold | | | 20,946,792 | | | | 31,347,924 | |
Shares issued in reinvestment of distributions | | | 168,075 | | | | 23,782 | |
Shares redeemed | | | (11,953,888 | ) | | | (4,029,103 | ) |
Total Institutional Shares | | | 9,160,979 | | | | 27,342,603 | |
Investor Shares: | | | | | | | | |
Shares sold | | | 1,104,109 | | | | 4,790,070 | |
Shares issued in reinvestment of distributions | | | 9,575 | | | | 2,736 | |
Shares redeemed | | | (1,673,874 | ) | | | (1,660,712 | ) |
Total Investor Shares | | | (560,190 | ) | | | 3,132,094 | |
A Shares(a): | | | | | | | | |
Shares sold | | | 1,848 | | | | | |
Shares issued in reinvestment of distributions | | | — | | | | | |
Shares redeemed | | | — | | | | | |
Total A Shares | | | 1,848 | | | | | |
C Shares(a): | | | | | | | | |
Shares sold | | | 6,199 | | | | | |
Shares issued in reinvestment of distributions | | | — | | | | | |
Shares redeemed | | | — | | | | | |
Total C Shares | | | 6,199 | | | | | |
| | See accompanying notes which are an integral part of these financial statements. | 31 |
Fuller & Thaler Funds
Statements of Changes in Net Assets (continued)
| | | Fuller & Thaler Behavioral
Small-Cap Growth Fund | |
| | For the Six
Months Ended
March 31, 2019
(Unaudited) | | | For the
Period Ended
September 30,
2018(b) | |
Increase (Decrease) in Net Assets due to: | | | | | | | | |
Operations | | | | | | | | |
Net investment loss | | $ | (30,080 | ) | | $ | (30,354 | ) |
Net realized loss on investment securities transactions | | | (783,893 | ) | | | (232,539 | ) |
Net change in unrealized appreciation (depreciation) of investment securities | | | (712,210 | ) | | | 1,983,410 | |
Net increase (decrease) in net assets resulting from operations | | | (1,526,183 | ) | | | 1,720,517 | |
Capital Transactions: | | | | | | | | |
R6 Shares: | | | | | | | | |
Proceeds from shares sold | | | 18,500 | | | | 3,231,018 | |
Reinvestment of distributions | | | — | | | | — | |
Amount paid for shares redeemed | | | (258,828 | ) | | | (1,040,070 | ) |
Total R6 Shares | | | (240,328 | ) | | | 2,190,948 | |
Institutional Shares: | | | | | | | | |
Proceeds from shares sold | | | 8,135,897 | | | | 9,023,606 | |
Reinvestment of distributions | | | — | | | | — | |
Amount paid for shares redeemed | | | (4,516,814 | ) | | | (657,514 | ) |
Total Institutional Shares | | | 3,619,083 | | | | 8,366,092 | |
Investor Shares: | | | | | | | | |
Proceeds from shares sold | | | 161,797 | | | | 464,219 | |
Reinvestment of distributions | | | — | | | | — | |
Amount paid for shares redeemed | | | (321,004 | ) | | | (11,289 | ) |
Total Investor Shares | | | (159,207 | ) | | | 452,930 | |
A Shares(a): | | | | | | | | |
Proceeds from shares sold | | | 4,019 | | | | | |
Reinvestment of distributions | | | — | | | | | |
Amount paid for shares redeemed | | | — | | | | | |
Total A Shares | | | 4,019 | | | | | |
C Shares(a): | | | | | | | | |
Proceeds from shares sold | | | 2,535 | | | | | |
Reinvestment of distributions | | | — | | | | | |
Amount paid for shares redeemed | | | — | | | | | |
Total C Shares | | | 2,535 | | | | | |
Net increase in net assets resulting from capital transactions | | | 3,226,102 | | | | 11,009,970 | |
Total Increase in Net Assets | | | 1,699,919 | | | | 12,730,487 | |
Net Assets | | | | | | | | |
Beginning of period | | | 12,730,487 | | | | — | |
End of period | | $ | 14,430,406 | | | $ | 12,730,487 | |
32 | See accompanying notes which are an integral part of these financial statements. | |
Fuller & Thaler Funds
Statements of Changes in Net Assets (continued)
| | | Fuller & Thaler Behavioral
Small-Cap Growth Fund | |
| | For the Six
Months Ended
March 31, 2019
(Unaudited) | | | For the
Period Ended
September 30,
2018(b) | |
Share Transactions: | | | | | | | | |
R6 Shares: | | | | | | | | |
Shares sold | | | 812 | | | | 161,053 | |
Shares issued in reinvestment of distributions | | | — | | | | — | |
Shares redeemed | | | (11,000 | ) | | | (50,004 | ) |
Total R6 Shares | | | (10,188 | ) | | | 111,049 | |
Institutional Shares: | | | | | | | | |
Shares sold | | | 374,704 | | | | 369,518 | |
Shares issued in reinvestment of distributions | | | — | | | | — | |
Shares redeemed | | | (185,736 | ) | | | (25,814 | ) |
Total Institutional Shares | | | 188,968 | | | | 343,704 | |
Investor Shares: | | | | | | | | |
Shares sold | | | 7,033 | | | | 18,360 | |
Shares issued in reinvestment of distributions | | | — | | | | — | |
Shares redeemed | | | (14,911 | ) | | | (464 | ) |
Total Investor Shares | | | (7,878 | ) | | | 17,896 | |
A Shares(a): | | | | | | | | |
Shares sold | | | 192 | | | | | |
Shares issued in reinvestment of distributions | | | — | | | | | |
Shares redeemed | | | — | | | | | |
Total A Shares | | | 192 | | | | | |
C Shares(a): | | | | | | | | |
Shares sold | | | 126 | | | | | |
Shares issued in reinvestment of distributions | | | — | | | | | |
Shares redeemed | | | — | | | | | |
Total C Shares | | | 126 | | | | | |
| | See accompanying notes which are an integral part of these financial statements. | 33 |
Fuller & Thaler Funds
Statements of Changes in Net Assets (continued)
| | | Fuller & Thaler Behavioral
Mid-Cap Value Fund | |
| | For the Six
Months Ended
March 31, 2019
(Unaudited) | | | For the
Period Ended
September 30,
2018(b) | |
Increase (Decrease) in Net Assets due to: | | | | | | | | |
Operations | | | | | | | | |
Net investment income | | $ | 69,879 | | | $ | 41,013 | |
Net realized gain (loss) on investment securities transactions | | | (27,543 | ) | | | 9,512 | |
Net change in unrealized appreciation (depreciation) of investment securities | | | (242,760 | ) | | | 252,829 | |
Net increase (decrease) in net assets resulting from operations | | | (200,424 | ) | | | 303,354 | |
Distributions to Shareholders from Earnings: | | | | | | | | |
R6 Shares | | | (14,741 | ) | | | — | |
Institutional Shares | | | (65,069 | ) | | | — | |
Investor Shares | | | (2,158 | ) | | | — | |
Total distributions | | | (81,968 | ) | | | — | |
Capital Transactions: | | | | | | | | |
R6 Shares: | | | | | | | | |
Proceeds from shares sold | | | 47,794 | | | | 3,293,787 | |
Reinvestment of distributions | | | 14,741 | | | | — | |
Amount paid for shares redeemed | | | (127,299 | ) | | | (995,571 | ) |
Total R6 Shares | | | (64,764 | ) | | | 2,298,216 | |
Institutional Shares: | | | | | | | | |
Proceeds from shares sold | | | 2,927,847 | | | | 10,465,676 | |
Reinvestment of distributions | | | 65,069 | | | | — | |
Amount paid for shares redeemed | | | (1,112,366 | ) | | | (77,002 | ) |
Total Institutional Shares | | | 1,880,550 | | | | 10,388,674 | |
Investor Shares: | | | | | | | | |
Proceeds from shares sold | | | 976,422 | | | | 376,162 | |
Reinvestment of distributions | | | 2,158 | | | | — | |
Amount paid for shares redeemed | | | (265,086 | ) | | | (39,906 | ) |
Total Investor Shares | | | 713,494 | | | | 336,256 | |
Net increase in net assets resulting from capital transactions | | | 2,529,280 | | | | 13,023,146 | |
Total Increase in Net Assets | | | 2,246,888 | | | | 13,326,500 | |
Net Assets | | | | | | | | |
Beginning of period | | | 13,326,500 | | | | — | |
End of period | | $ | 15,573,388 | | | $ | 13,326,500 | |
34 | See accompanying notes which are an integral part of these financial statements. | |
Fuller & Thaler Funds
Statements of Changes in Net Assets (continued)
| | | Fuller & Thaler Behavioral
Mid-Cap Value Fund | |
| | For the Six
Months Ended
March 31, 2019
(Unaudited) | | | For the
Period Ended
September 30,
2018(b) | |
Share Transactions: | | | | | | | | |
R6 Shares: | | | | | | | | |
Shares sold | | | 2,437 | | | | 164,813 | |
Shares issued in reinvestment of distributions | | | 782 | | | | — | |
Shares redeemed | | | (6,544 | ) | | | (50,004 | ) |
Total R6 Shares | | | (3,325 | ) | | | 114,809 | |
Institutional Shares: | | | | | | | | |
Shares sold | | | 149,770 | | | | 520,459 | |
Shares issued in reinvestment of distributions | | | 3,454 | | | | — | |
Shares redeemed | | | (58,010 | ) | | | (3,756 | ) |
Total Institutional Shares | | | 95,214 | | | | 516,703 | |
Investor Shares: | | | | | | | | |
Shares sold | | | 50,484 | | | | 18,784 | |
Shares issued in reinvestment of distributions | | | 115 | | | | — | |
Shares redeemed | | | (13,533 | ) | | | (1,981 | ) |
Total Investor Shares | | | 37,066 | | | | 16,803 | |
| | See accompanying notes which are an integral part of these financial statements. | 35 |
Fuller & Thaler Funds
Statements of Changes in Net Assets (continued)
| | | Fuller & Thaler
Behavioral
Unconstrained
Equity Fund | | | Fuller & Thaler
Behavioral
Small–Mid Core
Equity Fund | |
| | For the
Period Ended
March 31, 2019(c)
(Unaudited) | | | For the
Period Ended
March 31, 2019(c)
(Unaudited) | |
Increase (Decrease) in Net Assets due to: | | | | | | | | |
Operations | | | | | | | | |
Net investment income | | $ | 4,416 | | | $ | 5,489 | |
Net realized gain on investment securities transactions | | | — | | | | 19,851 | |
Net change in unrealized appreciation of investment securities | | | 388,720 | | | | 157,627 | |
Net increase in net assets resulting from operations | | | 393,136 | | | | 182,967 | |
Capital Transactions: | | | | | | | | |
R6 Shares: | | | | | | | | |
Proceeds from shares sold | | | 2,130,120 | | | | — | |
Reinvestment of distributions | | | — | | | | — | |
Amount paid for shares redeemed | | | (641,135 | ) | | | — | |
Total R6 Shares | | | 1,488,985 | | | | — | |
Institutional Shares: | | | | | | | | |
Proceeds from shares sold | | | 1,705,732 | | | | 2,230,593 | |
Reinvestment of distributions | | | — | | | | — | |
Amount paid for shares redeemed | | | — | | | | — | |
Total Institutional Shares | | | 1,705,732 | | | | 2,230,593 | |
Net increase in net assets resulting from capital transactions | | | 3,194,717 | | | | 2,230,593 | |
Total Increase in Net Assets | | | 3,587,853 | | | | 2,413,560 | |
Net Assets | | | | | | | | |
Beginning of period | | | — | | | | — | |
End of period | | $ | 3,587,853 | | | $ | 2,413,560 | |
Share Transactions: | | | | | | | | |
R6 Shares: | | | | | | | | |
Shares sold | | | 103,860 | | | | — | |
Shares issued in reinvestment of distributions | | | — | | | | — | |
Shares redeemed | | | (26,500 | ) | | | — | |
Total R6 Shares | | | 77,360 | | | | — | |
Institutional Shares: | | | | | | | | |
Shares sold | | | 70,850 | | | | 104,062 | |
Shares issued in reinvestment of distributions | | | — | | | | — | |
Shares redeemed | | | — | | | | — | |
Total Institutional Shares | | | 70,850 | | | | 104,062 | |
36 | See accompanying notes which are an integral part of these financial statements. | |
Fuller & Thaler Funds
Statements of Changes in Net Assets (continued)
| | | Fuller & Thaler
Behavioral
Micro-Cap
Equity Fund | |
| | For the
Period Ended
March 31, 2019(d)
(Unaudited) | |
Increase (Decrease) in Net Assets due to: | | | | |
Operations | | | | |
Net investment loss | | $ | (7,410 | ) |
Net realized gain on investment securities transactions | | | 72,423 | |
Net change in unrealized appreciation of investment securities | | | 481,463 | |
Net increase in net assets resulting from operations | | | 546,476 | |
Capital Transactions: | | | | |
Institutional Shares: | | | | |
Proceeds from shares sold | | | 2,536,269 | |
Reinvestment of distributions | | | — | |
Amount paid for shares redeemed | | | — | |
Total Institutional Shares | | | 2,536,269 | |
Net increase in net assets resulting from capital transactions | | | 2,536,269 | |
Total Increase in Net Assets | | | 3,082,745 | |
Net Assets | | | | |
Beginning of period | | | — | |
End of period | | $ | 3,082,745 | |
Share Transactions: | | | | |
Institutional Shares: | | | | |
Shares sold | | | 126,805 | |
Shares issued in reinvestment of distributions | | | — | |
Shares redeemed | | | — | |
Total Institutional Shares | | | 126,805 | |
(a) | For the period December 19, 2018 (commencement of operations) to March 31, 2019. |
(b) | For the period December 21, 2017 (commencement of operations) to September 30, 2018. |
(c) | For the period December 26, 2018 (commencement of operations) to March 31, 2019. |
(d) | For the period December 28, 2018 (commencement of operations) to March 31, 2019. |
| | See accompanying notes which are an integral part of these financial statements. | 37 |
Fuller & Thaler Behavioral Small-Cap Equity Fund – R6 Shares
Financial Highlights
Selected data for a share outstanding throughout each period.
| | | For the
Six Months
Ended
March 31,
2019 | | | Years Ended
September 30, | | | Period
Ended
September
30, | | | Years Ended
November 30, | |
| | | (unaudited) | | | 2018 | | | 2017 | | | 2016 | | | 2015(a) | | | 2014 | | | 2013 | |
Net asset value, at beginning of period | | $ | 26.76 | | | $ | 24.25 | | | $ | 18.97 | | | $ | 18.84 | | | $ | 25.83 | | | $ | 23.74 | | | $ | 19.10 | |
Income from investment operations: | | | | | | | | | | | | | | | | | | | | | | | | | | | | |
Net investment income(b) | | | 0.17 | | | | 0.18 | | | | 0.18 | | | | 0.25 | | | | 0.25 | | | | 0.31 | | | | 0.30 | |
Net realized and unrealized gain (loss) on investments | | | (2.65 | ) | | | 2.40 | | | | 5.19 | | | | 2.42 | | | | (0.96 | ) | | | 2.81 | | | | 5.73 | |
Total from investment operations | | | (2.48 | ) | | | 2.58 | | | | 5.37 | | | | 2.67 | | | | (0.71 | ) | | | 3.12 | | | | 6.03 | |
Distributions from: | | | | | | | | | | | | | | | | | | | | | | | | | | | | |
Net investment income | | | (0.14 | ) | | | (0.07 | ) | | | (0.09 | ) | | | (0.28 | ) | | | (0.42 | ) | | | (0.19 | ) | | | (0.30 | ) |
Net realized gain | | | — | | | | — | | | | — | | | | (2.26 | ) | | | (5.86 | ) | | | (0.84 | ) | | | (1.09 | ) |
Total from distributions | | | (0.14 | ) | | | (0.07 | ) | | | (0.09 | ) | | | (2.54 | ) | | | (6.28 | ) | | | (1.03 | ) | | | (1.39 | ) |
Net asset value, at end of period | | $ | 24.14 | | | $ | 26.76 | | | $ | 24.25 | | | $ | 18.97 | | | $ | 18.84 | | | $ | 25.83 | | | $ | 23.74 | |
Total Return(c) | | | (9.24 | )%(d) | | | 10.68 | % | | | 28.35 | % | | | 16.14 | % | | | (4.09 | )%(d) | | | 13.79 | % | | | 34.02 | % |
| | | | | | | | | | | | | | | | | | | | | | | | | | | | | |
Ratios/Supplemental Data: | | | | | | | | | | | | | | | | | | | | | | | | | | | | |
Net assets at end of period (thousands) | | $ | 105,868 | | | $ | 55,160 | | | $ | 3,740 | | | $ | 3,174 | | | $ | 15,677 | | | $ | 74,044 | | | $ | 48,281 | |
Before waiver or recoupment: | | | | | | | | | | | | | | | | | | | | | | | | | | | | |
Ratio of expenses to average net assets | | | 0.71 | %(e) | | | 0.74 | % | | | 1.30 | % | | | 2.65 | % | | | 0.99 | %(e)(f) | | | 0.76 | % | | | 1.05 | % |
After waiver or recoupment: | | | | | | | | | | | | | | | | | | | | | | | | | | | | |
Ratio of expenses to average net assets | | | 0.71 | %(e) | | | 0.76 | % | | | 0.75 | % | | | 0.64 | % | | | 0.55 | %(e)(f) | | | 0.55 | % | | | 0.55 | % |
Ratio of net investment income to average net assets | | | 1.43 | %(e) | | | 0.71 | % | | | 0.81 | % | | | 1.33 | % | | | 1.33 | %(e)(f) | | | 1.29 | % | | | 1.44 | % |
Portfolio turnover(g) | | | 22 | %(d) | | | 35 | % | | | 26 | % | | | 194 | % | | | 108 | %(d) | | | 89 | % | | | 64 | % |
(a) | Fiscal year end changed from November 30th to September 30th. |
(b) | Per share net investment income has been calculated using the average shares method. |
(c) | Total return in the above table represents the rate that the investor would have earned or lost on an investment in the Small-Cap Equity Fund, assuming reinvestment of distributions. |
(f) | Certain expenses incurred by the Small-Cap Equity Fund were not annualized. |
(g) | Portfolio turnover is calculated on the basis on the fund as a whole without distinguishing among the classes of shares. |
38 | See accompanying notes which are an integral part of these financial statements. | |
Fuller & Thaler Behavioral Small-Cap Equity Fund – Institutional Shares
Financial Highlights
Selected data for a share outstanding throughout each period.
| | | For the
Six Months
Ended
March 31,
2019 | | | Years Ended
September 30, | | | Period
Ended
September
30, | | | Years Ended
November 30, | |
| | | (unaudited) | | | 2018 | | | 2017 | | | 2016 | | | 2015(a) | | | 2014 | | | 2013 | |
Net asset value, at beginning of period | | $ | 26.55 | | | $ | 24.07 | | | $ | 18.85 | | | $ | 18.77 | | | $ | 25.84 | | | $ | 23.74 | | | $ | 19.09 | |
Income from investment operations: | | | | | | | | | | | | | | | | | | | | | | | | | | | | |
Net investment income(b) | | | 0.15 | | | | 0.15 | | | | 0.20 | | | | 0.23 | | | | 0.23 | | | | 0.31 | | | | 0.29 | |
Net realized and unrealized gain (loss) on investments | | | (2.62 | ) | | | 2.39 | | | | 5.11 | | | | 2.38 | | | | (0.97 | ) | | | 2.78 | | | | 5.71 | |
Total from investment operations | | | (2.47 | ) | | | 2.54 | | | | 5.31 | | | | 2.61 | | | | (0.74 | ) | | | 3.09 | | | | 6.00 | |
Distributions from: | | | | | | | | | | | | | | | | | | | | | | | | | | | | |
Net investment income | | | (0.12 | ) | | | (0.06 | ) | | | (0.09 | ) | | | (0.27 | ) | | | (0.47 | ) | | | (0.15 | ) | | | (0.26 | ) |
Net realized gain | | | — | | | | — | | | | — | | | | (2.26 | ) | | | (5.86 | ) | | | (0.84 | ) | | | (1.09 | ) |
Total from distributions | | | (0.12 | ) | | | (0.06 | ) | | | (0.09 | ) | | | (2.53 | ) | | | (6.33 | ) | | | (0.99 | ) | | | (1.35 | ) |
Net asset value, at end of period | | $ | 23.96 | | | $ | 26.55 | | | $ | 24.07 | | | $ | 18.85 | | | $ | 18.77 | | | $ | 25.84 | | | $ | 23.74 | |
Total Return(c) | | | (9.27 | )%(d) | | | 10.59 | % | | | 28.20 | % | | | 15.86 | % | | | (4.21 | )%(d) | | | 13.64 | % | | | 33.83 | % |
| | | | | | | | | | | | | | | | | | | | | | | | | | | | | |
Ratios/Supplemental Data: | | | | | | | | | | | | | | | | | | | | | | | | | | | | |
Net assets at end of period (thousands) | | $ | 1,046,055 | | | $ | 915,898 | | | $ | 172,238 | | | $ | 2,113 | | | $ | 100 | | | $ | 117 | | | $ | 17 | |
Before waiver or recoupment: | | | | | | | | | | | | | | | | | | | | | | | | | | | | |
Ratio of expenses to average net assets | | | 0.81 | %(e) | | | 0.84 | % | | | 1.39 | % | | | 2.75 | % | | | 1.23 | %(e)(f) | | | 0.81 | % | | | 1.20 | % |
After waiver or recoupment: | | | | | | | | | | | | | | | | | | | | | | | | | | | | |
Ratio of expenses to average net assets | | | 0.81 | %(e) | | | 0.86 | % | | | 0.85 | % | | | 0.74 | % | | | 0.65 | %(e)(f) | | | 0.65 | % | | | 0.65 | % |
Ratio of net investment income to average net assets | | | 1.28 | %(e) | | | 0.59 | % | | | 0.90 | % | | | 1.70 | % | | | 1.25 | %(e)(f) | | | 1.29 | % | | | 1.42 | % |
Portfolio turnover(g) | | | 22 | %(d) | | | 35 | % | | | 26 | % | | | 194 | % | | | 108 | %(d) | | | 89 | % | | | 64 | % |
(a) | Fiscal year end changed from November 30th to September 30th. |
(b) | Per share net investment income has been calculated using the average shares method. |
(c) | Total return in the above table represents the rate that the investor would have earned or lost on an investment in the Small-Cap Equity Fund, assuming reinvestment of distributions. |
(f) | Certain expenses incurred by the Small-Cap Equity Fund were not annualized. |
(g) | Portfolio turnover is calculated on the basis on the fund as a whole without distinguishing among the classes of shares. |
| | See accompanying notes which are an integral part of these financial statements. | 39 |
Fuller & Thaler Behavioral Small-Cap Equity Fund – Investor Shares
Financial Highlights
Selected data for a share outstanding throughout each period.
| | | For the
Six Months
Ended
March 31,
2019 | | | Years Ended
September 30, | | | Period
Ended
September
30, | | | Years Ended
November 30, | |
| | | (unaudited) | | | 2018 | | | 2017 | | | 2016 | | | 2015(a) | | | 2014 | | | 2013 | |
Net asset value, at beginning of period | | $ | 26.36 | | | $ | 23.91 | | | $ | 18.75 | | | $ | 18.70 | | | $ | 25.67 | | | $ | 23.72 | | | $ | 19.04 | |
Income from investment operations: | | | | | | | | | | | | | | | | | | | | | | | | | | | | |
Net investment income(b) | | | 0.12 | | | | 0.08 | | | | 0.15 | | | | 0.20 | | | | 0.20 | | | | 0.24 | | | | 0.24 | |
Net realized and unrealized gain (loss) on investments | | | (2.59 | ) | | | 2.39 | | | | 5.09 | | | | 2.38 | | | | (0.96 | ) | | | 2.79 | | | | 5.73 | |
Total from investment operations | | | (2.47 | ) | | | 2.47 | | | | 5.24 | | | | 2.58 | | | | (0.76 | ) | | | 3.03 | | | | 5.97 | |
Distributions from: | | | | | | | | | | | | | | | | | | | | | | | | | | | | |
Net investment income | | | (0.05 | ) | | | (0.02 | ) | | | (0.08 | ) | | | (0.27 | ) | | | (0.35 | ) | | | (0.24 | ) | | | (0.20 | ) |
Net realized gain | | | — | | | | — | | | | — | | | | (2.26 | ) | | | (5.86 | ) | | | (0.84 | ) | | | (1.09 | ) |
Total from distributions | | | (0.05 | ) | | | (0.02 | ) | | | (0.08 | ) | | | (2.53 | ) | | | (6.21 | ) | | | (1.08 | ) | | | (1.29 | ) |
Net asset value, at end of period | | $ | 23.84 | | | $ | 26.36 | | | $ | 23.91 | | | $ | 18.75 | | | $ | 18.70 | | | $ | 25.67 | | | $ | 23.72 | |
Total Return(c) | | | (9.37 | )%(d) | | | 10.35 | % | | | 27.97 | % | | | 15.74 | % | | | (4.33 | )%(d) | | | 13.43 | % | | | 33.61 | % |
| | | | | | | | | | | | | | | | | | | | | | | | | | | | | |
Ratios/Supplemental Data: | | | | | | | | | | | | | | | | | | | | | | | | | | | | |
Net assets at end of period (thousands) | | $ | 117,624 | | | $ | 144,856 | | | $ | 56,500 | | | $ | 4,319 | | | $ | 853 | | | $ | 10,023 | | | $ | 8,607 | |
Before waiver: | | | | | | | | | | | | | | | | | | | | | | | | | | | | |
Ratio of expenses to average net assets | | | 1.09 | %(e) | | | 1.13 | % | | | 1.65 | % | | | 2.90 | % | | | 1.27 | %(e)(f) | | | 1.02 | % | | | 1.25 | % |
After waiver: | | | | | | | | | | | | | | | | | | | | | | | | | | | | |
Ratio of expenses to average net assets | | | 1.09 | %(e) | | | 1.10 | % | | | 1.00 | % | | | 0.89 | % | | | 0.81 | %(e)(f) | | | 0.82 | % | | | 0.83 | % |
Ratio of net investment income to average net assets | | | 1.01 | %(e) | | | 0.32 | % | | | 0.70 | % | | | 1.32 | % | | | 1.11 | %(e)(f) | | | 1.02 | % | | | 1.09 | % |
Portfolio turnover(g) | | | 22 | %(d) | | | 35 | % | | | 26 | % | | | 194 | % | | | 108 | %(d) | | | 89 | % | | | 64 | % |
(a) | Fiscal year end changed from November 30th to September 30th. |
(b) | Per share net investment income has been calculated using the average shares method. |
(c) | Total return in the above table represents the rate that the investor would have earned or lost on an investment in the Small-Cap Equity Fund, assuming reinvestment of distributions. |
(f) | Certain expenses incurred by the Small-Cap Equity Fund were not annualized. |
(g) | Portfolio turnover is calculated on the basis on the fund as a whole without distinguishing among the classes of shares. |
40 | See accompanying notes which are an integral part of these financial statements. | |
Fuller & Thaler Behavioral Small-Cap Equity Fund – A Shares
Financial Highlights
Selected data for a share outstanding throughout the period.
| | | For the
Period Ended
March 31,
2019(a)
(unaudited) | |
Net asset value, at beginning of period | | $ | 20.99 | |
Income from investment operations: | | | | |
Net investment income | | | 0.12 | |
Net realized and unrealized gain on investments | | | 2.74 | |
Total from investment operations | | | 2.86 | |
Net asset value, at end of period | | $ | 23.85 | |
Total Return(b) | | | 13.63 | %(c) |
| | | | | |
Ratios/Supplemental Data: | | | | |
Net assets at end of period (thousands) | | $ | 44 | |
Before waiver or recoupment: | | | | |
Ratio of expenses to average net assets | | | 0.97 | %(d) |
After waiver or recoupment: | | | | |
Ratio of expenses to average net assets | | | 0.97 | %(d) |
Ratio of net investment income to average net assets | | | 1.80 | %(d) |
Portfolio turnover(e) | | | 22 | %(c) |
(a) | For the period December 19, 2018 (commencement of operations) through March 31, 2019. |
(b) | Total return in the above table represents the rate that the investor would have earned or lost on an investment in the Small-Cap Equity Fund, assuming reinvestment of distributions and excludes any sales charge. |
(e) | Portfolio turnover is calculated on the basis on the fund as a whole without distinguishing among the classes of shares. |
| | See accompanying notes which are an integral part of these financial statements. | 41 |
Fuller & Thaler Behavioral Small-Cap Equity Fund – C Shares
Financial Highlights
Selected data for a share outstanding throughout the period.
| | | For the
Period Ended
March 31,
2019(a)
(unaudited) | |
Net asset value, at beginning of period | | $ | 20.99 | |
Income from investment operations: | | | | |
Net investment income | | | 0.07 | |
Net realized and unrealized gain on investments | | | 2.74 | |
Total from investment operations | | | 2.81 | |
Net asset value, at end of period | | $ | 23.80 | |
Total Return(b) | | | 13.39 | %(c) |
| | | | | |
Ratios/Supplemental Data: | | | | |
Net assets at end of period (thousands) | | $ | 148 | |
Before waiver or recoupment: | | | | |
Ratio of expenses to average net assets | | | 1.72 | %(d) |
After waiver or recoupment: | | | | |
Ratio of expenses to average net assets | | | 1.72 | %(d) |
Ratio of net investment income to average net assets | | | 1.06 | %(d) |
Portfolio turnover(e) | | | 22 | %(c) |
(a) | For the period December 19, 2018 (commencement of operations) through March 31, 2019. |
(b) | Total return in the above table represents the rate that the investor would have earned or lost on an investment in the Small-Cap Equity Fund, assuming reinvestment of distributions and excludes any sales charge. |
(e) | Portfolio turnover is calculated on the basis on the fund as a whole without distinguishing among the classes of shares. |
42 | See accompanying notes which are an integral part of these financial statements. | |
Fuller & Thaler Behavioral Small-Cap Growth Fund - R6 Shares
Financial Highlights
Selected data for a share outstanding throughout each period.
| | | For the
Six Months
Ended
March 31,
2019
(unaudited) | | | For the
Period Ended
September 30,
2018(a) | |
Net asset value, at beginning of period | | $ | 26.95 | | | $ | 20.00 | |
Income from investment operations: | | | | | | | | |
Net investment loss(b) | | | (0.06 | ) | | | (0.11 | ) |
Net realized and unrealized gain (loss) on investments | | | (4.46 | ) | | | 7.06 | |
Total from investment operations | | | (4.52 | ) | | | 6.95 | |
Net asset value, at end of period | | $ | 22.43 | | | $ | 26.95 | |
Total Return(c) | | | (16.77 | )%(d) | | | 34.75 | %(d) |
| | | | | | | | | |
Ratios/Supplemental Data: | | | | | | | | |
Net assets at end of period (thousands) | | $ | 2,263 | | | $ | 2,993 | |
Before waiver: | | | | | | | | |
Ratio of expenses to average net assets | | | 2.58 | %(e)(f) | | | 4.42 | %(e) |
After waiver: | | | | | | | | |
Ratio of expenses to average net assets | | | 0.93 | %(e)(f) | | | 0.90 | %(e) |
Ratio of net investment loss to average net assets | | | (0.54 | )%(e) | | | (0.60 | )%(e) |
Portfolio turnover(g) | | | 76 | %(d) | | | 71 | %(d) |
(a) | For the period December 21, 2017 (commencement of operations) through September 30, 2018. |
(b) | Per share net investment income has been calculated using the average shares method. |
(c) | Total return in the above table represents the rate that the investor would have earned or lost on an investment in the Small-Cap Growth Fund, assuming reinvestment of distributions. |
(f) | Includes interest expense of 0.03% for the six months ended March 31, 2019. |
(g) | Portfolio turnover is calculated on the basis on the fund as a whole without distinguishing among the classes of shares. |
| | See accompanying notes which are an integral part of these financial statements. | 43 |
Fuller & Thaler Behavioral Small-Cap Growth Fund - Institutional Shares
Financial Highlights
Selected data for a share outstanding throughout each period.
| | | For the
Six Months
Ended
March 31,
2019
(unaudited) | | | For the
Period Ended
September 30,
2018(a) | |
Net asset value, at beginning of period | | $ | 26.93 | | | $ | 20.00 | |
Income from investment operations: | | | | | | | | |
Net investment loss(b) | | | (0.06 | ) | | | (0.14 | ) |
Net realized and unrealized gain (loss) on investments | | | (4.46 | ) | | | 7.07 | |
Total from investment operations | | | (4.52 | ) | | | 6.93 | |
Net asset value, at end of period | | $ | 22.41 | | | $ | 26.93 | |
Total Return(c) | | | (16.78 | )%(d) | | | 34.65 | %(d) |
| | | | | | | | | |
Ratios/Supplemental Data: | | | | | | | | |
Net assets at end of period (thousands) | | $ | 11,937 | | | $ | 9,257 | |
Before waiver: | | | | | | | | |
Ratio of expenses to average net assets | | | 2.62 | %(e)(f) | | | 4.55 | %(e) |
After waiver: | | | | | | | | |
Ratio of expenses to average net assets | | | 1.01 | %(e)(f) | | | 0.99 | %(e) |
Ratio of net investment loss to average net assets | | | (0.56 | )%(e) | | | (0.70 | )%(e) |
Portfolio turnover(g) | | | 76 | %(d) | | | 71 | %(d) |
(a) | For the period December 21, 2017 (commencement of operations) through September 30, 2018. |
(b) | Per share net investment income has been calculated using the average shares method. |
(c) | Total return in the above table represents the rate that the investor would have earned or lost on an investment in the Small-Cap Growth Fund, assuming reinvestment of distributions. |
(f) | Includes interest expense of 0.02% for the six months ended March 31, 2019. |
(g) | Portfolio turnover is calculated on the basis on the fund as a whole without distinguishing among the classes of shares. |
44 | See accompanying notes which are an integral part of these financial statements. | |
Fuller & Thaler Behavioral Small-Cap Growth Fund - Investor Shares
Financial Highlights
Selected data for a share outstanding throughout each period.
| | | For the
Six Months
Ended
March 31,
2019
(unaudited) | | | For the
Period Ended
September 30,
2018(a) | |
Net asset value, at beginning of period | | $ | 26.88 | | | $ | 20.00 | |
Income from investment operations: | | | | | | | | |
Net investment loss(b) | | | (0.10 | ) | | | (0.18 | ) |
Net realized and unrealized gain (loss) on investments | | | (4.44 | ) | | | 7.06 | |
Total from investment operations | | | (4.54 | ) | | | 6.88 | |
Net asset value, at end of period | | $ | 22.34 | | | $ | 26.88 | |
Total Return(c) | | | (16.89 | )%(d) | | | 34.40 | %(d) |
| | | | | | | | | |
Ratios/Supplemental Data: | | | | | | | | |
Net assets at end of period (thousands) | | $ | 224 | | | $ | 481 | |
Before waiver: | | | | | | | | |
Ratio of expenses to average net assets | | | 2.95 | %(e)(f) | | | 4.77 | %(e) |
After waiver: | | | | | | | | |
Ratio of expenses to average net assets | | | 1.28 | %(e)(f) | | | 1.24 | %(e) |
Ratio of net investment loss to average net assets | | | (0.90 | )%(e) | | | (0.92 | )%(e) |
Portfolio turnover(g) | | | 76 | %(d) | | | 71 | %(d) |
(a) | For the period December 21, 2017 (commencement of operations) through September 30, 2018. |
(b) | Per share net investment income has been calculated using the average shares method. |
(c) | Total return in the above table represents the rate that the investor would have earned or lost on an investment in the Small-Cap Growth Fund, assuming reinvestment of distributions. |
(f) | Includes interest expense of 0.03% for the six months ended March 31, 2019. |
(g) | Portfolio turnover is calculated on the basis on the fund as a whole without distinguishing among the classes of shares. |
| | See accompanying notes which are an integral part of these financial statements. | 45 |
Fuller & Thaler Behavioral Small-Cap Growth Fund - A Shares
Financial Highlights
Selected data for a share outstanding throughout the period.
| | | For the
Period Ended
March 31,
2019(a)
(unaudited) | |
Net asset value, at beginning of period | | $ | 19.59 | |
Income from investment operations: | | | | |
Net investment loss(b) | | | (0.04 | ) |
Net realized and unrealized gain on investments | | | 2.79 | |
Total from investment operations | | | 2.75 | |
Net asset value, at end of period | | $ | 22.34 | |
Total Return(c) | | | 14.04 | %(d) |
| | | | | |
Ratios/Supplemental Data: | | | | |
Net assets at end of period (thousands) | | $ | 4 | |
Before waiver: | | | | |
Ratio of expenses to average net assets | | | 2.25 | %(e) |
After waiver: | | | | |
Ratio of expenses to average net assets | | | 1.30 | %(e) |
Ratio of net investment loss to average net assets | | | (0.72 | )%(e) |
Portfolio turnover(f) | | | 76 | %(d) |
(a) | For the period December 19, 2018 (commencement of operations) through March 31, 2019. |
(b) | Per share net investment income has been calculated using the average shares method. |
(c) | Total return in the above table represents the rate that the investor would have earned or lost on an investment in the Small-Cap Growth Fund, assuming reinvestment of distributions and excludes any sales charge. |
(f) | Portfolio turnover is calculated on the basis on the fund as a whole without distinguishing among the classes of shares. |
46 | See accompanying notes which are an integral part of these financial statements. | |
Fuller & Thaler Behavioral Small-Cap Growth Fund - C Shares
Financial Highlights
Selected data for a share outstanding throughout the period.
| | | For the
Period Ended
March 31,
2019(a)
(unaudited) | |
Net asset value, at beginning of period | | $ | 19.59 | |
Income from investment operations: | | | | |
Net investment loss(b) | | | (0.08 | ) |
Net realized and unrealized gain on investments | | | 2.80 | |
Total from investment operations | | | 2.72 | |
Net asset value, at end of period | | $ | 22.31 | |
Total Return(c) | | | 13.88 | %(d) |
| | | | | |
Ratios/Supplemental Data: | | | | |
Net assets at end of period (thousands) | | $ | 3 | |
Before waiver: | | | | |
Ratio of expenses to average net assets | | | 2.99 | %(e) |
After waiver: | | | | |
Ratio of expenses to average net assets | | | 1.80 | %(e) |
Ratio of net investment loss to average net assets | | | (1.25 | )%(e) |
Portfolio turnover(f) | | | 76 | %(d) |
(a) | For the period December 19, 2018 (commencement of operations) through March 31, 2019. |
(b) | Per share net investment income has been calculated using the average shares method. |
(c) | Total return in the above table represents the rate that the investor would have earned or lost on an investment in the Small-Cap Growth Fund, assuming reinvestment of distributions and excludes any sales charge. |
(f) | Portfolio turnover is calculated on the basis on the fund as a whole without distinguishing among the classes of shares. |
| | See accompanying notes which are an integral part of these financial statements. | 47 |
Fuller & Thaler Behavioral Mid-Cap Value Fund - R6 Shares
Financial Highlights
Selected data for a share outstanding throughout each period.
| | | For the
Six Months
Ended
March 31,
2019
(unaudited) | | | For the
Period Ended
September 30,
2018(a) | |
Net asset value, at beginning of period | | $ | 20.56 | | | $ | 20.00 | |
Income from investment operations: | | | | | | | | |
Net investment income(b) | | | 0.11 | | | | 0.13 | |
Net realized and unrealized gain (loss) on investments | | | (0.51 | ) | | | 0.43 | |
Total from investment operations | | | (0.40 | ) | | | 0.56 | |
| | | | | | | | | |
Distributions from: | | | | | | | | |
Net investment income | | | (0.11 | ) | | | — | |
Net realized gain | | | (0.01 | ) | | | — | |
Total from distributions | | | (0.12 | ) | | | — | |
Net asset value, at end of period | | $ | 20.04 | | | $ | 20.56 | |
Total Return(c) | | | (1.87 | )%(d) | | | 2.80 | %(d) |
| | | | | | | | | |
Ratios/Supplemental Data: | | | | | | | | |
Net assets at end of period (thousands) | | $ | 2,235 | | | $ | 2,361 | |
Before waiver: | | | | | | | | |
Ratio of expenses to average net assets | | | 1.96 | %(e) | | | 4.29 | %(e) |
After waiver: | | | | | | | | |
Ratio of expenses to average net assets | | | 0.80 | %(e) | | | 0.80 | %(e) |
Ratio of net investment income to average net assets | | | 1.10 | %(e) | | | 0.82 | %(e) |
Portfolio turnover(f) | | | 6 | %(d) | | | 0.44 | %(d) |
(a) | For the period December 21, 2017 (commencement of operations) through September 30, 2018. |
(b) | Per share net investment income has been calculated using the average shares method. |
(c) | Total return in the above table represents the rate that the investor would have earned or lost on an investment in the Mid-Cap Value Fund, assuming reinvestment of distributions. |
(f) | Portfolio turnover is calculated on the basis on the fund as a whole without distinguishing among the classes of shares. |
48 | See accompanying notes which are an integral part of these financial statements. | |
Fuller & Thaler Behavioral Mid-Cap Value Fund - Institutional Shares
Financial Highlights
Selected data for a share outstanding throughout each period.
| | | For the
Six Months
Ended
March 31,
2019
(unaudited) | | | For the
Period Ended
September 30,
2018(a) | |
Net asset value, at beginning of period | | $ | 20.56 | | | $ | 20.00 | |
Income from investment operations: | | | | | | | | |
Net investment income(b) | | | 0.10 | | | | 0.14 | |
Net realized and unrealized gain (loss) on investments | | | (0.50 | ) | | | 0.42 | |
Total from investment operations | | | (0.40 | ) | | | 0.56 | |
| | | | | | | | | |
Distributions from: | | | | | | | | |
Net investment income | | | (0.11 | ) | | | — | |
Net realized gain | | | (0.01 | ) | | | — | |
Total from distributions | | | (0.12 | ) | | | — | |
Net asset value, at end of period | | $ | 20.04 | | | $ | 20.56 | |
Total Return(c) | | | (1.91 | )%(d) | | | 2.80 | %(d) |
| | | | | | | | | |
Ratios/Supplemental Data: | | | | | | | | |
Net assets at end of period (thousands) | | $ | 12,262 | | | $ | 10,621 | |
Before waiver: | | | | | | | | |
Ratio of expenses to average net assets | | | 2.05 | %(e) | | | 4.41 | %(e) |
After waiver: | | | | | | | | |
Ratio of expenses to average net assets | | | 0.89 | %(e) | | | 0.89 | %(e) |
Ratio of net investment income to average net assets | | | 1.03 | %(e) | | | 0.89 | %(e) |
Portfolio turnover(f) | | | 6 | %(d) | | | 0.44 | %(d) |
(a) | For the period December 21, 2017 (commencement of operations) through September 30, 2018. |
(b) | Per share net investment income has been calculated using the average shares method. |
(c) | Total return in the above table represents the rate that the investor would have earned or lost on an investment in the Mid-Cap Value Fund, assuming reinvestment of distributions. |
(f) | Portfolio turnover is calculated on the basis on the fund as a whole without distinguishing among the classes of shares. |
| | See accompanying notes which are an integral part of these financial statements. | 49 |
Fuller & Thaler Behavioral Mid-Cap Value Fund - Investor Shares
Financial Highlights
Selected data for a share outstanding throughout each period.
| | | For the
Six Months
Ended
March 31,
2019
(unaudited) | | | For the
Period Ended
September 30,
2018(a) | |
Net asset value, at beginning of period | | $ | 20.50 | | | $ | 20.00 | |
Income from investment operations: | | | | | | | | |
Net investment income(b) | | | 0.09 | | | | 0.10 | |
Net realized and unrealized gain (loss) on investments | | | (0.51 | ) | | | 0.40 | |
Total from investment operations | | | (0.42 | ) | | | 0.50 | |
| | | | | | | | | |
Distributions from: | | | | | | | | |
Net investment income | | | (0.08 | ) | | | — | |
Net realized gain | | | (0.01 | ) | | | — | |
Total from distributions | | | (0.09 | ) | | | — | |
Net asset value, at end of period | | $ | 19.99 | | | $ | 20.50 | |
Total Return(c) | | | (2.02 | )%(d) | | | 2.50 | %(d) |
| | | | | | | | | |
Ratios/Supplemental Data: | | | | | | | | |
Net assets at end of period (thousands) | | $ | 1,077 | | | $ | 344 | |
Before waiver: | | | | | | | | |
Ratio of expenses to average net assets | | | 2.34 | %(e) | | | 4.65 | %(e) |
After waiver: | | | | | | | | |
Ratio of expenses to average net assets | | | 1.14 | %(e) | | | 1.14 | %(e) |
Ratio of net investment income to average net assets | | | 0.89 | %(e) | | | 0.65 | %(e) |
Portfolio turnover(f) | | | 6 | %(d) | | | 0.44 | %(d) |
(a) | For the period December 21, 2017 (commencement of operations) through September 30, 2018. |
(b) | Per share net investment income has been calculated using the average shares method. |
(c) | Total return in the above table represents the rate that the investor would have earned or lost on an investment in the Mid-Cap Value Fund, assuming reinvestment of distributions. |
(f) | Portfolio turnover is calculated on the basis on the fund as a whole without distinguishing among the classes of shares. |
50 | See accompanying notes which are an integral part of these financial statements. | |
Fuller & Thaler Behavioral Unconstrained Equity Fund
Financial Highlights
Selected data for a share outstanding throughout the period.
| | | For the Period Ended
March 31, 2019(a)
(unaudited) | |
| | | R6 Shares | | | Institutional
Shares | |
Net asset value, at beginning of period | | $ | 20.00 | | | $ | 20.00 | |
Income from investment operations: | | | | | | | | |
Net investment income | | | 0.03 | | | | 0.03 | |
Net realized and unrealized gain on investments | | | 4.18 | | | | 4.17 | |
Total from investment operations | | | 4.21 | | | | 4.20 | |
Net asset value, at end of period | | $ | 24.21 | | | $ | 24.20 | |
Total Return(b) | | | 21.05 | %(c) | | | 21.00 | %(c) |
| | | | | | | | | |
Ratios/Supplemental Data: | | | | | | | | |
Net assets at end of period (thousands) | | $ | 1,873 | | | $ | 1,715 | |
Before waiver: | | | | | | | | |
Ratio of expenses to average net assets | | | 6.66 | %(d) | | | 6.66 | %(d) |
After waiver: | | | | | | | | |
Ratio of expenses to average net assets | | | 0.90 | %(d) | | | 0.99 | %(d) |
Ratio of net investment income to average net assets | | | 0.53 | %(d) | | | 0.44 | %(d) |
Portfolio turnover(e) | | | 0 | %(c) | | | 0 | %(c) |
(a) | For the period December 26, 2018 (commencement of operations) through March 31, 2019. |
(b) | Total return in the above table represents the rate that the investor would have earned or lost on an investment in the Unconstrained Equity Fund, assuming reinvestment of distributions. |
(e) | Portfolio turnover is calculated on the basis on the fund as a whole without distinguishing among the classes of shares. |
| | See accompanying notes which are an integral part of these financial statements. | 51 |
Fuller & Thaler Behavioral Small-Mid Core Equity Fund - Institutional Shares
Financial Highlights
Selected data for a share outstanding throughout the period.
| | | For the
Period Ended
March 31,
2019(a)
(unaudited) | |
Net asset value, at beginning of period | | $ | 20.00 | |
Income from investment operations: | | | | |
Net investment income(b) | | | 0.07 | |
Net realized and unrealized gain on investments | | | 3.12 | |
Total from investment operations | | | 3.19 | |
Net asset value, at end of period | | $ | 23.19 | |
Total Return(c) | | | 15.95 | %(d) |
| | | | | |
Ratios/Supplemental Data: | | | | |
Net assets at end of period (thousands) | | $ | 2,414 | |
Before waiver: | | | | |
Ratio of expenses to average net assets | | | 9.74 | %(e) |
After waiver: | | | | |
Ratio of expenses to average net assets | | | 0.95 | %(e) |
Ratio of net investment income to average net assets | | | 1.22 | %(e) |
Portfolio turnover | | | 7 | %(d) |
(a) | For the period December 26, 2018 (commencement of operations) through March 31, 2019. |
(b) | Per share net investment income has been calculated using the average shares method. |
(c) | Total return in the above table represents the rate that the investor would have earned or lost on an investment in the Small-Mid Core Equity Fund, assuming reinvestment of distributions. |
52 | See accompanying notes which are an integral part of these financial statements. | |
Fuller & Thaler Behavioral Micro-Cap Equity Fund - Institutional Shares
Financial Highlights
Selected data for a share outstanding throughout the period.
| | | For the
Period Ended
March 31,
2019(a)
(unaudited) | |
Net asset value, at beginning of period | | $ | 20.00 | |
Income from investment operations: | | | | |
Net investment loss(b) | | | (0.06 | ) |
Net realized and unrealized gain on investments | | | 4.37 | |
Total from investment operations | | | 4.31 | |
Net asset value, at end of period | | $ | 24.31 | |
Total Return(c) | | | 21.55 | %(d) |
| | | | | |
Ratios/Supplemental Data: | | | | |
Net assets at end of period (thousands) | | $ | 3,083 | |
Before waiver: | | | | |
Ratio of expenses to average net assets | | | 6.24 | %(e) |
After waiver: | | | | |
Ratio of expenses to average net assets | | | 1.75 | %(e) |
Ratio of net investment loss to average net assets | | | (1.00 | )%(e) |
Portfolio turnover | | | 17 | %(d) |
(a) | For the period December 28, 2018 (commencement of operations) through March 31, 2019. |
(b) | Per share net investment income has been calculated using the average shares method. |
(c) | Total return in the above table represents the rate that the investor would have earned or lost on an investment in the Micro-Cap Equity Fund, assuming reinvestment of distributions. |
| | See accompanying notes which are an integral part of these financial statements. | 53 |
Fuller & Thaler Funds
Notes to the Financial Statements
March 31, 2019 (Unaudited)
NOTE 1. ORGANIZATION
The Fuller & Thaler Behavioral Small-Cap Equity Fund (the “Small-Cap Equity Fund”), the Fuller & Thaler Behavioral Small-Cap Growth Fund (the “Small-Cap Growth Fund”), the Fuller & Thaler Behavioral Mid-Cap Value Fund (the “Mid-Cap Value Fund”), the Fuller & Thaler Behavioral Unconstrained Equity Fund (the “Unconstrained Equity Fund”), the Fuller & Thaler Behavioral Small-Mid Core Equity Fund (the “Small-Mid Core Equity Fund”) and the Fuller & Thaler Behavioral Micro-Cap Equity Fund (the “Micro-Cap Equity Fund”) (each a “Fund” and, collectively the “Funds”) were each organized as a diversified series of Capitol Series Trust (the “Trust”). The Trust is an open-end investment company established under the laws of Ohio by an Agreement and Declaration of Trust dated September 18, 2013 (the “Trust Agreement”). The Trust Agreement permits the Board of Trustees of the Trust (“the Board”) to issue an unlimited number of shares of beneficial interest of separate series without par value. The Funds’ investment adviser is Fuller & Thaler Asset Management, Inc. (the “Adviser” or “Fuller & Thaler”). The investment objective of each Fund is to seek long-term capital appreciation.
The Small Cap Equity Fund and Small Cap Growth Fund each currently offer five share classes: R6 Shares, Institutional Shares, Investor Shares, A Shares and C Shares. The Mid-Cap Value Fund currently offer three share classes: R6 Shares, Institutional Shares and Investor Shares. The Unconstrained Equity Fund currently offer two share classes: R6 Shares and Institutional Shares. The Small-Mid Core Equity Fund and Micro-Cap Equity Fund each currently offer one share class: Institutional Shares. A Shares have a maximum sales charge on purchases of up to 5.75% and a Contingent Deferred Sales Charge (“CDSC”) on redemptions made within 12 months from the date of purchase and a CDSC of 0.50% on redemptions made more than 12 months but less than 18 months from the date of purchase. C Shares impose a 1.00% CDSC on redemptions made within 12 months from the date of purchase. A Shares and C Shares may be purchased without a sales charge under certain circumstances. Each share represents an equal proportionate interest in the assets and liabilities belonging to each Fund and is entitled to such dividends and distributions out of income belonging to each Fund as are declared by the Board.
The Small-Cap Equity Fund is the accounting successor to a series of Allianz Funds Multi-Strategy Trust, which commenced operations on September 8, 2011, and for which the Adviser served as the sole sub-adviser (the “Predecessor Fund”). In a transaction that was consummated on October 23, 2015 (the “Reorganization”), the Small-Cap Equity Fund acquired the assets and liabilities of: the A, C, and D Classes of the Predecessor Fund (tickers- AZFAX, AZFCX, and AZFDX respectively), which became the Investor Shares (formerly, A Shares) of the Small-Cap Equity Fund; the Class P Shares of the Predecessor Fund (ticker AZFPX), which became the Institutional Shares (formerly, Select Shares) of the Small-Cap Equity Fund; and the Institutional Shares of the Predecessor Fund (ticker AZFIX), which became the R6 Shares (formerly, Institutional Shares) of the Small-Cap Equity Fund.
54
Fuller & Thaler Funds
Notes to the Financial Statements (continued)
March 31, 2019 (Unaudited)
NOTE 2. SIGNIFICANT ACCOUNTING POLICIES
The Funds are investment companies and follow accounting and reporting guidance under Financial Accounting Standards Board Accounting Standards Codification (“ASC”) Topic 946, “Financial Services-Investment Companies”. The following is a summary of significant accounting policies followed by the Funds in the preparation of their financial statements. These policies are in conformity with the generally accepted accounting principles in the United States of America (“GAAP”).
Estimates – The preparation of financial statements in conformity with GAAP requires management to make estimates and assumptions that affect the reported amounts of assets and liabilities and disclosure of contingent assets and liabilities at the date of the financial statements and the reported amounts of increases and decreases in net assets from operations during the reporting period. Actual results could differ from those estimates.
Foreign Currency Translation – The accounting records of the Funds are maintained in U.S. dollars. Foreign currency amounts are translated into U.S. dollars at the current rate of exchange each business day to determine the value of investments, and other assets and liabilities. Purchases and sales of foreign securities, and income and expenses, are translated at the prevailing rate of exchange on the respective date of these transactions. The Funds do not isolate that portion of the results of operations resulting from changes in foreign exchange rates on investments from fluctuation arising from changes in market prices of securities held. These fluctuations are included with the unrealized gain or loss from investments.
Federal Income Taxes – The Funds make no provision for federal income or excise tax. Each Fund has qualified and intends to qualify each year as a regulated investment company (“RIC”) under subchapter M of the Internal Revenue Code of 1986, as amended, by complying with the requirements applicable to RICs and by distributing substantially all of its taxable income. Each Fund also intends to distribute sufficient net investment income and net capital gains, if any, so that it will not be subject to excise tax on undistributed income and gains. If the required amount of net investment income or gains is not distributed, the Fund could incur a tax expense.
The Funds may be subject to taxes imposed by countries in which it invests. Such taxes are generally based on income and/or capital gains earned or repatriated. Taxes are accrued and applied to net investment income, net realized gains and unrealized appreciation as such income and/or gains are earned.
The Funds recognize tax benefits or expenses of uncertain tax positions only when the position is “more likely than not” to be sustained assuming examination by tax authorities. Management of the Funds has reviewed tax positions taken in tax years that remain subject to examination by all major tax jurisdictions, including federal (i.e., the previous three tax year ends and the interim tax period since then, as applicable) and has concluded that no provision for unrecognized tax benefits or expenses is required in these financial statements and does not expect this to change over the next twelve months. The Funds recognize interest and penalties, if any, related to unrecognized tax benefits as income tax expense in the Statement of Operations. During the period, the Funds did not incur any interest or penalties.
55
Fuller & Thaler Funds
Notes to the Financial Statements (continued)
March 31, 2019 (Unaudited)
Expenses – Expenses incurred by the Trust that do not relate to a specific fund of the Trust are allocated to the individual funds based on each fund’s relative net assets or other appropriate basis (as determined by the Board). Expenses specifically attributable to any class are borne by that class. Income, realized gains and losses, unrealized appreciation and depreciation, and expenses are allocated to each class based on the net assets in relation to the relative net assets of the Fund.
Security Transactions and Related Income – Throughout the reporting period, security transactions are accounted for no later than one business day following the trade date. For financial reporting purposes, security transactions are accounted for on trade date on the last business day of the reporting period. The specific identification method is used for determining gains or losses for financial statements and income tax purposes. Dividend income is recorded on the ex-dividend date and interest income is recorded on an accrual basis. Dividend income from real estate investment trusts (REITs) and distributions from limited partnerships are recognized on the ex-date and included in dividend income. The calendar year-end classification of distributions received from REITs during the fiscal year are reported subsequent to year end; accordingly, the Fund estimates the character of REIT distributions based on the most recent information available. Income or loss from limited partnerships is reclassified among the components of net assets upon receipt of K-1’s. Discounts and premiums on fixed income securities purchased are amortized or accreted over the life of the respective securities using the effective interest method.
Dividends and Distributions – Each Fund intends to distribute its net investment income and net realized long-term and short-term capital gains, if any, at least annually. Dividends and distributions to shareholders, which are determined in accordance with income tax regulations, are recorded on the ex-dividend date. The treatment for financial reporting purposes of distributions made to shareholders during the period from net investment income or net realized capital gains may differ from their ultimate treatment for federal income tax purposes. These differences are caused primarily by differences in the timing of the recognition of certain components of income, expense or realized capital gain for federal income tax purposes. Where such differences are permanent in nature, they are reclassified in the components of the net assets based on their ultimate characterization for federal income tax purposes. Any such reclassifications will have no effect on net assets, results of operations or net asset value (“NAV”) per share of the Funds.
Organization and Offering Costs – The Adviser advanced some of the Funds’ organization and initial offering costs and was subsequently reimbursed by the Funds. Costs of $10,240, $10,229 and $10,200 incurred in connection with the offering and initial registration of the Unconstrained Equity Fund, Small-Mid Core Equity Fund and Micro-Cap Equity Fund, respectively, have been deferred and are being amortized on a straight-line basis over the first twelve months after commencement of operations. There were $7,076, $7,066 and $7,180 in unamortized offering costs remaining as of March 31, 2019 in the Unconstrained Equity Fund, Small-Mid Core Equity Fund and Micro-Cap Equity Fund, respectively. Costs of $8,500 incurred in connection with the organization of the Unconstrained Equity Fund, Small-Mid Core Equity Fund and Micro-Cap Equity Fund were expensed as incurred.
56
Fuller & Thaler Funds
Notes to the Financial Statements (continued)
March 31, 2019 (Unaudited)
NOTE 3. SECURITIES VALUATION AND FAIR VALUE MEASUREMENTS
All investments in securities are recorded at their estimated fair value. Fair value is defined as the price that a Fund would receive upon selling an investment in a timely transaction to an independent buyer in the principal or most advantageous market of the investment. GAAP establishes a three-tier hierarchy to maximize the use of observable market data and minimize the use of unobservable inputs and to establish classification of fair value measurements for disclosure purposes.
Inputs refer broadly to the assumptions that market participants would use in pricing the asset or liability, including assumptions about risk (the risk inherent in a particular valuation technique used to measure fair value including a pricing model and/or the risk inherent in the inputs to the valuation technique). Inputs may be observable or unobservable. Observable inputs are inputs that reflect the assumptions market participants would use in pricing the asset or liability developed based on market data obtained and available from sources independent of the reporting entity. Unobservable inputs are inputs that reflect the reporting entity’s own assumptions about the assumptions market participants would use in pricing the asset or liability developed based on the best information available in the circumstances.
Various inputs are used in determining the value of each Fund’s investments. These inputs are summarized in the three broad levels listed below.
| | ● | Level 1 – unadjusted quoted prices in active markets for identical investments and/or registered investment companies where the value per share is determined and published and is the basis for current transactions for identical assets or liabilities at the valuation date |
| | ● | Level 2 – other significant observable inputs (including, but not limited to, quoted prices for an identical security in an inactive market, quoted prices for similar securities, interest rates, prepayment speeds, credit risk, etc.) |
| | ● | Level 3 – significant unobservable inputs (including the Funds’ own assumptions in determining fair value of investments based on the best information available) |
The inputs used to measure fair value may fall into different levels of the fair value hierarchy. In such cases, for disclosure purposes, the level in the fair value hierarchy which is reported, is determined based on the lowest level input that is significant to the fair value measurement in its entirety.
In computing the NAV of the Funds, fair value is based on market valuations with respect to portfolio securities for which market quotations are readily available. Pursuant to Board approved policies, the Funds rely on independent third-party pricing services to provide the current market value of securities. Those pricing services value equity securities, including exchange-traded funds, exchange-traded notes, closed-end funds and preferred stocks, traded on a securities exchange at the last reported sales price on the principal exchange. Equity securities quoted by NASDAQ are valued at the NASDAQ Official Closing Price. If there is no reported sale on the principal exchange, equity securities are valued at the mean between the most recent quoted bid and asked price. When using the market quotations or close prices provided by the pricing service and when the market is considered active, the security will be classified as a Level 1 security. Investments in open-end mutual funds, including money market mutual funds, are generally priced at the ending NAV provided by
57
Fuller & Thaler Funds
Notes to the Financial Statements (continued)
March 31, 2019 (Unaudited)
the pricing service of the funds and are generally categorized as Level 1 securities. Debt securities are valued using evaluated prices furnished by a pricing vendor selected by the Board and are generally classified as Level 2 securities.
In the event that market quotations are not readily available, the Adviser determines that the market quotation or the price provided by the pricing service does not accurately reflect the current fair value, or certain restricted or illiquid securities are being valued, such securities are valued as determined in good faith by the Trust’s Valuation Committee, based on recommendations from a pricing committee comprised of various officers of the Trust, various employees of the Fund’s administrator, and representatives of the Adviser (together the “Pricing Review Committee”). These securities will be classified as Level 2 or 3 within the fair value hierarchy, depending on the inputs used.
In accordance with the Trust’s Valuation Procedures, the Pricing Review Committee in making its recommendations is required to consider all appropriate factors relevant to the value of securities for which it has determined other pricing sources are not available or reliable as described above. No single standard exists for determining fair value, because fair value depends upon the circumstances of each individual case. As a general principle, the current fair value of an issue of securities being valued pursuant to the Trust’s Fair Valuation Procedures would be the amount which the Funds might reasonably expect to receive for them upon their current sale. Methods which are in accordance with this principle may, for example, be based on (i) a multiple of earnings; (ii) a discount from market prices of a similar freely traded security (including a derivative security or a basket of securities traded on other markets, exchanges or among dealers); or (iii) yield to maturity with respect to debt issues, or a combination of these and other methods. Fair value pricing is permitted if, in accordance with the Trust’s Valuation Procedures, the validity of market quotations appears to be questionable based on factors such as evidence of a thin market in the security based on a small number of quotations, a significant event occurs after the close of a market but before each Fund’s NAV calculation that may affect a security’s value, or other data calls into question the reliability of market quotations.
58
Fuller & Thaler Funds
Notes to the Financial Statements (continued)
March 31, 2019 (Unaudited)
The following is a summary of the inputs used to value the Funds’ investments as of March 31, 2019:
| | | Valuation Inputs | | | | | |
Small-Cap Equity Fund | | Level 1 | | | Level 2 | | | Level 3 | | | Total | |
Common Stocks(a) | | $ | 1,152,609,632 | | | $ | — | | | $ | — | | | $ | 1,152,609,632 | |
Money Market Funds | | | 83,285,549 | | | | — | | | | — | | | | 83,285,549 | |
Total | | $ | 1,235,895,181 | | | $ | — | | | $ | — | | | $ | 1,235,895,181 | |
| | | | | | | | | | | | | | | | | |
Small-Cap Growth Fund | | | | | | | | | | | | |
Common Stocks(a) | | $ | 13,424,090 | | | $ | — | | | $ | — | | | $ | 13,424,090 | |
Total | | $ | 13,424,090 | | | $ | — | | | $ | — | | | $ | 13,424,090 | |
| | | | | | | | | | | | | | | | | |
Mid-Cap Value Fund | | | | | | | | | | | | |
Common Stocks(a) | | $ | 13,740,685 | | | $ | — | | | $ | — | | | $ | 13,740,685 | |
Total | | $ | 13,740,685 | | | $ | — | | | $ | — | | | $ | 13,740,685 | |
| | | | | | | | | | | | | | | | | |
Unconstrained Equity Fund | | | | | | | | | | | | |
Common Stocks(a) | | $ | 3,546,235 | | | $ | — | | | $ | — | | | $ | 3,546,235 | |
Total | | $ | 3,546,235 | | | $ | — | | | $ | — | | | $ | 3,546,235 | |
| | | | | | | | �� | | | | | | | | | |
Small-Mid Core Equity Fund | | | | | | | | | | | | |
Common Stocks(a) | | $ | 2,327,387 | | | $ | — | | | $ | — | | | $ | 2,327,387 | |
Total | | $ | 2,327,387 | | | $ | — | | | $ | — | | | $ | 2,327,387 | |
| | | | | | | | | | | | | | | | | |
Micro-Cap Equity Fund | | | | | | | | | | | | |
Common Stocks(a) | | $ | 3,062,735 | | | $ | — | | | $ | — | | | $ | 3,062,735 | |
Total | | $ | 3,062,735 | | | $ | — | | | $ | — | | | $ | 3,062,735 | |
(a) | Refer to Schedule of Investments for industry classifications. |
The Funds did not hold any investments during the reporting period in which other significant observable inputs (Level 2) were used in determining fair value. The Funds did not hold any investments during the reporting period in which significant unobservable inputs (Level 3) were used in determining fair value; therefore, no reconciliation of Level 3 securities is included for this reporting period. The Funds did not hold any derivative instruments during the reporting period.
59
Fuller & Thaler Funds
Notes to the Financial Statements (continued)
March 31, 2019 (Unaudited)
NOTE 4. FEES AND OTHER TRANSACTIONS WITH AFFILIATES AND OTHER SERVICE PROVIDERS
Under the terms of the investment advisory agreement (the “Agreement”), the Adviser manages each Fund’s investments subject to approval of the Board. As compensation for its management services, the Funds are obligated to pay the Adviser a fee computed and accrued daily and paid monthly as follows:
| | | Small-Cap
Equity
Fund | | | Small-Cap
Growth
Fund | | | Mid-Cap
Value
Fund | | | Unconstrained
Equity
Fund | | | Small-Mid
Core Equity
Fund | | | Micro-Cap
Equity
Fund | |
Investment Adviser fee rate | | | 0.60 | % | | | 0.85 | % | | | 0.75 | % | | | 0.85 | % | | | 0.80 | % | | | 1.50 | % |
Investment Adviser fee earned | | $ | 3,192,870 | | | $ | 45,527 | | | $ | 50,462 | | | $ | 5,753 | | | $ | 3,589 | | | $ | 11,080 | |
Fees waived by Adviser | | $ | — | | | $ | (76,017 | ) | | $ | (77,286 | ) | | $ | (35,967 | ) | | $ | (35,514 | ) | | $ | (33,092 | ) |
Payable to/(Receivable from) Adviser | | $ | 639,738 | | | $ | 1,240 | | | $ | | (495) | | $ | (8,273 | ) | | $ | (9,026 | ) | | $ | (6,596 | ) |
The Adviser has contractually agreed to waive its management fee and/or reimburse expenses so that total annual operating expenses (excluding (i) interest; (ii) taxes; (iii) brokerage fees and commissions; (iv) other extraordinary expenses not incurred in the ordinary course of the Funds business; and (v) indirect expenses such as acquired fund fees and expenses) do not exceed the following percentages of each Fund’s average daily net assets through January 31, 2020 (“Expense Limitation”):
| | R6 Shares | Institutional
Shares | Investor
Shares | A Shares | C Shares |
| Small-Cap Equity Fund | 0.80% | 0.99% | 1.25% | 1.30% | 1.80% |
| Small-Cap Growth Fund | 0.90% | 0.99% | 1.25% | 1.30% | 1.80% |
| Mid-Cap Value Fund | 0.80% | 0.90% | 1.15% | | |
| Unconstrained Equity Fund | 0.90% | 0.99% | | | |
| Small-Mid Core Equity Fund | | 0.95% | | | |
| Micro-Cap Equity Fund | | 1.75% | | | |
Prior to December 19, 2018, the Adviser contractually agreed to waive its management fee and/or reimburse expenses so that total annual operating expenses (excluding (i) interest; (ii) taxes; (iii) brokerage fees and commissions; (iv) other extraordinary expenses not incurred in the ordinary course of the Funds business; and (v) indirect expenses such as acquired fund fees and expenses) did not exceed 0.97% for the Institutional Shares of the Small-Cap Equity Fund; 1.24% for the Investor Shares of the Small-Cap Growth Fund; and 1.14% and 0.89% for the Investor Shares and Institutional Shares, respectively of the Mid-Cap Value Fund.
During any fiscal year that the Agreement between the Adviser and the Trust is in effect, the Adviser may recoup the sum of all fees previously waived or expenses reimbursed, less any reimbursement previously paid, provided that the Adviser is only permitted to recoup fees or expenses within 36 months from the date the fee waiver or expense reimbursement took effect and provided further that
60
Fuller & Thaler Funds
Notes to the Financial Statements (continued)
March 31, 2019 (Unaudited)
such recoupment can be achieved within the Expense Limitation currently in effect and the Expense Limitation in place when the waiver/reimbursement occurred. This expense cap agreement may be terminated by the Board at any time.
As of March 31, 2019, the Adviser may seek repayment of investment advisory fee waivers and expense reimbursements as follows:
Recoverable Through | | Small-Cap
Equity
Fund | | | Small-Cap
Growth
Fund | | | Mid-Cap
Value
Fund | | | Unconstrained
Equity
Fund | | | Small-Mid
Core Equity
Fund | | | Micro-Cap
Equity
Fund | |
September 30, 2019 | | $ | 112,013 | | | $ | — | | | $ | — | | | $ | — | | | $ | — | | | $ | — | |
September 30, 2020 | | | 160,343 | | | | — | | | | — | | | | — | | | | — | | | | — | |
September 30, 2021 | | | 30,316 | | | | 128,041 | | | | 129,738 | | | | — | | | | — | | | | — | |
March 31, 2022 | | | — | | | | 76,017 | | | | 77,286 | | | | 35,967 | | | | 35,514 | | | | 33,092 | |
| | | $ | 302,672 | | | $ | 204,058 | | | $ | 207,024 | | | $ | 35,967 | | | $ | 35,514 | | | $ | 33,092 | |
The Trust retains Ultimus Fund Solutions, LLC (the “Administrator”) to provide the Funds with administration, fund accounting, transfer agent and compliance services, including all regulatory reporting. For the six months ended March 31, 2019, fees incurred for administration, fund accounting, transfer agent and compliance services, and the amounts due to the Administrator at March 31, 2019 were as follows:
| | | Small-Cap
Equity
Fund | | | Small-Cap
Growth
Fund | | | Mid-Cap
Value
Fund | | | Unconstrained
Equity
Fund(a) | | | Small-Mid
Core Equity
Fund(a) | | | Micro-Cap
Equity
Fund(b) | |
Administration | | $ | 230,472 | | | $ | 10,681 | | | $ | 10,392 | | | $ | 3,304 | | | $ | 3,302 | | | $ | 3,297 | |
Fund accounting | | | 77,869 | | | | 6,205 | | | | 6,205 | | | | 652 | | | | 651 | | | | 648 | |
Transfer agent | | | 49,467 | | | | 6,497 | | | | 8,161 | | | | 657 | | | | 660 | | | | 539 | |
Payable to Administrator | | | 64,526 | | | | 4,781 | | | | 5,412 | | | | 1,613 | | | | 1,613 | | | | 1,484 | |
(a) | For the period December 26, 2018 (commencement of operations) to March 31, 2019. |
(b) | For the period December 28, 2018 (commencement of operations) to March 31, 2019. |
The Board supervises the business activities of the Trust. Each Trustee serves as a Trustee for the lifetime of the Trust or until the earlier of his or her retirement as a Trustee at age 78 (which may be extended for up to two years in an emeritus non-voting capacity at the pleasure and request of the Board), or until he/she dies, resigns, or is removed, whichever is sooner. “Independent Trustees,” meaning those Trustees who are not “interested persons” as defined in the Investment Company Act of 1940 (“1940 Act”) of the Trust, each receives an annual retainer of $500 per Fund and $500 per Fund for each quarterly in-person Board meeting. In addition, the Trust reimburses Trustees for out-of-pocket expense incurred in conjunction with attendance at Board meetings.
The officers and one Trustee of the Trust are employees of the Administrator. Unified Financial Securities, LLC (the “Distributor”) acts as the principal distributor of each Fund’s shares. Both the Administrator and the Distributor operate as wholly-owned subsidiaries of Ultimus Fund Solutions, LLC.
61
Fuller & Thaler Funds
Notes to the Financial Statements (continued)
March 31, 2019 (Unaudited)
The Funds have adopted a Distribution Plan (the “Plan) pursuant to Rule 12b-1 of the 1940 Act. The Plan provides that the Funds will pay the Distributor and/or any registered securities dealer, financial institution or any other person (the “Recipient”) a fee of up to 0.25% of the average daily net assets of each Fund’s Investor Shares and A Shares and 1.00% of the average daily net assets of each Fund’s C Shares in connection with the promotion and distribution of each Fund’s Investor Shares, A Shares and C Shares or the provision of personal services to shareholders, including, but not necessarily limited to, advertising, compensation to underwriters, dealers and selling personnel, the printing and mailing of prospectuses to other than current Investor Shares shareholders, the printing and mailing of sales literature and servicing shareholder accounts (“12b-1 Expenses”). Under the 12b-1 Plan, the 1.00% C Share 12b-1 fee includes a 0.25% service fee. Over time, 12b-1 fees will increase the cost of your investment in a Fund’s Investor, A, and C Shares and may cost you more than paying other types of sales charges because these fees are paid out of the Fund’s Investor, A, and C Shares on an on-going basis. The Funds or Distributor may pay all or a portion of these fees to any Recipient who renders assistance in distributing or promoting the sale of shares, or who provides certain shareholder services, pursuant to a written agreement. The Plan is a compensation plan, which means that compensation is provided regardless of whether 12b-1 Expenses are actually incurred. Accordingly, the 12b-1 Expenses of the Investor Shares of each Fund may be less than fees paid out by the class under the Plan. For the six months ended March 31, 2019, 12b-1 expenses incurred by the Funds’ where as follows:
Distribution Fees | | Small-Cap
Equity Fund | | | Small-Cap
Growth Fund | | | Mid-Cap Value
Fund | |
Investor Shares | | $ | 149,623 | | | $ | 421 | | | $ | 851 | |
A Shares | | | 23 | | | | 2 | | | | — | |
C Shares | | | 93 | | | | 7 | | | | — | |
Payable for 12b-1 fees | | | 45,308 | | | | 89 | | | | 381 | |
The Funds have adopted an Administrative Services Plan (the “Plan”) for Institutional Shares, Investor Shares, and A Shares of the Funds. The Plan allows the Funds to pay financial intermediaries that provide services relating to Institutional Shares, Investor Shares, and A Shares. The Plan permits payments for the provision of certain administrative, recordkeeping and other non-distribution related services to Institutional Share, Investor Share and A Share shareholders. The Plan permits the Funds to make service fee payments at an annual rate of up to 0.25% of each Fund’s average daily net assets attributable to its A Shares and C Shares and up to 0.20% of each Fund’s average daily net assets attributable to its Institutional Shares or Investor Shares. Because these fees are paid respectively out of a the assets of each Fund’s Institutional Shares, Investor Shares, A Shares and C Shares on an ongoing basis, over time they will increase the cost of an investment in Institutional Shares, Investor Shares, A Shares and C Shares.
62
Fuller & Thaler Funds
Notes to the Financial Statements (continued)
March 31, 2019 (Unaudited)
NOTE 5. PURCHASES AND SALES OF SECURITIES
For the six months ended March 31, 2019, purchases and sales of investment securities, other than short-term investments were as follows:
| | | Purchases | | | Sales | |
Small-Cap Equity Fund | | $ | 454,100,275 | | | $ | 226,890,117 | |
Small-Cap Growth Fund | | | 11,141,647 | | | | 8,174,211 | |
Mid-Cap Value Fund | | | 1,772,644 | | | | 811,362 | |
Unconstrained Equity Fund | | | 3,157,514 | | | | — | |
Small-Mid Core Equity Fund | | | 2,269,633 | | | | 119,724 | |
Micro-Cap Equity Fund | | | 3,004,638 | | | | 495,789 | |
There were no purchases or sales of long-term U.S. government obligations during the six months ended March 31, 2019.
NOTE 6. FEDERAL TAX INFORMATION
At March 31, 2019, the net unrealized appreciation (depreciation) of investments for tax purposes was as follows:
| | | Small-Cap
Equity
Fund | | | Small-Cap
Growth
Fund | | | Mid-Cap
Value
Fund | | | Unconstrained
Equity Fund | | | Small-Mid
Core Equity
Fund | | | Micro-Cap
Equity
Fund | |
Gross unrealized appreciation | | $ | 76,612,167 | | | $ | 1,712,607 | | | $ | 951,782 | | | $ | 422,483 | | | $ | 186,903 | | | $ | 587,545 | |
Gross unrealized depreciation | | | (81,070,377 | ) | | | (441,407 | ) | | | (942,309 | ) | | | (33,763 | ) | | | (29,276 | ) | | | (106,082 | ) |
Net unrealized appreciation/(depreciation) on investments | | $ | (4,458,210 | ) | | $ | 1,271,200 | | | $ | 9,473 | | | $ | 388,720 | | | $ | 157,627 | | | $ | 481,463 | |
Tax cost of investments | | $ | 1,240,353,391 | | | $ | 12,152,890 | | | $ | 13,731,212 | | | $ | 3,157,514 | | | $ | 2,169,760 | | | $ | 2,581,271 | |
The tax character of distributions for the fiscal year ended September 30, 2018 was as follows:
| | | Small-Cap
Equity
Fund | |
Distributions paid from: | | | | |
Ordinary income | | $ | 783,264 | |
Long-term capital gains | | | — | |
Total distributions paid | | $ | 783,264 | |
63
Fuller & Thaler Funds
Notes to the Financial Statements (continued)
March 31, 2019 (Unaudited)
At September 30, 2018, the components of distributable earnings (accumulated losses) on a tax basis was as follows:
| | | Undistributed
Ordinary
Income | | | Undistributed
Long Term
Capital Gains | | | Accumulated
Capital and
Other Losses | | | Unrealized
Appreciation
(Depreciation)(a) | | | Total | |
Small-Cap Equity Fund | | $ | 3,363,072 | | | $ | — | | | $ | (4,936,397 | ) | | $ | 85,581,896 | | | $ | 84,008,571 | |
Small-Cap Growth Fund | | | — | | | | — | | | | (257,625 | ) | | | 1,978,114 | | | | 1,720,519 | |
Mid-Cap Value Fund | | | 45,243 | | | | 5,377 | | | | — | | | | 252,829 | | | | 303,449 | |
(a) | The difference between book basis and tax basis unrealized appreciation (depreciation) is primarily attributable to the tax deferral of wash losses. |
As of September 30, 2018, the Small-Cap Equity Fund and the Small-Cap Growth Fund had available for tax purposes an unused capital loss carryforward of $4,936,397 and $226,497, respectively, of short-term capital losses with no expiration, which is available to offset against future taxable net capital gains. To the extent that this carryforward is used to offset future gains, it is probable that the amount offset will not be distributed to shareholders.
Under current tax law, net investment losses after December 31 after and capital losses realized after October 31 of the Funds fiscal year may be deferred and treated as occurring on the first business day of the following fiscal year for tax purposes. As of September 30, 2018, the Small-Cap Growth Fund had a Qualified Late Year Ordinary Loss in the amount of $31,128.
NOTE 7. SECTOR RISK
If a Fund has significant investments in the securities of issuers within a particular sector, any development affecting that sector will have a greater impact on the value of the net assets of the Fund than would be the case if the Fund did not have significant investments in that sector. In addition, this may increase the risk of loss in the Fund and increase the volatility of the Fund’s NAV per share. For instance, economic or market factors, regulatory changes or other developments may negatively impact all companies in a particular sector, and therefore the value of the Fund’s portfolio will be adversely affected. As of March 31, 2019, Small-Cap Growth Fund and Unconstrained Equity Fund had 25.0% and 31.7%, respectively, of the value of their net assets invested in stocks within the Consumer Discretionary sector.
NOTE 8. COMMITMENTS AND CONTINGENCIES
The Trust indemnifies its officers and trustees for certain liabilities that may arise from their performance of their duties to the Trust or the Funds. Additionally, in the normal course of business, the Trust enters into contracts that contain a variety of representations and warranties which provide general indemnifications. The Trust’s maximum exposure under these arrangements is unknown, as this would involve future claims that may be made against the Trust that have not yet occurred.
64
Fuller & Thaler Funds
Notes to the Financial Statements (continued)
March 31, 2019 (Unaudited)
NOTE 9. SUBSEQUENT EVENTS
Management of the Funds has evaluated the need for disclosures and/or adjustments resulting from subsequent events through the date these financial statements were issued. Based upon this evaluation, management has determined there were no items requiring adjustment of the financial statements or additional disclosure.
65
Summary of Fund Expenses (Unaudited)
As a shareholder of one of the Funds, you incur two types of costs: (1) transaction costs and (2) ongoing costs, including management fees; and other Fund expenses. These examples are intended to help you understand your ongoing costs (in dollars) of investing in each Fund and to compare these costs with the ongoing costs of investing in other mutual funds. Each Fund’s example is based on an investment of $1,000 invested at the beginning of the period and held for the entire period from October 1, 2018 through March 31, 2019.
Actual Expenses
The first line of the table for each class provides information about actual account values and actual expenses. You may use the information in these lines, together with the amount you invested, to estimate the expenses that you paid over the period. Simply divide your account value by $1,000 (for example, an $8,600 account value divided by $1,000 = 8.60), then multiply the result by the number in the first line under the heading “Expenses Paid During Period” to estimate the expenses you paid on your account during this period.
Hypothetical Example for Comparison Purposes
The second line of the table for each class provides information about hypothetical account values and hypothetical expenses based on each Fund’s actual expense ratios and an assumed rate of return of 5% per year before expenses, which is not the Fund’s actual return. The hypothetical account values and expenses may not be used to estimate the actual ending account balances or expenses you paid for the period. You may use this information to compare the ongoing costs of investing in the Funds and other funds. To do so, compare this 5% hypothetical example with the 5% hypothetical examples that appear in the shareholder reports of the other funds.
Expenses shown in the table are meant to highlight your ongoing costs only and do not reflect any transactional costs. Therefore, the second line of the table for each class is useful in comparing ongoing costs only and will not help you determine the relative total costs of owning different funds. In addition, if transaction costs were included, your costs would have been higher.
66
Summary of Fund Expenses (Unaudited) (continued)
| | | Beginning
Account Value
October 1, 2018 | Ending
Account Value
March 31, 2019 | Expenses
Paid During
Period(a) | Annualized
Expense
Ratio |
Small-Cap Equity Fund | | | |
R6 Shares | Actual | $ 1,000.00 | $ 907.60 | $ 3.38 | 0.71% |
| | | | | | |
| | Hypothetical(b) | $ 1,000.00 | $ 1,021.39 | $ 3.58 | 0.71% |
| | | | | | |
Institutional Shares | Actual | $ 1,000.00 | $ 907.30 | $ 3.85 | 0.81% |
| | | | | | |
| | Hypothetical(b) | $ 1,000.00 | $ 1,020.89 | $ 4.08 | 0.81% |
| | | | | | |
Investor Shares | Actual | $ 1,000.00 | $ 906.30 | $ 5.18 | 1.09% |
| | | | | | |
| | Hypothetical(b) | $ 1,000.00 | $ 1,019.50 | $ 5.49 | 1.09% |
| | | | | | |
A Shares | Actual(c) | $ 1,000.00 | $ 1,136.30 | $ 2.90 | 0.97% |
| | | | | | |
| | Hypothetical(b) | $ 1,000.00 | $ 1,020.09 | $ 4.89 | 0.97% |
| | | | | | |
C Shares | Actual(c) | $ 1,000.00 | $ 1,133.90 | $ 5.13 | 1.72% |
| | | | | | |
| | Hypothetical(b) | $ 1,000.00 | $ 1,016.36 | $ 8.65 | 1.72% |
Small-Cap Growth Fund | | | |
R6 Shares | Actual | $ 1,000.00 | $ 832.30 | $ 4.27 | 0.93% |
| | | | | | |
| | Hypothetical(b) | $ 1,000.00 | $ 1,020.27 | $ 4.70 | 0.93% |
| | | | | | |
Institutional Shares | Actual | $ 1,000.00 | $ 832.20 | $ 4.61 | 1.01% |
| | | | | | |
| | Hypothetical(b) | $ 1,000.00 | $ 1,019.90 | $ 5.08 | 1.01% |
| | | | | | |
Investor Shares | Actual | $ 1,000.00 | $ 831.10 | $ 5.84 | 1.28% |
| | | | | | |
| | Hypothetical(b) | $ 1,000.00 | $ 1,018.55 | $ 6.44 | 1.28% |
| | | | | | |
A Shares | Actual(c) | $ 1,000.00 | $ 1,140.40 | $ 3.89 | 1.30% |
| | | | | | |
| | Hypothetical(b) | $ 1,000.00 | $ 1,018.45 | $ 6.54 | 1.30% |
| | | | | | |
C Shares | Actual(c) | $ 1,000.00 | $ 1,138.80 | $ 5.38 | 1.80% |
| | | | | | |
| | Hypothetical(b) | $ 1,000.00 | $ 1,015.95 | $ 9.05 | 1.80% |
67
Summary of Fund Expenses (Unaudited) (continued)
| | | Beginning
Account Value
October 1, 2018 | Ending
Account Value
March 31, 2019 | Expenses
Paid During
Period(a) | Annualized
Expense
Ratio |
Mid-Cap Value Fund | | | |
R6 Shares | Actual | $ 1,000.00 | $ 981.30 | $ 3.95 | 0.80% |
| | | | | | |
| | Hypothetical(b) | $ 1,000.00 | $ 1,020.94 | $ 4.03 | 0.80% |
| | | | | | |
Institutional Shares | Actual | $ 1,000.00 | $ 980.90 | $ 4.40 | 0.89% |
| | | | | | |
| | Hypothetical(b) | $ 1,000.00 | $ 1,020.49 | $ 4.48 | 0.89% |
| | | | | | |
Investor Shares | Actual | $ 1,000.00 | $ 979.80 | $ 5.63 | 1.14% |
| | | | | | |
| | Hypothetical(b) | $ 1,000.00 | $ 1,019.25 | $ 5.74 | 1.14% |
(a) | Expenses are equal to the Funds’ annualized expense ratios, multiplied by the average account value over the period, multiplied by 182/365 (to reflect the one-half year period). |
(b) | Hypothetical assumes 5% annual return before expenses. |
(c) | Actual expenses are equal to the A Shares and C Shares annualized expense ratios, multiplied by the average account value over the period, multiplied by 102/365 (to reflect the period since commencement of operations on December 19, 2018). The annualized expense ratios reflect reimbursement of expenses by the Funds’ investment adviser for the period beginning December 19, 2018 through March 31, 2019. The “Financial Highlights” tables in the Funds’ financial statements, included in the report, also show the gross expense ratios, without such reimbursements. Hypothetical expenses are equal to the Funds’ annualized expense ratios, multiplied by the average account value over the period, multiplied by 182/365 (to reflect the one-half year period). |
68
Summary of Fund Expenses (Unaudited) (continued)
| | | Beginning
Account Value
October 1, 2018 | Ending
Account Value
March 31, 2019 | Expenses
Paid During
Period(a) | Annualized
Expense
Ratio |
Unconstrained Equity Fund | | | |
R6 Shares | Actual(b) | $ 1,000.00 | $ 1,210.50 | $ 2.59 | 0.90% |
| | | | | | |
| | Hypothetical(c) | $ 1,000.00 | $ 1,020.44 | $ 4.53 | 0.90% |
| | | | | | |
Institutional Shares | Actual(b) | $ 1,000.00 | $ 1,210.00 | $ 2.85 | 0.99% |
| | | | | | |
| | Hypothetical(c) | $ 1,000.00 | $ 1,019.99 | $ 4.99 | 0.99% |
Small-Mid Core Equity Fund | | | |
Institutional Shares | Actual(b) | $ 1,000.00 | $ 1,159.50 | $ 2.67 | 0.95% |
| | | | | | |
| | Hypothetical(c) | $ 1,000.00 | $ 1,020.19 | $ 4.79 | 0.95% |
Micro-Cap Equity Fund | | | |
Institutional Shares | Actual(d) | $ 1,000.00 | $ 1,215.50 | $ 4.83 | 1.75% |
| | | | | | |
| | Hypothetical(c) | $ 1,000.00 | $ 1,016.21 | $ 8.80 | 1.75% |
(a) | Expenses are equal to the Funds’ annualized expense ratios, multiplied by the average account value over the period, multiplied by 182/365 (to reflect the one-half year period). |
(b) | Actual expenses are equal to the Unconstrained Equity Fund’s and Small-Mid Core Equity Fund’s annualized expense ratios, multiplied by the average account value over the period, multiplied by 95/365 (to reflect the period since commencement of operations on December 26, 2018). The annualized expense ratios reflect reimbursement of expenses by the Funds’ investment adviser for the period beginning December 26, 2018 through March 31, 2019. The “Financial Highlights” tables in the Funds’ financial statements, included in the report, also show the gross expense ratios, without such reimbursements. Hypothetical expenses are equal to the Funds’ annualized expense ratios, multiplied by the average account value over the period, multiplied by 182/365 (to reflect the one-half year period). |
(c) | Hypothetical assumes 5% annual return before expenses. |
(d) | Actual expenses are equal to the Micro-Cap Equity Fund’s annualized expense ratios, multiplied by the average account value over the period, multiplied by 91/365 (to reflect the period since commencement of operations on December 28, 2018). The annualized expense ratios reflect reimbursement of expenses by the Funds’ investment adviser for the period beginning December 28, 2018 through March 31, 2019. The “Financial Highlights” tables in the Funds’ financial statements, included in the report, also show the gross expense ratios, without such reimbursements. Hypothetical expenses are equal to the Funds’ annualized expense ratios, multiplied by the average account value over the period, multiplied by 182/365 (to reflect the one-half year period). |
69
Approval of Investment Advisory Agreement (Unaudited)
At a quarterly meeting of the Board of Trustees of Capitol Series Trust (“Trust”) conducted on December 17 and 18, 2018 (the “Meeting”), the Trust’s Board of Trustees (the “Board”), including all of the Trustees who are not “interested persons” of the Trust (the “Independent Trustees”) as that term is defined in Section 2(a)(19) of the Investment Company Act of 1940, as amended (the “1940 Act”), considered and approved an Amended and Restated Investment Advisory Agreement (“Investment Advisory Agreement”) between the Trust and Fuller & Thaler Asset Management, Inc. (“Fuller & Thaler” or “Adviser”). As it relates to the Fuller & Thaler Behavioral Small-Cap Equity Fund (the “Fuller & Thaler Small-Cap Equity Fund”), the Board’s approval of the Investment Advisory Agreement renewed the current advisory agreement between the Trust and Fuller & Thaler for an additional one-year term. With respect to each of the Fuller & Thaler Behavioral Unconstrained Equity Fund (the “Fuller & Thaler Unconstrained Equity Fund”), the Fuller & Thaler Behavioral Small-Mid Core Equity Fund (the “Fuller & Thaler SMID Fund”) and the Fuller & Thaler Behavioral Micro-Cap Equity Fund (the “Fuller & Thaler Micro-Cap Equity Fund”), the Board’s approval of the Investment Advisory Agreement was for an initial two-year term. It was noted that the Investment Advisory Agreement with respect to the Fuller & Thaler Behavioral Small-Cap Growth Fund and the Fuller & Thaler Behavioral Mid-Cap Value Fund had been approved for an initial two-year term in December 2017, and therefore was not subject to renewal. The Fuller & Thaler Small-Cap Equity Fund, Fuller & Thaler Unconstrained Equity Fund, Fuller & Thaler SMID Fund, and Fuller & Thaler Micro-Cap Equity Fund are hereinafter collectively referred to as the “Fuller & Thaler Funds.”
Prior to the Meeting, the Trustees received and considered information from Fuller & Thaler and the Trust’s administrator designed to provide the Trustees with the information necessary to evaluate the terms of the proposed Investment Advisory Agreement between the Trust and Fuller & Thaler, including, but not limited to: Fuller & Thaler’s combined responses to counsel’s due diligence letter and Fuller & Thaler’s supplemental responses to counsel’s supplemental requests, each requesting information relevant to the approval of the Investment Advisory Agreement; the Expense Limitation Agreement currently in effect between Fuller & Thaler and the Fuller & Thaler Small-Cap Equity Fund and the Expense Limitation Agreement effective December 19, 2018 through January 31, 2020 between Fuller & Thaler and the Fuller & Thaler Funds; and Morningstar peer group expense and performance data for comparative purposes (the “Support Materials”). The Trustees reviewed the Support Materials at various times with Fuller & Thaler, Trust management, and counsel to the Independent Trustees. Representatives of Fuller & Thaler met with the Trustees and provided additional relevant information, including but not limited to: the services it currently provides to the Fuller & Thaler Small-Cap Equity Fund and the proposed services it will provide to the Fuller & Thaler Unconstrained Equity Fund, the Fuller & Thaler SMID Fund and the Fuller & Thaler Micro-Cap Equity Fund; Fuller & Thaler’s investment philosophy; Fuller & Thaler’s distribution and marketing efforts on behalf of the Fuller & Thaler Funds; Fuller & Thaler’s rationale for the proposed advisory fees for each of the Fuller & Thaler Funds; the Adviser’s ownership structure and future plans with regard to its ownership structure; the firm’s financial statements, including information related to its profitability and balance sheets; historical profitability of the Fuller & Thaler Small-Cap Equity Fund, and projected profitability each of the Fuller & Thaler Funds, including Fuller & Thaler’s overhead allocation methodology; resources available to service the Fuller & Thaler Funds, including compliance resources; other benefits that Fuller & Thaler derived from its relationship with the Fuller & Thaler Funds; and Fuller & Thaler’s disaster recovery plan. In its considerations, the Board noted he completeness of the Support Materials that Fuller & Thaler had provided, as well as the robust discussions that had occurred with representatives of Fuller & Thaler at various times, including during the Meeting. This information, together with the information provided to and reviewed by
70
Approval of Investment Advisory Agreement (Unaudited)
(continued)
the Board throughout the course of the year and since the inception of the Fuller & Thaler Small-Cap Equity Fund, formed the primary, but not exclusive, basis for the Board’s determinations. Before voting to approve the Investment Advisory Agreement, the Trustees reviewed the terms and the form of the Investment Advisory Agreement and the Support Materials with Trust management and with counsel to the Independent Trustees. The Trustees received and discussed a memorandum from such counsel delineating the legal standards governing their consideration of the approval of the Investment Advisory Agreement, which memorandum described the various factors that the U.S. Securities and Exchange Commission (“SEC”) and U.S. Courts over the years have suggested would be appropriate for trustee consideration, including the factors outlined in Gartenberg v. Merrill Lynch Asset Management Inc., 694 F.2d 923, 928 (2d Cir. 1982); cert. denied sub. nom. and Andre v. Merrill Lynch Ready Assets Trust, Inc., 461 U.S. 906 (1983).
After having received and reviewed the Support Materials, as well as quarterly investment performance, compliance, operating, and distribution reports from Fuller & Thaler for the Fuller & Thaler Small-Cap Equity Fund since the Fund’s inception, the Trustees discussed the facts and factors relevant to their consideration and approval of the Investment Advisory Agreement, which incorporated and reflected their knowledge of Fuller & Thaler’s services to the Fuller & Thaler Small-Cap Equity Fund, as well as the scope of services that Fuller & Thaler proposed to provide to each of the Fuller & Thaler Funds. The Trustees noted the inclusion of a fee and performance comparison of the Fuller & Thaler Small-Cap Equity Fund to the Small-Cap Blend Morningstar peer group category and fee comparisons for each of the Fuller & Thaler Unconstrained Equity Fund, the Fuller & Thaler SMID Fund and the Fuller & Thaler Micro-Cap Equity Fund to the Small-Cap Blend Morningstar peer group category, custom combined Small and Mid-Cap Blend Morningstar peer group category and custom adviser-selected peer group category, respectively. The Trustees noted Fuller & Thaler’s explanation regarding its selection of a custom-defined peer group category for the micro-cap universe due to the lack of a Morningstar peer group category specific to the micro-cap universe. It was noted that the peer group comparisons were filtered by total net assets so that the Fuller & Thaler Funds were compared to other similarly sized funds, and the Trustees discussed the appropriateness of this comparison. The Trustees noted the confidential review of Fuller & Thaler’s financial statements at various times by Mr. Robert Dorsey, an interested Trustee serving on the Board, and noted no concerns. Taking such information into account, including the Trustees’ discussion with representatives of Fuller & Thaler at the Meeting, and the Board’s review of the Support Materials provided in connection with the approval of the Investment Advisory Agreement, the Board concluded that the overall arrangements between the Trust and Fuller & Thaler with respect to each Fuller & Thaler Fund, as set forth in the Investment Advisory Agreement, are fair and reasonable in light of the services to be performed, investment advisory fees to be paid and such other matters as the Trustees considered relevant in the exercise of their reasonable judgment. The material factors and conclusions that formed the basis of the Trustees’ determination to approve the Investment Advisory Agreement are summarized below.
In determining whether to approve the Investment Advisory Agreement with respect to the Fuller & Thaler Funds, the Trustees considered all factors they believed relevant, including the following: (1) the nature, extent, and quality of the services provided by Fuller & Thaler with respect to the Fuller & Thaler Small-Cap Equity Fund and the nature, extent, and quality of the services to be provided by Fuller & Thaler with respect to the Fuller & Thaler Unconstrained Equity Fund, the Fuller & Thaler SMID Fund, and the Fuller & Thaler Micro-Cap Equity Fund; (2) the cost of the services provided and the profits realized by Fuller & Thaler from services rendered to the Trust with respect to each of
71
Approval of Investment Advisory Agreement (Unaudited)
(continued)
the Fuller & Thaler Funds; (3) comparative fee and expense data for the Fuller & Thaler Funds and other investment companies with similar investment objectives; (4) the extent to which economies of scale may be realized as each Fund grows, and whether the advisory fees for each Fund reflects such economies of scale for each Fund’s benefit; and (5) other financial benefits to Fuller & Thaler resulting from services rendered to the Fuller & Thaler Funds. In their deliberations, the Trustees did not identify any particular information that was all-important or controlling.
Nature, Extent and Quality of Services Provided. The Trustees considered the scope of services that Fuller & Thaler provides under the Investment Advisory Agreement, noting that such services include but are not limited to the following: (1) investing each Fuller & Thaler Fund’s assets consistent with the Fund’s investment objective and investment policies; (2) determining the portfolio securities to be purchased, sold or otherwise disposed of and the timing of such transactions; (3) voting all proxies with respect to each Fund’s portfolio securities; (4) maintaining the required books and records for transactions that Fuller & Thaler effects on behalf of each Fuller & Thaler Fund; and (5) selecting broker-dealers to execute orders on behalf of each Fuller & Thaler Fund. The Trustees noted that no changes were contemplated to the services that Fuller & Thaler currently provides to the Fuller & Thaler Small-Cap Equity Fund under the terms of the Investment Advisory Agreement. The Trustees considered Fuller & Thaler’s capitalization and its assets under management. The Trustees further considered the investment philosophy and experience of the Fuller & Thaler Funds’ portfolio management team, including the firm’s expertise in behavioral finance and its proprietary behavioral finance model, which is a key component of each Fund’s investment strategy. In addition, the Trustees noted the compliance, marketing, distribution and client relationship services that Fuller & Thaler provides on behalf of the Fuller & Thaler Funds. The Trustees compared the Fuller & Thaler Small-Cap Equity Fund’s performance to its benchmark index and Small-Cap Blend Morningstar peer group category. The Trustees considered that the Fuller & Thaler Small-Cap Equity Fund outperformed its benchmark for the three- and five-year and since-inception periods ended September 30, 2018, and underperformed its benchmark for the one-year period ended September 30, 2018. They noted that the Fuller & Thaler Small-Cap Equity Fund outperformed the average and median of the Small-Cap Blend Morningstar peer group category for the three- and five-year periods ended September 30, 2018, and underperformed the average and median of the same Morningstar peer group category for the one-year period ended September 30, 2018. In addition, they noted that the Fuller & Thaler Small-Cap Equity Fund currently had an overall five-star Morningstar rating. The Trustees then considered the extensive composite performance information that Fuller & Thaler provided with respect to its unconstrained equity and micro-cap equity strategies, which were relevant to the Fuller & Thaler Unconstrained Equity Fund and the Fuller & Thaler Micro-Cap Equity Fund, respectively. The Trustees noted that a performance composite for the small- and mid-core equity strategy was not available due to the newness of the strategy. The Board noted that Fuller & Thaler uses the same behavioral finance investment strategy irrespective of the capitalization of the securities being purchased. Finally, the Trustees took notice of the significant growth of assets in the Fuller & Thaler Small-Cap Equity Fund and the overall growth in the Adviser’s assets under management. . Taking these factors into account, the Trustees concluded that they are satisfied with the nature, extent and quality of services that Fuller & Thaler currently provides to the Fuller & Thaler Small-Cap Equity Fund, and that they will provide to each Fuller & Thaler Fund under the Investment Advisory Agreement.
72
Approval of Investment Advisory Agreement (Unaudited)
(continued)
Cost of Advisory Services and Profitability. The Trustees considered the annual management fee that the Fuller & Thaler Small-Cap Equity Fund pays to Fuller & Thaler, as well as the management fee that each of the Fuller & Thaler Unconstrained Equity Fund, the Fuller & Thaler SMID Fund, and the Fuller & Thaler Micro-Cap Equity Fund will pay to Fuller & Thaler under the Investment Advisory Agreement. The Trustees also considered Fuller & Thaler’s profitability from the services rendered to the Fuller & Thaler Small-Cap Equity Fund and noted that the Fund is profitable. The Trustees further considered Fuller & Thaler’s pro forma profitability statement with regard to the Fuller & Thaler Unconstrained Equity Fund, the Fuller & Thaler SMID Fund, and the Fuller & Thaler Micro-Cap Equity Fund and noted that these Funds are not likely to be profitable in the first year of operations. The Trustees further considered Fuller & Thaler’s commitment to contractually reduce its management fees and, if necessary, reimburse each Fuller & Thaler Fund’s operating expenses through January 31, 2020, as specified in the Expense Limitation Agreement presented in the board materials at the Meeting. The Trustees took note of the fact that Fuller & Thaler is receiving nearly its full management fee from the Fuller & Thaler Small-Cap Equity Fund and had begun to recoup previously waived advisory fees and/or reimbursed expenses. Lastly, the Trustees noted that Fuller & Thaler subsidizes the costs of distribution services rendered to the Fuller & Thaler Small-Cap Equity Fund in excess of amounts accrued and payable pursuant to the Fund’s Rule 12b-1 Distribution Plan.
Comparative Fee and Expense Data. The Trustees noted that the Fuller & Thaler Small-Cap Equity Fund’s management fee is lower than the average and median gross management fee reported for the Small-Cap Blend Morningstar peer group category. The Trustees noted that the proposed management fee of the Fuller & Thaler Unconstrained Equity Fund and the Fuller & Thaler SMID Fund were each in line with the average and median gross management fee reported for its respective Morningstar peer group category. The Trustees further noted that the management fee proposed for the Fuller & Thaler Micro-Cap Equity Fund is slightly above the average and median of the custom adviser-selected peer group. The Trustees then noted that the Fuller & Thaler Small-Cap Equity Fund’s net total expense ratio and gross total expense ratio (reflected both with and without fee waivers and expense reimbursements) are each below the average and median net total expense ratio and gross total expense ratio reported for the Small-Cap Blend Morningstar peer group category. The Trustees noted that the Fuller & Thaler Unconstrained Equity Fund’s net total expense ratio (reflected with fee waivers and expense reimbursements) is below the average and median net total expense ratios reported for the Small-Cap Blend Morningstar peer group category and the Fund’s gross total expense ratio (reflected without fee waivers and expense reimbursements) is above the average and median gross total expense ratios reported for the same peer group category. The Trustees noted that the Fuller & Thaler SMID Fund’s net total expense ratio (reflected with fee waivers and expense reimbursements) is below the average and median net total expense ratios reported for the custom Small- and Mid-Cap Blend combined Morningstar peer group category and that the Fund’s gross total expense ratio (reflected without fee waivers and expense reimbursements) is above the average and median gross total expense ratios reported for the same custom peer group category. The Trustees noted that the Fuller & Thaler Micro-Cap Equity Fund’s net total expense ratio (reflected with fee waivers and expense reimbursements) is slightly above the average and median net total expense ratios report for Fuller & Thaler’s custom peer group, and that the Fund’s gross total expense ratio (reflected without fee waivers and expense reimbursements) is above the average and median gross total expense ratios reported for the same custom peer group. They further considered the fees charged by Fuller & Thaler’s to separately managed accounts and sub-advisory relationships with similar investment
73
Approval of Investment Advisory Agreement (Unaudited)
(continued)
objectives and strategies to those of each Fuller & Thaler Fund, noting the differences in the services provided to those accounts compared to the services provided to each Fuller & Thaler Fund. In particular, they noted that Fuller & Thaler has significant additional responsibilities with respect to the Fuller & Thaler Funds, including compliance, reporting and operational responsibilities. While recognizing that it is difficult to compare advisory fees because the scope of advisory services provided may vary from one investment adviser to another, or from one investment product to the other, the Trustees concluded that the respective advisory fee that Fuller & Thaler will charge with respect to each of the Fuller & Thaler Funds is reasonable.
Economies of Scale. The Trustees also considered whether the Fuller & Thaler Funds may benefit from any economies of scale. The Trustees noted that given the low management fee of the Fuller & Thaler Small-Cap Equity Fund relative to other funds in the same Morningstar Category, fee breakpoints would not be appropriate at the current time. The Trustees also determined that it would not be appropriate to implement fee breakpoints with regard to the management fees of the Fuller & Thaler Unconstrained Equity Fund, the Fuller & Thaler SMID Fund, and the Fuller & Thaler Micro-Cap Equity Fund, noting that these Funds are newly organized and that an increase in assets in the near term would mostly likely not decrease the scope of advisory services that Fuller & Thaler would need to provide to the Funds. The Trustees concluded that the Fuller & Thaler Funds are not likely to benefit from any economies of scale at this time.
Other Benefits. The Trustees considered the extent to which Fuller & Thaler utilizes soft dollar arrangements with respect to portfolio transactions, and noted that Fuller & Thaler does utilize soft dollar arrangements consistent with the Section 28(e) safe harbor in connection with the execution of client transactions. They also noted however, that affiliated brokers will not be utilized to execute the portfolio transactions of the Fuller & Thaler Funds. The Trustees concluded that, all things considered, Fuller & Thaler will not receive additional material financial benefits from services rendered to the Fuller & Thaler Funds.
74
FACTS | WHAT DOES CAPITOL SERIES TRUST DO WITH YOUR PERSONAL INFORMATION? |
| | |
Why? | Financial companies choose how they share your personal information. Federal law gives consumers the right to limit some but not all sharing. Federal law also requires us to tell you how we collect, share, and protect your personal information. Please read this notice carefully to understand what we do. |
| | |
What? | The types of personal information we collect and share depend on the product or service you have with us. This information can include: ■ Social Security number ■ account balances and account transactions ■ transaction or loss history and purchase history ■ checking account information and wire transfer instructions When you are no longer our customer, we continue to share your information as described in this notice. |
| | |
How? | All financial companies need to share customers’ personal information to run their everyday business. In the section below, we list the reasons financial companies can share their customers’ personal information; the reasons Capitol Series Trust chooses to share; and whether you can limit this sharing. |
Reasons we can share your personal information | Does Capitol Series
Trust share? |
For our everyday business purposes—
such as to process your transactions, maintain your account(s), respond to court orders and legal investigations, or report to credit bureaus | Yes |
For our marketing purposes—
to offer our products and services to you | Yes |
For joint marketing with other financial companies | No |
For our affiliates’ everyday business purposes—
information about your transactions and experiences | No |
For our affiliates’ everyday business purposes—
information about your creditworthiness | No |
For nonaffiliates to market to you | No |
Questions? | Call (888) 912-4562 |
75
Who we are |
Who is providing this notice? | Capitol Series Trust |
What we do |
How does Capitol Series Trust protect my personal information? | To protect your personal information from unauthorized access and use, we use security measures that comply with federal law. These measures include computer safeguards and secured files and buildings. |
How does Capitol Series Trust collect my personal information? | We collect your personal information, for example, when you ■ open an account or deposit money ■ buy securities from us or sell securities to us ■ make deposits or withdrawals from your account provide account information ■ give us your account information ■ make a wire transfer ■ tell us who receives the money ■ tell us where to send the money ■ show your government-issued ID ■ show your driver’s license |
Why can’t I limit all sharing? | Federal law gives you the right to limit only ■ sharing for affiliates’ everyday business purposes — information about your creditworthiness ■ affiliates from using your information to market to you ■ sharing for nonaffiliates to market to you State laws and individual companies may give you additional rights to limit sharing. |
Definitions |
Affiliates | Companies related by common ownership or control. They can be financial and nonfinancial companies. |
Nonaffiliates | Companies not related by common ownership or control. They can be financial and nonfinancial companies. ■ Capitol Series Trust does not share your personal information with nonaffiliates so they can market to you. |
Joint marketing | A formal agreement between nonaffiliated financial companies that together market financial products or services to you. ■ Capitol Series Trust doesn’t jointly market financial products or services to you. |
76
This page is intentionally left blank.
Proxy Voting (Unaudited)
A description of the policies and procedures that the Funds use to determine how to vote proxies relating to portfolio securities and information regarding how each Fund voted those proxies during the most recent twelve month period ended June 30, is available without charge upon request by (1) calling the Funds at (888) 912-4562 and (2) from Funds documents filed with the Securities and Exchange Commission (“SEC”) on the SEC’s website at www.sec.gov.
TRUSTEES
Walter B. Grimm, Chairman
John C. Davis
Robert G. Dorsey
Lori Kaiser
Janet Smith Meeks
Mary M. Morrow
OFFICERS
Matthew J. Miller, Chief Executive Officer and President
Zachary P. Richmond, Treasurer and Chief Financial Officer
Martin R. Dean, Interim Chief Compliance Officer
INVESTMENT ADVISER
Fuller & Thaler Asset Management, Inc.
411 Borel Avenue, Suite 300
San Mateo, CA 94402
DISTRIBUTOR
Unified Financial Securities, LLC
9465 Counselors Row, Suite 200
Indianapolis, IN 46240
INDEPENDENT REGISTERED PUBLIC ACCOUNTING FIRM
Ernst & Young LLP
800 Yard Street, Suite 200
Grandview Heights, OH 43212
LEGAL COUNSEL
Bernstein Shur
100 Middle Street, 6th Floor
Portland, ME 04104
CUSTODIAN
Huntington National Bank
41 South High Street
Columbus, OH 43215
ADMINISTRATOR, TRANSFER AGENT AND FUND ACCOUNTANT
Ultimus Fund Solutions, LLC
225 Pictoria Drive, Suite 450
Cincinnati, OH 45246
This report is intended only for the information of shareholders or those who have received the Funds’ prospectus which contains information about the Funds’ management fee and expenses. Please read the prospectus carefully before investing.
Distributed by Unified Financial Securities, LLC
Member FINRA/SIPC

Alta Quality Growth Fund
Institutional Shares – AQLGX
Semi-Annual Report
March 31, 2019
Beginning on January 1, 2021, as permitted by regulations adopted by the Securities and Exchange Commission, paper copies of the Fund’s shareholder reports like this one will no longer be sent by mail, unless you specifically request paper copies of the reports from the Fund or from your financial intermediary such as a broker-dealer or bank. Instead, the reports will be made available on a website, and you will be notified by mail each time a report is posted and provided with a website link to access the report.
If you already elected to receive shareholder reports electronically, you will not be affected by this change and you need not take any action. You may elect to receive shareholder reports and other communications from the Fund electronically by contacting the Fund at (800) 957-0681 or, if you own these shares through a financial intermediary, you may contact your financial intermediary.
You may elect to receive all future reports in paper free of charge. You can inform the Fund that you wish to continue receiving paper copies of your shareholder reports by contacting the Fund at (800) 957-0681. If you own shares through a financial intermediary, you may contact your financial intermediary or follow instructions included with this document to elect to continue to receive paper copies of your shareholder reports. Your election to receive reports in paper will apply to all funds held with the fund complex or at your financial intermediary.
Alta Capital Management, LLC
6440 South Wasatch Boulevard, Suite 260
Salt Lake City, Utah 84121
(800) 957-0681
Investment Results (Unaudited)
Total Returns(a) as of March 31, 2019
| | Since Inception
(12/19/2018) |
Alta Quality Growth Fund - Institutional Shares | 14.80% |
S&P 500® Index (b) | 13.70% |
Russell 1000® Growth Index (c) | 16.47% |
| | Expense Ratios(d) |
| | Institutional
Shares |
Gross | 1.92% |
With Applicable Waivers | 0.79% |
The performance quoted represents past performance, which does not guarantee future results. The investment return and principal value of an investment will fluctuate so that an investor’s shares, when redeemed, may be worth more or less than their original cost. The returns shown do not reflect deduction of taxes that a shareholder would pay on Alta Quality Growth Fund (the “Fund”) distributions or the redemption of Fund shares. Current performance of the Fund may be lower or higher than the performance quoted. The Fund’s investment objectives, risks, charges and expenses must be considered carefully before investing. Performance data current to the most recent month end may be obtained by calling (800) 957-0681.
(a) Return figures reflect any change in price per share and assume the reinvestment of all distributions. The Fund’s returns reflect any fee reductions during the applicable period and exclude the redemption fee. If such fee reductions had not occurred, the quoted performance would have been lower. Total returns for periods less than one year are not annualized.
(b) The S&P 500® Index (“Index”) is a widely recognized unmanaged index of equity securities and is representative of a broader domestic equity market and range of securities than is found in the Fund’s portfolio. Individuals cannot invest directly in the Index; however, an individual can invest in exchange-traded funds or other investment vehicles that attempt to track the performance of a benchmark index.
(c) The Russell 1000® Growth Index is a widely recognized unmanaged index of equity securities and is representative of a broader domestic equity market and range of securities than is found in the Fund’s portfolio. Individuals cannot invest directly in an index; however, an individual can invest in exchange traded funds or other investment vehicles that attempt to track the performance of a benchmark index.
(d) The expense ratios are from the Fund’s prospectus dated December 19, 2018. Alta Capital Management, LLC, the Fund’s adviser (the “Adviser”), has contractually agreed to waive its management fee and/or reimburse expenses so that total annual operating expenses for the Fund (excluding (i) interest; (ii) taxes; (iii) brokerage fees and commissions; (iv) other extraordinary expenses not incurred in the ordinary course of the Fund’s business; (v) dividend expense on short sales; and (vi) indirect expenses such as acquired fund fees and expenses) do not exceed 0.79% of the average daily net assets of the Fund through January 31, 2020 (the “Expense Limitation”). The Expense Limitation is expected to continued from year to year thereafter. During any fiscal year that the Investment Advisory Agreement between the Adviser and Capitol Series Trust (the “Trust”) is in effect, the Adviser may recoup the sum of all fees previously waived or expenses reimbursed, less any reimbursement previously paid, provided that the Adviser is only permitted to recoup fees or expenses within 36 months from the date the fee waiver or expemse reimbursement first occured and provided further that such recoupment can be achieved within the Expense Limitation Agreement currently in effect and the Expense Limitation Agreement in place when the waiver/reimbursement occurred. This Expense Limitation Agreement may not be terminated by the Adviser prior to its expiration date, but the Board of Trustees (the “Board”) may terminate such agreement at any time. The Expense Limitation Agreement terminates automatically upon the termination of the Advisory Agreement with the Adviser. Additional information pertaining to the Fund’s expense raios as of March 31, 2019, can be found in the financial highlights.
The Fund’s investment objectives, strategies, risks, charges and expenses must be considered carefully before investing. The prospectus contains this and other important information about the Fund and may be obtained by calling the same number as above. Please read it carefully before investing.
The Fund is distributed by Ultimus Fund Distributors, LLC, member FINRA/SIPC.
1
Fund Holdings (Unaudited)
March 31, 2019
The following chart gives a visual breakdown of the Fund’s sector holdings as a percentage of net assets.
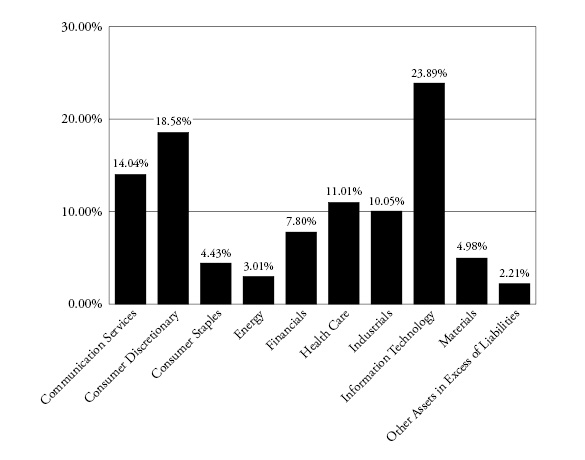
Availability of Portfolio Schedule (Unaudited)
The Fund files its complete schedule of portfolio holdings with the Securities and Exchange Commission (“SEC”) for the first and third quarters of each fiscal year within sixty days after the end of the period. The Fund’s portfolio holdings are available at the SEC’s website at www.sec.gov.
2
Alta Quality Growth Fund
Schedule of Investments (Unaudited)
March 31, 2019
| | Shares | | | Fair Value | |
COMMON STOCKS — 97.79% | | | | | | | | |
| | | | | | | | | |
Communication Services — 14.04% | | | | | | | | |
Alphabet, Inc., Class A(a) | | | 1,170 | | | $ | 1,376,960 | |
Facebook, Inc., Class A(a) | | | 6,650 | | | | 1,108,489 | |
Walt Disney Company (The) | | | 6,650 | | | | 738,350 | |
| | | | | | | | 3,223,799 | |
Consumer Discretionary — 18.58% | | | | | | | | |
Booking Holdings, Inc.(a) | | | 590 | | | | 1,029,497 | |
Dollar Tree, Inc.(a) | | | 7,730 | | | | 811,959 | |
Expedia Group, Inc. | | | 6,100 | | | | 725,900 | |
Home Depot, Inc. (The) | | | 5,050 | | | | 969,045 | |
TJX Companies, Inc. (The) | | | 13,700 | | | | 728,977 | |
| | | | | | | | 4,265,378 | |
Consumer Staples — 4.43% | | | | | | | | |
PepsiCo, Inc. | | | 3,700 | | | | 453,435 | |
Walgreens Boots Alliance, Inc. | | | 8,900 | | | | 563,103 | |
| | | | | | | | 1,016,538 | |
Energy — 3.01% | | | | | | | | |
Phillips 66 | | | 7,250 | | | | 689,983 | |
| | | | | | | | | |
Financials — 7.80% | | | | | | | | |
Berkshire Hathaway, Inc., Class B(a) | | | 2,550 | | | | 512,270 | |
S&P Global, Inc. | | | 3,025 | | | | 636,914 | |
Wells Fargo & Company | | | 13,300 | | | | 642,655 | |
| | | | | | | | 1,791,839 | |
Health Care — 11.01% | | | | | | | | |
Becton, Dickinson and Company | | | 2,650 | | | | 661,785 | |
CVS Health Corporation | | | 6,800 | | | | 366,724 | |
Thermo Fisher Scientific, Inc. | | | 3,200 | | | | 875,904 | |
Zoetis, Inc. | | | 6,200 | | | | 624,154 | |
| | | | | | | | 2,528,567 | |
Industrials — 10.05% | | | | | | | | |
Fortune Brands Home & Security, Inc. | | | 6,800 | | | | 323,748 | |
Middleby Corporation (The)(a) | | | 5,000 | | | | 650,150 | |
Union Pacific Corporation | | | 3,700 | | | | 618,640 | |
United Technologies Corporation | | | 5,540 | | | | 714,051 | |
| | | | | | | | 2,306,589 | |
Information Technology — 23.89% | | | | | | | | |
Amphenol Corporation, Class A | | | 7,600 | | | | 717,744 | |
Apple, Inc. | | | 8,850 | | | | 1,681,057 | |
Broadridge Financial Solutions, Inc. | | | 5,900 | | | | 611,771 | |
Cognizant Technology Solutions Corporation, Class A | | | 10,100 | | | | 731,745 | |
Mastercard, Inc., Class A | | | 3,750 | | | | 882,937 | |
Visa, Inc., Class A | | | 5,500 | | | | 859,045 | |
| | | | | | | | 5,484,299 | |
| | See accompanying notes which are an integral part of these financial statements. | 3 |
Alta Quality Growth Fund
Schedule of Investments (Unaudited) (continued)
March 31, 2019
| | Shares | | | Fair Value | |
COMMON STOCKS — (continued) | | | | | | | | |
| | | | | | | | | |
Materials — 4.98% | | | | | | | | |
Ecolab, Inc. | | | 2,080 | | | $ | 367,203 | |
Sherwin-Williams Company (The) | | | 1,800 | | | | 775,278 | |
| | | | | | | | 1,142,481 | |
| | | | | | | | | |
Total Common Stocks (Cost $19,675,790) | | | | | | | 22,449,473 | |
| | | | | | | | | |
Other Assets in Excess of Liabilities — 2.21% | | | | | | | 508,430 | |
| | | | | | | | | |
NET ASSETS — 100.00% | | | | | | $ | 22,957,903 | |
(a) | Non-income producing security. |
The sectors shown on the schedule of investments are based on the Global Industry Classification Standard, or GICS® (“GICS”). The GICS was developed by and/or is the exclusive property of MSCI, Inc. and Standard & Poor’s Financial Services LLC (“S&P”). GICS is a service mark of MSCI, Inc. and S&P and has been licensed for use by Ultimus Fund Solutions, LLC.
4 | See accompanying notes which are an integral part of these financial statements. | |
Alta Quality Growth Fund
Statement of Assets and Liabilities (Unaudited)
March 31, 2019
Assets |
Investments in securities at fair value (cost $19,675,790) | | $ | 22,449,473 | |
Cash | | | 511,466 | |
Dividends and interest receivable | | | 6,675 | |
Deferred offering costs | | | 7,521 | |
Receivable from Adviser | | | 8,029 | |
Total Assets | | | 22,983,164 | |
Liabilities | | | | |
Payable to Administrator | | | 6,994 | |
Payable to auditors | | | 8,446 | |
Payable to trustees | | | 612 | |
Other accrued expenses | | | 9,209 | |
Total Liabilities | | | 25,261 | |
Net Assets | | $ | 22,957,903 | |
Net Assets consist of: | | | | |
Paid-in capital | | $ | 20,000,010 | |
Accumulated earnings | | | 2,957,893 | |
Net Assets | | $ | 22,957,903 | |
Institutional Shares | | | | |
Net Assets | | $ | 22,957,903 | |
Shares outstanding | | | 2,000,001 | |
Net asset value, offering and redemption price per share | | $ | 11.48 | |
| | See accompanying notes which are an integral part of these financial statements. | 5 |
Alta Quality Growth Fund
Statement of Operations (Unaudited)
For the period ended March 31, 2019(a)
Investment Income | | | | |
Dividend income | | $ | 69,746 | |
Interest income | | | 8,818 | |
Total investment income | | | 78,564 | |
Expenses | | | | |
Investment Adviser | | | 45,487 | |
Fund accounting and fund administration | | | 13,551 | |
Organizational | | | 12,500 | |
Audit and tax preparation | | | 8,446 | |
Offering | | | 4,751 | |
Compliance services | | | 3,924 | |
Trustee | | | 3,737 | |
Legal | | | 3,635 | |
Transfer agent | | | 3,363 | |
Registration | | | 3,288 | |
Report printing | | | 2,950 | |
Custodian | | | 1,144 | |
Miscellaneous | | | 5,238 | |
Total expenses | | | 112,014 | |
Fees contractually waived and expenses reimbursed by Adviser | | | (64,037 | ) |
Net operating expenses | | | 47,977 | |
Net investment income | | | 30,587 | |
Net Realized and Change in Unrealized Gain (Loss) on Investments | | | | |
Net realized gain on investment securities transactions | | | 153,623 | |
Net change in unrealized appreciation of investment securities | | | 2,773,683 | |
Net realized and change in unrealized gain on investments | | | 2,927,306 | |
Net increase in net assets resulting from operations | | $ | 2,957,893 | |
(a) | For the period December 19, 2018 (commencement of operations) to March 31, 2019. |
6 | See accompanying notes which are an integral part of these financial statements. | |
Alta Quality Growth Fund
Statement of Changes in Net Assets
| | For the
Period Ended
March 31, 2019(a)
(Unaudited) | |
Increase (Decrease) in Net Assets due to: | | | | |
Operations | | | | |
Net investment income | | $ | 30,587 | |
Net realized gain on investment securities transactions | | | 153,623 | |
Net change in unrealized appreciation of investment securities | | | 2,773,683 | |
Net increase in net assets resulting from operations | | | 2,957,893 | |
Capital Transactions – Institutional Shares | | | | |
Proceeds from shares sold | | | 20,000,010 | |
Net increase in net assets resulting from capital transactions | | | 20,000,010 | |
Total Increase in Net Assets | | | 22,957,903 | |
Net Assets | | | | |
Beginning of period | | $ | — | |
End of period | | $ | 22,957,903 | |
Share Transactions – Institutional Shares | | | | |
Shares sold | | | 2,000,001 | |
Net increase in shares outstanding | | | 2,000,001 | |
(a) | For the period December 19, 2018 (commencement of operations) to March 31, 2019. |
| | See accompanying notes which are an integral part of these financial statements. | 7 |
Alta Quality Growth Fund - Institutional Shares
Financial Highlights
(For a share outstanding during the period)
| | | For the
Period Ended
March 31, 2019(a)
(Unaudited) | |
Selected Per Share Data | | | | |
Net asset value, beginning of period | | $ | 10.00 | |
Income from investment operations: | | | | |
Net investment income | | | 0.02 | |
Net realized and unrealized gain | | | 1.46 | |
Total from investment operations | | | 1.48 | |
Net asset value, end of period | | $ | 11.48 | |
Total Return(b) | | | 14.80 | %(c) |
| | | | | |
Ratios and Supplemental Data | | | | |
Net assets, end of period (000 omitted) | | $ | 22,958 | |
Before waiver or recoupment: | | | | |
Ratio of expenses to average net assets | | | 1.84 | %(d) |
After waiver or recoupment: | | | | |
Ratio of expenses to average net assets | | | 0.79 | %(d) |
Ratio of net investment income to average net assets | | | 0.50 | %(d) |
Portfolio turnover rate | | | 9 | %(c) |
(a) | For the period December 19, 2018 (commencement of operations) to March 31, 2019. |
(b) | Total return in the above table represents the rate that a shareholder would have earned or lost on an investment in the Fund, assuming reinvestment of dividends. |
8 | See accompanying notes which are an integral part of these financial statements. | |
Alta Quality Growth Fund
Notes to the Financial Statements (Unaudited)
March 31, 2019
NOTE 1. ORGANIZATION
The Alta Quality Growth Fund (the “Fund”) was organized as a diversified series of Capitol Series Trust (the “Trust”) on December 18, 2018. The Trust is an open-end investment company established under the laws of Ohio by an Agreement and Declaration of Trust dated September 18, 2013 (the “Trust Agreement”). The Trust Agreement permits the Board of Trustees of the Trust (the “Board”) to issue an unlimited number of shares of beneficial interest of separate series without par value. The Fund is one of a series of funds currently authorized by the Board. The Fund’s investment adviser is Alta Capital Management, LLC (the “Adviser”). The investment objective of the Fund is to seek long-term growth of capital with lower than market volatility.
The Fund currently offers one class of shares, Institutional Shares. Each share represents an equal proportionate interest in the assets and liabilities belonging to the Fund and is entitled to such dividends and distributions out of income belonging to the Fund as are declared by the Board.
NOTE 2. SIGNIFICANT ACCOUNTING POLICIES
The Fund is an investment company and follows accounting and reporting guidance under Financial Accounting Standards Board Accounting Standards Codification (“ASC”) Topic 946, “Financial Services-Investment Companies”. The following is a summary of significant accounting policies followed by the Fund in the preparation of its financial statements. These policies are in conformity with generally accepted accounting principles in the United States of America (“GAAP”).
Estimates – The preparation of financial statements in conformity with GAAP requires management to make estimates and assumptions that affect the reported amounts of assets and liabilities and disclosure of contingent assets and liabilities at the date of the financial statements and the reported amounts of increases and decreases in net assets from operations during the reporting period. Actual results could differ from those estimates.
Foreign Currency Translation – The accounting records of the Fund are maintained in U.S. dollars. Foreign currency amounts are translated into U.S. dollars at the current rate of exchange each business day to determine the value of investments, and other assets and liabilities. Purchases and sales of foreign securities, and income and expenses, are translated at the prevailing rate of exchange on the respective date of these transactions. The Fund does not isolate that portion of the results of operations resulting from changes in foreign exchange rates on investments from fluctuation arising from changes in market prices of securities held. These fluctuations are included with the unrealized gain or loss from investments.
9
Alta Quality Growth Fund
Notes to the Financial Statements (Unaudited) (continued)
March 31, 2019
Federal Income Taxes – The Fund makes no provision for federal income or excise tax. The Fund intends to qualify each year as a regulated investment company (“RIC”) under subchapter M of the Internal Revenue Code of 1986, as amended, by complying with the requirements applicable to RICs and by distributing substantially all of its taxable income. The Fund also intends to distribute sufficient net investment income and net realized capital gains, if any, so that it will not be subject to excise tax on undistributed income and gains. If the required amount of net investment income or gains is not distributed, the Fund could incur a tax expense.
The Fund may be subject to taxes imposed by countries in which it invests. Such taxes are generally based on income and/or capital gains earned or repatriated. Taxes are accrued and applied to net investment income, net realized gains and unrealized appreciation as such income and/or gains are earned.
The Fund recognizes tax benefits or expenses of uncertain tax positions only when the position is “more likely than not” to be sustained assuming examination by tax authorities. Management of the Fund has reviewed tax positions taken in tax years that remain subject to examination by all major tax jurisdictions, including federal (i.e., the interim tax period since commencement of operations, as applicable) and has concluded that no provision for unrecognized tax benefits or expenses is required in these financial statements and does not expect this to change over the next twelve months. The Fund recognizes interest and penalties, if any, related to unrecognized tax benefits as income tax expense in the Statement of Operations. During the period, the Fund did not incur any interest or penalties.
Expenses – Expenses incurred by the Trust that do not relate to a specific fund of the Trust are allocated to the individual funds based on each fund’s relative net assets or another appropriate basis (as determined by the Board).
Security Transactions and Related Income – Throughout the reporting period, security transactions are accounted for no later than one business day following the trade date. For financial reporting purposes, security transactions are accounted for on trade date on the last business day of the reporting period. The specific identification method is used for determining gains or losses for financial statements and income tax purposes. Dividend income is recorded on the ex-dividend date. Interest income is recorded on an accrual basis and includes, where applicable, the amortization of premium or accretion of discount. Discounts and premiums on fixed income securities are accreted or amortized over the life of the respective securities using the effective interest method.
Dividends and Distributions – The Fund intends to distribute its net investment income and net realized long-term and short-term capital gains, if any, at least annually. Dividends and distributions to shareholders, which are determined in accordance with income tax regulations, are recorded on the ex-dividend date. The treatment for financial reporting purposes of distributions made to shareholders during the period from net investment
10
Alta Quality Growth Fund
Notes to the Financial Statements (Unaudited) (continued)
March 31, 2019
income or net realized capital gains may differ from their ultimate treatment for federal income tax purposes. These differences are caused primarily by differences in the timing of the recognition of certain components of income, expense or realized capital gain for federal income tax purposes. Where such differences are permanent in nature, they are reclassified in the components of net assets based on their ultimate characterization for federal income tax purposes. Any such reclassifications will have no effect on net assets, results of operations or net asset value per share (“NAV”) of the Fund.
Organization and Offering Costs – The Adviser advanced some of the Fund’s organization and initial offering costs and was subsequently reimbursed by the Fund. Costs of $12,272 incurred in connection with the offering and initial registration of the Fund have been deferred and are being amortized on a straight-line basis over the first twelve months after commencement of operations. There were $7,521 in unamortized offering costs remaining as of March 31, 2019. Costs of $12,500 incurred in connection with the organization of the Fund were expensed as incurred.
NOTE 3. SECURITIES VALUATION AND FAIR VALUE MEASUREMENTS
Fair value is defined as the price that the Fund would receive upon selling an investment in a timely transaction to an independent buyer in the principal or most advantageous market of the investment. GAAP establishes a three-tier hierarchy to maximize the use of observable market data and minimize the use of unobservable inputs and to establish classification of fair value measurements for disclosure purposes.
Inputs refer broadly to the assumptions that market participants would use in pricing the asset or liability, including assumptions about risk (the risk inherent in a particular valuation technique used to measure fair value including a pricing model and/or the risk inherent in the inputs to the valuation technique). Inputs may be observable or unobservable. Observable inputs are inputs that reflect the assumptions market participants would use in pricing the asset or liability developed based on market data obtained and available from sources independent of the reporting entity. Unobservable inputs are inputs that reflect the reporting entity’s own assumptions about the assumptions market participants would use in pricing the asset or liability developed based on the best information available in the circumstances.
Various inputs are used in determining the value of the Fund’s investments. These inputs are summarized in the three broad levels listed below.
| | ● | Level 1 – unadjusted quoted prices in active markets for identical investments and/or registered investment companies where the value per share is determined and published and is the basis for current transactions for identical assets or liabilities at the valuation date |
11
Alta Quality Growth Fund
Notes to the Financial Statements (Unaudited) (continued)
March 31, 2019
| | ● | Level 2 – other significant observable inputs (including, but not limited to, quoted prices for an identical security in an inactive market, quoted prices for similar securities, interest rates, prepayment speeds, credit risk, etc.) |
| | ● | Level 3 – significant unobservable inputs (including the Fund’s own assumptions in determining fair value of investments based on the best information available) |
The inputs used to measure fair value may fall into different levels of the fair value hierarchy. In such cases, for disclosure purposes, the level in the fair value hierarchy which is reported, is determined based on the lowest level input that is significant to the fair value measurement in its entirety.
In computing the NAV of the Fund, fair value is based on market valuations with respect to portfolio securities for which market quotations are readily available. Pursuant to Board approved policies, the Fund relies on independent third-party pricing services to provide the current market value of securities. Those pricing services value equity securities, including exchange-traded funds, exchange-traded notes, closed-end funds and preferred stocks, traded on a securities exchange at the last reported sales price on the principal exchange. Equity securities quoted by NASDAQ are valued at the NASDAQ Official Closing Price. If there is no reported sale on the principal exchange, equity securities are valued at the mean between the most recent quoted bid and asked price. When using the market quotations or close prices provided by the pricing service and when the market is considered active, the security will be classified as a Level 1 security. Investments in open-end mutual funds, including money market mutual funds, are generally priced at the ending NAV provided by the pricing service of the funds and are generally categorized as Level 1 securities. Debt securities are valued using evaluated prices furnished by a pricing vendor selected by the Board and are generally classified as Level 2 securities.
In the event that market quotations are not readily available, the Adviser determines that the market quotation or the price provided by the pricing service does not accurately reflect the current fair value, or certain restricted or illiquid securities are being valued, such securities are valued as determined in good faith by the Trust’s Valuation Committee, based on recommendations from a pricing committee comprised of various officers of the Trust, various employees of the Fund’s administrator, and representatives of the Adviser (together the “Pricing Review Committee”). These securities will be classified as Level 2 or 3 within the fair value hierarchy, depending on the inputs used.
In accordance with the Trust’s Valuation Procedures, the Pricing Review Committee in making its recommendations is required to consider all appropriate factors relevant to the value of securities for which it has determined other pricing sources are not available or reliable as described above. No single standard exists for determining fair value, because fair value depends upon the circumstances of each individual case. As a general principle, the current fair value of an issue of securities being valued pursuant to the Trust’s Fair Valuation
12
Alta Quality Growth Fund
Notes to the Financial Statements (Unaudited) (continued)
March 31, 2019
Procedures would be the amount which the Fund might reasonably expect to receive for them upon their current sale. Methods which are in accordance with this principle may, for example, be based on (i) a multiple of earnings; (ii) a discount from market prices of a similar freely traded security (including a derivative security or a basket of securities traded on other markets, exchanges or among dealers); or (iii) yield to maturity with respect to debt issues, or a combination of these and other methods. Fair value pricing is permitted if, in accordance with the Trust’s Valuation Procedures, the validity of market quotations appears to be questionable based on factors such as evidence of a thin market in the security based on a small number of quotations, a significant event occurs after the close of a market but before the Fund’s NAV calculation that may affect a security’s value, or other data calls into question the reliability of market quotations.
The following is a summary of the inputs used to value the Fund’s investments as of March 31, 2019:
| | | Valuation Inputs | | | | | |
Assets | | Level 1 | | | Level 2 | | | Level 3 | | | Total | |
Common Stocks(a) | | $ | 22,449,473 | | | $ | — | | | $ | — | | | $ | 22,449,473 | |
(a) | Refer to Schedule of Investments for sector classifications. |
The Fund did not hold any investments at the end of the reporting period in which significant unobservable inputs (Level 3) were used in determining fair value; therefore, no reconciliation of Level 3 securities is included for this reporting period. The Fund did not hold any derivative instruments during the reporting period.
NOTE 4. FEES AND OTHER TRANSACTIONS WITH AFFILIATES AND OTHER SERVICE PROVIDERS
Under the terms of the investment advisory agreement (the “Agreement”), the Adviser manages the Fund’s investments subject to approval of the Board. As compensation for its management services, the Fund is obligated to pay the Adviser a fee computed and accrued daily and paid monthly at an annual rate of 0.75% of the Fund’s average daily net assets. For the period ended March 31, 2019, the Adviser earned fees of $45,487 from the Fund. At March 31, 2019, the Adviser owed the Fund $8,029.
The Adviser has contractually agreed to waive its management fee and/or reimburse expenses so that total annual operating expenses (excluding (i) interest; (ii) taxes; (iii) brokerage fees and commissions; (iv) other extraordinary expenses not incurred in the ordinary course of the Fund’s business; (v) dividend expenses on short sales; and (vi) indirect expenses such as acquired fund fees and expenses) do not exceed 0.79% of the Fund’s Institutional Shares average daily net assets through January 31, 2020 (“Expense Limitation”). During any fiscal year that the Agreement between the Adviser and the Trust is in effect, the Adviser may recoup the sum of all fees previously waived or expenses reimbursed, less any reimbursement
13
Alta Quality Growth Fund
Notes to the Financial Statements (Unaudited) (continued)
March 31, 2019
previously paid, provided that the Adviser is only permitted to recoup fees or expenses within 36 months from the date the fee waiver or expense reimbursement took effect and provided further that such recoupment can be achieved within the Expense Limitation currently in effect and the Expense Limitation in place when the waiver/reimbursement occurred. This expense cap agreement may be terminated by the Board at any time. As of March 31, 2019, the Adviser may seek repayment of investment advisory fee waivers and expense reimbursements in the amount of $64,037 from the Fund no later than March 31, 2022.
The Trust retains Ultimus Fund Solutions, LLC (the “Administrator”) to provide the Fund with administration, compliance, fund accounting and transfer agent services, including all regulatory reporting. For the period ended March 31, 2019, the Administrator earned fees of $13,551 for fund accounting and administration services, $3,924 for compliance services, and $3,363 for transfer agent services. At March 31, 2019, the Fund owed the Administrator $6,994 for such services.
The Board supervises the business activities of the Trust. Each Trustee serves as a Trustee for the lifetime of the Trust or until the earlier of his or her retirement as a Trustee at age 78 (which may be extended for up to two years in an emeritus non-voting capacity at the pleasure and request of the Board), or until he/she dies, resigns, or is removed, whichever is sooner. “Independent Trustees,” meaning those Trustees who are not “interested persons” as defined in the Investment Company Act of 1940 (“1940 Act”) of the Trust, each receives an annual retainer of $500 per Fund and $500 per Fund for each quarterly in-person Board meeting. In addition, the Trust reimburses Trustees for out-of-pocket expense incurred in conjunction with attendance at Board meetings.
The officers and one Trustee of the Trust are employees of the Administrator. Ultimus Fund Distributors, LLC (the “Distributor”) acts as the principal distributor of the Fund’s shares. The Distributor operates as wholly-owned subsidiary of Ultimus Fund Solutions, LLC.
NOTE 5. PURCHASES AND SALES OF SECURITIES
For the period ended March 31, 2019, purchases and sales of investment securities, other than short-term investments, were $21,427,959 and $1,905,793, respectively.
There were no purchases or sales of long-term U.S. government obligations during the period ended March 31, 2019.
14
Alta Quality Growth Fund
Notes to the Financial Statements (Unaudited) (continued)
March 31, 2019
NOTE 6. FEDERAL TAX INFORMATION
At March 31, 2019, the net unrealized appreciation (depreciation) of investments for tax purposes was as follows:
Gross unrealized appreciation | | $ | 2,911,743 | |
Gross unrealized depreciation | | | (138,060 | ) |
Net unrealized appreciation/(depreciation) on investments | | $ | 2,773,683 | |
Tax cost of investments | | $ | 19,675,790 | |
NOTE 7. COMMITMENTS AND CONTINGENCIES
The Trust indemnifies its officers and trustees for certain liabilities that may arise from their performance of their duties to the Trust or the Fund. Additionally, in the normal course of business, the Trust enters into contracts that contain a variety of representations and warranties which provide general indemnifications. The Trust’s maximum exposure under these arrangements is unknown, as this would involve future claims that may be made against the Trust that have not yet occurred.
NOTE 8. RECENT ACCOUNTING PRONOUNCEMENTS
In August 2018, the Financial Accounting Standards Board (“FASB”) issued Accounting Standards Update (“ASU”) 2018-13, which changes the fair value measurement disclosure requirements of FASB Accounting Standards Codification Topic 820, Fair Value Measurement. The update to Topic 820 includes new, eliminated, and modified disclosure requirements. ASU 2018-13 is effective for fiscal years beginning after December 15, 2019, including interim periods, although early adoption is permitted. Management has evaluated the implications of certain provisions of ASU 2018-13 and has determined to early adopt all aspects related to the removal and modification of certain fair value measurement disclosures under the ASU effective immediately.
NOTE 9. SUBSEQUENT EVENTS
Management of the Fund has evaluated the need for disclosures and/or adjustments resulting from subsequent events through the date these financial statements were issued. Based upon this evaluation, management has determined there were no items requiring adjustment of the financial statements or additional disclosure.
15
Summary of Fund Expenses (Unaudited)
As a shareholder of the Fund, you incur two types of costs: (1) transaction costs and (2) ongoing costs, including management fees, and other Fund expenses. These examples are intended to help you understand your ongoing costs (in dollars) of investing in the Fund and to compare these costs with the ongoing costs of investing in other mutual funds.
The Example is based on an investment of $1,000 invested at the beginning of the period and held for the entire period (October 1, 2018 through March 31, 2019).
Actual Expenses
The first line of the table provides information about actual account values and actual expenses. You may use the information in these lines, together with the amount you invested, to estimate the expenses that you paid over the period. Simply divide your account value by $1,000 (for example, an $8,600 account value divided by $1,000 = 8.60), then multiply the result by the number in the first line under the heading “Expenses Paid During Period” to estimate the expenses you paid on your account during this period.
Hypothetical Example for Comparison Purposes
The second line of the table provides information about hypothetical account values and hypothetical expenses based on the Fund’s actual expense ratios and an assumed rate of return of 5% per year before expenses, which is not the Fund’s actual return. The hypothetical account values and expenses may not be used to estimate the actual ending account balances or expenses you paid for the period. You may use this information to compare the ongoing costs of investing in the Fund and other funds. To do so, compare this 5% hypothetical example with the 5% hypothetical examples that appear in the shareholder reports of the other funds.
Expenses shown in the table are meant to highlight your ongoing costs only. Therefore, the second line of the table is useful in comparing ongoing costs only and will not help you determine the relative total costs of owning different funds. In addition, if transaction costs were included, your costs would have been higher.
16
Summary of Fund Expenses (Unaudited) (continued)
| | | Beginning
Account Value,
October 1,
2018 | Ending
Account Value,
March 31,
2019 | Expenses Paid
During
Period | Annualized
Expense
Ratio |
Alta Quality Growth Fund | | | |
Institutional Shares | Actual | $ 1,000.00 | $ 1,148.00 | $ 2.37(a) | 0.79% |
| | | | | | |
| | Hypothetical(b) | $ 1,000.00 | $ 1,020.99 | $ 3.99 | 0.79% |
(a) | Expenses are equal to the Fund’s annualized expense ratios, multiplied by the average account value over the period, multiplied by 102/365 (to reflect the period since commencement of operations on December 19, 2018). The annualized expense ratios reflect reimbursement of expenses by the Fund’s Adviser for the period beginning December 19, 2018 to March 31, 2019. The “Financial Highlights” tables in the Fund’s financial statements, included in the report, also show the gross expense ratio, without such reimbursements. |
(b) | Assumes a 5% return before expenses. The hypothetical example is calculated based on a six month period from October 1, 2018 to March 31, 2019. Accordingly, expenses are equal to the Fund’s annualized expense ratios, multiplied by the average account value over the six month period, multiplied by 182/365 (to reflect the one-half year period). |
Approval of Investment Advisory Agreement (Unaudited)
At a quarterly meeting of the Board of Trustees of Capitol Series Trust (the “Trust”) on December 17 and 18, 2018, the Trust’s Board of Trustees (the “Board”), including all of the Trustees who are not “interested persons” of the Trust (the “Independent Trustees”) as that term is defined in Section 2(a)(19) of the Investment Company Act of 1940, as amended (the “1940 Act”), considered and approved for an initial two-year period the Investment Advisory Agreement between the Trust and Alta Capital Management, LLC (“Alta”) (the “Investment Advisory Agreement”) with respect to the Alta Quality Growth Fund (the “Fund”), a series of the Trust.
Prior to the meeting, the Trustees received and considered information from Alta and the Trust’s administrator designed to provide the Trustees with the information necessary to evaluate the terms of the proposed Investment Advisory Agreement between the Trust and Alta, including, but not limited to, Alta’s response to counsel’s due diligence letter requesting information relevant to the approval of the Investment Advisory Agreement, the operating expense limitation agreement between the Trust and Alta (the “Expense Limitation Agreement”), and certain Morningstar peer group expense data for comparison purposes (collectively, the “Support Materials”). At various times, the Trustees reviewed the Support Materials with Alta, Trust management, and with counsel to the Independent Trustees. The completeness of the Support Materials provided by Alta, which included both responses and materials provided in response to initial and supplemental due diligence requests, was noted. Representatives from Alta met with the Trustees and provided further information, including but not limited to, the services it proposed to provide to the Fund, firm ownership, resources available to service the Fund, including compliance resources, other investment strategies managed by Alta, succession planning, and profitability. This
17
Approval of Investment Advisory Agreement
(Unaudited) (continued)
information formed the primary, but not exclusive, basis for the Board’s determinations. Before voting to approve the Investment Advisory Agreement, the Trustees reviewed the terms and the form of the Investment Advisory Agreement and the Support Materials with Trust management and with counsel to the Independent Trustees. The Trustees also received a memorandum from counsel discussing the legal standards for their consideration of the proposed Investment Advisory Agreement, which memorandum described the various factors that the U.S. Securities and Exchange Commission (“SEC”) and U.S. Courts over the years have suggested would be appropriate for trustee consideration in the advisory agreement approval process, including the factors outlined in the case of Gartenberg v. Merrill Lynch Asset Management Inc., 694 F.2d 923, 928 (2d Cir. 1982); cert. denied sub. nom. and Andre v. Merrill Lynch Ready Assets Trust, Inc., 461 U.S. 906 (1983).
After having received and reviewed the Support Materials, as well as Alta’s presentation, and noting additional discussions with representatives of Alta that had occurred at various times, the Trustees determined that they had all of the information they deemed reasonably necessary to make an informed decision concerning the approval of the Investment Advisory Agreement. The Trustees discussed the facts and factors relevant to the approval of the Investment Advisory Agreement, which incorporated and reflected their knowledge of Alta’s services to be provided to the Fund. Based upon Alta’s presentation and the Support Materials, the Board concluded that the overall arrangements between the Trust and Alta as set forth in the Investment Advisory Agreement are fair and reasonable in light of the services Alta will perform, the investment advisory fees that the Fund will pay, and such other matters as the Trustees considered relevant in the exercise of their reasonable business judgment. The material factors and conclusions that formed the basis of the Trustees’ determination to approve the Investment Advisory Agreement are summarized below.
In determining whether to approve the Investment Advisory Agreement, the Trustees considered all factors they believed relevant with respect to the Fund, including the following: (1) the nature, extent, and quality of the services to be provided by Alta; (2) the cost of the services to be provided and the profits to be realized by Alta from services rendered to the Trust with respect to the Fund; (3) comparative fee and expense data for the Fund and other investment companies with similar investment objectives; (4) the extent to which economies of scale may be realized as the Fund grows and whether the advisory fee for the Fund reflects these economies of scale for the Fund’s benefit; and (5) other financial benefits to Alta resulting from services to be rendered to the Fund. In their deliberations, the Trustees did not identify any particular information that was all-important or controlling.
Nature, Extent and Quality of Services Provided. The Trustees considered the scope of services that Alta will provide under the Investment Advisory Agreement with respect to the Fund, which include but are not limited to the following: (1) providing overall supervisory responsibility for the general management and investment of the Fund’s securities portfolio, including providing pre-trade portfolio compliance; (2) investing or overseeing the investment of the Fund’s assets consistent with its investment objective and investment
18
Approval of Investment Advisory Agreement
(Unaudited) (continued)
policies; (3) directly managing the Fund’s assets and determining or overseeing the portfolio securities to be purchased, sold or otherwise disposed of, as well as the timing of such transactions; (4) voting or overseeing the voting of all proxies with respect to the Fund’s portfolio securities; (5) maintaining or overseeing the maintenance of the required books and records for transactions effected by Alta on behalf of the Fund; (6) selecting or overseeing the selection of broker-dealers to execute orders on behalf of the Fund; (7) conducting in-house proprietary quantitative analysis and fundamental research; (8) providing client facing support to institutional clients and financial advisory partners; (9) providing compliance management and oversight; and (10) providing marketing support. The Trustees considered Alta’s own capitalization separately and its assets under management and large-cap quality growth strategy’s long-term positive performance. The Trustees discussed the ownership structure of Alta, which is 70% owned by Guardian Capital LP (who acquired Alta in 2017) and 30% owned by legacy Alta employees. The Trustees considered the extensive investment industry experience of Alta’s portfolio management team. They also noted that Alta employs a single investment discipline titled “Quality Growth”, and that utilizing this discipline, the firm manages five distinct investment strategies. The Trustees also reviewed a GIPS compliant performance report prepared by Alta comparing the performance of the Alta Large Cap Quality Growth Composite relative to its benchmarks over a 10-year period from 2008 through 2017, noting that the composite had outperformed such benchmarks in certain years and over certain periods. The Trustees concluded that they were satisfied with the nature, extent and quality of services that Alta proposes to provide to the Fund under the Investment Advisory Agreement.
Cost of Advisory Services and Profitability. The Trustees considered the proposed annual management fee that the Fund will pay to Alta under the Investment Advisory Agreement, as well as Alta’s pro forma profitability analysis for services that it will render to the Fund. In this regard, the Trustees noted the commitment by Alta pursuant to an Expense Limitation Agreement whereby the expense cap proposed is only 4 basis points above the proposed management fee. The Trustees emphasized that Alta had contractually agreed to reimburse the Fund for its operating expenses, and to reduce its management fees to the extent necessary to ensure that Total Annual Fund Operating Expenses (excluding acquired fund fees and expenses, brokerage fees and commissions, dividend expense on short sales, interest, taxes, and extraordinary expenses) do not exceed the amount specified in the Expense Limitation Agreement. The Trustees considered the break-even points discussed by Alta in order for it to begin to realize a profit with regard to the Fund. The Trustees further reviewed Alta’s overall financial condition as it considered the firm’s financial ability to service and support the Fund. The Trustees also considered Alta’s projected profitability with respect to its advisory relationship with the Fund, and concluded that itis reasonable.
Comparative Fee and Expense Data. The Trustees also reviewed and discussed with Alta the projected advisory fee and contractual expenses of the Fund as compared to those of other funds in the Large-Cap Growth Morningstar peer group category. It was noted that
19
Approval of Investment Advisory Agreement
(Unaudited) (continued)
the peer group comparison was filtered by total net assets so that the Fund was compared to other similarly sized funds, and the appropriateness of this comparison was discussed. The Trustees discussed the appropriateness of the Morningstar peer group category selected for the comparison. The Trustees noted that the Fund’s proposed management fee was slightly higher than the median and average management fees reported for the Large-Cap Growth Morningstar peer group category. In addition, they considered that the total gross expense ratio of the Fund was lower than the average total gross expense ratio and higher than the median total gross expense ratio reported for the same Morningstar peer group category. The Board noted that the Fund’s total net expense ratio (inclusive of waivers and expense reimbursements) was lower than both the average and median total net expense ratio of the same Morningstar peer group category. The Trustees also compared the Fund’s proposed management fee against fees charged by Alta to its separately managed accounts with a similar investment strategy. The Trustees noted that while the fee structure charged to separately managed accounts is lower than the proposed management fee of the Fund, the extent and nature of services performed on behalf of the Fund is different. The Trustees also compared the proposed management fee of the Fund to the Transamerica Multi-Cap Growth Fund subadvised by Alta and noted that while the subadvisory fees are lower than the Fund’s proposed management fee, the services to be performed by Alta on behalf of the Fund vary significantly from and are for more extensive than the services that Alta provides as subadvisor to the Transamerica Multi-Cap Growth Fund. While recognizing that it is difficult to compare management fees because the scope of advisory services provided may vary from one investment adviser to another, the Trustees concluded that Alta’s proposed management fee is reasonable at this time.
Economies of Scale. The Trustees considered whether the Fund would benefit from any economies of scale, noting that breakpoints to the management fee for advisory services rendered on behalf of the Fund were not necessary or appropriate at this time. The Trustees noted that the Fund is newly organized and that an increase in assets would mostly likely not decrease the level of advisory services that Alta would need to provide to the Fund at the present time. The Trustees concluded that the Fund is not likely at near-term projected asset levels to benefit from any economies of scale.
Other Benefits. The Trustees noted that Alta had confirmed that it will not utilize soft dollar arrangements with respect to portfolio transactions in the Fund and does not anticipate the use of affiliated brokers to execute the Fund’s portfolio transactions. The Trustees concluded that Alta will not receive any other material financial benefits from services rendered to the Fund.
Other Considerations. The Trustees also considered potential conflicts of interest for Alta. Based on representations received from Alta, the Trustees concluded that no conflict of interest exists that could adversely impact the Fund, and that Alta and the Fund each has policies and procedures in place to address such conflict situations should they arise.
20
FACTS | WHAT DOES CAPITOL SERIES TRUST DO WITH YOUR PERSONAL INFORMATION? |
| | |
Why? | Financial companies choose how they share your personal information. Federal law gives consumers the right to limit some but not all sharing. Federal law also requires us to tell you how we collect, share, and protect your personal information. Please read this notice carefully to understand what we do. |
| | |
What? | The types of personal information we collect and share depend on the product or service you have with us. This information can include: ■ Social Security number ■ account balances and account transactions ■ transaction or loss history and purchase history ■ checking account information and wire transfer instructions When you are no longer our customer, we continue to share your information as described in this notice. |
| | |
How? | All financial companies need to share customers’ personal information to run their everyday business. In the section below, we list the reasons financial companies can share their customers’ personal information; the reasons Capitol Series Trust chooses to share; and whether you can limit this sharing. |
Reasons we can share your personal information | Does Capitol Series
Trust share? |
For our everyday business purposes—
such as to process your transactions, maintain your account(s), respond to court orders and legal investigations, or report to credit bureaus | Yes |
For our marketing purposes—
to offer our products and services to you | Yes |
For joint marketing with other financial companies | No |
For our affiliates’ everyday business purposes—
information about your transactions and experiences | No |
For our affiliates’ everyday business purposes—
information about your creditworthiness | No |
For nonaffiliates to market to you | No |
Questions? | Call (800) 957-0681 |
21
Who we are |
Who is providing this notice? | Capitol Series Trust |
What we do |
How does Capitol Series Trust protect my personal information? | To protect your personal information from unauthorized access and use, we use security measures that comply with federal law. These measures include computer safeguards and secured files and buildings. |
How does Capitol Series Trust collect my personal information? | We collect your personal information, for example, when you ■ open an account or deposit money ■ buy securities from us or sell securities to us ■ make deposits or withdrawals from your account provide account information ■ give us your account information ■ make a wire transfer ■ tell us who receives the money ■ tell us where to send the money ■ show your government-issued ID ■ show your driver’s license |
Why can’t I limit all sharing? | Federal law gives you the right to limit only ■ sharing for affiliates’ everyday business purposes — information about your creditworthiness ■ affiliates from using your information to market to you ■ sharing for nonaffiliates to market to you State laws and individual companies may give you additional rights to limit sharing. |
Definitions |
Affiliates | Companies related by common ownership or control. They can be financial and nonfinancial companies. |
Nonaffiliates | Companies not related by common ownership or control. They can be financial and nonfinancial companies. ■ Capitol Series Trust does not share your personal information with nonaffiliates so they can market to you. |
Joint marketing | A formal agreement between nonaffiliated financial companies that together market financial products or services to you. ■ Capitol Series Trust doesn’t jointly market financial products or services to you. |
22
This page is intentionally left blank.
This page is intentionally left blank.
This page is intentionally left blank.
Proxy Voting (Unaudited)
A description of the policies and procedures that the Fund uses to determine how to vote proxies relating to portfolio securities and information regarding how the Fund voted those proxies during the most recent twelve month period ended June 30, is available without charge upon request by (1) calling the Fund at (800) 957-0681 and (2) from Fund documents filed with the Securities and Exchange Commission (“SEC”) on the SEC’s website at www.sec.gov.
TRUSTEES
Walter B. Grimm, Chairman
John C. Davis
Robert G. Dorsey
Lori Kaiser
Janet Smith Meeks
Mary M. Morrow
OFFICERS
Matthew J. Miller, Chief Executive Officer and President
Zachary P. Richmond, Chief Financial Officer and Treasurer
Martin R. Dean, Interim Chief Compliance Officer
INVESTMENT ADVISER
Alta Capital Management, LLC
6440 South Wasatch Boulevard, Suite 260
Salt Lake City, Utah 84121
DISTRIBUTOR
Ultimus Fund Distributors, LLC
225 Pictoria Drive, Suite 450
Cincinnati, Ohio 45246
INDEPENDENT REGISTERED PUBLIC ACCOUNTING FIRM
Ernst & Young LLP
800 Yard Street, Suite 500
Grandview Heights, OH 43212
LEGAL COUNSEL
Bernstein Shur
100 Middle Street, 6th Floor
Portland, ME 04104
CUSTODIAN
Huntington National Bank
41 South High Street
Columbus, OH 43215
ADMINISTRATOR, TRANSFER AGENT AND FUND ACCOUNTANT
Ultimus Fund Solutions, LLC
225 Pictoria Drive, Suite 450
Cincinnati, OH 45246
This report is intended only for the information of shareholders or those who have received the Fund’s prospectus which contains information about the Fund’s management fee and expenses. Please read the prospectus carefully before investing.
Distributed by Ultimus Fund Distributors, LLC
Member FINRA/SIPC
Item 2. Code of Ethics.
NOT APPLICABLE – disclosed with annual report
Item 3. Audit Committee Financial Expert.
NOT APPLICABLE – disclosed with annual report
Item 4. Principal Accountant Fees and Services.
NOT APPLICABLE – disclosed with annual report
Item 5.Audit Committee of Listed Registrants.
NOT APPLICABLE – applies to listed companies only
Item 6.Schedule of Investments.Schedules filed with Item 1.
Item 7. Disclosure of Proxy Voting Policies and Procedures for Closed-End Management Investment Companies.
NOT APPLICABLE – applies to closed-end funds only
Item 8. Portfolio Managers of Closed-End Management Investment Companies.
NOT APPLICABLE – applies to closed-end funds only
Item 9. Purchases of Equity Securities by Closed-End Management Investment Company and Affiliated Purchasers.
NOT APPLICABLE – applies to closed-end funds only
Item 10. Submission of Matters to a Vote of Security Holders.
The guidelines applicable to shareholders desiring to submit recommendations for nominees to the Registrant's board of trustees are contained in the statement of additional information of the Trust with respect to the Fund(s) for which this Form N-CSR is being filed.
Item 11. Controls and Procedures.
(a) Based on their evaluation of the registrant’s disclosure controls and procedures (as defined in Rule 30a-3(c) under the Investment Company Act of 1940, as amended (the “Act”)) as of a date within 90 days of the filing date of this report, the registrant’s principal executive officer and principal financial officer have concluded that such disclosure controls and procedures are reasonably designed and are operating effectively to ensure that material information relating to the registrant is made known to them by others within those entities, particularly during the period in which this report is being prepared, and that the information required in filings on Form N-CSR is recorded, processed, summarized, and reported on a timely basis.
(b) There were no changes in the registrant’s internal control over financial reporting (as defined in Rule 30a-3(d) under the Investment Company Act of 1940) that occurred during the second fiscal quarter of the period covered by this report that have materially affected, or are reasonably likely to materially affect, the registrant’s internal control over financial reporting.
Item 12. Disclosure of Securities Lending Activities for Closed-End Management Investment Companies.
NOT APPLICABLE – applies to closed-end funds only
Item 13. Exhibits.
(a)(1) NOT APPLICABLE – filed with annual report
(a)(2) Certifications by the registrant's principal executive officer and principal financial officer, pursuant to Section 302 of the Sarbanes-Oxley Act of 2002 and required by Rule 30a-2under the Investment Company Act of 1940 are filed herewith.
(a)(3) Not applicable.
(b) Certification pursuant to 18 U.S.C. Section 1350, as adopted pursuant to Section 906 of the Sarbanes-Oxley Act of 2002 is filed herewith.
SIGNATURES
Pursuant to the requirements of the Securities Exchange Act of 1934 and the Investment Company Act of 1940, the registrant has duly caused this report to be signed on its behalf by the undersigned, thereunto duly authorized.
| (Registrant) | Capitol Series Trust | | |
| | | | |
| By (Signature and Title) | /s/ Matthew J. Miller | |
| | | Matthew J. Miller, Chief Executive Officer and President | |
| | | | |
| Date | 5/29/2019 | | |
Pursuant to the requirements of the Securities Exchange Act of 1934 and the Investment Company Act of 1940, this report has been signed below by the following persons on behalf of the registrant and in the capacities and on the dates indicated.
| By (Signature and Title) | /s/ Matthew J. Miller | |
| | | Matthew J. Miller, Chief Executive Officer and President | |
| | | | |
| Date | 5/29/2019 | | |
| | | | |
| By (Signature and Title) | /s/ Zachary P. Richmond | |
| | Zachary P. Richmond, Treasurer and Chief Financial Officer |
| | | | |
| Date | 5/29/2019 | | |