UNITED STATES
SECURITIES AND EXCHANGE COMMISSION
Washington, D.C. 20549
FORM N-CSR
CERTIFIED SHAREHOLDER REPORT OF REGISTERED
MANAGEMENT INVESTMENT COMPANIES
| Investment Company Act file number: 811-22895 |
Capitol Series Trust
(Exact name of registrant as specified in charter)
Ultimus Fund Solutions, LLC
225 Pictoria Drive, Suite 450
Cincinnati, OH 45246
(Address of principal executive offices) (Zip code)
Zachary P. Richmond
Ultimus Fund Solutions, LLC
225 Pictoria Drive, Suite 450
Cincinnati, OH 45246
(Name and address of agent for service)
| Registrant’s telephone number, including area code: | 513-587-3400 |
| Date of fiscal year end: | September 30 |
| Date of reporting period: | March 31, 2024 |
Form N-CSR is to be used by management investment companies to file reports with the Commission not later than 10 days after the transmission to stockholders of any report that is required to be transmitted to stockholders under Rule 30e-1 under the Investment Company Act of 1940 (17 CFR 270.30e-1). The Commission may use the information provided on Form N-CSR in its regulatory, disclosure review, inspection and policymaking roles.
A registrant is required to disclose the information specified by Form N-CSR, and the Commission will make this information public. A registrant is not required to respond to the collection of information contained in Form N-CSR unless the Form displays a currently valid Office of Management and Budget ("OMB") control number. Please direct comments concerning the accuracy of the information collection burden estimate and any suggestions for reducing the burden to Secretary, Securities and Exchange Commission, 450 Fifth Street, NW, Washington, DC 20549-0609. The OMB has reviewed this collection of information under the clearance requirements of 44 U.S.C. § 3507.
Item 1. Reports to Stockholders.
| (a) |
 |
| FullerThaler Behavioral Small-Cap Equity Fund |
| FullerThaler Behavioral Small-Cap Growth Fund |
| FullerThaler Behavioral Mid-Cap Value Fund |
| FullerThaler Behavioral Unconstrained Equity Fund |
| FullerThaler Behavioral Small-Mid Core Equity Fund |
| FullerThaler Behavioral Micro-Cap Equity Fund |
| FullerThaler Behavioral Mid-Cap Equity Fund |
| Semi-Annual Report |
| March 31, 2024 |
| 411 Borel Avenue, Suite 300 |
| San Mateo, CA 94402 |
| (888) 912-4562 |
| www.fullerthalerfunds.com |
Investment Results (Unaudited)
Average Annual Total Returns* as of March 31, 2024
| Since | ||||||
| Inception | ||||||
| Six Months | One Year | Five Year | Ten Year | (12/19/18) | ||
| FullerThaler Behavioral Small-Cap Equity Fund | ||||||
| R6 Shares | 27.95% | 31.31% | 15.92% | 12.69% | ||
| Institutional Shares | 27.90% | 31.17% | 15.80% | 12.55% | ||
| Investor Shares | 27.71% | 30.75% | 15.46% | 12.29% | ||
| A Shares | ||||||
| Without Load | 27.69% | 30.78% | 15.50% | 17.42% | ||
| With Load | 20.36% | 23.26% | 14.13% | 16.12% | ||
| C Shares | ||||||
| Without Load | 27.33% | 30.02% | 14.81% | 16.71% | ||
| With Load | 26.33% | 30.02% | 14.81% | 16.71% | ||
| Russell 2000® Index(a) | 19.94% | 19.71% | 8.10% | 7.58% | 10.48% | |
| Institutional | Investor | |||||
| R6 Shares | Shares | Shares | A Shares | C Shares | ||
| Expense Ratio(b) | 0.64% | 0.75% | 1.05% | 1.04% | 1.64% | |
The performance quoted represents past performance, which does not guarantee future results. The investment return and principal value of an investment will fluctuate so that an investor’s shares, when redeemed, may be worth more or less than their original cost. The returns shown do not reflect the deduction of taxes that a shareholder would pay on FullerThaler Behavioral Small-Cap Equity Fund (the “Small-Cap Equity Fund”) distributions or the redemption of Small-Cap Equity Fund shares. Current performance of the Small-Cap Equity Fund may be lower or higher than the performance quoted. The Small-Cap Equity Fund’s investment objectives, risks, charges and expenses must be considered carefully before investing. Performance data current to the most recent month end may be obtained by calling (888) 912-4562.
| * | Return figures reflect any change in price per share and assume the reinvestment of all distributions. The Small-Cap Equity Fund’s returns reflect any fee waivers during the applicable periods. If such fee waivers had not occurred, the quoted performance would have been lower. Prior to October 26, 2015, the performance reflected represents that of a series of Allianz Funds Multi-Strategy Trust for which Fuller Thaler Asset Management, Inc. (the “Adviser”) served as the sole sub-adviser (“the Predecessor Fund”) (see Note 1). Total returns for periods less than 1 year are not annualized. |
| (a) | The Russell 2000® Index (“Russell 2000”) is a widely recognized unmanaged index of equity securities and is representative of a broader domestic equity market and range of securities than is found in the Small-Cap Equity Fund’s portfolio. The Russell 2000 measures the performance of the small-cap segment of the U.S. equity universe and is a subset of the Russell 3000® Index. Individuals cannot invest directly in an index; however, an individual can invest in exchange traded funds or other investment vehicles that attempt to track the performance of a benchmark index. |
| (b) | The expense ratios are from the Small-Cap Equity Fund’s most recent prospectus dated January 29, 2024. The Adviser has contractually agreed to waive its management fee and/or reimburse |
1
Investment Results (Unaudited) (continued)
Small-Cap Equity Fund expenses so that total annual operating expenses do not exceed 1.30%, 1.80%, 1.25%, 0.92% and 0.80% for A Shares, C Shares, Investor Shares, Institutional Shares and R6 Shares, respectively, of the average daily net assets for each class through January 31, 2025. The expense limitation does not apply to (i) interest (other than custodial overdraft fees and expenses associated with the Small-Cap Fund’s participation in an alternative liquidity program), (ii) taxes, (iii) brokerage fees and commissions, (iv) other extraordinary expenses not incurred in the ordinary course of the Small-Cap Equity Fund’s business, (v) dividend expense on short sales and (vi) indirect expenses such as acquired fund fees and expenses incurred by the Small-Cap Equity Fund in any fiscal year. During any fiscal year that the Investment Advisory Agreement between the Adviser and Capitol Series Trust (the “Trust”) is in effect, the Adviser may recoup the sum of all fees previously waived or expenses reimbursed, less any reimbursement previously paid, provided that the Adviser is only permitted to recoup fees or expenses within 36 months from the date the fee waiver or expense reimbursement occurred and provided further that such recoupment can be achieved within the Expense Limitation Agreement currently in effect and the Expense Limitation Agreement in place when the waiver/reimbursement occurred. The Expense Limitation Agreement may not be terminated by the Adviser prior to its expiration date, but the Board of Trustees of the Trust (the “Board”) may terminate such agreement at any time. The Expense Limitation Agreement shall terminate automatically upon the termination of the Advisory Agreement. Additional information pertaining to the Small-Cap Equity Fund’s expense ratios as of March 31, 2024 can be found in the financial highlights.
The Small-Cap Equity Fund’s investment objectives, strategies, risks, charges and expenses must be considered carefully before investing. The Small-Cap Equity Fund’s prospectus contains this and other important information about the Small-Cap Equity Fund and may be obtained by calling (888) 912-4562. Please read it carefully before investing.
The Small-Cap Equity Fund is distributed by Ultimus Fund Distributors, LLC, Member FINRA/SIPC.
2
Investment Results (Unaudited) (continued)
Average Annual Total Returns* as of March 31, 2024
| Since | Since | ||||
| Inception | Inception | ||||
| Six Months | One Year | Five Year | (12/21/17) | (12/19/18) | |
| FullerThaler Behavioral Small-Cap Growth Fund | |||||
| R6 Shares | 35.67% | 41.29% | 18.40% | 16.52% | |
| Institutional Shares | 35.62% | 41.18% | 18.29% | 16.42% | |
| Investor Shares | 35.42% | 40.76% | 17.97% | 16.11% | |
| A Shares | |||||
| Without Load | 35.40% | 40.65% | 17.91% | 19.83% | |
| With Load | 27.61% | 32.55% | 16.53% | 18.49% | |
| C Shares | |||||
| Without Load | 35.05% | 39.97% | 17.33% | 19.24% | |
| With Load | 34.05% | 39.97% | 17.33% | 19.24% | |
| Russell 2000® Growth Index(a) | 21.30% | 20.35% | 7.38% | 6.78% | 10.33% |
| Expense Ratios(b) | |||||
| Institutional | Investor | ||||
| R6 Shares | Shares | Shares | A Shares | C Shares | |
| Gross | 0.98% | 1.12% | 1.42% | 1.39% | 2.00% |
| With Applicable Waivers | 0.86% | 0.96% | 1.25% | 1.30% | 1.80% |
The performance quoted represents past performance, which does not guarantee future results. The investment return and principal value of an investment will fluctuate so that an investor’s shares, when redeemed, may be worth more or less than their original cost. The returns shown do not reflect the deduction of taxes that a shareholder would pay on FullerThaler Behavioral Small-Cap Growth Fund (the “Small-Cap Growth Fund”) distributions or the redemption of Small-Cap Growth Fund shares. Current performance of the Small-Cap Growth Fund may be lower or higher than the performance quoted. The Small-Cap Growth Fund’s investment objectives, risks, charges and expenses must be considered carefully before investing. Performance data current to the most recent month end may be obtained by calling (888) 912-4562.
| * | Return figures reflect any change in price per share and assume the reinvestment of all distributions. The Small-Cap Growth Fund’s returns reflect any fee waivers during the applicable periods. If such fee waivers had not occurred, the quoted performance would have been lower. Total returns for periods less than 1 year are not annualized. |
| (a) | The Russell 2000® Growth Index (“Russell 2000 Growth”) is a widely recognized unmanaged index of equity securities and is representative of a broader domestic equity market and range of securities than is found in the Small-Cap Growth Fund’s portfolio. Russell 2000 Growth measures the performance of those Russell 2000 companies with higher price/book ratios and higher forecasted growth values. Individuals cannot invest directly in an index; however, an individual can invest in exchange traded funds or other investment vehicles that attempt to track the performance of a benchmark index. |
| (b) | The expense ratios are from the Small-Cap Growth Fund’s most recent prospectus dated January |
3
Investment Results (Unaudited) (continued)
29, 2024. The Adviser has contractually agreed to waive its management fee and/or reimburse Small-Cap Growth Fund expenses so that total annual operating expenses do not exceed 1.30%, 1.80%, 1.25%, 0.96%, and 0.86% for A Shares, C Shares, Investor Shares, Institutional Shares and R6 Shares, respectively, of the average daily net assets for each class through January 31, 2025. The expense limitation does not apply to (i) interest (other than custodial overdraft fees and expenses associated with the Small-Cap Growth Fund’s participation in an alternative liquidity program), (ii) taxes, (iii) brokerage fees and commissions, (iv) other extraordinary expenses not incurred in the ordinary course of the Small-Cap Growth Fund’s business, (v) dividend expense on short sales and (vi) indirect expenses such as acquired fund fees and expenses incurred by the Small-Cap Growth Fund in any fiscal year. During any fiscal year that the Investment Advisory Agreement between the Adviser and the Trust is in effect, the Adviser may recoup the sum of all fees previously waived or expenses reimbursed, less any reimbursement previously paid, provided that the Adviser is only permitted to recoup fees or expenses within 36 months from the date the fee waiver or expense reimbursement occurred and provided further that such recoupment can be achieved within the Expense Limitation Agreement currently in effect and the Expense Limitation Agreement in place when the waiver/reimbursement occurred. The Expense Limitation Agreement may not be terminated by the Adviser prior to its expiration date, but the Board may terminate such agreement at any time. The Expense Limitation Agreement shall terminate automatically upon the termination of the Advisory Agreement. Additional information pertaining to the Small-Cap Growth Fund’s expense ratios as of March 31, 2024 can be found in the financial highlights.
The Small-Cap Growth Fund’s investment objectives, strategies, risks, charges and expenses must be considered carefully before investing. The prospectus contains this and other important information about the Small-Cap Growth Fund and may be obtained by calling (888) 912-4562. Please read it carefully before investing.
The Small-Cap Growth Fund is distributed by Ultimus Fund Distributors, LLC, Member FINRA/SIPC.
4
Investment Results (Unaudited) (continued)
Average Annual Total Returns* as of March 31, 2024
| Since | Since | ||||
| Inception | Inception | ||||
| Six Months | One Year | Five Year | (12/21/17) | (3/10/22) | |
| FullerThaler Behavioral Mid-Cap Value Fund | |||||
| R6 Shares | 23.11% | 23.69% | 12.54% | 10.02% | |
| Institutional Shares | 23.05% | 23.58% | 12.41% | 9.92% | |
| Investor Shares | 22.87% | 23.18% | 12.12% | 9.62% | |
| A Shares | |||||
| Without Load | 22.84% | 23.11% | 7.27% | ||
| With Load | 15.78% | 16.02% | 4.23% | ||
| C Shares | |||||
| Without Load | 22.51% | 22.51% | 6.71% | ||
| With Load | 21.51% | 22.51% | 6.71% | ||
| Russell Midcap® Value Index(a) | 21.33% | 20.40% | 9.94% | 7.95% | 6.79% |
| Expense Ratios(b) | |||||
| Institutional | Investor | ||||
| R6 Shares | Shares | Shares | A Shares | C Shares | |
| Gross | 0.83% | 0.97% | 1.25% | 1.20% | 1.83% |
| With Applicable Waivers | 0.69% | 0.79% | 1.15% | 1.20% | 1.70% |
The performance quoted represents past performance, which does not guarantee future results. The investment return and principal value of an investment will fluctuate so that an investor’s shares, when redeemed, may be worth more or less than their original cost. The returns shown do not reflect the deduction of taxes that a shareholder would pay on FullerThaler Behavioral Mid-Cap Value Fund (the “Mid-Cap Value Fund”) distributions or the redemption of Mid-Cap Value Fund shares. Current performance of the Mid-Cap Value Fund may be lower or higher than the performance quoted. The Mid-Cap Value Fund’s investment objectives, risks, charges and expenses must be considered carefully before investing. Performance data current to the most recent month end may be obtained by calling (888) 912-4562.
| * | Return figures reflect any change in price per share and assume the reinvestment of all distributions. The Mid-Cap Value Fund’s returns reflect any fee waivers during the applicable periods. If such fee waivers had not occurred, the quoted performance would have been lower. Total returns for periods less than 1 year are not annualized. |
| (a) | The Russell Midcap® Value Index (“Russell Midcap Value”) is a widely recognized unmanaged index of equity securities and is representative of a broader domestic equity market and range of securities than is found in the Mid-Cap Value Fund’s portfolio. The Russell Midcap Value measures the performance of those Russell Midcap companies with lower price/book ratios and lower forecasted growth values. Individuals cannot invest directly in an index; however, an individual can invest in exchange traded funds or other investment vehicles that attempt to track the performance of a benchmark index. |
| (b) | The expense ratios are from the Mid-Cap Value Fund’s most recent prospectus dated January 29, |
5
Investment Results (Unaudited) (continued)
2024. The Adviser has contractually agreed to waive its management fee and/or reimburse Mid-Cap Value Fund expenses so that total annual operating expenses do not exceed 1.20%, 1.70%, 1.15%, 0.79%, and 0.69% for A Shares, C Shares, Investor Shares, Institutional Shares and R6 Shares, respectively, of the average daily net assets for each class through January 31, 2025. The expense limitation does not apply to (i) interest (other than custodial overdraft fees and expenses associated with the Mid-Cap Value Fund’s participation in an alternative liquidity program), (ii) taxes, (iii) brokerage fees and commissions, (iv) other extraordinary expenses not incurred in the ordinary course of the Mid-Cap Value Fund’s business, (v) dividend expense on short sales and (vi) indirect expenses such as acquired fund fees and expenses incurred by the Mid-Cap Value Fund in any fiscal year. During any fiscal year that the Investment Advisory Agreement between the Adviser and the Trust is in effect, the Adviser may recoup the sum of all fees previously waived or expenses reimbursed, less any reimbursement previously paid, provided that the Adviser is only permitted to recoup fees or expenses within 36 months from the date the fee waiver or expense reimbursement occurred and provided further that such recoupment can be achieved within the Expense Limitation Agreement currently in effect and the Expense Limitation Agreement in place when the waiver/ reimbursement occurred. This Expense Limitation Agreement may not be terminated by the Adviser prior to its expiration date, but the Board may terminate such agreement at any time. The Expense Limitation Agreement shall terminate automatically upon the termination of the Advisory Agreement. Additional information pertaining to the Mid-Cap Value Fund’s expense ratios as of March 31, 2024 can be found in the financial highlights.
The Mid-Cap Value Fund’s investment objectives, strategies, risks, charges and expenses must be considered carefully before investing. The prospectus contains this and other important information about the Mid-Cap Value Fund and may be obtained by calling (888) 912-4562. Please read it carefully before investing.
The Mid-Cap Value Fund is distributed by Ultimus Fund Distributors, LLC, Member FINRA/SIPC.
6
Investment Results (Unaudited) (continued)
Average Annual Total Returns* as of March 31, 2024
| Since | Since | ||||
| Inception | Inception | ||||
| Six Months | One Year | Five Year | (12/26/18) | (5/27/21) | |
| FullerThaler Behavioral Unconstrained Equity Fund | |||||
| R6 Shares | 31.27% | 35.03% | 14.48% | 17.92% | |
| Institutional Shares | 31.29% | 35.00% | 14.39% | 17.82% | |
| A Shares | |||||
| Without Load | 31.29% | 34.78% | 7.68% | ||
| With Load | 23.73% | 27.03% | 5.47% | ||
| C Shares | |||||
| Without Load | 31.37% | 34.55% | 7.27% | ||
| With Load | 30.37% | 34.55% | 7.27% | ||
| Russell 3000® Index(a) | 23.30% | 29.29% | 14.34% | 16.81% | 8.27% |
| Russell MidCap Index(b) | 22.52% | 22.35% | 11.10% | 14.12% | 4.32% |
| Expense Ratios(b) | |||||
| Institutional | |||||
| R6 Shares | Shares | A Shares | C Shares | ||
| Gross | 1.23% | 1.42% | 1.73% | 2.32% | |
| With Applicable Waivers | 0.87% | 0.97% | 1.30% | 1.80% | |
The performance quoted represents past performance, which does not guarantee future results. The investment return and principal value of an investment will fluctuate so that an investor’s shares, when redeemed, may be worth more or less than their original cost. The returns shown do not reflect the deduction of taxes that a shareholder would pay on FullerThaler Behavioral Unconstrained Equity Fund (the “Unconstrained Equity Fund”) distributions or the redemption of Unconstrained Equity Fund shares. Current performance of the Unconstrained Equity Fund may be lower or higher than the performance quoted. The Unconstrained Equity Fund’s investment objectives, risks, charges and expenses must be considered carefully before investing. Performance data current to the most recent month end may be obtained by calling (888) 912-4562.
| * | Return figures reflect any change in price per share and assume the reinvestment of all distributions. The Unconstrained Equity Fund’s returns reflect any fee waivers during the applicable periods. If such fee waivers had not occurred, the quoted performance would have been lower. Total returns for periods less than 1 year are not annualized. |
| (a) | The Russell 3000® Index (“Russell 3000”) measures the performance of the broad U.S. equity market. The Russell 3000 represents the 3000 largest U.S. publicly traded companies as measured by market capitalization. Individuals cannot invest directly in an index; however, an individual can invest in exchange traded funds or other investment vehicles that attempt to track the performance of a benchmark index. |
| (a) | The Russell Midcap® Index (“Russell Midcap”) is a widely recognized unmanaged index of equity securities and is representative of a broader domestic equity market and range of securities than is found in the Mid-Cap Equity Fund’s portfolio. The Russell Midcap measures the performance |
7
Investment Results (Unaudited) (continued)
of the mid-cap segment of the US equity universe. Individuals cannot invest directly in an index; however, an individual can invest in exchange traded funds or other investment vehicles that attempt to track the performance of a benchmark index.
| (b) | The expense ratios are from the Unconstrained Equity Fund’s most recent prospectus dated January 29, 2024. The Adviser has contractually agreed to waive its management fee and/or reimburse Unconstrained Equity Fund expenses so that total annual operating expenses do not exceed 1.30%, 1.80%, 0.97% and 0.87% for A Shares, C Shares, Institutional Shares and R6 Shares, respectively, of the average daily net assets for each class through January 31, 2025. The expense limitation does not apply to (i) interest (other than custodial overdraft fees and expenses associated with the Unconstrained Equity Fund’s participation in an alternative liquidity program), (ii) taxes, (iii) brokerage fees and commissions, (iv) other extraordinary expenses not incurred in the ordinary course of the Unconstrained Equity Fund’s business, (v) dividend expense on short sales and (vi) indirect expenses such as acquired fund fees and expenses incurred by the Unconstrained Equity Fund in any fiscal year. During any fiscal year that the Investment Advisory Agreement between the Adviser and the Trust is in effect, the Adviser may recoup the sum of all fees previously waived or expenses reimbursed, less any reimbursement previously paid, provided that the Adviser is only permitted to recoup fees or expenses within 36 months from the date the fee waiver or expense reimbursement occurred and provided further that such recoupment can be achieved within the Expense Limitation Agreement currently in effect and the Expense Limitation Agreement in place when the waiver/reimbursement occurred. This Expense Limitation Agreement may not be terminated by the Adviser prior to its expiration date, but the Board may terminate such agreement at any time. The Expense Limitation Agreement shall terminate automatically upon the termination of the Advisory Agreement. Additional information pertaining to the Unconstrained Equity Fund’s expense ratios as of March 31, 2024 can be found in the financial highlights. |
The Unconstrained Equity Fund’s investment objectives, strategies, risks, charges and expenses must be considered carefully before investing. The prospectus contains this and other important information about the Unconstrained Equity Fund and may be obtained by calling (888) 912-4562. Please read it carefully before investing.
The Unconstrained Equity Fund is distributed by Ultimus Fund Distributors, LLC, Member FINRA/ SIPC.
8
Investment Results (Unaudited) (continued)
Average Annual Total Returns* as of March 31, 2024
| Since | Since | ||||
| Inception | Inception | ||||
| Six Months | One Year | Five Year | (12/26/18) | (3/10/22) | |
| FullerThaler Behavioral Small-Mid Core Equity Fund | |||||
| Institutional Shares | 20.49% | 19.73% | 12.12% | 14.66% | |
| A Shares | |||||
| Without Load | 20.26% | 19.26% | 7.29% | ||
| With Load | 13.36% | 12.41% | 4.24% | ||
| Russell 2500® Index(a) | 21.20% | 21.43% | 9.90% | 12.83% | 6.25% |
| Expense Ratios(b) | |||||
| Institutional | |||||
| Shares | A Shares | ||||
| Gross | 1.35% | 1.62% | |||
| With Applicable Waivers | 0.87% | 1.26% | |||
The performance quoted represents past performance, which does not guarantee future results. The investment return and principal value of an investment will fluctuate so that an investor’s shares, when redeemed, may be worth more or less than their original cost. The returns shown do not reflect the deduction of taxes that a shareholder would pay on FullerThaler Behavioral Small-Mid Core Equity Fund (the “Small-Mid Core Equity Fund”) distributions or the redemption of Small-Mid Core Equity Fund shares. Current performance of the Small-Mid Core Equity Fund may be lower or higher than the performance quoted. The Small-Mid Core Equity Fund’s investment objectives, risks, charges and expenses must be considered carefully before investing. Performance data current to the most recent month end may be obtained by calling (888) 912-4562.
| * | Return figures reflect any change in price per share and assume the reinvestment of all distributions. The Small-Mid Core Equity Fund’s returns reflect any fee waivers during the applicable periods. If such fee waivers had not occurred, the quoted performance would have been lower. Total returns for periods less than 1 year are not annualized. |
| (a) | The Russell 2500® Index (“Russell 2500”) is a widely recognized unmanaged index of equity securities and is representative of a broader domestic equity market and range of securities than is found in the Small-Mid Core Equity Fund’s portfolio. The Russell 2500 measures the performance of those Russell 2500 companies with lower price/book ratios and lower forecasted growth values. Individuals cannot invest directly in an index; however, an individual can invest in exchange traded funds or other investment vehicles that attempt to track the performance of a benchmark index. |
| (b) | The expense ratios are from the Small-Mid Core Equity Fund’s most recent prospectus dated January 29, 2024. The Adviser has contractually agreed to waive its management fee and/ or reimburse Small-Mid Core Equity Fund expenses so that total annual operating expenses do not exceed 1.26% and 0.87% of the Small-Mid Core Equity Fund’s A Shares and Institutional Shares average daily net assets through January 31, 2025. The expense limitation does not apply to (i) interest (other than custodial overdraft fees and expenses associated with the Small-Mid Core Equity Fund’s participation in an alternative liquidity program), (ii) taxes, (iii) brokerage fees and commissions, (iv) other extraordinary expenses not incurred in the ordinary course of the Small-Mid |
9
Investment Results (Unaudited) (continued)
Core Equity Fund’s business, (v) dividend expense on short sales and (vi) indirect expenses such as acquired fund fees and expenses incurred by the Small-Mid Core Equity Fund in any fiscal year. During any fiscal year that the Investment Advisory Agreement between the Adviser and the Trust is in effect, the Adviser may recoup the sum of all fees previously waived or expenses reimbursed, less any reimbursement previously paid, provided that the Adviser is only permitted to recoup fees or expenses within 36 months from the date the fee waiver or expense reimbursement occurred and provided further that such recoupment can be achieved within the Expense Limitation Agreement currently in effect and the Expense Limitation Agreement in place when the waiver/reimbursement occurred. This Expense Limitation Agreement may not be terminated by the Adviser prior to its expiration date, but the Board may terminate such agreement at any time. The Expense Limitation Agreement shall terminate automatically upon the termination of the Advisory Agreement. Additional information pertaining to the Small-Mid Core Equity Fund’s expense ratios as of March 31, 2024 can be found in the financial highlights.
The Small-Mid Core Equity Fund’s investment objectives, strategies, risks, charges and expenses must be considered carefully before investing. The prospectus contains this and other important information about the Small-Mid Core Equity Fund and may be obtained by calling (888) 912-4562. Please read it carefully before investing.
The Small-Mid Core Equity Fund is distributed by Ultimus Fund Distributors, LLC, Member FINRA/ SIPC.
10
Investment Results (Unaudited) (continued)
Average Annual Total Returns* as of March 31, 2024
| Since | ||||
| Inception | ||||
| Six Months | One Year | Five Year | (12/28/18) | |
| FullerThaler Behavioral Micro-Cap Equity Fund | ||||
| Institutional Shares | 7.78% | 11.02% | 3.90% | 7.64% |
| Russell Microcap® Index(a) | 21.49% | 17.79% | 6.90% | 9.24% |
| Expense Ratios(b) | ||||
| Institutional | ||||
| Shares | ||||
| Gross | 2.13% | |||
| With Applicable Waivers | 1.29% |
The performance quoted represents past performance, which does not guarantee future results. The investment return and principal value of an investment will fluctuate so that an investor’s shares, when redeemed, may be worth more or less than their original cost. The returns shown do not reflect the deduction of taxes that a shareholder would pay on FullerThaler Behavioral Micro-Cap Equity Fund (the “Micro-Cap Equity Fund”) distributions or the redemption of Micro-Cap Equity Fund shares. Current performance of the Micro-Cap Equity Fund may be lower or higher than the performance quoted. The Micro-Cap Equity Fund’s investment objectives, risks, charges and expenses must be considered carefully before investing. Performance data current to the most recent month end may be obtained by calling (888) 912-4562.
| * | Return figures reflect any change in price per share and assume the reinvestment of all distributions. The Micro-Cap Equity Fund’s returns reflect any fee waivers during the applicable periods. If such fee waivers had not occurred, the quoted performance would have been lower. Total returns for periods less than 1 year are not annualized. |
| (a) | The Russell Microcap® Index (“Russell Microcap”) measures the performance of the microcap segment of the U.S. equity market. Russell Microcap stocks make up less than 3% of the U.S. equity market (by market cap) and consist of the smallest 1,000 securities in the small cap Russell 2000® Index, plus the next smallest eligible securities by market cap. Individuals cannot invest directly in an index; however, an individual can invest in exchange traded funds or other investment vehicles that attempt to track the performance of a benchmark index. |
| (b) | The expense ratios are from the Micro-Cap Equity Fund’s most recent prospectus dated January 29, 2024. The Adviser has contractually agreed to waive its management fee and/or reimburse Micro-Cap Equity Fund expenses so that total annual operating expenses do not exceed 1.29% of the Micro-Cap Equity Fund’s Institutional Shares average daily net assets through January 31, 2025. The expense limitation does not apply to (i) interest (other than custodial overdraft fees and expenses associated with the Micro-Cap Equity Fund’s participation in an alternative liquidity program), (ii) taxes, (iii) brokerage fees and commissions, (iv) other extraordinary expenses not incurred in the ordinary course of the Micro-Cap Equity Fund’s business, (v) dividend expense on short sales and (vi) indirect expenses such as acquired fund fees and expenses incurred by the Micro-Cap Equity Fund in any fiscal year. During any fiscal year that the Investment Advisory Agreement between the Adviser and the Trust is in effect, the Adviser may recoup the sum of all fees previously waived or expenses reimbursed, less any reimbursement previously paid, provided that the Adviser |
11
Investment Results (Unaudited) (continued)
is only permitted to recoup fees or expenses within 36 months from the date the fee waiver or expense reimbursement occurred and provided further that such recoupment can be achieved within the Expense Limitation Agreement currently in effect and the Expense Limitation Agreement in place when the waiver/reimbursement occurred. This Expense Limitation Agreement may not be terminated by the Adviser prior to its expiration date, but the Board may terminate such agreement at any time. The Expense Limitation Agreement shall terminate automatically upon the termination of the Advisory Agreement. Additional information pertaining to the Micro-Cap Equity Fund’s expense ratios as of March 31, 2024 can be found in the financial highlights.
The Micro-Cap Equity Fund’s investment objectives, strategies, risks, charges and expenses must be considered carefully before investing. The prospectus contains this and other important information about the Micro-Cap Equity Fund and may be obtained by calling (888) 912-4562. Please read it carefully before investing.
The Micro-Cap Equity Fund is distributed by Ultimus Fund Distributors, LLC, Member FINRA/SIPC.
12
Investment Results (Unaudited) (continued)
Total Returns* as of March 31, 2024
| Since | ||
| Inception | ||
| (10/2/23) | ||
| FullerThaler Behavioral Mid-Cap Equity Fund | ||
| Institutional Shares | 24.37% | |
| Russell Midcap® Index(a) | 24.03% | |
| Expense Ratios(b) | ||
| Institutional | ||
| Shares | ||
| Gross | 5.23% | |
| With Applicable Waivers | 0.79% |
The performance quoted represents past performance, which does not guarantee future results. The investment return and principal value of an investment will fluctuate so that an investor’s shares, when redeemed, may be worth more or less than their original cost. The returns shown do not reflect the deduction of taxes that a shareholder would pay on FullerThaler Behavioral Mid-Cap Equity Fund (the “Mid-Cap Equity Fund”) distributions or the redemption of Mid-Cap Equity Fund shares. Current performance of the Mid-Cap Equity Fund may be lower or higher than the performance quoted. The Mid-Cap Equity Fund’s investment objectives, risks, charges and expenses must be considered carefully before investing. Performance data current to the most recent month end may be obtained by calling (888) 912-4562.
| * | Return figures reflect any change in price per share and assume the reinvestment of all distributions. The Mid-Cap Equity Fund’s returns reflect any fee waivers during the applicable periods. If such fee waivers had not occurred, the quoted performance would have been lower. Total returns for periods less than 1 year are not annualized. |
| (a) | The Russell Midcap® Index (“Russell Midcap”) is a widely recognized unmanaged index of equity securities and is representative of a broader domestic equity market and range of securities than is found in the Mid-Cap Equity Fund’s portfolio. The Russell Midcap measures the performance of the mid-cap segment of the US equity universe. Individuals cannot invest directly in an index; however, an individual can invest in exchange traded funds or other investment vehicles that attempt to track the performance of a benchmark index. |
| (b) | The expense ratios are from the Mid-Cap Equity Fund’s most recent prospectus dated January 29, 2024. The Adviser has contractually agreed to waive its management fee and/or reimburse Mid-Cap Equity Fund expenses so that total annual operating expenses do not exceed 0.79% of the Mid-Cap Equity Fund’s Institutional Shares average daily net assets through January 31, 2025. The expense limitation does not apply to (i) interest (other than custodial overdraft fees and expenses associated with the Mid-Cap Equity Fund’s participation in an alternative liquidity program), (ii) taxes, (iii) brokerage fees and commissions, (iv) other extraordinary expenses not incurred in the ordinary course of the Mid-Cap Equity Fund’s business, (v) dividend expense on short sales and (vi) indirect expenses such as acquired fund fees and expenses incurred by the Mid-Cap Equity Fund in any fiscal year. During any fiscal year that the Investment Advisory Agreement between the Adviser and the Trust is in effect, the Adviser may recoup the sum of all fees previously waived or expenses reimbursed, less any reimbursement previously paid, provided that the Adviser is only permitted to |
13
Investment Results (Unaudited) (continued)
recoup fees or expenses within 36 months from the date the fee waiver or expense reimbursement occurred and provided further that such recoupment can be achieved within the Expense Limitation Agreement currently in effect and the Expense Limitation Agreement in place when the waiver/ reimbursement occurred. This Expense Limitation Agreement may not be terminated by the Adviser prior to its expiration date, but the Board may terminate such agreement at any time. The Expense Limitation Agreement shall terminate automatically upon the termination of the Advisory Agreement. Additional information pertaining to the Mid-Cap Equity Fund’s expense ratios as of March 31, 2024 can be found in the financial highlights.
The Mid-Cap Equity Fund’s investment objectives, strategies, risks, charges and expenses must be considered carefully before investing. The prospectus contains this and other important information about the Mid-Cap Equity Fund and may be obtained by calling (888) 912-4562. Please read it carefully before investing.
The Mid-Cap Equity Fund is distributed by Ultimus Fund Distributors, LLC, Member FINRA/SIPC.
14
Portfolio Illustration (Unaudited)
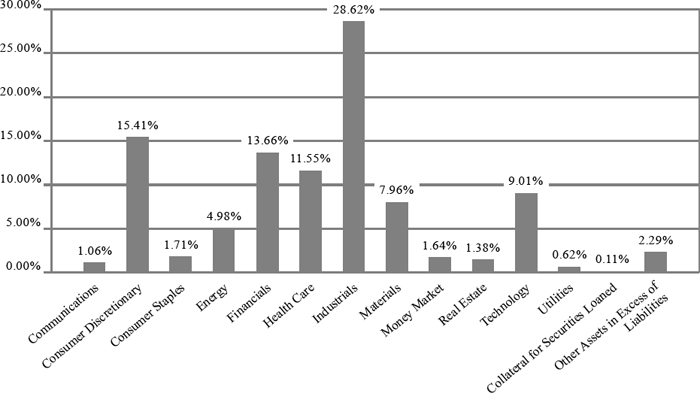
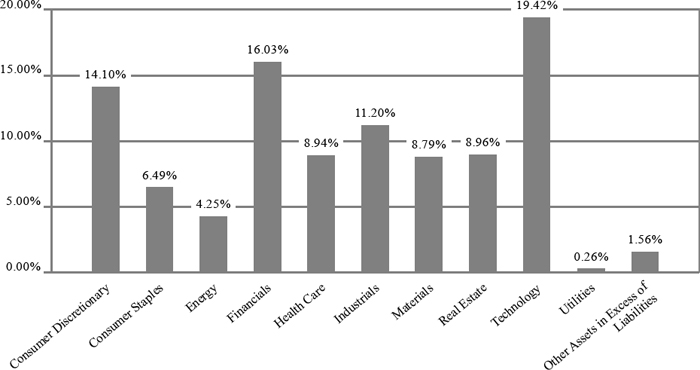
FullerThaler Behavioral Small-Cap Equity Fund Sector Holdings as of March 31, 2024.*
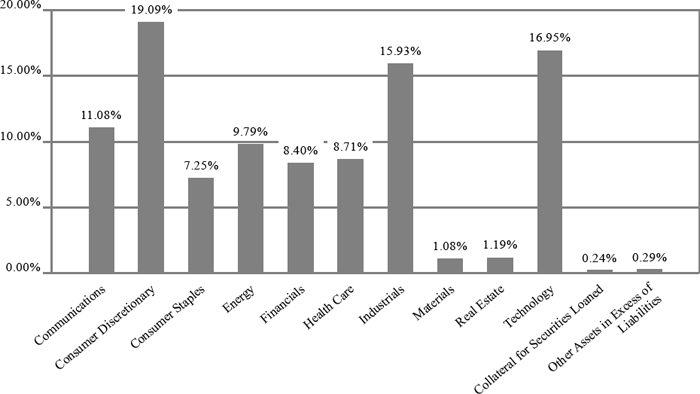
FullerThaler Behavioral Small-Cap Growth Fund Sector Holdings as of March 31, 2024.*
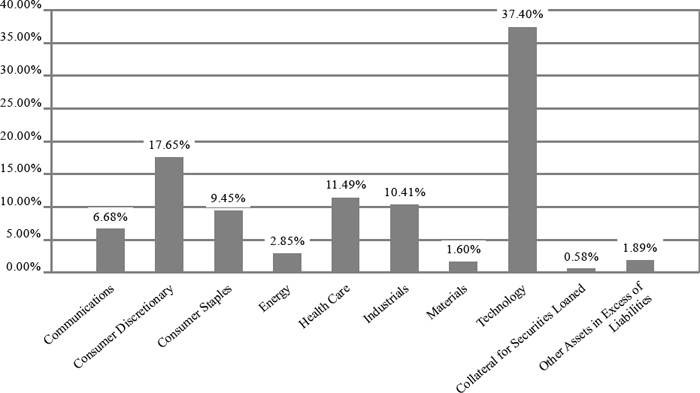
| * | As a percentage of net assets. |
15
Portfolio Illustration (Unaudited)
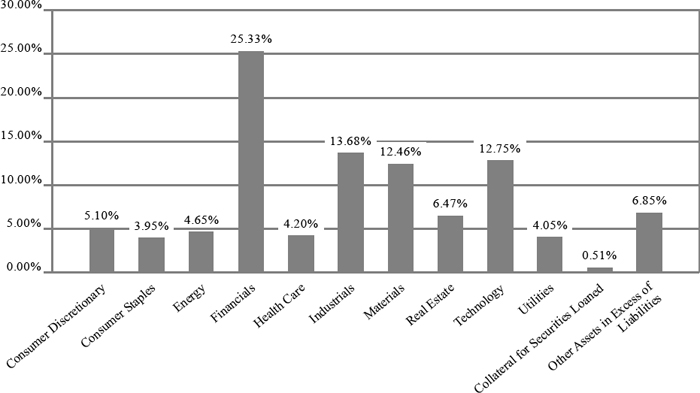
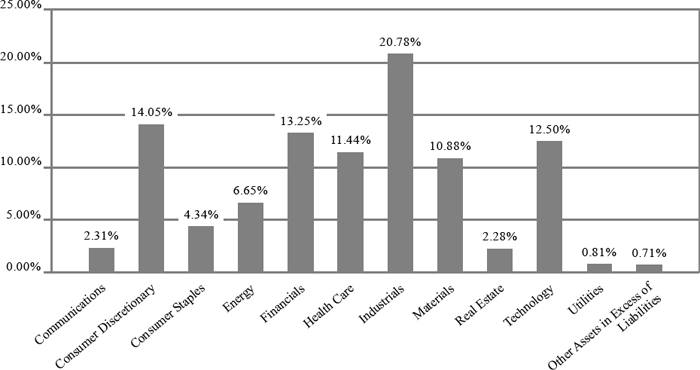
FullerThaler Behavioral Mid-Cap Value Fund Sector Holdings as of March 31, 2024.*
FullerThaler Behavioral Unconstrained Equity Fund Sector Holdings as of March 31, 2024.*
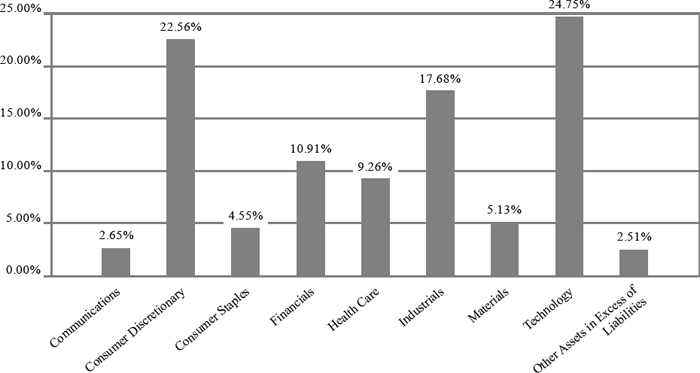
| * | As a percentage of net assets. |
16
Portfolio Illustration (Unaudited)
FullerThaler Behavioral Small-Mid Core Equity Fund Sector Holdings as of March 31, 2024.*
FullerThaler Behavioral Micro-Cap Equity Fund Sector Holdings as of March 31, 2024.*
| * | As a percentage of net assets. |
17
Portfolio Illustration (Unaudited)
FullerThaler Behavioral Mid-Cap Equity Fund Sector Holdings as of March 31, 2024.*
| * | As a percentage of net assets. |
Availability of Portfolio Schedules (Unaudited)
The Funds file their complete schedule of portfolio holdings with the Securities and Exchange Commission (“SEC”) for the first and third quarters of each fiscal year as an exhibit to its reports on Form N-PORT. The Funds’ Form N-PORT reports are available on the SEC’s website at http://www. sec.gov and on the Funds’ website at www.fullerthalerfunds.com.
18
| FullerThaler Behavioral Small-Cap Equity Fund |
| Schedule of Investments |
| March 31, 2024 - (Unaudited) |
| Shares | Fair Value | |||||||
| COMMON STOCKS — 95.96% | ||||||||
| Apparel & Textile Products — 4.70% | ||||||||
| Carter’s, Inc.(a) | 847,519 | $ | 71,767,909 | |||||
| Crocs, Inc.(b) | 798,187 | 114,779,291 | ||||||
| Deckers Outdoor Corp.(b) | 152,774 | 143,800,055 | ||||||
| Kontoor Brands, Inc. | 861,765 | 51,921,341 | ||||||
| Oxford Industries, Inc. | 124,124 | 13,951,538 | ||||||
| Ralph Lauren Corp. | 243,179 | 45,659,289 | ||||||
| 441,879,423 | ||||||||
| Asset Management — 2.29% | ||||||||
| Federated Hermes, Inc., Class B | 2,342,965 | 84,627,896 | ||||||
| Stifel Financial Corp. | 1,674,799 | 130,919,038 | ||||||
| 215,546,934 | ||||||||
| Banking — 8.52% | ||||||||
| Atlantic Union Bancshares Corp. | 227,426 | 8,030,412 | ||||||
| BancFirst Corp. | 234,477 | 20,641,010 | ||||||
| Bank OZK(a) | 3,311,412 | 150,536,790 | ||||||
| Berkshire Hills Bancorp, Inc. | 656,769 | 15,053,145 | ||||||
| Cadence Bank | 2,990,953 | 86,737,637 | ||||||
| F.N.B. Corp. | 3,769,901 | 53,155,604 | ||||||
| First Commonwealth Financial Corp. | 1,937,346 | 26,967,856 | ||||||
| First Financial Bancorp | 1,731,787 | 38,826,665 | ||||||
| First Financial Bankshares, Inc. | 1,422,031 | 46,656,837 | ||||||
| First Financial Corp. | 112,829 | 4,324,736 | ||||||
| Fulton Financial Corp. | 3,086,427 | 49,043,325 | ||||||
| Hancock Whitney Corp. | 1,668,421 | 76,814,103 | ||||||
| Lakeland Financial Corp. | 272,409 | 18,066,165 | ||||||
| NBT Bancorp, Inc. | 381,638 | 13,998,482 | ||||||
| Wintrust Financial Corp. | 1,153,798 | 120,444,973 | ||||||
| Zions Bancorp. | 1,629,362 | 70,714,311 | ||||||
| 800,012,051 | ||||||||
| Biotech & Pharma — 4.12% | ||||||||
| Amphastar Pharmaceuticals, Inc.(b) | 1,200,192 | 52,700,431 | ||||||
| Collegium Pharmaceutical, Inc.(b) | 925,379 | 35,923,213 | ||||||
| Exelixis, Inc.(b) | 2,134,027 | 50,640,461 | ||||||
| Jazz Pharmaceuticals PLC(b) | 1,028,486 | 123,850,284 | ||||||
| Shares | Fair Value | |||||||
| Biotech & Pharma — (continued) | ||||||||
| United Therapeutics Corp.(b) | 542,332 | $ | 124,584,506 | |||||
| 387,698,895 | ||||||||
| Chemicals — 0.40% | ||||||||
| Avient Corp. | 425,629 | 18,472,299 | ||||||
| Huntsman Corp. | 722,265 | 18,800,558 | ||||||
| 37,272,857 | ||||||||
| Commercial Support Services — 3.09% | ||||||||
| Clean Harbors, Inc.(b) | 135,751 | 27,328,034 | ||||||
| FTI Consulting, Inc.(b) | 210,807 | 44,330,604 | ||||||
| H&R Block, Inc.(a) | 2,995,394 | 147,103,799 | ||||||
| Kforce, Inc. | 270,263 | 19,058,947 | ||||||
| TriNet Group, Inc. | 394,487 | 52,265,583 | ||||||
| 290,086,967 | ||||||||
| Construction Materials — 1.58% | ||||||||
| Eagle Materials, Inc. | 546,247 | 148,442,622 | ||||||
| Consumer Services — 1.64% | ||||||||
| Adtalem Global Education, Inc.(b) | 773,197 | 39,742,326 | ||||||
| Perdoceo Education Corp. | 854,359 | 15,002,544 | ||||||
| Rent-A-Center, Inc. | 605,496 | 21,319,514 | ||||||
| Stride, Inc.(b) | 1,241,957 | 78,305,389 | ||||||
| 154,369,773 | ||||||||
| Containers & Packaging — 2.03% | ||||||||
| Graphic Packaging Holding Co. | 3,093,363 | 90,264,332 | ||||||
| Sonoco Products Co. | 1,738,731 | 100,568,201 | ||||||
| 190,832,533 | ||||||||
| Electric Utilities — 0.62% | ||||||||
| Otter Tail Corp.(a) | 677,021 | 58,494,614 | ||||||
| Electrical Equipment — 6.38% | ||||||||
| Acuity Brands, Inc. | 989,499 | 265,908,066 | ||||||
| Atkore, Inc. | 701,756 | 133,586,272 | ||||||
| Belden, Inc. | 654,496 | 60,612,875 | ||||||
| Vontier Corp. | 3,070,239 | 139,266,041 | ||||||
| 599,373,254 | ||||||||
| Engineering & Construction — 9.79% | ||||||||
| Comfort Systems USA, Inc. | 573,109 | 182,082,460 | ||||||
| EMCOR Group, Inc.(a) | 1,025,251 | 359,042,901 | ||||||
| Installed Building Products, Inc. | 657,283 | 170,058,831 | ||||||
| Primoris Services Corp. | 669,027 | 28,480,479 | ||||||
| Sterling Infrastructure, Inc.(b) | 921,306 | 101,629,265 | ||||||
See accompanying notes which are an integral part of these financial statements.
19
| FullerThaler Behavioral Small-Cap Equity Fund |
| Schedule of Investments (continued) |
| March 31, 2024 - (Unaudited) |
| Shares | Fair Value | |||||||
| COMMON STOCKS — (continued) | ||||||||
| Engineering & Construction — (continued) | ||||||||
| TopBuild Corp.(b) | 181,744 | $ | 80,100,033 | |||||
| 921,393,969 | ||||||||
| Food — 0.73% | ||||||||
| Simply Good Foods Co. (The)(b) | 2,013,238 | 68,510,489 | ||||||
| Health Care Facilities & Services — 3.19% | ||||||||
| Chemed Corp. | 150,410 | 96,552,691 | ||||||
| Medpace Holdings, Inc.(b) | 298,268 | 120,545,013 | ||||||
| Option Care Health, Inc.(b) | 2,479,028 | 83,146,599 | ||||||
| 300,244,303 | ||||||||
| Home Construction — 5.99% | ||||||||
| Armstrong World Industries, Inc. | 1,005,295 | 124,877,745 | ||||||
| Masonite International Corp.(b) | 483,657 | 63,576,713 | ||||||
| Masterbrand, Inc.(b) | 2,913,308 | 54,595,392 | ||||||
| Meritage Homes Corp. | 673,860 | 118,235,476 | ||||||
| Taylor Morrison Home Corp.(b) | 3,239,467 | 201,397,663 | ||||||
| 562,682,989 | ||||||||
| Household Products — 0.98% | ||||||||
| Edgewell Personal Care Co. | 1,727,437 | 66,748,166 | ||||||
| Helen of Troy Ltd.(b) | 224,880 | 25,915,171 | ||||||
| 92,663,337 | ||||||||
| Industrial Intermediate Products — 1.26% | ||||||||
| Mueller Industries, Inc.(a) | 2,194,508 | 118,349,816 | ||||||
| Industrial Support Services — 1.19% | ||||||||
| Applied Industrial Technologies, Inc. | 564,245 | 111,466,600 | ||||||
| Institutional Financial Services — 1.44% | ||||||||
| Evercore, Inc., Class A | 704,742 | 135,726,262 | ||||||
| Insurance — 1.15% | ||||||||
| Hanover Insurance Group, Inc. | 529,581 | 72,113,044 | ||||||
| Primerica, Inc. | 141,387 | 35,765,256 | ||||||
| 107,878,300 | ||||||||
| Leisure Facilities & Services — 0.28% | ||||||||
| Boyd Gaming Corp. | 387,354 | 26,076,671 | ||||||
| Machinery — 3.06% | ||||||||
| Crane Co.(a) | 389,594 | 52,645,837 | ||||||
| Shares | Fair Value | |||||||
| Machinery — (continued) | ||||||||
| Crane Holding Co. | 612,046 | $ | 37,885,647 | |||||
| Donaldson Co., Inc. | 1,367,092 | 102,094,432 | ||||||
| Standex International Corp. | 205,934 | 37,525,293 | ||||||
| Tennant Co. | 475,386 | 57,811,691 | ||||||
| 287,962,900 | ||||||||
| Medical Equipment & Devices — 4.24% | ||||||||
| Bruker Corp. | 1,962,302 | 184,338,651 | ||||||
| Globus Medical, Inc., Class A(b) | 125,738 | 6,744,586 | ||||||
| Integer Holdings Corp.(b) | 930,586 | 108,580,774 | ||||||
| Integra LifeSciences Holdings Corp.(b) | 416,644 | 14,770,030 | ||||||
| Merit Medical Systems, Inc.(b) | 1,095,027 | 82,948,295 | ||||||
| 397,382,336 | ||||||||
| Metals & Mining — 1.45% | ||||||||
| Alpha Metallurgical Resources, Inc. | 412,572 | 136,631,469 | ||||||
| Oil & Gas Producers — 4.98% | ||||||||
| Chord Energy Corp. | 983,446 | 175,289,415 | ||||||
| HF Sinclair Corp. | 1,705,560 | 102,964,657 | ||||||
| Murphy USA, Inc. | 453,808 | 190,236,314 | ||||||
| 468,490,386 | ||||||||
| Publishing & Broadcasting — 1.06% | ||||||||
| Nexstar Media Group, Inc., Class A | 577,281 | 99,459,743 | ||||||
| Real Estate — 1.38% | ||||||||
| Apple Hospitality REIT, Inc. | 6,777,247 | 111,011,305 | ||||||
| Piedmont Office Realty Trust, Inc., Class A | 2,655,786 | 18,670,176 | ||||||
| 129,681,481 | ||||||||
| Retail - Discretionary — 2.80% | ||||||||
| Academy Sports & Outdoors, Inc. | 878,327 | 59,322,206 | ||||||
| AutoNation, Inc.(b) | 346,715 | 57,409,070 | ||||||
| Builders FirstSource, Inc.(b) | 344,305 | 71,804,808 | ||||||
| Signet Jewelers Ltd.(a) | 745,887 | 74,640,911 | ||||||
| 263,176,995 | ||||||||
| Semiconductors — 0.91% | ||||||||
| Cirrus Logic, Inc.(b) | 827,581 | 76,600,897 | ||||||
| Diodes, Inc.(b) | 128,221 | 9,039,581 | ||||||
| 85,640,478 | ||||||||
See accompanying notes which are an integral part of these financial statements.
20
| FullerThaler Behavioral Small-Cap Equity Fund |
| Schedule of Investments (continued) |
| March 31, 2024 - (Unaudited) |
| Shares | Fair Value | |||||||
| COMMON STOCKS — (continued) | ||||||||
| Software — 1.63% | ||||||||
| Concentrix Corp.(a) | 166,876 | $ | 11,050,529 | |||||
| Donnelley Financial Solutions, Inc.(b) | 337,358 | 20,919,570 | ||||||
| Progress Software Corp.(a) | 1,114,547 | 59,416,500 | ||||||
| Teradata Corp.(b) | 182,285 | 7,048,961 | ||||||
| Ziff Davis, Inc. (b) | 872,038 | 54,973,275 | ||||||
| 153,408,835 | ||||||||
| Specialty Finance — 0.26% | ||||||||
| Stewart Information Services Corp. | 382,300 | 24,872,438 | ||||||
| Steel — 2.50% | ||||||||
| Commercial Metals Co. | 4,000,161 | 235,089,462 | ||||||
| Technology Hardware — 2.35% | ||||||||
| Avnet, Inc. | 688,972 | 34,159,232 | ||||||
| InterDigital, Inc. | 714,267 | 76,040,865 | ||||||
| Jabil, Inc. | 316,682 | 42,419,554 | ||||||
| Sanmina Corp.(b) | 1,096,834 | 68,201,138 | ||||||
| 220,820,789 | ||||||||
| Technology Services — 4.12% | ||||||||
| CSG Systems International, Inc.(a) | 1,331,967 | 68,649,579 | ||||||
| EVERTEC, Inc. | 1,069,276 | 42,664,112 | ||||||
| ExlService Holdings, Inc.(b) | 2,210,756 | 70,302,041 | ||||||
| Insight Enterprises, Inc.(b) | 155,423 | 28,834,075 | ||||||
| Parsons Corp.(b) | 867,846 | 71,987,826 | ||||||
| Science Applications International Corp. | 798,860 | 104,163,355 | ||||||
| 386,600,988 | ||||||||
| Transportation & Logistics — 2.55% | ||||||||
| Hub Group, Inc., Class A | 552,064 | 23,860,206 | ||||||
| Landstar System, Inc. | 384,529 | 74,121,811 | ||||||
| Ryder System, Inc. | 604,575 | 72,663,869 | ||||||
| Teekay Tankers Ltd., Class A | 1,178,801 | 68,853,766 | ||||||
| 239,499,652 | ||||||||
| Transportation Equipment — 1.30% | ||||||||
| Allison Transmission Holdings, Inc. | 1,510,839 | 122,619,693 | ||||||
| Total Common Stocks (Cost $6,241,862,263) | 9,020,340,304 | |||||||
| Shares | Fair Value | |||||||
| COLLATERAL FOR SECURITIES LOANED — 0.11% | ||||||||
| Money Market Funds — 0.11% | ||||||||
| Invesco Government & Agency Portfolio, Institutional Class, 5.24%(c) | 10,579,946 | $ | 10,579,946 | |||||
| Total Collateral for Securities Loaned/ Money Market Funds (Cost $10,579,946) | 10,579,946 | |||||||
| MONEY MARKET FUNDS - 1.64% | ||||||||
| Fidelity Investments Money Market Government Portfolio, Institutional Class, 5.25%(c) | 153,790,969 | 153,790,969 | ||||||
| Total Money Market Funds | ||||||||
| (Cost $153,790,969) | 153,790,969 | |||||||
| Total Investments — 97.71% | ||||||||
| (Cost $6,406,233,178) | 9,184,711,219 | |||||||
| Other Assets in Excess of Liabilities(d)— 2.29% | 214,932,621 | |||||||
| NET ASSETS — 100.00% | $ | 9,399,643,840 | ||||||
| (a) | All or a portion of the security was on loan as of March 31, 2024. The total value of securities on loan as of March 31, 2024 was $176,004,848. |
| (b) | Non-income producing security. |
| (c) | Rate disclosed is the seven day effective yield as of March 31, 2024. |
| (d) | Includes cash collateral for securities loaned in the amount of $167,234,279. This cash is held deposit accounts as part of the IntraFi Network Deposit Placement Agreement. |
See accompanying notes which are an integral part of these financial statements.
21
| FullerThaler Behavioral Small-Cap Growth Fund |
| Schedule of Investments |
| March 31, 2024 - (Unaudited) |
| Shares | Fair Value | |||||||
| COMMON STOCKS — 97.53% | ||||||||
| Aerospace & Defense — 1.31% | ||||||||
| AeroVironment, Inc.(a) | 91,400 | $ | 14,009,792 | |||||
| Automotive — 2.06% | ||||||||
| Modine Manufacturing Co.(a)(b) | 231,500 | 22,036,485 | ||||||
| Biotech & Pharma — 3.26% | ||||||||
| Alkermes PLC(a) | 345,125 | 9,342,534 | ||||||
| Halozyme Therapeutics, Inc.(a)(b) | 311,050 | 12,653,514 | ||||||
| TransMedics Group, Inc.(a)(b) | 174,600 | 12,909,924 | ||||||
| 34,905,972 | ||||||||
| Construction Materials — 1.60% | ||||||||
| Knife River Corp.(a) | 211,100 | 17,115,988 | ||||||
| Consumer Services — 1.17% | ||||||||
| Stride, Inc.(a) | 197,700 | 12,464,985 | ||||||
| E-Commerce Discretionary — 1.44% | ||||||||
| Revolve Group, Inc., Class A(a) | 726,800 | 15,386,356 | ||||||
| Electrical Equipment — 9.10% | ||||||||
| AAON, Inc. | 176,650 | 15,562,865 | ||||||
| Alarm.com Holdings, Inc.(a) | 197,935 | 14,344,349 | ||||||
| NEXTracker, Inc., Class A(a) | 276,100 | 15,536,147 | ||||||
| Vertiv Holdings Co., Class A | 635,430 | 51,895,569 | ||||||
| 97,338,930 | ||||||||
| Food — 3.12% | ||||||||
| BellRing Brands, Inc.(a) | 312,623 | 18,454,136 | ||||||
| Post Holdings, Inc.(a) | 140,100 | 14,889,828 | ||||||
| 33,343,964 | ||||||||
| Health Care Facilities & Services — 4.27% | ||||||||
| Fortrea Holdings, Inc.(a) | 479,100 | 19,231,074 | ||||||
| HealthEquity, Inc.(a) | 174,600 | 14,252,598 | ||||||
| Progyny, Inc.(a)(b) | 317,831 | 12,125,253 | ||||||
| 45,608,925 | ||||||||
| Household Products — 5.18% | ||||||||
| e.l.f. Beauty, Inc.(a) | 283,005 | 55,477,470 | ||||||
| Shares | Fair Value | |||||||
| Internet Media & Services — 4.85% | ||||||||
| Lyft, Inc.(a) | 942,000 | $ | 18,227,700 | |||||
| TripAdvisor, Inc.(a) | 824,300 | 22,907,297 | ||||||
| Upwork, Inc.(a) | 873,000 | 10,702,980 | ||||||
| 51,837,977 | ||||||||
| Leisure Facilities & Services — 6.16% | ||||||||
| Dutch Bros, Inc., Class A(a) | 365,440 | 12,059,520 | ||||||
| International Game Technology PLC | 582,013 | 13,147,674 | ||||||
| Red Rock Resorts, Inc., Class A | 251,800 | 15,062,676 | ||||||
| Wingstop, Inc. | 69,885 | 25,605,863 | ||||||
| 65,875,733 | ||||||||
| Leisure Products — 1.93% | ||||||||
| Axon Enterprise, Inc.(a) | 66,145 | 20,695,448 | ||||||
| Life Sciences Tools & Services — 1.18% | ||||||||
| Azenta, Inc.(a)(b) | 209,120 | 12,605,754 | ||||||
| Medical Equipment & Devices — 3.96% | ||||||||
| Integer Holdings Corp.(a) | 134,000 | 15,635,119 | ||||||
| Lantheus Holdings, Inc.(a) | 227,394 | 14,153,003 | ||||||
| Merit Medical Systems, Inc.(a)(b) | 166,445 | 12,608,209 | ||||||
| 42,396,331 | ||||||||
| Oil & Gas Services & Equipment — 2.85% | ||||||||
| Weatherford International PLC(a) | 263,915 | 30,461,069 | ||||||
| Retail - Consumer Staples — 1.15% | ||||||||
| Ollie’s Bargain Outlet Holdings, Inc.(a) | 154,300 | 12,277,651 | ||||||
| Retail - Discretionary — 4.89% | ||||||||
| Abercrombie & Fitch Co., Class A(a) | 233,465 | 29,260,168 | ||||||
| Freshpet, Inc.(a) | 198,925 | 23,047,451 | ||||||
| 52,307,619 | ||||||||
| Semiconductors — 2.74% | ||||||||
| ACM Research, Inc., Class A(a) | 503,500 | 14,671,990 | ||||||
| Cirrus Logic, Inc.(a) | 158,400 | 14,661,504 | ||||||
| 29,333,494 | ||||||||
See accompanying notes which are an integral part of these financial statements.
22
| FullerThaler Behavioral Small-Cap Growth Fund |
| Schedule of Investments (continued) |
| March 31, 2024 - (Unaudited) |
| Shares | Fair Value | |||||||
| COMMON STOCKS — (continued) | ||||||||
| Software — 21.17% | ||||||||
| AppFolio, Inc., Class A(a) | 64,195 | $ | 15,839,474 | |||||
| AZEK Co., Inc. (The)(a) | 353,300 | 17,742,726 | ||||||
| DigitalOcean Holdings, Inc.(a)(b) | 544,100 | 20,773,738 | ||||||
| Duolingo, Inc.(a) | 60,100 | 13,256,858 | ||||||
| Evolent Health, Inc., Class A(a)(b) | 576,570 | 18,905,730 | ||||||
| Freshworks, Inc., Class A(a) | 576,575 | 10,499,431 | ||||||
| Informatica, Inc., Class A(a) | 580,680 | 20,323,800 | ||||||
| Nutanix, Inc., Class A(a) | 600,920 | 37,088,782 | ||||||
| Pegasystems, Inc. | 304,500 | 19,682,880 | ||||||
| Rapid7, Inc.(a) | 259,910 | 12,745,986 | ||||||
| Tenable Holdings, Inc.(a)(b) | 284,200 | 14,048,006 | ||||||
| Vertex, Inc., Class A(a) | 467,000 | 14,831,920 | ||||||
| Zeta Global Holdings Corp., Class A(a)(b) | 982,611 | 10,739,938 | ||||||
| 226,479,269 | ||||||||
| Technology Hardware — 6.58% | ||||||||
| Harmonic, Inc.(a) | 990,800 | 13,316,352 | ||||||
| Super Micro Computer, Inc.(a)(b) | 56,490 | 57,056,595 | ||||||
| 70,372,947 | ||||||||
| Technology Services — 5.73% | ||||||||
| Cleanspark, Inc.(a)(b) | 1,149,100 | 24,372,411 | ||||||
| Flywire Corp.(a) | 534,000 | 13,248,540 | ||||||
| LiveRamp Holdings, Inc.(a) | 377,660 | 13,029,270 | ||||||
| Shift4 Payments, Inc., Class A(a)(b) | 160,350 | 10,594,325 | ||||||
| 61,244,546 | ||||||||
| Telecommunications — 1.83% | ||||||||
| Frontier Communications Parent, Inc.(a)(b) | 799,952 | 19,598,824 | ||||||
| Total Common Stocks | ||||||||
| (Cost $849,484,728) | 1,043,175,529 | |||||||
| Shares | Fair Value | |||||||
| COLLATERAL FOR SECURITIES LOANED — 0.58% | ||||||||
| Money Market Funds — 0.58% | ||||||||
| Invesco Government & Agency Portfolio, Institutional Class, 5.24%(c) | 6,204,599 | $ | 6,204,599 | |||||
| Total Collateral for Securities Loaned/ Money Market Funds (Cost $6,204,599) | 6,204,599 | |||||||
| Total Investments — 98.11% | ||||||||
| (Cost $855,689,327) | 1,049,380,128 | |||||||
| Other Assets in Excess of Liabilities(d)— 1.89% | 20,269,355 | |||||||
| NET ASSETS — 100.00% | $ | 1,069,649,483 | ||||||
| (a) | Non-income producing security. |
| (b) | All or a portion of the security was on loan as of March 31, 2024. The total value of securities on loan as of March 31, 2024 was $100,570,647. |
| (c) | Rate disclosed is the seven day effective yield as of March 31, 2024. |
| (d) | Includes cash collateral for securities loaned in the amount of $98,074,380. This cash is held deposit accounts as part of the IntraFi Network Deposit Placement Agreement. |
See accompanying notes which are an integral part of these financial statements.
23
| FullerThaler Behavioral Mid-Cap Value Fund |
| Schedule of Investments |
| March 31, 2024 - (Unaudited) |
| Shares | Fair Value | |||||||
| COMMON STOCKS — 92.64% | ||||||||
| Banking — 16.75% | ||||||||
| Citizens Financial Group, Inc. | 353,420 | $ | 12,825,611 | |||||
| East West Bancorp, Inc.(a) | 78,525 | 6,212,113 | ||||||
| First Citizens BancShares, Inc., Class A | 8,390 | 13,717,648 | ||||||
| First Horizon National Corp. | 148,810 | 2,291,674 | ||||||
| Huntington Bancshares, Inc. | 526,684 | 7,347,242 | ||||||
| KeyCorp | 737,480 | 11,659,559 | ||||||
| M&T Bank Corp. | 42,090 | 6,121,570 | ||||||
| Old National Bancorp | 274,665 | 4,781,918 | ||||||
| Wells Fargo & Co. | 84,505 | 4,897,910 | ||||||
| Zions Bancorp. | 116,565 | 5,058,921 | ||||||
| 74,914,166 | ||||||||
| Chemicals — 4.54% | ||||||||
| Celanese Corp.(a) | 45,390 | 7,800,725 | ||||||
| Olin Corp. | 140,490 | 8,260,812 | ||||||
| Sherwin-Williams Co. (The) | 12,214 | 4,242,289 | ||||||
| 20,303,826 | ||||||||
| Commercial Support Services — 5.16% | ||||||||
| Aramark | 319,675 | 10,395,830 | ||||||
| Brink’s Co. (The) | 79,660 | 7,358,991 | ||||||
| Republic Services, Inc. | 16,645 | 3,186,519 | ||||||
| Vestis Corp. | 110,937 | 2,137,756 | ||||||
| 23,079,096 | ||||||||
| Containers & Packaging — 7.92% | ||||||||
| Berry Plastics Group, Inc. | 196,830 | 11,904,278 | ||||||
| Crown Holdings, Inc. | 64,380 | 5,102,759 | ||||||
| Graphic Packaging Holding Co. | 399,660 | 11,662,079 | ||||||
| WestRock Co. | 135,875 | 6,719,019 | ||||||
| 35,388,135 | ||||||||
| Electric Utilities — 2.91% | ||||||||
| Alliant Energy Corp. | 40,785 | 2,055,564 | ||||||
| CenterPoint Energy, Inc. | 173,945 | 4,955,693 | ||||||
| CMS Energy Corp. | 29,100 | 1,755,894 | ||||||
| Shares | Fair Value | |||||||
| Electric Utilities — (continued) | ||||||||
| Edison International | 29,150 | $ | 2,061,780 | |||||
| Pinnacle West Capital Corp. | 28,915 | 2,160,818 | ||||||
| 12,989,749 | ||||||||
| Electrical Equipment — 2.87% | ||||||||
| AMETEK, Inc. | 18,590 | 3,400,111 | ||||||
| Johnson Controls International PLC | 102,735 | 6,710,651 | ||||||
| Roper Technologies, Inc. | 4,810 | 2,697,640 | ||||||
| 12,808,402 | ||||||||
| Food — 1.29% | ||||||||
| Ingredion, Inc. | 49,180 | 5,746,683 | ||||||
| Gas & Water Utilities — 1.14% | ||||||||
| Atmos Energy Corp. | 42,860 | 5,094,768 | ||||||
| Health Care Facilities & Services — 2.51% | ||||||||
| Centene Corp.(b) | 29,175 | 2,289,654 | ||||||
| Henry Schein, Inc.(a) (b) | 33,980 | 2,566,170 | ||||||
| Laboratory Corp. of America Holdings | 29,170 | 6,372,477 | ||||||
| 11,228,301 | ||||||||
| Home & Office Products — 0.31% | ||||||||
| Newell Brands, Inc. | 173,011 | 1,389,278 | ||||||
| Home Construction — 0.91% | ||||||||
| Mohawk Industries, Inc.(b) | 31,105 | 4,071,333 | ||||||
| Industrial Support Services — 2.76% | ||||||||
| U-Haul Holding Co.(a) | 185,250 | 12,352,470 | ||||||
| Insurance — 6.41% | ||||||||
| Everest Re Group, Ltd. | 25,730 | 10,227,675 | ||||||
| Globe Life, Inc. | 81,965 | 9,538,267 | ||||||
| Markel Corp.(b) | 5,835 | 8,877,836 | ||||||
| 28,643,778 | ||||||||
| Machinery — 2.89% | ||||||||
| AGCO Corp. | 56,800 | 6,987,536 | ||||||
| Donaldson Co., Inc. | 79,270 | 5,919,884 | ||||||
| 12,907,420 | ||||||||
See accompanying notes which are an integral part of these financial statements.
24
| FullerThaler Behavioral Mid-Cap Value Fund |
| Schedule of Investments (continued) |
| March 31, 2024 - (Unaudited) |
| Shares | Fair Value | |||||||
| COMMON STOCKS — (continued) | ||||||||
| Medical Equipment & Devices — 1.69% | ||||||||
| DENTSPLY SIRONA, Inc. | 227,850 | $ | 7,562,342 | |||||
| Oil & Gas Producers — 4.65% | ||||||||
| Cheniere Energy, Inc. | 40,505 | 6,532,646 | ||||||
| Devon Energy Corp. | 202,065 | 10,139,622 | ||||||
| Pioneer Natural Resources Co. | 15,610 | 4,097,625 | ||||||
| 20,769,893 | ||||||||
| Real Estate — 3.26% | ||||||||
| American Tower Corp., Class A | 33,285 | 6,576,783 | ||||||
| Brixmor Property Group, Inc.(a) | 251,325 | 5,893,571 | ||||||
| WP Carey, Inc. | 37,505 | 2,116,782 | ||||||
| 14,587,136 | ||||||||
| REIT — 3.21% | ||||||||
| Healthpeak Properties, Inc. | 598,455 | 11,221,031 | ||||||
| Public Storage(a) | 10,725 | 3,110,894 | ||||||
| 14,331,925 | ||||||||
| Retail - Consumer Staples — 2.66% | ||||||||
| Dollar General Corp. | 53,435 | 8,339,066 | ||||||
| Dollar Tree, Inc.(b) | 26,755 | 3,562,428 | ||||||
| 11,901,494 | ||||||||
| Retail - Discretionary — 3.88% | ||||||||
| Advance Auto Parts, Inc. | 106,645 | 9,074,424 | ||||||
| CarMax, Inc.(b) | 95,090 | 8,283,290 | ||||||
| 17,357,714 | ||||||||
| Specialty Finance — 2.17% | ||||||||
| Synchrony Financial | 225,298 | 9,714,850 | ||||||
| Technology Hardware — 0.49% | ||||||||
| NCR Atleos Corp.(b) | 47,070 | 929,633 | ||||||
| NCR Corp.(b) | 99,440 | 1,255,927 | ||||||
| 2,185,560 | ||||||||
| Technology Services — 12.26% | ||||||||
| Amdocs Ltd. | 31,830 | 2,876,477 | ||||||
| Dun & Bradstreet Holdings, Inc. | 565,725 | 5,679,879 | ||||||
| Shares | Fair Value | |||||||
| Technology Services — (continued) | ||||||||
| Fidelity National Information Services, Inc.(a) | 262,625 | $ | 19,481,523 | |||||
| Global Payments, Inc. | 95,450 | 12,757,847 | ||||||
| TransUnion | 131,000 | 10,453,800 | ||||||
| Verisk Analytics, Inc. | 15,095 | 3,558,344 | ||||||
| 54,807,870 | ||||||||
| Total Common Stocks | ||||||||
| (Cost $371,553,786) | 414,136,189 | |||||||
| COLLATERAL FOR SECURITIES LOANED — 0.51% | ||||||||
| Money Market Funds — 0.51% | ||||||||
| Invesco Government & Agency Portfolio, Institutional Class, 5.24%(c) | 2,270,979 | 2,270,979 | ||||||
| Total Collateral for Securities Loaned/ Money Market Funds (Cost $2,270,979) | 2,270,979 | |||||||
| Total Investments — 93.15% | ||||||||
| (Cost $373,824,765) | 416,407,168 | |||||||
| Other Assets in Excess of Liabilities(d)— 6.85% | 30,605,651 | |||||||
| NET ASSETS — 100.00% | $ | 447,012,819 | ||||||
| (a) | All or a portion of the security was on loan as of March 31, 2024. The total value of securities on loan as of March 31, 2024 was $37,787,302. |
| (b) | Non-income producing security. |
| (c) | Rate disclosed is the seven day effective yield as of March 31, 2024. |
| (d) | Includes cash collateral for securities loaned in the amount of $35,896,736. This cash is held deposit accounts as part of the IntraFi Network Deposit Placement Agreement. |
See accompanying notes which are an integral part of these financial statements.
25
| FullerThaler Behavioral Unconstrained Equity Fund |
| Schedule of Investments |
| March 31, 2024 - (Unaudited) |
| Shares | Fair Value | |||||||
| COMMON STOCKS — 97.49% | ||||||||
| Automotive — 4.10% | ||||||||
| Gentex Corp. | 76,890 | $ | 2,777,267 | |||||
| Banking — 3.17% | ||||||||
| First Citizens BancShares, Inc., Class A | 1,310 | 2,141,850 | ||||||
| Biotech & Pharma — 5.21% | ||||||||
| Amgen, Inc. | 4,165 | 1,184,193 | ||||||
| Exelixis, Inc.(a) | 98,685 | 2,341,795 | ||||||
| 3,525,988 | ||||||||
| Chemicals — 5.13% | ||||||||
| Ecolab, Inc. | 15,036 | 3,471,812 | ||||||
| Commercial Support Services — 5.99% | ||||||||
| Cintas Corp. | 5,893 | 4,048,668 | ||||||
| E-Commerce Discretionary — 6.41% | ||||||||
| eBay, Inc. | 82,225 | 4,339,836 | ||||||
| Leisure Facilities & Services — 2.05% | ||||||||
| Starbucks Corp. | 15,185 | 1,387,757 | ||||||
| Machinery — 5.59% | ||||||||
| Parker-Hannifin Corp. | 6,808 | 3,783,818 | ||||||
| Medical Equipment & Devices — 4.05% | ||||||||
| Waters Corp.(a) | 7,957 | 2,739,038 | ||||||
| Publishing & Broadcasting — 2.65% | ||||||||
| Liberty Media Corp.- Liberty Sirius XM, Class C(a) | 60,331 | 1,792,434 | ||||||
| Retail - Consumer Staples — 4.55% | ||||||||
| Dollar General Corp. | 19,735 | 3,079,844 | ||||||
| Retail - Discretionary — 10.00% | ||||||||
| O’Reilly Automotive, Inc.(a) | 2,697 | 3,044,589 | ||||||
| Ross Stores, Inc. | 25,335 | 3,718,165 | ||||||
| 6,762,754 | ||||||||
| Semiconductors — 16.40% | ||||||||
| KLA Corp. | 2,850 | 1,990,925 | ||||||
| Lam Research Corp. | 3,365 | 3,269,333 | ||||||
| NVIDIA Corp. | 3,000 | 2,710,680 | ||||||
| Shares | Fair Value | |||||||
| Semiconductors — (continued) | ||||||||
| Teradyne, Inc. | 27,647 | $ | 3,119,411 | |||||
| 11,090,349 | ||||||||
| Software — 2.88% | ||||||||
| Fortinet, Inc.(a) | 28,555 | 1,950,592 | ||||||
| Specialty Finance — 7.74% | ||||||||
| Capital One Financial Corp. | 12,965 | 1,930,359 | ||||||
| Synchrony Financial | 76,820 | 3,312,478 | ||||||
| 5,242,837 | ||||||||
| Technology Hardware — 5.47% | ||||||||
| Zebra Technologies Corp., Class A(a) | 12,270 | 3,698,669 | ||||||
| Transportation & Logistics — 1.43% | ||||||||
| UnionPacific Corp. | 3,942 | 969,456 | ||||||
| Transportation Equipment — 4.67% | ||||||||
| Allison Transmission Holdings, Inc. | 38,955 | 3,161,588 | ||||||
| Total Common Stocks | ||||||||
| (Cost $51,818,674) | 65,964,557 | |||||||
| Total Common Stocks/ Investments — 97.49% | ||||||||
| (Cost $51,818,674) | 65,964,557 | |||||||
| Other Assets in Excess of Liabilities— 2.51% | 1,699,051 | |||||||
| NET ASSETS — 100.00% | $ | 67,663,608 | ||||||
| (a) | Non-income producing security. |
See accompanying notes which are an integral part of these financial statements.
26
| FullerThaler Behavioral Small-Mid Core Equity Fund |
| Schedule of Investments |
| March 31, 2024 - (Unaudited) |
| Shares | Fair Value | |||||||
| COMMON STOCKS — 98.44% | ||||||||
| Asset Management — 1.77% | ||||||||
| Hamilton Lane, Inc., Class A | 10,415 | $ | 1,174,395 | |||||
| Automotive — 3.24% | ||||||||
| Gentex Corp. | 59,545 | 2,150,765 | ||||||
| Banking — 6.43% | ||||||||
| First Citizens BancShares,Inc., Class A | 975 | 1,594,126 | ||||||
| First Commonwealth Financial Corp. | 66,180 | 921,226 | ||||||
| First Financial Bankshares, Inc. | 28,400 | 931,804 | ||||||
| Live Oak Bancshares, Inc. | 19,612 | 814,094 | ||||||
| 4,261,250 | ||||||||
| Biotech & Pharma — 2.27% | ||||||||
| Exelixis, Inc.(a) | 63,415 | 1,504,838 | ||||||
| Chemicals — 3.79% | ||||||||
| Huntsman Corp. | 41,075 | 1,069,182 | ||||||
| Orion Engineered Carbons SA | 61,365 | 1,443,305 | ||||||
| 2,512,487 | ||||||||
| Commercial Support Services — 0.98% | ||||||||
| Cintas Corp. | 945 | 649,243 | ||||||
| Construction Materials — 1.66% | ||||||||
| Owens Corning | 6,595 | 1,100,046 | ||||||
| Containers & Packaging — 1.78% | ||||||||
| International Paper Co. | 30,340 | 1,183,867 | ||||||
| E-Commerce Discretionary — 3.18% | ||||||||
| eBay, Inc. | 40,000 | 2,111,200 | ||||||
| Electrical Equipment — 2.41% | ||||||||
| Acuity Brands, Inc. | 5,615 | 1,508,919 | ||||||
| Advanced Energy Industries, Inc. | 895 | 91,272 | ||||||
| 1,600,191 | ||||||||
| Food — 4.31% | ||||||||
| John B. Sanfilippo & Son, Inc. | 5,290 | 560,317 | ||||||
| Lancaster Colony Corp. | 11,070 | 2,298,464 | ||||||
| 2,858,781 | ||||||||
| Shares | Fair Value | |||||||
| Gas & Water Utilities — 0.26% | ||||||||
| UGI Corp. | 6,960 | $ | 170,798 | |||||
| Health Care Facilities & Services — 2.53% | ||||||||
| Medpace Holdings, Inc.(a) | 725 | 293,009 | ||||||
| Quest Diagnostics, Inc. | 10,410 | 1,385,675 | ||||||
| 1,678,684 | ||||||||
| Home & Office Products — 0.57% | ||||||||
| Tempur Sealy International, Inc. | 6,630 | 376,717 | ||||||
| Home Construction — 4.13% | ||||||||
| Masco Corp. | 23,960 | 1,889,965 | ||||||
| PulteGroup, Inc. | 7,020 | 846,752 | ||||||
| 2,736,717 | ||||||||
| Institutional Financial Services — 0.72% | ||||||||
| Nasdaq, Inc. | 7,520 | 474,512 | ||||||
| Insurance — 5.03% | ||||||||
| Brown & Brown, Inc. | 21,643 | 1,894,628 | ||||||
| Old Republic International Corp. | 47,025 | 1,444,608 | ||||||
| 3,339,236 | ||||||||
| Machinery — 1.74% | ||||||||
| Graco, Inc. | 8,370 | 782,261 | ||||||
| Parker-Hannifin Corp. | 670 | 372,379 | ||||||
| 1,154,640 | ||||||||
| Medical Equipment & Devices — 4.14% | ||||||||
| Align Technology, Inc.(a) | 1,315 | 431,215 | ||||||
| DENTSPLY SIRONA, Inc. | 29,900 | 992,381 | ||||||
| Waters Corp.(a) | 3,845 | 1,323,564 | ||||||
| 2,747,160 | ||||||||
| Oil & Gas Producers — 4.25% | ||||||||
| Coterra Energy, Inc. | 72,135 | 2,011,124 | ||||||
| Devon Energy Corp. | 16,104 | 808,099 | ||||||
| 2,819,223 | ||||||||
| Real Estate — 7.63% | ||||||||
| American Assets Trust, Inc. | 34,600 | 758,086 | ||||||
| Apple Hospitality REIT, Inc. | 84,810 | 1,389,188 | ||||||
See accompanying notes which are an integral part of these financial statements.
27
| FullerThaler Behavioral Small-Mid Core Equity Fund |
| Schedule of Investments (continued) |
| March 31, 2024 - (Unaudited) |
| Shares | Fair Value | |||||||
| COMMON STOCKS — (continued) | ||||||||
| Real Estate — (continued) | ||||||||
| Gaming and Leisure Properties, Inc. | 43,664 | $ | 2,011,600 | |||||
| National Storage AffiliatesTrust | 23,030 | 901,855 | ||||||
| 5,060,729 | ||||||||
| REIT — 1.33% | ||||||||
| Matson, Inc. | 7,850 | 882,340 | ||||||
| Retail - Consumer Staples — 2.18% | ||||||||
| Dollar General Corp. | 9,270 | 1,446,676 | ||||||
| Retail - Discretionary — 2.52% | ||||||||
| Advance Auto Parts, Inc. | 14,520 | 1,235,507 | ||||||
| Ross Stores, Inc. | 2,970 | 435,877 | ||||||
| 1,671,384 | ||||||||
| Semiconductors — 7.26% | ||||||||
| Cirrus Logic, Inc.(a) | 15,685 | 1,451,803 | ||||||
| IPG Photonics Corp.(a) | 7,000 | 634,830 | ||||||
| Power Integrations, Inc. | 13,640 | 975,942 | ||||||
| Teradyne, Inc. | 15,585 | 1,758,455 | ||||||
| 4,821,030 | ||||||||
| Software — 3.59% | ||||||||
| Akamai Technologies, Inc.(a) | 5,895 | 641,140 | ||||||
| Concentrix Corp. | 1,075 | 71,187 | ||||||
| SS&C Technologies Holdings, Inc. | 25,940 | 1,669,758 | ||||||
| 2,382,085 | ||||||||
| Specialty Finance — 2.08% | ||||||||
| Synchrony Financial | 32,070 | 1,382,858 | ||||||
| Steel — 1.56% | ||||||||
| Steel Dynamics, Inc. | 6,990 | 1,036,128 | ||||||
| Technology Hardware — 3.87% | ||||||||
| NetApp, Inc. | 10,890 | 1,143,123 | ||||||
| Zebra Technologies Corp., Class A(a) | 4,715 | 1,421,290 | ||||||
| 2,564,413 | ||||||||
| Technology Services — 4.70% | ||||||||
| Leidos Holdings, Inc. | 14,835 | 1,944,720 | ||||||
| Shares | Fair Value | |||||||
| Technology Services — (continued) | ||||||||
| Science Applications International Corp. | 8,975 | $ | 1,170,250 | |||||
| 3,114,970 | ||||||||
| Transportation & Logistics — 2.18% | ||||||||
| Expeditors International of Washington, Inc. | 11,880 | 1,444,252 | ||||||
| Transportation Equipment — 3.89% | ||||||||
| Allison Transmission Holdings, Inc. | 31,820 | 2,582,511 | ||||||
| Wholesale - Discretionary — 0.46% | ||||||||
| Pool Corp. | 760 | 306,660 | ||||||
| Total Common Stocks/Investments — 98.44% | ||||||||
| (Cost $57,353,945) | 65,300,786 | |||||||
| Other Assets in Excess of Liabilities — 1.56% | 1,035,357 | |||||||
| NET ASSETS — 100.00% | $ | 66,336,143 | ||||||
| (a) | Non-income producing security. |
REIT - Real Estate Investment Trust
See accompanying notes which are an integral part of these financial statements.
28
| FullerThaler Behavioral Micro-Cap Equity Fund |
| Schedule of Investments |
| March 31, 2024 - (Unaudited) |
| Shares | Fair Value | |||||||
| COMMON STOCKS — 99.47% | ||||||||
| Advertising & Marketing — 1.69% | ||||||||
| Cardlytics, Inc.(a) | 23,700 | $ | 343,413 | |||||
| Asset Management — 3.26% | ||||||||
| B. Riley Financial, Inc.(b) | 12,046 | 255,014 | ||||||
| Vitesse Energy, Inc. | 17,210 | 408,393 | ||||||
| 663,407 | ||||||||
| Automotive — 0.87% | ||||||||
| Holley, Inc.(a) | 39,550 | 176,393 | ||||||
| Beverages — 1.38% | ||||||||
| BRC, Inc.(a)(b) | 65,850 | 281,838 | ||||||
| Biotech & Pharma — 4.39% | ||||||||
| Emergent BioSolutions, Inc.(a) | 100,900 | 255,277 | ||||||
| OmniAb, Inc.(a) | 58,575 | 317,477 | ||||||
| PetIQ, Inc., Class A(a) | 17,675 | 323,099 | ||||||
| 895,853 | ||||||||
| Commercial Support Services — 3.50% | ||||||||
| Acacia Research Corp.(a) | 67,960 | 362,227 | ||||||
| BrightView Holdings, Inc.(a) | 29,550 | 351,645 | ||||||
| 713,872 | ||||||||
| Containers & Packaging — 1.08% | ||||||||
| TriMas Corp. | 8,200 | 219,186 | ||||||
| E-Commerce Discretionary — 6.46% | ||||||||
| 1-800-FLOWERS. COM, Inc., Class A(a) | 33,862 | 366,725 | ||||||
| Beyond, Inc.(a) | 13,665 | 490,710 | ||||||
| RealReal, Inc. (The)(a) | 117,066 | 457,728 | ||||||
| 1,315,163 | ||||||||
| Electrical Equipment — 3.37% | ||||||||
| Babcock & Wilcox Enterprises, Inc.(a) | 53,900 | 60,907 | ||||||
| FARO Technologies, Inc.(a) | 16,745 | 360,185 | ||||||
| nLIGHT, Inc.(a) | 20,475 | 266,175 | ||||||
| 687,267 | ||||||||
| Food — 4.54% | ||||||||
| Hain Celestial Group, Inc. (The)(a) | 29,225 | 229,709 | ||||||
| Limoneira Co.(a) | 20,760 | 406,065 | ||||||
| SunOpta, Inc.(a) | 41,800 | 287,166 | ||||||
| 922,940 | ||||||||
| Internet Media & Services — 4.48% | ||||||||
| Groupon, Inc.(a) | 25,075 | 334,500 | ||||||
| LiveOne, Inc.(a) | 126,080 | 245,856 | ||||||
| Shares | Fair Value | |||||||
| Internet Media & Services — (continued) | ||||||||
| TrueCar, Inc.(a) | 97,897 | $ | 331,871 | |||||
| 912,227 | ||||||||
| Leisure Facilities & Services — 6.49% | ||||||||
| Bally’s Corp.(a) | 26,125 | 364,182 | ||||||
| Denny’s Corp.(a) | 26,175 | 234,528 | ||||||
| Noodles & Co.(a) | 87,025 | 166,218 | ||||||
| Red Robin Gourmet Burgers, Inc.(a) | 32,310 | 247,495 | ||||||
| Rush Street Interactive, Inc.(a) | 48,000 | 312,479 | ||||||
| 1,324,902 | ||||||||
| Machinery — 2.08% | ||||||||
| Ranpak Holdings Corp., Class A(a) | 53,890 | 424,114 | ||||||
| Medical Equipment & Devices — 4.32% | ||||||||
| Quanterix Corp.(a) | 20,315 | 478,621 | ||||||
| Zimvie, Inc.(a) | 24,300 | 400,707 | ||||||
| 879,328 | ||||||||
| Oil & Gas Producers — 5.39% | ||||||||
| Matador Resources Co. | 11,665 | 778,872 | ||||||
| SandRidge Energy, Inc. | 21,885 | 318,864 | ||||||
| 1,097,736 | ||||||||
| Oil & Gas Services & Equipment — 4.40% | ||||||||
| DMC Global, Inc.(a) | 16,600 | 323,534 | ||||||
| Newpark Resources, Inc.(a) | 79,295 | 572,510 | ||||||
| 896,044 | ||||||||
| Publishing & Broadcasting — 3.08% | ||||||||
| National CineMedia, Inc.(a) | 56,300 | 289,945 | ||||||
| Townsquare Media, Inc., Class A(a) | 30,715 | 337,251 | ||||||
| 627,196 | ||||||||
| REIT — 1.19% | ||||||||
| Farmland Partners, Inc. | 21,920 | 243,312 | ||||||
| Retail - Discretionary — 5.27% | ||||||||
| Aaron’s Co., Inc. (The)(a) | 25,730 | 192,975 | ||||||
| Aspen Aerogels, Inc.(a) | 34,285 | 603,416 | ||||||
| GrowGeneration Corp.(a) | 97,158 | 277,872 | ||||||
| 1,074,263 | ||||||||
| Semiconductors — 1.61% | ||||||||
| AXT, Inc.(a) | 71,500 | 328,185 | ||||||
| Software — 9.69% | ||||||||
| Bandwidth, Inc., Class A(a) | 17,250 | 314,985 | ||||||
See accompanying notes which are an integral part of these financial statements.
29
| FullerThaler Behavioral Micro-Cap Equity Fund |
| Schedule of Investments (continued) |
| March 31, 2024 - (Unaudited) |
| Shares | Fair Value | |||||||
| COMMON STOCKS — (continued) | ||||||||
| Software — (continued) | ||||||||
| Cantaloupe, Inc.(a) | 59,712 | $ | 383,948 | |||||
| OneSpan, Inc.(a) | 23,247 | 270,363 | ||||||
| Porch Group, Inc.(a) | 151,695 | 653,806 | ||||||
| PubMatic, Inc., Class A(a) | 14,800 | 351,056 | ||||||
| 1,974,158 | ||||||||
| Specialty Finance — 5.14% | ||||||||
| Applied Digital Corp.(a) (b) | 68,310 | 292,367 | ||||||
| LendingTree, Inc.(a) | 7,300 | 309,082 | ||||||
| Oportun Financial Corp.(a) | 70,315 | 170,865 | ||||||
| PRA Group, Inc.(a) | 10,574 | 275,770 | ||||||
| 1,048,084 | ||||||||
| Technology Hardware — 5.65% | ||||||||
| NETGEAR, Inc.(a) | 19,025 | 300,024 | ||||||
| PlayAGS, Inc.(a) | 44,450 | 399,161 | ||||||
| Turtle Beach Corp.(a) | 26,155 | 450,912 | ||||||
| 1,150,097 | ||||||||
| Telecommunications — 1.83% | ||||||||
| Spok Holdings, Inc.(a) | 23,410 | 373,390 | ||||||
| Transportation & Logistics — 6.08% | ||||||||
| Nordic American Tankers Ltd. | 71,130 | 278,830 | ||||||
| Overseas Shipholding Group, Inc., Class A(a) | 149,485 | 956,704 | ||||||
| 1,235,534 | ||||||||
| Transportation Equipment — 0.90% | ||||||||
| AerSale Corp.(a) | 25,600 | 183,808 | ||||||
| Wholesale - Consumer Staples — 1.33% | ||||||||
| Calavo Growers, Inc. | 9,750 | 271,148 | ||||||
| Total Common Stocks | ||||||||
| (Cost $16,785,304) | 20,262,858 | |||||||
| COLLATERAL FOR SECURITIES LOANED — 0.24% | ||||||||
| Money Market Funds — 0.24% | ||||||||
| Invesco Government & Agency Portfolio, Institutional Class, 5.24%(c) | 49,264 | 49,264 | ||||||
| Total Collateral for Securities Loaned/ Money Market Funds (Cost $49,264) | 49,264 | |||||||
| Shares | Fair Value | |||||||
| Total Investments — 99.71% | ||||||||
| (Cost $16,834,568) | $ | 20,312,122 | ||||||
| Other Assets in Excess of Liabilities(d)— 0.29% | 58,085 | |||||||
| NET ASSETS — 100.00% | $ | 20,370,207 | ||||||
| (a) | Non-income producing security. |
| (b) | All or a portion of the security was on loan as of March 31, 2024. The total value of securities on loan as of March 31, 2024 was $819,084. |
| (c) | Rate disclosed is the seven day effective yield as of March 31, 2024. |
| (d) | Includes cash collateral for securities loaned in the amount of $778,700. This cash is held deposit accounts as part of the IntraFi Network Deposit Placement Agreement. |
REIT – Real Estate Investment Trust
See accompanying notes which are an integral part of these financial statements.
30
| FullerThaler Behavioral Mid-Cap Equity Fund |
| Schedule of Investments |
| March 31, 2024 - (Unaudited) |
| Shares | Fair Value | |||||||
| COMMON STOCKS — 99.29% | ||||||||
| Advertising & Marketing — 1.11% | ||||||||
| Omnicom Group, Inc. | 1,515 | $ | 146,592 | |||||
| Aerospace & Defense — 1.61% | ||||||||
| Textron, Inc. | 2,225 | 213,444 | ||||||
| Apparel & Textile Products — 1.84% | ||||||||
| Crocs, Inc.(a) | 405 | 58,239 | ||||||
| Deckers Outdoor Corp.(a) | 110 | 103,539 | ||||||
| Skechers U.S.A., Inc., Class A(a) | 1,335 | 81,782 | ||||||
| 243,560 | ||||||||
| Automotive — 0.39% | ||||||||
| BorgWarner, Inc. | 1,475 | 51,242 | ||||||
| Banking — 4.99% | ||||||||
| Bank OZK | 1,125 | 51,143 | ||||||
| Cullen/Frost Bankers, Inc. | 1,730 | 194,746 | ||||||
| East West Bancorp, Inc. | 635 | 50,235 | ||||||
| Fifth Third Bancorp | 6,460 | 240,376 | ||||||
| Wintrust Financial Corp. | 760 | 79,336 | ||||||
| Zions Bancorp. | 1,000 | 43,400 | ||||||
| 659,236 | ||||||||
| Biotech & Pharma — 1.17% | ||||||||
| Biogen, Inc.(a) | 245 | 52,829 | ||||||
| Exelixis, Inc.(a) | 1,320 | 31,324 | ||||||
| United Therapeutics Corp.(a) | 310 | 71,213 | ||||||
| 155,366 | ||||||||
| Chemicals — 4.32% | ||||||||
| CF Industries Holdings, Inc. | 3,360 | 279,585 | ||||||
| Dow, Inc. | 845 | 48,951 | ||||||
| Eastman Chemical Co. | 1,025 | 102,726 | ||||||
| Mosaic Co. (The) | 2,035 | 66,056 | ||||||
| Olin Corp. | 1,295 | 76,146 | ||||||
| 573,464 | ||||||||
| Commercial Support Services — 2.73% | ||||||||
| Cintas Corp. | 400 | 274,812 | ||||||
| Clean Harbors, Inc.(a) | 430 | 86,563 | ||||||
| 361,375 | ||||||||
| Construction Materials — 2.87% | ||||||||
| Owens Corning | 2,275 | 379,470 | ||||||
| Electric Utilities — 0.81% | ||||||||
| OGE Energy Corp. | 1,070 | 36,701 | ||||||
| Shares | Fair Value | |||||||
| Electric Utilities — (continued) | ||||||||
| Vistra Corp. | 1,020 | $ | 71,043 | |||||
| 107,744 | ||||||||
| Electrical Equipment — 4.55% | ||||||||
| Acuity Brands, Inc. | 435 | 116,898 | ||||||
| AMETEK, Inc. | 460 | 84,134 | ||||||
| Trane Technologies PLC | 1,045 | 313,709 | ||||||
| Vontier Corp. | 1,925 | 87,318 | ||||||
| 602,059 | ||||||||
| Engineering & Construction — 4.34% | ||||||||
| EMCOR Group, Inc. | 1,045 | 365,959 | ||||||
| TopBuild Corp.(a) | 475 | 209,347 | ||||||
| 575,306 | ||||||||
| Entertainment Content — 0.80% | ||||||||
| Electronic Arts, Inc. | 800 | 106,136 | ||||||
| Food Products — 0.68% | ||||||||
| Hershey Co. (The) | 465 | 90,443 | ||||||
| Health Care Facilities & Services — 7.35% | ||||||||
| Cardinal Health, Inc. | 1,905 | 213,170 | ||||||
| Centene Corp.(a) | 3,730 | 292,730 | ||||||
| IQVIA Holdings, Inc.(a) | 995 | 251,626 | ||||||
| Laboratory Corp. of America Holdings | 505 | 110,322 | ||||||
| Quest Diagnostics, Inc. | 780 | 103,826 | ||||||
| 971,674 | ||||||||
| Home Construction — 3.46% | ||||||||
| PulteGroup, Inc. | 1,940 | 234,002 | ||||||
| Taylor Morrison Home Corp.(a) | 1,980 | 123,097 | ||||||
| Toll Brothers, Inc. | 780 | 100,909 | ||||||
| 458,008 | ||||||||
| Hotels, Restaurants & Leisure — 0.42% | ||||||||
| Darden Restaurants, Inc. | 330 | 55,160 | ||||||
| Industrial Support Services — 2.58% | ||||||||
| W.W. Grainger, Inc. | 336 | 341,813 | ||||||
| Institutional Financial Services — 1.02% | ||||||||
| Bank of New York Mellon Corp. (The) | 2,355 | 135,695 | ||||||
| Insurance — 4.50% | ||||||||
| Aflac, Inc. | 625 | 53,663 | ||||||
| Hartford Financial Services Group, Inc. (The) | 2,440 | 251,442 | ||||||
See accompanying notes which are an integral part of these financial statements.
31
| FullerThaler Behavioral Mid-Cap Equity Fund |
| Schedule of Investments (continued) |
| March 31, 2024 - (Unaudited) |
| Shares | Fair Value | |||||||
| COMMON STOCKS — (continued) | ||||||||
| Insurance — (continued) | ||||||||
| Principal Financial Group, Inc. | 1,775 | $ | 153,200 | |||||
| Reinsurance Group of America, Inc. | 715 | 137,909 | ||||||
| 596,214 | ||||||||
| Leisure Facilities & Services — 1.16% | ||||||||
| Hilton Worldwide Holdings, Inc. | 420 | 89,590 | ||||||
| Texas Roadhouse, Inc. | 415 | 64,105 | ||||||
| 153,695 | ||||||||
| Machinery — 4.96% | ||||||||
| AGCO Corp. | 1,755 | 215,900 | ||||||
| Donaldson Co., Inc. | 2,070 | 154,588 | ||||||
| Lincoln Electric Holdings, Inc. | 915 | 233,727 | ||||||
| Snap-on, Inc. | 180 | 53,320 | ||||||
| 657,535 | ||||||||
| Medical Equipment & Devices — 2.92% | ||||||||
| Agilent Technologies, Inc. | 580 | 84,396 | ||||||
| Bruker Corp. | 2,415 | 226,864 | ||||||
| Mettler-Toledo International, Inc.(a) | 57 | 75,884 | ||||||
| 387,144 | ||||||||
| Oil & Gas Producers — 6.65% | ||||||||
| Cheniere Energy, Inc. | 1,590 | 256,435 | ||||||
| Coterra Energy, Inc. | 9,115 | 254,126 | ||||||
| Devon Energy Corp. | 2,155 | 108,138 | ||||||
| HF Sinclair Corp. | 2,210 | 133,418 | ||||||
| Murphy USA, Inc. | 305 | 127,856 | ||||||
| 879,973 | ||||||||
| Publishing & Broadcasting — 0.40% | ||||||||
| Nexstar Media Group, Inc. | 305 | 52,548 | ||||||
| Real Estate — 1.69% | ||||||||
| Gaming and Leisure Properties, Inc. | 1,285 | 59,200 | ||||||
| Mid-America Apartment Communities, Inc. | 360 | 47,369 | ||||||
| Weyerhaeuser Co. | 3,250 | 116,707 | ||||||
| 223,276 | ||||||||
| Real Estate Services — 0.59% | ||||||||
| CBRE Group, Inc., Class A(a) | 810 | 78,764 | ||||||
| Shares | Fair Value | |||||||
| Retail - Consumer Staples — 3.41% | ||||||||
| Casey’s General Stores, Inc. | 1,250 | $ | 398,063 | |||||
| Kroger Co. (The) | 920 | 52,560 | ||||||
| 450,623 | ||||||||
| Retail - Discretionary — 6.27% | ||||||||
| AutoNation, Inc.(a) | 465 | 76,995 | ||||||
| Builders FirstSource, Inc.(a) | 2,100 | 437,954 | ||||||
| O’Reilly Automotive, Inc.(a) | 102 | 115,146 | ||||||
| Ulta Beauty, Inc.(a) | 385 | 201,308 | ||||||
| 831,403 | ||||||||
| Semiconductors — 0.65% | ||||||||
| Microchip Technology, Inc. | 965 | 86,570 | ||||||
| Software — 2.06% | ||||||||
| Manhattan Associates, Inc.(a) | 1,090 | 272,751 | ||||||
| Specialty Finance — 2.34% | ||||||||
| Capital One Financial Corp. | 1,040 | 154,846 | ||||||
| Synchrony Financial | 3,605 | 155,447 | ||||||
| 310,293 | ||||||||
| Steel — 3.69% | ||||||||
| Commercial Metals Co. | 1,945 | 114,308 | ||||||
| Nucor Corp. | 1,265 | 250,343 | ||||||
| Reliance Steel & Aluminum Co. | 370 | 123,647 | ||||||
| 488,298 | ||||||||
| Technology Hardware — 5.15% | ||||||||
| Dell Technologies, Inc., Class C | 415 | 47,356 | ||||||
| F5, Inc.(a) | 310 | 58,773 | ||||||
| Hewlett Packard Enterprise Co. | 5,675 | 100,618 | ||||||
| Jabil, Inc. | 1,585 | 212,311 | ||||||
| NetApp, Inc. | 2,500 | 262,424 | ||||||
| 681,482 | ||||||||
| Technology Services — 4.64% | ||||||||
| Amdocs Ltd. | 2,145 | 193,843 | ||||||
| Cognizant Technology Solutions Corp., Class A | 2,075 | 152,077 | ||||||
| Corpay, Inc.(a) | 230 | 70,964 | ||||||
| ExlService Holdings, Inc.(a) | 1,970 | 62,646 | ||||||
See accompanying notes which are an integral part of these financial statements.
32
| FullerThaler Behavioral Mid-Cap Equity Fund |
| Schedule of Investments (continued) |
| March 31, 2024 - (Unaudited) |
| Shares | Fair Value | |||||||
| COMMON STOCKS — (continued) | ||||||||
| Technology Services — (continued) | ||||||||
| Science Applications International Corp. | 1,030 | $ | 134,302 | |||||
| 613,832 | ||||||||
| Transportation & Logistics — 0.41% | ||||||||
| Landstar System, Inc. | 285 | 54,937 | ||||||
| Wholesale - Consumer Staples — 0.25% | ||||||||
| Archer-Daniels-Midland Co. | 530 | 33,289 | ||||||
| Wholesale - Discretionary — 0.51% | ||||||||
| LKQ Corp. | 1,260 | 67,297 | ||||||
| Total Common Stocks/Investments — 99.29% | ||||||||
| (Cost $11,069,853) | 13,147,711 | |||||||
| Other Assets in Excess of Liabilities — 0.71% | 93,481 | |||||||
| NET ASSETS — 100.00% | $ | 13,241,192 | ||||||
| (a) | Non-income producing security. |
See accompanying notes which are an integral part of these financial statements.
33
| FullerThaler Funds |
| Statements of Assets and Liabilities |
| March 31, 2024 - (Unaudited) |
| FullerThaler | FullerThaler | FullerThaler | ||||||||||
| Behavioral Small- | Behavioral Small- | Behavioral Mid- | ||||||||||
| Cap Equity Fund | Cap Growth Fund | Cap Value Fund | ||||||||||
| Assets | ||||||||||||
| Investments in securities at fair value (cost $6,406,233,178, $855,689,327 and $373,824,765) | $ | 9,184,711,219 | $ | 1,049,380,128 | $ | 416,407,168 | ||||||
| Cash and cash equivalents | 253,646,773 | 46,627,206 | 31,858,950 | |||||||||
| Receivable for fund shares sold | 13,569,645 | 6,364,598 | 1,017,253 | |||||||||
| Receivable for investments sold | 21,656,859 | — | — | |||||||||
| Dividends and interest receivable | 7,329,654 | 431,359 | 460,915 | |||||||||
| Cash collateral for securities loaned | 167,234,279 | 98,074,380 | 35,896,736 | |||||||||
| Securities lending income receivable | 10,664 | 4,205 | 1,326 | |||||||||
| Prepaid expenses | 153,392 | 105,451 | 74,963 | |||||||||
| Total Assets | 9,648,312,485 | 1,200,987,327 | 485,717,311 | |||||||||
| Liabilities | ||||||||||||
| Payable for investments purchased | 47,833,517 | 25,371,747 | — | |||||||||
| Payable for fund shares redeemed | 17,026,980 | 807,122 | 234,276 | |||||||||
| Payable for collateral upon return of | ||||||||||||
| securities loaned | 177,814,225 | 104,278,979 | 38,167,715 | |||||||||
| Payable to Adviser | 4,440,858 | 682,493 | 217,497 | |||||||||
| Accrued 12b-1 fees | 88,058 | 23,665 | 2,499 | |||||||||
| Accrued administrative service fees | 1,261,796 | 153,238 | 57,130 | |||||||||
| Payable to affiliates | 107,552 | 6,728 | 8,607 | |||||||||
| Payable to auditors | 9,352 | 9,352 | 9,355 | |||||||||
| Other accrued expenses | 86,307 | 4,520 | 7,413 | |||||||||
| Total Liabilities | 248,668,645 | 131,337,844 | 38,704,492 | |||||||||
| Net Assets | $ | 9,399,643,840 | $ | 1,069,649,483 | $ | 447,012,819 | ||||||
| Net Assets consist of: | ||||||||||||
| Paid-in capital | $ | 6,279,032,231 | $ | 885,178,460 | $ | 403,678,222 | ||||||
| Accumulated earnings | 3,120,611,609 | 184,471,023 | 43,334,597 | |||||||||
| Net Assets | $ | 9,399,643,840 | $ | 1,069,649,483 | $ | 447,012,819 | ||||||
See accompanying notes which are an integral part of these financial statements.
34
| FullerThaler Funds |
| Statements of Assets and Liabilities (continued) |
| March 31, 2024 - (Unaudited) |
| FullerThaler Behavioral Small- Cap Equity Fund | FullerThaler Behavioral Small- Cap Growth Fund | FullerThaler Behavioral Mid- Cap Value Fund | ||||||||||
| R6 Shares: | ||||||||||||
| Net Assets | $ | 2,280,611,248 | $ | 128,718,226 | $ | 182,631,040 | ||||||
| Shares outstanding (unlimited number of shares authorized, no par value) | 48,876,130 | 2,880,062 | 5,451,057 | |||||||||
| Net asset value, offering and redemption price per share | $ | 46.66 | $ | 44.69 | $ | 33.50 | ||||||
| Institutional Shares: | ||||||||||||
| Net Assets | $ | 6,548,350,881 | $ | 887,307,399 | $ | 252,138,645 | ||||||
| Shares outstanding (unlimited number of shares authorized, no par value) | 141,624,994 | 19,972,249 | 7,532,579 | |||||||||
| Net asset value, offering and redemption price per share | $ | 46.24 | $ | 44.43 | $ | 33.47 | ||||||
| Investor Shares: | ||||||||||||
| Net Assets | $ | 540,614,268 | $ | 35,735,714 | $ | 8,826,467 | ||||||
| Shares outstanding (unlimited number of shares authorized, no par value) | 11,780,773 | 819,287 | 264,664 | |||||||||
| Net asset value, offering and redemption price per share | $ | 45.89 | $ | 43.62 | $ | 33.35 | ||||||
| A Shares: | ||||||||||||
| Net Assets | $ | 15,175,147 | $ | 6,061,608 | $ | 2,451,287 | ||||||
| Shares outstanding (unlimited number of shares authorized, no par value) | 331,404 | 139,374 | 73,522 | |||||||||
| Net asset value, offering and redemption price per share | $ | 45.79 | $ | 43.49 | $ | 33.34 | ||||||
| Maximum offering price per share (Note 1) | $ | 48.58 | $ | 46.14 | $ | 35.37 | ||||||
| C Shares: | ||||||||||||
| Net Assets | $ | 14,892,296 | $ | 11,826,536 | $ | 965,380 | ||||||
| Shares outstanding (unlimited number of shares authorized, no par value) | 330,466 | 279,772 | 29,118 | |||||||||
| Net asset value, offering and redemption price per share | $ | 45.06 | $ | 42.27 | $ | 33.15 | ||||||
See accompanying notes which are an integral part of these financial statements.
35
| FullerThaler Funds |
| Statements of Assets and Liabilities (continued) |
| March 31, 2024 - (Unaudited) |
| FullerThaler | FullerThaler | |||||||
| Behavioral | Behavioral Small | |||||||
| Unconstrained | Mid Core Equity | |||||||
| Equity Fund | Fund | |||||||
| Assets | ||||||||
| Investments in securities at fair value (cost $51,818,674 and $57,353,945) | $ | 65,964,557 | $ | 65,300,786 | ||||
| Cash and cash equivalents | 1,850,815 | 955,818 | ||||||
| Receivable for fund shares sold | 482,251 | 70,720 | ||||||
| Receivable for investments sold | 1,719,388 | — | ||||||
| Dividends and interest receivable | 26,214 | 42,501 | ||||||
| Cash collateral for securities loaned | — | — | ||||||
| Securities lending income receivable | — | — | ||||||
| Prepaid expenses | 52,596 | 35,544 | ||||||
| Total Assets | 70,095,821 | 66,405,369 | ||||||
| Liabilities | ||||||||
| Payable for investments purchased | 2,385,233 | — | ||||||
| Payable for fund shares redeemed | — | 21,676 | ||||||
| Payable to Adviser | 31,934 | 27,311 | ||||||
| Accrued 12b-1 fees | 61 | 115 | ||||||
| Accrued administrative service fees | 3,818 | 8,613 | ||||||
| Payable to affiliates | 2,568 | 2,570 | ||||||
| Payable to auditors | 8,599 | 8,480 | ||||||
| Other accrued expenses | — | 461 | ||||||
| Total Liabilities | 2,432,213 | 69,226 | ||||||
| Net Assets | $ | 67,663,608 | $ | 66,336,143 | ||||
| Net Assets consist of: | ||||||||
| Paid-in capital | $ | 55,927,067 | $ | 59,096,612 | ||||
| Accumulated earnings | 11,736,541 | 7,239,531 | ||||||
| Net Assets | $ | 67,663,608 | $ | 66,336,143 | ||||
See accompanying notes which are an integral part of these financial statements.
36
| FullerThaler Funds |
| Statements of Assets and Liabilities (continued) |
| March 31, 2024 - (Unaudited) |
| FullerThaler | FullerThaler | |||||||
| Behavioral | Behavioral Small- | |||||||
| Unconstrained | Mid Core Equity | |||||||
| Equity Fund | Fund | |||||||
| R6 Shares: | ||||||||
| Net Assets | $ | 45,390,078 | ||||||
| Shares outstanding (unlimited number of shares authorized, no par value) | 967,436 | |||||||
| Net asset value, offering and redemption price per share | $ | 46.92 | ||||||
| Institutional Shares: | ||||||||
| Net Assets | $ | 22,121,055 | $ | 65,038,527 | ||||
| Shares outstanding (unlimited number of shares authorized, no par value) | 472,436 | 1,746,216 | ||||||
| Net asset value, offering and redemption price per share | $ | 46.82 | $ | 37.25 | ||||
| A Shares: | ||||||||
| Net Assets | $ | 112,967 | $ | 1,297,616 | ||||
| Shares outstanding (unlimited number of shares authorized, no par value) | 2,423 | 34,985 | ||||||
| Net asset value, offering and redemption price per share | $ | 46.62 | $ | 37.09 | ||||
| Maximum offering price per share(Note 1) | $ | 49.46 | $ | 39.35 | ||||
| C Shares: | ||||||||
| Net Assets | $ | 39,508 | ||||||
| Shares outstanding (unlimited number of shares authorized, no par value) | 857 | |||||||
| Net asset value, offering and redemption price per share | $ | 46.11 | (a) | |||||
| (a) | Per share amounts may not recalculate due to rounding of net assets and/or shares outstanding. |
See accompanying notes which are an integral part of these financial statements.
37
| FullerThaler Funds |
| Statements of Assets and Liabilities (continued) |
| March 31, 2024 - (Unaudited) |
| FullerThaler | FullerThaler | |||||||
| Behavioral Micro- | Behavioral Mid- | |||||||
| Cap Equity Fund | Cap Equity Fund | |||||||
| Assets | ||||||||
| Investments in securities at fair value (cost $16,834,568 and $11,069,853) | $ | 20,312,122 | $ | 13,147,711 | ||||
| Cash and cash equivalents | — | 437,524 | ||||||
| Receivable for fund shares sold | 583,574 | 52,208 | ||||||
| Receivable for investments sold | — | 138,520 | ||||||
| Dividends and interest receivable | 24,976 | 11,510 | ||||||
| Cash collateral for securities loaned | 778,700 | — | ||||||
| Securities lending income receivable | 9,267 | — | ||||||
| Deferred offering costs | — | 8,571 | ||||||
| Receivable from Adviser | — | 5,394 | ||||||
| Prepaid expenses | 7,337 | 6,094 | ||||||
| Total Assets | 21,715,976 | 13,807,532 | ||||||
| Liabilities | ||||||||
| Bank overdraft | 491,747 | — | ||||||
| Payable for investments purchased | — | 551,547 | ||||||
| Payable for fund shares redeemed | — | 3,196 | ||||||
| Payable for collateral upon return of securities loaned | 827,964 | — | ||||||
| Payable to Adviser | 9,997 | — | ||||||
| Accrued administrative service fees | 2,659 | 2,453 | ||||||
| Payable to affiliates | 2,568 | 2,518 | ||||||
| Payable to auditors | 8,473 | 4,133 | ||||||
| Other accrued expenses | 2,361 | 2,493 | ||||||
| Total Liabilities | 1,345,769 | 566,340 | ||||||
| Net Assets | $ | 20,370,207 | $ | 13,241,192 | ||||
| Net Assets consist of: | ||||||||
| Paid-in capital | $ | 21,090,633 | $ | 10,980,419 | ||||
| Accumulated earnings (deficit) | (720,426 | ) | 2,260,773 | |||||
| Net Assets | $ | 20,370,207 | $ | 13,241,192 | ||||
| Institutional Shares: | ||||||||
| Net Assets | $ | 20,370,207 | $ | 13,241,192 | ||||
| Shares outstanding (unlimited number of shares authorized, no par value) | 790,080 | 533,368 | ||||||
| Net asset value, offering and redemption price per share | $ | 25.78 | $ | 24.83 | ||||
See accompanying notes which are an integral part of these financial statements.
38
| FullerThaler Funds |
| Statements of Operations |
| For the six months ended March 31, 2024 - (Unaudited) |
| FullerThaler | FullerThaler | FullerThaler | ||||||||||
| Behavioral Small- | Behavioral Small- | Behavioral Mid- | ||||||||||
| Cap Equity Fund | Cap Growth Fund | Cap Value Fund | ||||||||||
| Investment Income: | ||||||||||||
| Dividend income | $ | 61,083,350 | $ | 571,000 | $ | 4,325,128 | ||||||
| Interest income | 4,090,995 | 623,924 | 403,774 | |||||||||
| Securities lending income | 57,803 | 33,455 | 8,051 | |||||||||
| Total investment income | 65,232,148 | 1,228,379 | 4,736,953 | |||||||||
| Expenses: | ||||||||||||
| Adviser | 23,502,801 | 2,416,256 | 1,450,207 | |||||||||
| Administrative Services - Institutional Shares | 3,394,607 | 308,595 | 147,349 | |||||||||
| Administrative Services - Investor Shares | 383,523 | 18,085 | 7,707 | |||||||||
| Administrative Services - A Shares | 11,086 | 2,050 | 1,174 | |||||||||
| 12b-1 fees - Investor Shares | 544,627 | 25,777 | 10,844 | |||||||||
| 12b-1 fees - A Shares | 16,159 | 3,388 | 2,513 | |||||||||
| 12b-1 fees - C Shares | 69,594 | 33,787 | 2,821 | |||||||||
| Administration | 449,526 | 26,735 | 23,671 | |||||||||
| Report printing | 176,018 | 15,877 | 10,077 | |||||||||
| Fund accounting | 142,688 | 8,480 | 7,518 | |||||||||
| Registration | 121,818 | 47,559 | 47,936 | |||||||||
| ReFlow fees (Note 9) | 116,840 | 39,761 | 89,620 | |||||||||
| Custodian | 97,371 | 9,383 | 8,613 | |||||||||
| Transfer agent | 67,456 | 4,014 | 3,551 | |||||||||
| Legal | 24,337 | 5,940 | 5,946 | |||||||||
| Audit and tax preparation | 9,127 | 9,127 | 9,130 | |||||||||
| Trustee | 8,641 | 8,641 | 8,641 | |||||||||
| Compliance services | 3,069 | 3,069 | 3,069 | |||||||||
| Miscellaneous | 56,563 | 21,557 | 16,879 | |||||||||
| Total expenses | 29,195,851 | 3,008,081 | 1,857,266 | |||||||||
| Fees contractually waived by Adviser | — | (262,388 | ) | (326,895 | ) | |||||||
| Net operating expenses | 29,195,851 | 2,745,693 | 1,530,371 | |||||||||
| Net investment income (loss) | 36,036,297 | (1,517,314 | ) | 3,206,582 | ||||||||
| Net Realized and Change in Unrealized Gain (Loss) on Investments and In-Kind Redemptions | ||||||||||||
| Net realized gain (loss) on investment securities transactions | 319,698,119 | 8,193,169 | (13,144,393 | ) | ||||||||
| Net realized gain from in-kind redemptions (Note 2) | 45,309,758 | 15,231,947 | 20,854,746 | |||||||||
| Net change in unrealized appreciation of investment securities | 1,570,041,602 | 154,961,941 | 67,429,678 | |||||||||
| Net realized and change in unrealized gain on investments and in-kind redemptions | 1,935,049,479 | 178,387,057 | 75,140,031 | |||||||||
| Net increase in net assets resulting from operations | $ | 1,971,085,776 | $ | 176,869,743 | $ | 78,346,613 | ||||||
See accompanying notes which are an integral part of these financial statements.
39
| FullerThaler Funds |
| Statements of Operations (continued) |
| For the period ended March 31, 2024 - (Unaudited) |
| FullerThaler | FullerThaler | |||||||
| Behavioral | Behavioral Small | |||||||
| Unconstrained | Mid Core Equity | |||||||
| Equity Fund | Fund | |||||||
| Investment Income: | ||||||||
| Dividend income (net of foreign taxes withheld of $ and $361) | $ | 303,977 | $ | 504,373 | ||||
| Interest income | 44,557 | 46,878 | ||||||
| Securities lending income | — | 2 | ||||||
| Total investment income | 348,534 | 551,253 | ||||||
| Expenses: | ||||||||
| Adviser | 242,911 | 206,549 | ||||||
| Administrative Services - Institutional Shares | 12,062 | 24,522 | ||||||
| Administrative Services - A Shares | 87 | 833 | ||||||
| 12b-1 fees - A Shares | 87 | 1,111 | ||||||
| 12b-1 fees - C Shares | 164 | — | ||||||
| Registration | 31,522 | 19,539 | ||||||
| ReFlow fees (Note 9) | 10,383 | 18,781 | ||||||
| Trustee | 8,641 | 8,641 | ||||||
| Audit and tax preparation | 8,373 | 8,255 | ||||||
| Legal | 5,936 | 5,936 | ||||||
| Administration | 4,089 | 4,089 | ||||||
| Compliance services | 3,069 | 3,069 | ||||||
| Report printing | 3,014 | 2,427 | ||||||
| Custodian | 2,072 | 1,799 | ||||||
| Fund accounting | 1,298 | 1,298 | ||||||
| Transfer agent | 613 | 613 | ||||||
| Miscellaneous | 11,390 | 11,089 | ||||||
| Total expenses | 345,711 | 318,551 | ||||||
| Fees contractually waived by Adviser | (88,105 | ) | (83,135 | ) | ||||
| Net operating expenses | 257,606 | 235,416 | ||||||
| Net investment income | 90,928 | 315,837 | ||||||
| Net Realized and Change in Unrealized Gain (Loss) on Investments and In-Kind Redemptions | ||||||||
| Net realized loss on investment securities transactions | (827,095 | ) | (1,412,623 | ) | ||||
| Net realized gain from in-kind redemptions (Note 2) | 2,712,316 | 1,362,622 | ||||||
| Net change in unrealized appreciation of investment securities | 14,179,415 | 10,032,877 | ||||||
| Net realized and change in unrealized gain on investments and in-kind redemptions | 16,064,636 | 9,982,876 | ||||||
| Net increase in net assets resulting from operations | $ | 16,155,564 | $ | 10,298,713 | ||||
See accompanying notes which are an integral part of these financial statements.
40
| FullerThaler Funds |
| Statements of Operations (continued) |
| For the period ended March 31, 2024 - (Unaudited) |
| FullerThaler | FullerThaler | |||||||
| Behavioral Micro- | Behavioral Mid- | |||||||
| Cap Equity Fund | Cap Equity Fund(a) | |||||||
| Investment Income: | ||||||||
| Dividend income | $ | 153,503 | $ | 74,857 | ||||
| Interest income | 11,431 | 5,008 | ||||||
| Securities lending income | 31,355 | — | ||||||
| Total investment income | 196,289 | 79,865 | ||||||
| Expenses: | ||||||||
| Adviser | 135,554 | 35,228 | ||||||
| Administrative Services - Institutional Shares | 9,608 | 5,067 | ||||||
| Trustee | 8,641 | 8,532 | ||||||
| Audit and tax preparation | 8,248 | 8,148 | ||||||
| Registration | 6,516 | 313 | ||||||
| Legal | 5,936 | 5,905 | ||||||
| Administration | 4,089 | 4,067 | ||||||
| Compliance services | 3,069 | 3,051 | ||||||
| ReFlow fees (Note 9) | 1,715 | 929 | ||||||
| Report printing | 1,403 | 1,523 | ||||||
| Fund accounting | 1,298 | 1,291 | ||||||
| Custodian | 709 | 324 | ||||||
| Transfer agent | 613 | 610 | ||||||
| Offering | — | 8,269 | ||||||
| Organizational | — | 10,500 | ||||||
| Miscellaneous | 10,548 | 9,282 | ||||||
| Total expenses | 197,947 | 103,039 | ||||||
| Fees contractually waived and expenses reimbursed by Adviser | (70,925 | ) | (63,555 | ) | ||||
| Net operating expenses | 127,022 | 39,484 | ||||||
| Net investment income | 69,267 | 40,381 | ||||||
| Net Realized and Change in Unrealized Gain (Loss) on Investments and In-Kind Redemptions | ||||||||
| Net realized loss on investment securities transactions | (844,910 | ) | (35,035 | ) | ||||
| Net realized gain from in-kind redemptions (Note 2) | 554,436 | 194,955 | ||||||
| Net change in unrealized appreciation of investment securities | 1,658,300 | 2,077,858 | ||||||
| Net realized and change in unrealized gain on investments and in-kind redemptions | 1,367,826 | 2,237,778 | ||||||
| Net increase in net assets resulting from operations | $ | 1,437,093 | $ | 2,278,159 | ||||
| (a) | For the period October 2, 2023 (commencement of operations) to March 31, 2024. |
See accompanying notes which are an integral part of these financial statements.
41
| FullerThaler Funds |
| Statements of Changes in Net Assets |
| FullerThaler Behavioral Small-Cap | ||||||||
| Equity Fund | ||||||||
| For the Six Months | ||||||||
| Ended March 31, | For the Year Ended | |||||||
| 2024 | September 30, 2023 | |||||||
| (Unaudited) | ||||||||
| Increase (Decrease) in Net Assets due to: | ||||||||
| Operations | ||||||||
| Net investment income | $ | 36,036,297 | $ | 62,608,963 | ||||
| Net realized gain on investment securities transactions | 319,698,119 | 44,167,158 | ||||||
| Net realized gain from in-kind redemptions (Note 2) | 45,309,758 | 71,094,546 | ||||||
| Net change in unrealized appreciation of investment securities | 1,570,041,602 | 800,428,286 | ||||||
| Net increase in net assets resulting from operations | 1,971,085,776 | 978,298,953 | ||||||
| Distributions to Shareholders from Earnings: | ||||||||
| R6 Shares | (38,464,492 | ) | (19,327,335 | ) | ||||
| Institutional Shares | (96,726,072 | ) | (46,680,956 | ) | ||||
| Investor Shares | (6,978,694 | ) | (2,755,570 | ) | ||||
| A Shares | (205,854 | ) | (89,102 | ) | ||||
| C Shares | (154,519 | ) | (61,770 | ) | ||||
| Total distributions | (142,529,631 | ) | (68,914,733 | ) | ||||
| Capital Transactions: | ||||||||
| R6 Shares: | ||||||||
| Proceeds from shares sold | 291,622,071 | 625,715,575 | ||||||
| Reinvestment of distributions | 13,969,899 | 5,571,572 | ||||||
| Amount paid for shares redeemed | (282,126,824 | ) | (416,167,048 | ) | ||||
| Total R6 Shares | 23,465,146 | 215,120,099 | ||||||
| Institutional Shares: | ||||||||
| Proceeds from shares sold | 1,114,875,349 | 1,497,763,887 | ||||||
| Reinvestment of distributions | 71,521,191 | 35,308,013 | ||||||
| Amount paid for shares redeemed | (549,355,405 | ) | (934,107,965 | ) | ||||
| Total Institutional Shares | 637,041,135 | 598,963,935 | ||||||
| Investor Shares: | ||||||||
| Proceeds from shares sold | 144,005,664 | 139,048,508 | ||||||
| Reinvestment of distributions | 6,551,461 | 2,521,438 | ||||||
| Amount paid for shares redeemed | (60,611,317 | ) | (102,290,503 | ) | ||||
| Total Investor Shares | 89,945,808 | 39,279,443 | ||||||
| A Shares: | ||||||||
| Proceeds from shares sold | 1,223,407 | 1,809,456 | ||||||
| Reinvestment of distributions | 193,537 | 85,691 | ||||||
| Amount paid for shares redeemed | (572,593 | ) | (1,447,266 | ) | ||||
| Total A Shares | 844,351 | 447,881 | ||||||
| C Shares: | ||||||||
| Proceeds from shares sold | 1,193,275 | 2,312,985 | ||||||
| Reinvestment of distributions | 135,608 | 54,047 | ||||||
| Amount paid for shares redeemed | (2,469,738 | ) | (2,399,653 | ) | ||||
| Total C Shares | (1,140,855 | ) | (32,621 | ) | ||||
| Net increase in net assets resulting from capital transactions | 750,155,585 | 853,778,737 | ||||||
| Total Increase in Net Assets | 2,578,711,730 | 1,763,162,957 | ||||||
See accompanying notes which are an integral part of these financial statements.
42
| FullerThaler Funds |
| Statements of Changes in Net Assets (continued) |
| FullerThaler Behavioral Small-Cap | ||||||||
| Equity Fund | ||||||||
| For the Six Months | ||||||||
| Ended March 31, | For the Year Ended | |||||||
| 2024 | September 30, 2023 | |||||||
| (Unaudited) | ||||||||
| Net Assets | ||||||||
| Beginning of period | 6,820,932,110 | 5,057,769,153 | ||||||
| End of period | $ | 9,399,643,840 | $ | 6,820,932,110 | ||||
| Share Transactions: | ||||||||
| R6 Shares: | ||||||||
| Shares sold | 7,092,357 | 17,407,933 | ||||||
| Shares issued in reinvestment of distributions | 343,843 | 157,767 | ||||||
| Shares redeemed | (6,817,124 | ) | (11,568,665 | ) | ||||
| Total R6 Shares | 619,076 | 5,997,035 | ||||||
| Institutional Shares: | ||||||||
| Shares sold | 26,949,807 | 41,600,182 | ||||||
| Shares issued in reinvestment of distributions | 1,772,109 | 1,010,184 | ||||||
| Shares redeemed | (13,486,773 | ) | (26,036,089 | ) | ||||
| Total Institutional Shares | 15,235,143 | 16,574,277 | ||||||
| Investor Shares: | ||||||||
| Shares sold | 3,603,156 | 3,881,423 | ||||||
| Shares issued in reinvestment of distributions | 164,159 | 72,381 | ||||||
| Shares redeemed | (1,508,808 | ) | (2,855,110 | ) | ||||
| Total Investor Shares | 2,258,507 | 1,098,694 | ||||||
| A Shares: | ||||||||
| Shares sold | 30,082 | 50,467 | ||||||
| Shares issued in reinvestment of distributions | 4,865 | 2,465 | ||||||
| Shares redeemed | (13,916 | ) | (43,986 | ) | ||||
| Total A Shares | 21,031 | 8,946 | ||||||
| C Shares: | ||||||||
| Shares sold | 30,139 | 65,654 | ||||||
| Shares issued in reinvestment of distributions | 3,533 | 1,560 | ||||||
| Shares redeemed | (60,210 | ) | (68,410 | ) | ||||
| Total C Shares | (26,538 | ) | (1,196 | ) | ||||
See accompanying notes which are an integral part of these financial statements.
43
| FullerThaler Funds |
| Statements of Changes in Net Assets (continued) |
| FullerThaler Behavioral Small-Cap | ||||||||
| Growth Fund | ||||||||
| For the Six Months | ||||||||
| Ended March 31, | For the Year Ended | |||||||
| 2024 | September 30, 2023 | |||||||
| (Unaudited) | ||||||||
| Increase (Decrease) in Net Assets due to: | ||||||||
| Operations | ||||||||
| Net investment loss | $ | (1,517,314 | ) | $ | (1,126,127 | ) | ||
| Net realized gain (loss) on investment securities transactions | 8,193,169 | (21,890,990 | ) | |||||
| Net realized gain from in-kind redemptions (Note 2) | 15,231,947 | 7,729,264 | ||||||
| Net change in unrealized appreciation of investment securities | 154,961,941 | 47,767,293 | ||||||
| Net increase in net assets resulting from operations | 176,869,743 | 32,479,440 | ||||||
| Capital Transactions: | ||||||||
| R6 Shares: | ||||||||
| Proceeds from shares sold | 142,805,736 | 80,783,154 | ||||||
| Amount paid for shares redeemed | (101,739,367 | ) | (46,677,069 | ) | ||||
| Total R6 Shares | 41,066,369 | 34,106,085 | ||||||
| Institutional Shares: | ||||||||
| Proceeds from shares sold | 539,335,083 | 172,179,021 | ||||||
| Amount paid for shares redeemed | (41,166,266 | ) | (40,210,522 | ) | ||||
| Total Institutional Shares | 498,168,817 | 131,968,499 | ||||||
| Investor Shares: | ||||||||
| Proceeds from shares sold | 19,198,128 | 10,462,083 | ||||||
| Amount paid for shares redeemed | (3,060,467 | ) | (1,216,003 | ) | ||||
| Total Investor Shares | 16,137,661 | 9,246,080 | ||||||
| A Shares: | ||||||||
| Proceeds from shares sold | 4,835,042 | 1,500,900 | ||||||
| Amount paid for shares redeemed | (1,102,856 | ) | (483,425 | ) | ||||
| Total A Shares | 3,732,186 | 1,017,475 | ||||||
| C Shares: | ||||||||
| Proceeds from shares sold | 6,749,141 | 2,307,377 | ||||||
| Amount paid for shares redeemed | (216,961 | ) | (134,201 | ) | ||||
| Total C Shares | 6,532,180 | 2,173,176 | ||||||
| Net increase in net assets resulting from capital transactions | 565,637,213 | 178,511,315 | ||||||
| Total Increase in Net Assets | 742,506,956 | 210,990,755 | ||||||
See accompanying notes which are an integral part of these financial statements.
44
| FullerThaler Funds |
| Statements of Changes in Net Assets (continued) |
| FullerThaler Behavioral Small-Cap | ||||||||
| Growth Fund | ||||||||
| For the Six Months | ||||||||
| Ended March 31, | For the Year Ended | |||||||
| 2024 | September 30, 2023 | |||||||
| (Unaudited) | ||||||||
| Net Assets | ||||||||
| Beginning of period | 327,142,527 | 116,151,772 | ||||||
| End of period | $ | 1,069,649,483 | $ | 327,142,527 | ||||
| Share Transactions: | ||||||||
| R6 Shares: | ||||||||
| Shares sold | 4,035,390 | 2,556,289 | ||||||
| Shares redeemed | (2,851,671 | ) | (1,483,038 | ) | ||||
| Total R6 Shares | 1,183,719 | 1,073,251 | ||||||
| Institutional Shares: | ||||||||
| Shares sold | 13,314,274 | 5,494,847 | ||||||
| Shares redeemed | (1,085,829 | ) | (1,308,496 | ) | ||||
| Total Institutional Shares | 12,228,445 | 4,186,351 | ||||||
| Investor Shares: | ||||||||
| Shares sold | 494,743 | 327,736 | ||||||
| Shares redeemed | (81,418 | ) | (39,020 | ) | ||||
| Total Investor Shares | 413,325 | 288,716 | ||||||
| A Shares: | ||||||||
| Shares sold | 122,674 | 47,654 | ||||||
| Shares redeemed | (28,379 | ) | (15,497 | ) | ||||
| Total A Shares | 94,295 | 32,157 | ||||||
| C Shares: | ||||||||
| Shares sold | 187,875 | 75,456 | ||||||
| Shares redeemed | (6,316 | ) | (4,709 | ) | ||||
| Total C Shares | 181,559 | 70,747 | ||||||
See accompanying notes which are an integral part of these financial statements.
45
| FullerThaler Funds |
| Statements of Changes in Net Assets (continued) |
| FullerThaler Behavioral Mid-Cap Value | ||||||||
| Fund | ||||||||
| For the Six Months | ||||||||
| Ended March 31, | For the Year Ended | |||||||
| 2024 | September 30, 2023 | |||||||
| (Unaudited) | ||||||||
| Increase (Decrease) in Net Assets due to: | ||||||||
| Operations | ||||||||
| Net investment income | $ | 3,206,582 | $ | 5,727,655 | ||||
| Net realized loss on investment securities transactions | (13,144,393 | ) | (6,675,749 | ) | ||||
| Net realized gain from in-kind redemptions (Note 2) | 20,854,746 | 14,708,557 | ||||||
| Net change in unrealized appreciation (depreciation) of investment securities | 67,429,678 | (1,010,941 | ) | |||||
| Net increase in net assets resulting from operations | 78,346,613 | 12,749,522 | ||||||
| Distributions to Shareholders from Earnings: | ||||||||
| R6 Shares | (3,002,777 | ) | (4,882,882 | ) | ||||
| Institutional Shares | (3,070,489 | ) | (4,069,248 | ) | ||||
| Investor Shares | (116,331 | ) | (139,944 | ) | ||||
| A Shares | (31,492 | ) | (4,018 | ) | ||||
| C Shares | (5,900 | ) | (3,375 | ) | ||||
| Total distributions | (6,226,989 | ) | (9,099,467 | ) | ||||
| Capital Transactions: | ||||||||
| R6 Shares: | ||||||||
| Proceeds from shares sold | 86,045,742 | 86,601,555 | ||||||
| Reinvestment of distributions | 3,002,777 | 4,882,882 | ||||||
| Amount paid for shares redeemed | (156,847,638 | ) | (58,125,918 | ) | ||||
| Total R6 Shares | (67,799,119 | ) | 33,358,519 | |||||
| Institutional Shares: | ||||||||
| Proceeds from shares sold | 92,032,802 | 169,657,350 | ||||||
| Reinvestment of distributions | 2,875,745 | 3,477,679 | ||||||
| Amount paid for shares redeemed | (63,252,299 | ) | (121,796,622 | ) | ||||
| Total Institutional Shares | 31,656,248 | 51,338,407 | ||||||
| Investor Shares: | ||||||||
| Proceeds from shares sold | 1,161,301 | 9,646,784 | ||||||
| Reinvestment of distributions | 115,706 | 138,870 | ||||||
| Amount paid for shares redeemed | (2,237,308 | ) | (7,583,166 | ) | ||||
| Total Investor Shares | (960,301 | ) | 2,202,488 | |||||
| A Shares: | ||||||||
| Proceeds from shares sold | 412,580 | 2,250,553 | ||||||
| Reinvestment of distributions | 31,492 | 4,018 | ||||||
| Amount paid for shares redeemed | (108,131 | ) | (552,332 | ) | ||||
| Total A Shares | 335,941 | 1,702,239 | ||||||
| C Shares: | ||||||||
| Proceeds from shares sold | 522,470 | 288,356 | ||||||
| Reinvestment of distributions | 5,900 | 3,375 | ||||||
| Amount paid for shares redeemed | — | (6,012 | ) | |||||
| Total C Shares | 528,370 | 285,719 | ||||||
| Net increase (decrease) in net assets resulting from capital transactions | (36,238,861 | ) | 88,887,372 | |||||
See accompanying notes which are an integral part of these financial statements.
46
| FullerThaler Funds |
| Statements of Changes in Net Assets (continued) |
| FullerThaler Behavioral Mid-Cap Value | ||||||||
| Fund | ||||||||
| For the Six Months | ||||||||
| Ended March 31, | For the Year Ended | |||||||
| 2024 | September 30, 2023 | |||||||
| (Unaudited) | ||||||||
| Total Increase in Net Assets | 35,880,763 | 92,537,427 | ||||||
| Net Assets | ||||||||
| Beginning of period | 411,132,056 | 318,594,629 | ||||||
| End of period | $ | 447,012,819 | $ | 411,132,056 | ||||
| Share Transactions: | ||||||||
| R6 Shares: | ||||||||
| Shares sold | 2,946,413 | 3,110,382 | ||||||
| Shares issued in reinvestment of distributions | 96,801 | 170,441 | ||||||
| Shares redeemed | (5,416,539 | ) | (2,143,832 | ) | ||||
| Total R6 Shares | (2,373,325 | ) | 1,136,991 | |||||
| Institutional Shares: | ||||||||
| Shares sold | 2,983,636 | 5,863,820 | ||||||
| Shares issued in reinvestment of distributions | 92,766 | 121,608 | ||||||
| Shares redeemed | (2,201,364 | ) | (4,432,979 | ) | ||||
| Total Institutional Shares | 875,038 | 1,552,449 | ||||||
| Investor Shares: | ||||||||
| Shares sold | 38,619 | 338,427 | ||||||
| Shares issued in reinvestment of distributions | 3,743 | 4,867 | ||||||
| Shares redeemed | (72,588 | ) | (268,773 | ) | ||||
| Total Investor Shares | (30,226 | ) | 74,521 | |||||
| A Shares: | ||||||||
| Shares sold | 13,790 | 78,540 | ||||||
| Shares issued in reinvestment of distributions | 1,019 | 141 | ||||||
| Shares redeemed | (3,575 | ) | (19,248 | ) | ||||
| Total A Shares | 11,234 | 59,433 | ||||||
| C Shares: | ||||||||
| Shares sold | 17,194 | 10,000 | ||||||
| Shares issued in reinvestment of distributions | 192 | 119 | ||||||
| Shares redeemed | — | (211 | ) | |||||
| Total C Shares | 17,386 | 9,908 | ||||||
See accompanying notes which are an integral part of these financial statements.
47
| FullerThaler Funds |
| Statements of Changes in Net Assets (continued) |
| FullerThaler Behavioral Unconstrained | ||||||||
| Equity Fund | ||||||||
| For the Six Months | ||||||||
| Ended March 31, | For the Year Ended | |||||||
| 2024 | September 30, 2023 | |||||||
| (Unaudited) | ||||||||
| Increase (Decrease) in Net Assets due to: | ||||||||
| Operations | ||||||||
| Net investment income | $ | 90,928 | $ | 126,192 | ||||
| Net realized loss on investment securities transactions | (827,095 | ) | (3,347,499 | ) | ||||
| Net realized gain from in-kind redemptions (Note 2) | 2,712,316 | 3,994,037 | ||||||
| Net change in unrealized appreciation of investment securities | 14,179,415 | 7,141,176 | ||||||
| Net increase in net assets resulting from operations | 16,155,564 | 7,913,906 | ||||||
| Distributions to Shareholders from Earnings: | ||||||||
| R6 Shares | (124,358 | ) | — | |||||
| Institutional Shares | (32,753 | ) | — | |||||
| Total distributions | (157,111 | ) | — | |||||
| Capital Transactions: | ||||||||
| R6 Shares: | ||||||||
| Proceeds from shares sold | 15,119,476 | 30,700,026 | ||||||
| Reinvestment of distributions | 73,434 | — | ||||||
| Amount paid for shares redeemed | (14,403,730 | ) | (34,872,906 | ) | ||||
| Total R6 Shares | 789,180 | (4,172,880 | ) | |||||
| Institutional Shares: | ||||||||
| Proceeds from shares sold | 5,512,539 | 3,134,933 | ||||||
| Reinvestment of distributions | 32,139 | — | ||||||
| Amount paid for shares redeemed | (1,885,976 | ) | (1,995,946 | ) | ||||
| Total Institutional Shares | 3,658,702 | 1,138,987 | ||||||
| A Shares: | ||||||||
| Proceeds from shares sold | 36,178 | 12,771 | ||||||
| Amount paid for shares redeemed | (112 | ) | (112 | ) | ||||
| Total A Shares | 36,066 | 12,659 | ||||||
| C Shares: | ||||||||
| Proceeds from shares sold | 1,200 | — | ||||||
| Total C Shares | 1,200 | — | ||||||
| Net increase (decrease) in net assets resulting from capital transactions | 4,485,148 | (3,021,234 | ) | |||||
| Total Increase in Net Assets | 20,483,601 | 4,892,672 | ||||||
See accompanying notes which are an integral part of these financial statements.
48
| FullerThaler Funds |
| Statements of Changes in Net Assets (continued) |
| FullerThaler Behavioral Unconstrained | ||||||||
| Equity Fund | ||||||||
| For the Six Months | ||||||||
| Ended March 31, | For the Year Ended | |||||||
| 2024 | September 30, 2023 | |||||||
| (Unaudited) | ||||||||
| Net Assets | ||||||||
| Beginning of period | 47,180,007 | 42,287,335 | ||||||
| End of period | $ | 67,663,608 | $ | 47,180,007 | ||||
| Share Transactions: | ||||||||
| R6 Shares: | ||||||||
| Shares sold | 387,172 | 878,245 | ||||||
| Shares issued in reinvestment of distributions | 1,816 | — | ||||||
| Shares redeemed | (356,069 | ) | (1,023,536 | ) | ||||
| Total R6 Shares | 32,919 | (145,291 | ) | |||||
| Institutional Shares: | ||||||||
| Shares sold | 137,050 | 89,118 | ||||||
| Shares issued in reinvestment of distributions | 797 | — | ||||||
| Shares redeemed | (45,791 | ) | (58,708 | ) | ||||
| Total Institutional Shares | 92,056 | 30,410 | ||||||
| A Shares: | ||||||||
| Shares sold | 818 | 367 | ||||||
| Shares redeemed | (3 | ) | (3 | ) | ||||
| Total A Shares | 815 | 364 | ||||||
| C Shares: | ||||||||
| Shares sold | 27 | — | ||||||
| Total C Shares | 27 | — | ||||||
See accompanying notes which are an integral part of these financial statements.
49
| FullerThaler Funds |
| Statements of Changes in Net Assets (continued) |
| FullerThaler Behavioral Small–Mid Core | ||||||||
| Equity Fund | ||||||||
| For the Six Months | ||||||||
| Ended March 31, | For the Year Ended | |||||||
| 2024 | September 30, 2023 | |||||||
| (Unaudited) | ||||||||
| Increase (Decrease) in Net Assets due to: | ||||||||
| Operations | ||||||||
| Net investment income | $ | 315,837 | $ | 310,227 | ||||
| Net realized loss on investment securities transactions | (1,412,623 | ) | (839,748 | ) | ||||
| Net realized gain from in-kind redemptions (Note 2) | 1,362,622 | 2,595,851 | ||||||
| Net change in unrealized appreciation (depreciation) of investment securities | 10,032,877 | (1,206,049 | ) | |||||
| Net increase in net assets resulting from operations | 10,298,713 | 860,281 | ||||||
| Distributions to Shareholders from Earnings: | ||||||||
| Institutional Shares | (427,648 | ) | (71,804 | ) | ||||
| A Shares | (5,372 | ) | (39 | ) | ||||
| Total distributions | (433,020 | ) | (71,843 | ) | ||||
| Capital Transactions: | ||||||||
| Institutional Shares: | ||||||||
| Proceeds from shares sold | 34,205,423 | 57,951,189 | ||||||
| Reinvestment of distributions | 367,630 | 71,804 | ||||||
| Amount paid for shares redeemed | (20,795,677 | ) | (24,008,554 | ) | ||||
| Total Institutional Shares | 13,777,376 | 34,014,439 | ||||||
| A Shares: | ||||||||
| Proceeds from shares sold | 1,178,562 | 695,071 | ||||||
| Reinvestment of distributions | 5,372 | 39 | ||||||
| Amount paid for shares redeemed | (621,637 | ) | (127,698 | ) | ||||
| Total A Shares | 562,297 | 567,412 | ||||||
| Net increase in net assets resulting from capital transactions | 14,339,673 | 34,581,851 | ||||||
| Total Increase in Net Assets | 24,205,366 | 35,370,289 | ||||||
| Net Assets | ||||||||
| Beginning of period | 42,130,777 | 6,760,488 | ||||||
| End of period | $ | 66,336,143 | $ | 42,130,777 | ||||
| Share Transactions: | ||||||||
| Institutional Shares: | ||||||||
| Shares sold | 1,051,357 | 1,824,200 | ||||||
| Shares issued in reinvestment of distributions | 10,759 | 2,467 | ||||||
| Shares redeemed | (648,924 | ) | (748,278 | ) | ||||
| Total Institutional Shares | 413,192 | 1,078,389 | ||||||
| A Shares: | ||||||||
| Shares sold | 36,869 | 22,225 | ||||||
| Shares issued in reinvestment of distributions | 158 | 1 | ||||||
| Shares redeemed | (20,300 | ) | (4,093 | ) | ||||
| Total A Shares | 16,727 | 18,133 | ||||||
See accompanying notes which are an integral part of these financial statements.
50
| FullerThaler Funds |
| Statements of Changes in Net Assets (continued) |
| FullerThaler Behavioral Micro-Cap | ||||||||
| Equity Fund | ||||||||
| For the Six Months | ||||||||
| Ended March 31, | For the Year Ended | |||||||
| 2024 | September 30, 2023 | |||||||
| (Unaudited) | ||||||||
| Increase (Decrease) in Net Assets due to: | ||||||||
| Operations | ||||||||
| Net investment income | $ | 69,267 | $ | 79,021 | ||||
| Net realized loss on investment securities transactions | (844,910 | ) | (3,694,425 | ) | ||||
| Net realized gain from in-kind redemptions (Note 2) | 554,436 | 384,692 | ||||||
| Net change in unrealized appreciation of investment securities | 1,658,300 | 4,705,383 | ||||||
| Net increase in net assets resulting from operations | 1,437,093 | 1,474,671 | ||||||
| Capital Transactions: | ||||||||
| Institutional Shares: | ||||||||
| Proceeds from shares sold | 4,185,909 | 5,177,276 | ||||||
| Amount paid for shares redeemed | (3,296,614 | ) | (2,282,018 | ) | ||||
| Total Institutional Shares | 889,295 | 2,895,258 | ||||||
| Net increase in net assets resulting from capital transactions | 889,295 | 2,895,258 | ||||||
| Total Increase in Net Assets | 2,326,388 | 4,369,929 | ||||||
| Net Assets | ||||||||
| Beginning of period | 18,043,819 | 13,673,890 | ||||||
| End of period | $ | 20,370,207 | $ | 18,043,819 | ||||
| Share Transactions: | ||||||||
| Institutional Shares: | ||||||||
| Shares sold | 170,790 | 220,258 | ||||||
| Shares redeemed | (135,190 | ) | (96,745 | ) | ||||
| Total Institutional Shares | 35,600 | 123,513 | ||||||
See accompanying notes which are an integral part of these financial statements.
51
| FullerThaler Funds |
| Statements of Changes in Net Assets (continued) |
| FullerThaler | ||||
| Behavioral Mid-Cap | ||||
| Equity Fund | ||||
| For the Period | ||||
| Ended March 31, | ||||
| 2024(a) | ||||
| (Unaudited) | ||||
| Increase (Decrease) in Net Assets due to: | ||||
| Operations | ||||
| Net investment income | $ | 40,381 | ||
| Net realized loss on investment securities transactions | (35,035 | ) | ||
| Net realized gain from in-kind redemptions (Note 2) | 194,955 | |||
| Net change in unrealized appreciation of investment securities | 2,077,858 | |||
| Net increase in net assets resulting from operations | 2,278,159 | |||
| Distributions to Shareholders from Earnings: | ||||
| Institutional Shares | (17,386 | ) | ||
| Total distributions | (17,386 | ) | ||
| Capital Transactions: | ||||
| Institutional Shares: | ||||
| Proceeds from shares sold | 12,339,990 | |||
| Reinvestment of distributions | 16,880 | |||
| Amount paid for shares redeemed | (1,376,451 | ) | ||
| Total Institutional Shares | 10,980,419 | |||
| Net increase in net assets resulting from capital transactions | 10,980,419 | |||
| Total Increase in Net Assets | 13,241,192 | |||
| Net Assets | ||||
| Beginning of period | — | |||
| End of period | $ | 13,241,192 | ||
| Share Transactions: | ||||
| Institutional Shares: | ||||
| Shares sold | 591,428 | |||
| Shares issued in reinvestment of distributions | 760 | |||
| Shares redeemed | (58,820 | ) | ||
| Total Institutional Shares | 533,368 | |||
| (a) | For the period October 2, 2023 (commencement of operations) to March 31, 2024. |
See accompanying notes which are an integral part of these financial statements.
52
| FullerThaler Behavioral Small-Cap Equity Fund - R6 Shares |
| Financial Highlights |
(For a share outstanding during each period)
| For the Six | ||||||||||||||||||||||||
| Months | ||||||||||||||||||||||||
| Ended | ||||||||||||||||||||||||
| March | ||||||||||||||||||||||||
| 31, 2024 | For the Years Ended September 30, | |||||||||||||||||||||||
| (Unaudited) | 2023 | 2022 | 2021 | 2020 | 2019 | |||||||||||||||||||
| Net asset value, beginning of period | $ | 37.18 | $ | 31.61 | $ | 36.83 | $ | 24.76 | $ | 25.39 | $ | 26.76 | ||||||||||||
| Income from investment operations: | ||||||||||||||||||||||||
| Net investment income(a) | 0.21 | 0.40 | 0.33 | 0.49 | 0.11 | 0.17 | ||||||||||||||||||
| Net realized and unrealized gain (loss) on investments | 10.07 | 5.63 | (4.09 | ) | 11.71 | (0.61 | ) (b) | (1.40 | ) | |||||||||||||||
| Total from investment operations | 10.28 | 6.03 | (3.76 | ) | 12.20 | (0.50 | ) | (1.23 | ) | |||||||||||||||
| Less distributions to shareholders from: | ||||||||||||||||||||||||
| Net investment income | (0.45 | ) | (0.29 | ) | (0.18 | ) | (0.13 | ) | (0.13 | ) | (0.14 | ) | ||||||||||||
| Net realized gains | (0.35 | ) | (0.17 | ) | (1.28 | ) | — | — | — | |||||||||||||||
| Total from distributions | (0.80 | ) | (0.46 | ) | (1.46 | ) | (0.13 | ) | (0.13 | ) | (0.14 | ) | ||||||||||||
| Net asset value, end of period | $ | 46.66 | $ | 37.18 | $ | 31.61 | $ | 36.83 | $ | 24.76 | $ | 25.39 | ||||||||||||
| Total Return (c) | 27.95 | % (d) | 19.16 | % | (10.81 | )% | 49.38 | % | (2.02 | )% | (4.54 | )% | ||||||||||||
| Ratios and Supplemental Data: | ||||||||||||||||||||||||
| Net assets, end of period (000 omitted) | $ | 2,280,611 | $ | 1,794,005 | $ | 1,335,836 | $ | 1,395,653 | $ | 610,476 | $ | 184,779 | ||||||||||||
| Before waiver or recoupment: | ||||||||||||||||||||||||
| Ratio of expenses to average net assets | 0.63 | % (e) | 0.64 | % | 0.65 | % | 0.64 | % | 0.69 | % | 0.72 | % | ||||||||||||
| After waiver or recoupment: | ||||||||||||||||||||||||
| Ratio of net expenses to average net assets | 0.63 | % (e) | 0.64 | % | 0.65 | % | 0.64 | % | 0.69 | % | 0.72 | % | ||||||||||||
| Ratio of net investment income to average net assets | 1.03 | % (e) | 1.10 | % | 0.94 | % | 1.42 | % | 0.47 | % | 0.69 | % | ||||||||||||
| Portfolio turnover(f)(g) | 23 | % (d) | 35 | % | 35 | % | 31 | % | 54 | % | 38 | % | ||||||||||||
| (a) | Per share net investment income has been calculated using the average shares method. |
| (b) | The amount shown for a share outstanding throughout the period does not accord with the change in aggregate gains and losses in the portfolio of securities during the period due to the timing of sales and purchases of fund shares in relation to fluctuating market values during the period. |
| (c) | Total return in the above table represents the rate that the investor would have earned or lost on an investment in the Small-Cap Equity Fund, assuming reinvestment of distributions. |
| (d) | Not annualized. |
| (e) | Annualized. |
| (f) | Portfolio turnover is calculated on the basis on the Small-Cap Equity Fund as a whole without distinguishing among the classes of shares. |
| (g) | Portfolio turnover excludes securities delivered as a result of a redemption in-kind. |
See accompanying notes which are an integral part of these financial statements.
53
| FullerThaler Behavioral Small-Cap Equity Fund – Institutional Shares |
| Financial Highlights |
(For a share outstanding during the period)
| For the Six | ||||||||||||||||||||||||
| Months | ||||||||||||||||||||||||
| Ended | ||||||||||||||||||||||||
| March | ||||||||||||||||||||||||
| 31, 2024 | For the Years Ended September 30, | |||||||||||||||||||||||
| (Unaudited) | 2023 | 2022 | 2021 | 2020 | 2019 | |||||||||||||||||||
| Net asset value, beginning of period | $ | 36.83 | $ | 31.32 | $ | 36.51 | $ | 24.55 | $ | 25.18 | $ | 26.55 | ||||||||||||
| Income from investment operations: | ||||||||||||||||||||||||
| Net investment income(a) | 0.19 | 0.36 | 0.29 | 0.44 | 0.09 | 0.15 | ||||||||||||||||||
| Net realized and unrealized gain (loss) on investments | 9.98 | 5.57 | (4.05 | ) | 11.62 | (0.61 | ) (b) | (1.40 | ) | |||||||||||||||
| Total from investment operations | 10.17 | 5.93 | (3.76 | ) | 12.06 | (0.52 | ) | (1.25 | ) | |||||||||||||||
| Less distributions to shareholders from: | ||||||||||||||||||||||||
| Net investment income | (0.41 | ) | (0.25 | ) | (0.15 | ) | (0.10 | ) | (0.11 | ) | (0.12 | ) | ||||||||||||
| Net realized gains | (0.35 | ) | (0.17 | ) | (1.28 | ) | — | — | — | |||||||||||||||
| Total from distributions | (0.76 | ) | (0.42 | ) | (1.43 | ) | (0.10 | ) | (0.11 | ) | (0.12 | ) | ||||||||||||
| Net asset value, end of period | $ | 46.24 | $ | 36.83 | $ | 31.32 | $ | 36.51 | $ | 24.55 | $ | 25.18 | ||||||||||||
| Total Return (c) | 27.90 | % (d) | 19.03 | % | (10.90 | )% | 49.24 | % | (2.11 | )% | (4.65 | )% | ||||||||||||
| Ratios and Supplemental Data: | ||||||||||||||||||||||||
| Net assets, end of period (000 omitted) | $ | 6,548,351 | $ | 4,654,951 | $ | 3,439,879 | $ | 3,599,929 | $ | 2,089,639 | $ | 1,620,327 | ||||||||||||
| Before waiver or recoupment: | ||||||||||||||||||||||||
| Ratio of expenses to average net assets | 0.76 | % (e) | 0.75 | % | 0.74 | % | 0.75 | % | 0.79 | % | 0.82 | % | ||||||||||||
| After waiver or recoupment: | ||||||||||||||||||||||||
| Ratio of net expenses to average net assets | 0.76 | % (e) | 0.75 | % | 0.74 | % | 0.75 | % | 0.79 | % | 0.82 | % | ||||||||||||
| Ratio of net investment income to average net assets | 0.91 | % (e) | 0.98 | % | 0.83 | % | 1.28 | % | 0.36 | % | 0.60 | % | ||||||||||||
| Portfolio turnover(f)(g) | 23 | % (d) | 35 | % | 35 | % | 31 | % | 54 | % | 38 | % | ||||||||||||
| (a) | Per share net investment income has been calculated using the average shares method. |
| (b) | The amount shown for a share outstanding throughout the period does not accord with the change in aggregate gains and losses in the portfolio of securities during the period due to the timing of sales and purchases of fund shares in relation to fluctuating market values during the period. |
| (c) | Total return in the above table represents the rate that the investor would have earned or lost on an investment in the Small-Cap Equity Fund, assuming reinvestment of distributions. |
| (d) | Not annualized. |
| (e) | Annualized. |
| (f) | Portfolio turnover is calculated on the basis on the Small-Cap Equity Fund as a whole without distinguishing among the classes of shares. |
| (g) | Portfolio turnover excludes securities delivered as a result of a redemption in-kind. |
See accompanying notes which are an integral part of these financial statements.
54
| FullerThaler Behavioral Small-Cap Equity Fund – Investor Shares |
| Financial Highlights |
(For a share outstanding during each period)
| For the Six | ||||||||||||||||||||||||
| Months | ||||||||||||||||||||||||
| Ended | ||||||||||||||||||||||||
| March | ||||||||||||||||||||||||
| 31, 2024 | For the Years Ended September 30, | |||||||||||||||||||||||
| (Unaudited) | 2023 | 2022 | 2021 | 2020 | 2019 | |||||||||||||||||||
| Net asset value, beginning of period | $ | 36.53 | $ | 31.08 | $ | 36.25 | $ | 24.39 | $ | 25.02 | $ | 26.36 | ||||||||||||
| Income from investment operations: | ||||||||||||||||||||||||
| Net investment income(a) | 0.12 | 0.25 | 0.19 | 0.34 | 0.02 | 0.09 | ||||||||||||||||||
| Net realized and unrealized gain (loss) on investments | 9.90 | 5.52 | (4.02 | ) | 11.55 | (0.62 | ) (b) | (1.38 | ) | |||||||||||||||
| Total from investment operations | 10.02 | 5.77 | (3.83 | ) | 11.89 | (0.60 | ) | (1.29 | ) | |||||||||||||||
| Less distributions to shareholders from: | ||||||||||||||||||||||||
| Net investment income | (0.31 | ) | (0.15 | ) | (0.06 | ) | (0.03 | ) | (0.03 | ) | (0.05 | ) | ||||||||||||
| Net realized gains | (0.35 | ) | (0.17 | ) | (1.28 | ) | — | — | — | |||||||||||||||
| Total from distributions | (0.66 | ) | (0.32 | ) | (1.34 | ) | (0.03 | ) | (0.03 | ) | (0.05 | ) | ||||||||||||
| Net asset value, end of period | $ | 45.89 | $ | 36.53 | $ | 31.08 | $ | 36.25 | $ | 24.39 | $ | 25.02 | ||||||||||||
| Total Return (c) | 27.71 | % (d) | 18.65 | % | (11.15 | )% | 48.79 | % | (2.40 | )% | (4.89 | )% | ||||||||||||
| Ratios and Supplemental Data: | ||||||||||||||||||||||||
| Net assets, end of period (000 omitted) | $ | 540,614 | $ | 347,885 | $ | 261,786 | $ | 273,271 | $ | 139,789 | $ | 124,550 | ||||||||||||
| Before waiver or recoupment: | ||||||||||||||||||||||||
| Ratio of expenses to average net assets | 1.06 | % (e) | 1.05 | % | 1.03 | % | 1.03 | % | 1.08 | % | 1.10 | % | ||||||||||||
| After waiver or recoupment: | ||||||||||||||||||||||||
| Ratio of net expenses to average net assets | 1.06 | % (e) | 1.05 | % | 1.03 | % | 1.03 | % | 1.08 | % | 1.10 | % | ||||||||||||
| Ratio of net investment income to average net assets | 0.61 | % (e) | 0.69 | % | 0.55 | % | 1.01 | % | 0.07 | % | 0.38 | % | ||||||||||||
| Portfolio turnover(f)(g) | 23 | % (d) | 35 | % | 35 | % | 31 | % | 54 | % | 38 | % | ||||||||||||
| (a) | Per share net investment income has been calculated using the average shares method. |
| (b) | The amount shown for a share outstanding throughout the period does not accord with the change in aggregate gains and losses in the portfolio of securities during the period due to the timing of sales and purchases of fund shares in relation to fluctuating market values during the period. |
| (c) | Total return in the above table represents the rate that the investor would have earned or lost on an investment in the Small-Cap Equity Fund, assuming reinvestment of distributions. |
| (d) | Not annualized. |
| (e) | Annualized. |
| (f) | Portfolio turnover is calculated on the basis on the Small-Cap Equity Fund as a whole without distinguishing among the classes of shares. |
| (g) | Portfolio turnover excludes securities delivered as a result of a redemption in-kind. |
See accompanying notes which are an integral part of these financial statements.
55
| FullerThaler Behavioral Small-Cap Equity Fund – A Shares |
| Financial Highlights |
(For a share outstanding during each period)
| For the Six | ||||||||||||||||||||||||
| Months | For the | |||||||||||||||||||||||
| Ended | Period | |||||||||||||||||||||||
| March | Ended | |||||||||||||||||||||||
| 31, 2024 | For the Years Ended September 30, | September | ||||||||||||||||||||||
| (Unaudited) | 2023 | 2022 | 2021 | 2020 | 30, 2019(a) | |||||||||||||||||||
| Net asset value, beginning of period | $ | 36.45 | $ | 31.00 | $ | 36.18 | $ | 24.38 | $ | 25.04 | $ | 20.99 | ||||||||||||
| Income from investment operations: | ||||||||||||||||||||||||
| Net investment income(b) | 0.12 | 0.25 | 0.21 | 0.40 | 0.01 | 0.07 | ||||||||||||||||||
| Net realized and unrealized gain (loss) on investments | 9.88 | 5.52 | (4.04 | ) | 11.48 | (0.58 | ) (c) | 3.98 | ||||||||||||||||
| Total from investment operations | 10.00 | 5.77 | (3.83 | ) | 11.88 | (0.57 | ) | 4.05 | ||||||||||||||||
| Less distributions to shareholders from: | ||||||||||||||||||||||||
| Net investment income | (0.31 | ) | (0.15 | ) | (0.07 | ) | (0.08 | ) | (0.09 | ) | — | |||||||||||||
| Net realized gains | (0.35 | ) | (0.17 | ) | (1.28 | ) | — | — | — | |||||||||||||||
| Total from distributions | (0.66 | ) | (0.32 | ) | (1.35 | ) | (0.08 | ) | (0.09 | ) | — | |||||||||||||
| Net asset value, end of period | $ | 45.79 | $ | 36.45 | $ | 31.00 | $ | 36.18 | $ | 24.38 | $ | 25.04 | ||||||||||||
| Total Return (excludes sales charge)(d) | 27.69 | % (e) | 18.69 | % | (11.15 | )% | 48.80 | % | (2.31 | )% | 19.29 | % (e) | ||||||||||||
| Ratios and Supplemental Data: | ||||||||||||||||||||||||
| Net assets, end of period (000 omitted) | $ | 15,175 | $ | 11,313 | $ | 9,345 | $ | 7,408 | $ | 941 | $ | 575 | ||||||||||||
| Before waiver or recoupment: | ||||||||||||||||||||||||
| Ratio of expenses to average net assets | 1.05 | % (f) | 1.04 | % | 1.02 | % | 1.02 | % | 1.13 | % | 1.01 | % (f) | ||||||||||||
| After waiver or recoupment: | ||||||||||||||||||||||||
| Ratio of net expenses to average net assets | 1.05 | % (f) | 1.04 | % | 1.02 | % | 1.02 | % | 1.13 | % | 1.01 | % (f) | ||||||||||||
| Ratio of net investment income to average net assets | 0.60 | % (f) | 0.69 | % | 0.60 | % | 1.15 | % | 0.05 | % | 0.37 | % (f) | ||||||||||||
| Portfolio turnover(g)(h) | 23 | % (e) | 35 | % | 35 | % | 31 | % | 54 | % | 38 | % (e) | ||||||||||||
| (a) | For the period December 19, 2018 (commencement of operations) to September 30, 2019. |
| (b) | Per share net investment income has been calculated using the average shares method. |
| (c) | The amount shown for a share outstanding throughout the period does not accord with the change in aggregate gains and losses in the portfolio of securities during the period due to the timing of sales and purchases of fund shares in relation to fluctuating market values during the period. |
| (d) | Total return in the above table represents the rate that the investor would have earned or lost on an investment in the Small-Cap Equity Fund, assuming reinvestment of distributions. |
| (e) | Not annualized. |
| (f) | Annualized. |
| (g) | Portfolio turnover is calculated on the basis on the Small-Cap Equity Fund as a whole without distinguishing among the classes of shares. |
| (h) | Portfolio turnover excludes securities delivered as a result of a redemption in-kind. |
See accompanying notes which are an integral part of these financial statements.
56
| FullerThaler Behavioral Small-Cap Equity Fund – C Shares |
| Financial Highlights |
(For a share outstanding during each period)
| For the Six | ||||||||||||||||||||||||
| Months | For the | |||||||||||||||||||||||
| Ended | Period | |||||||||||||||||||||||
| March | Ended | |||||||||||||||||||||||
| 31, 2024 | For the Years Ended September 30, | September | ||||||||||||||||||||||
| (Unaudited) | 2023 | 2022 | 2021 | 2020 | 30, 2019(a) | |||||||||||||||||||
| Net asset value, beginning of period | $ | 35.79 | $ | 30.49 | $ | 35.75 | $ | 24.16 | $ | 24.92 | $ | 20.99 | ||||||||||||
| Income from investment operations: | ||||||||||||||||||||||||
| Net investment income (loss)(b) | — | (c) | 0.03 | (0.02 | ) | 0.17 | (0.12 | ) | (0.09 | ) | ||||||||||||||
| Net realized and unrealized gain (loss) on investments | 9.71 | 5.44 | (3.96 | ) | 11.42 | (0.61 | ) (d) | 4.02 | ||||||||||||||||
| Total from investment operations | 9.71 | 5.47 | (3.98 | ) | 11.59 | (0.73 | ) | 3.93 | ||||||||||||||||
| Less distributions to shareholders from: | ||||||||||||||||||||||||
| Net investment income | (0.09 | ) | — | — | — | (0.03 | ) | — | ||||||||||||||||
| Net realized gains | (0.35 | ) | (0.17 | ) | (1.28 | ) | — | — | — | |||||||||||||||
| Total from distributions | (0.44 | ) | (0.17 | ) | (1.28 | ) | — | (0.03 | ) | — | ||||||||||||||
| Net asset value, end of period | $ | 45.06 | $ | 35.79 | $ | 30.49 | $ | 35.75 | $ | 24.16 | $ | 24.92 | ||||||||||||
| Total Return (excludes sales charge)(e) | 27.33 | % (f) | 17.97 | % | (11.70 | )% | 47.97 | % | (2.95 | )% | 18.72 | % (f) | ||||||||||||
| Ratios and Supplemental Data: | ||||||||||||||||||||||||
| Net assets, end of period (000 omitted) | $ | 14,892 | $ | 12,779 | $ | 10,923 | $ | 10,096 | $ | 2,987 | $ | 472 | ||||||||||||
| Before waiver or recoupment: | ||||||||||||||||||||||||
| Ratio of expenses to average net assets | 1.63 | % (g) | 1.64 | % | 1.65 | % | 1.64 | % | 1.69 | % | 1.72 | % (g) | ||||||||||||
| After waiver or recoupment: | ||||||||||||||||||||||||
| Ratio of net expenses to average net assets | 1.63 | % (g) | 1.64 | % | 1.65 | % | 1.64 | % | 1.69 | % | 1.72 | % (g) | ||||||||||||
| Ratio of net investment income (loss) to average net assets | 0.02 | % (g) | 0.10 | % | (0.05 | )% | 0.50 | % | (0.52 | )% | 0.46 | % (g) | ||||||||||||
| Portfolio turnover(h)(i) | 23 | % (f) | 35 | % | 35 | % | 31 | % | 54 | % | 38 | % (f) | ||||||||||||
| (a) | For the period December 19, 2018 (commencement of operations) to September 30, 2019. |
| (b) | Per share net investment income has been calculated using the average shares method. |
| (c) | Rounds to less than $0.005 per share. |
| (d) | The amount shown for a share outstanding throughout the period does not accord with the change in aggregate gains and losses in the portfolio of securities during the period due to the timing of sales and purchases of fund shares in relation to fluctuating market values during the period. |
| (e) | Total return in the above table represents the rate that the investor would have earned or lost on an investment in the Small-Cap Equity Fund, assuming reinvestment of distributions. |
| (f) | Not annualized. |
| (g) | Annualized. |
| (h) | Portfolio turnover is calculated on the basis on the Small-Cap Equity Fund as a whole without distinguishing among the classes of shares. |
| (i) | Portfolio turnover excludes securities delivered as a result of a redemption in-kind. |
See accompanying notes which are an integral part of these financial statements.
57
| FullerThaler Behavioral Small-Cap Growth Fund - R6 Shares |
| Financial Highlights |
(For a share outstanding during each period)
| For the Six | ||||||||||||||||||||||||
| Months | ||||||||||||||||||||||||
| Ended | ||||||||||||||||||||||||
| March | ||||||||||||||||||||||||
| 31, 2024 | For the Years Ended September 30, | |||||||||||||||||||||||
| (Unaudited) | 2023 | 2022 | 2021 | 2020 | 2019 | |||||||||||||||||||
| Net asset value, beginning of period | $ | 32.94 | $ | 26.90 | $ | 43.92 | $ | 28.12 | $ | 21.73 | $ | 26.95 | ||||||||||||
| Income from investment operations: | ||||||||||||||||||||||||
| Net investment loss(a) | (0.09 | ) | (0.17 | ) | (0.15 | ) | (0.27 | ) | (0.14 | ) | (0.10 | ) | ||||||||||||
| Net realized and unrealized gain (loss) on investments | 11.84 | 6.21 | (10.34 | ) | 16.07 | 6.53 | (5.12 | ) | ||||||||||||||||
| Total from investment operations | 11.75 | 6.04 | (10.49 | ) | 15.80 | 6.39 | (5.22 | ) | ||||||||||||||||
| Less distributions to shareholders from: | ||||||||||||||||||||||||
| Net realized gains | — | — | (6.53 | ) | — | — | — | |||||||||||||||||
| Total from distributions | — | — | (6.53 | ) | — | — | — | |||||||||||||||||
| Net asset value, end of period | $ | 44.69 | $ | 32.94 | $ | 26.90 | $ | 43.92 | $ | 28.12 | $ | 21.73 | ||||||||||||
| Total Return (b) | 35.67 | % (c) | 22.45 | % | (28.48 | )% | 56.19 | % | 29.41 | % | (19.37 | )% | ||||||||||||
| Ratios and Supplemental Data: | ||||||||||||||||||||||||
| Net assets, end of period (000 omitted) | $ | 128,718 | $ | 55,874 | $ | 16,759 | $ | 5,940 | $ | 13,083 | $ | 2,191 | ||||||||||||
| Before waiver or recoupment: | ||||||||||||||||||||||||
| Ratio of expenses to average net assets | 0.92 | % (d) | 0.98 | % | 1.09 | % | 1.06 | % | 1.63 | % | 2.19 | % | ||||||||||||
| After waiver or recoupment: | ||||||||||||||||||||||||
| Ratio of net expenses to average net assets | 0.86 | % (d) | 0.87 | % | 0.90 | % | 0.90 | % | 0.90 | % | 0.92 | % (e) | ||||||||||||
| Ratio of net investment loss to average net assets | (0.45 | )% (d) | (0.51 | )% | (0.46 | )% | (0.73 | )% | (0.57 | )% | (0.45 | )% | ||||||||||||
| Portfolio turnover(f)(g) | 44 | % (c) | 101 | % | 102 | % | 114 | % | 128 | % | 127 | % | ||||||||||||
| (a) | Per share net investment income has been calculated using the average shares method. |
| (b) | Total return in the above table represents the rate that the investor would have earned or lost on an investment in the Small-Cap Growth Fund, assuming reinvestment of distributions. |
| (c) | Not annualized. |
| (d) | Annualized. |
| (e) | Includes interest expense of 0.02% for the fiscal year ended September 30, 2019. |
| (f) | Portfolio turnover is calculated on the basis on the Small-Cap Growth Fund as a whole without distinguishing among the classes of shares. |
| (g) | Portfolio turnover excludes securities delivered as a result of a redemption in-kind. |
See accompanying notes which are an integral part of these financial statements.
58
| FullerThaler Behavioral Small-Cap Growth Fund - Institutional Shares |
| Financial Highlights |
(For a share outstanding during each period)
| For the Six | ||||||||||||||||||||||||
| Months | ||||||||||||||||||||||||
| Ended | ||||||||||||||||||||||||
| March | ||||||||||||||||||||||||
| 31, 2024 | For the Years Ended September 30, | |||||||||||||||||||||||
| (Unaudited) | 2023 | 2022 | 2021 | 2020 | 2019 | |||||||||||||||||||
| Net asset value, beginning of period | $ | 32.76 | $ | 26.77 | $ | 43.79 | $ | 28.06 | $ | 21.69 | $ | 26.93 | ||||||||||||
| Income from investment operations: | ||||||||||||||||||||||||
| Net investment loss(a) | (0.10 | ) | (0.18 | ) | (0.24 | ) | (0.31 | ) | (0.16 | ) | (0.11 | ) | ||||||||||||
| Net realized and unrealized gain (loss) on investments | 11.77 | 6.17 | (10.25 | ) | 16.04 | 6.53 | (5.13 | ) | ||||||||||||||||
| Total from investment operations | 11.67 | 5.99 | (10.49 | ) | 15.73 | 6.37 | (5.24 | ) | ||||||||||||||||
| Less distributions to shareholders from: | ||||||||||||||||||||||||
| Net realized gains | — | — | (6.53 | ) | — | — | — | |||||||||||||||||
| Total from distributions | — | — | (6.53 | ) | — | — | — | |||||||||||||||||
| Net asset value, end of period | $ | 44.43 | $ | 32.76 | $ | 26.77 | $ | 43.79 | $ | 28.06 | $ | 21.69 | ||||||||||||
| Total Return (b) | 35.62 | % (c) | 22.38 | % | (28.57 | )% | 56.06 | % | 29.37 | % | (19.46 | )% | ||||||||||||
| Ratios and Supplemental Data: | ||||||||||||||||||||||||
| Net assets, end of period (000 omitted) | $ | 887,307 | $ | 253,671 | $ | 95,249 | $ | 104,236 | $ | 44,808 | $ | 13,359 | ||||||||||||
| Before waiver or recoupment: | ||||||||||||||||||||||||
| Ratio of expenses to average net assets | 1.06 | % (d) | 1.12 | % | 1.18 | % | 1.12 | % | 1.71 | % | 2.25 | % | ||||||||||||
| After waiver or recoupment: | ||||||||||||||||||||||||
| Ratio of net expenses to average net assets | 0.96 | % (d) | 0.97 | % | 0.99 | % | 0.99 | % | 0.99 | % | 1.00 | % (e) | ||||||||||||
| Ratio of net investment loss to average net assets | (0.52 | )% (d) | (0.56 | )% | (0.72 | )% | (0.79 | )% | (0.65 | )% | (0.48 | )% | ||||||||||||
| Portfolio turnover(f)(g) | 44 | % (c) | 101 | % | 102 | % | 114 | % | 128 | % | 127 | % | ||||||||||||
| (a) | Per share net investment income has been calculated using the average shares method. |
| (b) | Total return in the above table represents the rate that the investor would have earned or lost on an investment in the Small-Cap Growth Fund, assuming reinvestment of distributions. |
| (c) | Not annualized. |
| (d) | Annualized. |
| (e) | Includes interest expense of 0.01% for the fiscal year ended September 30, 2019. |
| (f) | Portfolio turnover is calculated on the basis on the Small-Cap Growth Fund as a whole without distinguishing among the classes of shares. |
| (g) | Portfolio turnover excludes securities delivered as a result of a redemption in-kind. |
See accompanying notes which are an integral part of these financial statements.
59
| FullerThaler Behavioral Small-Cap Growth Fund - Investor Shares |
| Financial Highlights |
(For a share outstanding during each period)
| For the Six | ||||||||||||||||||||||||
| Months | ||||||||||||||||||||||||
| Ended | ||||||||||||||||||||||||
| March | ||||||||||||||||||||||||
| 31, 2024 | For the Years Ended September 30, | |||||||||||||||||||||||
| (Unaudited) | 2023 | 2022 | 2021 | 2020 | 2019 | |||||||||||||||||||
| Net asset value, beginning of period | $ | 32.21 | $ | 26.40 | $ | 43.36 | $ | 27.86 | $ | 21.60 | $ | 26.88 | ||||||||||||
| Income from investment operations: | ||||||||||||||||||||||||
| Net investment loss(a) | (0.15 | ) | (0.26 | ) | (0.33 | ) | (0.41 | ) | (0.22 | ) | (0.19 | ) | ||||||||||||
| Net realized and unrealized gain (loss) on investments | 11.56 | 6.07 | (10.10 | ) | 15.91 | 6.48 | (5.09 | ) | ||||||||||||||||
| Total from investment operations | 11.41 | 5.81 | (10.43 | ) | 15.50 | 6.26 | (5.28 | ) | ||||||||||||||||
| Less distributions to shareholders from: | ||||||||||||||||||||||||
| Net realized gains | — | — | (6.53 | ) | — | — | — | |||||||||||||||||
| Total from distributions | — | — | (6.53 | ) | — | — | — | |||||||||||||||||
| Net asset value, end of period | $ | 43.62 | $ | 32.21 | $ | 26.40 | $ | 43.36 | $ | 27.86 | $ | 21.60 | ||||||||||||
| Total Return (b) | 35.42 | % (c) | 22.01 | % | (28.74 | )% | 55.64 | % | 28.98 | % | (19.64 | )% | ||||||||||||
| Ratios and Supplemental Data: | ||||||||||||||||||||||||
| Net assets, end of period (000 omitted) | $ | 35,736 | $ | 13,075 | $ | 3,095 | $ | 3,245 | $ | 781 | $ | 153 | ||||||||||||
| Before waiver or recoupment: | ||||||||||||||||||||||||
| Ratio of expenses to average net assets | 1.35 | % (d) | 1.42 | % | 1.48 | % | 1.44 | % | 1.98 | % | 2.57 | % | ||||||||||||
| After waiver or recoupment: | ||||||||||||||||||||||||
| Ratio of net expenses to average net assets | 1.25 | % (d) | 1.25 | % | 1.25 | % | 1.25 | % | 1.25 | % | 1.27 | % (e) | ||||||||||||
| Ratio of net investment loss to average net assets | (0.82 | )% (d) | (0.84 | )% | (0.99 | )% | (1.04 | )% | (0.87 | )% | (0.85 | )% | ||||||||||||
| Portfolio turnover(f)(g) | 44 | % (c) | 101 | % | 102 | % | 114 | % | 128 | % | 127 | % | ||||||||||||
| (a) | Per share net investment income has been calculated using the average shares method. |
| (b) | Total return in the above table represents the rate that the investor would have earned or lost on an investment in the Small-Cap Growth Fund, assuming reinvestment of distributions. |
| (c) | Not annualized. |
| (d) | Annualized. |
| (e) | Includes interest expense of 0.02% for the fiscal year ended September 30, 2019. |
| (f) | Portfolio turnover is calculated on the basis on the Small-Cap Growth Fund as a whole without distinguishing among the classes of shares. |
| (g) | Portfolio turnover excludes securities delivered as a result of a redemption in-kind. |
See accompanying notes which are an integral part of these financial statements.
60
| FullerThaler Behavioral Small-Cap Growth Fund - A Shares |
| Financial Highlights |
(For a share outstanding during each period)
| For the Six | ||||||||||||||||||||||||
| Months | For the | |||||||||||||||||||||||
| Ended | Period | |||||||||||||||||||||||
| March | Ended | |||||||||||||||||||||||
| 31, 2024 | For the Years Ended September 30, | September | ||||||||||||||||||||||
| (Unaudited) | 2023 | 2022 | 2021 | 2020 | 30, 2019(a) | |||||||||||||||||||
| Net asset value, beginning of period | $ | 32.12 | $ | 26.34 | $ | 43.30 | $ | 27.83 | $ | 21.59 | $ | 19.59 | ||||||||||||
| Income from investment operations: | ||||||||||||||||||||||||
| Net investment loss(b) | (0.16 | ) | (0.28 | ) | (0.34 | ) | (0.43 | ) | (0.24 | ) | (0.13 | ) | ||||||||||||
| Net realized and unrealized gain (loss) on investments | 11.53 | 6.06 | (10.09 | ) | 15.90 | 6.48 | 2.13 | |||||||||||||||||
| Total from investment operations | 11.37 | 5.78 | (10.43 | ) | 15.47 | 6.24 | 2.00 | |||||||||||||||||
| Less distributions to shareholders from: | ||||||||||||||||||||||||
| Net realized gains | — | — | (6.53 | ) | — | — | — | |||||||||||||||||
| Total from distributions | — | — | (6.53 | ) | — | — | — | |||||||||||||||||
| Net asset value, end of period | $ | 43.49 | $ | 32.12 | $ | 26.34 | $ | 43.30 | $ | 27.83 | $ | 21.59 | ||||||||||||
| Total Return (excludes sales charge)(c) | 35.40 | % (d) | 21.94 | % | (28.78 | )% | 55.59 | % | 28.90 | % | 10.21 | % (d) | ||||||||||||
| Ratios and Supplemental Data: | ||||||||||||||||||||||||
| Net assets, end of period (000 omitted) | $ | 6,062 | $ | 1,448 | $ | 340 | $ | 365 | $ | 60 | $ | 4 | ||||||||||||
| Before waiver or recoupment: | ||||||||||||||||||||||||
| Ratio of expenses to average net assets | 1.32 | % (e) | 1.39 | % | 1.41 | % | 1.35 | % | 1.91 | % | 2.15 | % (e) | ||||||||||||
| After waiver or recoupment: | ||||||||||||||||||||||||
| Ratio of net expenses to average net assets | 1.30 | % (e) | 1.30 | % | 1.30 | % | 1.30 | % | 1.30 | % | 1.30 | % (e) | ||||||||||||
| Ratio of net investment loss to average net assets | (0.86 | )% (e) | (0.88 | )% | (1.04 | )% | (1.08 | )% | (0.95 | )% | (0.75 | )% (e) | ||||||||||||
| Portfolio turnover(f)(g) | 44 | % (d) | 101 | % | 102 | % | 114 | % | 128 | % | 127 | % (d) | ||||||||||||
| (a) | For the period December 19, 2018 (commencement of operations) to September 30, 2019. |
| (b) | Per share net investment income has been calculated using the average shares method. |
| (c) | Total return in the above table represents the rate that the investor would have earned or lost on an investment in the Small-Cap Growth Fund, assuming reinvestment of distributions. |
| (d) | Not annualized. |
| (e) | Annualized. |
| (f) | Portfolio turnover is calculated on the basis on the Small-Cap Growth Fund as a whole without distinguishing among the classes of shares. |
| (g) | Portfolio turnover excludes securities delivered as a result of a redemption in-kind. |
See accompanying notes which are an integral part of these financial statements.
61
| FullerThaler Behavioral Small-Cap Growth Fund - C Shares |
| Financial Highlights |
(For a share outstanding during each period)
| For the Six | ||||||||||||||||||||||||
| Months | For the | |||||||||||||||||||||||
| Ended | Period | |||||||||||||||||||||||
| March | Ended | |||||||||||||||||||||||
| 31, 2024 | For the Years Ended September 30, | September | ||||||||||||||||||||||
| (Unaudited) | 2023 | 2022 | 2021 | 2020 | 30, 2019(a) | |||||||||||||||||||
| Net asset value, beginning of period | $ | 31.30 | $ | 25.80 | $ | 42.72 | $ | 27.60 | $ | 21.51 | $ | 19.59 | ||||||||||||
| Income from investment operations: | ||||||||||||||||||||||||
| Net investment loss(b) | (0.25 | ) | (0.42 | ) | (0.49 | ) | (0.64 | ) | (0.36 | ) | (0.22 | ) | ||||||||||||
| Net realized and unrealized gain (loss) on investments | 11.22 | 5.92 | (9.90 | ) | 15.76 | 6.45 | 2.14 | |||||||||||||||||
| Total from investment operations | 10.97 | 5.50 | (10.39 | ) | 15.12 | 6.09 | 1.92 | |||||||||||||||||
| Less distributions to shareholders from: | ||||||||||||||||||||||||
| Net realized gains | — | — | (6.53 | ) | — | — | — | |||||||||||||||||
| Total from distributions | — | — | (6.53 | ) | — | — | — | |||||||||||||||||
| Net asset value, end of period | $ | 42.27 | $ | 31.30 | $ | 25.80 | $ | 42.72 | $ | 27.60 | $ | 21.51 | ||||||||||||
| Total Return (excludes sales charge)(c) | 35.05 | % (d) | 21.32 | % | (29.12 | )% | 54.78 | % | 28.31 | % | 9.80 | % (d) | ||||||||||||
| Ratios and Supplemental Data: | ||||||||||||||||||||||||
| Net assets, end of period (000 omitted) | $ | 11,827 | $ | 3,074 | $ | 709 | $ | 726 | $ | 28 | $ | 2 | ||||||||||||
| Before waiver or recoupment: | ||||||||||||||||||||||||
| Ratio of expenses to average net assets | 1.92 | % (e) | 2.00 | % | 2.09 | % | 2.03 | % | 2.62 | % | 2.87 | % (e) | ||||||||||||
| After waiver or recoupment: | ||||||||||||||||||||||||
| Ratio of net expenses to average net assets | 1.80 | % (e) | 1.80 | % | 1.80 | % | 1.80 | % | 1.80 | % | 1.80 | % (e) | ||||||||||||
| Ratio of net investment loss to average net assets | (1.37 | )% (e) | (1.38 | )% | (1.52 | )% | (1.59 | )% | (1.45 | )% | (1.27 | )% (e) | ||||||||||||
| Portfolio turnover(f)(g) | 44 | % (d) | 101 | % | 102 | % | 114 | % | 128 | % | 127 | % (d) | ||||||||||||
| (a) | For the period December 19, 2018 (commencement of operations) to September 30, 2019. |
| (b) | Per share net investment income has been calculated using the average shares method. |
| (c) | Total return in the above table represents the rate that the investor would have earned or lost on an investment in the Small-Cap Growth Fund, assuming reinvestment of distributions. |
| (d) | Not annualized. |
| (e) | Annualized. |
| (f) | Portfolio turnover is calculated on the basis on the Small-Cap Growth Fund as a whole without distinguishing among the classes of shares. |
| (g) | Portfolio turnover excludes securities delivered as a result of a redemption in-kind. |
See accompanying notes which are an integral part of these financial statements.
62
| FullerThaler Behavioral Mid-Cap Value Fund - R6 Shares |
| Financial Highlights |
(For a share outstanding during each period)
| For the Six | ||||||||||||||||||||||||
| Months | ||||||||||||||||||||||||
| Ended | ||||||||||||||||||||||||
| March | ||||||||||||||||||||||||
| 31, 2024 | For the Years Ended September 30, | |||||||||||||||||||||||
| (Unaudited) | 2023 | 2022 | 2021 | 2020 | 2019 | |||||||||||||||||||
| Net asset value, beginning of period | $ | 27.71 | $ | 26.53 | $ | 28.97 | $ | 19.00 | $ | 21.49 | $ | 20.56 | ||||||||||||
| Income from investment operations: | ||||||||||||||||||||||||
| Net investment income(a) | 0.26 | 0.41 | 0.28 | 0.24 | 0.27 | 0.20 | ||||||||||||||||||
| Net realized and unrealized gain (loss) on investments | 6.10 | 1.45 | (2.21 | ) | 9.85 | (2.47 | ) | 0.85 | ||||||||||||||||
| Total from investment operations | 6.36 | 1.86 | (1.93 | ) | 10.09 | (2.20 | ) | 1.05 | ||||||||||||||||
| Less distributions to shareholders from: | ||||||||||||||||||||||||
| Net investment income | (0.57 | ) | (0.23 | ) | (0.18 | ) | (0.12 | ) | (0.15 | ) | (0.11 | ) | ||||||||||||
| Net realized gains | — | (0.45 | ) | (0.33 | ) | — | (0.14 | ) | (0.01 | ) | ||||||||||||||
| Total from distributions | (0.57 | ) | (0.68 | ) | (0.51 | ) | (0.12 | ) | (0.29 | ) | (0.12 | ) | ||||||||||||
| Net asset value, end of period | $ | 33.50 | $ | 27.71 | $ | 26.53 | $ | 28.97 | $ | 19.00 | $ | 21.49 | ||||||||||||
| Total Return (b) | 23.11 | % (c) | 6.94 | % | (6.90 | )% | 53.28 | % | (10.42 | )% | 5.23 | % | ||||||||||||
| Ratios and Supplemental Data: | ||||||||||||||||||||||||
| Net assets, end of period (000 omitted) | $ | 182,631 | $ | 216,829 | $ | 177,423 | $ | 158,664 | $ | 24,324 | $ | 2,403 | ||||||||||||
| Before waiver or recoupment: | ||||||||||||||||||||||||
| Ratio of expenses to average net assets | 0.88 | % (d) | 0.83 | % | 0.83 | % | 0.90 | % | 1.39 | % | 1.72 | % | ||||||||||||
| After waiver or recoupment: | ||||||||||||||||||||||||
| Ratio of net expenses to average net assets | 0.73 | % (d) | 0.77 | % | 0.80 | % | 0.80 | % | 0.80 | % | 0.80 | % | ||||||||||||
| Ratio of net investment income to average net assets | 1.73 | % (d) | 1.43 | % | 0.92 | % | 0.88 | % | 1.36 | % | 0.98 | % | ||||||||||||
| Portfolio turnover(e)(f) | 21 | % (c) | 15 | % | 12 | % | 14 | % | 30 | % | 12 | % | ||||||||||||
| (a) | Per share net investment income has been calculated using the average shares method. |
| (b) | Total return in the above table represents the rate that the investor would have earned or lost on an investment in the Mid-Cap Value Fund, assuming reinvestment of distributions. |
| (c) | Not annualized. |
| (d) | Annualized. |
| (e) | Portfolio turnover is calculated on the basis on the Mid-Cap Value Fund as a whole without distinguishing among the classes of shares. |
| (f) | Portfolio turnover excludes securities delivered as a result of a redemption in-kind. |
See accompanying notes which are an integral part of these financial statements.
63
| FullerThaler Behavioral Mid-Cap Value Fund - Institutional Shares |
| Financial Highlights |
(For a share outstanding during each period)
| For the Six | ||||||||||||||||||||||||
| Months | ||||||||||||||||||||||||
| Ended | ||||||||||||||||||||||||
| March | ||||||||||||||||||||||||
| 31, 2024 | For the Years Ended September 30, | |||||||||||||||||||||||
| (Unaudited) | 2023 | 2022 | 2021 | 2020 | 2019 | |||||||||||||||||||
| Net asset value, beginning of period | $ | 27.66 | $ | 26.49 | $ | 28.94 | $ | 18.98 | $ | 21.47 | $ | 20.56 | ||||||||||||
| Income from investment operations: | ||||||||||||||||||||||||
| Net investment income(a) | 0.24 | 0.39 | 0.28 | 0.20 | 0.21 | 0.18 | ||||||||||||||||||
| Net realized and unrealized gain (loss) on investments | 6.09 | 1.44 | (2.24 | ) | 9.86 | (2.43 | ) | 0.85 | ||||||||||||||||
| Total from investment operations | 6.33 | 1.83 | (1.96 | ) | 10.06 | (2.22 | ) | 1.03 | ||||||||||||||||
| Less distributions to shareholders from: | ||||||||||||||||||||||||
| Net investment income | (0.52 | ) | (0.21 | ) | (0.16 | ) | (0.10 | ) | (0.13 | ) | (0.11 | ) | ||||||||||||
| Net realized gains | — | (0.45 | ) | (0.33 | ) | — | (0.14 | ) | (0.01 | ) | ||||||||||||||
| Total from distributions | (0.52 | ) | (0.66 | ) | (0.49 | ) | (0.10 | ) | (0.27 | ) | (0.12 | ) | ||||||||||||
| Net asset value, end of period | $ | 33.47 | $ | 27.66 | $ | 26.49 | $ | 28.94 | $ | 18.98 | $ | 21.47 | ||||||||||||
| Total Return (b) | 23.05 | % (c) | 6.84 | % | (7.00 | )% | 53.13 | % | (10.51 | )% | 5.09 | % | ||||||||||||
| Ratios and Supplemental Data: | ||||||||||||||||||||||||
| Net assets, end of period (000 omitted) | $ | 252,139 | $ | 184,154 | $ | 135,239 | $ | 25,889 | $ | 9,826 | $ | 12,511 | ||||||||||||
| Before waiver or recoupment: | ||||||||||||||||||||||||
| Ratio of expenses to average net assets | 1.02 | % (d) | 0.97 | % | 0.95 | % | 1.02 | % | 1.49 | % | 1.81 | % | ||||||||||||
| After waiver or recoupment: | ||||||||||||||||||||||||
| Ratio of net expenses to average net assets | 0.83 | % (d) | 0.86 | % | 0.90 | % | 0.90 | % | 0.90 | % | 0.90 | % | ||||||||||||
| Ratio of net investment income to average net assets | 1.61 | % (d) | 1.36 | % | 0.94 | % | 0.76 | % | 1.05 | % | 0.90 | % | ||||||||||||
| Portfolio turnover(e)(f) | 21 | % (c) | 15 | % | 12 | % | 14 | % | 30 | % | 12 | % | ||||||||||||
| (a) | Per share net investment income has been calculated using the average shares method. |
| (b) | Total return in the above table represents the rate that the investor would have earned or lost on an investment in the Mid-Cap Value Fund, assuming reinvestment of distributions. |
| (c) | Not annualized. |
| (d) | Annualized. |
| (e) | Portfolio turnover is calculated on the basis on the Mid-Cap Value Fund as a whole without distinguishing among the classes of shares. |
| (f) | Portfolio turnover excludes securities delivered as a result of a redemption in-kind. |
See accompanying notes which are an integral part of these financial statements.
64
| FullerThaler Behavioral Mid-Cap Value Fund - Investor Shares |
| Financial Highlights |
(For a share outstanding during each period)
| For the Six | ||||||||||||||||||||||||
| Months | ||||||||||||||||||||||||
| Ended | ||||||||||||||||||||||||
| March | ||||||||||||||||||||||||
| 31, 2024 | For the Years Ended September 30, | |||||||||||||||||||||||
| (Unaudited) | 2023 | 2022 | 2021 | 2020 | 2019 | |||||||||||||||||||
| Net asset value, beginning of period | $ | 27.50 | $ | 26.36 | $ | 28.82 | $ | 18.90 | $ | 21.39 | $ | 20.50 | ||||||||||||
| Income from investment operations: | ||||||||||||||||||||||||
| Net investment income(a) | 0.19 | 0.31 | 0.19 | 0.13 | 0.15 | 0.14 | ||||||||||||||||||
| Net realized and unrealized gain (loss) on investments | 6.07 | 1.43 | (2.22 | ) | 9.82 | (2.41 | ) | 0.84 | ||||||||||||||||
| Total from investment operations | 6.26 | 1.74 | (2.03 | ) | 9.95 | (2.26 | ) | 0.98 | ||||||||||||||||
| Less distributions to shareholders from: | ||||||||||||||||||||||||
| Net investment income | (0.41 | ) | (0.15 | ) | (0.10 | ) | (0.03 | ) | (0.09 | ) | (0.08 | ) | ||||||||||||
| Net realized gains | — | (0.45 | ) | (0.33 | ) | — | (0.14 | ) | (0.01 | ) | ||||||||||||||
| Total from distributions | (0.41 | ) | (0.60 | ) | (0.43 | ) | (0.03 | ) | (0.23 | ) | (0.09 | ) | ||||||||||||
| Net asset value, end of period | $ | 33.35 | $ | 27.50 | $ | 26.36 | $ | 28.82 | $ | 18.90 | $ | 21.39 | ||||||||||||
| Total Return (b) | 22.87 | % (c) | 6.53 | % | (7.23 | )% | 52.70 | % | (10.72 | )% | 4.84 | % | ||||||||||||
| Ratios and Supplemental Data: | ||||||||||||||||||||||||
| Net assets, end of period (000 omitted) | $ | 8,826 | $ | 8,110 | $ | 5,809 | $ | 2,509 | $ | 1,043 | $ | 1,676 | ||||||||||||
| Before waiver or recoupment: | ||||||||||||||||||||||||
| Ratio of expenses to average net assets | 1.30 | % (d) | 1.25 | % | 1.23 | % | 1.31 | % | 1.76 | % | 2.10 | % | ||||||||||||
| After waiver or recoupment: | ||||||||||||||||||||||||
| Ratio of net expenses to average net assets | 1.15 | % (d) | 1.15 | % | 1.15 | % | 1.15 | % | 1.15 | % | 1.15 | % | ||||||||||||
| Ratio of net investment income to average net assets | 1.31 | % (d) | 1.08 | % | 0.63 | % | 0.50 | % | 0.78 | % | 0.70 | % | ||||||||||||
| Portfolio turnover(e)(f) | 21 | % (c) | 15 | % | 12 | % | 14 | % | 30 | % | 12 | % | ||||||||||||
| (a) | Per share net investment income has been calculated using the average shares method. |
| (b) | Total return in the above table represents the rate that the investor would have earned or lost on an investment in the Mid-Cap Value Fund, assuming reinvestment of distributions. |
| (c) | Not annualized. |
| (d) | Annualized. |
| (e) | Portfolio turnover is calculated on the basis on the Mid-Cap Value Fund as a whole without distinguishing among the classes of shares. |
| (f) | Portfolio turnover excludes securities delivered as a result of a redemption in-kind. |
See accompanying notes which are an integral part of these financial statements.
65
| FullerThaler Behavioral Mid-Cap Value Fund - A Shares |
| Financial Highlights |
(For a share outstanding during each period)
| For the Six | ||||||||||||
| Months | For the | |||||||||||
| Ended | For the | Period | ||||||||||
| March | Year Ended | Ended | ||||||||||
| 31, 2024 | September | September | ||||||||||
| (Unaudited) | 30, 2023 | 30, 2022(a) | ||||||||||
| Net asset value, beginning of period | $ | 27.56 | $ | 26.48 | $ | 29.98 | ||||||
| Income from investment operations: | ||||||||||||
| Net investment income(b) | 0.19 | 0.32 | 0.14 | |||||||||
| Net realized and unrealized gain (loss) on investments | 6.07 | 1.42 | (3.64 | ) | ||||||||
| Total from investment operations | 6.26 | 1.74 | (3.50 | ) | ||||||||
| Less distributions to shareholders from: | ||||||||||||
| Net investment income | (0.48 | ) | (0.21 | ) | — | |||||||
| Net realized gains | — | (0.45 | ) | — | ||||||||
| Total from distributions | (0.48 | ) | (0.66 | ) | — | |||||||
| Net asset value, end of period | $ | 33.34 | $ | 27.56 | $ | 26.48 | ||||||
| Total Return (excludes sales charge)(c) | 22.84 | % (d) | 6.49 | % | (11.67 | )% (d) | ||||||
| Ratios and Supplemental Data: | ||||||||||||
| Net assets, end of period (000 omitted) | $ | 2,451 | $ | 1,717 | $ | 76 | ||||||
| Before waiver or recoupment: | ||||||||||||
| Ratio of expenses to average net assets | 1.24 | % (e) | 1.20 | % | 1.14 | % (e) | ||||||
| After waiver or recoupment: | ||||||||||||
| Ratio of net expenses to average net assets | 1.20 | % (e) | 1.20 | % | 1.14 | % (e) | ||||||
| Ratio of net investment income to average net assets | 1.27 | % (e) | 1.11 | % | 0.83 | % (e) | ||||||
| Portfolio turnover(f)(g) | 21 | % (d) | 15 | % | 12 | % (d) | ||||||
| (a) | For the period March 10, 2022 (commencement of operations) to September 30, 2022. |
| (b) | Per share net investment income has been calculated using the average shares method. |
| (c) | Total return in the above table represents the rate that the investor would have earned or lost on an investment in the Mid-Cap Value Fund, assuming reinvestment of distributions. |
| (d) | Not annualized. |
| (e) | Annualized. |
| (f) | Portfolio turnover is calculated on the basis on the Mid-Cap Value Fund as a whole without distinguishing among the classes of shares. |
| (g) | Portfolio turnover excludes securities delivered as a result of a redemption in-kind. |
See accompanying notes which are an integral part of these financial statements.
66
| FullerThaler Behavioral Mid-Cap Value Fund - C Shares |
| Financial Highlights |
(For a share outstanding during each period)
| For the Six | ||||||||||||
| Months | For the | |||||||||||
| Ended | For the | Period | ||||||||||
| March | Year Ended | Ended | ||||||||||
| 31, 2024 | September | September | ||||||||||
| (Unaudited) | 30, 2023 | 30, 2022(a) | ||||||||||
| Net asset value, beginning of period | $ | 27.38 | $ | 26.40 | $ | 29.98 | ||||||
| Income from investment operations: | ||||||||||||
| Net investment income(b) | 0.12 | 0.17 | 0.02 | |||||||||
| Net realized and unrealized gain (loss) on investments | 6.01 | 1.42 | (3.60 | ) | ||||||||
| Total from investment operations | 6.13 | 1.59 | (3.58 | ) | ||||||||
| Less distributions to shareholders from: | ||||||||||||
| Net investment income | (0.36 | ) | (0.16 | ) | — | |||||||
| Net realized gains | — | (0.45 | ) | — | ||||||||
| Total from distributions | (0.36 | ) | (0.61 | ) | — | |||||||
| Net asset value, end of period | $ | 33.15 | $ | 27.38 | $ | 26.40 | ||||||
| Total Return (excludes sales charge)(c) | 22.51 | % (d) | 5.94 | % | (11.94 | )% (d) | ||||||
| Ratios and Supplemental Data: | ||||||||||||
| Net assets, end of period (000 omitted) | $ | 965 | $ | 321 | $ | 48 | ||||||
| Before waiver or recoupment: | ||||||||||||
| Ratio of expenses to average net assets | 1.86 | % (e) | 1.83 | % | 1.84 | % (e) | ||||||
| After waiver or recoupment: | ||||||||||||
| Ratio of net expenses to average net assets | 1.70 | % (e) | 1.70 | % | 1.70 | % (e) | ||||||
| Ratio of net investment income to average net assets | 0.77 | % (e) | 0.60 | % | 0.14 | % (e) | ||||||
| Portfolio turnover(f)(g) | 21 | % (d) | 15 | % | 12 | % (d) | ||||||
| (a) | For the period March 10, 2022 (commencement of operations) to September 30, 2022. |
| (b) | Per share net investment income has been calculated using the average shares method. |
| (c) | Total return in the above table represents the rate that the investor would have earned or lost on an investment in the Mid-Cap Value Fund, assuming reinvestment of distributions. |
| (d) | Not annualized. |
| (e) | Annualized. |
| (f) | Portfolio turnover is calculated on the basis on the Mid-Cap Value Fund as a whole without distinguishing among the classes of shares. |
| (g) | Portfolio turnover excludes securities delivered as a result of a redemption in-kind. |
See accompanying notes which are an integral part of these financial statements.
67
| FullerThaler Behavioral Unconstrained Equity Fund - R6 Shares |
| Financial Highlights |
(For a share outstanding during each period)
| For the Six | ||||||||||||||||||||||||
| Months | For the | |||||||||||||||||||||||
| Ended | Period | |||||||||||||||||||||||
| March | Ended | |||||||||||||||||||||||
| 31, 2024 | For the Years Ended September 30, | September | ||||||||||||||||||||||
| (Unaudited) | 2023 | 2022 | 2021 | 2020 | 30, 2019(a) | |||||||||||||||||||
| Net asset value, beginning of period | $ | 35.85 | $ | 29.55 | $ | 38.06 | $ | 27.47 | $ | 25.83 | $ | 20.00 | ||||||||||||
| Income from investment operations: | ||||||||||||||||||||||||
| Net investment income (loss)(b) | 0.07 | 0.11 | 0.01 | (0.03 | ) | 0.04 | 0.07 | |||||||||||||||||
| Net realized and unrealized gain (loss) on investments | 11.12 | 6.19 | (8.52 | ) | 10.73 | 1.82 | 5.76 | |||||||||||||||||
| Total from investment operations | 11.19 | 6.30 | (8.51 | ) | 10.70 | 1.86 | 5.83 | |||||||||||||||||
| Less distributions to shareholders from: | ||||||||||||||||||||||||
| Net investment income | (0.12 | ) | — | — | (0.03 | ) | (0.10 | ) | — | |||||||||||||||
| Net realized gains | — | — | — | (0.08 | ) | (0.12 | ) | — | ||||||||||||||||
| Total from distributions | (0.12 | ) | — | — | (0.11 | ) | (0.22 | ) | — | |||||||||||||||
| Net asset value, end of period | $ | 46.92 | $ | 35.85 | $ | 29.55 | $ | 38.06 | $ | 27.47 | $ | 25.83 | ||||||||||||
| Total Return (c) | 31.27 | % (d) | 21.32 | % | (22.36 | )% | 39.01 | % | 7.22 | % | 29.15 | % (d) | ||||||||||||
| Ratios and Supplemental Data: | ||||||||||||||||||||||||
| Net assets, end of period (000 omitted) | $ | 45,390 | $ | 33,502 | $ | 31,913 | $ | 68,584 | $ | 43,131 | $ | 1,368 | ||||||||||||
| Before waiver or recoupment: | ||||||||||||||||||||||||
| Ratio of expenses to average net assets | 1.16 | % (e) | 1.23 | % | 1.19 | % | 1.02 | % | 1.67 | % | 4.33 | % (e) | ||||||||||||
| After waiver or recoupment: | ||||||||||||||||||||||||
| Ratio of net expenses to average net assets | 0.87 | % (e) | 0.88 | % | 0.90 | % | 0.90 | % | 0.90 | % | 0.90 | % (e) | ||||||||||||
| Ratio of net investment income (loss) to average net assets | 0.35 | % (e) | 0.32 | % | 0.02 | % | (0.07 | )% | 0.15 | % | 0.41 | % (e) | ||||||||||||
| Portfolio turnover(f)(g) | 9 | % (d) | 19 | % | 25 | % | 38 | % | 32 | % | 10 | % (d) | ||||||||||||
| (a) | For the period December 26, 2018 (commencement of operations) to September 30, 2019. |
| (b) | Per share net investment income has been calculated using the average shares method. |
| (c) | Total return in the above table represents the rate that the investor would have earned or lost on an investment in the Unconstrained Equity Fund, assuming reinvestment of distributions. |
| (d) | Not annualized. |
| (e) | Annualized. |
| (f) | Portfolio turnover is calculated on the basis on the Unconstrained Equity Fund as a whole without distinguishing among the classes of shares. |
| (g) | Portfolio turnover excludes securities delivered as a result of a redemption in-kind. |
See accompanying notes which are an integral part of these financial statements.
68
| FullerThaler Behavioral Unconstrained Equity Fund - Institutional Shares |
| Financial Highlights |
(For a share outstanding during each period)
| For the Six | ||||||||||||||||||||||||
| Months | For the | |||||||||||||||||||||||
| Ended | Period | |||||||||||||||||||||||
| March | Ended | |||||||||||||||||||||||
| 31, 2024 | For the Years Ended September 30, | September | ||||||||||||||||||||||
| (Unaudited) | 2023 | 2022 | 2021 | 2020 | 30, 2019(a) | |||||||||||||||||||
| Net asset value, beginning of period | $ | 35.73 | $ | 29.47 | $ | 38.00 | $ | 27.43 | $ | 25.81 | $ | 20.00 | ||||||||||||
| Income from investment operations: | ||||||||||||||||||||||||
| Net investment income (loss)(b) | 0.05 | 0.08 | (0.02 | ) | (0.06 | ) | 0.01 | 0.08 | ||||||||||||||||
| Net realized and unrealized gain (loss) on investments | 11.12 | 6.18 | (8.51 | ) | 10.72 | 1.81 | 5.73 | |||||||||||||||||
| Total from investment operations | 11.17 | 6.26 | (8.53 | ) | 10.66 | 1.82 | 5.81 | |||||||||||||||||
| Less distributions to shareholders from: | ||||||||||||||||||||||||
| Net investment income | (0.08 | ) | — | — | (0.01 | ) | (0.08 | ) | — | |||||||||||||||
| Net realized gains | — | — | — | (0.08 | ) | (0.12 | ) | — | ||||||||||||||||
| Total from distributions | (0.08 | ) | — | — | (0.09 | ) | (0.20 | ) | — | |||||||||||||||
| Net asset value, end of period | $ | 46.82 | $ | 35.73 | $ | 29.47 | $ | 38.00 | $ | 27.43 | $ | 25.81 | ||||||||||||
| Total Return (c) | 31.29 | % (d) | 21.24 | % | (22.45 | )% | 38.90 | % | 7.09 | % | 29.05 | % (d) | ||||||||||||
| Ratios and Supplemental Data: | ||||||||||||||||||||||||
| Net assets, end of period (000 omitted) | $ | 22,121 | $ | 13,592 | $ | 10,313 | $ | 10,238 | $ | 8,004 | $ | 3,265 | ||||||||||||
| Before waiver or recoupment: | ||||||||||||||||||||||||
| Ratio of expenses to average net assets | 1.31 | % (e) | 1.42 | % | 1.31 | % | 1.12 | % | 1.77 | % | 4.39 | % (e) | ||||||||||||
| After waiver or recoupment: | ||||||||||||||||||||||||
| Ratio of net expenses to average net assets | 0.97 | % (e) | 0.98 | % | 0.99 | % | 0.99 | % | 0.99 | % | 0.99 | % (e) | ||||||||||||
| Ratio of net investment income (loss) to average net assets | 0.25 | % (e) | 0.23 | % | (0.04 | )% | (0.17 | )% | 0.03 | % | 0.42 | % (e) | ||||||||||||
| Portfolio turnover(f)(g) | 9 | % (d) | 19 | % | 25 | % | 38 | % | 32 | % | 10 | % (d) | ||||||||||||
| (a) | For the period December 26, 2018 (commencement of operations) to September 30, 2019. |
| (b) | Per share net investment income has been calculated using the average shares method. |
| (c) | Total return in the above table represents the rate that the investor would have earned or lost on an investment in the Unconstrained Equity Fund, assuming reinvestment of distributions. |
| (d) | Not annualized. |
| (e) | Annualized. |
| (f) | Portfolio turnover is calculated on the basis on the Unconstrained Equity Fund as a whole without distinguishing among the classes of shares. |
| (g) | Portfolio turnover excludes securities delivered as a result of a redemption in-kind. |
See accompanying notes which are an integral part of these financial statements.
69
| FullerThaler Behavioral Unconstrained Equity Fund - A Shares |
| Financial Highlights |
(For a share outstanding during each period)
| For the Six | ||||||||||||||||
| Months | For the | |||||||||||||||
| Ended | Period | |||||||||||||||
| March | For the Years Ended | Ended | ||||||||||||||
| 31, 2024 | September 30, | September | ||||||||||||||
| (Unaudited) | 2023 | 2022 | 30, 2021(a) | |||||||||||||
| Net asset value, beginning of period | $ | 35.51 | $ | 29.36 | $ | 37.99 | $ | 37.77 | ||||||||
| Income from investment operations: | ||||||||||||||||
| Net investment loss(b) | (0.02 | ) | (0.03 | ) | (0.14 | ) | (0.08 | ) | ||||||||
| Net realized and unrealized gain (loss) on investments | 11.13 | 6.18 | (8.49 | ) | 0.30 | |||||||||||
| Total from investment operations | 11.11 | 6.15 | (8.63 | ) | 0.22 | |||||||||||
| Net asset value, end of period | $ | 46.62 | $ | 35.51 | $ | 29.36 | $ | 37.99 | ||||||||
| Total Return (excludes sales charge)(c) | 31.29 | % (d) | 20.95 | % | (22.72 | )% | 0.58 | % (d) | ||||||||
| Ratios and Supplemental Data: | ||||||||||||||||
| Net assets, end of period (000 omitted) | $ | 113 | $ | 57 | $ | 37 | $ | 47 | ||||||||
| Before waiver or recoupment: | ||||||||||||||||
| Ratio of expenses to average net assets | 1.67 | % (e) | 1.73 | % | 1.56 | % | 1.31 | % (e) | ||||||||
| After waiver or recoupment: | ||||||||||||||||
| Ratio of net expenses to average net assets | 1.30 | % (e) | 1.30 | % | 1.30 | % | 1.30 | % (e) | ||||||||
| Ratio of net investment loss to average net assets | (0.08 | )% (e) | (0.09 | )% | (0.38 | )% | (0.61 | )% (e) | ||||||||
| Portfolio turnover(f)(g) | 9 | % (d) | 19 | % | 25 | % | 38 | % (d) | ||||||||
| (a) | For the period May 27, 2021 (commencement of operations) to September 30, 2021. |
| (b) | Per share net investment income has been calculated using the average shares method. |
| (c) | Total return in the above table represents the rate that the investor would have earned or lost on an investment in the Unconstrained Equity Fund, assuming reinvestment of distributions. |
| (d) | Not annualized. |
| (e) | Annualized. |
| (f) | Portfolio turnover is calculated on the basis on the Unconstrained Equity Fund as a whole without distinguishing among the classes of shares. |
| (g) | Portfolio turnover excludes securities delivered as a result of a redemption in-kind. |
See accompanying notes which are an integral part of these financial statements.
70
| FullerThaler Behavioral Unconstrained Equity Fund - C Shares |
| Financial Highlights |
(For a share outstanding during each period)
| For the Six | ||||||||||||||||
| Months | For the | |||||||||||||||
| Ended | Period | |||||||||||||||
| March | For the Years Ended | Ended | ||||||||||||||
| 31, 2024 | September 30, | September | ||||||||||||||
| (Unaudited) | 2023 | 2022 | 30, 2021(a) | |||||||||||||
| Net asset value, beginning of period | $ | 35.10 | $ | 29.12 | $ | 37.93 | $ | 37.77 | ||||||||
| Income from investment operations: | ||||||||||||||||
| Net investment loss(b) | (0.11 | ) | (0.20 | ) | (0.28 | ) | (0.14 | ) | ||||||||
| Net realized and unrealized gain (loss) on investments | 11.12 | 6.18 | (8.53 | ) | 0.30 | |||||||||||
| Total from investment operations | 11.01 | 5.98 | (8.81 | ) | 0.16 | |||||||||||
| Net asset value, end of period | $ | 46.11 | $ | 35.10 | $ | 29.12 | $ | 37.93 | ||||||||
| Total Return (excludes sales charge)(c) | 31.37 | % (d) | 20.54 | % | (23.23 | )% | 0.42 | % (d) | ||||||||
| Ratios and Supplemental Data: | ||||||||||||||||
| Net assets, end of period (000 omitted) | $ | 40 | $ | 29 | $ | 24 | $ | 25 | ||||||||
| Before waiver or recoupment: | ||||||||||||||||
| Ratio of expenses to average net assets | 2.19 | % (e) | 2.32 | % | 2.21 | % | 2.05 | % (e) | ||||||||
| After waiver or recoupment: | ||||||||||||||||
| Ratio of net expenses to average net assets | 1.80 | % (e) | 1.80 | % | 1.80 | % | 1.80 | % (e) | ||||||||
| Ratio of net investment loss to average net assets | (0.56 | )% (e) | (0.58 | )% | (0.80 | )% | (1.06 | )% (e) | ||||||||
| Portfolio turnover(f)(g) | 9 | % (d) | 19 | % | 25 | % | 38 | % (d) | ||||||||
| (a) | For the period May 27, 2021 (commencement of operations) to September 30, 2021. |
| (b) | Per share net investment income has been calculated using the average shares method. |
| (c) | Total return in the above table represents the rate that the investor would have earned or lost on an investment in the Unconstrained Equity Fund, assuming reinvestment of distributions. |
| (d) | Not annualized. |
| (e) | Annualized. |
| (f) | Portfolio turnover is calculated on the basis on the Unconstrained Equity Fund as a whole without distinguishing among the classes of shares. |
| (g) | Portfolio turnover excludes securities delivered as a result of a redemption in-kind. |
See accompanying notes which are an integral part of these financial statements.
71
| FullerThaler Behavioral Small-Mid Core Equity Fund - Institutional Shares |
| Financial Highlights |
(For a share outstanding during each period)
| For the Six | ||||||||||||||||||||||||
| Months | For the | |||||||||||||||||||||||
| Ended | Period | |||||||||||||||||||||||
| March | Ended | |||||||||||||||||||||||
| 31, 2024 | For the Years Ended September 30, | September | ||||||||||||||||||||||
| (Unaudited) | 2023 | 2022 | 2021 | 2020 | 30, 2019(a) | |||||||||||||||||||
| Net asset value, beginning of period | $ | 31.18 | $ | 26.54 | $ | 35.99 | $ | 23.59 | $ | 23.96 | $ | 20.00 | ||||||||||||
| Income from investment operations: | ||||||||||||||||||||||||
| Net investment income(b) | 0.21 | 0.34 | 0.32 | 0.10 | 0.13 | 0.13 | ||||||||||||||||||
| Net realized and unrealized gain (loss) on investments | 6.15 | 4.58 | (7.80 | ) | 12.41 | 0.04 | (c) | 3.83 | ||||||||||||||||
| Total from investment operations | 6.36 | 4.92 | (7.48 | ) | 12.51 | 0.17 | 3.96 | |||||||||||||||||
| Less distributions to shareholders from: | ||||||||||||||||||||||||
| Net investment income | (0.29 | ) | (0.28 | ) | (0.13 | ) | (0.11 | ) | (0.15 | ) | — | |||||||||||||
| Net realized gains | — | — | (1.84 | ) | — | (0.39 | ) | — | ||||||||||||||||
| Total from distributions | (0.29 | ) | (0.28 | ) | (1.97 | ) | (0.11 | ) | (0.54 | ) | — | |||||||||||||
| Net asset value, end of period | $ | 37.25 | $ | 31.18 | $ | 26.54 | $ | 35.99 | $ | 23.59 | $ | 23.96 | ||||||||||||
| Total Return (d) | 20.49 | % (e) | 18.61 | % | (22.13 | )% | 53.10 | % | 0.63 | % | 19.80 | % (e) | ||||||||||||
| Ratios and Supplemental Data: | ||||||||||||||||||||||||
| Net assets, end of period (000 omitted) | $ | 65,039 | $ | 41,564 | $ | 6,757 | $ | 5,149 | $ | 3,102 | $ | 2,494 | ||||||||||||
| Before waiver or recoupment: | ||||||||||||||||||||||||
| Ratio of expenses to average net assets | 1.23 | % (f) | 1.35 | % | 2.56 | % | 2.69 | % | 4.09 | % | 6.27 | % (f) | ||||||||||||
| After waiver or recoupment: | ||||||||||||||||||||||||
| Ratio of net expenses to average net assets | 0.91 | % (f) | 0.93 | % | 0.95 | % | 0.95 | % | 0.95 | % | 0.95 | % (f) | ||||||||||||
| Ratio of net investment income to average net assets | 1.23 | % (f) | 1.09 | % | 0.99 | % | 0.30 | % | 0.59 | % | 0.73 | % (f) | ||||||||||||
| Portfolio turnover(g)(h) | 19 | % (e) | 41 | % | 37 | % | 35 | % | 35 | % | 25 | % (e) | ||||||||||||
| (a) | For the period December 26, 2018 (commencement of operations) to September 30, 2019. |
| (b) | Per share net investment income has been calculated using the average shares method. |
| (c) | The amount shown for a share outstanding throughout the period does not accord with the change in aggregate gains and losses in the portfolio of securities during the period due to the timing of sales and purchases of fund shares in relation to fluctuating market values during the period. |
| (d) | Total return in the above table represents the rate that the investor would have earned or lost on an investment in the Small-Mid Core Equity Fund, assuming reinvestment of distributions. |
| (e) | Not annualized. |
| (f) | Annualized. |
| (g) | Portfolio turnover is calculated on the basis on the Small-Mid Core Equity Fund as a whole without distinguishing among the classes of shares. |
| (h) | Portfolio turnover excludes securities delivered as a result of a redemption in-kind. |
See accompanying notes which are an integral part of these financial statements.
72
| FullerThaler Behavioral Small-Mid Core Equity Fund - A Shares |
| Financial Highlights |
(For a share outstanding during each period)
| For the Six | ||||||||||||
| Months | For the | |||||||||||
| Ended | For the | Period | ||||||||||
| March | Year Ended | Ended | ||||||||||
| 31, 2024 | September | September | ||||||||||
| (Unaudited) | 30, 2023 | 30, 2022(a) | ||||||||||
| Net asset value, beginning of period | $ | 31.05 | $ | 26.49 | $ | 32.58 | ||||||
| Income from investment operations: | ||||||||||||
| Net investment income(b) | 0.15 | 0.26 | 0.17 | |||||||||
| Net realized and unrealized gain (loss) on investments | 6.12 | 4.55 | (6.26 | ) | ||||||||
| Total from investment operations | 6.27 | 4.81 | (6.09 | ) | ||||||||
| Less distributions to shareholders from: | ||||||||||||
| Net investment income | (0.23 | ) | (0.25 | ) | — | |||||||
| Total from distributions | (0.23 | ) | (0.25 | ) | — | |||||||
| Net asset value, end of period | $ | 37.09 | $ | 31.05 | $ | 26.49 | ||||||
| Total Return (excludes sales charge)(c) | 20.26 | % (d) | 18.20 | % | (18.69 | )% (d) | ||||||
| Ratios and Supplemental Data: | ||||||||||||
| Net assets, end of period (000 omitted) | $ | 1,298 | $ | 567 | $ | 3 | ||||||
| Before waiver or recoupment: | ||||||||||||
| Ratio of expenses to average net assets | 1.56 | % (e) | 1.62 | % | 2.72 | % (e) | ||||||
| After waiver or recoupment: | ||||||||||||
| Ratio of net expenses to average net assets | 1.26 | % (e) | 1.26 | % | 1.26 | % (e) | ||||||
| Ratio of net investment income to average net assets | 0.91 | % (e) | 0.82 | % | 1.00 | % (e) | ||||||
| Portfolio turnover(f)(g) | 19 | % (d) | 41 | % | 37 | % (d) | ||||||
| (a) | For the period March 10, 2022 (commencement of operations) to September 30, 2022. |
| (b) | Per share net investment income has been calculated using the average shares method. |
| (c) | Total return in the above table represents the rate that the investor would have earned or lost on an investment in the Small-Mid Core Equity Fund, assuming reinvestment of distributions. |
| (d) | Not annualized. |
| (e) | Annualized. |
| (f) | Portfolio turnover is calculated on the basis on the Small-Mid Core Equity Fund as a whole without distinguishing among the classes of shares. |
| (g) | Portfolio turnover excludes securities delivered as a result of a redemption in-kind. |
See accompanying notes which are an integral part of these financial statements.
73
| FullerThaler Behavioral Micro-Cap Equity Fund - Institutional Shares |
| Financial Highlights |
(For a share outstanding during each period)
| For the Six | ||||||||||||||||||||||||
| Months | For the | |||||||||||||||||||||||
| Ended | Period | |||||||||||||||||||||||
| March | Ended | |||||||||||||||||||||||
| 31, 2024 | For the Years Ended September 30, | September | ||||||||||||||||||||||
| (Unaudited) | 2023 | 2022 | 2021 | 2020 | 30, 2019(a) | |||||||||||||||||||
| Net asset value, beginning of period | $ | 23.92 | $ | 21.67 | $ | 34.45 | $ | 17.79 | $ | 21.70 | $ | 20.00 | ||||||||||||
| Income from investment operations: | ||||||||||||||||||||||||
| Net investment income (loss)(b) | 0.09 | 0.11 | (0.17 | ) | (0.02 | ) | 0.16 | (0.20 | ) | |||||||||||||||
| Net realized and unrealized gain (loss) on investments | 1.77 | 2.14 | (9.86 | ) | 16.78 | (2.95 | ) | 1.90 | ||||||||||||||||
| Total from investment operations | 1.86 | 2.25 | (10.03 | ) | 16.76 | (2.79 | ) | 1.70 | ||||||||||||||||
| Less distributions to shareholders from: | ||||||||||||||||||||||||
| Net investment income | — | — | — | (0.10 | ) | — | — | |||||||||||||||||
| Net realized gains | — | — | (2.75 | ) | — | (1.12 | ) | — | ||||||||||||||||
| Total from distributions | — | — | (2.75 | ) | (0.10 | ) | (1.12 | ) | — | |||||||||||||||
| Net asset value, end of period | $ | 25.78 | $ | 23.92 | $ | 21.67 | $ | 34.45 | $ | 17.79 | $ | 21.70 | ||||||||||||
| Total Return (c) | 7.78 | % (d) | 10.38 | % | (31.87 | )% | 94.37 | % | (13.88 | )% | 8.50 | % (d) | ||||||||||||
| Ratios and Supplemental Data: | ||||||||||||||||||||||||
| Net assets, end of period (000 omitted) | $ | 20,370 | $ | 18,044 | $ | 13,674 | $ | 13,695 | $ | 5,770 | $ | 2,819 | ||||||||||||
| Before waiver or recoupment: | ||||||||||||||||||||||||
| Ratio of expenses to average net assets | 2.12 | % (e) | 2.13 | % | 2.19 | % | 2.30 | % | 4.33 | % | 5.28 | % (e) | ||||||||||||
| After waiver or recoupment: | ||||||||||||||||||||||||
| Ratio of net expenses to average net assets | 1.36 | % (e) | 1.41 | % | 1.45 | % | 1.52 | % | 1.75 | % | 1.75 | % (e) | ||||||||||||
| Ratio of net investment income (loss) to average net assets | 0.74 | % (e) | 0.45 | % | (0.58 | )% | (0.05 | )% | 0.90 | % | (1.16 | )% (e) | ||||||||||||
| Portfolio turnover(f) | 43 | % (d) | 78 | % | 74 | % | 78 | % | 82 | % | 42 | % (d) | ||||||||||||
| (a) | For the period December 28, 2018 (commencement of operations) to September 30, 2019. |
| (b) | Per share net investment income has been calculated using the average shares method. |
| (c) | Total return in the above table represents the rate that the investor would have earned or lost on an investment in the Micro-Cap Equity Fund, assuming reinvestment of distributions. |
| (d) | Not annualized. |
| (e) | Annualized. |
| (f) | Portfolio turnover excludes securities delivered as a result of a redemption in-kind. |
See accompanying notes which are an integral part of these financial statements.
74
| FullerThaler Behavioral Mid-Cap Equity Fund - Institutional Shares |
| Financial Highlights |
(For a share outstanding during each period)
| For the | ||||
| Period | ||||
| Ended | ||||
| March | ||||
| 31, 2024(a) | ||||
| (Unaudited) | ||||
| Net asset value, beginning of period | $ | 20.00 | ||
| Income from investment operations: | ||||
| Net investment income(b) | 0.09 | |||
| Net realized and unrealized gain on investments | 4.78 | |||
| Total from investment operations | 4.87 | |||
| Less distributions to shareholders from: | ||||
| Net investment income | (0.04 | ) | ||
| Total from distributions | (0.04 | ) | ||
| Net asset value, end of period | $ | 24.83 | ||
| Total Return (c) | 24.37 | % (d) | ||
| Ratios and Supplemental Data: | ||||
| Net assets, end of period (000 omitted) | $ | 13,241 | ||
| Before waiver or recoupment: | ||||
| Ratio of expenses to average net assets | 2.19 | % (e) | ||
| After waiver or recoupment: | ||||
| Ratio of net expenses to average net assets | 0.84 | % (e) | ||
| Ratio of net investment income to average net assets | 0.86 | % (e) | ||
| Portfolio turnover(f) | 9 | % (d) | ||
| (a) | For the period October 2, 2023 (commencement of operations) to March 31, 2024. |
| (b) | Per share net investment income has been calculated using the average shares method. |
| (c) | Total return in the above table represents the rate that the investor would have earned or lost on an investment in the Mid-Cap Equity Fund, assuming reinvestment of distributions. |
| (d) | Not annualized. |
| (e) | Annualized. |
| (f) | Portfolio turnover excludes securities delivered as a result of a redemption in-kind. |
See accompanying notes which are an integral part of these financial statements.
75
| FullerThaler Funds |
| Notes to the Financial Statements |
| March 31, 2024 - (Unaudited) |
NOTE 1. ORGANIZATION
The FullerThaler Behavioral Small-Cap Equity Fund (the “Small-Cap Equity Fund”), the FullerThaler Behavioral Small-Cap Growth Fund (the “Small-Cap Growth Fund”), the FullerThaler Behavioral Mid-Cap Value Fund (the “Mid-Cap Value Fund”), the FullerThaler Behavioral Unconstrained Equity Fund (the “Unconstrained Equity Fund”), the FullerThaler Behavioral Small-Mid Core Equity Fund (the “Small-Mid Core Equity Fund”), the FullerThaler Behavioral Micro-Cap Equity Fund (the “Micro-Cap Equity Fund”) and the FullerThaler Behavioral Mid-Cap Equity Fund (the “Mid-Cap Equity Fund”), (each a “Fund” and, collectively the “Funds”) were each registered under the Investment Company Act of 1940, as amended (“1940 Act”), as a diversified (Unconstrained Equity Fund is non-diversified) series of Capitol Series Trust (the “Trust”). The Trust is an open-end investment company established under the laws of Ohio by an Agreement and Declaration of Trust dated September 18, 2013 as amended and restated November 18, 2021 (the “Trust Agreement”). The Trust Agreement permits the Board of Trustees of the Trust (“the Board”) to issue an unlimited number of shares of beneficial interest of separate series without par value. The Funds’ investment adviser is Fuller & Thaler Asset Management, Inc. (the “Adviser” or “FullerThaler”). The investment objective of each Fund is to seek long-term capital appreciation.
The Small-Cap Equity Fund, Small-Cap Growth Fund and Mid-Cap Value Fund each currently offer five share classes: R6 Shares, Institutional Shares, Investor Shares, A Shares and C Shares. The Unconstrained Equity Fund currently offers four share classes: R6 Shares, Institutional Shares, A Shares and C Shares. The Unconstrained Equity Fund’s Investor Shares have been approved by the Board, but are not yet available for purchase. The Small-Mid Core Equity Fund currently offers two share classes: Institutional Shares and A Shares. The Micro-Cap Equity Fund and Mid-Cap Equity Fund currently offers one share class: Institutional Shares. A Shares have a maximum sales charge on purchases of up to 5.75% and a Contingent Deferred Sales Charge (“CDSC”) on redemptions made within 12 months from the date of purchase and a CDSC of 0.50% on redemptions made more than 12 months but less than 18 months from the date of purchase. C Shares impose a 1.00% CDSC on redemptions made within 12 months from the date of purchase. A Shares and C Shares may be purchased without a sales charge under certain circumstances. Each share represents an equal proportionate interest in the assets and liabilities belonging to each Fund and is entitled to such dividends and distributions out of income belonging to each Fund as are declared by the Board.
The Small-Cap Equity Fund is the accounting successor to a series of Allianz Funds Multi-Strategy Trust, which commenced operations on September 8, 2011, and for which the Adviser served as the sole sub-adviser (the “Predecessor Fund”). In a transaction that was
76
| FullerThaler Funds |
| Notes to the Financial Statements (continued) |
| March 31, 2024 - (Unaudited) |
consummated on October 23, 2015 (the “Reorganization”), the Small-Cap Equity Fund acquired the assets and liabilities of: the A, C, and D Classes of the Predecessor Fund, which became the Investor Shares of the Small-Cap Equity Fund; the Class P Shares of the Predecessor Fund, which became the Institutional Shares of the Small-Cap Equity Fund; and the Institutional Shares of the Predecessor Fund, which became the R6 Shares of the Small-Cap Equity Fund.
NOTE 2. SIGNIFICANT ACCOUNTING POLICIES
The Funds are investment companies and follow accounting and reporting guidance under Financial Accounting Standards Board Accounting Standards Codification (“ASC”) Topic 946, “Financial Services-Investment Companies,” including Accounting Standards Update 2013-08. The following is a summary of significant accounting policies followed by the Funds in the preparation of their financial statements. These policies are in conformity with generally accepted accounting principles in the United States of America (“GAAP”).
Regulatory update – Tailored Shareholder Reports for Mutual Funds and Exchange-Traded Funds (“ETFs”) – Effective January 24, 2023, the Securities and Exchange Commission adopted rule and form amendments to require mutual funds and ETFs to transmit concise and visually engaging streamlined annual and semiannual reports to shareholders that highlight key information. Other information, including financial statements, will no longer appear in a streamlined shareholder report but must be available online, delivered free of charge upon request, and filed on a semiannual basis on Form N-CSR. The rule and form amendments have a compliance date of July 24, 2024. At this time, management is evaluating the impact of these amendments on the shareholder reports for the Funds.
Estimates – The preparation of financial statements in conformity with GAAP requires management to make estimates and assumptions that affect the reported amounts of assets and liabilities and disclosure of contingent assets and liabilities at the date of the financial statements and the reported amounts of increases and decreases in net assets from operations during the reporting period. Actual results could differ from those estimates.
Foreign Currency Translation – The accounting records of the Funds are maintained in U.S. dollars. Foreign currency amounts are translated into U.S. dollars at the current rate of exchange each business day to determine the value of investments, and other assets and liabilities. Purchases and sales of foreign securities, and income and expenses, are translated at the prevailing rate of exchange on the respective date of these transactions. The Funds do not isolate that portion of the results of operations resulting from changes in foreign exchange rates on investments from fluctuation arising from changes in market
77
| FullerThaler Funds |
| Notes to the Financial Statements (continued) |
| March 31, 2024 - (Unaudited) |
prices of securities held. These fluctuations are included with the unrealized gain or loss from investments.
In-Kind Redemptions – The Funds intend to redeem shares in cash. However, if the amount an investor is redeeming is over the lesser of $250,000 or 1% of a Fund’s NAV, the Funds have the right to redeem such shares by giving the investor the amount that exceeds the lesser of $250,000 or 1% of a Fund’s NAV in securities instead of cash, which is referred to as a “redemption in-kind.” In the event that a redemption in kind is made, a shareholder may incur additional expenses, such as the payment of brokerage commissions, on the sale or other disposition of the securities received from the Funds.
During the six months ended March 31, 2024, the following Funds had shares redeemed that included in-kind redemption transactions:
| Redemptions In-Kind | ||||||||||||||||||||
| Value of | ||||||||||||||||||||
| Fund / Class | Shares | Securities | Cash | Total Amount | Realized Gains | |||||||||||||||
| Small-Cap Equity Fund - R6 Shares | 1,522,206 | $ | 62,097,021 | $ | 2,475,286 | $ | 64,572,307 | $ | 45,309,758 | |||||||||||
| Small-Cap Growth Fund - R6 Shares | 866,958 | 28,829,592 | 999,838 | 29,829,430 | 15,231,947 | |||||||||||||||
| Mid-Cap Value Fund - R6Shares | 11,230,473 | 98,488,129 | 1,569,259 | 100,017,389 | 20,854,746 | |||||||||||||||
| Unconstrained Equity Fund - R6 Shares | 183,916 | 7,231,946 | 149,670 | 7,381,646 | 2,712,316 | |||||||||||||||
| Small-Mid Core Equity Fund - Institutional Shares | 288,590 | 8,982,174 | 247,284 | 9,229,458 | 1,362,622 | |||||||||||||||
| Micro-Cap Equity Fund - Institutional Shares | 47,809 | 1,122,341 | 22,556 | 1,144,897 | 554,436 | |||||||||||||||
| Mid-Cap Equity Fund - Institutional Shares | 28,169 | 651,812 | 12,196 | 664,009 | 194,955 | |||||||||||||||
The Funds recognize a gain on in-kind redemptions to the extent that the value of the distributed securities on the date of redemption exceeds the cost of those securities and recognizes a loss to the extent that the cost of those securities exceeds the value of the distributed securities on the date of redemption. Such net gains are not taxable to the Funds and are not required to be distributed to shareholders. The Funds have reclassified these amounts against paid-in capital on the Statements of Assets and Liabilities. Such reclassification, the result of permanent differences between the financial statement and income tax reporting requirements, has no effect on the Funds’ net assets or NAV per share.
Federal Income Taxes – The Funds make no provision for federal income or excise tax. Each Fund has qualified and intends to qualify each year as a regulated investment
78
| FullerThaler Funds |
| Notes to the Financial Statements (continued) |
| March 31, 2024 - (Unaudited) |
company (“RIC”) under subchapter M of the Internal Revenue Code of 1986, as amended, by complying with the requirements applicable to RICs and by distributing substantially all of its taxable income. Each Fund also intends to distribute sufficient net investment income and net capital gains, if any, so that it will not be subject to excise tax on undistributed income and gains. If the required amount of net investment income or gains is not distributed, the Funds could incur a tax expense.
The Funds may be subject to taxes imposed by countries in which they invest. Such taxes are generally based on income and/or capital gains earned or repatriated. Taxes are accrued and applied to net investment income, net realized gains and unrealized appreciation as such income and/or gains are earned.
The Funds recognize tax benefits or expenses of uncertain tax positions only when the position is “more likely than not” to be sustained assuming examination by tax authorities. Management of the Funds has reviewed tax positions taken in tax years that remain subject to examination by all major tax jurisdictions, including federal (i.e., the previous three tax year ends and the interim tax period since then, as applicable) and has concluded that no provision for unrecognized tax benefits or expenses is required in these financial statements and does not expect this to change over the next twelve months. The Funds recognize interest and penalties, if any, related to unrecognized tax benefits as income tax expense in the Statements of Operations. During the period, the Funds did not incur any interest or penalties.
Expenses – Expenses incurred by the Trust that do not relate to a specific fund of the Trust are allocated to the individual funds based on each fund’s relative net assets or another appropriate basis (as determined by the Board). Expenses specifically attributable to any class are borne by that class. Income, realized gains and losses, unrealized appreciation and depreciation, and fund-wide expenses not allocated to a particular class shall be allocated to each class based on the net assets of that class in relation to the net assets of the entire fund.
Security Transactions and Related Income – Throughout the reporting period, security transactions are accounted for no later than one business day following the trade date. For financial reporting purposes, security transactions are accounted for on trade date on the last business day of the reporting period. The specific identification method is used for determining gains or losses for financial statements and income tax purposes. Dividend income is recorded on the ex-dividend date and interest income is recorded on an accrual basis. Dividend income from real estate investment trusts (REITs) and distributions from limited partnerships are recognized on the ex-date and are included in dividend income. The calendar year-end classification of distributions received from REITs, which may include return of capital, during the fiscal year are reported subsequent to year end; accordingly, the Fund estimates the character of REIT distributions based on the most recent information
79
| FullerThaler Funds |
| Notes to the Financial Statements (continued) |
| March 31, 2024 - (Unaudited) |
available. Income or loss from limited partnerships is reclassified among the components of net assets upon receipt of K-1’s. Withholding taxes on foreign dividends, if any, have been recorded for in accordance with the Fund’s understanding of the applicable country’s tax rules and rates.
Securities Lending - The Trust has entered into a Securities Lending Agreement (“SLA”) with Mitsubishi UFJ Trust and Banking Corp. (“Mitsubishi”). Under the terms of the SLA, each Fund may make secured loans of its portfolio securities in an amount not exceeding 33 1/3% of the value of the Fund’s total assets (as permitted by the 1940 Act) to certain broker-dealers and banks in exchange for collateral in the amount of at least 102% of the value of U.S. securities loaned or at least 105% of the value of non-U.S. securities loaned, marked to market daily. The collateral can be received in the form of cash collateral and/or non-cash collateral. Non-cash collateral can include U.S. Government Securities and letters of credit. The cash collateral is invested in the Invesco Government & Agency Portfolio, as noted in each lending Fund’s respective Schedule of Investments. Cash collateral may also be placed in a deposit account managed by TriState Capital subject to the IntraFi Network Deposit Placement Agreement. The IntraFi Network provides FDIC insurance for deposits above $250,000 by spreading deposits across the company’s network of banks. The market value of the loaned securities is determined daily at the close of business of the Funds and any additional required collateral is delivered to each Fund on the next business day. The Funds continue to benefit from interest or dividends on the securities loaned and may also earn a return from the collateral. The Funds pay various fees in connection with the investment of cash collateral. The Funds pay Mitsubishi fees based on the investment income received from securities lending activities. Although risk is mitigated by the collateral, the Funds could experience a delay in recovering its securities and possible loss of income or value if the borrower fails to return them. A Fund does not have the right to vote securities on loan, but could terminate the loan and regain the right to vote if that were considered important with respect to the investment.
80
| FullerThaler Funds |
| Notes to the Financial Statements (continued) |
| March 31, 2024 - (Unaudited) |
At March 31, 2024, the value of securities loaned and cash collateral received are as follows:
| Value of | ||||||||
| Securities | Cash Collateral | |||||||
| Loaned | Received | |||||||
| Small-Cap Equity Fund | $ | 176,004,848 | $ | 177,814,225 | ||||
| Small-Cap Growth Fund | 100,570,647 | 104,278,979 | ||||||
| Mid-Cap Value Fund | 37,787,302 | 38,167,715 | ||||||
| Unconstrained Equity Fund | — | — | ||||||
| Small-Mid Core Equity Fund | — | — | ||||||
| Micro-Cap Equity Fund | 819,084 | 827,964 | ||||||
| Mid-Cap Equity Fund | — | — | ||||||
| Total | $ | 315,181,881 | $ | 321,088,883 | ||||
Disclosures about Offsetting Assets and Liabilities - The Funds are required to disclose information about offsetting and related arrangements to enable users of its financial statements to understand the effect of those arrangements on its financial position. As there are no master netting arrangements relating to the Funds’ participation in securities lending, and all amounts related to securities lending are presented gross on the Funds’ Statements of Assets and Liabilities, no additional disclosures have been made on behalf of the Funds. Please refer to the Securities Lending Note for additional disclosures related to securities lending, including collateral related to securities on loan.
Dividends and Distributions – Each Fund intends to distribute its net investment income and net realized long-term and short-term capital gains, if any, at least annually. Dividends and distributions to shareholders, which are determined in accordance with income tax regulations, are recorded on the ex-dividend date. The treatment for financial reporting purposes of distributions made to shareholders during the period from net investment income or net realized capital gains may differ from their ultimate treatment for federal income tax purposes. These differences are caused primarily by differences in the timing of the recognition of certain components of income, expense or realized capital gain for federal income tax purposes. Where such differences are permanent in nature, they are reclassified among the components of the net assets based on their ultimate characterization for federal income tax purposes. Any such reclassifications will have no effect on net assets, results of operations or net asset Value (“NAV”) per share of the Funds.
NOTE 3. SECURITIES VALUATION AND FAIR VALUE MEASUREMENTS
Each Fund values its portfolio securities at fair value as of the close of regular trading on the New York Stock Exchange (the “NYSE”) (normally 4:00 p.m. Eastern time) on each business day the NYSE is open for business. Fair value is defined as the price that a Fund would receive upon selling an investment in a timely transaction to an independent
81
| FullerThaler Funds |
| Notes to the Financial Statements (continued) |
| March 31, 2024 - (Unaudited) |
buyer in the principal or most advantageous market of the investment. GAAP establishes a three-tier hierarchy to maximize the use of observable market data and minimize the use of unobservable inputs and to establish classification of fair value measurements for disclosure purposes.
Inputs refer broadly to the assumptions that market participants would use in pricing the asset or liability, including assumptions about risk (the risk inherent in a particular valuation technique used to measure fair value including a pricing model and/or the risk inherent in the inputs to the valuation technique). Inputs may be observable or unobservable. Observable inputs are inputs that reflect the assumptions market participants would use in pricing the asset or liability developed based on market data obtained and available from sources independent of the reporting entity. Unobservable inputs are inputs that reflect the reporting entity’s own assumptions about the assumptions market participants would use in pricing the asset or liability developed based on the best information available in the circumstances.
Various inputs are used in determining the value of each Fund’s investments. These inputs are summarized in the three broad levels listed below.
| ● | Level 1 – unadjusted quoted prices in active markets for identical investments and/or registered investment companies where the value per share is determined and published and is the basis for current transactions for identical assets or liabilities at the valuation date |
| ● | Level 2 – other significant observable inputs (including, but not limited to, quoted prices for an identical security in an inactive market, quoted prices for similar securities, interest rates, prepayment speeds, credit risk, etc.) |
| ● | Level 3 – significant unobservable inputs (including the Funds’ own assumptions in determining fair value of investments based on the best information available) |
The inputs used to measure fair value may fall into different levels of the fair value hierarchy. In such cases, for disclosure purposes, the level in the fair value hierarchy which is reported is determined based on the lowest level input that is significant to the fair value measurement in its entirety.
In computing the NAV of the Funds, fair value is based on market valuations with respect to portfolio securities for which market quotations are readily available. Pursuant to Board approved policies, the Funds rely on independent third-party pricing services to provide the current market value of securities. Those pricing services value equity securities, including exchange-traded funds, exchange-traded notes, closed-end funds and preferred stocks, traded on a securities exchange at the last reported sales price on the principal exchange.
82
| FullerThaler Funds |
| Notes to the Financial Statements (continued) |
| March 31, 2024 - (Unaudited) |
Equity securities quoted by NASDAQ are valued at the NASDAQ Official Closing Price. If there is no reported sale on the principal exchange, equity securities are valued at the mean between the most recent quoted bid and asked price. When using market quotations or close prices provided by the pricing service and when the market is considered active, the security will be classified as a Level 1 security. Investments in open-end mutual funds, including money market mutual funds, are generally priced at the ending NAV provided by the pricing service of the funds and are generally categorized as Level 1 securities.
In the event that market quotations are not readily available or are considered unreliable due to market or other events, securities are valued in good faith by the Adviser as “valuation designee” under the oversight of the Board. The Adviser has adopted written policies and procedures for valuing securities and other assets in circumstances where market quotes are not readily available. In the event that market quotes are not readily available, and the security or asset cannot be valued pursuant to one of the valuation methods, the value of the security or asset will be determined in good faith by the Adviser pursuant to its policies and procedures. On a quarterly basis, the Adviser’s fair valuation determinations will be reviewed by the Board. Under these policies, the securities will be classified as Level 2 or 3 within the fair value hierarchy, depending on the inputs used.
83
| FullerThaler Funds |
| Notes to the Financial Statements (continued) |
| March 31, 2024 - (Unaudited) |
The following is a summary of the inputs used to value the Funds’ investments as of March 31, 2024:
| Valuation Inputs | ||||||||||||||||
| Small-Cap Equity Fund | Level 1 | Level 2 | Level 3 | Total | ||||||||||||
| Common Stocks(a) | $ | 9,020,340,304 | $ | — | $ | — | $ | 9,020,340,304 | ||||||||
| Money Market Funds | 153,790,969 | — | — | 153,790,969 | ||||||||||||
| Collateral for Securities | ||||||||||||||||
| Loaned(a) | $ | 10,579,946 | $ | — | $ | — | $ | 10,579,946 | ||||||||
| Total | $ | 9,184,711,219 | $ | — | $ | — | $ | 9,184,711,219 | ||||||||
| Small-Cap Growth Fund | ||||||||||||||||
| Common Stocks(a) | $ | 1,043,175,529 | $ | — | $ | — | $ | 1,043,175,529 | ||||||||
| Collateral for Securities | ||||||||||||||||
| Loaned(a) | 6,204,599 | — | — | 6,204,599 | ||||||||||||
| Total | $ | 1,049,380,128 | $ | — | $ | — | $ | 1,049,380,128 | ||||||||
| Mid-Cap Value Fund | ||||||||||||||||
| Common Stocks(a) | $ | 414,136,189 | $ | — | $ | — | $ | 414,136,189 | ||||||||
| Collateral for Securities | ||||||||||||||||
| Loaned(a) | 2,270,979 | — | — | 2,270,979 | ||||||||||||
| Total | $ | 416,407,168 | $ | — | $ | — | $ | 416,407,168 | ||||||||
| Unconstrained Equity Fund | ||||||||||||||||
| Common Stocks(a) | $ | 65,964,557 | $ | — | $ | — | $ | 65,964,557 | ||||||||
| Small-Mid Core Equity Fund | ||||||||||||||||
| Common Stocks(a) | $ | 65,300,786 | $ | — | $ | — | $ | 65,300,786 | ||||||||
| Micro-Cap Equity Fund | ||||||||||||||||
| Common Stocks(a) | $ | 20,262,858 | $ | — | $ | — | $ | 20,262,858 | ||||||||
| Collateral for Securities | ||||||||||||||||
| Loaned(a) | 49,264 | — | — | 49,264 | ||||||||||||
| Total | $ | 20,312,122 | $ | — | $ | — | $ | 20,312,122 | ||||||||
| Mid-Cap Equity Fund | ||||||||||||||||
| Common Stocks(a) | $ | 13,147,711 | $ | — | $ | — | $ | 13,147,711 | ||||||||
| (a) | Refer to Schedule of Investments for industry classifications. |
The Funds did not hold any investments during or at the end of the reporting period in which significant unobservable inputs (Level 3) were used in determining fair value; therefore, no reconciliation of Level 3 securities is included for this reporting period.
84
| FullerThaler Funds |
| Notes to the Financial Statements (continued) |
| March 31, 2024 - (Unaudited) |
NOTE 4. FEES AND OTHER TRANSACTIONS WITH AFFILIATES AND OTHER SERVICE PROVIDERS
Under the terms of the investment advisory agreement (the “Agreement”), the Adviser manages each Fund’s investments subject to approval of the Board. As compensation for its management services, the Funds are obligated to pay the Adviser a fee computed and accrued daily and paid monthly as follows:
| Small-Cap | Small-Cap | Mid-Cap | Small-Mid | Micro-Cap | Mid-Cap | |||||||||
| Equity | Growth | Value | Unconstrained | Core Equity | Equity | Equity | ||||||||
| Fund | Fund | Fund | Equity Fund | Fund | Fund | Fund | ||||||||
| Investment Adviser fee rate | 0.60% | 0.85% | 0.74%(a) | 0.85% | 0.74%(b) | 1.45% | 0.75% | |||||||
| Investment Adviser fee earned | $23,502,801 | $2,416,256 | $1,450,207 | $242,911 | $206,549 | $135,554 | $35,228 | |||||||
| Fees waived and/or expenses reimbursed by Adviser | $– | $(262,388) | $(326,895) | $(88,105) | $(83,135) | $(70,925) | $(63,555) | |||||||
| Payable to /(Receivable from) Adviser | $4,440,858 | $682,493 | $217,497 | $31,934 | $27,311 | $9,997 | $(5,394) |
| (a) | FullerThaler has agreed to contractually waive its management fee of 0.75% for all share classes of the Mid-Cap Value Fund so that the management fee for all share classes of the Fund is 0.74% to be effective concurrently for the contractual period covered by the Expense LimitationAgreement of the Fund dated January 29, 2024, as amended March 27, 2024, and expiring on January 31, 2025. |
| (b) | FullerThaler has agreed to contractually waive its management fee of 0.80% for all share classes of the Small-Mid Core Equity Fund so that the management fee for all share classes of the Fund is 0.74% to be effective concurrently for the contractual period covered by the Expense Limitation Agreement of the Fund dated January 29, 2024, as amended March 27, 2024, and expiring on January 31, 2025. |
85
| FullerThaler Funds |
| Notes to the Financial Statements (continued) |
| March 31, 2024 - (Unaudited) |
The Adviser has contractually agreed to waive its management fee and/or reimburse expenses so that total annual operating expenses (excluding (i) interest (other than custodial overdraft fees and expenses associated with the Fund’s participation in an alternative liquidity program), (ii) taxes, (iii) brokerage fees and commissions, (iv) other extraordinary expenses not incurred in the ordinary course of the Fund’s business, (v) dividend expense on short sales and (vi) indirect expenses such as acquired fund fees and expenses incurred by the Fund in any fiscal year) do not exceed the following percentages of each Fund’s average daily net assets through January 31, 2025 (“Expense Limitation”):
| Institutional | Investor | |||||||||
| R6 Shares | Shares | Shares | A Shares | C Shares | ||||||
| Small-Cap Equity Fund | 0.80% | 0.92% | 1.25% | 1.30% | 1.80% | |||||
| Small-Cap Growth Fund | 0.86% | 0.96% | 1.25% | 1.30% | 1.80% | |||||
| Mid-Cap Value Fund | 0.69% | 0.79% | 1.15% | 1.20% | 1.70% | |||||
| Unconstrained Equity Fund | 0.87% | 0.97% | 1.30% | 1.80% | ||||||
| Small-Mid Core Equity Fund | 0.87% | 1.26% | ||||||||
| Micro-Cap Equity Fund | 1.29% | |||||||||
| Mid-Cap Equity | 0.79% |
Prior to January 29, 2024, the Adviser contractually agreed to waive its management fee and/or reimburse expenses so that total annual operating expenses (excluding (i) interest (other than custodial overdraft fees and expenses associated with the Fund’s participation in an alternative liquidity program), (ii) taxes, (iii) brokerage fees and commissions, (iv) other extraordinary expenses not incurred in the ordinary course of the Fund’s business, (v) dividend expense on short sales and (vi) indirect expenses such as acquired fund fees and expenses incurred by the Fund in any fiscal year) did not exceed 0.75% and 0.85% for the R6 Shares and Institutional Shares of the Mid-Cap Value Fund; 0.93% for the Institutional Shares of the Small-Mid Core Equity Fund; and 1.40% for the Institutional Shares of the Micro-Cap Equity Fund.
During any fiscal year that the Agreement between the Adviser and the Trust is in effect, the Adviser may recoup the sum of all fees previously waived or expenses reimbursed, less any reimbursement previously paid, provided that the Adviser is only permitted to recoup fees or expenses within 36 months from the date the fee waiver or expense reimbursement took effect and provided further that such recoupment can be achieved within the Expense Limitation currently in effect and the Expense Limitation in place when the waiver/ reimbursement occurred. This expense cap agreement may be terminated by the Board at any time.
86
| FullerThaler Funds |
| Notes to the Financial Statements (continued) |
| March 31, 2024 - (Unaudited) |
As of March 31, 2024, the Adviser may seek repayment of investment advisory fee waivers and expense reimbursements as follows:
| Small-Cap Equity | Small-Cap | Mid-Cap Value | Unconstrained | |||||||||||||
| Recoverable Through | Fund | Growth Fund | Fund | Equity Fund | ||||||||||||
| September 30, 2024 | $ | — | $ | 59,130 | $ | 49,094 | $ | 50,274 | ||||||||
| September 30, 2025 | — | 217,496 | 110,343 | 178,975 | ||||||||||||
| September 30, 2026 | — | 299,044 | 353,753 | 160,352 | ||||||||||||
| March 31, 2027 | — | 262,388 | 326,895 | 88,105 | ||||||||||||
| $ | — | $ | 838,058 | $ | 840,085 | $ | 477,706 | |||||||||
| Small-Mid Core | Micro-Cap | Mid-Cap Equity | ||||||||||||||
| Recoverable Through | Equity Fund | Equity Fund | Fund | |||||||||||||
| September 30, 2024 | $ | 38,094 | $ | 53,729 | $ | — | ||||||||||
| September 30, 2025 | 96,132 | 110,062 | — | |||||||||||||
| September 30, 2026 | 118,926 | 124,720 | — | |||||||||||||
| March 31, 2027 | 83,135 | 70,925 | 63,555 | |||||||||||||
| $ | 336,287 | $ | 359,436 | $ | 63,555 | |||||||||||
The Trust retains Ultimus Fund Solutions, LLC (the “Administrator”) to provide the Funds with administration, fund accounting and transfer agent services, including all regulatory reporting. Northern Lights Compliance Services, LLC (“NLCS”), an affiliate of the Administrator, provides a Chief Compliance Officer to the Trust, as well as related compliance services, pursuant to a consulting agreement between NLCS and the Trust.
The Board supervises the business activities of the Trust. Each Trustee serves as a Trustee for the lifetime of the Trust or until the earlier of his or her required retirement as a Trustee at age 78 (which may be extended for up to two years in an emeritus capacity at the pleasure and request of the Board), or until he/she dies, resigns, or is removed, whichever is sooner. “Independent Trustees”, meaning those Trustees who are not “interested persons” of the Trust, as defined in the 1940 Act, as amended, each receive an annual retainer of $2,000 per Fund and $500 per Fund for each quarterly Board meeting. The Trust also reimburses Trustees for out-of-pocket expense incurred in conjunction with attendance at Board meetings.
The officers of the Trust are employees of the Administrator. Ultimus Fund Distributors, LLC (the “Distributor”) acts as the principal distributor of each Fund’s shares. The Distributor is a wholly-owned subsidiary of the Administrator. The Distributor is compensated by the Adviser (not the Funds) for acting as principal underwriter.
The Funds have adopted a Distribution Plan (the “12b-1 Plan”) pursuant to Rule 12b-1 of the 1940 Act. The 12b-1 Plan provides that the Funds will pay the Distributor and/or any registered securities dealer, financial institution or any other person (the “Recipient”) a fee of 0.25% of the average daily net assets of each Fund’s Investor Shares and A Shares and
87
| FullerThaler Funds |
| Notes to the Financial Statements (continued) |
| March 31, 2024 - (Unaudited) |
1.00% of the average daily net assets of each Fund’s C Shares in connection with the promotion and distribution of each Fund’s Investor Shares, A Shares and C Shares or the provision of personal services to shareholders, including, but not necessarily limited to, advertising, compensation to underwriters, dealers and selling personnel, the printing and mailing of prospectuses to other than current shareholders, the printing and mailing of sales literature and servicing shareholder accounts (“12b-1 Expenses”). Under the 12b-1 Plan, the 1.00% C Share 12b-1 fee includes a 0.25% service fee. Over time, 12b-1 fees will increase the cost of your investment in a Fund’s Investor, A, and C Shares and may cost you more than paying other types of sales charges because these fees are paid out of the Fund’s Investor, A, and C Shares on an on-going basis. For the six months ended March 31, 2024, 12b-1 expenses incurred by the Funds were as follows:
| Small-Mid | ||||||||||||||||||||
| Small-Cap | Small-Cap | Mid-Cap | Unconstrained | Core Equity | ||||||||||||||||
| Distribution Fees | Equity Fund | Growth Fund | Value Fund | Equity Fund | Fund | |||||||||||||||
| Investor Shares | $ | 544,627 | $ | 25,777 | $ | 10,844 | $ | — | $ | — | ||||||||||
| A Shares | 16,159 | 3,388 | 2,513 | 87 | 1,111 | |||||||||||||||
| C Shares | 69,594 | 33,787 | 2,821 | 164 | — | |||||||||||||||
| Payable for 12b-1 fees | 88,058 | 23,665 | 2,499 | 61 | 115 | |||||||||||||||
During the six months ended March 31, 2024, the Distributor retained the following amounts in sales commissions from the sales of A Shares of the Funds:
| Small-Cap Equity Fund | $ | 1,354 | ||
| Small-Cap Growth Fund | 6,473 | |||
| Mid-Cap Value Fund | 1,238 | |||
| Unconstrained Equity Fund | 14 | |||
| Small-Mid Core Equity Fund | 424 |
During the six months ended March 31, 2024, the Distributor received the following amounts in contingent deferred sales charges related to redemptions of C Shares of the Funds:
| Small-Cap Equity Fund | $ | 9,217 | ||
| Small-Cap Growth Fund | 66,996 | |||
| Mid-Cap Value Fund | 5,225 | |||
| Unconstrained Equity Fund | 12 |
The Funds have adopted an Administrative Services Plan (the “Plan”) for Institutional Shares, Investor Shares, and A Shares of the Funds. The Plan allows the Funds to pay financial intermediaries that provide services relating to Institutional Shares, Investor Shares, and A Shares. The Plan permits payments for the provision of certain administrative, recordkeeping and other non-distribution related services to Institutional Share, Investor Share and A Share shareholders. The Plan permits the Funds to make service fee payments at an annual rate of up to 0.25% of each Fund’s average daily net assets attributable to
88
| FullerThaler Funds |
| Notes to the Financial Statements (continued) |
| March 31, 2024 - (Unaudited) |
its A Shares and up to 0.20% of each Fund’s average daily net assets attributable to its Institutional Shares or Investor Shares. Effective March 7, 2023, Institutional Shares, Investor Shares and A Shares include an allocation of up to 0.03% of service fees payable to the Adviser for certain non-distribution related shareholder services that it provides pursuant to the Plan. Because these fees are paid respectively out of the assets of each Fund’s Institutional Shares, Investor Shares and A Shares on an ongoing basis, over time they will increase the cost of an investment in Institutional Shares, Investor Shares and A Shares.
NOTE 5. PURCHASES AND SALES OF SECURITIES
For the six months ended March 31, 2024, purchases and sales of investment securities, other than short-term investments and in-kind transactions, were as follows:
| Purchases | Sales | |||||||
| Small-Cap Equity Fund | $ | 2,519,983,115 | $ | 1,703,851,805 | ||||
| Small-Cap Growth Fund | 826,316,168 | 245,845,258 | ||||||
| Mid-Cap Value Fund | 106,214,718 | 78,526,624 | ||||||
| Unconstrained Equity Fund | 15,464,428 | 4,994,898 | ||||||
| Small-Mid Core Equity Fund | 34,271,479 | 9,402,193 | ||||||
| Micro-Cap Equity Fund | 10,179,724 | 8,022,120 | ||||||
| Mid-Cap Equity Fund | 12,363,836 | 802,092 | ||||||
There were no purchases or sales of long-term U.S. government obligations during the six months ended March 31, 2024.
For the six months ended March 31, 2024, in-kind purchases and sales transactions were as follows:
| In-Kind Purchases | In-Kind Sales | |||||||
| Small-Cap Equity Fund | $ | — | $ | 62,097,021 | ||||
| Small-Cap Growth Fund | — | 28,829,592 | ||||||
| Mid-Cap Value Fund | — | 98,488,129 | ||||||
| Unconstrained Equity Fund | — | 7,231,946 | ||||||
| Small-Mid Core Equity Fund | — | 8,982,174 | ||||||
| Micro-Cap Equity Fund | — | 1,122,341 | ||||||
| Mid-Cap Equity Fund | — | 651,812 | ||||||
89
| FullerThaler Funds |
| Notes to the Financial Statements (continued) |
| March 31, 2024 - (Unaudited) |
NOTE 6. FEDERAL TAX INFORMATION
At March 31, 2024, the net unrealized appreciation (depreciation) and tax cost of investments for tax purposes were as follows:
| Small-Cap | Small-Cap | Mid-Cap Value | Unconstrained | |||||||||||||
| Equity Fund | Growth Fund | Fund | Equity Fund | |||||||||||||
| Gross unrealized appreciation | $ | 2,799,554,254 | $ | 207,530,356 | $ | 54,360,866 | $ | 14,627,411 | ||||||||
| Gross unrealized depreciation | (21,076,213 | ) | (13,839,555 | ) | (11,778,463 | ) | (481,528 | ) | ||||||||
| Net unrealized appreciation/(depreciation) on investments | $ | 2,778,478,041 | $ | 193,690,801 | $ | 42,582,403 | $ | 14,145,883 | ||||||||
| Tax cost of investments | $ | 6,406,233,178 | $ | 855,689,327 | $ | 373,824,765 | $ | 51,818,674 | ||||||||
| Small-Mid | ||||||||||||||||
| Core Equity | Micro-Cap | Mid-Cap | ||||||||||||||
| Fund | Equity Fund | Equity Fund | ||||||||||||||
| Gross unrealized appreciation | $ | 8,344,001 | $ | 4,557,865 | $ | 2,110,665 | ||||||||||
| Gross unrealized depreciation | (397,160 | ) | (1,080,311 | ) | (32,807 | ) | ||||||||||
| Net unrealized appreciation/(depreciation) on investments | $ | 7,946,841 | $ | 3,477,554 | $ | 2,077,858 | ||||||||||
| Tax cost of investments | $ | 57,353,945 | $ | 16,834,568 | $ | 11,069,853 | ||||||||||
The tax character of distributions paid for the fiscal year ended September 30, 2023, the Funds’ most recent fiscal year end, were as follows:
| Small-Mid | ||||||||||||
| Small-Cap | Mid-Cap Value | Core Equity | ||||||||||
| Equity Fund | Fund | Fund | ||||||||||
| Distributions paid from: | ||||||||||||
| Ordinary income(a) | $ | 41,223,576 | $ | 6,968,397 | $ | 71,843 | ||||||
| Long-term capital gains | 27,691,157 | 2,131,070 | — | |||||||||
| Total distributions paid | $ | 68,914,733 | $ | 9,099,467 | $ | 71,843 | ||||||
| (a) | Short-term capital gain distributions are treated as ordinary income for tax purposes. |
90
| FullerThaler Funds |
| Notes to the Financial Statements (continued) |
| March 31, 2024 - (Unaudited) |
At September 30, 2023, the components of accumulated earnings (deficit) on a tax basis were as follows:
| Small-Cap | Small-Cap | Mid-Cap Value | Unconstrained | Small-Mid Core | Micro-Cap | |||||||||||||||||||
| Equity Fund | Growth Fund | Fund | Equity Fund | Equity Fund | Equity Fund | |||||||||||||||||||
| Undistributed Ordinary Income | $ | 62,420,810 | $ | — | $ | 4,521,223 | $ | 126,192 | $ | 291,509 | $ | — | ||||||||||||
| Undistributed Long-Term Capital Gains | 31,479,570 | — | — | — | — | — | ||||||||||||||||||
| Accumulated Capital and Other Losses | — | (30,841,409 | ) | (4,662,790 | ) | (4,133,775 | ) | (156,779 | ) | (4,009,529 | ) | |||||||||||||
| Unrealized Appreciation (Depreciation) on Investments(a) | 1,198,155,084 | 38,442,689 | (28,643,460 | ) | (254,329 | ) | (2,760,892 | ) | 1,852,010 | |||||||||||||||
| Total Accumulated Earnings (Deficits) | $ | 1,292,055,464 | $ | 7,601,280 | $ | (28,785,027 | ) | $ | (4,261,912 | ) | $ | (2,626,162 | ) | $ | (2,157,519 | ) | ||||||||
| (a) | The difference between book basis and tax basis unrealized appreciation (depreciation) is primarily attributable to the tax deferral of wash losses and return of capital adjustments. |
As of September 30, 2023 the Small-Cap Growth Fund, Unconstrained Equity Fund, Small-Mid Core Equity Fund and Micro-Cap Equity Fund had short-term and long-term net capital loss carryforwards which are available to offset future net capital gains of $29,707,194, $257,748, $2,399,826, $1,733,949, $156,779, $0, $3,022,984 and $986,545, respectively.
Certain qualified losses incurred after October 31, and within the current taxable year, are deemed to arise on the first business day of the Funds following taxable year. For the tax year ended September 30, 2023, the Mid-Cap Value Fund deferred post October qualified losses in the amount of $4,662,790.
Under current tax law, net investment losses after December 31 and capital losses realized after October 31 of the Funds fiscal year may be deferred and treated as occurring on the first business day of the following fiscal year for tax purposes. For the tax year ended September 30, 2023, the Small-Cap Growth Fund had Qualified Late Year Ordinary Losses in the amount of $876,467.
91
| FullerThaler Funds |
| Notes to the Financial Statements (continued) |
| March 31, 2024 - (Unaudited) |
NOTE 7. SECTOR RISK
If a Fund has significant investments in the securities of issuers within a particular sector, any development affecting that sector will have a greater impact on the value of the net assets of the Fund than would be the case if the Fund did not have significant investments in that sector. In addition, this may increase the risk of loss in the Fund and increase the volatility of the Fund’s NAV per share. For instance, economic or market factors, regulatory changes or other developments may negatively impact all companies in a particular sector, and therefore the value of the Fund’s portfolio will be adversely affected. As of March 31, 2024, the Small-Cap Equity Fund had 28.62% of the value of its net assets invested in securities within the Industrials sector, the Small-Cap Growth Fund had 37.40% within the Technology sector and the Mid-Cap Value Fund had 25.33% within the Financials sector.
NOTE 8. COMMITMENTS AND CONTINGENCIES
The Trust indemnifies its officers and Trustees for certain liabilities that may arise from their performance of their duties to the Trust or the Funds. Additionally, in the normal course of business, the Trust enters into contracts that contain a variety of representations and warranties which provide general indemnifications. The Trust’s maximum exposure under these arrangements is unknown, as this would involve future claims that may be made against the Trust that have not yet occurred.
NOTE 9. REFLOW LIQUIDITY PROGRAM
The Funds may participate in the ReFlow Fund, LLC (“ReFlow”) liquidity program, which is designed to provide an alternative liquidity source for mutual funds experiencing redemptions of their shares. In order to pay cash to shareholders who redeem their shares on a given day, a mutual fund typically must hold cash in its portfolio, liquidate portfolio securities, or borrow money, all of which impose certain costs on a fund. ReFlow provides participating mutual funds with another source of cash by standing ready to purchase shares from a fund equal to the amount of each fund’s net redemptions on a given day. ReFlow will purchase shares of a Fund at net asset value and will not be subject to any investment minimum applicable to such shares. ReFlow is prohibited from acquiring more than 3% of the outstanding voting securities of each Fund. ReFlow will periodically redeem its entire share position in a Fund. For use of the ReFlow service, each Fund will pay a fee to ReFlow at a rate determined by a daily auction with other participating mutual funds.
92
| FullerThaler Funds |
| Notes to the Financial Statements (continued) |
| March 31, 2024 - (Unaudited) |
During the six months ended March 31, 2024, the following Funds utilized ReFlow:
| ReFlow Purchased Shares | Reflow Amount | ReFlow Service Fees | ||||||||||
| Small-Cap Equity Fund | 2,401,507 | $ | 91,696,247 | $ | 116,840 | |||||||
| Small-Cap Growth Fund | 1,153,575 | 41,434,774 | 39,761 | |||||||||
| Mid-Cap Value Fund | 2,305,201 | 64,863,770 | 89,620 | |||||||||
| Unconstrained Equity Fund | 155,060 | 6,628,421 | 10,383 | |||||||||
| Small-Mid Core Equity Fund | 271,663 | 8,694,366 | 18,781 | |||||||||
| Micro-Cap Equity Fund | 73,176 | 1,801,881 | 1,715 | |||||||||
| Mid-Cap Equity Fund | 663,783 | 28,434 | 929 | |||||||||
NOTE 10. SUBSEQUENT EVENTS
Management of the Funds has evaluated the need for disclosures and/or adjustments resulting from subsequent events through the date at which these financial statements were issued. Based upon this evaluation, management has determined there were no items requiring adjustment of the financial statements or additional disclosure.
93
| Liquidity Risk Management Program (Unaudited) |
The Trust has adopted and implemented a written liquidity risk management program (the “Program”) as required by Rule 22e-4 (the “Liquidity Rule”) under the 1940 Act. The Program applies to each individual series of the Trust. The Program is reasonably designed to assess and manage the Fund’s liquidity risk, taking into consideration, among other factors, the Fund’s investment strategy and the liquidity of its portfolio investments during normal and reasonably foreseeable stressed conditions; its short and long-term cash flow projections; and its cash holdings and access to other funding sources. The Board approved the appointment of the Liquidity Administrator Committee, comprising certain Trust officers and employees of the Adviser. The Liquidity Administrator Committee maintains Program oversight and reports to the Board on at least an annual basis regarding the Program’s operational effectiveness through a written report (the “Report”). The Report outlined the operation of the Program and the adequacy and effectiveness of the Program’s implementation and was presented to the Board for consideration at its meeting held on December 7 and 8, 2023. During the review period, the Fund did not experience unusual stress or disruption to its operations related to purchase and redemption activity. Also, during the review period the Fund held adequate levels of cash and highly liquid investments to meet shareholder redemption activities in accordance with applicable requirements. The Report concluded that the Program is reasonably designed to prevent violation of the Liquidity Rule and has been effectively implemented.
94
| Summary of Fund Expenses (Unaudited) |
As a shareholder of a Fund, you incur two types of costs: (1) transaction costs and (2) ongoing costs, including management fees, distribution (12b-1) fees and other Fund expenses. These examples are intended to help you understand your ongoing costs (in dollars) of investing in each Fund and to compare these costs with the ongoing costs of investing in other funds. Each Fund’s example is based on an investment of $1,000 invested at the beginning of the period and held for the entire period from October 1, 2023 through March 31, 2024.
Actual Expenses
The first line of the table for each Fund class provides information about actual account values and actual expenses. You may use the information in these lines, together with the amount you invested, to estimate the expenses that you paid over the period. Simply divide your account value by $1,000 (for example, an $8,600 account value divided by $1,000 = 8.6), then multiply the result by the number in the first line under the heading “Expenses Paid During Period” to estimate the expenses you paid on your account during this period.
Hypothetical Example for Comparison Purposes
The second line of the table below for each class provides information about hypothetical account values and hypothetical expenses based on each Fund’s actual expense ratios and an assumed rate of return of 5% per year before expenses, which is not the Fund’s actual return. The hypothetical account values and expenses may not be used to estimate the actual ending account balances or expenses you paid for the period. You may use this information to compare the ongoing costs of investing in the Funds and other funds. To do so, compare this 5% hypothetical example with the 5% hypothetical examples that appear in the shareholder reports of other funds.
Expenses shown in the table are meant to highlight your ongoing costs only and do not reflect any transactional costs. Therefore, the second line of the table for each class is useful in comparing ongoing costs only and will not help you determine the relative total costs of owning different funds. In addition, if transaction costs were included, your costs would have been higher.
| Beginning | Ending | ||||||||||
| Account | Account | Expenses | |||||||||
| Value | Value | Paid | Annualized | ||||||||
| October 1, | March 31, | During | Expense | ||||||||
| 2023 | 2024 | Period(a) | Ratio | ||||||||
| Small-Cap Equity Fund | |||||||||||
| R6 Shares | Actual | $1,000.00 | $1,279.50 | $ | 3.61 | 0.63% | |||||
| Hypothetical(b) | $1,000.00 | $1,021.84 | $ | 3.20 | 0.63% | ||||||
| Institutional Shares | Actual | $1,000.00 | $1,279.00 | $ | 4.32 | 0.76% | |||||
| Hypothetical(b) | $1,000.00 | $1,021.21 | $ | 3.83 | 0.76% | ||||||
| Investor Shares | Actual | $1,000.00 | $1,277.10 | $ | 6.03 | 1.06% | |||||
| Hypothetical(b) | $1,000.00 | $1,019.71 | $ | 5.34 | 1.06% | ||||||
| A Shares | Actual | $1,000.00 | $1,276.90 | $ | 6.00 | 1.05% | |||||
| Hypothetical(b) | $1,000.00 | $1,019.73 | $ | 5.32 | 1.05% | ||||||
| C Shares | Actual | $1,000.00 | $1,273.30 | $ | 9.28 | 1.63% | |||||
| Hypothetical(b) | $1,000.00 | $1,016.84 | $ | 8.23 | 1.63% | ||||||
95
| Summary of Fund Expenses (Unaudited) (continued) |
| Beginning | Ending | ||||||||||
| Account | Account | Expenses | |||||||||
| Value | Value | Paid | Annualized | ||||||||
| October 1, | March 31, | During | Expense | ||||||||
| 2023 | 2024 | Period(a) | Ratio | ||||||||
| Small-Cap Growth Fund | |||||||||||
| R6 Shares | Actual | $1,000.00 | $1,356.70 | $ | 5.07 | 0.86% | |||||
| Hypothetical(b) | $1,000.00 | $1,020.70 | $ | 4.34 | 0.86% | ||||||
| Institutional Shares | Actual | $1,000.00 | $1,356.20 | $ | 5.65 | 0.96% | |||||
| Hypothetical(b) | $1,000.00 | $1,020.20 | $ | 4.85 | 0.96% | ||||||
| Investor Shares | Actual | $1,000.00 | $1,354.20 | $ | 7.36 | 1.25% | |||||
| Hypothetical(b) | $1,000.00 | $1,018.75 | $ | 6.31 | 1.25% | ||||||
| A Shares | Actual | $1,000.00 | $1,354.00 | $ | 7.65 | 1.30% | |||||
| Hypothetical(b) | $1,000.00 | $1,018.50 | $ | 6.56 | 1.30% | ||||||
| C Shares | Actual | $1,000.00 | $1,350.50 | $ | 10.58 | 1.80% | |||||
| Hypothetical(b) | $1,000.00 | $1,016.00 | $ | 9.07 | 1.80% | ||||||
| Mid-Cap Value Fund | |||||||||||
| R6 Shares | Actual | $1,000.00 | $1,231.10 | $ | 4.07 | 0.73% | |||||
| Hypothetical(b) | $1,000.00 | $1,021.35 | $ | 3.69 | 0.73% | ||||||
| Institutional Shares | Actual | $1,000.00 | $1,230.50 | $ | 4.61 | 0.83% | |||||
| Hypothetical(b) | $1,000.00 | $1,020.87 | $ | 4.17 | 0.83% | ||||||
| Investor Shares | Actual | $1,000.00 | $1,228.70 | $ | 6.41 | 1.15% | |||||
| Hypothetical(b) | $1,000.00 | $1,019.25 | $ | 5.81 | 1.15% | ||||||
| A Shares | Actual | $1,000.00 | $1,228.40 | $ | 6.69 | 1.20% | |||||
| Hypothetical(b) | $1,000.00 | $1,019.00 | $ | 6.06 | 1.20% | ||||||
| C Shares | Actual | $1,000.00 | $1,225.10 | $ | 9.46 | 1.70% | |||||
| Hypothetical(b) | $1,000.00 | $1,016.50 | $ | 8.57 | 1.70% | ||||||
| Unconstrained Equity Fund | |||||||||||
| R6 Shares | Actual | $1,000.00 | $1,312.70 | $ | 5.03 | 0.87% | |||||
| Hypothetical(b) | $1,000.00 | $1,020.65 | $ | 4.39 | 0.87% | ||||||
| Institutional Shares | Actual | $1,000.00 | $1,312.90 | $ | 5.61 | 0.97% | |||||
| Hypothetical(b) | $1,000.00 | $1,020.15 | $ | 4.90 | 0.97% | ||||||
| A Shares | Actual | $1,000.00 | $1,312.90 | $ | 7.52 | 1.30% | |||||
| Hypothetical(b) | $1,000.00 | $1,018.50 | $ | 6.56 | 1.30% | ||||||
| C Shares | Actual | $1,000.00 | $1,313.70 | $ | 10.41 | 1.80% | |||||
| Hypothetical(b) | $1,000.00 | $1,016.00 | $ | 9.07 | 1.80% | ||||||
| Small-Mid Core Equity Fund | |||||||||||
| Institutional Shares | Actual | $1,000.00 | $1,204.90 | $ | 4.99 | 0.91% | |||||
| Hypothetical(b) | $1,000.00 | $1,020.47 | $ | 4.58 | 0.91% | ||||||
| A Shares | Actual | $1,000.00 | $1,202.60 | $ | 6.92 | 1.26% | |||||
| Hypothetical(b) | $1,000.00 | $1,018.72 | $ | 6.34 | 1.26% | ||||||
96
| Summary of Fund Expenses (Unaudited) (continued) |
| Beginning | Ending | ||||||||||
| Account | Account | Expenses | |||||||||
| Value | Value | Paid | Annualized | ||||||||
| October 1, | March 31, | During | Expense | ||||||||
| 2023 | 2024 | Period(a) | Ratio | ||||||||
| Micro-Cap Equity Fund | |||||||||||
| Institutional Shares | Actual | $1,000.00 | $1,077.80 | $ | 7.06 | 1.36% | |||||
| Hypothetical(b) | $1,000.00 | $1,018.20 | $ | 6.86 | 1.36% | ||||||
| Mid-Cap Equity Fund | |||||||||||
| Institutional Shares | Actual(c) | $1,000.00 | $1,243.70 | $ | 4.66 | 0.84% | |||||
| Hypothetical(b) | $1,000.00 | $1,020.78 | $ | 4.25 | 0.84% | ||||||
| (a) | Expenses are equal to the Fund’s annualized expense ratios, multiplied by the average account value over the period, multiplied by 183/366 (to reflect the one-half year period). |
| (b) | Hypothetical assumes 5% annual return before expenses. |
| (c) | Actual expenses are equal to the Institutional annualized expense ratios, multiplied by the average account value over the period, multiplied by 181/366 (to reflect the period since commencement of operations on October 2, 2023). The annualized expense ratios reflect reimbursement of expenses by the Funds’ investment adviser for the period beginning October 2, 2023 through March 31, 2024. The “Financial Highlights” tables in the Funds’ financial statements, included in the report, also show the gross expense ratios, without such reimbursements. Hypothetical expenses are equal to the Funds’ annualized expense ratios, multiplied by the average account value over the period, multiplied by 183/366 (to reflect the one-half year period). |
97
| Investment Advisory Agreement Approval (Unaudited) |
At a quarterly meeting of the Board of Trustees of Capitol Series Trust (“Trust”) conducted on December 7 and 8, 2023 (the “Meeting”), the Trust’s Board of Trustees (the “Board”), including all of the Trustees who are not “interested persons” of the Trust (the “Independent Trustees”), as that term is defined in Section 2(a)(19) of the Investment Company Act of 1940, as amended (the “1940 Act”), considered and approved the continuation of the Investment Advisory Agreement (the “Current Investment Advisory Agreement”) between the Trust and Fuller & Thaler Asset Management, Inc. (“FullerThaler” or the “Adviser”) as it relates to the FullerThaler Behavioral Small-Cap Equity Fund (the “Small-Cap Equity Fund”), the Fuller Thaler Behavioral Small-Cap Growth Fund (the “Small-Cap Growth Fund”), the FullerThaler Behavioral Mid-Cap Value Fund (the “Mid-Cap Value Fund”), the FullerThaler Behavioral Unconstrained Equity Fund (the “Unconstrained Equity Fund”), the FullerThaler Behavioral Small-Mid Core Equity Fund (the “Small-Mid Core Equity Fund”), the FullerThaler Behavioral Micro-Cap Equity Fund (the “Micro-Cap Fund”, and collectively referred to herein as the “Funds” or the “FullerThaler Funds”). It was noted that the FullerThaler Behavioral Mid-Cap Equity Fund’s Investment Advisory Agreement between the Adviser and the Trust was initially considered and approved for a two-year term at a meeting of the Board of Trustees held on December 7 and 8, 2022, and therefore, was not subject to renewal. (For the purposes herein, the references to “FullerThaler Funds” with regard to the continuation of the Investment Advisory Agreement with FullerThaler excludes the FullerThaler Behavioral Mid-Cap Equity Fund.)
Prior to the Meeting, the Trustees received and considered information from FullerThaler and the Trust’s administrator designed to provide the Trustees with the information necessary to evaluate the terms of the Investment Advisory Agreement between the Trust and FullerThaler as it relates to each FullerThaler Fund. The Trustees also received and considered information including, but not limited to, FullerThaler’s combined responses to counsel’s due diligence letter and FullerThaler’s supplemental responses to counsel’s supplemental requests (the “Support Materials”). Counsel’s due diligence letter and supplemental requests each requested information relevant to the renewal of the Investment Advisory Agreement as it relates to each of the FullerThaler Funds. The Trustees also received and considered information concerning an Expense Limitation Agreement to become effective January 29, 2024, whereby FullerThaler has contractually committed to reduce its management fees and, if necessary, reimburse each FullerThaler Fund’s operating expenses through January 31, 2025, as specified in the Expense Limitation Agreement, which included proposed lower expense limits for certain class of certain Funds, as detailed in the Support Materials. It was also noted that in addition to the Support Materials, the Adviser had provided confidential documentation regarding FullerThaler’s financials and overall profitability to the Trustees. The Trustees also received and considered as part of the Support Materials benchmark performance comparison data and Morningstar peer group category and custom peer group expense and performance data previously compiled by Broadridge for comparative purposes relative to each FullerThaler Fund. In this regard, the Trustees noted discussions with representatives of the Adviser regarding its dissatisfaction with the construction of certain peer groups of the FullerThaler Funds by Broadridge. The Trustees also noted that the Adviser took advantage of the opportunity to review and discuss the peer group construction directly with Broadridge prior to its presentation to the Board.
The Trustees reviewed the Support Materials at various times with FullerThaler, Trust management, and counsel to the Independent Trustees. Representatives of FullerThaler met with the Trustees and provided additional relevant information, including but not limited to information relating to: the services FullerThaler currently provides to the FullerThaler Funds; FullerThaler’s investment
98
| Investment Advisory Agreement Approval (Unaudited) (continued) |
philosophy; FullerThaler’s distribution and marketing efforts on behalf of the FullerThaler Funds; the Adviser’s ownership structure and future plans with regard to its ownership structure; the Adviser’s financial statements, including information related to its profitability and balance sheets; historical and projected profitability of the FullerThaler Funds, including FullerThaler’s overhead allocation methodology; resources available to service the FullerThaler Funds, including compliance resources; other benefits that FullerThaler derives from its relationship with the FullerThaler Funds; and FullerThaler’s disaster recovery plan. In its considerations, the Board noted the completeness of the Support Materials that FullerThaler had provided, as well as the discussions that had occurred with representatives of FullerThaler at various times, including during the Meeting. This information, together with the information provided to and reviewed by the Board throughout the course of the year and since the inception of each of the FullerThaler Funds, formed the primary, but not exclusive, basis for the Board’s determinations.
Before voting to renew the Investment Advisory Agreement, the Trustees reviewed the terms of the Investment Advisory Agreement as it relates to each FullerThaler Fund and the Support Materials with Trust management and with counsel to the Independent Trustees. The Trustees received and discussed a memorandum from such counsel delineating the legal standards governing their consideration of the approval of the Investment Advisory Agreement and describing each Trustee’s duty of care and duty of loyalty obligations to shareholders application and the section application of fiduciary duty standards imposed by Section 36(b) of the 1940 Act, which memorandum described the various factors that the U.S. Securities and Exchange Commission (“SEC”) and U.S. Courts over the years have suggested would be appropriate for trustee consideration, including the factors outlined in Gartenberg v. Merrill Lynch Asset Management Inc., 694 F.2d 923, 928 (2d Cir. 1982); cert. denied sub. nom. and Andre v. Merrill Lynch Ready Assets Trust, Inc., 461 U.S. 906 (1983).
In determining whether to renew the Investment Advisory Agreement with respect to each of the FullerThaler Funds, the Trustees considered all factors they believed relevant, including the following: (1) the nature, extent, and quality of the services provided by FullerThaler with respect to the FullerThaler Funds; (2) the cost of the services provided and the profits realized by FullerThaler from services rendered to the Trust with respect to the FullerThaler Funds, both individually and collectively; (3) comparative fee and expense data for each of the FullerThaler Funds and other investment companies with similar investment objectives; (4) the extent to which economies of scale may be realized as each Fund grows, and whether the advisory fees for each Fund reflects such economies of scale for each Fund’s benefit; and (5) other financial benefits to FullerThaler resulting from services that it renders to the FullerThaler Funds. In their deliberations, the Trustees did not identify any particular information that was all-important or controlling.
After having received and reviewed the Support Materials, as well as quarterly investment performance, compliance, operating, and distribution reports from FullerThaler for the FullerThaler Funds since each Fund’s inception, the Trustees determined that they had all of the information they deemed reasonably necessary to make an informed decision about the renewal of the Investment Advisory Agreement. The Trustees discussed the facts and factors relevant to their consideration and approval of the Investment Advisory Agreement as it relates to each FullerThaler Fund, which incorporated and reflected their knowledge of FullerThaler’s ongoing services to the FullerThaler Funds. The Trustees noted the inclusion of fee and performance comparisons of each FullerThaler Fund to such Fund’s respective Morningstar peer group category (the “Morningstar Category”),
99
| Investment Advisory Agreement Approval (Unaudited) (continued) |
as well as a custom peer group comparison created by Broadridge (“Peer Group”). Taking such information into account, including the Trustees’ discussions with representatives of FullerThaler at the Meeting as well as the Board’s review of the Support Materials provided in connection with the approval of the renewal of the Investment Advisory Agreement, the Board concluded that the overall arrangements between the Trust and FullerThaler with respect to each FullerThaler Fund, as set forth in the Investment Advisory Agreement, are fair and reasonable in light of the services FullerThaler performs, the investment advisory fees that each FullerThaler Fund pays, and such other matters as the Trustees considered relevant in the exercise of their reasonable judgment. The material factors and conclusions that formed the basis of the Trustees’ determination to approve the continuation of the Investment Advisory Agreement for an additional one-year term are summarized below.
Nature, Extent and Quality of Services Provided. The Trustees considered the scope of services that FullerThaler provides under the Investment Advisory Agreement, noting that such services include but are not limited to the following: (1) investing each Fund’s assets consistent with the Fund’s investment objective and investment policies; (2) determining the portfolio securities to be purchased, sold or otherwise disposed of and the timing of such transactions; (3) voting all proxies with respect to each Fund’s portfolio securities; (4) maintaining the required books and records for transactions that FullerThaler affects on behalf of each Fund; and (5) selecting broker-dealers to execute orders on behalf of each Fund. The Trustees noted no changes to the services that FullerThaler currently provides to the FullerThaler Funds under the terms of the Investment Advisory Agreement. The Trustees considered FullerThaler’s capitalization and its assets under management. The Trustees further considered the investment philosophy and experience of each Fund’s portfolio management team, including the firm’s expertise in behavioral finance and proprietary behavioral finance model which is a key component of each Fund’s investment strategy. In addition, the Trustees noted the compliance services, marketing, distribution, and client relationship services that FullerThaler provides on behalf of the Funds. The Trustees compared the FullerThaler Funds’ performance to each Fund’s benchmark index, Morningstar Category, and Peer Group. The Trustees discussed the filters applied by Broadridge for each Fund’s custom Peer Group, noting that generally each Fund’s Peer Group was a sub-set of its Morningstar Category filtered for actively managed, institutional, single funds with no 12b-1 fees. The Trustees also noted that the Peer Group for each Fund had additional filters applied, such as portfolio concentration or net assets, as applicable. It was further noted that peer funds with “value” in the name had been removed from the Peer Groups created for the Small-Cap Equity Fund and the Small-Mid Core Equity Fund, at the Adviser’s request. In addition, the Trustees noted FullerThaler’s disagreement with Broadridge regarding the construction of certain Peer Groups. It was noted that while the Board reviewed Morningstar peer group and benchmark performance data compared to all of the applicable share classes offered by each respective Fund, the comparison of each Fund’s Institutional Class Shares to the Fund’s respective benchmark index, Morningstar Category and Peer Group is discussed herein for consistency of presentation and because the Institutional Share Class represents the largest share class and has the longest performance history for each Fund. The Trustees considered that, for the periods indicated:
| ● | The Small-Cap Equity Fund outperformed its benchmark index, the Russell 2000 TR Index, for the one-, three-, five-, and ten-year and since inception (9/8/2011) periods ended September 30, 2023. The Small-Cap Equity Fund also outperformed the median performance of its Morningstar Category, Small Blend, as well as the median performance of its Peer Group, for |
100
| Investment Advisory Agreement Approval (Unaudited) (continued) |
the one-, three- and five-year and since inception periods ended September 30, 2023.
| ● | The Small-Cap Growth Fund outperformed its benchmark index, the Russell 2000 Growth TR Index, for the one-, three- and five-year and since-inception (12/21/2017) periods ended September 30, 2023. The Small-Cap Growth Fund outperformed the Morningstar Category median, Small Growth, and the Peer Group median for the one-year, three-year, five-year, and since inception periods ended September 30, 2023. |
| ● | The Mid-Cap Value Fund trailed its benchmark index, the Russell Mid-Cap Value TR Index for the one-year period ended September 30, 2023 and outperformed the benchmark index for the three-year, five-year and since inception (12/21/2017) periods ended September 30, 2023. The Mid-Cap Value Fund trailed the Morningstar Category and Peer Group median for the one-year period ended September 30, 2023, and outperformed the Morningstar Category median and Peer Group median for the three-year, five-year and since inception (12/21/2017) periods ended September 30, 2023. |
| ● | The Unconstrained Equity Fund outperformed its benchmark index, the Russell 3000 TR Index, for the one-period ended September 30, 2023, and trailed the benchmark index for the three-year and since-inception (12/26/2018) periods ended September 30, 2023. The Unconstrained Equity Fund outperformed its Morningstar Category median, the Mid-Cap Blend, for the one-year and since inception (12/26/2018) periods and trailed the Category median for the three-year period ended September 30, 2023. The Unconstrained Equity Fund outperformed the Peer Group median for the one- and three-year, and since inception periods ended September 30, 2023. |
| ● | The Micro-Cap Equity Fund outperformed its benchmark index, the Russell Micro Cap TR Index, for the one- and three-year and since inception (12/28/2018) periods ended September 30, 2023. The Micro-Cap Equity Fund trailed the performance of the median of its Morningstar Category, Small Blend, for the one-year and since inception periods, and outperformed the Category median for the three-year period ended September 30, 2023. The Micro-Cap Equity Fund trailed its Peer Group median for the one- and three-year and since inception periods ended September 30, 2023. |
| ● | The Small-Mid Core Equity Fund outperformed its benchmark index, the Russell 2500 TR Index, for the one-year, three-year, and since inception (12/26/2018) periods ended September 30, 2023. The Small-Mid Core Equity Fund outperformed the median of both its Morningstar Category, Mid-Cap Blend, and Peer Group for the one- and three-year and since inception periods ended September 30, 2023. |
Finally, the Trustees took notice of the growth of assets in the FullerThaler Funds and the growth of the firm overall. Taking these factors into account, the Trustees concluded that they are satisfied with the nature, extent, and quality of services that FullerThaler currently provides to the FullerThaler Funds under the Investment Advisory Agreement.
Cost of Advisory Services and Profitability. The Trustees considered the annual management fee that each FullerThaler Fund pays to FullerThaler under the Investment Advisory Agreement. The Trustees also considered FullerThaler’s profitability from the services rendered to the FullerThaler Funds. The Trustees further considered FullerThaler’s commitment to contractually reduce its
101
| Investment Advisory Agreement Approval (Unaudited) (continued) |
management fees and, if necessary, reimburse each FullerThaler Fund’s operating expenses through January 31, 2025, as specified in the Expense Limitation Agreement - Appendix A presented in the Support Materials. Lastly, the Trustees noted that FullerThaler subsidizes the costs of distribution services rendered to the FullerThaler Funds in excess of amounts accrued and payable pursuant to the Funds’ Rule 12b-1 Distribution Plan.
Comparative Fee and Expense Data. The Trustees noted that:
| ● | The Small-Cap Equity Fund’s contractual management fee of 0.60% was lower than the average and median of both its Morningstar Category and Peer Group. Further, the Small-Cap Equity Fund’s net and gross total expense ratios of 0.74% for its Institutional Class Shares (which are the same because this Fund’s annualized operating expense ratio is lower than the expense ratio cap in its operating expense limitation agreement) was lower than the average and median of the net and gross total expense ratios for its Morningstar Category and Peer Group. |
| ● | The Small-Cap Growth Fund’s contractual management fee of 0.85% was higher than average and median of the Morningstar Category, equal to the median of the Peer Group, and slightly less than the average of the Peer Group. Further, the Small-Cap Growth Fund’s net total expense ratio of 0.98% for its Institutional Class Shares was slightly higher than median and equaled the average of its Morningstar Category, and lower than the median and average of the Peer Group. The Small-Cap Growth Fund’s gross total expense ratio of 1.13% for its Institutional Class was higher than the median and lower than the average of its Morningstar Category, and lower than the median and average of the Peer Group. The Board noted that shareholders were currently only impacted by the net expense ratio due to the Adviser’s commitment to its expense limitation agreement. The Board also noted that the Small-Cap Growth Fund’s net assets were, in general, lower than many of the funds to which it was compared in its Morningstar Category and were also higher than the median and lower than the average net assets of the Peer Group. |
| ● | The Mid-Cap Value Fund’s contractual management fee of 0.75% was higher than the median and average of its Morningstar Category, equal to the median of the Peer Group and higher than the average of the Peer Group. Further, the Mid-Cap Value Fund’s net total expense ratio of 0.88% for its Institutional Class Shares was higher than both the average and median of the Morningstar Category, higher than the average of the Peer Group and slightly lower than the median of the Peer Group. The Mid-Cap Value Fund’s gross total expense ratio of 0.93% for its Institutional Class Shares was higher than both the average and median of the Morningstar Category, higher than the average of the Peer Group and slightly lower than the median of the Peer Group. The Board noted that the Mid-Cap Value Fund’s shareholders were currently only impacted by the net expense ratio due to the Adviser’s commitment to its expense limitation agreement. The Board also noted that the Mid-Cap Value Fund’s net assets were, in general, lower than many of the funds to which it was compared in its Morningstar Category, significantly lower than the average net assets of the Peer Group and higher than the median net assets of the Peer Group. |
| ● | The Unconstrained Equity Fund’s contractual management fee of 0.85% was higher than the median and average of its Morningstar Category, slightly higher than the median of the Peer Group and slightly lower than the average of the Peer Group. Further, the Unconstrained Equity |
102
| Investment Advisory Agreement Approval (Unaudited) (continued) |
Fund’s net total expense ratio of 0.98% for its Institutional Class Shares was higher than the average and median of the Morningstar Category, slightly higher than the median of the Peer Group and lower than the average of the Peer Group. The Unconstrained Equity Fund’s gross total expense ratio of its Institutional Class Shares of 1.50% was higher than the median and lower than the average of both its Morningstar Category (Mid-Cap Blend) and Peer Group. The Board noted that the Unconstrained Equity Fund’s shareholders were currently only impacted by the net expense ratio due to the Adviser’s commitment to its expense limitation agreement. The Board also noted that the Unconstrained Equity Fund’s net assets were, in general, lower than many of the funds to which it was compared in both the Morningstar Category and the Peer Group.
| ● | The Micro-Cap Equity Fund’s contractual management fee of 1.45% was higher than the average and median of both its Morningstar Category (Small Blend) and the Peer Group. Further, the Micro-Cap Equity Fund’s net total expense ratio of 1.43% for its Institutional Class Shares was higher than the median and average of both its Morningstar Category and Peer Group. The Micro-Cap Equity Fund’s gross total expense ratio of 2.11% for its Institutional Class Shares was higher than the average and median of its Morningstar Category, higher than the median of the Peer Group and lower than the average of the Peer Group. The Board noted that the Micro-Cap Fund’s shareholders were currently only impacted by the net expense ratio due to the Adviser’s commitment to its expense limitation agreement. However, the Board noted the distinct differences in the Micro-Cap Equity Fund’s strategy compared to other funds in its Morningstar Category of Small Blend and its Peer Group, which was a sub-set of the Small Blend, Small Value and Small Growth Morningstar categories. The Board also considered the comparatively small net assets of the Micro-Cap Equity Fund in comparison to its Morningstar Category and Peer Group. |
| ● | The Small-Mid Core Equity Fund’s contractual management fee of 0.80% was higher than the average and median of its Morningstar Category (Mid-Cap Blend), equal to the median of the Peer Group, and slightly less than the average of the Peer Group. Further, the Small-Mid Core Equity Fund’s net total expense ratio of 0.94% of its Institutional Class Shares was higher than the average and median of its Morningstar Category, slightly higher than the median of the Peer Group and lower than the average of the Peer Group. The Small-Mid Core Equity Fund’s gross total expense ratio of 1.64% for its Institutional Class Shares was higher than the median and average of its Morningstar Category, equal to the median of the Peer Group and less than the average of the Peer Group. The Board noted that the Small-Mid Core Equity Fund’s shareholders were currently only impacted by the net expense ratio due to the Adviser’s commitment to its expense limitation agreement. The Board also noted that the Small-Mid Core Equity Fund’s net assets were, in general, lower than many of the funds to which it was compared in both the Morningstar Category, lower than the average net assets of the Peer Group and equal to the median net assets of the Peer Group. |
The Trustees further considered the fees paid by FullerThaler’s separately managed accounts and sub-advisory relationships to other accounts with similar investment objectives and strategies to that of each FullerThaler Fund contemplated herein, noting the differences in the services provided to those accounts compared to the services provided to each FullerThaler Fund. In particular, they also noted that FullerThaler has additional responsibilities with respect to the FullerThaler Funds,
103
| Investment Advisory Agreement Approval (Unaudited) (continued) |
including compliance, reporting, administrative, and operational responsibilities. While recognizing that it is difficult to compare advisory fees because the scope of advisory services provided may vary from one investment adviser to another, or from one investment product to the other, the Trustees concluded that the advisory fee charged to the respective FullerThaler Funds are each reasonable.
Morningstar Ranking. The Trustees noted the overall Morningstar ranking for each of the FullerThaler Funds as presented in the Support Materials. Morningstar fund ratings are a purely quantitative, backward-looking measure of a fund’s past performance, measured from one to five stars. Star ratings are calculated at the end of every month. The overall star rating for each Fund is based on a weighted average (rounded to the nearest integer) of the number of stars assigned to it in the three-, five-, and 10-year rating periods. The Trustees observed that for the period ended September 30, 2023 the Funds had the following overall Morningstar rating: the Small-Cap Equity Fund was rated five stars; the Small-Cap Growth Fund was rated four stars; the Mid-Cap Value Fund was rated four stars; the Unconstrained Equity Fund was rated three stars; the Small-Mid Core Equity Fund was rated four stars; and the Micro-Cap Equity Fund was rated two stars.
Economies of Scale. The Trustees considered whether the FullerThaler Funds may benefit from any economies of scale. The Trustees noted that given the very low management fee of the Small-Cap Equity Fund, fee breakpoints would not be appropriate at the current time. They additionally noted while the Small-Cap Equity Fund has realized some economies of scale with regard to certain fees and expenses that it bears, the Trustees did not find that any material economies currently exist with respect to the advisory services that FullerThaler provides that would warrant the imposition of breakpoints. The Trustees also noted that it was not appropriate to implement fee breakpoints with regard to the management fees of the other FullerThaler Funds. The Trustees considered that an increase in assets in the other FullerThaler Funds would most likely not decrease the extent of advisory services that FullerThaler would need to provide to the Funds at the present time. The Trustees concluded that the other FullerThaler Funds are not likely to benefit from any economies of scale at this time.
Other Benefits. The Trustees considered the extent to which FullerThaler utilizes soft dollar arrangements with respect to portfolio transactions and noted that FullerThaler does utilize soft dollar arrangements consistent with the Section 28(e) safe harbor in connection with the execution of client transactions. They also noted however, that affiliated brokers will not be utilized to execute the portfolio transactions of the FullerThaler Funds. The Trustees concluded that, all things considered, FullerThaler will not receive material additional financial benefits from services rendered to the FullerThaler Funds.
Conclusions. Based upon FullerThaler’s presentation to the Board and the Support Materials considered in connection with the renewal of the Investment Advisory Agreement for an additional one-year period on behalf of the FullerThaler Funds (with the exception of the FullerThaler Mid-Cap Equity Fund), as well as the information provided throughout the course of the year, the Board concluded that the overall arrangements between the Trust and FullerThaler, as set forth in the Investment Advisory Agreement, are fair and reasonable in light of the services to be performed, investment advisory fees to be paid, and such other matters as the Trustees considered relevant in the exercise of their reasonable judgment.
104
| FACTS | WHAT DO THE FULLERTHALER FUNDS (the “Funds”) DO WITH YOUR PERSONAL INFORMATION? |
| Why? | Financial companies choose how they share your personal information. Federal law gives consumers the right to limit some but not all sharing. Federal law also requires us to tell you how we collect, share, and protect your personal information. Please read this notice carefully to understand what we do. |
| What? | The types of personal information we collect and share depend on the product or service you have with us. This information can include:
■ Social Security number
■ account balances and account transactions
■ transaction or loss history and purchase history
■ checking account information and wire transfer instructions
When you are no longer our customer, we continue to share your information as described in this notice. |
| How? | All financial companies need to share customers’ personal information to run their everyday business. In the section below, we list the reasons financial companies can share their customers’ personal information; the reasons the Funds choose to share; and whether you can limit this sharing. |
| Reasons we can share your personal information | Do the Funds share? |
| For our everyday business purposes— such as to process your transactions, maintain your account(s), respond to court orders and legal investigations, or report to credit bureaus | Yes |
| For our marketing purposes— to offer our products and services to you | No |
| For joint marketing with other financial companies | No |
| For our affiliates’ everyday business purposes— information about your transactions and experiences | No |
| For our affiliates’ everyday business purposes— information about your creditworthiness | No |
| For nonaffiliates to market to you | No |
| Questions? | Call (888) 912-4562 |
105
| Who we are | |
| Who is providing this notice? | FullerThaler Funds Ultimus Fund Distributors, LLC (Distributor) Ultimus Fund Solutions, LLC (Administrator) |
| What we do | |
| How do the Funds protect my personal information? | To protect your personal information from unauthorized access and use, we use security measures that comply with federal law. These measures include computer safeguards and secured files and buildings. Our service providers are held accountable for adhering to strict policies and procedures to prevent any misuse of your nonpublic personal information. |
| How do the Funds collect my personal information? | We collect your personal information, for example, when you
■ open an account or deposit money
■ buy securities from us or sell securities to us
■ make deposits or withdrawals from your account
■ give us your account information
■ make a wire transfer
■ tell us who receives the money
■ tell us where to send the money
■ show your government-issued ID
■ show your driver’s license
|
| Why can’t I limit all sharing? | Federal law gives you the right to limit only
■ sharing for affiliates’ everyday business purposes —information about your creditworthiness
■ affiliates from using your information to market to you
■ sharing for nonaffiliates to market to you
State laws and individual companies may give you additional rights to limit sharing. |
| Definitions | |
| Affiliates | Companies related by common ownership or control. They can be financial and nonfinancial companies.
■ FullerThaler Asset Management, Inc., the investment adviser to the Fund, could be deemed to be an affiliate. |
| Nonaffiliates | Companies not related by common ownership or control. They can be financial and nonfinancial companies.
■ The FullerThaler Funds do not share your personal information with nonaffiliates so they can market to you |
| Joint marketing | A formal agreement between nonaffiliated financial companies that together market financial products or services to you.
■ The FullerThaler Funds do not jointly market. |
106
PROXY VOTING
A description of the policies and procedures that each Fund uses to determine how to vote proxies relating to portfolio securities and information regarding how each Fund voted those proxies during the most recent twelve month period ended June 30, are available (1) without charge upon request by calling the Funds at (888) 912-4562 and (2) in Fund documents filed with the SEC on the SEC’s website at www.sec.gov.
| TRUSTEES Walter B. Grimm, Chairman Lori Kaiser Janet Smith Meeks Mary Madick | INDEPENDENT REGISTERED PUBLIC ACCOUNTING FIRM Ernst & Young LLP 221 East 4th Street, Suite 2900 Cincinnati, OH 45202 |
| OFFICERS Matthew J. Miller, Chief Executive Officer and President Zachary P. Richmond, Chief Financial Officer and Treasurer Martin R. Dean, Chief Compliance Officer Tiffany R. Franklin, Secretary | LEGAL COUNSEL Practus, LLP 11300 Tomahawk Creek Parkway, Suite 310 Leawood, KS 66211 |
| INVESTMENT ADVISER Fuller & Thaler Asset Management, Inc. 411 BorelAvenue, Suite 300 San Mateo, CA 94402 | CUSTODIAN Huntington National Bank 41 South High Street Columbus, OH 43215 |
| DISTRIBUTOR Ultimus Fund Distributors, LLC 225 PictoriaDrive, Suite 450 Cincinnati, OH 45246 | ADMINISTRATOR, TRANSFER AGENT AND FUND ACCOUNTANT UltimusFund Solutions, LLC 225 PictoriaDrive, Suite 450 Cincinnati, OH 45246 |
This report is intended only for the information of shareholders or those who have received the Funds’ prospectus which contains information about the Funds’ management fee and expenses. Please read the prospectus carefully before investing.
Distributed by Ultimus Fund Distributors, LLC, Member FINRA/SIPC
Fuller-SAR-24
 |
| Guardian Capital Dividend Growth Fund |
| Institutional Shares – DIVGX |
| Guardian Capital Fundamental Global Equity Fund |
| Institutional Shares – GFGEX |
| Alta Quality Growth Fund |
| Institutional Shares – AQLGX |
| Semi-Annual Report |
| March 31, 2024 |
| Investment Results (Unaudited) |
Average Annual Total Returns(a) as of March 31, 2024
| Since | ||||||||
| Six | One | Inception | ||||||
| Months | Year | Three Year | 5/1/2019 | |||||
| Guardian Capital Dividend Growth Fund | ||||||||
| Institutional Shares | 19.44% | 23.10% | 10.59% | 11.23% | ||||
| MSCI World Index(b) | 21.31% | 25.11% | 8.60% | 11.58% | ||||
| Expense | ||||||||
| Ratios(c) | ||||||||
| Institutional | ||||||||
| Shares | ||||||||
| Gross | 1.66% | |||||||
| With Applicable Waivers | 0.95% |
The performance quoted represents past performance, which does not guarantee future results. The investment return and principal value of an investment will fluctuate so that an investor’s shares, when redeemed, may be worth more or less than their original cost. The returns shown do not reflect deduction of taxes that a shareholder would pay on Guardian Capital Dividend Growth Fund (the “Guardian Dividend Fund”) distributions or the redemption of Guardian Dividend Fund shares. Current performance of the Guardian Dividend Fund may be lower or higher than the performance quoted. The Guardian Dividend Fund’s investment objectives, risks, charges and expenses must be considered carefully before investing. Performance data current to the most recent month end may be obtained by calling (800) 957-0681.
| (a) | Return figures reflect any change in price per share and assume the reinvestment of all distributions. The Fund’s returns reflect any fee reductions during the applicable periods. If such fee reductions had not occurred, the quoted performance would have been lower. Total returns for less than one year are not annualized. |
| (b) | The MSCI World Index is an unmanaged free float-adjusted market capitalization index that is designed to measure global developed market equity performance. Currently the MSCI World Index consists of the following 23 developed market country indices: Australia, Austria, Belgium, Canada, Denmark, Finland, France, Germany, Hong Kong, Ireland, Israel, Italy, Japan, Netherlands, New Zealand, Norway, Portugal, Singapore, Spain, Sweden, Switzerland, the United Kingdom and the United States. The performance of the index is expressed in terms of U.S. dollars, and does not reflect the deduction of fees or taxes with a mutual fund, such as investment management and fund accounting fees. Individuals cannot invest directly in an index; however, an individual can invest in exchange traded funds or other investment vehicles that attempt to track the performance of a benchmark index. |
| (c) | The expense ratio is from the Guardian Dividend Fund’s prospectus dated January 29, 2024. Guardian Capital LP, the Guardian Dividend Fund’s adviser (the “Adviser”), has contractually agreed to waive its management fee and/or reimburse expenses so that total annual operating expenses for the Guardian Dividend Fund (excluding (i) interest; (ii) taxes; (iii) brokerage fees and commissions; (iv) other extraordinary expenses not incurred in the ordinary course of the Guardian Dividend Fund’s business; (v) dividend expense on short sales; and (vi) indirect expenses such as acquired fund fees and expenses) do not exceed 0.95% of the Guardian Dividend Fund’s average daily net assets through January 31, 2025 (the “Expense Limitation”). During any fiscal year that the |
1
| Investment Results (Unaudited) (continued) |
Investment Advisory Agreement between the Adviser and the Capitol Series Trust (the “Trust”) is in effect, the Adviser may recoup the sum of all fees previously waived or expenses reimbursed, less any reimbursement previously paid, provided that the Adviser is only permitted to recoup fees or expenses within 36 months from the date the fee waiver or expense reimbursement first occurred and provided further that such recoupment can be achieved within the Expense Limitation Agreement currently in effect and the Expense Limitation Agreement in place when the waiver/reimbursement occurred. This Expense Limitation Agreement may be terminated by the Board of Trustees (the “Board”) at any time. The Expense Limitation Agreement terminates automatically upon the termination of the Investment Advisory Agreement with the Adviser. Additional information pertaining to the Guardian Dividend Fund’s expense ratios as of March 31, 2024, can be found in the financial highlights.
The Guardian Dividend Fund’s investment objectives, strategies, risks, charges and expenses must be considered carefully before investing. The prospectus contains this and other important information about the Guardian Dividend Fund and may be obtained by calling (800) 957-0681. Please read it carefully before investing.
The Guardian Dividend Fund is distributed by Ultimus Fund Distributors, LLC, Member FINRA/SIPC.
2
| Investment Results (Unaudited) (continued) |
Average Annual Total Returns(a) as of March 31, 2024
| Since | ||||||||
| Six | One | Three | Inception | |||||
| Months | Year | Year | (12/19/2019) | |||||
| Guardian Capital Fundamental Global Equity Fund | ||||||||
| Institutional Shares | 13.50% | 10.03% | 5.55% | 8.47% | ||||
| MSCI World Index(b) | 21.31% | 25.11% | 8.60% | 11.11% | ||||
| Expense | ||||||||
| Ratios(c) | ||||||||
| Institutional | ||||||||
| Shares | ||||||||
| Gross | 1.13% | |||||||
| With Applicable Waivers | 0.99% |
The performance quoted represents past performance, which does not guarantee future results. The investment return and principal value of an investment will fluctuate so that an investor’s shares, when redeemed, may be worth more or less than their original cost. The returns shown do not reflect deduction of taxes that a shareholder would pay on Guardian Capital Fundamental Global Equity Fund (“Guardian Equity Fund”) distributions or the redemption of Guardian Equity Fund shares. Current performance of the Guardian Equity Fund may be lower or higher than the performance quoted. The Guardian Equity Fund’s investment objectives, risks, charges and expenses must be considered carefully before investing. Performance data current to the most recent month end may be obtained by calling (800) 957-0681.
| (a) | Return figures reflect any change in price per share and assume the reinvestment of all distributions. The Guardian Equity Fund’s returns reflect any fee reductions during the applicable period. If such fee reductions had not occurred, the quoted performance would have been lower. Total returns for less than one year are not annualized. |
| (b) | The MSCI World Index is an unmanaged free float-adjusted market capitalization index that is designed to measure global developed market equity performance. Currently the MSCI World Index consists of the following 23 developed market country indices: Australia, Austria, Belgium, Canada, Denmark, Finland, France, Germany, Hong Kong, Ireland, Israel, Italy, Japan, Netherlands, New Zealand, Norway, Portugal, Singapore, Spain, Sweden, Switzerland, the United Kingdom and the United States. The performance of the index is expressed in terms of U.S. dollars, and does not reflect the deduction of fees or taxes with a mutual fund, such as investment management and fund accounting fees. Individuals cannot invest directly in an index; however, an individual can invest in exchange-traded funds or other investment vehicles that attempt to track the performance of a benchmark index. |
| (c) | The expense ratios are from the Guardian Equity Fund’s prospectus dated January 29, 2024. The Adviser has contractually agreed to waive its management fee and/or reimburse expenses so that total annual operating expenses for the Guardian Equity Fund (excluding (i) interest; (ii) taxes; (iii) brokerage fees and commissions; (iv) other extraordinary expenses not incurred in the ordinary course of the Guardian Equity Fund’s business; (v) dividend expense on short sales; and (vi) indirect expenses such as acquired fund fees and expenses) do not exceed 0.99% of the average daily net assets of the Guardian Equity Fund through January 31, 2025 (the “Expense Limitation”). During any fiscal year that the Investment Advisory Agreement between the Adviser and Trust is in effect, |
3
| Investment Results (Unaudited) (continued) |
the Adviser may recoup the sum of all fees previously waived or expenses reimbursed, less any reimbursement previously paid, provided that the Adviser is only permitted to recoup fees or expenses within 36 months from the date the fee waiver or expense reimbursement first occurred and provided further that such recoupment can be achieved within the Expense Limitation Agreement currently in effect and the Expense Limitation Agreement in place when the waiver/reimbursement occurred. This Expense Limitation Agreement may be terminated by the Board at any time. The Expense Limitation Agreement terminates automatically upon the termination of the Investment Advisory Agreement with the Adviser. Additional information pertaining to the Guardian Equity Fund’s expense ratios as of March 31, 2024 can be found in the financial highlights.
The Guardian Equity Fund’s investment objectives, strategies, risks, charges and expenses must be considered carefully before investing. The prospectus contains this and other important information about the Guardian Equity Fund and may be obtained by calling (800) 957-0681. Please read it carefully before investing
The Guardian Equity Fund is distributed by Ultimus Fund Distributors, LLC, Member FINRA/SIPC.
4
| Investment Results (Unaudited) (continued) |
Average Annual Total Returns(a) as of March 31, 2024
| Since | ||||||||
| Inception | ||||||||
| Six Months | One Year | Five Year | (12/19/2018) | |||||
| Alta Quality Growth Fund – Institutional Shares | 19.76% | 25.01% | 10.72% | 13.04% | ||||
| S&P 500® Index (b) | 23.48% | 29.88 % | 15.05% | 17.01% | ||||
| Russell 1000® Growth Index (c) | 27.19% | 39.00% | 18.52% | 20.90% | ||||
| Expense | ||||||||
| Ratios(d) | ||||||||
| Gross | 1.16% | |||||||
| With Applicable Waivers | 0.79% |
The performance quoted represents past performance, which does not guarantee future results. The investment return and principal value of an investment will fluctuate so that an investor’s shares, when redeemed, may be worth more or less than their original cost. The returns shown do not reflect deduction of taxes that a shareholder would pay on Alta Quality Growth Fund (“Alta Growth Fund”) distributions or the redemption of Alta Growth Fund shares. Current performance of the Alta Growth Fund may be lower or higher than the performance quoted. The Alta Growth Fund’s investment objectives, risks, charges and expenses must be considered carefully before investing. Performance data current to the most recent month end may be obtained by calling (800) 957-0681.
| (a) | Return figures reflect any change in price per share and assume the reinvestment of all distributions. The Alta Growth Fund’s returns reflect any fee reductions during the applicable period. If such fee reductions had not occurred, the quoted performance would have been lower. Total returns for less than one year are not annualized. |
| (b) | The S&P 500® Index is a widely recognized unmanaged index of equity securities and is representative of a broader domestic equity market and range of securities than is found in the Alta Growth Fund’s portfolio. Individuals cannot invest directly in an index; however, an individual can invest in exchange-traded funds or other investment vehicles that attempt to track the performance of a benchmark index. |
| (c) | The Russell 1000® Growth Index is a widely recognized unmanaged index of equity securities and is representative of a broader domestic equity market and range of securities than is found in the Alta Growth Fund’s portfolio. Individuals cannot invest directly in an index; however, an individual can invest in exchange traded funds or other investment vehicles that attempt to track the performance of a benchmark index. |
| (d) | The expense ratios are from the Alta Growth Fund’s prospectus dated January 29, 2024. Alta Capital Management, LLC, the Alta Growth Fund’s adviser has contractually agreed to waive its management fee and/or reimburse expenses so that total annual operating expenses for the Alta Growth Fund (excluding (i) interest; (ii) taxes; (iii) brokerage fees and commissions; (iv) other extraordinary expenses not incurred in the ordinary course of the Alta Growth Fund’s business; (v) dividend expense on short sales; and (vi) indirect expenses such as acquired fund fees and expenses) do not exceed 0.79% of the average daily net assets of the Alta Growth Fund through January 31, 2025 (the “Expense Limitation”). During any fiscal year that the Investment Advisory |
5
| Investment Results (Unaudited) (continued) |
Agreement between Alta Capital Management, LLC and Capitol Series Trust (the “Trust”) is in effect, Alta Capital Management, LLC may recoup the sum of all fees previously waived or expenses reimbursed, less any reimbursement previously paid, provided that the Alta Capital Management, LLC is only permitted to recoup fees or expenses within 36 months from the date the fee waiver or expense reimbursement first occurred and provided further that such recoupment can be achieved within the Expense Limitation Agreement currently in effect and the Expense Limitation Agreement in place when the waiver/reimbursement occurred. This Expense Limitation Agreement may be terminated by the Board at any time. The Expense Limitation Agreement terminates automatically upon the termination of the Advisory Agreement with Alta Capital Management, LLC. Additional information pertaining to the Alta Growth Fund’s expense ratios as of March 31, 2024, can be found in the financial highlights.
The Alta Growth Fund’s investment objectives, strategies, risks, charges and expenses must be considered carefully before investing. The prospectus contains this and other important information about the Alta Growth Fund and may be obtained by calling (800) 957-0681. Please read it carefully before investing.
The Alta Growth Fund is distributed by Ultimus Fund Distributors, LLC, Member FINRA/SIPC.
6
| Fund Holdings (Unaudited) |
Guardian Capital Dividend Growth Fund Holdings as of March 31, 2024.*
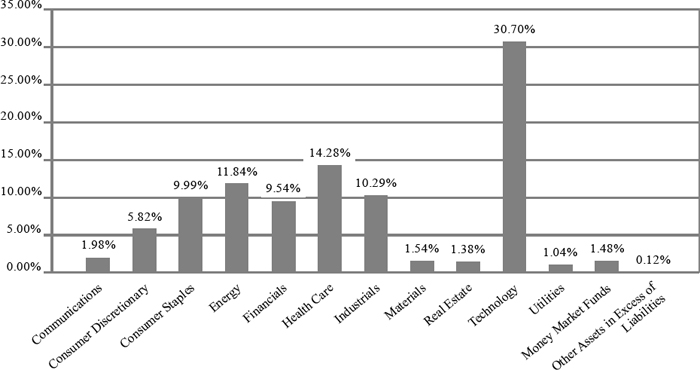
| * | As a percentage of net assets. |
Guardian Capital Fundamental Global Equity Fund Holdings as of March 31, 2024.*
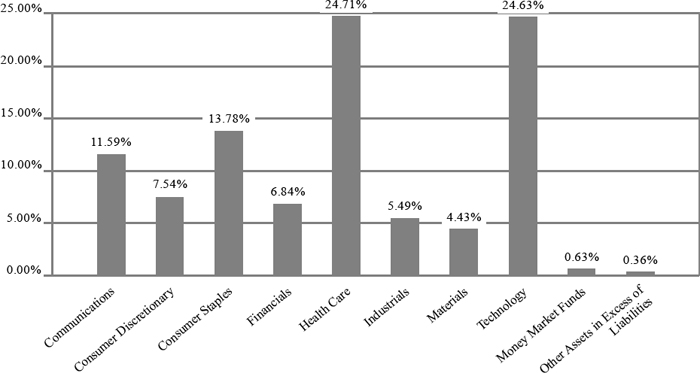
| * | As a percentage of net assets. |
7
| Fund Holdings (Unaudited) |
Alta Quality Growth Fund Holdings as of March 31, 2024.*
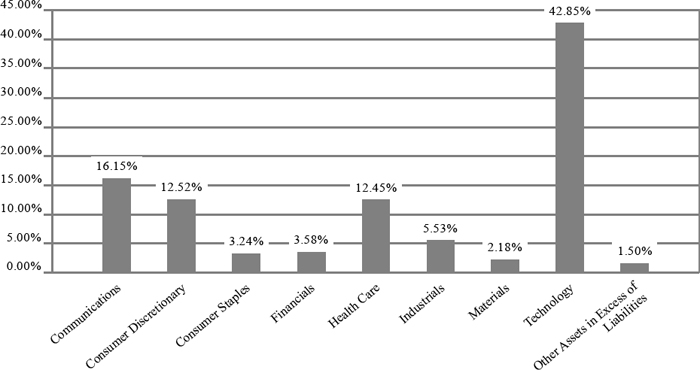
| * | As a percentage of net assets. |
| Availability of Portfolio Schedules (Unaudited) |
The Funds file a complete schedule of portfolio holdings with the Securities and Exchange Commission (the “SEC”) for the first and third quarters of each fiscal year as an exhibit to its reports on Form N-PORT. The Funds’ Form N-PORT reports are available on the SEC’s website at http:// www.sec.gov or on the Funds’ website at www.guardiancapitalfunds.com.
8
| Guardian Capital Dividend Growth Fund |
| Schedule of Investments |
| March 31, 2024 - (Unaudited) |
| Common Stocks — 98.40% | Shares | Fair Value | ||||||
| Canada — 6.27% | ||||||||
| Communications — 1.98% | ||||||||
| BCE, Inc. | 5,162 | $ | 175,431 | |||||
| TELUS Corp. | 19,751 | 316,005 | ||||||
| 491,436 | ||||||||
| Energy — 1.05% | ||||||||
| Canadian Natural Resources Ltd. | 3,408 | 260,099 | ||||||
| Financials — 3.24% | ||||||||
| Royal Bank of Canada(a) | 7,987 | 805,647 | ||||||
| Total Canada | 1,557,182 | |||||||
| Denmark — 3.63% | ||||||||
| Health Care — 3.63% | ||||||||
| Novo Nordisk A/S - ADR | 7,020 | 901,368 | ||||||
| Total Denmark | 901,368 | |||||||
| France — 10.28% | ||||||||
| Consumer Discretionary — 1.55% | ||||||||
| LVMH Moet Hennessy Louis Vuitton S.A. - ADR | 2,131 | 385,775 | ||||||
| Energy — 3.44% | ||||||||
| TotalEnergies S.E. - ADR | 12,452 | 857,071 | ||||||
| Financials — 2.07% | ||||||||
| AXA S.A. | 13,700 | 514,526 | ||||||
| Health Care — 0.75% | ||||||||
| Sanofi - ADR | 3,830 | 186,138 | ||||||
| Industrials — 2.47% | ||||||||
| Schneider Electric S.E. - ADR | 13,574 | 614,902 | ||||||
| Total France | 2,558,412 | |||||||
| Germany — 2.16% | ||||||||
| Financials — 2.16% | ||||||||
| Allianz S.E. | 1,800 | 539,417 | ||||||
| Total Germany | 539,417 | |||||||
| Ireland — 3.30% | ||||||||
| Technology — 3.30% | ||||||||
| Accenture PLC, Class A | 2,372 | 822,159 | ||||||
| Total Ireland | 822,159 | |||||||
| Netherlands — 6.77% | ||||||||
| Technology — 6.77% | ||||||||
| ASML Holding N.V. | 868 | 842,368 | ||||||
| Wolters Kluwer N.V. - ADR | 5,350 | 839,522 | ||||||
| Total Netherlands | 1,681,890 | |||||||
See accompanying notes which are an integral part of these financial statements.
9
| Guardian Capital Dividend Growth Fund |
| Schedule of Investments (continued) |
| March 31, 2024 - (Unaudited) |
| Common Stocks — 98.40% - (continued) | Shares | Fair Value | ||||||
| Switzerland — 2.88% | ||||||||
| Consumer Staples — 2.88% | ||||||||
| Nestle S.A. - ADR | 6,742 | $ | 716,000 | |||||
| Total Switzerland | 716,000 | |||||||
| United Kingdom — 3.38% | ||||||||
| Consumer Staples — 0.96% | ||||||||
| Unilever PLC - ADR | 4,784 | 240,109 | ||||||
| Health Care — 2.42% | ||||||||
| AstraZeneca PLC - ADR | 8,878 | 601,485 | ||||||
| Total United Kingdom | 841,594 | |||||||
| United States — 59.73% | ||||||||
| Consumer Discretionary — 4.27% | ||||||||
| Home Depot, Inc. (The) | 1,502 | 576,167 | ||||||
| McDonald’s Corp. | 1,727 | 486,928 | ||||||
| 1,063,095 | ||||||||
| Consumer Staples — 6.15% | ||||||||
| Costco Wholesale Corp. | 1,581 | 1,158,288 | ||||||
| Procter & Gamble Co. (The) | 2,292 | 371,877 | ||||||
| 1,530,165 | ||||||||
| Energy — 7.35% | ||||||||
| EOG Resources, Inc. | 1,734 | 221,675 | ||||||
| Shell PLC - ADR | 10,651 | 714,043 | ||||||
| Williams Cos., Inc. (The) | 22,943 | 894,088 | ||||||
| 1,829,806 | ||||||||
| Financials — 2.07% | ||||||||
| Hartford Financial Services Group, Inc. (The) | 4,993 | 514,529 | ||||||
| Health Care — 7.48% | ||||||||
| AbbVie, Inc. | 2,491 | 453,611 | ||||||
| Amgen, Inc. | 773 | 219,779 | ||||||
| Johnson & Johnson | 4,031 | 637,664 | ||||||
| UnitedHealth Group, Inc. | 1,114 | 551,096 | ||||||
| 1,862,150 | ||||||||
| Industrials — 7.82% | ||||||||
| Illinois Tool Works, Inc. | 778 | 208,761 | ||||||
| Republic Services, Inc. | 4,113 | 787,393 | ||||||
| W.W. Grainger, Inc. | 293 | 298,069 | ||||||
| Waste Management, Inc. | 3,061 | 652,452 | ||||||
| 1,946,675 | ||||||||
| Materials — 1.54% | ||||||||
| Air Products & Chemicals, Inc. | 1,586 | 384,240 | ||||||
| Real Estate — 1.38% | ||||||||
| Equinix, Inc. | 417 | 344,163 | ||||||
| Technology — 20.63% | ||||||||
| Apple, Inc. | 7,575 | 1,298,961 | ||||||
| Broadcom, Inc. | 1,210 | 1,603,745 | ||||||
See accompanying notes which are an integral part of these financial statements.
10
| Guardian Capital Dividend Growth Fund |
| Schedule of Investments (continued) |
| March 31, 2024 - (Unaudited) |
| Common Stocks — 98.40% - (continued) | Shares | Fair Value | ||||||
| United States — 59.73% - (continued) | ||||||||
| Technology — 20.63% - (continued) | ||||||||
| MasterCard, Inc., Class A | 1,326 | $ | 638,562 | |||||
| Microsoft Corp. | 3,779 | 1,589,901 | ||||||
| 5,131,169 | ||||||||
| Utilities — 1.04% | ||||||||
| WEC Energy Group, Inc. | 3,166 | 259,992 | ||||||
| Total United States | 14,865,984 | |||||||
| Total Common Stocks | ||||||||
| (Cost $15,536,285) | 24,484,006 | |||||||
| Money Market Funds - 1.48% | ||||||||
| Morgan Stanley Institutional Liquidity Funds Treasury Securities Portfolio, Institutional Class, 5.16%(b) | 369,109 | 369,109 | ||||||
| Total Money Market Funds | ||||||||
| (Cost $369,109) | 369,109 | |||||||
| Total Investments — 99.88% | ||||||||
| (Cost $15,905,394) | 24,853,115 | |||||||
| Other Assets in Excess of Liabilities — 0.12% | 29,294 | |||||||
| Net Assets — 100.00% | $ | 24,882,409 | ||||||
| (a) | Non-income producing security. |
| (b) | Rate disclosed is the seven day effective yield as of March 31, 2024. |
ADR- American Depositary Receipt
See accompanying notes which are an integral part of these financial statements.
11
| Guardian Capital Fundamental Global Equity Fund |
| Schedule of Investments |
| March 31, 2024 - (Unaudited) |
| Common Stocks — 99.01% | Shares | Fair Value | ||||||
| China — 4.00% | ||||||||
| Consumer Discretionary — 4.00% | ||||||||
| Yum China Holdings, Inc. | 90,162 | $ | 3,587,546 | |||||
| Total China | 3,587,546 | |||||||
| Denmark — 12.07% | ||||||||
| Health Care — 7.64% | ||||||||
| Coloplast A/S, Class B | 15,000 | 2,022,805 | ||||||
| Novo Nordisk A/S, Class B | 37,832 | 4,822,183 | ||||||
| 6,844,988 | ||||||||
| Materials — 4.43% | ||||||||
| Novozymes A/S, Class B | 67,712 | 3,968,219 | ||||||
| Total Denmark | 10,813,207 | |||||||
| France — 11.38% | ||||||||
| Consumer Staples — 3.54% | ||||||||
| L’Oreal S.A. | 6,708 | 3,174,179 | ||||||
| Health Care — 7.84% | ||||||||
| EssilorLuxottica S.A. | 31,039 | 7,021,444 | ||||||
| Total France | 10,195,623 | |||||||
| Ireland — 5.01% | ||||||||
| Technology — 5.01% | ||||||||
| Accenture PLC, Class A | 12,945 | 4,486,866 | ||||||
| Total Ireland | 4,486,866 | |||||||
| Japan — 2.12% | ||||||||
| Industrials — 2.12% | ||||||||
| Keyence Corp. | 4,100 | 1,898,216 | ||||||
| Total Japan | 1,898,216 | |||||||
| Switzerland — 2.97% | ||||||||
| Consumer Staples — 2.97% | ||||||||
| Nestle S.A. | 25,049 | 2,659,498 | ||||||
| Total Switzerland | 2,659,498 | |||||||
| United Kingdom — 6.32% | ||||||||
| Consumer Staples — 2.95% | ||||||||
| Reckitt Benckiser Group PLC | 46,480 | 2,646,849 | ||||||
| Industrials — 3.37% | ||||||||
| Intertek Group PLC(a) | 48,018 | 3,021,086 | ||||||
| Total United Kingdom | 5,667,935 | |||||||
| United States — 55.14% | ||||||||
| Communications — 11.59% | ||||||||
| Alphabet, Inc., Class A(a) | 37,519 | 5,662,742 | ||||||
| Booking Holdings, Inc. | 1,303 | 4,727,128 | ||||||
| 10,389,870 | ||||||||
See accompanying notes which are an integral part of these financial statements.
12
| Guardian Capital Fundamental Global Equity Fund |
| Schedule of Investments (continued) |
| March 31, 2024 - (Unaudited) |
| Common Stocks — 99.01% - (continued) | Shares | Fair Value | ||||||
| United States — 55.14% - (continued) | ||||||||
| Consumer Discretionary — 3.54% | ||||||||
| Nike, Inc., Class B | 33,754 | $ | 3,172,201 | |||||
| Consumer Staples — 4.32% | ||||||||
| Colgate-Palmolive Co. | 42,932 | 3,866,027 | ||||||
| Financials — 6.84% | ||||||||
| CME Group, Inc. | 28,486 | 6,132,751 | ||||||
| Health Care — 9.23% | ||||||||
| Illumina, Inc.(a) | 14,616 | 2,007,069 | ||||||
| UnitedHealth Group, Inc. | 7,193 | 3,558,377 | ||||||
| Waters Corp.(a) | 7,867 | 2,708,057 | ||||||
| 8,273,503 | ||||||||
| Technology — 19.62% | ||||||||
| Automatic Data Processing, Inc. | 12,323 | 3,077,546 | ||||||
| MarketAxess Holdings, Inc. | 17,286 | 3,789,956 | ||||||
| MasterCard, Inc., Class A | 11,420 | 5,499,530 | ||||||
| Microsoft Corp. | 8,528 | 3,587,900 | ||||||
| Verisk Analytics, Inc. | 6,914 | 1,629,837 | ||||||
| 17,584,769 | ||||||||
| Total United States | 49,419,121 | |||||||
| Total Common Stocks | ||||||||
| (Cost $74,838,480) | 88,728,012 | |||||||
| Money Market Funds - 0.63% | ||||||||
| Morgan Stanley Institutional Liquidity Funds Treasury Portfolio, Institutional Class, 5.16%(b) | 564,817 | 564,817 | ||||||
| Total Money Market Funds | ||||||||
| (Cost $564,817) | 564,817 | |||||||
| Total Investments — 99.64% | ||||||||
| (Cost $75,403,297) | 89,292,829 | |||||||
| Other Assets in Excess of Liabilities — 0.36% | 322,976 | |||||||
| Net Assets — 100.00% | $ | 89,615,805 | ||||||
| (a) | Non-income producing security. |
| (b) | Rate disclosed is the seven day effective yield as of March 31, 2024. |
See accompanying notes which are an integral part of these financial statements.
13
| Alta Quality Growth Fund |
| Schedule of Investments |
| March 31, 2024 - (Unaudited) |
| Common Stocks — 98.50% | Shares | Fair Value | ||||||
| Ireland — 7.24% | ||||||||
| Health Care — 3.62% | ||||||||
| ICON PLC(a) | 7,800 | $ | 2,620,409 | |||||
| Technology — 3.62% | ||||||||
| Accenture PLC, Class A | 7,550 | 2,616,906 | ||||||
| Total Ireland | 5,237,315 | |||||||
| United States — 91.26% | ||||||||
| Communications — 16.15% | ||||||||
| Alphabet, Inc., Class A(a) | 31,950 | 4,822,213 | ||||||
| Booking Holdings, Inc. | 650 | 2,358,122 | ||||||
| Take-Two Interactive Software, Inc.(a) | 8,500 | 1,262,165 | ||||||
| VeriSign, Inc.(a) | 5,468 | 1,036,241 | ||||||
| Walt Disney Co. (The) | 18,000 | 2,202,480 | ||||||
| 11,681,221 | ||||||||
| Consumer Discretionary — 12.52% | ||||||||
| Amazon.com, Inc.(a) | 8,865 | 1,599,069 | ||||||
| Home Depot, Inc. (The) | 8,500 | 3,260,599 | ||||||
| Restaurant Brands International, Inc. | 25,750 | 2,045,838 | ||||||
| TJX Companies, Inc. (The) | 21,200 | 2,150,104 | ||||||
| 9,055,610 | ||||||||
| Consumer Staples — 3.24% | ||||||||
| Dollar General Corp. | 15,000 | 2,340,900 | ||||||
| Financials — 3.58% | ||||||||
| Markel Corp.(a) | 1,700 | 2,586,516 | ||||||
| Health Care — 8.83% | ||||||||
| Thermo Fisher Scientific, Inc. | 4,350 | 2,528,264 | ||||||
| UnitedHealth Group, Inc. | 4,150 | 2,053,005 | ||||||
| Zoetis, Inc., Class A | 10,650 | 1,802,087 | ||||||
| 6,383,356 | ||||||||
| Industrials — 5.53% | ||||||||
| Amphenol Corp., Class A | 21,300 | 2,456,955 | ||||||
| Raytheon Technologies Corp. | 15,800 | 1,540,974 | ||||||
| 3,997,929 | ||||||||
| Materials — 2.18% | ||||||||
| Sherwin-Williams Co. (The) | 4,550 | 1,580,352 | ||||||
| Technology — 39.23% | ||||||||
| Adobe Systems, Inc.(a) | 5,200 | 2,623,920 | ||||||
| Apple, Inc. | 21,600 | 3,703,968 | ||||||
| Autodesk, Inc.(a) | 8,800 | 2,291,696 | ||||||
| Broadridge Financial Solutions, Inc. | 7,000 | 1,434,020 | ||||||
| Fiserv, Inc.(a) | 17,150 | 2,740,912 | ||||||
| Intuit, Inc. | 3,100 | 2,015,000 | ||||||
| MasterCard, Inc., Class A | 5,350 | 2,576,400 | ||||||
| Microsoft Corp. | 10,800 | 4,543,776 | ||||||
See accompanying notes which are an integral part of these financial statements.
14
| Alta Quality Growth Fund |
| Schedule of Investments (continued) |
| March 31, 2024 - (Unaudited) |
| Common Stocks — 98.50% - (continued) | Shares | Fair Value | ||||||
| United States — 91.26% - (continued) | ||||||||
| Technology — 39.23% - (continued) | ||||||||
| S&P Global, Inc. | 4,300 | $ | 1,829,435 | |||||
| Visa, Inc., Class A | 7,700 | 2,148,916 | ||||||
| Zebra Technologies Corp., Class A(a) | 8,200 | 2,471,808 | ||||||
| 28,379,851 | ||||||||
| Total United States | 66,005,735 | |||||||
| Total Common Stocks/Investments — 98.50% | ||||||||
| (Cost $47,840,082) | $ | 71,243,050 | ||||||
| Other Assets in Excess of Liabilities — 1.50% | 1,088,398 | |||||||
| Net Assets — 100.00% | $ | 72,331,448 | ||||||
| (a) | Non-income producing security. |
See accompanying notes which are an integral part of these financial statements.
15
| Guardian Capital Funds |
| Statements of Assets and Liabilities |
| March 31, 2024 - (Unaudited) |
| Guardian | ||||||||||||
| Guardian | Capital | |||||||||||
| Capital | Fundamental | |||||||||||
| Dividend | Global Equity | Alta Quality | ||||||||||
| Growth Fund | Fund | Growth Fund | ||||||||||
| Assets | ||||||||||||
| Investments in securities at fair value (cost | ||||||||||||
| $15,905,394, $75,403,297 and $47,840,082) | $ | 24,853,115 | $ | 89,292,829 | $ | 71,243,050 | ||||||
| Cash and cash equivalents | 6,353 | 2,687 | 1,072,425 | |||||||||
| Foreign currency at value (cost $0, $25,586 and $0) | — | 25,488 | — | |||||||||
| Receivable for fund shares sold | — | — | 19,265 | |||||||||
| Receivable for investments sold | — | 481,113 | — | |||||||||
| Dividends and interest receivable | 29,051 | 37,262 | 29,321 | |||||||||
| Tax reclaims receivable | 24,888 | 90,922 | — | |||||||||
| Prepaid expenses | 20,011 | 20,570 | 19,494 | |||||||||
| Total Assets | 24,933,418 | 89,950,871 | 72,383,555 | |||||||||
| Liabilities | ||||||||||||
| Payable for fund shares redeemed | — | — | 1,845 | |||||||||
| Payable for investments purchased | — | 256,666 | — | |||||||||
| Payable for distributions to shareholders | 28,698 | — | — | |||||||||
| Payable to Adviser | 3,660 | 54,650 | 29,352 | |||||||||
| Payable to affiliates | 8,198 | 9,724 | 9,337 | |||||||||
| Payable to auditors | 8,896 | 8,895 | 8,895 | |||||||||
| Other accrued expenses | 1,557 | 5,131 | 2,678 | |||||||||
| Total Liabilities | 51,009 | 335,066 | 52,107 | |||||||||
| Net Assets | $ | 24,882,409 | $ | 89,615,805 | $ | 72,331,448 | ||||||
| Net Assets consist of: | ||||||||||||
| Paid-in capital | $ | 16,404,365 | $ | 74,026,653 | $ | 50,312,884 | ||||||
| Accumulated earnings | 8,478,044 | 15,589,152 | 22,018,564 | |||||||||
| Net Assets | $ | 24,882,409 | $ | 89,615,805 | $ | 72,331,448 | ||||||
| Institutional Shares: | ||||||||||||
| Net Assets | $ | 24,882,409 | $ | 89,615,805 | $ | 72,331,448 | ||||||
| Shares outstanding (unlimited number of shares authorized, no par value) | 1,613,443 | 6,780,472 | 4,236,828 | |||||||||
| Net asset value, offering and redemption price per share | $ | 15.42 | $ | 13.22 | $ | 17.07 | ||||||
See accompanying notes which are an integral part of these financial statements.
16
| Guardian Capital Funds |
| Statements of Operations |
| For the six months ended March 31, 2024 - (Unaudited) |
| Guardian | ||||||||||||
| Guardian | Capital | |||||||||||
| Capital | Fundamental | |||||||||||
| Dividend | Global Equity | Alta Quality | ||||||||||
| Growth Fund | Fund | Growth Fund | ||||||||||
| Investment Income | ||||||||||||
| Dividend income (net of foreign taxes withheld of $11,638, $16,638 and $4,303) | $ | 252,513 | $ | 578,335 | $ | 243,621 | ||||||
| Interest income | — | — | 16,319 | |||||||||
| Total investment income | 252,513 | 578,335 | 259,940 | |||||||||
| Expenses | ||||||||||||
| Adviser | 85,860 | 340,099 | 242,646 | |||||||||
| Administration | 33,035 | 39,101 | 36,989 | |||||||||
| Legal | 9,594 | 11,094 | 9,594 | |||||||||
| Trustee | 8,686 | 8,686 | 8,686 | |||||||||
| Audit and tax preparation | 8,671 | 8,670 | 8,670 | |||||||||
| Transfer agent | 6,676 | 10,014 | 10,014 | |||||||||
| Registration | 5,204 | 4,870 | 8,237 | |||||||||
| Compliance services | 5,067 | 5,067 | 5,067 | |||||||||
| Custodian | 3,597 | 17,119 | 3,754 | |||||||||
| Report printing | 1,821 | 3,237 | 3,832 | |||||||||
| Pricing | 619 | 865 | 285 | |||||||||
| Miscellaneous | 12,146 | 13,386 | 13,805 | |||||||||
| Total expenses | 180,976 | 462,208 | 351,579 | |||||||||
| Fees contractually waived by Adviser | (72,261 | ) | (41,666 | ) | (96,075 | ) | ||||||
| Net operating expenses | 108,715 | 420,542 | 255,504 | |||||||||
| Net investment income | 143,798 | 157,793 | 4,436 | |||||||||
| Net Realized and Change in Unrealized | ||||||||||||
| Gain (Loss) on Investments | ||||||||||||
| Net realized gain (loss) on investment securities transactions | (9,836 | ) | 1,904,700 | (1,199,610 | ) | |||||||
| Net realized gain (loss) on foreign currency transactions | 169 | (13,895 | ) | — | ||||||||
| Net change in unrealized appreciation of investment securities | 3,906,013 | 8,529,776 | 12,677,304 | |||||||||
| Net change in unrealized appreciation on foreign currency translations | 211 | 1,844 | — | |||||||||
| Net realized and change in unrealized gain on investments | 3,896,557 | 10,422,425 | 11,477,694 | |||||||||
| Net increase in net assets resulting from operations | $ | 4,040,355 | $ | 10,580,218 | $ | 11,482,130 | ||||||
See accompanying notes which are an integral part of these financial statements.
17
| Guardian Capital Funds |
| Statements of Changes in Net Assets |
| Guardian Capital Dividend Growth | ||||||||
| Fund | ||||||||
| For the | ||||||||
| For the Six | Year Ended | |||||||
| Months Ended | September 30, | |||||||
| March 31, 2024 | 2023 | |||||||
| (Unaudited) | ||||||||
| Increase (Decrease) in Net Assets due to: | ||||||||
| Operations | ||||||||
| Net investment income | $ | 143,798 | $ | 346,487 | ||||
| Net realized loss on investment securities transactions | (9,667 | ) | (459,300 | ) | ||||
| Net change in unrealized appreciation of investment securities | 3,906,224 | 3,433,731 | ||||||
| Net increase in net assets resulting from operations | 4,040,355 | 3,320,918 | ||||||
| Distributions to Shareholders from: | ||||||||
| Earnings | (148,229 | ) | (572,974 | ) | ||||
| Total distributions | (148,229 | ) | (572,974 | ) | ||||
| Capital Transactions - Institutional Shares | ||||||||
| Proceeds from shares sold | 96,995 | — | ||||||
| Reinvestment of distributions | 103,885 | 468,216 | ||||||
| Net increase in net assets resulting from capital transactions | 200,880 | 468,216 | ||||||
| Total Increase in Net Assets | 4,093,006 | 3,216,160 | ||||||
| Net Assets | ||||||||
| Beginning of period | 20,789,403 | 17,573,243 | ||||||
| End of period | $ | 24,882,409 | $ | 20,789,403 | ||||
| Share Transactions - Institutional Shares | ||||||||
| Shares sold | 6,291 | — | ||||||
| Shares issued in reinvestment of distributions | 6,939 | 37,055 | ||||||
| Net increase in shares | 13,230 | 37,055 | ||||||
See accompanying notes which are an integral part of these financial statements.
18
| Guardian Capital Funds |
| Statements of Changes in Net Assets (continued) |
| Guardian Capital Fundamental | ||||||||
| Global Equity Fund | ||||||||
| For the | ||||||||
| For the Six | Year Ended | |||||||
| Months Ended | September 30, | |||||||
| March 31, 2024 | 2023 | |||||||
| (Unaudited) | ||||||||
| Increase (Decrease) in Net Assets due to: | ||||||||
| Operations | ||||||||
| Net investment income | $ | 157,793 | $ | 410,983 | ||||
| Net realized gain on investment securities transactions | 1,890,805 | 1,756,488 | ||||||
| Net change in unrealized appreciation of investment securities | 8,531,620 | 7,534,318 | ||||||
| Net increase in net assets resulting from operations | 10,580,218 | 9,701,789 | ||||||
| Distributions to Shareholders from: | ||||||||
| Earnings | (2,169,463 | ) | (701,199 | ) | ||||
| Total distributions | (2,169,463 | ) | (701,199 | ) | ||||
| Capital Transactions - Institutional Shares | ||||||||
| Proceeds from shares sold | 1,640,686 | 41,348,047 | ||||||
| Reinvestment of distributions | 2,150,558 | 671,327 | ||||||
| Amount paid for shares redeemed | (1,414,827 | ) | (438,677 | ) | ||||
| Net increase in net assets resulting from capital transactions | 2,376,417 | 41,580,697 | ||||||
| Total Increase in Net Assets | 10,787,172 | 50,581,287 | ||||||
| Net Assets | ||||||||
| Beginning of period | 78,828,633 | 28,247,346 | ||||||
| End of period | $ | 89,615,805 | $ | 78,828,633 | ||||
| Share Transactions - Institutional Shares | ||||||||
| Shares sold | 126,976 | 3,697,496 | ||||||
| Shares issued in reinvestment of distributions | 169,602 | 59,281 | ||||||
| Shares redeemed | (110,702 | ) | (36,874 | ) | ||||
| Net increase in shares | 185,877 | 3,719,903 | ||||||
See accompanying notes which are an integral part of these financial statements.
19
| Guardian Capital Funds |
| Statements of Changes in Net Assets (continued) |
| Alta Quality Growth Fund | ||||||||
| For the | ||||||||
| For the Six | Year Ended | |||||||
| Months Ended | September 30, | |||||||
| March 31, 2024 | 2023 | |||||||
| (Unaudited) | ||||||||
| Increase (Decrease) in Net Assets due to: | ||||||||
| Operations | ||||||||
| Net investment income | $ | 4,436 | $ | 21,883 | ||||
| Net realized gain (loss) on investment securities transactions | (1,199,610 | ) | 73,179 | |||||
| Net change in unrealized appreciation of investment securities | 12,677,304 | 8,478,170 | ||||||
| Net increase in net assets resulting from operations | 11,482,130 | 8,573,232 | ||||||
| Distributions to Shareholders from: | ||||||||
| Earnings | (73,256 | ) | (2,565,420 | ) | ||||
| Total distributions | (73,256 | ) | (2,565,420 | ) | ||||
| Capital Transactions - Institutional Shares | ||||||||
| Proceeds from shares sold | 5,348,595 | 17,106,042 | ||||||
| Reinvestment of distributions | 61,721 | 2,349,234 | ||||||
| Amount paid for shares redeemed | (2,306,086 | ) | (6,772,532 | ) | ||||
| Net increase in net assets resulting from capital transactions | 3,104,230 | 12,682,744 | ||||||
| Total Increase in Net Assets | 14,513,104 | 18,690,556 | ||||||
| Net Assets | ||||||||
| Beginning of period | 57,818,344 | 39,127,788 | ||||||
| End of period | $ | 72,331,448 | $ | 57,818,344 | ||||
| Share Transactions - Institutional Shares | ||||||||
| Shares sold | 327,819 | 1,237,131 | ||||||
| Shares issued in reinvestment of distributions | 3,884 | 189,454 | ||||||
| Shares redeemed | (146,766 | ) | (489,025 | ) | ||||
| Net increase in shares | 184,937 | 937,560 | ||||||
See accompanying notes which are an integral part of these financial statements.
20
| Guardian Capital Dividend Growth Fund – Institutional Class |
| Financial Highlights |
(For a share outstanding during each period)
| For the Six | ||||||||||||||||||||||||
| Months | For the Five | |||||||||||||||||||||||
| Ended | Months | For the | ||||||||||||||||||||||
| March | For the Years Ended | Ended | For the Year | Period | ||||||||||||||||||||
| 31, 2024 | September 30, | September | Ended April | Ended April | ||||||||||||||||||||
| (Unaudited) | 2023 | 2022 | 30, 2021(a) | 30, 2021 | 30, 2020(b) | |||||||||||||||||||
| Net asset value, beginning of period | $ | 12.99 | $ | 11.24 | $ | 12.87 | $ | 12.68 | $ | 9.85 | $ | 10.00 | ||||||||||||
| Investment operations: | ||||||||||||||||||||||||
| Net investment income | 0.09 | 0.22 | 0.22 | 0.11 | 0.16 | 0.17 | ||||||||||||||||||
| Net realized and unrealized gain (loss) on investments | 2.43 | 1.89 | (1.63 | ) | 0.20 | 2.82 | (0.16 | ) | ||||||||||||||||
| Total from investment operations | 2.52 | 2.11 | (1.41 | ) | 0.31 | 2.98 | 0.01 | |||||||||||||||||
| Distributions from: | ||||||||||||||||||||||||
| Net investment income | (0.09 | ) | (0.22 | ) | (0.22 | ) | (0.12 | ) | (0.15 | ) | (0.16 | ) | ||||||||||||
| Net realized gains | — | (0.14 | ) | — | — | — | — | |||||||||||||||||
| Total from distributions | (0.09 | ) | (0.36 | ) | (0.22 | ) | (0.12 | ) | (0.15 | ) | (0.16 | ) | ||||||||||||
| Net asset value, end of period | $ | 15.42 | $ | 12.99 | $ | 11.24 | $ | 12.87 | $ | 12.68 | $ | 9.85 | ||||||||||||
| Total Return(c) | 19.44 | % (d) | 18.91 | % | (11.11 | )% | 2.42 | % (d) | 30.41 | % | 0.10 | % (d) | ||||||||||||
| Ratios/Supplemental Data: | ||||||||||||||||||||||||
| Net assets, end of period (000 omitted) | $ | 24,882 | $ | 20,789 | $ | 17,573 | $ | 19,864 | $ | 19,449 | $ | 14,953 | ||||||||||||
| Before waiver or recoupment: | ||||||||||||||||||||||||
| Ratio of expenses to average net assets | 1.58 | % (e) | 1.66 | % | 1.67 | % | 1.78 | % (e) | 1.73 | % | 1.94 | % (e) | ||||||||||||
| After waiver or recoupment: | ||||||||||||||||||||||||
| Ratio of expenses to average net assets | 0.95 | % (e) | 0.95 | % | 0.95 | % | 0.95 | % (e) | 0.95 | % | 0.95 | % (e) | ||||||||||||
| Ratio of net investment income to average net assets | 1.26 | % (e) | 1.71 | % | 1.71 | % | 1.94 | % (e) | 1.40 | % | 1.64 | % (e) | ||||||||||||
| Portfolio turnover rate | 4 | % (d) | 7 | % | 25 | % | 6 | % (d) | 47 | % | 29 | % (d) | ||||||||||||
| (a) | The Fund changed its fiscal year end to September 30. |
| (b) | For the period May 1, 2019 (commencement of operations) to April 30, 2020. |
| (c) | Total return represents the rate that the investor would have earned or lost on an investment in the Fund, assuming reinvestment of distributions. |
| (d) | Not annualized. |
| (e) | Annualized. |
See accompanying notes which are an integral part of these financial statements.
21
| Guardian Capital Fundamental Global Equity Fund - Institutional Shares |
| Financial Highlights |
(For a share outstanding during each period)
| For the Six | ||||||||||||||||||||
| Months | For the | |||||||||||||||||||
| Ended | Period | |||||||||||||||||||
| March | Ended | |||||||||||||||||||
| 31, 2024 | For the Years Ended September 30, | September | ||||||||||||||||||
| (Unaudited) | 2023 | 2022 | 2021 | 30, 2020(a) | ||||||||||||||||
| Net asset value, beginning of period | $ | 11.95 | $ | 9.83 | $ | 12.84 | $ | 10.62 | $ | 10.00 | ||||||||||
| Investment operations: | ||||||||||||||||||||
| Net investment income | 0.02 | 0.07 | 0.03 | 0.03 | 0.02 | |||||||||||||||
| Net realized and unrealized gain (loss) on investments | 1.57 | 2.16 | (2.65 | ) | 2.22 | 0.62 | ||||||||||||||
| Total from investment operations | 1.59 | 2.23 | (2.62 | ) | 2.25 | 0.64 | ||||||||||||||
| Distributions from: | ||||||||||||||||||||
| Net investment income | (0.02 | ) | (0.05 | ) | (0.02 | ) | (0.03 | ) | (0.02 | ) | ||||||||||
| Net realized gains | (0.30 | ) | (0.06 | ) | (0.37 | ) | — | — | ||||||||||||
| Total from distributions | (0.32 | ) | (0.11 | ) | (0.39 | ) | (0.03 | ) | (0.02 | ) | ||||||||||
| Net asset value, end of period | $ | 13.22 | $ | 11.95 | $ | 9.83 | $ | 12.84 | $ | 10.62 | ||||||||||
| Total Return(b) | 13.50 | % (c) | 22.73 | % | (21.15 | )% | 21.19 | % | 6.39 | % (c) | ||||||||||
| Ratios/Supplemental Data: | ||||||||||||||||||||
| Net assets, end of period (000 omitted) | $ | 89,616 | $ | 78,829 | $ | 28,247 | $ | 29,756 | $ | 22,862 | ||||||||||
| Before waiver or recoupment: | ||||||||||||||||||||
| Ratio of expenses to average net assets | 1.09 | % (d) | 1.13 | % | 1.51 | % | 1.53 | % | 1.82 | % (d) | ||||||||||
| After waiver or recoupment: | ||||||||||||||||||||
| Ratio of expenses to average net assets | 0.99 | % (d) | 0.99 | % | 0.99 | % | 0.99 | % | 0.99 | % (d) | ||||||||||
| Ratio of net investment income to average net assets | 0.37 | % (d) | 0.58 | % | 0.28 | % | 0.22 | % | 0.26 | % (d) | ||||||||||
| Portfolio turnover rate | 13 | % (c) | 4 | % | 4 | % | 14 | % | 10 | % (c) | ||||||||||
| (a) | For the period December 19, 2019 (commencement of operations) to September 30, 2020. |
| (b) | Total return represents the rate that the investor would have earned or lost on an investment in the Fund, assuming reinvestment of distributions. |
| (c) | Not annualized. |
| (d) | Annualized. |
See accompanying notes which are an integral part of these financial statements.
22
| Alta Quality Growth Fund - Institutional Shares |
| Financial Highlights |
(For a share outstanding during each period)
| For the Six | ||||||||||||||||||||||||
| Months | For the | |||||||||||||||||||||||
| Ended | Period | |||||||||||||||||||||||
| March | Ended | |||||||||||||||||||||||
| 31, 2024 | For the Years Ended September 30, | September | ||||||||||||||||||||||
| (Unaudited) | 2023 | 2022 | 2021 | 2020 | 30, 2019(a) | |||||||||||||||||||
| Net asset value, beginning of period | $ | 14.27 | $ | 12.56 | $ | 17.65 | $ | 13.80 | $ | 12.57 | $ | 10.00 | ||||||||||||
| Investment operations: | ||||||||||||||||||||||||
| Net investment income (loss) | —(b) | 0.01 | (0.04 | ) | (0.05 | ) | 0.02 | 0.04 | ||||||||||||||||
| Net realized and unrealized gain (loss) on investments | 2.82 | 2.51 | (4.70 | ) | 3.91 | 1.59 | 2.53 | |||||||||||||||||
| Total from investment operations | 2.82 | 2.52 | (4.74 | ) | 3.86 | 1.61 | 2.57 | |||||||||||||||||
| Distributions from: | ||||||||||||||||||||||||
| Net investment income | — | — | — | (0.01 | ) | (0.05 | ) | — | ||||||||||||||||
| Net realized gains | (0.02 | ) | (0.81 | ) | (0.35 | ) | — | (0.33 | ) | — | ||||||||||||||
| Total from distributions | (0.02 | ) | (0.81 | ) | (0.35 | ) | (0.01 | ) | (0.38 | ) | — | |||||||||||||
| Net asset value, end of period | $ | 17.07 | $ | 14.27 | $ | 12.56 | $ | 17.65 | $ | 13.80 | $ | 12.57 | ||||||||||||
| Total Return(c) | 19.76 | % (d) | 21.04 | % | (27.45 | )% | 27.96 | % | 12.92 | % | 25.70 | % (d) | ||||||||||||
| Ratios/Supplemental Data: | ||||||||||||||||||||||||
| Net assets, end of period (000 omitted) | $ | 72,331 | $ | 57,818 | $ | 39,128 | $ | 51,805 | $ | 38,490 | $ | 27,446 | ||||||||||||
| Before waiver or recoupment: | ||||||||||||||||||||||||
| Ratio of expenses to average net assets | 1.09 | % (e) | 1.16 | % | 1.18 | % | 1.18 | % | 1.30 | % | 1.54 | % (e) | ||||||||||||
| After waiver or recoupment: | ||||||||||||||||||||||||
| Ratio of expenses to average net assets | 0.79 | % (e) | 0.79 | % | 0.79 | % | 0.79 | % | 0.79 | % | 0.79 | % (e) | ||||||||||||
| Ratio of net investment income (loss) to average net assets | 0.01 | % (e) | 0.04 | % | (0.24 | )% | (0.32 | )% | 0.14 | % | 0.45 | % (e) | ||||||||||||
| Portfolio turnover rate | 3 | % (d) | 22 | % | 19 | % | 16 | % | 26 | % | 16 | % (d) | ||||||||||||
| (a) | For the period December 19, 2018 (commencement of operations) to September 30, 2019. |
| (b) | Rounds to less than $0.005 per share. |
| (c) | Total return represents the rate that the investor would have earned or lost on an investment in the Fund, assuming reinvestment of distributions. |
| (d) | Not annualized. |
| (e) | Annualized. |
See accompanying notes which are an integral part of these financial statements.
23
| Guardian Capital Funds |
| Notes to the Financial Statements |
| March 31, 2024 - (Unaudited) |
NOTE 1. ORGANIZATION
The Guardian Capital Dividend Growth Fund (“Guardian Dividend Fund”), Guardian Capital Fundamental Global Equity Fund (“Guardian Equity Fund”) and Alta Quality Growth Fund (“Alta Growth Fund”) (each a “Fund” and, collectively the “Funds”) were organized as diversified (Guardian Dividend Fund and Alta Growth Fund) and non-diversified (Guardian Equity Fund) series of the Capitol Series Trust (the “Trust”). The Funds are registered under the Investment Company Act of 1940, as amended (“1940 Act”). The Trust is an open-end investment company established under the laws of Ohio by an Agreement and Declaration of Trust dated September 18, 2013 as amended and restated November 18, 2021 (the “Trust Agreement”). The Trust Agreement permits the Board of Trustees of the Trust (the “Board”) to issue an unlimited number of shares of beneficial interest of separate series without par value. The Guardian Dividend Fund’s and Guardian Equity Fund’s investment adviser is Guardian Capital LP and the Alta Growth Fund’s investment adviser is Alta Capital Management, LLC (each an “Adviser”). Alta Capital Management, LLC is a wholly-owned U.S. domiciled subsidiary of Guardian Capital LP. The Guardian Equity Fund’s sub-adviser is GuardCap Asset Management Limited, a non-U.S. wholly-owned subsidiary of Guardian Capital LP domiciled in the United Kingdom. The investment objective of the Guardian Dividend Fund is to provide long-term capital appreciation and current income. The investment objective of the Guardian Equity Fund is to provide long-term capital appreciation. The investment objective of the Alta Growth Fund is to seek long-term growth of capital with lower than market volatility.
Each Fund currently offers one class of shares, Institutional Shares. Each share represents an equal proportionate interest in the assets and liabilities belonging to the Funds and is entitled to such dividends and distributions out of income belonging to the Funds as are declared by the Board.
NOTE 2. SIGNIFICANT ACCOUNTING POLICIES
The Funds are investment companies and follow accounting and reporting guidance under Financial Accounting Standards Board Accounting Standards Codification (“ASC”) Topic 946, “Financial Services-Investment Companies”. The following is a summary of significant accounting policies followed by the Funds in the preparation of their financial statements. These policies are in conformity with generally accepted accounting principles in the United States of America (“GAAP”).
Regulatory Update – Tailored Shareholder Reports for Mutual Funds and Exchange-Traded Funds (“ETFs”) – Effective January 24, 2023, the Securities and Exchange Commission adopted rule and form amendments that will result in changes to the design and delivery of shareholder reports of mutual funds and ETFs, requiring them to transmit
24
| Guardian Capital Funds |
| Notes to the Financial Statements (continued) |
| March 31, 2024 - (Unaudited) |
concise and visually engaging streamlined annual and semi-annual reports to shareholders that highlight key information. Other information, including financial statements, will no longer appear in a streamlined shareholder report but must be available online, delivered free of charge upon request, and filed on a semi-annual basis on Form N-CSR. The rule and form amendments have a compliance date of July 24, 2024.
Estimates – The preparation of financial statements in conformity with GAAP requires management to make estimates and assumptions that affect the reported amounts of assets and liabilities and disclosure of contingent assets and liabilities at the date of the financial statements and the reported amounts of increases and decreases in net assets from operations during the reporting period. Actual results could differ from those estimates.
Foreign Currency Translation – The accounting records of the Funds are maintained in U.S. dollars. Foreign currency amounts are translated into U.S. dollars at the current rate of exchange each business day to determine the value of investments, and other assets and liabilities. Purchases and sales of foreign securities, and income and expenses, are translated at the prevailing rate of exchange on the respective date of these transactions. The Funds do not isolate that portion of the results of operations resulting from changes in foreign exchange rates on investments from fluctuation arising from changes in market prices of securities held. These fluctuations are included with the unrealized gain or loss from investments.
Federal Income Taxes – The Funds make no provision for federal income or excise tax. Each Fund has qualified and intends to qualify each year as a regulated investment company (“RIC”) under subchapter M of the Internal Revenue Code of 1986, as amended, by complying with the requirements applicable to RICs and by distributing substantially all of its taxable income. Each Fund also intends to distribute sufficient net investment income and net capital gains, if any, so that it will not be subject to excise tax on undistributed income and gains. If the required amount of net investment income or gains is not distributed, the Funds could incur a tax expense.
The Funds may be subject to taxes imposed by countries in which they invest. Such taxes are generally based on income and/or capital gains earned or repatriated. Taxes are accrued and applied to net investment income, net realized gains and unrealized appreciation as such income and/or gains are earned.
The Funds recognize tax benefits or expenses of uncertain tax positions only when the position is “more likely than not” to be sustained assuming examination by tax authorities. Management of the Funds has reviewed tax positions taken in tax years that remain subject to examination by all major tax jurisdictions, including federal (i.e., the previous three tax year ends and the interim tax period since then, as applicable) and has concluded
25
| Guardian Capital Funds |
| Notes to the Financial Statements (continued) |
| March 31, 2024 - (Unaudited) |
that no provision for unrecognized tax benefits or expenses is required in these financial statements and does not expect this to change over the next twelve months. The Funds recognize interest and penalties, if any, related to unrecognized tax benefits as income tax expense in the Statements of Operations. During the period, the Funds did not incur any interest or penalties.
Expenses – Expenses incurred by the Trust that do not relate to a specific fund are allocated to the individual funds of the Trust based on each fund’s relative net assets or another appropriate basis (as determined by the Board).
Security Transactions and Related Income – Throughout the reporting period, security transactions are accounted for no later than one business day following the trade date. For financial reporting purposes, security transactions are accounted for on trade date on the last business day of the reporting period. The specific identification method is used for determining gains or losses for financial statements and income tax purposes. Dividend income is recorded on the ex-dividend date. Interest income is recorded on an accrual basis and includes, where applicable, the amortization of premium or accretion of discount. Withholding taxes on foreign dividends have been recorded for in accordance with the Funds’ understanding of the applicable country’s tax rules and rates.
Dividends and Distributions – The Guardian Dividend Fund and the Guardian Equity Fund intend to distribute their net investment income quarterly and their net realized long-term and short-term capital gains, if any, at least annually. The Alta Growth Fund intends to distribute its net investment income and net realized long-term and short-term capital gains, if any, at least annually. Dividends and distributions to shareholders, which are determined in accordance with income tax regulations, are recorded on the ex-dividend date. The treatment for financial reporting purposes of distributions made to shareholders during the period from net investment income or net realized capital gains may differ from their ultimate treatment for federal income tax purposes. These differences are caused primarily by differences in the timing of the recognition of certain components of income, expense or realized capital gain for federal income tax purposes. Where such differences are permanent in nature, they are reclassified among the components of the net assets based on their ultimate characterization for federal income tax purposes. Any such reclassifications will have no effect on net assets, results of operations or net asset value (“NAV”) per share of the Funds.
26
| Guardian Capital Funds |
| Notes to the Financial Statements (continued) |
| March 31, 2024 - (Unaudited) |
NOTE 3. SECURITIES VALUATION AND FAIR VALUE MEASUREMENTS
Each Fund values its portfolio securities at fair value as of the close of regular trading on the New York Stock Exchange (“NYSE”) (normally 4:00 p.m. Eastern Time) on each business day the NYSE is open for business. Fair value is defined as the price that a Fund would receive upon selling an investment or transferring a liability in a timely transaction to an independent buyer in the principal or most advantageous market of the investment. GAAP establishes a three-tier hierarchy to maximize the use of observable market data and minimize the use of unobservable inputs and to establish classification of fair value measurements for disclosure purposes.
Inputs refer broadly to the assumptions that market participants would use in pricing the asset or liability, including assumptions about risk (the risk inherent in a particular valuation technique used to measure fair value including a pricing model and/or the risk inherent in the inputs to the valuation technique). Inputs may be observable or unobservable. Observable inputs are inputs that reflect the assumptions market participants would use in pricing the asset or liability developed based on market data obtained and available from sources independent of the reporting entity. Unobservable inputs are inputs that reflect the reporting entity’s own assumptions about the assumptions market participants would use in pricing the asset or liability developed based on the best information available in the circumstances.
Various inputs are used in determining the value of each Fund’s investments. These inputs are summarized in the three broad levels listed below.
| ● | Level 1 – unadjusted quoted prices in active markets for identical investments and/or registered investment companies where the value per share is determined and published and is the basis for current transactions for identical assets or liabilities at the valuation date |
| ● | Level 2 – other significant observable inputs (including, but not limited to, quoted prices for an identical security in an inactive market, quoted prices for similar securities, interest rates, prepayment speeds, credit risk, etc.) |
| ● | Level 3 – significant unobservable inputs (including the Funds’ own assumptions in determining fair value of investments based on the best information available) |
The inputs used to measure fair value may fall into different levels of the fair value hierarchy. In such cases, for disclosure purposes, the level in the fair value hierarchy which is reported is determined based on the lowest level input that is significant to the fair value measurement in its entirety.
27
| Guardian Capital Funds |
| Notes to the Financial Statements (continued) |
| March 31, 2024 - (Unaudited) |
In computing the NAV of the Funds, fair value is based on market valuations with respect to portfolio securities for which market quotations are readily available. Pursuant to Board approved policies, the Funds rely on independent third-party pricing services to provide the current market value of securities. Those pricing services value equity securities, including exchange-traded funds, exchange-traded notes, closed-end funds and preferred stocks, traded on a securities exchange at the last reported sales price on the principal exchange. Equity securities quoted by NASDAQ are valued at the NASDAQ Official Closing Price. If there is no reported sale on the principal exchange, equity securities are valued at the mean between the most recent quoted bid and asked price. When using market quotations or close prices provided by the pricing service and when the market is considered active, the security will be classified as a Level 1 security. Investments in open-end mutual funds, including money market mutual funds, are generally priced at the ending NAV provided by the pricing service of the funds and are generally categorized as Level 1 securities.
In the event that market quotations are not readily available or are considered unreliable due to market or other events, securities are valued in good faith by the Adviser as “valuation designee” under the oversight of the Board. The Adviser has adopted written policies and procedures for valuing securities and other assets in circumstances where market quotes are not readily available. In the event that market quotes are not readily available, and the security or asset cannot be valued pursuant to one of the valuation methods, the value of the security or asset will be determined in good faith by the Adviser pursuant to its policies and procedures. On a quarterly basis, the Adviser’s fair valuation determinations will be reviewed by the Board. Under these policies, the securities will be classified as Level 2 or 3 within the fair value hierarchy, depending on the inputs used.
The following is a summary of the inputs used to value the Funds’ investments as of March 31, 2024:
| Valuation Inputs | ||||||||||||||||
| Assets | Level 1 | Level 2 | Level 3 | Total | ||||||||||||
| Guardian Dividend Fund | ||||||||||||||||
| Common Stocks (a) | $ | 24,484,006 | $ | — | $ | — | $ | 24,484,006 | ||||||||
| Money Market Funds | 369,109 | — | — | 369,109 | ||||||||||||
| Total | $ | 24,853,115 | $ | — | $ | — | $ | 24,853,115 | ||||||||
| Guardian Equity Fund | ||||||||||||||||
| Common Stocks (a) | $ | 88,728,012 | $ | — | $ | — | $ | 88,728,012 | ||||||||
| Money Market Funds | 564,817 | — | — | 564,817 | ||||||||||||
| Total | $ | 89,292,829 | $ | — | $ | — | $ | 89,292,829 | ||||||||
| Alta Growth Fund | ||||||||||||||||
| Common Stocks (a) | $ | 71,243,050 | $ | — | $ | — | $ | 71,243,050 | ||||||||
| Total | $ | 71,243,050 | $ | — | $ | — | $ | 71,243,050 | ||||||||
| (a) | Refer to Schedule of Investments for sector classifications. |
28
| Guardian Capital Funds |
| Notes to the Financial Statements (continued) |
| March 31, 2024 - (Unaudited) |
The Funds did not hold any investments during or at the end of the reporting period in which significant unobservable inputs (Level 3) were used in determining fair value; therefore, no reconciliation of Level 3 securities is included for this reporting period.
NOTE 4. FEES AND OTHER TRANSACTIONS WITH AFFILIATES AND OTHER SERVICE PROVIDERS
Each Adviser manages its Funds’ investments under the terms of the investment advisory agreement with the Trust with respect to each Fund (each an “Agreement”). As compensation for its management services, each Fund pays its Adviser a fee based on the Fund’s average daily net assets as follows:
| Guardian Dividend | Guardian Equity | |||||
| Fund | Fund | Alta Growth Fund | ||||
| Management fee rate | 0.75% | 0.80% | 0.75% | |||
| Management fees earned | $85,860 | $340,099 | $242,646 | |||
| Fees waived/expenses reimbursed | $(72,261) | $(41,666) | $(96,075) |
Each Adviser has contractually agreed to waive its management fee and/or reimburse expenses so that total annual operating expenses (excluding (i) interest; (ii) taxes; (iii) brokerage fees and commissions; (iv) other extraordinary expenses not incurred in the ordinary course of each Fund’s business; (v) dividend expenses on short sales; and (vi) indirect expenses such as acquired fund fees and expenses) do not exceed 0.95% of the Guardian Dividend Fund’s, 0.99% of the Guardian Equity Fund’s and 0.79% of the Alta Growth Fund’s average daily net assets through January 31, 2025 (“Expense Limitation”). During any fiscal year that the Agreements between each Adviser and the Trust is in effect, the Adviser may recoup the sum of all fees previously waived or expenses reimbursed with respect to each Fund it advises, less any reimbursement previously paid, provided that the Adviser is only permitted to recoup fees or expenses within 36 months from the date the fee waiver or expense reimbursement took effect and provided further that such recoupment can be achieved within the Expense Limitation currently in effect and the Expense Limitation in place when the waiver/reimbursement occurred. This Expense Limitation agreement may not be terminated by the Adviser prior to its expiration date, but the Board may terminate such agreement at any time.
29
| Guardian Capital Funds |
| Notes to the Financial Statements (continued) |
| March 31, 2024 - (Unaudited) |
As of March 31, 2024, each respective Adviser may seek repayment of investment advisory fee waivers and expense reimbursements in the amount as follows:
| Guardian | ||||||||
| Dividend | ||||||||
| Recoverable Through | Fund | |||||||
| April 30, 2024 | $ | 11,870 | ||||||
| September 30, 2024 | 63,443 | |||||||
| September 30, 2025 | 147,961 | |||||||
| September 30, 2026 | 144,066 | |||||||
| March 31, 2027 | 72,261 | |||||||
| Guardian | Alta Growth | |||||||
| Recoverable Through | Equity Fund | Fund | ||||||
| September 30, 2024 | $ | — | $ | 93,671 | ||||
| September 30, 2025 | 109,000 | 192,184 | ||||||
| September 30, 2026 | 102,610 | 183,313 | ||||||
| March 31, 2027 | 41,666 | 96,075 | ||||||
The Trust retains Ultimus Fund Solutions, LLC (the “Administrator”) to provide the Funds with administration, fund accounting and transfer agent services, including all regulatory reporting. Northern Lights Compliance Services, LLC (“NLCS”), an affiliate of the Administrator, provides a Chief Compliance Officer to the Trust, as well as related compliance services, pursuant to a consulting agreement between NLCS and the Trust.
The Board supervises the business activities of the Trust. Each Trustee serves as a Trustee for the lifetime of the Trust or until the earlier of his or her required retirement as a Trustee at age 78 (which may be extended for up to two years in an emeritus non-voting capacity at the pleasure and request of the Board), or until he/she dies, resigns, or is removed, whichever is sooner. “Independent Trustees,” meaning those Trustees who are not “interested persons” of the Trust, as defined in the 1940 Act, as amended, have each received an annual retainer of $1,500 per Fund and $500 per Fund for each quarterly Board meeting though March 31, 2023. Effective April 1, 2023, the annual retainer increased to $2,000 per Fund. In addition, each Independent Trustee may be compensated for preparation related to and participation in any special meetings of the Board and/or any Committee of the Board, with such compensation determined on a case-by-case basis based on the length and complexity of the meeting. The Trust also reimburses Trustees for out-of-pocket expense incurred in conjunction with attendance at Board meetings.
The officers and one trustee of the Trust are employees of the Administrator. Ultimus Fund Distributors, LLC (the “Distributor”) acts as the principal distributor of each Fund’s shares. The Distributor is a wholly-owned subsidiary of the Administrator. The Distributor is compensated by the Adviser (not the Funds) for acting as principal underwriter.
30
| Guardian Capital Funds |
| Notes to the Financial Statements (continued) |
| March 31, 2024 - (Unaudited) |
NOTE 5. PURCHASES AND SALES OF SECURITIES
For the six months ended March 31, 2024, purchases and sales of investment securities, other than short-term investments, were as follows:
| Guardian | Guardian | Alta Growth | ||||||||||
| Dividend Fund | Equity Fund | Fund | ||||||||||
| Purchases | $ | 904,198 | $ | 11,039,293 | $ | 4,718,562 | ||||||
| Sales | $ | 893,235 | $ | 10,443,679 | $ | 1,795,736 | ||||||
There were no purchases or sales of long-term U.S. government obligations during the six months ended March 31, 2024.
NOTE 6. FEDERAL TAX INFORMATION
At March 31, 2024, the net unrealized appreciation (depreciation) and tax cost of investments for tax purposes were as follows:
| Guardian | Guardian | Alta Growth | ||||||||||
| Dividend Fund | Equity Fund | Fund | ||||||||||
| Gross unrealized appreciation | $ | 9,133,862 | $ | 18,079,344 | $ | 23,533,802 | ||||||
| Gross unrealized depreciation | (186,141 | ) | (4,189,812 | ) | (130,834 | ) | ||||||
| Net unrealized appreciation/(depreciation) on investments | $ | 8,947,721 | $ | 13,889,532 | $ | 23,402,968 | ||||||
| Tax cost of investments | $ | 15,905,394 | $ | 75,403,297 | $ | 47,840,082 | ||||||
The tax character of distributions paid for the fiscal year ended September 30, 2023, the Funds’ most recent fiscal year end, were as follows:
| Guardian | Guardian | Alta Growth | ||||||||||
| Dividend Fund | Equity Fund | Fund | ||||||||||
| Distributions paid from: | ||||||||||||
| Ordinary income(a) | $ | 346,641 | $ | 297,126 | $ | — | ||||||
| Long-term capital gains | 229,867 | 400,284 | 2,565,420 | |||||||||
| Total distributions paid | $ | 576,508 | $ | 697,410 | $ | 2,565,420 | ||||||
| (a) | Short-term capital gain distributions are treated as ordinary income for tax purposes. |
31
| Guardian Capital Funds |
| Notes to the Financial Statements (continued) |
| March 31, 2024 - (Unaudited) |
At September 30, 2023, the components of accumulated earnings (deficit) on a tax basis were as follows:
| Guardian | ||||||||||||
| Dividend | Guardian | Alta Growth | ||||||||||
| Fund | Equity Fund | Fund | ||||||||||
| Undistributed ordinary income | $ | 24,701 | $ | 5,287 | $ | — | ||||||
| Undistributed long-term capital gains | — | 1,867,459 | — | |||||||||
| Distributions payable | (20,207 | ) | (1,842 | ) | — | |||||||
| Accumulated capital and other losses | (470,690 | ) | — | (100,690 | ) | |||||||
| Unrealized appreciation on investments(a) | 5,052,114 | 5,307,493 | 10,710,380 | |||||||||
| Total accumulated earnings | $ | 4,585,918 | $ | 7,178,397 | $ | 10,609,690 | ||||||
| (a) | The difference between book basis and tax basis unrealized appreciation (depreciation) is primarily attributable to the tax deferral of wash losses. |
As of September 30, 2023, the Guardian Dividend Fund had available for tax purposes unused capital loss carryforwards of $178,197 and $292,493 of short-term and long-term capital loss carryforwards, respectively, with no expiration, which was available to offset against future taxable net capital gains. To the extent that these carryforwards are used to offset future gains, it is probable that the amount offset will not be distributed to shareholders.
Certain qualified late year ordinary losses incurred after October 31, and within the current taxable year, are deemed to arise on the first business day of the Funds following taxable year. For the tax year ended September 30, 2023, the Alta Growth Fund deferred post October qualified losses in the amount of $100,690.
NOTE 7. SECTOR RISK
If a Fund has significant investments in the securities of issuers within a particular sector, any development affecting that sector will have a greater impact on the value of the net assets of the Fund than would be the case if the Fund did not have significant investments in that sector. In addition, this may increase the risk of loss in a Fund and increase the volatility of a Fund’s NAV per share. For instance, economic or market factors, regulatory changes or other developments may negatively impact all companies in a particular sector, and therefore the value of a Fund’s portfolio will be adversely affected. As of March 31, 2024, the Guardian Dividend Fund and Alta Growth Fund had 30.70% and 42.85% of the value of their net assets invested in stocks within the Technology sector, respectively.
32
| Guardian Capital Funds |
| Notes to the Financial Statements (continued) |
| March 31, 2024 - (Unaudited) |
NOTE 8. BENEFICIAL OWNERSHIP
The beneficial ownership, either directly or indirectly, of more than 25% of the voting securities of a fund creates a presumption of control of the fund, under Section 2(a) (9) of the 1940 Act. As of March 31, 2024, Alexandria Bancorp Limited owned 100%, 31% and 47% of the Guardian Dividend Fund, Guardian Equity Fund and Alta Growth Fund, respectively. National Financial Services LLC owned 54% of the Guardian Equity Fund. As a result, Alexandria Bancorp Limited and National Financial Services LLC may be deemed to control the Funds.
NOTE 9. COMMITMENTS AND CONTINGENCIES
The Trust indemnifies its officers and Trustees for certain liabilities that may arise from their performance of their duties to the Trust or the Funds. Additionally, in the normal course of business, the Trust enters into contracts that contain a variety of representations and warranties which provide general indemnifications. The Trust’s maximum exposure under these arrangements is unknown, as this would involve future claims that may be made against the Trust that have not yet occurred.
NOTE 10. SUBSEQUENT EVENTS
Management of the Funds has evaluated the need for disclosures and/or adjustments resulting from subsequent events through the date at which these financial statements were issued. Based upon this evaluation, management has determined there were no items requiring adjustment of the financial statements or additional disclosure.
33
| Liquidity Risk Management Program (Unaudited) |
The Trust has adopted and implemented a written liquidity risk management program (the “Program”) as required by Rule 22e-4 (the “Liquidity Rule”) under the 1940 Act. The Program applies to each individual series of the Trust. The Program is reasonably designed to assess and manage the Fund’s liquidity risk, taking into consideration, among other factors, the Fund’s investment strategy and the liquidity of its portfolio investments during normal and reasonably foreseeable stressed conditions; its short and long-term cash flow projections; and its cash holdings and access to other funding sources. The Board approved the appointment of the Liquidity Administrator Committee, comprising certain Trust officers and employees of the Adviser. The Liquidity Administrator Committee maintains Program oversight and reports to the Board on at least an annual basis regarding the Program’s operational effectiveness through a written report (the “Report”). The Report outlined the operation of the Program and the adequacy and effectiveness of the Program’s implementation and was presented to the Board for consideration at its meeting held on December 7 and 8, 2023. During the review period, the Fund did not experience unusual stress or disruption to its operations related to purchase and redemption activity. Also, during the review period the Fund held adequate levels of cash and highly liquid investments to meet shareholder redemption activities in accordance with applicable requirements. The Report concluded that the Program is reasonably designed to prevent violation of the Liquidity Rule and has been effectively implemented.
34
| Summary of Fund Expenses (Unaudited) |
As a shareholder of a Fund, you incur two types of costs: (1) transaction costs and (2) ongoing costs, including management fees and other Fund expenses. These examples are intended to help you understand your ongoing costs (in dollars) of investing in each Fund and to compare these costs with the ongoing costs of investing in other mutual funds. Each Fund’s example is based on an investment of $1,000 invested at the beginning of the period and held for the entire period from October 1, 2023 through March 31, 2024.
Actual Expenses
The first line of the table below provides information about actual account values and actual expenses. You may use the information in this line, together with the amount you invested, to estimate the expenses that you paid over the period. Simply divide your account value by $1,000 (for example, an $8,600 account value divided by $1,000 = 8.6), then multiply the result by the number in the first line under the heading “Expenses Paid During Period” to estimate the expenses you paid on your account during this period.
Hypothetical Example for Comparison Purposes
The second line of the table below provides information about hypothetical account values and hypothetical expenses based on each Fund’s actual expense ratio and an assumed rate of return of 5% per year before expenses, which is not the Fund’s actual return. The hypothetical account values and expenses may not be used to estimate the actual ending account balance or expenses you paid for the period. You may use this information to compare the ongoing costs of investing in the Funds and other funds. To do so, compare this 5% hypothetical example with the 5% hypothetical examples that appear in the shareholder reports of other funds.
Expenses shown in the table are meant to highlight your ongoing costs only and do not reflect any transactional costs. Therefore, the second line of the table for each class is useful in comparing ongoing costs only and will not help you determine the relative total costs of owning different funds. In addition, if transaction costs were included, your costs would have been higher.
| Beginning | Ending | ||||||||||
| Account | Account | Expenses | |||||||||
| Value | Value | Paid | Annualized | ||||||||
| October 1, | March 31, | During | Expense | ||||||||
| 2023 | 2024 | Period(a) | Ratio | ||||||||
| Guardian Dividend Fund | |||||||||||
| Institutional Shares | Actual | $1,000.00 | $1,194.40 | $ | 5.21 | 0.95% | |||||
| Hypothetical(b) | $1,000.00 | $1,020.25 | $ | 4.80 | 0.95% | ||||||
| Guardian Equity Fund | |||||||||||
| Institutional Shares | Actual | $1,000.00 | $1,135.00 | $ | 5.28 | 0.99% | |||||
| Hypothetical(b) | $1,000.00 | $1,020.05 | $ | 5.00 | 0.99% | ||||||
| Alta Growth Fund | |||||||||||
| Institutional Shares | Actual | $1,000.00 | $1,197.60 | $ | 4.34 | 0.79% | |||||
| Hypothetical(b) | $1,000.00 | $1,021.05 | $ | 3.99 | 0.79% | ||||||
| (a) | Expenses are equal to the Fund’s annualized expense ratios, multiplied by the average account value over the period, multiplied by 183/366 (to reflect the one-half year period). |
| (b) | Hypothetical assumes 5% annual return before expenses. |
35
| FACTS | WHAT DO THE GUARDIAN CAPITAL FUNDS (THE “FUNDS”) DO WITH YOUR PERSONAL INFORMATION? |
| Why? | Financial companies choose how they share your personal information. Federal law gives consumers the right to limit some but not all sharing. Federal law also requires us to tell you how we collect, share, and protect your personal information. Please read this notice carefully to understand what we do. |
| What? | The types of personal information we collect and share depend on the product or service you have with us. This information can include:
■ Social Security number
■ account balances and account transactions
■ transaction or loss history and purchase history
■ checking account information and wire transfer instructions
When you are no longer our customer, we continue to share your information as described in this notice. |
| How? | All financial companies need to share customers’ personal information to run their everyday business. In the section below, we list the reasons financial companies can share their customers’ personal information; the reasons the Funds choose to share; and whether you can limit this sharing. |
| Reasons we can share your personal information | Do the Funds share? |
| For our everyday business purposes— such as to process your transactions, maintain your account(s), respond to court orders and legal investigations, or report to credit bureaus | Yes |
| For our marketing purposes— to offer our products and services to you | No |
| For joint marketing with other financial companies | No |
| For our affiliates’ everyday business purposes— information about your transactions and experiences | No |
| For our affiliates’ everyday business purposes— information about your creditworthiness | No |
| For nonaffiliates to market to you | No |
| Questions? | Call (800) 957-0681 |
36
| Who we are | |
| Who is providing this notice? | Guardian Capital Funds Ultimus Fund Distributors, LLC (Distributor) Ultimus Fund Solutions, LLC (Administrator) |
| What we do | |
| How do the Funds protect my personal information? | To protect your personal information from unauthorized access and use, we use security measures that comply with federal law. These measures include computer safeguards and secured files and buildings. Our service providers are held accountable for adhering to strict policies and procedures to prevent any misuse of your nonpublic personal information. |
| How do the Funds collect my personal information? | We collect your personal information, for example, when you
■ open an account or deposit money
■ buy securities from us or sell securities to us
■ make deposits or withdrawals from your account
■ give us your account information
■ make a wire transfer
■ tell us who receives the money
■ tell us where to send the money
■ show your government-issued ID
■ show your driver’s license
|
| Why can’t I limit all sharing? | Federal law gives you the right to limit only
■ sharing for affiliates’ everyday business purposes —information about your creditworthiness
■ affiliates from using your information to market to you
■ sharing for nonaffiliates to market to you
State laws and individual companies may give you additional rights to limit sharing. |
| Definitions | |
| Affiliates | Companies related by common ownership or control. They can be financial and nonfinancial companies.
■ Guardian Capital LP and Alta Capital Management, LLC, the investment advisers to the Funds, could be deemed to be affiliates. |
| Nonaffiliates | Companies not related by common ownership or control. They can be financial and nonfinancial companies.
■ The Guardian Capital Funds do not share your personal information with nonaffiliates so they can market to you |
| Joint marketing | A formal agreement between nonaffiliated financial companies that together market financial products or services to you.
■ The Guardian Capital Funds do not jointly market. |
37
| PROXY VOTING |
A description of the policies and procedures that each Fund uses to determine how to vote proxies relating to portfolio securities and information regarding how each Fund voted those proxies during the most recent twelve month period ended June 30, are available (1) without charge upon request by calling the Funds at (800) 957-0681 and (2) in Fund documents filed with the SEC on the SEC’s website at www.sec.gov.
| TRUSTEES Walter B. Grimm, Chairman Lori Kaiser Janet Smith Meeks Mary Madick | INDEPENDENT REGISTERED PUBLIC ACCOUNTING FIRM Ernst & Young LLP 221 East 4th Street, Suite 2900 Cincinnati, OH 45202 |
| OFFICERS Matthew J. Miller, Chief Executive Officer and President Zachary P. Richmond, Chief Financial Officer and Treasurer Martin R. Dean, Chief Compliance Officer Tiffany R. Franklin, Secretary | LEGAL COUNSEL Practus, LLP 11300 Tomahawk Creek Parkway, Suite 310 Leawood, KS 66211 |
INVESTMENT ADVISERS | CUSTODIAN Huntington National Bank 41 South High Street Columbus, OH 43215 |
| DISTRIBUTOR Ultimus Fund Distributors, LLC 225 Pictoria Drive, Suite 450 Cincinnati, OH 45246 | ADMINISTRATOR, TRANSFER AGENT AND FUND ACCOUNTANT |
This report is intended only for the information of shareholders or those who have received the Funds’ prospectus which contains information about the Funds’ management fee and expenses. Please read the prospectus carefully before investing.
Distributed by Ultimus Fund Distributors, LLC, Member FINRA/SIPC
GUARDIAN-SAR-24
| (b) | NOT APPLICABLE. |
Item 2. Code of Ethics.
NOT APPLICABLE – disclosed with annual report
Item 3. Audit Committee Financial Expert.
NOT APPLICABLE – disclosed with annual report
Item 4. Principal Accountant Fees and Services.
NOT APPLICABLE – disclosed with annual report
Item 5. Audit Committee of Listed Registrants.
NOT APPLICABLE – disclosed with annual report
Item 6. Schedule of Investments.
Schedule filed with Item 1.
Item 7. Disclosure of Proxy Voting Policies and Procedures for Closed-End Management Investment Companies.
NOT APPLICABLE – applies to closed-end funds only
Item 8. Portfolio Managers of Closed-End Management Investment Companies.
NOT APPLICABLE – applies to closed-end funds only
Item 9. Purchases of Equity Securities by Closed-End Management Investment Company and Affiliated Purchasers.
NOT APPLICABLE – applies to closed-end funds only
Item 10. Submission of Matters to a Vote of Security Holders.
The guidelines applicable to shareholders desiring to submit recommendations for nominees to the Registrant's board of trustees are contained in the statement of additional information of the Trust with respect to the Fund(s) for which this Form N-CSR is being filed.
Item 11. Controls and Procedures.
(a) Based on their evaluation of the registrant’s disclosure controls and procedures (as defined in Rule 30a-3(c) under the Investment Company Act of 1940, as amended (the “Act”)) as of a date within 90 days of the filing date of this report, the registrant’s principal executive officer and principal financial officer have concluded that such disclosure controls and procedures are reasonably designed and are operating effectively to ensure that material information relating to the registrant is made known to them by others within those entities, particularly during the period in which this report is being prepared, and that the information required in filings on Form N-CSR is recorded, processed, summarized, and reported on a timely basis.
(b) There were no changes in the registrant’s internal control over financial reporting (as defined in Rule 30a-3(d) under the Investment Company Act of 1940) that occurred during the period covered by this report that have materially affected, or are reasonably likely to materially affect, the registrant’s internal control over financial reporting.
Item 12. Disclosure of Securities Lending Activities for Closed-End Management Investment Companies.
NOT APPLICABLE – applies to closed-end funds only
Item 13. Exhibits.
(a)(1) NOT APPLICABLE – disclosed with annual report
(a)(3) NOT APPLICABLE.
SIGNATURES
Pursuant to the requirements of the Securities Exchange Act of 1934 and the Investment Company Act of 1940, the registrant has duly caused this report to be signed on its behalf by the undersigned, thereunto duly authorized.
| (Registrant) | Capitol Series Trust |
| By (Signature and Title) | /s/ Matthew J. Miller | |
| Matthew J. Miller, President and Principal Executive Officer | ||
| Date | 6/6/2024 |
Pursuant to the requirements of the Securities Exchange Act of 1934 and the Investment Company Act of 1940, this report has been signed below by the following persons on behalf of the registrant and in the capacities and on the dates indicated.
| By (Signature and Title) | /s/ Matthew J. Miller | |
| Matthew J. Miller, President and Principal Executive Officer | ||
| Date | 6/6/2024 |
| By (Signature and Title) | /s/ Zachary P. Richmond | |
| Zachary P. Richmond, Treasurer and Principal Financial Officer | ||
| Date | 6/6/2024 |