INVESTOR UPDATE September 2018

FORWARD-LOOKING STATEMENTS Statements contained in this presentation that include company expectations or predictions should be considered forward-looking statements that are covered by the safe harbor provisions of the Securities Act of 1933 and the Securities and Exchange Act of 1934. It is important to note that the actual results could differ materially from those projected in such forward-looking statements. For additional information that could cause actual results to differ materially from such forward-looking statements, refer to ONE Gas’ Securities and Exchange Commission filings. All future cash dividends (declared or paid) discussed in this presentation are subject to the approval of the ONE Gas board of directors. All references in this presentation to guidance are based on news releases issued on Jan. 16, 2018 and July 30, 2018, and are not being updated or affirmed by this presentation. 2

VALUE CREATION STRATEGY
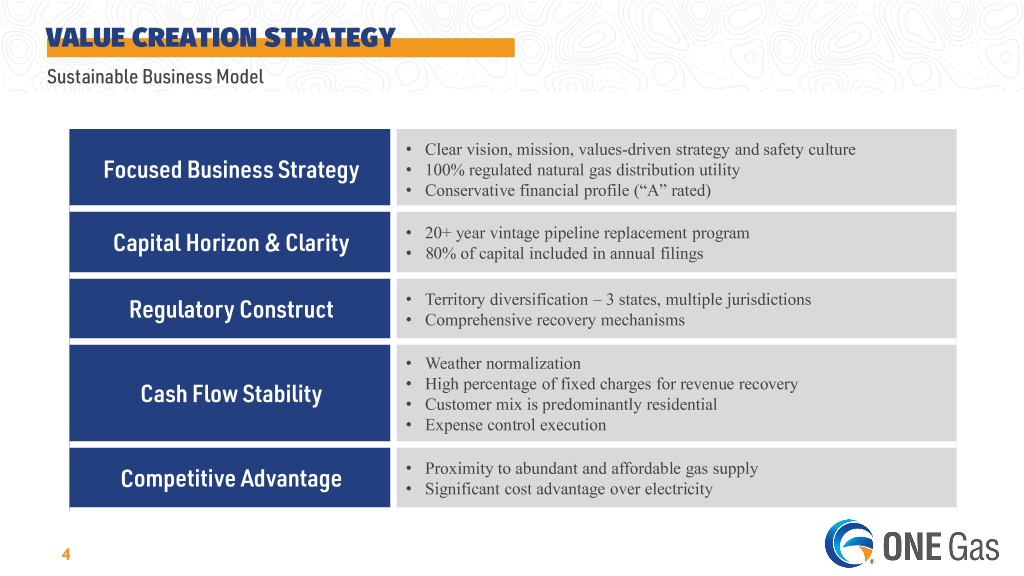
VALUE CREATION STRATEGY Sustainable Business Model • Clear vision, mission, values-driven strategy and safety culture Focused Business Strategy • 100% regulated natural gas distribution utility • Conservative financial profile (“A” rated) • 20+ year vintage pipeline replacement program Capital Horizon & Clarity • 80% of capital included in annual filings • Territory diversification – 3 states, multiple jurisdictions Regulatory Construct • Comprehensive recovery mechanisms • Weather normalization • High percentage of fixed charges for revenue recovery Cash Flow Stability • Customer mix is predominantly residential • Expense control execution • Proximity to abundant and affordable gas supply Competitive Advantage • Significant cost advantage over electricity 4

FOCUSED BUSINESS STRATEGY
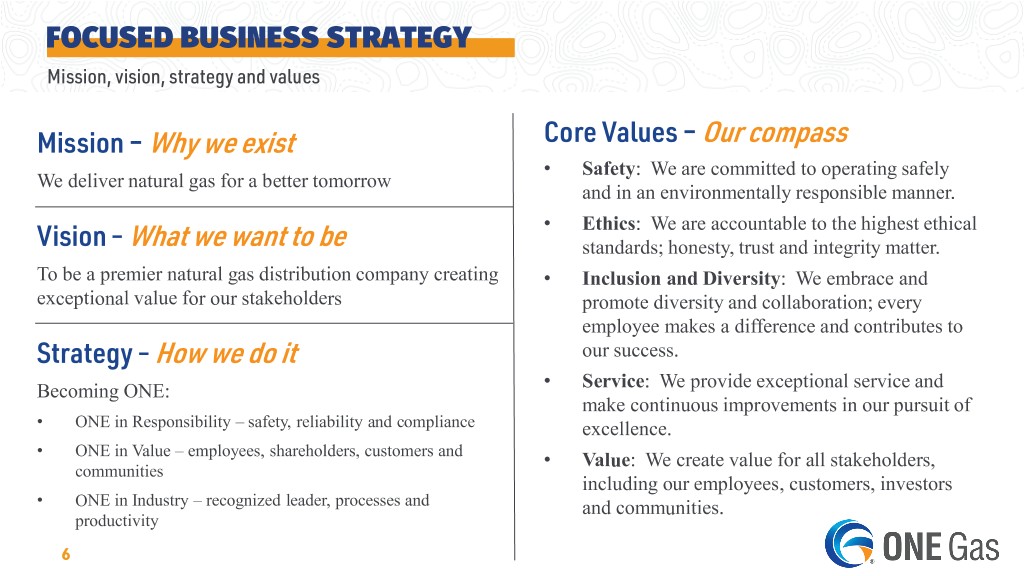
FOCUSED BUSINESS STRATEGY Mission, vision, strategy and values Mission – Why we exist Core Values – Our compass • Safety: We are committed to operating safely We deliver natural gas for a better tomorrow and in an environmentally responsible manner. • Ethics: We are accountable to the highest ethical Vision – What we want to be standards; honesty, trust and integrity matter. To be a premier natural gas distribution company creating • Inclusion and Diversity: We embrace and exceptional value for our stakeholders promote diversity and collaboration; every employee makes a difference and contributes to Strategy – How we do it our success. : We provide exceptional service and Becoming ONE: • Service make continuous improvements in our pursuit of • ONE in Responsibility – safety, reliability and compliance excellence. • ONE in Value – employees, shareholders, customers and • Value: We create value for all stakeholders, communities including our employees, customers, investors • ONE in Industry – recognized leader, processes and and communities. productivity 6
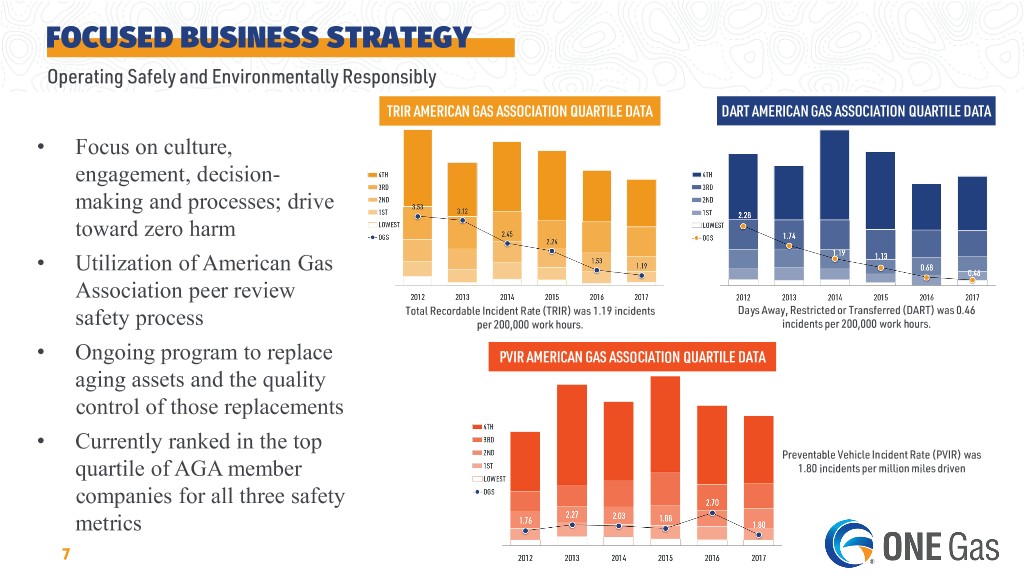
FOCUSED BUSINESS STRATEGY Operating Safely and Environmentally Responsibly TRIR AMERICAN GAS ASSOCIATION QUARTILE DATA DART AMERICAN GAS ASSOCIATION QUARTILE DATA • Focus on culture, engagement, decision- making and processes; drive toward zero harm • Utilization of American Gas Association peer review Total Recordable Incident Rate (TRIR) was 1.19 incidents Days Away, Restricted or Transferred (DART) was 0.46 safety process per 200,000 work hours. incidents per 200,000 work hours. • Ongoing program to replace PVIR AMERICAN GAS ASSOCIATION QUARTILE DATA aging assets and the quality control of those replacements Currently ranked in the top • Preventable Vehicle Incident Rate (PVIR) was quartile of AGA member 1.80 incidents per million miles driven companies for all three safety metrics 7
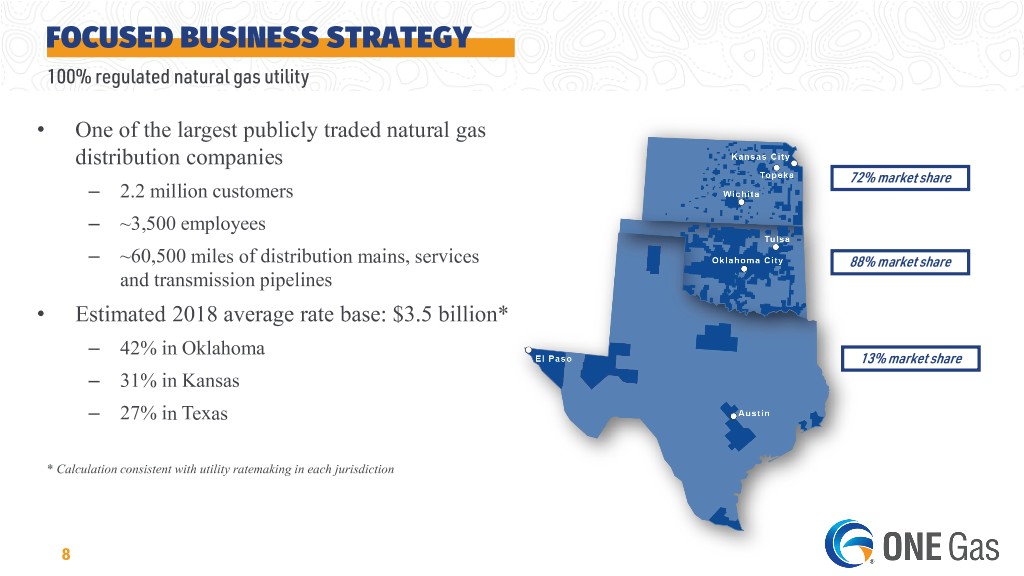
FOCUSED BUSINESS STRATEGY 100% regulated natural gas utility • One of the largest publicly traded natural gas distribution companies 72% market share – 2.2 million customers – ~3,500 employees – ~60,500 miles of distribution mains, services 88% market share and transmission pipelines • Estimated 2018 average rate base: $3.5 billion* – 42% in Oklahoma 13% market share – 31% in Kansas – 27% in Texas * Calculation consistent with utility ratemaking in each jurisdiction 8
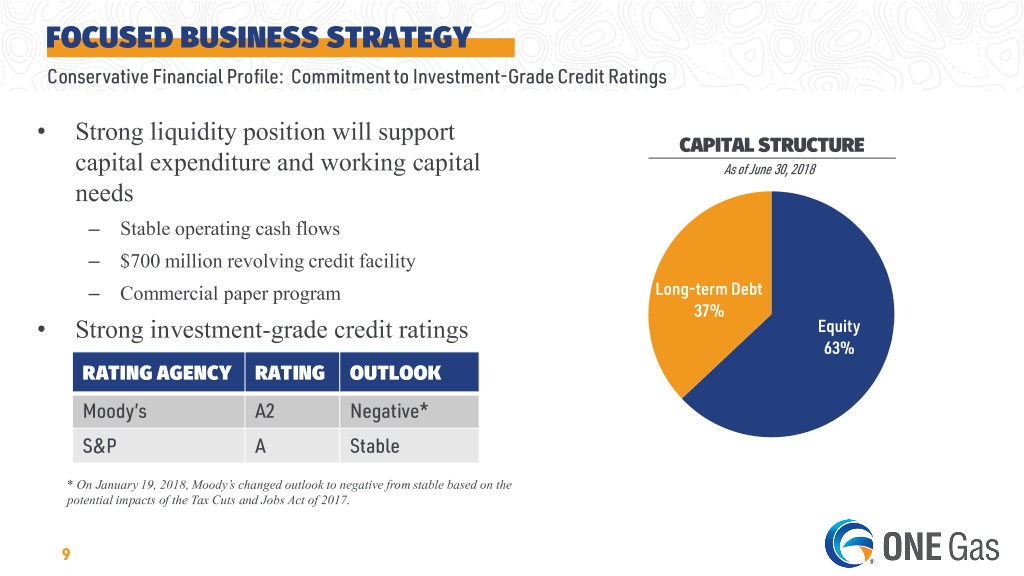
FOCUSED BUSINESS STRATEGY Conservative Financial Profile: Commitment to Investment-Grade Credit Ratings • Strong liquidity position will support CAPITAL STRUCTURE capital expenditure and working capital As of June 30, 2018 needs – Stable operating cash flows – $700 million revolving credit facility – Commercial paper program Long-term Debt 37% • Strong investment-grade credit ratings Equity 63% RATING AGENCY RATING OUTLOOK Moody’s A2 Negative* S&P A Stable * On January 19, 2018, Moody’s changed outlook to negative from stable based on the potential impacts of the Tax Cuts and Jobs Act of 2017. 9

CAPITAL HORIZON & CLARITY
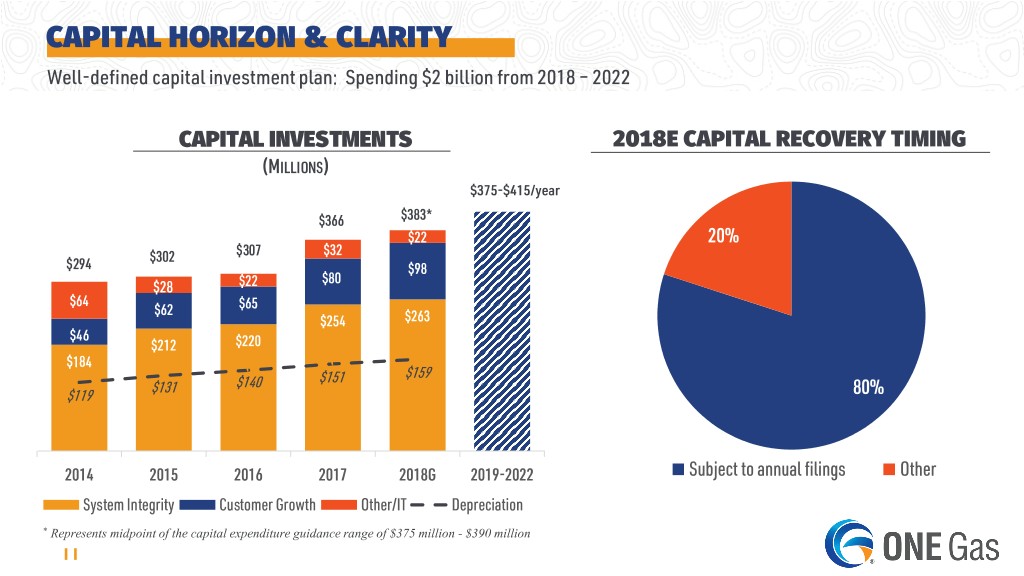
CAPITAL HORIZON & CLARITY Well-defined capital investment plan: Spending $2 billion from 2018 – 2022 CAPITAL INVESTMENTS 2018E CAPITAL RECOVERY TIMING (MILLIONS) $375-$415/year $366 $383* $22 20% $302 $307 $32 $294 $98 $80 $28 $22 $64 $62 $65 $254 $263 $46 $212 $220 $184 $151 $159 $131 $140 $119 80% 2014 2015 2016 2017 2018G 2019-2022 Subject to annual filings Other System Integrity Customer Growth Other/IT Depreciation * Represents midpoint of the capital expenditure guidance range of $375 million - $390 million 11
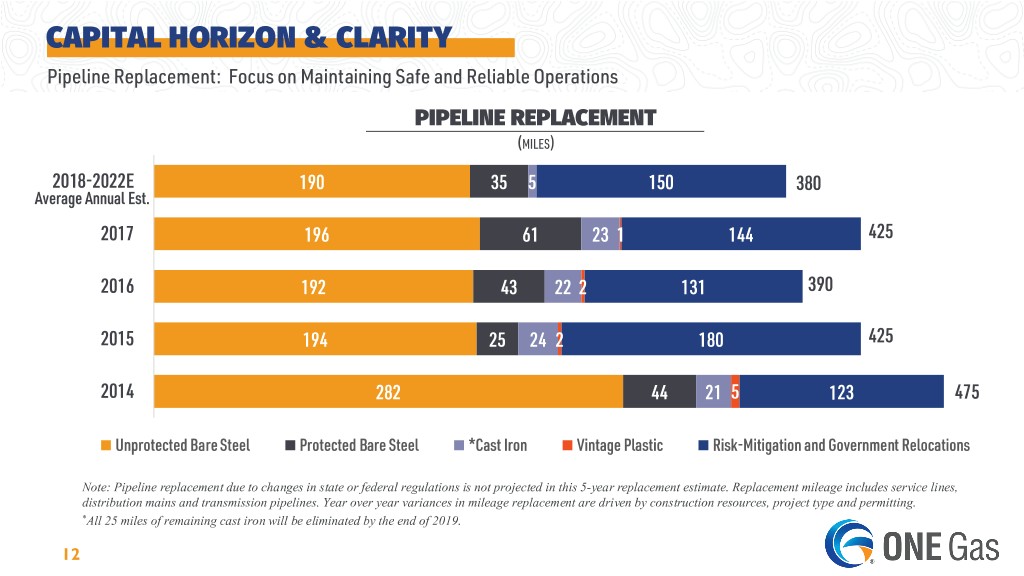
CAPITAL HORIZON & CLARITY Pipeline Replacement: Focus on Maintaining Safe and Reliable Operations PIPELINE REPLACEMENT (MILES) 2018-2022E 190 35 5 150 380 Average Annual Est. 2017 196 61 23 1 144 425 2016 192 43 22 2 131 390 2015 194 25 24 2 180 425 2014 282 44 21 5 123 475 Unprotected Bare Steel Protected Bare Steel *Cast Iron Vintage Plastic Risk-Mitigation and Government Relocations Note: Pipeline replacement due to changes in state or federal regulations is not projected in this 5-year replacement estimate. Replacement mileage includes service lines, distribution mains and transmission pipelines. Year over year variances in mileage replacement are driven by construction resources, project type and permitting. *All 25 miles of remaining cast iron will be eliminated by the end of 2019. 12
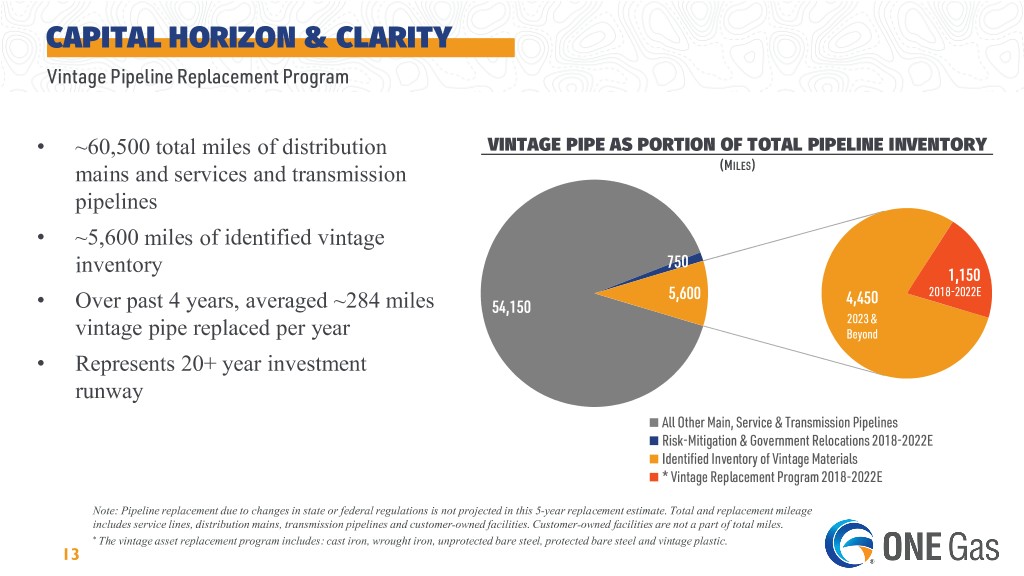
CAPITAL HORIZON & CLARITY Vintage Pipeline Replacement Program • ~60,500 total miles of distribution VINTAGE PIPE AS PORTION OF TOTAL PIPELINE INVENTORY mains and services and transmission (MILES) pipelines • ~5,600 miles of identified vintage 750 inventory 1,150 5,600 4,450 2018-2022E • Over past 4 years, averaged ~284 miles 54,150 2023 & vintage pipe replaced per year Beyond • Represents 20+ year investment runway All Other Main, Service & Transmission Pipelines Risk-Mitigation & Government Relocations 2018-2022E Identified Inventory of Vintage Materials * Vintage Replacement Program 2018-2022E Note: Pipeline replacement due to changes in state or federal regulations is not projected in this 5-year replacement estimate. Total and replacement mileage includes service lines, distribution mains, transmission pipelines and customer-owned facilities. Customer-owned facilities are not a part of total miles. * The vintage asset replacement program includes: cast iron, wrought iron, unprotected bare steel, protected bare steel and vintage plastic. 13

CAPITAL HORIZON & CLARITY Capital Investment – Rate Base Growth RATE BASE 2018 ESTIMATED RATE BASE (BILLIONS) TOTAL: $3.46 BILLION* $3.46 $3.18 $2.96 $2.71 $2.52 $0.94 billion $1.43 billion $1.09 billion 2014 2015 2016 2017 2018G 2019-2022 Oklahoma Kansas Texas * Estimated average rate base; calculation consistent with utility ratemaking in each jurisdiction 14
REGULATORY CONSTRUCT & UPDATE
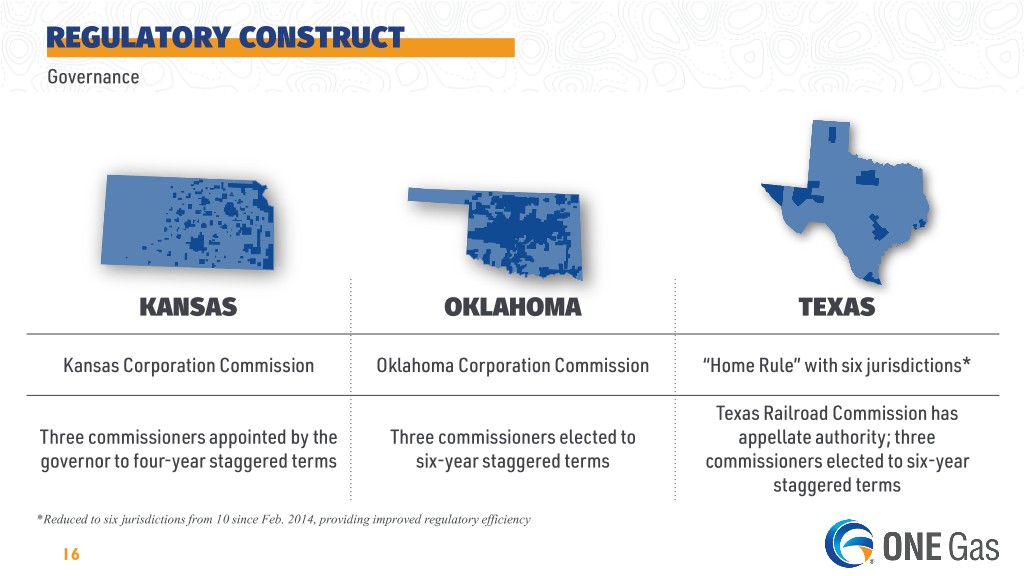
REGULATORY CONSTRUCT Governance KANSAS OKLAHOMA TEXAS Kansas Corporation Commission Oklahoma Corporation Commission “Home Rule” with six jurisdictions* Texas Railroad Commission has Three commissioners appointed by the Three commissioners elected to appellate authority; three governor to four-year staggered terms six-year staggered terms commissioners elected to six-year staggered terms *Reduced to six jurisdictions from 10 since Feb. 2014, providing improved regulatory efficiency 16
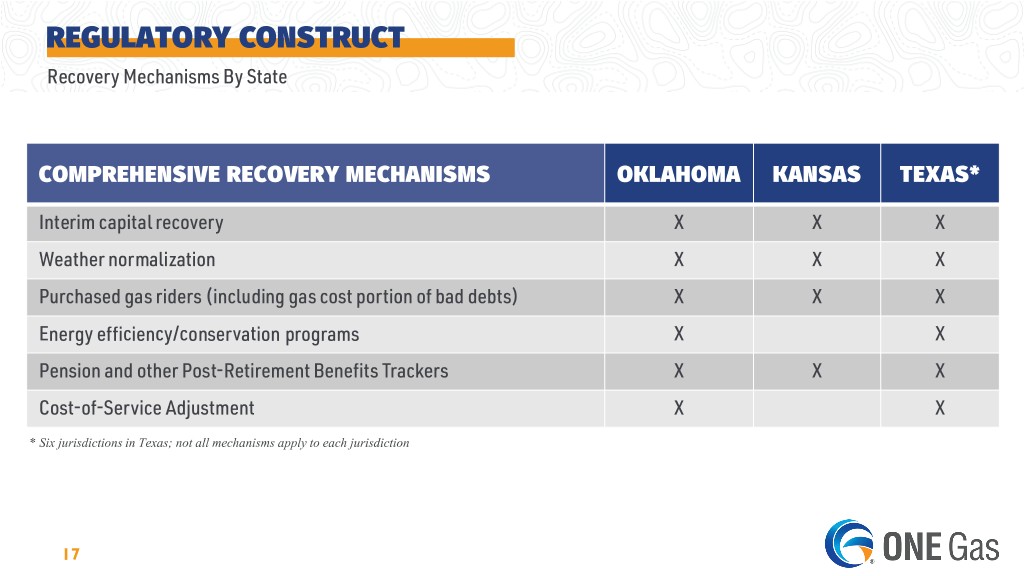
REGULATORY CONSTRUCT Recovery Mechanisms By State COMPREHENSIVE RECOVERY MECHANISMS OKLAHOMA KANSAS TEXAS* Interim capital recovery X X X Weather normalization X X X Purchased gas riders (including gas cost portion of bad debts) X X X Energy efficiency/conservation programs X X Pension and other Post-Retirement Benefits Trackers X X X Cost-of-Service Adjustment X X * Six jurisdictions in Texas; not all mechanisms apply to each jurisdiction 17
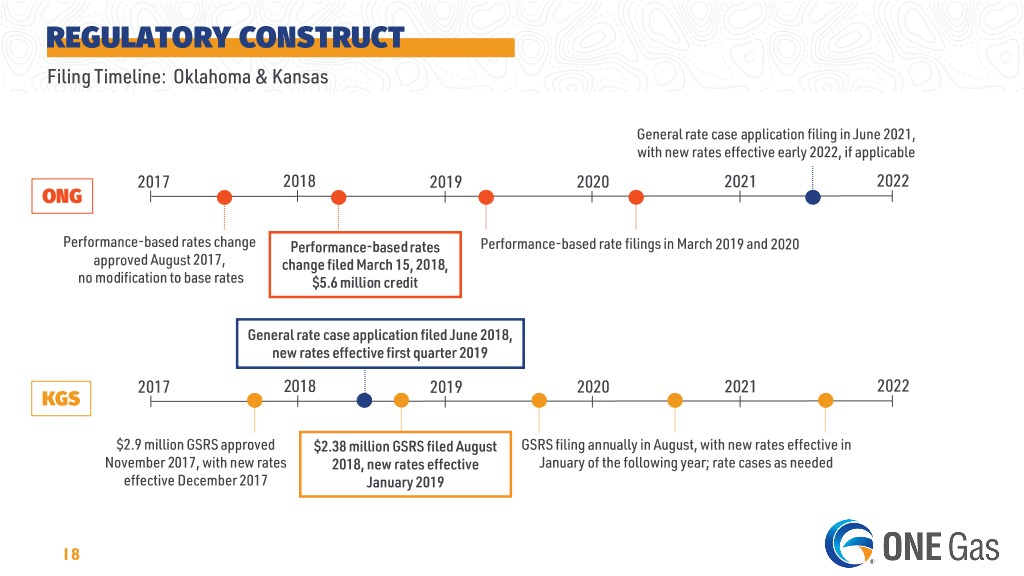
REGULATORY CONSTRUCT Filing Timeline: Oklahoma & Kansas General rate case application filing in June 2021, with new rates effective early 2022, if applicable 2017 2018 2019 2020 2021 2022 ONG Performance-based rates change Performance-based rates Performance-based rate filings in March 2019 and 2020 approved August 2017, change filed March 15, 2018, no modification to base rates $5.6 million credit General rate case application filed June 2018, new rates effective first quarter 2019 2017 2018 2019 2020 2021 2022 KGS $2.9 million GSRS approved $2.38 million GSRS filed August GSRS filing annually in August, with new rates effective in November 2017, with new rates 2018, new rates effective January of the following year; rate cases as needed effective December 2017 January 2019 18
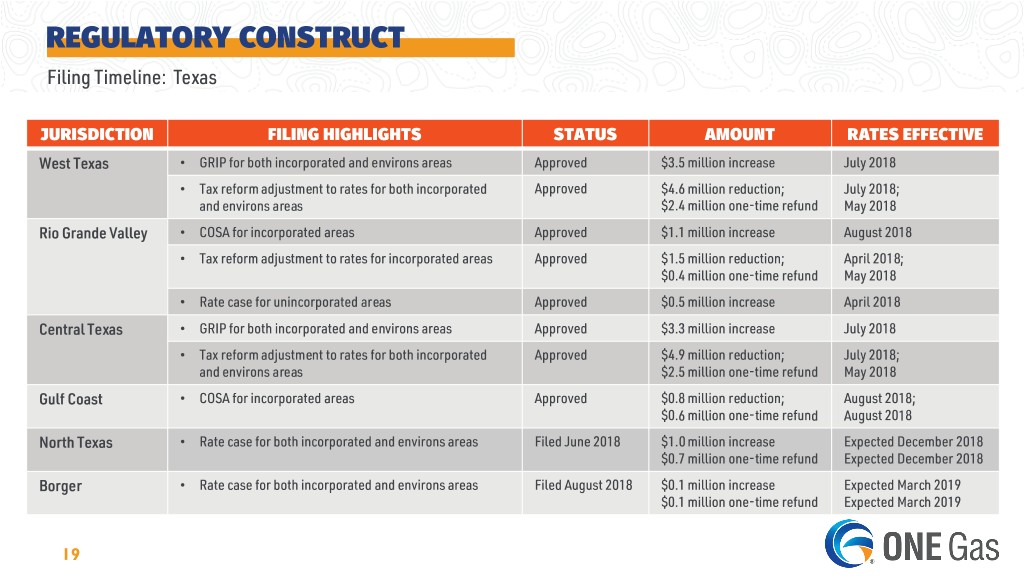
REGULATORY CONSTRUCT Filing Timeline: Texas JURISDICTION FILING HIGHLIGHTS STATUS AMOUNT RATES EFFECTIVE West Texas • GRIP for both incorporated and environs areas Approved $3.5 million increase July 2018 • Tax reform adjustment to rates for both incorporated Approved $4.6 million reduction; July 2018; and environs areas $2.4 million one-time refund May 2018 Rio Grande Valley • COSA for incorporated areas Approved $1.1 million increase August 2018 • Tax reform adjustment to rates for incorporated areas Approved $1.5 million reduction; April 2018; $0.4 million one-time refund May 2018 • Rate case for unincorporated areas Approved $0.5 million increase April 2018 Central Texas • GRIP for both incorporated and environs areas Approved $3.3 million increase July 2018 • Tax reform adjustment to rates for both incorporated Approved $4.9 million reduction; July 2018; and environs areas $2.5 million one-time refund May 2018 Gulf Coast • COSA for incorporated areas Approved $0.8 million reduction; August 2018; $0.6 million one-time refund August 2018 North Texas • Rate case for both incorporated and environs areas Filed June 2018 $1.0 million increase Expected December 2018 $0.7 million one-time refund Expected December 2018 Borger • Rate case for both incorporated and environs areas Filed August 2018 $0.1 million increase Expected March 2019 $0.1 million one-time refund Expected March 2019 19
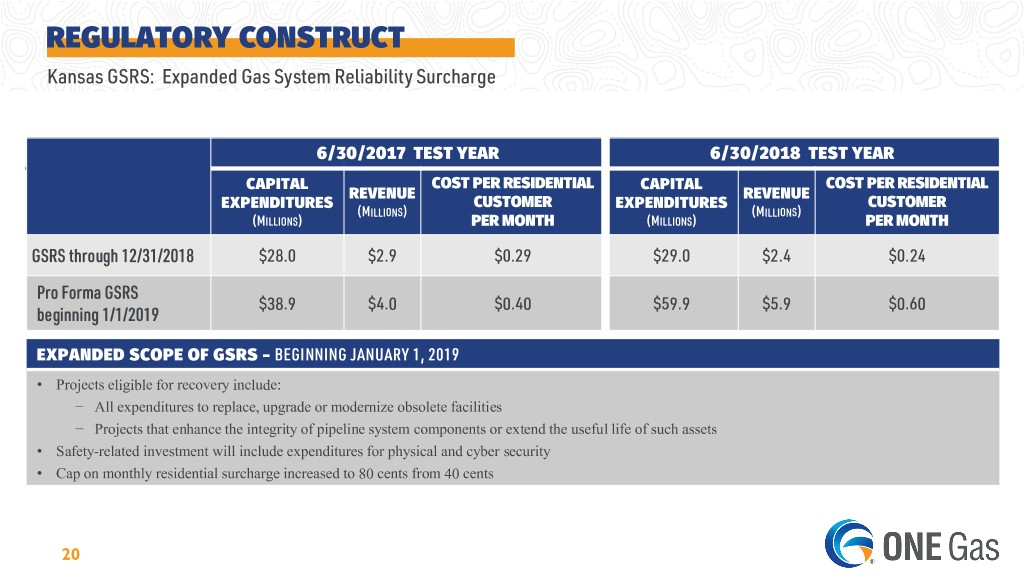
REGULATORY CONSTRUCT Kansas GSRS: Expanded Gas System Reliability Surcharge 6/30/2017 TEST YEAR 6/30/2018 TEST YEAR CAPITAL COST PER RESIDENTIAL CAPITAL COST PER RESIDENTIAL REVENUE REVENUE EXPENDITURES CUSTOMER EXPENDITURES CUSTOMER (MILLIONS) (MILLIONS) (MILLIONS) PER MONTH (MILLIONS) PER MONTH GSRS through 12/31/2018 $28.0 $2.9 $0.29 $29.0 $2.4 $0.24 Pro Forma GSRS $38.9 $4.0 $0.40 $59.9 $5.9 $0.60 beginning 1/1/2019 EXPANDED SCOPE OF GSRS – BEGINNING JANUARY 1, 2019 • Projects eligible for recovery include: − All expenditures to replace, upgrade or modernize obsolete facilities − Projects that enhance the integrity of pipeline system components or extend the useful life of such assets • Safety-related investment will include expenditures for physical and cyber security • Cap on monthly residential surcharge increased to 80 cents from 40 cents 20
CASH FLOW STABILITY
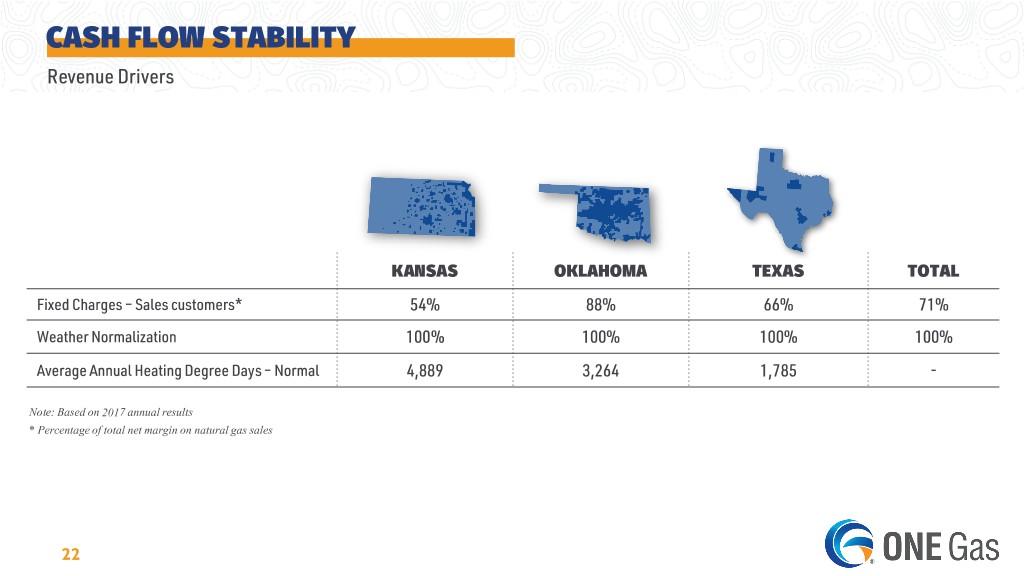
CASH FLOW STABILITY Revenue Drivers KANSAS OKLAHOMA TEXAS TOTAL Fixed Charges – Sales customers* 54% 88% 66% 71% Weather Normalization 100% 100% 100% 100% Average Annual Heating Degree Days – Normal 4,889 3,264 1,785 - Note: Based on 2017 annual results * Percentage of total net margin on natural gas sales 22
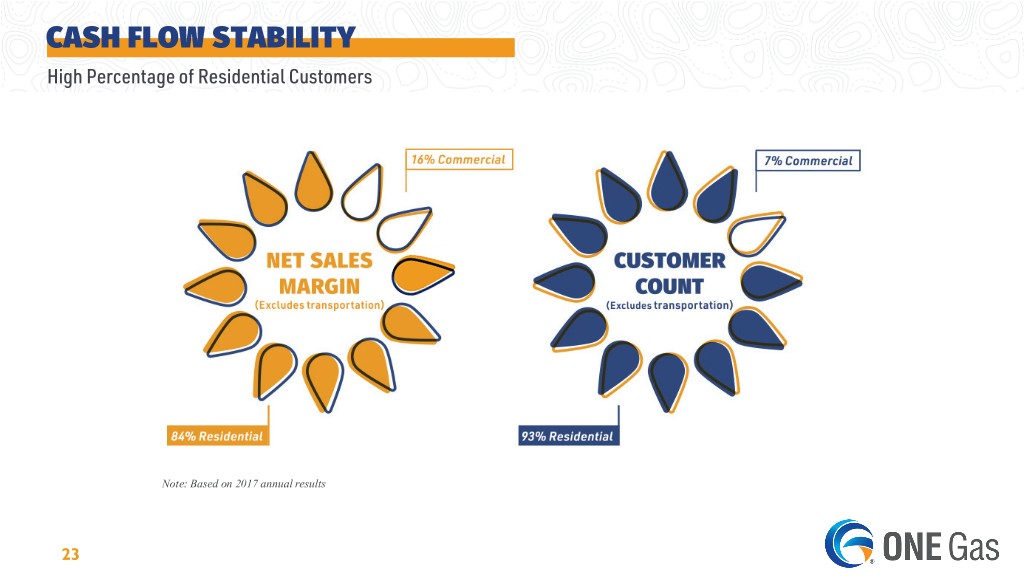
CASH FLOW STABILITY High Percentage of Residential Customers Note: Based on 2017 annual results 23
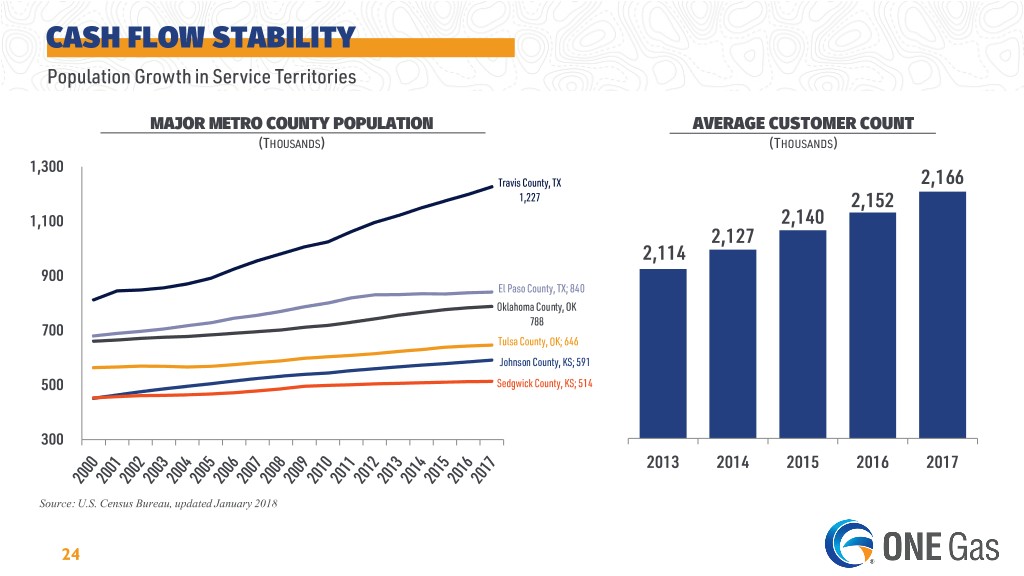
CASH FLOW STABILITY Population Growth in Service Territories MAJOR METRO COUNTY POPULATION AVERAGE CUSTOMER COUNT (THOUSANDS) (THOUSANDS) 1,300 Travis County, TX 2,166 1,227 2,152 1,100 2,140 2,127 2,114 900 El Paso County, TX; 840 Oklahoma County, OK 788 700 Tulsa County, OK; 646 Johnson County, KS; 591 500 Sedgwick County, KS; 514 300 2013 2014 2015 2016 2017 Source: U.S. Census Bureau, updated January 2018 24
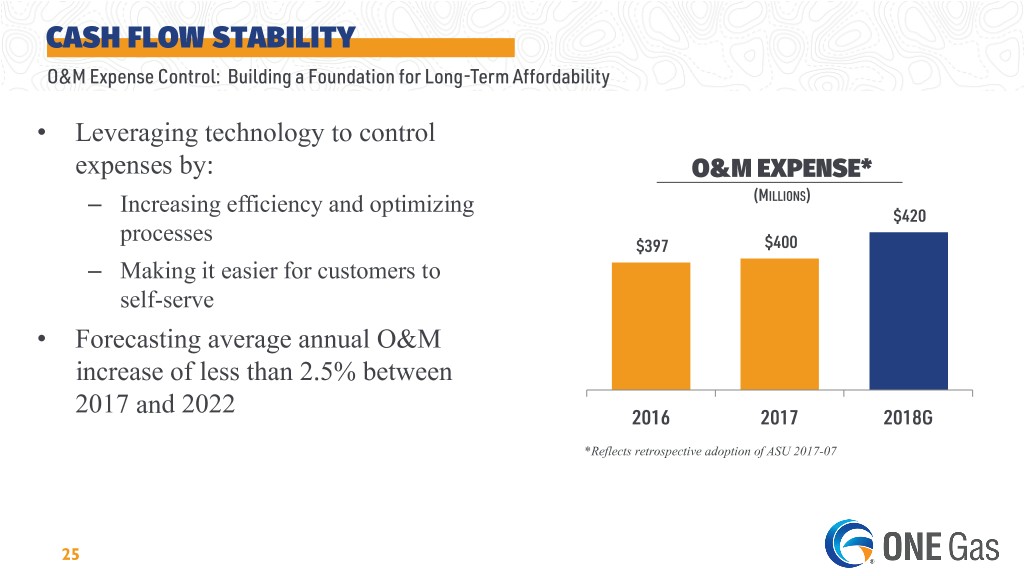
CASH FLOW STABILITY O&M Expense Control: Building a Foundation for Long-Term Affordability • Leveraging technology to control expenses by: O&M EXPENSE* (MILLIONS) – Increasing efficiency and optimizing $420 processes $397 $400 – Making it easier for customers to self-serve • Forecasting average annual O&M increase of less than 2.5% between 2017 and 2022 2016 2017 2018G *Reflects retrospective adoption of ASU 2017-07 25

COMPETITIVE ADVANTAGE
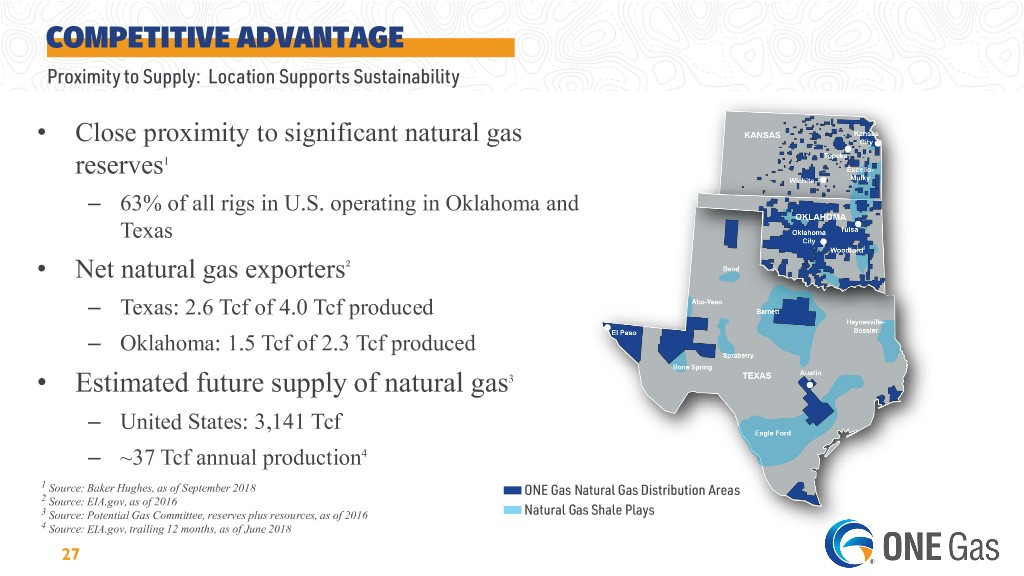
COMPETITIVE ADVANTAGE Proximity to Supply: Location Supports Sustainability • Close proximity to significant natural gas reserves1 – 63% of all rigs in U.S. operating in Oklahoma and Texas • Net natural gas exporters² – Texas: 2.6 Tcf of 4.0 Tcf produced – Oklahoma: 1.5 Tcf of 2.3 Tcf produced • Estimated future supply of natural gas3 – United States: 3,141 Tcf – ~37 Tcf annual production4 1 Source: Baker Hughes, as of September 2018 ONE Gas Natural Gas Distribution Areas 2 Source: EIA.gov, as of 2016 3 Source: Potential Gas Committee, reserves plus resources, as of 2016 Natural Gas Shale Plays 4 Source: EIA.gov, trailing 12 months, as of June 2018 27
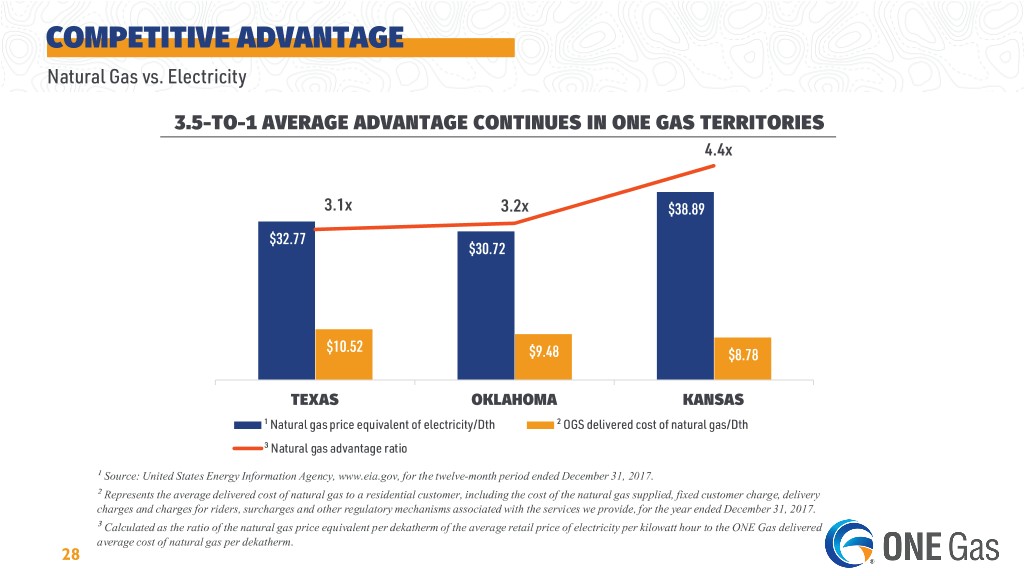
COMPETITIVE ADVANTAGE Natural Gas vs. Electricity 3.5-TO-1 AVERAGE ADVANTAGE CONTINUES IN ONE GAS TERRITORIES 4.4x 3.1x 3.2x $38.89 $32.77 $30.72 $10.52 $9.48 $8.78 TEXAS OKLAHOMA KANSAS ¹ Natural gas price equivalent of electricity/Dth ² OGS delivered cost of natural gas/Dth ³ Natural gas advantage ratio ¹ Source: United States Energy Information Agency, www.eia.gov, for the twelve-month period ended December 31, 2017. ² Represents the average delivered cost of natural gas to a residential customer, including the cost of the natural gas supplied, fixed customer charge, delivery charges and charges for riders, surcharges and other regulatory mechanisms associated with the services we provide, for the year ended December 31, 2017. ³ Calculated as the ratio of the natural gas price equivalent per dekatherm of the average retail price of electricity per kilowatt hour to the ONE Gas delivered average cost of natural gas per dekatherm. 28

FINANCIAL PERFORMANCE & OBJECTIVES
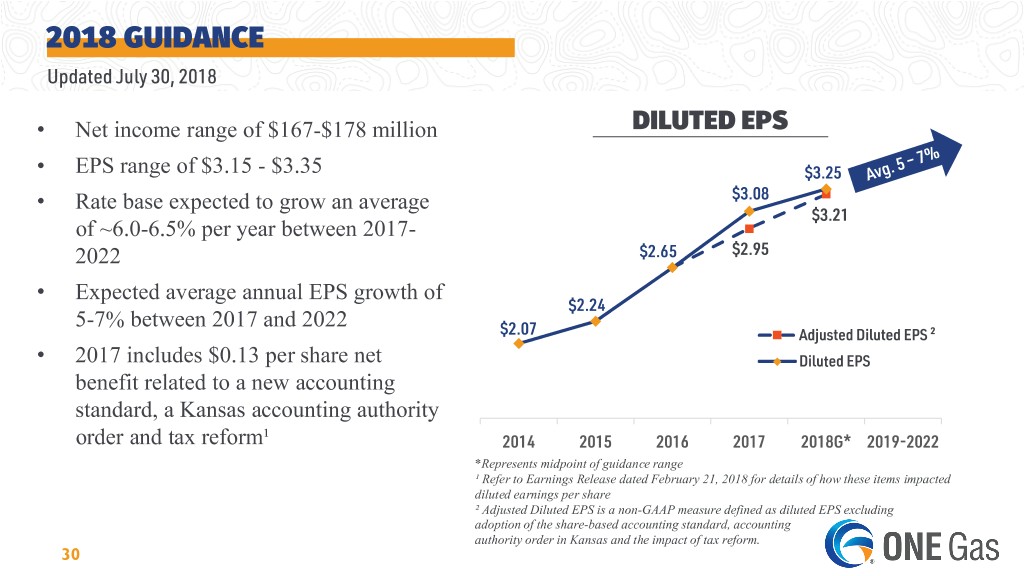
2018 GUIDANCE Updated July 30, 2018 • Net income range of $167-$178 million DILUTED EPS • EPS range of $3.15 - $3.35 $3.25 • Rate base expected to grow an average $3.08 $3.21 of ~6.0-6.5% per year between 2017- 2022 $2.65 $2.95 • Expected average annual EPS growth of $2.24 5-7% between 2017 and 2022 $2.07 Adjusted Diluted EPS ² • 2017 includes $0.13 per share net Diluted EPS benefit related to a new accounting standard, a Kansas accounting authority order and tax reform¹ 2014 2015 2016 2017 2018G* 2019-2022 *Represents midpoint of guidance range ¹ Refer to Earnings Release dated February 21, 2018 for details of how these items impacted diluted earnings per share ² Adjusted Diluted EPS is a non-GAAP measure defined as diluted EPS excluding adoption of the share-based accounting standard, accounting authority order in Kansas and the impact of tax reform. 30
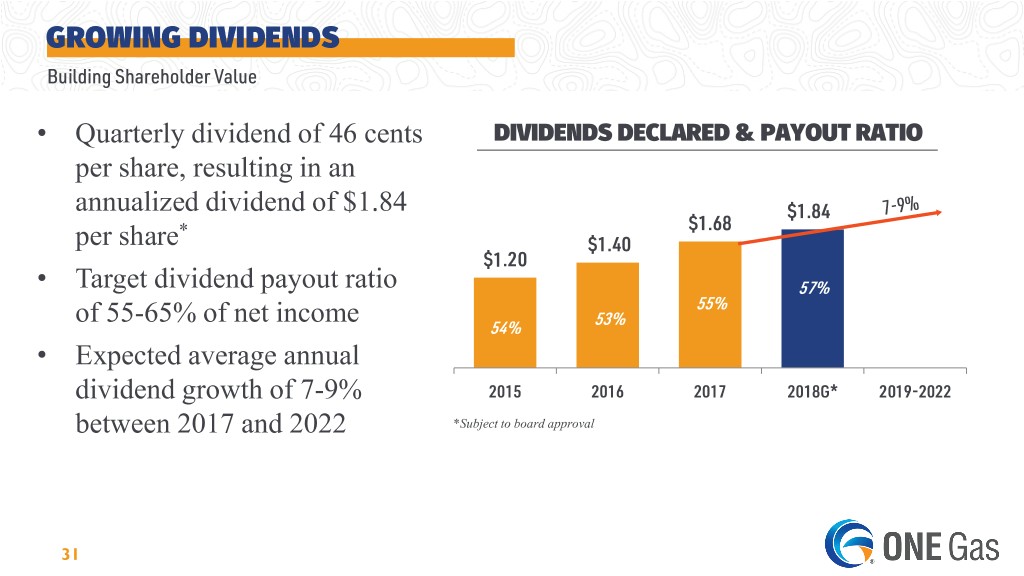
GROWING DIVIDENDS Building Shareholder Value • Quarterly dividend of 46 cents DIVIDENDS DECLARED & PAYOUT RATIO per share, resulting in an annualized dividend of $1.84 $1.84 * $1.68 per share $1.40 $1.20 • Target dividend payout ratio 57% 55% 53% of 55-65% of net income 54% • Expected average annual dividend growth of 7-9% 2015 2016 2017 2018G* 2019-2022 between 2017 and 2022 *Subject to board approval 31
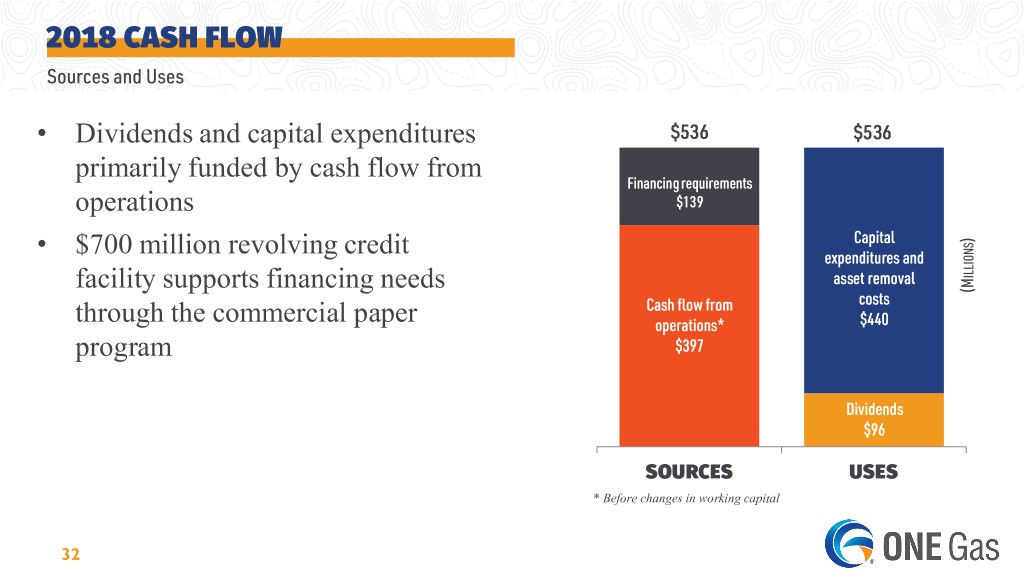
2018 CASH FLOW Sources and Uses • Dividends and capital expenditures $536 $536 primarily funded by cash flow from Financing requirements operations $139 Capital ) • $700 million revolving credit expenditures and asset removal ILLIONS facility supports financing needs (M Cash flow from costs through the commercial paper operations* $440 program $397 Dividends $96 SOURCES USES * Before changes in working capital 32
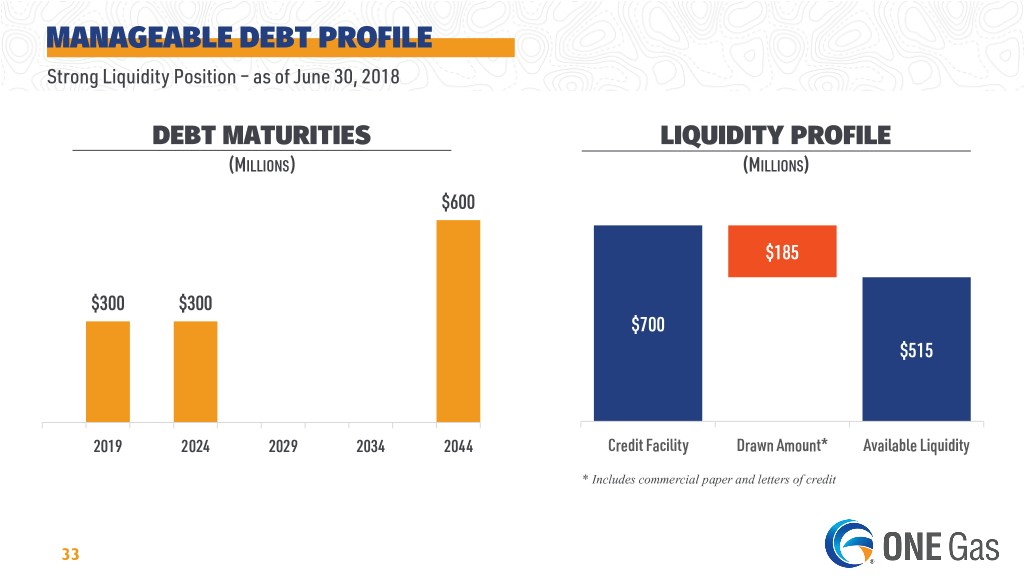
MANAGEABLE DEBT PROFILE Strong Liquidity Position – as of June 30, 2018 DEBT MATURITIES LIQUIDITY PROFILE (MILLIONS) (MILLIONS) $600 $185 $300 $300 $700 $515 2019 2024 2029 2034 2044 Credit Facility Drawn Amount* Available Liquidity * Includes commercial paper and letters of credit 33
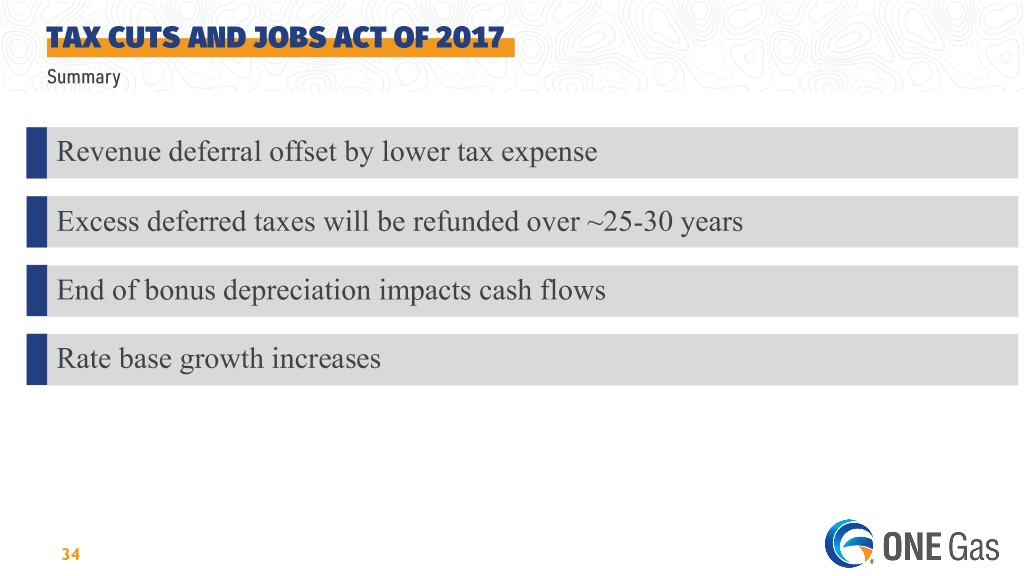
TAX CUTS AND JOBS ACT OF 2017 Summary Revenue deferral offset by lower tax expense Excess deferred taxes will be refunded over ~25-30 years End of bonus depreciation impacts cash flows Rate base growth increases 34

KEY TAKEAWAYS
KEY TAKEAWAYS • Focused business strategy • Well-defined capital investment plan • Stable revenue and cash flow profile 36

APPENDIX
CORPORATE STRUCTURE INCORPORATED ENTITY 100% regulated natural gas distribution No levered holding company, all debt issued at OGS Division capital structures match Corporate capital structure 38
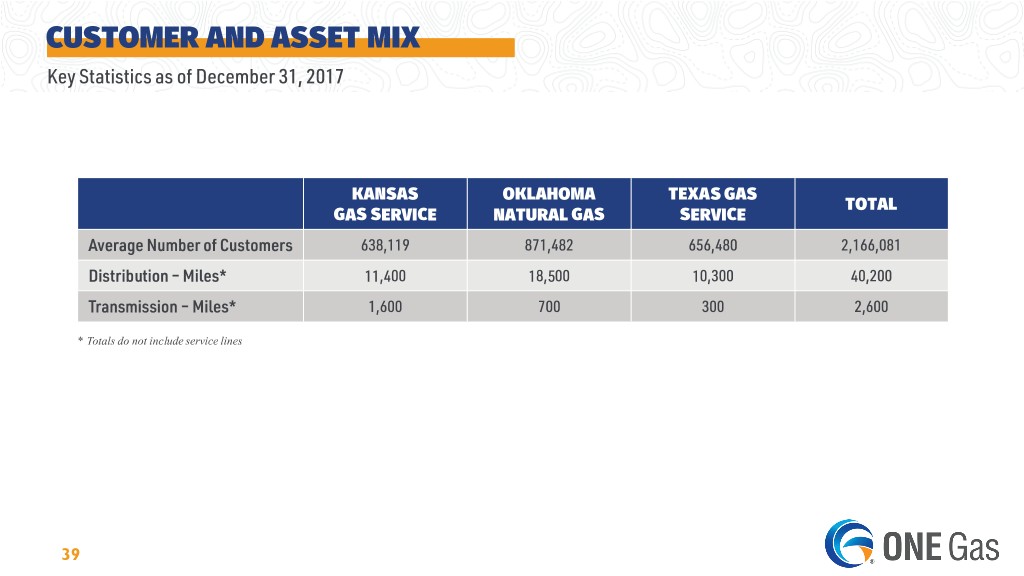
CUSTOMER AND ASSET MIX Key Statistics as of December 31, 2017 KANSAS OKLAHOMA TEXAS GAS TOTAL GAS SERVICE NATURAL GAS SERVICE Average Number of Customers 638,119 871,482 656,480 2,166,081 Distribution – Miles* 11,400 18,500 10,300 40,200 Transmission – Miles* 1,600 700 300 2,600 * Totals do not include service lines 39
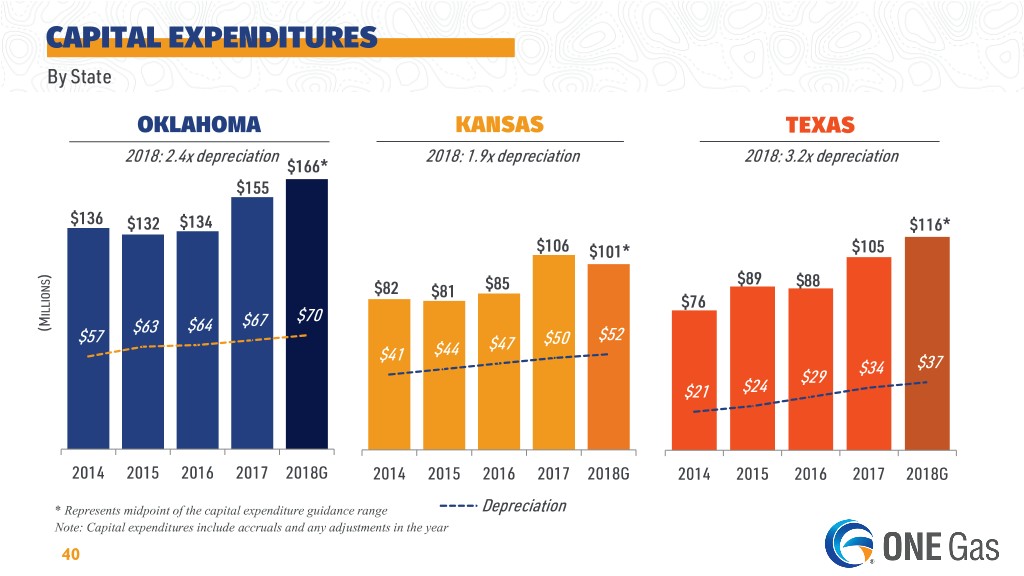
CAPITAL EXPENDITURES By State OKLAHOMA KANSAS TEXAS 2018: 2.4x depreciation 2018: 1.9x depreciation 2018: 3.2x depreciation $166* $155 $136 $132 $134 $116* $106 $101* $105 ) $89 $88 $82 $81 $85 $76 ILLIONS $67 $70 (M $64 $63 $52 $57 $47 $50 $41 $44 $34 $37 $29 $21 $24 2014 2015 2016 2017 2018G 2014 2015 2016 2017 2018G 2014 2015 2016 2017 2018G * Represents midpoint of the capital expenditure guidance range Depreciation Note: Capital expenditures include accruals and any adjustments in the year 40
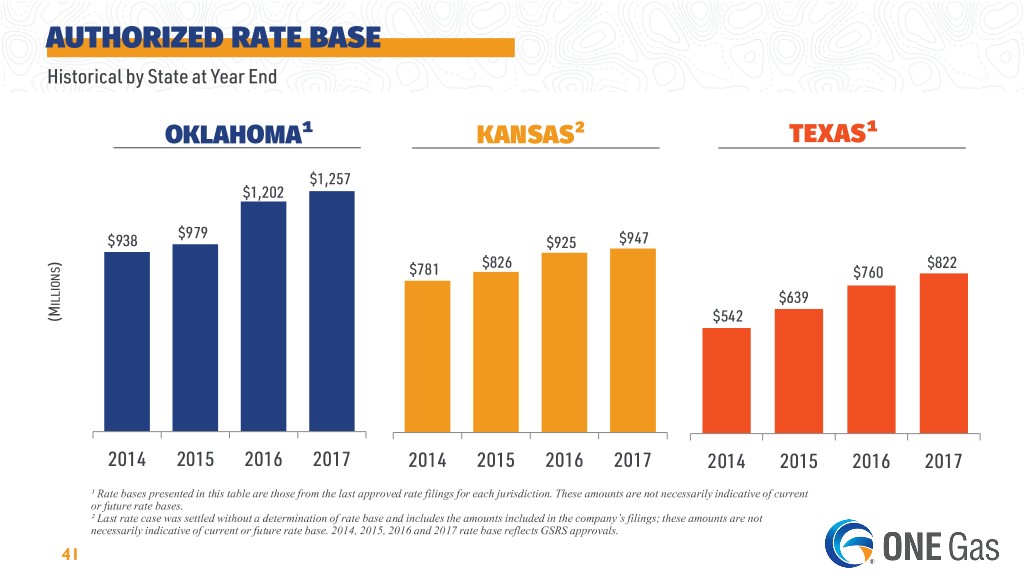
AUTHORIZED RATE BASE Historical by State at Year End OKLAHOMA¹ KANSAS² TEXAS¹ $1,257 $1,202 $979 $938 $925 $947 ) $826 $822 $781 $760 ILLIONS $639 (M $542 2014 2015 2016 2017 2014 2015 2016 2017 2014 2015 2016 2017 ¹ Rate bases presented in this table are those from the last approved rate filings for each jurisdiction. These amounts are not necessarily indicative of current or future rate bases. ² Last rate case was settled without a determination of rate base and includes the amounts included in the company’s filings; these amounts are not necessarily indicative of current or future rate base. 2014, 2015, 2016 and 2017 rate base reflects GSRS approvals. 41

TAX REFORM – DETAIL BY STATE Tax Cuts and Jobs Act of 2017 • OKLAHOMA: In March 2018, ONG’s PBRC filing requested potential refunds including: – A regulatory liability reflecting the revaluation of accumulated deferred income tax (ADIT) for the change in the federal income tax rate that will be returned to customers over an amortization period – An additional $2.9 million liability for the estimated impact to customer rates for the period between January 9, 2018, and the date new rates are expected to go into effect • KANSAS: KGS will accrue $14.1 million, as a regulatory liability – the portion of its revenue representing the difference between the 21 percent and 35 percent federal tax rate for 2018. KGS will establish a regulatory liability reflecting the revaluation of ADIT for the change in the federal income tax rate that will be returned to customers over an amortization period. Both of these items will be addressed in KGS’ next rate case • TEXAS: Requests were approved in four TGS jurisdictions regarding treatment of tax reform: – West Texas: $4.6 million decrease to rates and a one-time refund of $2.4 million to customers in the incorporated and unincorporated areas – Rio Grande Valley: $1.6 million decrease to rates and a one-time refund of $0.4 million to customers in the incorporated and unincorporated areas – Central Texas: $4.9 million decrease to rates and a one-time refund of $2.5 million to customers in the incorporated and unincorporated areas – Gulf Coast: $0.8 million decrease to rates and a one-time refund of $0.6 million to customers in the incorporated and unincorporated areas – North Texas: $0.9 million decrease to rates and one-time refund of $0.7 million requested in June 2018 for customers in the incorporated and unincorporated areas – Borger: $0.2 million decrease to rates and one-time refund of $0.1 million requested in August 2018 for customers in the incorporated and unincorporated areas 42
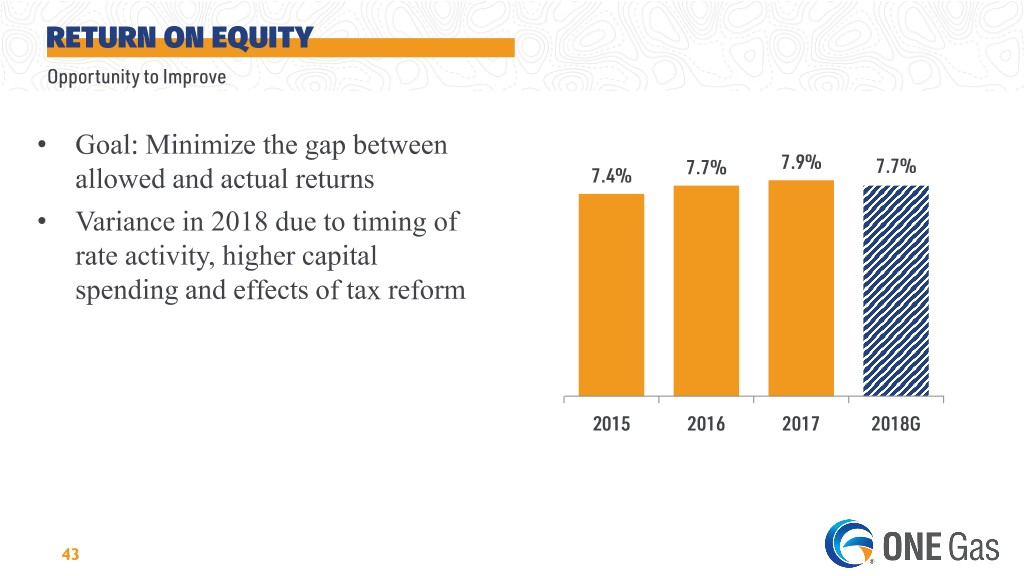
RETURN ON EQUITY Opportunity to Improve • Goal: Minimize the gap between 7.9% 7.7% allowed and actual returns 7.4% 7.7% • Variance in 2018 due to timing of rate activity, higher capital spending and effects of tax reform 2015 2016 2017 2018G 43
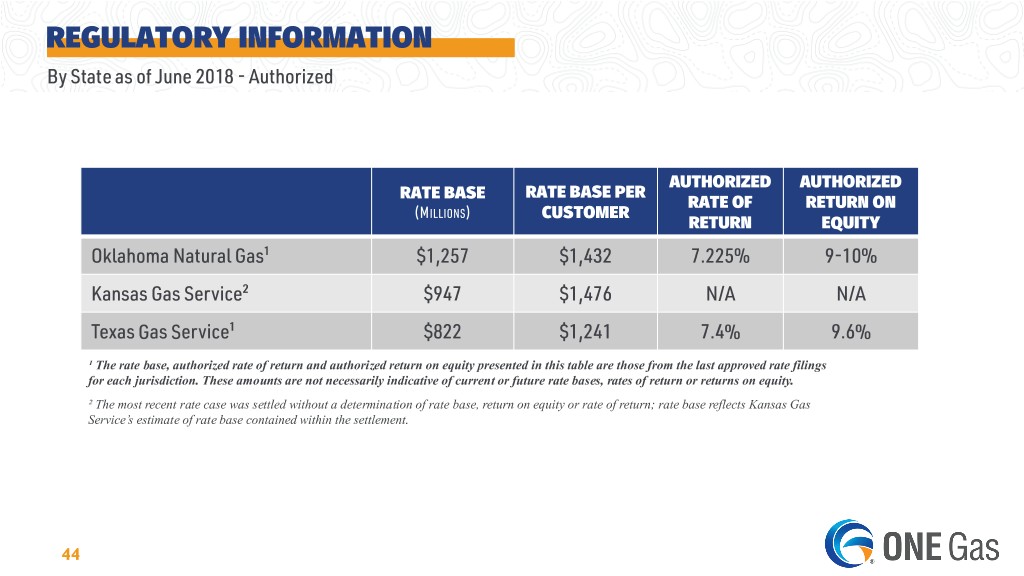
REGULATORY INFORMATION By State as of June 2018 - Authorized AUTHORIZED AUTHORIZED RATE BASE RATE BASE PER RATE OF RETURN ON (MILLIONS) CUSTOMER RETURN EQUITY Oklahoma Natural Gas¹ $1,257 $1,432 7.225% 9-10% Kansas Gas Service² $947 $1,476 N/A N/A Texas Gas Service¹ $822 $1,241 7.4% 9.6% ¹ The rate base, authorized rate of return and authorized return on equity presented in this table are those from the last approved rate filings for each jurisdiction. These amounts are not necessarily indicative of current or future rate bases, rates of return or returns on equity. ² The most recent rate case was settled without a determination of rate base, return on equity or rate of return; rate base reflects Kansas Gas Service’s estimate of rate base contained within the settlement. 44
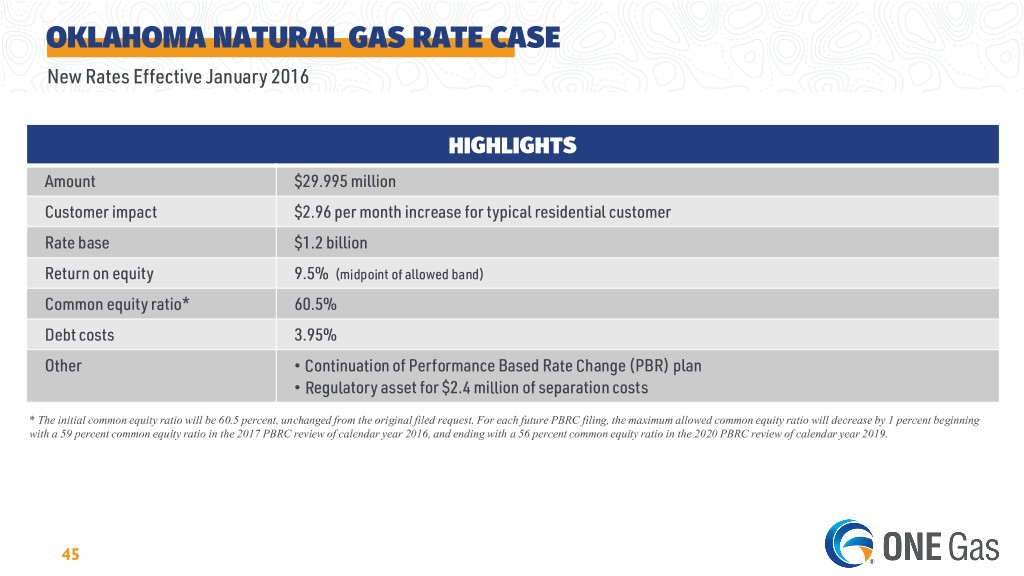
OKLAHOMA NATURAL GAS RATE CASE New Rates Effective January 2016 HIGHLIGHTS Amount $29.995 million Customer impact $2.96 per month increase for typical residential customer Rate base $1.2 billion Return on equity 9.5% (midpoint of allowed band) Common equity ratio* 60.5% Debt costs 3.95% Other • Continuation of Performance Based Rate Change (PBR) plan • Regulatory asset for $2.4 million of separation costs * The initial common equity ratio will be 60.5 percent, unchanged from the original filed request. For each future PBRC filing, the maximum allowed common equity ratio will decrease by 1 percent beginning with a 59 percent common equity ratio in the 2017 PBRC review of calendar year 2016, and ending with a 56 percent common equity ratio in the 2020 PBRC review of calendar year 2019. 45

KANSAS GAS SERVICE RATE CASE Filed June 29, 2018 HIGHLIGHTS Base rates $45.6 million total increase, $42.7 million net increase (already recovering $2.9 million through GSRS) Operating income ~$31 million annual impact, as filed Customer impact $5.67 per month increase for average residential customer Rate base $1.0 billion Capital expenditures $179 million since the previous general rate case Return on equity 10.0% Common equity ratio 62.2% Debt costs 3.94% Other • Each 25 bps change in requested ROE results in a change of approximately $2.2 million • Every 1% change in requested equity ratio results in a change of approximately $1.4 million 46

KANSAS GAS SERVICE Accounting Authority Order HIGHLIGHTS Details • The agreement allows Kansas Gas Service to defer manufactured gas plant (MGP) costs for the investigation and remediation at the 12 former MGP sites incurred after January 1, 2017, up to a cap of $15.0 million, net of any related insurance recoveries and amortize approved costs in a future rate proceeding over a 15-year period • The unamortized amounts will not be included in rate base or accumulate carrying charges • At the time future investigation and remediation work, net of any related insurance recoveries, is expected to exceed $15.0 million, Kansas Gas Service will be required to file an application with the KCC for approval to increase the $15.0 million cap Estimated Costs A regulatory asset of approximately $5.9 million was recorded in the fourth quarter 2017 for estimated costs that were accrued at January 1, 2017 Status Approved November 2017 47
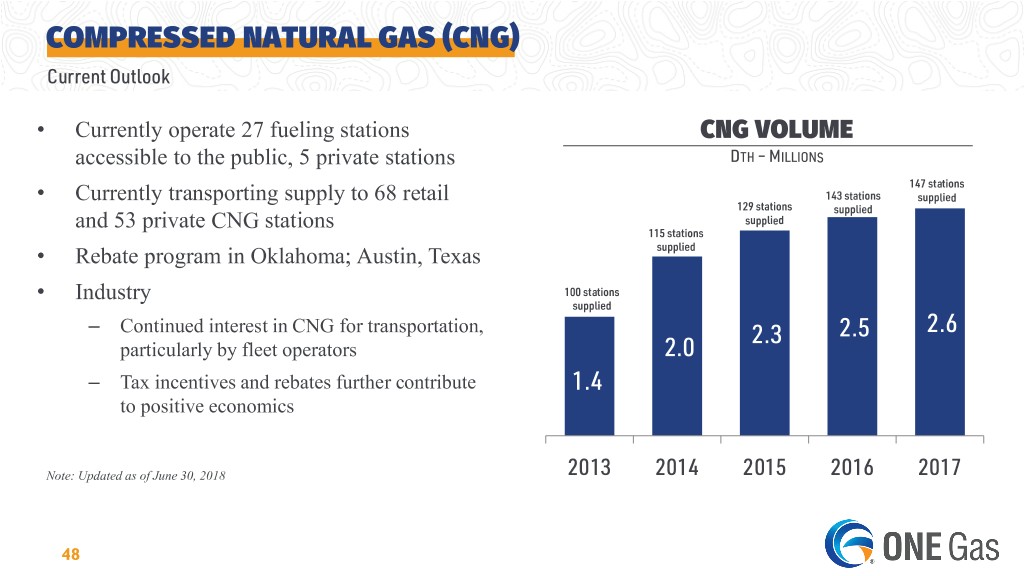
COMPRESSED NATURAL GAS (CNG) Current Outlook • Currently operate 27 fueling stations CNG VOLUME accessible to the public, 5 private stations DTH – MILLIONS 147 stations • Currently transporting supply to 68 retail 143 stations supplied 129 stations supplied supplied and 53 private CNG stations 115 stations supplied • Rebate program in Oklahoma; Austin, Texas • Industry 100 stations supplied – Continued interest in CNG for transportation, 2.3 2.5 2.6 particularly by fleet operators 2.0 – Tax incentives and rebates further contribute 1.4 to positive economics Note: Updated as of June 30, 2018 2013 2014 2015 2016 2017 48
NON-GAAP INFORMATION ONE Gas has disclosed in this presentation cash flow from operations before changes in working capital and adjusted diluted earnings per share, which are non-GAAP financial measures. Cash flow from operations before changes in working capital and adjusted diluted earnings per share are used as measures of the company's financial performance. Cash flow from operations before changes in working capital is defined as net income adjusted for depreciation and amortization, deferred income taxes, and certain other noncash items. Adjusted diluted earnings per share is defined as diluted earnings per share excluding adoption of the share-based accounting standard, accounting authority order in Kansas and the impact of tax reform. These non-GAAP financial measures described above are useful to investors as indicators of financial performance of the company's investments to generate cash flows sufficient to support our capital expenditure programs and pay dividends to our investors. ONE Gas cash flow from operations before changes in working capital should not be considered in isolation or as a substitute for net income or any other measure of financial performance presented in accordance with GAAP. This non-GAAP financial measure excludes some, but not all, items that affect net income. Additionally, these calculations may not be comparable with similarly titled measures of other companies. A reconciliation of cash flow from operations before changes in working capital and adjusted diluted earnings per share are included in this presentation. 49
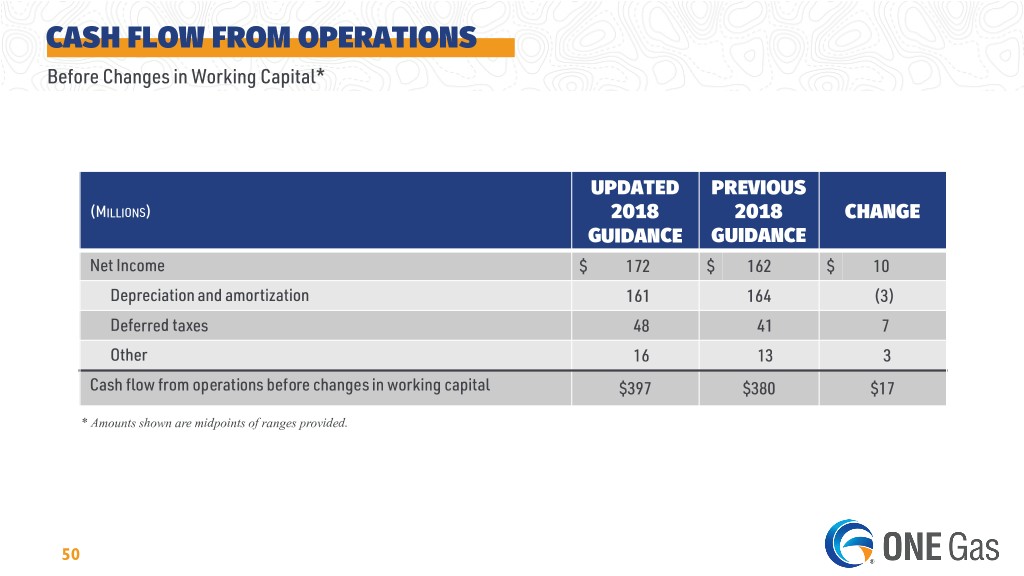
CASH FLOW FROM OPERATIONS Before Changes in Working Capital* UPDATED PREVIOUS (MILLIONS) 2018 2018 CHANGE GUIDANCE GUIDANCE Net Income $ 172 $ 162 $ 10 Depreciation and amortization 161 164 (3) Deferred taxes 48 41 7 Other 16 13 3 Cash flow from operations before changes in working capital $397 $380 $17 * Amounts shown are midpoints of ranges provided. 50