
Resilient and Reliable Energy For a Better Tomorrow January 18, 2022 2022 FINANCIAL GUIDANCE
FORWARD LOOKING STATEMENTS| 2 Forward-Looking Statements Statements contained in this presentation that include or refer to Company expectations, our business outlook, our future plans or predictions relating to any matters should be considered forward-looking statements that are covered by the safe harbor provisions of the Private Securities Litigation Reform Act of 1995, the Securities Act of 1933 and the Securities and Exchange Act of 1934, each as amended. All statements, other than statements of historical facts, included in this presentation are forward-looking statements. Words such as “anticipates,” “expects,” “projects,” “intends,” “goals,” “plans,” “potential,” “might,” “believes,” “target,” “objective,” “strategy,” “opportunity,” “pursue,” “budgets,” “outlook,” “trends,” “focus,” “on schedule,” “on track,” “poised,” “slated,” “seeks,” “estimates,” “forecasts,” “guidance,” “scheduled,” “continues,” “may,” “will,” “would,” “should,” “could,” “likely,” and variations of such words and similar expressions are intended to identify such forward-looking statements. One should not place undue reliance on forward-looking statements. In addition, statements that refer to or are based on estimates, forecasts, projections, uncertain events or assumptions, including statements relating to market opportunities, future products or processes and the expected availability and benefits of such products or processes, and anticipated trends in our businesses or the markets relevant to them, including those developments relating to regulation and litigation trends and developments, also identify forward-looking statements. Such statements are based on management's expectations as of the date of this investor presentation, unless an earlier date is indicated, and involve many risks and uncertainties, known and unknown, that could cause actual results, performance or achievements to differ materially from those expressed or implied in these forward-looking statements. It is important to note that the actual results could differ materially from those projected in such forward-looking statements. Important risks and uncertainties that could cause actual results to differ materially from the company's expectations include, but are not limited to, our ability to recover, manage and maintain costs; the concentration of our operations in Kansas, Oklahoma and Texas; regulatory or legislative changes in the jurisdictions in which we operate; the length and severity of unpredictable events, including, but not limited to, the COVID-19 pandemic, threatened terrorism, war or cyber-attacks or breaches, or extreme weather events, including those related to climate change; the competitive implications of alternative sources of energy and efforts to conserve energy; our competitive position, including, but not limited to our ability to secure competitive sourcing and pricing and our ability to compete with respect to expansion and infrastructure; the economic climate and our comparable economic position; our access to capital and the restrictions that result from our current capital arrangements; the effectiveness of our risk mitigation and compliance efforts; the uncertainties of any estimates or assumptions we use in our projections; our strategic and transactional efforts and future plans; and costs and uncertainties relating to our workforce, and other risks and uncertainties, including those that are set forth in ONE Gas’ earnings release dated Nov. 1, 2021, which is included as an exhibit to ONE Gas’ Form 8-K furnished to the SEC on such date. For additional information regarding these and other factors that could cause actual results to differ materially from such forward-looking statements, refer to ONE Gas’ Securities and Exchange Commission filings., including the Company's most recent reports on Forms 10-K and 10-Q. Copies of the Company’s Form 10-K, 10-Q and 8-K reports may be obtained by visiting our “Investors” website under “Financials & Filings” at https://www.onegas.com/investors/financials-and-filings/quarterly-results/default.aspx or the SEC’s website at www.sec.gov. Other unpredictable or unknown factors not discussed in this presentation could also have material adverse effects on the Company, its operations or the outcomes described in the forward- looking statements in this presentation or in the Company’s filings with the Securities and Exchange Commission. All future cash dividends discussed in this presentation are subject to the approval of the ONE Gas board of directors. All references in this presentation to guidance are based on news releases issued on or before Jan. 18, 2022, and are not being updated or affirmed by this presentation. ONE Gas does not undertake, and expressly disclaims any duty, to update any statement made in this presentation, whether as a result of new information, new developments or otherwise, except to the extent that disclosure may be required by law.

FINANCIAL OUTLOOK
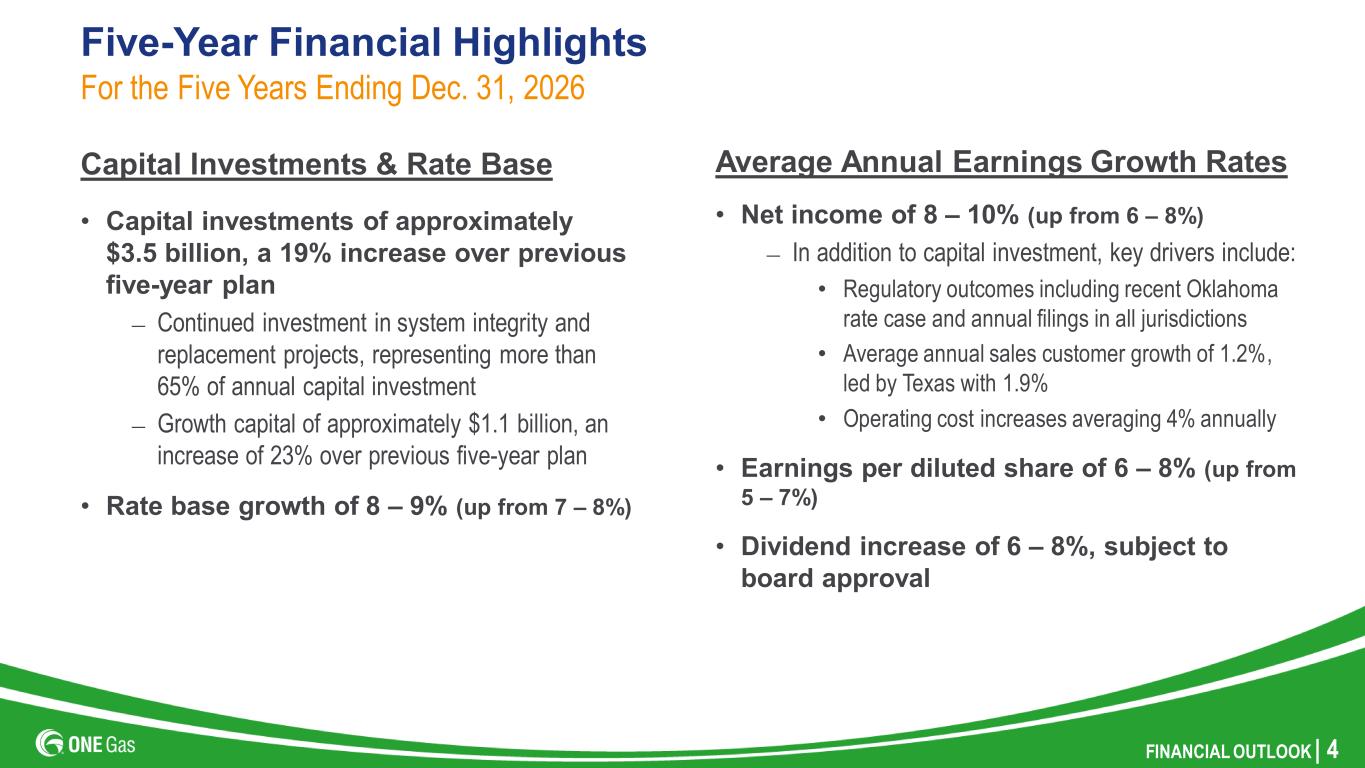
FINANCIAL OUTLOOK | 4 Five-Year Financial Highlights Capital Investments & Rate Base • Capital investments of approximately $3.5 billion, a 19% increase over previous five-year plan – Continued investment in system integrity and replacement projects, representing more than 65% of annual capital investment – Growth capital of approximately $1.1 billion, an increase of 23% over previous five-year plan • Rate base growth of 8 – 9% (up from 7 – 8%) For the Five Years Ending Dec. 31, 2026 Average Annual Earnings Growth Rates • Net income of 8 – 10% (up from 6 – 8%) – In addition to capital investment, key drivers include: • Regulatory outcomes including recent Oklahoma rate case and annual filings in all jurisdictions • Average annual sales customer growth of 1.2%, led by Texas with 1.9% • Operating cost increases averaging 4% annually • Earnings per diluted share of 6 – 8% (up from 5 – 7%) • Dividend increase of 6 – 8%, subject to board approval
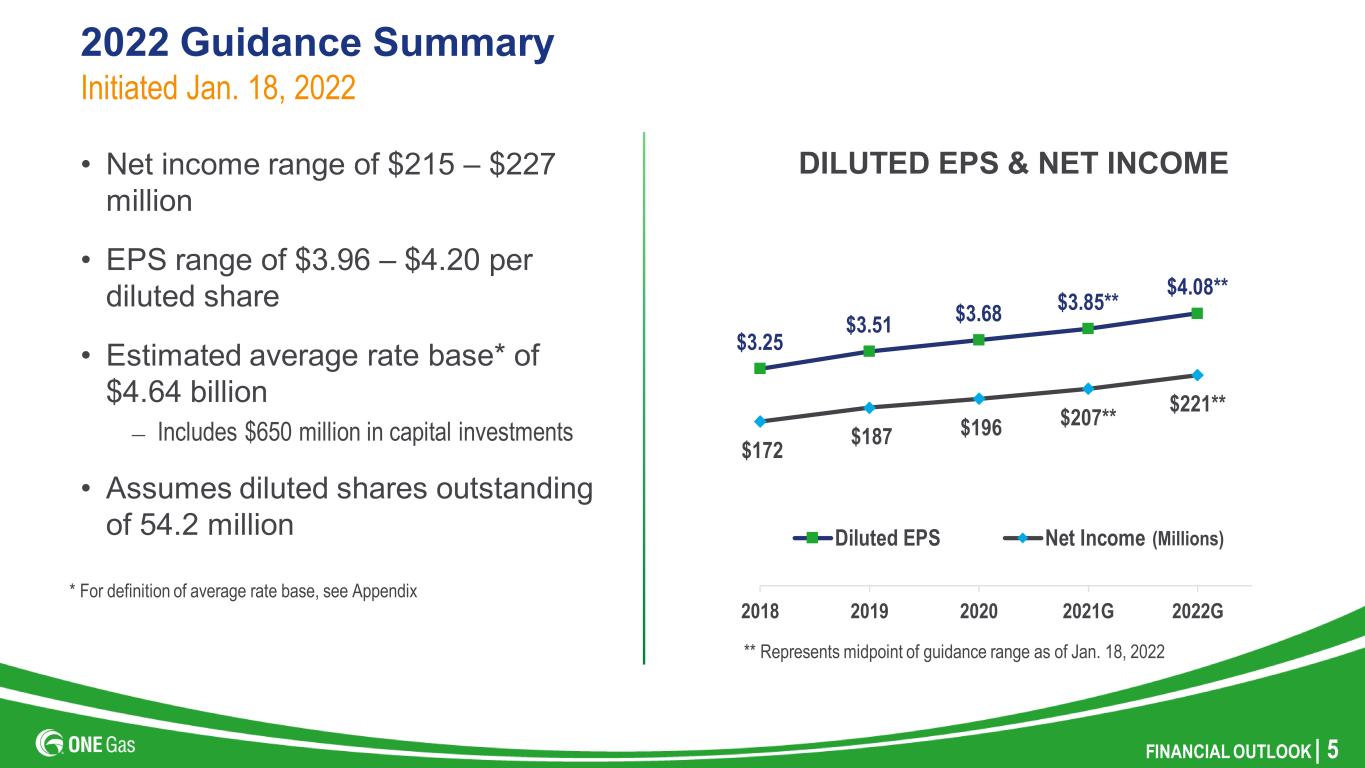
FINANCIAL OUTLOOK | 5 ** Represents midpoint of guidance range as of Jan. 18, 2022 * For definition of average rate base, see Appendix 2022 Guidance Summary • Net income range of $215 ‒ $227 million • EPS range of $3.96 ‒ $4.20 per diluted share • Estimated average rate base* of $4.64 billion – Includes $650 million in capital investments • Assumes diluted shares outstanding of 54.2 million Initiated Jan. 18, 2022 (Millions) $3.25 $3.51 $3.68 $3.85** $4.08** $172 $187 $196 $207** $221** 2018 2019 2020 2021G 2022G DILUTED EPS & NET INCOME Diluted EPS Net Income

FINANCIAL OUTLOOK | 6 Growing Dividends • Quarterly Dividend – 62 cents per share in 2022* • Target annual payout ratio – 55 to 65% of net income Building Shareholder Value $1.84 $2.00 $2.16 $2.32 $2.48* 2018 2019 2020 2021 2022G DIVIDENDS & PAYOUT RATIO 57% 57% 59% 60%** 61%** * Subject to board approval ** Represents midpoint of guidance range as of Jan. 18, 2022 6.9% increase over 2021
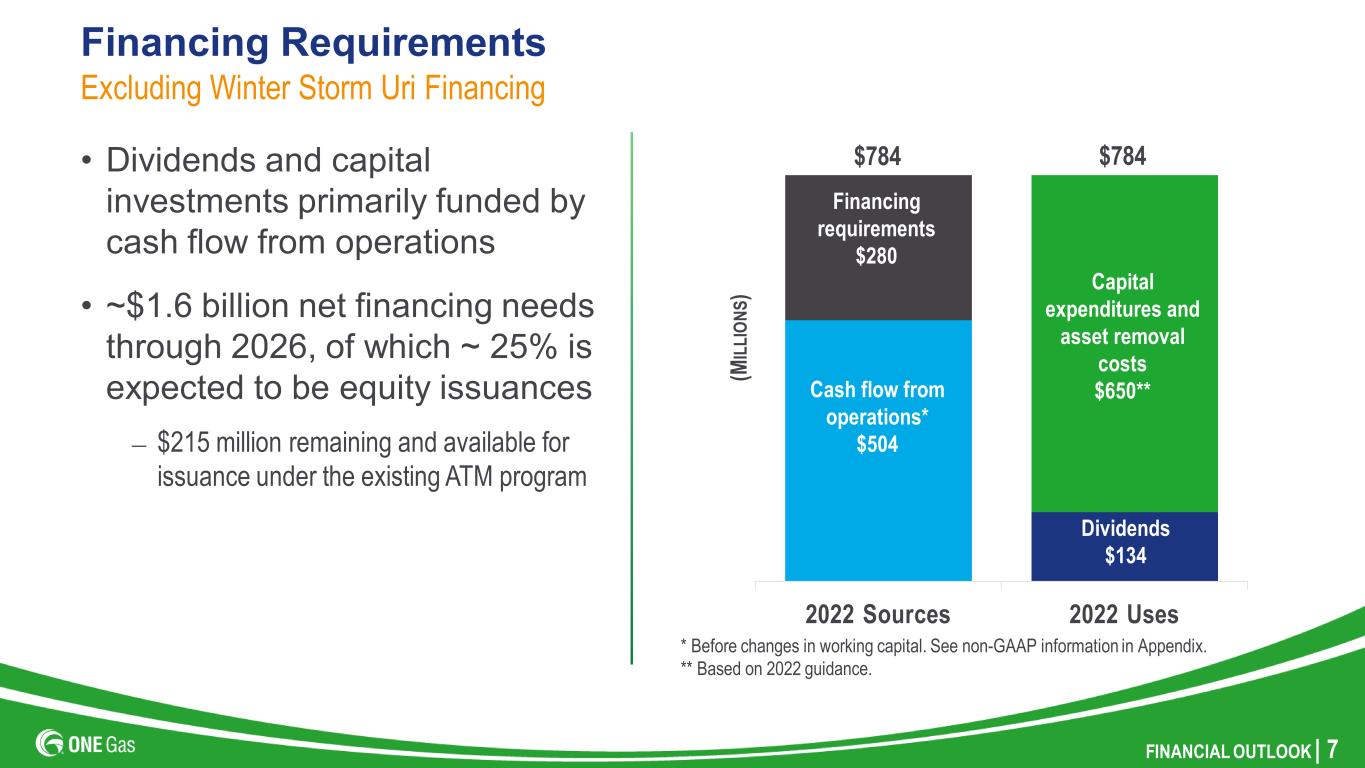
FINANCIAL OUTLOOK | 7 Financing Requirements • Dividends and capital investments primarily funded by cash flow from operations • ~$1.6 billion net financing needs through 2026, of which ~ 25% is expected to be equity issuances – $215 million remaining and available for issuance under the existing ATM program Excluding Winter Storm Uri Financing * Before changes in working capital. See non-GAAP information in Appendix. ** Based on 2022 guidance. Financing requirements $174 Financing requirements $210 2022 Sources 2022 Uses (M IL LI ON S) Dividends $134 Capital expenditures and asset removal costs $650**Cash flow from operations* $504 $784 $784 Financing requirements $280
CAPITAL INVESTMENTS & RATE BASE
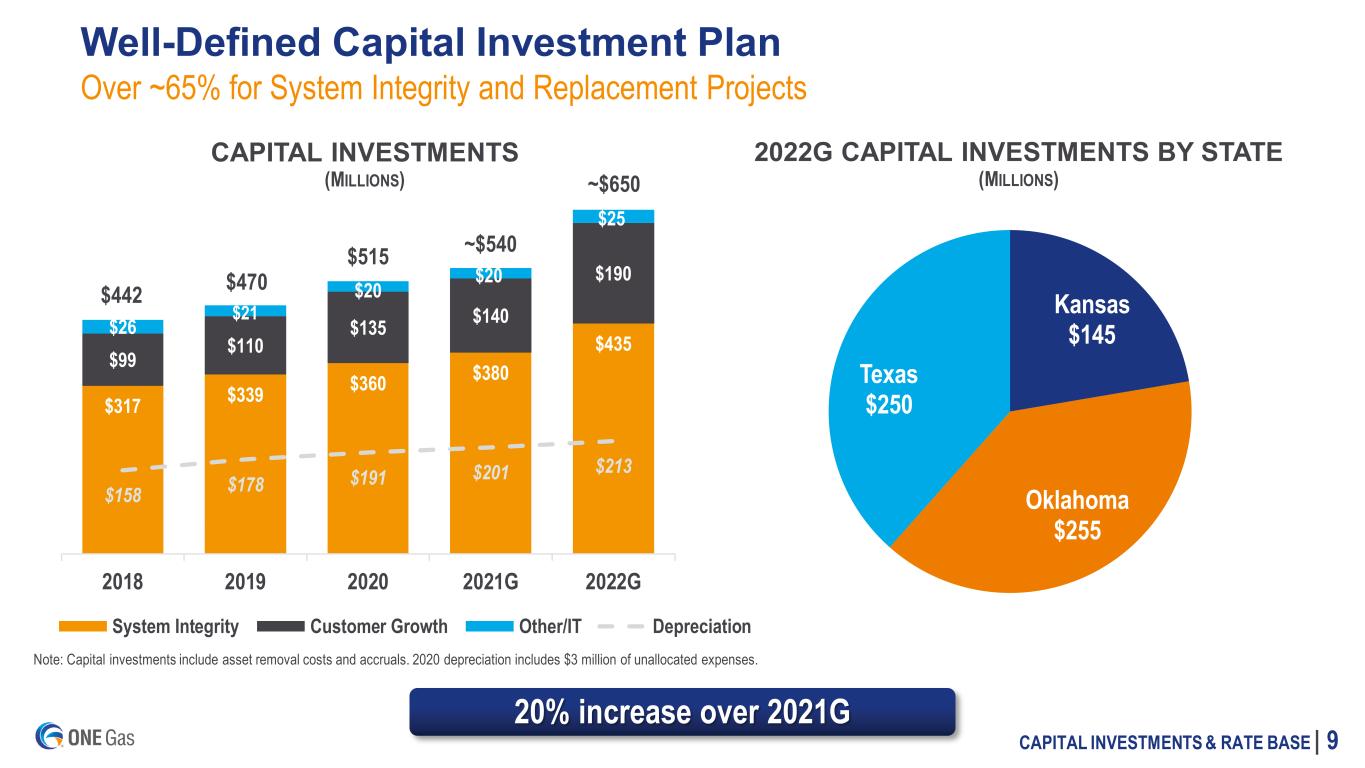
CAPITAL INVESTMENTS & RATE BASE | 9 $317 $339 $360 $380 $435 $99 $110 $135 $140 $190 $26 $21 $20 $20 $25 $158 $178 $191 $201 $213 2018 2019 2020 2021G 2022G CAPITAL INVESTMENTS (MILLIONS) System Integrity Customer Growth Other/IT Depreciation $442 $470 $515 ~$540 ~$650 Well-Defined Capital Investment Plan Over ~65% for System Integrity and Replacement Projects Kansas $145 Oklahoma $255 Texas $250 2022G CAPITAL INVESTMENTS BY STATE (MILLIONS) Note: Capital investments include asset removal costs and accruals. 2020 depreciation includes $3 million of unallocated expenses. 20% increase over 2021G

CAPITAL INVESTMENTS & RATE BASE | 10 Capital Investments Spending 3x Depreciation $126 $123 $129 $135 $145 $52 $64 $68 $72 $75 2018 2019 2020 2021G 2022G KANSAS 2022: 1.9X DEPRECIATION $180 $191 $198 $215 $255 $69 $74 $76 $81 $87 2018 2019 2020 2021G 2022G OKLAHOMA Depreciation 2022: 2.9X DEPRECIATION $136 $156 $188 $190 $250 $37 $40 $44 $48 $51 2018 2019 2020 2021G 2022G TEXAS 2022: 5.0X DEPRECIATION (M IL LI ON S) Note: Capital investments include asset removal costs and accruals
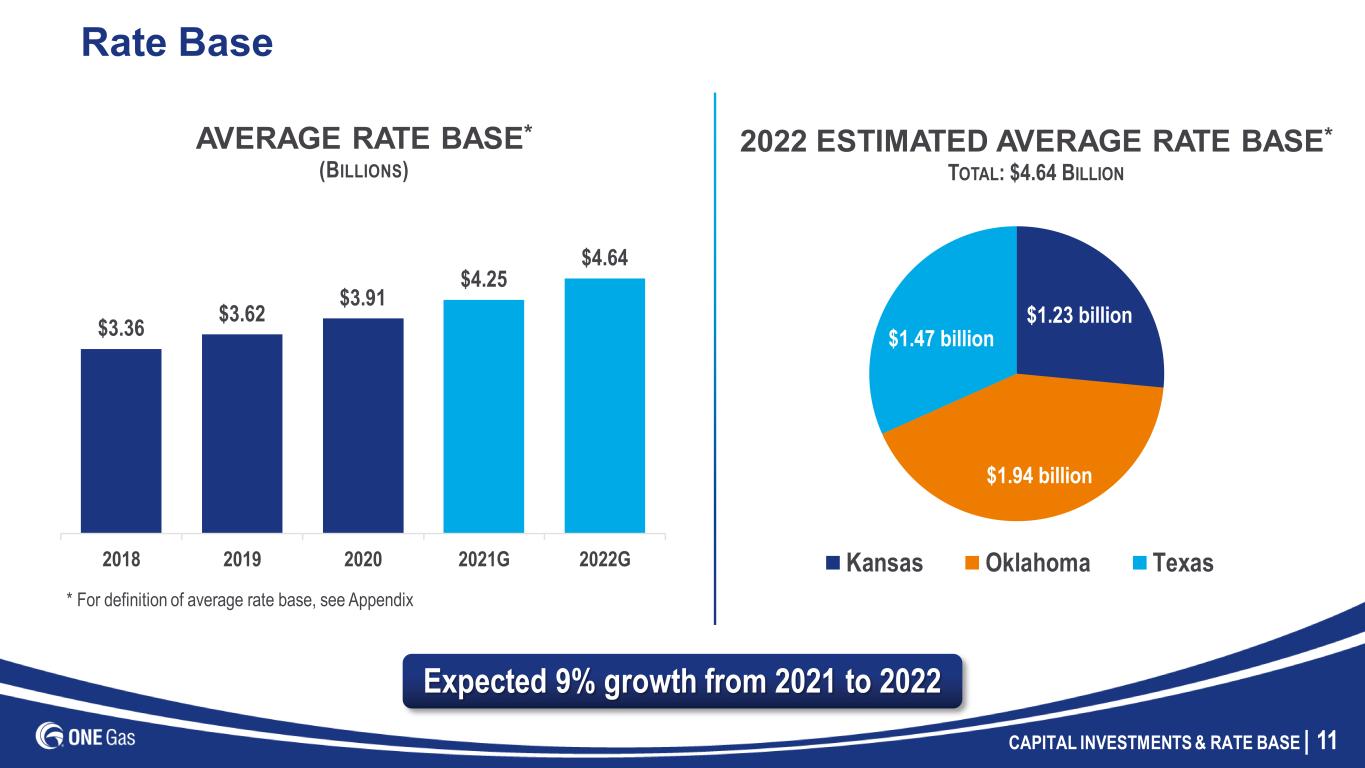
CAPITAL INVESTMENTS & RATE BASE | 11 $1.23 billion $1.94 billion $1.47 billion 2022 ESTIMATED AVERAGE RATE BASE* TOTAL: $4.64 BILLION Kansas Oklahoma Texas Rate Base $3.36 $3.62 $3.91 $4.25 $4.64 2018 2019 2020 2021G 2022G AVERAGE RATE BASE* (BILLIONS) * For definition of average rate base, see Appendix Expected 9% growth from 2021 to 2022

APPENDIX

APPENDIX | 13 Authorized Rate Base $1,257 $1,407 $1,475 $1,616 $1,726 2017 2018 2019 2020 2021 OKLAHOMA2 1 Kansas Gas Service’s most recent rate case, approved in February 2019, was settled without a determination of rate base and reflects Kansas Gas Service’s estimate of rate base contained within the settlement; these amounts are not necessarily indicative of current or future rate base. 2 Reflects authorized rate base as of Dec. 31, 2021. These amounts are not necessarily indicative of current or future rate bases. (M IL LI ON S) $947 $1,033 $1,068 $1,133 $1,197 2017 2018 2019 2020 2021 KANSAS1 $822 $895 $986 $1,047 $1,239 2017 2018 2019 2020 2021 TEXAS2

APPENDIX | 14 Rate Base Definition Authorized Rate Base $4.16 billion (as of Dec. 31, 2021) • Includes capital investments authorized in most recent rate cases and interim filings • Excludes any capital investments since last approved rate cases or filings 2022 Estimated Average Rate Base $4.64 billion • Average of rate base per book at beginning and end of year • Includes capital investments and other changes in rate base not yet approved for recovery
APPENDIX | 15 Non-GAAP Information ONE Gas has disclosed in this presentation cash flow from operations before changes in working capital, which is a non-GAAP financial measure. Cash flow from operations before changes in working capital is used as a measure of the company's financial performance. Cash flow from operations before changes in working capital is defined as net income adjusted for depreciation and amortization, deferred income taxes, and certain other noncash items. This non-GAAP financial measure is useful to investors as an indicator of financial performance of the company to generate cash flows sufficient to support our capital expenditure programs and pay dividends to our investors. ONE Gas cash flow from operations before changes in working capital should not be considered in isolation or as a substitute for net income or any other measure of financial performance presented in accordance with GAAP. This non-GAAP financial measure excludes some, but not all, items that affect net income. Additionally, this calculation may not be comparable with similarly titled measures of other companies. A reconciliation of cash flow from operations before changes in working capital to the most directly comparable GAAP measure are included in this presentation.

APPENDIX | 16 (MILLIONS) 2022 GUIDANCE* Net income $ 221 Depreciation and amortization 220 Deferred taxes 43 Other 20 Cash flow from operations before changes in working capital $ 504 Non-GAAP Reconciliation Cash Flow From Operations Before Changes in Working Capital * Amounts shown are estimated midpoints as contemplated in 2022 guidance


