| FREE WRITING PROSPECTUS | ||
| FILED PURSUANT TO RULE 433 | ||
| REGISTRATION FILE NO.: 333-177891-06 | ||
 |  |
Free Writing Prospectus
Structural and Collateral Term Sheet
$904,354,517
(Approximate Aggregate Cut-off Date Balance of Mortgage Pool)
$796,962,000
(Approximate Aggregate Principal Balance of Offered Certificates)
WFRBS Commercial Mortgage Trust 2013-C17
as Issuing Entity
RBS Commercial Funding Inc.
as Depositor
Wells Fargo Bank, National Association
The Royal Bank of Scotland
Rialto Mortgage Finance, LLC
Liberty Island Group I LLC
Basis Real Estate Capital II, LLC
C-III Commercial Mortgage LLC
The Royal Bank of Scotland
Rialto Mortgage Finance, LLC
Liberty Island Group I LLC
Basis Real Estate Capital II, LLC
C-III Commercial Mortgage LLC
as Sponsors and Mortgage Loan Sellers
Commercial Mortgage Pass-Through Certificates Series 2013-C17 | ||
October 28, 2013
RBS | WELLS FARGO SECURITIES | |
Co-Lead Manager and Co-Bookrunner | Co-Lead Manager and Co-Bookrunner | |
| Barclays Co-Manager | Deutsche Bank Securities Co-Manager |
STATEMENT REGARDING THIS FREE WRITING PROSPECTUS
The depositor has filed a registration statement (including a prospectus) with the Securities and Exchange Commission (‘‘SEC’’) (SEC File No. 333-177891) for the offering to which this communication relates. Before you invest, you should read the prospectus in the registration statement and other documents the depositor has filed with the SEC for more complete information about the depositor, the issuing entity and this offering. You may get these documents for free by visiting EDGAR on the SEC Web site at www.sec.gov. Alternatively, the depositor, any underwriter, or any dealer participating in the offering will arrange to send you the prospectus after filing if you request it by calling toll free 1-866-884-2071 (8 a.m. – 5 p.m. EST) or by emailing rbscmbs@rbs.com.
Nothing in this document constitutes an offer to sell or a solicitation to buy securities in any jurisdiction where such offer, solicitation or sale is not permitted. The information contained herein is preliminary as of the date hereof, supersedes any such information previously delivered to you and will be superseded by any information subsequently delivered and ultimately by the final prospectus relating to the securities. These materials are subject to change, completion, supplement or amendment from time to time.
STATEMENT REGARDING ASSUMPTIONS AS TO SECURITIES, PRICING ESTIMATES AND OTHER INFORMATION
The attached information contains certain tables and other statistical analyses (the “Computational Materials”) which have been prepared in reliance upon information furnished by the Mortgage Loan Sellers. Numerous assumptions were used in preparing the Computational Materials, which may or may not be reflected herein. As such, no assurance can be given as to the Computational Materials’ accuracy, appropriateness or completeness in any particular context; or as to whether the Computational Materials and/or the assumptions upon which they are based reflect present market conditions or future market performance. The Computational Materials should not be construed as either projections or predictions or as legal, tax, financial or accounting advice. You should consult your own counsel, accountant and other advisors as to the legal, tax, business, financial and related aspects of a purchase of these securities. Any weighted average lives, yields and principal payment periods shown in the Computational Materials are based on prepayment and/or loss assumptions, and changes in such prepayment and/or loss assumptions may dramatically affect such weighted average lives, yields and principal payment periods. In addition, it is possible that prepayments or losses on the underlying assets will occur at rates higher or lower than the rates shown in the attached Computational Materials. The specific characteristics of the securities may differ from those shown in the Computational Materials due to differences between the final underlying assets and the preliminary underlying assets used in preparing the Computational Materials. The principal amount and designation of any security described in the Computational Materials are subject to change prior to issuance. None of RBS Securities Inc. (“RBSSI”), Wells Fargo Securities, LLC (“WFS”), Barclays Capital Inc., Deutsche Bank Securities Inc. or any of their respective affiliates make any representation or warranty as to the actual rate or timing of payments or losses on any of the underlying assets or the payments or yield on the securities. The information in this presentation is based upon management forecasts and reflects prevailing conditions and management’s views as of this date, all of which are subject to change. In preparing this presentation, we have relied upon and assumed, without independent verification, the accuracy and completeness of all information available from public sources or which was provided to us by or on behalf of the Mortgage Loan Sellers or which was otherwise reviewed by us.
This free writing prospectus contains certain forward-looking statements. If and when included in this free writing prospectus, the words “expects”, “intends”, “anticipates”, “estimates” and analogous expressions and all statements that are not historical facts, including statements about our beliefs or expectations, are intended to identify forward-looking statements. Any forward-looking statements are made subject to risks and uncertainties which could cause actual results to differ materially from those stated. Those risks and uncertainties include, among other things, declines in general economic and business conditions, increased competition, changes in demographics, changes in political and social conditions, regulatory initiatives and changes in customer preferences, many of which are beyond our control and the control of any other person or entity related to this offering. The forward-looking statements made in this free writing prospectus are made as of the date stated on the cover. We have no obligation to update or revise any forward-looking statement.
RBS is a trade name for the investment banking business of RBSSI. Securities, syndicated loan arranging, financial advisory and other investment banking activities are performed by RBSSI and their securities affiliates. Lending, derivatives and other commercial banking activities are performed by The Royal Bank of Scotland plc and their banking affiliates. RBSSI is a member of SIPC, FINRA and the NYSE.
Wells Fargo Securities is the trade name for the capital markets and investment banking services of Wells Fargo & Company and its subsidiaries, including Wells Fargo Securities, LLC, a member of FINRA, NYSE, NFA and SIPC, Wells Fargo Institutional Securities, LLC, a member of FINRA and SIPC, Wells Fargo Prime Services, LLC, a member of FINRA, NFA and SIPC and Wells Fargo Bank, N.A.
IRS CIRCULAR 230 NOTICE
THIS TERM SHEET IS NOT INTENDED OR WRITTEN TO BE USED, AND CANNOT BE USED, FOR THE PURPOSE OF AVOIDING U.S. FEDERAL, STATE OR LOCAL TAX PENALTIES. THIS TERM SHEET IS WRITTEN AND PROVIDED BY THE DEPOSITOR IN CONNECTION WITH THE PROMOTION OR MARKETING BY THE DEPOSITOR AND THE CO-LEAD BOOKRUNNING MANAGERS OF THE TRANSACTION OR MATTERS ADDRESSED HEREIN. INVESTORS SHOULD SEEK ADVICE BASED ON THEIR PARTICULAR CIRCUMSTANCES FROM AN INDEPENDENT TAX ADVISOR.
IMPORTANT NOTICE REGARDING THE OFFERED CERTIFICATES
The offered certificates referred to in these materials and the asset pool backing them are subject to modification or revision (including the possibility that one or more classes of certificates may be split, combined or eliminated at any time prior to issuance or availability of a final prospectus) and are offered on a “when, as and if issued” basis. Prospective investors should understand that, when considering the purchase of the offered certificates, a contract of sale will come into being no sooner than the date on which the relevant class of certificates has been priced and the underwriters have confirmed the allocation of certificates to be made to investors; any “indications of interest” expressed by any prospective investor, and any “soft circles” generated by the underwriters, will not create binding contractual obligations for such prospective investors, on the one hand, or the underwriters, the depositor or any of their respective agents or affiliates, on the other hand.
As a result of the foregoing, a prospective investor may commit to purchase certificates that have characteristics that may change, and each prospective investor is advised that all or a portion of the certificates referred to in these materials may be issued that differ from the characteristics described in these materials. The underwriters’ obligation to sell certificates to any prospective investor is conditioned on the certificates and the transaction having the characteristics described in these materials. If the underwriters determine that a condition is not satisfied in any material respect, such prospective investor will be notified, and neither the depositor nor the underwriters will have any obligation to such prospective investor to deliver any portion of the offered certificates which such prospective investor has committed to purchase, and there will be no liability between the underwriters, the depositor or any of their respective agents or affiliates, on the one hand, and such prospective investor, on the other hand, as a consequence of the non-delivery.
Each prospective investor has requested that the underwriters provide to such prospective investor information in connection with such prospective investor’s consideration of the purchase of the certificates described in these materials. These materials are being provided to each prospective investor for informative purposes only in response to such prospective investor’s specific request. The underwriters described in these materials may from time to time perform investment banking services for, or solicit investment banking business from, any company named in these materials. The underwriters and/or their affiliates or respective employees may from time to time have a long or short position in any security or contract discussed in these materials.
The information contained herein supersedes any previous such information delivered to any prospective investor and will be superseded by information delivered to such prospective investor prior to the time of sale.
IMPORTANT NOTICE RELATING TO AUTOMATICALLY-GENERATED EMAIL DISCLAIMERS
Any legends, disclaimers or other notices that may appear at the bottom of, or attached to, any email communication to which this free writing prospectus is attached relating to (1) these materials not constituting an offer (or a solicitation of an offer), (2) no representation that these materials are accurate or complete and may not be updated or (3) these materials possibly being confidential, are not applicable to these materials and should be disregarded. Such legends, disclaimers or other notices have been automatically generated as a result of these materials having been sent via Bloomberg or another system.
THE INFORMATION IN THIS STRUCTURAL AND COLLATERAL TERM SHEET IS NOT COMPLETE AND MAY BE AMENDED PRIOR TO THE TIME OF SALE. THIS TERM SHEET IS NOT AN OFFER TO SELL THESE SECURITIES AND IT IS NOT A SOLICITATION OF AN OFFER TO BUY THESE SECURITIES IN ANY JURISDICTION WHERE THE OFFER OR SALE IS NOT PERMITTED.
2
| WFRBS Commercial Mortgage Trust 2013-C17 | Issue Characteristics |
I. Certificate Structure
| Approximate | ||||||||||
| Initial Certificate | Weighted | Certificate | ||||||||
| Principal Balance | Approx. | Pass-Through | Average | Expected | Certificate | Principal | ||||
| Expected Ratings | or Notional | Initial Credit | Rate | Life | Principal | Principal to | U/W NOI | |||
| Class | (Fitch/Moody's/DBRS)(1) | Amount(2) | Support(3) | Description | (Years)(4) | Window(4) | Value Ratio(5) | Debt Yield(6) | ||
| Offered Certificates | ||||||||||
| A-1 | AAA(sf)/Aaa(sf)/AAA(sf) | $48,455,000 | 30.000% | (7) | 2.56 | 12/13 - 08/18 | 41.8% | 17.2% | ||
| A-2 | AAA(sf)/Aaa(sf)/AAA(sf) | $166,900,000 | 30.000% | (7) | 4.87 | 08/18 - 11/18 | 41.8% | 17.2% | ||
| A-3 | AAA(sf)/Aaa(sf)/AAA(sf) | $125,000,000 | 30.000% | (7) | 9.86 | 08/23 - 10/23 | 41.8% | 17.2% | ||
| A-4 | AAA(sf)/Aaa(sf)/AAA(sf) | $236,856,000 | 30.000% | (7) | 9.91 | 10/23 - 11/23 | 41.8% | 17.2% | ||
| A-SB | AAA(sf)/Aaa(sf)/AAA(sf) | $55,837,000 | 30.000% | (7) | 7.46 | 11/18 - 08/23 | 41.8% | 17.2% | ||
| A-S | AAA(sf)/Aaa(sf)/AAA(sf) | $73,478,000 | 21.875% | (7) | 9.99 | 11/23 - 11/23 | 46.6% | 15.5% | ||
| B | AA-(sf)/Aa3(sf)/AA(low)(sf) | $58,784,000 | 15.375% | (7) | 9.99 | 11/23 - 11/23 | 50.5% | 14.3% | ||
| C | A-(sf)/A3(sf)/A(low)(sf) | $31,652,000 | 11.875% | (7) | 9.99 | 11/23 - 11/23 | 52.6% | 13.7% | ||
| X-A | AAA(sf)/Aaa(sf)/AAA(sf) | $706,526,000(8) | NAP | Variable(9) | NAP | NAP | N/A | N/A | ||
| X-B | AA-(sf)/Aa3(sf)/AAA(sf) | $58,784,000(10) | NAP | Variable(11) | NAP | NAP | N/A | N/A | ||
Non-Offered Certificates | ||||||||||
| X-C | NR/NR/ AAA(sf) | $59,913,517(12) | NAP | Variable(13) | NAP | NAP | N/A | N/A | ||
| D | BBB-(sf)/NR/ BBB(low)(sf) | $47,479,000 | 6.625% | (7) | 9.99 | 11/23 - 11/23 | 55.7% | 12.9% | ||
| E | BB(sf)/NR/ BB(sf) | $15,826,000 | 4.875% | (7) | 9.99 | 11/23 - 11/23 | 56.8% | 12.7% | ||
| F | B(sf)/NR/ B(sf) | $9,043,000 | 3.875% | (7) | 9.99 | 11/23 - 11/23 | 57.4% | 12.6% | ||
| G | NR/NR/NR | $35,044,517 | 0.000% | (7) | 9.99 | 11/23 - 11/23 | 59.7% | 12.1% |
| Notes: | |||
| (1) | The expected ratings presented are those of Fitch Ratings, Inc. (“Fitch”), Moody’s Investors Service, Inc. (“Moody's”) and DBRS, Inc. (“DBRS”), which the depositor hired to rate the rated offered certificates. One or more other nationally recognized statistical ratings organizations, as defined in Section 3(a)(62) of the Securities Exchange Act of 1934, as amended (the “Exchange Act”), that were not hired by the depositor may use information they receive pursuant to Rule 17g-5 under the Securities Exchange Act or otherwise to rate or provide market reports and/or published commentary related to the offered certificates. We cannot assure you as to what ratings a non-hired nationally recognized statistical rating organization would assign or that its reports will not express differing, possibly negative, views of the mortgage loans and/or the offered certificates. See “Risk Factors—Risks Related to the Offered Certificates—Nationally Recognized Statistical Rating Organizations May Assign Different Ratings to the Certificates; Ratings of the Certificates Reflect Only the Views of the Applicable Rating Agencies as of the Dates Such Ratings Were Issued; Ratings May Affect ERISA Eligibility; Ratings May be Downgraded” in the free writing prospectus, dated October 28, 2013 (the “Free Writing Prospectus”). | ||
| (2) | The principal balances and notional amounts set forth in the table are approximate. The actual initial principal balances and notional amounts may be larger or smaller depending on the aggregate cut-off date principal balance of the mortgage loans definitively included in the pool of mortgage loans, which aggregate cut-off date principal balance may be as much as 5% larger or smaller than the amount presented in the Free Writing Prospectus. | ||
| (3) | The approximate initial credit support with respect to the Class A-1, A-2, A-3, A-4 and A-SB Certificates represents the approximate credit enhancement for the Class A-1, A-2, A-3, A-4 and A-SB Certificates in the aggregate. | ||
| (4) | Weighted Average Lives and Expected Principal Windows are calculated based on an assumed prepayment rate of 0% CPR and the “Structuring Assumptions” described on Annex D to the Free Writing Prospectus. | ||
| (5) | The Certificate Principal to Value Ratio for each of the Class A-S, B, C, D, E, F and G Certificates is calculated by dividing the aggregate principal balance of such class of certificates and all classes of certificates (other than Class X-A, X-B and X-C, which are notional amount certificates and will not have principal balances) senior to such class by the aggregate appraised value of $1,515,361,393 (calculated as described in the Free Writing Prospectus) of the mortgaged properties securing the mortgage loans (excluding, with respect to the Matrix MHC Portfolio, Westfield Mission Valley and Home Depot Brush Avenue loan combinations, a pro rata portion of the related appraised value allocated to the related companion loan based on its cut-off date principal balance). The Certificate Principal to Value Ratios for each of the Class A-1, A-2, A-3, A-4 and A-SB Certificates are calculated by dividing the aggregate principal balance of the Class A-1, A-2, A-3, A-4 and A-SB Certificates by such aggregate appraised value (excluding, with respect to the Matrix MHC Portfolio, Westfield Mission Valley and Home Depot Brush Avenue loan combinations, a pro rata portion of the related appraised value allocated to the related companion loan based on its cut-off date principal balance). However, excess mortgaged property value associated with a mortgage loan will not be available to offset losses on any other mortgage loan (unless such mortgage loans are cross-collateralized and the cross-collateralization remains in effect). | ||
| (6) | The Certificate Principal U/W NOI Debt Yield for each of the Class A-S, B, C, D, E, F and G Certificates is calculated by dividing the underwritten net operating income (which excludes, with respect to the Matrix MHC Portfolio, Westfield Mission Valley and Home Depot Brush Avenue loan combinations, a pro rata portion of the related underwritten net operating income allocated to the related companion loan based on its cut-off date principal balance) for the mortgage pool of $109,174,369 (calculated as described in the Free Writing Prospectus) by the aggregate principal balance of such class of certificates and all classes of certificates (other than Class X-A, X-B and X-C, which are notional amount certificates and will not have principal balances) senior to such class of certificates. The Certificate Principal U/W NOI Debt Yield for each of the Class A-1, A-2, A-3, A-4 and A-SB Certificates is calculated by dividing such mortgage pool underwritten net operating income (which excludes, with respect to the Matrix MHC Portfolio, Westfield Mission Valley and Home Depot Brush Avenue loan combinations, a pro rata portion of the related underwritten net operating income allocated to the related companion loan based on its cut-off date principal balance) by the aggregate principal balance of the Class A-1, A-2, A-3, A-4 and A-SB Certificates. However, cash flow from each mortgaged property supports only the related mortgage loan and will not be available to support any other mortgage loan (unless such mortgage loans are cross-collateralized and the cross-collateralization remains in effect). | ||
| (7) | The pass-through rates for the Class A-1, A-2, A-3, A-4, A-SB, A-S, B, C, D, E, F and G Certificates, in each case, will be one of the following: (i) a fixed rate per annum, (ii) the WAC Rate (as defined in the Free Writing Prospectus) for the related distribution date, (iii) a variable rate per annum equal to the lesser of (a) a fixed rate and (b) the WAC Rate for the related distribution date or (iv) a variable rate per annum equal to the WAC Rate for the related distribution date minus a specified percentage. | ||
| (8) | The Class X-A Certificates are notional amount certificates. The Notional Amount of the Class X-A Certificates will be equal to the aggregate principal balance of the Class A-1, A-2, A-3, A-4, A-SB and A-S Certificates outstanding from time to time. The Class X-A Certificates will not be entitled to distributions of principal. | ||
| (9) | The pass-through rate for the Class X-A Certificates for any distribution date will be a per annum rate equal to the excess, if any, of (a) the WAC Rate for the related distribution date, over (b) the weighted average of the pass-through rates on the Class A-1, A-2, A-3, A-4, A-SB and A-S Certificates for the related distribution date, weighted on the basis of their respective aggregate principal balances outstanding immediately prior to that distribution date. | ||
| (10) | The Class X-B Certificates are notional amount certificates. The Notional Amount of the Class X-B Certificates will be equal to the principal balance of the Class B Certificates outstanding from time to time. The Class X-B Certificates will not be entitled to distributions of principal. | ||
THE INFORMATION IN THIS STRUCTURAL AND COLLATERAL TERM SHEET IS NOT COMPLETE AND MAY BE AMENDED PRIOR TO THE TIME OF SALE. THIS TERM SHEET IS NOT AN OFFER TO SELL THESE SECURITIES AND IT IS NOT A SOLICITATION OF AN OFFER TO BUY THESE SECURITIES IN ANY JURISDICTION WHERE THE OFFER OR SALE IS NOT PERMITTED.
3
| WFRBS Commercial Mortgage Trust 2013-C17 | Issue Characteristics |
| (11) | The pass-through rate for the Class X-B Certificates for any distribution date will be a per annum rate equal to the excess, if any, of (a) the WAC Rate for the related distribution date, over (b) the pass-through rates on the Class B Certificates for the related distribution date. | ||
| (12) | The Class X-C Certificates are notional amount certificates. The Notional Amount of the Class X-C Certificates will be equal to the aggregate principal balance of the Class E, F and G Certificates outstanding from time to time. The Class X-C Certificates will not be entitled to distributions of principal. | ||
| (13) | The pass-through rate for the Class X-C Certificates for any distribution date will be a per annum rate equal to the excess, if any, of (a) the WAC Rate for the related distribution date, over (b) the weighted average of the pass-through rates on the Class E, F and G Certificates for the related distribution date, weighted on the basis of their respective aggregate principal balances outstanding immediately prior to that distribution date. |
THE INFORMATION IN THIS STRUCTURAL AND COLLATERAL TERM SHEET IS NOT COMPLETE AND MAY BE AMENDED PRIOR TO THE TIME OF SALE. THIS TERM SHEET IS NOT AN OFFER TO SELL THESE SECURITIES AND IT IS NOT A SOLICITATION OF AN OFFER TO BUY THESE SECURITIES IN ANY JURISDICTION WHERE THE OFFER OR SALE IS NOT PERMITTED.
4
| WFRBS Commercial Mortgage Trust 2013-C17 | Issue Characteristics |
II. Transaction Highlights
Mortgage Loan Sellers:
| Number of | Number of | % of Cut-off | ||||||||
| Mortgage | Mortgaged | Aggregate Cut-off | Date Pool | |||||||
| Mortgage Loan Seller | Loans | Properties | Date Balance | Balance | ||||||
| Wells Fargo Bank, National Association | 35 | 44 | $310,523,181 | 34.3 | % | |||||
The Royal Bank of Scotland(1) | 13 | 16 | 221,057,500 | 24.4 | ||||||
| Rialto Mortgage Finance, LLC | 8 | 28 | 173,864,840 | 19.2 | ||||||
| Liberty Island Group I LLC | 7 | 14 | 83,681,740 | 9.3 | ||||||
| Basis Real Estate Capital II, LLC | 7 | 18 | 63,311,424 | 7.0 | ||||||
| C-III Commercial Mortgage LLC | 14 | 14 | 51,915,832 | 5.7 | ||||||
| Total | 84 | 134 | $904,354,517 | 100.0 | % | |||||
| (1) | The mortgage loan seller referred to herein as The Royal Bank of Scotland is comprised of two affiliated companies: The Royal Bank of Scotland plc and RBS Financial Products Inc. With respect to the mortgage loans being sold for the deposit into the trust by The Royal Bank of Scotland: (a) eight (8) mortgage loans, having an aggregate cut-off date principal balance of $115,457,500 and representing 12.8% of the aggregate principal balance of the pool of mortgage loans as of the cut-off date, are being sold for deposit into the trust only by The Royal Bank of Scotland plc (b) five (5) mortgage loans, having a cut-off date principal balance of $105,600,000 and representing 11.7% of the aggregate principal balance of the pool of mortgage loans as of the cut-off date are being sold for deposit into the trust by RBS Financial Products Inc. |
| Loan Pool: | ||
| Cut-off Date Balance: | $904,354,517 | |
| Number of Mortgage Loans: | 84 | |
| Average Cut-off Date Balance per Mortgage Loan: | $10,766,125 | |
| Number of Mortgaged Properties: | 134 | |
Average Cut-off Date Balance per Mortgaged Property(1): | $6,748,914 | |
| Weighted Average Mortgage Interest Rate: | 5.194% | |
| Ten Largest Mortgage Loans as % of Cut-off Date Pool Balance: | 45.3% | |
| Weighted Average Original Term to Maturity or ARD (months): | 109 | |
| Weighted Average Remaining Term to Maturity or ARD (months): | 108 | |
Weighted Average Original Amortization Term (months)(2): | 346 | |
Weighted Average Remaining Amortization Term (months)(2): | 346 | |
| Weighted Average Seasoning (months): | 1 |
| (1) | Information regarding mortgage loans secured by multiple properties is based on an allocation according to relative appraised values or the allocated loan amounts or property-specific release prices set forth in the related loan documents or such other allocation as the related mortgage loan seller deemed appropriate. |
| (2) | Excludes any mortgage loan that does not amortize. |
| Credit Statistics: | ||
Weighted Average U/W Net Cash Flow DSCR(1): | 1.80x | |
Weighted Average U/W Net Operating Income Debt Yield Ratio(1): | 12.1% | |
Weighted Average Cut-off Date Loan-to-Value Ratio(1): | 62.6% | |
Weighted Average Balloon or ARD Loan-to-Value Ratio(1): | 54.4% | |
| % of Mortgage Loans with Additional Subordinate Debt: | 7.2% | |
% of Mortgage Loans with Single Tenants(2): | 5.7% |
| (1) | With respect to the Matrix MHC Portfolio, Westfield Mission Valley and Home Depot Brush Avenue mortgage loans, loan-to-value ratio, debt service coverage ratio and debt yield calculations include the related pari passu companion loan (unless otherwise stated) in total debt. The information for each mortgaged property that relates to a mortgage loan that is cross-collateralized with other mortgage loans is based upon the principal balance of that mortgage loan, except that the applicable loan-to-value ratio, debt service coverage ratio, or debt yield for each such mortgaged property is based upon the ratio or yield (as applicable) for the aggregate indebtedness evidenced by all loans in the group. On an individual basis, without regard to the cross-collateralization feature, any mortgaged property securing a mortgage loan that is part of a cross-collateralized group of mortgage loans may have a higher loan-to-value ratio, lower debt service coverage ratio and/or lower debt yield than is presented herein. See Annex A to the Free Writing Prospectus. Debt service coverage ratio, debt yield and loan-to-value ratio information takes no account of subordinate debt (whether or not secured by the mortgaged property), if any, that is allowed under the terms of any mortgage loan. |
| (2) | Excludes mortgage loans that are secured by multiple single-tenant properties with different tenants at such properties. |
THE INFORMATION IN THIS STRUCTURAL AND COLLATERAL TERM SHEET IS NOT COMPLETE AND MAY BE AMENDED PRIOR TO THE TIME OF SALE. THIS TERM SHEET IS NOT AN OFFER TO SELL THESE SECURITIES AND IT IS NOT A SOLICITATION OF AN OFFER TO BUY THESE SECURITIES IN ANY JURISDICTION WHERE THE OFFER OR SALE IS NOT PERMITTED.
5
| WFRBS Commercial Mortgage Trust 2013-C17 | Issue Characteristics |
Loan Structural Features:
Amortization: Based on the Cut-off Date Pool Balance, 80.6% of the mortgage pool (79 mortgage loans) has scheduled amortization, as follows:
55.1% (65 mortgage loans) requires amortization during the entire loan term
25.4% (14 mortgage loans) provides for an interest-only period followed by an amortization period
Interest-Only: Based on the Cut-off Date Pool Balance, 19.4% of the mortgage pool (5 mortgage loans) provides for interest-only payments during the entire loan term. The Weighted Average Cut-off Date Loan-to-Value Ratio and Weighted Average U/W Net Cash Flow DSCR for those mortgage loans is 44.6% and 3.00x, respectively.
Hard Lockboxes: Based on the Cut-off Date Pool Balance, 35.5% of the mortgage pool (20 mortgage loans) has hard lockboxes in place.
Reserves: The mortgage loans require amounts to be escrowed monthly as follows (excluding any mortgage loans with springing provisions):
| Real Estate Taxes: | 76.4% of the pool | |
| Insurance Premiums: | 65.8% of the pool | |
| Capital Replacements: | 79.2% of the pool | |
| TI/LC: | 67.2% of the pool | (1) |
| (1) The percentage of Cut-off Date Balance for loans with TI/LC reserves is based on the aggregate principal balance allocable to office, retail, industrial and mixed use properties. | ||
Call Protection/Defeasance: Based on the Cut-off Date Pool Balance, the mortgage pool has the following call protection and defeasance features:
89.7% of the mortgage pool (79 mortgage loans) features a lockout period, then defeasance only until an open period
6.1% of the mortgage pool (1 mortgage loan) features a lockout period, then defeasance or the greater of a prepayment premium or yield maintenance until an open period
4.3% of the mortgage pool (4 mortgage loans) features a lockout period, then the greater of a prepayment premium or yield maintenance until an open period
THE INFORMATION IN THIS STRUCTURAL AND COLLATERAL TERM SHEET IS NOT COMPLETE AND MAY BE AMENDED PRIOR TO THE TIME OF SALE. THIS TERM SHEET IS NOT AN OFFER TO SELL THESE SECURITIES AND IT IS NOT A SOLICITATION OF AN OFFER TO BUY THESE SECURITIES IN ANY JURISDICTION WHERE THE OFFER OR SALE IS NOT PERMITTED.
6
| WFRBS Commercial Mortgage Trust 2013-C17 | Issue Characteristics |
| III. | Issue Characteristics | ||
| Securities Offered: | $796,962,000 approximate monthly pay, multi-class, commercial mortgage REMIC pass-through certificates consisting of ten classes (Classes A-1, A-2, A-3, A-4, A-SB, A-S, B, C, X-A and X-B), which are offered pursuant to a registration statement filed with the SEC. | ||
| Mortgage Loan Sellers: | Wells Fargo Bank, National Association (“WFB”); The Royal Bank of Scotland (“RBS”); Rialto Mortgage Finance, LLC (“RMF”); Liberty Island Group I LLC (“LIG I”); Basis Real Estate Capital II, LLC (“Basis”) and C-III Commercial Mortgage LLC (“CIIICM”) | ||
| Co-lead Bookrunning | |||
| Managers: | RBS Securities Inc. and Wells Fargo Securities, LLC | ||
| Co-Managers: | Barclays Capital Inc. and Deutsche Bank Securities Inc. | ||
| Rating Agencies: | Fitch Ratings, Inc., Moody’s Investors Service, Inc. and DBRS, Inc., | ||
| Master Servicer: | Wells Fargo Bank, National Association | ||
| Special Servicer: | Rialto Capital Advisors, LLC | ||
| Certificate Administrator: | Wells Fargo Bank, National Association | ||
| Trustee: | U.S. Bank National Association | ||
| Trust Advisor: | Trimont Real Estate Advisors, Inc. | ||
Initial Majority Subordinate Certificateholder: | RREF II CMBS AIV, LP, an affiliate of Rialto Real Estate Fund, LP, or another affiliate of Rialto Real Estate Fund, LP | ||
| Cut-off Date: | The Cut-off Date with respect to each mortgage loan is the due date for the monthly debt service payment that is due in November 2013 (or, in the case of any mortgage loan that has its first due date in December 2013, the date that would have been its due date in November 2013 under the terms of that mortgage loan if a monthly debt service payment were scheduled to be due in that month). | ||
| Expected Closing Date: | On or about November 20, 2013. | ||
| Determination Dates: | The eleventh day of each month (or if that day is not a business day, the next succeeding business day), commencing in December 2013. | ||
| Distribution Dates: | The fourth business day following the Determination Date in each month, commencing in December 2013. | ||
| Rated Final Distribution Date: | The Distribution Date in December 2046. | ||
| Interest Accrual Period: | With respect to any Distribution Date, the calendar month preceding the month in which such Distribution Date occurs. | ||
| Day Count: | The Offered Certificates will accrue interest on a 30/360 basis. | ||
| Minimum Denominations: | $10,000 for each Class of Offered Certificates (other than the class X-A and class X-B Certificates) and $1,000,000 for the class X-A and Class X-B Certificates. Investments may also be made in any whole dollar denomination in excess of the applicable minimum denomination. | ||
| Clean-up Call: | 1% | ||
| Delivery: | DTC, Euroclear and Clearstream Banking | ||
| ERISA/SMMEA Status: | Each Class of Offered Certificates is expected to be eligible for exemptive relief under ERISA. No Class of Offered Certificates will be SMMEA eligible. | ||
| Risk Factors: | THE CERTIFICATES INVOLVE CERTAIN RISKS AND MAY NOT BE SUITABLE FOR ALL INVESTORS. SEE THE “RISK FACTORS” SECTION OF THE FREE WRITING PROSPECTUS. | ||
Bond Analytics Information: | The Certificate Administrator will be authorized to make distribution date settlements, CREFC® reports and certain supplemental reports (other than confidential information) available to certain financial modeling and data provision services, including Bloomberg Financial Markets L.P., Trepp LLC, Intex Solutions, Inc., Markit Group Limited, Interactive Data Corp.,BlackRock Financial Management, Inc. and CMBS.com, Inc. |
THE INFORMATION IN THIS STRUCTURAL AND COLLATERAL TERM SHEET IS NOT COMPLETE AND MAY BE AMENDED PRIOR TO THE TIME OF SALE. THIS TERM SHEET IS NOT AN OFFER TO SELL THESE SECURITIES AND IT IS NOT A SOLICITATION OF AN OFFER TO BUY THESE SECURITIES IN ANY JURISDICTION WHERE THE OFFER OR SALE IS NOT PERMITTED.
7
| WFRBS Commercial Mortgage Trust 2013-C17 | Characteristics of the Mortgage Pool |
IV. Characteristics of the Mortgage Pool(1)
A. Ten Largest Mortgage Loans
| % of Cut- | ||||||||||||||||||||||||||||||
| Number of | off Date | Number of | Cut-off Date | |||||||||||||||||||||||||||
| Mortgage | Mortgage Loans / | Mortgage Loan | Pool | SF, Rooms, | Balance Per | Cut-off Date | Balloon or | U/W NOI | ||||||||||||||||||||||
| Loan | Mortgaged | Cut-off Date | Balance | Property | Pads or | Unit of | LTV Ratio | ARD LTV | U/W NCF | Debt Yield | ||||||||||||||||||||
| Seller | Mortgage Loan Name | City | State | Properties | Balance ($) | (%) | Type | Beds | Measure($) | (%) | Ratio (%) | DSCR (x) | (%) | |||||||||||||||||
| WFB | Hilton Sandestin Beach Resort & Spa | Destin | FL | 1 / 1 | $75,000,000 | 8.3 | % | Hospitality | 598 | $125,418 | 36.6 | % | 36.6 | % | 3.37 | x | 19.8 | % | ||||||||||||
| Manufactured | ||||||||||||||||||||||||||||||
| RMF | Matrix MHC Portfolio | Various | Various | 1 / 11 | 65,500,000 | 7.2 | Housing | 5,347 | 25,248 | 69.4 | 66.2 | 1.47 | 11.1 | |||||||||||||||||
| Community | ||||||||||||||||||||||||||||||
| RBS | Westfield Mission Valley | San Diego | CA | 1 / 1 | 55,000,000 | 6.1 | Retail | 997,549 | 155 | 43.9 | 43.9 | 3.12 | 14.9 | |||||||||||||||||
| RBS | One Bridge Street | Irvington | NY | 1 / 1 | 52,000,000 | 5.7 | Office | 195,402 | 266 | 74.3 | 61.6 | 1.31 | 9.2 | |||||||||||||||||
| RMF | Olympia Development Portfolio I | Various | Various | 1 / 10 | 35,130,000 | 3.9 | Various | Various | Various | 69.5 | 65.9 | 1.30 | 9.8 | |||||||||||||||||
| RBS | Marriott Courtyard - Goleta | Goleta | CA | 1 / 1 | 30,100,000 | 3.3 | Hospitality | 115 | 261,739 | 69.7 | 57.3 | 1.57 | 11.0 | |||||||||||||||||
| WFB | Security Self Storage Portfolio I | Various | Various | 1 / 7 | 26,800,000 | 3.0 | Self Storage | 381,700 | 70 | 71.2 | 58.2 | 1.52 | 9.9 | |||||||||||||||||
| WFB | The Barlow | Sebastopol | CA | 1 / 1 | 23,800,000 | 2.6 | Mixed Use | 174,901 | 136 | 67.6 | 63.1 | 1.48 | 9.6 | |||||||||||||||||
| WFB | Rockwall Market Center | Rockwall | TX | 1 / 1 | 23,070,000 | 2.6 | Retail | 209,054 | 110 | 72.5 | 65.6 | 1.33 | 9.4 | |||||||||||||||||
| Basis | Crowne Tundra Hotel Portfolio | Various | Various | 1 / 2 | 22,968,294 | 2.5 | Hospitality | 480 | 47,851 | 55.9 | 50.3 | 1.75 | 15.6 | |||||||||||||||||
| Top Three Total/Weighted Average | 3 / 13 | $195,500,000 | 21.6 | % | 49.6 | % | 48.6 | % | 2.66 | x | 15.5 | % | ||||||||||||||||||
| Top Five Total/Weighted Average | 5 / 24 | $282,630,000 | 31.3 | % | 56.6 | % | 53.1 | % | 2.24 | x | 13.6 | % | ||||||||||||||||||
| Top Ten Total/Weighted Average | 10 / 36 | $409,368,294 | 45.3 | % | 60.0 | % | 54.9 | % | 2.02 | x | 12.8 | % | ||||||||||||||||||
| Non-Top Ten Total/Weighted Average | 74 / 98 | $494,986,223 | 54.7 | % | 64.7 | % | 53.9 | % | 1.62 | x | 11.4 | % | ||||||||||||||||||
(1) With respect to the Matrix MHC Portfoilo and Westfield Mission Valley mortgage loans, Cut-off Date Balance per unit of measure, loan-to-value ratio, debt service coverage ratio and debt yield calculations include the related pari passu companion loan (unless otherwise stated) in total debt. | ||||||||||||||||||||||||||||||
B. Summary of Pari Passu Split Loan Structures
| Whether Note is | |||||||||||||
| Related Notes in | Lead Servicing for | ||||||||||||
| Mortgage Loan | Loan Group | the Entire Loan | Current Master Servicer Under Related | Current Special Servicer Under Related | |||||||||
| Mortgage Loan Name | Seller | (Original Balance) | Holder of Note | Combination | Securitization PSA | Securitization PSA | |||||||
| Matrix MHC Portfolio | RMF | $65,500,000 | WFRBS 2013-C17 | No | Wells Fargo Bank, National Association | Rialto Capital Advisors, LLC | |||||||
| RMF | $69,500,000 | GSMS 2013-GCJ16(1) | Yes | Wells Fargo Bank, National Association | Rialto Capital Advisors, LLC | ||||||||
| Westfield Mission Valley | RBS | $55,000,000 | WFRBS 2013-C17 | No | Wells Fargo Bank, National Association | Rialto Capital Advisors, LLC | |||||||
| Home Depot Brush Avenue | RBS | $100,000,000 | WFRBS 2013-C16 | Yes | Wells Fargo Bank, National Association | Rialto Capital Advisors, LLC | |||||||
| RMF | $14,400,000 | WFRBS 2013-C17 | Yes | Wells Fargo Bank, National Association | Rialto Capital Advisors, LLC | ||||||||
| RMF | $12,600,000 | GSMS 2013-GCJ16(1) | No | Wells Fargo Bank, National Association | Rialto Capital Advisors, LLC | ||||||||
(1) The related pari passu companion loans are currently held by the mortgage loan seller for the mortgage loan included in the WFRBS 2013-C17 trust, but is expected to be held by the trustee for the GSMS 2013-GCJ16 Trust upon the closing of such securitization.
THE INFORMATION IN THIS STRUCTURAL AND COLLATERAL TERM SHEET IS NOT COMPLETE AND MAY BE AMENDED PRIOR TO THE TIME OF SALE. THIS TERM SHEET IS NOT AN OFFER TO SELL THESE SECURITIES AND IT IS NOT A SOLICITATION OF AN OFFER TO BUY THESE SECURITIES IN ANY JURISDICTION WHERE THE OFFER OR SALE IS NOT PERMITTED.
8
| WFRBS Commercial Mortgage Trust 2013-C17 | Characteristics of the Mortgage Pool |
C. Previous Securitization History(1) |
| Mortgage Loan | ||||||||||||||||
| Mortgage | or Mortgaged | % of Cut-off | ||||||||||||||
| Loan | Mortgage | Loan or Mortgaged | Property | Property Cut-off | Date Pool | |||||||||||
| No. | Loan Seller | Property Name | City | State | Type | Date Balance ($) | Balance (%) | Previous Securitization | ||||||||
| 1 | WFB | Hilton Sandestin Beach Resort & Spa | Destin | FL | Hospitality | $75,000,000 | 8.3% | BSCMS 2004-PWR6 | ||||||||
| 4 | RBS | One Bridge Street | Irvington | NY | Office | 52,000,000 | 5.7 | CSFB 2005-C6 | ||||||||
| 5.01 | RMF | Publix Supermarket & Retail: H&R Block, UPS, Domino's | Temple Terrace | FL | Retail | 6,750,000 | 0.7 | WBCMT 2005-C17 | ||||||||
| 5.03 | RMF | Walgreens #4398 | Dunedin | FL | Retail | 4,880,000 | 0.5 | WBCMT 2005-C17 | ||||||||
| 5.04 | RMF | Walgreens #5447 | Marietta | GA | Retail | 3,840,000 | 0.4 | WBCMT 2005-C17 | ||||||||
| 5.05 | RMF | Walgreens #5580 | Decatur | GA | Retail | 3,680,000 | 0.4 | WBCMT 2005-C17 | ||||||||
| 5.06 | RMF | Walgreens #4480 | Oldsmar | FL | Retail | 3,127,500 | 0.3 | WBCMT 2005-C17 | ||||||||
| 5.07 | RMF | Applebee's | Lithia Springs | GA | Retail | 2,390,000 | 0.3 | WBCMT 2005-C17 | ||||||||
| 5.08 | RMF | Dunedin Office (Da Vinci & BayCare) | Dunedin | FL | Office | 2,217,500 | 0.2 | WBCMT 2005-C17 | ||||||||
| 5.09 | RMF | Bank of America | Dunedin | FL | Retail | 1,575,000 | 0.2 | WBCMT 2005-C17 | ||||||||
| 5.10 | RMF | Anytime Fitness/Dunkin' Donuts | Dunedin | FL | Retail | 1,500,000 | 0.2 | WBCMT 2005-C17 | ||||||||
| 12 | LIG I | Midway Shopping Center | Mill Creek Hundred | DE | Retail | 17,000,000 | 1.9 | WBCMT 2003-C4 | ||||||||
| 16 | RBS | 450 - 460 N. Canon Drive | Beverly Hills | CA | Retail | 14,500,000 | 1.6 | MLMT 2005-CIP1 | ||||||||
| 19 | LIG I | Holiday Inn Express Old Town San Diego | San Diego | CA | Hospitality | 13,985,158 | 1.5 | JPMCC 2004-PNC1 | ||||||||
| 30 | BASIS | Huntington Ridge | Irving | TX | Multifamily | 8,500,000 | 0.9 | CSFB 2005-C1 | ||||||||
| 33 | LIG I | 690 Merrill Road | Pittsfield | MA | Retail | 8,000,000 | 0.9 | PNCMA 1999-CM1 | ||||||||
| 40 | WFB | Locust Grove Village | Locust Grove | GA | Retail | 7,189,771 | 0.8 | MLMT 2003-KEY1 | ||||||||
| 43 | WFB | Park Plaza Shopping Center | Chico | CA | Retail | 6,500,000 | 0.7 | BSCMS 2004-PWR3 | ||||||||
| 44 | CIIICM | Lincoln Park MHC | West Allis | WI | Manufactured Housing Community | 6,493,382 | 0.7 | BACM 2004-C1 | ||||||||
| 51 | CIIICM | Wheatland Estates MHC | Burlington | WI | Manufactured Housing Community | 5,084,817 | 0.6 | BACM 2004-C1 | ||||||||
| 56 | CIIICM | Arlington MHC | Bloomington | IN | Manufactured Housing Community | 4,130,790 | 0.5 | BACM 2004-C1 | ||||||||
| 58 | CIIICM | Champions Business Park | Houston | TX | Mixed Use | 4,000,000 | 0.4 | LBUBS 2004-C1 | ||||||||
| 59 | WFB | Royal Plaza Building | Los Angeles | CA | Mixed Use | 3,994,402 | 0.4 | MSC 2004-T13 | ||||||||
| 62 | RBS | Torrey Highlands Plaza | San Diego | CA | Retail | 3,500,000 | 0.4 | JPMCC 2004-C1 | ||||||||
| 63 | WFB | Walgreens - Prattville | Prattville | AL | Retail | 3,495,009 | 0.4 | WGL 2002-1 | ||||||||
| 64 | WFB | Walgreens - Suwanee | Suwanee | GA | Retail | 3,292,541 | 0.4 | MLMT 2003-KEY1 | ||||||||
| 66 | WFB | Antelope Self Storage | Sacramento | CA | Self Storage | 3,096,963 | 0.3 | MSC 2004-T13 | ||||||||
| 67 | CIIICM | Sunset MHC | Marshalltown | IA | Manufactured Housing Community | 3,096,844 | 0.3 | BACM 2004-1 | ||||||||
| 71 | WFB | Shops at Dana Park | Mesa | AZ | Retail | 2,622,503 | 0.3 | MSC 2004-HQ3 | ||||||||
| 72 | WFB | Fort Security Self Storage | Fort Wayne | IN | Self Storage | 2,597,683 | 0.3 | CSFB 2004-C1 | ||||||||
| 73 | RBS | Budget Self Storage Portfolio | Various | CA | Self Storage | 2,500,000 | 0.3 | BSCMS 2005-PWR8 | ||||||||
| 73.01 | RBS | Lancaster | Lancaster | CA | Self Storage | 1,302,100 | 0.1 | BSCMS 2005-PWR8 | ||||||||
| 73.02 | RBS | Palmdale | Palmdale | CA | Self Storage | 1,197,900 | 0.1 | BSCMS 2005-PWR8 | ||||||||
| 74 | WFB | Village Plaza Shopping Center | Redding | CA | Retail | 2,196,537 | 0.2 | MSC 2003-T11 | ||||||||
| 76 | WFB | Walgreens - Leander | Leander | TX | Retail | 1,993,018 | 0.2 | WBCMT 2003-C8 | ||||||||
| 77 | CIIICM | Thousand Oaks | Mansfeld | TX | Manufactured Housing Community | 1,835,000 | 0.2 | JPMCC 2004-C1 | ||||||||
| 78 | WFB | All Climate Controlled Self Storage | Miramar Beach | FL | Self Storage | 1,700,000 | 0.2 | LBUBS 2004-C1 | ||||||||
| 83 | WFB | Charger Square | Mesquite | TX | Mixed Use | 1,000,000 | 0.1 | LBUBS 2003-C8 | ||||||||
| Total | $291,764,418 | 32.3% |
| (1) | The table above represents the most recent securitization with respect to the mortgaged property securing the related mortgage loan, based on information provided by the related borrower or obtained through searches of a third-party database. While the above mortgage loans may have been securitized multiple times in prior transactions, mortgage loans are only listed in the above chart if the mortgage loan paid off a mortgage loan in another securitization. The information has not otherwise been confirmed by the mortgage loan sellers. |
THE INFORMATION IN THIS STRUCTURAL AND COLLATERAL TERM SHEET IS NOT COMPLETE AND MAY BE AMENDED PRIOR TO THE TIME OF SALE. THIS TERM SHEET IS NOT AN OFFER TO SELL THESE SECURITIES AND IT IS NOT A SOLICITATION OF AN OFFER TO BUY THESE SECURITIES IN ANY JURISDICTION WHERE THE OFFER OR SALE IS NOT PERMITTED.
9
| WFRBS Commercial Mortgage Trust 2013-C17 | Characteristics of the Mortgage Pool |
D. Mortgage Loans with Scheduled Balloon Payments and Related Classes |
Class A-2(1) | ||||||||||||||||||||||||||||||||
Loan No. | Mortgage Loan Seller | Mortgage Loan Name | State | Property Type | Mortgage Loan Cut-off Date Balance ($) | % of Cut-off Date Pool Balance (%) | Mortgage Loan Balance at Maturity ($) | % of Class A-2 Certificate Principal Balance (%)(2) | Pads/ Units/SF /Rooms | Loan per Pad/Unit/ SF/ Room ($) | U/W NCF DSCR (x) | U/W NOI Debt Yield (%) | Cut-off Date LTV Ratio (%) | Balloon LTV Ratio (%) | Rem. IO Period (mos.) | Rem. Term to Maturity (mos.) | ||||||||||||||||
| 2 | RMF | Matrix MHC Portfolio | Various | Manufactured Housing Community | $65,500,000 | 7.2% | $62,483,509 | 37.4% | 5,347 | $25,248 | 1.47x | 11.1% | 69.4% | 66.2% | 9 | 57 | ||||||||||||||||
| 5 | RMF | Olympia Development Portfolio I | Various | Various | 35,130,000 | 3.9 | 33,308,227 | 20.0 | Various | Various | 1.30 | 9.8 | 69.5 | 65.9 | 18 | 60 | ||||||||||||||||
| 8 | WFB | The Barlow | CA | Mixed Use | 23,800,000 | 2.6 | 22,220,965 | 13.3 | 174,901 | 136 | 1.48 | 9.6 | 67.6 | 63.1 | 12 | 60 | ||||||||||||||||
| 10 | Basis | Crowne Tundra Hotel Portfolio | Various | Hospitality | 22,968,294 | 2.5 | 20,665,581 | 12.4 | 480 | 47,851 | 1.75 | 15.6 | 55.9 | 50.3 | 0 | 59 | ||||||||||||||||
| 18 | RBS | 21st Century Storage Portfolio | Various | Self Storage | 14,200,000 | 1.6 | 14,200,000 | 8.5 | 225,776 | 63 | 2.24 | 9.9 | 66.6 | 66.6 | 60 | 60 | ||||||||||||||||
| 28 | RMF | Reserve at Garden Lake | GA | Multifamily | 8,750,000 | 1.0 | 8,186,085 | 4.9 | 278 | 31,475 | 1.51 | 10.2 | 75.0 | 70.1 | 11 | 59 | ||||||||||||||||
| 74 | WFB | Village Plaza Shopping Center | CA | Retail | 2,196,537 | 0.2 | 1,953,327 | 1.2 | 75,750 | 29 | 1.83 | 15.9 | 43.2 | 38.5 | 0 | 59 | ||||||||||||||||
| Total/Weighted Average | $172,544,831 | 19.1% | $163,017,694 | 97.7% | 1.54x | 11.1% | 67.1% | 63.5% | 14 | 59 | ||||||||||||||||||||||
(1) The table above presents the mortgage loans whose balloon payments would be applied to pay down the principal balance of the Class A-2 Certificates, assuming a 0% CPR and applying the “Structuring Assumptions” described in the Free Writing Prospectus, including the assumptions that (i) none of the mortgage loans in the pool experience prepayments, defaults or losses; (ii) there are no extensions of maturity dates of any mortgage loans in the pool; and (iii) each mortgage loan in the pool is paid in full on its stated maturity date. Each class of Certificates, including the Class A-2 Certificates, evidences undivided ownership interests in the entire pool of mortgage loans. (1) Reflects the percentage of the Mortgage Loan Balance at Maturity divided by the initial Class A-2 Certificate Principal Balance. |
THE INFORMATION IN THIS STRUCTURAL AND COLLATERAL TERM SHEET IS NOT COMPLETE AND MAY BE AMENDED PRIOR TO THE TIME OF SALE. THIS TERM SHEET IS NOT AN OFFER TO SELL THESE SECURITIES AND IT IS NOT A SOLICITATION OF AN OFFER TO BUY THESE SECURITIES IN ANY JURISDICTION WHERE THE OFFER OR SALE IS NOT PERMITTED.
10
(THIS PAGE INTENTIONALLY LEFT BLANK)
11
| WFRBS Commercial Mortgage Trust 2013-C17 | Characteristics of the Mortgage Pool |
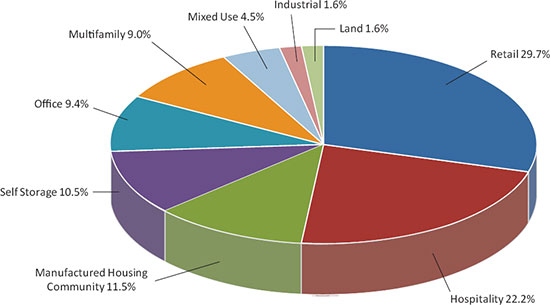
E. Property Type Distribution(1)
| % of Cut- | Weighted | Weighted | Weighted | Weighted | |||||||||||||||||||||||
| off Date | Average | Average | Weighted | Average | Average | Weighted | |||||||||||||||||||||
| Number of | Aggregate Cut- | Pool | Cut-off | Balloon or | Average | U/W NOI | U/W NCF | Average | |||||||||||||||||||
| Mortgaged | off Date Balance | Balance | Date LTV | ARD LTV | U/W NCF | Debt | Debt | Mortgage | |||||||||||||||||||
| Property Type | Properties | ($) | (%) | Ratio (%) | Ratio (%) | DSCR (x) | Yield (%) | Yield (%) | Rate (%) | ||||||||||||||||||
| Retail | 46 | $268,748,461 | 29.7 | % | 61.0 | % | 53.2 | % | 1.83 | x | 11.5 | % | 10.6 | % | 5.004 | % | |||||||||||
| Anchored | 15 | 135,534,741 | 15.0 | 67.8 | 58.0 | 1.51 | 10.3 | 9.3 | 5.089 | ||||||||||||||||||
| Regional Mall | 1 | 55,000,000 | 6.1 | 43.9 | 43.9 | 3.12 | 14.9 | 14.4 | 4.554 | ||||||||||||||||||
| Single Tenant | 21 | 42,271,068 | 4.7 | 64.3 | 54.9 | 1.41 | 10.9 | 9.9 | 5.175 | ||||||||||||||||||
| Unanchored | 6 | 23,576,769 | 2.6 | 57.3 | 47.3 | 1.53 | 11.3 | 10.4 | 5.181 | ||||||||||||||||||
Shadow Anchored(2) | 3 | 12,365,883 | 1.4 | 57.6 | 47.6 | 1.68 | 11.9 | 10.9 | 5.142 | ||||||||||||||||||
| Hospitality | 16 | 200,895,094 | 22.2 | 52.2 | 45.2 | 2.36 | 16.2 | 14.1 | 5.202 | ||||||||||||||||||
| Full Service | 4 | 103,138,294 | 11.4 | 42.5 | 41.1 | 2.91 | 18.4 | 15.7 | 5.127 | ||||||||||||||||||
| Limited Service | 11 | 87,771,354 | 9.7 | 63.0 | 50.2 | 1.70 | 13.1 | 11.7 | 5.277 | ||||||||||||||||||
| Extended Stay | 1 | 9,985,446 | 1.1 | 57.1 | 43.2 | 2.56 | 20.2 | 18.6 | 5.310 | ||||||||||||||||||
| Manufactured Housing Community | 23 | 104,264,527 | 11.5 | 69.4 | 62.6 | 1.52 | 11.1 | 10.8 | 5.898 | ||||||||||||||||||
| Manufactured Housing Community | 23 | 104,264,527 | 11.5 | 69.4 | 62.6 | 1.52 | 11.1 | 10.8 | 5.898 | ||||||||||||||||||
| Self Storage | 25 | 95,012,025 | 10.5 | 66.1 | 56.4 | 1.68 | 10.5 | 10.3 | 4.985 | ||||||||||||||||||
| Self Storage | 25 | 95,012,025 | 10.5 | 66.1 | 56.4 | 1.68 | 10.5 | 10.3 | 4.985 | ||||||||||||||||||
| Office | 6 | 84,907,378 | 9.4 | 71.7 | 60.3 | 1.39 | 9.9 | 9.2 | 5.220 | ||||||||||||||||||
| Suburban | 6 | 84,907,378 | 9.4 | 71.7 | 60.3 | 1.39 | 9.9 | 9.2 | 5.220 | ||||||||||||||||||
| Multifamily | 11 | 80,960,767 | 9.0 | 71.6 | 61.9 | 1.44 | 10.2 | 9.5 | 5.264 | ||||||||||||||||||
| Garden | 9 | 60,370,308 | 6.7 | 72.9 | 63.3 | 1.42 | 10.2 | 9.5 | 5.313 | ||||||||||||||||||
| Mid Rise | 1 | 11,850,000 | 1.3 | 71.2 | 62.0 | 1.36 | 9.5 | 9.1 | 5.290 | ||||||||||||||||||
| Student Housing | 1 | 8,740,459 | 1.0 | 63.3 | 51.9 | 1.62 | 11.0 | 10.3 | 4.890 | ||||||||||||||||||
| Mixed Use | 5 | 40,261,266 | 4.5 | 66.8 | 57.9 | 1.54 | 11.3 | 10.3 | 4.923 | ||||||||||||||||||
| Industrial/Retail | 1 | 23,800,000 | 2.6 | 67.6 | 63.1 | 1.48 | 9.6 | 9.0 | 4.500 | ||||||||||||||||||
| Office/Retail | 3 | 12,461,266 | 1.4 | 63.0 | 48.5 | 1.73 | 14.6 | 12.8 | 5.518 | ||||||||||||||||||
| Office/Warehouse/Storage | 1 | 4,000,000 | 0.4 | 74.1 | 56.5 | 1.34 | 10.8 | 10.0 | 5.590 | ||||||||||||||||||
| Industrial | 1 | 14,905,000 | 1.6 | 55.0 | 41.7 | 1.69 | 13.0 | 12.3 | 5.400 | ||||||||||||||||||
| Warehouse | 1 | 14,905,000 | 1.6 | 55.0 | 41.7 | 1.69 | 13.0 | 12.3 | 5.400 | ||||||||||||||||||
| Land | 1 | 14,400,000 | 1.6 | 56.0 | 56.0 | 1.60 | 7.9 | 7.9 | 4.905 | ||||||||||||||||||
| Land | 1 | 14,400,000 | 1.6 | 56.0 | 56.0 | 1.60 | 7.9 | 7.9 | 4.905 | ||||||||||||||||||
| Total/Weighted Average | 134 | $904,354,517 | 100.0 | % | 62.6 | % | 54.4 | % | 1.80 | x | 12.1 | % | 11.1 | % | 5.194 | % | |||||||||||
(1) | Because this table presents information relating to the mortgaged properties and not the mortgage loans, (a) the information for mortgage loans secured by more than one mortgaged property (other than through cross-collateralization with other mortgage loans) is based on allocated amounts (allocating the mortgage loan principal balance to each of those properties according to the relative appraised values of the mortgaged properties or the allocated loan amounts or property-specific release prices set forth in the related mortgage loan documents or such other allocation as the related mortgage loan seller deemed appropriate), and (b) the information for each mortgaged property that relates to a mortgage loan that is cross-collateralized with other mortgage loans is based upon the principal balance of that mortgage loan, except that the applicable loan-to-value ratio, debt service coverage ratio or debt yield for each such mortgaged property is based upon the ratio or yield (as applicable) for the aggregate indebtedness evidenced by all loans in the group. On an individual basis, without regard to the cross-collateralization feature, any mortgaged property securing a mortgage loan that is part of a cross-collateralized group of mortgage loans may have a higher loan-to-value ratio, lower debt service coverage ratio and/or lower debt yield than is presented herein. Debt service coverage ratio, debt yield and loan-to-value ratio information takes no account of subordinate debt (whether or not secured by the mortgaged property), if any, that is allowed under the terms of any mortgage loan. With respect to the Matrix MHC Portfolio, Westfield Mission Valley and Home Depot Brush Avenue mortgage loans, loan-to-value ratio, debt service coverage ratio and debt yield calculations include the related pari passu companion loan (unless otherwise stated) in total debt. |
(2) | A mortgaged property is classified as shadow anchored if it is located in close proximity to an anchored retail property. |
THE INFORMATION IN THIS STRUCTURAL AND COLLATERAL TERM SHEET IS NOT COMPLETE AND MAY BE AMENDED PRIOR TO THE TIME OF SALE. THIS TERM SHEET IS NOT AN OFFER TO SELL THESE SECURITIES AND IT IS NOT A SOLICITATION OF AN OFFER TO BUY THESE SECURITIES IN ANY JURISDICTION WHERE THE OFFER OR SALE IS NOT PERMITTED.
12
| WFRBS Commercial Mortgage Trust 2013-C17 | Characteristics of the Mortgage Pool |
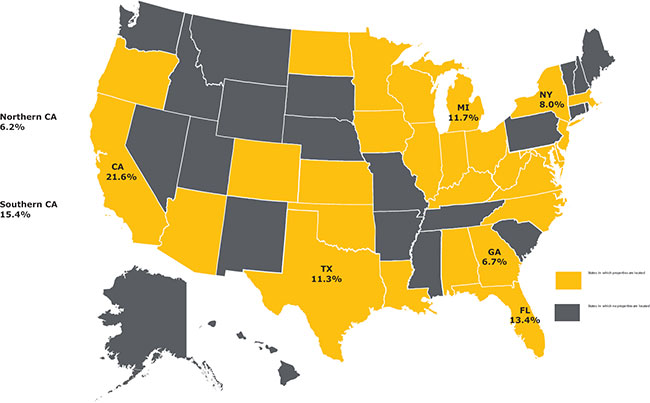
F. Geographic Distribution(1)(2)
| % of | Weighted | Weighted | Weighted | ||||||||||||||||||||
| Cut-off | Weighted | Average | Weighted | Average | Average | Weighted | |||||||||||||||||
| Number of | Date | Average Cut-off | Balloon or | Average | U/W NOI | U/W NCF | Average | ||||||||||||||||
| Mortgaged | Aggregate Cut-off | Pool | Date LTV Ratio | ARD LTV | U/W NCF | Debt Yield | Debt | Mortgage | |||||||||||||||
Location(3) | Properties | Date Balance ($) | Balance | (%) | Ratio (%) | DSCR (x) | (%) | Yield (%) | Rate (%) | ||||||||||||||
| California | 15 | $195,498,060 | 21.6 | % | 58.1 | % | 50.9 | % | 2.03x | 12.2 | % | 11.5 | % | 4.837 | % | ||||||||
| Southern | 9 | 139,329,560 | 15.4 | 57.0 | 49.6 | 2.19 | 12.7 | 11.9 | 4.842 | ||||||||||||||
| Northern | 6 | 56,168,501 | 6.2 | 60.8 | 54.0 | 1.63 | 10.9 | 10.3 | 4.826 | ||||||||||||||
| Florida | 12 | 121,361,864 | 13.4 | 48.0 | 45.1 | 2.60 | 16.2 | 14.0 | 5.054 | ||||||||||||||
| Michigan | 23 | 105,834,445 | 11.7 | 65.7 | 58.1 | 1.53 | 12.1 | 11.3 | 6.000 | ||||||||||||||
| Texas | 21 | 102,251,596 | 11.3 | 70.9 | 60.0 | 1.43 | 10.3 | 9.5 | 5.199 | ||||||||||||||
| New York | 3 | 72,500,000 | 8.0 | 70.2 | 60.2 | 1.38 | 9.0 | 8.6 | 5.178 | ||||||||||||||
| Georgia | 11 | 60,412,612 | 6.7 | 67.0 | 57.8 | 1.51 | 10.8 | 10.0 | 5.088 | ||||||||||||||
Other States(4) | 49 | 246,495,940 | 27.3 | 65.2 | 55.2 | 1.69 | 11.9 | 11.0 | 5.228 | ||||||||||||||
| Total/Weighted Average | 134 | $904,354,517 | 100.0 | % | 62.6 | % | 54.4 | % | 1.80x | 12.1 | % | 11.1 | % | 5.194 | % | ||||||||
| (1) | The Mortgaged Properties are located in 28 states and the District of Columbia. |
| (2) | Because this table presents information relating to the mortgaged properties and not the mortgage loans, (a) the information for mortgage loans secured by more than one mortgaged property (other than through cross-collateralization with other mortgage loans) is based on allocated amounts (allocating the mortgage loan principal balance to each of those properties according to the relative appraised values of the mortgaged properties or the allocated loan amounts or property-specific release prices set forth in the related mortgage loan documents or such other allocation as the related mortgage loan seller deemed appropriate), and (b) the information for each mortgaged property that relates to a mortgage loan that is cross-collateralized with other mortgage loans is based upon the principal balance of that mortgage loan, except that the applicable loan-to-value ratio, debt service coverage ratio or debt yield for each such mortgaged property is based upon the ratio or yield (as applicable) for the aggregate indebtedness evidenced by all loans in the group. On an individual basis, without regard to the cross-collateralization feature, any mortgaged property securing a mortgage loan that is part of a cross-collateralized group of mortgage loans may have a higher loan-to-value ratio, lower debt service coverage ratio and/or lower debt yield than is presented herein. Debt service coverage ratio, debt yield and loan-to-value ratio information takes no account of subordinate debt (whether or not secured by the mortgaged property), if any, that is allowed under the terms of any mortgage loan. With respect to the Matrix MHC Portfolio, Westfield Mission Valley and Home Depot Brush Avenue mortgage loans, loan-to-value ratio, debt service coverage ratio and debt yield calculations include the related pari passu companion loan (unless otherwise stated) in total debt. |
| (3) | For purposes of determining whether a mortgaged property is in Northern California or Southern California, Northern California includes areas with zip codes above 93600 and Southern California includes areas with zip codes of 93600 and below. |
| (4) | Includes 22 other states and the District of Columbia. |
THE INFORMATION IN THIS STRUCTURAL AND COLLATERAL TERM SHEET IS NOT COMPLETE AND MAY BE AMENDED PRIOR TO THE TIME OF SALE. THIS TERM SHEET IS NOT AN OFFER TO SELL THESE SECURITIES AND IT IS NOT A SOLICITATION OF AN OFFER TO BUY THESE SECURITIES IN ANY JURISDICTION WHERE THE OFFER OR SALE IS NOT PERMITTED.
13
| WFRBS Commercial Mortgage Trust 2013-C17 | Characteristics of the Mortgage Pool |
G. Characteristics of the Mortgage Pool(1)
| CUT-OFF DATE BALANCE | LOAN PURPOSE | |||||||||||||||||
| Number of | Aggregate Cut- | % of Cut-off | Number of | Aggregate Cut- | % of Cut-off | |||||||||||||
| Range of Cut-off Date | Mortgage | off Date Balance | Date Pool | Mortgage | off Date Balance | Date Pool | ||||||||||||
| Balances ($) | Loans | ($) | Balance | Loan Purpose | Loans | ($) | Balance | |||||||||||
| 1,000,000 - 2,000,000 | 9 | $13,799,679 | 1.5% | Refinance | 67 | $700,692,852 | 77.5% | |||||||||||
| 2,000,001 - 3,000,000 | 8 | 20,299,102 | 2.2 | Acquisition | 15 | 119,109,376 | �� | 13.2 | ||||||||||
| 3,000,001 - 4,000,000 | 11 | 39,344,139 | 4.4 | Various | 2 | 84,552,290 | 9.3 | |||||||||||
| 4,000,001 - 5,000,000 | 5 | 22,988,419 | 2.5 | Total: | 84 | $904,354,517 | 100.0% | |||||||||||
| 5,000,001 - 6,000,000 | 4 | 22,234,817 | 2.5 | |||||||||||||||
| 6,000,001 - 7,000,000 | 7 | 45,490,238 | 5.0 | MORTGAGE RATE | ||||||||||||||
| 7,000,001 - 8,000,000 | 8 | 61,601,207 | 6.8 | Number of | Aggregate Cut- | % of Cut-off | ||||||||||||
| 8,000,001 - 9,000,000 | 5 | 42,788,459 | 4.7 | Range of Mortgage Rates | Mortgage | off Date Balance | Date Pool | |||||||||||
| 9,000,001 - 10,000,000 | 2 | 19,885,446 | 2.2 | (%) | Loans | ($) | Balance | |||||||||||
| 10,000,001 - 15,000,000 | 12 | 154,752,427 | 17.1 | 4.295 - 4.500 | 2 | $38,000,000 | 4.2% | |||||||||||
| 15,000,001 - 20,000,000 | 3 | 51,802,290 | 5.7 | 4.501 - 4.750 | 3 | 80,750,000 | 8.9 | |||||||||||
| 20,000,001 - 30,000,000 | 4 | 96,638,294 | 10.7 | 4.751 - 5.000 | 12 | 192,951,997 | 21.3 | |||||||||||
| 30,000,001 - 50,000,000 | 2 | 65,230,000 | 7.2 | 5.001 - 5.250 | 24 | 277,001,031 | 30.6 | |||||||||||
| 50,000,001 - 70,000,000 | 3 | 172,500,000 | 19.1 | 5.251 - 5.500 | 20 | 118,239,936 | 13.1 | |||||||||||
| 70,000,001 - 75,000,000 | 1 | 75,000,000 | 8.3 | 5.501 - 5.750 | 18 | 114,752,547 | 12.7 | |||||||||||
| Total: | 84 | $904,354,517 | 100.0% | 5.751 - 6.275 | 5 | 82,659,007 | 9.1 | |||||||||||
| Average: | $10,766,125 | Total: | 84 | $904,354,517 | 100.0% | |||||||||||||
| Weighted Average: | 5.194% | |||||||||||||||||
| UNDERWRITTEN NOI DEBT SERVICE COVERAGE RATIO | ||||||||||||||||||
| Number of | Aggregate Cut- | % of Cut-off | UNDERWRITTEN NOI DEBT YIELD | |||||||||||||||
| Range of U/W NOI | Mortgage | off Date Balance | Date Pool | Number of | Aggregate Cut- | % of Cut-off | ||||||||||||
| DSCRs (x) | Loans | ($) | Balance | Range of U/W NOI | Mortgage | off Date Balance | Date Pool | |||||||||||
| 1.23 - 1.30 | 4 | $23,280,568 | 2.6% | Debt Yields (%) | Loans | ($) | Balance | |||||||||||
| 1.31 - 1.40 | 4 | 84,000,000 | 9.3 | 7.9 - 8.9 | 3 | $44,650,000 | 4.9% | |||||||||||
| 1.41 - 1.50 | 18 | 130,026,691 | 14.4 | 9.0 - 9.9 | 15 | 251,588,391 | 27.8 | |||||||||||
| 1.51 - 1.60 | 14 | 238,172,791 | 26.3 | 10.0 - 10.9 | 20 | 125,872,346 | 13.9 | |||||||||||
| 1.61 - 1.70 | 11 | 90,262,653 | 10.0 | 11.0 - 11.9 | 17 | 175,479,209 | 19.4 | |||||||||||
| 1.71 - 1.80 | 11 | 64,821,130 | 7.2 | 12.0 - 12.9 | 11 | 40,105,539 | 4.4 | |||||||||||
| 1.81 - 1.90 | 5 | 17,697,847 | 2.0 | 13.0 - 13.9 | 6 | 46,252,007 | 5.1 | |||||||||||
| 1.91 - 2.00 | 2 | 9,298,000 | 1.0 | 14.0 - 14.9 | 6 | 99,262,347 | 11.0 | |||||||||||
| 2.01 - 2.25 | 6 | 59,918,452 | 6.6 | 15.0 - 17.9 | 2 | 25,164,831 | 2.8 | |||||||||||
| 2.26 - 2.50 | 3 | 18,896,537 | 2.1 | 18.0 - 19.9 | 3 | 85,994,402 | 9.5 | |||||||||||
| 2.51 - 2.75 | 2 | 10,994,402 | 1.2 | 20.0 - 20.2 | 1 | 9,985,446 | 1.1 | |||||||||||
| 2.76 - 3.00 | 1 | 9,985,446 | 1.1 | Total: | 84 | $904,354,517 | 100.0% | |||||||||||
| 3.01 - 3.50 | 2 | 72,000,000 | 8.0 | Weighted Average: | 12.1% | |||||||||||||
| 3.51 - 3.91 | 1 | 75,000,000 | 8.3 | |||||||||||||||
| Total: | 84 | $904,354,517 | 100.0% | UNDERWRITTEN NCF DEBT YIELD | ||||||||||||||
| Weighted Average: | 1.96x | Number of | Aggregate Cut- | % of Cut-off | ||||||||||||||
| Range of U/W NCF | Mortgage | off Date Balance | Date Pool | |||||||||||||||
| UNDERWRITTEN NCF DEBT SERVICE COVERAGE RATIO | Debt Yields (%) | Loans | ($) | Balance | ||||||||||||||
| Number of | Aggregate Cut- | % of Cut-off | 7.7 - 7.9 | 2 | $28,900,000 | 3.2% | ||||||||||||
| Range of U/W NCF | Mortgage | off Date Balance | Date Pool | 8.0 - 8.9 | 6 | 149,627,429 | 16.5 | |||||||||||
| DSCRs (x) | Loans | ($) | Balance | 9.0 - 9.9 | 21 | 207,539,030 | 22.9 | |||||||||||
| 1.20 - 1.30 | 10 | $121,365,287 | 13.4% | 10.0 - 10.9 | 24 | 203,341,826 | 22.5 | |||||||||||
| 1.31 - 1.40 | 16 | 159,157,174 | 17.6 | 11.0 - 11.9 | 7 | 32,998,524 | 3.6 | |||||||||||
| 1.41 - 1.50 | 15 | 166,379,453 | 18.4 | 12.0 - 12.9 | 14 | 66,924,409 | 7.4 | |||||||||||
| 1.51 - 1.60 | 12 | 131,829,010 | 14.6 | 13.0 - 13.9 | 4 | 61,543,452 | 6.8 | |||||||||||
| 1.61 - 1.70 | 10 | 59,810,099 | 6.6 | 14.0 - 18.6 | 6 | 153,479,848 | 17.0 | |||||||||||
| 1.71 - 1.80 | 3 | 34,766,294 | 3.8 | Total: | 84 | $904,354,517 | 100.0% | |||||||||||
| 1.81 - 1.90 | 7 | 18,717,195 | 2.1 | Weighted Average: | 11.1% | |||||||||||||
| 1.91 - 2.00 | 1 | 6,075,000 | 0.7 | |||||||||||||||
| 2.01 - 2.50 | 6 | 49,269,560 | 5.4 | |||||||||||||||
| 2.51 - 3.37 | 4 | 156,985,446 | 17.4 | |||||||||||||||
| Total: | 84 | $904,354,517 | 100.0% | |||||||||||||||
| Weighted Average: | 1.80x | |||||||||||||||||
| (1) | Information regarding mortgage loans that are cross-collateralized with other mortgage loans is based upon the individual loan balances, except that the applicable loan-to value ratio, debt service coverage ratio or debt yield for each such mortgage loan is based upon the ratio or yield (as applicable) for the aggregate indebtedness evidenced by all loans in the group. On an individual basis, without regard to the cross-collateralization feature, any mortgage loan that is part of a cross-collateralized group of mortgage loans may have a higher loan-to-value ratio, lower debt service coverage ratio and/or lower debt yield than is presented herein. Debt service coverage ratio, debt yield and loan-to-value ratio information takes no account of subordinate debt (whether or not secured by the mortgaged property), if any, that is allowed under the terms of any mortgage loan. With respect to the Matrix MHC Portfoilo, Westfield Mission Valley and Home Depot Brush Avenue mortgage loans, loan-to-value ratio, debt service coverage ratio and debt yield calculations include the related pari passu companion loan (unless otherwise stated) in total debt. |
THE INFORMATION IN THIS STRUCTURAL AND COLLATERAL TERM SHEET IS NOT COMPLETE AND MAY BE AMENDED PRIOR TO THE TIME OF SALE. THIS TERM SHEET IS NOT AN OFFER TO SELL THESE SECURITIES AND IT IS NOT A SOLICITATION OF AN OFFER TO BUY THESE SECURITIES IN ANY JURISDICTION WHERE THE OFFER OR SALE IS NOT PERMITTED.
14
| WFRBS Commercial Mortgage Trust 2013-C17 | Characteristics of the Mortgage Pool |
| ORIGINAL TERM TO MATURITY OR ARD | CUT-OFF DATE LOAN-TO-VALUE RATIO | ||||||||||||||||||
| Number of | Aggregate Cut- | % of Cut-off | Number of | Aggregate Cut- | % of Cut-off | ||||||||||||||
| Range of Original Terms to | Mortgage | off Date Balance | Date Pool | Range of Cut-off Date LTV | Mortgage | off Date Balance | Date Pool | ||||||||||||
| Maturity or ARD (months) | Loans | ($) | Balance | Ratios (%) | Loans | ($) | Balance | ||||||||||||
| 60 - 83 | 7 | $172,544,831 | 19.1% | 36.6 - 40.0 | 3 | $85,994,402 | 9.5% | ||||||||||||
| 120 | 77 | 731,809,686 | 80.9 | 40.1 - 45.0 | 2 | 57,196,537 | 6.3 | ||||||||||||
| Total: | 84 | $904,354,517 | 100.0% | 45.1 - 50.0 | 3 | 17,075,000 | 1.9 | ||||||||||||
| Weighted Average: | 109 months | 50.1 - 55.0 | 8 | 57,082,981 | 6.3 | ||||||||||||||
| 55.1 - 60.0 | 7 | 70,935,056 | 7.8 | ||||||||||||||||
| REMAINING TERM TO MATURITY OR ARD | 60.1 - 65.0 | 14 | 81,155,793 | 9.0 | |||||||||||||||
| Range of Remaining Terms | Number of | Aggregate Cut- | % of Cut-off | 65.1 - 70.0 | 20 | 259,405,751 | 28.7 | ||||||||||||
| to Maturity or ARD | Mortgage | off Date Balance | Date Pool | 70.1 - 75.0 | 26 | 274,011,030 | 30.3 | ||||||||||||
| (months) | Loans | ($) | Balance | 75.1 - 76.8 | 1 | 1,497,967 | 0.2 | ||||||||||||
| 57 - 60 | 7 | $172,544,831 | 19.1% | Total: | 84 | $904,354,517 | 100.0% | ||||||||||||
| 85 - 120 | 77 | 731,809,686 | 80.9 | Weighted Average: | 62.6% | ||||||||||||||
| Total: | 84 | $904,354,517 | 100.0% | ||||||||||||||||
| Weighted Average: | 108 months | BALLOON OR ARD LOAN-TO-VALUE RATIO | |||||||||||||||||
| Number of | Aggregate Cut- | % of Cut-off | |||||||||||||||||
| ORIGINAL AMORTIZATION TERM(2) | Range of Balloon or ARD | Mortgage | off Date Balance | Date Pool | |||||||||||||||
| Range of Original | Number of | Aggregate Cut- | % of Cut-off | LTV Ratios (%) | Loans | ($) | Balance | ||||||||||||
| Amortization Terms | Mortgage | off Date Balance | Date Pool | 22.0 - 30.0 | 1 | $1,993,018 | 0.2% | ||||||||||||
| (months) | Loans | ($) | Balance | 30.1 - 35.0 | 2 | 10,994,402 | 1.2 | ||||||||||||
| Non-Amortizing | 5 | $175,600,000 | 19.4% | 35.1 - 40.0 | 5 | 94,064,079 | 10.4 | ||||||||||||
| 180 - 240 | 2 | 5,285,559 | 0.6 | 40.1 - 45.0 | 10 | 110,846,222 | 12.3 | ||||||||||||
| 241 - 300 | 22 | 144,293,097 | 16.0 | 45.1 - 50.0 | 6 | 44,095,432 | 4.9 | ||||||||||||
| 301 - 360 | 55 | 579,175,861 | 64.0 | 50.1 - 55.0 | 21 | 143,181,610 | 15.8 | ||||||||||||
| Total: | 84 | $904,354,517 | 100.0% | 55.1 - 60.0 | 21 | 190,133,930 | 21.0 | ||||||||||||
Weighted Average(3): | 346 months | 60.1 - 65.0 | 12 | 150,850,824 | 16.7 | ||||||||||||||
| (2) | The original amortization term shown for any mortgage loan that is interest-only for part of its term does not include the number of months in its interest-only period and reflects only the number of months as of the commencement of amortization remaining from the end of such interest-only period. | 65.1 - 70.1 | 6 | 158,195,000 | 17.5 | ||||||||||||||
| Total: | 84 | $904,354,517 | 100.0% | ||||||||||||||||
| Weighted Average: | 54.4% | ||||||||||||||||||
| (3) | Excludes the non-amortizing loans. | ||||||||||||||||||
| AMORTIZATION TYPE | |||||||||||||||||||
| REMAINING AMORTIZATION TERM(4) | Number of | Aggregate Cut- | % of Cut-off | ||||||||||||||||
| Range of Remaining | Number of | Aggregate Cut- | % of Cut-off | Mortgage | off Date Balance | Date Pool | |||||||||||||
| Amortization Terms | Mortgage | off Date Balance | Date Pool | Type of Amortization | Loans | ($) | Balance | ||||||||||||
| (months) | Loans | ($) | Balance | Amortizing Balloon | 63 | $468,004,017 | 51.8% | ||||||||||||
| Non-Amortizing | 5 | $175,600,000 | 19.4% | Interest-only, Amortizing | |||||||||||||||
| 179 - 240 | 2 | 5,285,559 | 0.6 | Balloon | 11 | 182,613,000 | 20.2 | ||||||||||||
| 241 - 300 | 22 | 144,293,097 | 16.0 | Interest-only, Balloon | 5 | 175,600,000 | 19.4 | ||||||||||||
| 301 - 360 | 55 | 579,175,861 | 64.0 | Interest-only, Amortizing ARD | 3 | 47,482,500 | 5.3 | ||||||||||||
| Total: | 84 | $904,354,517 | 100.0% | Amortizing ARD | 2 | 30,655,000 | 3.4 | ||||||||||||
Weighted Average(5): | 346 months | Total: | 84 | $904,354,517 | 100.0% | ||||||||||||||
| (4) | The remaining amortization term shown for any mortgage loan that is interest-only for part of its term does not include the number of months in its interest-only period and reflects only the number of months as of the commencement of amortization remaining from the end of such interest-only period. | ||||||||||||||||||
| ORIGINAL TERM OF INTEREST-ONLY PERIOD FOR PARTIAL IO LOANS | |||||||||||||||||||
| Number of | Aggregate Cut- | % of Cut-off | |||||||||||||||||
| (5) | Excludes the non-amortizing loans. | Mortgage | off Date Balance | Date Pool | |||||||||||||||
| IO Term (months) | Loans | ($) | Balance | ||||||||||||||||
| LOCKBOXES | 6 | 1 | $5,700,000 | 0.6% | |||||||||||||||
| Number of | Aggregate Cut- | % of Cut-off | 12 | 5 | 108,912,500 | 12.0 | |||||||||||||
| Mortgage | off Date Balance | Date Pool | 13 - 24 | 3 | 61,480,000 | 6.8 | |||||||||||||
| Type of Lockbox | Loans | ($) | Balance | 25 - 36 | 1 | 3,500,000 | 0.4 | ||||||||||||
| Springing (W/Out Estab. Account) | 39 | $393,198,326 | 43.5% | 37 - 48 | 1 | 23,070,000 | 2.6 | ||||||||||||
| Hard/Springing Cash Management | 18 | 311,419,011 | 34.4 | 49 - 60 | 2 | 19,843,000 | 2.2 | ||||||||||||
| Soft/Springing Cash Management | 4 | 101,252,271 | 11.2 | 61 - 84 | 1 | 7,590,000 | 0.8 | ||||||||||||
| None | 20 | 85,289,900 | 9.4 | Total: | 14 | $230,095,500 | 25.4% | ||||||||||||
| Hard/Upfront Cash Management | 2 | 9,195,009 | 1.0 | Weighted Average: | 25 months | ||||||||||||||
| Springing (With Estab. Account) | 1 | 4,000,000 | 0.4 | ||||||||||||||||
| Total: | 84 | $904,354,517 | 100.0% | SEASONING | |||||||||||||||
| Number of | Aggregate Cut- | % of Cut-off | |||||||||||||||||
| PREPAYMENT PROVISION SUMMARY | Mortgage | off Date Balance | Date Pool | ||||||||||||||||
| Number of | Aggregate Cut- | % of Cut-off | Seasoning (months) | Loans | ($) | Balance | |||||||||||||
| Mortgage | off Date Balance | Date Pool | 0 | 42 | $424,420,000 | 46.9% | |||||||||||||
| Prepayment Provision | Loans | ($) | Balance | 1 - 3 | 42 | 479,934,517 | 53.1 | ||||||||||||
| Lockout/Defeasance/Open | 79 | $810,904,210 | 89.7% | Total: | 84 | $904,354,517 | 100.0% | ||||||||||||
| Lockout/Defeasance or GRTR 1% | Weighted Average: | 1 month | |||||||||||||||||
| or YM/Open | 1 | 55,000,000 | 6.1 | ||||||||||||||||
| Lockout/GRTR 1% or YM/Open | 4 | 38,450,307 | 4.3 | ||||||||||||||||
| Total: | 84 | $904,354,517 | 100.0% | ||||||||||||||||
THE INFORMATION IN THIS STRUCTURAL AND COLLATERAL TERM SHEET IS NOT COMPLETE AND MAY BE AMENDED PRIOR TO THE TIME OF SALE. THIS TERM SHEET IS NOT AN OFFER TO SELL THESE SECURITIES AND IT IS NOT A SOLICITATION OF AN OFFER TO BUY THESE SECURITIES IN ANY JURISDICTION WHERE THE OFFER OR SALE IS NOT PERMITTED.
15
| WFRBS Commercial Mortgage Trust 2013-C17 | Certain Terms and Conditions |
| V. | Certain Terms and Conditions | |||
| Interest Entitlements: | The interest entitlement of each Class of Offered Certificates on each Distribution Date generally will be the interest accrued during the related Interest Accrual Period on the related Certificate Principal Balance or Notional Amount at the related pass-through rate, net of any prepayment interest shortfalls allocated to that Class for such Distribution Date as described below. If prepayment interest shortfalls arise from voluntary prepayments (without Special Servicer consent) on particular non-specially serviced mortgage loans during any collection period, the Master Servicer is required to make a compensating interest payment to offset those shortfalls, generally up to an amount equal to the portion of its master servicing fees that accrue at one basis point per annum. The remaining amount of prepayment interest shortfalls will be allocated to reduce the interest entitlement on all Classes of Certificates (other than the Class X-A, X-B and Class X-C Certificates), pro rata, based on their respective amounts of accrued interest for the related Distribution Date. If a Class receives less than the entirety of its interest entitlement on any Distribution Date, then the shortfall, excluding any shortfall due to prepayment interest shortfalls, will be added to its interest entitlement for the next succeeding Distribution Date. Interest entitlements on the Class E, D, C and B Certificates, in that order, may be reduced by certain Trust Advisor expenses. | |||
Principal Distribution Amount: | The Principal Distribution Amount for each Distribution Date generally will be the aggregate amount of principal received or advanced in respect of the mortgage loans, net of any non-recoverable advances and interest thereon that are reimbursed to the Master Servicer, the Special Servicer or the Trustee during the related collection period. Non-recoverable advances and interest thereon are reimbursable from principal collections and advances before reimbursement from other amounts. The Principal Distribution Amount may also be reduced, with a corresponding loss, to the Class E, D, C, B and A-S Certificates, then to the Class A-1, A-2, A-3, A-4 and A-SB Certificates (with any losses on the Class A-1, A-2, A-3, A-4 and A-SB Certificates allocated pro rata according to their respective Certificate Principal Balances immediately prior to that Distribution Date), in that order, in connection with certain Trust Advisor expenses to the extent that interest entitlements on the Class B, C, D and E Certificates are insufficient to absorb the effect of the expense on any particular Distribution Date. | |||
| Distributions: | On each Distribution Date, funds available for distribution from the mortgage loans, net of specified trust fees, expenses and reimbursements will generally be distributed in the following amounts and order of priority (in each case to the extent of remaining available funds): | |||
| 1. | Class A-1, A-2, A-3, A-4, A-SB, X-A, X-B and X-C Certificates: To interest on the Class A-1, A-2, A-3, A-4, A-SB, X-A, X-B and X-C Certificates, pro rata, according to their respective interest entitlements. | |||
| 2. | Class A-1, A-2, A-3, A-4 and A-SB Certificates: To principal on the Class A-1, A-2, A-3, A-4 and A-SB Certificates in the following amounts and order of priority: (i) first, to principal on the Class A-SB Certificates, in an amount up to the Principal Distribution Amount for such Distribution Date until their Certificate Principal Balance is reduced to the Class A-SB Planned Principal Balance for such Distribution Date; (ii) second, to principal on the Class A-1 Certificates until their Certificate Principal Balance is reduced to zero, up to the remainder of the Principal Distribution Amount for such Distribution Date; (iii) third, to principal on the Class A-2 Certificates until their Certificate Principal Balance is reduced to zero, up to the remainder of the Principal Distribution Amount for such Distribution Date; (iv) fourth, to principal on the Class A-3 Certificates until their Certificate Principal Balance is reduced to zero, up to the remainder of the Principal Distribution Amount for such Distribution Date; (v) fifth, to principal on the Class A-4 Certificates until their Certificate Principal Balance is reduced to zero, up to the remainder of the Principal Distribution Amount for such Distribution Date; and (vi) sixth, to principal on the Class A-SB Certificates until their Certificate Principal Balance is reduced to zero, up to the remainder of the Principal Distribution Amount for such Distribution Date. However, if the Certificate Principal Balance of each and every Class of Principal Balance Certificates, other than the Class A-1, A-2, A-3, A-4 and A-SB Certificates, has been reduced to zero as a result of the allocation of Mortgage Loan losses and expenses and any of the Class A-1, A-2, A-3, A-4 and A-SB Certificates remains outstanding, then the Principal Distribution Amount will be distributed on the Class A-1, A-2, A-3, A-4 and A-SB Certificates, pro rata, based on their respective outstanding Certificate Principal Balances, until their Certificate Principal Balances have been reduced to zero. | |||
| 3. | Class A-1, A-2, A-3, A-4 and A-SB Certificates: To reimburse the holders of the Class A-1, A-2, A-3, A-4 and A-SB Certificates, pro rata, for any previously unreimbursed losses (other than certain Trust Advisor expenses) on the mortgage loans that were previously allocated in reduction of the Certificate Principal Balances of such Classes. | |||
THE INFORMATION IN THIS STRUCTURAL AND COLLATERAL TERM SHEET IS NOT COMPLETE AND MAY BE AMENDED PRIOR TO THE TIME OF SALE. THIS TERM SHEET IS NOT AN OFFER TO SELL THESE SECURITIES AND IT IS NOT A SOLICITATION OF AN OFFER TO BUY THESE SECURITIES IN ANY JURISDICTION WHERE THE OFFER OR SALE IS NOT PERMITTED.
16
| WFRBS Commercial Mortgage Trust 2013-C17 | Certain Terms and Conditions |
| 4. | Class A-S Certificates: To make distributions on the Class A-S Certificates as follows: (a) first, to interest on Class A-S Certificates in the amount of the interest entitlement for that Class; (b) next, to the extent of the portion of the Principal Distribution Amount remaining after distributions in respect of principal to each Class with a higher distribution priority (in this case, the Class A-1, A-2, A-3, A-4 and A-SB Certificates), to principal on the Class A-S Certificates until their Certificate Principal Balance is reduced to zero; and (c) next, to reimburse the holders of the Class A-S Certificates for any previously unreimbursed losses (other than certain Trust Advisor expenses) on the mortgage loans that were previously allocated to that Class in reduction of its Certificate Principal Balance. | |||
| 5. | Class B Certificates: To make distributions on the Class B Certificates as follows: (a) first, to interest on Class B Certificates in the amount of the interest entitlement for that Class; (b) next, to the extent of the portion of the Principal Distribution Amount remaining after distributions in respect of principal to each Class with a higher distribution priority (in this case, the Class A-1, A-2, A-3, A-4, A-SB and A-S Certificates), to principal on the Class B Certificates until their Certificate Principal Balance is reduced to zero; and (c) next, to reimburse the holders of the Class B Certificates for any previously unreimbursed losses (other than certain Trust Advisor expenses) on the mortgage loans that were previously allocated to that Class in reduction of its Certificate Principal Balance. | |||
| 6. | Class C Certificates: To make distributions on the Class C Certificates as follows: (a) first, to interest on Class C Certificates in the amount of the interest entitlement for that Class; (b) next, to the extent of the portion of the Principal Distribution Amount remaining after distributions in respect of principal to each Class with a higher distribution priority (in this case, the Class A-1, A-2, A-3, A-4, A-SB, A-S and B Certificates), to principal on the Class C Certificates until their Certificate Principal Balance is reduced to zero; and (c) next, to reimburse the holders of the Class C Certificates for any previously unreimbursed losses (other than certain Trust Advisor expenses) on the mortgage loans that were previously allocated to that Class in reduction of its Certificate Principal Balance. | |||
| 7. | After the Class A-1, A-2, A-3, A-4, A-SB, A-S, B and C Certificates are paid all amounts to which they are entitled, the remaining funds available for distribution will be used to pay interest, principal and loss reimbursement amounts (other than certain Trust Advisor expenses) on the Class D, E, F and G Certificates sequentially in that order in a manner analogous to the Class C Certificates. | |||
Allocation of Yield Maintenance and Prepayment Premiums: | If any yield maintenance charges and prepayment premiums are collected during any particular collection period with respect to any mortgage loan, then on the distribution date corresponding to that collection period, the certificate administrator will pay a portion of the yield maintenance charges and prepayment premiums (net of liquidation fees payable therefrom) in the following manner: (1) pro rata, between (x) the group (the “YM Group A”) of the Class A-1, A-2, A-3, A-4, A-SB, A-S and X-A Certificates and (y) the group (the “YM Group B” and, collectively with the YM Group A, the “YM Groups”) of Class B, C, D and X-B Certificates, based upon the aggregate amount of principal distributed to the applicable classes of principal balance certificates in each YM Group for that distribution date, and (2) among the classes of certificates and regular interest(s) in each YM Group, in the following manner, up to an amount equal to the product of (a) the yield maintenance or prepayment premium allocated to such YM Group, (b) the related Base Interest Fraction (as defined in the Free Writing Prospectus), and (c) a fraction, which in no event may be greater than 1.0, the numerator of which is equal to the amount of principal distributed to the holder(s) of such class for that distribution date, and the denominator of which is the aggregate amount of principal distributed to all the certificates in that YM Group for that distribution date. Any yield maintenance charges or prepayment premium allocated to such YM Group remaining after such distributions to Principal Balance Certificates described above will be distributed to the Class X-A or Class X-B Certificates as applicable, in such YM Group. | |||
| No prepayment premiums or yield maintenance charges will be distributed to the holders of the Class X-C, E, F or G Certificates. The holders of the Class X-B Certificates will be entitled to all prepayment premiums and yield maintenance charges collected after the Class A-1, A-2, A-3, A-4, X-A, A-SB, A-S, B, C and D Certificates are retired. For a description of when prepayment premiums and yield maintenance charges are generally required on the mortgage loans, see Annex A to the Free Writing Prospectus. See also “Risk Factors—Prepayments and Repurchases of the Mortgage Assets Will Affect the Timing of Your Cash Flow and May Affect Your Yield” in the prospectus attached to the Free Writing Prospectus. Prepayment premiums and yield maintenance charges will be distributed on each Distribution Date only to the extent they are actually received on the mortgage loans as of the related Determination Date. | ||||
THE INFORMATION IN THIS STRUCTURAL AND COLLATERAL TERM SHEET IS NOT COMPLETE AND MAY BE AMENDED PRIOR TO THE TIME OF SALE. THIS TERM SHEET IS NOT AN OFFER TO SELL THESE SECURITIES AND IT IS NOT A SOLICITATION OF AN OFFER TO BUY THESE SECURITIES IN ANY JURISDICTION WHERE THE OFFER OR SALE IS NOT PERMITTED.
17
| WFRBS Commercial Mortgage Trust 2013-C17 | Certain Terms and Conditions |
| Realized Losses: | The Certificate Principal Balances of the Class A-1, A-2, A-3, A-4, A-SB, A-S, B, C, D, E, F and G Certificates will be reduced without distribution on any Distribution Date as a write-off to the extent of any losses realized on the mortgage loans allocated to such Class on such Distribution Date. Such losses (other than certain Trust Advisor expenses) will be applied in the following order, in each case until the related Certificate Principal Balance is reduced to zero: first, to Class G; second, to Class F; third, to Class E; fourth, to Class D; fifth, to Class C; sixth, to Class B; seventh, to Class A-S; and, finally, pro rata, to Classes A-1, A-2, A-3, A-4 and A-SB based on their outstanding Certificate Principal Balances. Certain Trust Advisor expenses (if not absorbed by reductions of interest entitlements on Class E, D, C and B Certificates) will be applied as write-offs in a similar manner, except that such write-offs will be applied only to the Class E, D, C, B and A-S Certificates, and the Class A-1, A-2, A-3, A-4 and A-SB Certificates (with any write-offs on the Class A-1, A-2, A-3, A-4 and A-SB Certificates to be allocated pro rata according to their respective Certificate Principal Balances immediately prior to that Distribution Date), in that order. The notional amount of the Class X-A Certificates will be reduced by the amount of all losses that are allocated to the Class A-1, A-2, A-3, A-4, A-SB or A-S Certificates as write-offs in reduction of their Certificate Principal Balances. The notional amount of the Class X-B Certificates will be reduced by the amount of all losses that are allocated to the Class B Certificates as write-offs in reduction of their Certificate Principal Balance. The notional amount of the Class X-C Certificates will be reduced by the amount of all losses that are allocated to the Class E, F or G Certificates as write-offs in reduction of their Certificate Principal Balances. |
| Debt Service Advances: | The Master Servicer or, if the Master Servicer fails to do so, the Trustee, will be obligated to advance delinquent debt service payments (other than balloon payments and default interest) and assumed debt service payments on the mortgage loans (including each pari passu mortgage loan but not its related pari passu companion loan), except to the extent any such advance is deemed non-recoverable from collections on the related mortgage loan. In addition, if an Appraisal Reduction Amount exists for a given mortgage loan, the interest portion of any debt service advance for such mortgage loan will be reduced, which will have the effect of reducing the amount of interest available for distribution to the Certificates in reverse alphabetical order of their Class designations (except that interest payments on the Class A-1, A-2, A-3, A-4, A-SB, X-A, X-B and X-C Certificates would be affected on a pari passu basis). |
| Servicing Advances: | The Master Servicer or, if the Master Servicer fails to do so, the Trustee, will be obligated to make servicing advances with respect to each mortgage loan it services, including the payment of delinquent property taxes, insurance premiums and ground rent, except to the extent that those advances are deemed non-recoverable from collections on the related mortgage loan. The applicable master servicer under the GSMS 2013-GCJ16 securitization is expected to have the primary obligation to make any servicing advances with respect to the Matrix MHC Portfolio loan combination, and the applicable master servicer under the WFRBS 2013-C16 securitization will have the primary obligation to make any servicing advances with respect to the Westfield Mission Valley loan combination. |
Appraisal Reduction Amounts: | An Appraisal Reduction Amount generally will be created in the amount, if any, by which the principal balance of a required appraisal loan (which is a mortgage loan with respect to which certain defaults, modifications or insolvency events have occurred as further described in the Free Writing Prospectus) plus other amounts overdue or advanced in connection with such mortgage loan exceeds 90% of the appraised value of the related mortgaged property plus certain escrows and reserves (including letters of credit) held with respect to the mortgage loan. |
| A mortgage loan will cease to be a required appraisal loan when the same has ceased to be a specially serviced mortgage loan (if applicable), has been brought current for at least three consecutive months and no other circumstances exist that would cause such mortgage loan to be a required appraisal loan. | |
| Appraisal Reduction Amounts will affect the amount of debt service advances on the related mortgage loan. Appraisal Reduction Amounts will also be taken into account in the determination of the identity of the Class whose majority constitutes the “majority subordinate certificateholder” and is entitled to appoint the subordinate class representative. | |
Clean-Up Call and Exchange Termination: | On each Distribution Date occurring after the aggregate unpaid principal balance of the mortgage loans is reduced below 1% of the initial aggregate principal balance of the mortgage loans as of the Cut-off Date, certain specified persons will have the option to purchase all of the remaining mortgage loans (and the trust’s interest in all property acquired through exercise of remedies in respect of any mortgage loan) at the price specified in the Free Writing Prospectus. Exercise of the option will terminate the trust and retire the then-outstanding certificates. |
THE INFORMATION IN THIS STRUCTURAL AND COLLATERAL TERM SHEET IS NOT COMPLETE AND MAY BE AMENDED PRIOR TO THE TIME OF SALE. THIS TERM SHEET IS NOT AN OFFER TO SELL THESE SECURITIES AND IT IS NOT A SOLICITATION OF AN OFFER TO BUY THESE SECURITIES IN ANY JURISDICTION WHERE THE OFFER OR SALE IS NOT PERMITTED.
18
| WFRBS Commercial Mortgage Trust 2013-C17 | Certain Terms and Conditions |
| If the aggregate Certificate Principal Balances of each of the Class A-1, A-2, A-3, A-4, A-SB, A-S, B, C and D Certificates have been reduced to zero, the trust may also be terminated in connection with an exchange of all the then-outstanding certificates, for the mortgage loans and REO properties then remaining in the issuing entity, but all of the holders of those Classes of outstanding certificates would have to voluntarily participate in the exchange. | |
| Liquidated Loan Waterfall: | Following the liquidation of any loan or property, the net liquidation proceeds generally will be applied (after reimbursement of advances and certain trust fund expenses), first, as a recovery of accrued interest, other than delinquent interest that was not advanced as a result of Appraisal Reduction Amounts, second, as a recovery of principal until all principal has been recovered, and then as a recovery of delinquent interest that was not advanced as a result of Appraisal Reduction Amounts. Please see “Description of the Offered Certificates—Distributions—Application of Mortgage Loan Collections” in the Free Writing Prospectus. |
Majority Subordinate Certificateholder and Subordinate Class Representative: | A subordinate class representative may be appointed by the “majority subordinate certificateholder”, which will be the holder(s) of a majority of: (a) during a “subordinate control period”, the most subordinate class between the Class F and G Certificates that has a Certificate Principal Balance, as notionally reduced by any Appraisal Reduction Amounts allocable to that class, that is at least equal to 25% of its total initial principal balance and (b) during a “collective consultation period”, the most subordinate class between the Class F and G Certificates that has a total principal balance, without regard to Appraisal Reduction Amounts, that is at least equal to 25% of its initial Certificate Principal Balance. The majority subordinate certificateholder will have a continuing right to appoint, remove or replace the subordinate class representative in its sole discretion. This right may be exercised at any time and from time to time. See “Servicing of the Mortgage Loans and Administration of the Trust Fund—The Majority Subordinate Certificateholder and the Subordinate Class Representative” in the Free Writing Prospectus. |
| Control and Consultation: | The rights of various parties to replace the Special Servicer and approve or consult with respect to major actions of the Special Servicer will vary according to defined periods. A “subordinate control period” will exist as long as the Class F Certificates have a Certificate Principal Balance, net of any Appraisal Reduction Amounts allocable to that class, that is not less than 25% of the initial principal balance of that class (unless a senior consultation period is deemed to occur generally or with respect to a particular mortgage loan, pursuant to clause (ii) of the definition of “senior consultation period”). In general, during a subordinate control period, (i) the subordinate class representative will be entitled to grant or withhold approval of asset status reports prepared, and material servicing actions proposed, by the Special Servicer, and (ii) the majority subordinate certificateholder, or the subordinate class representative on its behalf, will be entitled to terminate and replace the Special Servicer with or without cause, and appoint itself or another person as the applicable successor special servicer (other than with respect to the Matrix MHC Portfolio loan combination and the Westfield Mission Valley loan combination). It will be a condition to such appointment that Fitch, Moody’s and DBRS confirm that the appointment would not result in a qualification, downgrade or withdrawal of any of their then-current ratings of certificates. A “collective consultation period” will exist as long as the Class F Certificates have a Certificate Principal Balance that both (i) as notionally reduced by any Appraisal Reduction Amounts allocable to that class, is less than 25% of its initial principal balance and (ii) without regard to any Appraisal Reduction Amounts allocable to that class, is 25% or more of its initial Certificate Principal Balance (unless a senior consultation period is deemed to occur generally or with respect to a particular mortgage loan, pursuant to clause (ii) of the definition of “senior consultation period”). In general, during a collective consultation period, the Special Servicer will be required to consult with the Trust Advisor (in addition to the subordinate class representative, during a collective consultation period) in connection with asset status reports and material special servicing actions. A “senior consultation period” will exist as long as either (i) the Class F certificates have an aggregate principal balance, without regard to any Appraisal Reduction Amounts allocable to that class, that is less than 25% of its initial principal balance or (ii) during such time as the Class F certificates are the most subordinate class of control-eligible certificates that have a then outstanding principal balance, net of Appraisal Reduction Amounts, at least equal to 25% of its initial principal balance, the then-majority subordinate certificateholder has irrevocably waived its right to appoint a subordinate class representative and to exercise any of the rights of the majority subordinate certificateholder or cause the exercise of the rights of the subordinate class representative and such rights have not been reinstated to a successor majority subordinate certificateholder as set forth in the pooling and servicing agreement. In general, during a senior consultation period, the Special Servicer must seek to consult with the Trust Advisor in connection with asset status reports and material special servicing actions, and, in general, no subordinate class representative will be recognized or have any right to terminate the Special Servicer or approve, direct or consult with respect to servicing matters. With respect to the Westfield Mission Valley loan combination, the rights of the subordinate class representative described above will be subject to the consultation rights of the holder of the related pari passu companion loan described under “Loan Combinations” below. |
THE INFORMATION IN THIS STRUCTURAL AND COLLATERAL TERM SHEET IS NOT COMPLETE AND MAY BE AMENDED PRIOR TO THE TIME OF SALE. THIS TERM SHEET IS NOT AN OFFER TO SELL THESE SECURITIES AND IT IS NOT A SOLICITATION OF AN OFFER TO BUY THESE SECURITIES IN ANY JURISDICTION WHERE THE OFFER OR SALE IS NOT PERMITTED.
19
| WFRBS Commercial Mortgage Trust 2013-C17 | Certain Terms and Conditions |
| Furthermore, notwithstanding any contrary description set forth above, with respect to the Matrix MHC Portfolio mortgage loan, in general the loan combination is expected to be serviced under the GSMS 2013-GCJ16 pooling and servicing agreement, which grants to the subordinate class representative or similar party under that pooling and servicing agreement control rights that include the right to approve or disapprove various material servicing actions involving the loan combination but the subordinate class representative for this securitization will nonetheless have the right to be consulted on a non-binding basis with respect to such actions. | |
| Furthermore, notwithstanding any contrary description set forth above, with respect to the Westfield Mission Valley mortgage loan, in general the loan combination will be serviced under the WFRBS 2013-C16 pooling and servicing agreement, which grants to the subordinate class representative under that pooling and servicing agreement control rights that include the right to approve or disapprove various material servicing actions involving the loan combination but the subordinate class representative for this securitization will nonetheless have the right to be consulted on a non-binding basis with respect to such actions. | |
| For purposes of the servicing of the Matrix MHC Portfolio loan combination and the Westfield Mission Valley loan combination, the occurrence and continuance of a collective consultation period or senior consultation period with respect to the subordinate class representative under this securitization will not limit the control or other rights of the subordinate class representative or similar party under the GSMS 2013-GCJ16 securitization or the WFRBS 2013-C16 securitization, as applicable, and any collective consultation period or senior consultation period or similar period under the GSMS 2013-GCJ16 securitization or the WFRBS 2013-C16 securitization will not limit the consultation rights of the subordinate class representative under this securitization. | |
| In general, loan combination control rights also include the right, in certain circumstances, to direct the replacement of the applicable special servicer for the related loan combination only. | |
Replacement of Special Servicer by General Vote of Certificateholders: | During any “collective consultation period” or “senior consultation period”, the Special Servicer may be terminated and replaced upon the affirmative direction of certificate owners holding not less than 75% of the appraisal-reduced voting rights of all certificates, following a proposal from certificate owners holding not less than 25% of the appraisal-reduced voting rights of all certificates. The certificateholders who initiate a vote on a termination and replacement of the Special Servicer without cause must cause Fitch, Moody’s and DBRS to confirm the then-current ratings of the certificates (or decline to review the matter) and cause the payment of the fees and expenses incurred in the replacement. |
| Appraisal Remedy: | Solely for purposes of determining whether a “subordinate control period” is in effect, whenever the Special Servicer obtains an appraisal or updated appraisal under the pooling and servicing agreement, the subordinate class representative, with respect to the mortgage loans (other than the Matrix MHC Portfolio mortgage loan and the Westfield Mission Valley mortgage loan) will have the right (at its expense) to direct the Special Servicer to hire a qualified appraiser to prepare a second appraisal of the mortgaged property. The Special Servicer must thereafter determine whether, based on its assessment of such second appraisal, any recalculation of the Appraisal Reduction Amount is warranted. The Appraisal Reduction Amount, whether based on the first or the second appraisal, will become effective following the second appraisal, except that the Appraisal Reduction Amount based on the first appraisal shall become effective if the subordinate class representative declines to demand a second appraisal within a specified number of business days, or if a second appraisal is not received within 90 days after the direction of the subordinate class representative. In addition, for the same purposes, if there is a material change in the mortgaged property securing any mortgage loan for which an Appraisal Reduction Amount has been calculated, the majority certificateholder of the Class F or G Certificates or other designated certificateholders will be entitled (at its expense) to present an additional appraisal to the Special Servicer, which will generally be required to recalculate the Appraisal Reduction Amount based upon such additional appraisal. This latter right may not be exercised more frequently than once in any 12-month period for each mortgage loan for which an Appraisal Reduction Amount was calculated and can only be exercised during a subordinate control period or a collective consultation period as further described in the Free Writing Prospectus. |
Sale of Defaulted Assets: | There will be no “fair value” purchase option. Instead, the pooling and servicing agreement will authorize the Special Servicer to sell defaulted mortgage loans serviced by the Special Servicer to the highest bidder in a manner generally similar to sales of REO properties. Subject to certain limitations set forth in the related intercreditor agreement, the Home Depot Brush Avenue mortgage loan may not be sold unless that mortgage loan and the related pari passu companion loan are sold together as one whole loan. The sale of a defaulted loan (other than the Matrix MHC Portfolio mortgage loan or the Westfield Mission Valley mortgage loan) for less than par plus |
THE INFORMATION IN THIS STRUCTURAL AND COLLATERAL TERM SHEET IS NOT COMPLETE AND MAY BE AMENDED PRIOR TO THE TIME OF SALE. THIS TERM SHEET IS NOT AN OFFER TO SELL THESE SECURITIES AND IT IS NOT A SOLICITATION OF AN OFFER TO BUY THESE SECURITIES IN ANY JURISDICTION WHERE THE OFFER OR SALE IS NOT PERMITTED.
20
| WFRBS Commercial Mortgage Trust 2013-C17 | Certain Terms and Conditions |
| accrued interest and certain other fees and expenses owed on the loan will be subject to consent or consultation rights of the subordinate class representative and/or Trust Advisor and, in the case of the Home Depot Brush Avenue mortgage loan, consultation rights of the holder of the related pari passu companion loan, as described in the Free Writing Prospectus. | |
| In the case of the Matrix MHC Portfolio mortgage loan, pursuant to the respective intercreditor agreement and the GSMS 2013-GCJ16 pooling and servicing agreement, the GSMS 2013-GCJ16 special servicer may offer to sell to any person (or may offer to purchase) for cash such loan combination during such time as such loan combination constitutes a defaulted mortgage loan, and, in connection with any such sale, the GSMS 2013-GCJ16 special servicer is required to sell both the pari passu mortgage loan and related pari passu companion loan in any such loan combination as a whole loan. The subordinate class representative will have consultation rights as the holder of an interest in the related pari passu mortgage loan, as described in the Free Writing Prospectus. | |
| In the case of the Westfield Mission Valley mortgage loan, pursuant to the respective intercreditor agreement and the WFRBS 2013-C16 pooling and servicing agreement, the applicable WFRBS 2013-C16 special servicer may offer to sell to any person (or may offer to purchase) for cash such loan combination during such time as such loan applicable combination constitutes a defaulted mortgage loan, and, in connection with any such sale, the WFRBS 2013-C16 special servicer is required to sell both the pari passu mortgage loan and related pari passu companion loan in any such loan combination as a whole loan. The subordinate class representative will have consultation rights as the holder of an interest in the related pari passu mortgage loan, as described in the Free Writing Prospectus. | |
| “As-Is” Appraisals: | Appraisals must be conducted on an “as-is” basis, and must be no more than 9 months old, for purposes of determining Appraisal Reduction Amounts, market value in connection with REO sales, etc. Required appraisals may consist of updates of prior appraisals. Internal valuations by the Special Servicer are permitted if the principal balance of a mortgage loan is less than $2,000,000. |
| Trust Advisor: | The Trust Advisor will perform certain review duties that will generally include a limited annual review of and report regarding the Special Servicer to the Certificate Administrator. The review and report generally will be based on: (a) during a collective consultation period or senior consultation period, any asset status reports and additional information delivered to the Trust Advisor by the Special Servicer with respect to any mortgage loan serviced by the Special Servicer, and/or (b) during a senior consultation period, in addition to the applicable information described above, a meeting with the Special Servicer to conduct a limited review of the Special Servicer’s operational practices on a platform basis in light of the servicing standard. In addition, during any collective consultation period or senior consultation period, the Special Servicer must seek to consult with the Trust Advisor (in addition to the subordinate class representative during a collective consultation period) in connection with material special servicing actions with respect to specially serviced mortgage loans serviced by the Special Servicer. Furthermore, under certain circumstances, but only during a senior consultation period, the Trust Advisor may recommend the replacement of the Special Servicer, in which case the Certificate Administrator will deliver notice of such recommendation to the certificateholders, and certificateholders with specified percentages of the voting rights may direct the replacement of the Special Servicer at their expense. |
| Notwithstanding any contrary provision described above, the Trust Advisor will have no rights or duties in connection with the Matrix MHC Portfolio mortgage loan or the Westfield Mission Valley mortgage loan. | |
The Trust Advisor may be removed and replaced without cause upon the affirmative direction of certificates owners holding not less than 75% of the appraisal-reduced voting rights of all certificates, following a proposal from certificate owners holding not less than 25% of the appraisal-reduced voting rights of all certificates. The certificateholders who initiate a vote on a termination and replacement of the Trust Advisor without cause must cause Fitch, Moody’s and DBRS to confirm the then-current ratings of the certificates (or decline to review the matter) and cause the payment of the fees and expenses incurred in the replacement. During any “subordinate control period”, the proposed replacement trust advisor will be subject to the subordinate class representative’s consent (such consent not to be unreasonably withheld). If a proposed termination and replacement of the Trust Advisor is not consummated within 180 days following the initial request of the certificateholders who requested a vote, the proposed termination and replacement shall have no further force or effect. The Trust Advisor generally may be discharged from its duties if and when the Class A-1, A-2, A-3, A-4, A-SB, A-S, B, C, D and E Certificates are retired. |
THE INFORMATION IN THIS STRUCTURAL AND COLLATERAL TERM SHEET IS NOT COMPLETE AND MAY BE AMENDED PRIOR TO THE TIME OF SALE. THIS TERM SHEET IS NOT AN OFFER TO SELL THESE SECURITIES AND IT IS NOT A SOLICITATION OF AN OFFER TO BUY THESE SECURITIES IN ANY JURISDICTION WHERE THE OFFER OR SALE IS NOT PERMITTED.
21
| WFRBS Commercial Mortgage Trust 2013-C17 | Certain Terms and Conditions |
| Certain Fee Offsets: | If a workout fee is earned by the Special Servicer following a loan default with respect to any mortgage loan that it services, then certain limitations will apply to the collection and retention of a modification fee from the borrower. The modification fee generally must not exceed 1% of the principal balance of the loan as modified. In addition, if the loan re-defaults within a specified period of months and other conditions are satisfied, any subsequent workout or liquidation fee on that loan must be reduced by a portion of the previously-collected modification fee. Furthermore, workout fees, liquidation fees and modification fees collected with respect to any workout, liquidation and/or partial liquidation of a mortgage loan or loan combination that is serviced by the Special Servicer will be subject to an aggregate cap equal to the greater of (i) $1,000,000 and (ii) 1.00% of the stated principal balance of the subject mortgage loan or loan combination. |
| Deal Website: | The Certificate Administrator will be required to maintain a deal website which will include, among other items: (a) summaries of asset status reports prepared by the Special Servicer, (b) inspection reports, (c) appraisals, (d) various “special notices” described in the Free Writing Prospectus, (e) the “Investor Q&A Forum” and (f) a voluntary “Investor Registry”. Investors may access the deal website following execution of a certification and confidentiality agreement. |
Initial Majority Subordinate Certificateholder: | It is expected that RREF II CMBS AIV, LP, an affiliate of Rialto Real Estate Fund, LP, or another affiliate of Rialto Real Estate Fund, LP will be the initial majority subordinate certificateholder. |
| Loan Combinations: | Each of the mortgaged properties identified on Annex A to the Free Writing Prospectus as Matrix MHC Portfolio, Westfield Mission Valley and Home Depot Brush Avenue secure both a mortgage loan to be included in the trust fund and one other mortgage loan that will not be included in the trust fund, which will be pari passu in right of payment with the trust mortgage loan. With respect to each group of mortgage loans, which we refer to as a “loan combination”, only the Home Depot Brush Avenue loan combination will be principally serviced under the pooling and servicing agreement. The Matrix MHC Portfolio loan combination is expected to be serviced under the pooling and servicing agreement relating to the GSMS 2013-GCJ16 transaction. The Westfield Mission Valley loan combination will be serviced under the pooling and servicing agreement relating to the WFRBS 2013-C16 transaction. |
With respect to the Home Depot Brush Avenue pari passu mortgage loan, the servicing and administration of such loan combination will be conducted according to substantially the same provisions as apply to mortgage loans that are not included in a loan combination, except that the holder of the pari passu companion loan, or a representative thereof, will have rights to certain consultation rights with respect to the servicing of the loan combinations. As of the closing date, the Home Depot Brush Avenue pari passu companion loan is expected to be included in the GSMS 2013-GCJ16 securitization. |
THE INFORMATION IN THIS STRUCTURAL AND COLLATERAL TERM SHEET IS NOT COMPLETE AND MAY BE AMENDED PRIOR TO THE TIME OF SALE. THIS TERM SHEET IS NOT AN OFFER TO SELL THESE SECURITIES AND IT IS NOT A SOLICITATION OF AN OFFER TO BUY THESE SECURITIES IN ANY JURISDICTION WHERE THE OFFER OR SALE IS NOT PERMITTED.
22
(THIS PAGE INTENTIONALLY LEFT BLANK)
23
| HILTON SANDESTIN BEACH RESORT AND SPA |
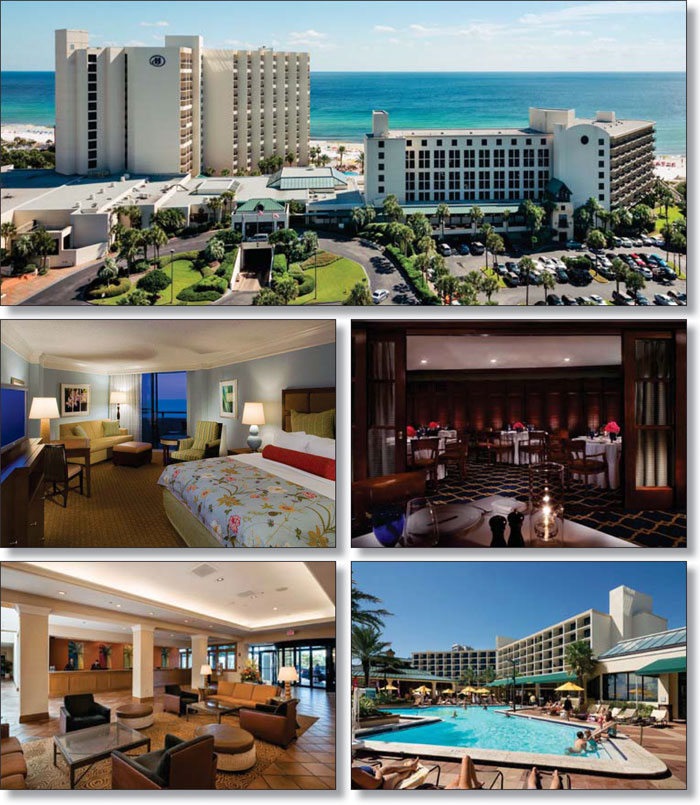
THE INFORMATION IN THIS STRUCTURAL AND COLLATERAL TERM SHEET IS NOT COMPLETE AND MAY BE AMENDED PRIOR TO THE TIME OF SALE. THIS TERM SHEET IS NOT AN OFFER TO SELL THESE SECURITIES AND IT IS NOT A SOLICITATION OF AN OFFER TO BUY THESE SECURITIES IN ANY JURISDICTION WHERE THE OFFER OR SALE IS NOT PERMITTED.
24
| HILTON SANDESTIN BEACH RESORT AND SPA |
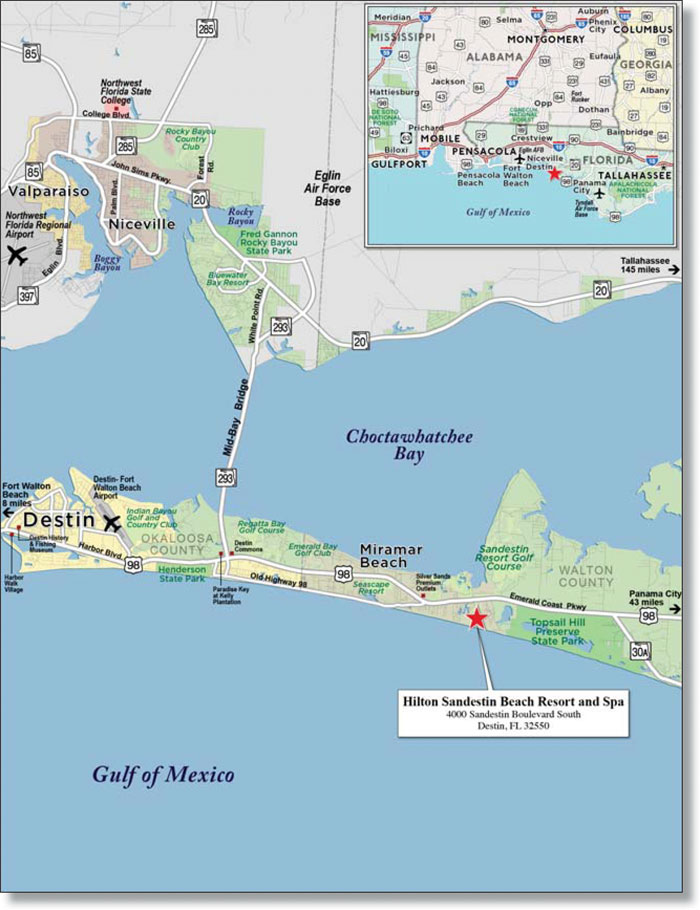
THE INFORMATION IN THIS STRUCTURAL AND COLLATERAL TERM SHEET IS NOT COMPLETE AND MAY BE AMENDED PRIOR TO THE TIME OF SALE. THIS TERM SHEET IS NOT AN OFFER TO SELL THESE SECURITIES AND IT IS NOT A SOLICITATION OF AN OFFER TO BUY THESE SECURITIES IN ANY JURISDICTION WHERE THE OFFER OR SALE IS NOT PERMITTED.
25
No. 1 – Hilton Sandestin Beach Resort and Spa | |||||||
Loan Information | Property Information | ||||||
| Mortgage Loan Seller: | Wells Fargo Bank, National Association | Single Asset/Portfolio: | Single Asset | ||||
| Credit Assessment (Fitch/Moody’s/DBRS): | NR/BBB-/NR | Property Type: | Hospitality | ||||
| Original Principal Balance: | $75,000,000 | Specific Property Type: | Full Service | ||||
| Cut-off Date Principal Balance: | $75,000,000 | Location: | Destin, FL | ||||
| % of Initial Pool Balance: | 8.3% | Size: | 598 rooms | ||||
| Loan Purpose: | Refinance | Cut-off Date Principal Balance Per Room: | $125,418 | ||||
| Borrower Name: | Sandestin Beach Hotel, Ltd. | Year Built/Renovated: | 1984/2013 | ||||
| Sponsor: | S H General Partner, Inc. | Title Vesting: | Fee | ||||
| Mortgage Rate: | 4.990% | Property Manager: | Sandcastle Resort of Sandestin, Inc. | ||||
| Note Date: | September 4, 2013 | 3rd Most Recent Occupancy (As of): | 59.7% (12/31/2010) | ||||
| Anticipated Repayment Date: | NAP | 2nd Most Recent Occupancy (As of): | 64.3% (12/31/2011) | ||||
| Maturity Date: | October 1, 2023 | Most Recent Occupancy (As of): | 68.8% (12/31/2012) | ||||
| IO Period: | 120 months | Current Occupancy (As of): | 67.4% (6/30/2013) | ||||
| Loan Term (Original): | 120 months | ||||||
| Seasoning: | 1 month | Underwriting and Financial Information: | |||||
| Amortization Term (Original): | NAP | ||||||
| Loan Amortization Type: | Interest-only, Balloon | 3rd Most Recent NOI (As of): | $12,005,665 (12/31/2011) | ||||
| Interest Accrual Method: | Actual/360 | 2nd Most Recent NOI (As of): | $15,227,344 (12/31/2012) | ||||
| Call Protection: | L(25),D(91),O(4) | Most Recent NOI (As of): | $15,779,056 (TTM 6/30/2013) | ||||
| Lockbox Type: | Springing (Without Established Account) | ||||||
Additional Debt(1): | Yes | ||||||
Additional Debt Type(1): | Future Mezzanine and Unsecured | U/W Revenues: | $51,251,619 | ||||
| U/W Expenses: | $36,429,579 | ||||||
| U/W NOI: | $14,822,040 | ||||||
| U/W NCF: | $12,771,975 | ||||||
| U/W NOI DSCR: | 3.91x | ||||||
Escrows and Reserves(2): | U/W NCF DSCR: | 3.37x | |||||
| U/W NOI Debt Yield: | 19.8% | ||||||
Type: | Initial | Monthly | Cap (If Any) | U/W NCF Debt Yield: | 17.0% | ||
| Taxes | $407,929 | $37,084 | NAP | As-Is Appraised Value: | $205,000,000 | ||
| Insurance | $778,923 | $97,365 | NAP | As-Is Appraisal Valuation Date: | July 11, 2013 | ||
| FF&E | $0 | $170,839 | NAP | Cut-off Date LTV Ratio: | 36.6% | ||
| PIP Reserve | $8,500,000 | $0 | NAP | LTV Ratio at Maturity or ARD: | 36.6% | ||
| (1) | See “Subordinate and Mezzanine Indebtedness” section. |
| (2) | See “Escrows” section. |
The Mortgage Loan. The mortgage loan (the “Hilton Sandestin Beach Resort and Spa Mortgage Loan”) is evidenced by a single promissory note that is secured by a first mortgage encumbering a full-service hotel located in Destin, Florida (the “Hilton Sandestin Beach Resort and Spa Property”). The Hilton Sandestin Beach Resort and Spa Mortgage Loan was originated on September 4, 2013 by Wells Fargo Bank, National Association. The Hilton Sandestin Beach Resort and Spa Mortgage Loan had an original principal balance of $75,000,000, has an outstanding principal balance as of the Cut-off Date of $75,000,000 and accrues interest at an interest rate of 4.990% per annum. The Hilton Sandestin Beach Resort and Spa Mortgage Loan had an initial term of 120 months, has a remaining term of 119 months as of the Cut-off Date and requires interest-only payments through the term of the Hilton Sandestin Beach Resort and Spa Mortgage Loan. The Hilton Sandestin Beach Resort and Spa Mortgage Loan matures on October 1, 2023.
Following the lockout period, the borrower has the right to defease the Hilton Sandestin Beach Resort and Spa Mortgage Loan in whole, but not in part, on any date before July 1, 2023. In addition, the Hilton Sandestin Beach Resort and Spa Mortgage Loan is prepayable without penalty on or after July 1, 2023.
THE INFORMATION IN THIS STRUCTURAL AND COLLATERAL TERM SHEET IS NOT COMPLETE AND MAY BE AMENDED PRIOR TO THE TIME OF SALE. THIS TERM SHEET IS NOT AN OFFER TO SELL THESE SECURITIES AND IT IS NOT A SOLICITATION OF AN OFFER TO BUY THESE SECURITIES IN ANY JURISDICTION WHERE THE OFFER OR SALE IS NOT PERMITTED.
26
| HILTON SANDESTIN BEACH RESORT AND SPA |
Sources and Uses
| Sources | Uses | |||||||
| Original loan amount | $75,000,000 | 100.0% | Loan payoff(1) | $45,222,307 | 60.3% | |||
| Reserves | 9,686,852 | 12.9 | ||||||
| Closing costs | 819,977 | 1.1 | ||||||
| Return of equity | 19,270,864 | 25.7 | ||||||
| Total Sources | $75,000,000 | 100.0% | Total Uses | $75,000,000 | 100.0% |
| (1) | The Hilton Sandestin Beach Resort and Spa Property was previously securitized in BSCMS 2004–PWR6. |
The Property. The Hilton Sandestin Beach Resort and Spa Property consists of three building structures: Emerald Tower, Spa Tower and the Lobby building. The Emerald Tower and the Spa Tower are connected through the lobby building. In total, the Hilton Sandestin Beach Resort and Spa Property is comprised of 598 rooms located in the Emerald Tower and Spa Tower. The Emerald Tower consists of 16 stories and the Lobby building consists of two-stories and both buildings were part of the original structure constructed in 1984. The Spa Tower consists of eight stories and was added as part of a renovation and expansion in 1998. The Hilton Sandestin Beach Resort and Spa Property offers 306 king bedrooms, 279 double bedrooms, 12 ADA compliant rooms and one suite. Amenities at the Hilton Sandestin Beach Resort and Spa Property include four restaurants, a coffee shop, a poolside tiki bar, approximately 34,600 square feet of meeting room space, exercise room, business center, gift shop, two outdoor swimming pools and one indoor swimming pool, spa and health club and direct access to the beach. Approximately $32.2 million has been invested in the Hilton Sandestin Beach Resort and Spa Property over the past 10 years and an additional $12.5 million renovation began in 2013 and is expected to be completed in 2014. The renovation includes upgrades to the lobby area, meeting rooms, restaurants, carpeting and lighting for guest room hallways. All guest rooms will be renovated with upgrades to soft goods and bathrooms. In addition, a second story parking deck will be added above the current valet parking lot. The Hilton Sandestin Beach Resort and Spa Property has operated under a franchise agreement with Hilton Hotels since 1984 and the current management agreement expires December 31, 2024.
Operating History and Underwritten Net Cash Flow. The following table represents certain information relating to the historical operating performance and the Underwritten Net Cash Flow at the Hilton Sandestin Beach Resort and Spa Property:
Cash Flow Analysis
| 2011 | 2012 | TTM 6/30/2013 | U/W | U/W $ per Room | ||||||
| Occupancy | 64.3% | 68.8% | 67.4% | 67.4% | ||||||
| ADR | $194.47 | $204.47 | $209.59 | $209.59 | ||||||
| RevPAR | $125.04 | $140.68 | $141.26 | $141.26 | ||||||
| Total Revenue | $45,629,234 | $50,680,032 | $51,521,525 | $51,251,619 | $85,705 | |||||
| Total Department Expenses | 16,756,237 | 17,913,944 | 17,791,631 | 18,277,221 | 30,564 | |||||
| Gross Operating Profit | $28,872,997 | $32,766,088 | $33,729,894 | $32,974,399 | $55,141 | |||||
| Total Undistributed Expenses | 14,806,019 | 15,421,299 | 15,764,623 | 15,767,613 | 26,367 | |||||
| Profit Before Fixed Charges | $14,066,978 | $17,344,789 | $17,965,271 | $17,206,785 | $28,774 | |||||
| Total Fixed Charges | 2,061,313 | 2,117,445 | 2,186,215 | 2,384,746 | 3,988 | |||||
| Net Operating Income | $12,005,665 | $15,227,344 | $15,779,056 | $14,822,040 | $24,786 | |||||
| FF&E | 1,826,631 | 2,028,958 | 2,060,861 | 2,050,065 | 3,428 | |||||
| Net Cash Flow | $10,179,034 | $13,198,386 | $13,718,195 | $12,771,975 | $21,358 | |||||
| NOI DSCR | 3.16x | 4.01x | 4.16x | 3.91x | ||||||
| NCF DSCR | 2.68x | 3.48x | 3.62x | 3.37x | ||||||
| NOI DY | 16.0% | 20.3% | 21.0% | 19.8% | ||||||
| NCF DY | 13.6% | 17.6% | 18.3% | 17.0% | ||||||
Appraisal. As of the appraisal valuation date of July 11, 2013, the Hilton Sandestin Beach Resort and Spa Property had an “as-is” appraised value of $205,000,000.
Environmental Matters. According to the Phase I environmental assessment dated July 12, 2013, there was no evidence of any recognized environmental conditions at the Hilton Sandestin Beach Resort and Spa Property.
Market Overview and Competition. The Hilton Sandestin Beach Resort and Spa Property is situated along the south side of United States Highway 98, directly fronting the Gulf of Mexico in Destin, Florida. The Hilton Sandestin Beach Resort and Spa Property is located in the Northwest Florida panhandle in Walton County. Walton County is part of the Emerald Coast, which is approximately 100 miles of shoreline and is approximately 48 miles east of Pensacola, Florida and 162 miles west of Tallahassee, Florida. The Hilton Sandestin Beach Resort and Spa Property is located within the Sandestin Golf and Beach Resort, which is a 2,400 acre resort founded in 1973. The Sandestin Golf and Beach Resort contains more than 1,400 rental accommodations, four golf courses, 14 tennis courts, four swimming pools and a 98-slip marina. Leisure demand is the largest demand driver in the local hospitality market and the Hilton Sandestin Beach Resort and Spa Property’s location and beaches along the Gulf of Mexico attract tourists primarily from the nearby states of Alabama, Mississippi, Louisiana and Georgia as well as tourists from cold winter areas.
THE INFORMATION IN THIS STRUCTURAL AND COLLATERAL TERM SHEET IS NOT COMPLETE AND MAY BE AMENDED PRIOR TO THE TIME OF SALE. THIS TERM SHEET IS NOT AN OFFER TO SELL THESE SECURITIES AND IT IS NOT A SOLICITATION OF AN OFFER TO BUY THESE SECURITIES IN ANY JURISDICTION WHERE THE OFFER OR SALE IS NOT PERMITTED.
27
| HILTON SANDESTIN BEACH RESORT AND SPA |
The following table presents certain information relating to the Hilton Sandestin Beach Resort and Spa Property’s competitive set:
Subject and Market Historical Occupancy, ADR and RevPAR(1)
Competitive Set | Hilton Sandestin Beach Resort and Spa | Penetration Factor | |||||||||||||||
Year | Occupancy | ADR | RevPAR | Occupancy | ADR | RevPAR | Occupancy | ADR | RevPAR | ||||||||
| 8/30/2013 TTM | 52.6% | $168.79 | $88.75 | 68.2% | $209.40 | $142.81 | 129.7% | 124.1% | 160.9% | ||||||||
| 8/30/2012 TTM | 51.8% | $162.75 | $84.28 | 68.2% | $203.08 | $138.46 | 131.7% | 124.8% | 164.3% | ||||||||
| 8/30/2011 TTM | 51.5% | $154.42 | $79.59 | 61.6% | $194.88 | $120.13 | 119.6% | 126.2% | 150.9% | ||||||||
| (1) | Information obtained from a third party hospitality research report dated September 18, 2013. According to such third party hospitality report, the competitive set includes the following hotels: Marriott Grand Hotel Resort Golf Club, Omni Hilton Head Oceanfront Resort, Sandestin Golf & Beach Resort, Wyndham Bay Point Resort, Marriott Sawgrass Golf Resort & Spa and Embassy Suites Destin Miramar Beach. |
The Borrower. The borrower is Sandestin Beach Hotel, Ltd., a Florida limited partnership and a single purpose entity with two independent directors. Legal counsel to the borrower delivered a non-consolidation opinion in connection with the origination of the Hilton Sandestin Beach Resort and Spa Mortgage Loan. S H General Partner Inc., the sponsor, is the guarantor of certain nonrecourse carveouts under the Hilton Sandestin Beach Resort and Spa Mortgage Loan. S H General Partner, Inc. owns approximately 1.1% of the borrower and the remaining 98.9% is owned through 222 separate entities and individuals (collectively, the “Limited Partners”).
The Sponsor. The sponsor, S H General Partner, Inc., which is owned by the Limited Partners and each Limited Partner owns one share of the sponsor. The sponsor is controlled by a seven-member board of directors. The board of directors represents the Limited Partners and makes all decisions on behalf of the borrower. The seven member board of directors is elected on an annual basis with two-year staggered terms.
Escrows. The loan documents provide for upfront reserves in the amount of $407,929 for real estate taxes, $778,923 for insurance premiums and $8,500,000 for the PIP Reserve. The loan documents also provide for ongoing monthly reserves in the amount of $37,084 for real estate taxes and $97,365 for insurance premiums. In addition, the loan documents provide for an ongoing monthly FF&E reserve (currently $170,839) equal to the greater of (i) 4.0% of operating income for the preceding calendar year and (ii) the amount required by the franchise agreement.
Lockbox and Cash Management. Upon the occurrence of a Cash Management Trigger Event (as defined below), the borrower is required to establish a lender-controlled lockbox account into which the borrower and the property manager are required to deposit all rents within one business day of receipt. Following a Cash Management Trigger Event and prior to a Cash Trap Event Period (as defined below), all excess funds on deposit in the lockbox account are swept to the borrower’s operating account. During a Cash Trap Event Period, all excess funds on deposit in the lockbox account are swept to a lender-controlled cash flow subaccount.
A “Cash Management Trigger Event” will occur upon the earlier of (i) the occurrence and continuance of an event of default; (ii) the net cash flow debt yield falling below 10.5% for any trailing 12-month period; or (iii) the borrower obtains mezzanine debt.
A “Cash Trap Event Period” will commence upon the earlier of (i) the occurrence and continuance of an event of default; (ii) the net cash flow debt yield falling below 8.5% for any trailing 12-month period; or (iii) the borrower obtains mezzanine debt. A Cash Trap Event Period will expire, with regard to circumstances in clause (i), upon the cure of such event of default (provided that a Cash Trap Event Period has not occurred or is continuing pursuant to clauses (ii) or (iii)); with regard to circumstances in clause (ii), the net cash flow debt yield is equal to or greater than 9.5% for the trailing 12-month period (provided that a Cash Trap Event Period has not occurred or is continuing pursuant to clauses (i) or (iii)); with regard to circumstances in clause (iii), the repayment in full of outstanding mezzanine debt (provided that a Cash Trap Event Period has not occurred or is continuing pursuant to clauses (i) or (ii)).
Property Management. The Hilton Sandestin Beach Resort and Spa is managed by Sandcastle Resort of Sandestin, Inc.
Assumption. The borrower has a two-time right to transfer the Hilton Sandestin Beach Resort and Spa Property, provided that no event of default has occurred and is continuing and certain other conditions are satisfied, including (i) the lender’s reasonable determination that the proposed transferee and guarantor satisfy the lender’s credit review and underwriting standards, taking into consideration transferee experience, financial strength and general business standing; (ii) execution of a recourse guaranty and an environmental indemnity by an affiliate of the transferee; and (iii) if requested by the lender, rating agency confirmation from Fitch, Moody’s and DBRS that the transfer will not result in a downgrade, withdrawal or qualification of the respective ratings assigned to the Series 2013-C17 Certificates.
Partial Release. Not permitted.
Real Estate Substitution. Not permitted.
THE INFORMATION IN THIS STRUCTURAL AND COLLATERAL TERM SHEET IS NOT COMPLETE AND MAY BE AMENDED PRIOR TO THE TIME OF SALE. THIS TERM SHEET IS NOT AN OFFER TO SELL THESE SECURITIES AND IT IS NOT A SOLICITATION OF AN OFFER TO BUY THESE SECURITIES IN ANY JURISDICTION WHERE THE OFFER OR SALE IS NOT PERMITTED.
28
| HILTON SANDESTIN BEACH RESORT AND SPA |
Subordinate and Mezzanine Indebtedness. There is no existing mezzanine debt related to the Hilton Sandestin Beach Resort and Spa Mortgage Loan; however, future mezzanine debt (not to exceed $18,750,000) is permitted subject to satisfaction of certain conditions, including: (i) no event of default has occurred and is continuing; (ii) the lender receives no less than 30 days’ prior written notice; (iii) the combined loan-to-value ratio is equal to or less than 50.0%; (iv) the combined debt service coverage ratio is equal to or greater than 2.00x; (v) an intercreditor agreement in form and substance is acceptable to Fitch, Moody’s and DBRS and reasonably acceptable to the lender; and (vi) the term of the permitted mezzanine debt will be coterminous with the Hilton Sandestin Beach Resort and Spa Mortgage Loan.
The borrower has the right to incur up to $5,000,000 of unsecured subordinate debt. The unsecured subordinate debt will only be payable from excess cash flow after all property expenses, reserves and debt service payments have been made and a subordination and standstill agreement will be required to be executed.
Ground Lease. None.
Terrorism Insurance. The loan documents require that the “all risk” insurance policy required to be maintained by the borrower provide coverage for terrorism in an amount equal to the full replacement cost of the Hilton Sandestin Beach Resort and Spa Property, as well as business interruption insurance covering no less than the 18-month period following the occurrence of a casualty event, together with a six-month extended period of indemnity.
Windstorm/Flood Insurance. The loan documents require windstorm insurance covering the full replacement cost of the Hilton Sandestin Beach Resort and Spa Property during the loan term. At the time of closing, the Hilton Sandestin Beach Resort and Spa Property had insurance coverage for windstorm and flood.
THE INFORMATION IN THIS STRUCTURAL AND COLLATERAL TERM SHEET IS NOT COMPLETE AND MAY BE AMENDED PRIOR TO THE TIME OF SALE. THIS TERM SHEET IS NOT AN OFFER TO SELL THESE SECURITIES AND IT IS NOT A SOLICITATION OF AN OFFER TO BUY THESE SECURITIES IN ANY JURISDICTION WHERE THE OFFER OR SALE IS NOT PERMITTED.
29
| MATRIX MHC PORTFOLIO |
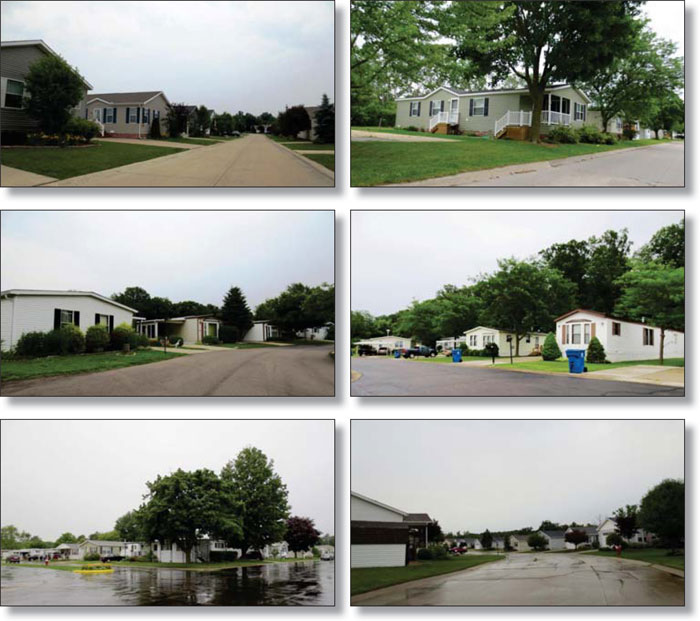
THE INFORMATION IN THIS STRUCTURAL AND COLLATERAL TERM SHEET IS NOT COMPLETE AND MAY BE AMENDED PRIOR TO THE TIME OF SALE. THIS TERM SHEET IS NOT AN OFFER TO SELL THESE SECURITIES AND IT IS NOT A SOLICITATION OF AN OFFER TO BUY THESE SECURITIES IN ANY JURISDICTION WHERE THE OFFER OR SALE IS NOT PERMITTED.
30
| MATRIX MHC PORTFOLIO |
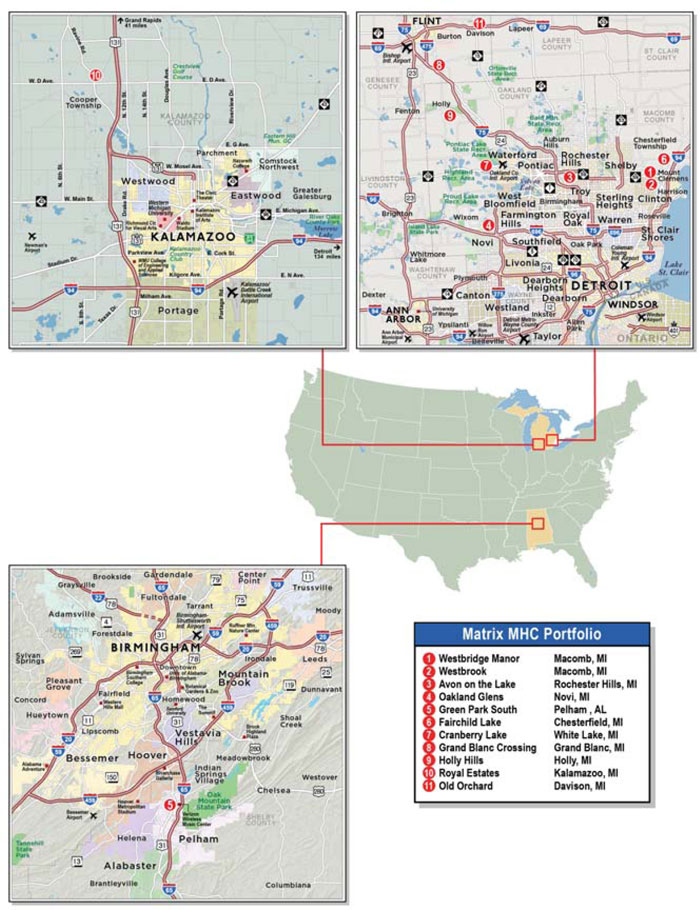
THE INFORMATION IN THIS STRUCTURAL AND COLLATERAL TERM SHEET IS NOT COMPLETE AND MAY BE AMENDED PRIOR TO THE TIME OF SALE. THIS TERM SHEET IS NOT AN OFFER TO SELL THESE SECURITIES AND IT IS NOT A SOLICITATION OF AN OFFER TO BUY THESE SECURITIES IN ANY JURISDICTION WHERE THE OFFER OR SALE IS NOT PERMITTED.
31
| No. 2 – Matrix MHC Portfolio | ||||||||
| Loan Information | Property Information | |||||||
| Mortgage Loan Seller: | Rialto Mortgage Finance, LLC | Single Asset/Portfolio: | Portfolio | |||||
| Credit Assessment (Fitch/Moody’s/DBRS): | NR/NR/NR | Property Type: | Manufactured Housing Community | |||||
Original Principal Balance(1): | $65,500,000 | Specific Property Type: | Manufactured Housing Community | |||||
Cut-off Date Principal Balance(1): | $65,500,000 | Location: | Various – See Table | |||||
| % of Initial Pool Balance: | 7.2% | Size: | 5,347 pads | |||||
Loan Purpose(2): | Various | Cut-off Date Principal Balance Per Pad(1): | $25,248 | |||||
Borrower Name(3): | Various | Year Built/Renovated: | Various – See Table | |||||
| Sponsor: | Glen Nelson | Title Vesting: | Fee | |||||
| Mortgage Rate: | 6.2745% | Property Manager: | Cobblestone Property Management LLC | |||||
| Note Date: | July 22, 2013 | 3rd Most Recent Occupancy (As of): | NAV | |||||
| Anticipated Repayment Date: | NAP | 2nd Most Recent Occupancy (As of): | 67.5% (12/31/2011) | |||||
| Maturity Date: | August 6, 2018 | Most Recent Occupancy (As of): | 68.8% (12/31/2012) | |||||
| IO Period: | 12 months | Current Occupancy (As of): | 69.6% (Various) | |||||
| Loan Term (Original): | 60 months | |||||||
| Seasoning: | 3 months | Underwriting and Financial Information: | ||||||
| Amortization Term (Original): | 360 months | |||||||
| Loan Amortization Type: | Interest-only, Amortizing Balloon | 3rd Most Recent NOI (As of): | $14,448,347 (7/2011-6/2012) | |||||
| Interest Accrual Method: | Actual/360 | 2nd Most Recent NOI (As of): | $14,754,077 (12/31/2012) | |||||
| Call Protection: | L(27),D(30),O(3) | Most Recent NOI (As of): | $15,529,549 (TTM 6/30/2013) | |||||
| Lockbox Type: | Soft/Springing Cash Management | |||||||
Additional Debt(1): | Yes | U/W Revenues: | $24,867,276 | |||||
Additional Debt Type(1)(4): | Pari Passu and Mezzanine | U/W Expenses: | $9,840,909 | |||||
| U/W NOI: | $15,026,367 | |||||||
| U/W NCF: | $14,654,017 | |||||||
Escrows and Reserves(5): | U/W NOI DSCR(1): | 1.51x | ||||||
U/W NCF DSCR(1): | 1.47x | |||||||
Type: | Initial | Monthly | Cap (If Any) | U/W NOI Debt Yield(1): | 11.1% | |||
| Taxes | $100,000 | $150,500 | NAP | U/W NCF Debt Yield(1): | 10.9% | |||
| Insurance | $0 | $36,100 | NAP | As-Is Appraised Value: | $194,560,000 | |||
| Replacement Reserves | $1,794,188 | $31,029 | NAP | As-Is Appraisal Valuation Date(7): | Various | |||
| Home Purchase Reserve | $3,000,000 | $125,000 | NAP(6) | Cut-off Date LTV Ratio(1): | 69.4% | |||
| Deferred Maintenance | $455,812 | $0 | NAP | LTV Ratio at Maturity or ARD(1): | 66.2% | |||
| (1) | The Matrix MHC Portfolio Loan Combination, totaling $135,000,000, is comprised of two pari passu notes (Notes A-1 and A-2). The controlling Note A-1 had an original principal balance of $69,500,000 and is expected to be contributed to the GSMS 2013-GCJ16 Trust. The non-controlling Note A-2 had an original principal balance of $65,500,000 and will be contributed to the WFRBS 2013-C17 trust. All statistical financial information related to balances per square foot, loan-to-value ratios, debt service coverage ratios and debt yields are based on the Matrix MHC Portfolio Loan Combination. The total debt (Matrix MHC Portfolio Loan Combination and mezzanine debt) NOI DSCR, NOI LTV and NOI Debt Yield are 1.27x, 77.1% and 10.0%, respectively. |
| (2) | The Matrix MHC Portfolio Loan Combination proceeds, along with additional borrower equity, were used to acquire 10 manufactured housing community properties located in Michigan and refinance existing debt on one manufactured housing community (Green Park South) located in Alabama. |
| (3) | The borrower is comprised of 22 separate limited liability companies. |
| (4) | See “Subordinate and Mezzanine Indebtedness” section. |
| (5) | See “Escrows” section. |
| (6) | Monthly deposits to the Home Purchase Reserve are only required during the first 12 months of the loan term for a total of $1,500,000. |
| (7) | The As-Is Appraisal Valuation Dates range from June 27, 2013 to July 5, 2013. |
The Mortgage Loan. The mortgage loan combination (the “Matrix MHC Portfolio Loan Combination”) is evidenced by two pari passu promissory notes (Note A-1 and Note A-2) secured by a first mortgage encumbering a portfolio of manufactured home communities located in Michigan (10 properties) and Alabama (one property) (the “Matrix MHC Portfolio Properties”). The Matrix MHC Portfolio Loan Combination was originated on July 22, 2013 by Jefferies LoanCore LLC (an entity not affiliated with Rialto Mortgage Finance, LLC). Rialto Mortgage Finance LLC will acquire Note A-1 (the “Matrix MHC Portfolio Loan”) on or prior to the securitization closing date. The Matrix MHC Portfolio Loan Combination had an original principal balance of $135,000,000, has an outstanding principal balance as of the Cut-off Date of $135,000,000 and accrues interest at an interest rate of 6.2745% per annum. The Matrix MHC Portfolio Loan Combination had an initial term of 60 months, has a remaining term of 57 months as of the Cut-off Date and requires interest-only payments for the first 12 payments following origination and thereafter requires payments of principal and interest based on a 360-month amortization schedule. The Matrix MHC Portfolio Loan Combination matures on August 6, 2018. See “Description of the Mortgage Pool—Matrix MHC Portfolio Loan Combination” and “The Pooling and Servicing Agreement—Servicing of the Loan Combinations” in the Free Writing Prospectus.
THE INFORMATION IN THIS STRUCTURAL AND COLLATERAL TERM SHEET IS NOT COMPLETE AND MAY BE AMENDED PRIOR TO THE TIME OF SALE. THIS TERM SHEET IS NOT AN OFFER TO SELL THESE SECURITIES AND IT IS NOT A SOLICITATION OF AN OFFER TO BUY THESE SECURITIES IN ANY JURISDICTION WHERE THE OFFER OR SALE IS NOT PERMITTED.
32
| MATRIX MHC PORTFOLIO |
The Matrix MHC Portfolio Loan, which will be contributed to the WFRBS 2013-C17 Trust, had an original principal balance of $65,500,000 and has an outstanding principal balance as of the Cut-off Date of $65,500,000. The related companion loan, evidenced by Note A-1, which had an original principal balance of $69,500,000, an outstanding principal balance as of the Cut-off Date of $69,500,000 and represents the controlling interest in the Matrix MHC Portfolio Loan Combination, is expected to be contributed to the GSMS 2013-GCJ16 Trust.
Following the lockout period, the borrowers have the right to defease the Matrix MHC Portfolio Loan Combination in whole or in part on any date before June 6, 2018. In addition, the Matrix MHC Portfolio Loan Combination is prepayable without penalty on or after June 6, 2018.
Sources and Uses
| Sources | Uses | |||||||||||
| Original loan combination amount | $135,000,000 | 73.7 | % | Purchase price | $165,000,000 | 90.0 | % | |||||
| Mezzanine loan amount | 15,000,000 | 8.2 | Loan payoff (1) | 8,488,742 | 4.6 | |||||||
| Sponsor’s new cash contribution | 14,137,835 | 7.7 | Reserves | 5,350,000 | 2.9 | |||||||
Collateral pledge equity contribution(1) | 9,711,258 | 5.3 | Closing costs | 4,440,352 | 2.4 | |||||||
Unsecured notes(2) | 9,430,000 | 5.1 | ||||||||||
| Total Sources | $183,279,094 | 100.0 | % | Total Uses | $183,279,094 | 100.0 | % | |||||
| (1) | At origination, the borrowers contributed one manufactured housing community property (the “Green Park South property”) located in Alabama, as collateral for the Matrix MHC Portfolio Loan Combination. The Green Park South property had a total of $8,488,742 of outstanding debt (which was paid off at origination) and has an appraised value of $18,200,000 resulting in an implied equity contribution of $9,711,258. |
| (2) | At origination, certain affiliates of the borrowers obtained seller financing in the form of 427 unsecured notes in the amount of $9,430,000 in conjunction with the acquisition of the Matrix MHC Portfolio Properties. |
The Properties. The Matrix MHC Portfolio Properties consist of 11 manufactured housing communities totaling 5,347 pads, of which 10 are located in Michigan (4,932 pads) and one is located in Alabama (415 pads). The Matrix MHC Portfolio Properties are comprised of seven all-age and four age-restricted manufactured housing communities and feature approximately 60% double-wide sites and 40% single-wide sites. Common amenities at the Matrix MHC Portfolio Properties include a clubhouse, pool, playground, fitness center, laundry facility, RV storage and lake access. In addition, there are approximately 840 borrower-owned homes (15.7% of total pad count), as described below under “Manufactured Home Collateral” for which tenants pay a combined monthly rent for use of the pad and the home. The weighted average occupancy of the park owned homes is approximately 96.4%.
The following table presents certain information relating to Matrix MHC Portfolio Properties:
| Property Name – Location | Allocated Cut-off Date Principal Balance | % of Portfolio Cut-off Date Principal Balance | Occupancy | Year Built/ Renovated | Pads | Appraised Value | |||||||||||
| Westbridge Manor - Macomb, MI | $25,110,000 | 18.6% | 58.7% | 1973/NAP | 1,426 | $39,860,000 | |||||||||||
| Westbrook - Macomb, MI | $21,375,000 | 15.8% | 94.3% | 1996/NAP | 388 | $28,040,000 | |||||||||||
Avon on the Lake - Rochester Hills, MI(1) | $16,920,000 | 12.5% | 74.2% | 1969/NAP | 617 | $24,000,000 | |||||||||||
| Oakland Glens - Novi, MI | $14,850,000 | 11.0% | 58.2% | 1971/NAP | 725 | $21,780,000 | |||||||||||
| Green Park South - Pelham, AL | $13,950,000 | 10.3% | 99.0% | 1965/NAP | 415 | $18,200,000 | |||||||||||
| Fairchild Lake - Chesterfield, MI | $10,980,000 | 8.1% | 75.1% | 1969/NAP | 345 | $15,230,000 | |||||||||||
Cranberry Lake - White Lake, MI(1) | $10,890,000 | 8.1% | 82.9% | 1966/NAP | 328 | $15,530,000 | |||||||||||
| Grand Blanc Crossing - Grand Blanc, MI | $7,560,000 | 5.6% | 53.6% | 1989/NAP | 478 | $11,070,000 | |||||||||||
| Holly Hills - Holly, MI | $4,635,000 | 3.4% | 63.6% | 1998/NAP | 242 | $7,700,000 | |||||||||||
Royal Estates - Kalamazoo, MI(1) | $4,410,000 | 3.3% | 81.4% | 1969/NAP | 183 | $7,150,000 | |||||||||||
Old Orchard - Davison, MI(1) | $4,320,000 | 3.2% | 70.0% | 1974/NAP | 200 | $6,000,000 | |||||||||||
| Total/Weighted Average | $135,000,000 | 100.0% | 69.6% | 5,347 | $194,560,000 | ||||||||||||
| (1) | These Matrix MHC Portfolio Properties are age-restricted (55+) properties. |
The following table presents historical occupancy percentages at the Matrix MHC Portfolio Properties:
Historical Occupancy
12/31/2011(1) | 12/31/2012(1) | 2013(2) | ||
| 67.5% | 68.8% | 69.6% |
| (1) | Information obtained from the borrower. |
| (2) | As of various dates in 2013. |
THE INFORMATION IN THIS STRUCTURAL AND COLLATERAL TERM SHEET IS NOT COMPLETE AND MAY BE AMENDED PRIOR TO THE TIME OF SALE. THIS TERM SHEET IS NOT AN OFFER TO SELL THESE SECURITIES AND IT IS NOT A SOLICITATION OF AN OFFER TO BUY THESE SECURITIES IN ANY JURISDICTION WHERE THE OFFER OR SALE IS NOT PERMITTED.
33
| MATRIX MHC PORTFOLIO |
Operating History and Underwritten Net Cash Flow. The following table presents certain information relating to the historical operating performance and the Underwritten Net Cash Flow at the Matrix MHC Portfolio Properties:
Cash Flow Analysis
7/2011 – 6/2012 | 2012 | TTM 6/30/2013 | U/W | U/W $ per Pad | |||||||
| Base Rent | $32,155,549 | $32,719,115 | $33,443,872 | $33,600,539(1) | $6,284 | ||||||
| Concessions | (633,206) | (801,457) | (851,808) | (853,436) | (160) | ||||||
| Other Income | 1,634,486 | 1,861,986 | 1,937,622 | 1,937,622 | 362 | ||||||
| Less Vacancy & Credit Loss | (10,234,242) | (10,268,661) | (10,092,969) | (9,817,449) | (2) | (1,836) | |||||
| Effective Gross Income | $22,922,587 | $23,510,983 | $24,436,717 | $24,867,276 | $4,651 | ||||||
| Total Operating Expenses | $8,474,240 | $8,756,906 | $8,907,168 | $9,840,909 | $1,840 | ||||||
| Net Operating Income | $14,448,347 | $14,754,077 | $15,529,549 | $15,026,367 | $2,810 | ||||||
| Capital Expenditures | 21,819 | 28,061 | 23,794 | 372,350 | 70 | ||||||
| Net Cash Flow | $14,426,528 | $14,726,016 | $15,505,755 | $14,654,017 | $2,741 | ||||||
| NOI DSCR | 1.45x | 1.48x | 1.56x | 1.51x | |||||||
| NCF DSCR | 1.45x | 1.48x | 1.56x | 1.47x | |||||||
| NOI DY | 10.7% | 10.9% | 11.5% | 11.1% | |||||||
| NCF DY | 10.7% | 10.9% | 11.5% | 10.9% | |||||||
| (1) | Underwritten gross potential rent is based on annualized in-place rents as of the May 2013 rent rolls for the Michigan properties and the June 2013 rent roll for the Alabama property with vacant units grossed up at appraiser concluded market rents. |
| (2) | The underwritten economic vacancy is 32.1%. The Matrix MHC Portfolio Properties were 74.0% physically occupied as of various dates in 2013. |
Appraisal. As of the appraisal valuation dates ranging from June 27, 2013 to July 5, 2013, the Matrix MHC Portfolio Properties had an aggregate “as-is” appraised value of $194,560,000.
Environmental Matters. According to environmental reports dated from July 2, 2013 to July 8, 2013, there were no recommendations for further action other than, with respect to certain of the Matrix MHC Portfolio Properties, operations and maintenance plans for asbestos.
The Borrowers. The borrowers are 22, single-purpose, single-asset limited liability companies each of which has a managing member with two independent directors, comprised of the following: (i) 20 of the borrowers are each a borrower in a two-entity tenant-in-common structure each of which owns one of the 10 Michigan properties, (ii) one borrower owns the Alabama property and (iii) one borrower owns certain of the manufactured homes located at the Michigan properties. Legal counsel to the borrowers delivered a non-consolidation opinion in connection with the origination of the Matrix MHC Portfolio Loan Combination. Glen Nelson is the guarantor of the nonrecourse carveouts under the Matrix MHC Portfolio Loan Combination.
The Sponsor. The sponsor is Glen Nelson. Mr. Nelson has over 25 years of residential and commercial real estate experience and is the founder and CEO of Matrix Realty Group, a New York-based real estate investment and management company with holdings throughout the United States. Matrix Realty Group’s current holdings include multifamily, office and special purpose commercial properties totaling over 6.0 million square feet. Matrix Realty Group has successfully acquired, repositioned and ultimately sold nearly 10.0 million square feet of office and residential real estate. One of the tenant-in-common borrowers at each of the Michigan properties holds a 5% interest in its corresponding property and are indirectly 100% owned by Enrico Scarda, who is the principal of The Crest Group.
Escrows. At origination, the borrowers funded aggregate reserves of $5,350,000 with respect to the Matrix MHC Portfolio Properties, comprised of: (i) $100,000 for real estate taxes, (ii) $1,794,188 for replacement reserves, (iii) $3,000,000 for home purchases (the “Home Purchase Reserve”) and (iv) $455,812 for deferred maintenance. On each monthly payment date, the borrowers are required to fund: (i) a tax reserve and an insurance reserve, in an amount equal to one-twelfth of the amount that the lender estimates will be necessary to pay tax and insurance premiums over the then succeeding 12-month period, currently $150,500 and $36,100, respectively and (ii) a replacement reserve in the monthly amount of $31,029.
Further, on each monthly due date during the initial 12 months of the Matrix MHC Portfolio Loan Combination term, the borrowers are required to fund $125,000 into the Home Purchase Reserve (totaling $1,500,000). In addition to any deposits noted above, 100% of the net sales proceeds from the sale and release of any Manufactured Home Collateral (described below) is required to be deposited into the Home Purchase Reserve. The Home Purchase Reserve will be used for the purchase of new or used coaches to be used within the Matrix MHC Portfolio Properties.
Lockbox and Cash Management. The Matrix MHC Portfolio Loan Combination requires a soft lockbox, which is already in place. All rents and other revenue collected by the borrowers or the property manager are required to be deposited into the lockbox account within two business days of receipt. Prior to the occurrence of a Cash Management Period (as defined below), all amounts in the lockbox account are swept on a daily basis to a borrower-controlled operating account. A “Cash Management Period” will commence upon the earlier of (i) the debt yield, as calculated in accordance with the loan documents, is less than 8.9% or (ii) an event of default has occurred and is continuing.
THE INFORMATION IN THIS STRUCTURAL AND COLLATERAL TERM SHEET IS NOT COMPLETE AND MAY BE AMENDED PRIOR TO THE TIME OF SALE. THIS TERM SHEET IS NOT AN OFFER TO SELL THESE SECURITIES AND IT IS NOT A SOLICITATION OF AN OFFER TO BUY THESE SECURITIES IN ANY JURISDICTION WHERE THE OFFER OR SALE IS NOT PERMITTED.
34
| MATRIX MHC PORTFOLIO |
During a Cash Management Period, all funds in the lockbox are swept on a daily basis into a lender-controlled cash management account and any excess funds in the cash management account, after the payment of debt service, the funding of required reserves and the lender approved operating expenses, are required to be retained by the lender and held as cash collateral for the Matrix MHC Portfolio Loan Combination. A Cash Management Period terminates once (i) the debt yield is at least 8.9% for two consecutive calendar quarters or (ii) the event of default has been cured.
Property Management. The Matrix MHC Portfolio Properties are currently managed by Cobblestone Property Management LLC.
Assumption. The borrowers have a one-time right to transfer all (but not less than all) of the Matrix MHC Portfolio Properties, provided that no event of default has occurred and is continuing and certain other conditions are satisfied, including (i) the lender’s reasonable determination that the proposed transferee and guarantor satisfy the lender’s credit review and underwriting standards, taking into consideration transferee experience, financial strength and general business standing; (ii) execution of a recourse guaranty (including an environmental indemnity) by an affiliate of the transferee; and (iii) if requested by the lender, rating agency confirmation from Fitch, Moody’s and DBRS that the transfer will not result in a downgrade, withdrawal or qualification of the respective ratings assigned to the Series 2013-C17 Certificates.
Partial Release. Following the second anniversary of the later of the issuance of the Series 2013-C17 Certificates and the Series 2013-GCJ16 Certificates, any borrower may obtain the release of the property owned by it from the Matrix MHC Portfolio Loan Combination upon a sale of such property, provided, among other things: (i) such sale is to a third party not affiliated with any borrower or guarantor and no borrower and or guarantor has any beneficial interest; (ii) the borrower has delivered defeasance collateral sufficient to defease an amount equal to the greater of (x) 100% of net sales proceeds for the Matrix MHC Portfolio property to be released and (y) 115% of the allocated loan amount for the Matrix MHC Portfolio property to be released; and (iii) after the release, the debt yield, calculated based on the sum of the outstanding principal balances of the Matrix MHC Portfolio Loan Combination and the Matrix MHC Portfolio Loan Combination mezzanine loan, for the remaining properties is no less than the greater of (x) the NOI debt yield immediately preceding such release and (y) 9.5%. In addition, the borrowers have the right to obtain the release of the individual homes that make up the Manufactured Home Collateral (described below), provided, among other things: (i) such sale is to a third party not affiliated with any borrower or guarantor, (ii) the borrowers pay to the lender 100% of the net sales proceeds of such sale for deposit into the Home Purchase Reserve described above and (iii) the release is in compliance with REMIC requirements.
Manufactured Home Collateral. Certain of the individual manufactured homes located at the Matrix MHC Portfolio Properties located in Michigan are owned by a borrower (rather than a third party individual homeowner). Accordingly, the borrowers have pledged their interest in such homes (the “Manufactured Home Collateral”) as collateral for the Matrix MHC Portfolio Loan Combination (including any homes subsequently acquired by the borrowers after the Matrix MHC Portfolio Loan Combination closing date). At origination, there were approximately 840 manufactured home collateral units.
Subordinate and Mezzanine Indebtedness. Concurrently with the funding of the Matrix MHC Portfolio Loan Combination, Jefferies LoanCore LLC funded a mezzanine loan in the amount of $15,000,000 to 22 mezzanine borrowers, each of which is the sole member and owner of 100% of the equity interests in the corresponding borrower. The mezzanine loan is secured by a pledge of each mezzanine borrower’s 100% equity interest in the corresponding borrower. The mezzanine loan is coterminous with the Matrix MHC Portfolio Loan Combination. The mezzanine loan was transferred to Terra Secured Income Fund 4, LLC.
Ground Lease. None.
Terrorism Insurance. The borrowers are required to maintain an “all risk” insurance policy that provides coverage for terrorism in an amount equal to the full replacement cost of the Matrix MHC Portfolio Properties, plus 18 months of business interruption coverage in an amount equal to 100% of the projected net operating income plus fixed expenses from the Matrix MHC Portfolio Properties for such period or until the restoration of the Matrix MHC Portfolio Properties has been completed; provided that such coverage is available. In the event that such coverage with respect to terrorist acts is not included as part of the “all risk” property policy, the borrower is nevertheless required to obtain coverage for terrorism (as standalone coverage) in an amount equal to 100% of the full replacement cost of the properties comprising the Matrix MHC Portfolio Properties, plus 18 months of business interruption coverage; provided that such coverage is available. See “Risk Factors—Risks Related to Mortgage Loans and Mortgaged Properties—Terrorism Insurance May Not Be Available for All Mortgage Properties” in the Free Writing Prospectus.
Windstorm/Flood Insurance. The loan documents require windstorm insurance covering the full replacement cost of the Matrix MHC Portfolio Properties during the loan term. Additionally, flood insurance is required through the National Flood Insurance Program since certain of the Matrix MHC Portfolio Properties (Green Park South Property and Grand Blanc) are located in a Flood Zone “A” or “V”. At the time of closing, the Matrix MHC Portfolio Properties had insurance coverage for windstorm and flood (to the extent located in a Flood Zone “A” or “V”).
THE INFORMATION IN THIS STRUCTURAL AND COLLATERAL TERM SHEET IS NOT COMPLETE AND MAY BE AMENDED PRIOR TO THE TIME OF SALE. THIS TERM SHEET IS NOT AN OFFER TO SELL THESE SECURITIES AND IT IS NOT A SOLICITATION OF AN OFFER TO BUY THESE SECURITIES IN ANY JURISDICTION WHERE THE OFFER OR SALE IS NOT PERMITTED.
35
| WESTFIELD MISSION VALLEY |
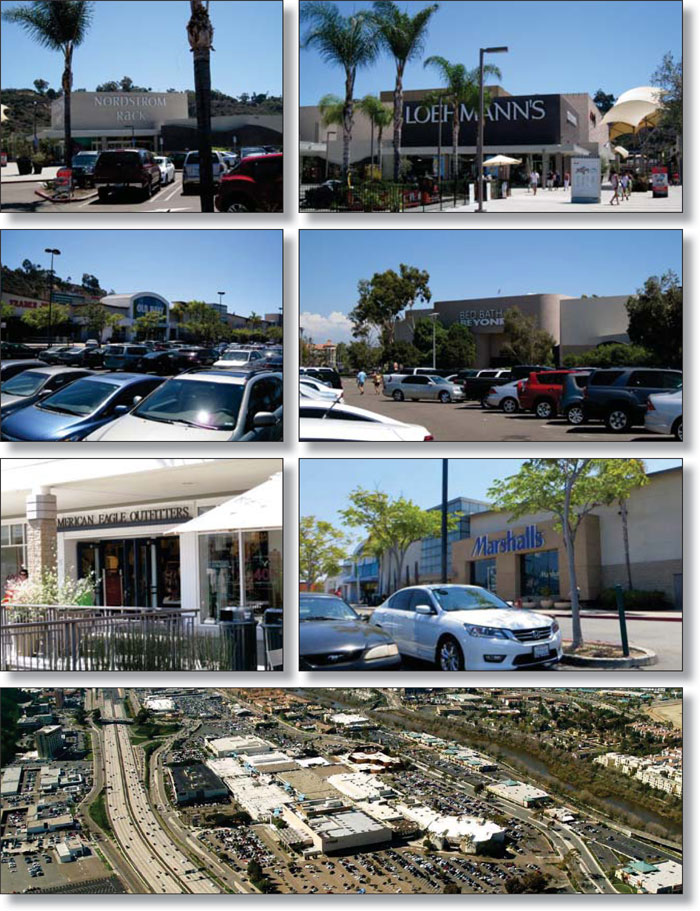
THE INFORMATION IN THIS STRUCTURAL AND COLLATERAL TERM SHEET IS NOT COMPLETE AND MAY BE AMENDED PRIOR TO THE TIME OF SALE. THIS TERM SHEET IS NOT AN OFFER TO SELL THESE SECURITIES AND IT IS NOT A SOLICITATION OF AN OFFER TO BUY THESE SECURITIES IN ANY JURISDICTION WHERE THE OFFER OR SALE IS NOT PERMITTED.
36
| WESTFIELD MISSION VALLEY |
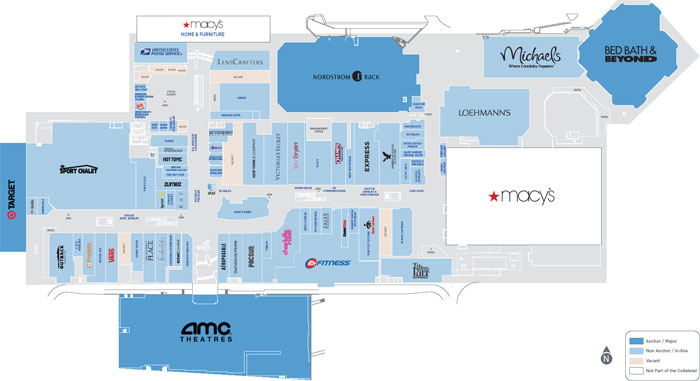
THE INFORMATION IN THIS STRUCTURAL AND COLLATERAL TERM SHEET IS NOT COMPLETE AND MAY BE AMENDED PRIOR TO THE TIME OF SALE. THIS TERM SHEET IS NOT AN OFFER TO SELL THESE SECURITIES AND IT IS NOT A SOLICITATION OF AN OFFER TO BUY THESE SECURITIES IN ANY JURISDICTION WHERE THE OFFER OR SALE IS NOT PERMITTED.
37
| WESTFIELD MISSION VALLEY |
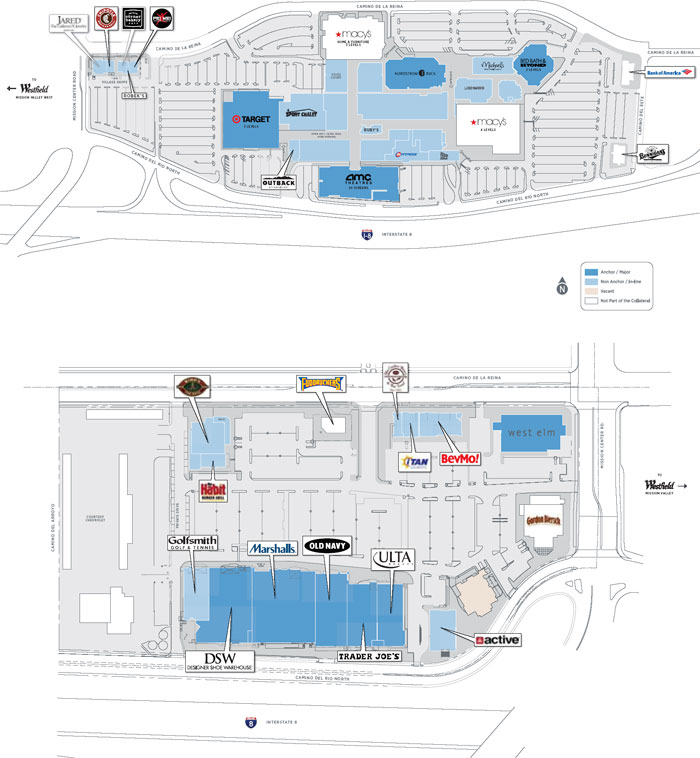
THE INFORMATION IN THIS STRUCTURAL AND COLLATERAL TERM SHEET IS NOT COMPLETE AND MAY BE AMENDED PRIOR TO THE TIME OF SALE. THIS TERM SHEET IS NOT AN OFFER TO SELL THESE SECURITIES AND IT IS NOT A SOLICITATION OF AN OFFER TO BUY THESE SECURITIES IN ANY JURISDICTION WHERE THE OFFER OR SALE IS NOT PERMITTED.
38
| WESTFIELD MISSION VALLEY |
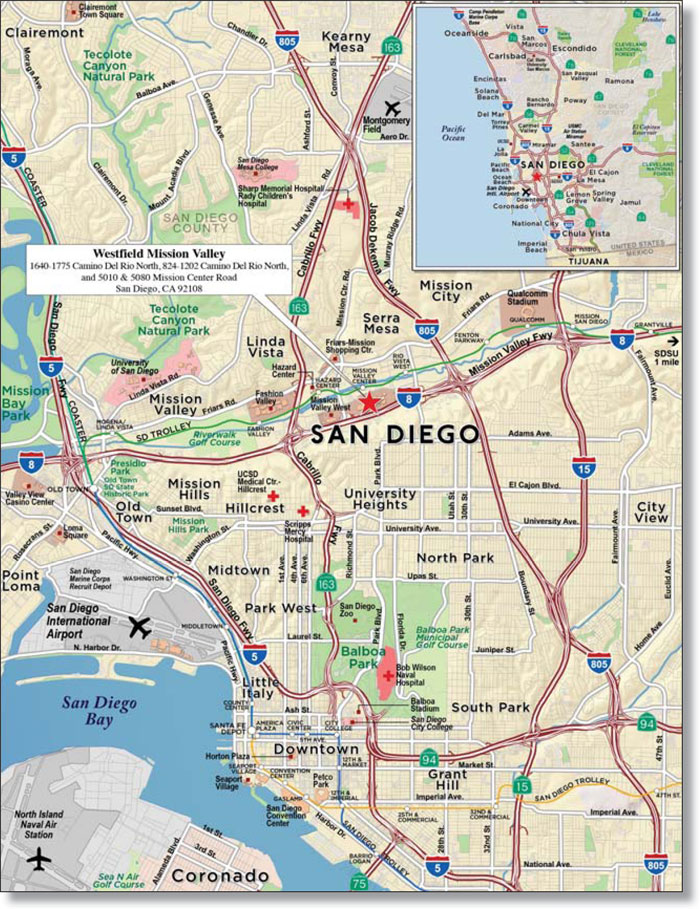
THE INFORMATION IN THIS STRUCTURAL AND COLLATERAL TERM SHEET IS NOT COMPLETE AND MAY BE AMENDED PRIOR TO THE TIME OF SALE. THIS TERM SHEET IS NOT AN OFFER TO SELL THESE SECURITIES AND IT IS NOT A SOLICITATION OF AN OFFER TO BUY THESE SECURITIES IN ANY JURISDICTION WHERE THE OFFER OR SALE IS NOT PERMITTED.
39
| No. 3 – Westfield Mission Valley | |||||||
| Loan Information | Property Information | ||||||
| Mortgage Loan Seller: | The Royal Bank of Scotland | Single Asset/Portfolio: | Single Asset | ||||
| Credit Assessment (Fitch/Moody’s/DBRS): | A/BBB/A3 | Property Type: | Retail | ||||
Original Principal Balance(1): | $55,000,000 | Specific Property Type: | Regional Mall | ||||
Cut-off Date Principal Balance(1): | $55,000,000 | Location: | San Diego, CA | ||||
| % of Initial Pool Balance: | 6.1% | Size: | 997,549 SF | ||||
| Loan Purpose: | Refinance | Cut-off Date Principal Balance Per SF: | $155.38 | ||||
| Borrower Name: | Mission Valley Shoppingtown LLC | Year Built/Renovated: | 1960/2008 | ||||
| Sponsor: | Westfield America, Inc.; Canada Pension Plan Investment Board | Title Vesting: | Fee | ||||
| Mortgage Rate: | 4.554% | Property Manager: | Self-managed | ||||
| Note Date: | September 10, 2013 | 3rd Most Recent Occupancy (As of)(3): | 99.1% (12/31/2010) | ||||
| Anticipated Repayment Date: | NAP | 2nd Most Recent Occupancy (As of)(3): | 98.1% (12/31/2011) | ||||
| Maturity Date: | October 1, 2023 | Most Recent Occupancy (As of)(3): | 97.6% (12/31/2012) | ||||
| IO Period: | 120 months | Current Occupancy (As of)(3): | 98.3% (8/13/2013) | ||||
| Loan Term (Original): | 120 months | ||||||
| Seasoning: | 1 month | Underwriting and Financial Information: | |||||
| Amortization Term (Original): | NAP | ||||||
| Loan Amortization Type: | Interest-only, Balloon | 3rd Most Recent NOI (As of): | $21,320,072 (12/31/2011) | ||||
| Interest Accrual Method: | Actual/360 | 2nd Most Recent NOI (As of): | $20,971,632 (12/31/2012) | ||||
| Call Protection: | L(25),D or GRTR 1% or YM(89),O(6) | Most Recent NOI (As of)(4): | $22,215,542 (TTM 7/31/2013) | ||||
| Lockbox Type: | Hard/Springing Cash Management | ||||||
Additional Debt(1): | Yes | U/W Revenues: | $31,522,806 | ||||
Additional Debt Type(1): | Pari Passu | U/W Expenses: | $8,362,511 | ||||
U/W NOI(4): | $23,160,295 | ||||||
| U/W NCF: | $22,304,479 | ||||||
| U/W NOI DSCR: | 3.24x | ||||||
Escrows and Reserves(2): | U/W NCF DSCR: | 3.12x | |||||
| U/W NOI Debt Yield: | 14.9% | ||||||
Type: | Initial | Monthly | Cap (If Any) | U/W NCF Debt Yield: | 14.4% | ||
| Taxes | $0 | Springing | NAP | As-Is Appraised Value: | $352,800,000 | ||
| Insurance | $0 | Springing | NAP | As-Is Appraisal Valuation Date: | August 13, 2013 | ||
| Replacement Reserves | $0 | Springing | $249,387 | Cut-off Date LTV Ratio: | 43.9% | ||
| TI/LC Reserve | $0 | Springing | $412,799 | LTV Ratio at Maturity or ARD: | 43.9% | ||
| (1) | The Westfield Mission Valley Loan Combination, totalling $155,000,000, is comprised of two pari passu notes (Notes A-1 and A-2). Note A-2 had an original principal balance of $55,000,000, has an outstanding principal balance as of the Cut-off Date of $55,000,000 and will be contributed to the WFRBS 2013-C17 Trust. Note A-1 had an original principal balance of $100,000,000 and was contributed to the WFRBS 2013-C16 Trust. All statistical information related to balances per square foot, loan-to-value ratios, debt service coverage ratios and debt yields are based on the Westfield Mission Valley Loan Combination. |
| (2) | See “Escrows” section. |
| (3) | Historical and current occupancy excludes temporary and seasonal tenants. As of August 13, 2013, the occupancy inclusive of these tenants was 99.8%. |
| (4) | See “Cash Flow Analysis” section. |
The Mortgage Loan. The Loan Combination (the “Westfield Mission Valley Loan Combination”) is evidenced by two pari passu notes (Note A-1 and Note A-2) that are secured by a first mortgage encumbering a regional mall located in San Diego, California (the “Westfield Mission Valley Property”). The Westfield Mission Valley Loan Combination was originated on September 10, 2013 by The Royal Bank of Scotland. The Westfield Mission Valley Loan Combination had an original principal balance of $155,000,000, has an outstanding principal balance as of the Cut-off Date of $155,000,000 and accrues interest at an interest rate of 4.554% per annum. The Westfield Mission Valley Loan Combination had an initial term of 120 months, has a remaining term of 119 months as of the Cut-off Date and requires interest-only payments through the term of the Westfield Mission Valley Loan Combination. The Westfield Mission Valley Loan Combination matures on October 1, 2023. See “Description of the Mortgage Pool - The Westfield Mission Valley Loan Combination” and “The Pooling and Servicing Agreement - Servicing of the Loan Combinations” in the Free Writing Prospectus.
THE INFORMATION IN THIS STRUCTURAL AND COLLATERAL TERM SHEET IS NOT COMPLETE AND MAY BE AMENDED PRIOR TO THE TIME OF SALE. THIS TERM SHEET IS NOT AN OFFER TO SELL THESE SECURITIES AND IT IS NOT A SOLICITATION OF AN OFFER TO BUY THESE SECURITIES IN ANY JURISDICTION WHERE THE OFFER OR SALE IS NOT PERMITTED.
40
| WESTFIELD MISSION VALLEY |
Note A-2, which will be contributed to the WFRBS 2013-C17 Trust, had an original principal balance of $55,000,000 and has an outstanding principal balance as of the Cut-off Date of $55,000,000. Note A-1, which had an original principal balance of $100,000,000 and represents the controlling interest in the Westfield Mission Valley Loan Combination, was contributed to the WFRBS 2013-C16 Trust.
Following the defeasance lockout period, the borrower has the right to either (i) prepay the Westfield Mission Valley Loan Combination in whole, but not in part, provided that the borrower pays the greater of a yield maintenance premium or a prepayment premium equal to 1.0% of the outstanding loan balance or (ii) defease the Westfield Mission Valley Loan Combination in whole, but not in part, on any due date before May 1, 2023. In addition, the Westfield Mission Valley Loan Combination is prepayable without penalty on or after May 1, 2023.
Sources and Uses
| Sources | Uses | |||||||
| Original loan amount | $155,000,000 | 100.0% | Loan payoff | $115,575,000 | 74.6% | |||
| Closing costs | 686,949 | 0.4 | ||||||
| Return of equity | 38,738,051 | 25.0 | ||||||
| Total Sources | $155,000,000 | 100.0% | Total Uses | $155,000,000 | 100.0% |
The Property. The Westfield Mission Valley Property is comprised of a 1,355,803 square foot regional mall and an adjacent 215,767 square foot retail center (Mission Valley West) located in San Diego, California, approximately five miles north of the San Diego central business district. The collateral for the Westfield Mission Valley Loan Combination consists of 997,549 square feet, which includes 781,782 square feet of collateral at the regional mall and 215,767 square feet of collateral at the adjacent retail center. The Westfield Mission Valley Property is anchored by Macy’s, Macy’s Home & Furniture and Macy’s Warehouse (none of which are part of the collateral), Target (on a ground lease), Bed, Bath & Beyond and American Multi-Cinema (on a ground lease). The Westfield Mission Valley Property was built in 1960 and underwent renovations in 2008. In-line stores include Sport Chalet, Courtesy Chevrolet, Marshall’s, Loehmanns, DSW Shoe Warehouse, 24 Hour Fitness, American Eagle, Old Navy, Victoria’s Secret, and Champs Sports, among others. The Westfield Mission Valley Property contains 5,248 parking spaces reflecting a parking ratio of 5.3 spaces per 1,000 square feet of net rentable area at the Westfield Mission Valley Property. For the trailing 12-month period ending June 30, 2013, tenants occupying less than 10,000 square feet had comparable in-line sales of $498 per square foot with an average occupancy cost of 12.9%. As of August 13, 2013, the Westfield Mission Valley Property was 99.8% occupied by approximately 124 tenants, including seasonal and temporary tenants, and 98.3% leased excluding seasonal and temporary tenants.
THE INFORMATION IN THIS STRUCTURAL AND COLLATERAL TERM SHEET IS NOT COMPLETE AND MAY BE AMENDED PRIOR TO THE TIME OF SALE. THIS TERM SHEET IS NOT AN OFFER TO SELL THESE SECURITIES AND IT IS NOT A SOLICITATION OF AN OFFER TO BUY THESE SECURITIES IN ANY JURISDICTION WHERE THE OFFER OR SALE IS NOT PERMITTED.
41
| WESTFIELD MISSION VALLEY |
The following table presents certain information relating to the tenancies at the Westfield Mission Valley Property:
Major Tenants
| Tenant Name | Credit Rating (Fitch/ Moody’s/ S&P)(1) | Tenant NRSF | % of NRSF | Annual U/W Base Rent PSF(2) | Annual U/W Base Rent(2) | % of Total Annual U/W Base Rent | Sales PSF(3) | Occupancy Cost(3)(4) | Lease Expiration Date | |
| Anchor Tenants – Not Part of Collateral | ||||||||||
| Macy’s | BBB/Baa3/BBB | 363,054 | ANCHOR OWNED - NOT PART OF THE COLLATERAL | |||||||
| Macy’s Home & Furniture | BBB/Baa3/BBB | 173,227 | ANCHOR OWNED - NOT PART OF THE COLLATERAL | |||||||
| Macy’s Warehouse | BBB/Baa3/BBB | 37,740 | ANCHOR OWNED - NOT PART OF THE COLLATERAL | |||||||
| Anchor Tenants – Collateral | ||||||||||
| Bed, Bath & Beyond | NR/NR/BBB+ | 77,925 | 7.8% | $14.00 | $1,090,950 | 5.2% | $339 | 4.1% | 1/31/2017 | |
American Multi-Cinema(5) | NR/NR/NR | 76,485 | 7.7% | $14.00 | $1,070,790 | 5.1% | $881,750(6) | 10.6% | 1/31/2026 | |
| Nordstrom Rack | A-/Baa1/A- | 52,876 | 5.3% | $19.63 | $1,038,068 | 5.0% | $816 | 2.7% | 2/28/2017 | |
Target(5) | A-/A2/A+ | 204,907 | 20.5% | $0.33 | $67,453 | 0.3% | $496 | 0.6% | 1/31/2022 | |
| Total Anchor Tenants – Collateral | 412,193 | 41.3% | $7.93 | $3,267,261 | 15.6% | |||||
| Major Tenants – Collateral | ||||||||||
| Sport Chalet | NR/NR/NR | 47,000 | 4.7% | $20.78 | $976,615 | 4.7% | $255 | 8.1% | 6/30/2018 | |
| West Elm | NR/NR/NR | 16,850 | 1.7% | $39.91 | $672,444 | 3.2% | $361 | 11.7% | 1/31/2018 | |
| DSW Shoe Warehouse | NR/NR/NR | 25,000 | 2.5% | $22.00 | $550,000 | 2.6% | $167 | 16.7% | 12/31/2014 | |
| Marshalls | NR/NR/NR | 32,000 | 3.2% | $17.00 | $544,000 | 2.6% | $479 | 5.5% | 1/31/2019 | |
| 24 Hour Fitness | NR/NR/NR | 22,083 | 2.2% | $23.10 | $510,117 | 2.4% | $0 | 0.0% | 9/18/2020 | |
| Loehmanns | NR/NR/NR | 25,030 | 2.5% | $18.85 | $471,816 | 2.2% | $182 | 13.8% | 8/31/2016 | |
| Michaels | NR/NR/NR | 21,300 | 2.1% | $18.15 | $386,595 | 1.8% | $244 | 10.6% | 12/31/2016 | |
| Old Navy | NR/NR/NR | 16,500 | 1.7% | $21.50 | $354,750 | 1.7% | $487 | 5.7% | 1/31/2014 | |
| Total Major Tenants – Collateral | 205,763 | 20.6% | $21.71 | $4,466,337 | 21.3% | |||||
| Non-Major Tenants – Collateral | 362,386 | 36.3% | $36.61 | $13,266,184 | 63.2% | |||||
| Occupied Collateral Total | 980,342 | 98.3% | $21.42 | $20,999,782 | 100.0% | |||||
| Vacant Space | 17,207 | 1.7% | ||||||||
| Collateral Total | 997,549 | 100.0% | ||||||||
(1) | Certain ratings are those of the parent company whether or not the parent guarantees the lease. |
| (2) | Underwritten base rent includes contractual rent steps through February 2014. |
| (3) | Sales and occupancy costs are for the trailing 12-month period ending June 30, 2013. |
| (4) | Occupancy costs include base rent, reimbursements and percentage rent, as applicable. |
| (5) | Target and American Multi-Cinema owns their own improvements and are lessees under ground leases with the borrower. |
| (6) | American Multi-Cinema operates 20 stadium-seating screens and reported sales of $881,750 per screen for the trailing 12-month period ending June 30, 2013. |
THE INFORMATION IN THIS STRUCTURAL AND COLLATERAL TERM SHEET IS NOT COMPLETE AND MAY BE AMENDED PRIOR TO THE TIME OF SALE. THIS TERM SHEET IS NOT AN OFFER TO SELL THESE SECURITIES AND IT IS NOT A SOLICITATION OF AN OFFER TO BUY THESE SECURITIES IN ANY JURISDICTION WHERE THE OFFER OR SALE IS NOT PERMITTED.
42
| WESTFIELD MISSION VALLEY |
The following table presents certain information relating to the historical sales and occupancy costs at the Westfield Mission Valley Property:
Historical Sales (PSF) and Occupancy Costs(1)
| Tenant Name | 2010 | 2011 | 2012 | TTM 6/30/2013 |
| Target | $391 | $415 | $491 | $496 |
| Bed, Bath & Beyond | $321 | $321 | $337 | $339 |
| American Multi-Cinema | NAV | NAV | $231 | $231 |
| Nordstrom Rack | $741 | $770 | $809 | $816 |
| Sports Chalet | $238 | $244 | $246 | $255 |
| Marshalls | $430 | $455 | $472 | $479 |
| Loehmanns | $251 | $231 | $195 | $182 |
| DSW Warehouse | NAV | $165 | $167 | |
Total In-line (<10,000 square feet)(2) | $457 | $472 | $489 | $498 |
| Occupancy Costs | NAV | 12.5% | 12.5% | 12.9% |
| (1) | Historical Sales (PSF) and Occupancy Costs are based on historical statements provided by the borrower. |
| (2) | Represents tenants occupying less than 10,000 square feet who reported sales for two years prior to each trailing 12-month reporting period. |
The following table presents certain information relating to the lease rollover schedule at the Westfield Mission Valley Property:
Lease Expiration Schedule(1)(2)
Year Ending December 31, | No. of Leases Expiring | Expiring NRSF | % of Total NRSF | Cumulative Expiring NRSF | Cumulative % of Total NRSF | Annual U/W Base Rent | Annual U/W Base Rent PSF(3) | |
| MTM | 1 | 6,086 | 0.6% | 6,086 | 0.6% | $216,768 | $35.62 | |
| 2013 | 1 | 1,138 | 0.1% | 7,224 | 0.7% | $47,227 | $41.50 | |
| 2014 | 16 | 54,549 | 5.5% | 61,773 | 6.2% | $1,828,086 | $33.51 | |
| 2015 | 22 | 68,843 | 6.9% | 130,616 | 13.1% | $2,469,495 | $35.87 | |
| 2016 | 15 | 74,215 | 7.4% | 204,831 | 20.5% | $2,099,321 | $28.29 | |
| 2017 | 14 | 156,788 | 15.7% | 361,619 | 36.3% | $3,270,146 | $20.86 | |
| 2018 | 15 | 103,089 | 10.3% | 464,708 | 46.6% | $3,719,587 | $36.08 | |
| 2019 | 6 | 69,056 | 6.9% | 533,764 | 53.5% | $1,280,727 | $18.55 | |
| 2020 | 4 | 33,933 | 3.4% | 567,697 | 56.9% | $874,892 | $25.78 | |
| 2021 | 2 | 12,570 | 1.3% | 580,267 | 58.2% | $299,113 | $23.80 | |
| 2022 | 5 | 213,470 | 21.4% | 793,737 | 79.6% | $545,039 | $2.55 | |
| 2023 | 9 | 52,880 | 5.3% | 846,617 | 84.9% | $2,105,280 | $39.81 | |
| Thereafter | 5 | 133,725 | 13.4% | 980,342 | 98.3% | $2,244,101 | $16.78 | |
| Vacant | 0 | 17,207 | 1.7% | 997,549 | 100.0% | $0 | $0.00 | |
| Total/Weighted Average | 115 | 997,549 | 100.0% | $20,999,782 | $21.42 |
| (1) | Information obtained from the underwritten rent roll. |
| (2) | Certain tenants may have lease termination options that are exercisable prior to the originally stated expiration date of the subject lease and that are not considered in the Lease Expiration Schedule. |
| (3) | Weighted Average Annual U/W Base Rent PSF excludes vacant space. |
The following table presents historical occupancy percentages at the Westfield Mission Valley Property:
Historical Occupancy
12/31/2010(1)(2) | 12/31/2011(1)(2) | 12/31/2012(1)(2) | 8/13/2013(2) | |||
| 99.1% | 98.1% | 97.6% | 98.3% |
(1) | Information obtained from the borrower. |
| (2) | Occupancy excludes temporary and seasonal tenants. |
THE INFORMATION IN THIS STRUCTURAL AND COLLATERAL TERM SHEET IS NOT COMPLETE AND MAY BE AMENDED PRIOR TO THE TIME OF SALE. THIS TERM SHEET IS NOT AN OFFER TO SELL THESE SECURITIES AND IT IS NOT A SOLICITATION OF AN OFFER TO BUY THESE SECURITIES IN ANY JURISDICTION WHERE THE OFFER OR SALE IS NOT PERMITTED.
43
| WESTFIELD MISSION VALLEY |
Operating History and Underwritten Net Cash Flow. The following table presents certain information relating to the historical operating performance and the Underwritten Net Cash Flow at the Westfield Mission Valley Property:
Cash Flow Analysis
| 2011 | 2012 | TTM 7/31/2013 | U/W | U/W $ per SF | |||||
| Base Rent | $19,357,899 | $18,880,616 | $19,296,721(1) | $20,727,792(1) | $20.78 | ||||
| Grossed Up Vacant Space | 0 | 0 | 0 | 1,293,490 | 1.30 | ||||
| Percentage Rent | 563,035 | 748,860 | 904,656 | 825,045(2) | 0.83 | ||||
| Total Reimbursables | 8,703,529 | 9,034,683 | 9,257,827 | 9,090,377 | 9.11 | ||||
| Other Income | 985,475 | 971,241 | 1,075,321 | 1,075,321 | 1.08 | ||||
| Less Vacancy & Credit Loss | 63,598 | (284,194) | (94,283) | (1,489,219)(3) | (1.49) | ||||
| Effective Gross Income | $29,673,536 | $29,351,206 | $30,440,242 | $31,522,806 | $31.60 | ||||
| Total Operating Expenses | $8,353,464 | $8,379,574 | $8,224,700 | $8,362,511 | $8.38 | ||||
| Net Operating Income | $21,320,072 | $20,971,632 | $22,215,542(1) | $23,160,295(1) | $23.22 | ||||
| TI/LC | 0 | 0 | 0 | 631,961 | 0.63 | ||||
| Capital Expenditures | 0 | 0 | 0 | 223,855 | 0.22 | ||||
| Net Cash Flow | $21,320,072 | $20,971,632 | $22,215,542 | $22,304,479 | $22.36 | ||||
| NOI DSCR | 2.98x | 2.93x | 3.10x | 3.24x | |||||
| NCF DSCR | 2.98x | 2.93x | 3.10x | 3.12x | |||||
| NOI DY | 13.8% | 13.5% | 14.3% | 14.9% | |||||
| NCF DY | 13.8% | 13.5% | 14.3% | 14.4% |
| (1) | The U/W Base Rent and NOI are higher than the Base Rent and NOI from the trailing 12-month period ending July 31, 2013 due to recently signed leases, lease renewals at higher rental rates and rent bumps taken through February 2014. |
| (2) | Percentage Rent includes $807,675 of percentage overage rent and $17,370 of percentage rent in lieu. |
| (3) | The underwritten economic vacancy is 4.7%. The Westfield Mission Valley Property was 99.8% physically occupied inclusive of seasonal and temporary tenants and 98.3% physically occupied exclusive of seasonal and temporary tenants as of August 13, 2013. |
Appraisal. As of the appraisal valuation date of August 13, 2013, the Westfield Mission Valley Property had an “as-is” appraised value of $352,800,000.
Environmental Matters. According to a Phase I environmental site assessment dated August 29, 2013, a former tenant at the Westfield Mission Valley Property removed gasoline and waste oil underground storage tanks, but groundwater contamination remains. A vapor barrier was installed under the current buildings during redevelopment of the Westfield Mission Valley Property. The assessment recommends tracking the progress of the responsible party in complying with a directive from regulatory authorities to submit and implement a corrective action plan, continuing periodic groundwater monitoring, and obtaining for review regulatory documents concerning all underground storage tanks that have been removed from the Westfield Mission Valley Property by tenants.
Market Overview and Competition. The Westfield Mission Valley Property is located less than five miles north of the San Diego central business district. The Westfield Mission Valley Property is located within San Diego County, which ranks third in population among California’s 58 counties and fourth as the most populous county in the nation. According to the appraisal, the San Diego visitor industry employs approximately 160,000 people. Additionally, over 70 telecommunications firms are currently in operation within San Diego county. The Westfield Mission Valley Property is located along Interstate 8, a major east/west freeway in San Diego County. The Westfield Mission Valley Property is also located a mile and a half west of Interstate 805 and less than three miles west of Interstate 15.
According to the appraisal, the Westfield Mission Valley Property has a primary trade area that encompasses a five-mile radius within the San Diego County retail market. The 2013 population and average household income for the trade area were reported at approximately 509,255 and $65,829, respectively. The Westfield Mission Valley Property is located within the San Diego County retail market and West San Diego Beach retail market, which as of the second quarter 2013, reported average asking rents of $28.58 and $33.56 per square foot, respectively, on a triple net basis. The San Diego County retail market and West San Diego Beach retail market also reported vacancy rates of 6.2% and 5.9%, respectively, as of the second quarter 2013.
THE INFORMATION IN THIS STRUCTURAL AND COLLATERAL TERM SHEET IS NOT COMPLETE AND MAY BE AMENDED PRIOR TO THE TIME OF SALE. THIS TERM SHEET IS NOT AN OFFER TO SELL THESE SECURITIES AND IT IS NOT A SOLICITATION OF AN OFFER TO BUY THESE SECURITIES IN ANY JURISDICTION WHERE THE OFFER OR SALE IS NOT PERMITTED.
44
| WESTFIELD MISSION VALLEY |
The following table presents certain information relating to some comparable retail center properties for the Westfield Mission Valley Property:
Competitive Set(1)
Westfield Mission Valley (Subject) | Fashion Valley Mall | Otay Ranch Center | Chula Vista Center | |
| Market | San Diego, CA | San Diego, CA | Chula Vista, CA | Chula Vista, CA |
| Distance from Subject | -- | 0.8 miles | 13.4 miles | 12.4 miles |
| Property Type | Regional Mall | Regional Mall | Regional Mall | Regional Mall |
| Year Built/Renovated | 1960/2008 | 1969/NAP | 2006/NAP | 1963/2004 |
| Anchors | Macy’s, Target, Bed, Bath & Beyond, American Multi- Cinema, Nordstrom Rack | Nordstrom, JC Penney, Macy’s, Neiman Marcus, Bloomingdales | Macy’s, REI, Barnes & Noble, AMC Theaters | Sears, JC Penney, Macy’s, Ultra Star Cinema, Burlington Coat Factory |
| Total GLA | 1,571,570 SF(2) | 1,700,000 SF | 703,000 SF | 883,000 SF |
| Total Occupancy | 98% | 100% | 90% | 98% |
| (1) | Information obtained from the borrower’s rent roll and the appraisal. |
| (2) | Total GLA and Total Occupancy are inclusive of non-collateral anchors. |
The Borrower. The borrower is Mission Valley Shoppingtown LLC, a Delaware limited liability company and a single purpose entity with two independent directors. Legal counsel to the borrower delivered a non-consolidation opinion in connection with the origination of the Westfield Mission Valley Loan Combination. Westfield America, Inc. is the guarantor of certain nonrecourse carveouts under the Westfield Mission Valley Loan Combination.
The Sponsor. The sponsor is 41.7% owned by Westfield America, Inc. (“Westfield”), a subsidiary of Westfield Group, LLC, 34.1% owned by Canada Pension Plan Investment Board (“CPPIB”) and 24.2% owned by various third party limited partners. Westfield is a publicly owned Australian REIT that has one of the world’s largest shopping center portfolios, with 100 centers in the United States, Australia, New Zealand and the United Kingdom. As of December 31, 2012, Westfield reported a net worth over $6.3 billion. CPPIB is a professional management organization headquartered in Toronto, Canada and is one of the 10 largest retirement funds in the world. As of June 30, 2013, CPPIB reported net assets of $188.9 billion.
Escrows. No monthly tax, replacement reserve or tenant improvement and leasing commission reserve escrow is required so long as no Reserve DSCR Trigger Period (as defined below) has occurred and is continuing under the Westfield Mission Valley Loan Combination. No monthly insurance escrow payments are required so long as (i) no Reserve DSCR Trigger Period has occurred and is continuing under the Westfield Mission Valley Loan Combination, or (ii) the insurance required to be maintained by the borrower is in effect under an acceptable blanket insurance policy and no event of default is ongoing. In the event that a Reserve DSCR Trigger Period has occurred, a monthly replacement reserve of $20,782 will commence (subject to a cap of $249,387). A monthly tenant improvement and leasing commission escrow of $73,400 will commence (subject to a cap of $412,799). During a Reserve DSCR Trigger Period, the borrower has the ability to post a letter of credit or have a credit-worthy entity enter into a guarantee in lieu of making any reserve payments.
Lockbox and Cash Management. The Westfield Mission Valley Loan Combination requires a lender-controlled lockbox account, which is already in place, and that the tenants deposit all revenues into such lockbox account. The loan documents also require that all rents received by the borrower or the property manager be deposited into the lockbox account within two business days after receipt. Prior to the occurrence of a Reserve DSCR Trigger Period all funds on deposit in the lockbox account are swept into the borrower’s operating account on a daily basis. During a Reserve DSCR Trigger Period, all funds on deposit in the lockbox account are swept on a daily basis to a cash management account under the control of the lender.
A “Reserve DSCR Trigger Period” will commence upon the debt service coverage ratio falling below 1.50x as of the end of any calendar quarter. A Reserve DSCR Trigger Period will end when an amortizing debt service coverage ratio of at least 1.50x has been achieved for two consecutive calendar quarters.
Property Management. The Westfield Mission Valley Property is managed by an affiliate of the borrower.
Assumption. The borrower has the right to transfer the Westfield Mission Valley Property, provided that no event of default has occurred and is continuing and certain other conditions are satisfied, including, but not limited to: (i) if requested by the lender, rating agency confirmation from Fitch, Moody’s and DBRS that the transfer will not result in a downgrade, withdrawal or qualification of the respective ratings assigned to the Series 2013-C17 Certificates; and (ii) the lender reasonably determines that the proposed transferee is majority owned and controlled by a Qualified Transferee (as defined below) and guarantor is acceptable to the lender in all respects.
A “Qualified Transferee” is (i) certain affiliates of the sponsor (ii) Canada Pension Plan Investment Board (iii) a bank, savings and loan association, investment bank, insurance company, trust company, commingled pension trust fund, commercial credit corporation, pension plan, pension fund or pension advisory firm, mutual fund, government entity or plan, sovereign wealth fund, university endowment, real estate company, real estate partnership investment fund, real estate investment trust, or an institution substantially similar to any of the foregoing, provided that in each case under this clause (iii) any such person or entity has: (a) total assets in excess of $600,000,000; (b) capital surplus or shareholder equity in excess of $250,000,000 (excluding the Westfield Mission Valley Property); (c) is regularly engaged in the business of owning interests in at least five regional malls totaling at least
THE INFORMATION IN THIS STRUCTURAL AND COLLATERAL TERM SHEET IS NOT COMPLETE AND MAY BE AMENDED PRIOR TO THE TIME OF SALE. THIS TERM SHEET IS NOT AN OFFER TO SELL THESE SECURITIES AND IT IS NOT A SOLICITATION OF AN OFFER TO BUY THESE SECURITIES IN ANY JURISDICTION WHERE THE OFFER OR SALE IS NOT PERMITTED.
45
| WESTFIELD MISSION VALLEY |
3,000,000 square feet; and (d) has not been the subject of a material governmental or regulatory investigation in the past seven years; (iv) any direct or indirect wholly owned subsidiary of one or more of the entities described in the clauses (i) through (iii) above; or (v) any other entity, provided that the lender has received written confirmation from Fitch, Moody’s and DBRS that the assumption to such entity will not, in and of itself, result in a downgrade, qualification or withdrawal of the then-current ratings assigned to any class of Series 2013-C17 Certificates and similar confirmations with respect to the ratings of any securities backed by Note A-2 of the Westfield Mission Valley Loan Combination.
Partial Release. The borrower may obtain a release of certain immaterial or non-income producing portions of the Westfield Mission Valley Property from the lien of the Westfield Mission Valley Loan Combination upon the satisfaction of certain conditions, including but not limited to: (i) no event of default has occurred and is continuing; and (ii) the borrower has certified to the lender that the release of the parcel will not materially and adversely affect the use, operations or economic value of the remaining improvements.
Real Estate Substitution. Not permitted.
Subordinate and Mezzanine Indebtedness. Not permitted.
Ground Lease. The borrower has a long-term, financeable leasehold interest in certain non-income producing common areas currently owned in fee by Macy’s.
Terrorism Insurance. The loan documents require that the “all risk” insurance policy required to be maintained by the borrower provides coverage for damage from terrorism in an amount equal to the full replacement cost of the Westfield Mission Valley Property as well as business interruption insurance covering no less than the 18-month period following the occurrence of a casualty event, combined with the extended period of indemnity, shall be no less than 24 months or the actual period of restoration plus 365 days, whichever is shorter.
THE INFORMATION IN THIS STRUCTURAL AND COLLATERAL TERM SHEET IS NOT COMPLETE AND MAY BE AMENDED PRIOR TO THE TIME OF SALE. THIS TERM SHEET IS NOT AN OFFER TO SELL THESE SECURITIES AND IT IS NOT A SOLICITATION OF AN OFFER TO BUY THESE SECURITIES IN ANY JURISDICTION WHERE THE OFFER OR SALE IS NOT PERMITTED.
46
(THIS PAGE INTENTIONALLY LEFT BLANK)
47
(THIS PAGE INTENTIONALLY LEFT BLANK)
48
| ONE BRIDGE STREET |

THE INFORMATION IN THIS STRUCTURAL AND COLLATERAL TERM SHEET IS NOT COMPLETE AND MAY BE AMENDED PRIOR TO THE TIME OF SALE. THIS TERM SHEET IS NOT AN OFFER TO SELL THESE SECURITIES AND IT IS NOT A SOLICITATION OF AN OFFER TO BUY THESE SECURITIES IN ANY JURISDICTION WHERE THE OFFER OR SALE IS NOT PERMITTED.
49
| ONE BRIDGE STREET |
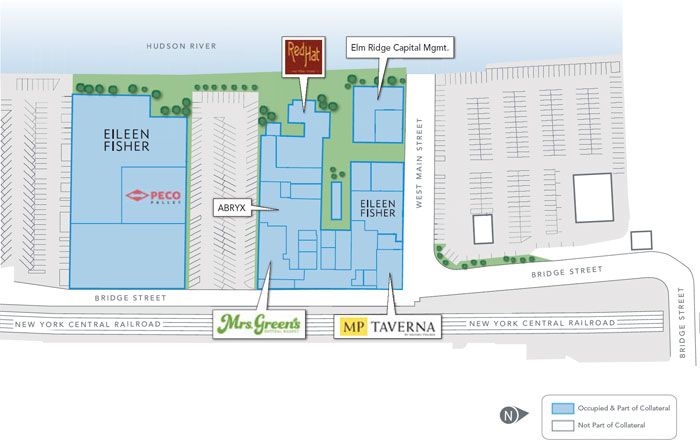
THE INFORMATION IN THIS STRUCTURAL AND COLLATERAL TERM SHEET IS NOT COMPLETE AND MAY BE AMENDED PRIOR TO THE TIME OF SALE. THIS TERM SHEET IS NOT AN OFFER TO SELL THESE SECURITIES AND IT IS NOT A SOLICITATION OF AN OFFER TO BUY THESE SECURITIES IN ANY JURISDICTION WHERE THE OFFER OR SALE IS NOT PERMITTED.
50
| ONE BRIDGE STREET |
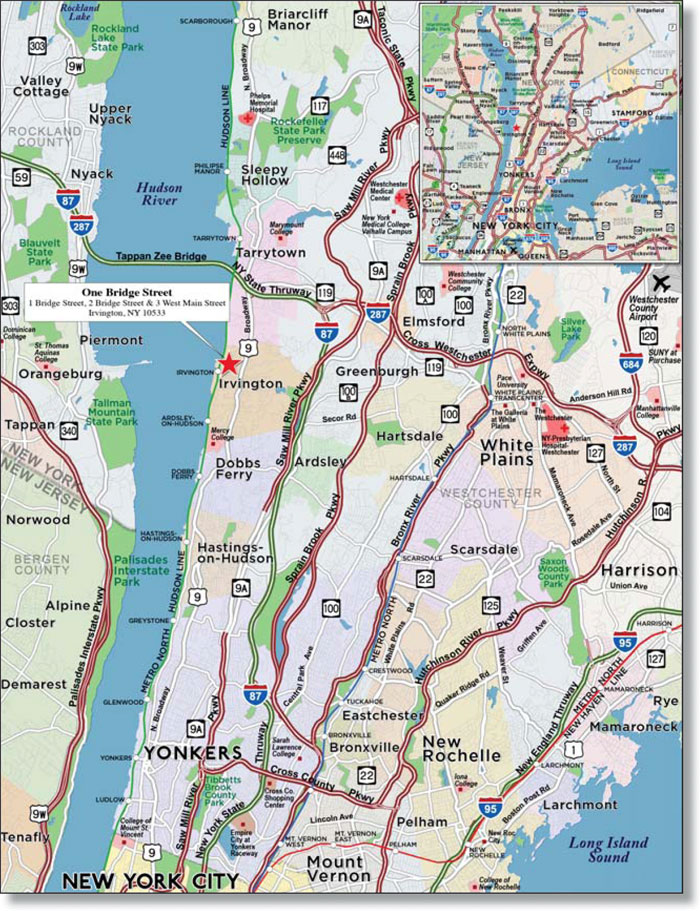
THE INFORMATION IN THIS STRUCTURAL AND COLLATERAL TERM SHEET IS NOT COMPLETE AND MAY BE AMENDED PRIOR TO THE TIME OF SALE. THIS TERM SHEET IS NOT AN OFFER TO SELL THESE SECURITIES AND IT IS NOT A SOLICITATION OF AN OFFER TO BUY THESE SECURITIES IN ANY JURISDICTION WHERE THE OFFER OR SALE IS NOT PERMITTED.
51
| No. 4 – One Bridge Street | |||||||
| Loan Information | Property Information | ||||||
| Mortgage Loan Seller: | The Royal Bank of Scotland | Single Asset/Portfolio: | Single Asset | ||||
Credit Assessment (Fitch/Moody’s/DBRS): | NR/NR/NR | Property Type: | Office | ||||
| Original Principal Balance: | $52,000,000 | Specific Property Type: | Suburban | ||||
| Cut-off Date Principal Balance: | $52,000,000 | Location: | Irvington, NY | ||||
| % of Initial Pool Balance: | 5.7% | Size: | 195,402 SF | ||||
| Loan Purpose: | Refinance | Cut-off Date Principal Balance Per SF: | $266.12 | ||||
| Borrower Name: | Bridge Street Commercial LLC | Year Built/Renovated(2): | 1912/2005 | ||||
| Sponsors: | William J. Thompson; Matthew Callahan; Jeffrey P. Reich | Title Vesting: | Fee | ||||
| Mortgage Rate: | 5.248% | Property Manager: | Cushman and Wakefield, Inc. | ||||
| Note Date: | October 11, 2013 | 3rd Most Recent Occupancy (As of): | 98.9% (12/31/2010) | ||||
| Anticipated Repayment Date: | NAP | 2nd Most Recent Occupancy (As of): | 99.6% (12/31/2011) | ||||
| Maturity Date: | November 1, 2023 | Most Recent Occupancy (As of): | 98.8% (12/31/2012) | ||||
| IO Period: | None | Current Occupancy (As of): | 98.2% (9/30/2013) | ||||
| Loan Term (Original): | 120 months | ||||||
| Seasoning: | 0 months | Underwriting and Financial Information(3): | |||||
| Amortization Term (Original): | 360 months | ||||||
| Loan Amortization Type: | Amortizing Balloon | 3rd Most Recent NOI (As of): | $5,029,431 (12/31/2011) | ||||
| Interest Accrual Method: | Actual/360 | 2nd Most Recent NOI (As of): | $4,681,192 (12/31/2012) | ||||
| Call Protection: | L(24),D(88),O(8) | Most Recent NOI (As of): | $4,063,455 (TTM 8/31/2013) | ||||
| Lockbox Type: | Hard/Springing Cash Management | ||||||
| Additional Debt: | None | ||||||
| Additional Debt Type: | NAP | ||||||
| U/W Revenues: | $7,443,995 | ||||||
| U/W Expenses: | $2,675,635 | ||||||
| U/W NOI: | $4,768,361 | ||||||
Escrows and Reserves(1): | U/W NCF: | $4,523,194 | |||||
| U/W NOI DSCR: | 1.38x | ||||||
Type: | Initial | Monthly | Cap (If Any) | U/W NCF DSCR: | 1.31x | ||
| Taxes | $80,980 | $82,397 | NAP | U/W NOI Debt Yield: | 9.2% | ||
| Insurance | $111,394 | $11,530 | NAP | U/W NCF Debt Yield: | 8.7% | ||
| Replacement Reserves | $4,071 | $4,071 | $0 | As-Is Appraised Value: | $70,000,000 | ||
| TI/LC Reserve | $16,284 | $16,284 | $395,000 | As-Is Appraisal Valuation Date: | September 13, 2013 | ||
| Deferred Maintenance | $4,875 | NAP | NAP | Cut-off Date LTV Ratio: | 74.3% | ||
| Eileen Fisher Reserve | $0 | Springing | $1,600,000 | LTV Ratio at Maturity or ARD: | 61.6% | ||
| (1) | See “Escrows” section. |
| (2) | Two of the buildings were built in 1912 and renovated in 2005 and the third building was built in 2005. |
| (3) | See “Cash Flow Analysis” section. |
The Mortgage Loan. The mortgage loan (the “One Bridge Street Mortgage Loan”) is evidenced by a single promissory note that is secured by a first mortgage encumbering three adjacent office buildings, located in Irvington, New York (the “One Bridge Street Property”). The One Bridge Street Mortgage Loan was originated on October 11, 2013 by The Royal Bank of Scotland. The One Bridge Street Mortgage Loan had an original principal balance of $52,000,000, has an outstanding principal balance as of the Cut-off Date of $52,000,000 and accrues interest at an interest rate of 5.248% per annum. The One Bridge Street Mortgage Loan had an initial term of 120 months, has a remaining term of 120 months as of the Cut-off Date and requires payments of principal and interest based on a 30-year amortization schedule. The One Bridge Street Mortgage Loan matures on November 1, 2023.
Following the lockout period, the borrower has the right to defease the One Bridge Street Mortgage Loan in whole, but not in part, on any due date before April 1, 2023. In addition, the One Bridge Street Mortgage Loan is prepayable without penalty on or after April 1, 2023.
THE INFORMATION IN THIS STRUCTURAL AND COLLATERAL TERM SHEET IS NOT COMPLETE AND MAY BE AMENDED PRIOR TO THE TIME OF SALE. THIS TERM SHEET IS NOT AN OFFER TO SELL THESE SECURITIES AND IT IS NOT A SOLICITATION OF AN OFFER TO BUY THESE SECURITIES IN ANY JURISDICTION WHERE THE OFFER OR SALE IS NOT PERMITTED.
52
| ONE BRIDGE STREET |
Sources and Uses
| Sources | Uses | |||||||
| Original loan amount | $52,000,000 | 100.0% | Loan payoff | $34,087,772 | 65.6% | |||
| Reserves | 217,604 | 0.4 | ||||||
| Closing costs | 920,537 | 1.8 | ||||||
| Return of equity | 16,774,087 | 32.2 | ||||||
| Total Sources | $52,000,000 | 100.0% | Total Uses | $52,000,000 | 100.0% |
The Property. The One Bridge Street Property consists of three low-rise office buildings located in Irvington, New York along the Hudson River. The One Bridge Street Property consists of a one-story building, a two-story building and a three-story building. Two of the buildings were originally built in 1912, and renovated in 2003, and the third building was built in 2005. The One Bridge Street Property was built on 9.1 acres and contains 195,402 rentable square feet. The One Bridge Street Property contains 487 parking spaces reflecting a parking ratio of 2.5 spaces per 1,000 square feet. Since 1995, the One Bridge Street Property has undergone $16.0 million of renovations and the largest tenant, Eileen Fisher, Inc. has invested over $7.0 million to upgrade their space between 2010 and 2013. As of September 30, 2013, the One Bridge Street Property was 98.2% leased to 50 different tenants, including traditional office, financial services, restaurants and retail companies.
The following table presents certain information relating to the tenancies at the One Bridge Street Property:
Major Tenants
| Tenant Name | Credit Rating (Fitch/ Moody’s/ S&P) | Tenant NRSF | % of NRSF | Annual U/W Base Rent PSF | Annual U/W Base Rent | % of Total Annual U/W Base Rent | Lease Expiration Date | |
| Major Tenants | ||||||||
| Eileen Fisher, Inc. | NR/NR/NR | 43,038 | 22.0% | $28.72 | $1,236,266 | 21.2% | 12/31/2022 | |
| Elm Ridge Capital Management, LLC | NR/NR/NR | 17,890 | 9.2% | $43.78 | $783,196 | 13.5% | 3/31/2018 | |
| Lockard & Wechsler, Inc. | NR/NR/NR | 17,230 | 8.8% | $31.81 | $548,076 | 9.4% | 8/31/2020 | |
| Mrs. Greens Management Corp. | NR/NR/NR | 11,555 | 5.9% | $24.60 | $284,253 | 4.9% | 6/30/2024 | |
| Orthocon, Inc. | NR/NR/NR | 8,650 | 4.4% | $30.00 | $259,500 | 4.5% | 9/15/2014 | |
| PECO Pallet, Inc. | NR/NR/NR | 12,100 | 6.2% | $20.13 | $243,612 | 4.2% | 11/30/2022 | |
| Total Major Tenants | 110,463 | 56.5% | $30.37 | $3,354,903 | 57.7% | |||
| Non-Major Tenants | 81,394 | 41.7% | $30.26 | $2,462,899 | 42.3% | |||
| Occupied Collateral | 191,857 | 98.2% | $30.32 | $5,817,802 | 100.0% | |||
| Vacant Space | 3,545 | 1.8% | ||||||
| Collateral Total | 195,402 | 100.0% | ||||||
THE INFORMATION IN THIS STRUCTURAL AND COLLATERAL TERM SHEET IS NOT COMPLETE AND MAY BE AMENDED PRIOR TO THE TIME OF SALE. THIS TERM SHEET IS NOT AN OFFER TO SELL THESE SECURITIES AND IT IS NOT A SOLICITATION OF AN OFFER TO BUY THESE SECURITIES IN ANY JURISDICTION WHERE THE OFFER OR SALE IS NOT PERMITTED.
53
| ONE BRIDGE STREET |
The following tables present certain information relating to the lease rollover schedule at the One Bridge Street Property:
Lease Expiration Schedule(1)(2)
Year Ending December 31, | No. of Leases Expiring | Expiring NRSF | % of Total NRSF | Cumulative of Total NRSF | Cumulative % of Total NRSF | Annual U/W Base Rent | Annual U/W Base Rent PSF(3) | |
| MTM | 5 | 1,265 | 0.6% | 1,265 | 0.6% | $40,272 | $31.84 | |
| 2013 | 5 | 5,721 | 2.9% | 6,986 | 3.6% | $157,416 | $27.52 | |
| 2014 | 12 | 16,626 | 8.5% | 23,612 | 12.1% | $503,907 | $30.31 | |
| 2015 | 5 | 13,344 | 6.8% | 36,956 | 18.9% | $356,842 | $26.74 | |
| 2016 | 7 | 10,583 | 5.4% | 47,539 | 24.3% | $366,031 | $34.59 | |
| 2017 | 3 | 9,938 | 5.1% | 57,477 | 29.4% | $358,478 | $36.07 | |
| 2018 | 8 | 25,255 | 12.9% | 82,732 | 42.3% | $1,016,937 | $40.27 | |
| 2019 | 1 | 1,217 | 0.6% | 83,949 | 43.0% | $39,069 | $32.10 | |
| 2020 | 8 | 31,260 | 16.0% | 115,209 | 59.0% | $979,649 | $31.34 | |
| 2021 | 0 | 0 | 0.0% | 115,209 | 59.0% | $0 | $0.00 | |
| 2022 | 5 | 60,313 | 30.9% | 175,522 | 89.8% | $1,583,301 | $26.25 | |
| 2023 | 0 | 0 | 0.0% | 175,522 | 89.8% | $0 | $0.00 | |
| Thereafter | 3 | 16,335 | 8.4% | 191,857 | 98.2% | $415,900 | $25.46 | |
| Vacant | 0 | 3,545 | 1.8% | 195,402 | 100.0% | $0 | $0.00 | |
| Total/Weighted Average | 62 | 195,402 | 100.0% | $5,817,802 | $30.32 |
| (1) | Information obtained from the underwritten rent roll. |
| (2) | Certain tenants may have lease termination options that are exercisable prior to the stated expiration date of the subject lease and that are not considered in the Lease Expiration Schedule. |
| (3) | Weighted Average Annual U/W Base Rent PSF excludes vacant space. |
The following table presents historical occupancy percentages at the One Bridge Street Property:
Historical Occupancy
12/31/2010(1) | 12/31/2011(1) | 12/31/2012(1) | 9/30/2013 | |||
| 98.9% | 99.6% | 98.8% | 98.2% |
(1) | Information obtained from the borrower. |
Operating History and Underwritten Net Cash Flow. The following table presents certain information relating to the historical operating performance and the Underwritten Net Cash Flow at the One Bridge Street Property:
Cash Flow Analysis
| 2011 | 2012 | TTM 8/31/2013 | U/W | U/W $ per SF | ||||||
| Base Rent | $5,581,892 | $5,341,065 | $5,422,969 | $5,817,802 | $29.77 | |||||
| Grossed Up Vacant Space | 0 | 0 | 0 | 118,900 | 0.61 | |||||
| Total Reimbursables | 1,687,087 | 1,628,532 | 1,749,189 | 1,780,669 | 9.11 | |||||
| Other Income | 183,919 | 212,904 | 817,147(1) | 112,493 | 0.58 | |||||
| Less Vacancy & Credit Loss | 0 | 0 | 0 | (385,869)(2) | (1.97) | |||||
| Effective Gross Income | $7,452,898 | $7,182,501 | $7,989,305 | $7,443,995 | $38.10 | |||||
| Total Operating Expenses | $2,423,467 | $2,501,309 | $3,925,850(3) | $2,675,635 | $13.69 | |||||
| Net Operating Income | $5,029,431 | $4,681,192 | $4,063,455 | $4,768,361 | $24.40 | |||||
| TI/LC | 0 | 0 | 0 | 196,316 | 1.00 | |||||
| Capital Expenditures | 0 | 0 | 0 | 48,851 | 0.25 | |||||
| Net Cash Flow | $5,029,431 | $4,681,192 | $4,063,455 | $4,523,194 | $23.15 | |||||
| NOI DSCR | 1.46x | 1.36x | 1.18x | 1.38x | ||||||
| NCF DSCR | 1.46x | 1.36x | 1.18x | 1.31x | ||||||
| NOI DY | 9.7% | 9.0% | 7.8% | 9.2% | ||||||
| NCF DY | 9.7% | 9.0% | 7.8% | 8.7% |
| (1) | The TTM 8/31/2013 Other Income is higher than the U/W Other Income due to approximately $781,482 of non-recurring income related to sponsor renovations to the Weleda and PECO Pallet tenants’ space reimbursed by the tenants. |
| (2) | The underwritten economic vacancy is 5.0%. The One Bridge Street Property was 98.2% physically occupied as of September 30, 2013. |
| (3) | The TTM Total Operating Expenses is higher than the U/W Total Operating Expense due to approximately $1,197,301 of net non-recurring expenses related to the cleanup and repairs of damages related to Hurricane Sandy in October 2012. |
Appraisal. As of the appraisal valuation date of September 13, 2013, the One Bridge Street Property had an “as-is” appraised value of $70,000,000.
Environmental Matters. According to the Phase I environmental site assessment dated October 10, 2013, there was no evidence of any recognized environmental conditions.
THE INFORMATION IN THIS STRUCTURAL AND COLLATERAL TERM SHEET IS NOT COMPLETE AND MAY BE AMENDED PRIOR TO THE TIME OF SALE. THIS TERM SHEET IS NOT AN OFFER TO SELL THESE SECURITIES AND IT IS NOT A SOLICITATION OF AN OFFER TO BUY THESE SECURITIES IN ANY JURISDICTION WHERE THE OFFER OR SALE IS NOT PERMITTED.
54
| ONE BRIDGE STREET |
Market Overview and Competition. The One Bridge Street Property is located in Irvington, Westchester County, New York, with frontage on the Hudson River, approximately 20 miles north of New York City. The One Bridge Street Property is situated adjacent to the Metro-North commuter railroad, “Irvington Station”, which serves Irvington via the Hudson line. According to the appraisal, the estimated 2013 population and average household income in Westchester County, New York are 965,400 and $127,445, respectively. The average unemployment rate in Westchester County in 2012 was 7.1% compared to the State of New York, which had an unemployment rate of 8.3%.
According to a third party market research report, the Westchester County office market contains approximately 28.9 million square feet of office space with an overall vacancy rate of 18.4%, as of the second quarter 2013. The One Bridge Street Property is located in the Central submarket, which contains approximately 6.1 million square feet of office space with an overall class A vacancy rate of 15.1%, as of the second quarter 2013. The Westchester County overall market rent was $29.08 per square foot and the appraiser concluded average rent for the competitive peer submarket set to be $38.35 to $40.75 per square foot, on a triple net basis.
Competitive Set(1)
One Bridge Street (Subject) | 120 White Plains Road | 81 Main Street | 10 Bank Street | 1 N. Lexington Ave | 777 W. Putnam Ave | 660 Steamboat Rd | |
| Market | Irvington, NY | White Plains, NY | White Plains, NY | White Plains, NY | White Plains, NY | Greenwich, CT | Greenwich, CT |
| Distance from Subject | -- | 2.6 miles | 7.8 miles | 8.4 miles | 8.8 miles | 17.3 miles | 18.5 miles |
| Property Type | Office | Office | Office | Office | Office | Office | Office |
| Year Built/Renovated | 1912/2005 | 1984/NAP | 1984/NAP | 1989/NAP | 1985/NAP | 1979/NAP | 1971/NAP |
| Total GLA | 195,402 SF | 205,000 SF | 125,000 SF | 249,015 SF | 530,519 SF | 130,000 SF | 44,500 SF |
| Total Occupancy | 98% | 97% | 92% | 68% | 81% | 80% | 90% |
| (1) | Information obtained from the appraisal dated September 13, 2013. |
The Borrower. The borrower is Bridge Street Commercial LLC, a Delaware limited liability company and a single purpose entity with a managing member that has two independent directors. Legal counsel to the borrower delivered a non-consolidation opinion in connection with the origination of the One Bridge Street Mortgage Loan. William J. Thompson and Jeffrey P. Reich are the guarantors of certain nonrecourse carveouts under the One Bridge Street Mortgage Loan.
The Sponsor. The sponsor for the One Bridge Street Mortgage Loan is an entity ultimately controlled by William J. Thompson (37%), Jeffrey P. Reich (37%) and Matthew Callahan (26%). Mr. Thompson co-owns Nobel Van & Storage and Mr. Reich manages Bridge Street Capital Management, a diversified investment firm. Mr. Callahan has over 20 years of experience owning, financing and developing commercial and residential real estate in Connecticut, New York and Texas. Mr. Callahan is the Managing Principal and founder of Ash Creek Capital Management, an investment fund engaged in private equity and fixed income investments located in Madison, Connecticut. Mr. Callahan is also the Managing Partner and CFO for Bridge Street Capital Management.
Escrows. The loan documents provide for upfront escrows at closing in the amount of $80,980 for real estate taxes, $111,394 for insurance, $4,071 for replacement reserves, $4,875 for deferred maintenance and $16,284 for tenant improvement and leasing commissions. The loan documents also provide for ongoing monthly escrows in the amount of $82,397 for real estate taxes, $11,530 for insurance, $4,071 for replacement reserves and $16,284 for tenant improvements and leasing commissions, up to a cap of $395,000 for tenant improvements and leasing commissions.
The loan documents require a special rollover reserve to be calculated on multiple payment dates and consequently, various amounts to be funded by the borrower upon the occurrence of any of the following: (i) on December 22, 2017, provided either (a) a Major Lease (as defined below) is not renewed, or (b) a Major Lease is renewed for less than the previously occupied space; (ii) any Major Lease is surrendered or terminated prior to its then current expiration date; or (iii) the occurrence of a default by any tenant under a Major Lease. The loan documents require a cap, which shall be reduced on a pro rata basis in the event that a portion of the space is demised under the Major Lease is re-tenanted.
A “Major Lease” is defined as the Eileen Fisher, Inc. lease or any other lease which demises more than 21,500 square feet of the improvements.
Lockbox and Cash Management. The One Bridge Street Mortgage Loan requires a lender-controlled lockbox account, which is already in place, and that the borrower direct tenants to pay their rents directly to such lockbox account. The loan documents also require that all rents received by the borrower or the property manager be deposited into the lockbox account within two business days after receipt. Prior to the occurrence of a Cash Management Period (as defined below) all funds on deposit in the lockbox account are swept into the borrower’s operating account on a daily basis. During a Cash Management Period, all funds on deposit in the lockbox account are swept on a daily basis to a cash management account under the control of the lender.
A “Cash Management Period” will commence upon either of the following events: (i) the occurrence of an event of default or (ii) the amortizing debt service coverage ratio falling below 1.10x as of the end of any calendar quarter. A Cash Management Period will end with respect to the matters described in clause (i) above, when such event of default has been cured, and with respect to the matters described in clause (ii) above, when (a) an amortizing debt service coverage ratio of at least 1.10x has been achieved for two consecutive calendar quarters or (b) the borrower deposits additional collateral to the lender to achieve a debt service coverage ratio of at least 1.10x.
THE INFORMATION IN THIS STRUCTURAL AND COLLATERAL TERM SHEET IS NOT COMPLETE AND MAY BE AMENDED PRIOR TO THE TIME OF SALE. THIS TERM SHEET IS NOT AN OFFER TO SELL THESE SECURITIES AND IT IS NOT A SOLICITATION OF AN OFFER TO BUY THESE SECURITIES IN ANY JURISDICTION WHERE THE OFFER OR SALE IS NOT PERMITTED.
55
| ONE BRIDGE STREET |
Property Management. The One Bridge Street Property is managed by Cushman and Wakefield, Inc.
Assumption. The borrower has the right to transfer the One Bridge Street Property, provided that no event of default has occurred and is continuing and certain other conditions are satisfied, including: (i) receipt of a rating agency confirmation from Fitch, Moody’s and DBRS that the transfer will not result in a downgrade, withdrawal or qualification of the respective ratings assigned to the Series 2013-C17 Certificates; and (ii) the lender reasonably determines that the proposed transferee and guarantor satisfy the lender’s credit review and underwriting standards, taking into consideration transferee experience, financial strength and general business standing.
Partial Release. Not permitted.
Real Estate Substitution. Not Permitted.
Subordinate and Mezzanine Indebtedness. None.
Ground Lease. None.
Terrorism Insurance. The loan documents require that the “all risk” insurance policy required to be maintained by the borrower provides coverage for damage from terrorism in an amount equal to the full replacement cost of the One Bridge Street Property as well as business interruption insurance covering no less than the 18-month period following the occurrence of a casualty event, together with a six-month extended period of indemnity.
Windstorm/Flood Insurance. The loan documents require windstorm insurance covering the full replacement cost of the One Bridge Street Property during the loan term. Additionally, flood insurance is required through the National Flood Insurance Program since part of the One Bridge Street Property is located in a Flood Zone “A” or “V”. At the time of closing, the One Bridge Street Property had insurance coverage for windstorm and flood.
THE INFORMATION IN THIS STRUCTURAL AND COLLATERAL TERM SHEET IS NOT COMPLETE AND MAY BE AMENDED PRIOR TO THE TIME OF SALE. THIS TERM SHEET IS NOT AN OFFER TO SELL THESE SECURITIES AND IT IS NOT A SOLICITATION OF AN OFFER TO BUY THESE SECURITIES IN ANY JURISDICTION WHERE THE OFFER OR SALE IS NOT PERMITTED.
56
(THIS PAGE INTENTIONALLY LEFT BLANK)
57
OLYMPIA DEVELOPMENT PORTFOLIO I |
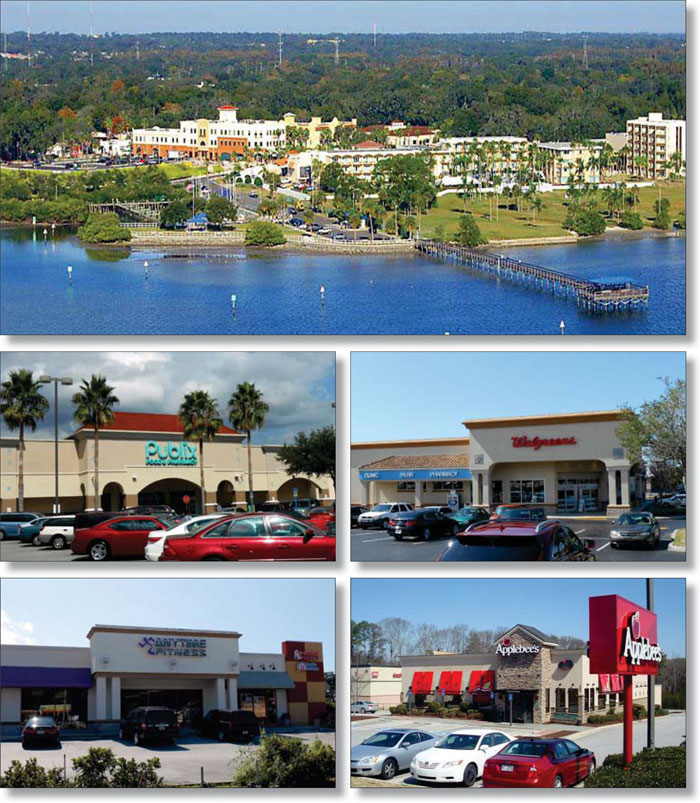
THE INFORMATION IN THIS STRUCTURAL AND COLLATERAL TERM SHEET IS NOT COMPLETE AND MAY BE AMENDED PRIOR TO THE TIME OF SALE. THIS TERM SHEET IS NOT AN OFFER TO SELL THESE SECURITIES AND IT IS NOT A SOLICITATION OF AN OFFER TO BUY THESE SECURITIES IN ANY JURISDICTION WHERE THE OFFER OR SALE IS NOT PERMITTED.
58
OLYMPIA DEVELOPMENT PORTFOLIO I |
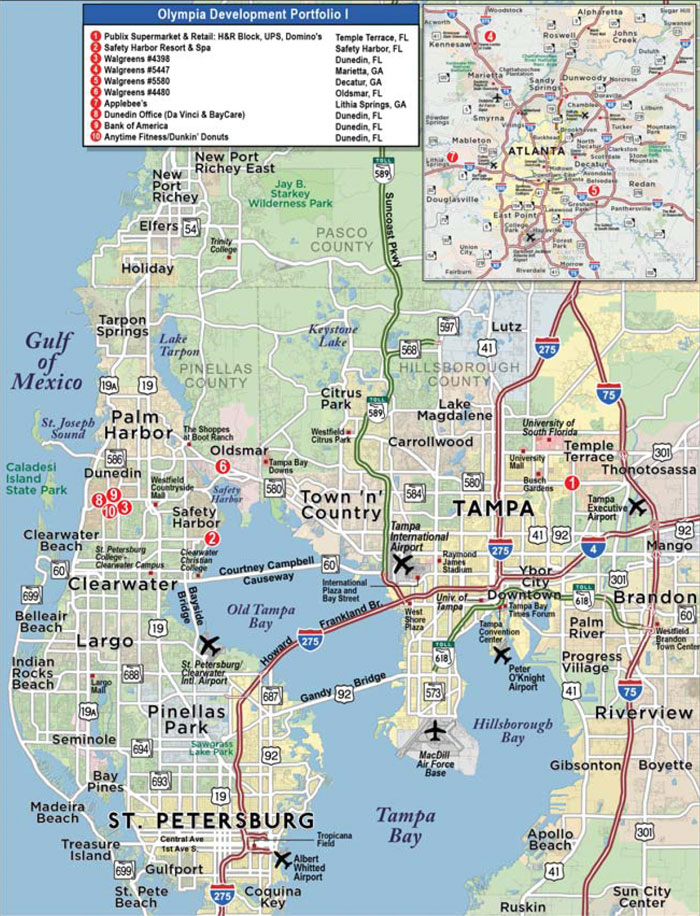
THE INFORMATION IN THIS STRUCTURAL AND COLLATERAL TERM SHEET IS NOT COMPLETE AND MAY BE AMENDED PRIOR TO THE TIME OF SALE. THIS TERM SHEET IS NOT AN OFFER TO SELL THESE SECURITIES AND IT IS NOT A SOLICITATION OF AN OFFER TO BUY THESE SECURITIES IN ANY JURISDICTION WHERE THE OFFER OR SALE IS NOT PERMITTED.
59
| No. 5 – Olympia Development Portfolio I | |||||||
| Loan Information | Property Information | ||||||
| Mortgage Loan Seller: | Rialto Mortgage Finance, LLC | Single Asset/Portfolio: | Portfolio | ||||
Credit Assessment (Fitch/Moody’s/DBRS): | NR/NR/NR | Property Type: | Various– See Table | ||||
| Original Principal Balance: | $35,130,000 | Specific Property Type: | Various – See Table | ||||
| Cut-off Date Principal Balance: | $35,130,000 | Location: | Various – See Table | ||||
| % of Initial Pool Balance: | 3.9% | Size: | 156,123 SF / 173 Rooms | ||||
| Loan Purpose: | Refinance | Cut-off Date Principal Balance Per SF / Unit: | $191.90 / $29,884 | ||||
Borrower Name(1): | Various | Year Built/Renovated: | Various – See Table | ||||
| Sponsor: | William Touloumis | Title Vesting: | Fee | ||||
| Mortgage Rate: | 5.020% | Property Manager: | Olympia Development Group, Inc. | ||||
| Note Date: | October 18, 2013 | 3rd Most Recent Occupancy (As of)(3): | 91.2% (12/31/2010) | ||||
| Anticipated Repayment Date: | November 6, 2018 | 2nd Most Recent Occupancy (As of)(3): | 91.6% (12/31/2011) | ||||
| Maturity Date: | November 6, 2023 | Most Recent Occupancy (As of)(3): | 92.2% (12/31/2012) | ||||
| IO Period: | 18 months | Current Occupancy (As of)(3): | 92.4% (Various) | ||||
| Loan Term (Original): | 60 months | ||||||
| Seasoning: | 0 months | Underwriting and Financial Information: | |||||
| Amortization Term (Original): | 360 months | ||||||
| Loan Amortization Type: | Interest-only, Amortizing ARD | 3rd Most Recent NOI (As of): | $2,737,333 (12/31/2011) | ||||
| Interest Accrual Method: | Actual/360 | 2nd Most Recent NOI (As of): | $3,138,292 (12/31/2012) | ||||
| Call Protection: | L(24),D(32),O(4) | Most Recent NOI (As of): | $3,496,043 (TTM 7/31/2013) | ||||
| Lockbox Type: | Hard/Springing Cash Management | ||||||
| Additional Debt: | None | ||||||
| Additional Debt Type: | NAP | ||||||
| U/W Revenues: | $14,651,618 | ||||||
| U/W Expenses: | $11,196,720 | ||||||
Escrows and Reserves(2): | U/W NOI: | $3,454,897 | |||||
| U/W NCF: | $2,944,511 | ||||||
Type: | Initial | Monthly | Cap (If Any) | U/W NOI DSCR: | 1.52x | ||
| Taxes | $350,180 | $37,056/ Springing | NAP | U/W NCF DSCR: | 1.30x | ||
| Insurance | $129,321 | $41,054 | NAP | U/W NOI Debt Yield: | 9.8% | ||
| Replacement Reserves | $0 | $1,282 | NAP | U/W NCF Debt Yield: | 8.4% | ||
| TI/LC Reserve | $0 | $1,952 | NAP | As-Is Appraised Value: | $50,560,000 | ||
| Deferred Maintenance | $124,310 | $0 | NAP | As-Is Appraisal Valuation Date: | Various | ||
| FF&E | $0 | 4.0% of hotel gross income | NAP | Cut-off Date LTV Ratio: | 69.5% | ||
| Critical Tenant TI/LC | $0 | Springing | NAP | LTV Ratio at Maturity or ARD: | 65.9% | ||
| (1) | See “Borrower” section. |
| (2) | See “Escrows” section. |
| (3) | Occupancy represents weighted average portfolio occupancy by Allocated Cut-off Date Balance. The retail and office Olympia Development Portfolio I Properties occupancy is as of October 1, 2013, and the Safety Harbor Resort & Spa property occupancy is as of the trailing 12-months ended July 31, 2013. |
The Mortgage Loan. The mortgage loan (the “Olympia Development Portfolio I Mortgage Loan”) is evidenced by a single promissory note that is secured by a first mortgage encumbering eight retail properties, one office property, and one hotel property located in the Tampa, Florida and Atlanta, Georgia metropolitan statistical areas (“MSAs”) (the “Olympia Development Portfolio I Properties”). The Olympia Development Portfolio I Mortgage Loan was originated on October 18, 2013 by Rialto Mortgage Finance, LLC. The Olympia Development Portfolio I Mortgage Loan had an original principal balance of $35,130,000, has an outstanding principal balance as of the Cut-off Date of $35,130,000 and accrues interest at an interest rate of 5.020% per annum. The Olympia Development Portfolio I Mortgage Loan had an initial term of 60 months, has a remaining term of 60 months as of the Cut-off Date and requires interest-only payments for the first 18 payments following origination and thereafter requires payments of principal and interest based on a 30-year amortization schedule through the Anticipated Repayment Date (“ARD”). The ARD is November 6, 2018, and the final maturity date is November 6, 2023. In the event the Olympia Development Portfolio I Mortgage Loan is not repaid in full on or before the ARD, the interest rate on the Olympia Development Portfolio I Mortgage Loan will increase to the greater of (i) the treasury index rate as of the ARD plus 4.000% and (ii) 10.000%. The ARD automatically triggers a full cash flow sweep whereby all excess cash flow will be used to pay down the principal balance of the Olympia Development Portfolio I Mortgage Loan.
Following the lockout period, the borrowers have the right to defease the Olympia Development Portfolio I Mortgage Loan in whole or in part on any date before August 6, 2018. In addition, the Olympia Development Portfolio I Mortgage Loan is prepayable without penalty on or after August 6, 2018.
THE INFORMATION IN THIS STRUCTURAL AND COLLATERAL TERM SHEET IS NOT COMPLETE AND MAY BE AMENDED PRIOR TO THE TIME OF SALE. THIS TERM SHEET IS NOT AN OFFER TO SELL THESE SECURITIES AND IT IS NOT A SOLICITATION OF AN OFFER TO BUY THESE SECURITIES IN ANY JURISDICTION WHERE THE OFFER OR SALE IS NOT PERMITTED.
60
OLYMPIA DEVELOPMENT PORTFOLIO I |
Sources and Uses
| Sources | Uses | |||||||
| Original loan amount | $35,130,000 | 100.0% | Loan payoff | $23,649,309 | 67.3% | |||
Settlement/payoff costs(1) | 9,092,811 | 25.9 | ||||||
| Closing costs | 1,664,753 | 4.7 | ||||||
| Reserves | 603,811 | 1.7 | ||||||
| Return of equity | 119,315 | 0.3 | ||||||
| Total Sources | $35,130,000 | 100.0% | Total Uses | $35,130,000 | 100.0% |
| (1) | Settlement/payoff costs include (a) $400,000 paid to a prior lender for amounts due under a loan secured by a vacant parcel of land, which is included in the Dunedin property, (as defined below), and is included in the collateral, (b) $4.25 million paid to a prior lender in connection with the settlement of a litigation related to defaulted loans (as described under “Description of the Mortgage Pool—Litigation Considerations” in the accompanying Free Writing Prospectus) and (c) a portion of the remaining $11.75 million negotiated settlement amount related the prior bankruptcy of the Safety Harbor Resort & Spa property (as described under “Description of the Mortgage Pool—Litigation Considerations” in the accompanying Free Writing Prospectus). |
The Properties. The Olympia Development Portfolio I Mortgage Loan is secured by the fee interests in eight retail properties, one office property, and one hotel property located in the Tampa, Florida and Atlanta, Georgia MSAs, totaling 156,123 square feet and 173 rooms. As of October 1, 2013, the retail and office components of the Olympia Development Portfolio I Properties were 95.2% leased by 11 tenants.
The Olympia Development Portfolio I Properties are made up of a Publix anchored shopping center, four freestanding Walgreens stores, a freestanding Applebee’s restaurant, a freestanding Bank of America branch office, a retail building that is 100.0% leased by Anytime Fitness and Dunkin’ Donuts, a two building office property and a 173-room hotel resort and spa.
The following table presents certain information relating to the Olympia Development Portfolio I Properties:
| Property Name | Location | Property Type | Allocated Cut-off Date Principal Balance | % of Portfolio Cut-off Date Principal Balance | Occupancy | Year Built/ Renovated | Net Rentable Area (SF/Rooms) | Appraised Value | |
| Publix Supermarket & Retail: H&R Block, UPS, Domino’s | Temple Terrace, FL | Retail | $6,750,000 | 19.2% | 100.0% | 1999/NAP | 48,769 | $9,000,000 | |
| Safety Harbor Resort & Spa | Safety Harbor, FL | Hospitality | $5,170,000 | 14.7% | 59.2% | 1925/2012 | 173 | $10,400,000 | |
Walgreens #4398(1) | Dunedin, FL | Retail | $4,880,000 | 13.9% | 100.0% | 1998/NAP | 15,120 | $6,560,000 | |
| Walgreens #5447 | Marietta, GA | Retail | $3,840,000 | 10.9% | 100.0% | 2002/NAP | 15,120 | $5,120,000 | |
| Walgreens #5580 | Decatur, GA | Retail | $3,680,000 | 10.5% | 100.0% | 2001/NAP | 15,120 | $4,920,000 | |
| Walgreens #4480 | Oldsmar, FL | Retail | $3,127,500 | 8.9% | 100.0% | 1998/NAP | 15,120 | $4,170,000 | |
| Applebee’s | Lithia Springs, GA | Retail | $2,390,000 | 6.8% | 100.0% | 2003/2012 | 4,523 | $3,190,000 | |
Dunedin Office (Da Vinci & BayCare)(1) | Dunedin, FL | Office | $2,217,500 | 6.3% | 74.0% | 1999/NAP | 28,610 | $3,100,000 | |
Bank of America(1) | Dunedin, FL | Retail | $1,575,000 | 4.5% | 100.0% | 1998/NAP | 4,400 | $2,100,000 | |
Anytime Fitness/ Dunkin’ Donuts(1) | Dunedin, FL | Retail | $1,500,000 | 4.3% | 100.0% | 1998/NAP | 9,341 | $2,000,000 | |
| Total/Weighted Average | $35,130,000 | 100.0% | 92.4% | 156,123 SF 173 Rooms | $50,560,000 | ||||
| (1) | The properties located in Dunedin, Florida listed above are situated on adjacent properties, owned by one borrower (the “Dunedin Property”). The related borrower has the right, subject to conditions set forth in the loan documents, to obtain a release of each such parcel. For purposes of this disclosure, the Dunedin Property is considered to be four individual mortgaged properties. |
Publix Supermarket & Retail: H&R Block, UPS, Domino’s – Temple Terrace, FL (19.2% of Portfolio Cut-off Date Principal Balance)
The Publix Supermarket & Retail: H&R Block, UPS, Domino’s property consists of a 48,796 square foot neighborhood shopping center built in 1999 and situated on a 4.2 acre site. Parking is provided by approximately 200 surface parking spaces, which results in a parking ratio of 4.1 spaces per 1,000 square feet of rentable area. The Publix Center property is anchored by Publix and contains inline tenants H&R Block, UPS Store, and Domino’s. As of October 1, 2013, the Publix Center property was 100.0% occupied by four tenants.
Safety Harbor Resort & Spa – Safety Harbor, FL (14.7% of Portfolio Cut-off Date Principal Balance)
The Safety Harbor Resort & Spa property consists of a 173-room, bayfront, full-service resort lodging facility situated on a 15.5 acre site. The Safety Harbor Resort & Spa was initially opened in 1925, built in phases and last renovated in 2012. Since acquiring the property in 2004, the sponsor has invested over $13.0 million in capital improvements. The hotel was recognized as a historic landmark by the U.S. Department of the Interior in 1964 and was recognized as a Florida Heritage Landmark in 1997. The property features a restaurant, a lounge, a full-service spa, two outdoor pools, an indoor pool, two whirlpools, seven outdoor tennis courts, a volleyball court, 20,678 square feet of meeting space, a business center, vending areas and guest laundry rooms.
THE INFORMATION IN THIS STRUCTURAL AND COLLATERAL TERM SHEET IS NOT COMPLETE AND MAY BE AMENDED PRIOR TO THE TIME OF SALE. THIS TERM SHEET IS NOT AN OFFER TO SELL THESE SECURITIES AND IT IS NOT A SOLICITATION OF AN OFFER TO BUY THESE SECURITIES IN ANY JURISDICTION WHERE THE OFFER OR SALE IS NOT PERMITTED.
61
OLYMPIA DEVELOPMENT PORTFOLIO I |
Walgreens #4398 – Dunedin, FL (13.9% of Portfolio Cut-off Date Principal Balance)
The Walgreens #4398 property consists of a 15,120 square foot freestanding retail building 100.0% occupied by Walgreens as of October 1, 2013. The Walgreens #4398 property was built in 1998 on a 1.4 acre site. Parking is provided by 75 surface parking spaces, which results in a parking ratio of approximately 5.0 spaces per 1,000 square feet of rentable area.
Walgreens #5447 – Marietta, GA (10.9% of Portfolio Cut-off Date Principal Balance)
The Walgreens #5447 property consists of a 15,120 square foot freestanding retail building 100.0% occupied by Walgreens as of October 1, 2013. The Walgreens #5447 property was built in 2002 on a 1.6 acre site. Parking is provided by 77 surface parking spaces, which results in a parking ratio of approximately 5.1 spaces per 1,000 square feet of rentable area.
Walgreens #5580 – Decatur, GA (10.5% of Portfolio Cut-off Date Principal Balance)
The Walgreens #5580 property consists of a 15,120 square foot freestanding retail building 100.0% occupied by Walgreens as of October 1, 2013. The Walgreens #5580 property was built in 2001 on a 2.0 acre site. Parking is provided by 80 surface parking spaces, which results in a parking ratio of approximately 5.3 per 1,000 square feet of rentable area.
Walgreens #4480 – Oldsmar, FL (8.9% of Portfolio Cut-off Date Principal Balance)
The Walgreens #4480 property consists of a 15,120 square foot freestanding retail building 100.0% occupied by Walgreens as of October 1, 2013. The Walgreens #4480 property was built in 1996 on a 2.7 acre site. Parking is provided by 76 surface parking spaces, which results in a parking ratio of approximately 5.0 spaces per 1,000 square feet of rentable area.
Applebee’s – Lithia Springs, GA (6.8% of Portfolio Cut-off Date Principal Balance)
The Applebee’s property consists of a 4,523 square foot freestanding retail building 100.0% occupied by Applebee’s as of October 1, 2013. The Applebee’s property was built in 2003 and renovated in 2012 on a 1.0 acre site. Parking is provided by 82 surface parking spaces, which results in a parking ratio of approximately 18.1 spaces per 1,000 square feet of rentable area.
Dunedin Office (Da Vinci & BayCare) – Dunedin, FL (6.3% of Portfolio Cut-off Date Principal Balance)
The Dunedin Office (Da Vinci & BayCare) property consists of two one-story office buildings containing 28,610 square foot of rentable area. The property was built in 1999 on a 3.9 acre site. Parking is provided by 67 surface parking spaces, which results in a parking ratio of approximately 2.3 spaces per 1,000 square feet of rentable area. As of October 1, 2013, the Dunedin Office property was 74.0% occupied by two tenants, Academie Da Vinci Charter School and BayCare Home Care.
Bank of America – Dunedin, FL (4.5% of Portfolio Cut-off Date Principal Balance)
The Bank of America property consists of a 4,400 square foot freestanding bank branch office building 100.0% occupied by Bank of America as of October 1, 2013. The Bank of America property was built in 1998 on a 1.1 acre site. Parking is provided by 42 surface parking spaces, which results in a parking ratio of approximately 9.5 spaces per 1,000 square feet of rentable area.
Anytime Fitness/Dunkin’ Donuts – Dunedin, FL (4.3% of Portfolio Cut-off Date Principal Balance)
The Anytime Fitness/Dunkin’ Donuts property consists of a 9,341 square foot, one-story retail building. The property was built in 1998 on a 3.4 acre site. Parking is provided by 83 surface parking space resulting in a parking ratio of 8.9 spaces per 1,000 square feet of rentable area. As of October 1, 2013, the property was 100.0% occupied by Anytime Fitness and Dunkin’ Donuts.
THE INFORMATION IN THIS STRUCTURAL AND COLLATERAL TERM SHEET IS NOT COMPLETE AND MAY BE AMENDED PRIOR TO THE TIME OF SALE. THIS TERM SHEET IS NOT AN OFFER TO SELL THESE SECURITIES AND IT IS NOT A SOLICITATION OF AN OFFER TO BUY THESE SECURITIES IN ANY JURISDICTION WHERE THE OFFER OR SALE IS NOT PERMITTED.
62
OLYMPIA DEVELOPMENT PORTFOLIO I |
The following table presents certain information relating to the tenancies at the retail and office Olympia Development Portfolio I Properties:
Major Tenants
| Tenant Name | Credit Rating (Fitch/Moody’s/ S&P)(1) | Tenant NRSF | % of NRSF | Annual U/W Base Rent PSF(2) | Annual U/W Base Rent(2) | % of Total Annual U/W Base Rent | Lease Expiration Date |
| Major Tenants | |||||||
Walgreens(3) | NR/Baa1/BBB | 60,480 | 38.7% | $21.94 | $1,326,662 | 49.4% | Various |
| Publix | NR/NR/NR | 44,265 | 28.4% | $12.00 | $531,180 | 19.8% | 9/30/2024 |
| Academie Da Vinci Charter School | NR/NR/NR | 18,869 | 12.1% | $10.75 | $202,842 | 7.6% | 9/30/2022 |
| Total Major Tenants | 123,614 | 79.2% | $16.67 | $2,060,684 | 76.7% | ||
| Non-Major Tenants | 25,083 | 16.1% | $24.89 | $624,310 | 23.3% | ||
| Occupied Collateral Total | 148,697 | 95.2% | $18.06 | $2,684,994 | 100.0% | ||
| Vacant Space | 7,426 | 4.8% | |||||
| Collateral Total | 156,123 | 100.0% | |||||
| (1) | Certain ratings are those of the parent company whether or not the parent guarantees the lease. |
| (2) | U/W Base Rent PSF and U/W Base Rent include contractual rent steps through October 1, 2014. |
| (3) | Walgreens is the sole tenant at four individual Olympia Development Portfolio I Properties. The Walgreens #4398, Walgreens #5447, Walgreens #5580 and Walgreens #4480 property leases expire on October 31, 2028, June 30, 2021, June 30, 2020, and May 31, 2018, respectively. |
The following table presents certain information relating to the lease rollover schedule at the retail and office Olympia Development Portfolio I Properties:
Lease Expiration Schedule(1)(2)
Year Ending December 31, | No. of Leases Expiring | Expiring NRSF | % of Total NRSF | Cumulative Expiring NRSF | Cumulative % of Total NRSF | Annual U/W Base Rent | Annual U/W Base Rent PSF(3) | |
| MTM | 0 | 0 | 0.0% | 0 | 0.0% | $0 | $0.00 | |
| 2013 | 0 | 0 | 0.0% | 0 | 0.0% | $0 | $0.00 | |
| 2014 | 1 | 2,315 | 1.5% | 2,315 | 1.5% | $42,182 | $18.22 | |
| 2015 | 2 | 4,165 | 2.7% | 6,480 | 4.2% | $85,304 | $20.48 | |
| 2016 | 1 | 1,512 | 1.0% | 7,992 | 5.1% | $32,463 | $21.47 | |
| 2017 | 1 | 6,656 | 4.3% | 14,648 | 9.4% | $93,184 | $14.00 | |
| 2018 | 3 | 21,032 | 13.5% | 35,680 | 22.9% | $451,528 | $21.47 | |
| 2019 | 0 | 0 | 0.0% | 35,680 | 22.9% | $0 | $0.00 | |
| 2020 | 1 | 15,120 | 9.7% | 50,800 | 32.5% | $320,000 | $21.16 | |
| 2021 | 1 | 15,120 | 9.7% | 65,920 | 42.2% | $333,000 | $22.02 | |
| 2022 | 1 | 18,869 | 12.1% | 84,789 | 54.3% | $202,842 | $10.75 | |
| 2023 | 1 | 4,523 | 2.9% | 89,312 | 57.2% | $199,645 | $44.14 | |
| Thereafter | 2 | 59,385 | 38.0% | 148,697 | 95.2% | $924,846 | $15.57 | |
| Vacant | 0 | 7,426 | 4.8% | 156,123 | 100.0% | $0 | $0.00 | |
| Total/Weighted Average | 14 | 156,123 | 100.0% | $2,684,994 | $18.06 |
| (1) | Information obtained from the underwritten rent roll. |
| (2) | Certain tenants may have lease termination options that are exercisable prior to the stated expiration date of the subject lease and that are not considered in the Lease Expiration Schedule. |
| (3) | Weighted Average Annual U/W Base Rent PSF excludes vacant space. |
THE INFORMATION IN THIS STRUCTURAL AND COLLATERAL TERM SHEET IS NOT COMPLETE AND MAY BE AMENDED PRIOR TO THE TIME OF SALE. THIS TERM SHEET IS NOT AN OFFER TO SELL THESE SECURITIES AND IT IS NOT A SOLICITATION OF AN OFFER TO BUY THESE SECURITIES IN ANY JURISDICTION WHERE THE OFFER OR SALE IS NOT PERMITTED.
63
OLYMPIA DEVELOPMENT PORTFOLIO I |
The following table presents historical occupancy percentages at the Olympia Development Portfolio I Properties:
Historical Occupancy
| Property Name | 2010(1) | 2011(1) | 2012(1) | 10/1/2013(2) |
| Publix Supermarket & Retail: H&R Block, UPS, Domino’s | 100.0% | 100.0% | 100.0% | 100.0% |
| Safety Harbor Resort & Spa | 47.7% | 50.2% | 57.9% | 59.2% |
Dunedin Office (DaVinci & BayCare) Remaining Retail Properties | 83.0% 100.0% | 83.0% 100.0% | 74.0% 100.0% | 74.0% 100.0% |
| (1) | Information obtained from the borrower rent roll and leases. |
| (2) | The Safety Harbor Resort & Spa property occupancy is as of the trailing 12-months ended July 31, 2013. |
Underwritten Net Cash Flow. The following table presents certain information relating to the historical operating performance and the Underwritten Net Cash Flow at the retail and office Olympia Development Portfolio I Properties:
Cash Flow Analysis
| 2011 | 2012 | TTM 7/31/2013 | U/W | U/W $ per SF | ||||||
| Base Rent | $2,811,114 | $2,559,629 | $2,625,750 | $2,684,994 | $17.20 | |||||
| Grossed Up Vacant Space | 0 | 0 | 0 | 115,103 | 0.74 | |||||
| Total Reimbursables | 131,740 | 131,255 | 130,972 | 239,334 | 1.53 | |||||
| Other Income | 999 | 4,086 | 3,485 | 3,485 | 0.02 | |||||
| Less Vacancy & Credit Loss | 0 | 0 | 0 | (180,814)(1) | (1.16) | |||||
| Effective Gross Income | $2,943,853 | $2,694,969 | $2,760,208 | $2,862,101 | $18.33 | |||||
| Total Operating Expenses | $384,096 | $330,823 | $299,405 | $416,907 | $2.67 | |||||
| Net Operating Income | $2,559,757 | $2,364,146 | $2,460,803 | $2,445,195 | $15.66 | |||||
| TI/LC | 0 | 0 | 0 | 23,418 | 0.15 | |||||
| Capital Expenditures | 0 | 0 | 0 | 15,389 | 0.10 | |||||
| Net Cash Flow | $2,559,757 | $2,364,146 | $2,460,803 | $2,406,388 | $15.41 | |||||
| (1) | The underwritten economic vacancy is 5.9%. The retail and office Olympia Development Portfolio I Properties were 95.2% occupied as of October 1, 2013. |
The following table presents certain information relating to the historical operating performance and the Underwritten Net Cash Flow at the Safety Harbor Resort & Spa property:
Cash Flow Analysis
| 2011 | 2012 | TTM 7/31/2013 | U/W | U/W $ per Room | ||||||
| Occupancy | 50.2% | 57.9% | 59.2% | 58.9% | ||||||
| ADR | $100.44 | $109.22 | $114.58 | $114.58 | ||||||
| RevPAR | $50.39 | $63.29 | $67.83 | $67.46 | ||||||
| Total Revenue | $9,987,213 | $11,385,503 | $11,789,517 | $11,789,517 | $68,147 | |||||
| Total Department Expenses | 5,492,597 | 5,618,740 | 5,851,393 | 5,851,393 | 33,823 | |||||
| Gross Operating Profit | $4,494,616 | $5,766,763 | $5,938,124 | $5,938,124 | $34,324 | |||||
| Total Undistributed Expenses | 3,626,327 | 4,333,855 | 4,165,805 | 4,186,561 | 24,200 | |||||
| Profit Before Fixed Charges | $868,289 | $1,432,908 | $1,772,319 | $1,751,562 | $10,125 | |||||
| Total Fixed Charges | 690,713 | 658,762 | 737,079 | 741,859 | 4,288 | |||||
| Net Operating Income | $177,576 | $774,146 | $1,035,240 | $1,009,704 | $5,836 | |||||
| FF&E | 0 | 0 | 0 | 471,581 | 2,726 | |||||
| Net Cash Flow | $177,576 | $774,146 | $1,035,240 | $538,123 | $3,111 | |||||
THE INFORMATION IN THIS STRUCTURAL AND COLLATERAL TERM SHEET IS NOT COMPLETE AND MAY BE AMENDED PRIOR TO THE TIME OF SALE. THIS TERM SHEET IS NOT AN OFFER TO SELL THESE SECURITIES AND IT IS NOT A SOLICITATION OF AN OFFER TO BUY THESE SECURITIES IN ANY JURISDICTION WHERE THE OFFER OR SALE IS NOT PERMITTED.
64
OLYMPIA DEVELOPMENT PORTFOLIO I |
The following table presents certain information relating to the historical operating performance and the Underwritten Net Cash Flow at the Olympia Development Portfolio I Properties as a collective whole:
Combined Cash Flow Analysis
| 2011 | 2012 | TTM 7/31/2013 | U/W | ||||||
| Net Operating Income | $2,737,333 | $3,138,292 | $3,496,043 | $3,454,897 | |||||
| Net Cash Flow | $2,737,333 | $3,138,292 | $3,496,043 | $2,944,511 | |||||
| NOI DSCR | 1.21x | 1.38x | 1.54x | 1.52x | |||||
| NCF DSCR | 1.21x | 1.38x | 1.54x | 1.30x | |||||
| NOI DY | 7.8% | 8.9% | 10.0% | 9.8% | |||||
| NCF DY | 7.8% | 8.9% | 10.0% | 8.4% |
Appraisal. As of various appraisal valuations dates ranging from August 20, 2013 to August 29, 2013, the Olympia Development Portfolio I Properties had an aggregate “as-is” appraised value of $50,560,000.
Environmental Matters. According to the Phase I environmental site assessments dated between September 3, 2013 and September 12, 2013, there was no evidence of any recognized environmental conditions at the Olympia Development Portfolio I Properties, except with respect to the Safety Harbor Resort & Spa property. Four historical underground storage tanks have been removed from the Safety Harbor Resort & Spa property and soil and groundwater remediation has been completed. The Safety Harbor Resort & Spa property was designated “No Further Action” on January 7, 1993. The Phase I environmental report recommended that any onsite wells, if no longer in use, should be properly abandoned in accordance with applicable regulatory requirements and implement an Asbestos Operations and Maintenance (O&M) Plan, which is already in place.
Market Overview and Competition. Seven of the Olympia Development Portfolio I Properties are located in the Tampa MSA. With an estimated 2013 population of approximately 2.9 million, the Tampa MSA is the second most populous metropolitan area in the state of Florida. Employment growth in the Tampa MSA has outpaced the state of Florida in terms of job creation since early 2011. Overall employment in the Tampa MSA totaled approximately 1.26 million, as of May 2013, representing an increase of 10.4% from January 2011. According to the Bureau of Labor Statistics, the unemployment rate for the Tampa MSA was 7.3%, as of June 2013. According to a market research report, as of mid-year 2013 the Tampa MSA retail market had a vacancy rate of 7.2% and a quoted rental rate of $13.70. The Tampa MSA office market had a vacancy rate of 13.3% as of mid-year 2013 and a quoted rental rate of $18.28.
Three of the Olympia Development Portfolio I Properties are located in the Atlanta MSA. With an estimated 2013 population of approximately 5.5 million, the Atlanta MSA is the 9th largest in the U.S. Over half of the State of Georgia’s population lives and works with the Atlanta MSA. According to the third party research report, the unemployment rate for the Atlanta MSA was 8.8%, as of June 2013. According to a market research report, as of mid-year 2013 the Atlanta MSA retail market has a vacancy rate of 9.7% and a quoted rental rate of $12.91.
The Borrowers. The borrowers are seven separate limited liability companies, each of which is a single purpose entity and has two independent directors. Legal counsel to the borrower delivered a non-consolidation opinion in connection with the origination of the Olympia Development Portfolio I Mortgage Loan. William Touloumis, the principal of the borrower, is the guarantor of certain nonrecourse carveouts under the Olympia Development Portfolio I Mortgage Loan.
The Sponsor. The sponsor for the Olympia Development Portfolio I Mortgage Loan is William Touloumis. Olympia Development Group (“Olympia”) is a commercial real estate development company founded in 1991 by William Toulomis. Starting with single tenant projects, Olympia has expanded its expertise and now owns, manages and/or leases approximately 850,000 square feet of rentable area in 35 completed or under development projects in Florida and Georgia. The executive team has over 200 years combined experience delivering architectural and construction expertise with in-house sales, leasing, financial and legal capabilities.
Escrows. The loan documents provide for upfront escrows in the amount of $350,180 for real estate taxes, $129,321 for insurance premiums and $124,310 for deferred maintenance.
The loan documents require monthly reserves in the amount of $37,056 for real estate taxes for the non-Walgreens occupied Olympia Development Portfolio I Properties, $41,054 for insurance premiums, $1,282 for replacement reserves, $1,952 for tenant improvements and leasing commissions and an amount equal to 1/12th of 4.0% of the gross income from operations from the Safety Harbor Resort & Spa during the calendar year immediately preceding the calendar year of such monthly payment date for FF&E at the Safety Harbor Resort & Spa property. The borrower will be required to make monthly tax deposits with respect to the Walgreens occupied properties in the event that (i) an event of default has occurred and is continuing; (ii) Walgreens is not expressly obligated to directly pay all taxes due; (iii) the respective Walgreens lease is not in full force and effect; (iv) Walgreens does not pay all taxes prior to the due date; or (v) the borrower does not provide paid receipts for the on time payment of taxes to the lender.
Upon the occurrence and continuation of a Critical Tenant Trigger Event (as defined below), all Remaining Cash Flow (as defined below) will be swept into the Critical Tenant TI/LC reserve fund.
THE INFORMATION IN THIS STRUCTURAL AND COLLATERAL TERM SHEET IS NOT COMPLETE AND MAY BE AMENDED PRIOR TO THE TIME OF SALE. THIS TERM SHEET IS NOT AN OFFER TO SELL THESE SECURITIES AND IT IS NOT A SOLICITATION OF AN OFFER TO BUY THESE SECURITIES IN ANY JURISDICTION WHERE THE OFFER OR SALE IS NOT PERMITTED.
65
OLYMPIA DEVELOPMENT PORTFOLIO I |
A “Critical Tenant Trigger Event” will occur if (i) on or prior to 12 months prior to the then applicable date on which Walgreen Co. (“Walgreens”) is permitted to terminate its lease in accordance with section 3 of the Walgreens lease, Walgreens fails to waive its right to terminate its lease, (ii) a monetary event of default occurs under the Walgreens lease, the Publix Super Markets, Inc. (“Publix”) lease or the Academie Da Vinci Charter School, Inc. (“Davinci”) lease, as applicable, (iii) Walgreens, Publix or Davinci is subject to a bankruptcy or insolvency proceeding or (iv) Walgreens is downgraded below BBB-/Baa3 by Fitch, Moody’s and DBRS.
Lockbox and Cash Management. The Olympia Development Portfolio I Mortgage Loan requires a lender-controlled lockbox which is already in place and springing cash management. The Olympia Development Portfolio I Mortgage Loan documents require all revenue to be deposited directly into a lockbox account. Prior to the occurrence of a Cash Management Trigger Event, as defined below, all funds in the lockbox account will be released to the borrower. From and after the occurrence and continuation of a Cash Management Trigger Event (as defined below), funds in the lockbox account will be swept daily into a lender controlled cash management account. In the absence of a Cash Sweep Event, (as defined below), all funds in the cash management account will be applied by the lender to payments of debt service, required reserves, approved operating expenses and other items required under the loan documents and the remaining cash flow (“Remaining Cash Flow”) will be released to the borrower. Upon the occurrence and continuation of a Cash Sweep Event all Remaining Cash Flow will be held by the lender as additional collateral for the Olympia Development Portfolio I Mortgage Loan.
A “Cash Management Trigger Event” will commence upon: (i) the occurrence and continuance of an event of default; (ii) the bankruptcy or insolvency of the borrower, guarantor, or the property manager; (iii) the DSCR falling below 1.20x; (iv) the occurrence of a Critical Tenant Trigger Event; or (v) the failure to repay or defease the entire Olympia Development Portfolio I Mortgage Loan on or prior to the ARD.
A “Cash Sweep Event” will commence upon (i) an event and continuance of default; (ii) the bankruptcy or insolvency of the borrower, guarantor, or the property manager; (iii) the amortizing DSCR falling below 1.10x; (iv) the occurrence of a Critical Tenant Trigger Event, defined below; or (v) the failure to repay or defease the entire Olympia Development Portfolio I Mortgage Loan on or prior to the ARD.
Property Management. The Olympia Development Portfolio I Properties are managed by an affiliate of the borrower.
Assumption. The borrower has a right to transfer the Olympia Development Portfolio I Properties, provided that no event of default has occurred and is continuing and certain other conditions are satisfied, including, but not limited to: (i) if requested by the lender, rating agency confirmation from Fitch, Moody’s and DBRS that the transfer will not result in a downgrade, withdrawal or qualification of the respective ratings assigned to the Series 2013-C17 Certificates; (ii) execution of a recourse guaranty and an environmental indemnity by an affiliate of the transferee reasonably acceptable to the lender; and (iii) transferee and transferee’s sponsors (together with transferee’s proposed property manager) are experienced owners and operators of properties similar in location, size, class, use, operation and value as the Olympia Development Portfolio I Properties, as evidenced by financial statements and other information reasonably satisfactory to the lender.
Partial Release. After the expiration of the lockout period, the loan documents permit the release of an individual Olympia Development Portfolio I Property from the lien of the security instrument subject to the satisfaction of certain conditions, including, but not limited to, (i) the borrower delivers defeasance collateral in an amount equal to 125% of the allocated loan amount for the property to be released (or 120% of the allocated loan amount in connection with a release of the Safety Harbor Resort & Spa property), (ii) after the release, (a) the net cash flow DSCR for all remaining properties is not less than the greater of (x) 1.25x and (y) the net cash flow DSCR for all properties immediately preceding such release; and (b) the loan-to-value ratio of all remaining properties is not greater than the lesser of (x) 69.5% and (y) the loan-to-value ratio for all properties immediately preceding the release. In addition, the loan documents permit the free release of certain vacant and unimproved parcels located at the Dunedin Property, provided, among other things, the release is in compliance with the REMIC requirements.
Real Estate Substitution. Not permitted.
Subordinate and Mezzanine Indebtedness. Not permitted.
Ground Lease. None.
Terrorism Insurance. The loan documents require that the “all risk” insurance policy required to be maintained by the borrower provide coverage for terrorism in an amount equal to the full replacement cost of the Olympia Development Portfolio I Properties. The loan documents also require business interruption insurance covering no less than the 12-month period following the occurrence of a casualty event, together with a ninety-day extended period of indemnity.
Windstorm/Flood Insurance. The loan documents require windstorm insurance for the Olympia Development Portfolio Properties located in Florida covering the full replacement cost for such property during the loan term. At the time of closing, such insurance is maintained by the borrower, except with respect to Florida properties that contain Walgreens (which tenant insures such properties against windstorm loss pursuant to its lease and as permitted under the loan documents).
THE INFORMATION IN THIS STRUCTURAL AND COLLATERAL TERM SHEET IS NOT COMPLETE AND MAY BE AMENDED PRIOR TO THE TIME OF SALE. THIS TERM SHEET IS NOT AN OFFER TO SELL THESE SECURITIES AND IT IS NOT A SOLICITATION OF AN OFFER TO BUY THESE SECURITIES IN ANY JURISDICTION WHERE THE OFFER OR SALE IS NOT PERMITTED.
66
(THIS PAGE INTENTIONALLY LEFT BLANK)
67
MARRIOTT COURTYARD - GOLETA |
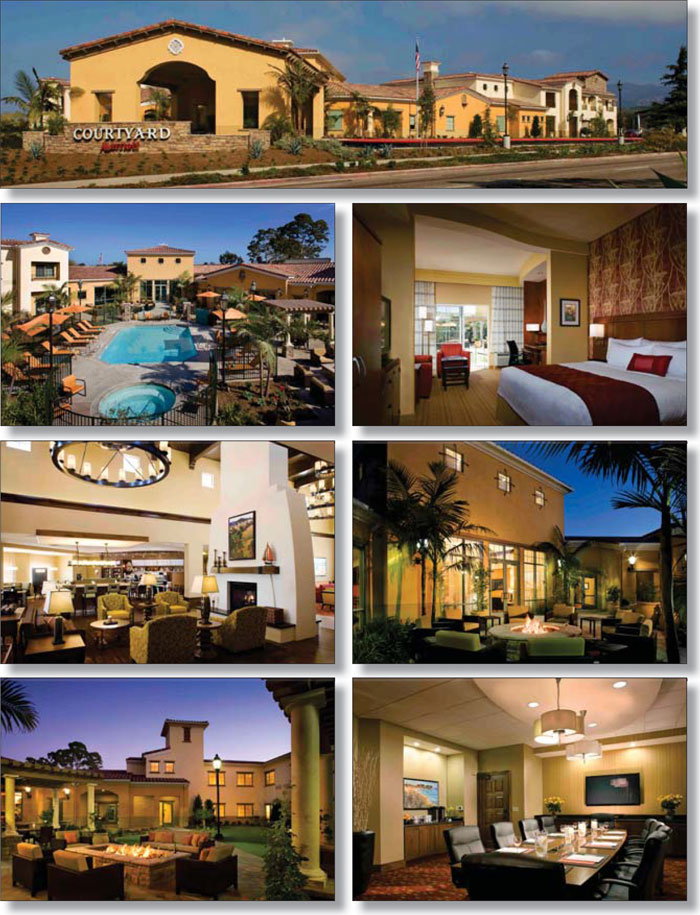
THE INFORMATION IN THIS STRUCTURAL AND COLLATERAL TERM SHEET IS NOT COMPLETE AND MAY BE AMENDED PRIOR TO THE TIME OF SALE. THIS TERM SHEET IS NOT AN OFFER TO SELL THESE SECURITIES AND IT IS NOT A SOLICITATION OF AN OFFER TO BUY THESE SECURITIES IN ANY JURISDICTION WHERE THE OFFER OR SALE IS NOT PERMITTED.
68
MARRIOTT COURTYARD - GOLETA |
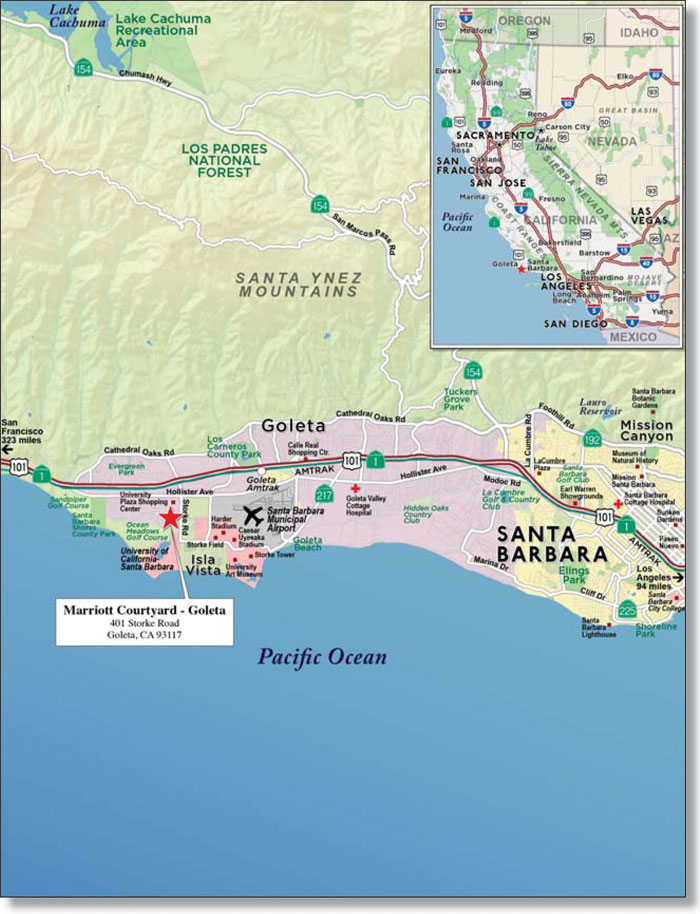
THE INFORMATION IN THIS STRUCTURAL AND COLLATERAL TERM SHEET IS NOT COMPLETE AND MAY BE AMENDED PRIOR TO THE TIME OF SALE. THIS TERM SHEET IS NOT AN OFFER TO SELL THESE SECURITIES AND IT IS NOT A SOLICITATION OF AN OFFER TO BUY THESE SECURITIES IN ANY JURISDICTION WHERE THE OFFER OR SALE IS NOT PERMITTED.
69
| No. 6 – Marriott Courtyard - Goleta | |||||||
| Loan Information | Property Information | ||||||
| Mortgage Loan Seller: | The Royal Bank of Scotland | Single Asset/Portfolio: | Single Asset | ||||
Credit Assessment (Fitch/Moody’s/DBRS): | NR/NR/NR | Property Type: | Hospitality | ||||
| Original Principal Balance: | $30,100,000 | Specific Property Type: | Limited Service | ||||
| Cut-off Date Principal Balance: | $30,100,000 | Location: | Goleta, CA | ||||
| % of Initial Pool Balance: | 3.3% | Size: | 115 rooms | ||||
| Loan Purpose: | Refinance | Cut-off Date Principal Balance Per Room: | $261,739 | ||||
| Borrower Name: | Camino Real Hotels, LLC | Year Built/Renovated: | 2012/NAP | ||||
| Sponsor: | Robert D. Olson | Title Vesting: | Fee | ||||
| Mortgage Rate: | 5.040% | Property Manager: | Courtyard Management Corporation | ||||
| Note Date: | October 18, 2013 | 3rd Most Recent Occupancy (As of)(2): | NAV | ||||
| Anticipated Repayment Date: | NAP | 2nd Most Recent Occupancy (As of)(2): | NAV | ||||
| Maturity Date: | November 1, 2023 | Most Recent Occupancy (As of)(2): | NAV | ||||
| IO Period: | None | Current Occupancy (As of): | 77.9% (8/31/2013) | ||||
| Loan Term (Original): | 120 months | ||||||
| Seasoning: | 0 months | Underwriting and Financial Information(2): | |||||
| Amortization Term (Original): | 360 months | ||||||
| Loan Amortization Type: | Amortizing Balloon | 3rd Most Recent NOI (As of): | NAV | ||||
| Interest Accrual Method: | Actual/360 | 2nd Most Recent NOI (As of): | NAV | ||||
| Call Protection: | L(24),D(92),O(4) | Most Recent NOI (As of): | $3,281,737 (TTM 8/31/2013) | ||||
| Lockbox Type: | Springing (Without Established Account) | ||||||
| Additional Debt: | None | U/W Revenues: | $6,601,349 | ||||
| Additional Debt Type: | NAP | U/W Expenses: | $3,285,765 | ||||
| U/W NOI: | $3,315,583 | ||||||
| U/W NCF: | $3,051,529 | ||||||
| U/W NOI DSCR: | 1.70x | ||||||
| U/W NCF DSCR: | 1.57x | ||||||
Escrows and Reserves(1): | U/W NOI Debt Yield: | 11.0% | |||||
| U/W NCF Debt Yield: | 10.1% | ||||||
Type: | Initial | Monthly | Cap (If Any) | As-Is Appraised Value: | $43,200,000 | ||
| Taxes | $0 | Springing | NAP | As-Is Appraisal Valuation Date: | September 16, 2013 | ||
| Insurance | $0 | Springing | NAP | Cut-off Date LTV Ratio: | 69.7% | ||
| FF&E | $0 | Springing | NAP | LTV Ratio at Maturity or ARD: | 57.3% | ||
| (1) | See “Escrows” section. |
| (2) | No additional occupancy or financial information is available as the Marriott Courtyard - Goleta property was built in 2012. |
The Mortgage Loan. The mortgage loan (the “Marriott Courtyard - Goleta Mortgage Loan”) is evidenced by a single promissory note that is secured by a first mortgage encumbering a limited service hotel located in Goleta, California (the “Marriott Courtyard - Goleta Property”). The Marriott Courtyard - Goleta Mortgage Loan was originated on October 18, 2013 by The Royal Bank of Scotland. The Marriott Courtyard - Goleta Mortgage Loan had an original principal balance of $30,100,000, has an outstanding principal balance as of the Cut-off Date of $30,100,000 and accrues interest at an interest rate of 5.040% per annum. The Marriott Courtyard - Goleta Mortgage Loan had an initial term of 120 months, has a remaining term of 120 months as of the Cut-off Date and requires payments of principal and interest based on a 30-year amortization schedule. The Marriott Courtyard - Goleta Mortgage Loan matures on November 1, 2023.
Following the lockout period, the borrower has the right to defease the Marriott Courtyard - Goleta Mortgage Loan in whole, but not in part, on any due date before August 1, 2023. In addition, the Marriott Courtyard - Goleta Mortgage Loan is prepayable without penalty on or after August 1, 2023.
Sources and Uses
| Sources | Uses | |||||||
| Original loan amount | $30,100,000 | 100.0% | Loan payoff | $15,991,286 | 53.1% | |||
| Closing costs | 160,616 | 0.5 | ||||||
| Return of equity | 13,948,098 | 46.3 | ||||||
| Total Sources | $30,100,000 | 100.0% | Total Uses | $30,100,000 | 100.0% |
THE INFORMATION IN THIS STRUCTURAL AND COLLATERAL TERM SHEET IS NOT COMPLETE AND MAY BE AMENDED PRIOR TO THE TIME OF SALE. THIS TERM SHEET IS NOT AN OFFER TO SELL THESE SECURITIES AND IT IS NOT A SOLICITATION OF AN OFFER TO BUY THESE SECURITIES IN ANY JURISDICTION WHERE THE OFFER OR SALE IS NOT PERMITTED.
70
| MARRIOTT COURTYARD - GOLETA |
The Property. The Marriott Courtyard - Goleta Property is a 115-room, two-story limited service hotel located in Goleta, California. The Marriott Courtyard - Goleta Property was constructed in 2012 and features 35 king guestrooms, 69 queen guestrooms, 10 king suite guestrooms and one queen suite guestroom. Amenities at the Marriott Courtyard - Goleta Property include a business center, 1,500 square feet of meeting and group space, a restaurant that serves breakfast, dinner, and evening cocktails, pool and whirlpool, fitness center, market pantry, guest laundry and a putting green. The Marriott Courtyard - Goleta Property has 118 surface parking spaces, which equates to 1.0 space per room. The management agreement expires in August 2032 with one, 10-year renewal option.
Operating History and Underwritten Net Cash Flow. The following table presents certain information relating to the historical operating performance and the Underwritten Net Cash Flow at the Marriott Courtyard - Goleta Property:
Cash Flow Analysis(1)
| TTM 8/31/2013 | U/W | U/W $ per Room | ||||
| Occupancy | 77.9% | 77.9% | ||||
| ADR | $186.66 | $186.66 | ||||
| RevPAR | $145.43 | $145.43 | ||||
| Number of Days Open | 351 | 365 | ||||
| Total Revenue | $6,345,495 | $6,601,349 | $57,403 | |||
| Total Department Expenses | 1,210,221 | 1,258,492 | 10,943 | |||
| Gross Operating Profit | $5,135,274 | $5,342,856 | $46,460 | |||
| Total Undistributed Expenses | 1,633,481 | 1,764,988 | 15,348 | |||
| Profit Before Fixed Charges | $3,501,793 | $3,577,868 | $31,112 | |||
| Total Fixed Charges | 220,056 | 262,285 | 2,281 | |||
| Net Operating Income | $3,281,737 | $3,315,583 | $28,831 | |||
| FF&E | 0 | 264,054 | 2,296 | |||
| Net Cash Flow | $3,281,737 | $3,051,529 | $26,535 | |||
| NOI DSCR | 1.68x | 1.70x | ||||
| NCF DSCR | 1.68x | 1.57x | ||||
| NOI DY | 10.9% | 11.0% | ||||
| NCF DY | 10.9% | 10.1% | ||||
| (1) | No additional historical financial information is available as the Marriott Courtyard - Goleta Property opened in August 2012. |
Appraisal. As of the appraisal valuation date of September 16, 2013, the Marriott Courtyard - Goleta Property had an “as-is” appraised value of $43,200,000.
Environmental Matters. According to the Phase I environmental site assessment dated September 24, 2013, there was no evidence of any recognized environmental conditions at the Marriott Courtyard - Goleta Property.
Market Overview and Competition. The Marriott Courtyard - Goleta Property is located in the county of Santa Barbara, at the intersection of Storke and Phelps Road approximately 90 miles north of Los Angeles. The Marriott Courtyard - Goleta is located less than one-mile from the Pacific Coastal Highway (Route 1), which provides primary regional access to Ventura to the southeast and San Francisco to the northwest. The Marriott Courtyard - Goleta Property is located less than four miles west of the Santa Barbara Municipal Airport, the busiest airport on the California coast between Los Angeles and San Jose, serving more than 750,000 passengers annually. The Marriott Courtyard - Goleta Property benefits from local demand generators such as the Santa Barbara Museum of Art, more than 130 wineries, Girsch Park, a 35-acre outdoor sports complex that attracts approximately 350,000 visitors per year, and Stearns Wharf, a popular landmark parallel to the Pacific shoreline. The University of California, Santa Barbara (“USCB”) is located less than two miles southeast of the Marriott Courtyard - Goleta Property. USCB has an enrollment of over 21,000 undergraduate students and is the largest employer within the area, with almost 10,000 employees.
THE INFORMATION IN THIS STRUCTURAL AND COLLATERAL TERM SHEET IS NOT COMPLETE AND MAY BE AMENDED PRIOR TO THE TIME OF SALE. THIS TERM SHEET IS NOT AN OFFER TO SELL THESE SECURITIES AND IT IS NOT A SOLICITATION OF AN OFFER TO BUY THESE SECURITIES IN ANY JURISDICTION WHERE THE OFFER OR SALE IS NOT PERMITTED.
71
| MARRIOTT COURTYARD - GOLETA |
The following table presents certain information relating to the Marriott Courtyard - Goleta Property’s competitive set:
Subject and Market Historical Occupancy, ADR and RevPAR(1)
Competitive Set | Marriott Courtyard - Goleta | Penetration Factor | ||||||||||||||
Year | Occupancy | ADR | RevPAR | Occupancy | ADR | RevPAR | Occupancy | ADR | RevPAR | |||||||
| 8/31/2013 TTM | 75.7% | $146.45 | $110.89 | 77.7% | $184.53 | $143.29 | 102.6% | 126.0% | 129.2% | |||||||
| 8/31/2012 TTM | 81.9% | $146.40 | $119.88 | NAP | NAP | NAP | NAP | NAP | NAP | |||||||
| 8/31/2011 TTM | 81.3% | $139.75 | $113.64 | NAP | NAP | NAP | NAP | NAP | NAP | |||||||
| (1) | Information obtained from a third party hospitality report dated September 18, 2013. According to such third party hospitality report, the competitive set includes the following hotels: Courtyard Santa Barbara Goleta, Hotel Goleta, Best Western Plus South Coast Inn, Pacifica Suites and Hampton Inn Santa Barbara Goleta. |
The Borrower. The borrower is Camino Real Hotels, LLC, a California limited liability company and a single purpose entity with one independent director. Legal counsel to the borrower delivered a non-consolidation opinion in connection with the origination of the Marriott Courtyard - Goleta Mortgage Loan. Robert D. Olson is the guarantor of certain nonrecourse carveouts under the Marriott Courtyard - Goleta Mortgage Loan.
The Sponsor. Robert D. Olson is the sponsor and is the founder of R.D. Olson Development, an Irvine, California-based firm engaged in the development and repositioning of commercial properties nationwide. Mr. Olson established the company in 1997 following nearly 20 years as the founder and CEO of R.D. Olson Construction.
Escrows. No upfront tax, insurance and FF&E reserves are required. No monthly tax escrow is required so long as (i) no event of default has occurred and is continuing; (ii) the borrower adheres to making payments as defined in the management agreement; and (iii) the borrower provides the lender with evidence of timely payments. No monthly insurance escrow is required so long as (i) no event of default has occurred and is continuing; (ii) the borrower participates in an insurance program and complies with all obligations under the franchise agreement with respect to insurance reserves and payment of insurance premiums; and (iii) the borrower provides the lender with evidence of timely payments. No monthly FF&E escrow is required so long as (i) no event of default has occurred and is continuing; and (ii) the borrower adheres to making payments as defined in the management agreement.
Lockbox and Cash Management. The Marriott Courtyard - Goleta Mortgage Loan requires a lender-controlled lockbox account be established upon the occurrence of a Cash Management Period. During a Cash Management Period (as defined below), Marriott agrees to deposit all net cash flow payable by Marriott to the borrower into the lockbox account and all funds on deposit in the lockbox account are swept to a lender-controlled cash management account each business day.
A “Cash Management Period” will commence upon: (i) the occurrence and continuance of an event of default or (ii) the debt service coverage ratio falling below 1.20x at the end of any calendar quarter. A Cash Management Period will expire upon (a) with respect to the matters described in clause (i) above, the cure of such event of default; and (b) with respect to the matters described in clause (ii) above, the debt service coverage ratio being at least 1.20x for two consecutive calendar quarters.
Property Management. The Marriott Courtyard - Goleta Property is managed by Courtyard Management Corporation.
Assumption. The borrower has the right to transfer the Marriott Courtyard - Goleta Property provided that certain conditions are satisfied, including (i) no event of default has occurred and is continuing; (ii) the lender reasonably determined that the proposed transferee and guarantor satisfy the lender’s credit review and underwriting standards, taking into consideration transferee experience, financial strength and general business standing; and (iii) the lender has received confirmation from Fitch, Moody’s and DBRS that such assumption will not result in a downgrade, withdrawal or qualification of the respective ratings assigned to the Series 2013-C17 Certificates.
Partial Release. Not permitted.
Real Estate Substitution. Not permitted.
Subordinate and Mezzanine Indebtedness. Not permitted.
Ground Lease. None.
Terrorism Insurance. The loan documents require that the “all risk” insurance policy required to be maintained by the borrower provide coverage for terrorism in an amount equal to the full replacement cost of the Marriott Courtyard - Goleta Property, as well as business interruption insurance covering no less than the 18-month period following the occurrence of a casualty event, together with a six-month extended period of indemnity.
Earthquake Insurance. The lender did not require an earthquake insurance policy at the time of loan closing. Based on the seismic study, the probable maximum loss (PML) was 8%.
THE INFORMATION IN THIS STRUCTURAL AND COLLATERAL TERM SHEET IS NOT COMPLETE AND MAY BE AMENDED PRIOR TO THE TIME OF SALE. THIS TERM SHEET IS NOT AN OFFER TO SELL THESE SECURITIES AND IT IS NOT A SOLICITATION OF AN OFFER TO BUY THESE SECURITIES IN ANY JURISDICTION WHERE THE OFFER OR SALE IS NOT PERMITTED.
72
(THIS PAGE INTENTIONALLY LEFT BLANK)
73
| SECURITY SELF STORAGE PORTFOLIO I |
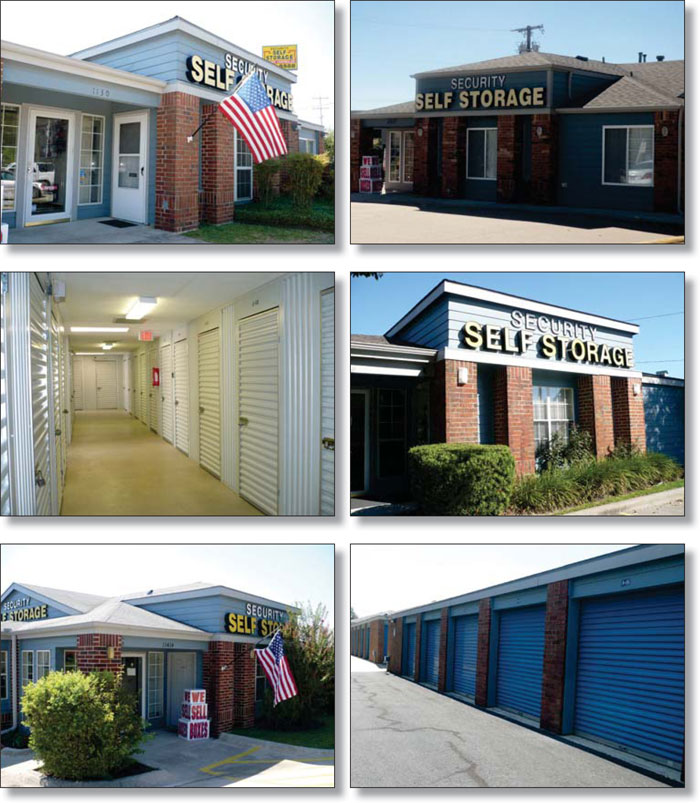
THE INFORMATION IN THIS STRUCTURAL AND COLLATERAL TERM SHEET IS NOT COMPLETE AND MAY BE AMENDED PRIOR TO THE TIME OF SALE. THIS TERM SHEET IS NOT AN OFFER TO SELL THESE SECURITIES AND IT IS NOT A SOLICITATION OF AN OFFER TO BUY THESE SECURITIES IN ANY JURISDICTION WHERE THE OFFER OR SALE IS NOT PERMITTED.
74
| SECURITY SELF STORAGE PORTFOLIO I |
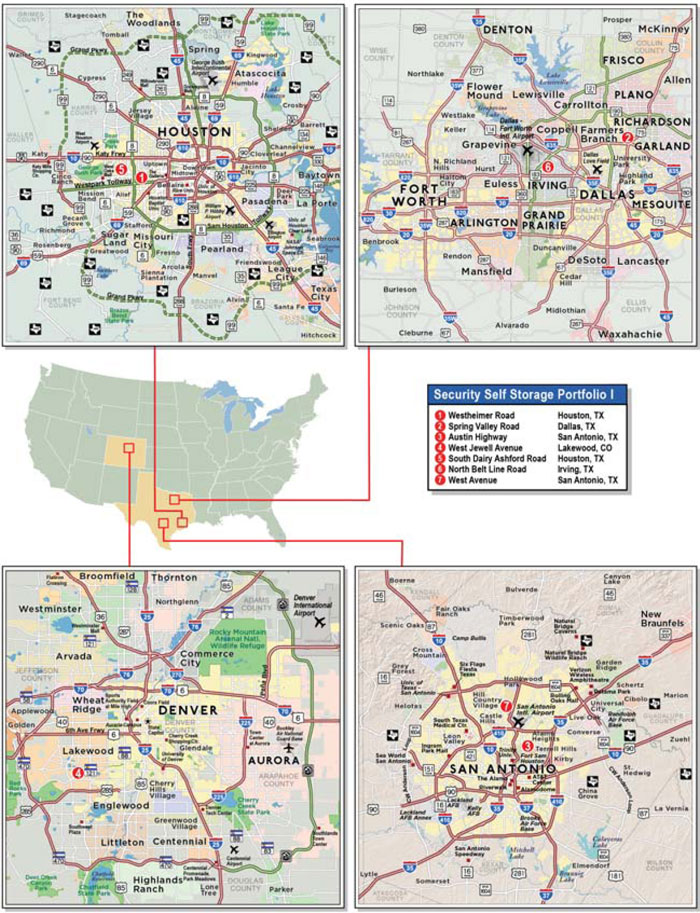
THE INFORMATION IN THIS STRUCTURAL AND COLLATERAL TERM SHEET IS NOT COMPLETE AND MAY BE AMENDED PRIOR TO THE TIME OF SALE. THIS TERM SHEET IS NOT AN OFFER TO SELL THESE SECURITIES AND IT IS NOT A SOLICITATION OF AN OFFER TO BUY THESE SECURITIES IN ANY JURISDICTION WHERE THE OFFER OR SALE IS NOT PERMITTED.
75
| No. 7 – Security Self Storage Portfolio I | ||||||
| Loan Information | Property Information | |||||
| Mortgage Loan Seller: | Wells Fargo Bank, National Association | Single Asset/Portfolio: | Portfolio | |||
| Credit Assessment (Fitch/Moody’s/DBRS): | NR/NR/NR | Property Type: | Self Storage | |||
| Original Principal Balance: | $26,800,000 | Specific Property Type: | Self Storage | |||
| Cut-off Date Principal Balance: | $26,800,000 | Location: | Various – See Table | |||
| % of Initial Pool Balance: | 3.0% | Size: | 381,700 SF | |||
| Loan Purpose: | Refinance | Cut-off Date Principal Balance Per SF: | $70.21 | |||
| Borrower Name: | Security Portfolio I, LLC | Year Built/Renovated: | Various – See Table | |||
Sponsor(1): | Various | Title Vesting: | Fee | |||
| Mortgage Rate: | 4.860% | Property Manager: | Landvest Corporation | |||
| Note Date: | October 21, 2013 | 3rd Most Recent Occupancy (As of): | 88.8% (12/31/2010) | |||
| Anticipated Repayment Date: | NAP | 2nd Most Recent Occupancy (As of): | 90.5% (12/31/2011) | |||
| Maturity Date: | November 1, 2023 | Most Recent Occupancy (As of): | 92.7% (12/31/2012) | |||
| IO Period: | None | Current Occupancy (As of): | 92.6% (10/8/2013) | |||
| Loan Term (Original): | 120 months | |||||
| Seasoning: | 0 months | Underwriting and Financial Information: | ||||
| Amortization Term (Original): | 360 months | |||||
| Loan Amortization Type: | Amortizing Balloon | 3rd Most Recent NOI (As of): | $2,545,324 (12/31/2011) | |||
| Interest Accrual Method: | Actual/360 | 2nd Most Recent NOI (As of): | $2,767,385 (12/31/2012) | |||
| Call Protection: | L(24),D(92),O(4) | Most Recent NOI (As of): | $2,881,434 (TTM 8/31/2013) | |||
| Lockbox Type: | Springing (Without Established Account) | |||||
Additional Debt(2): | Yes | U/W Revenues: | $4,412,027 | |||
Additional Debt Type(2): | Future Mezzanine | U/W Expenses: | $1,752,205 | |||
| U/W NOI: | $2,659,822 | |||||
| U/W NCF: | $2,590,685 | |||||
| U/W NOI DSCR: | 1.57x | |||||
Escrows and Reserves(3): | U/W NCF DSCR: | 1.52x | ||||
| U/W NOI Debt Yield: | 9.9% | |||||
Type: | Initial | Monthly | Cap (If Any) | U/W NCF Debt Yield: | 9.7% | |
| Taxes | $0 | Springing | NAP | As-Is Appraised Value: | $37,650,000 | |
| Insurance | $0 | Springing | NAP | As-Is Appraisal Valuation Date(4): | Various | |
| Replacement Reserves | $0 | $5,761 | $138,274 | Cut-off Date LTV Ratio: | 71.2% | |
| Deferred Maintenance | $84,784 | $0 | NAP | LTV Ratio at Maturity or ARD: | 58.2% | |
| (1) | See “The Sponsors” section. |
| (2) | See “Subordinate and Mezzanine Indebtedness” section. |
| (3) | See “Escrows” section. |
| (4) | See “Appraisal” section. |
The Mortgage Loan. The mortgage loan (the “Security Self Storage Portfolio I Mortgage Loan”) is evidenced by a single promissory note that is secured by two first mortgages encumbering seven self storage properties located in Texas and Colorado (the “Security Self Storage Portfolio I Properties”). The Security Self Storage Portfolio I Mortgage Loan was originated on October 21, 2013 by Wells Fargo Bank, National Association. The Security Self Storage Portfolio I Mortgage Loan had an original principal balance of $26,800,000, has an outstanding principal balance as of the Cut-off Date of $26,800,000 and accrues interest at an interest rate of 4.860% per annum. The Security Self Storage Portfolio I Mortgage Loan had an initial term of 120 months, has a remaining term of 120 months as of the Cut-off Date and requires payments of principal and interest based on a 30-year amortization schedule. The Security Self Storage Portfolio I Mortgage Loan matures on November 1, 2023.
Following the lockout period, the borrower has the right to defease the Security Self Storage Portfolio I Mortgage Loan in whole or in part on any day before August 1, 2023. In addition, the Security Self Storage Portfolio I Mortgage Loan is prepayable without penalty on or after August 1, 2023.
THE INFORMATION IN THIS STRUCTURAL AND COLLATERAL TERM SHEET IS NOT COMPLETE AND MAY BE AMENDED PRIOR TO THE TIME OF SALE. THIS TERM SHEET IS NOT AN OFFER TO SELL THESE SECURITIES AND IT IS NOT A SOLICITATION OF AN OFFER TO BUY THESE SECURITIES IN ANY JURISDICTION WHERE THE OFFER OR SALE IS NOT PERMITTED.
76
| SECURITY SELF STORAGE PORTFOLIO I |
Sources and Uses
| Sources | Uses | |||||||
| Original loan amount | $26,800,000 | 100.0% | Loan payoff | $2,897,874 | 10.8% | |||
| Reserves | 84,784 | 0.3 | ||||||
| Closing costs | 804,139 | 3.0 | ||||||
| Return of equity | 23,013,203 | 85.9 | ||||||
| Total Sources | $26,800,000 | 100.0% | Total Uses | $26,800,000 | 100.0% |
The Properties. The Security Self Storage Portfolio I Mortgage Loan is secured by the fee interests in seven self storage properties totaling 381,700 rentable square feet and located in two states: Texas (6 properties) and Colorado (1 property). The Security Self Storage Portfolio I Properties range in size from 48,160 square feet to 62,970 square feet and amenities include surveillance cameras, individual locks, keypad entry and on-site management. In addition, all of the Security Self Storage Portfolio I Properties with the exception of the West Jewell Avenue property have climate controlled units. As of October 8, 2013 the Security Self Storage Portfolio I Properties were 92.6% occupied.
The following table presents certain information relating to the Security Self Storage Portfolio I Properties:
| Property Name – Location | Allocated Cut-off Date Principal Balance | % of Portfolio Cut-off Date Principal Balance | Occupancy | Year Built/ Renovated | Net Rentable Area (SF) | Appraised Value | |||||
| Westheimer Road – Houston, TX | $4,911,554 | 18.3% | 93.2% | 1993/NAP | 57,375 | $6,900,000 | |||||
| Spring Valley Road – Dallas, TX | $4,555,645 | 17.0% | 91.5% | 1994/NAP | 62,970 | $6,400,000 | |||||
| Austin Highway – San Antonio, TX | $4,128,552 | 15.4% | 91.9% | 1994/NAP | 49,840 | $5,800,000 | |||||
| West Jewell Avenue – Lakewood, CO | $3,950,598 | 14.7% | 91.3% | 1996/NAP | 52,500 | $5,550,000 | |||||
| South Dairy Ashford Road – Houston, TX | $3,274,369 | 12.2% | 93.8% | 1994/NAP | 50,030 | $4,600,000 | |||||
| North Belt Line Road – Irving, TX | $3,060,823 | 11.4% | 93.4% | 1994/NAP | 60,825 | $4,300,000 | |||||
| West Avenue – San Antonio, TX | $2,918,459 | 10.9% | 92.9% | 1994/NAP | 48,160 | $4,100,000 | |||||
| Total/Weighted Average | $26,800,000 | 100.0% | 92.6% | 381,700 | $37,650,000 |
The following table presents historical occupancy percentages at the Security Self Storage Portfolio I Properties:
Historical Occupancy(1)
12/31/2010 | 12/31/2011 | 12/31/2012 | 10/8/2013 | |||
| 88.8% | 90.5% | 92.7% | 92.6% |
| (1) | Information obtained from the borrowers. |
Operating History and Underwritten Net Cash Flow. The following table presents certain information relating to the historical operating performance and the Underwritten Net Cash Flow at the Security Self Storage Portfolio I Properties:
Cash Flow Analysis
2011 | 2012 | TTM 8/31/2013 | U/W | U/W $ per SF | ||||||
| Base Rent | $4,295,893 | $4,504,384 | $4,643,798 | $4,626,202 | $12.12 | |||||
| Grossed Up Vacant Space | 0 | 0 | 0 | 373,752 | 0.98 | |||||
| Less Concessions | (224,107) | (243,564) | (263,568) | (263,568) | (0.69) | |||||
| Other Income | 154,321 | 172,958 | 171,211 | 171,211 | 0.45 | |||||
| Less Vacancy & Credit Loss | 0 | 0 | 0 | (495,570)(1) | (1.30) | |||||
| Effective Gross Income | $4,226,107 | $4,433,778 | $4,551,441 | $4,412,027 | $11.56 | |||||
| Total Operating Expenses | $1,680,783 | $1,666,392 | $1,670,007 | $1,752,205 | $4.59 | |||||
| Net Operating Income | $2,545,324 | $2,767,385 | $2,881,434 | $2,659,822 | $6.97 | |||||
| TI/LC | 0 | 0 | 0 | 0 | 0.00 | |||||
| Capital Expenditures | 0 | 0 | 0 | 69,137 | 0.18 | |||||
| Net Cash Flow | $2,545,324 | $2,767,385 | $2,881,434 | $2,590,685 | $6.79 | |||||
| NOI DSCR | 1.50x | 1.63x | 1.70x | 1.57x | ||||||
| NCF DSCR | 1.50x | 1.63x | 1.70x | 1.52x | ||||||
| NOI DY | 9.5% | 10.3% | 10.8% | 9.9% | ||||||
| NCF DY | 9.5% | 10.3% | 10.8% | 9.7% |
| (1) | The underwritten economic vacancy is 9.9%. The Security Self Storage Portfolio I Properties were 92.6% physically occupied as of October 8, 2013. |
THE INFORMATION IN THIS STRUCTURAL AND COLLATERAL TERM SHEET IS NOT COMPLETE AND MAY BE AMENDED PRIOR TO THE TIME OF SALE. THIS TERM SHEET IS NOT AN OFFER TO SELL THESE SECURITIES AND IT IS NOT A SOLICITATION OF AN OFFER TO BUY THESE SECURITIES IN ANY JURISDICTION WHERE THE OFFER OR SALE IS NOT PERMITTED.
77
| SECURITY SELF STORAGE PORTFOLIO I |
Appraisal. As of the appraisal valuation dates ranging from May 16, 2013 through August 26, 2013 the Security Self Storage Portfolio I Properties had an aggregate “as-is” appraised value of $37,650,000.
Environmental Matters. According to Phase I environmental assessments dated May 28, 2013 through September 3, 2013, recognized environmental conditions were identified at the West Jewell Avenue property. A former gasoline service station was located immediately northeast of the West Jewell Avenue property. Three groundwater monitoring wells were installed in 1997 and 1998, it was determined there was no significant risk to human and environmental health and a no action determination letter was issued by the Colorado Department of Public Health. The Phase I investigation recommended no further action.
The Borrower. The borrower is Security Portfolio I, LLC, a Delaware limited liability company and single purpose entity. James E. Harris Jr., Stephen L. Clark, the Stephen L. Clark Trust, Orlin E. Ard, Jr. and the Orlin E. Ard, Jr. Revocable Trust, the indirect owners of the borrower, are the guarantors of certain nonrecourse carveouts under the Security Self Storage Portfolio I Mortgage Loan.
The Sponsor. The sponsors are James E. Harris Jr., Stephen L. Clark and Orlin E. Ard, Jr. Stephen L. Clark and Orlin E. Ard Jr. founded Security Self Storage in 1979 and have developed over 50 facilities in seven states.
Escrows. The loan documents provide for an upfront escrow in the amount of $84,784 for deferred maintenance and ongoing monthly reserves in the amount of $5,761 for replacement reserves (subject to a cap of $138,274). The loan documents do not require monthly escrows for real estate taxes provided the following conditions are met: (i) no event of default has occurred and is continuing and (ii) the borrower has provided the lender with proof of timely payment of real estate taxes. The loan documents do not require monthly escrows for insurance provided the following conditions are met: (a) no event of default has occurred and is continuing; (b) the Security Self Storage Portfolio I Properties are covered by an acceptable blanket insurance policy; and (c) the Security Self Storage Portfolio I borrower provides the lender with evidence of renewal of the policies and timely proof of payment of insurance premiums.
Lockbox and Cash Management. Upon the occurrence of a Trigger Event (as defined below), the Security Self Storage Portfolio I Mortgage Loan requires that a lender-controlled lockbox account be established and the borrower will direct the property managers to deposit all rents directly into such lockbox account. The loan documents also require that upon an occurrence of a Trigger Event, all cash revenues and other monies received by the borrower or the property managers relating to the Security Self Storage Portfolio I Properties be deposited directly into the lockbox account.
A “Trigger Event” will commence upon the earlier of (i) the occurrence and continuance of an event of default; and (ii) the net cash flow debt service coverage ratio for the trailing 12-month period falling below 1.15x at the end of any calendar month. A Trigger Event will expire, with regard to circumstances in clause (i), upon the cure of such event of default (provided that a Trigger Event has not occurred and is not continuing pursuant to clause (ii)), or with regard to circumstances in clause (ii), upon the date that the net cash flow debt service coverage ratio is equal to or greater than 1.25x for two consecutive calendar quarters (provided that an event of default has not occurred and is continuing).
Property Management. The Security Self Storage Portfolio I Properties are managed by Landvest Corporation.
Assumption. The borrower has a three-time right to transfer the Security Self Storage Portfolio I Properties, in whole but not in part, provided that no event of default has occurred and is continuing and certain other conditions are satisfied, including: (i) the lender’s reasonable determination that the proposed transferee and guarantor satisfy the lender’s credit review and underwriting standards, taking into consideration transferee experience, financial strength and general business standing; (ii) execution of a recourse guaranty and an environmental indemnity by an affiliate of the transferee; and (iii) if requested by the lender, rating agency confirmation from Fitch, Moody’s and DBRS that the transfer will not result in a downgrade, withdrawal or qualification of the respective ratings assigned to the Series 2013-C17 Certificates.
Partial Release. Following the second anniversary of the issuance of the Series 2013-C17 Certificates, the borrower is permitted to partially release any constituent properties in connection with a partial defeasance, subject to certain conditions including (i) having the principal balance reduced by the greater of (a) 100% of net proceeds of the sale of the release property; and (b) 125% of the released property’s allocated loan balance; (ii) the loan-to-value ratio with respect to the remaining properties will be no greater than the lesser of (a) 70.0%; and (b) the combined loan-to-value ratio of all properties prior to release; (iii) the net cash flow debt service coverage ratio with respect to the remaining properties will be no less than the greater of (a) 1.45x; and (b) the combined net cash flow debt service coverage ratio of all properties prior to release; (iv) the net cash flow debt yield with respect to the remaining properties will be no less than 10.0%; and (v) the lender receives rating agency confirmation from Fitch, Moody’s and DBRS that the release will not result in a downgrade, withdrawal or qualification of the respective ratings assigned to the Series 2013-C17 Certificates.
Real Estate Substitution. Not permitted.
Subordinate and Mezzanine Indebtedness. There is no existing mezzanine debt in place related to the Security Self Storage Portfolio I Mortgage Loan; however, future mezzanine debt is permitted at any time prior to October 21, 2022, subject to the satisfaction of certain conditions, including: (i) no event of default has occurred and is continuing; (ii) the lender receives no less than 30 days prior written notice; (iii) an intercreditor agreement in form and substance acceptable to Fitch, Moody’s, DBRS and any other rating agencies rating securities backed by the Security Self Storage Portfolio I Mortgage Loan and reasonably acceptable to the lender; (iv) the combined loan-to-value ratio will not be greater than or equal to 70.0%; (v) the combined net cash flow debt service coverage ratio will not be less than 1.35x; (vi) the combined net cash flow debt yield will not be less than 10.5%; and (vii)
THE INFORMATION IN THIS STRUCTURAL AND COLLATERAL TERM SHEET IS NOT COMPLETE AND MAY BE AMENDED PRIOR TO THE TIME OF SALE. THIS TERM SHEET IS NOT AN OFFER TO SELL THESE SECURITIES AND IT IS NOT A SOLICITATION OF AN OFFER TO BUY THESE SECURITIES IN ANY JURISDICTION WHERE THE OFFER OR SALE IS NOT PERMITTED.
78
| SECURITY SELF STORAGE PORTFOLIO I |
mezzanine loan documents acceptable to Fitch, Moody’s, DBRS and reasonably acceptable to the lender will have been delivered to the lender.
Ground Lease. None.
Terrorism Insurance. The loan documents require that the “all risk” insurance policy required to be maintained by the borrower provide coverage for terrorism in an amount equal to the full replacement cost of Security Self Storage Portfolio I Properties, as well as business interruption insurance covering no less than the 12-month period following the occurrence of a casualty event, together with a six-month extended period of indemnity.
Windstorm/Flood Insurance. The loan documents require windstorm insurance covering the full replacement cost of the Security Self Storage Portfolio I Properties.
THE INFORMATION IN THIS STRUCTURAL AND COLLATERAL TERM SHEET IS NOT COMPLETE AND MAY BE AMENDED PRIOR TO THE TIME OF SALE. THIS TERM SHEET IS NOT AN OFFER TO SELL THESE SECURITIES AND IT IS NOT A SOLICITATION OF AN OFFER TO BUY THESE SECURITIES IN ANY JURISDICTION WHERE THE OFFER OR SALE IS NOT PERMITTED.
79
(THIS PAGE INTENTIONALLY LEFT BLANK)
80
| THE BARLOW |

THE INFORMATION IN THIS STRUCTURAL AND COLLATERAL TERM SHEET IS NOT COMPLETE AND MAY BE AMENDED PRIOR TO THE TIME OF SALE. THIS TERM SHEET IS NOT AN OFFER TO SELL THESE SECURITIES AND IT IS NOT A SOLICITATION OF AN OFFER TO BUY THESE SECURITIES IN ANY JURISDICTION WHERE THE OFFER OR SALE IS NOT PERMITTED.
81
| THE BARLOW |
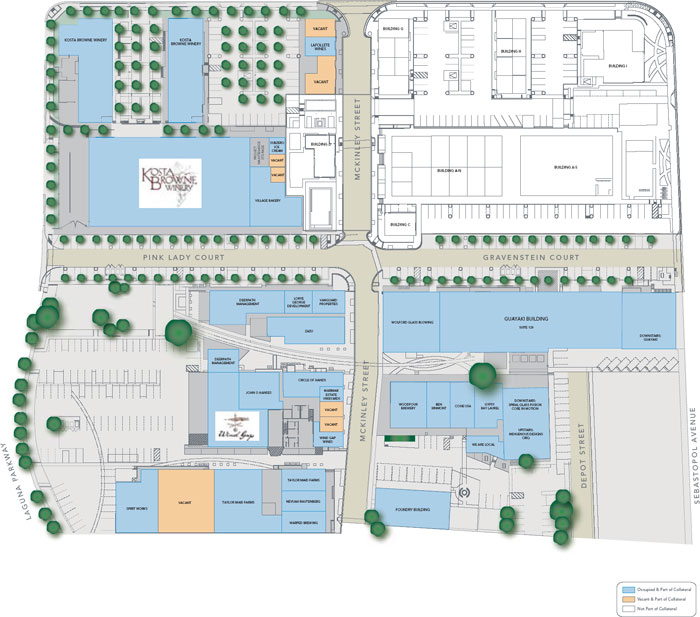
THE INFORMATION IN THIS STRUCTURAL AND COLLATERAL TERM SHEET IS NOT COMPLETE AND MAY BE AMENDED PRIOR TO THE TIME OF SALE. THIS TERM SHEET IS NOT AN OFFER TO SELL THESE SECURITIES AND IT IS NOT A SOLICITATION OF AN OFFER TO BUY THESE SECURITIES IN ANY JURISDICTION WHERE THE OFFER OR SALE IS NOT PERMITTED.
82
| THE BARLOW |
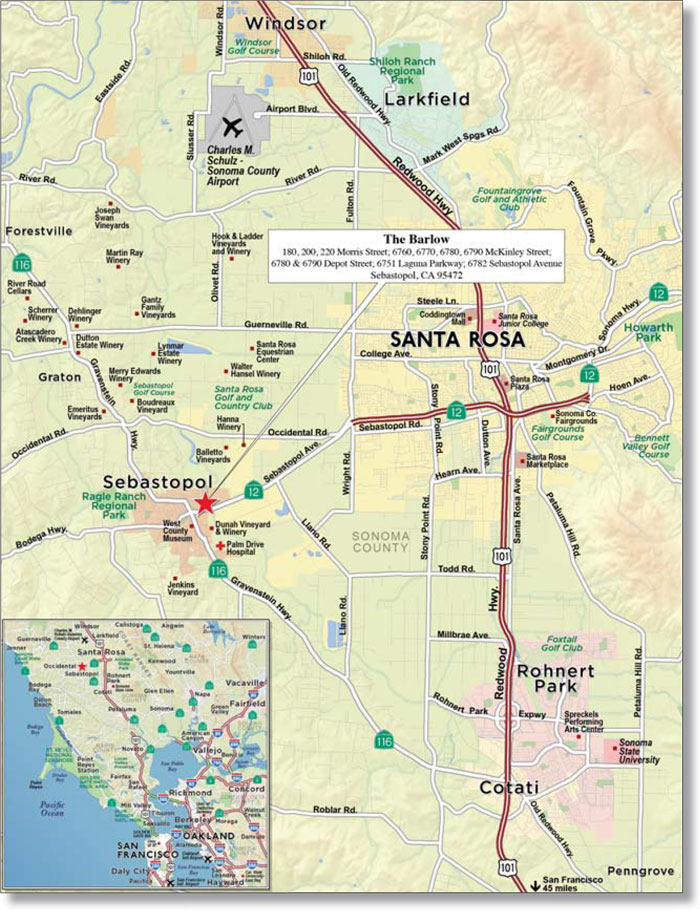
THE INFORMATION IN THIS STRUCTURAL AND COLLATERAL TERM SHEET IS NOT COMPLETE AND MAY BE AMENDED PRIOR TO THE TIME OF SALE. THIS TERM SHEET IS NOT AN OFFER TO SELL THESE SECURITIES AND IT IS NOT A SOLICITATION OF AN OFFER TO BUY THESE SECURITIES IN ANY JURISDICTION WHERE THE OFFER OR SALE IS NOT PERMITTED.
83
| No. 8 – The Barlow | |||||||
| Loan Information | Property Information | ||||||
| Mortgage Loan Seller: | Wells Fargo Bank, National Association | Single Asset/Portfolio: | Single Asset | ||||
| Credit Assessment (Fitch/Moody’s/DBRS): | NR/NR/NR | Property Type: | Mixed Use | ||||
| Original Principal Balance: | $23,800,000 | Specific Property Type: | Industrial/Retail | ||||
| Cut-off Date Principal Balance: | $23,800,000 | Location: | Sebastopol, CA | ||||
| % of Initial Pool Balance: | 2.6% | Size: | 174,901 SF | ||||
| Loan Purpose: | Refinance | Cut-off Date Principal Balance Per SF: | $136.08 | ||||
| Borrower Name: | Barlow Sebastopol, LLC | Year Built/Renovated(2): | Various/Various | ||||
| Sponsors: | Bernard Aldridge; Donna Aldridge | Title Vesting: | Fee | ||||
| Mortgage Rate: | 4.500% | Property Manager: | Self-managed | ||||
| Note Date: | October 25, 2013 | 3rd Most Recent Occupancy(3): | NAV | ||||
| Anticipated Repayment Date: | NAP | 2nd Most Recent Occupancy(3): | NAV | ||||
| Maturity Date: | November 1, 2018 | Most Recent Occupancy(3): | NAV | ||||
| IO Period: | 12 months | Current Occupancy (As of)(4): | 95.3% (10/4/2013) | ||||
| Loan Term (Original): | 60 months | ||||||
| Seasoning: | 0 months | Underwriting and Financial Information: | |||||
| Amortization Term (Original): | 360 months | ||||||
| Loan Amortization Type: | Interest-only, Amortizing Balloon | 3rd Most Recent NOI (As of)(5): | NAV | ||||
| Interest Accrual Method: | Actual/360 | 2nd Most Recent NOI (As of)(5): | NAV | ||||
| Call Protection: | L(24),D(32),O(4) | Most Recent NOI (As of): | $2,039,968 (T-3 Annualized 9/30/2013) | ||||
| Lockbox Type: | Soft/Springing Cash Management | ||||||
| Additional Debt: | None | ||||||
| Additional Debt Type: | NAP | U/W Revenues(5): | $3,146,030 | ||||
| U/W Expenses: | $851,992 | ||||||
U/W NOI(5): | $2,294,038 | ||||||
Escrows and Reserves(1): | U/W NCF: | $2,142,085 | |||||
| U/W NOI DSCR: | 1.59x | ||||||
Type: | Initial | Monthly | Cap (If Any) | U/W NCF DSCR: | 1.48x | ||
| Taxes | $23,036 | $11,518 | NAP | U/W NOI Debt Yield: | 9.6% | ||
| Insurance | $114,318 | $24,832 | NAP | U/W NCF Debt Yield: | 9.0% | ||
| Replacement Reserves | $0 | $2,186 | $52,470 | As-Is Appraised Value: | $35,210,000 | ||
| TI/LC Reserve | $0 | $8,281 | $298,116 | As-Is Appraisal Valuation Date: | October 2, 2013 | ||
| Tenant Specific Reserve | $443,250 | $0 | NAP | Cut-off Date LTV Ratio: | 67.6% | ||
| Environmental Reserve | $143,125 | $0 | NAP | LTV Ratio at Maturity or ARD: | 63.1% | ||
| (1) | See “Escrows” section. |
| (2) | Six buildings were constructed between 1910 and 1958 and renovated in 2012; the other four buildings were newly constructed in 2012. |
| (3) | See “Historical Occupancy” section. |
| (4) | Current Occupancy includes seven tenants who are not yet paying rent or open for business totalling 17,804 square feet (10.2% of net rentable square feet) and $343,249 of the Annual U/W Base Rent (14.4% of Total Annual U/W Base Rent). An upfront reserve totalling $443,250 is in place for all rent and any outstanding TI/LC costs. |
| (5) | See “Cash Flow Analysis” section. |
The Mortgage Loan. The mortgage loan (the “The Barlow Mortgage Loan”) is evidenced by a single promissory note that is secured by a first mortgage encumbering a mixed use industrial/retail center located in Sebastopol, California (“The Barlow Property”). The Barlow Mortgage Loan was originated on October 25, 2013 by Wells Fargo Bank, National Association. The Barlow Mortgage Loan had an original principal balance of $23,800,000, has an outstanding principal balance as of the Cut-off Date of $23,800,000 and accrues interest at an interest rate of 4.500% per annum. The Barlow Mortgage Loan had an initial term of 60 months, has a remaining term of 60 months as of the Cut-off Date and requires interest-only payments for the first 12 payments following origination and, thereafter, requires payments of principal and interest based on a 30-year amortization schedule. The Barlow Mortgage Loan matures on November 1, 2018.
Following the lockout period, the borrower has the right to defease The Barlow Mortgage Loan in whole, but not in part, on any date before August 1, 2018. In addition, The Barlow Mortgage Loan is prepayable without penalty on or after August 1, 2018.
THE INFORMATION IN THIS STRUCTURAL AND COLLATERAL TERM SHEET IS NOT COMPLETE AND MAY BE AMENDED PRIOR TO THE TIME OF SALE. THIS TERM SHEET IS NOT AN OFFER TO SELL THESE SECURITIES AND IT IS NOT A SOLICITATION OF AN OFFER TO BUY THESE SECURITIES IN ANY JURISDICTION WHERE THE OFFER OR SALE IS NOT PERMITTED.
84
| THE BARLOW |
Sources and Uses
| Sources | Uses | ||||||||
| Original loan amount | $23,800,000 | 97.3% | Loan payoff | $23,206,180 | 94.9% | ||||
| Sponsor’s new cash contribution | 662,458 | 2.7% | Reserves | 723,729 | 3.0 | ||||
| Closing costs | 532,549 | 2.2 | |||||||
| Total Sources | $24,462,458 | 100.0% | Total Uses | $24,462,458 | 100.0% |
The Property. The Barlow Property is a mixed use industrial/retail center containing approximately 174,901 square feet and located in Sebastopol, California. Originally constructed in 1910 and 1944 through 1958 as an industrial park, The Barlow Property underwent significant renovation and construction in 2012 and now features a modern, eclectic mix of warehouse, production, distribution and retail uses. Six buildings, totaling 119,438 square feet (68.3% of net rentable square feet) were fully renovated, while the other four buildings totaling 55,463 square feet (31.7% of net rentable square feet) are recent construction. Inspired by nationally acclaimed projects such as the Ferry Building in San Francisco and Chelsea Marketplace in New York, The Barlow Property is a place where consumers can buy directly from manufacturers, with a tenancy that includes wine makers, food producers and artisans, creating a space that offers a meeting place and forms a synergy amongst the makers of the regions products and consumers. The Barlow Property features approximately 59,467 square feet (34.0% of net rentable square feet) of warehouse space, 45,873 square feet (26.2% of net rentable square feet) of manufacturing/retail space, 45,581 square feet (26.1% of net rentable square feet) of winery space and 23,980 square feet (13.7% of net rentable square feet) of retail/restaurant space. The Barlow Property is situated on a 9.2-acre parcel, adjacent to and directly east of downtown Sebastopol, with parking provided by approximately 416 surface parking spaces, resulting in a parking ratio of 2.4 spaces per 1,000 square feet of rentable area. As of October 4, 2013, The Barlow Property was 95.3% leased to 30 tenants.
The following table presents certain information relating to the tenancies at The Barlow Property:
Major Tenants
| Tenant Name | Credit Rating (Fitch/ Moody’s/ S&P) | Tenant NRSF | % of NRSF | Annual U/W Base Rent PSF | Annual U/W Base Rent | % of Total Annual U/W Base Rent | Lease Expiration Date | |
| Major Tenants | ||||||||
Kosta Browne Winery(1) | NR/NR/NR | 45,581 | 26.1% | $16.52 | $753,180 | 31.6% | 5/31/2020 | |
| Guayaki | NR/NR/NR | 27,944 | 16.0% | $11.67 | $325,988 | 13.7% | 6/30/2016 | |
| Wind Gap Wines | NR/NR/NR | 12,106 | 6.9% | $9.49 | $114,885 | 4.8% | 9/30/2017 | |
| Spirit Works | NR/NR/NR | 8,417 | 4.8% | $12.00 | $101,004 | 4.2% | 1/31/2021 | |
| Taylor Maid Farms | NR/NR/NR | 8,926 | 5.1% | $11.17 | $99,744 | 4.2% | 5/31/2022 | |
| Total Major Tenants | 102,974 | 58.9% | $13.55 | $1,394,801 | 58.6% | |||
Non-Major Tenants(2) | 63,789 | 36.5% | $15.45 | $985,249 | 41.4% | |||
| Occupied Collateral Total | 166,763 | 95.3% | $14.27 | $2,380,050 | 100.0% | |||
| Vacant Space | 8,138 | 4.7% | ||||||
| Collateral Total | 174,901 | 100.0% | ||||||
| (1) | Kosta Browne Winery has the option to purchase its premises in between January and February 2018, as further detailed in the “KB Release and Purchase Option” section. |
| (2) | Non-Major Tenants included in occupancy but not yet paying rent or open for business total 17,804 square feet (10.2% of net rentable square feet) and $343,249 of the Annual U/W Base Rent (14.4% of Total Annual U/W Base Rent) and include: Vanguard Properties, Cosie USA, John O Hanses, Subzero Ice Cream, Village Bakery, Indigenous Designs and Cirq. An upfront reserve totaling $443,250 is in place for all rent and any outstanding TI/LC costs ($100,000 of the $443,250). |
THE INFORMATION IN THIS STRUCTURAL AND COLLATERAL TERM SHEET IS NOT COMPLETE AND MAY BE AMENDED PRIOR TO THE TIME OF SALE. THIS TERM SHEET IS NOT AN OFFER TO SELL THESE SECURITIES AND IT IS NOT A SOLICITATION OF AN OFFER TO BUY THESE SECURITIES IN ANY JURISDICTION WHERE THE OFFER OR SALE IS NOT PERMITTED.
85
| THE BARLOW |
The following table presents certain information relating to the lease rollover schedule at The Barlow Property:
Lease Expiration Schedule(1)
Year Ending December 31, | No. of Leases Expiring | Expiring NRSF | % of Total NRSF | Cumulative Expiring NRSF | Cumulative % of Total NRSF | Annual U/W Base Rent | Annual U/W Base Rent PSF(2) | |||||||
| MTM | 0 | 0 | 0.0% | 0 | 0.0% | $0 | $0.00 | |||||||
| 2013 | 1 | 4,191 | 2.4% | 4,191 | 2.4% | $62,868 | $15.00 | |||||||
| 2014 | 0 | 0 | 0.0% | 4,191 | 2.4% | $0 | $0.00 | |||||||
| 2015 | 2 | 6,027 | 3.4% | 10,218 | 5.8% | $68,444 | $11.36 | |||||||
| 2016 | 7 | 45,856 | 26.2% | 56,074 | 32.1% | $551,647 | $12.03 | |||||||
| 2017 | 4 | 20,371 | 11.6% | 76,445 | 43.7% | $235,241 | $11.55 | |||||||
| 2018 | 9 | 15,961 | 9.1% | 92,406 | 52.8% | $329,806 | $20.66 | |||||||
| 2019 | 0 | 0 | 0.0% | 92,406 | 52.8% | $0 | $0.00 | |||||||
| 2020 | 4 | 53,350 | 30.5% | 145,756 | 83.3% | $873,012 | $16.36 | |||||||
| 2021 | 1 | 8,417 | 4.8% | 154,173 | 88.1% | $101,004 | $12.00 | |||||||
| 2022 | 1 | 8,926 | 5.1% | 163,099 | 93.3% | $99,744 | $11.17 | |||||||
| 2023 | 0 | 0 | 0.0% | 163,099 | 93.3% | $0 | $0.00 | |||||||
| Thereafter | 1 | 3,664 | 2.1% | 166,763 | 95.3% | $58,284 | $15.91 | |||||||
| Vacant | 0 | 8,138 | 4.7% | 174,901 | 100.0% | $0 | $0.00 | |||||||
| Total/Weighted Average | 30 | 174,901 | 100.0% | $2,380,050 | $14.27 |
| (1) | Information obtained from the underwritten rent roll. |
| (2) | Weighted Average Annual U/W Base Rent PSF excludes vacant space. |
The following table presents historical occupancy percentages at The Barlow Property:
Historical Occupancy
12/31/2010 | 12/31/2011 | 12/31/2012 | 10/4/2013 | |||
NAV(1) | NAV(1) | NAV(1) | 95.3%(2) |
| (1) | Historical Occupancy is not available as The Barlow Property was undergoing renovations to the six existing buildings. Further, four of the buildings were not constructed until 2012. |
| (2) | Current Occupancy includes seven tenants who are not yet paying rent or open for business totalling 17,804 square feet (10.2% of net rentable square feet) and $343,249 of the Annual U/W Base Rent (14.4% of Total Annual U/W Base Rent). An upfront reserve totalling $443,250 is in place for all rent and any outstanding TI/LC costs. |
Operating History and Underwritten Net Cash Flow. The following table presents certain information relating to the historical operating performance and Underwritten Net Cash Flow at The Barlow Property:
Cash Flow Analysis(1)
| T3 Annualized 9/30/2013 | U/W(2) | U/W $ per SF | ||
| Base Rent | $2,091,228 | $2,380,050 | $13.61 | |
| Grossed Up Vacant Space | 0 | 184,590 | 1.06 | |
| Percentage Rent | 0 | 0 | 0.00 | |
| Total Reimbursables | 564,592 | 778,868 | 4.45 | |
| Other Income | 6,408 | 0 | 0.00 | |
| Less Vacancy & Credit Loss | 0 | (197,477) | (1.13) | |
| Effective Gross Income | $2,662,228 | $3,146,030 | $17.99 | |
| Total Operating Expenses | $622,260 | $851,992 | $4.87 | |
| Net Operating Income | $2,039,968 | $2,294,038 | $13.12 | |
| TI/LC | 0 | 125,718 | 0.72 | |
| Capital Expenditures | 0 | 26,235 | 0.15 | |
| Net Cash Flow | $2,039,968 | $2,142,085 | $12.25 | |
| NOI DSCR | 1.41x | 1.59x | ||
| NCF DSCR | 1.41x | 1.48x | ||
| NOI DY | 8.6% | 9.6% | ||
| NCF DY | 8.6% | 9.0% |
| (1) | Historical Cash Flow is not available as The Barlow Property was undergoing renovations to the six existing buildings. Further, four of the buildings were not constructed until 2012. An upfront reserve totalling $443,250 is in place for all rent and any outstanding TI/LC costs. |
| (2) | The increase in U/W Effective Gross Income and Net Operating Income is due to seven tenants who have signed leases but are not yet in occupancy or paying rent. These tenants comprise 17,804 square feet (10.2% of net rentable square feet) and $343,249 of the Annual U/W Base Rent (14.4% of Total Annual U/W Base Rent). |
THE INFORMATION IN THIS STRUCTURAL AND COLLATERAL TERM SHEET IS NOT COMPLETE AND MAY BE AMENDED PRIOR TO THE TIME OF SALE. THIS TERM SHEET IS NOT AN OFFER TO SELL THESE SECURITIES AND IT IS NOT A SOLICITATION OF AN OFFER TO BUY THESE SECURITIES IN ANY JURISDICTION WHERE THE OFFER OR SALE IS NOT PERMITTED.
86
| THE BARLOW |
Appraisal. As of the appraisal valuation date of October 2, 2013, The Barlow Property had an “as-is” appraised value of $35,210,000 and an “as-stabilized” appraised value of $35,720,000 as of an effective date of March 2, 2014.
Environmental Matters. According to the Phase I environmental site assessment (“ESA”) dated June 26, 2013, recognized environmental conditions and historical recognized environmental conditions were identified. Four underground storage tanks (“UST”) were removed from The Barlow Property between 1985 and 1992. From 1991 through 2012 soil vapor extraction and excavation remediation was performed. The results of the Phase I ESA recommended no further action other than continued monitoring of the remedial status and cooperation with regulatory oversight associated with the open leaking underground storage tank (“LUST”) case. See “Escrows” for further detail on the additional remediation.
Market Overview and Competition. The Barlow Property is located in Sebastopol, California, approximately seven miles west of Santa Rosa and 60 miles north of San Francisco, in the heart of Sonoma County’s premium wine producing regions. The Barlow Property is located in downtown Sebastopol near the intersection of Highway 12 and Highway 116, primary thoroughfares in the region connecting Santa Rosa to the coast. The average daily traffic count at the intersection of Highway 12 (Sebastopol Avenue) and Morris Street is 28,000 cars per day. The Barlow Property is located adjacent to complementary retail uses including a Whole Foods, a nine screen movie theater, restaurants and boutique retailers and directly east of downtown Sebastopol. Major demand generators for Sonoma County are the wine industry, government employment and recreation and tourism. According a local tourism report, more than 7 million visitors come to Sonoma County annually, and overnight visitors spend $292 per day, less than half of which is spent on lodging.” According to the appraisal, as of 2013, the estimated population and household income within a five-mile radius of The Barlow Property was approximately 68,009 and $72,286, respectively.
Due to the mixed-use nature of The Barlow Property, the appraisal analyzed both industrial and retail information. According to the appraisal, The Barlow Property is located within the Sebastopol/Bodego/West industrial submarket in the Marin/Sonoma County Market. As of the second quarter of 2013, the submarket reports an estimated inventory of 1.6 million square feet with a 4.6% vacancy rate and average asking rents of $6.86 per square foot, on a triple net basis. According to the appraisal, The Barlow Property is located within the Sebastopol retail submarket in the Sonoma County Market. As of the second quarter of 2013, the submarket reports an estimated inventory of 592,604 square feet with a 1.6% vacancy rate. The appraiser concluded to a market retail rent of $27.00 per square foot, on a triple net basis.
The Borrower. The borrower is Barlow Sebastopol LLC, a Delaware limited liability company and single purpose entity. Legal counsel delivered a non-consolidation opinion in connection with the origination of The Barlow Mortgage Loan. Bernard Aldridge and Donna Aldridge, the loan sponsors, are the guarantors of certain nonrecourse carveouts under The Barlow Mortgage Loan.
The Sponsor. The loan sponsors are Bernard Aldridge and Donna Aldridge. Mr. Aldridge began his career in real estate in 1992 and his previous real estate holdings include 143 single family/condominiums, a 50-unit multifamily property and a 10,000 square foot office building in Santa Rosa, California, as well as a 45,000 square foot mixed use (office/retail) property in Boulder, Colorado.
Escrows. The loan documents provide for upfront escrows in the amount of $23,036 for real estate taxes, $114,318 for insurance, $443,250 for outstanding rent and tenant improvements and leasing commissions associated with tenants not yet in occupancy or paying rent ($100,000 is for outstanding tenant improvements and leasing commissions), and $143,125 for certain environmental testing. The borrower must engage an environmental consultant to complete a vapor encroachment screening (and any other necessary tests) associated with the leaking underground storage tank (“LUST”) at The Barlow Property. If a vapor encroachment condition (“VEC”) exists that requires mitigation, the borrower must install a vapor mitigation system at The Barlow Property and appropriately remediate any environmental hazard, at the borrower’s sole expense, no later than 180 days after The Barlow Mortgage Loan closing date. The loan documents also provide for ongoing monthly escrow deposits of $11,518 for real estate taxes, $24,832 for insurance, $2,186 for replacement reserves (capped at $52,470) and $8,281 for ongoing tenant improvements and leasing commissions (capped at $298,116).
Lockbox and Cash Management. The Barlow Mortgage Loan requires a lender-controlled lockbox account, which is already in place, and that all rents received by the borrower or the property manager be deposited into the lockbox account within one business day of receipt. Other than during a Cash Trap Event Period (as defined below), all funds on deposit are disbursed to the borrower.
A “Cash Trap Event Period” will commence upon the earlier of (i) the occurrence and continuance of an event of default; (ii) the amortizing DSCR falling below 1.20x at the end of any calendar quarter; or (iii) the occurrence and continuance of a Kosta Browne Winery (“KB”) Sweep Period (as defined below). A Cash Trap Event Period will end, with regard to the circumstances in clause (i), upon the cure of such event of default; with regard to the circumstances in clause (ii), upon the date that the amortizing DSCR is equal to or greater than 1.20x for two consecutive calendar quarters; with regard to the circumstances in clause (iii), upon the occurrence of a KB Sweep Period Cure (as defined below).
A “KB Sweep Period” will commence upon (i) KB being in monetary or material non-monetary default under its lease; (ii) the commencement of any bankruptcy or insolvency proceedings against KB; (iii) KB vacating or ceasing business operations in any portion of its space; and (iv) KB failing to give notice of lease renewal 12 months prior to its lease expiration date. If the KB Release (as defined below) has occurred, there shall not be a KB Sweep Period.
THE INFORMATION IN THIS STRUCTURAL AND COLLATERAL TERM SHEET IS NOT COMPLETE AND MAY BE AMENDED PRIOR TO THE TIME OF SALE. THIS TERM SHEET IS NOT AN OFFER TO SELL THESE SECURITIES AND IT IS NOT A SOLICITATION OF AN OFFER TO BUY THESE SECURITIES IN ANY JURISDICTION WHERE THE OFFER OR SALE IS NOT PERMITTED.
87
| THE BARLOW |
A “KB Sweep Period Cure” means, with regard to the circumstances in clause (i), two consecutive calendar quarters after the cure of the applicable default; with regard to the circumstances in clause (ii), upon the date on which a plan of reorganization is confirmed in which KB affirms the lease; with regard to the circumstances in clause (iii), upon KB resuming business operations in the space vacated for three consecutive months; and with regard to the circumstances in clause (iv), upon KB renewing the lease for the entire premises on terms and conditions satisfactory to the lender. Generally, a KB Sweep Period Cure will also occur on the date an acceptable replacement tenant enters into a new lease for the entire KB premises, takes occupancy and commences paying rent or upon the closing of the KB Release.
Property Management. The Barlow Property is self-managed by an affiliate of the borrower.
Assumption. The borrower has a two-time right to transfer The Barlow Property, provided that no event of default has occurred and is continuing and certain other conditions are satisfied, including, but not limited to the following: (i) the lender’s reasonable determination that the proposed transferee and guarantor satisfy the lender’s credit review and underwriting standards, taking into consideration transferee experience, financial strength and general business standing; (ii) execution of a recourse guaranty and an environmental indemnity by an affiliate of the transferee; and (iii) if requested by the lender, rating agency confirmation from Fitch, Moody’s and DBRS that the transfer will not result in a downgrade, withdrawal or qualification of the respective ratings assigned to the Series 2013-C17 Certificates.
KB Release and Purchase Option. KB has an option to purchase its leased premises (the “KB Premises”) from January 1, 2018 to February 28, 2018 with six months’ prior notice, subject to certain conditions, including: (i) KB’s continuing to be in occupancy and not in default under its lease; and (ii) satisfaction of the KB Financial Covenants (as defined below). The option price will be based on an appraisal and allows KB to purchase the KB Premises for a minimum price of $10.5 million and a maximum price of $12.5 million. The option may not be assigned. The allocated loan amount for the KB Premises is $7.9 million.
Provided no event of default exists, The Barlow Mortgage Loan documents provide for a one-time right, to be exercised concurrently with the KB purchase option, to release of the KB Premises from the lien of The Barlow Mortgage Loan after the expiration of the lockout period (the “KB Release”) in connection with a partial defeasance, subject to the following conditions: (i) a defeasance amount equal to the sum of (a) $9.48 million, and (b) the greater of (1) 50.0% of the net proceeds of the sale (no less than 94% of the gross sales proceeds) in excess of $9.48 million, or (2) the amount necessary to satisfy the KB Financial Covenants, and (c) any net proceeds remaining after credit to the borrower for actual defeasance costs; and (ii) after giving effect to the release, (a) the amortizing DSCR of the remainder of The Barlow Property must be not less than the greater of 1.30x or the amortizing DSCR immediately prior to the release; (b) the NCF debt yield for the remainder of The Barlow Property must be not less than the greater of 9.25% or the NCF debt yield immediately prior to the release; (c) the “As Is” LTV ratio of the remainder of The Barlow Property must be not greater than the lesser of 65.0% or the LTV ratio immediately prior to the release (collectively, the “KB Financial Covenants”); (d) written evidence that the KB Premises has been legally subdivided from The Barlow Property, and the remaining The Barlow Property represents a separate legal tax parcel; (e) rating agency confirmation from Fitch, Moody’s and DBRS that the release will not result in a downgrade, withdrawal or qualification of the respective ratings assigned to the Series 2013-C17 certificates and (f) the delivery of a legal opinion to the lender to demonstrate the release of the KB Premises will satisfy REMIC requirements. Notwithstanding the foregoing, provided that the tests described above are met, the borrower may utilize up to 50.0% of the difference between the sale proceeds and the $9.48 million toward the payment of any defeasance costs described above and no portion of the sale proceeds shall be delivered to the borrower.
Partial Release. Except as otherwise outlined above, not permitted.
Real Estate Substitution. Not permitted.
Subordinate and Mezzanine Indebtedness. Not permitted.
Ground Lease. None.
Terrorism Insurance. The loan documents require that the “all risk” insurance policy required to be maintained by the borrower provides coverage for terrorism in an amount equal to the full replacement cost of The Barlow Property. The loan documents also require business interruption insurance covering no less than the 12-month period following the occurrence of a casualty event, together with a six-month extended period of indemnity.
Earthquake Insurance. The lender did not require an earthquake insurance policy at the time of closing. Based on the seismic study, the probable maximum loss (PML) was 11%.
THE INFORMATION IN THIS STRUCTURAL AND COLLATERAL TERM SHEET IS NOT COMPLETE AND MAY BE AMENDED PRIOR TO THE TIME OF SALE. THIS TERM SHEET IS NOT AN OFFER TO SELL THESE SECURITIES AND IT IS NOT A SOLICITATION OF AN OFFER TO BUY THESE SECURITIES IN ANY JURISDICTION WHERE THE OFFER OR SALE IS NOT PERMITTED.
88
(THIS PAGE INTENTIONALLY LEFT BLANK)
89
(THIS PAGE INTENTIONALLY LEFT BLANK)
90
| ROCKWALL MARKET CENTER |
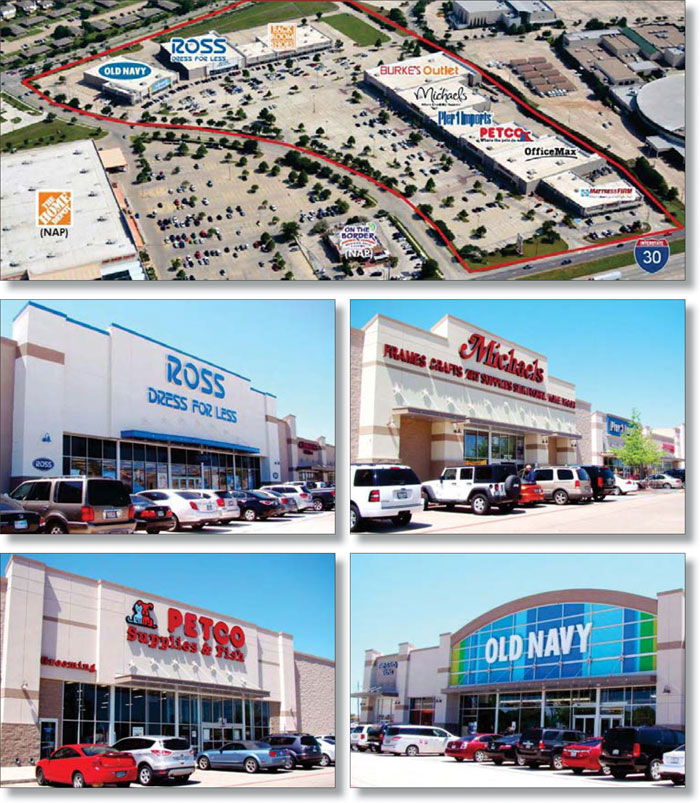
THE INFORMATION IN THIS STRUCTURAL AND COLLATERAL TERM SHEET IS NOT COMPLETE AND MAY BE AMENDED PRIOR TO THE TIME OF SALE. THIS TERM SHEET IS NOT AN OFFER TO SELL THESE SECURITIES AND IT IS NOT A SOLICITATION OF AN OFFER TO BUY THESE SECURITIES IN ANY JURISDICTION WHERE THE OFFER OR SALE IS NOT PERMITTED.
91
| ROCKWALL MARKET CENTER |
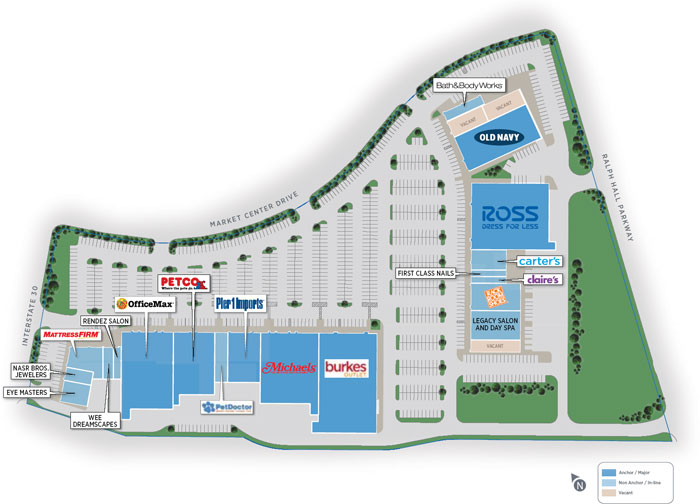
THE INFORMATION IN THIS STRUCTURAL AND COLLATERAL TERM SHEET IS NOT COMPLETE AND MAY BE AMENDED PRIOR TO THE TIME OF SALE. THIS TERM SHEET IS NOT AN OFFER TO SELL THESE SECURITIES AND IT IS NOT A SOLICITATION OF AN OFFER TO BUY THESE SECURITIES IN ANY JURISDICTION WHERE THE OFFER OR SALE IS NOT PERMITTED.
92
| ROCKWALL MARKET CENTER |
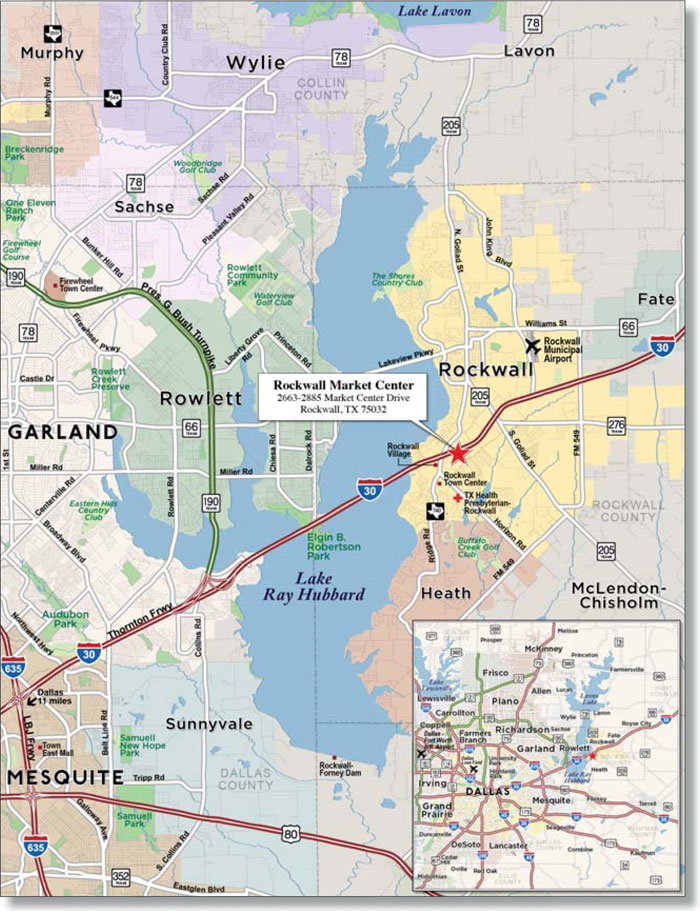
THE INFORMATION IN THIS STRUCTURAL AND COLLATERAL TERM SHEET IS NOT COMPLETE AND MAY BE AMENDED PRIOR TO THE TIME OF SALE. THIS TERM SHEET IS NOT AN OFFER TO SELL THESE SECURITIES AND IT IS NOT A SOLICITATION OF AN OFFER TO BUY THESE SECURITIES IN ANY JURISDICTION WHERE THE OFFER OR SALE IS NOT PERMITTED.
93
| No. 9 – Rockwall Market Center | |||||||
| Loan Information | Property Information | ||||||
| Mortgage Loan Seller: | Wells Fargo Bank, National Association | Single Asset/Portfolio: | Single Asset | ||||
| Credit Assessment (Fitch/Moody’s/DBRS): | NR/NR/NR | Property Type: | Retail | ||||
| Original Principal Balance: | $23,070,000 | Specific Property Type: | Anchored | ||||
| Cut-off Date Principal Balance: | $23,070,000 | Location: | Rockwall, TX | ||||
| % of Initial Pool Balance: | 2.6% | Size: | 209,054 SF | ||||
| Loan Purpose: | Acquisition | Cut-off Date Principal Balance Per SF: | $110.35 | ||||
| Borrower Name: | Rockwall Dunhill LLC | Year Built/Renovated: | 1999/NAP | ||||
| Sponsor: | William L. Hutchinson | Title Vesting: | Fee | ||||
| Mortgage Rate: | 5.030% | Property Manager: | Self-managed | ||||
| Note Date: | October 11, 2013 | 3rd Most Recent Occupancy(2): | NAV | ||||
| Anticipated Repayment Date: | NAP | 2nd Most Recent Occupancy (As of): | 75.0% (12/31/2011) | ||||
| Maturity Date: | November 1, 2023 | Most Recent Occupancy (As of): | 79.0% (12/31/2012) | ||||
| IO Period: | 48 months | Current Occupancy (As of): | 94.5% (8/31/2013) | ||||
| Loan Term (Original): | 120 months | ||||||
| Seasoning: | 0 months | Underwriting and Financial Information: | |||||
| Amortization Term (Original): | 360 months | ||||||
| Loan Amortization Type: | Interest-only, Amortizing Balloon | 3rd Most Recent NOI (As of): | $1,912,948 (T6 Annualized 12/31/2011) | ||||
| Interest Accrual Method: | Actual/360 | 2nd Most Recent NOI (As of): | $1,917,697 (12/31/2012) | ||||
| Call Protection: | L(24),D(92),O(4) | Most Recent NOI (As of): | $1,913,515 (TTM 8/31/2013) | ||||
| Lockbox Type: | Hard/Springing Cash Management | ||||||
| Additional Debt: | None | ||||||
| Additional Debt Type: | NAP | ||||||
| U/W Revenues: | $3,095,054 | ||||||
| U/W Expenses: | $929,716 | ||||||
Escrows and Reserves(1): | U/W NOI(3): | $2,165,338 | |||||
| U/W NCF: | $1,976,496 | ||||||
Type: | Initial | Monthly | Cap (If Any) | U/W NOI DSCR: | 1.45x | ||
| Taxes | $0 | $32,347 | NAP | U/W NCF DSCR: | 1.33x | ||
| Insurance | $40,977 | $4,553 | NAP | U/W NOI Debt Yield: | 9.4% | ||
| Replacement Reserves | $0 | $5,923 | NAP | U/W NCF Debt Yield: | 8.6% | ||
| TI/LC Reserve | $0 | $9,814 | NAP | As-Is Appraised Value: | $31,800,000 | ||
| Carter’s TI/LC Reserve | $173,712 | $0 | NAP | As-Is Appraisal Valuation Date: | September 10, 2013 | ||
| Pet Doctor’s TI/LC Reserve | $37,600 | $0 | NAP | Cut-off Date LTV Ratio: | 72.5% | ||
| Michael’s Floor Reserve | Springing | $0 | NAP | LTV Ratio at Maturity or ARD: | 65.6% | ||
(1) | See “Escrows” section. |
| (2) | See “Historical Occupancy” section. |
| (3) | See “Cash Flow Analysis” section. |
The Mortgage Loan. The mortgage loan (the “Rockwall Market Center Mortgage Loan”) is evidenced by a single promissory note that is secured by a first mortgage encumbering an anchored retail center located in Rockwall, Texas (the “Rockwall Market Center Property”). The Rockwall Market Center Mortgage Loan was originated on October 11, 2013 by Wells Fargo Bank, National Association. The Rockwall Market Center Mortgage Loan had an original principal balance of $23,070,000, has an outstanding principal balance as of the Cut-off Date of $23,070,000 and accrues interest at an interest rate of 5.030% per annum. The Rockwall Market Center Mortgage Loan had an initial term of 120 months, has a remaining term of 120 months as of the Cut-off Date and requires interest-only payments for the first 48 payments following origination and, thereafter, requires payments of principal and interest based on a 30-year amortization schedule. The Rockwall Market Center Mortgage Loan matures on November 1, 2023.
Following the lockout period, the borrower has the right to defease the Rockwall Market Center Mortgage Loan in whole, but not in part, on any date before August 1, 2023. In addition, the Rockwall Market Center Mortgage Loan is prepayable without penalty on or after August 1, 2023.
THE INFORMATION IN THIS STRUCTURAL AND COLLATERAL TERM SHEET IS NOT COMPLETE AND MAY BE AMENDED PRIOR TO THE TIME OF SALE. THIS TERM SHEET IS NOT AN OFFER TO SELL THESE SECURITIES AND IT IS NOT A SOLICITATION OF AN OFFER TO BUY THESE SECURITIES IN ANY JURISDICTION WHERE THE OFFER OR SALE IS NOT PERMITTED.
94
ROCKWALL MARKET CENTER
Sources and Uses
| Sources | Uses | |||||||
| Original loan amount | $23,070,000 | 71.5% | Purchase price | $30,765,306 | 95.3% | |||
| Sponsor’s new cash contribution | 9,196,929 | 28.5% | Reserves | 252,289 | 0.8 | |||
| Closing costs | 1,249,334 | 3.9 | ||||||
| Total Sources | $32,255,929 | 100.0% | Total Uses | $32,266,929 | 100.0% |
The Property. The Rockwall Market Center Property is an anchored retail center containing approximately 209,054 square feet and located in Rockwall, Texas. Built in 1999, the Rockwall Market Center Property comprises three buildings and is anchored by Office Max, Ross Dress for Less (“Ross”) and Michael’s and shadow anchored by Home Depot (not part of the collateral). The Rockwall Market Center Property is situated on a 21.4-acre parcel and provides approximately 1,015 surface parking spaces, resulting in a parking ratio of 4.9 spaces per 1,000 square feet of rentable area. As of August 31, 2013, the Rockwall Market Center Property was 94.5% leased to 19 tenants.
The following table presents certain information relating to the tenancies at the Rockwall Market Center Property:
Major Tenants
| Tenant Name | Credit Rating (Fitch/ Moody’s/ S&P)(1) | Tenant NRSF | % of NRSF | Annual U/W Base Rent PSF | Annual U/W Base Rent | % of Total Annual U/W Base Rent | Sales PSF(2) | Occupancy Cost(2) | Lease Expiration Date |
| Major Tenants | |||||||||
| Office Max | NR/B2/NR | 23,602 | 11.3% | $11.44 | $270,120 | 11.6% | NAV | NAV | 10/31/2019 |
| Ross Dress for Less | NR/NR/A- | 30,187 | 14.4% | $8.50 | $256,590 | 11.0% | $317 | 4.1% | 1/31/2016 |
| Michael’s | NR/B3/B | 23,988 | 11.5% | $9.00 | $215,892 | 9.3% | NAV | NAV | 2/28/2015 |
| Petco | NR/B3/B | 15,330 | 7.3% | $13.75 | $210,788 | 9.1% | NAV | NAV | 1/31/2020 |
| Old Navy | BBB-/Baa3/BBB- | 17,239 | 8.2% | $10.00 | $172,390 | 7.4% | $313 | 4.6% | 10/31/2019(3) |
| Burke’s Outlet | NR/NR/NR | 34,027 | 16.3% | $5.00 | $170,135 | 7.3% | NAV(4) | NAV | 1/31/2024(5) |
| Pier 1 | NR/NR/NR | 9,400 | 4.5% | $15.00 | $141,000 | 6.1% | $151 | 12.9% | 7/31/2015 |
| Mattress Firm | NR/NR/NR | 4,967 | 2.4% | $25.85 | $128,397 | 5.5% | NAV | NAV | 11/30/2017 |
| Total Major Tenants | 158,740 | 75.9% | $9.86 | $1,565,312 | 67.4% | ||||
| Non-Major Tenants | 38,757 | 18.5% | $19.56 | $757,933 | 32.6% | ||||
| Occupied Collateral Total | 197,497 | 94.5% | $11.76 | $2,323,244 | 100.0% | ||||
| Vacant Space | 11,557 | 5.5% | |||||||
| Collateral Total | 209,054 | 100.0% | |||||||
| (1) | Certain ratings are those of the parent company whether or not the parent guarantees the lease. |
| (2) | Sales PSF and Occupancy Costs for Ross Dress for Less and Pier 1 are calculated based on trailing 12-month sales through December 2012. Sales PSF and Occupancy Costs for Old Navy are calculated based on trailing 12-month sales through August 2013. Unless otherwise noted, tenants with sales listed as ‘NAV’ are not required to report sales. |
| (3) | Old Navy has the option to terminate its lease, along with the payment of a termination fee equal to $215,487, if sales from November 2013 through October 2014 do not meet or exceed $5,000,000 (approximately $290 per square foot). |
| (4) | While required to report sales per the lease, sales are not available for Burke’s Outlet, as the tenant’s lease commenced in September 2013. |
| (5) | Burke’s Outlet has the option to terminate its lease, along with a termination fee equal to $75,000, if sales from August 2018 through July 2019 do not exceed $3,000,000 (approximately $88 per square foot). |
THE INFORMATION IN THIS STRUCTURAL AND COLLATERAL TERM SHEET IS NOT COMPLETE AND MAY BE AMENDED PRIOR TO THE TIME OF SALE. THIS TERM SHEET IS NOT AN OFFER TO SELL THESE SECURITIES AND IT IS NOT A SOLICITATION OF AN OFFER TO BUY THESE SECURITIES IN ANY JURISDICTION WHERE THE OFFER OR SALE IS NOT PERMITTED.
95
ROCKWALL MARKET CENTER
The following table presents certain information relating to the historical sales at the Rockwall Market Center Property:
Historical Sales (PSF)(1)
| Tenant Name | 2010 | 2011 | 2012 | TTM 8/31/2013 |
| Ross Dress for Less | $284 | $293 | $317 | NAV |
| Old Navy | $303 | $324 | $311 | $313 |
| Pier 1 | $126 | $146 | $151 | NAV |
| Occupancy Costs | NAV | NAV | NAV | NAV |
(1) Historical Sales (PSF) are based on historical statements provided by the borrower.
The following table presents certain information relating to the lease rollover schedule at the Rockwall Market Center Property:
Lease Expiration Schedule(1)(2)
Year Ending December 31, | No. of Leases Expiring | Expiring NRSF | % of Total NRSF | Cumulative Expiring NRSF | Cumulative % of Total NRSF | Annual U/W Base Rent | Annual U/W Base Rent PSF(3) |
| MTM | 0 | 0 | 0.0% | 0 | 0.0% | $0 | $0.00 |
| 2013 | 0 | 0 | 0.0% | 0 | 0.0% | $0 | $0.00 |
| 2014 | 3 | 6,416 | 3.1% | 6,416 | 3.1% | $153,265 | $23.89 |
| 2015 | 4 | 43,233 | 20.7% | 49,649 | 23.7% | $521,772 | $12.07 |
| 2016 | 3 | 33,732 | 16.1% | 83,381 | 39.9% | $340,861 | $10.10 |
| 2017 | 1 | 4,967 | 2.4% | 88,348 | 42.3% | $128,397 | $25.85 |
| 2018 | 1 | 3,760 | 1.8% | 92,108 | 44.1% | $94,000 | $25.00 |
| 2019 | 3 | 43,473 | 20.8% | 135,581 | 64.9% | $499,098 | $11.48 |
| 2020 | 1 | 15,330 | 7.3% | 150,911 | 72.2% | $210,788 | $13.75 |
| 2021 | 0 | 0 | 0.0% | 150,911 | 72.2% | $0 | $0.00 |
| 2022 | 1 | 8,423 | 4.0% | 159,334 | 76.2% | $126,345 | $15.00 |
| 2023 | 1 | 4,136 | 2.0% | 163,470 | 78.2% | $78,584 | $19.00 |
| Thereafter | 1 | 34,027 | 16.3% | 197,497 | 94.5% | $170,135 | $5.00 |
| Vacant | 0 | 11,557 | 5.5% | 209,054 | 100.0% | $0 | $0.00 |
| Total/Weighted Average | 19 | 209,054 | 100.0% | $2,323,244 | $11.76 |
| (1) | Information obtained from the underwritten rent roll. |
| (2) | Certain tenants may have lease termination options that are exercisable prior to the originally stated expiration date of the subject lease and that are not considered in the Lease Expiration Schedule. |
| (3) | Weighted Average Annual U/W Base Rent PSF excludes vacant space. |
The following table presents historical occupancy percentages at the Rockwall Market Center Property:
Historical Occupancy(1)
12/31/2010 | 12/31/2011 | 12/31/2012 | 8/31/2013 | |||
NAV(2) | 75.0% | 79.0% | 94.5% |
| (1) | Information obtained from the borrower. |
| (2) | Occupancy for 2010 is not available due to the previous owner’s acquisition of the Rockwall Market Center Property in 2011. |
THE INFORMATION IN THIS STRUCTURAL AND COLLATERAL TERM SHEET IS NOT COMPLETE AND MAY BE AMENDED PRIOR TO THE TIME OF SALE. THIS TERM SHEET IS NOT AN OFFER TO SELL THESE SECURITIES AND IT IS NOT A SOLICITATION OF AN OFFER TO BUY THESE SECURITIES IN ANY JURISDICTION WHERE THE OFFER OR SALE IS NOT PERMITTED.
96
ROCKWALL MARKET CENTER
Operating History and Underwritten Net Cash Flow. The following table presents certain information relating to the historical operating performance and Underwritten Net Cash Flow at the Rockwall Market Center Property:
Cash Flow Analysis
| T6 Annualized 12/31/2011 | 2012 | TTM 8/31/2013 | U/W(1) | U/W $ per SF | ||||||
| Base Rent | $2,132,906 | $2,181,501 | $2,257,330 | $2,323,244 | $11.11 | |||||
| Grossed Up Vacant Space | 0 | 0 | 0 | 265,811 | 1.27 | |||||
| Percentage Rent | 0 | 0 | 0 | 0 | 0.00 | |||||
| Total Reimbursables | 576,809 | 588,787 | 537,505 | 768,811 | 3.68 | |||||
| Other Income | 13,016 | 2,999 | 2,364 | 2,999 | 0.01 | |||||
| Less Vacancy & Credit Loss | 0 | 0 | 0 | (265,811)(2) | (1.27) | |||||
| Effective Gross Income | $2,722,731 | $2,773,287 | $2,797,199 | $3,095,054 | $14.81 | |||||
| Total Operating Expenses | $809,784 | $855,590 | $883,685 | $929,716 | $4.45 | |||||
| Net Operating Income | $1,912,948 | $1,917,697 | $1,913,515 | $2,165,338 | $10.36 | |||||
| TI/LC | 0 | 0 | 0 | 117,763 | 0.56 | |||||
| Capital Expenditures | 0 | 20,943 | 12,288 | 71,078 | 0.34 | |||||
| Net Cash Flow | $1,912,948 | $1,896,753 | $1,901,227 | $1,976,496 | $9.45 | |||||
| NOI DSCR | 1.28x | 1.29x | 1.28x | 1.45x | ||||||
| NCF DSCR | 1.28x | 1.27x | 1.27x | 1.33x | ||||||
| NOI DY | 8.3% | 8.3% | 8.3% | 9.4% | ||||||
| NCF DY | 8.3% | 8.2% | 8.2% | 8.6% |
| (1) | Underwritten NOI is higher than historicals due to new leases to Burke’s Outlet (lease commencement September 2013, 7.3% of Base Rent) and Carter’s (lease commencement September 2013, 3.4% of Base Rent). |
| (2) | The underwritten economic vacancy is 10.3%. The Rockwall Market Center Property was 94.5% physically occupied as of August 31, 2013. |
Appraisal. As of the appraisal valuation date of September 10, 2013, the Rockwall Market Center Property had an “as-is” appraised value of $31,800,000.
Environmental Matters. According to the Phase I environmental site assessment dated September 24, 2013, there was no evidence of any recognized environmental conditions at the Rockwall Market Center Property.
Market Overview and Competition. The Rockwall Market Center Property is located in Rockwall, Texas, within Rockwall County and approximately 22 miles northeast of the Dallas central business district. The Rockwall Market Center Property is located just south of Interstate 30 East, a major east/west thoroughfare that crosses the Dallas Fort Worth metropolitan area and connects the local area to the Dallas central business district. Major employers in the Dallas Fort Worth metropolitan area include American Airlines, Bank of America and Baylor Healthcare Systems. According to the appraisal, as of September 2013, the population of Rockwall County was approximately 84,791, which represents an 8.2% increase since 2010 with an additional 11.7% growth projected by 2018. For the same period, the median household income in Rockwall County was approximately $81,324, which is 52.3% higher than the median household income of the entire Dallas Fort Worth MSA of $53,408.
According to a third party market research report, the Rockwall Market Center Property is located within the Rockwall submarket. As of the third quarter of 2013, the submarket reports an estimated inventory of 182 retail properties totaling approximately 3.8 million square feet with a 3.8% vacancy rate and average asking rents of $21.53 per square foot, on a triple net basis.
The following table presents certain information relating to comparable retail properties for the Rockwall Market Center Property:
Competitive Set(1)
Rockwall Market Center (Subject) | The Plaza at Rockwall | Rockwall Town Center | |
| Location | Rockwall, TX | Rockwall, TX | Rockwall, TX |
| Distance from Subject | -- | 3.2 miles | 2.7 miles |
| Property Type | Anchored Retail | Anchored Retail | Anchored Retail |
| Year Built/Renovated | 1999/NAP | 2007/NAP | 2003/NAP |
| Anchors | Office Max, Ross Dress for Less, Michael’s | Best Buy, Dick’s Sporting Goods | Kroger |
| Total GLA | 209,054 SF | 289,371 SF | 249,798 SF |
| Total Occupancy | 94% | 98% | 97% |
| (1) Information obtained from the appraisal. | |||
THE INFORMATION IN THIS STRUCTURAL AND COLLATERAL TERM SHEET IS NOT COMPLETE AND MAY BE AMENDED PRIOR TO THE TIME OF SALE. THIS TERM SHEET IS NOT AN OFFER TO SELL THESE SECURITIES AND IT IS NOT A SOLICITATION OF AN OFFER TO BUY THESE SECURITIES IN ANY JURISDICTION WHERE THE OFFER OR SALE IS NOT PERMITTED.
97
ROCKWALL MARKET CENTER
The Borrower. The borrower is Rockwall Dunhill LLC, a single purpose entity with an independent director. Legal counsel to the borrower delivered a non-consolidation opinion in connection with the origination of the Rockwall Market Center Mortgage Loan. William L. Hutchinson, the loan sponsor, is the guarantor of certain nonrecourse carveouts under the Rockwall Market Center Mortgage Loan.
The Sponsor. The loan sponsor is William L. Hutchinson, who is the founder of Dunhill Partners (“Dunhill”). Dunhill is a commercial real estate investment and brokerage firm founded in 1984 that specializes in the acquisition, sale, leasing and management of commercial real estate properties. As of October 2013, in addition to the Rockwall Market Center Property, Dunhill owns and manages 25 retail properties (23 of which are located in Texas) totaling more than 4 million square feet.
Escrows. The loan documents provide for upfront escrows in the amount of $40,977 for insurance, $173,712 for outstanding tenant improvements in connection with the tenant Carter’s space and $37,600 for outstanding tenant improvements in connection with the tenant Pet Doctor’s space. The loan documents also provide for ongoing monthly escrow deposits of $32,347 for taxes, $4,553 for insurance, $5,923 for replacement reserves and $9,814 for ongoing tenant improvements and leasing commissions. In the event Michaels does not complete its flooring replacement by October 2014, the borrower is required to escrow with the lender any funds remaining in a third party held, flooring replacement escrow account.
Lockbox and Cash Management. The Rockwall Market Center Mortgage Loan requires a lender-controlled lockbox account, which is already in place, and that the borrower direct tenants to pay their rents directly into such lockbox account. The loan documents also require that all rents received by the borrower or the property manager be deposited into the lockbox account within one business day of receipt. Prior to the occurrence of a Cash Trap Event Period (as defined below), all excess funds on deposit in the lockbox account are swept into the borrower’s operating account on a daily basis. During a Cash Trap Event Period, all cash flow is swept on a monthly basis to a cash management account under control of the lender.
A “Cash Trap Event Period” will commence upon the earlier of (i) the occurrence and continuance of an event of default; (ii) the amortizing DSCR falling below 1.15x at the end of any calendar month; (iii) the default of the borrower as landlord under any Major Lease (as defined below); (iv) the default of any Major Lease; or (v) the commencement of a Ross Trap Period (as defined below). A Cash Trap Event Period will end, with regard to the circumstances in clause (i), upon the cure of such event of default; with regard to the circumstances in clause (ii), upon the date that the amortizing DSCR is equal to or greater than 1.15x for two consecutive calendar quarters; with regard to the circumstances in clause (iii), either (x) upon the borrower’s cure of such default or (y) upon the tenant waiving the default in writing; with regard to the circumstances in clause (iv), either (a) upon the cure of such default by the tenant in question or (b) on the date on which one or more satisfactory replacement tenants are in occupancy, paying rent and open for business with no outstanding tenant improvements or leasing commissions owed; and with regard to the circumstances in clause (v), upon the termination of such Ross Trap Period.
A “Major Lease” is (i) any lease accounting for at least 10% of the gross leasable area or at least 10% of the total rental income at the Rockwall Market Center Property; (ii) any lease which contains any option, offer, right of first refusal or other similar entitlement to acquire any portion of the Rockwall Market Center Property; or (iii) any instrument guaranteeing or providing credit support for any lease meeting the requirements of (i) and/or (ii) above.
A “Ross Trap Period” will commence (i) if Ross does not extend or renew its lease at least six months prior to the lease expiration date or (ii) if Ross goes dark, fails to occupy or vacates its space. A Ross Trap Period will terminate with regard to the circumstances in clause (i), either (x) upon the renewal or extension of the Ross lease or (y) on the date on which one or more satisfactory replacement tenants are in occupancy, paying rent and open for business in the space currently leased to Ross with no outstanding tenant improvements or leasing commissions owed; and with regard to the circumstances in clause (ii), either (a) upon Ross resuming normal business operations in its space for six consecutive calendar months or (b) clause (y) above.
Property Management. The Rockwall Market Center Property is managed by an affiliate of the borrower.
Assumption. The borrower has the two-time right to transfer the Rockwall Market Center Property, provided that no event of default has occurred and is continuing and certain other conditions are satisfied, including, but not limited to the following: (i) the lender’s reasonable determination that the proposed transferee and guarantor satisfy the lender’s credit review and underwriting standards, taking into consideration transferee experience, financial strength and general business standing; (ii) execution of a recourse guaranty and an environmental indemnity by an affiliate of the transferee; and (iii) if requested by the lender, rating agency confirmation from Fitch, Moody’s and DBRS that the transfer will not result in a downgrade, withdrawal or qualification of the respective ratings assigned to the Series 2013-C17 Certificates.
Partial Release. Not permitted.
Real Estate Substitution. Not permitted.
Subordinate and Mezzanine Indebtedness. Not permitted.
Ground Lease. None.
Terrorism Insurance. The loan documents require that the “all risk” insurance policy required to be maintained by the borrower provides coverage for terrorism in an amount equal to the full replacement cost of the Rockwall Market Center Property. The loan documents also require business interruption insurance covering no less than the 12-month period following the occurrence of a casualty event, together with a six-month extended period of indemnity.
THE INFORMATION IN THIS STRUCTURAL AND COLLATERAL TERM SHEET IS NOT COMPLETE AND MAY BE AMENDED PRIOR TO THE TIME OF SALE. THIS TERM SHEET IS NOT AN OFFER TO SELL THESE SECURITIES AND IT IS NOT A SOLICITATION OF AN OFFER TO BUY THESE SECURITIES IN ANY JURISDICTION WHERE THE OFFER OR SALE IS NOT PERMITTED.
98
ROCKWALL MARKET CENTER
Windstorm Insurance. The loan documents require windstorm insurance covering the full replacement cost of the Rockwall Market Center Property during the loan term.
THE INFORMATION IN THIS STRUCTURAL AND COLLATERAL TERM SHEET IS NOT COMPLETE AND MAY BE AMENDED PRIOR TO THE TIME OF SALE. THIS TERM SHEET IS NOT AN OFFER TO SELL THESE SECURITIES AND IT IS NOT A SOLICITATION OF AN OFFER TO BUY THESE SECURITIES IN ANY JURISDICTION WHERE THE OFFER OR SALE IS NOT PERMITTED.
99
CROWNE TUNDRA HOTEL PORTFOLIO

THE INFORMATION IN THIS STRUCTURAL AND COLLATERAL TERM SHEET IS NOT COMPLETE AND MAY BE AMENDED PRIOR TO THE TIME OF SALE. THIS TERM SHEET IS NOT AN OFFER TO SELL THESE SECURITIES AND IT IS NOT A SOLICITATION OF AN OFFER TO BUY THESE SECURITIES IN ANY JURISDICTION WHERE THE OFFER OR SALE IS NOT PERMITTED.
100
CROWNE TUNDRA HOTEL PORTFOLIO
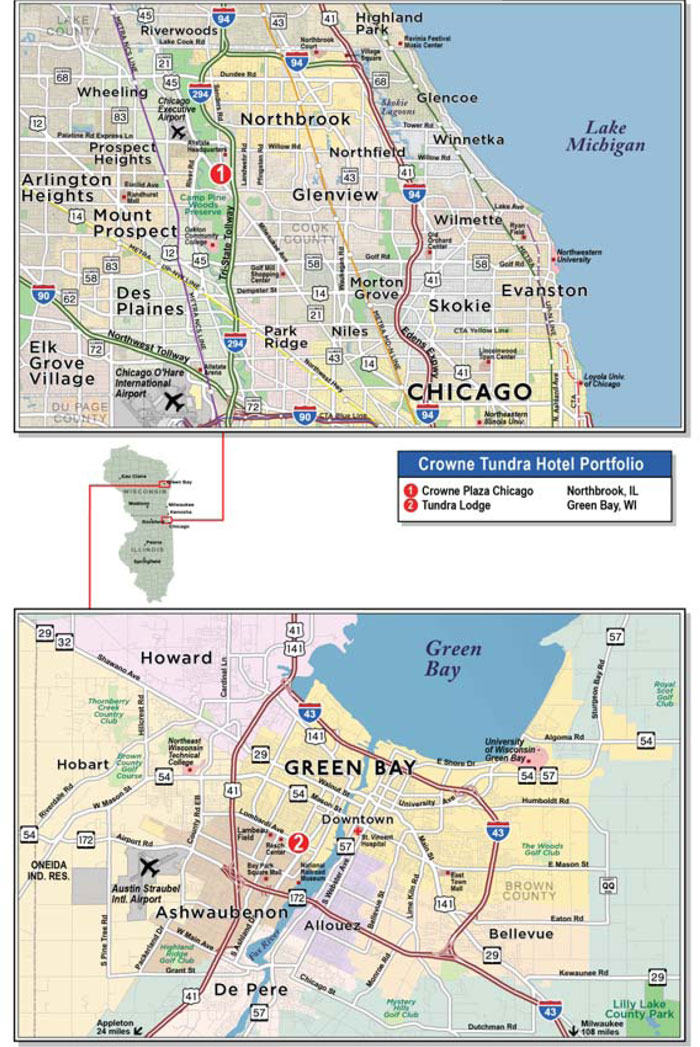
THE INFORMATION IN THIS STRUCTURAL AND COLLATERAL TERM SHEET IS NOT COMPLETE AND MAY BE AMENDED PRIOR TO THE TIME OF SALE. THIS TERM SHEET IS NOT AN OFFER TO SELL THESE SECURITIES AND IT IS NOT A SOLICITATION OF AN OFFER TO BUY THESE SECURITIES IN ANY JURISDICTION WHERE THE OFFER OR SALE IS NOT PERMITTED.
101
| No. 10 - Crowne Tundra Hotel Portfolio | |||||||
| Loan Information | Property Information | ||||||
| Mortgage Loan Seller: | Basis Real Estate Capital II, LLC | Single Asset/Portfolio: | Portfolio | ||||
Credit Assessment (Fitch/Moody’s/DBRS): | NR/NR/NR | Property Type: | Hospitality | ||||
| Original Principal Balance: | $23,000,000 | Specific Property Type: | Full Service | ||||
| Cut-off Date Principal Balance: | $22,968,294 | Location: | Various – See Table | ||||
| % of Initial Pool Balance: | 2.5% | Size: | 480 rooms | ||||
| Loan Purpose: | Refinance | Cut-off Date Principal Balance Per Room: | $47,851 | ||||
| Borrower Names: | Bays Northbrook Hospitality, Corp., Bays Tundra Hospitality Corp. | Year Built/Renovated: | Various/2012– See Table | ||||
| Sponsor: | John V. Bays | Title Vesting: | Fee | ||||
| Mortgage Rate: | 5.600% | Property Manager: | Self-managed | ||||
| Note Date: | September 24, 2013 | 3rd Most Recent Occupancy (As of): | NAV | ||||
| Anticipated Repayment Date: | NAP | 2nd Most Recent Occupancy (As of): | 57.7% (12/31/2011) | ||||
| Maturity Date: | October 1, 2018 | Most Recent Occupancy (As of): | 59.6% (12/31/2012) | ||||
| IO Period: | None | Current Occupancy (As of): | 61.3% (6/30/2013) | ||||
| Loan Term (Original): | 60 months | ||||||
| Seasoning: | 1 month | Underwriting and Financial Information: | |||||
| Amortization Term (Original): | 300 months | ||||||
| Loan Amortization Type: | Amortizing Balloon | 3rd Most Recent NOI (As of): | $3,390,670 (12/31/2011) | ||||
| Interest Accrual Method: | Actual/360 | 2nd Most Recent NOI (As of): | $3,876,237 (12/31/2012) | ||||
| Call Protection: | L(25),D(32),O(3) | Most Recent NOI (As of)(2): | $4,072,939 (TTM 6/30/2013) | ||||
| Lockbox Type: | Hard/Springing Cash Management | ||||||
Additional Debt(3): | Yes | ||||||
Additional Debt Type(3): | Unsecured Debt | U/W Revenues: | $15,045,322 | ||||
| U/W Expenses: | $11,456,031 | ||||||
U/W NOI(3): | $3,589,291 | ||||||
| U/W NCF: | $2,987,478 | ||||||
Escrows and Reserves(1): | U/W NOI DSCR: | 2.10x | |||||
| U/W NCF DSCR: | 1.75x | ||||||
| Type: | Initial | Monthly | Cap (If Any) | U/W NOI Debt Yield: | 15.6% | ||
| Taxes | $183,323 | $62,608 | NAP | U/W NCF Debt Yield: | 13.0% | ||
| Insurance | $118,149 | Springing | NAP | As-Is Appraised Value: | $41,100,000 | ||
| Deferred Maintenance | $24,026 | $0 | NAP | As-Is Appraisal Valuation Date: | Various | ||
| FF&E | $0 | $50,151 | NAP | Cut-off Date LTV Ratio: | 55.9% | ||
| Seasonality Reserve | $200,000 | Springing | $200,000 | LTV Ratio at Maturity or ARD: | 50.3% | ||
| (1) | See “Escrow” section. |
| (2) | See “Cash Flow Analysis” section. |
| (3) | See “Subordinate and Mezzanine Indebtedness” section. |
The Mortgage Loan. The mortgage loan (the “Crowne Tundra Hotel Portfolio Mortgage Loan”) is evidenced by a single promissory note that is secured by two first mortgages, encumbered by two full service hotel properties located in Illinois and Wisconsin (the “Crowne Tundra Hotel Portfolio Properties”). The Crowne Tundra Hotel Portfolio Mortgage Loan was originated on September 24, 2013 by Basis Real Estate Capital II, LLC. The Crowne Tundra Hotel Portfolio Mortgage Loan had an original principal balance of $23,000,000, has an outstanding principal balance as of the Cut-off Date of $22,968,294 and accrues interest at an interest rate of 5.600% per annum. The Crowne Tundra Hotel Portfolio Mortgage Loan had an initial term of 60 months, has a remaining term of 59 months as of the Cut-off Date and will require payments of principal and interest based on a 25-year amortization schedule. The Crowne Tundra Hotel Portfolio Mortgage Loan matures on October 1, 2018.
Following the lockout period, the borrower has the right to defease the Crowne Tundra Hotel Portfolio Mortgage Loan in whole, or in part, on any date before August 1, 2018. In addition, the Crowne Tundra Hotel Portfolio Mortgage Loan is prepayable without penalty on or after August 1, 2018.
THE INFORMATION IN THIS STRUCTURAL AND COLLATERAL TERM SHEET IS NOT COMPLETE AND MAY BE AMENDED PRIOR TO THE TIME OF SALE. THIS TERM SHEET IS NOT AN OFFER TO SELL THESE SECURITIES AND IT IS NOT A SOLICITATION OF AN OFFER TO BUY THESE SECURITIES IN ANY JURISDICTION WHERE THE OFFER OR SALE IS NOT PERMITTED.
102
| CROWNE TUNDRA HOTEL PORTFOLIO |
Sources and Uses
| Sources | Uses | |||||||
| Original loan amount | $23,000,000 | 100.0% | Loan payoff | $21,964,017 | 95.5% | |||
| Reserves | 525,498 | 2.3 | ||||||
| Closing costs | 469,392 | 2.0 | ||||||
| Return of equity | 41,093 | 0.2 | ||||||
| Total Sources | $23,000,000 | 100.0% | Total Uses | $23,000,000 | 100.0% | |||
The Properties. The Crowne Tundra Hotel Portfolio Mortgage Loan is secured by the borrower’s fee interest in two full service hotels located in Northbrook, Illinois and Green Bay, Wisconsin. The Crowne Tundra Hotel Portfolio Properties comprise a total of 480 rooms.
The following table presents certain information relating to the Crowne Tundra Hotel Portfolio Properties:
| Property Name - Location | Specific Property Type | Allocated Cut-off Date Principal Balance | % of Portfolio Cut-off Date Principal Balance | Rooms | Cut-off Date Principal Balance Per Room | Year Built/ Renovated | Appraised Value |
| Crowne Plaza Chicago – Northbrook, IL | Full Service | $13,980,701 | 60.9% | 318 | $43,964 | 1961/2012 | $24,100,000 |
| Tundra Lodge – Green Bay, WI | Full Service | $8,987,593 | 39.1% | 162 | $55,479 | 2003/2012 | $17,000,000 |
| Total/Weighted Average | $22,968,294 | 100.0% | 480 | $47,851 | $41,100,000 |
Crowne Plaza Chicago – Northbrook, IL
The Crowne Plaza Chicago property is a seven-story, 318-room, full service hotel located in Northbrook, Illinois. The property was built in 1961, and renovated from 2008 to 2012. The sponsor spent approximately $4.7 million ($14,908 per room) in capital expenditures to upgrade and renovate the Crowne Plaza Chicago property, including $2.8 million to convert the hotel from a Radisson to a Crowne Plaza in 2008, new furniture and soft goods for all guestrooms, new carpeting throughout the property, new bathroom tile, new chandeliers, and upgrades to all mechanical systems, roof, pool, and computer hardware and software. The Crowne Plaza Chicago property features a full service restaurant, sports bar/lounge, 24-hour fitness center, 24-hour business center, outdoor heated swimming pool, over 15,000 square feet of banquet and meeting space and a 3,430 square feet ballroom. The Crowne Plaza Chicago property’s franchise agreement expires in December 2028.
The Crowne Plaza Chicago property is located two miles west of Interstate 294, in Northbrook, Illinois, a North Shore suburb of Chicago. The property is located 20 miles northwest of the Chicago central business district. The Crowne Plaza Chicago Property is located 1.2 miles southeast of the Chicago Executive Airport (167,000 take off/landings per year, 3rd busiest in the Chicago area), and 9 miles north of Chicago O’Hare International Airport (67 million passengers in 2012, second most in the US). Chicago O’Hare International Airport is a demand generator for the Crowne Plaza as overflow business is often directed to the hotel. Several corporations are headquartered in the Northbrook area, including Allstate Corporation, Kraft, Caremark, Crate and Barrel, Donlen Corporation and Wiss, Janney, Elstner Associates, Inc. (an engineering firm founded in 1956 with 19 offices across the United States). The Crowne Plaza Chicago property is located approximately 0.5 miles west of Allstate Corporation’s corporate headquarters. Allstate is the largest employer in Northbrook with approximately 5,500 employees. In 2013, the Crowne Plaza Chicago property won a Certificate of Excellence from TripAdvisor for ranking in the top 10% worldwide based on traveler feedback. There is currently no new construction in the immediate submarket. Per a third party hospitality report dated July 19, 2013, the Crowne Plaza Chicago property’s competitive set includes five full service hotels, including the Crowne Plaza Chicago property, with a total of 1,062 guestrooms. Occupancy at the Crowne Plaza Chicago property increased from 49.2% in 2010 to 63.7% as of June 2013 as a result of increased demand from commercial and group/meeting travelers.
Subject and Market Historical Occupancy, ADR and RevPAR
(Crowne Plaza Chicago – Northbrook, IL)(1)(2)
Competitive Set | Crowne Plaza Chicago Northbrook | Penetration Factor | |||||||||||||||
Year | Occupancy | ADR | RevPAR | Occupancy | ADR | RevPAR | Occupancy | ADR | RevPAR | ||||||||
| 6/30/2013 TTM | 55.8% | $88.88 | $49.60 | 63.7% | $85.70 | $54.57 | 114.1% | 96.4% | 110.0% | ||||||||
| 6/30/2012 TTM | 53.5% | $84.44 | $45.15 | 61.3% | $82.34 | $50.49 | 114.7% | 97.5% | 111.8% | ||||||||
| 6/30/2011 TTM | NAV | NAV | NAV | 55.6% | $72.97 | $40.56 | NAV | NAV | NAV | ||||||||
| (1) | Information obtained from a third party hospitality report dated July 19, 2013. |
| (2) | The competitive set includes Hilton Chicago Northbrook, Wyndham Glenview, Comfort Inn & Suites Prospect Heights and Holiday Inn Mount Prospect Chicago. |
THE INFORMATION IN THIS STRUCTURAL AND COLLATERAL TERM SHEET IS NOT COMPLETE AND MAY BE AMENDED PRIOR TO THE TIME OF SALE. THIS TERM SHEET IS NOT AN OFFER TO SELL THESE SECURITIES AND IT IS NOT A SOLICITATION OF AN OFFER TO BUY THESE SECURITIES IN ANY JURISDICTION WHERE THE OFFER OR SALE IS NOT PERMITTED.
103
| CROWNE TUNDRA HOTEL PORTFOLIO |
Tundra Lodge – Green Bay, WI
The Tundra Lodge property is a three-story, 162-room, full service hotel located in Green Bay, Wisconsin. The Tundra Lodge property was built in 2003 and was renovated from 2010 to 2012. The Tundra Lodge property features a full-service restaurant, a three-story, 30,000 square foot indoor waterpark, a 25,000 square foot convention center added in 2008, on-site arcade, gift shop, candy store, indoor pool/whirlpool, 24-hour business center and 24-hour fitness center. The Tundra Lodge property is independently owned and managed.
The Tundra Lodge property is located at 865 Lombardi Avenue, which is 0.9 miles east of the National Football League’s Green Bay Packers Lambeau Field. The Tundra Lodge property is located three miles northeast of the Route 41 & Route 172 Interchange, which provides direct access south to Milwaukee (117 miles), Madison (134 miles) and Chicago (207 miles). The Tundra Lodge property is located two miles south of the Green Bay central business district and six miles east of Austin Straubel International Airport. The Tundra Lodge property is located in the center of a dense area thus there is limited vacant land for new development. The Tundra Lodge property is situated off of major thoroughfares which provide good access to the subject neighborhood, which is characterized by major sports venues, including Lambeau Field, the Resch Center, and Shopko Hall, as well as numerous bars, restaurants, small retail stores, and some industrial uses along the primary thoroughfares, with residential areas located along the secondary roadways. According to a third party hospitality report dated July 18, 2013, the Tundra Lodge property’s competitive set includes eight full service hotels, including the Tundra Lodge property, with a total of 1,451 guestrooms.
Subject and Market Historical Occupancy, ADR and RevPAR
(Tundra Lodge – Green Bay, WI)(1)(2)
Competitive Set | Tundra Lodge – Green Bay, WI | Penetration Factor | |||||||||||||||
Year | Occupancy | ADR | RevPAR | Occupancy | ADR | RevPAR | Occupancy | ADR | RevPAR | ||||||||
| 6/30/2013 TTM | 54.0% | $103.57 | $55.93 | 55.6% | $128.72 | $71.55 | 102.9% | 124.3% | 127.9% | ||||||||
| 6/30/2012 TTM | 55.0% | $101.49 | $55.78 | 53.1% | $132.46 | $70.40 | 96.7% | 130.5% | 126.2% | ||||||||
| 6/30/2011 TTM | 55.8% | $97.13 | $54.23 | 55.2% | $124.48 | $68.65 | 98.8% | 128.2% | 126.6% | ||||||||
| (1) | Information obtained from a third party hospitality report dated July 18, 2013. |
| (2) | The competitive set includes Clarion Hotel Green Bay, Best Western Green Bay Inn Conference Center, Hyatt Green Bay, Comfort Suites Green Bay, Radisson Hotel & Conference Center Green Bay, Hilton Garden Inn Green Bay and Springhill Suites Green Bay. |
The following table presents historical occupancy percentages at the Crowne Tundra Hotel PortfolioProperties:
Historical Occupancy
12/31/2011(1) | 12/31/2012(1) | 6/30/2013 | ||
| 57.7% | 59.6% | 61.3% |
| (1) | Information obtained from the borrower. |
THE INFORMATION IN THIS STRUCTURAL AND COLLATERAL TERM SHEET IS NOT COMPLETE AND MAY BE AMENDED PRIOR TO THE TIME OF SALE. THIS TERM SHEET IS NOT AN OFFER TO SELL THESE SECURITIES AND IT IS NOT A SOLICITATION OF AN OFFER TO BUY THESE SECURITIES IN ANY JURISDICTION WHERE THE OFFER OR SALE IS NOT PERMITTED.
104
| CROWNE TUNDRA HOTEL PORTFOLIO |
Operating History and Underwritten Net Cash Flow. The following table presents certain information relating to the historical operating performance and the Underwritten Net Cash Flow at the Crowne Tundra Hotel PortfolioProperties:
Cash Flow Analysis
| 2011 | 2012 | TTM 6/30/2013 | U/W(1) | U/W $ per Room | ||||||
| Occupancy | 57.7% | 59.6% | 60.9% | 60.4% | ||||||
| ADR | $94.53 | $96.82 | $98.48 | $99.27 | ||||||
| RevPAR | $54.54 | $57.71 | $60.00 | $59.99 | ||||||
| Total Revenue | $13,557,389 | $14,506,158 | $15,104,223 | $15,045,322 | $31,344 | |||||
| Total Department Expenses | 5,332,953 | 5,618,765 | 5,759,478 | 5,716,810 | 11,910 | |||||
| Gross Operating Profit | $8,224,437 | $8,887,394 | $9,344,744 | $9,328,512 | $19,434 | |||||
| Total Undistributed Expenses | 3,799,709 | 3,980,233 | 4,197,403 | 4,594,950 | 9,573 | |||||
| Profit Before Fixed Charges | $4,424,727 | $4,907,160 | $5,147,341 | $4,733,562 | $9,862 | |||||
| Total Fixed Charges | 1,034,057 | 1,030,923 | 1,074,403 | 1,144,271 | 2,384 | |||||
| Net Operating Income | $3,390,670 | $3,876,237 | $4,072,939 | $3,589,291 | $7,478 | |||||
| FF&E | 559,759 | 608,553 | 629,847 | 601,813 | 1,254 | |||||
| Net Cash Flow | $2,830,910 | $3,267,684 | $3,443,092 | $2,987,478 | $6,224 | |||||
| NOI DSCR | 1.98x | 2.26x | 2.38x x | 2.10x | ||||||
| NCF DSCR | 1.65x | 1.91x | 2.01x | 1.75x | ||||||
| NOI DY | 14.8% | 16.9% | 17.7% | 15.6% | ||||||
| NCF DY | 12.3% | 14.2% | 15.0% | 13.0% | ||||||
| (1) | The U/W NOI is lower than the TTM 6/30/2013 primarily because: (i) underwritten revenue for the Crowne Plaza Chicago property excludes $57,500 of non-recurring insurance proceeds revenue that is exhibited on the trailing 12-month operating statement, and (ii) a 5% franchise fee was underwritten for the Tundra Lodge property despite it being independently owned and managed. |
Appraisal. As of the appraisal valuation dates of August 7, 2013, and August 9, 2013, the Crowne Tundra Hotel Portfolio Properties had an aggregate “as-is” appraised value of $41,100,000.
Environmental Matters. According to the Phase I environmental assessments dated August 14, 2013 and August 16, 2013 there was no evidence of any recognized environmental conditions at the Crowne Tundra Hotel Portfolio Properties.
The Borrower. The borrowers are Bays Northbrook Hospitality Corp., an Illinois corporation (the Crowne Plaza Chicago property); and Bays Tundra Hospitality Corp. (the Tundra Lodge property), a Wisconsin corporation. John V. Bays is the guarantor of certain nonrecourse carveouts under the Crowne Tundra Hotel Portfolio Mortgage Loan.
The Sponsors. The sponsor is John V. Bays. Mr. Bays has experience developing, owning and operating real estate across various asset classes, and has owned and operated hotels for 20 years. Throughout his career as an hotelier, Mr. Bays has owned eight hotels including the Crowne Tundra Hotel Portfolio Properties and Mr. Bays currently owns 32 other real estate properties.
Escrows. The loan documents provide for upfront escrows in the amount of $183,323 for real estate taxes, $118,149 for insurance, $24,026 for deferred maintenance and $200,000 for a seasonality reserve. The seasonality reserve will be replenished if drawn upon up to a cap of $200,000. The loan documents also provide for monthly deposits of $62,608 for real estate taxes and monthly FF&E reserve deposits equal to 4.0% of total revenue (initially $50,151). No monthly insurance escrow payments are required so long as (i) no event of default exists and is continuing and (ii) the insurance required to be maintained by the borrower is in effect under an acceptable insurance policy and borrower has provided timely proof of payment of insurance premiums.
Lockbox and Cash Management. The Crowne Tundra Hotel Portfolio Mortgage Loan requires a lender-controlled lockbox account, which is already in place, and that the borrower shall cause all revenues to be transmitted directly by any and all credit card companies and commercial tenants of the property into such lockbox. The loan documents also require that all revenues received by the borrower or the property manager be deposited into the lockbox account within one business day after receipt. Prior to the occurrence of a Cash Trap Event Period (as defined below) all funds on deposit in the lockbox account are swept into the borrower’s operating account on a daily basis. During a Cash Trap Event Period, all funds on deposit in the lockbox account are swept on a daily basis to a cash management account under the control of the lender.
A “Cash Trap Event Period” will commence upon (i) an event of default or (ii) the amortizing debt service coverage ratio falling below 1.20x as of the end of two consecutive calendar quarters. A Cash Trap Event Period will end when an amortizing net cash flow debt service coverage ratio of at least 1.25x has been achieved for two consecutive calendar quarters.
Property Management. The Crowne Tundra Hotel Portfolio Properties are managed by an affiliate of the borrower.
THE INFORMATION IN THIS STRUCTURAL AND COLLATERAL TERM SHEET IS NOT COMPLETE AND MAY BE AMENDED PRIOR TO THE TIME OF SALE. THIS TERM SHEET IS NOT AN OFFER TO SELL THESE SECURITIES AND IT IS NOT A SOLICITATION OF AN OFFER TO BUY THESE SECURITIES IN ANY JURISDICTION WHERE THE OFFER OR SALE IS NOT PERMITTED.
105
| CROWNE TUNDRA HOTEL PORTFOLIO |
Assumption. The borrower has the right to transfer the Crowne Tundra Hotel Portfolio Properties, in whole but not in part, subject to customary conditions set forth in the loan documents, including but not limited to: (i) no event of default has occurred and is continuing, (ii) the proposed transferee, the property manager and management agreement are satisfactory to the lender and Fitch, Moodys and DBRS; and (iii) rating agency confirmation from Fitch, Moody’s and that the transfer will not result in a downgrade, withdrawal or qualification of the respective ratings assigned to the Series 2013-C17 Certificates.
Partial Release. Following the second anniversary of the issuance of the Series 2013-C17 Certificates, the borrower is permitted to release the Tundra Lodge property in connection with a partial defeasance provided no event of default has occurred or continuing. The Borrower may obtain a release of Tundra Lodge by partially defeasing the Loan in an amount equal to the greater of 120% of its allocated loan amount and such amount as would be required to enable the conditions below: (a) the debt yield on the Crowne Plaza property shall not be less than 11.5%, (b) the DSCR for the Crowne Plaza Chicago property shall not be less than 1.60x; (c) the LTV on the Crowne Plaza property shall not exceed 56.0%. If the debt yield, DSCR and LTV conditions are not satisfied, a release may still occur if the Guarantor delivers a Letter of Credit in an amount which can further reduce the principal balance sufficient to cause the borrower to satisfy the debt yield, DSCR and LTV conditions. The partial defeasance is subject to rating agency confirmation that the release will not result in a downgrade, withdrawal or qualification of the respective ratings from Fitch, Moody’s and DBRS assigned to the Series 2013-C17 Certificates. The borrower can effect a partial release by posting a Line of Credit if Debt Yield, DSCR, LTV conditions are not met.
Real Estate Substitution. Not permitted.
Subordinate and Mezzanine Indebtedness. Existing unsecured debt in the amount of $13,033,192 in the form of shareholder loans (the “Shareholder Loans”) made by Guarantor, the sole shareholder in Borrower, to Borrower. The Shareholder Loans were made to Borrower to, among other things, acquire the Property and provide working capital. Guarantor has fully subordinated the Shareholder Loans to Lender and executed a Subordination and Standstill Agreement.
Ground Lease. None.
Terrorism Insurance. The loan documents require that the “all risk” insurance policy required to be maintained by the borrower provide coverage for terrorism in an amount equal to the full replacement cost of the Crowne Tundra Hotel PortfolioProperties, as well as business interruption insurance covering no less than the 12-month period following the occurrence of a casualty event, together with an six-month extended period of indemnity.
THE INFORMATION IN THIS STRUCTURAL AND COLLATERAL TERM SHEET IS NOT COMPLETE AND MAY BE AMENDED PRIOR TO THE TIME OF SALE. THIS TERM SHEET IS NOT AN OFFER TO SELL THESE SECURITIES AND IT IS NOT A SOLICITATION OF AN OFFER TO BUY THESE SECURITIES IN ANY JURISDICTION WHERE THE OFFER OR SALE IS NOT PERMITTED.
106
(THIS PAGE INTENTIONALLY LEFT BLANK)
107
| No. 11 – Devonshire Portfolio 2 | |||||||
| Loan Information | Property Information | ||||||
| Mortgage Loan Seller: | Liberty Island Group I LLC | Single Asset/Portfolio: | Portfolio | ||||
Credit Assessment (Fitch/Moody’s/DBRS): | NR/NR/NR | Property Type: | Various – See Table | ||||
| Original Principal Balance: | $19,069,500 | Specific Property Type: | Various – See Table | ||||
| Cut-off Date Principal Balance: | $19,052,290 | Location: | Various – See Table | ||||
| % of Initial Pool Balance: | 2.1% | Size: | 357,790 SF | ||||
Loan Purpose(1): | Various | Cut-off Date Principal Balance Per SF: | $53.25 | ||||
Borrower Names(2): | Various | Year Built/Renovated: | Various – See Table | ||||
| Sponsor: | Devonshire Operating Partnership, LP | Title Vesting: | Fee | ||||
| Mortgage Rate: | 5.670% | Property Manager: | Self-managed | ||||
| Note Date: | September 6, 2013 | 3rd Most Recent Occupancy (As of): | 96.1% (12/31/2010) | ||||
| Anticipated Repayment Date: | NAP | 2nd Most Recent Occupancy (As of): | 93.7% (12/31/2011) | ||||
| Maturity Date: | October 1, 2023 | Most Recent Occupancy (As of): | 96.7% (12/31/2012) | ||||
| IO Period: | None | Current Occupancy (As of)(4): | 98.3% (6/30/2013) | ||||
| Loan Term (Original): | 120 months | ||||||
| Seasoning: | 1 months | Underwriting and Financial Information: | |||||
| Amortization Term (Original): | 360 months | ||||||
| Loan Amortization Type: | Amortizing Balloon | 3rd Most Recent NOI (As of): | $1,526,137 (12/31/2010) | ||||
| Interest Accrual Method: | Actual/360 | 2nd Most Recent NOI (As of): | $1,946,539 (12/31/2011) | ||||
| Call Protection: | L(26),GRTR 1% or YM(90),O(4) | Most Recent NOI (As of): | $2,028,596 (12/31/2012) | ||||
| Lockbox Type: | Springing (Without Established Account) | ||||||
| Additional Debt: | None | ||||||
| Additional Debt Type: | NAP | ||||||
| U/W Revenues: | $2,984,030 | ||||||
| U/W Expenses: | $1,013,740 | ||||||
| U/W NOI: | $1,970,290 | ||||||
| U/W NCF: | $1,713,029 | ||||||
Escrows and Reserves: | U/W NOI DSCR: | 1.49x | |||||
| U/W NCF DSCR: | 1.29x | ||||||
Type: | Initial | Monthly | Cap (If Any) | U/W NOI Debt Yield: | 10.3% | ||
| Taxes | $103,689 | $34,563 | NAP | U/W NCF Debt Yield: | 9.0% | ||
| Insurance | $32,162 | $2,924 | NAP | As-Is Appraised Value: | $26,520,000 | ||
| Replacement Reserves | $15,772 | $7,886 | NAP | As-Is Appraisal Valuation Date(5): | Various | ||
| TI/LC Reserve | $18,500 | $18,500 | $660,000 | Cut-off Date LTV Ratio: | 71.8% | ||
| Deferred Maintenance | $214,625 | $0 | NAP | LTV Ratio at Maturity or ARD: | 60.4% | ||
Men’s Wearhouse Leasing Reserve(3) | $1,140,000 | $0 | NAP | ||||
| (1) | Of the $19,069,500 loan amount, $6,675,000 was used toward the acquisition of the Barberton property. The remaining proceeds were used to refinance the Kroger Taylor, South Haven, Michael’s/Men’s Wearhouse, Kroger (Toledo) Ground Lease and AW Professional properties. |
| (2) | The borrower comprises six separate limited liability companies. |
| (3) | The borrower deposited $1.14 million into a Men’s Wearhouse Leasing Reserve at closing. The borrower was granted the right to use a portion of the Men’s Wearhouse Leasing Reserve for landlord and tenant improvements for the Men’s Wearhouse space. Upon the borrower’s request, the lender will fund 70% of the actual costs incurred for landlord and tenant improvements up to $332,500 (70% of the $475,000 total cost estimate). The amount of any funds drawn in this manner will be recourse to the guarantor until the lender confirms that the tenant is open for business and receives an estoppel which confirms all of the landlord obligations have been satisfied and the payment of rent has commenced. |
| (4) | The tenant Men’s Wearhouse, in the Michael’s/Men’s Wearhouse property, has a signed lease but has not yet taken occupancy. There is a $1,140,000 leasing reserve in place for this tenant, and it has been underwritten as occupied. |
| (5) | Appraisal dates range from June 7, 2013 to July 11, 2013. |
The Devonshire Portfolio 2 mortgage loan is evidenced by a single promissory note that is secured by a first mortgage encumbering four retail centers, one office building and a leased fee interest located in Michigan, Ohio and West Virginia (the “Devonshire Portfolio 2 Properties”). The Devonshire Portfolio 2 mortgage loan was originated on September 6, 2013 by Prudential Mortgage Capital Company, LLC. The Devonshire Portfolio 2 Properties consist of a 95,020 square foot retail center located in Taylor, Michigan; a 101,801 square foot retail center located in Barberton, Ohio; a 63,485 square foot retail building ground leased to a tenant on approximately 7.2 acres owned by the borrower and located in Toledo, Ohio; a 35,769 square foot retail center located in Barboursville, West Virginia; a 41,715 square foot retail center located in South Haven, Michigan; and a 20,000 square foot office building in Whitehouse, Ohio. The Devonshire Portfolio 2 Properties were built between 1975 and 2005. The Kroger Taylor property was 100.0% leased by two tenants as of June 30, 2013; the Barberton property was 95.7% leased by seven tenants as of June 30, 2013; the Michael’s/Men’s Wearhouse property was 100.0% leased by two tenants as of June 30, 2013; the Kroger (Toledo) Ground Lease property was 100.0% leased by one tenant as of June 30, 2013; the AW Professional property was 100.0% leased by three
THE INFORMATION IN THIS STRUCTURAL AND COLLATERAL TERM SHEET IS NOT COMPLETE AND MAY BE AMENDED PRIOR TO THE TIME OF SALE. THIS TERM SHEET IS NOT AN OFFER TO SELL THESE SECURITIES AND IT IS NOT A SOLICITATION OF AN OFFER TO BUY THESE SECURITIES IN ANY JURISDICTION WHERE THE OFFER OR SALE IS NOT PERMITTED.
108
| DEVONSHIRE PORTFOLIO 2 |
tenants as of June 30, 2013; and the South Haven property was 96.0% leased by four tenants as of June 30, 2013. As of June 30, 2013, the Devonshire Portfolio 2 Properties were 98.3% leased by 18 tenants.
Sources and Uses
| Sources | Uses | |||||||
Original loan amount(1) | $19,069,500 | 91.3% | Loan payoff | $9,828,964 | 47.1% | |||
| Sponsor’s new cash contribution | 1,693,642 | 8.1 | Purchase price | 6,675,000 | 32.0 | |||
| Other sources | 122,887 | 0.6 | Reserves | 1,524,748 | 7.3 | |||
| Closing costs | 2,087,645 | 10.0 | ||||||
| Return of equity | 769,672 | 3.7 | ||||||
| Total Sources | $20,886,029 | 100.0% | Total Uses | $20,886,029 | 100.0% |
| (1) | Of the $19,069,500 loan amount, $6,675,000 was used toward the acquisition of the Barberton property. The rest of the proceeds were used towards the refinancing of the Kroger Taylor, South Haven, Michael’s/Men’s Wearhouse, Kroger (Toledo) Ground Lease and AW Professional properties. |
The following table represents certain information relating to the Devonshire Portfolio 2 Properties:
| Property Name | Location | Property Type | Allocated Cut-off Date Principal Balance | % of Portfolio Cut-off Date Principal Balance | Occupancy | Year Built/ Renovated | Net Rentable Area (SF) | Appraised Value | ||||||
| Kroger Taylor | Taylor, MI | Retail | $6,348,487 | 33.3% | 100.0% | 1999/NAP | 95,020 | $9,300,000 | ||||||
| Barberton | Barberton, OH | Retail | $4,716,994 | 24.8% | 95.7% | 1971/2006 | 101,801 | 6,910,000 | ||||||
Michael’s/Men’s Wearhouse(1) | Barboursville, WV | Retail | $2,430,175 | 12.8% | 100.0% | 1983/NAP | 35,769 | 2,170,000 | ||||||
| Kroger (Toledo) Ground Lease | Toledo, OH | Retail | $2,307,300 | 12.1% | 100.0% | 1998/NAP | 63,485 | 3,380,000 | ||||||
| AW Professional | Whitehouse, OH | Office | $1,672,449 | 8.8% | 100.0% | 2005/NAP | 20,000 | 2,450,000 | ||||||
| South Haven | South Haven, MI | Retail | $1,576,886 | 8.3% | 96.0% | 1975/1982 | 41,715 | 2,310,000 | ||||||
Total/Weighted Average | $19,052,290 | 100.0% | 98.3% | 357,790 | $26,520,000 | |||||||||
| (1) | The tenant Men’s Wearhouse, in the Michael’s/Men’s Wearhouse property, has a signed lease but has not yet taken occupancy. There is a $1.14 million leasing reserve in place for this tenant, and it has been underwritten as occupied. |
The following table presents certain information relating to the tenancies at the Devonshire Portfolio 2 Properties:
Major Tenants
| Tenant Name | Credit Rating (Fitch/ Moody’s/ S&P)(1) | Tenant NRSF | % of NRSF | Annual U/W Base Rent PSF | Annual U/W Base Rent | % of Total Annual U/W Base Rent | Sales PSF | Occupancy Cost | Lease Expiration Date |
| Major Tenants | |||||||||
| Kroger Co. of Michigan | BBB/Baa2/BBB | 67,930 | 19.0% | $8.27 | $561,552 | 24.4% | $539(2) | 1.9%(2) | 8/31/2024 |
| Giant Eagle (Leased Fee) | NR/NR/NR | 87,851 | 24.6% | $4.41 | $387,000 | 16.8% | NAV | NAV | 1/31/2027 |
| The Kroger Co. (Lease Fee) | BBB/Baa2/BBB | 63,485 | 17.7% | $3.59 | $228,126 | 9.9% | NAV | NAV | 6/30/2022 |
| Michael’s | NR/B3 /B | 29,584 | 8.3% | $6.50 | $192,296 | 8.4% | $87(3) | 9.5%(3) | 2/28/2019 |
| Big Lots, Inc. | NR/NR/BBB- | 27,090 | 7.6% | $7.00 | $189,630 | 8.2% | $131(4) | 7.6%(4) | 1/31/2015 |
| Total Major Tenants | 275,940 | 77.1% | $5.65 | $1,558,604 | 67.8% | ||||
| Non-Major Tenants | 75,792 | 21.2% | $9.76 | $739,968 | 32.2% | ||||
| Occupied Collateral Total | 351,732 | 98.3% | $6.54 | $2,298,572 | 100.0% | ||||
| 6,058 | 1.7% | ||||||||
| Vacant Space | |||||||||
| Collateral Total | 357,790 | 100.0% | |||||||
| (1) | Certain ratings are those of the parent company whether or not the parent guarantees the lease. |
| (2) | Sales PSF and Occupancy Cost for Kroger Co. of Michigan are for the trailing 12-month period ending September 30, 2012. |
| (3) | Sales PSF and Occupancy Cost for Michael’s are for the trailing 12-month period ending December 1, 2012. |
| (4) | Sales PSF and Occupancy Cost for Big Lots, Inc. are for the trailing 12-month period ending January 1, 2013. |
THE INFORMATION IN THIS STRUCTURAL AND COLLATERAL TERM SHEET IS NOT COMPLETE AND MAY BE AMENDED PRIOR TO THE TIME OF SALE. THIS TERM SHEET IS NOT AN OFFER TO SELL THESE SECURITIES AND IT IS NOT A SOLICITATION OF AN OFFER TO BUY THESE SECURITIES IN ANY JURISDICTION WHERE THE OFFER OR SALE IS NOT PERMITTED.
109
| DEVONSHIRE PORTFOLIO 2 |
The following table presents certain information relating to the lease rollover schedule at the Devonshire Portfolio 2 Properties:
Lease Expiration Schedule(1)(2)(3)
Year Ending December 31, | No. of Leases Expiring | Expiring NRSF | % of Total NRSF | Cumulative Expiring NRSF | Cumulative % of Total NRSF | Annual U/W Base Rent | Annual U/W Base Rent PSF(4) | |
| MTM | 1 | 2,500 | 0.7% | 2,500 | 0.7% | $30,000 | $12.00 | |
| 2013 | 1 | 1,667 | 0.5% | 4,167 | 1.2% | $20,004 | $12.00 | |
| 2014 | 1 | 1,666 | 0.5% | 5,833 | 1.6% | $19,992 | $12.00 | |
| 2015 | 4 | 41,872 | 11.7% | 47,705 | 13.3% | $379,782 | $9.07 | |
| 2016 | 1 | 1,452 | 0.4% | 49,157 | 13.7% | $20,328 | $14.00 | |
| 2017 | 0 | 0 | 0.0% | 49,157 | 13.7% | $0 | $0.00 | |
| 2018 | 3 | 35,740 | 10.0% | 84,897 | 23.7% | $226,100 | $6.33 | |
| 2019 | 1 | 29,584 | 8.3% | 114,481 | 32.0% | $192,296 | $6.50 | |
| 2020 | 1 | 4,300 | 1.2% | 118,781 | 33.2% | $38,400 | $8.93 | |
| 2021 | 0 | 0 | 0.0% | 118,781 | 33.2% | $0 | $0.00 | |
| 2022 | 2 | 70,985 | 19.8% | 189,766 | 53.0% | $333,126 | $4.69 | |
| 2023 | 1 | 6,185 | 1.7% | 195,951 | 54.8% | $89,992 | $14.55 | |
| Thereafter | 2 | 155,781 | 43.5% | 351,732 | 98.3% | $948,552 | $6.09 | |
| Vacant | 0 | 6,058 | 1.7% | 357,790 | 100.0% | $0 | $0.00 | |
| Total/Weighted Average | 18 | 357,790 | 100.0% | $2,298,572 | $6.54 | |||
| (1) | Information was obtained from the underwritten rent roll. |
| (2) | Certain tenants may have lease termination options that are exercisable prior to the originally stated expiration date of the subject lease and that are not considered in the Lease Expiration Schedule. |
| (3) | Lease Expiration Schedule includes the Men’s Wearhouse (6,185 square feet) which has executed a lease but has not yet taken occupancy. An escrow was established at closing for this tenant. See “Escrows” section. |
| (4) | Weighted Average Annual U/W Base Rent PSF excludes vacant space. |
The following table presents historical occupancy percentages at the Devonshire Portfolio 2 Properties:
Historical Occupancy
12/31/2010(1) | 12/31/2011(1) | 12/31/2012(1) | 6/30/2013 | |||
| 96.1% | 93.7% | 96.7% | 98.3% |
| (1) | Information obtained from borrower rent rolls. |
Operating History and Underwritten Net Cash Flow. The following table presents certain information relating to the historical operating performance and the Underwritten Net Cash Flow at the Devonshire Portfolio 2 Properties:
Cash Flow Analysis
2010 | 2011 | 2012 | U/W | U/W $ per SF | ||||||
| Base Rent | $1,621,585 | $2,119,995 | $2,193,812 | $2,298,569 | $6.42 | |||||
| Grossed Up Vacant Space | 0 | 0 | 0 | 72,892 | 0.20 | |||||
| Total Reimbursables | 493,192 | 690,420 | 695,209 | 872,089 | 2.44 | |||||
| Other Income | 0 | 0 | 147 | 3,780 | 0.01 | |||||
| Less Vacancy & Credit Loss | 0 | 0 | 0 | (263,299)(1) | (0.74) | |||||
| Effective Gross Income | $2,114,777 | $2,810,415 | $2,889,168 | $2,984,030 | $8.34 | |||||
| Total Operating Expenses | $588,640 | $863,876 | $860,572 | $1,013,740 | $2.83 | |||||
| Net Operating Income | $1,526,137 | $1,946,539 | $2,028,596 | $1,970,290 | $5.51 | |||||
| TI/LC | 0 | 0 | 0 | 157,157 | 0.44 | |||||
| Reserves for Replacements | 0 | 0 | 0 | 100,104 | 0.28 | |||||
| Net Cash Flow | $1,526,137 | $1,946,539 | $2,028,596 | $1,713,029 | $4.79 | |||||
| NOI DSCR | 1.15x | 1.47x | 1.53x | 1.49x | ||||||
| NCF DSCR | 1.15x | 1.47x | 1.53x | 1.29x | ||||||
| NOI DY | 8.0% | 10.2% | 10.6% | 10.3% | ||||||
| NCF DY | 8.0% | 10.2% | 10.6% | 9.0% | ||||||
| (1) | The underwritten economic vacancy is 8.1%. The Devonshire Portfolio 2 Properties were 98.3% physically occupied as of June 30, 2013. |
THE INFORMATION IN THIS STRUCTURAL AND COLLATERAL TERM SHEET IS NOT COMPLETE AND MAY BE AMENDED PRIOR TO THE TIME OF SALE. THIS TERM SHEET IS NOT AN OFFER TO SELL THESE SECURITIES AND IT IS NOT A SOLICITATION OF AN OFFER TO BUY THESE SECURITIES IN ANY JURISDICTION WHERE THE OFFER OR SALE IS NOT PERMITTED.
110
(THIS PAGE INTENTIONALLY LEFT BLANK)
111
| No. 12 – Midway Shopping Center | |||||||
| Loan Information | Property Information | ||||||
| Mortgage Loan Seller: | Liberty Island Group I LLC | Single Asset/Portfolio: | Single Asset | ||||
Credit Assessment (Fitch/Moody’s/DBRS): | NR/NR/NR | Property Type: | Retail | ||||
| Original Principal Balance: | $17,000,000 | Specific Property Type: | Anchored | ||||
| Cut-off Date Principal Balance: | $17,000,000 | Location: | Mill Creek Hundred, DE | ||||
| % of Initial Pool Balance: | 1.9% | Size: | 156,552 SF | ||||
| Loan Purpose: | Refinance | Cut-off Date Principal Balance Per SF: | $108.59 | ||||
| Borrower Name: | Midway Shopping Center, LLC | Year Built/Renovated: | 1960/2002 | ||||
| Sponsor: | Louis J. Capano Jr. | Title Vesting: | Fee | ||||
| Mortgage Rate: | 4.650% | Property Manager: | Self-managed | ||||
| Note Date: | September 24, 2013 | 3rd Most Recent Occupancy (As of): | 87.5% (12/31/2010) | ||||
| Anticipated Repayment Date: | NAP | 2nd Most Recent Occupancy (As of): | 83.4% (12/31/2011) | ||||
| Maturity Date: | October 1, 2023 | Most Recent Occupancy (As of): | 79.5% (12/31/2012) | ||||
| IO Period: | 120 Months | Current Occupancy (As of): | 90.5% (5/30/2013) | ||||
| Loan Term (Original): | 120 months | ||||||
| Seasoning: | 1 month | Underwriting and Financial Information: | |||||
| Amortization Term (Original): | NAP | ||||||
| Loan Amortization Type: | Interest-only, Balloon | 3rd Most Recent NOI (As of): | $2,493,134 (12/31/2011) | ||||
| Interest Accrual Method: | Actual/360 | 2nd Most Recent NOI (As of): | $1,968,794 (12/31/2012) | ||||
| Call Protection: | L(25),D(91),O(4) | Most Recent NOI (As of)(4): | $2,003,084 (TTM 5/31/2013) | ||||
| Lockbox Type: | None | ||||||
| Additional Debt: | None | ||||||
| Additional Debt Type: | NAP | U/W Revenues: | $3,061,089 | ||||
| U/W Expenses: | $622,919 | ||||||
| U/W NOI: | $2,438,170 | ||||||
| U/W NCF: | $2,237,340 | ||||||
Escrows and Reserves: | U/W NOI DSCR: | 3.04x | |||||
| U/W NCF DSCR: | 2.79x | ||||||
Type: | Initial | Monthly | Cap (If Any) | U/W NOI Debt Yield: | 14.3% | ||
Taxes(1) | $0 | Springing | NAP | U/W NCF Debt Yield: | 13.2% | ||
Insurance(2) | $0 | Springing | NAP | As-Is Appraised Value: | $31,500,000 | ||
| Replacement Reserves | $0 | $0 | NAP | As-Is Appraisal Valuation Date: | March 5, 2013 | ||
TI/LC Reserve(3) | $0 | Springing | NAP | Cut-off Date LTV Ratio: | 54.0% | ||
Deferred Maintenance Reserve(4) | $21,750 | $0 | NAP | LTV Ratio at Maturity or ARD: | 54.0% | ||
| (1) | Springing reserves if borrower fails to pay taxes in a timely manner. |
| (2) | Springing reserves if borrower fails to pay insurance premiums in a timely manner. |
| (3) | No monthly leasing reserve required, except upon: (a) the termination of the Marshalls lease or the date which is 12 months prior to the expiration of the original term of the Marshalls lease or any extension period thereof, upon either such trigger, the borrower is obligated to deposit $600,000 or (b) DSCR is less than 2.0:1.0 for the immediately preceding calendar quarter, upon such trigger, the borrower is obligated to pay a monthly deposit of $10,000. |
| (4) | See “Cash Flow Analysis” section. |
The Midway Shopping Center mortgage loan is evidenced by a single promissory note that is secured by a first mortgage encumbering a 156,552 square foot anchored retail property located in Mill Creek Hundred, Delaware (the “Midway Shopping Center Property”). The Midway Shopping Center Property was built in 1960, is situated on a 13.4 acre site; and is anchored by Marshalls/HomeGoods. Parking at the Midway Shopping Center Property is provided by 729 surface spaces, resulting in a parking ratio of 4.7 spaces per 1,000 square feet of rentable area. As of May 30, 2013, the Midway Shopping Center Property was 90.5% leased to 23 tenants.
THE INFORMATION IN THIS STRUCTURAL AND COLLATERAL TERM SHEET IS NOT COMPLETE AND MAY BE AMENDED PRIOR TO THE TIME OF SALE. THIS TERM SHEET IS NOT AN OFFER TO SELL THESE SECURITIES AND IT IS NOT A SOLICITATION OF AN OFFER TO BUY THESE SECURITIES IN ANY JURISDICTION WHERE THE OFFER OR SALE IS NOT PERMITTED.
112
| MIDWAY SHOPPING CENTER |
Sources and Uses
| Sources | Uses | |||||||
| Original loan amount | $17,000,000 | 100.0% | Loan payoff(1) | $7,836,507 | 46.1% | |||
| Reserves | 21,750 | 0.1 | ||||||
Closing costs Return of equity | 492,945 8,648,798 | 2.9 50.9 | ||||||
| Total Sources | $17,000,000 | 100.0% | Total Uses | $17,000,000 | 100.0% |
| (1) | The Midway Shopping Center Property was previously securitized in WBCMT 2003-C4. |
The following table presents certain information relating to the tenancies at the Midway Shopping Center Property:
Major Tenants
| Tenant Name | Credit Rating (Fitch/ Moody’s/ S&P)(1) | Tenant NRSF | % of NRSF | Annual U/W Base Rent PSF | Annual U/W Base Rent | % of Total Annual U/W Base Rent | Sales PSF(2) | Occupancy Cost(2)(3) | Lease Expiration Date | |
| Major Tenants | ||||||||||
| Marshalls/HomeGoods | NR/A3/A | 51,050 | 32.6% | $19.00 | $969,950 | 33.9% | $390 | 5.1% | 5/31/2017(4) | |
| AT&T (Pad) | A/A3/A- | 5,500 | 3.5% | $41.82 | $230,000 | 8.0% | NAV | NAV | 5/31/2023 | |
| Rite Aid | BB-/B3/B | 9,990 | 6.4% | $23.00 | $229,770 | 8.0% | NAV | NAV | 11/30/2020 | |
| Mandees | NR/NR/NR | 9,875 | 6.3% | $17.50 | $172,813 | 6.0% | NAV | NAV | 1/31/2014 | |
| Five Below | NR/NR/NR | 9,000 | 5.7% | $17.50 | $157,500 | 5.5% | NAV | NAV | 8/14/2023 | |
| Total Major Tenants | 85,415 | 54.6% | $20.61 | $1,760,033 | 61.5% | |||||
| Non-Major Tenants | 56,217 | 35.9% | $19.60 | $1,101,894 | 38.5% | |||||
| Occupied Collateral Total | 141,632 | 90.5% | $20.21 | $2,861,927 | 100.0% | |||||
| 14,920 | 9.5% | |||||||||
| Vacant Space | ||||||||||
| Collateral Total | 156,552 | 100.0% | ||||||||
| (1) | Certain ratings are those of the parent company whether or not the parent guarantees the lease. |
| (2) | Sales and occupancy cost are for the trailing 12-month period ending December 31, 2012. |
| (3) | Occupancy costs includes base rent, reimbursements and percentage rent, as applicable. Other tenants are not required to report sales. |
| (4) | The Marshalls/HomeGoods lease expires on May 31, 2017. In the event that Marshalls/Homegoods does not renew its lease within 12 months prior to the expiration, the borrower must deposit $600,000 into a leasing reserve. The tenant has two 5-year extension options included in its lease. |
THE INFORMATION IN THIS STRUCTURAL AND COLLATERAL TERM SHEET IS NOT COMPLETE AND MAY BE AMENDED PRIOR TO THE TIME OF SALE. THIS TERM SHEET IS NOT AN OFFER TO SELL THESE SECURITIES AND IT IS NOT A SOLICITATION OF AN OFFER TO BUY THESE SECURITIES IN ANY JURISDICTION WHERE THE OFFER OR SALE IS NOT PERMITTED.
113
| MIDWAY SHOPPING CENTER |
The following table presents certain information relating to the lease rollover schedule at the Midway Shopping Center Property:
Lease Expiration Schedule(1)(2)
Year Ending December 31, | No. of Leases Expiring | Expiring NRSF | % of Total NRSF | Cumulative Expiring NRSF | Cumulative % of Total NRSF | Annual U/W Base Rent | Annual U/W Base Rent PSF(3) |
| MTM | 0 | 0 | 0.0% | 0 | 0.0% | $0 | $0.00 |
| 2013 | 1 | 5,419 | 3.5% | 5,419 | 3.5% | $82,800 | $15.28 |
| 2014 | 5 | 20,827 | 13.3% | 26,246 | 16.8% | $331,339 | $15.91 |
| 2015 | 6 | 18,255 | 11.7% | 44,501 | 28.4% | $329,492 | $18.05 |
| 2016 | 1 | 2,000 | 1.3% | 46,501 | 29.7% | $42,000 | $21.00 |
| 2017 | 4 | 61,541 | 39.3% | 108,042 | 69.0% | $1,279,326 | $20.79 |
| 2018 | 1 | 3,400 | 2.2% | 111,442 | 71.2% | $71,400 | $21.00 |
| 2019 | 0 | 0 | 0.0% | 111,442 | 71.2% | $0 | $0.00 |
| 2020 | 1 | 9,990 | 6.4% | 121,432 | 77.6% | $229,770 | $23.00 |
| 2021 | 0 | 0 | 0.0% | 121,432 | 77.6% | $0 | $0.00 |
| 2022 | 1 | 2,850 | 1.8% | 124,282 | 79.4% | $54,150 | $19.00 |
| 2023 | 3 | 17,350 | 11.1% | 141,632 | 90.5% | $441,650 | $25.46 |
| Thereafter | 0 | 0 | 0.0% | 141,632 | 90.5% | $0 | $0.00 |
| Vacant | 0 | 14,920 | 9.5% | 156,552 | 100.0% | $0 | $0.00 |
| Total/Weighted Average | 23 | 156,552 | 100.0% | $2,861,927 | $20.21 |
| (1) | Information obtained from the underwritten rent roll. |
| (2) | Certain tenants may have lease termination options that are exercisable prior to the originally stated expiration date of the subject lease and that are not considered in the Lease Expiration Schedule. |
| (3) | Weighted Average Annual U/W Base Rent PSF excludes vacant space. |
The following table presents historical occupancy percentages at the Midway Shopping Center Property:
Historical Occupancy(1)
12/31/2010 | 12/31/2011 | 12/31/2012 | 5/31/2013 | |||
| 87.5% | 83.4% | 79.5% | 90.5% |
| (1) | Information obtained from the borrower. |
Operating History and Underwritten Net Cash Flow. The following table presents certain information relating to the historical operating performance and the Underwritten Net Cash Flow at the Midway Shopping Center Property:
Cash Flow Analysis
2011 | 2012 | TTM 5/31/2013 | U/W | U/W $ per SF | ||||||
| Base Rent | $2,781,832 | $2,354,520 | $2,381,446(1) | $3,143,327(1) | $20.08 | |||||
| Grossed Up Vacant Space | 0 | 0 | 0 | 0 | 0 | |||||
| Total Reimbursables | 285,962 | 200,558 | 214,519 | 257,883 | 1.65 | |||||
| Other Income | 4,400 | 0 | (77) | 0 | 0 | |||||
| Less Vacancy & Credit Loss | 0 | (34,096) | (74,631) | (340,121)(2) | (2.17) | |||||
| Effective Gross Income | $3,072,194 | $2,520,982 | $2,521,257 | $3,061,089 | $19.55 | |||||
| Total Operating Expenses | $579,060 | $552,188 | $518,173 | $622,919 | $3.98 | |||||
| Net Operating Income | $2,493,134 | $1,968,794 | $2,003,084(1) | $2,438,170(1) | $15.57 | |||||
| TI/LC | 0 | 0 | 0 | 161,692 | 1.03 | |||||
| Capital Expenditures | 0 | 0 | 0 | 39,138 | 0.25 | |||||
| Net Cash Flow | $2,493,134 | $1,968,794 | $2,003,084 | $2,237,340 | $14.29 | |||||
| NOI DSCR | 3.11x | 2.46x | 2.50x | 3.04x | ||||||
| NCF DSCR | 3.11x | 2.46x | 2.50x | 2.79x | ||||||
| NOI DY | 14.7% | 11.6% | 11.8% | 14.3% | ||||||
| NCF DY | 14.7% | 11.6% | 11.8% | 13.2% | ||||||
| (1) | The U/W Base Rent and Net Operating Income are higher than the Base Rent and Net Operating Income from the trailing 12-month period ending May 31, 2013 due to recently signed leases |
| (2) | The underwritten economic vacancy is 10.0%. The Midway Shopping Center Property was 90.5% physically occupied as of May 31, 2013. |
THE INFORMATION IN THIS STRUCTURAL AND COLLATERAL TERM SHEET IS NOT COMPLETE AND MAY BE AMENDED PRIOR TO THE TIME OF SALE. THIS TERM SHEET IS NOT AN OFFER TO SELL THESE SECURITIES AND IT IS NOT A SOLICITATION OF AN OFFER TO BUY THESE SECURITIES IN ANY JURISDICTION WHERE THE OFFER OR SALE IS NOT PERMITTED.
114
(THIS PAGE INTENTIONALLY LEFT BLANK)
115
| Loan Information | Property Information | |||||||
| Mortgage Loan Seller: | Rialto Mortgage Finance, LLC | Single Asset/Portfolio: | Single Asset | |||||
Credit Assessment (Fitch/Moody’s/DBRS): | NR/NR/NR | Property Type: | Retail | |||||
| Original Principal Balance: | Specific Property Type: | |||||||
| Cut-off Date Principal Balance: | Location: | |||||||
| % of Initial Pool Balance: | 1.7% | Size: | ||||||
| Loan Purpose: | Refinance | Cut-off Date Principal Balance Per SF: | ||||||
| Borrower Name: | Year Built/Renovated: | |||||||
| Sponsor: | Title Vesting: | |||||||
| Mortgage Rate: | Property Manager: | |||||||
| Note Date: | 3rd Most Recent Occupancy (As of): | |||||||
| Anticipated Repayment Date: | November 6, 2023 | 2nd Most Recent Occupancy (As of): | ||||||
| Maturity Date: | Most Recent Occupancy (As of): | |||||||
| IO Period: | None | Current Occupancy (As of): | ||||||
| Loan Term (Original): | ||||||||
| Seasoning: | 0 months | Underwriting and Financial Information: | ||||||
| Amortization Term (Original): | ||||||||
| Loan Amortization Type: | 3rd Most Recent NOI (As of): | |||||||
| Interest Accrual Method: | 2nd Most Recent NOI (As of): | |||||||
| Call Protection: | Most Recent NOI (As of): | |||||||
| Lockbox Type: | ||||||||
| Additional Debt: | None | U/W Revenues: | ||||||
| Additional Debt Type: | NAP | U/W Expenses: | ||||||
| U/W NOI: | ||||||||
Escrows and Reserves: | U/W NCF: | |||||||
| U/W NOI DSCR: | 1.34x | |||||||
| Type: | Initial | Monthly | Cap (If Any) | U/W NCF DSCR: | 1.25x | |||
| Taxes | $50,753 | $25,377 | NAP | U/W NOI Debt Yield: | ||||
| Insurance | $37,054 | NAP | U/W NCF Debt Yield: | |||||
| Replacement Reserves | NAP | As-Is Appraised Value: | ||||||
| TI/LC Reserve | $190,000 | As-Is Appraisal Valuation Date: | ||||||
| Deferred Maintenance | NAP | Cut-off Date LTV Ratio: | ||||||
Critical Tenant TI/LC Fund(1) | $0 | $350,000 | LTV Ratio at Maturity or ARD: | 58.3% | ||||
| (1) | All excess cash flow will be swept into the Critical Tenant TI/LC Fund in the event that (i) Michaels gives notice of its intention to not renew its lease or fails to give notice to renew its lease on or six months prior to the lease expiration, (ii) Ashley Furniture gives notice of its intention to not renew its lease or fails to give notice to renew its lease on or twelve months prior to the lease expiration, (iii) an event of default occurs under the Michaels lease or Ashley Furniture lease, (iv) Michaels or Ashley Furniture is subject to a bankruptcy or insolvency proceeding, or (v) Michaels or Ashley Furniture discontinues its normal operations at its respective leased premises. |
The Sierra Commons Shopping Center mortgage loan is evidenced by a single promissory note that is secured by a first mortgage encumbering a 104,811 square feet anchored retail property located in Palmdale, California (the “Sierra Commons Shopping Center Property”), approximately 62 miles north of the Los Angeles, California central business district. The Sierra Commons Shopping Center Property was built in 1994 and is situated on a 9.5-acre site. Parking is provided by 419 surface parking spaces, resulting in a parking ratio of 4.00 spaces per 1,000 square feet of rentable area. As of September 1, 2013, the Sierra Commons Shopping Center Property was 90.2% leased to 10 tenants.
Sources and Uses
| Sources | Uses | |||||||
| Original loan amount | % | Loan payoff | ||||||
| Sponsor’s new cash contribution | 3.7 | |||||||
| Total Sources | 100.0 | % | Total Uses | 100.0% |
THE INFORMATION IN THIS STRUCTURAL AND COLLATERAL TERM SHEET IS NOT COMPLETE AND MAY BE AMENDED PRIOR TO THE TIME OF SALE. THIS TERM SHEET IS NOT AN OFFER TO SELL THESE SECURITIES AND IT IS NOT A SOLICITATION OF AN OFFER TO BUY THESE SECURITIES IN ANY JURISDICTION WHERE THE OFFER OR SALE IS NOT PERMITTED.
116
| SIERRA COMMONS SHOPPING CENTER |
The following table presents certain information relating to the tenancies at the Sierra Commons Shopping Center Property:
Major Tenants
| Tenant Name | Credit Rating (Fitch/ Moody’s/ S&P)(1) | Tenant NRSF | % of NRSF | Annual U/W Base Rent PSF(2) | Annual U/W Base Rent(2) | % of Total Annual U/W Base Rent | Lease Expiration Date |
| Major Tenants – Collateral | |||||||
| NR/NR/NR | |||||||
| NR/NR/NR | |||||||
| Total Major Tenants – Collateral | 74.3% | ||||||
| Non-Major Tenants – Collateral | 14,340 | 13.7% | $26.90 | $385,747 | 25.7% | ||
| Occupied Collateral Total | 100.0% | ||||||
| Vacant Space | |||||||
| Collateral Total | 100.0% | ||||||
| (1) | Certain ratings are those of the parent company whether or not the parent guarantees the lease. |
| (2) | Unless otherwise noted, Annual U/W Base Rent PSF and Annual U/W Base Rent include any contractual rent escalations through August 2014. |
The following table presents certain information relating to the lease rollover schedule at the Sierra Commons Shopping Center Property:
Lease Expiration Schedule(1)(2)
Year Ending December 31, | No. of Leases Expiring | Expiring NRSF | % of Total NRSF | Cumulative Expiring NRSF | Cumulative % of Total NRSF | Annual U/W Base Rent | Annual U/W Base Rent PSF(3) | |
| MTM | 0.0% | 0.0% | ||||||
| 2013 | 0.0% | 0.0% | ||||||
| 4.7% | ||||||||
| 1.4% | ||||||||
| 0.0% | 6.1% | |||||||
| 30.0% | 36.1% | |||||||
| 1.0% | ||||||||
| 2.1% | ||||||||
| 40.8% | ||||||||
| 0.0% | ||||||||
| 0.0% | ||||||||
| 0.0% | ||||||||
| Thereafter | 10.2% | |||||||
| Vacant | 0 | 9.8% | $0 | $0.00 | ||||
| Total/Weighted Average | 100.0% |
| (1) | Information obtained from the underwritten rent roll. |
| (2) | Certain tenants may have lease termination options that are exercisable prior to the originally stated expiration date of the subject lease and that are not considered in the Lease Expiration Schedule. |
| (3) | Weighted Average Annual U/W Base Rent PSF excludes vacant space. |
The following table presents historical occupancy percentages at the Sierra Commons Shopping Center Property:
Historical Occupancy(1)
(1) | Information obtained from the borrower. |
THE INFORMATION IN THIS STRUCTURAL AND COLLATERAL TERM SHEET IS NOT COMPLETE AND MAY BE AMENDED PRIOR TO THE TIME OF SALE. THIS TERM SHEET IS NOT AN OFFER TO SELL THESE SECURITIES AND IT IS NOT A SOLICITATION OF AN OFFER TO BUY THESE SECURITIES IN ANY JURISDICTION WHERE THE OFFER OR SALE IS NOT PERMITTED.
117
| SIERRA COMMONS SHOPPING CENTER |
Operating History and Underwritten Net Cash Flow. The following table presents certain information relating to the historical operating performance and Underwritten Net Cash Flow at the Sierra Commons Shopping Center Property:
Cash Flow Analysis
| U/W | U/W $ per SF | |||||||||
| Base Rent | ||||||||||
| Rent Steps | ||||||||||
| Grossed Up Vacant Space | ||||||||||
| Total Reimbursables | ||||||||||
| Less Vacancy & Credit Loss | (1.77) | |||||||||
| Effective Gross Income | ||||||||||
| Total Operating Expenses | ||||||||||
| Net Operating Income | ||||||||||
| TI/LC | ||||||||||
| Capital Expenditures | ||||||||||
| Net Cash Flow | ||||||||||
| NOI DSCR | 1.25x | 1.47x | 1.45x | 1.34x | ||||||
| NCF DSCR | 1.25x | 1.47x | 1.45x | 1.25x | ||||||
| NOI DY | ||||||||||
| NCF DY | ||||||||||
(1) The underwritten economic vacancy is 8.5%. The Sierra Commons Shopping Center Property was 90.2% physically occupied as of September 1, 2013.
THE INFORMATION IN THIS STRUCTURAL AND COLLATERAL TERM SHEET IS NOT COMPLETE AND MAY BE AMENDED PRIOR TO THE TIME OF SALE. THIS TERM SHEET IS NOT AN OFFER TO SELL THESE SECURITIES AND IT IS NOT A SOLICITATION OF AN OFFER TO BUY THESE SECURITIES IN ANY JURISDICTION WHERE THE OFFER OR SALE IS NOT PERMITTED.
118
(THIS PAGE INTENTIONALLY LEFT BLANK)
119
| No. 14 – AdvancePierre Distribution Center | ||||||||||
| Loan Information | Property Information | |||||||||
| Mortgage Loan Seller: | The Royal Bank of Scotland | Single Asset/Portfolio: | Single Asset | |||||||
| Credit Assessment (Fitch/Moody’s/DBRS): | NR/NR/NR | Property Type: | Industrial | |||||||
| Original Principal Balance: | $14,905,000 | Specific Property Type: | Warehouse | |||||||
| Cut-off Date Principal Balance: | $14,905,000 | Location: | Enid, OK | |||||||
| % of Initial Pool Balance: | 1.6% | Size: | 246,851 SF | |||||||
| Loan Purpose: | Acquisition | Cut-off Date Principal Balance Per SF: | $60.38 | |||||||
| Borrower Name: | AGNL Victuals, L.L.C. | Year Built/Renovated: | 1997/NAP | |||||||
| Sponsor: | AG Net Lease II Corp. | Title Vesting: | Fee | |||||||
| Mortgage Rate: | 5.400% | Property Manager: | Self-managed | |||||||
| Note Date: | October 16, 2013 | 3rd Most Recent Occupancy (As of): | 100.0% (12/31/2010) | |||||||
| Anticipated Repayment Date: | November 6, 2023 | 2nd Most Recent Occupancy (As of): | 100.0% (12/31/2011) | |||||||
| Maturity Date: | November 6, 2043 | Most Recent Occupancy (As of): | 100.0% (12/31/2012) | |||||||
| IO Period: | None | Current Occupancy (As of): | 100.0% (11/1/2013) | |||||||
| Loan Term (Original): | 120 months | |||||||||
| Seasoning: | 0 months | Underwriting and Financial Information: | ||||||||
| Amortization Term (Original): | 300 months | |||||||||
| Loan Amortization Type: | Amortizing ARD | 3rd Most Recent NOI (As of)(2): | NAV | |||||||
| Interest Accrual Method: | Actual/360 | 2nd Most Recent NOI (As of)(2): | NAV | |||||||
| Call Protection: | L(24),GRTR 1% or YM(88),O(8) | Most Recent NOI (As of)(2): | NAV | |||||||
| Lockbox Type: | Hard/Springing Cash Management | |||||||||
Additional Debt(1): | Yes | U/W Revenues: | $1,999,493 | |||||||
Additional Debt Type(1): | Future Mezzanine | U/W Expenses: | $59,985 | |||||||
| U/W NOI: | $1,939,508 | |||||||||
| U/W NCF: | $1,838,919 | |||||||||
U/W NOI DSCR : | 1.78x | |||||||||
Escrows and Reserves: | U/W NCF DSCR: | 1.69x | ||||||||
| U/W NOI Debt Yield: | 13.0% | |||||||||
Type: | Initial | Monthly | Cap (If Any) | U/W NCF Debt Yield: | 12.3% | |||||
| Taxes | $0 | Springing | NAP | As-Is Appraised Value: | $27,100,000 | |||||
| Insurance | $0 | Springing | NAP | As-Is Appraisal Valuation Date: | September 24, 2013 | |||||
| Replacement Reserve | $0 | $3,086 | $1,000,000 | Cut-off Date LTV Ratio: | 55.0% | |||||
| TI/LC | $0 | Springing | $1,000,000 | LTV Ratio at Maturity or ARD: | 41.7% | |||||
| (1) | Future mezzanine debt is permitted subject to the following conditions: (i) the combined has a loan-to-value ratio of no more than 70.0%; (ii) the combined debt service ratio is not less than 1.35x; (iii) the combined debt yield is not less than 11.0%; and (iv) the delivery of mezzanine loan documents that are reasonably acceptable to lender and acceptable to Fitch, Moody’s and DBRS. |
| (2) | Historical financial data is not available as the AdvancePierre Distribution Center property was acquired in a sale-leaseback transaction in December 2012. |
The AdvancePierre Distribution Center mortgage loan is evidenced by a single promissory note that is secured by a first mortgage encumbering a 246,851 square foot warehouse and cold storage building located in Enid, Oklahoma (the “AdvancePierre Distribution Center Property”) located approximately 70 miles north of Oklahoma City, Oklahoma. The AdvancePierre Distribution Center Property is 100% occupied by AdvancePierre Foods, Inc. on a 20-year, triple-net lease. The AdvancePierre Distribution Center Property was built in three phases with Phase I completed in 1997, Phase II completed in 2002 and Phase III completed in 2005. There are 30 dock high doors on the east side of the building with levelers, automatic roll-up doors, air locks and safety lights. The dock area is cooled to 35 to 40 degrees and has a 24-feet ceiling clear height while the majority of the building is freezer space that is cooled to negative seven to negative 10 degrees and has 36-feet ceiling clear heights. The AdvancePierre Distribution Center Property has an office area that contains 5,804 square feet on the east side of the building with general office space, locker rooms and a break room.
Sources and Uses(1)
| Sources | Uses | |||||||
| Original loan amount | $14,905,000 | 100.0% | Return of equity | $14,585,418 | 97.9% | |||
| Closing costs | 319,582 | 2.1 | ||||||
| Total Sources | $14,905,000 | 100.0% | Total Uses | $14,905,000 | 100.0% |
| (1) | The AdvancePierre Distribution Center was purchased all cash in a sale-leaseback transaction in December 2012. |
THE INFORMATION IN THIS STRUCTURAL AND COLLATERAL TERM SHEET IS NOT COMPLETE AND MAY BE AMENDED PRIOR TO THE TIME OF SALE. THIS TERM SHEET IS NOT AN OFFER TO SELL THESE SECURITIES AND IT IS NOT A SOLICITATION OF AN OFFER TO BUY THESE SECURITIES IN ANY JURISDICTION WHERE THE OFFER OR SALE IS NOT PERMITTED.
120
| ADVANCEPIERRE DISTRIBUTION CENTER |
The following table presents certain information relating to the tenancy at the AdvancePierre Distribution Center Property:
Major Tenant
| Tenant Name | Credit Rating (Fitch/Moody’s/ S&P)(1) | Tenant NRSF | % of NRSF | Annual U/W Base Rent PSF | Annual U/W Base Rent | % of Total Annual U/W Base Rent | Lease Expiration Date | ||
| Major Tenant | |||||||||
| AdvancePierre Foods, Inc. | NR/B2/B | 246,851 | 100.0% | $9.00 | $2,221,659 | 100.0% | 12/31/2032 | ||
| Occupied Collateral Total | 246,851 | 100.0% | $9.00 | $2,221,659 | 100.0% | ||||
| (1) | Certain ratings are those of the parent company whether or not the parent guarantees the lease. |
The following table presents certain information relating to the lease rollover schedule at the AdvancePierre Distribution Center Property:
Lease Expiration Schedule(1)
Year Ending December 31, | No. of Leases Expiring | Expiring NRSF | % of Total NRSF | Cumulative Expiring NRSF | Cumulative % of Total NRSF | Annual U/W Base Rent | Annual U/W Base Rent PSF | |
| MTM | 0 | 0 | 0.0% | 0 | 0.0% | $0 | $0.00 | |
| 2013 | 0 | 0 | 0.0% | 0 | 0.0% | $0 | $0.00 | |
| 2014 | 0 | 0 | 0.0% | 0 | 0.0% | $0 | $0.00 | |
| 2015 | 0 | 0 | 0.0% | 0 | 0.0% | $0 | $0.00 | |
| 2016 | 0 | 0 | 0.0% | 0 | 0.0% | $0 | $0.00 | |
| 2017 | 0 | 0 | 0.0% | 0 | 0.0% | $0 | $0.00 | |
| 2018 | 0 | 0 | 0.0% | 0 | 0.0% | $0 | $0.00 | |
| 2019 | 0 | 0 | 0.0% | 0 | 0.0% | $0 | $0.00 | |
| 2020 | 0 | 0 | 0.0% | 0 | 0.0% | $0 | $0.00 | |
| 2021 | 0 | 0 | 0.0% | 0 | 0.0% | $0 | $0.00 | |
| 2022 | 0 | 0 | 0.0% | 0 | 0.0% | $0 | $0.00 | |
| 2023 | 0 | 0 | 0.0% | 0 | 0.0% | $0 | $0.00 | |
| Thereafter | 1 | 246,851 | 100.0% | 246,851 | 100.0% | $2,221,659 | $9.00 | |
| Vacant | 0 | 0 | 0.0% | 246,851 | 100.0% | $0 | $0.00 | |
| Total/Weighted Average | 1 | 246,851 | 100.0% | $2,221,659 | $9.00 | |||
| (1) | Information obtained from the underwritten rent roll. |
The following table presents historical occupancy percentages at the AdvancePierre Distribution Center Property:
Historical Occupancy
12/31/2010(1) | 12/31/2011(1) | 12/31/2012(1) | 9/1/2013 | |||
| 100.0% | 100.0% | 100.0% | 100.0% |
| (1) | Information obtained from the lease. |
THE INFORMATION IN THIS STRUCTURAL AND COLLATERAL TERM SHEET IS NOT COMPLETE AND MAY BE AMENDED PRIOR TO THE TIME OF SALE. THIS TERM SHEET IS NOT AN OFFER TO SELL THESE SECURITIES AND IT IS NOT A SOLICITATION OF AN OFFER TO BUY THESE SECURITIES IN ANY JURISDICTION WHERE THE OFFER OR SALE IS NOT PERMITTED.
121
| ADVANCEPIERRE DISTRIBUTION CENTER |
Operating History and Underwritten Net Cash Flow. The following table presents certain information relating to the Underwritten Net Cash Flow at the AdvancePierre Distribution Center Property:
Cash Flow Analysis(1)
| In Place | U/W | U/W $ per SF | |||||
| Base Rent | $2,221,659 | $2,221,659 | $9.00 | ||||
| Grossed Up Vacant Space | 0 | 0 | 0.00 | ||||
| Total Reimbursables | 0 | 0 | 0.00 | ||||
| Other Income | 0 | 0 | 0.00 | ||||
| Less Vacancy & Credit Loss | 0 | (222,166)(2) | (0.90) | ||||
| Effective Gross Income | $2,221,659 | $1,999,493 | $8.10 | ||||
| Total Operating Expenses | $0 | $59,985 | $0.24 | ||||
| Net Operating Income | $2,221,659 | $1,939,508 | $7.86 | ||||
| TI/LC | 0 | 63,314 | 0.26 | ||||
| Capital Expenditures | 0 | 37,275 | 0.15 | ||||
| Net Cash Flow | $2,221,659 | $1,838,919 | $7.45 | ||||
| NOI DSCR | 2.04x | 1.78x | |||||
| NCF DSCR | 2.04x | 1.69x | |||||
| NOI DY | 14.9% | 13.0% | |||||
| NCF DY | 14.9% | 12.3% | |||||
| (1) | No historical financial information is available as the sponsor purchased the AdvancePierre Distribution Property in December 2012. |
| (2) | The underwritten economic vacancy is 10.0%. The AdvancePierre Distribution Center Property is currently 100.0% physically occupied as of November 1, 2013. |
THE INFORMATION IN THIS STRUCTURAL AND COLLATERAL TERM SHEET IS NOT COMPLETE AND MAY BE AMENDED PRIOR TO THE TIME OF SALE. THIS TERM SHEET IS NOT AN OFFER TO SELL THESE SECURITIES AND IT IS NOT A SOLICITATION OF AN OFFER TO BUY THESE SECURITIES IN ANY JURISDICTION WHERE THE OFFER OR SALE IS NOT PERMITTED.
122
(THIS PAGE INTENTIONALLY LEFT BLANK)
123
| No. 15 – SPS Daly City II | |||||||
| Loan Information | Property Information | ||||||
| Mortgage Loan Seller: | Wells Fargo Bank, National Association | Single Asset/Portfolio: | Single Asset | ||||
Credit Assessment (Fitch/Moody’s/DBRS): | NR/NR/NR | Property Type: | Self Storage | ||||
| Original Principal Balance: | $14,500,000 | Specific Property Type: | Self Storage | ||||
| Cut-off Date Principal Balance: | $14,500,000 | Location: | Daly City, CA | ||||
| % of Initial Pool Balance: | 1.6% | Size: | 93,605 SF | ||||
| Loan Purpose: | Refinance | Cut-off Date Principal Balance Per SF: | $154.91 | ||||
| Borrower Name: | Security Public Storage-Daly City II LLC | Year Built/Renovated: | 2004/NAP | ||||
Sponsors(1): | Various | Title Vesting: | Fee | ||||
| Mortgage Rate: | 5.230% | Property Manager: | Self-managed | ||||
| Note Date: | September 16, 2013 | 3rd Most Recent Occupancy (As of): | 79.1% (12/31/2010) | ||||
| Anticipated Repayment Date: | NAP | 2nd Most Recent Occupancy (As of): | 91.0% (12/31/2011) | ||||
| Maturity Date: | October 1, 2023 | Most Recent Occupancy (As of): | 92.8% (12/31/2012) | ||||
| IO Period: | 24 months | Current Occupancy (As of): | 96.0% (7/30/2013) | ||||
| Loan Term (Original): | 120 months | ||||||
| Seasoning: | 1 month | Underwriting and Financial Information: | |||||
| Amortization Term (Original): | 360 months | ||||||
| Loan Amortization Type: | Interest-only, Amortizing Balloon | 3rd Most Recent NOI (As of): | $1,237,165 (12/31/2011) | ||||
| Interest Accrual Method: | Actual/360 | 2nd Most Recent NOI (As of): | $1,361,561 (12/31/2012) | ||||
| Call Protection: | L(25),D(91),O(4) | Most Recent NOI (As of): | $1,441,129 (TTM 8/31/2013) | ||||
| Lockbox Type: | Springing (Without Established Account) | ||||||
| Additional Debt: | None | U/W Revenues: | $2,053,919 | ||||
| Additional Debt Type: | NAP | U/W Expenses: | $568,170 | ||||
| U/W NOI: | $1,485,749 | ||||||
| U/W NCF: | $1,471,709 | ||||||
| U/W NOI DSCR: | 1.55x | ||||||
| U/W NCF DSCR: | 1.54x | ||||||
Escrows and Reserves: | U/W NOI Debt Yield: | 10.2% | |||||
| U/W NCF Debt Yield: | 10.1% | ||||||
Type: | Initial | Monthly | Cap (If Any) | As-Is Appraised Value: | $23,500,000 | ||
Taxes(2) | $0 | Springing | NAP | As-Is Appraisal Valuation Date: | August 8, 2013 | ||
Insurance(3) | $0 | Springing | NAP | Cut-off Date LTV Ratio: | 61.7% | ||
Replacement Reserves(4) | $0 | Springing | NAP | LTV Ratio at Maturity or ARD: | 53.7% | ||
| (1) | The sponsor is comprised of six separate entities. |
| (2) | Monthly tax escrows are not required as long as the following conditions are satisfied: (i) no event of default exists and is continuing; (ii) the borrower is the sole fee simple owner of the SPS Daly City II property; and (iii) the borrower provides satisfactory evidence of timely payment of tax bills. |
| (3) | Monthly insurance escrows are not required as long as the following conditions are satisfied: (i) no event of default exists and is continuing; (ii) the borrower is the sole fee simple owner of the SPS Daly City II property; and (iii) the borrower provides satisfactory evidence of timely payment and renewal of insurance premiums. |
| (4) | Monthly replacement reserve escrows are not required as long as the following conditions are satisfied: (i) no event of default exists and is continuing; (ii) the borrower is the sole fee simple owner of the SPS Daly City II property; and (iii) the borrower maintains the SPS Daly City II property as required by the lender. |
The SPS Daly City II mortgage loan is evidenced by a single promissory note that is secured by a first mortgage encumbering a 93,605 square foot self storage property located in Daly City, California (the “SPS Daly City II Property”). The SPS Daly City II Property is approximately eight miles southwest of downtown San Francisco, inclusive of 20,075 square feet of climate controlled units and has amenities including 24 hour on site managers, security cameras, code access gates and unit door alarms. As of July 30, 2013, the SPS Daly City II Property was 96.0% occupied.
Sources and Uses
| Sources | Uses | ||||||||
| Original loan amount | $14,500,000 | 100.0% | Loan payoff | $6,371,333 | 43.9 | % | |||
| Closing costs | 69,136 | 0.5 | |||||||
| Return of equity | 8,059,531 | 55.6 | |||||||
| Total Sources | $14,500,000 | 100.0% | Total Uses | $14,500,000 | 100.0 | % |
THE INFORMATION IN THIS STRUCTURAL AND COLLATERAL TERM SHEET IS NOT COMPLETE AND MAY BE AMENDED PRIOR TO THE TIME OF SALE. THIS TERM SHEET IS NOT AN OFFER TO SELL THESE SECURITIES AND IT IS NOT A SOLICITATION OF AN OFFER TO BUY THESE SECURITIES IN ANY JURISDICTION WHERE THE OFFER OR SALE IS NOT PERMITTED.
124
| SPS DALY CITY II |
The following table presents historical occupancy percentages at the SPS Daly City II Property:
Historical Occupancy Percentages(1)
12/31/2010 | 12/31/2011 | 12/31/2012 | 7/30/2013 | |||
| 79.1% | 91.0% | 92.8% | 96.0% |
| (1) | Information obtained from the borrower. |
Operating History and Underwritten Net Cash Flow. The following table presents certain information relating to the historical operating performance and the Underwritten Net Cash Flow at the SPS Daly City II Property:
Cash Flow Analysis
| 2011 | 2012 | TTM 8/31/2013 | U/W | U/W $ per SF | |||||||
| Base Rent | $1,705,994 | $1,869,752 | $1,954,910 | $2,135,424 | $22.81 | ||||||
| Grossed Up Vacant Space | 0 | 0 | 0 | 103,180 | 1.10 | ||||||
| Other Income | 46,757 | 52,112 | 52,607 | 52,607 | 0.56 | ||||||
| Less Vacancy & Credit Loss | 0 | 0 | 0 | (237,292)(1) | (2.54) | ||||||
| Effective Gross Income | $1,752,751 | $1,921,864 | $2,007,517 | $2,053,919 | $21.94 | ||||||
| Total Operating Expenses | $515,586 | $560,303 | $566,388 | $568,170 | $6.07 | ||||||
| Net Operating Income | $1,237,165 | $1,361,561 | $1,441,129 | $1,485,749 | $15.87 | ||||||
| Capital Expenditures | 0 | 0 | 0 | 14,041 | 0.15 | ||||||
| Net Cash Flow | $1,237,165 | $1,361,561 | $1,441,129 | $1,471,709 | $15.72 | ||||||
| NOI DSCR | 1.29x | 1.42x | 1.50x | 1.55x | |||||||
| NCF DSCR | 1.29x | 1.42x | 1.50x | 1.54x | |||||||
| NOI DY | 8.5% | 9.4% | 9.9% | 10.2% | |||||||
| NCF DY | 8.5% | 9.4% | 9.9% | 10.1% | |||||||
| (1) | The underwritten economic vacancy is 10.6%. The SPS Daly City II Property was 96.0% physically occupied as of July 30, 2013. |
THE INFORMATION IN THIS STRUCTURAL AND COLLATERAL TERM SHEET IS NOT COMPLETE AND MAY BE AMENDED PRIOR TO THE TIME OF SALE. THIS TERM SHEET IS NOT AN OFFER TO SELL THESE SECURITIES AND IT IS NOT A SOLICITATION OF AN OFFER TO BUY THESE SECURITIES IN ANY JURISDICTION WHERE THE OFFER OR SALE IS NOT PERMITTED.
125
| WFRBS Commercial Mortgage Trust 2013-C17 | Transaction Contact Information |
VI. Transaction Contact Information
Questions regarding this Structural and Collateral Term Sheet may be directed to any of the following individuals:
| RBS Securities Inc. | Wells Fargo Securities, LLC | ||
| Todd Jaeger - Trading | Tel. (203) 897-2900 | Brigid Mattingly | Tel. (312) 269-3062 |
| Fax (312) 658-0140 | |||
| Adam Ansaldi | Tel. (203) 897-0881 | A.J. Sfarra | Tel. (212) 214-5613 |
| Fax (203) 873-3542 | Fax (212) 214-8970 | ||
| Jim Barnard | Tel. (203) 897-4417 | Alex Wong | Tel. (212) 214-5615 |
| Fax (203) 873-4310 | Fax (212) 214-8970 |
THE INFORMATION IN THIS STRUCTURAL AND COLLATERAL TERM SHEET IS NOT COMPLETE AND MAY BE AMENDED PRIOR TO THE TIME OF SALE. THIS TERM SHEET IS NOT AN OFFER TO SELL THESE SECURITIES AND IT IS NOT A SOLICITATION OF AN OFFER TO BUY THESE SECURITIES IN ANY JURISDICTION WHERE THE OFFER OR SALE IS NOT PERMITTED.
126