UNITED STATES
SECURITIES AND EXCHANGE COMMISSION
Washington, D.C. 20549
FORM N-CSR
CERTIFIED SHAREHOLDER REPORT OF REGISTERED
MANAGEMENT INVESTMENT COMPANIES
Investment Company Act file number 811-22894
INVESTMENT MANAGERS SERIES TRUST II
(Exact name of registrant as specified in charter)
235 W. Galena Street
Milwaukee, WI 53212
(Address of principal executive offices) (Zip code)
Diane J. Drake
Mutual Fund Administration, LLC
2220 E. Route 66, Suite 226
Glendora, CA 91740
(Name and address of agent for service)
(626) 385-5777
Registrant's telephone number, including area code
Date of fiscal year end: September 30
Date of reporting period: September 30, 2020
Item 1. Report to Stockholders.
The registrant’s annual report transmitted to shareholders pursuant to Rule 30e-1 under the Investment Company Act of 1940, as amended (the “Investment Company Act”), is as follows:

AXS Alternative Growth Fund
(Class A: EEHAX)
(Class I: EEHIX)
AXS Aspect Core Diversified Strategy Fund
(Class A: EQAAX)
(Class C: EQACX)
(Class I: EQAIX)
AXS Chesapeake Strategy Fund
(Class A: ECHAX)
(Class C: ECHCX)
(Class I: EQCHX)
AXS Managed Futures Strategy Fund
(Class A: MHFAX)
(Class C: MHFCX)
(Class I: MHFIX)
AXS Multi-Strategy Alternatives Fund
(Class I: KCMIX)
(Class R-1: KCMTX)
ANNUAL REPORT
September 30, 2020
Beginning on January 1, 2021, as permitted by regulations adopted by the Securities and Exchange Commission, paper copies of the Funds’ shareholder reports like this one will no longer be sent by mail, unless you specifically request paper copies of the reports from the Funds, if you hold your shares directly with the Funds, or from your financial intermediary, such as a broker-dealer or bank, if you hold your shares through a financial intermediary. Instead, the reports will be made available on a website, and you will be notified by mail each time a report is posted and provided with a website link to access the report. If you already elected to receive shareholder reports electronically, you will not be affected by this change and you need not take any action. If you hold your shares directly with the Funds, you may elect to receive shareholder reports and other communications from the Funds electronically by contacting the Funds at (833) 297-2587 or, if you hold your shares through a financial intermediary, contacting your financial intermediary. You may elect to receive all future reports in paper free of charge. If you hold your shares directly with the Fund, you can inform the Funds that you wish to continue receiving paper copies of your shareholder reports at (833) 297-2587 or, if you hold your shares through a financial intermediary, contacting your financial intermediary. Your election to receive reports in paper will apply to all of the Investment Managers Series Trust II’s Funds you hold directly or through your financial intermediary, as applicable. |
AXS Funds
Each a series of Investment Managers Series Trust II
Table of Contents
| Shareholder Letters | 1 |
| Fund Performance | 31 |
| Consolidated Schedule of Investments | 40 |
| Consolidated Statements of Assets and Liabilities | 72 |
| Consolidated Statements of Operations | 76 |
| Consolidated Statements of Changes in Net Assets | 79 |
| Consolidated Financial Highlights | 84 |
| Notes to Consolidated Financial Statements | 97 |
| Report of Independent Registered Public Accounting Firm | 129 |
| Supplemental Information | 132 |
| Expense Examples | 135 |
This report and the financial statements contained herein are provided for the general information of the shareholders of the AXS Funds. This report is not authorized for distribution to prospective investors in the Fund unless preceded or accompanied by an effective prospectus.
www.axsinvestments.com

AXS Alternative Growth Fund
Letter to Shareholders for the quarter ending September 30, 2020
For the quarter ended September 30, 2020, the AXS Alternative Growth Fund (formerly, the Equinox Ampersand Strategy Fund) (the “Alternative Growth Fund” or the “Fund) Class I and Class A, respectively, were up 7.47% and 7.26% , underperforming the S&P 500 Total Return Index® (“S&P 500®”), which was up +8.93%.
| | Return 3-Mo | Annualized Rate of Return (AROR) Since Inception (9/9/2013 to 9/30/2020) | Annualized Standard Deviation Since Inception (9/9/2013 to 9/30/2020) |
| AXS Alternative Growth – Class I | 7.47% | 8.64% | 14.67% |
| AXS Alternative Growth – Class A | 7.26% | 8.35% | 14.62% |
| AXS Alternative Growth – Class A (w/ 5.75% max sales charge) | 1.09% | 7.45% | -- |
| S&P 500® | 8.93% | 12.68% | 13.65% |
Past performance does not guarantee future results. Investors cannot directly invest in an index.
Rationale
Over the years, we have observed that many investor portfolios are inadequately diversified because of the perceived opportunity cost of selling equities to gain exposure to diversifying alternative assets. We believe an overlay strategy offers the potential for superior and meaningful diversification without the need to reduce exposure to core holdings. This is the concept implemented in the Alternative Growth Fund. The Fund provides futures-based exposure to the broad US equity market, while simultaneously seeking to diversify equity factor risk through strategic and meaningful exposure to a futures-based portfolio of (i) uncorrelated diversifiers and (ii) negatively correlated dynamic equity-hedging strategies.
Analysis of Performance
The Fund’s long only equity strategy, which seeks to mirror approximately the performance of the S&P 500 Index, was up for the quarter (+9.77%). The hedge strategy had a negative quarter (−2.02%), which was not unexpected given the strong performance of equities, while the diversifier strategy had a slightly down quarter (−0.48%). The Fund’s fixed income holdings contributed positively (+0.20%).
ampersandinvestments.com • 47 Hulfish St., Suite 510 Princeton, NJ 08542 • 609.454.5200
Fund Contribution by Strategy:
| Strategy | Jul-20 | Aug-20 | Sep-20 | Q3 2020 |
| Long Only | 6.26% | 8.23% | -4.48% | 9.77% |
| Diversifier | 0.95% | -0.16% | -1.12% | -0.48% |
| Hedge | -0.20% | -1.15% | -0.65% | -2.02% |
| Fixed Income | 0.08% | 0.06% | 0.06% | 0.20% |
| Overall Fund Performance EEHIX | 7.09% | 6.98% | -6.19% | 7.47% |
Seven of our diversifying trading programs contributed positively. The best performer was an adaptive machine-learning program. Of the eight programs that contributed negatively, the worst performer was a short-term trading program.
There was one addition to the Fund’s portfolio of hedging programs. In July, we made an allocation to the Quadriga Smart Gold options and futures trading program. The Smart Gold Strategy is a liquid, absolute return strategy that aims to protect capital and generate negatively correlated returns (“crisis alpha”) during adverse and hostile equity markets, while seeking to earn neutral to positive returns during benign markets. Thus, the strategy seeks to earn, in the long run, higher risk-adjusted overall returns, particularly on the downside, through the combination of potentially higher compounded returns, lower realized volatility, and shallower drawdowns.
The Smart Gold strategy comprises three parts:
| · | A Core Precious Metals Strategy that seeks to maintain a long position in gold and other precious metals via futures contracts; |
| · | A Core U.S. Treasuries Strategy that seeks to maintain a long position in U.S. Treasury securities via futures contracts; and |
| · | A Long-Only Options Trading Program that primarily buys put options on various underlying “bubble” assets, such as equities, and call options on “anti-bubble” assets such as sovereign debt and precious metals. |
The Quadriga Smart Gold strategy performed negatively for the quarter, as did the Quest Hedging Strategy, while the QDRA strategy was virtually flat.
ampersandinvestments.com • 47 Hulfish St., Suite 510 Princeton, NJ 08542 • 609.454.5200
Performance Attribution by CTAs:
| Commodity Trading Advisor | 31-Jul-20 | 31-Aug-20 | 30-Sep-20 | Q3 2020 |
| Diversifiers | | | | |
| Arctic Blue Capital | 0.09% | 0.08% | -0.20% | -0.03% |
| Crabel Capital Management | -0.03% | -0.46% | -0.09% | -0.59% |
| Emil van Essen | 0.20% | 0.03% | 0.04% | 0.26% |
| FORT, L.P. | 0.06% | -0.12% | 0.08% | 0.02% |
| H20 Asset Management | -0.10% | 0.42% | -0.28% | 0.02% |
| IPM Informed Portfolio Mgmt. | 0.39% | 0.17% | -0.44% | 0.10% |
| JE Moody | -0.03% | -0.06% | 0.08% | -0.01% |
| KeyQuant | 0.32% | -0.05% | -0.04% | 0.24% |
| LCJ Investments | -0.14% | -0.02% | -0.01% | -0.18% |
| Mesirow Financial (Currency Management) | -0.07% | -0.03% | -0.11% | -0.22% |
| QMS Capital Management | -0.26% | -0.07% | 0.01% | -0.33% |
| Quantica Capital | 0.26% | 0.12% | -0.32% | 0.04% |
| Quantitative Investment Management | -0.37% | -0.17% | 0.24% | -0.33% |
| Quest Partners | 0.11% | -0.06% | -0.06% | -0.02% |
| SCT Capital Management | 0.52% | 0.06% | -0.02% | 0.55% |
| Total Diversifier | 0.95% | -0.16% | -1.12% | -0.48% |
| Hedges | | | | |
| QDRA Pty. Ltd | -0.12% | -0.12% | 0.26% | 0.01% |
| Quadriga Asset Managers | -0.05% | -0.64% | -0.75% | -1.44% |
| Quest Partners | -0.03% | -0.39% | -0.16% | -0.59% |
| Total Hedge | -0.20% | -1.15% | -0.65% | -2.02% |
Performance attribution is estimated by Ampersand Investment Management and is net of fees. Past performance does not guarantee future results.
At the sector level, only equity indices had meaningful positive performance, while agricultural commodities added a smaller contribution. Fixed income was the biggest detractor, followed by metals, currencies and energy.
The overlay’s largest gross exposure as of quarter-end was to agricultural commodities (about 35%), followed by energy (21%), equity indices (about 15%), currencies (about 13%), fixed income (about 10%) and metals (about 6%). Together, the financial sectors represented about 38% of the Fund’s exposure. Net exposure to all sectors was long. At the end of the quarter, the dynamic hedging strategies had a negative beta of about −0.29 with respect to the S&P 500 Index. It is expected that this beta over time will be, on average, negative. Equity indices had the largest negative beta (−0.13), followed by currencies (−0.11), and fixed income (−0.08). Energy, agricultural commodities and metals had betas that were positive, but very close to zero.
ampersandinvestments.com • 47 Hulfish St., Suite 510 Princeton, NJ 08542 • 609.454.5200
Gross Sector Exposure (As of 9/30/2020):
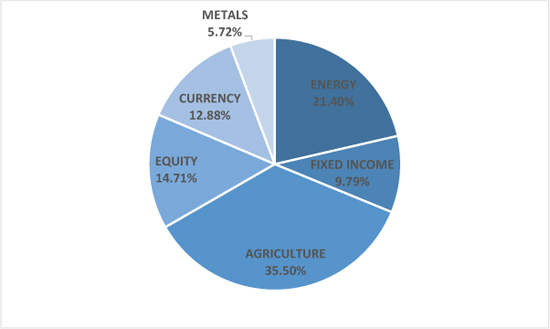
Source: Ampersand Investment Management and Bloomberg, LP. Reflects aggregate sector gross risk exposures
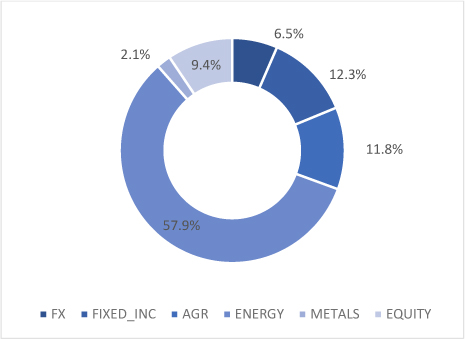
Futures Position Transparency (As of 9/30/2020):

Source: Ampersand Investment Management and Bloomberg, LP. Reflects broad sector net risk exposures. Sector exposures and positions held may vary depending on market conditions and may not be representative of the Fund’s current or future exposures. Portfolio positions are subject to change and should not be considered investment advice. Attribution numbers have been rounded for ease of use
ampersandinvestments.com • 47 Hulfish St., Suite 510 Princeton, NJ 08542 • 609.454.5200
Market Commentary
It was another good quarter for global equity markets. Equity market volatility as measured by the VIX® Index declined further during the quarter, staying in the 20% to 30% range, still higher than its long-term historical average.
JULY 2020
The Fund’s Class I shares were up during July (+7.09%), driven mainly by the long strategy (+6.26%). The diversifier strategy was also up (+0.95%), while the hedge strategy had slightly negative performance. (−0.20%).
The widespread havoc wreaked by the Coronavirus pandemic was reflected in record contractions in the second-quarter GDP readings of major global economies. Millions of lost jobs were, however, regained in June, although a continued rise in COVID-19 cases in the US raised concerns the recovery may be faltering, with newly imposed business closings and an increase in jobless claims. EU leaders agreed on a pandemic recovery package, partly funded in common debt, an unprecedented event for the bloc. Arrests in Hong Kong under the new security laws led to escalating tensions between Beijing and the US and Europe, adding to the stresses already created by the White House’s characterization of the Coronavirus as the “Wuhan/China virus.” US Treasury yields declined to near all-time lows as investors remained concerned about the pace of the economic recovery and Congress’s failure to agree on the next stimulus deal. Giant tech companies beat earnings estimates, leading to higher US equity markets, while European counterparts struggled amid surges in COVID-19 cases. Long fixed income positions yielded gains as yields fell on central bank easing, spurred by the potential second wave of Coronavirus infections. Global stock markets also rose on upbeat earnings from technology stocks, and the prospects of further stimulus deals. The US Dollar experienced its worst month in almost a decade amid weak economic data and political uncertainty. Demand revival and ongoing supply pressures boosted major agricultural markets. Coffee prices rose as data showed surges in home consumption. Oil prices rose on unprecedented cuts in North American output, while natural gas prices were more volatile, but climbed on forecasts of hotter weather. Precious metals also rose, as investors continued to clamor for insurance against the Coronavirus impact.
AUGUST 2020
The Fund performed positively in August (up +6.98%), driven entirely by the long strategy was again up (+8.23%). Both the hedge strategy (−1.15%) and the diversifier strategy (−0.16%) detracted from performance.
August saw the end of the S&P 500's sharpest bear market, which also turned out to be the shortest ever, as it took only 126 trading days to recoup pandemic-induced losses. Investor sentiment was somewhat bolstered by promising economic data and talk of a potential Coronavirus vaccine. Russia became the first country to approve a vaccine for civilian use, causing safe-haven assets to sell off. A new inflation goal (targeting an average inflation rate of 2%) from the Federal Reserve, designed to give the central bank further flexibility on monetary policy, also spurred a rally in risk assets. Government bond yields reversed their July decline, leading to losses in long positions. Global stock markets rallied, achieving new record highs, and leading to losses in short positions in some Asian and European stock indices. Some profits were generated from net short US Dollar positions, as the Federal Reserve's announcement drove the currency down against its major peers. Net short energy exposures generated losses. Notably, natural gas futures posted their biggest single-day gain in the last 18 months, as a hotter weather forecast along with increased export demand continued to send prices soaring. Energy prices were further affected by a major Atlantic hurricane, which disrupted production and forced plant closures. In agricultural commodities, short exposure led to losses, particularly in corn, whose price surged on concerns of worsening crop outlooks from the US to Europe and optimism over demand from China, where imports of corn climbed to a three-year high. Long metals exposure yielded some profits, with most precious and base metals rallying as the US Dollar weakened.
ampersandinvestments.com • 47 Hulfish St., Suite 510 Princeton, NJ 08542 • 609.454.5200
SEPTEMBER 2020
September was a negative month for the Fund (−6.19%), as the long strategy (−4.48%), the diversifier strategy (−1.12%), and the hedge strategy (−0.65%) all performed negatively.
A rapid resurgence of Coronavirus cases in Europe and the associated tightening of restrictions contributed towards a general risk-off sentiment throughout the month. Payroll data and jobless claims painted an ambiguous picture of the state of the US recovery, while German PMI (Purchasing Managers’ Index) data at a 2-year high together with data showing the Eurozone in deflation territory raised similar doubts about the trajectory of the Eurozone economy. On the political scene, negotiations between the House and the Trump administration saw no agreement on another US virus relief package. The prospect of a hotly contested presidential election and the increased likelihood of a “no-deal outcome” on Brexit affected market sentiment. As the global economic recovery showed signs of stalling, further economic support was promised by several governments. As multiple equity markets declined for the first time in months, investors fled to bonds and the US Dollar. Currencies performed poorly, as the US Dollar reversed its prevailing bearish trend, leading to losses, particularly against the Euro and the Australian Dollar. Gains from short positions in energy were more than offset by losses in metals and agricultural commodities. Natural gas prices reversed and fell as inventories rose and the weather turned milder, whereas the
Conclusion
We believe that concerns about the global economy and geopolitics have been exacerbated by the coronavirus crisis. Historically, futures trading programs have tended to perform well in a variety of market conditions, perhaps particularly so during periods of market turbulence and volatility expansion. A period of a few weeks or months is far too short to judge the long-term potential of any strategy or asset class.
The Fund seeks to provide returns that, in the long run, are comparable to the S&P 500® Total Return Index with comparable volatility, while seeking to mitigate downside risk. We continue to believe that a significant and strategic allocation to the Fund as a substitute for core equity exposure in a portfolio may provide “smarter” equity exposure: equity exposure that is dynamically hedged, coupled with the potential for uncorrelated alpha in the long run.
Definition of Terms
Alpha is a measure of performance on a risk-adjusted basis. Alpha takes the volatility (price risk) of a fund and compares its risk-adjusted performance to a benchmark index. The excess return of the fund relative to the return of the benchmark index is a fund’s alpha.
Annualized rate of return (AROR) is the geometric average return for a period greater than or equal to one year, expressed on an annual basis or as a return per year.
Beta is a measure of the volatility, or systematic risk, of a security or a portfolio in comparison to the market as a whole. A beta of 1 indicates that the security's return will move with the market. A beta of less than 1 means that the security’s return will be less volatile than the market. A beta of greater than 1 indicates that the security's return will be more volatile than the market. For example, if a stock's beta is 1.2, it's return is theoretically 20% more volatile than the market’s return.
Brexit is an abbreviation of “British exit,” which refers to the June 23, 2016 referendum by British voters to exit the European Union. The referendum roiled global markets, including currencies, causing the British pound to fall to its lowest level in decades. Prime Minister David Cameron, who supported the UK remaining in the EU announced he would step down in October.
ampersandinvestments.com • 47 Hulfish St., Suite 510 Princeton, NJ 08542 • 609.454.5200
Call options are financial contracts that give the option buyer the right, but not the obligation, to buy a stock, bond, commodity or other asset or instrument at a specified price within a specific time period.
Commodity Trading Advisors (CTA) provide advice and services related to trading in futures contracts. They are responsible for the trading within managed futures accounts.
Correlation is a statistical measure of how two securities move in relation to each other.
Crisis alpha: Refers to profits or gains that can be made by exploiting certain market trends during times of market turmoil.
Hedge is making an investment to reduce the risk of adverse price movements in an asset. Normally, a hedge consists of taking an offsetting position in a related security, such as a futures contract.
Long position refers to buying a security such as a stock, commodity, or currency, with the expectation that the asset will rise in value.
Put option is a contract giving the owner the right, but not the obligation, to sell – or sell short – a specified amount of an underlying security at a pre-determined price within a specified time frame.
The Purchasing Managers' Index (PMI) is an index of the prevailing direction of economic trends in the manufacturing and service sectors. The PMI is based on a monthly survey sent to senior executives at more than 400 companies in 19 primary industries, which are weighted by their contribution to U.S. GDP.
The S&P500 Total Return Index® is widely regarded as the best single gauge of the U.S. equities market. This world-renowned Index includes 500 leading companies in leading industries of the U.S. economy.
Short position is a position whereby an investor sells borrowed securities in anticipation of a price decline and is required to return an equal number of shares at some point in the future.
Standard Deviation (Volatility) is a measure of fluctuation in the value of an asset or investment. Lower volatility improves the stability and lowers the risk of an investment portfolio.
The VIX® Index (VIX) is a forward-looking measure of equity market volatility. Since its introduction, the VIX is considered by many to be the world’s premier barometer of investor sentiment and market volatility.
Yield is the income return on an investment. This refers to the interest or dividends received from a security and is usually expressed annually as a percentage based on the investment’s cost, its current market value or its face value.
Investors cannot directly invest in an index and unmanaged index returns do not reflect any fees, expenses or sales charges. The views in this letter were as of September 30, 2020 and may not necessarily reflect the same views on the date this letter is first published or any time thereafter. These views are intended to help shareholders in understanding the fund’s investment methodology and do not constitute investment advice.
ampersandinvestments.com • 47 Hulfish St., Suite 510 Princeton, NJ 08542 • 609.454.5200
Annual Commentary - AXS Aspect Core Diversified Strategy Fund
| October 2019 – September 2020 | Private and Confidential |

October 2019 to September 2020
Poor US, UK and European economic data supported global slowdown worries at the start of Q4 2019. A double dose of relief pushed risk assets higher towards the end of the quarter as a preliminary trade deal between the US and China was announced and the Conservative Party won the UK election. Global stock markets ascended on the back of positive trade and economic headlines over the quarter benefitting the AXS Aspect Core Diversified Strategy Fund’s (“the Fund”) net long* stock index positions. Improvements in risk appetite shifted market participants out of safe-haven assets, lifting sovereign bond yields and resulting in losses for the Fund’s mostly long bond positions. The Fund’s short** positions in the New Zealand Dollar and Australian Dollar led to losses, as the currencies strengthened amid improved market sentiment.
At the start of 2020, risk appetite vacillated, as the threat of significant military conflict and the rapid de-escalation between the US and Iran interrupted an otherwise strong start for risk assets. The much-anticipated phase one trade deal between the US and China was signed, and upbeat US economic data helped brighten global sentiment. Towards the end January, the World Health Organisation declared the outbreak of a new coronavirus a global health emergency. There were early hopes that the respiratory disease could be contained, and after China’s central bank added a larger than expected liquidity injection, US equities reached all-time highs. During March, as the spread of coronavirus turned into one of the most significant pandemics in a century, growing fears of a global economic shutdown as a result of the socio-economic impact provided the spark for markets to experience one of the most rapid collapses in modern history. In the bond sector, a net long exposure throughout Q1 2020 created profits as globally governments enacted rate cuts and liquidity pumping pushing prices higher. After reaching record highs many stock indices reversed in record speed as there was a concerted flight to safety, causing losses for the Fund’s net long position early in Q1 2020. In energies, milder weather led natural gas prices lower rewarding the Fund’s short position.
Despite the backdrop in April of an overwhelmingly negative global economic outlook, the sheer size of the Fed's stimulus resulted in US equity markets recording their best month in 30 years. Lacklustre demand driven by COVID-19 disruption and the resulting storage capacity concerns, pushed WTI Crude oil into negative price territory for the first time in history. The remainder of Q2 2020 saw a continuation of positive sentiment across equity and commodity markets as some major economies eased lockdowns and economic activity began to tentatively resume. The reversal in sentiment from overwhelmingly bearish to bullish caused reversals in pro-cyclical assets such as stock indices, energies and industrial metals. The subsequent rallies in these markets detracted from performance. In currencies, the weakness in the world’s reserve currency, the US dollar was bolstered as investors looked towards a global recovery and this proved challenging for the currency sector.
At the start of Q3 2020, US Treasury yields declined to near all-time lows as investors remained worried about the pace of economic recovery and as the US Congress failed to agree on the next stimulus deal. August saw the end of the S&P 500’s shortest and sharpest bear market in its history, taking 126 trading days to recover pandemic-induced losses. During September, a rapid resurgence of coronavirus cases in Europe, the prospect of a hotly contested US presidential election and the increased likelihood of Brexit trade talks faltering marred market sentiment. The Fund gave back some earlier gains made in currencies during September as the US Dollar rallied against its prevailing bearish trend leading to losses particularly against the Pound. The Fund’s short lean hogs position dominated losses within the agriculturals sector as prices rose on increased demand expectations. Whereas, in energies, it was the short exposure in natural gas which mainly detracted from performance. The energy market posted its largest single-day gain in 18 months during August off the back of hotter weather forecasts and increased export demand.
 | October 2019 – September 2020 | Private and Confidential |
Annual Commentary - AXS Aspect Core Diversified Strategy Fund
The views in this letter were as of September 30, 2020 and may not necessarily reflect the same views on the date this letter is first published or any time thereafter. These views are intended to help shareholders in understanding the Fund’s investment methodology and do not constitute investment advice
* A long position refers to getting economic exposure to a reference asset, and this position will increase in value if the reference asset’s price increases.
** A short position refers to getting economic exposure to a reference asset, and this position will increase in value if the reference asset’s price decreases.
| October 2019 – September 2020 | Private and Confidential |

OCTOBER 2019
October was a tough month in the markets for the fund. Nearly every sector was negative for the month, with the exception of metals. Metals led the commodity sector with gains for the fund. As is so often the case when the equity markets falter, investors fled to the safety of precious metals. Both gold and silver were up on the month. Palladium also continued its upward advance in October, rising to new highs as analysts are now projecting shortages in that metal because of the demands from the automobile industry. The Softs, Meats & Grains complexes all contributed negatively to monthly performance. Currencies continued their wild swings during the month as this sector had the largest negative impact on the Fund’s performance in October. Gains in emerging currencies including the Mexican Peso and Russian Ruble could not offset losses from G-7 currencies in particular, British Pound.
As with the currencies, equity markets continue to be volatile. Overall performance in equities was negative as most issues were down. Healthcare stocks were one subsector, which performed nicely as positions in Merck were positive. Our Nike position, which has been one of the best performing stocks in the Dow Jones this year, gave back some ground as investors locked in some gains. Another poor performer was McDonald’s whose stock declined sharply as they reported poor earnings, also hurting performance.
NOVEMBER 2019
The markets in November continued the malaise experienced in October. Commodities were particularly hard hit and continued to underperform and hurt our performance.
Metals, which rallied in October, were the worst performing sector as both gold and silver gave back the ground that was gained in the prior month. Losses were recorded in the base metals complex as nickel and lead were down on fears that a slowdown in the Chinese economy would lessen demand for metals. Palladium was a bright spot, as it continued its advance on strong demand from the automobile industry. Our positions in Softs, Meats & Grains were again down in November.
As with Metals, Currencies reversed course from being our biggest detractor October to becoming our biggest gainer in November. Our position in the Brazilian Real contributed to gains as that currency continued to slide and sit at near yearly lows. We were also bolstered by our long position in the Israeli Shekel, as that currency remains strong on the strength of the Israeli economy.
As in the prior month, the equity markets continue to be volatile and performance was only slightly positive. Despite rallying for most of the month, the complex gave back gains in the last week. Overall performance in equities was positive in November. Target reported very strong earnings in the third quarter, which benefited the portfolio. Gains were also recorded in both the French and Australian equity markets.
DECEMBER 2019
The markets in December continued to be difficult to navigate. Commodities were mixed in December. Metals and agricultural markets were positive contributors to the portfolio. Palladium prices continued to move higher due to automobile industry demand. Bean oil positions also provided positives returns as strong demand for vegetable oils in China continued to rise, while the amount of oilseeds being planted remains steady. Positions in the soft and livestock complexes added to negative performance.
| Chesapeake Capital Corporation | administration@chesapeakecapital.com |
| 1721 Summit Avenue | tel 804.836.1617 |
| Richmond, VA 23230 | fax 804.836.1610 |
Currencies once again reversed course and contributed to the negative performance for the month. The British Pound weighed on the sector, declining during the election process that took place in December and renewed Brexit fears. Though volatile, our positions in the equity markets performed well in December and added positive performance for the month.
The interest rate sector, particularly global bonds markets, were negative attributes to the portfolio again in December.
JANUARY 2020
2020 was off to a nice start as the AXS Chesapeake Strategy Fund was positive in January. Gains in the currency complex and the fixed income sector were strong and they offset losses incurred in the equity and commodity sectors. The fixed income sector of the Fund performed well and was led by gains from positions in Italian, Australian and US Government bonds, as the uncertainty in the equity markets in the last half of the month caused these issues to rally.
The currencies complex provided positive returns for the month. Committee sensitive currencies like the Australian and New Zealand dollar as well as the Brazilian Real continued their decline, which helped our performance as we hold short positions against the US Dollar. The commodity complex had mixed results as gains on long positions in metals were not enough to overcome losses in other commodities. Metals were again a top mover in the commodity space and, palladium once again continued to lead the charge, rising sharply on the demand from foreign and domestic automakers. Losses were incurred in the softs, meats & grains led by losses in coffee, live cattle and soybean oil. Gains were recorded in cocoa and lean hogs.
Equity markets, which started off strong in January, tailed off in the second half of the month on global concerns about the coronavirus and economic growth.
FEBRUARY 2020
After an extremely strong first 20 days to the month, February ended up being a difficult market as a broad sell-off across sectors on COVID-19 fears led to losses for the Fund. Equity markets, up sharply for most of the month, collapsed in the last five trading days of February, causing the Fund substantial losses.
Fixed income markets were not spared either, as our positions gave back ground from their January gains. Italian Government bonds were off sharply as that country was suddenly struck with the coronavirus in the northern part of the country. The Fund was still able to post gains for the month in the fixed income complex but not enough to offset the equity rout. The US dollar was not immune to market volatility and currency positions suffered losses during the month as well.
In commodities, the Fund was able to post positive results for the month from the energy and soft commodity complexes. Short positions in heating oil led gainers for the month.
| Chesapeake Capital Corporation | administration@chesapeakecapital.com |
| 1721 Summit Avenue | tel 804.836.1617 |
| Richmond, VA 23230 | fax 804.836.1610 |
MARCH 2020
Equity markets continued to collapse in March. The Fund incurred losses in the equity and currency sectors and had gains in fixed income and commodities. The commodity sector was net positive, led by gains from energy and agricultural markets. Losses were incurred in the soft complex and metals, as palladium, which has been a positive long-term trade, finally gave back ground as the coronavirus very quickly dampened the market for Chinese automobiles.
The Fund profited from holding long positions in global bond markets. The long end of the US curve proved to be the strongest sub-sector in fixed income during the month. The volatility in the currency complex proved difficult and the Fund posted negative results in the complex. The strong US dollar helped the Fund’s positions in US dollar positions against emerging market and commodity currencies. Short dollar positions against safe haven currencies like the Japanese Yen and the Swiss Franc incurred losses and were closed out during the month.
APRIL 2020
The AXS Chesapeake Strategy Fund I share posted a gain in April. Gains in the interest rate and commodity sectors led the Fund in positive performance for the month, while losses were recorded in the equity and currency complexes. Interest rates were also positive as long positions in the US 10-year Note and the London Gilt contributed gains to the Fund for the month.
The commodity sector posted positive results for the month. Metals were positive led by long positions in the precious metals complex. The grain complex also produced gains. Losses from long positions in wheat were more than offset from gains on short positions in the corn, canola and soybean oil markets. Short positions in live cattle and live hogs also produced gains for the month. In the energy complex, short positions in heating oil led all gainers and was the best performing market for the month.
The equity sector produced losses for the month as short positions in Oracle and Verizon as well as short positions in the FTSE index contributed to the losses.
The currency sector also was negative for the month. Gains were recorded on long US Dollar positions against the South African Rand, Mexican Peso and Brazilian Real. Losses were incurred on long US Dollar positions vs. the Swedish Krona and Australian and Canadian Dollars.
MAY 2020
The Fund posted a loss in May. Losses in the currency and commodity sectors were the biggest drag on performance for the month. Gains were recorded in fixed income.
The currency sector was negative for the month. Losses were recorded on long US Dollar positions against the South African Rand, Mexican Peso and Brazilian Real as well as from long US Dollar positions vs. the Swedish Krona and Australian and Canadian Dollars.
The commodity sector posted negative results for the month. Energy positions led the losses for the month as all subsectors in the commodity complex incurred losses. In the metals complex, long positions in gold were positive, but short positions in industrial metals, aluminum and zinc offset these gains. The grain and meat complexes also produced losses for the month. Interest rates performance was positive as long positions in the US 10-year Note and the London Gilt contributed gains to the Fund for the month.
| Chesapeake Capital Corporation | administration@chesapeakecapital.com |
| 1721 Summit Avenue | tel 804.836.1617 |
| Richmond, VA 23230 | fax 804.836.1610 |
The equity sector was flat for the month.
JUNE 2020
The Fund posted a loss in June. Losses in the commodity sector contributed the largest impact of negative performance for the month. Gains were recorded in the equity and fixed income complexes.
The commodity sector posted negative results for the month. Energy positions led the losses for the month as well as the grain and industrial metal markets. In the metals complex, long positions in gold continued to provide positive results but short positions in industrial metals, copper, aluminum and zinc offset these gains. Long positions in wheat and short positions in the corn and soybean oil markets produced losses in the grain complex for the month. The meats and soft complexes produced small gains in June.
The currency sector also was negative for the month. Gains were recorded on long US Dollar positions against the Mexican Peso and Brazilian Real. Losses were incurred on long US Dollar positions vs. the Swedish Krona, the Russian Ruble and the Canadian Dollar.
The equity sector produced gains on long positions for the month. Performance for interest rates was positive as long positions in the US 5-year Note and US 10-year Note contributed gains to the Fund for the month.
JULY 2020
The AXS Chesapeake Strategy Fund posted a gain in July. Gains were recorded in all four sectors of the Fund: fixed income, equities, commodities and currencies. The commodity sector posted positive results for the month.
The metals markets were positive from long positions in the precious metals, gold and silver. The grain complex also produced gains. Losses from long positions in soybean oil were more than offset from gains on short positions in corn. In the energy and meat complex, short positions posted minor losses.
The fixed income sector was positive as long positions in the US and global rate markets all contributed positive results as interest rates declined. Gains were recorded across the curve led by the long end of the US rate market.
The equity sector produced positive results as long positions in the Nasdaq and S&P 500, coupled with gains on short positions in the London FTSE market all contributed gains for the month.
The currency sector was the best performing sector for the month. Gains were recorded on short US Dollar positions against the Euro Dollar, Swiss Franc, Swedish Krona and Australian dollar. Losses were incurred on long dollar positions versus the Brazilian Real.
| Chesapeake Capital Corporation | administration@chesapeakecapital.com |
| 1721 Summit Avenue | tel 804.836.1617 |
| Richmond, VA 23230 | fax 804.836.1610 |
AUGUST 2020
The Fund posted a gain in August. Gains were recorded in equities, currency and commodities, and losses were incurred in the fixed income sector.
As in July, the currency sector was the best performing sector for the month. Gains were recorded on short US Dollar positions with the biggest contributors to gains being the British Pound, Canadian Dollar and the Australian Dollar.
The commodity sector posted positive results for the month. Gains on long positions in the precious metals complex, led by silver, were the best performing subsector. Losses were recorded in the grain complex on short corn positions.
The equity sector posted positive results for the month. Gains were led by long positions in the broad indices, the Nasdaq and S&P 500. Gains were also recorded in single names led by Target and Wal-Mart.
The fixed income sector posted losses for the month. As global interest rates rose, losses were experienced on long fixed income positions.
SEPTEMBER 2020
The Fund posted a loss in September. The month saw a reversal of trends from August as losses were recorded in equities, currency and commodities. Gains were incurred in the fixed income sector.
The commodity sector posted negative results for the month. The metals complex produced negative results on long positions in gold and silver. Gains were recorded in the grain complex led by long positions in soybeans and canola.
The equity sector produced losses on long positions for the month.
The currency sector also was negative for the month. Losses were recorded on short US Dollar positions against the Swiss Franc, Swedish Krona and Euro Dollar as well as the British Pound, Canadian Dollar and the Australian Dollar. Gains were recorded on long US Dollar positions against the Mexican Peso and short US Dollar positions against the Japanese Yen.
In fixed income, interest rate performance was positive for the month. Global bond markets contributed the most to the positive performance led by Italian, German and British interest rate positions.
The views in this letter were as of September 30, 2020 and may not necessarily reflect the same views on the date this letter is first published or any time thereafter. These views are intended to help shareholders in understanding the Fund’s investment methodology and do not constitute investment advice.
| Chesapeake Capital Corporation | administration@chesapeakecapital.com |
| 1721 Summit Avenue | tel 804.836.1617 |
| Richmond, VA 23230 | fax 804.836.1610 |
AXS Managed Futures Strategy Fund
Annual Letter to Shareholders for the year ended September 30, 2020
For the fiscal year, October 1, 2019 through September 30, 2020, the AXS Managed Futures Strategy Fund’s (formerly the Equinox MutualHedge Strategy Fund) Class A Shares (with No Load) returned -25.22%, Class A Shares (with Maximum Load) returned -29.49 %, Class C Shares returned -25.80%, and Class I Shares returned -25.01%. During the period, the Fund’s Class I Shares underperformed the Barclay BTOP50 Index® (the “Managed Futures Index”), which returned -3.67%, as well as US equities (as represented by S&P 500® Total Return Index, the “Equities Index”), which returned +15.15%.
The Fund has remained virtually uncorrelated to equities since inception, with a 0.12 correlation coefficient relative to the Equities Index. Like the managed futures asset class as a whole, to which it had a correlation of 0.80 since inception, the Fund offers the potential for diversification benefits when added to traditional investment portfolios that have equities as their core holding.
FUND STRATEGY
The Fund’s investment objective is to achieve capital appreciation in both rising and falling equity markets, with an annualized level of volatility that is generally lower than the historical level of volatility experienced by the Equities Index The sub-advisor seeks an annualized level of volatility that is generally lower than the historic level of volatility experienced by the S&P 500 Index. This is only a long-term target, and short-term volatility may fall outside this range. The Fund’s realized volatility since inception has been a little over 10%.
The Sub-Advisor pursues the Fund’s investment objectives mainly by investing in (i) fixed-income securities, and (ii) global derivatives markets, through the proprietary programs of one or more commodity trading advisors (“CTAs”), which are often labeled “managed futures” programs.
The Sub-Advisor draws on its experience in the managed futures space to select futures trading programs and, by analyzing the interrelationships among them, to combine them in a portfolio that seeks to offer performance potential with lower volatility than individual programs. The portfolio is designed to be diversified across (i) trading methodologies (e.g., trend-following, global macro trading, relative value trading); (ii) trading time horizons (short-term, medium-term, long-term); (iii) sectors (energy, metals, agricultural commodities, equity indices, interest rates, currencies); and (iv) geography. The Sub-Advisor seeks to manage the risk of the portfolio by monitoring key parameters such as returns, volatility, drawdowns, value at risk (VaR), and sector exposures. While the portfolio is actively managed, it does not express or incorporate tactical views on markets or trading programs; rather, the Sub-Advisor emphasizes strategic allocation and long-term risk-adjusted returns.
ampersandinvestments.com • 47 Hulfish St., Suite 510 Princeton, NJ 08542 • 609.454.5200
PORTFOLIO
As of September 30, 2020, the Fund’s portfolio consisted of 19 futures trading programs. Three global macro programs (H2O, IPM and QMS) represented about 21% of the Fund’s portfolio, while four diversified intermediate-term to long-term trend-following programs (Winton, KeyQuant, Quantica, and Quest) represented approximately 19% of the Fund’s portfolio. Three relative-value/commodity trading programs (Arctic Blue, EVE, and J E Moody) represented approximately 15%, while four machine-learning/short-term trading programs (Crabel, Katonah, QIM and SCT) had a 21% allocation. Two currency trading programs (LCJ and Mesirow, formerly Cambridge) represented a 9% allocation. The remaining 15% was allocated to FORT Contrarian, QDRA and Quadriga. The Sub-Advisor believes that this diversification across trading styles and horizons has the potential, over time, to earn positive returns under varying market conditions while keeping the volatility of the Fund’s returns generally lower than the historic level of volatility experienced by the S&P 500 Index. It is worth mentioning that the above allocations are based on “notional trading,” whereas the Sub-Advisor employs a modified “risk-parity” allocation approach to determine allocations.
Table 1 displays the Fund’s quarter-by-quarter allocations to futures trading programs. This year, there were two additions.
In February 2020, we made an allocation to the Katonah Capital Partners machine-learning based futures trading program. The program seeks to derive trading/portfolio features by the amalgamation of information from proprietary flow models. These features are fed through a proprietary ‘machine learning framework,’ including a “states of the world” model, that systematically evolves with changes in financial markets. Over the long term, returns are expected to be uncorrelated to other futures trading strategies as well as to core asset classes.
In July 2020, we made an allocation to the Quadriga Smart Gold options and futures trading program. The Smart Gold Strategy is a liquid, absolute return strategy that aims to protect capital and generate negatively correlated returns (“crisis alpha”) during adverse and hostile equity markets, while seeking to earn neutral to positive returns during benign markets. Thus, the strategy seeks to earn, in the long run, higher risk-adjusted overall returns, particularly on the downside, through the combination of potentially higher compounded returns, lower realized volatility, and shallower drawdowns. The Smart Gold strategy comprises three parts:
• A Core Precious Metals Strategy that seeks to maintain a long position in gold and other precious metals via futures contracts
• A Core U.S. Treasuries Strategy that seeks to maintain a long position in U.S. Treasury securities via futures contracts; and
• A Long-Only Options Trading Program that primarily buys put options on various underlying “bubble” assets, such as equities, and calls on “anti-bubble” assets such as sovereign debt and precious metals.
ampersandinvestments.com • 47 Hulfish St., Suite 510 Princeton, NJ 08542 • 609.454.5200
TABLE 1: QUARTER-END PORTFOLIO ALLOCATIONS
| Advisor | 9/30/2019 | 12/31/2019 | 3/31/2020 | 6/30/2020 | 9/30/2020 |
| Arctic Blue | 5.0% | 5.0% | 5.0% | 5.0% | 5.0% |
| Crabel | 8.0% | 7.0% | 7.0% | 7.0% | 7.0% |
| Emil van Essen | 6.0% | 6.0% | 6.0% | 5.0% | 5.0% |
| Fort Contrarian | 6.0% | 6.0% | 5.0% | 5.0% | 5.0% |
| H2O Asset Management | 10.0% | 10.0% | 7.0% | 9.0% | 9.0% |
| IPM | 7.0% | 7.0% | 7.0% | 7.0% | 7.0% |
| JE Moody | 4.0% | 4.0% | 5.0% | 5.0% | 5.0% |
| Katonah | | | 4.0% | 4.0% | 4.0% |
| Key Trends | 5.0% | 6.0% | 5.0% | 5.0% | 5.0% |
| LCJ | 5.0% | 5.0% | 5.0% | 5.0% | 5.0% |
| Mesirow Financial | 5.0% | 5.0% | 5.0% | 5.0% | 4.0% |
| QDRA | 7.0% | 7.0% | 8.0% | 7.0% | 6.0% |
| QIM | 7.0% | 7.0% | 7.0% | 7.0% | 6.0% |
| QMS | 5.0% | 5.0% | 5.0% | 5.0% | 5.0% |
| Quadriga | | | | | 4.0% |
| Quantica | 7.0% | 7.0% | 6.0% | 7.0% | 6.0% |
| Quest | 3.0% | 3.0% | 3.0% | 3.0% | 3.0% |
| SCT | 4.0% | 4.0% | 4.0% | 4.0% | 4.0% |
| Winton | 6.0% | 6.0% | 6.0% | 5.0% | 5.0% |
ANALYSIS OF FUND PERFORMANCE
As shown in Table 2, the Fund underperformed both the Managed Futures Index and the Equities Index. The Fund’s volatility since inception is lower than that of the Equities Index.
TABLE 2: PERFORMANCE STATISTICS OF THE FUND
| | RETURN
(Fiscal Year) | VOLATILITY
(5/24/2011-9/30/2020) | CORRELATION
(5/24/2011 – 9/30/2020) |
| Fund (Class I shares) | -25.01% | 10.1% | 1.00 |
| Barclay BTOP50 Index® | -3.67% | 6.40% | 0.80 |
| S&P 500 Total Return Index® | 15.15% | 13.4% | 0.12 |
Past performance does not guarantee future results.
FUND PERFORMANCE ATTRIBUTION BY TRADING PROGRAM AND SECTOR
The fact that only three trading programs had a positive year, as shown in Table 3, is an indication that this was an unusual period. Generally, because of the diversified portfolio of trading allocations, even in a bad year, the number of positive and negative performers tends to be roughly balanced.
ampersandinvestments.com • 47 Hulfish St., Suite 510 Princeton, NJ 08542 • 609.454.5200
TABLE 3: TRADING PROGRAM CONTRIBUTIONS TO PERFORMANCE (10/1/2019 to 9/30/2020)
| Trading Program | Contribution |
| Arctic Blue | 0.78% |
| Crabel | -0.18% |
| Emil van Essen | -2.60% |
| Fort Contrarian | -0.86% |
| H2O Asset Management | -6.93% |
| IPM | -1.44% |
| JE Moody | 2.75% |
| Katonah | -0.79% |
| Key Trends | -1.53% |
| LCJ | -2.24% |
| Mesirow Financial | -1.48% |
| QDRA | -1.08% |
| QIM | -0.78% |
| QMS | -1.70% |
| Quadriga | -2.23% |
| Quantica | -1.18% |
| Quest | 0.20% |
| SCT | -0.79% |
| Winton | -4.22% |
| Fixed Income Securities | 1.29% |
| TOTAL | -25.01% |
At the sector level, as shown in Table 4, except for Interest Rates, all other sectors contributed negatively, again an occurrence that is out of the ordinary.
TABLE 4: FUND PERFORMANCE ATTRIBUTION BY SECTOR (10/1/2019 to 9/30/2020)
| Sector | Contribution |
| Currencies | -10.46% |
| Equity Indices | -13.69% |
| Interest Rates | 2.47% |
| Agricultural Commodities | -0.18% |
| Energy | -2.56% |
| Metals | -1.88% |
| Fixed Income Securities | 1.29% |
| Total | -25.01% |
Performance contribution is estimated by Ampersand Investment Management and is net of fees. Past performance does not guarantee future results.
ampersandinvestments.com • 47 Hulfish St., Suite 510 Princeton, NJ 08542 • 609.454.5200
FUND SECTOR DIVERSIFICATION
RISK EXPOSURE AS OF 9/30/2019
RISK EXPOSURE AS OF 9/30/2020

Source: Ampersand Investment Management and Bloomberg, LP. Reflects aggregate sector gross risk exposures
The Fund’s largest gross exposure as of quarter-end was to the energy sector (about 29%), followed by agricultural commodities (about 23%), equity indices (about 19%), currencies (about 15%) and interest rates (about 10%), while exposure to metals was the smallest (about 5%). Combined, the financial sectors represent about 44% of the Fund’s exposure, significantly higher than the 28% exposure at the end of the prior period.
MARKET COMMENTARY
Q4 2019
The Fund’s Class I shares were down (−5.05%) for the quarter, but still ended the year up +9.32%.
ampersandinvestments.com • 47 Hulfish St., Suite 510 Princeton, NJ 08542 • 609.454.5200
Equity market volatility as measured by the VIX® Index, was relatively high (17%-20%) during the first ten days of October, but subsided dramatically thereafter and stayed within a narrow range (about 12% to 16%), ending the quarter and the year at under 14%.
OCTOBER 2019
The Fund had a difficult October (−4.06%).
Poor US, UK and European economic data led to global slowdown worries early during the month. However, these concerns started to ease when the initial phase of a trade deal was outlined, which involved the US holding off on tariff increases in exchange for some Chinese concessions. Optimism over the trade relationship continued through the rest of the month. Meanwhile, UK Prime Minister Boris Johnson secured a draft Brexit deal with the European Union. He lost the vote, but ultimately the UK was granted an extension of the October 31 deadline, paving the way for a general election.
Stock indices mostly recovered their initial losses by the end of the month, with Asian and European markets leading the way. Quarterly earnings were positive on average, which also drove equity indices higher through the second half of the month. The S&P 500® reached another new high.
US and Eurozone government bond yields dropped in the first week amid concerns of a slowdown. However, later news of positive developments on the geopolitical front enticed market participants to sell safe-haven assets, boosting yields. The yield surge halted when the Fed announced its widely anticipated rate cut. The accompanying verbiage was, as always, open to interpretation. However, the market generally chose to focus on the resistance to future hikes, which led to a small recovery in global bond prices.
In the UK, a breakthrough in Brexit negotiations improved investor sentiment, with both the pound and Euro rallying through the month. Both the Australian and New Zealand Dollars also strengthened.
In energy markets, oil prices moved sideways initially as Russia said it would not cut production significantly, but the Saudis later affirmed that they would. Long positions in oils were profitable as prices rose amid trade optimism. Meanwhile, natural gas prices also rallied on expectations of higher demand.
Continued automotive demand for palladium benefitted long positions, as did the rally in prices of other precious metals, especially gold.
Choppy market conditions in agricultural commodities led to losses, from mainly short positions.
NOVEMBER 2019
Performance reversed and was positive for November (+2.23%).
Optimism increased in light of the ongoing trade talks and better economic data. The proposed US-China trade agreement appeared more holistic than initially anticipated, with the inclusion of Chinese intellectual property considerations. However, geopolitical uncertainty remained after President Trump signed a bill supportive of the Hong Kong demonstrators, which drew criticism from China. In Europe, Brexit continued to feature prominently as the UK Parliament was dissolved and campaigning began for the third general election in four years. Election polls predicted the Conservative Party would win with a firm majority.
ampersandinvestments.com • 47 Hulfish St., Suite 510 Princeton, NJ 08542 • 609.454.5200
Global stock markets climbed higher on the back of positive trade and economic headlines. US equities hit further new highs as constructive developments around “Phase One” of the US-China trade agreement shaped headlines. European and Asian indices moved up albeit less, as Purchasing Managers' Index (PMI) survey results and earning reports both disappointed.
In reaction to optimistic signals on the trade war front, government bond yields increased across developed markets. Risk-on sentiment was further supported by stronger economic data from the US and comments from Fed Chairman Powell that “sustained expansion of economic activity is likely”.
Long US Dollar exposure vs the Euro and the Yen was profitable. Meanwhile, the Australian Dollar fell on monetary easing prospects and the Chilean Peso plummeted in response to civil unrest.
In volatile energy markets, crude oil prices experienced a modest rally on the back of the improved trade sentiment and expectations that OPEC would deepen production cuts. Natural gas dropped on predictions of warmer weather and increased output from shale basins.
In metals, nickel prices fell as Indonesia eased its metal export ban and Chinese steel production output appeared to weaken. Precious metals declined as investors reduced their exposure to safe-haven assets, and as the US dollar rallied.
In agricultural commodities, sugar futures rose on production concerns linked to frost-damaged crops in the US.
DECEMBER 2019
The Fund ended the year up despite a difficult December (−3.19%).
In December, risk assets rallied as a preliminary trade deal between the US and China was announced, staving off the December 15 hike in tariffs. Meanwhile, the Conservative Party won the UK elections handily. Recessionary fears temporarily eased as economic growth indicators showed that the economy maintained a moderate pace of expansion, supported by a strong labor market. Meanwhile, China experienced an unexpected rebound in manufacturing.
Stock indices experienced a shaky start as the US adopted a more aggressive trade stance by reinstating tariffs on Argentina and Brazil. However, improving geopolitics and upbeat economic data helped major stock indices end the month higher; the S&P 500® gained almost 31.5% for the year.
Bond yields generally rose as risk sentiment improved, to the detriment of long positions. Sweden ended its five-year spell of negative interest rates, prompting speculation among investors that other central banks could reassess the efficacy of sub-zero rates.
In currencies, rosier global growth prospects and improving relations between the US and China led to waning safe-haven demand for the US Dollar, which weakened against most major currencies as well as the Australian Dollar and some Latin American currencies. The election-driven rally in GBP was short-lived, however, as Mr. Johnson ruled out any extension to the transition period in which a trade deal with the EU must be negotiated.
Long agricultural positions, particularly the soy complex, struggled as markets rallied broadly on the news of a partial US-China trade deal. Beijing committed to buy $32 billion additional US agricultural products over the next two years. In energies, oil rallied after OPEC agreed on deeper than anticipated output cuts at the December meeting. The rally continued against a more buoyant demand outlook, driven by US-China trade optimism. In metals, palladium extended its 2019 rally, powered by a sustained global deficit.
ampersandinvestments.com • 47 Hulfish St., Suite 510 Princeton, NJ 08542 • 609.454.5200
Q1 2020
In what turned out to be an extremely turbulent and volatile quarter, the Fund’s Class I shares were down −10.51%.
Equity market volatility as measured by the VIX® Index, kicked off the year in the 12%-14% range until the third week of January, but began to trend higher as fears about the pandemic caught hold. Still, until February 21, it stayed in the 14%-19% range. It spiked to 25% on February 24 and ended the month at 40%. It continued to rise during March, peaking at about 83% on March 16, before subsiding slightly to end the month and quarter at about 54%. During this explosively volatile period, equity markets whipsawed sharply almost every day, conditions that are generally not conducive to futures trading strategies in the short run.
JANUARY 2020
The Fund started off the year with a good month of January (+2.56%).
Spurred by a series of geopolitical and economic events, markets fluctuated between “risk on” and “risk off” during the month. The threat of significant military conflict between the US and Iran was one of the first risk-off catalysts. However, by mid-month, the long-awaited phase one trade deal between the US and China was signed, and positive US economic data releases restored global sentiment, and equity markets touched new highs. However, everything changed towards the end of the month, when the WHO declared the outbreak of the coronavirus a global health emergency. The US treasury curve inverted once again, reviving fears of a global growth slowdown.
Global stock indices were hit amid flaring tensions and fears about the economic consequences of coronavirus. The MSCI Emerging Markets and FTSE China A50 indices were among those most affected. In fixed income, long positions profited from the risk-off environment. In currencies, the US Dollar gained amid increasing safe-haven demand.
In agricultural commodities, long coffee positions gave up previous ground gained on supply concerns on signals of ample supply from Brazil, the world's top producer. In metals, palladium continued to hit new record highs amid the ongoing global supply shortage. Fears that the coronavirus could slow global transportation hurt energy markets, particularly from WTI Crude oil and natural gas. Other cyclically sensitive commodities like industrial metals also sold off. Gold played its role as a traditional safe-haven asset and gained.
FEBRUARY 2020
The Fund continued to perform well until February 20, when it was up more than 6% for the month. However, performance reversed sharply thereafter and was negative for the full month of February. (−3.38%).
COVID-19 continued to spread beyond China to many other parts of the globe. Early in the month, there were hopes that the respiratory virus could be contained, and after China's central bank injected greater liquidity than expected, US equities reached new highs. However, the fear of rapidly growing infections and supply chain disruptions grew, and gold and government bonds began to rally. Those fears were realized when coronavirus outbreak clusters were picked up in Italy, Iran and South Korea. As Italy locked down northern towns, Switzerland banned large gatherings and the US had its first community infection, the WHO issued its highest alert. Markets responded with a concerted flight to safety and major US and European indices entered correction territory. Industrial and agricultural commodities including energy also sold off sharply. The benchmark US 10Y yield hit historic lows, while German and Japanese yields fell further below zero. Gold continued its safe-haven rally.
Short positions in bonds and the US Dollar were decimated during the month, as were long equity index positions and long energy positions. In short, the same positions that had driven the Fund up nearly 9% for the year-to-date gave up all those gains and then some.
ampersandinvestments.com • 47 Hulfish St., Suite 510 Princeton, NJ 08542 • 609.454.5200
MARCH 2020
In March, the Fund had one of its worst months ever (−9.70%).
Against one of the most significant global pandemics in a century, the fragility of the financial markets became evident. Rising fears of a global economic shutdown as a result of the socio-economic impact of COVID-19 provided the spark for markets to experience one of the most rapid collapses in modern history.
For several days during the month, equity markets fell by their largest single day drops on record, only to also rally by equally record setting moves.
Central banks and governments the world over provided unprecedented levels of stimulus as they sought to stabilize the markets and to support shuttered economies. The lasting effects of the pandemic on society as a whole and on nations, economies, and populations are yet to play out fully, and the aftershocks will be felt for a long time to come.
Amid the pandemonium, the world also saw the disintegration of the OPEC cartel and the ensuing record low oil prices. The massive twin supply and demand shocks saw crude oil collapse by 75% so far this year.
Q2 2020
In a quarter slightly less turbulent than Q1, the AXS Managed Futures Strategy Fund’s Class I shares were down −6.45%.
Equity market volatility as measured by the VIX Index declined during April from 57 to about 35 but continued to be high by recent historical standards. The average for May and June was about 31, with the index staying in a narrow range of 25 to 36, barring one outlier of 41.
APRIL 2020
The Fund started off the quarter with a positive month of April (+1.00%).
Against the backdrop of the negative global economic outlook caused by the pandemic and in the face of US jobless claims that rose above previous record highs, the Fed’s stimulus lifted US equity markets to their best month in 30 years. Elsewhere, data showed that China and the Eurozone both suffered a historic economic slump in the first quarter. With bonds and commodities signaling a prolonged period of low growth, the recent rally in equity markets appears almost irrational. Unprecedented price swings rocked global oil markets, as the end of the price war between Saudi Arabia and Russia and the prospect of production cuts sent oil prices soaring at the start of the month, only to see lackluster COVID-driven demand disruption and the resulting storage capacity shortage concerns push WTI Crude into negative territory for the first time in history.
Government bond prices rose across the globe on continuing historic levels of monetary stimulus. Volatility declined, while remaining high compared to its long-term average, leading global equity markets to recover by around 25% from their March lows. The US Dollar lost ground, notably against the Australian Dollar, as the Reserve Bank of Australia's unchanged monetary policy stimulated that currency, while safe-haven demand subsided somewhat.
In agricultural commodities, a sharp decline in ethanol production sent corn prices tumbling as demand fell. Natural gas prices rose on expectations of reduced supply given the collapse in crude oil prices. Industrial metals rallied on hopes that the easing of lockdowns and restarting of factories would revive demand.
MAY 2020
The Fund gave up ground in May (−3.97%).
ampersandinvestments.com • 47 Hulfish St., Suite 510 Princeton, NJ 08542 • 609.454.5200
Positive sentiment across equity and commodity markets continued to build as some major economies eased lockdowns and economic activity began to resume, albeit hesitantly. Hopes of earlier-than-anticipated treatments or vaccines for COVID-19 buoyed sentiment in risk assets, and this was reinforced by major stimulus packages in the EU and Japan. Bond markets, however, still appeared concerned about the precariousness of the recovery. Risk sentiment whipsawed in the last part of the month, as the US and China reignited and escalated their trade war.
In fixed income markets, yields continued to decline globally; however, increases were seen at the longer end of the US yield curve, as the US Treasury was forced to announce larger auctions to finance its stimulus packages. Stock indices broadly continued to rally. The US Dollar continued to decline as “risk-off” sentiment decreased. The Norwegian Krone strengthened as oil prices rallied.
The reopening of economies boosted the prices of industrial metals. Natural gas prices reversed their trend, as did WTI Crude, whose worst month on record was followed by its best, as global oil production cuts kicked in.
JUNE 2020
June was another negative month for the Fund (−3.55%).
Markets vacillated between risk-on and risk-off postures. Surprisingly positive US jobs figures sent some US stock indices to record highs; however, a subsequent resurgence in COVID-19 cases, gloomy economic forecasts, and concerns over global trade restrictions led to a sharp retreat. Meanwhile, increased stimulus from the Fed and the European Central Bank boosted positive sentiment.
Led by Germany, government bond yields dropped as governments and central banks reaffirmed their accommodative policies. Gains in Asian markets were offset by losses from short positions in emerging market indices, which gained partly due to a weaker US Dollar. This weakness was bolstered as investors looking towards a global recovery moved out of safe-haven assets.
Short positions in lean hogs and cocoa were profitable, as these commodities struggled amid oversupply and weakened demand, respectively. Volatile natural gas futures touched a 25-year low amid swelling stockpiles, before regaining ground due to warmer weather forecasts and the bankruptcy of a major supplier. Short exposure to oil was unprofitable, as it rallied on higher fuel demand. In metals, sliding Chinese inventories alongside better economic prospects led to losses for short positions in industrial metals such as aluminum.
Q3 2020
In a quarter slightly less turbulent than Q2, the Fund’s Class I shares were down −5.67%. Multiple sharp reversals in equity, fixed income, currency and energy markets amid the persistence of the pandemic were not conducive to performance.
Equity market volatility as measured by the VIX® Index declined further during the quarter, staying in the 20% to 30% range, still higher than its long-term historical average.
JULY 2020
The Fund started off the quarter with a positive month of July (+0.77%). The widespread havoc wreaked by the Coronavirus pandemic was reflected in record contractions in the second-quarter GDP readings of major global economies. Millions of lost jobs were, however, regained in June, although a continued rise in COVID-19 cases in the US raised concerns the recovery may be faltering, with newly imposed business closings and an increase in jobless claims. EU leaders agreed on a pandemic recovery package, partly funded in common debt, an unprecedented event for the bloc. Arrests in Hong Kong under the new security laws led to escalating tensions between Beijing and the US and Europe, adding to the stresses already created by the White House’s characterization of the Coronavirus as the “Wuhan/China virus.” US Treasury yields declined to near all-time lows as investors remained concerned about the pace of the economic recovery and Congress’s failure to agree on the next stimulus deal. Giant tech companies beat earnings estimates, leading to higher US equity markets, while European counterparts struggled amid surges in COVID-19 cases.
ampersandinvestments.com • 47 Hulfish St., Suite 510 Princeton, NJ 08542 • 609.454.5200
Long fixed income positions yielded gains as yields fell on central bank easing, spurred by the potential second wave of Coronavirus infections. Global stock markets also rose on upbeat earnings from technology stocks, and the prospects of further stimulus deals. The US Dollar experienced its worst month in almost a decade amid weak economic data and political uncertainty. Demand revival and ongoing supply pressures boosted major agricultural markets. Coffee prices rose as data showed surges in home consumption. Oil prices rose on unprecedented cuts in North American output, while natural gas prices were more volatile, but climbed on forecasts of hotter weather. Precious metals also rose, as investors continued to clamor for insurance against the Coronavirus impact.
AUGUST 2020
The Fund gave up some ground in August (−1.67%). August saw the end of the S&P 500's sharpest bear market, which also turned out to be the shortest ever, as it took only 126 trading days to recoup pandemic-induced losses. Investor sentiment was somewhat bolstered by promising economic data and talk of a potential Coronavirus vaccine. Russia became the first country to approve a vaccine for civilian use, causing safe-haven assets to sell off. A new inflation goal (targeting an average inflation rate of 2%) from the Federal Reserve, designed to give the central bank further flexibility on monetary policy, also spurred a rally in risk assets. Government bond yields reversed their July decline, leading to losses in long positions. Global stock markets rallied, achieving new record highs, and leading to losses in short positions in some Asian and European stock indices. Some profits were generated from net short US Dollar positions, as the Federal Reserve's announcement drove the currency down against its major peers Net short energy exposures generated losses. Notably, natural gas futures posted their biggest single-day gain in the last 18 months, as hotter weather forecast along with increased export demand continued to send prices soaring. Energy prices were further affected by a major Atlantic hurricane, which disrupted production and forced plant closures. In agricultural commodities, short exposure led to losses, particularly in corn, whose price surged on concerns of worsening crop outlooks from the US to Europe and optimism over demand from China, where imports of corn climbed to a three-year high. Long metals exposure yielded some profits, with most precious and base metals rallying as the US Dollar weakened.
SEPTEMBER 2020
September was a disappointing month for the Fund (−4.79%). A rapid resurgence of Coronavirus cases in Europe and the associated tightening of restrictions contributed towards a general risk-off sentiment throughout the month. Payroll data and jobless claims painted an ambiguous picture of the state of the US recovery, while German PMI (Purchasing Managers’ Index) data at a 2-year high together with data showing the Eurozone in deflation territory raised similar doubts about the trajectory of the Eurozone economy. On the political scene, negotiations between the House and the Trump administration saw no agreement on another US virus relief package. The prospect of a hotly contested presidential election and the increased likelihood of a “no-deal outcome” on Brexit affected market sentiment. As the global economic recovery showed signs of stalling, further economic support was promised by several governments.
As multiple equity markets declined for the first time in months, investors fled to bonds and the US Dollar. Currencies performed poorly, as the US Dollar reversed its prevailing bearish trend, leading to losses, particularly against the Euro and the Australian Dollar. Gains from short positions in energy were more than offset by losses in metals and agricultural commodities. Natural gas prices reversed and fell as inventories rose and the weather turned milder, whereas the crude oil complex declined on slowing global demand. Long precious metals positions incurred losses as investors took profits on the extended rallies in gold and silver. Lean hog positions suffered as prices hit a four-month high on rising wholesale pork prices and increased demand expectations.
ampersandinvestments.com • 47 Hulfish St., Suite 510 Princeton, NJ 08542 • 609.454.5200
Conclusion
We believe that concerns about the global economy and geopolitics have been exacerbated by the coronavirus crisis. Historically, futures trading programs have tended to perform well in a variety of market conditions, perhaps particularly so during periods of market turbulence and volatility expansion. A period of a few weeks or months is far too short to judge the long-term potential of any strategy or asset class.
The Fund seeks to provide returns that, in the long run, are comparable to the S&P 500® Total Return Index with comparable volatility, while seeking to mitigate downside risk. We continue to believe that a significant and strategic allocation to the Fund as a substitute for core equity exposure in a portfolio may provide “smarter” equity exposure: equity exposure that is dynamically hedged, coupled with the potential for uncorrelated alpha in the long run.
Definition of Terms
Allocation based on Notional Trading Level: An allocation to the above two CTA programs of $1 million each would be viewed as an “equal-weighted” allocation based on notional trading level. However, such an allocation would be clearly more heavily risk-weighted towards the higher volatility CTA program. (An example of this would be to invest $1 million each in the S&P and US Treasury Bonds. Such a portfolio would be heavily risk-weighted towards equities.)
Allocation based on Risk Parity: An allocation to the above two CTA programs based on seeking to equalize their risk contributions to a portfolio would be called a “Risk Parity” allocation. This would, in general, almost certainly result in underweighting the riskier program relative to the less risky one, so that their risk contributions are approximately equal. (Investing say $250,000 in equities and $1,750,000 in bonds would be more of a risk-parity approach.)
Alpha is a measure of performance on a risk-adjusted basis. Alpha takes the volatility (price risk) of a fund and compares its risk-adjusted performance to a benchmark index. The excess return of the fund relative to the return of the benchmark index is a fund’s alpha.
Annualized rate of return (AROR) is the geometric average return for a period greater than or equal to one year, expressed on an annual basis or as a return per year.
Brexit is an abbreviation of “British exit,” which refers to the June 23, 2016 referendum by British voters to exit the European Union. The referendum roiled global markets, including currencies, causing the British pound to fall to its lowest level in decades. Prime Minister David Cameron, who supported the UK remaining in the EU announced he would step down in October.
Call options are financial contracts that give the option buyer the right, but not the obligation, to buy a stock, bond, commodity or other asset or instrument at a specified price within a specific time period.
Commodity Trading Advisors (CTA) provide advice and services related to trading in futures contracts. They are responsible for the trading within managed futures accounts.
Correlation is a statistical measure of how two securities move in relation to each other.
Crisis alpha: Refers to profits or gains that can be made by exploiting certain market trends during times of market turmoil.
ampersandinvestments.com • 47 Hulfish St., Suite 510 Princeton, NJ 08542 • 609.454.5200
A Drawdown is a peak-to-trough decline during a specific period for an investment, trading account, or fund. A drawdown is usually quoted as the percentage between the peak and the subsequent trough.
The FTSE China A50 Index is the benchmark for investors to access the China domestic market that comprises the largest 50 A Share companies by full market capitalization of the securities listed on the Shanghai and Shenzhen stock exchanges.
Hedge is making an investment to reduce the risk of adverse price movements in an asset. Normally, a hedge consists of taking an offsetting position in a related security, such as a futures contract.
Long position refers to buying a security such as a stock, commodity, or currency, with the expectation that the asset will rise in value.
Notional Trading Level: Futures contracts are traded on exchanges generally by posting a relatively small amount of margin relative to their “contract value” or “notional value.” CTA trading programs, which trade a wide range of different futures markets, have to find a way to aggregate the notional values of contracts ranging from gold to the S&P 500® index to Treasury Bond futures, since these cannot simply be added together to get a meaningful number. CTAs therefore calibrate the “notional value” of their trading program based on the target volatility of the portfolio of futures contracts traded within that program. One CTA’s program may have a relatively low target volatility of say 6%-8%, whereas another CTA program may target a higher volatility of say 12%-16%. Investors can decide the amount they wish to allocate to each of the two CTA programs based on this target volatility.
Put option is a contract giving the owner the right, but not the obligation, to sell – or sell short – a specified amount of an underlying security at a pre-determined price within a specified time frame.
The Purchasing Managers' Index (PMI) is an index of the prevailing direction of economic trends in the manufacturing and service sectors. The PMI is based on a monthly survey sent to senior executives at more than 400 companies in 19 primary industries, which are weighted by their contribution to U.S. GDP.
The S&P500 Total Return Index® is widely regarded as the best single gauge of the U.S. equities market. This world-renowned Index includes 500 leading companies in leading industries of the U.S. economy.
Short position is a position whereby an investor sells borrowed securities in anticipation of a price decline and is required to return an equal number of shares at some point in the future.
Standard Deviation (Volatility) is a measure of fluctuation in the value of an asset or investment. Lower volatility improves the stability and lowers the risk of an investment portfolio.
Value at risk (VAR) is a measure of the risk of loss for investments. It estimates how much a set of investments might lose (with a given probability), given normal market conditions, in a set time period.
The VIX® Index (VIX) is a forward-looking measure of equity market volatility. Since its introduction, the VIX is considered by many to be the world’s premier barometer of investor sentiment and market volatility.
Yield is the income return on an investment. This refers to the interest or dividends received from a security and is usually expressed annually as a percentage based on the investment’s cost, its current market value or its face value.
Investors cannot directly invest in an index and unmanaged index returns do not reflect any fees, expenses or sales charges. The views in this letter were as of September 30, 2020 and may not necessarily reflect the same views on the date this letter is first published or any time thereafter. These views are intended to help shareholders in understanding the fund’s investment methodology and do not constitute investment advice.
ampersandinvestments.com • 47 Hulfish St., Suite 510 Princeton, NJ 08542 • 609.454.5200

Dear Fellow Shareholders,
As the subadvisor to the AXS Multi-Strategy Alternatives Fund (“the Fund”), we write this annual shareholder letter as of our new fiscal year end on September 30, 2020. This letter covers the months May through September, as our prior fiscal year ended on April 30, 2020.
OVERVIEW
The five-month period saw the market rally off the Coronavirus stimulus and Fed easing into early September. The Fund transitioned to net 100% long1 equities before June and participated in the rally.
September brought volatility as the looming election and political infighting over filling Justice Ginsberg’s seat cast a pall on the timing of the next stimulus package. The Fund maintained its equity position yet outperformed the S&P 500 in September’s downturn.
At the end of September, Morningstar accepted our category appeal and classified the Fund as Long-Short Equity2. Lipper continues to classify the Fund in its Alternative Global Macro category.
INVESTMENT STRATEGY
The AXS Multi-Strategy Alternatives Fund is a liquid, equity-focused macro fund with the flexibility to invest globally and tactically, including long/short, across all asset classes. The Fund's flexible mandate gives it the ability to invest globally in a wide variety of asset classes, company sizes, industries and equity types (growth vs. value). It can also employ leverage to accentuate market moves and hedge in an effort to control risk and manage volatility. Quantitative, top-down hedging and bottoms-up stock picking tools are used which we believe have the added benefit of reducing emotion and behavioral biases in investment decision-making.
| 1 | Net long percentage is the Fund’s gross long exposure less its gross short exposure. In this case, the Fund allocated approximately 120% of AUM to stock purchases (long) and another 20% to stock sales (short selling). |
| 2 | Long-Short Equity funds often establish simultaneous stock positions both long (buying) and short (short selling). |
INVESTMENT PHILOSOPHY
The AXS Multi-Strategy Alternatives Fund employs a risk-averse investment strategy predicated on the belief that strong long-term investment results are best achieved through the compounding of reasonable gains and the avoidance of major losses. The Fund strives to be nimble and responsive to significant market cycle changes by moving out of “harm’s way” during recessions and capitalizing on opportunistic equity strategies during stronger markets. Said another way, the Fund strives to both “manage and participate” by “de-risking” the portfolio in dangerous markets and “re-risking” or “re-engaging” the portfolio to return generating assets when markets are stronger.
INVESTMENT PROCESS
1. Long-term growth of capital
The Fund’s mandate gives it the flexibility to invest globally in any asset class, long or short. We believe, however, that owning common stocks offers the greatest opportunity to grow capital over time. We therefore start by determining if we want to be invested in stocks. We make this determination via equity exposure rules. We call this our "Risk On/Risk Off" hedging process.
If Risk is On, we become stock pickers. Last year we implemented several quantitative, equity strategies, via algorithms, to make the buy/sell decision. These algorithms are based on fundamental input and are designed to exploit opportunities in the marketplace. Our testing of the algorithms prior to implementation demonstrated a more efficient and profitable outcome for the Fund, over long and short-term periods, past and future. As before, each strategy focuses on various factors, both fundamental (such as earnings, debt, free cash flow, dividends and industry leadership) and technical (including price, momentum, volume, volatility and breadth). Each has its own ranking system and buy/sell rules.
Most of our strategies set exposure ceilings of 25-35% on any one sector, with individual names limited to about 3%. We believe this diversification reduces sector and stock-specific risk. International allocations are made in the same manner and held in American Depositary Receipts (ADRs).
2. Preservation of capital
If Risk is Off, we will hedge using three approaches: (a) buying ETFs that act inverse to the stock market to create a market neutral or net short posture, (b) option trades that accomplish the same thing, and (3) by investing in non-correlated asset classes such as bonds, precious metals or currencies through the use of ETFs.
We also have a plan for exiting the hedge. This too is rules-based and very important. We want to get back in to the market as soon as possible in order to catch the rally off the bottom which is often the most profitable leg up in a new bull market.
3. Tax efficiency
Although not our primary focus, we build stock strategies with portfolio turnover in mind in order to maximize our chance for long-term capital gains. We want stocks we can own for several months to several years. In addition, we prefer to build strategies that hold on to winners longer, and cut losers earlier.
We also seek to reduce turnover with our hedging process. First, by using leveraged inverse ETFs or the options market to put on hedges, we are able to stay partially invested. This enables us to build a market neutral position without having to raise a lot of cash and realize gains.
4. Our edge
We believe our equity exposure and stock selection tools give us two distinct long-term advantages over our competitors and the market.
First, our Risk On/Risk Off market exposure process tells us when to be invested in stocks. Hedging can be very tricky. Hedge too early and you get whipsawed (market resumes trend up). Remove the hedge too late and you miss the rally off the bottom. This quantitative tool gives us direction.
Second, our quantitative, fundamentally-based stock selection models tell us when to buy and sell stocks. This, as noted above, reduces both emotion and behavioral bias in the decision. We’ve found that most investors have a good buy philosophy, but poor sell discipline. Our quantitative models assist with both sides of the trade.
PERFORMANCE
Institutional shares3 of the Fund were up 11.94% for the period, beating our benchmark HFRX Equity Hedge Index by 4.67%. and beating the Morningstar Long Short Equity category by 5.13%.
Largest drivers of performance to the upside were our stock selections of Apple, Amazon, Nvidia, Tesla and Resideo Technologies. Largest detractors were Sally Beauty, Exxon Mobil, Cisco Systems, Vipshop and World Fuel Services.
From a factor perspective, momentum and growth contributed to performance, while value and small company size factors hurt performance. On this last point, less than 40% of S&P 500 stocks actually beat the S&P 500 index for the period, and less than 35% of S&P 400 midcap stocks beat the S&P 500 index. This is evidence that the large cap stocks led the market up, as seen in the names of some our strongest performers.
OUTLOOK
Going forward, performance is going to depend on the staying power of the market rally as it attempts to rebound from the economic carnage caused by the Coronavirus. Should the market stumble and our hedge rules become triggered, we will take defensive action again.
The views in this letter were as of September 30, 2020 and may not necessarily reflect the same views on the date this letter is first published or any time thereafter. These views are intended to help shareholders in understanding the Fund’s investment methodology and do not constitute investment advice.
Faithfully yours,
| Martin L Kerns, III | Parker B. Binion |
| CEO, Kerns Capital Management, Inc. | CIO, Kerns Capital Management, Inc. |
AXS Alternative Growth Fund
FUND PERFORMANCE at September 30, 2020 (Unaudited)
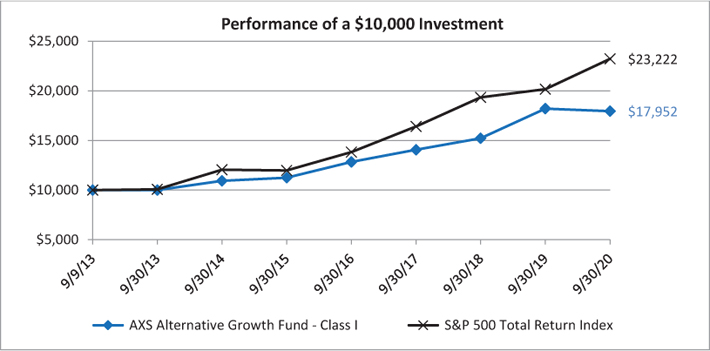
This graph compares a hypothetical $10,000 investment in the Fund’s Class I shares, made at its inception, with a similar investment in the S&P 500 Total Return Index. The performance graph above is shown for the Fund Class I shares. Class A shares performance may vary. Results include the reinvestment of all dividends and capital gains.
The S&P 500 Total Return Index is widely regarded as the best single gauge of the U.S. equities market. This world-renowned Index includes 500 leading companies in leading industries of the U.S. economy. The index does not reflect expenses, fees or sales charge, which would lower performance. The index is unmanaged and is not available for investment.
| Average Annual Total Returns as of September 30, 2020 | 1 Year | 5 Years | Since Inception | Inception Date |
| Before deducting maximum sales charge | | | | |
| Class A1 | -1.47% | 9.48% | 8.35% | 09/09/13 |
| Class I | -1.38% | 9.79% | 8.64% | 09/09/13 |
| After deducting maximum sales charge | | | | |
| Class A1 | -7.13% | 8.19% | 7.45% | 09/09/13 |
| S&P 500 Total Return Index | 15.15% | 14.15% | 12.68% | 09/09/13 |
| 1 | Maximum sales charge for Class A shares is 5.75%. |
The performance data quoted here represents past performance and past performance is not a guarantee of future results. Investment return and principal value will fluctuate so that an investor’s shares, when redeemed, may be worth more or less than their original cost. Current performance may be lower or higher than the performance information quoted. The most recent month end performance may be obtained by calling (833) 297-2587.
The Fund acquired the assets and liabilities of the Equinox Ampersand Strategy Fund, a series of the Equinox Funds Trust (the “Predecessor Fund”) on November 8, 2019. As a result of the reorganization, the Fund is the accounting successor of the Predecessor Fund. Performance results shown in the graph and the performance table above for the periods prior to November 8, 2019, reflect the performance of the Predecessor Fund.
Gross and net expense ratios for the Class A shares were 2.33% and 1.24%, respectively, and the Class I shares were 2.08% and 0.99%, respectively, which were stated in the current prospectus dated November 1, 2020. For the Fund’s current one year expense ratios, please refer to the Consolidated Financial Highlights section of this report. The Fund’s Advisor has contractually agreed to waive its fees and/or pay for operating expenses of the Fund to ensure that total annual fund operating expenses (excluding, as applicable, taxes, leverage interest, brokerage commissions, dividend and interest expenses on short sales, acquired fund fees and expenses as determined in accordance with Form N-1A, expenses incurred in connection with any merger or reorganization, or extraordinary expenses such as litigation expenses) do not exceed 1.24% and 0.99% of the average daily net assets of the Fund’s Class A and Class I shares, respectively. This agreement is in effect until November 9, 2021, and it may be terminated before that date only by the Trust’s Board of Trustees. In the absence of such waivers, the Fund’s returns would be lower.
AXS Alternative Growth Fund
FUND PERFORMANCE at September 30, 2020 (Unaudited) – Continued
Returns reflect the reinvestment of distributions made by the Fund, if any. The graph and the performance table above do not reflect the deduction of taxes that a shareholder would pay on Fund distributions or the redemption of the Fund shares. Shares redeemed within 30 days of purchase will be charged 1.00% redemption fee.
AXS Aspect Core Diversified Strategy Fund
FUND PERFORMANCE at September 30, 2020 (Unaudited)
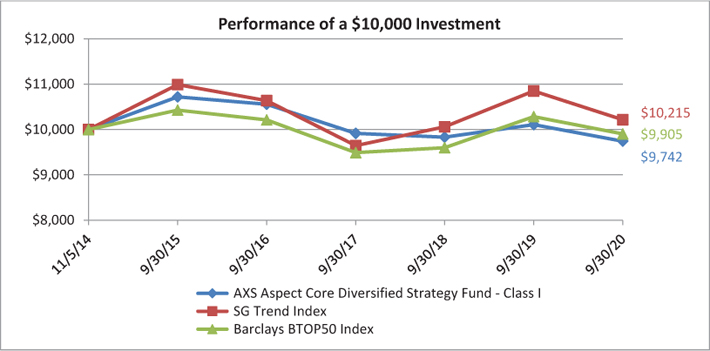
This graph compares a hypothetical $10,000 investment in the Fund’s Class I shares, made at its inception, with a similar investment in the SG Trend Index and Barclays BTOP50 Index. The performance graph above is shown for the Fund Class I shares. Class A shares and Class C shares performance may vary. Results include the reinvestment of all dividends and capital gains.
In November 2020, the Fund’s performance benchmark changed to the SG Trend Index from Barclays BTOP50 Index. The Fund is a pure trend following program whose strategy is better represented with the SG Trend Index instead of BTOP50 Index. The SG Trend Index is comprised of a pool of trend following based hedge fund managers compared to the BTOP50 Index which is comprised of a diversified group of CTA managers which comprise at least 50% of the investable assets of the category. Quantitative measures of goodness of fit and tracking error represent a better fit by the SG Trend vs the BTOP50.
The SG Trend Index is designed to track the 10 largest (by AUM) trend following CTAs and be representative of the trend followers in the managed futures space. The SG Trend index is equally weighted, and rebalanced and reconstituted annually. The Barclays BTOP50 index seeks to replicate the overall composition of the managed futures industry with regard to trading style and overall market exposure. The indexes do not reflect expenses, fees or sales charge, which would lower performance. The indexes are unmanaged and is not available for investment.
| Average Annual Total Returns as of September 30, 2020 | 1 Year | 5 Years | Since Inception | Inception Date |
| Before deducting maximum sales charge | | | | |
| Class A1 | -3.79% | -2.11% | -2.10% | 08/21/15 |
| Class C2 | -4.57% | -2.87% | -2.87% | 08/21/15 |
| Class I3 | -3.62% | -1.89% | -0.44% | 11/05/14 |
| After deducting maximum sales charge | | | | |
| Class A1 | -9.28% | -3.25% | -3.23% | 08/21/15 |
| Class C2 | -5.42% | -2.87% | -2.87% | 08/21/15 |
| SG Trend Index | -5.84% | -1.45% | 0.36% | 11/05/14 |
| Barclays BTOP50 Index | -3.68% | -1.02% | -0.16% | 11/05/14 |
| 1 | Maximum sales charge for Class A shares is 5.75%. No initial sales charge applies to purchase of $1 million or more, but a contingent deferred sales charge (“CDSC”) of 1.00% will be imposed on certain redemptions of such shares within 12 months of purchase. |
| 2 | Class C Shares are subject to a CDSC of 1.00% on any shares sold within 12 months of the date of purchase. |
| 3 | Class I shares do not have any initial or contingent deferred sales charge. |
AXS Aspect Core Diversified Strategy Fund
FUND PERFORMANCE at September 30, 2020 (Unaudited) – Continued
The performance data quoted here represents past performance and past performance is not a guarantee of future results. Investment return and principal value will fluctuate so that an investor’s shares, when redeemed, may be worth more or less than their original cost. Current performance may be lower or higher than the performance information quoted. The most recent month end performance may be obtained by calling (833) 297-2587.
The Fund acquired the assets and liabilities of the Equinox Aspect Core Diversified Strategy Fund, a series of the Equinox Funds Trust (the “Predecessor Fund”) on November 8, 2019. As a result of the reorganization, the Fund is the accounting successor of the Predecessor Fund. Performance results shown in the graph and the performance table above for the period prior to November 8, 2019, reflect the performance of the Predecessor Fund.
Gross and net expense ratios for the Class A were 2.27% and 1.70%, respectively, for the Class C shares were 3.02% and 2.45%, respectively, and for the Class I shares were 2.02% and 1.45%, respectively, which were stated in the current prospectus dated February 1, 2020. For the Fund’s current one year expense ratios, please refer to the Consolidated Financial Highlights section of this report. The Fund’s Advisor has contractually agreed to waive its fees and/or pay for operating expenses of the Fund to ensure that total annual fund operating expenses (excluding, as applicable, taxes, leverage interest, brokerage commissions, dividend and interest expenses on short sales, acquired fund fees and expenses as determined in accordance with Form N-1A, expenses incurred in connection with any merger or reorganization, or extraordinary expenses such as litigation expenses) do not exceed 1.70%, 2.45%, and 1.45% of the average daily net assets of the Fund’s Class A, Class C, and Class I shares, respectively. This agreement is in effect until November 9, 2021, and it may be terminated before that date only by the Trust’s Board of Trustees. In the absence of such waivers, the Fund’s returns would be lower.
Returns reflect the reinvestment of distributions made by the Fund, if any. The graph and the performance table above do not reflect the deduction of taxes that a shareholder would pay on Fund distributions or the redemption of the Fund shares.
AXS Chesapeake Strategy Fund
FUND PERFORMANCE at September 30, 2020 (Unaudited)
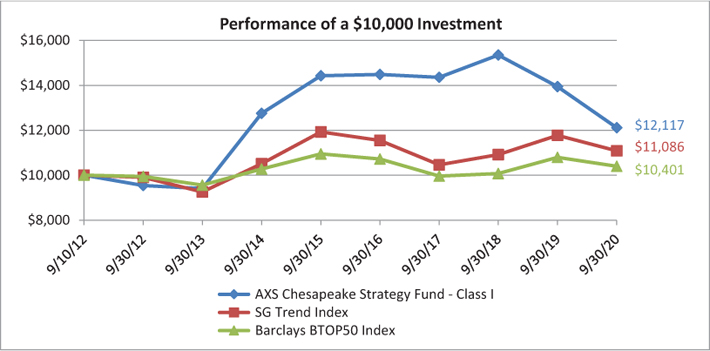
This graph compares a hypothetical $10,000 investment in the Fund’s Class I shares, made at its inception, with a similar investment in the SG Trend Index and Barclays BTOP50 Index. The performance graph above is shown for the Fund Class I shares. Class A shares and Class C shares performance may vary. Results include the reinvestment of all dividends and capital gains.
In November 2020, the Fund’s performance benchmark changed to the SG Trend Index from Barclays BTOP50 Index. The Fund is a pure trend following program whose strategy is better represented with the SG Trend Index instead of BTOP50 Index. The SG Trend Index is comprised of a pool of trend following based hedge fund managers compared to the BTOP50 Index which is comprised of a diversified group of CTA managers which comprise at least 50% of the investable assets of the category. Quantitative measures of goodness of fit and tracking error represent a better fit by the SG Trend vs the BTOP50.
The SG Trend Index is designed to track the 10 largest (by AUM) trend following CTAs and be representative of the trend followers in the managed futures space. The SG Trend index is equally weighted, and rebalanced and reconstituted annually. The Barclays BTOP50 index seeks to replicate the overall composition of the managed futures industry with regard to trading style and overall market exposure. The indexes do not reflect expenses, fees or sales charge, which would lower performance. The indexes are unmanaged and is not available for investment.
| Average Annual Total Returns as of September 30, 2020 | 1 Year | 5 Years | Since Inception | Inception Date |
| Before deducting maximum sales charge | | | | |
| Class A1 | -13.23% | -3.68% | -4.33% | 08/21/15 |
| Class C2 | -13.88% | -4.38% | -5.03% | 08/21/15 |
| Class I3 | -13.07% | -3.42% | 2.41% | 09/10/12 |
| After deducting maximum sales charge | | | | |
| Class A1 | -18.24% | -4.81% | -5.43% | 08/21/15 |
| Class C2 | -14.72% | -4.38% | -5.03% | 08/21/15 |
| SG Trend Index | -5.84% | -1.45% | 1.29% | 09/10/12 |
| Barclays BTOP50 Index | -3.68% | -1.02% | 0.49% | 09/10/12 |
| 1 | Maximum sales charge for Class A shares is 5.75%. No initial sales charge applies to purchase of $1 million or more, but a contingent deferred sales charge (“CDSC”) of 1.00% will be imposed on certain redemptions of such shares within 12 months of purchase. |
| 2 | Class C Shares are subject to a CDSC of 1.00% on any shares sold within 12 months of the date of purchase. |
| 3 | Class I shares do not have any initial or contingent deferred sales charge. |
AXS Chesapeake Strategy Fund
FUND PERFORMANCE at September 30, 2020 (Unaudited) – Continued
The performance data quoted here represents past performance and past performance is not a guarantee of future results. Investment return and principal value will fluctuate so that an investor’s shares, when redeemed, may be worth more or less than their original cost. Current performance may be lower or higher than the performance information quoted. The most recent month end performance may be obtained by calling (833) 297-2587.
The Fund acquired the assets and liabilities of the Equinox Chesapeake Strategy Fund, a series of the Equinox Funds Trust (the “Predecessor Fund”) on November 8, 2019. As a result of the reorganization, the Fund is the accounting successor of the Predecessor Fund. Performance results shown in the graph and the performance table above for the period prior to November 8, 2019, reflect the performance of the Predecessor Fund.
The expense ratios for the Class A, Class C, and Class I shares were 2.10%, 2.85%, and 1.85%, respectively, which were stated in the current prospectus dated February 1, 2020. For the Fund’s current one year expense ratios, please refer to the Consolidated Financial Highlights section of this report. The Fund’s Advisor has contractually agreed to waive its fees and/or pay for operating expenses of the Fund to ensure that total annual fund operating expenses (excluding, as applicable, taxes, leverage interest, brokerage commissions, dividend and interest expenses on short sales, acquired fund fees and expenses as determined in accordance with Form N-1A, expenses incurred in connection with any merger or reorganization, or extraordinary expenses such as litigation expenses) do not exceed 2.10%, 2.85%, and 1.85% of the average daily net assets of the Fund’s Class A, Class C, and Class I shares, respectively. This agreement is in effect until November 9, 2021, and it may be terminated before that date only by the Trust’s Board of Trustees. In the absence of such waivers, the Fund’s returns would be lower.
Returns reflect the reinvestment of distributions made by the Fund, if any. The graph and the performance table above do not reflect the deduction of taxes that a shareholder would pay on Fund distributions or the redemption of the Fund shares.
AXS Managed Futures Strategy Fund
FUND PERFORMANCE at September 30, 2020 (Unaudited)
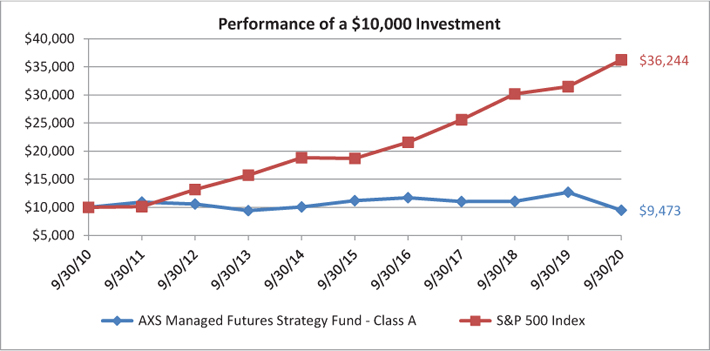
This graph compares a hypothetical $10,000 investment in the Fund’s Class A shares with a similar investment in the S&P 500 Index. The performance graph above is shown for the Fund Class A shares. Class C shares and Class I shares performance may vary. Results include the reinvestment of all dividends and capital gains.
The S&P 500 Index includes a representative sample of 500 leading companies in leading industries of the U.S. economy and assumes any dividends are reinvested back into the index. The index does not reflect expenses, fees or sales charge, which would lower performance. The index is unmanaged and is not available for investment.
| Average Annual Total Returns as of September 30, 2020 | 1 Year | 5 Years | 10 Years |
| Before deducting maximum sales charge | | | |
| Class A1 | -25.22% | -3.29% | -0.54% |
| Class C2 | -25.80% | -4.01% | -1.28% |
| Class I3 | -25.01% | -3.05% | N/A |
| After deducting maximum sales charge | | | |
| Class A1 | -29.49% | -4.42% | -1.13% |
| Class C2 | -26.45% | -4.01% | -1.28% |
| S&P 500 Index | 15.15% | 14.15% | 13.74% |
| 1 | Maximum sales charge for Class A shares is 5.75%. No initial sales charge applies to purchase of $1 million or more, but a contingent deferred sales charge (“CDSC”) of 1.00% will be imposed on certain redemptions of such shares within 12 months of purchase. |
| 2 | Class C Shares are subject to a CDSC of 1.00% on any shares sold within 12 months of the date of purchase. |
| 3 | Class I shares do not have any initial or contingent deferred sales charge. |
The performance data quoted here represents past performance and past performance is not a guarantee of future results. Investment return and principal value will fluctuate so that an investor’s shares, when redeemed, may be worth more or less than their original cost. Current performance may be lower or higher than the performance information quoted. The most recent month end performance may be obtained by calling (833) 297-2587.
The Fund acquired the assets and liabilities of the Equinox MutualHedge Futures Strategy Fund, a series of the Northern Lights Fund Trust (the “Predecessor Fund”) on January 24, 2020. As a result of the reorganization, the Fund is the accounting successor of the Predecessor Fund. Performance results shown in the graph and the performance table above for the period prior to January 24, 2020, reflect the performance of the Predecessor Fund.
AXS Managed Futures Strategy Fund
FUND PERFORMANCE at September 30, 2020 (Unaudited) – Continued
The expense ratios for the Class A, Class C, and Class I shares were 1.91%, 2.66%, and 1.66%, respectively, which were stated in the current prospectus dated February 1, 2020. For the Fund’s current one year expense ratios, please refer to the Consolidated Financial Highlights section of this report. The Fund’s Advisor has contractually agreed to waive its fees and/or pay for operating expenses of the Fund to ensure that total annual fund operating expenses (excluding, as applicable, taxes, leverage interest, brokerage commissions, dividend and interest expenses on short sales, acquired fund fees and expenses as determined in accordance with Form N-1A, expenses incurred in connection with any merger or reorganization, or extraordinary expenses such as litigation expenses) do not exceed 1.95%, 2.70%, and 1.70% of the average daily net assets of the Fund’s Class A, Class C, and Class I shares, respectively. This agreement is in effect until November 9, 2021, and it may be terminated before that date only by the Trust’s Board of Trustees. In the absence of such waivers, the Fund’s returns would be lower.
Returns reflect the reinvestment of distributions made by the Fund, if any. The graph and the performance table above do not reflect the deduction of taxes that a shareholder would pay on Fund distributions or the redemption of the Fund shares. Shares redeemed within 30 days of purchase will be charged a redemption fee of 1.00%.
AXS Multi-Strategy Alternatives Fund
FUND PERFORMANCE at September 30, 2020 (Unaudited)
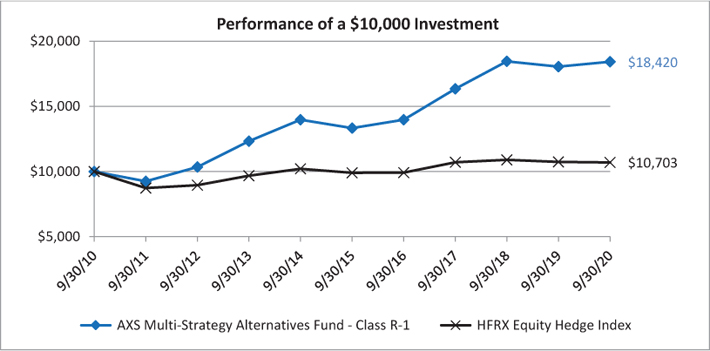
This graph compares a hypothetical $10,000 investment in the Fund’s Class R-1 shares with a similar investment in the HFRX Equity Hedge Index during the periods shown. The performance graph above is shown for the Fund Class R-1 shares. Class I shares performance may vary. Results include the reinvestment of all dividends and capital gains.
The HFRX Equity Hedge Index is an unmanaged index designed to measure daily performance representative of long-short equity hedge funds. The index does not reflect expenses, fees or sales charge, which would lower performance. The index is unmanaged and is not available for investment.
| Average Annual Total Returns as of September 30, 2020 | 1 Year | 5 Years | 10 Years |
| Class R-1 | 2.05% | 6.67% | 6.30% |
| Class I | 2.38% | N/A | N/A |
| HFRX Equity Hedge Index | -0.39% | 1.56% | 0.68% |
The performance data quoted here represents past performance and past performance is not a guarantee of future results. Investment return and principal value will fluctuate so that an investor’s shares, when redeemed, may be worth more or less than their original cost. Current performance may be lower or higher than the performance information quoted. The most recent month end performance may be obtained by calling (833) 297-2587.
The Fund acquired the assets and liabilities of the KCM Macro Trends Fund, a series of Northern Lights Fund Trust (the “Predecessor Fund”) on October 18, 2019. As a result of the reorganization, the Fund is the accounting successor of the Predecessor Fund. Performance results shown in the graph and the performance table above for the period prior to October 18, 2019, reflect the performance of the Predecessor Fund.
Expense ratios for Class R-1 and Class I shares were 1.64% and 1.39%, respectively, which were the amounts stated in the current prospectus dated September 1, 2020. For the Fund’s current one year expense ratios, please refer to the Financial Highlights section of this report.
Returns reflect the reinvestment of distributions made by the Fund, if any. The graph and the performance table shown do not reflect the deduction of taxes that a shareholder would pay on Fund distributions or the redemption of Fund shares.
AXS Alternative Growth Fund
CONSOLIDATED SCHEDULE OF INVESTMENTS
As of September 30, 2020
| Number of Shares | | | | | Value | |
| | | | | EXCHANGE-TRADED FUNDS — 0.9% | | | | |
| | 3,000 | | | Invesco BulletShares 2020 High Yield Corporate Bond ETF | | $ | 70,080 | |
| | | | | TOTAL EXCHANGE-TRADED FUNDS | | | | |
| | | | | (Cost $72,755) | | | 70,080 | |
| Principal Amount | | | | | | |
| | | | | U.S. TREASURY BILLS — 25.1% | | | | |
| $ | 2,000,000 | | | United States Treasury Bill
0.000%, 11/27/2020 | | | 1,999,730 | |
| | | | | TOTAL U.S. TREASURY BILLS | | | | |
| | | | | (Cost $1,999,747) | | | 1,999,730 | |
| | | | | U.S. TREASURY NOTES — 41.5% | | | | |
| | | | | United States Treasury Note | | | | |
| | 2,297,000 | | | 1.625%, 11/30/20201,2 | | | 2,302,740 | |
| | 1,000,000 | | | 2.250%, 2/15/2021 | | | 1,007,967 | |
| | | | | TOTAL U.S. TREASURY NOTES | | | | |
| | | | | (Cost $3,297,030) | | | 3,310,707 | |
| Number of Shares | | | | | | |
| | | | | SHORT-TERM INVESTMENTS — 15.6% | | | | |
| | 1,247,441 | | | Fidelity Investments Money Market Government Portfolio - Class I, 0.01%3 | | | 1,247,441 | |
| | | | | TOTAL SHORT-TERM INVESTMENTS | | | | |
| | | | | (Cost $1,247,441) | | | 1,247,441 | |
| | | | | TOTAL INVESTMENTS — 83.1% | | | | |
| | | | | (Cost $6,616,973) | | | 6,627,958 | |
| | | | | Other Assets in Excess of Liabilities — 16.9% | | | 1,343,975 | |
| | | | | TOTAL NET ASSETS — 100.0% | | $ | 7,971,933 | |
ETF – Exchange-Traded Fund
| 1 | All or a portion of this investment is a holding of AXS Alternative Growth Fund Limited. |
| 2 | All or a portion of this security is segregated as collateral for swap agreement. As of September 30, 2020, the aggregate value of those securities was $798,992, representing 10.0% of net assets. |
| 3 | The rate is the annualized seven-day yield at period end. |
See accompanying Notes to Consolidated Financial Statements.
AXS Alternative Growth Fund
CONSOLIDATED SCHEDULE OF INVESTMENTS - Continued
As of September 30, 2020
FUTURES CONTRACTS
| Number of Contracts | | Description | | Expiration Date | | Notional Value | | | Value at September 30, 2020 | | | Unrealized Appreciation (Depreciation) | |
| 55 | | S&P 500 E-Mini | | December 2020 | | $ | 9,291,115 | | | $ | 9,218,000 | | | $ | (73,115 | ) |
| TOTAL FUTURES CONTRACTS | | $ | 9,291,115 | | | $ | 9,218,000 | | | $ | (73,115 | ) |
See accompanying Notes to Consolidated Financial Statements.
AXS Alternative Growth Fund
CONSOLIDATED SCHEDULE OF INVESTMENTS - Continued
As of September 30, 2020
SWAP CONTRACT
TOTAL RETURN SWAP
| Counterparty | | Reference Entity | | Pay/Receive Total Return on Reference Entity | | Financing Rate1 | | Termination Date | | Notional Value | | | Unrealized Appreciation (Depreciation) | |
| Deutsche Bank | | AXS Alternative Growth Fund Custom Basket2 | | Receive | | 0.50% of Notional Value | | June 1, 2023 | | $ | 13,849,095 | | | $ | (810,634 | ) |
| TOTAL SWAP CONTRACT | | | | | | | | | | $ | (810,634 | ) |
| 1 | Financing rate is based upon predetermined notional amounts. |
| 2 | This investment is a holding of the AXS Alternative Growth Fund Limited. |
See accompanying Notes to Consolidated Financial Statements.
AXS Alternative Growth Fund
CONSOLIDATED SCHEDULE OF INVESTMENTS - Continued
As of September 30, 2020
Total Return Swap Top 50 Holdings^
FUTURES CONTRACTS
| Number of Long Contracts | | Description | | Expiration Date | | Notional Value | | | Unrealized Appreciation (Depreciation) | |
| 43 | | Eurodollar | | Dec-21 | | $ | 10,742,641 | | | $ | (2,135 | ) |
| 23 | | Eurodollar | | Jun-23 | | | 5,849,045 | | | | (882 | ) |
| 68 | | 3 year Australian Treasury Bond | | Dec-20 | | | 5,679,530 | | | | 12,039 | |
| 26 | | Three Month Canadian Bankers Acceptance Future | | Mar-22 | | | 4,832,945 | | | | 1,606 | |
| 19 | | Eurodollar | | Jun-21 | | | 4,672,917 | | | | 106 | |
| 28 | | 3 month Sterling | | Jun-21 | | | 4,570,719 | | | | 2,700 | |
| 25 | | 90 Day Bank Accepted Bill Future | | Nov-21 | | | 4,431,238 | | | | 3,062 | |
| 18 | | 2 year US Treasury Notes | | Dec-20 | | | 4,037,597 | | | | 1,123 | |
| 28 | | 2 year Euro-Schatz | | Dec-20 | | | 3,748,724 | | | | 10 | |
| 26 | | 10 year US Treasury Notes | | Dec-20 | | | 3,691,975 | | | | 4,604 | |
| 21 | | 10 year Australian Treasury Bond Future | | Dec-20 | | | 2,277,824 | | | | 16,556 | |
| 12 | | 90 Day Bank Accepted Bill Future | | Sep-21 | | | 2,206,215 | | | | 1,569 | |
| 11 | | Three Month Canadian Bankers Acceptance Future | | Jun-21 | | | 2,040,375 | | | | 374 | |
| 16 | | 5 year US Treasury Notes | | Dec-20 | | | 2,006,973 | | | | 316 | |
| 8 | | Eurodollar | | Dec-22 | | | 1,947,931 | | | | (175 | ) |
| 12 | | 3 month Sterling | | Jun-22 | | | 1,870,156 | | | | 370 | |
| 9 | | Three Month Canadian Bankers Acceptance Future | | Sep-21 | | | 1,761,832 | | | | 197 | |
| 5 | | 3 month Euro (EURIBOR) | | Mar-22 | | | 1,551,247 | | | | 416 | |
| 9 | | 3 month Sterling | | Sep-21 | | | 1,512,318 | | | | 278 | |
| 5 | | 3 month Euro (EURIBOR) | | Sep-21 | | | 1,482,668 | | | | 583 | |
| 5 | | 3 month Euro (EURIBOR) | | Jun-21 | | | 1,453,635 | | | | 342 | |
| 8 | | 90 Day Bank Accepted Bill Future | | Oct-22 | | | 1,410,785 | | | | 632 | |
| 1 | | 10 year Japanese Government Bond | | Dec-20 | | | 1,359,794 | | | | 872 | |
| 5 | | Eurodollar | | Sep-21 | | | 1,308,612 | | | | 39 | |
| 5 | | Eurodollar | | Mar-21 | | | 1,267,613 | | | | 64 | |
| 4 | | 3 month Euro (EURIBOR) | | Dec-21 | | | 1,255,771 | | | | 364 | |
| 7 | | Long Gilt Future | | Dec-20 | | | 1,246,008 | | | | 3,290 | |
| 6 | | Euro-BUND | | Dec-20 | | | 1,153,383 | | | | 3,668 | |
| Number of Short Contracts | | Description | | Expiration Date | | Notional Value | | | Unrealized Appreciation (Depreciation) | |
| (45) | | 90 Day Bank Accepted Bill Future | | Oct-20 | | $ | (7,951,001 | ) | | $ | (2,711 | ) |
| (34) | | Three Month Canadian Bankers Acceptance Future | | Dec-20 | | | (6,298,757 | ) | | | (287 | ) |
| (16) | | Eurodollar | | Mar-22 | | | (3,943,274 | ) | | | 1,069 | |
| (10) | | 3 month Euro (EURIBOR) | | Dec-20 | | | (3,059,607 | ) | | | (1,099 | ) |
| (14) | | Euro-BUND | | Dec-20 | | | (2,864,320 | ) | | | (13,868 | ) |
| (11) | | Eurodollar | | Dec-20 | | | (2,744,265 | ) | | | (1,082 | ) |
| (1) | | 10 year Japanese Government Bond | | Dec-20 | | | (2,078,584 | ) | | | (2,746 | ) |
| (12) | | 3 month Sterling | | Sep-21 | | | (1,910,752 | ) | | | (632 | ) |
| (6) | | Eurodollar | | Sep-21 | | | (1,520,847 | ) | | | 148 | |
| (6) | | Eurodollar | | Jun-22 | | | (1,501,958 | ) | | | 293 | |
| (5) | | Eurodollar | | Sep-22 | | | (1,343,538 | ) | | | 201 | |
| (10) | | 10 year Canadian Govt Bond | | Dec-20 | | | (1,097,811 | ) | | | 692 | |
OPTIONS ON CURRENCY
| | | Put/Call | | Description | | Expiration Date | | Strike Price | | | Notional Value | | | Unrealized Appreciation (Depreciation) | |
| Purchased | | | | | | | | | | | | | | | |
| | Put | | AUD/USD | | Dec-20 | | $ | 0.71 | | | $ | 2,101,959 | | | $ | 2,620 | |
| | | Call | | USD/EUR | | Jan-21 | | | 1.23 | | | | 2,073,550 | | | | 6,649 | |
| | | Call | | GBP/EUR | | Feb-21 | | | 0.98 | | | | 1,727,096 | | | | 1,619 | |
| | | Call | | XAG/USD | | Sep-21 | | | 24.08 | | | | 1,538,346 | | | | (1,116 | ) |
| | | Call | | XAG/USD | | Jul-21 | | | 29.40 | | | | 1,538,346 | | | | 3,511 | |
| | | Call | | HKD/USD | | Jan-21 | | | 7.80 | | | | 1,473,949 | | | | 1,340 | |
| | | Call | | GBP/EUR | | Nov-20 | | | 0.95 | | | | 1,066,508 | | | | 1,129 | |
| | | | | | | | | | | | | | | | | | | |
| Written | | | | | | | | | | | | | | | | | | |
| | | Call | | USD/EUR | | Jan-21 | | $ | 1.23 | | | $ | (2,073,550 | ) | | $ | (6,649 | ) |
| | | Put | | JPY/USD | | Feb-21 | | | 97.50 | | | | (2,042,409 | ) | | | (2,000 | ) |
| | | Call | | GBP/EUR | | Feb-21 | | | 0.98 | | | | (1,727,096 | ) | | | (5,658 | ) |
AUD - Australian Dollar
EUR - Euro
GBP - British Pound
HKD - Hong Kong Dollar
JPY - Japanese Yen
USD - U.S. Dollar
XAG - Silver
| ^ | These investments are not direct holdings of the Fund. The holdings were determined based on the absolute notional values of the positions within the underlying swap basket. |
See accompanying Notes to Consolidated Financial Statements.
AXS Alternative Growth Fund
CONSOLIDATED SUMMARY OF INVESTMENTS
As of September 30, 2020
| Security Type | | Percent of Total
Net Assets | |
| U.S. Treasury Notes | | | 41.5 | % |
| U.S. Treasury Bills | | | 25.1 | % |
| Exchange-Traded Funds | | | 0.9 | % |
| Short-Term Investments | | | 15.6 | % |
| Total Investments | | | 83.1 | % |
| Other Assets in Excess of Liabilities | | | 16.9 | % |
| Total Net Assets | | | 100.0 | % |
See accompanying Notes to Consolidated Financial Statements.
AXS Aspect Core Diversified Strategy Fund
CONSOLIDATED SCHEDULE OF INVESTMENTS
As of September 30, 2020
| Principal Amount | | | | | Value | |
| | | | | U.S. TREASURY NOTES — 37.7% | | | | |
| | | | | United States Treasury Note | | | | |
| $ | 4,200,000 | | | 1.625%, 11/30/2020 | | $ | 4,210,496 | |
| | 4,200,000 | | | 2.250%, 2/15/2021 | | | 4,233,461 | |
| | | | | TOTAL U.S. TREASURY NOTES | | | | |
| | | | | (Cost $8,386,414) | | | 8,443,957 | |
| Number of Shares | | | | | | |
| | | | | SHORT-TERM INVESTMENTS — 47.6% | | | | |
| | 10,649,766 | | | Fidelity Investments Money Market Treasury Portfolio - Institutional Class, 0.01%1 | | | 10,649,766 | |
| | | | | TOTAL SHORT-TERM INVESTMENTS | | | | |
| | | | | (Cost $10,649,766) | | | 10,649,766 | |
| | | | | TOTAL INVESTMENTS — 85.3% | | | | |
| | | | | (Cost $19,036,180) | | | 19,093,723 | |
| | | | | Other Assets in Excess of Liabilities — 14.7% | | | 3,288,273 | |
| | | | | TOTAL NET ASSETS — 100.0% | | $ | 22,381,996 | |
| 1 | The rate is the annualized seven-day yield at period end. |
See accompanying Notes to Consolidated Financial Statements.
AXS Aspect Core Diversified Strategy Fund
CONSOLIDATED SCHEDULE OF INVESTMENTS - Continued
As of September 30, 2020
FUTURES CONTRACTS
| Long Contracts | | Expiration Date | | Number of Contracts | | Notional Value | | | Value at September 30, 2020 | | | Unrealized Appreciation (Depreciation) | |
| Commodity Futures | | | | | | | | | | | | | |
| CBOT Soybean1 | | November 2020 | | 7 | | $ | 347,892 | | | $ | 358,225 | | | $ | 10,333 | |
| CBOT Soybean Meal1 | | December 2020 | | 5 | | | 166,692 | | | | 171,400 | | | | 4,708 | |
| CBOT Soybean Oil1 | | December 2020 | | 5 | | | 100,902 | | | | 99,390 | | | | (1,512 | ) |
| CBOT Wheat1 | | December 2020 | | 1 | | | 27,490 | | | | 28,900 | | | | 1,410 | |
| CBOT Wheat1 | | March 2021 | | 1 | | | 28,265 | | | | 29,188 | | | | 923 | |
| CMX Copper1 | | December 2020 | | 5 | | | 367,798 | | | | 379,063 | | | | 11,265 | |
| CMX Gold1 | | December 2020 | | 2 | | | 395,914 | | | | 379,100 | | | | (16,814 | ) |
| CMX Silver1 | | December 2020 | | 1 | | | 136,452 | | | | 117,470 | | | | (18,982 | ) |
| ICE Cocoa1 | | December 2020 | | 3 | | | 54,773 | | | | 53,621 | | | | (1,152 | ) |
| ICE Cocoa1 | | March 2021 | | 3 | | | 53,493 | | | | 52,676 | | | | (817 | ) |
| KCBT Hard Red Winter Wheat1 | | December 2020 | | 2 | | | 47,517 | | | | 50,975 | | | | 3,458 | |
| LME Copper1 | | December 2020 | | 3 | | | 491,391 | | | | 500,606 | | | | 9,215 | |
| LME Primary Aluminum1 | | December 2020 | | 1 | | | 45,463 | | | | 44,106 | | | | (1,357 | ) |
| LME Primary Nickel1 | | December 2020 | | 1 | | | 94,345 | | | | 87,090 | | | | (7,255 | ) |
| LME Zinc1 | | December 2020 | | 2 | | | 127,750 | | | | 120,113 | | | | (7,637 | ) |
| NYBOT Cocoa1 | | December 2020 | | 2 | | | 52,055 | | | | 50,920 | | | | (1,135 | ) |
| NYBOT Cocoa1 | | March 2021 | | 1 | | | 25,443 | | | | 25,270 | | | | (173 | ) |
| NYBOT Cotton #21 | | December 2020 | | 3 | | | 97,618 | | | | 98,685 | | | | 1,067 | |
| NYBOT Sugar #111 | | March 2021 | | 1 | | | 14,966 | | | | 15,131 | | | | 165 | |
| | | | | | | | | | | | | | | | | |
| Foreign Exchange Futures | | | | | | | | | | | | | | | | |
| CME Australian Dollar | | December 2020 | | 7 | | | 510,035 | | | | 501,410 | | | | (8,625 | ) |
| CME Euro | | December 2020 | | 33 | | | 4,882,037 | | | | 4,840,894 | | | | (41,143 | ) |
| CME Japanese Yen | | December 2020 | | 10 | | | 1,195,094 | | | | 1,185,937 | | | | (9,157 | ) |
| CME New Zealand Dollar | | December 2020 | | 7 | | | 468,944 | | | | 462,910 | | | | (6,034 | ) |
| CME Swiss Franc | | December 2020 | | 7 | | | 965,097 | | | | 951,738 | | | | (13,359 | ) |
| | | | | | | | | | | | | | | | | |
| Index Futures | | | | | | | | | | | | | | | | |
| CME NASDAQ 100 E-Mini | | December 2020 | | 1 | | | 220,975 | | | | 228,145 | | | | 7,170 | |
| FTSE China A50 | | October 2020 | | 15 | | | 225,402 | | | | 226,800 | | | | 1,398 | |
| SGX Taiwan Index | | October 2020 | | 7 | | | 337,860 | | | | 345,100 | | | | 7,240 | |
| SSE OMXS30 Index | | October 2020 | | 2 | | | 365,042 | | | | 365,177 | | | | 135 | |
| | | | | | | | | | | | | | | | | |
| Interest Rate Futures | | | | | | | | | | | | | | | | |
| CBOT 10-Year U.S. Treasury Note | | December 2020 | | 26 | | | 3,619,711 | | | | 3,627,813 | | | | 8,102 | |
| CBOT 2-Year U.S. Treasury Note | | December 2020 | | 27 | | | 5,963,247 | | | | 5,965,945 | | | | 2,698 | |
| CBOT 5-Year U.S. Treasury Note | | December 2020 | | 34 | | | 4,280,436 | | | | 4,285,063 | | | | 4,627 | |
| CBOT U.S. Long Bond | | December 2020 | | 4 | | | 705,646 | | | | 705,125 | | | | (521 | ) |
| CBOT Ultra Long-Term U.S. Treasury Bond | | December 2020 | | 2 | | | 446,846 | | | | 443,625 | | | | (3,221 | ) |
| CME Eurodollar | | March 2021 | | 15 | | | 3,742,638 | | | | 3,742,688 | | | | 50 | |
| CME Eurodollar | | June 2021 | | 14 | | | 3,493,499 | | | | 3,493,350 | | | | (149 | ) |
| CME Eurodollar | | September 2021 | | 13 | | | 3,243,960 | | | | 3,243,825 | | | | (135 | ) |
| CME Eurodollar | | December 2021 | | 13 | | | 3,243,322 | | | | 3,243,175 | | | | (147 | ) |
| CME Eurodollar | | March 2022 | | 11 | | | 2,744,831 | | | | 2,743,950 | | | | (881 | ) |
| CME Eurodollar | | June 2022 | | 12 | | | 2,994,020 | | | | 2,993,100 | | | | (920 | ) |
| CME Eurodollar | | September 2022 | | 11 | | | 2,744,118 | | | | 2,743,400 | | | | (718 | ) |
| CME Eurodollar | | December 2022 | | 11 | | | 2,742,831 | | | | 2,742,713 | | | | (118 | ) |
| CME Eurodollar | | March 2023 | | 11 | | | 2,741,668 | | | | 2,742,300 | | | | 632 | |
| EUX Euro-BOBL | | December 2020 | | 13 | | | 1,757,117 | | | | 1,757,226 | | | | 109 | |
| EUX Euro-BTP Italian Government Bond | | December 2020 | | 4 | | | 585,432 | | | | 591,163 | | | | 5,731 | |
| EUX Euro-Bund | | December 2020 | | 9 | | | 1,565,685 | | | | 1,571,542 | | | | 5,857 | |
| EUX Euro-Buxl 30 Year Bond | | December 2020 | | 1 | | | 219,101 | | | | 223,297 | | | | 4,196 | |
| EUX EURO-OAT | | December 2020 | | 4 | | | 671,152 | | | | 674,726 | | | | 3,574 | |
| EUX Short-term Euro-BTP Italian Government Bond | | December 2020 | | 3 | | | 339,502 | | | | 339,863 | | | | 361 | |
| ICF 3 Month Euro Euribor | | June 2022 | | 2 | | | 502,614 | | | | 502,627 | | | | 13 | |
| ICF 3 Month Euro Euribor | | September 2022 | | 6 | | | 1,507,629 | | | | 1,507,830 | | | | 201 | |
| ICF 3 Month Euro Euribor | | December 2022 | | 8 | | | 2,009,967 | | | | 2,010,240 | | | | 273 | |
| ICF 3 Month Euro Euribor | | March 2023 | | 13 | | | 3,265,633 | | | | 3,266,166 | | | | 533 | |
| ICF 90 Day Sterling | | March 2021 | | 21 | | | 2,623,904 | | | | 2,623,963 | | | | 59 | |
| ICF 90 Day Sterling | | June 2021 | | 52 | | | 6,498,020 | | | | 6,500,994 | | | | 2,974 | |
| ICF 90 Day Sterling | | September 2021 | | 52 | | | 6,499,508 | | | | 6,502,659 | | | | 3,151 | |
AXS Aspect Core Diversified Strategy Fund
CONSOLIDATED SCHEDULE OF INVESTMENTS - Continued
As of September 30, 2020
FUTURES CONTRACTS (Continued)
| Long Contracts (Continued) | | Expiration Date | | Number of Contracts | | Notional Value | | | Value at September 30, 2020 | | | Unrealized Appreciation (Depreciation) | |
| Interest Rate Futures (Continued) | | | | | | | | | | | | | | | | |
| ICF 90 Day Sterling | | December 2021 | | 53 | | $ | 6,625,620 | | | $ | 6,627,384 | | | $ | 1,764 | |
| ICF 90 Day Sterling | | March 2022 | | 50 | | | 6,250,094 | | | | 6,251,182 | | | | 1,088 | |
| ICF 90 Day Sterling | | June 2022 | | 49 | | | 6,123,075 | | | | 6,126,349 | | | | 3,274 | |
| ICF 90 Day Sterling | | September 2022 | | 45 | | | 5,623,304 | | | | 5,625,855 | | | | 2,551 | |
| ICF 90 Day Sterling | | December 2022 | | 32 | | | 3,998,291 | | | | 3,999,980 | | | | 1,689 | |
| ICF 90 Day Sterling | | March 2023 | | 27 | | | 3,372,239 | | | | 3,374,713 | | | | 2,474 | |
| ICF Long Gilt | | December 2020 | | 17 | | | 2,315,629 | | | | 2,313,359 | | | | (2,270 | ) |
| MSE 3 Month Bank Acceptence | | March 2021 | | 17 | | | 4,228,118 | | | | 4,228,433 | | | | 315 | |
| MSE 3 Month Bank Acceptence | | June 2021 | | 20 | | | 4,973,623 | | | | 4,974,282 | | | | 659 | |
| MSE 3 Month Bank Acceptence | | September 2021 | | 18 | | | 4,475,457 | | | | 4,476,146 | | | | 689 | |
| MSE 3 Month Bank Acceptence | | December 2021 | | 12 | | | 2,983,059 | | | | 2,983,503 | | | | 444 | |
| MSE 3 Month Bank Acceptence | | March 2022 | | 9 | | | 2,236,779 | | | | 2,237,245 | | | | 466 | |
| MSE 3 Month Bank Acceptence | | June 2022 | | 7 | | | 1,739,087 | | | | 1,739,725 | | | | 638 | |
| MSE Canadian 10 Year Bond | | December 2020 | | 37 | | | 5,615,526 | | | | 5,616,610 | | | | 1,084 | |
| SFE 90 Day Bank Bill | | March 2021 | | 34 | | | 33,987,576 | | | | 33,992,272 | | | | 4,696 | |
| SFE 90 Day Bank Bill | | June 2021 | | 29 | | | 28,988,601 | | | | 28,993,181 | | | | 4,580 | |
| SFE 90 Day Bank Bill | | September 2021 | | 23 | | | 22,990,560 | | | | 22,993,666 | | | | 3,106 | |
| SFE 90 Day Bank Bill | | December 2021 | | 14 | | | 13,992,833 | | | | 13,995,247 | | | | 2,414 | |
| SFE 90 Day Bank Bill | | March 2022 | | 10 | | | 9,995,216 | | | | 9,996,524 | | | | 1,308 | |
| SFE 90 Day Bank Bill | | June 2022 | | 6 | | | 5,996,833 | | | | 5,997,724 | | | | 891 | |
| SFE Australian 10 Year Bond | | December 2020 | | 18 | | | 2,669,120 | | | | 2,683,410 | | | | 14,290 | |
| SFE Australian 3 Year Bond | | December 2020 | | 125 | | | 14,626,398 | | | | 14,652,823 | | | | 26,425 | |
| Total Long Contracts | | | | | | | 276,405,780 | | | | 276,438,021 | | | | 32,241 | |
| Short Contracts | | Expiration Date | | Number of Contracts | | Notional Value | | | Value at September 30, 2020 | | | Unrealized Appreciation (Depreciation) | |
| Commodity Futures | | | | | | | | | | | | | | | | |
| CBOT Corn1 | | December 2020 | | (1) | | | (16,123 | ) | | | (18,950 | ) | | | (2,827 | ) |
| CBOT Corn1 | | March 2021 | | (2) | | | (33,583 | ) | | | (38,825 | ) | | | (5,242 | ) |
| CME Lean Hogs1 | | December 2020 | | (2) | | | (40,725 | ) | | | (50,480 | ) | | | (9,755 | ) |
| CME Lean Hogs1 | | February 2021 | | (2) | | | (50,425 | ) | | | (54,400 | ) | | | (3,975 | ) |
| CME Live Cattle1 | | December 2020 | | (2) | | | (87,845 | ) | | | (89,880 | ) | | | (2,035 | ) |
| CME Live Cattle1 | | February 2021 | | (1) | | | (45,717 | ) | | | (46,350 | ) | | | (633 | ) |
| CME Live Cattle1 | | April 2021 | | (1) | | | (46,017 | ) | | | (47,110 | ) | | | (1,093 | ) |
| ICE Brent Crude Oil1 | | December 2020 | | (3) | | | (130,886 | ) | | | (126,900 | ) | | | 3,986 | |
| ICE Brent Crude Oil1 | | January 2021 | | (2) | | | (89,157 | ) | | | (85,500 | ) | | | 3,657 | |
| ICE Low Sulphur Gas1 | | November 2020 | | (8) | | | (281,265 | ) | | | (267,000 | ) | | | 14,265 | |
| ICE Low Sulphur Gas1 | | December 2020 | | (3) | | | (101,171 | ) | | | (101,400 | ) | | | (229 | ) |
| LME Lead1 | | December 2020 | | (1) | | | (47,050 | ) | | | (45,556 | ) | | | 1,494 | |
| NYBOT Sugar #111 | | May 2021 | | (1) | | | (13,840 | ) | | | (14,806 | ) | | | (966 | ) |
| NYMEX Natural Gas1 | | November 2020 | | (14) | | | (389,862 | ) | | | (353,780 | ) | | | 36,082 | |
| NYMEX Natural Gas1 | | December 2020 | | (3) | | | (96,174 | ) | | | (93,510 | ) | | | 2,664 | |
| NYMEX NY Harbor ULSD1 | | November 2020 | | (5) | | | (256,558 | ) | | | (241,962 | ) | | | 14,596 | |
| NYMEX NY Harbor ULSD1 | | December 2020 | | (2) | | | (100,829 | ) | | | (97,902 | ) | | | 2,927 | |
| NYMEX RBOB Gasoline1 | | December 2020 | | (4) | | | (194,223 | ) | | | (195,754 | ) | | | (1,531 | ) |
| NYMEX WTI Crude Oil1 | | November 2020 | | (3) | | | (117,273 | ) | | | (120,660 | ) | | | (3,387 | ) |
| NYMEX WTI Crude Oil1 | | December 2020 | | (1) | | | (38,947 | ) | | | (40,470 | ) | | | (1,523 | ) |
| | | | | | | | | | | | | | | | | |
| Foreign Exchange Futures | | | | | | | | | | | | | | | | |
| CME British Pound | | December 2020 | | (25) | | | (2,009,536 | ) | | | (2,016,250 | ) | | | (6,714 | ) |
| CME Canadian Dollar | | December 2020 | | (4) | | | (299,170 | ) | | | (300,520 | ) | | | (1,350 | ) |
| CME Mexican Peso | | December 2020 | | (8) | | | (178,889 | ) | | | (179,400 | ) | | | (511 | ) |
See accompanying Notes to Consolidated Financial Statements.
AXS Aspect Core Diversified Strategy Fund
CONSOLIDATED SCHEDULE OF INVESTMENTS - Continued
As of September 30, 2020
FUTURES CONTRACTS (Continued)
| Short Contracts (Continued) | | Expiration Date | | Number of Contracts | | Notional Value | | | Value at September 30, 2020 | | | Unrealized Appreciation (Depreciation) | |
| Index Futures | | | | | | | | | | | | | | | | |
| CME E-mini Russell 2000 Index | | December 2020 | | (1) | | $ | (74,466 | ) | | $ | (75,220 | ) | | $ | (754 | ) |
| CME E-mini S&P MidCap 400 | | December 2020 | | (1) | | | (184,854 | ) | | | (185,590 | ) | | | (736 | ) |
| EOE AEX Index (Amsterdam) | | October 2020 | | (1) | | | (110,399 | ) | | | (109,364 | ) | | | 1,035 | |
| EOP CAC 40 10 Euro | | October 2020 | | (3) | | | (149,274 | ) | | | (143,126 | ) | | | 6,148 | |
| EUX Euro STOXX 50 | | December 2020 | | (4) | | | (130,528 | ) | | | (127,283 | ) | | | 3,245 | |
| HKG Hang Seng Index | | October 2020 | | (2) | | | (2,331,361 | ) | | | (2,332,863 | ) | | | (1,502 | ) |
| HKG HSCEI | | October 2020 | | (3) | | | (1,410,362 | ) | | | (1,409,928 | ) | | | 434 | |
| ICF FTSE 100 Index | | December 2020 | | (3) | | | (181,183 | ) | | | (173,521 | ) | | | 7,662 | |
| MIL FTSE/MIB Index | | December 2020 | | (2) | | | (193,473 | ) | | | (188,991 | ) | | | 4,482 | |
| MSE S&P/TSE 60 Index | | December 2020 | | (1) | | | (193,011 | ) | | | (192,477 | ) | | | 534 | |
| NYF MSCI EAFE Index | | December 2020 | | (1) | | | (94,443 | ) | | | (92,660 | ) | | | 1,783 | |
| SAF FTSE/JSE Top 40 | | December 2020 | | (3) | | | (1,537,181 | ) | | | (1,535,645 | ) | | | 1,536 | |
| SFE SPI 200 Index | | December 2020 | | (2) | | | (294,346 | ) | | | (291,305 | ) | | | 3,041 | |
| SGX Nifty 50 Index | | October 2020 | | (5) | | | (111,741 | ) | | | (112,540 | ) | | | (799 | ) |
| | | | | | | | | | | | | | | | | |
| Interest Rate Futures | | | | | | | | | | | | | | | | |
| EUX Euro-Schatz | | December 2020 | | (5) | | | (561,482 | ) | | | (561,444 | ) | | | 38 | |
| OSE Japanese 10-Year Bond | | December 2020 | | (1) | | | (151,824,305 | ) | | | (151,827,014 | ) | | | (2,709 | ) |
| Total Short Contracts | | | | | | | (164,047,674 | ) | | | (163,986,336 | ) | | | 61,338 | |
| | | | | | | | | | | | | | | | | |
| TOTAL FUTURES CONTRACTS | | | | | | $ | 112,358,106 | | | $ | 112,451,685 | | | $ | 93,579 | |
| 1 | This investment is a holding of AXS Aspect Core Diversified Strategy Fund Limited. |
See accompanying Notes to Consolidated Financial Statements.
AXS Aspect Core Diversified Strategy Fund
CONSOLIDATED SCHEDULE OF INVESTMENTS - Continued
As of September 30, 2020
FORWARD FOREIGN CURRENCY CONTRACTS
| Settlement Date | | Counterparty | | Currency Units to Receive/(Deliver) | | In Exchange For | | Unrealized Appreciation (Depreciation) | |
| 12/16/2020 | | Morgan Stanley | | | 266,035 | | | BRL | | | 50,000 | | | USD | | $ | (2,732 | ) |
| 12/16/2020 | | Morgan Stanley | | | 134,998 | | | BRL | | | 25,000 | | | USD | | | (1,014 | ) |
| 12/16/2020 | | Morgan Stanley | | | 134,955 | | | BRL | | | 25,000 | | | USD | | | (1,022 | ) |
| 12/16/2020 | | Morgan Stanley | | | 131,303 | | | BRL | | | 25,000 | | | USD | | | (1,671 | ) |
| 12/16/2020 | | Morgan Stanley | | | 131,230 | | | BRL | | | 25,000 | | | USD | | | (1,683 | ) |
| 12/16/2020 | | Morgan Stanley | | | (138,678 | ) | | BRL | | | (25,000 | ) | | USD | | | 360 | |
| 12/16/2020 | | Morgan Stanley | | | (138,718 | ) | | BRL | | | (25,000 | ) | | USD | | | 353 | |
| 12/16/2020 | | Morgan Stanley | | | (140,153 | ) | | BRL | | | (25,000 | ) | | USD | | | 98 | |
| 12/16/2020 | | Morgan Stanley | | | (140,180 | ) | | BRL | | | (25,000 | ) | | USD | | | 94 | |
| 12/16/2020 | | Morgan Stanley | | | (1,848,059 | ) | | BRL | | | (350,000 | ) | | USD | | | 21,644 | |
| 12/16/2020 | | Morgan Stanley | | | 38,633,675 | | | CLP | | | 50,000 | | | USD | | | (749 | ) |
| 12/16/2020 | | Morgan Stanley | | | 38,515,675 | | | CLP | | | 50,000 | | | USD | | | (899 | ) |
| 12/16/2020 | | Morgan Stanley | | | (38,714,875 | ) | | CLP | | | (50,000 | ) | | USD | | | 645 | |
| 12/16/2020 | | Morgan Stanley | | | (39,144,325 | ) | | CLP | | | (50,000 | ) | | USD | | | 98 | |
| 12/16/2020 | | Morgan Stanley | | | (39,482,325 | ) | | CLP | | | (50,000 | ) | | USD | | | (333 | ) |
| 12/16/2020 | | Morgan Stanley | | | 1,550,616 | | | CNH | | | 225,000 | | | USD | | | 2,339 | |
| 12/16/2020 | | Morgan Stanley | | | 1,550,377 | | | CNH | | | 225,000 | | | USD | | | 2,304 | |
| 12/16/2020 | | Morgan Stanley | | | 1,378,160 | | | CNH | | | 200,000 | | | USD | | | 2,055 | |
| 12/16/2020 | | Morgan Stanley | | | 1,378,024 | | | CNH | | | 200,000 | | | USD | | | 2,036 | |
| 12/16/2020 | | Morgan Stanley | | | 1,205,674 | | | CNH | | | 175,000 | | | USD | | | 1,767 | |
| 12/16/2020 | | Morgan Stanley | | | 689,160 | | | CNH | | | 100,000 | | | USD | | | 1,039 | |
| 12/16/2020 | | Morgan Stanley | | | 517,174 | | | CNH | | | 75,000 | �� | | USD | | | 824 | |
| 12/16/2020 | | Morgan Stanley | | | (339,816 | ) | | CNH | | | (50,000 | ) | | USD | | | 179 | |
| 12/16/2020 | | Morgan Stanley | | | (340,090 | ) | | CNH | | | (50,000 | ) | | USD | | | 139 | |
| 12/16/2020 | | Morgan Stanley | | | (341,663 | ) | | CNH | | | (50,000 | ) | | USD | | | (92 | ) |
| 12/16/2020 | | Morgan Stanley | | | (343,614 | ) | | CNH | | | (50,000 | ) | | USD | | | (378 | ) |
| 12/16/2020 | | Morgan Stanley | | | 186,706,075 | | | COP | | | 50,000 | | | USD | | | (1,415 | ) |
| 12/16/2020 | | Morgan Stanley | | | 94,830,538 | | | COP | | | 25,000 | | | USD | | | (323 | ) |
| 12/16/2020 | | Morgan Stanley | | | 94,801,788 | | | COP | | | 25,000 | | | USD | | | (330 | ) |
| 12/16/2020 | | Morgan Stanley | | | 93,228,750 | | | COP | | | 25,000 | | | USD | | | (740 | ) |
| 12/16/2020 | | Morgan Stanley | | | 93,169,000 | | | COP | | | 25,000 | | | USD | | | (755 | ) |
| 12/16/2020 | | Morgan Stanley | | | (95,103,250 | ) | | COP | | | (25,000 | ) | | USD | | | 252 | |
| 12/16/2020 | | Morgan Stanley | | | (95,172,713 | ) | | COP | | | (25,000 | ) | | USD | | | 234 | |
| 12/16/2020 | | Morgan Stanley | | | (96,816,463 | ) | | COP | | | (25,000 | ) | | USD | | | (194 | ) |
| 12/16/2020 | | Morgan Stanley | | | (96,843,213 | ) | | COP | | | (25,000 | ) | | USD | | | (201 | ) |
| 12/16/2020 | | Morgan Stanley | | | (97,104,213 | ) | | COP | | | (25,000 | ) | | USD | | | (269 | ) |
| 12/16/2020 | | Morgan Stanley | | | (97,178,463 | ) | | COP | | | (25,000 | ) | | USD | | | (288 | ) |
| 12/16/2020 | | Morgan Stanley | | | (97,571,213 | ) | | COP | | | (25,000 | ) | | USD | | | (390 | ) |
| 12/16/2020 | | Morgan Stanley | | | (97,807,463 | ) | | COP | | | (25,000 | ) | | USD | | | (452 | ) |
| 12/16/2020 | | Morgan Stanley | | | (1,120,688,550 | ) | | COP | | | (300,000 | ) | | USD | | | 8,369 | |
| 12/16/2020 | | Morgan Stanley | | | 400,000 | | | EUR | | | 10,625,900 | | | CZK | | | 8,912 | |
| 12/16/2020 | | Morgan Stanley | | | 50,000 | | | EUR | | | 1,329,724 | | | CZK | | | 1,049 | |
| 12/16/2020 | | Morgan Stanley | | | 50,000 | | | EUR | | | 1,340,664 | | | CZK | | | 575 | |
| 12/16/2020 | | Morgan Stanley | | | 50,000 | | | EUR | | | 1,327,728 | | | CZK | | | 1,136 | |
| 12/16/2020 | | Morgan Stanley | | | 50,000 | | | EUR | | | 1,339,239 | | | CZK | | | 637 | |
| 12/16/2020 | | Morgan Stanley | | | 50,000 | | | EUR | | | 1,331,071 | | | CZK | | | 991 | |
| 12/16/2020 | | Morgan Stanley | | | 50,000 | | | EUR | | | 1,352,713 | | | CZK | | | 52 | |
| 12/16/2020 | | Morgan Stanley | | | 50,000 | | | EUR | | | 1,362,942 | | | CZK | | | (391 | ) |
| 12/16/2020 | | Morgan Stanley | | | 25,000 | | | EUR | | | 679,601 | | | CZK | | | (115 | ) |
See accompanying Notes to Consolidated Financial Statements.
AXS Aspect Core Diversified Strategy Fund
CONSOLIDATED SCHEDULE OF INVESTMENTS - Continued
As of September 30, 2020
FORWARD FOREIGN CURRENCY CONTRACTS - Continued
| Settlement Date | | Counterparty | | Currency Units to Receive/(Deliver) | | In Exchange For | | Unrealized Appreciation (Depreciation) | |
| 12/16/2020 | | Morgan Stanley | | | 25,000 | | | EUR | | | 678,821 | | | CZK | | $ | (81 | ) |
| 12/16/2020 | | Morgan Stanley | | | 150,000 | | | EUR | | | 53,880,250 | | | HUF | | | 2,628 | |
| 12/16/2020 | | Morgan Stanley | | | 75,000 | | | EUR | | | 26,918,405 | | | HUF | | | 1,384 | |
| 12/16/2020 | | Morgan Stanley | | | 75,000 | | | EUR | | | 26,945,952 | | | HUF | | | 1,295 | |
| 12/16/2020 | | Morgan Stanley | | | 75,000 | | | EUR | | | 26,917,895 | | | HUF | | | 1,386 | |
| 12/16/2020 | | Morgan Stanley | | | 50,000 | | | EUR | | | 17,930,378 | | | HUF | | | 972 | |
| 12/16/2020 | | Morgan Stanley | | | 50,000 | | | EUR | | | 17,931,623 | | | HUF | | | 968 | |
| 12/16/2020 | | Morgan Stanley | | | 50,000 | | | EUR | | | 17,938,118 | | | HUF | | | 947 | |
| 12/16/2020 | | Morgan Stanley | | | 50,000 | | | EUR | | | 17,955,568 | | | HUF | | | 891 | |
| 12/16/2020 | | Morgan Stanley | | | 50,000 | | | EUR | | | 17,931,838 | | | HUF | | | 967 | |
| 12/16/2020 | | Morgan Stanley | | | 25,000 | | | EUR | | | 8,965,202 | | | HUF | | | 486 | |
| 12/16/2020 | | Morgan Stanley | | | 25,000 | | | EUR | | | 8,965,569 | | | HUF | | | 485 | |
| 12/16/2020 | | Morgan Stanley | | | 25,000 | | | EUR | | | 8,965,869 | | | HUF | | | 484 | |
| 12/16/2020 | | Morgan Stanley | | | 25,000 | | | EUR | | | 8,966,109 | | | HUF | | | 483 | |
| 12/16/2020 | | Morgan Stanley | | | 25,000 | | | EUR | | | 8,967,164 | | | HUF | | | 480 | |
| 12/16/2020 | | Morgan Stanley | | | 25,000 | | | EUR | | | 8,968,842 | | | HUF | | | 474 | |
| 12/16/2020 | | Morgan Stanley | | | 25,000 | | | EUR | | | 8,963,684 | | | HUF | | | 491 | |
| 12/16/2020 | | Morgan Stanley | | | 25,000 | | | EUR | | | 8,976,667 | | | HUF | | | 449 | |
| 12/16/2020 | | Morgan Stanley | | | 25,000 | | | EUR | | | 8,974,927 | | | HUF | | | 455 | |
| 12/16/2020 | | Morgan Stanley | | | 25,000 | | | EUR | | | 8,973,142 | | | HUF | | | 460 | |
| 12/16/2020 | | Morgan Stanley | | | 25,000 | | | EUR | | | 8,964,552 | | | HUF | | | 488 | |
| 12/16/2020 | | Morgan Stanley | | | 25,000 | | | EUR | | | 8,970,442 | | | HUF | | | 469 | |
| 12/16/2020 | | Morgan Stanley | | | 25,000 | | | EUR | | | 8,962,622 | | | HUF | | | 494 | |
| 12/16/2020 | | Morgan Stanley | | | 25,000 | | | EUR | | | 8,942,249 | | | HUF | | | 560 | |
| 12/16/2020 | | Morgan Stanley | | | 25,000 | | | EUR | | | 8,937,034 | | | HUF | | | 577 | |
| 12/16/2020 | | Morgan Stanley | | | 550,000 | | | EUR | | | 5,918,938 | | | NOK | | | 11,343 | |
| 12/16/2020 | | Morgan Stanley | | | 50,000 | | | EUR | | | 554,294 | | | NOK | | | (707 | ) |
| 12/16/2020 | | Morgan Stanley | | | 50,000 | | | EUR | | | 535,994 | | | NOK | | | 1,255 | |
| 12/16/2020 | | Morgan Stanley | | | 50,000 | | | EUR | | | 558,411 | | | NOK | | | (1,148 | ) |
| 12/16/2020 | | Morgan Stanley | | | 50,000 | | | EUR | | | 535,137 | | | NOK | | | 1,347 | |
| 12/16/2020 | | Morgan Stanley | | | 50,000 | | | EUR | | | 556,375 | | | NOK | | | (930 | ) |
| 12/16/2020 | | Morgan Stanley | | | 50,000 | | | EUR | | | 548,641 | | | NOK | | | (101 | ) |
| 12/16/2020 | | Morgan Stanley | | | 50,000 | | | EUR | | | 549,411 | | | NOK | | | (183 | ) |
| 12/16/2020 | | Morgan Stanley | | | 50,000 | | | EUR | | | 535,793 | | | NOK | | | 1,277 | |
| 12/16/2020 | | Morgan Stanley | | | 50,000 | | | EUR | | | 536,683 | | | NOK | | | 1,182 | |
| 12/16/2020 | | Morgan Stanley | | | 50,000 | | | EUR | | | 535,463 | | | NOK | | | 1,312 | |
| 12/16/2020 | | Morgan Stanley | | | 25,000 | | | EUR | | | 267,893 | | | NOK | | | 639 | |
| 12/16/2020 | | Morgan Stanley | | | 25,000 | | | EUR | | | 267,903 | | | NOK | | | 638 | |
| 12/16/2020 | | Morgan Stanley | | | 250,000 | | | EUR | | | 1,114,098 | | | PLN | | | 5,382 | |
| 12/16/2020 | | Morgan Stanley | | | 50,000 | | | EUR | | | 228,153 | | | PLN | | | (304 | ) |
| 12/16/2020 | | Morgan Stanley | | | 50,000 | | | EUR | | | 227,015 | | | PLN | | | (9 | ) |
| 12/16/2020 | | Morgan Stanley | | | 50,000 | | | EUR | | | 225,111 | | | PLN | | | 483 | |
| 12/16/2020 | | Morgan Stanley | | | 50,000 | | | EUR | | | 222,932 | | | PLN | | | 1,047 | |
| 12/16/2020 | | Morgan Stanley | | | 50,000 | | | EUR | | | 226,851 | | | PLN | | | 33 | |
| 12/16/2020 | | Morgan Stanley | | | 50,000 | | | EUR | | | 222,727 | | | PLN | | | 1,100 | |
| 12/16/2020 | | Morgan Stanley | | | 50,000 | | | EUR | | | 222,970 | | | PLN | | | 1,038 | |
| 12/16/2020 | | Morgan Stanley | | | 25,000 | | | EUR | | | 111,448 | | | PLN | | | 528 | |
| 12/16/2020 | | Morgan Stanley | | | 25,000 | | | EUR | | | 113,904 | | | PLN | | | (107 | ) |
| 12/16/2020 | | Morgan Stanley | | | 25,000 | | | EUR | | | 111,529 | | | PLN | | | 508 | |
See accompanying Notes to Consolidated Financial Statements.
AXS Aspect Core Diversified Strategy Fund
CONSOLIDATED SCHEDULE OF INVESTMENTS - Continued
As of September 30, 2020
FORWARD FOREIGN CURRENCY CONTRACTS - Continued
| Settlement Date | | Counterparty | | Currency Units to Receive/(Deliver) | | In Exchange For | | Unrealized Appreciation (Depreciation) | |
| 12/16/2020 | | Morgan Stanley | | | 25,000 | | | EUR | | | 113,864 | | | PLN | | $ | (97 | ) |
| 12/16/2020 | | Morgan Stanley | | | 100,000 | | | EUR | | | 1,060,080 | | | SEK | | | (1,031 | ) |
| 12/16/2020 | | Morgan Stanley | | | 100,000 | | | EUR | | | 1,045,221 | | | SEK | | | 630 | |
| 12/16/2020 | | Morgan Stanley | | | 100,000 | | | EUR | | | 1,056,460 | | | SEK | | | (627 | ) |
| 12/16/2020 | | Morgan Stanley | | | 100,000 | | | EUR | | | 1,041,470 | | | SEK | | | 1,049 | |
| 12/16/2020 | | Morgan Stanley | | | 100,000 | | | EUR | | | 1,036,144 | | | SEK | | | 1,644 | |
| 12/16/2020 | | Morgan Stanley | | | 100,000 | | | EUR | | | 1,057,591 | | | SEK | | | (753 | ) |
| 12/16/2020 | | Morgan Stanley | | | 100,000 | | | EUR | | | 1,042,804 | | | SEK | | | 900 | |
| 12/16/2020 | | Morgan Stanley | | | 100,000 | | | EUR | | | 1,041,783 | | | SEK | | | 1,014 | |
| 12/16/2020 | | Morgan Stanley | | | 100,000 | | | EUR | | | 1,041,589 | | | SEK | | | 1,036 | |
| 12/16/2020 | | Morgan Stanley | | | 50,000 | | | EUR | | | 532,050 | | | SEK | | | (740 | ) |
| 12/16/2020 | | Morgan Stanley | | | 50,000 | | | EUR | | | 531,420 | | | SEK | | | (670 | ) |
| 12/16/2020 | | Morgan Stanley | | | 50,000 | | | EUR | | | 531,280 | | | SEK | | | (655 | ) |
| 12/16/2020 | | Morgan Stanley | | | 50,000 | | | EUR | | | 532,139 | | | SEK | | | (751 | ) |
| 12/16/2020 | | Morgan Stanley | | | 36,475,804 | | | HUF | | | 100,000 | | | EUR | | | 38 | |
| 12/16/2020 | | Morgan Stanley | | | 338,598 | | | ILS | | | 100,000 | | | USD | | | (1,028 | ) |
| 12/16/2020 | | Morgan Stanley | | | (171,468 | ) | | ILS | | | (50,000 | ) | | USD | | | (120 | ) |
| 12/16/2020 | | Morgan Stanley | | | (171,530 | ) | | ILS | | | (50,000 | ) | | USD | | | (138 | ) |
| 12/16/2020 | | Morgan Stanley | | | (341,204 | ) | | ILS | | | (100,000 | ) | | USD | | | 267 | |
| 12/16/2020 | | Morgan Stanley | | | (347,407 | ) | | ILS | | | (100,000 | ) | | USD | | | (1,546 | ) |
| 12/16/2020 | | Morgan Stanley | | | 3,715,542 | | | INR | | | 50,000 | | | USD | | | (49 | ) |
| 12/16/2020 | | Morgan Stanley | | | 3,709,952 | | | INR | | | 50,000 | | | USD | | | (124 | ) |
| 12/16/2020 | | Morgan Stanley | | | 3,693,182 | | | INR | | | 50,000 | | | USD | | | (349 | ) |
| 12/16/2020 | | Morgan Stanley | | | 1,855,139 | | | INR | | | 25,000 | | | USD | | | (60 | ) |
| 12/16/2020 | | Morgan Stanley | | | 1,854,864 | | | INR | | | 25,000 | | | USD | | | (63 | ) |
| 12/16/2020 | | Morgan Stanley | | | 29,519,218 | | | KRW | | | 25,000 | | | USD | | | 243 | |
| 12/16/2020 | | Morgan Stanley | | | 29,465,218 | | | KRW | | | 25,000 | | | USD | | | 197 | |
| 12/16/2020 | | Morgan Stanley | | | 29,417,218 | | | KRW | | | 25,000 | | | USD | | | 156 | |
| 12/16/2020 | | Morgan Stanley | | | 29,369,968 | | | KRW | | | 25,000 | | | USD | | | 115 | |
| 12/16/2020 | | Morgan Stanley | | | 29,160,968 | | | KRW | | | 25,000 | | | USD | | | (64 | ) |
| 12/16/2020 | | Morgan Stanley | | | 29,136,218 | | | KRW | | | 25,000 | | | USD | | | (85 | ) |
| 12/16/2020 | | Morgan Stanley | | | 29,122,250 | | | KRW | | | 25,000 | | | USD | | | (97 | ) |
| 12/16/2020 | | Morgan Stanley | | | 29,105,750 | | | KRW | | | 25,000 | | | USD | | | (111 | ) |
| 12/16/2020 | | Morgan Stanley | | | 29,094,750 | | | KRW | | | 25,000 | | | USD | | | (120 | ) |
| 12/16/2020 | | Morgan Stanley | | | 29,080,885 | | | KRW | | | 25,000 | | | USD | | | (132 | ) |
| 12/16/2020 | | Morgan Stanley | | | 29,061,478 | | | KRW | | | 25,000 | | | USD | | | (149 | ) |
| 12/16/2020 | | Morgan Stanley | | | 29,045,580 | | | KRW | | | 25,000 | | | USD | | | (162 | ) |
| 12/16/2020 | | Morgan Stanley | | | (29,696,665 | ) | | KRW | | | (25,000 | ) | | USD | | | (394 | ) |
| 12/16/2020 | | Morgan Stanley | | | (29,698,250 | ) | | KRW | | | (25,000 | ) | | USD | | | (396 | ) |
| 12/16/2020 | | Morgan Stanley | | | 19,562,800 | | | PHP | | | 400,000 | | | USD | | | 2,192 | |
| 12/16/2020 | | Morgan Stanley | | | 19,530,400 | | | PHP | | | 400,000 | | | USD | | | 1,526 | |
| 12/16/2020 | | Morgan Stanley | | | (2,431,913 | ) | | PHP | | | (50,000 | ) | | USD | | | 2 | |
| 12/16/2020 | | Morgan Stanley | | | (2,434,133 | ) | | PHP | | | (50,000 | ) | | USD | | | (43 | ) |
| 12/16/2020 | | Morgan Stanley | | | (2,437,263 | ) | | PHP | | | (50,000 | ) | | USD | | | (108 | ) |
| 12/16/2020 | | Morgan Stanley | | | 226,303 | | | PLN | | | 50,000 | | | EUR | | | (175 | ) |
| 12/16/2020 | | Morgan Stanley | | | 3,976,342 | | | RUB | | | 50,000 | | | USD | | | 713 | |
| 12/16/2020 | | Morgan Stanley | | | 3,782,659 | | | RUB | | | 50,000 | | | USD | | | (1,758 | ) |
| 12/16/2020 | | Morgan Stanley | | | (49,248,875 | ) | | RUB | | | (650,000 | ) | | USD | | | 21,900 | |
| 12/16/2020 | | Morgan Stanley | | | 7,011,455 | | | SEK | | | 675,000 | | | EUR | | | (9,145 | ) |
See accompanying Notes to Consolidated Financial Statements.
AXS Aspect Core Diversified Strategy Fund
CONSOLIDATED SCHEDULE OF INVESTMENTS - Continued
As of September 30, 2020
FORWARD FOREIGN CURRENCY CONTRACTS - Continued
| Settlement Date | | Counterparty | | Currency Units to Receive/(Deliver) | | In Exchange For | | Unrealized Appreciation (Depreciation) | |
| 12/16/2020 | | Morgan Stanley | | | 1,815,083 | | | SEK | | | 175,000 | | | EUR | | $ | (2,673 | ) |
| 12/16/2020 | | Morgan Stanley | | | 1,555,565 | | | SEK | | | 150,000 | | | EUR | | | (2,316 | ) |
| 12/16/2020 | | Morgan Stanley | | | 1,555,495 | | | SEK | | | 150,000 | | | EUR | | | (2,323 | ) |
| 12/16/2020 | | Morgan Stanley | | | 1,036,058 | | | SEK | | | 100,000 | | | EUR | | | (1,654 | ) |
| 12/16/2020 | | Morgan Stanley | | | 777,923 | | | SEK | | | 75,000 | | | EUR | | | (1,142 | ) |
| 12/16/2020 | | Morgan Stanley | | | 777,712 | | | SEK | | | 75,000 | | | EUR | | | (1,166 | ) |
| 12/16/2020 | | Morgan Stanley | | | 777,057 | | | SEK | | | 75,000 | | | EUR | | | (1,239 | ) |
| 12/16/2020 | | Morgan Stanley | | | 776,997 | | | SEK | | | 75,000 | | | EUR | | | (1,246 | ) |
| 12/16/2020 | | Morgan Stanley | | | 259,254 | | | SEK | | | 25,000 | | | EUR | | | (386 | ) |
| 12/16/2020 | | Morgan Stanley | | | 259,069 | | | SEK | | | 25,000 | | | EUR | | | (407 | ) |
| 12/16/2020 | | Morgan Stanley | | | 136,943 | | | SGD | | | 100,000 | | | USD | | | 332 | |
| 12/16/2020 | | Morgan Stanley | | | 68,467 | | | SGD | | | 50,000 | | | USD | | | 163 | |
| 12/16/2020 | | Morgan Stanley | | | 67,983 | | | SGD | | | 50,000 | | | USD | | | (192 | ) |
| 12/16/2020 | | Morgan Stanley | | | 67,892 | | | SGD | | | 50,000 | | | USD | | | (259 | ) |
| 12/16/2020 | | Morgan Stanley | | | (68,340 | ) | | SGD | | | (50,000 | ) | | USD | | | (70 | ) |
| 12/16/2020 | | Morgan Stanley | | | (68,438 | ) | | SGD | | | (50,000 | ) | | USD | | | (142 | ) |
| 12/16/2020 | | Morgan Stanley | | | (68,785 | ) | | SGD | | | (50,000 | ) | | USD | | | (395 | ) |
| 12/16/2020 | | Morgan Stanley | | | (68,787 | ) | | SGD | | | (50,000 | ) | | USD | | | (397 | ) |
| 12/16/2020 | | Morgan Stanley | | | 1,562,227 | | | THB | | | 50,000 | | | USD | | | (702 | ) |
| 12/16/2020 | | Morgan Stanley | | | 1,559,227 | | | THB | | | 50,000 | | | USD | | | (797 | ) |
| 12/16/2020 | | Morgan Stanley | | | (1,573,673 | ) | | THB | | | (50,000 | ) | | USD | | | 341 | |
| 12/16/2020 | | Morgan Stanley | | | (1,574,558 | ) | | THB | | | (50,000 | ) | | USD | | | 313 | |
| 12/16/2020 | | Morgan Stanley | | | (1,580,088 | ) | | THB | | | (50,000 | ) | | USD | | | 139 | |
| 12/16/2020 | | Morgan Stanley | | | (1,586,198 | ) | | THB | | | (50,000 | ) | | USD | | | (54 | ) |
| 12/16/2020 | | Morgan Stanley | | | (1,588,337 | ) | | THB | | | (50,000 | ) | | USD | | | (121 | ) |
| 12/16/2020 | | Morgan Stanley | | | (1,589,764 | ) | | THB | | | (50,000 | ) | | USD | | | (167 | ) |
| 12/16/2020 | | Morgan Stanley | | | (1,590,668 | ) | | THB | | | (50,000 | ) | | USD | | | (195 | ) |
| 12/16/2020 | | Morgan Stanley | | | (3,145,315 | ) | | THB | | | (100,000 | ) | | USD | | | 746 | |
| 12/16/2020 | | Morgan Stanley | | | 15,993,915 | | | TWD | | | 550,000 | | | USD | | | 2,401 | |
| 12/16/2020 | | Morgan Stanley | | | 1,436,542 | | | TWD | | | 50,000 | | | USD | | | (384 | ) |
| 12/16/2020 | | Morgan Stanley | | | 1,426,650 | | | TWD | | | 50,000 | | | USD | | | (726 | ) |
| 12/16/2020 | | Morgan Stanley | | | 724,275 | | | TWD | | | 25,000 | | | USD | | | 15 | |
| 12/16/2020 | | Morgan Stanley | | | 723,850 | | | TWD | | | 25,000 | | | USD | | | - | |
| 12/16/2020 | | Morgan Stanley | | | 722,821 | | | TWD | | | 25,000 | | | USD | | | (35 | ) |
| 12/16/2020 | | Morgan Stanley | | | 722,100 | | | TWD | | | 25,000 | | | USD | | | (60 | ) |
| 12/16/2020 | | Morgan Stanley | | | (717,775 | ) | | TWD | | | (25,000 | ) | | USD | | | 209 | |
| 12/16/2020 | | Morgan Stanley | | | (717,825 | ) | | TWD | | | (25,000 | ) | | USD | | | 208 | |
| 12/16/2020 | | Morgan Stanley | | | (719,654 | ) | | TWD | | | (25,000 | ) | | USD | | | 144 | |
| 12/16/2020 | | Morgan Stanley | | | (719,854 | ) | | TWD | | | (25,000 | ) | | USD | | | 138 | |
| 12/16/2020 | | Morgan Stanley | | | 843,120 | | | ZAR | | | 50,000 | | | USD | | | (145 | ) |
| 12/16/2020 | | Morgan Stanley | | | 819,355 | | | ZAR | | | 50,000 | | | USD | | | (1,551 | ) |
| 12/16/2020 | | Morgan Stanley | | | (865,992 | ) | | ZAR | | | (50,000 | ) | | USD | | | (1,207 | ) |
| 12/16/2020 | | Morgan Stanley | | | (2,574,716 | ) | | ZAR | | | (150,000 | ) | | USD | | | (2,246 | ) |
| TOTAL FORWARD FOREIGN CURRENCY CONTRACTS | | | | $ | 78,694 | |
BRL - Brazilian Real
CLP - Chilean Peso
CNH - Chinese Yuan Renminbi
See accompanying Notes to Consolidated Financial Statements.
AXS Aspect Core Diversified Strategy Fund
CONSOLIDATED SCHEDULE OF INVESTMENTS - Continued
As of September 30, 2020
COP - Colombian Peso
CZK - Czech Koruna
EUR - Euro
HUF - Hungarian Forint
ILS - New Israeli Sheqel
INR - Indian Rupee
KRW - South Korean Won
NOK - Norwegian Krone
PHP - Philippine Peso
PLN - Polish Zloty
RUB - Russian Ruble
SEK - Swedish Krona
SGD - Singapore Dollar
THB - Baht
TWD - New Taiwan Dollar
USD - United States Dollar
ZAR - South African Rand
See accompanying Notes to Consolidated Financial Statements.
AXS Aspect Core Diversified Strategy Fund
CONSOLIDATED SUMMARY OF INVESTMENTS
As of September 30, 2020
| Security Type | | Percent of Total
Net Assets | |
| U.S. Treasury Notes | | | 37.7 | % |
| Short-Term Investments | | | 47.6 | % |
| Total Investments | | | 85.3 | % |
| Other Assets in Excess of Liabilities | | | 14.7 | % |
| Total Net Assets | | | 100.0 | % |
See accompanying Notes to Consolidated Financial Statements.
AXS Chesapeake Strategy Fund
CONSOLIDATED SCHEDULE OF INVESTMENTS
As of September 30, 2020
| Principal Amount | | | | | Value | |
| | | | | U.S. TREASURY NOTES — 77.1% | | | | |
| | | | | United States Treasury Notes | | | | |
| $ | 7,000,000 | | | 1.625%, 11/30/2020 | | $ | 7,017,493 | |
| | 5,000,000 | | | 2.250%, 2/15/2021 | | | 5,039,835 | |
| | | | | TOTAL U.S. TREASURY NOTES | | | | |
| | | | | (Cost $11,983,853) | | | 12,057,328 | |
| Number of Shares | | | | | | |
| | | | | SHORT-TERM INVESTMENTS — 14.8% | | | | |
| | 2,316,278 | | | Fidelity Investments Money Market Government Portfolio - Institutional Class, 0.01%1 | | | 2,316,278 | |
| | | | | TOTAL SHORT-TERM INVESTMENTS | | | | |
| | | | | (Cost $2,316,278) | | | 2,316,278 | |
| | | | | | | | | |
| | | | | TOTAL INVESTMENTS — 91.9% | | | | |
| | | | | (Cost $14,300,131) | | | 14,373,606 | |
| | | | | Other Assets in Excess of Liabilities — 8.1% | | | 1,266,455 | |
| | | | | TOTAL NET ASSETS — 100.0% | | $ | 15,640,061 | |
| 1 | The rate is the annualized seven-day yield at period end. |
See accompanying Notes to Consolidated Financial Statements.
AXS Chesapeake Strategy Fund
CONSOLIDATED SCHEDULE OF INVESTMENTS - Continued
As of September 30, 2020
FUTURES CONTRACTS
| Long Contracts | | Expiration Date | | Number of Contracts | | Notional Value | | | Value at September 30, 2020 | | | Unrealized Appreciation (Depreciation) | |
| Commodity Futures | | | | | | | | | | | | | | | | |
| CBOT Soybean1 | | November 2020 | | 15 | | $ | 725,312 | | | $ | 767,625 | | | $ | 42,313 | |
| CBOT Soybean Oil1 | | December 2020 | | 28 | | | 566,616 | | | | 556,584 | | | | (10,032 | ) |
| CMX Copper1 | | December 2020 | | 7 | | | 518,000 | | | | 530,688 | | | | 12,688 | |
| CMX Gold1 | | December 2020 | | 5 | | | 964,650 | | | | 947,750 | | | | (16,900 | ) |
| CMX Silver1 | | December 2020 | | 8 | | | 1,087,720 | | | | 939,760 | | | | (147,959 | ) |
| ICE Canola1 | | November 2020 | | 189 | | | 1,865,020 | | | | 1,941,689 | | | | 76,668 | |
| LME Zinc1 | | December 2020 | | 8 | | | 489,500 | | | | 480,450 | | | | (9,050 | ) |
| NYMEX Palladium1 | | December 2020 | | 2 | | | 439,640 | | | | 466,100 | | | | 26,460 | |
| NYMEX Platinum1 | | January 2021 | | 2 | | | 88,720 | | | | 90,920 | | | | 2,200 | |
| | | | | | | | | | | | | | | | | |
| Currency Futures | | | | | | | | | | | | | | | | |
| Canadian Dollar | | December 2020 | | 39 | | | 2,976,629 | | | | 2,930,070 | | | | (46,559 | ) |
| CME Australian Dollar | | December 2020 | | 34 | | | 2,461,872 | | | | 2,435,420 | | | | (26,452 | ) |
| CME British Pound | | December 2020 | | 32 | | | 2,647,669 | | | | 2,580,800 | | | | (66,869 | ) |
| CME Euro | | December 2020 | | 19 | | | 2,806,561 | | | | 2,787,181 | | | | (19,380 | ) |
| CME Japanese Yen | | December 2020 | | 13 | | | 1,529,450 | | | | 1,541,719 | | | | 12,269 | |
| CME Swiss Franc | | December 2020 | | 26 | | | 3,558,263 | | | | 3,535,025 | | | | (23,238 | ) |
| Indian Rupee | | October 2020 | | 66 | | | 4,475,790 | | | | 4,474,800 | | | | (990 | ) |
| | | | | | | | | | | | | | | | | |
| Index Futures | | | | | | | | | | | | | | | | |
| CME E-mini S&P 500 | | December 2020 | | 7 | | | 1,165,552 | | | | 1,173,200 | | | | 7,648 | |
| CME NASDAQ 100 E-Mini | | December 2020 | | 10 | | | 2,233,040 | | | | 2,281,450 | | | | 48,410 | |
| | | | | | | | | | | | | | | | | |
| Interest Rate Futures | | | | | | | | | | | | | | | | |
| CBOT 10-Year U.S. Treasury Note | | December 2020 | | 75 | | | 10,466,018 | | | | 10,464,844 | | | | (1,174 | ) |
| CBOT 5-Year U.S. Treasury Note | | December 2020 | | 60 | | | 7,560,468 | | | | 7,561,875 | | | | 1,407 | |
| CBOT U.S. Long Bond | | December 2020 | | 12 | | | 2,136,750 | | | | 2,115,375 | | | | (21,375 | ) |
| CBOT Ultra Long-Term U.S. Treasury Bond | | December 2020 | | 5 | | | 1,129,492 | | | | 1,109,062 | | | | (20,430 | ) |
| EUX Euro-BTP Italian Government Bond | | December 2020 | | 32 | | | 4,664,000 | | | | 4,732,660 | | | | 68,660 | |
| EUX Euro-Bund | | December 2020 | | 3 | | | 523,560 | | | | 523,560 | | | | - | |
| EUX Euro-Buxl 30-Year Bond | | December 2020 | | 8 | | | 1,765,760 | | | | 1,784,144 | | | | 18,384 | |
| ICF Long Gilt | | December 2020 | | 12 | | | 1,633,200 | | | | 1,633,355 | | | | 155 | |
| Total Long Contracts | | | | | | | 60,479,252 | | | | 60,386,106 | | | | (93,146 | ) |
| | | | | | | | | | | | | | | | | |
| Short Contracts | | | | | | | | | | | | | | | | |
| Commodity Futures | | | | | | | | | | | | | | | | |
| CME Lean Hogs1 | | December 2020 | | (5) | | | (131,500 | ) | | | (126,200 | ) | | | 5,300 | |
| NYMEX NY Harbor ULSD1 | | November 2020 | | (12) | | | (558,684 | ) | | | (580,709 | ) | | | (22,025 | ) |
| | | | | | | | | | | | | | | | | |
| Currency Futures | | | | | | | | | | | | | | | | |
| Brazil Real | | November 2020 | | (74) | | | (1,364,560 | ) | | | (1,315,720 | ) | | | 48,839 | |
| CME Mexican Peso | | December 2020 | | (13) | | | (296,920 | ) | | | (291,525 | ) | | | 5,395 | |
| Swedish Krona | | December 2020 | | (37) | | | (32,254,010 | ) | | | (32,351,200 | ) | | | (97,189 | ) |
| | | | | | | | | | | | | | | | | |
| Index Futures | | | | | | | | | | | | | | | | |
| ICF FTSE 100 Index | | December 2020 | | (10) | | | (597,350 | ) | | | (580,318 | ) | | | 17,032 | |
| Total Short Contracts | | | | | | | (35,203,024 | ) | | | (35,245,672 | ) | | | (42,648 | ) |
| | | | | | | | | | | | | | | | | |
| TOTAL FUTURES CONTRACTS | | | | | | $ | 25,276,228 | | | $ | 25,140,434 | | | $ | (135,794 | ) |
| 1 | This investment is a holding of AXS Chesapeake Strategy Fund Limited. |
See accompanying Notes to Consolidated Financial Statements.
AXS Chesapeake Strategy Fund
CONSOLIDATED SUMMARY OF INVESTMENTS
As of September 30, 2020
| Security Type | | Percent of Total Net Assets | |
| U.S. Treasury Notes | | | 77.1 | % |
| Short-Term Investments | | | 14.8 | % |
| Total Investments | | | 91.9 | % |
| Other Assets in Excess of Liabilities | | | 8.1 | % |
| Total Net Assets | | | 100.0 | % |
See accompanying Notes to Consolidated Financial Statements.
AXS Managed Futures Strategy Fund
CONSOLIDATED SCHEDULE OF INVESTMENTS
As of September 30, 2020
| Principal Amount | | | | | Value | |
| | | | | U.S. TREASURY BILLS — 8.6% | | | | |
| $ | 10,000,000 | | | United States Treasury Bill
0.000%, 11/27/2020 | | $ | 9,998,650 | |
| | | | | TOTAL U.S. TREASURY BILLS | | | | |
| | | | | (Cost $9,998,735) | | | 9,998,650 | |
| | | | | U.S. TREASURY NOTES — 40.1% | | | | |
| | | | | United States Treasury Note | | | | |
| | 30,458,000 | | | 1.625%, 11/30/20201,2 | | | 30,534,114 | |
| | 16,000,000 | | | 2.250%, 2/15/2021 | | | 16,127,472 | |
| | | | | TOTAL U.S. TREASURY NOTES | | | | |
| | | | | (Cost $46,479,763) | | | 46,661,586 | |
| Number of Shares | | | | | | |
| | | | | SHORT-TERM INVESTMENTS — 16.0% | | | | |
| | 11,539,772 | | | Fidelity Investments Money Market Government Portfolio - Class I, 0.01%3 | | | 11,539,772 | |
| | 3,507,618 | | | Goldman Sachs Funds PLC - US$ Liquid Reserves Fund - Administration Share Class, 0.01%1,2,3 | | | 3,507,618 | |
| | 3,507,583 | | | JPMorgan Liquidity Funds - US Dollar Liquidity Fund - Premier Share Class, 0.03%1,2,3 | | | 3,507,583 | |
| | | | | TOTAL SHORT-TERM INVESTMENTS | | | | |
| | | | | (Cost $18,554,973) | | | 18,554,973 | |
| | | | | TOTAL INVESTMENTS — 64.7% | | | | |
| | | | | (Cost $75,033,471) | | | 75,215,209 | |
| | | | | Other Assets in Excess of Liabilities — 35.3% | | | 41,000,019 | |
| | | | | TOTAL NET ASSETS — 100.0% | | $ | 116,215,228 | |
PLC – Public Limited Company
US – United States
| 1 | All or a portion of this security is segregated as collateral for swap agreement. As of September 30, 2020, the aggregate value of those securities was $21,509,346, representing 18.5% of net assets. |
| 2 | All or a portion of this investment is a holding of AXS Managed Futures Strategy Fund Limited. |
| 3 | The rate is the annualized seven-day yield at period end. |
See accompanying Notes to Consolidated Financial Statements.
AXS Managed Futures Strategy Fund
CONSOLIDATED SCHEDULE OF INVESTMENTS - Continued
As of September 30, 2020
SWAP CONTRACTS
TOTAL RETURN SWAPS
| Counterparty | | Reference Entity | | Pay/Receive Total Return on Reference Entity | | Financing Rate1 | | Termination Date | | Notional Value | | | Unrealized Appreciation (Depreciation) | |
| Deutsche Bank | | AXS Financial Futures Index | | Receive | | 0.50% of Notional Value | | 1/31/22 | | $ | 143,975,539 | | | $ | (14,188,524 | ) |
| Deutsche Bank | | AXS Physical Futures Index2 | | Receive | | 0.50% of Notional Value | | 9/30/21 | | | 228,249,538 | | | | 1,015,513 | |
| Morgan Stanley | | Single CTA Program Total Return Swap2 | | Receive | | One month USD Libor plus 0.27% of the notional value | | 3/9/22 | | | 21,597,892 | | | | (138,373 | ) |
| Morgan Stanley | | ALPHAS Managed Accounts Platform XC Limited-Laplace Segregated Portfolio2 | | Receive | | 0.45% of Notional Value | | 2/12/21 | | | 21,118,966 | | | | 9,841 | |
| TOTAL SWAP CONTRACTS | | | | | | | | | | $ | (13,301,543 | ) |
| 1 | Financing rate is based upon predetermined notional amounts. |
| 2 | This investment is a holding of the AXS Managed Futures Strategy Fund Limited. |
See accompanying Notes to Consolidated Financial Statements.
AXS Managed Futures Strategy Fund
CONSOLIDATED SCHEDULE OF INVESTMENTS - Continued
As of September 30, 2020
AXS Financial Futures Index Top 50 Holdings1
FUTURES CONTRACTS
| Number of Long Contracts | | Description | | Counterparty | | Expiration Date | | Notional Value | | | Unrealized Appreciation (Depreciation) | |
| 694 | | 2 year US Treasury Notes | | Deutsche Bank | | Dec-20 | | $ | 153,312,484 | | | $ | 43,120 | |
| 765 | | 2 year Euro-Schatz | | Deutsche Bank | | Dec-20 | | | 100,886,928 | | | | 3,353 | |
| 283 | | Eurodollar | | Deutsche Bank | | Jun-21 | | | 70,519,020 | | | | 2,173 | |
| 233 | | Eurodollar | | Deutsche Bank | | Sep-21 | | | 58,081,011 | | | | 1,856 | |
| 494 | | 10 year Australian Treasury Bond Future | | Deutsche Bank | | Dec-20 | | | 52,749,238 | | | | 404,999 | |
| 313 | | 10 year US Treasury Notes | | Deutsche Bank | | Dec-20 | | | 43,707,876 | | | | 68,870 | |
| 256 | | 3 month Sterling | | Deutsche Bank | | Sep-21 | | | 41,445,435 | | | | (2,967 | ) |
| 125 | | 3 month Euro (EURIBOR) | | Deutsche Bank | | Mar-21 | | | 36,912,914 | | | | 2,190 | |
| 121 | | 3 month Euro (EURIBOR) | | Deutsche Bank | | Dec-20 | | | 35,756,698 | | | | (2,566 | ) |
| 120 | | Eurodollar | | Deutsche Bank | | Dec-20 | | | 29,964,837 | | | | 6,087 | |
| 99 | | 3 month Euro (EURIBOR) | | Deutsche Bank | | Jun-21 | | | 29,129,861 | | | | 4,832 | |
| 95 | | 3 month Euro (EURIBOR) | | Deutsche Bank | | Mar-22 | | | 27,977,532 | | | | 5,641 | |
| 84 | | 3 month Euro (EURIBOR) | | Deutsche Bank | | Sep-21 | | | 24,805,284 | | | | 9,173 | |
| 77 | | 3 month Euro (EURIBOR) | | Deutsche Bank | | Sep-22 | | | 22,783,289 | | | | 4,195 | |
| Number of Short Contracts | | Description | | Counterparty | | Expiration Date | | Notional Value | | | Unrealized Appreciation (Depreciation) | |
| (459) | | Euro-BUND | | Deutsche Bank | | Dec-20 | | $ | (94,131,480 | ) | | $ | (497,648 | ) |
| (338) | | 10 year Canadian Govt Bond | | Deutsche Bank | | Dec-20 | | | (38,498,900 | ) | | | 22,559 | |
OPTIONS ON CURRENCY
| | | Put/Call | | Description | | Expiration Date | | Strike Price | | | Notional Value | | | Unrealized Appreciation (Depreciation) | |
| Purchased | | | | | | | | | | | | | | | |
| | Call | | USD/EUR | | Jan-21 | | $ | 1.23 | | | $ | 65,193,781 | | | $ | 209,061 | |
| | | Call | | GBP/EUR | | Feb-21 | | | 0.98 | | | | 54,301,054 | | | | 50,900 | |
| | | Call | | GBP/EUR | | Nov-20 | | | 0.95 | | | | 33,531,714 | | | | 35,488 | |
| | | Put | | JPY/USD | | Oct-20 | | | 105.25 | | | | 32,107,340 | | | | 178,803 | |
| | | Put | | JPY/USD | | Jan-21 | | | 97.00 | | | | 27,383,501 | | | | (42,931 | ) |
| | | Put | | USD/GBP | | Mar-21 | | | 1.15 | | | | 27,356,245 | | | | 28,910 | |
| | | Call | | GBP/EUR | | Oct-20 | | | 0.91 | | | | 27,150,527 | | | | 339,352 | |
| | | Call | | GBP/EUR | | Nov-20 | | | 0.95 | | | | 26,256,348 | | | | 36,027 | |
| | | Call | | NOK/EUR | | Mar-21 | | | 12.15 | | | | 24,711,857 | | | | 59,821 | |
| | | Call | | CAD/USD | | Mar-21 | | | 1.45 | | | | 24,539,972 | | | | 15,775 | |
| | | | | | | | | | | | | | | | | | | |
| Written | | | | | | | | | | | | | | | | | | |
| | | Call | | USD/EUR | | Jan-21 | | $ | 1.23 | | | $ | (65,193,781 | ) | | $ | (209,061 | ) |
| | | Put | | JPY/USD | | Feb-21 | | | 97.50 | | | | (64,214,680 | ) | | | (62,890 | ) |
| | | Call | | GBP/EUR | | Feb-21 | | | 0.98 | | | | (54,301,054 | ) | | | (177,892 | ) |
| | | Call | | GBP/EUR | | Nov-20 | | | 0.95 | | | | (33,531,714 | ) | | | (35,488 | ) |
| | | Put | | JPY/USD | | Jan-21 | | | 97.00 | | | | (27,383,501 | ) | | | (10,319 | ) |
| | | Put | | USD/GBP | | Mar-21 | | | 1.15 | | | | (27,356,245 | ) | | | (28,910 | ) |
| | | Call | | USD/EUR | | Feb-21 | | | 1.29 | | | | (27,178,707 | ) | | | (10,264 | ) |
| | | Put | | GBP/EUR | | Oct-20 | | | 0.91 | | | | (27,150,527 | ) | | | (151,466 | ) |
| | | Call | | GBP/EUR | | Nov-20 | | | 0.95 | | | | (26,229,252 | ) | | | (35,989 | ) |
| | | Put | | JPY/USD | | Feb-21 | | | 93.50 | | | | (25,667,419 | ) | | | (1,326 | ) |
| | | Call | | NOK/EUR | | Mar-21 | | | 12.15 | | | | (24,711,857 | ) | | | (59,821 | ) |
| | | Call | | CAD/USD | | Mar-21 | | | 1.45 | | | | (24,539,972 | ) | | | (15,775 | ) |
| | | Put | | NOK/GBP | | Nov-20 | | | 10.70 | | | | (24,050,102 | ) | | | (979 | ) |
See accompanying Notes to Consolidated Financial Statements.
AXS Managed Futures Strategy Fund
CONSOLIDATED SCHEDULE OF INVESTMENTS - Continued
As of September 30, 2020
AXS Financial Futures Index Top 50 Holdings1 - Continued
OPTIONS ON FUTURES
| | | Put/Call | | Description | | Number of Contracts | | Expiration Date | | Strike Price | | | Notional Value | | | Unrealized Appreciation (Depreciation) | |
| Purchased | | | | | | | | | | | | | | | | | | | | |
| | Put | | 5 year US Treasury Notes | | 241 | | Nov-20 | | $ | 125.25 | | | $ | 30,205,237 | | | $ | 23,552 | |
| | | Put | | 10 year US Treasury Notes | | 210 | | Nov-20 | | | 137.00 | | | | 28,809,887 | | | | 41,075 | |
| | | | | | | | | | | | | | | | | | | | | |
| Written | | | | | | | | | | | | | | | | | | | | |
| | | Put | | 10 year US Treasury Notes | | (210) | | Nov-20 | | $ | 134.00 | | | $ | (28,179,014 | ) | | $ | (11,501 | ) |
FORWARD FOREIGN CURRENCY CONTRACTS
| Settlement Date | | Counterparty | | Currency Units to Receive/Deliver | | In Exchange For | | Unrealized Appreciation (Depreciation) | |
| Dec-20 | | Deutsche Bank | | | 28,432,558 | | | USD | | | 39,105,737 | | | AUD | | $ | (394,385 | ) |
| Dec-20 | | Deutsche Bank | | | 39,932,295 | | | USD | | | 33,725,182 | | | EUR | | | 247,973 | |
| Dec-20 | | Deutsche Bank | | | 3,242,876,573 | | | JPY | | | 30,715,600 | | | USD | | | 77,265 | |
| Dec-20 | | Deutsche Bank | | | 21,134,390 | | | USD | | | 29,153,919 | | | AUD | | | 231,535 | |
| Dec-20 | | Deutsche Bank | | | 778,491,770 | | | TWD | | | 26,860,808 | | | USD | | | 269,233 | |
| Dec-20 | | Deutsche Bank | | | 34,283,438 | | | USD | | | 26,530,747 | | | GBP | | | 53,496 | |
| Dec-20 | | Deutsche Bank | | | 34,545,938 | | | CAD | | | 26,177,266 | | | USD | | | 250,563 | |
| Dec-20 | | Deutsche Bank | | | 16,248,694 | | | USD | | | 24,409,352 | | | NZD | | | 104,071 | |
AUD - Australian Dollar
CAD - Canadian Dollar
EUR - Euro
GBP - British Pound
JPY - Japanese Yen
NOK - Norwegian Krone
NZD - New Zealand Dollar
TWD - Taiwan Dollar
USD - U.S. Dollar
| 1 | These investments are not direct holdings of the Fund. The holdings were determined based on the absolute notional values of the positions within the underlying swap basket. |
See accompanying Notes to Consolidated Financial Statements.
AXS Managed Futures Strategy Fund
CONSOLIDATED SCHEDULE OF INVESTMENTS - Continued
As of September 30, 2020
AXS Physical Futures Index Top 50 Holdings1
FUTURES CONTRACTS
| Number of Long Contracts | | Description | | Counterparty | | Expiration Date | | Notional Value | | | Unrealized Appreciation (Depreciation) | |
| 627 | | Eurodollar | | Deutsche Bank | | Dec-21 | | $ | 156,298,235 | | | $ | (32,079 | ) |
| 538 | | 3 month Sterling | | Deutsche Bank | | Jun-21 | | | 86,995,848 | | | | 61,899 | |
| 307 | | Eurodollar | | Deutsche Bank | | Jun-21 | | | 76,582,789 | | | | 1,879 | |
| 394 | | Three Month Canadian Bankers Acceptance Future | | Deutsche Bank | | Mar-22 | | | 73,422,413 | | | | 24,397 | |
| 381 | | 90 Day Bank Accepted Bill Future | | Deutsche Bank | | Mar-21 | | | 67,319,664 | | | | 46,511 | |
| 296 | | 10 year US Treasury Notes | | Deutsche Bank | | Dec-20 | | | 41,302,793 | | | | 40,330 | |
| 469 | | 3 year Australian Treasury Bond | | Deutsche Bank | | Dec-20 | | | 39,453,013 | | | | 93,416 | |
| 26 | | 10 year Japanese Government Bond | | Deutsche Bank | | Dec-20 | | | 37,351,030 | | | | 19,972 | |
| 190 | | 90 Day Bank Accepted Bill Future | | Deutsche Bank | | Sep-21 | | | 33,516,958 | | | | 23,839 | |
| 250 | | 5 year US Treasury Notes | | Deutsche Bank | | Dec-20 | | | 31,566,428 | | | | 4,205 | |
| 119 | | Eurodollar | | Deutsche Bank | | Dec-22 | | | 29,713,751 | | | | (2,663 | ) |
| 218 | | 2 year Euro-Schatz | | Deutsche Bank | | Dec-20 | | | 28,701,750 | | | | (1,105 | ) |
| 115 | | Eurodollar | | Deutsche Bank | | Jun-23 | | | 28,542,142 | | | | (5,228 | ) |
| 147 | | Three Month Canadian Bankers Acceptance Future | | Deutsche Bank | | Sep-21 | | | 27,513,133 | | | | 3,031 | |
| 676 | | Light Sweet Crude Oil (WTI) Future | | Deutsche Bank | | Nov-20 | | | 27,130,527 | | | | 730,071 | |
| 91 | | 3 month Euro (EURIBOR) | | Deutsche Bank | | Jun-22 | | | 26,781,098 | | | | 13,039 | |
| 130 | | Euro-BUND | | Deutsche Bank | | Dec-20 | | | 26,732,746 | | | | 69,118 | |
| 149 | | Euro-BOBL | | Deutsche Bank | | Dec-20 | | | 23,631,024 | | | | 7,426 | |
| 121 | | 90 Day Bank Accepted Bill Future | | Deutsche Bank | | Mar-22 | | | 21,432,731 | | | | 9,595 | |
| 110 | | Gold | | Deutsche Bank | | Dec-20 | | | 21,034,318 | | | | (733,168 | ) |
| 118 | | Long Gilt Future | | Deutsche Bank | | Dec-20 | | | 20,722,893 | | | | 61,855 | |
| 105 | | Three Month Canadian Bankers Acceptance Future | | Deutsche Bank | | Jun-21 | | | 19,532,269 | | | | 4,263 | |
| 116 | | Copper Grade A Future | | Deutsche Bank | | Nov-20 | | | 19,365,227 | | | | 640,954 | |
| 109 | | 3 month Sterling | | Deutsche Bank | | Jun-22 | | | 17,571,154 | | | | 4,874 | |
| 97 | | E-Mini S&P 500 | | Deutsche Bank | | Dec-20 | | | 16,348,196 | | | | 43,381 | |
| 110 | | EUR/USD | | Deutsche Bank | | Dec-20 | | | 16,160,841 | | | | (33,090 | ) |
| 97 | | Copper Grade A Future | | Deutsche Bank | | Oct-20 | | | 16,028,070 | | | | 585,717 | |
| 90 | | 30 year US Treasury Bonds | | Deutsche Bank | | Dec-20 | | | 15,892,637 | | | | (27,673 | ) |
| 97 | | 3 month Sterling | | Deutsche Bank | | Sep-21 | | | 15,729,802 | | | | 9,357 | |
| Number of Short Contracts | | Description | | Counterparty | | Expiration Date | | Notional Value | | | Unrealized Appreciation (Depreciation) | |
| (684) | | 90 Day Bank Accepted Bill Future | | Deutsche Bank | | Dec-20 | | $ | (120,792,135 | ) | | $ | (41,186 | ) |
| (513) | | Three Month Canadian Bankers Acceptance Future | | Deutsche Bank | | Dec-20 | | | (95,691,130 | ) | | | (4,357 | ) |
| (245) | | Eurodollar | | Deutsche Bank | | Mar-22 | | | (61,177,925 | ) | | | 16,571 | |
| (156) | | 3 month Euro (EURIBOR) | | Deutsche Bank | | Dec-20 | | | (46,067,661 | ) | | | (16,692 | ) |
| (167) | | Eurodollar | | Deutsche Bank | | Dec-20 | | | (41,603,602 | ) | | | (16,437 | ) |
| (699) | | Light Sweet Crude Oil (WTI) Future | | Deutsche Bank | | Oct-20 | | | (27,884,960 | ) | | | (905,431 | ) |
| (167) | | 3 month Sterling | | Deutsche Bank | | Sep-21 | | | (26,985,968 | ) | | | (9,494 | ) |
| (104) | | Eurodollar | | Deutsche Bank | | Sep-21 | | | (26,057,138 | ) | | | 2,454 | |
| (93) | | Eurodollar | | Deutsche Bank | | Jun-22 | | | (23,271,899 | ) | | | 4,532 | |
| (81) | | Eurodollar | | Deutsche Bank | | Sep-22 | | | (20,323,649 | ) | | | 3,063 | |
| (116) | | Copper Grade A Future | | Deutsche Bank | | Nov-20 | | | (19,365,227 | ) | | | (644,623 | ) |
| (832) | | Soybean Oil Future | | Deutsche Bank | | Dec-20 | | | (16,215,406 | ) | | | 185,873 | |
| (97) | | Copper Grade A Future | | Deutsche Bank | | Oct-20 | | | (16,028,070 | ) | | | (591,263 | ) |
OPTIONS ON CURRENCY AND COMMODITY
| | | Put/Call | | Description | | Expiration Date | | Strike Price | | | Notional Value | | | Unrealized Appreciation (Depreciation) | |
| Purchased | | | | | | | | | | | | | | | | | | |
| | Put | | USD/AUD | | Dec-20 | | $ | 0.71 | | | $ | 44,627,985 | | | $ | 55,630 | |
| | | Call | | USD/XAG | | Sep-21 | | | 24.08 | | | | 32,661,569 | | | | (23,703 | ) |
| | | Call | | USD/XAG | | Jul-21 | | | 29.40 | | | | 32,661,569 | | | | 74,542 | |
| | | Call | | HKD/USD | | Jan-21 | | | 7.80 | | | | 31,294,303 | | | | 28,457 | |
| | | Put | | JPY/AUD | | Oct-20 | | | 77.10 | | | | 21,945,640 | | | | 463,021 | |
| | | Call | | USD/XAU | | Dec-22 | | | 1,900.00 | | | | 20,408,254 | | | | 305,953 | |
| | | Call | | USD/XAU | | Apr-25 | | | 1,913.00 | | | | 16,891,306 | | | | 151,772 | |
| | | Call | | CNH/USD | | Jan-21 | | | 7.15 | | | | 15,647,151 | | | | 35,206 | |
AUD - Australian Dollar
CNH - Chinese Yuan
EUR - Euro
USD - U.S. Dollar
XAG - Silver
XAU - Gold
| 1 | These investments are not direct holdings of the Fund. The holdings were determined based on the absolute notional values of the positions within the underlying swap basket. |
See accompanying Notes to Consolidated Financial Statements.
AXS Managed Futures Strategy Fund
CONSOLIDATED SCHEDULE OF INVESTMENTS - Continued
As of September 30, 2020
Single CTA Program Total Return Swap Top 50 Holdings1
FUTURES CONTRACTS
| Number of Long (Short) Contracts | | Description | | Counterparty | | Expiration Date | | Notional Value | | | Unrealized Appreciation (Depreciation) | |
| 13 | | 90-Day Bank Bill | | Morgan Stanley | | Dec-20 | | $ | 9,361,728 | | | $ | 1,693 | |
| 11 | | 90-Day Bank Bill | | Morgan Stanley | | Mar-21 | | | 7,579,564 | | | | 1,319 | |
| 24 | | 3 month Euro (EURIBOR) | | Morgan Stanley | | Mar-22 | | | 7,157,562 | | | | 3,432 | |
| 24 | | 3 month Euro (EURIBOR) | | Morgan Stanley | | Dec-21 | | | 6,972,612 | | | | 3,742 | |
| 24 | | 3 month Euro (EURIBOR) | | Morgan Stanley | | Jun-22 | | | 6,971,919 | | | | 3,240 | |
| 22 | | 3 month Euro (EURIBOR) | | Morgan Stanley | | Sep-22 | | | 6,605,869 | | | | 3,295 | |
| 22 | | 3 month Euro (EURIBOR) | | Morgan Stanley | | Sep-21 | | | 6,424,469 | | | | 2,994 | |
| 21 | | 3 month Euro (EURIBOR) | | Morgan Stanley | | Dec-22 | | | 6,054,287 | | | | 3,067 | |
| 25 | | US 2Yr Note | | Morgan Stanley | | Dec-20 | | | 5,504,114 | | | | 2,841 | |
| 19 | | 3 month Euro (EURIBOR) | | Morgan Stanley | | Mar-23 | | | 5,502,814 | | | | 2,784 | |
| 18 | | 3 month Euro (EURIBOR) | | Morgan Stanley | | Jun-21 | | | 5,321,760 | | | | 1,981 | |
| 17 | | 3 month Euro (EURIBOR) | | Morgan Stanley | | Jun-23 | | | 4,950,958 | | | | 2,619 | |
| 16 | | 90 Day Euro Future | | Morgan Stanley | | Dec-21 | | | 4,039,000 | | | | (241 | ) |
| 16 | | 90 Day Euro Future | | Morgan Stanley | | Jun-22 | | | 3,883,547 | | | | (631 | ) |
| 15 | | 90 Day Euro Future | | Morgan Stanley | | Sep-21 | | | 3,730,399 | | | | (226 | ) |
| 15 | | 90 Day Euro Future | | Morgan Stanley | | Sep-22 | | | 3,728,530 | | | | (304 | ) |
| 12 | | 3 month Euro (EURIBOR) | | Morgan Stanley | | Sep-23 | | | 3,666,466 | | | | 1,113 | |
| 14 | | 90 Day Euro Future | | Morgan Stanley | | Mar-22 | | | 3,572,124 | | | | 560 | |
| 5 | | 90-Day Bank Bill | | Morgan Stanley | | Jun-21 | | | 3,564,327 | | | | 901 | |
| 5 | | 90-Day Bank Bill | | Morgan Stanley | | Sep-21 | | | 3,563,614 | | | | 692 | |
| 27 | | US 5Yr Note | | Morgan Stanley | | Dec-20 | | | 3,453,222 | | | | 5,566 | |
| 14 | | 90 Day Euro Future | | Morgan Stanley | | Dec-22 | | | 3,416,095 | | | | 304 | |
| 22 | | Euro Fx Currency Future | | Morgan Stanley | | Dec-20 | | | 3,278,925 | | | | (28,881 | ) |
| 12 | | 90 Day Euro Future | | Morgan Stanley | | Mar-23 | | | 3,103,785 | | | | 451 | |
| 12 | | 90 Day Euro Future | | Morgan Stanley | | Jun-23 | | | 2,948,332 | | | | 856 | |
| 11 | | 90 Day Euro Future | | Morgan Stanley | | Jun-21 | | | 2,797,175 | | | | 148 | |
| 16 | | 90 Day Sterling Future | | Morgan Stanley | | Dec-21 | | | 2,512,000 | | | | 4,894 | |
| 16 | | 90 Day Sterling Future | | Morgan Stanley | | Mar-22 | | | 2,511,749 | | | | 3,909 | |
| 16 | | 90 Day Sterling Future | | Morgan Stanley | | Jun-22 | | | 2,511,497 | | | | 4,070 | |
| 10 | | 90 Day Euro Future | | Morgan Stanley | | Sep-23 | | | 2,481,534 | | | | (522 | ) |
| 16 | | Euro-BOBL Future | | Morgan Stanley | | Dec-20 | | | 2,467,578 | | | | 1,037 | |
| 15 | | 90 Day Sterling Future | | Morgan Stanley | | Sep-22 | | | 2,411,489 | | | | 3,989 | |
| 12 | | Gold 100 Oz Future | | Morgan Stanley | | Dec-20 | | | 2,242,377 | | | | (55,325 | ) |
| 31 | | AUD/USD Currency Future | | Morgan Stanley | | Dec-20 | | | 2,230,558 | | | | (31,603 | ) |
| 14 | | 90 Day Sterling Future | | Morgan Stanley | | Dec-22 | | | 2,209,418 | | | | 3,547 | |
| 13 | | 90 Day Sterling Future | | Morgan Stanley | | Sep-21 | | | 2,110,273 | | | | 3,447 | |
| 12 | | 90 Day Sterling Future | | Morgan Stanley | | Mar-23 | | | 2,007,628 | | | | 3,156 | |
| 28 | | AUD 3Yr Bond Future | | Morgan Stanley | | Dec-20 | | | 2,002,661 | | | | 6,110 | |
| 14 | | Us 10Yr Note | | Morgan Stanley | | Dec-20 | | | 1,911,561 | | | | 5,478 | |
| 11 | | 90 Day Sterling Future | | Morgan Stanley | | Jun-23 | | | 1,807,129 | | | | 1,844 | |
| 10 | | 90 Day Sterling Future | | Morgan Stanley | | Jun-21 | | | 1,606,584 | | | | 2,135 | |
| 12 | | Euro-Schatz Future | | Morgan Stanley | | Dec-20 | | | 1,557,499 | | | | (51 | ) |
| 9 | | 90 Day Sterling Future | | Morgan Stanley | | Sep-23 | | | 1,405,443 | | | | 10 | |
| 7 | | Euro-Bund Future | | Morgan Stanley | | Dec-20 | | | 1,401,644 | | | | 4,578 | |
| 11 | | Silver Future | | Morgan Stanley | | Dec-20 | | | 1,243,796 | | | | (148,379 | ) |
| 11 | | CAN 10 Yr Bond Future | | Morgan Stanley | | Dec-20 | | | 1,207,320 | | | | 112 | |
| 5 | | Euro-Oat Future | | Morgan Stanley | | Dec-20 | | | 984,147 | | | | 5,564 | |
| 13 | | AUD 10Yr Bond Future | | Morgan Stanley | | Dec-20 | | | 928,959 | | | | 13,428 | |
| 4 | | US Long Bond | | Morgan Stanley | | Dec-20 | | | 768,581 | | | | (409 | ) |
| Number of Long (Short) Contracts | | Description | | Counterparty | | Expiration Date | | Notional Value | | | Unrealized Appreciation (Depreciation) | |
| (14) | | BP Currency Future | | Morgan Stanley | | Dec-20 | | $ | (1,104,905 | ) | | $ | (2,688 | ) |
AUD - Austrailian Dollar
BP - British Pound
CAN - Canadian Dollar
USD - United States Dollar
| 1 | These investments are not direct holdings of the Fund. The holdings were determined based on the absolute notional values of the positions within the underlying swap basket. |
See accompanying Notes to Consolidated Financial Statements.
AXS Managed Futures Strategy Fund
CONSOLIDATED SCHEDULE OF INVESTMENTS - Continued
As of September 30, 2020
ALPHAS Managed Accounts Platform XC Limited-Laplace Segregated Portfolio Top 50 Holdings1
FUTURES CONTRACTS
| Number of Long Contracts | | Description | | Counterparty | | Expiration Date | | Notional Value | | | Unrealized Appreciation (Depreciation) | |
| 30 | | Japan Yen Currency Future | | Morgan Stanley | | Dec-20 | | $ | 3,560,347 | | | $ | (3,766 | ) |
| 14 | | Euro Fx Currency Future | | Morgan Stanley | | Dec-20 | | | 2,050,723 | | | | 1,484 | |
| 26 | | New Zealand Dollar Future | | Morgan Stanley | | Dec-20 | | | 1,705,360 | | | | 12,104 | |
| 8 | | Silver Future | | Morgan Stanley | | Dec-20 | | | 944,407 | | | | (4,644 | ) |
| 2 | | Dax Index Future | | Morgan Stanley | | Dec-20 | | | 749,356 | | | | (1,786 | ) |
| 9 | | E-Mini Russ 2000 | | Morgan Stanley | | Dec-20 | | | 673,765 | | | | 2,464 | |
| 16 | | Natural Gas Future | | Morgan Stanley | | Dec-20 | | | 517,182 | | | | (18,784 | ) |
| 2 | | Nasdaq 100 E-Mini | | Morgan Stanley | | Dec-20 | | | 454,472 | | | | 1,816 | |
| 2 | | Euro-Bund Future | | Morgan Stanley | | Dec-20 | | | 408,681 | | | | (304 | ) |
| 3 | | CHF Currency Future | | Morgan Stanley | | Dec-20 | | | 407,738 | | | | 141 | |
| 6 | | Coffee 'C' Future | | Morgan Stanley | | Dec-20 | | | 264,945 | | | | (15,294 | ) |
| 5 | | NY Harbor ULSD Future | | Morgan Stanley | | Dec-20 | | | 240,303 | | | | 4,447 | |
| 3 | | Copper Future | | Morgan Stanley | | Dec-20 | | | 225,058 | | | | 2,378 | |
| 4 | | Soybean Future | | Morgan Stanley | | Nov-20 | | | 204,800 | | | | (92 | ) |
| 1 | | Gold 100 Oz Future | | Morgan Stanley | | Dec-20 | | | 187,207 | | | | 2,341 | |
| 3 | | CAC 40 10 Euro Future | | Morgan Stanley | | Oct-20 | | | 168,082 | | | | 433 | |
| 5 | | Soybean Oil Future | | Morgan Stanley | | Dec-20 | | | 98,562 | | | | 815 | |
| 1 | | FTSE 100 Index Future | | Morgan Stanley | | Dec-20 | | | 75,983 | | | | (628 | ) |
| 1 | | AUD/USD Currency Future | | Morgan Stanley | | Dec-20 | | | 71,360 | | | | 271 | |
| 2 | | Corn Future | | Morgan Stanley | | Dec-20 | | | 36,400 | | | | 1,507 | |
| 1 | | Sugar #11 (World) | | Morgan Stanley | | Mar-21 | | | 14,896 | | | | 235 | |
| Number of Short Contracts | | Description | | Counterparty | | Expiration Date | | Notional Value | | | Unrealized Appreciation (Depreciation) | |
| (3) | | Long Gilt Future | | Morgan Stanley | | Dec-20 | | $ | (528,707 | ) | | $ | 1,966 | |
AUD - Austrailian Dollar
USD - United States Dollar
| 1 | These investments are not direct holdings of the Fund. The holdings were determined based on the absolute notional values of the positions within the underlying swap basket. |
See accompanying Notes to Consolidated Financial Statements.
AXS Managed Futures Strategy Fund
CONSOLIDATED SUMMARY OF INVESTMENTS
As of September 30, 2020
| Security Type | | Percent of Total
Net Assets | |
| U.S. Treasury Notes | | | 40.1 | % |
| U.S. Treasury Bills | | | 8.6 | % |
| Short-Term Investments | | | 16.0 | % |
| Total Investments | | | 64.7 | % |
| Other Assets in Excess of Liabilities | | | 35.3 | % |
| Total Net Assets | | | 100.0 | % |
See accompanying Notes to Consolidated Financial Statements.
AXS Multi-Strategy Alternatives Fund
SCHEDULE OF INVESTMENTS
As of September 30, 2020
| Number of Shares | | | | | Value | |
| | | | | COMMON STOCKS — 74.1% | | | | |
| | | | | APPAREL — 1.8% | | | | |
| | 8,950 | | | NIKE, Inc. - Class B | | $ | 1,123,583 | |
| | | | | AUTO MANUFACTURERS — 3.1% | | | | |
| | 4,550 | | | Tesla, Inc.* | | | 1,951,995 | |
| | | | | BANKS — 1.3% | | | | |
| | 4,200 | | | Goldman Sachs Group, Inc. | | | 844,074 | |
| | | | | BEVERAGES — 2.9% | | | | |
| | 17,750 | | | Coca-Cola Co. | | | 876,317 | |
| | 6,700 | | | PepsiCo, Inc. | | | 928,620 | |
| | | | | | | | 1,804,937 | |
| | | | | BIOTECHNOLOGY — 4.4% | | | | |
| | 3,650 | | | Amgen, Inc. | | | 927,684 | |
| | 1,300 | | | Argenx S.E. - ADR*,1 | | | 341,276 | |
| | 5,000 | | | Genmab A/S - ADR*,1 | | | 183,050 | |
| | 6,850 | | | United Therapeutics Corp.* | | | 691,850 | |
| | 2,200 | | | Vertex Pharmaceuticals, Inc.* | | | 598,664 | |
| | | | | | | | 2,742,524 | |
| | | | | COMMERCIAL SERVICES — 3.6% | | | | |
| | 24,350 | | | Adtalem Global Education, Inc.* | | | 597,549 | |
| | 40,000 | | | H&R Block, Inc. | | | 651,600 | |
| | 2,100 | | | New Oriental Education & Technology Group, Inc. - ADR*,1 | | | 313,950 | |
| | 3,425 | | | PayPal Holdings, Inc.* | | | 674,828 | |
| | | | | | | | 2,237,927 | |
| | | | | COMPUTERS — 5.3% | | | | |
| | 16,800 | | | Apple, Inc. | | | 1,945,608 | |
| | 25,150 | | | Infosys Ltd. - ADR1 | | | 347,321 | |
| | 6,825 | | | International Business Machines Corp. | | | 830,398 | |
| | 3,150 | | | WNS Holdings Ltd. - ADR*,1 | | | 201,474 | |
| | | | | | | | 3,324,801 | |
| | | | | DIVERSIFIED FINANCIAL SERVICES — 2.4% | | | | |
| | 8,450 | | | American Express Co. | | | 847,112 | |
| | 900 | | | BlackRock, Inc. | | | 507,195 | |
| | 5,400 | | | Noah Holdings Ltd. - ADR*,1 | | | 140,778 | |
| | | | | | | | 1,495,085 | |
| | | | | ELECTRONICS — 0.6% | | | | |
| | 2,350 | | | Honeywell International, Inc. | | | 386,834 | |
AXS Multi-Strategy Alternatives Fund
SCHEDULE OF INVESTMENTS - Continued
As of September 30, 2020
| Number of Shares | | | | | Value | |
| | | | | COMMON STOCKS (Continued) | | | | |
| | | | | HEALTHCARE-PRODUCTS — 2.9% | | | | |
| | 9,900 | | | Abbott Laboratories | | $ | 1,077,417 | |
| | 1,100 | | | Intuitive Surgical, Inc.* | | | 780,494 | |
| | | | | | | | 1,857,911 | |
| | | | | HEALTHCARE-SERVICES — 2.2% | | | | |
| | 9,700 | | | Centene Corp.* | | | 565,801 | |
| | 4,450 | | | Molina Healthcare, Inc.* | | | 814,528 | |
| | | | | | | | 1,380,329 | |
| | | | | INTERNET — 15.5% | | | | |
| | 850 | | | Alibaba Group Holding Ltd. - ADR*,1 | | | 249,883 | |
| | 925 | | | Alphabet, Inc. - Class A* | | | 1,355,680 | |
| | 790 | | | Amazon.com, Inc.* | | | 2,487,497 | |
| | 2,600 | | | Autohome, Inc. - ADR1 | | | 249,600 | |
| | 1,550 | | | Baidu, Inc. - ADR*,1 | | | 196,215 | |
| | 325 | | | Booking Holdings, Inc.* | | | 555,971 | |
| | 6,225 | | | Facebook, Inc. - Class A* | | | 1,630,327 | |
| | 4,750 | | | JD.com, Inc. - ADR*,1 | | | 368,647 | |
| | 4,400 | | | Netflix, Inc.* | | | 2,200,132 | |
| | 30,400 | | | Vipshop Holdings Ltd. - ADR*,1 | | | 475,456 | |
| | | | | | | | 9,769,408 | |
| | | | | IRON/STEEL — 0.6% | | | | |
| | 4,750 | | | POSCO - ADR1 | | | 198,835 | |
| | 9,550 | | | Ternium S.A. - ADR*,1 | | | 179,827 | |
| | | | | | | | 378,662 | |
| | | | | MACHINERY-DIVERSIFIED — 1.4% | | | | |
| | 8,000 | | | Dover Corp. | | | 866,720 | |
| | | | | MEDIA — 1.7% | | | | |
| | 16,500 | | | AMC Networks, Inc. - Class A* | | | 407,715 | |
| | 32,600 | | | Liberty Global PLC*,1 | | | 669,441 | |
| | | | | | | | 1,077,156 | |
| | | | | MISCELLANEOUS MANUFACTURING — 1.5% | | | | |
| | 5,800 | | | 3M Co. | | | 929,044 | |
| | | | | PHARMACEUTICALS — 2.7% | | | | |
| | 2,850 | | | Dr Reddy's Laboratories Ltd. - ADR1 | | | 198,246 | |
| | 6,650 | | | Grifols S.A. - ADR1 | | | 115,378 | |
| | 19,075 | | | Herbalife Nutrition Ltd.*,1 | | | 889,849 | |
AXS Multi-Strategy Alternatives Fund
SCHEDULE OF INVESTMENTS - Continued
As of September 30, 2020
| Number of Shares | | | | | Value | |
| | | | | COMMON STOCKS (Continued) | | | | |
| | | | | PHARMACEUTICALS (Continued) | | | | |
| | 2,700 | | | Novartis A.G. - ADR1 | | $ | 234,792 | |
| | 3,850 | | | Novo Nordisk A/S - ADR1 | | | 267,305 | |
| | | | | | | | 1,705,570 | |
| | | | | RETAIL — 6.5% | | | | |
| | 2,800 | | | Costco Wholesale Corp. | | | 994,000 | |
| | 2,600 | | | Domino's Pizza, Inc. | | | 1,105,728 | |
| | 4,100 | | | McDonald's Corp. | | | 899,909 | |
| | 63,550 | | | Sally Beauty Holdings, Inc.* | | | 552,249 | |
| | 25,850 | | | World Fuel Services Corp. | | | 547,762 | |
| | | | | | | | 4,099,648 | |
| | | | | SEMICONDUCTORS — 3.8% | | | | |
| | 9,900 | | | Advanced Micro Devices, Inc.* | | | 811,701 | |
| | 2,050 | | | NVIDIA Corp. | | | 1,109,501 | |
| | 15,050 | | | STMicroelectronics N.V.1 | | | 461,884 | |
| | | | | | | | 2,383,086 | |
| | | | | SOFTWARE — 6.5% | | | | |
| | 2,400 | | | Adobe, Inc.* | | | 1,177,032 | |
| | 1,875 | | | Intuit, Inc. | | | 611,644 | |
| | 7,750 | | | Microsoft Corp. | | | 1,630,057 | |
| | 1,000 | | | NetEase, Inc. - ADR1 | | | 454,670 | |
| | 1,450 | | | SAP S.E. - ADR1 | | | 225,925 | |
| | | | | | | | 4,099,328 | |
| | | | | TELECOMMUNICATIONS — 2.0% | | | | |
| | 19,450 | | | Cisco Systems, Inc. | | | 766,135 | |
| | 2,050 | | | Nice Ltd. - ADR*,1 | | | 465,412 | |
| | | | | | | | 1,231,547 | |
| | | | | TRANSPORTATION — 1.4% | | | | |
| | 5,050 | | | Kansas City Southern | | | 913,192 | |
| | | | | TOTAL COMMON STOCKS | | | | |
| | | | | (Cost $42,747,692) | | | 46,603,361 | |
| | | | | EXCHANGE-TRADED FUNDS — 12.1% | | | | |
| | 48,700 | | | Direxion Daily S&P 500 Bull 3X - ETF | | | 2,564,542 | |
| | 45,900 | | | ProShares UltraPro S&P 500 - ETF | | | 2,566,269 | |
| | 32,000 | | | VanEck Vectors Gold Miners ETF - ETF | | | 1,253,120 | |
AXS Multi-Strategy Alternatives Fund
SCHEDULE OF INVESTMENTS - Continued
As of September 30, 2020
Number
of Shares | | | | | Value | |
| | | | | EXCHANGE-TRADED FUNDS (Continued) | | | | |
| | 7,000 | | | VanEck Vectors Semiconductor ETF - ETF | | | 1,219,400 | |
| | | | | TOTAL EXCHANGE-TRADED FUNDS | | | | |
| | | | | (Cost $6,663,623) | | | 7,603,331 | |
| | | | | SHORT-TERM INVESTMENTS — 14.2% | | | | |
| | 8,918,724 | | | Fidelity Investments Money Market Government Portfolio - Class I, 0.01%2,3 | | | 8,918,724 | |
| | | | | TOTAL SHORT-TERM INVESTMENTS | | | | |
| | | | | (Cost $8,918,724) | | | 8,918,724 | |
| | | | | TOTAL INVESTMENTS — 100.4% | | | | |
| | | | | (Cost $58,330,039) | | | 63,125,416 | |
| | | | | Liabilities in Excess of Other Assets — (0.4)% | | | (259,770 | ) |
| | | | | TOTAL NET ASSETS — 100.0% | | $ | 62,865,646 | |
ADR – American Depository Receipt
PLC – Public Limited Company
ETF – Exchange-Traded Fund
| * | Non-income producing security. |
| 1 | Foreign security denominated in U.S. Dollars. |
| 2 | All or a portion of this security is segregated as collateral for swap agreement. As of September 30, 2020, the aggregate value of those securities was $8,125,911, representing 12.9% of net assets. |
| 3 | The rate is the annualized seven-day yield at period end. |
See accompanying Notes to Consolidated Financial Statements.
AXS Multi-Strategy Alternatives Fund
SCHEDULE OF INVESTMENTS - Continued
As of September 30, 2020
SWAP CONTRACTS
EQUITY SWAP CONTRACTS
| Counterparty | | Reference Entity | | Pay/Receive Equity on Reference Entity | | Financing Rate | | Pay/Receive Frequency | | Termination Date | | Notional Amount | | | Premium Paid (Received) | | | Unrealized Appreciation (Depreciation) | |
| Cowen | | Cowen Financial Product - AXS Multi-Strat Long | | Receive | | OBRF01* | | Monthly | | 8/12/2021 | | $ | 12,012,424 | | | $ | - | | | $ | (591,847 | ) |
| Cowen | | Cowen Financial Product - AXS Multi-Strat Short | | Pay | | OBRF01* | | Monthly | | 8/12/2021 | | | (12,104,325 | ) | | | - | | | | 384,687 | |
| TOTAL EQUITY SWAP CONTRACTS | | | | | | | | | | | | $ | (207,160 | ) |
| * | OBFR01 - Overnight Bank Funding Rate, 0.08% as of September 30, 2020. |
| Equity Swap Top 50 Holdings^ | | | | | | |
| Cowen Financial Product - AXS Multi-Strat Long | | EQUITIES | | | | |
| | | | | | | | | | |
| Number of Shares | | | Description | | Notional Value | | | Percentage of Equity Swap's Notional Amount | |
| | 24,500 | | | Invesco QQQ Trust Series 1 | | $ | 6,807,080 | | | | 56.67 | % |
| | 19,100 | | | Invesco S&P Pure Growth ETF | | | 2,705,324 | | | | 22.52 | % |
| | 51,000 | | | Invesco S&P Pure Value ETF | | | 2,500,020 | | | | 20.81 | % |
| Cowen Financial Product - AXS Multi-Strat Short | | EQUITIES | | | | |
| | | | | | | | | | |
| Number of Shares | | | Description | | Value | | | Percentage of Equity Swap's Notional Amount | |
| | (22,500 | ) | | SPDR Dow Jones Industrial Average ETF | | | (6,243,750 | ) | | | 51.58 | % |
| | (17,500 | ) | | SPDR S&P 500 ETF | | | (5,860,575 | ) | | | 48.42 | % |
| ^ | These investments are not direct holdings of the Fund. The holdings were determined based on the absolute notional values of the positions within the underlying swap basket. |
See accompanying Notes to Consolidated Financial Statements.
AXS Multi-Strategy Alternatives Fund
SUMMARY OF INVESTMENTS
As of September 30, 2020
| Security Type/Industry | | Percent of Total
Net Assets | |
| Common Stocks | | | | |
| Internet | | | 15.5 | % |
| Retail | | | 6.5 | % |
| Software | | | 6.5 | % |
| Computers | | | 5.3 | % |
| Biotechnology | | | 4.4 | % |
| Semiconductors | | | 3.8 | % |
| Commercial Services | | | 3.6 | % |
| Auto Manufacturers | | | 3.1 | % |
| Healthcare-Products | | | 2.9 | % |
| Beverages | | | 2.9 | % |
| Pharmaceuticals | | | 2.7 | % |
| Diversified Financial Services | | | 2.4 | % |
| Healthcare-Services | | | 2.2 | % |
| Telecommunications | | | 2.0 | % |
| Apparel | | | 1.8 | % |
| Media | | | 1.7 | % |
| Miscellaneous Manufacturing | | | 1.5 | % |
| Machinery-Diversified | | | 1.4 | % |
| Transportation | | | 1.4 | % |
| Banks | | | 1.3 | % |
| Iron/Steel | | | 0.6 | % |
| Electronics | | | 0.6 | % |
| Total Common Stocks | | | 74.1 | % |
| Exchange-Traded Funds | | | 12.1 | % |
| Short-Term Investments | | | 14.2 | % |
| Total Investments | | | 100.4 | % |
| Liabilities in Excess of Other Assets | | | (0.4 | )% |
| Total Net Assets | | | 100.0 | % |
See accompanying Notes to Consolidated Financial Statements.
AXS Funds
CONSOLIDATED STATEMENTS OF ASSETS AND LIABILITIES
As of September 30, 2020
| | | Alternative Growth Fund1 | | | Aspect Core Diversified Strategy Fund | | | Chesapeake Strategy Fund | |
| Assets: | | | | | | | | | | | | |
| Investments, at value (cost $6,616,973, $19,036,180, and $14,300,131, respectively) | | $ | 6,627,958 | | | $ | 19,093,723 | | | $ | 14,373,606 | |
| Cash | | | 35,169 | | | | 1,382,739 | | | | 170,000 | |
| Cash deposited with brokers for open futures contracts | | | 446,238 | | | | 1,658,088 | | | | 1,148,299 | |
| Cash deposited with brokers for open swap contract | | | 2,001,918 | | | | - | | | | - | |
| Unrealized appreciation on open futures contracts | | | - | | | | 93,579 | | | | - | |
| Unrealized appreciation on forward foreign currency exchange contracts | | | - | | | | 78,694 | | | | - | |
| Receivables: | | | | | | | | | | | | |
| Fund shares sold | | | 1,076 | | | | - | | | | 414 | |
| Due from Advisor | | | 32,419 | | | | 35,823 | | | | 28,884 | |
| Dividends and interest | | | 15,420 | | | | 35,095 | | | | 52,649 | |
| Prepaid expenses | | | 73,283 | | | | 52,789 | | | | 73,282 | |
| Total assets | | | 9,233,481 | | | | 22,430,530 | | | | 15,847,134 | |
| | | | | | | | | | | | | |
| Liabilities: | | | | | | | | | | | | |
| Advance on unrealized swap appreciation | | | - | | | | - | | | | - | |
| Unrealized depreciation on open swap contract | | | 810,634 | | | | - | | | | - | |
| Unrealized depreciation on open futures contracts | | | 73,115 | | | | - | | | | 135,794 | |
| Payables: | | | | | | | | | | | | |
| Fund shares redeemed | | | 15,737 | | | | 18,700 | | | | 21,461 | |
| Due to Broker - swap contract | | | 290,271 | | | | - | | | | - | |
| Advisory fees | | | - | | | | - | | | | - | |
| Distribution fees - Class A & Class C (Note 7) | | | 219 | | | | 1,865 | | | | 962 | |
| Auditing fees | | | 49,421 | | | | 16,815 | | | | 21,080 | |
| Shareholder reporting fees | | | 6,616 | | | | - | | | | 1,245 | |
| Fund administration and accounting fees | | | 6,576 | | | | 3,467 | | | | 8,151 | |
| Transfer agent fees and expenses | | | 2,482 | | | | 1,124 | | | | 7,349 | |
| Sub-transfer agent fees and expenses | | | 1,315 | | | | 285 | | | | 1,571 | |
| Trustees' fees and expenses | | | 856 | | | | 742 | | | | 4,766 | |
| Chief Compliance Officer fees | | | 820 | | | | 539 | | | | 704 | |
| Swap interest | | | 738 | | | | - | | | | - | |
| Legal fees | | | 699 | | | | 1,274 | | | | 1,823 | |
| Trustees' deferred compensation (Note 3) | | | 606 | | | | 873 | | | | - | |
| Custody fees | | | 169 | | | | | | | | 578 | |
| Accrued other expenses | | | 1,274 | | | | 2,850 | | | | 1,589 | |
| Total liabilities | | | 1,261,548 | | | | 48,534 | | | | 207,073 | |
| | | | | | | | | | | | | |
| Net Assets | | $ | 7,971,933 | | | $ | 22,381,996 | | | $ | 15,640,061 | |
See accompanying Notes to Consolidated Financial Statements.
AXS Funds
CONSOLIDATED STATEMENTS OF ASSETS AND LIABILITIES - Continued
As of September 30, 2020
| | | Alternative Growth Fund1 | | | Aspect Core Diversified Strategy Fund | | | Chesapeake Strategy Fund | |
| Components of Net Assets: | | | | | | | | | | | | |
| Paid-in capital (par value of $0.01 per share with an unlimited number of shares authorized) | | $ | 11,314,684 | | | $ | 28,355,684 | | | $ | 46,487,114 | |
| Total distributable earnings (accumulated deficit) | | | (3,342,751 | ) | | | (5,973,688 | ) | | | (30,847,053 | ) |
| Net Assets | | $ | 7,971,933 | | | $ | 22,381,996 | | | $ | 15,640,061 | |
| | | | | | | | | | | | | |
| Maximum Offering Price per Share: | | | | | | | | | | | | |
| Class A Shares: | | | | | | | | | | | | |
| Net assets applicable to shares outstanding | | $ | 946,426 | | | $ | 630,842 | | | $ | 3,376,351 | |
| Shares of beneficial interest issued and outstanding | | | 85,382 | | | | 78,580 | | | | 358,379 | |
| Redemption price per share2 | | $ | 11.08 | | | $ | 8.03 | | | $ | 9.42 | |
| Maximum sales charge (5.75% of offering price)3 | | | 0.68 | | | | 0.49 | | | | 0.57 | |
| Maximum offering price to public | | $ | 11.76 | | | $ | 8.52 | | | $ | 9.99 | |
| | | | | | | | | | | | | |
| Class C Shares: | | | | | | | | | | | | |
| Net assets applicable to shares outstanding | | | | | | $ | 2,113,337 | | | $ | 309,242 | |
| Shares of beneficial interest issued and outstanding | | | | | | | 273,274 | | | | 33,580 | |
| Redemption price per share | | | | | | $ | 7.73 | | | $ | 9.21 | |
| | | | | | | | | | | | | |
| Class I Shares: | | | | | | | | | | | | |
| Net assets applicable to shares outstanding | | $ | 7,025,507 | | | $ | 19,637,817 | | | $ | 11,954,468 | |
| Shares of beneficial interest issued and outstanding | | | 626,405 | | | | 2,438,684 | | | | 1,258,290 | |
| Redemption price per share2 | | $ | 11.22 | | | $ | 8.05 | | | $ | 9.50 | |
| 1 | Fiscal year end changed to September 30, effective July 1, 2020. |
| 2 | Redemptions made within 30 days of purchase may be assessed a redemption fee of 1.00%. |
| 3 | No sales charge applies on investments of $1 million or more, but a contingent deferred sales charge ("CDSC") of 1.00% will be imposed on certain redemptions of such shares within 12 months of the date of purchase. |
See accompanying Notes to Consolidated Financial Statements.
AXS Funds
CONSOLIDATED STATEMENTS OF ASSETS AND LIABILITIES - Continued
As of September 30, 2020
| | | Managed Futures Strategy Fund | | | Multi-Strategy Alternatives Fund4,5 | |
| Assets: | | | | | | | | |
| Investments, at value (cost $75,033,471 and $58,330,039, respectively) | | $ | 75,215,209 | | | $ | 63,125,416 | |
| Cash | | | - | | | | - | |
| Cash deposited with brokers for open futures contracts | | | - | | | | - | |
| Cash deposited with brokers for open swap contracts | | | 62,549,278 | | | | - | |
| Unrealized appreciation on open futures contracts | | | - | | | | - | |
| Unrealized appreciation on forward foreign currency exchange contracts | | | - | | | | - | |
| Receivables: | | | | | | | | |
| Fund shares sold | | | 122,816 | | | | 2 | |
| Due from Advisor | | | - | | | | - | |
| Dividends and interest | | | 212,397 | | | | 19,740 | |
| Prepaid expenses | | | 60,109 | | | | 67,843 | |
| Total assets | | | 138,159,809 | | | | 63,213,001 | |
| | | | | | | | | |
| Liabilities: | | | | | | | | |
| Advance on unrealized swap appreciation | | | 6,891,854 | | | | - | |
| Unrealized depreciation on open swap contracts | | | 13,301,543 | | | | 207,160 | |
| Unrealized depreciation on open futures contracts | | | - | | | | - | |
| Payables: | | | | | | | | |
| Fund shares redeemed | | | 308,752 | | | | - | |
| Due to Broker - swap contracts | | | 1,292,594 | | | | 49,521 | |
| Advisory fees | | | 26,595 | | | | 25,437 | |
| Distribution fees - Class A, Class C, & Class R-1(Note 7) | | | 12,285 | | | | 2,650 | |
| Auditing fees | | | 22,438 | | | | 21,321 | |
| Shareholder reporting fees | | | 1,474 | | | | 3,629 | |
| Fund administration and accounting fees | | | 35,358 | | | | 11,978 | |
| Transfer agent fees and expenses | | | 33,155 | | | | 4,916 | |
| Sub-transfer agent fees and expenses | | | 602 | | | | 3,595 | |
| Trustees' fees and expenses | | | 4,193 | | | | 3,158 | |
| Chief Compliance Officer fees | | | 4,195 | | | | 1,513 | |
| Swap interest | | | - | | | | - | |
| Legal fees | | | 1,073 | | | | 2,435 | |
| Trustees' deferred compensation (Note 3) | | | 4,586 | | | | 2,795 | |
| Custody fees | | | - | | | | 2,948 | |
| Accrued other expenses | | | 3,884 | | | | 4,299 | |
| Total liabilities | | | 21,944,581 | | | | 347,355 | |
| | | | | | | | | |
| Net Assets | | $ | 116,215,228 | | | $ | 62,865,646 | |
See accompanying Notes to Consolidated Financial Statements.
AXS Funds
CONSOLIDATED STATEMENTS OF ASSETS AND LIABILITIES - Continued
As of September 30, 2020
| | | Managed Futures Strategy Fund | | | Multi-Strategy Alternatives Fund4,5 | |
| Components of Net Assets: | | | | | | | | |
| Paid-in capital (par value of $0.01 per share with an unlimited number of shares authorized) | | $ | 281,955,120 | | | $ | 62,205,824 | |
| Total distributable earnings (accumulated deficit) | | | (165,739,892 | ) | | | 659,822 | |
| Net Assets | | $ | 116,215,228 | | | $ | 62,865,646 | |
| | | | | | | | | |
| Maximum Offering Price per Share: | | | | | | | | |
| Class A Shares: | | | | | | | | |
| Net assets applicable to shares outstanding | | $ | 13,632,367 | | | | | |
| Shares of beneficial interest issued and outstanding | | | 2,244,092 | | | | | |
| Redemption price per share6 | | $ | 6.07 | | | | | |
| Maximum sales charge (5.75% of offering price)7 | | | 0.37 | | | | | |
| Maximum offering price to public | | $ | 6.44 | | | | | |
| | | | | | | | | |
| Class C Shares: | | | | | | | | |
| Net assets applicable to shares outstanding | | $ | 10,944,527 | | | | | |
| Shares of beneficial interest issued and outstanding | | | 1,910,074 | | | | | |
| Redemption price per share | | $ | 5.73 | | | | | |
| | | | | | | | | |
| Class R-1 Shares: | | | | | | | | |
| Net assets applicable to shares outstanding | | | | | | $ | 12,940,824 | |
| Shares of beneficial interest issued and outstanding | | | | | | | 1,163,411 | |
| Redemption price per share | | | | | | $ | 11.12 | |
| | | | | | | | | |
| Class I Shares: | | | | | | | | |
| Net assets applicable to shares outstanding | | $ | 91,638,334 | | | $ | 49,924,822 | |
| Shares of beneficial interest issued and outstanding | | | 14,869,876 | | | | 4,472,380 | |
| Redemption price per share | | $ | 6.16 | | | $ | 11.16 | |
| 4 | Fiscal year end changed to September 30, effective May 1, 2020. |
| 5 | Financial statements are not consolidated. |
| 6 | Redemptions made within 30 days of purchase may be assessed a redemption fee of 1.00%. |
| 7 | No sales charge applies on investments of $1 million or more, but a contingent deferred sales charge ("CDSC") of 1.00% will be imposed on certain redemptions of such shares within 12 months of the date of purchase. |
See accompanying Notes to Consolidated Financial Statements.
AXS Funds
CONSOLIDATED STATEMENTS OF OPERATIONS
| | | Alternative Growth Fund | |
| | | For the Period July 1, 2020 through September 30, 20201 | | | For the Year Ended June 30, 2020 | |
| Investment Income: | | | | | | | | |
| Dividends | | $ | 95 | | | $ | 3,118 | |
| Interest | | | 15,049 | | | | 211,403 | |
| Total investment income | | | 15,144 | | | | 214,521 | |
| | | | | | | | | |
| Expenses: | | | | | | | | |
| Auditing fees | | | 25,866 | | | | 28,888 | |
| Advisory fees | | | 14,635 | | | | 116,743 | |
| Registration fees | | | 13,494 | | | | 40,720 | |
| Fund administration and accounting fees | | | 12,948 | | | | 45,627 | |
| Shareholder reporting fees | | | 5,660 | | | | 27,004 | |
| Transfer agent fees and expenses | | | 5,086 | | | | 12,216 | |
| Legal fees | | | 3,812 | | | | 14,495 | |
| Sub-transfer agent fees and expenses | | | 2,787 | | | | 11,106 | |
| Custody fees | | | 1,786 | | | | 9,311 | |
| Miscellaneous | | | 1,493 | | | | 5,297 | |
| Chief Compliance Officer fees | | | 1,069 | | | | 4,348 | |
| Distribution fees - Class A (Note 7) | | | 724 | | | | 4,728 | |
| Distribution fees - Class C (Note 7) | | | - | | | | - | |
| Distribution fees - Class R-1 (Note 7) | | | - | | | | - | |
| Trustees' fees and expenses | | | 555 | | | | 5,967 | |
| Insurance fees | | | 283 | | | | 3,282 | |
| Reorganizational costs | | | - | | | | - | |
| Total expenses | | | 90,198 | | | | 329,732 | |
| Advisory fees waived | | | (14,635 | ) | | | (116,743 | ) |
| Other expenses absorbed | | | (55,284 | ) | | | (50,538 | ) |
| Fees paid indirectly (Note 3) | | | (237 | ) | | | (1,325 | ) |
| Net expenses | | | 20,042 | | | | 161,126 | |
| Net investment income (loss) | | | (4,898 | ) | | | 53,395 | |
| | | | | | | | | |
| Realized and Unrealized Gain (Loss): | | | | | | | | |
| Net realized gain (loss) on: | | | | | | | | |
| Investments | | | - | | | | 79,605 | |
| Futures contracts | | | 815,897 | | | | (2,686,279 | ) |
| Forward foreign currency exchange contracts | | | - | | | | - | |
| Foreign currency transactions | | | - | | | | - | |
| Swap contract | | | - | | | | 88,544 | |
| Net realized gain (loss) | | | 815,897 | | | | (2,518,130 | ) |
| Net change in unrealized appreciation/depreciation on: | | | | | | | | |
| Investments | | | (12,322 | ) | | | 193 | |
| Futures contracts | | | (59,771 | ) | | | (84,219 | ) |
| Forward foreign currency exchange contracts | | | - | | | | - | |
| Foreign currency translations | | | - | | | | - | |
| Swap contract | | | (207,399 | ) | | | (1,012,462 | ) |
| Net change in unrealized appreciation/depreciation | | | (279,492 | ) | | | (1,096,488 | ) |
| Net increase from payment by affiliates (Note 3) | | | - | | | | - | |
| Net realized and unrealized gain (loss) | | | 536,405 | | | | (3,614,618 | ) |
| Net Increase (Decrease) in Net Assets from Operations | | $ | 531,507 | | | $ | (3,561,223 | ) |
| 1 | Fiscal year end changed to September 30, effective July 1, 2020. |
See accompanying Notes to Consolidated Financial Statements.
AXS Funds
CONSOLIDATED STATEMENTS OF OPERATIONS - Continued
| | | Aspect Core Diversified Strategy Fund | | | Chesapeake Strategy Fund | | | Managed Futures Strategy Fund | |
| | | For the Year Ended September 30, 2020 | | | For the Year Ended September 30, 2020 | | | For the Year Ended September 30, 2020 | |
| Investment Income: | | | | | | | | | | | | |
| Dividends | | $ | - | | | $ | - | | | $ | - | |
| Interest | | | 368,010 | | | | 1,114,764 | | | | 2,760,583 | |
| Total investment income | | | 368,010 | | | | 1,114,764 | | | | 2,760,583 | |
| | | | | | | | | | | | | |
| Expenses: | | | | | | | | | | | | |
| Auditing fees | | | 25,039 | | | | 21,060 | | | | 28,012 | |
| Advisory fees | | | 275,548 | | | | 875,228 | | | | 2,848,168 | |
| Registration fees | | | 53,606 | | | | 54,570 | | | | 75,832 | |
| Fund administration and accounting fees | | | 61,424 | | | | 72,128 | | | | 162,861 | |
| Shareholder reporting fees | | | 14,698 | | | | 24,744 | | | | 41,166 | |
| Transfer agent fees and expenses | | | 6,853 | | | | 23,810 | | | | 63,968 | |
| Legal fees | | | 17,359 | | | | 40,152 | | | | 46,012 | |
| Sub-transfer agent fees and expenses | | | 8,208 | | | | 55,177 | | | | 144,082 | |
| Custody fees | | | 7,614 | | | | 11,903 | | | | 13,467 | |
| Miscellaneous | | | 7,819 | | | | 7,949 | | | | 8,535 | |
| Chief Compliance Officer fees | | | 10,007 | | | | 12,990 | | | | 22,494 | |
| Distribution fees - Class A (Note 7) | | | 1,652 | | | | 10,904 | | | | 60,785 | |
| Distribution fees - Class C (Note 7) | | | 24,988 | | | | 3,933 | | | | 159,092 | |
| Distribution fees - Class R-1 (Note 7) | | | - | | | | - | | | | - | |
| Trustees' fees and expenses | | | 7,345 | | | | 10,991 | | | | 30,358 | |
| Insurance fees | | | 755 | | | | 4,312 | | | | 7,940 | |
| Reorganizational costs | | | 3,457 | | | | 13,297 | | | | - | |
| Total expenses | | | 526,372 | | | | 1,243,148 | | | | 3,712,772 | |
| Advisory fees waived | | | (187,164 | ) | | | (130,274 | ) | | | (150,061 | ) |
| Other expenses absorbed | | | - | | | | - | | | | - | |
| Fees paid indirectly (Note 3) | | | (1,796 | ) | | | (5,868 | ) | | | (8,617 | ) |
| Net expenses | | | 337,412 | | | | 1,107,006 | | | | 3,554,094 | |
| Net investment income (loss) | | | 30,598 | | | | 7,758 | | | | (793,511 | ) |
| | | | | | | | | | | | | |
| Realized and Unrealized Gain (Loss): | | | | | | | | | | | | |
| Net realized gain (loss) on: | | | | | | | | | | | | |
| Investments | | | 24,695 | | | | 144,121 | | | | 83,243 | |
| Futures contracts | | | (1,027,736 | ) | | | (9,299,183 | ) | | | - | |
| Forward foreign currency exchange contracts | | | (158,480 | ) | | | - | | | | - | |
| Foreign currency transactions | | | (21,121 | ) | | | 16,322 | | | | - | |
| Swap contracts | | | - | | | | - | | | | (12,309,920 | ) |
| Net realized gain (loss) | | | (1,182,642 | ) | | | (9,138,740 | ) | | | (12,226,677 | ) |
| Net change in unrealized appreciation/depreciation on: | | | | | | | | | | | | |
| Investments | | | (80,454 | ) | | | (296,686 | ) | | | (232,205 | ) |
| Futures contracts | | | 112,268 | | | | (1,372,604 | ) | | | - | |
| Forward foreign currency exchange contracts | | | 76,986 | | | | - | | | | - | |
| Foreign currency translations | | | 1,152 | | | | 37,373 | | | | - | |
| Swap contracts | | | - | | | | - | | | | (44,014,165 | ) |
| Net change in unrealized appreciation/depreciation | | | 109,952 | | | | (1,631,917 | ) | | | (44,246,370 | ) |
| Net increase from payment by affiliates (Note 3) | | | - | | | | 457 | | | | - | |
| Net realized and unrealized gain (loss) | | | (1,072,690 | ) | | | (10,770,200 | ) | | | (56,473,047 | ) |
| Net Increase (Decrease) in Net Assets from Operations | | $ | (1,042,092 | ) | | $ | (10,762,442 | ) | | $ | (57,266,558 | ) |
See accompanying Notes to Consolidated Financial Statements.
AXS Funds
STATEMENTS OF OPERATIONS - Continued
| | | Multi-Strategy Alternatives Fund | |
| | | For the Period May 1, 2020 through September 30, 20203 | | | For the Year Ended April 30, 2020 | |
| Investment Income: | | | | | | | | |
| Dividends | | $ | 229,511 | | | $ | 915,242 | |
| Interest | | | 4,283 | | | | 134,185 | |
| Total investment income | | | 233,794 | | | | 1,049,427 | |
| | | | | | | | | |
| Expenses: | | | | | | | | |
| Auditing fees | | | 14,500 | | | | 27,622 | |
| Advisory fees | | | 256,037 | | | | 818,010 | |
| Registration fees | | | 24,484 | | | | 34,743 | |
| Fund administration and accounting fees | | | 19,362 | | | | 96,326 | |
| Shareholder reporting fees | | | 7,041 | | | | 5,429 | |
| Transfer agent fees and expenses | | | 4,526 | | | | 23,318 | |
| Legal fees | | | 8,725 | | | | 10,602 | |
| Sub-transfer agent fees and expenses | | | 6,790 | | | | 15,945 | |
| Custody fees | | | 4,696 | | | | 18,771 | |
| Miscellaneous | | | 2,997 | | | | 2,693 | |
| Chief Compliance Officer fees | | | 5,952 | | | | 14,414 | |
| Distribution fees - Class A (Note 7) | | | - | | | | - | |
| Distribution fees - Class C (Note 7) | | | - | | | | - | |
| Distribution fees - Class R-1 (Note 7) | | | 13,901 | | | | 146,767 | |
| Trustees' fees and expenses | | | 6,572 | | | | 12,794 | |
| Insurance fees | | | 525 | | | | 7,206 | |
| Reorganizational costs | | | - | | | | - | |
| Total expenses | | | 376,108 | | | | 1,234,640 | |
| Advisory fees waived | | | - | | | | - | |
| Other expenses absorbed | | | - | | | | - | |
| Fees paid indirectly (Note 3) | | | (1,963 | ) | | | (2,857 | ) |
| Net expenses | | | 374,145 | | | | 1,231,783 | |
| Net investment income (loss) | | | (140,351 | ) | | | (182,356 | ) |
| | | | | | | | | |
| Realized and Unrealized Gain (Loss): | | | | | | | | |
| Net realized gain (loss) on: | | | | | | | | |
| Investments | | | 2,191,106 | | | | (2,600,963 | ) |
| Futures contracts | | | - | | | | - | |
| Forward foreign currency exchange contracts | | | - | | | | - | |
| Foreign currency transactions | | | - | | | | - | |
| Swap contracts | | | (454,525 | ) | | | (2,528,434 | ) |
| Net realized gain (loss) | | | 1,736,581 | | | | (5,129,397 | ) |
| Net change in unrealized appreciation/depreciation on: | | | | | | | | |
| Investments | | | 5,040,167 | | | | (4,133,581 | ) |
| Futures contracts | | | - | | | | - | |
| Forward foreign currency exchange contracts | | | - | | | | - | |
| Foreign currency translations | | | - | | | | - | |
| Swap contracts | | | 184,518 | | | | (391,678 | ) |
| Net change in unrealized appreciation/depreciation | | | 5,224,685 | | | | (4,525,259 | ) |
| Net increase from payment by affiliates (Note 3) | | | - | | | | - | |
| Net realized and unrealized gain (loss) | | | 6,961,266 | | | | (9,654,656 | ) |
| Net Increase (Decrease) in Net Assets from Operations | | $ | 6,820,915 | | | $ | (9,837,012 | ) |
| 3 | Fiscal year end changed to September 30, effective May 1, 2020. |
See accompanying Notes to Consolidated Financial Statements.
AXS Alternative Growth Fund*
CONSOLIDATED STATEMENTS OF CHANGES IN NET ASSETS
| | | For the Period July 1, 2020 through September 30, 2020* | | | For the Year Ended June 30, 20201 | | | For the Year Ended June 30, 2019 | |
| Increase (Decrease) in Net Assets from: | | | | | | | | | | | | |
| Operations: | | | | | | | | | | | | |
| Net investment income (loss) | | $ | (4,898 | ) | | $ | 53,395 | | | $ | 90,259 | |
| Net realized gain (loss) on investments, futures contracts and swap contract | | | 815,897 | | | | (2,518,130 | ) | | | (689,147 | ) |
| Net change in unrealized appreciation/depreciation on investments, futures contracts and swap contract | | | (279,492 | ) | | | (1,096,488 | ) | | | 1,158,697 | |
| Net increase (decrease) in net assets resulting from operations | | | 531,507 | | | | (3,561,223 | ) | | | 559,809 | |
| | | | | | | | | | | | | |
| Distributions to Shareholders: | | | | | | | | | | | | |
| Distributions: | | | | | | | | | | | | |
| Class A | | | - | | | | (131,196 | ) | | | (100,358 | ) |
| Class I | | | - | | | | (1,394,208 | ) | | | (296,646 | ) |
| Total distributions to shareholders | | | - | | | | (1,525,404 | ) | | | (397,004 | ) |
| | | | | | | | | | | | | |
| Capital Transactions: | | | | | | | | | | | | |
| Net proceeds from shares sold: | | | | | | | | | | | | |
| Class A | | | 12,725 | | | | 3,929,092 | | | | 464,075 | |
| Class I | | | 1,667,805 | | | | 20,297,244 | | | | 1,931,169 | |
| Reinvestment of distributions: | | | | | | | | | | | | |
| Class A | | | - | | | | 122,272 | | | | 93,700 | |
| Class I | | | - | | | | 1,022,008 | | | | 278,639 | |
| Cost of shares redeemed: | | | | | | | | | | | | |
| Class A2 | | | (439,701 | ) | | | (3,267,260 | ) | | | (3,275,075 | ) |
| Class I3 | | | (852,881 | ) | | | (16,630,753 | ) | | | (4,775,907 | ) |
| Net increase (decrease) in net assets from capital transactions | | | 387,948 | | | | 5,472,603 | | | | (5,283,399 | ) |
| | | | | | | | | | | | | |
| Total increase (decrease) in net assets | | | 919,455 | | | | 385,976 | | | | (5,120,594 | ) |
| | | | | | | | | | | | | |
| Net Assets: | | | | | | | | | | | | |
| Beginning of period | | | 7,052,478 | | | | 6,666,502 | | | | 11,787,096 | |
| End of period | | $ | 7,971,933 | | | $ | 7,052,478 | | | $ | 6,666,502 | |
| | | | | | | | | | | | | |
| Capital Share Transactions: | | | | | | | | | | | | |
| Shares sold: | | | | | | | | | | | | |
| Class A | | | 1,112 | | | | 334,813 | | | | 44,726 | |
| Class I | | | 149,160 | | | | 1,719,381 | | | | 181,246 | |
| Shares reinvested: | | | | | | | | | | | | |
| Class A | | | - | | | | 10,605 | | | | 10,624 | |
| Class I | | | - | | | | 87,576 | | | | 31,238 | |
| Shares redeemed: | | | | | | | | | | | | |
| Class A | | | (39,836 | ) | | | (322,742 | ) | | | (340,631 | ) |
| Class I | | | (75,335 | ) | | | (1,728,137 | ) | | | (473,438 | ) |
| Net increase (decrease) in capital share transactions | | | 35,101 | | | | 101,496 | | | | (546,235 | ) |
| * | Fiscal year end changed to September 30, effective July 1, 2020. |
| 1 | With the Plan of Reorganization with respect to the Equinox Ampersand Strategy Fund, Class A and Class I shareholders received Class A and Class I shares of the AXS Alternative Growth Fund, respectively, effective as of the close of business on November 8, 2019. See Note 1 in the accompanying Notes to Consolidated Financial Statements. |
| 2 | Net of redemption fee proceeds of $0, $7,399 and $263, respectively. |
| 3 | Net of redemption fee proceeds of $119, $5,614 and $1,218, respectively. |
See accompanying Notes to Consolidated Financial Statements.
AXS Aspect Core Diversified Strategy Fund
CONSOLIDATED STATEMENTS OF CHANGES IN NET ASSETS
| | | For the Year Ended September 30, 20201 | | | For the Year Ended September 30, 2019 | |
| Increase (Decrease) in Net Assets from: | | | | | | | | |
| Operations: | | | | | | | | |
| Net investment income | | $ | 30,598 | | | $ | 197,992 | |
| Net realized loss on investments, futures contracts, forward foreign currency contracts and foreign currency transactions | | | (1,182,642 | ) | | | (160,426 | ) |
| Net change in unrealized appreciation/depreciation on investments, futures contracts, forward foreign currency contracts and foreign currency transactions | | | 109,952 | | | | (651,703 | ) |
| Net decrease in net assets resulting from operations | | | (1,042,092 | ) | | | (614,137 | ) |
| | | | | | | | | |
| Distributions to Shareholders: | | | | | | | | |
| Distributions: | | | | | | | | |
| Class A | | | (57,109 | ) | | | - | |
| Class C | | | (239,407 | ) | | | - | |
| Class I | | | (1,278,806 | ) | | | - | |
| From return of capital: | | | | | | | | |
| Class A | | | (25,536 | ) | | | - | |
| Class C | | | (117,329 | ) | | | - | |
| Class I | | | (553,854 | ) | | | - | |
| Total distributions to shareholders | | | (2,272,041 | ) | | | - | |
| | | | | | | | | |
| Capital Transactions: | | | | | | | | |
| Net proceeds from shares sold: | | | | | | | | |
| Class A | | | 125,766 | | | | 231,593 | |
| Class C | | | 450,353 | | | | 581,887 | |
| Class I | | | 9,259,885 | | | | 8,901,314 | |
| Reinvestment of distributions: | | | | | | | | |
| Class A | | | 82,645 | | | | - | |
| Class C | | | 299,326 | | | | - | |
| Class I | | | 1,356,208 | | | | - | |
| Cost of shares redeemed: | | | | | | | | |
| Class A | | | (188,441 | ) | | | (151,141 | ) |
| Class C | | | (1,605,417 | ) | | | (226,219 | ) |
| Class I | | | (7,524,674 | ) | | | (22,697,256 | ) |
| Net increase (decrease) in net assets from capital transactions | | | 2,255,651 | | | | (13,359,822 | ) |
| | | | | | | | | |
| Total decrease in net assets | | | (1,058,482 | ) | | | (13,973,959 | ) |
| | | | | | | | | |
| Net Assets: | | | | | | | | |
| Beginning of period | | | 23,440,478 | | | | 37,414,437 | |
| End of period | | $ | 22,381,996 | | | $ | 23,440,478 | |
| | | | | | | | | |
| Capital Share Transactions: | | | | | | | | |
| Shares sold: | | | | | | | | |
| Class A | | | 14,402 | | | | 25,558 | |
| Class C | | | 57,206 | | | | 68,788 | |
| Class I | | | 1,085,986 | | | | 1,011,176 | |
| Shares reinvested: | | | | | | | | |
| Class A | | | 10,153 | | | | - | |
| Class C | | | 37,938 | | | | - | |
| Class I | | | 166,406 | | | | - | |
| Shares redeemed: | | | | | | | | |
| Class A | | | (22,146 | ) | | | (16,166 | ) |
| Class C | | | (195,843 | ) | | | (25,653 | ) |
| Class I | | | (858,339 | ) | | | (2,646,492 | ) |
| Net increase (decrease) in capital share transactions | | | 295,763 | | | | (1,582,789 | ) |
| 1 | With the Plan of Reorganization with respect to the Equinox Aspect Core Diversified Strategy Fund, Class A, Class C, and Class I shareholders received Class A, Class C, and Class I shares of the AXS Aspect Core Diversified Strategy Fund, respectively, effective as of the close of business on November 8, 2019. See Note 1 in the accompanying Notes to Consolidated Financial Statements. |
See accompanying Notes to Consolidated Financial Statements.
AXS Chesapeake Strategy Fund
CONSOLIDATED STATEMENTS OF CHANGES IN NET ASSETS
| | | For the Year Ended September 30, 20201 | | | For the Year Ended September 30, 2019 | |
| Increase (Decrease) in Net Assets from: | | | | | | | | |
| Operations: | | | | | | | | |
| Net investment income | | $ | 7,758 | | | $ | 544,308 | |
| Net realized loss on investments, futures contracts and foreign currency transactions | | | (9,138,740 | ) | | | (14,843,609 | ) |
| Net change in unrealized appreciation/depreciation on investments, futures contracts and foreign currency translations | | | (1,631,917 | ) | | | (4,251,982 | ) |
| Net increase from payment by affiliates (Note 3) | | | 457 | | | | - | |
| Net decrease in net assets resulting from operations | | | (10,762,442 | ) | | | (18,551,283 | ) |
| | | | | | | | | |
| Distributions to Shareholders: | | | | | | | | |
| Distributions: | | | | | | | | |
| Class A | | | (170,310 | ) | | | (47,608 | ) |
| Class C | | | (12,387 | ) | | | (3,479 | ) |
| Class I | | | (2,963,494 | ) | | | (1,647,251 | ) |
| Total distributions to shareholders | | | (3,146,191 | ) | | | (1,698,338 | ) |
| | | | | | | | | |
| Capital Transactions: | | | | | | | | |
| Net proceeds from shares sold: | | | | | | | | |
| Class A | | | 1,573,610 | | | | 2,275,722 | |
| Class C | | | 30,000 | | | | 67,270 | |
| Class I | | | 15,250,896 | | | | 65,429,277 | |
| Reinvestment of distributions: | | | | | | | | |
| Class A | | | 162,508 | | | | 45,919 | |
| Class C | | | 10,898 | | | | 3,205 | |
| Class I | | | 2,777,102 | | | | 1,504,780 | |
| Cost of shares redeemed: | | | | | | | | |
| Class A | | | (2,570,995 | ) | | | (2,458,605 | ) |
| Class C | | | (249,436 | ) | | | (315,569 | ) |
| Class I | | | (83,180,693 | ) | | | (116,164,021 | ) |
| Net decrease in net assets from capital transactions | | | (66,196,110 | ) | | | (49,612,022 | ) |
| | | | | | | | | |
| Total decrease in net assets | | | (80,104,743 | ) | | | (69,861,643 | ) |
| | | | | | | | | |
| Net Assets: | | | | | | | | |
| Beginning of period | | | 95,744,804 | | | | 165,606,447 | |
| End of period | | $ | 15,640,061 | | | $ | 95,744,804 | |
| | | | | | | | | |
| Capital Share Transactions: | | | | | | | | |
| Shares sold: | | | | | | | | |
| Class A | | | 151,250 | | | | 204,164 | |
| Class C | | | 3,015 | | | | 6,099 | |
| Class I | | | 1,476,667 | | | | 5,714,068 | |
| Shares reinvested: | | | | | | | | |
| Class A | | | 15,824 | | | | 4,137 | |
| Class C | | | 1,079 | | | | 294 | |
| Class I | | | 268,578 | | | | 134,716 | |
| Shares redeemed: | | | | | | | | |
| Class A | | | (257,101 | ) | | | (222,347 | ) |
| Class C | | | (24,462 | ) | | | (28,383 | ) |
| Class I | | | (8,423,115 | ) | | | (10,475,001 | ) |
| Net decrease in capital share transactions | | | (6,788,265 | ) | | | (4,662,253 | ) |
| 1 | With the Plan of Reorganization with respect to the Equinox Chesapeake Strategy Fund, Class A, Class C and Class I shareholders received Class A, Class C and Class I shares of the AXS Chesapeake Strategy Fund, respectively, effective as of the close of business on November 8, 2019. See Note 1 in the accompanying Notes to Consolidated Financial Statements. |
See accompanying Notes to Consolidated Financial Statements.
AXS Managed Futures Strategy Fund
CONSOLIDATED STATEMENTS OF CHANGES IN NET ASSETS
| | | For the Year Ended September 30, 20201 | | | For the Year Ended September 30, 2019 | |
| Increase (Decrease) in Net Assets from: | | | | | | | | |
| Operations: | | | | | | | | |
| Net investment income (loss) | | $ | (793,511 | ) | | $ | 815,643 | |
| Net realized loss on investments and swap contracts | | | (12,226,677 | ) | | | (1,024,761 | ) |
| Net change in unrealized appreciation/depreciation on investments and swap contracts | | | (44,246,370 | ) | | | 33,159,854 | |
| Net increase (decrease) in net assets resulting from operations | | | (57,266,558 | ) | | | 32,950,736 | |
| | | | | | | | | |
| Distributions to Shareholders: | | | | | | | | |
| Distributions: | | | | | | | | |
| Class A | | | (3,604,474 | ) | | | - | |
| Class C | | | (2,160,419 | ) | | | - | |
| Class I | | | (21,960,143 | ) | | | - | |
| From return of capital | | | | | | | | |
| Class A | | | (215,848 | ) | | | - | |
| Class C | | | (129,373 | ) | | | - | |
| Class I | | | (1,315,044 | ) | | | - | |
| Total distributions to shareholders | | | (29,385,301 | ) | | | - | |
| | | | | | | | | |
| Capital Transactions: | | | | | | | | |
| Net proceeds from shares sold: | | | | | | | | |
| Class A | | | 5,692,683 | | | | 13,960,318 | |
| Class C | | | 902,004 | | | | 1,308,686 | |
| Class I | | | 56,712,284 | | | | 77,828,944 | |
| Reinvestment of distributions: | | | | | | | | |
| Class A | | | 3,679,350 | | | | - | |
| Class C | | | 2,204,352 | | | | - | |
| Class I | | | 21,976,827 | | | | - | |
| Cost of shares redeemed: | | | | | | | | |
| Class A2 | | | (18,179,968 | ) | | | (16,410,678 | ) |
| Class C3 | | | (6,132,701 | ) | | | (11,084,581 | ) |
| Class I4 | | | (118,977,271 | ) | | | (105,192,837 | ) |
| Net decrease in net assets from capital transactions | | | (52,122,440 | ) | | | (39,590,148 | ) |
| | | | | | | | | |
| Total decrease in net assets | | | (138,774,299 | ) | | | (6,639,412 | ) |
| | | | | | | | | |
| Net Assets: | | | | | | | | |
| Beginning of period | | | 254,989,527 | | | | 261,628,939 | |
| End of period | | $ | 116,215,228 | | | $ | 254,989,527 | |
| | | | | | | | | |
| Capital Share Transactions: | | | | | | | | |
| Shares sold: | | | | | | | | |
| Class A | | | 740,840 | | | | 1,677,375 | |
| Class C | | | 122,591 | | | | 172,267 | |
| Class I | | | 7,441,210 | | | | 9,489,643 | |
| Shares reinvested: | | | | | | | | |
| Class A | | | 472,317 | | | | - | |
| Class C | | | 298,288 | | | | - | |
| Class I | | | 2,785,403 | | | | - | |
| Shares redeemed: | | | | | | | | |
| Class A | | | (2,554,978 | ) | | | (1,982,982 | ) |
| Class C | | | (894,179 | ) | | | (1,406,448 | ) |
| Class I | | | (16,817,971 | ) | | | (12,811,109 | ) |
| Net decrease in capital share transactions | | | (8,406,479 | ) | | | (4,861,254 | ) |
| 1 | With the Plan of Reorganization with respect to the Equinox MutualHedge Futures Strategy Fund, Class A, Class C, and Class I shareholders received Class A, Class C, and Class I shares of the AXS Managed Futures Strategy Fund, respectively, effective as of the close of business on January 24, 2020. See Note 1 in the accompanying Notes to Consolidated Financial Statements. |
| 2 | Net of redemption fee proceeds of $8,566 and $1,271, respectively. |
| 3 | Net of redemption fee proceeds of $61 and $1, respectively. |
| 4 | Net of redemption fee proceeds of $19,340 and $2,591, respectively. |
See accompanying Notes to Consolidated Financial Statements.
AXS Multi-Strategy Alternatives Fund
STATEMENTS OF CHANGES IN NET ASSETS
| | | For the Period May 1, 2020 through September 30, 2020* | | | For the Year Ended April 30, 20201 | | | For the Year Ended April 30, 2019 | |
| Increase (Decrease) in Net Assets from: | | | | | | | | | | | | |
| Operations: | | | | | | | | | | | | |
| Net investment loss | | $ | (140,351 | ) | | $ | (182,356 | ) | | $ | (18,231 | ) |
| Net realized gain (loss) on investments and swap contracts | | | 1,736,581 | | | | (5,129,397 | ) | | | 4,585,206 | |
| Net change in unrealized appreciation/depreciation on investments and swap contracts | | | 5,224,685 | | | | (4,525,259 | ) | | | 31,594 | |
| Net increase (decrease) in net assets resulting from operations | | | 6,820,915 | | | | (9,837,012 | ) | | | 4,598,569 | |
| | | | | | | | | | | | | |
| Distributions to Shareholders: | | | | | | | | | | | | |
| Distributions: | | | | | | | | | | | | |
| Class R-1 | | | - | | | | (239,097 | ) | | | (14,979,546 | ) |
| Class I | | | - | | | | (579,979 | ) | | | (101,796 | ) |
| Total distributions to shareholders | | | - | | | | (819,076 | ) | | | (15,081,342 | ) |
| | | | | | | | | | | | | |
| Capital Transactions: | | | | | | | | | | | | |
| Net proceeds from shares sold: | | | | | | | | | | | | |
| Class R-1 | | | 866,530 | | | | 4,838,789 | | | | 26,878,991 | |
| Class I | | | 3,042,521 | | | | 70,226,126 | | | | - | |
| Reinvestment of distributions: | | | | | | | | | | | | |
| Class R-1 | | | - | | | | 237,859 | | | | 14,830,205 | |
| Class I | | | - | | | | 579,979 | | | | 101,796 | |
| Cost of shares redeemed: | | | | | | | | | | | | |
| Class R-1 | | | (3,975,549 | ) | | | (83,269,760 | ) | | | (18,808,087 | ) |
| Class I | | | (2,351,039 | ) | | | (21,287,319 | ) | | | (125,000 | ) |
| Capital contribution from a predecessor affiliate (Note 3) | | | - | | | | 43,948 | | | | - | |
| Net increase (decrease) in net assets from capital transactions | | | (2,417,537 | ) | | | (28,630,378 | ) | | | 22,877,905 | |
| | | | | | | | | | | | | |
| Total increase (decrease) in net assets | | | 4,403,378 | | | | (39,286,466 | ) | | | 12,395,132 | |
| | | | | | | | | | | | | |
| Net Assets: | | | | | | | | | | | | |
| Beginning of period | | | 58,462,268 | | | | 97,748,734 | | | | 85,353,602 | |
| End of period | | $ | 62,865,646 | | | $ | 58,462,268 | | | $ | 97,748,734 | |
| | | | | | | | | | | | | |
| Capital Share Transactions: | | | | | | | | | | | | |
| Shares sold: | | | | | | | | | | | | |
| Class R-1 | | | 79,979 | | | | 436,570 | | | | 2,288,825 | |
| Class I | | | 289,476 | | | | 6,299,413 | | | | - | |
| Shares reinvested: | | | | | | | | | | | | |
| Class R-1 | | | - | | | | 21,256 | | | | 1,343,316 | |
| Class I | | | - | | | | 51,784 | | | | 9,196 | |
| Shares redeemed: | | | | | | | | | | | | |
| Class R-1 | | | (382,487 | ) | | | (7,461,647 | ) | | | (1,548,341 | ) |
| Class I | | | (216,039 | ) | | | (1,992,795 | ) | | | (11,052 | ) |
| Net increase (decrease) in capital share transactions | | | (229,071 | ) | | | (2,645,419 | ) | | | 2,081,944 | |
| * | Fiscal year end changed to September 30, effective May 1, 2020. |
| 1 | With the Plan of Reorganization with respect to the KCM Macro Trends Fund, Class R-1 and Institutional Class shareholders received Class R-1 and Class I shares of the AXS Multi-Strategy Alternatives Fund, respectively, effective as of the close of business on October 18, 2019. See Note 1 in the accompanying Notes to Consolidated Financial Statements. |
See accompanying Notes to Consolidated Financial Statements.
AXS Alternative Growth Fund
CONSOLIDATED FINANCIAL HIGHLIGHTS
Class A*
Per share operating performance.
For a capital share outstanding throughout each period.
| | | For the Period July 1, 2020 through | | | For the Year Ended June 30, | |
| | | September 30, 2020** | | | 2020 | | | 2019 | | | 2018 | | | 2017 | | | 2016 | |
| Net asset value, beginning of period | | $ | 10.33 | | | $ | 11.47 | | | $ | 10.42 | | | $ | 10.36 | | | $ | 10.21 | | | $ | 10.11 | |
| Income from Investment Operations: | | | | | | | | | | | | | | | | | | | | | | | | |
| Net investment income (loss)1 | | | (0.01 | ) | | | 0.01 | | | | 0.09 | | | | (0.07 | ) | | | (0.11 | ) | | | (0.13 | ) |
| Net realized and unrealized gain (loss) | | | 0.76 | | | | (0.44 | ) | | | 1.41 | | | | 1.05 | | | | 0.78 | | | | 0.89 | |
| Total from investment operations | | | 0.75 | | | | (0.43 | ) | | | 1.50 | | | | 0.98 | | | | 0.67 | | | | 0.76 | |
| | | | | | | | | | | | | | | | | | | | | | | | | |
| Less Distributions: | | | | | | | | | | | | | | | | | | | | | | | | |
| From net investment income | | | - | | | | (0.34 | ) | | | - | 2 | | | - | | | | (0.26 | ) | | | - | |
| From net realized gain | | | - | | | | (0.41 | ) | | | (0.45 | ) | | | (0.92 | ) | | | (0.26 | ) | | | (0.66 | ) |
| Total distributions | | | - | | | | (0.75 | ) | | | (0.45 | ) | | | (0.92 | ) | | | (0.52 | ) | | | (0.66 | ) |
| | | | | | | | | | | | | | | | | | | | | | | | | |
| Redemption fee proceeds1 | | | - | | | | 0.04 | | | | - | 2 | | | - | 2 | | | - | 2 | | | - | 2 |
| | | | | | | | | | | | | | | | | | | | | | | | | |
| Net asset value, end of period | | $ | 11.08 | | | $ | 10.33 | | | $ | 11.47 | | | $ | 10.42 | | | $ | 10.36 | | | $ | 10.21 | |
| | | | | | | | | | | | | | | | | | | | | | | | | |
| Total return3 | | | 7.26 | %7 | | | (4.05 | )% | | | 15.75 | % | | | 9.50 | % | | | 6.79 | % | | | 8.24 | % |
| | | | | | | | | | | | | | | | | | | | | | | | | |
| Ratios and Supplemental Data: | | | | | | | | | | | | | | | | | | | | | | | | |
| Net assets, end of period (in thousands) | | $ | 946 | | | $ | 1,282 | | | $ | 1,163 | | | $ | 4,029 | | | $ | 4,098 | | | $ | 3,972 | |
| | | | | | | | | | | | | | | | | | | | | | | | | |
| Ratio of expenses to average net assets: | | | | | | | | | | | | | | | | | | | | | | | | |
| Before fees waived and expenses absorbed | | | 4.83 | %8 | | | 2.33 | %4 | | | 3.98 | %5 | | | 3.36 | % | | | 3.37 | % | | | 4.08 | % |
| After fees waived and expenses absorbed | | | 1.24 | %8 | | | 1.25 | %4 | | | 1.24 | %5 | | | 1.45 | % | | | 1.45 | % | | | 1.45 | % |
| Ratio of net investment income (loss) to average net assets: | | | | | | | | | | | | | | | | | | | | | | | | |
| Before fees waived and expenses absorbed | | | (4.05 | )%8 | | | (0.95 | )% | | | (1.86 | )%5,6 | | | (2.61 | )% | | | (3.00 | )% | | | (3.91 | )% |
| After fees waived and expenses absorbed | | | (0.46 | )%8 | | | 0.13 | % | | | 0.88 | %5,6 | | | (0.70 | )% | | | (1.08 | )% | | | (1.28 | )% |
| | | | | | | | | | | | | | | | | | | | | | | | | |
| Portfolio turnover rate | | | 0 | %7 | | | 99 | % | | | 80 | % | | | 69 | % | | | 0 | % | | | 0 | % |
| * | Financial information from June 30, 2015 through November 8, 2019 is for the Equinox Ampersand Strategy Fund, which was reorganized into the AXS Alternative Growth Fund as of the close of business on November 8, 2019. See Note 1 in the accompanying Notes to Financial Statements. |
| ** | Fiscal year end changed to September 30, effective July 1, 2020. |
| 1 | Based on average shares outstanding for the period. |
| 2 | Amount represents less than $0.005 per share. |
| 3 | Total returns would have been lower had expenses not been waived and absorbed by the Advisor. Returns shown include Rule 12b-1 fees of up to 0.25% and do not reflect the deduction of taxes that a shareholder would pay on Fund distributions or the redemption of Fund shares. Returns shown do not include payment of sales load of 5.75% of offering price which will not apply on sales of $1 million or more. If the sales charge was included total returns would be lower. |
| 4 | If expenses not included in the expense cap had been excluded, the expense ratios would have been lower by 0.01% for the year ended June 30, 2020. |
| 5 | Does not include the expenses of other investment companies in which the Fund invests. |
| 6 | Recognition of net investment income by the Fund is affected by the timing of the declaration of dividends by the underlying exchange traded funds in which the Fund invests. |
See accompanying Notes to Consolidated Financial Statements.
AXS Alternative Growth Fund
CONSOLIDATED FINANCIAL HIGHLIGHTS
Class I*
Per share operating performance.
For a capital share outstanding throughout each period.
| | | For the Period July 1, 2020 through | | | For the Year Ended June 30, | |
| | | September 30, 2020** | | | 2020 | | | 2019 | | | 2018 | | | 2017 | | | 2016 | |
| Net asset value, beginning of period | | $ | 10.44 | | | $ | 11.62 | | | $ | 10.56 | | | $ | 10.43 | | | $ | 10.28 | | | $ | 10.15 | |
| Income from Investment Operations: | | | | | | | | | | | | | | | | | | | | | | | | |
| Net investment income (loss)1 | | | (0.01 | ) | | | 0.04 | | | | 0.11 | | | | (0.04 | ) | | | (0.09 | ) | | | (0.10 | ) |
| Net realized and unrealized gain (loss) | | | 0.79 | | | | (0.44 | ) | | | 1.45 | | | | 1.05 | | | | 0.79 | | | | 0.89 | |
| Total from investment operations | | | 0.78 | | | | (0.40 | ) | | | 1.56 | | | | 1.01 | | | | 0.70 | | | | 0.79 | |
| | | | | | | | | | | | | | | | | | | | | | | | | |
| Less Distributions: | | | | | | | | | | | | | | | | | | | | | | | | |
| From net investment income | | | - | | | | (0.37 | ) | | | (0.05 | ) | | | - | | | | (0.29 | ) | | | - | |
| From net realized gain | | | - | | | | (0.41 | ) | | | (0.45 | ) | | | (0.92 | ) | | | (0.26 | ) | | | (0.66 | ) |
| Total distributions | | | - | | | | (0.78 | ) | | | (0.50 | ) | | | (0.92 | ) | | | (0.55 | ) | | | (0.66 | ) |
| | | | | | | | | | | | | | | | | | | | | | | | | |
| Redemption fee proceeds1 | | | - | 2 | | | - | 2 | | | - | 2 | | | 0.04 | | | | - | | | | - | 2 |
| | | | | | | | | | | | | | | | | | | | | | | | | |
| Net asset value, end of period | | $ | 11.22 | | | $ | 10.44 | | | $ | 11.62 | | | $ | 10.56 | | | $ | 10.43 | | | $ | 10.28 | |
| | | | | | | | | | | | | | | | | | | | | | | | | |
| Total return3 | | | 7.47 | %7 | | | (4.13 | )% | | | 16.19 | % | | | 10.15 | % | | | 7.00 | % | | | 8.50 | % |
| | | | | | | | | | | | | | | | | | | | | | | | | |
| Ratios and Supplemental Data: | | | | | | | | | | | | | | | | | �� | | | | | | | |
| Net assets, end of period (in thousands) | | $ | 7,026 | | | $ | 5,770 | | | $ | 5,503 | | | $ | 7,758 | | | $ | 2,458 | | | $ | 1,650 | |
| | | | | | | | | | | | | | | | | | | | | | | | | |
| Ratio of expenses to average net assets: | | | | | | | | | | | | | | | | | | | | | | | | |
| Before fees waived and expenses absorbed | | | 4.58 | %8 | | | 2.08 | %4 | | | 3.57 | %5 | | | 3.32 | % | | | 3.11 | % | | | 3.77 | % |
| After fees waived and expenses absorbed | | | 0.99 | %8 | | | 1.00 | %4 | | | 0.99 | %5 | | | 1.20 | % | | | 1.20 | % | | | 1.20 | % |
| Ratio of net investment income (loss) to average net assets: | | | | | | | | | | | | | | | | | | | | | | | | |
| Before fees waived and expenses absorbed | | | (3.80 | )%8 | | | (0.70 | )% | | | (1.50 | )%5,6 | | | (2.53 | )% | | | (2.74 | )% | | | (3.61 | )% |
| After fees waived and expenses absorbed | | | (0.21 | )%8 | | | 0.38 | % | | | 1.08 | %5,6 | | | (0.41 | )% | | | (0.83 | )% | | | (1.04 | )% |
| | | | | | | | | | | | | | | | | | | | | | | | | |
| Portfolio turnover rate | | | 0 | %7 | | | 99 | % | | | 80 | % | | | 69 | % | | | 0 | % | | | 0 | % |
| * | Financial information from June 30, 2015 through November 8, 2019 is for the Equinox Ampersand Strategy Fund, which was reorganized into the AXS Alternative Growth Fund as of the close of business on November 8, 2019. See Note 1 in the accompanying Notes to Financial Statements. |
| ** | Fiscal year end changed to September 30, effective July 1, 2020. |
| 1 | Based on average shares outstanding for the period. |
| 2 | Amount represents less than $0.005 per share. |
| 3 | Total returns would have been lower had expenses not been waived and absorbed by the Advisor. Returns shown do not reflect the deduction of taxes that a shareholder would pay on Fund distributions or the redemption of Fund shares. |
| 4 | If expenses not included in the expense cap had been excluded, the expense ratios would have been lower by 0.01% for the year ended June 30, 2020. |
| 5 | Does not include the expenses of other investment companies in which the Fund invests. |
| 6 | Recognition of net investment income by the Fund is affected by the timing of the declaration of dividends by the underlying exchange traded funds in which the Fund invests. |
See accompanying Notes to Consolidated Financial Statements.
AXS Aspect Core Diversified Strategy Fund
CONSOLIDATED FINANCIAL HIGHLIGHTS
Class A*
Per share operating performance.
For a capital share outstanding throughout each period.
| | | For the Year Ended September 30, | |
| | | 2020 | | | 2019 | | | 2018 | | | 2017 | | | 2016 | |
| Net asset value, beginning of period | | $ | 9.42 | | | $ | 9.19 | | | $ | 9.29 | | | $ | 9.98 | | | $ | 10.73 | |
| Income from Investment Operations: | | | | | | | | | | | | | | | | | | | | |
| Net investment income (loss)1 | | | - | 2 | | | 0.06 | | | | (0.04 | ) | | | (0.12 | ) | | | (0.15 | ) |
| Net realized and unrealized gain (loss) | | | (0.34 | ) | | | 0.17 | | | | (0.06 | ) | | | (0.49 | ) | | | (0.04 | ) |
| Total from investment operations | | | (0.34 | ) | | | 0.23 | | | | (0.10 | ) | | | (0.61 | ) | | | (0.19 | ) |
| | | | | | | | | | | | | | | | | | | | | |
| Less Distributions: | | | | | | | | | | | | | | | | | | | | |
| From net investment income | | | (0.73 | ) | | | - | | | | - | | | | (0.08 | ) | | | (0.13 | ) |
| From net realized gain | | | - | | | | - | | | | - | | | | - | | | | (0.43 | ) |
| From return of capital | | | (0.32 | ) | | | - | | | | - | | | | - | | | | - | |
| Total distributions | | | (1.05 | ) | | | - | | | | - | | | | (0.08 | ) | | | (0.56 | ) |
| | | | | | | | | | | | | | | | | | | | | |
| Net asset value, end of period | | $ | 8.03 | | | $ | 9.42 | | | $ | 9.19 | | | $ | 9.29 | | | $ | 9.98 | |
| | | | | | | | | | | | | | | | | | | | | |
| Total return3 | | | (3.79 | )% | | | 2.50 | % | | | (1.08 | )% | | | (6.18 | )% | | | (1.77 | )% |
| | | | | | | | | | | | | | | | | | | | | |
| Ratios and Supplemental Data: | | | | | | | | | | | | | | | | | | | | |
| Net assets, end of period (in thousands) | | $ | 631 | | | $ | 717 | | | $ | 614 | | | $ | 131 | | | $ | 734 | |
| | | | | | | | | | | | | | | | | | | | | |
| Ratio of expenses to average net assets: | | | | | | | | | | | | | | | | | | | | |
| Before fees waived and expenses absorbed | | | 2.61 | %4 | | | 2.42 | % | | | 2.14 | % | | | 2.47 | % | | | 2.29 | % |
| After fees waived and expenses absorbed | | | 1.72 | %4 | | | 1.70 | % | | | 1.70 | % | | | 1.70 | % | | | 1.70 | % |
| Ratio of net investment income (loss) to average net assets: | | | | | | | | | | | | | | | | | | | | |
| Before fees waived and expenses absorbed | | | (0.87 | )% | | | (0.09 | )% | | | (0.88 | )% | | | (2.00 | )% | | | (2.03 | )% |
| After fees waived and expenses absorbed | | | 0.02 | % | | | 0.63 | % | | | (0.44 | )% | | | (1.23 | )% | | | (1.44 | )% |
| | | | | | | | | | | | | | | | | | | | | |
| Portfolio turnover rate | | | 0 | % | | | 59 | % | | | 20 | % | | | 0 | % | | | 0 | % |
| * | Financial information from September 30, 2015 through November 8, 2019 is for the Equinox Aspect Core Diversified Strategy Fund, which was reorganized into the AXS Aspect Core Diversified Strategy Fund as of the close of business on November 8, 2019. See Note 1 in the accompanying Notes to Consolidated Financial Statements. |
| 1 | Based on average shares outstanding for the period. |
| 2 | Amount represents less than $0.005 per share. |
| 3 | Total returns would have been higher/lower had expenses not been recovered/waived and absorbed by the Advisor. Returns shown include Rule 12b-1 fees of up to 0.25% and do not reflect the deduction of taxes that a shareholder would pay on Fund distributions or the redemption of Fund shares. Returns shown do not include payment of sales load of 5.75% of offering price which will not apply on sales of $1 million or more. If the sales charge was included total returns would be lower. |
| 4 | If expenses not included in the expense cap had been excluded, the expense ratios would have been lower by 0.02% for the year ended September 30, 2020. |
See accompanying Notes to Consolidated Financial Statements.
AXS Aspect Core Diversified Strategy Fund
CONSOLIDATED FINANCIAL HIGHLIGHTS
Class C*
Per share operating performance.
For a capital share outstanding throughout each period.
| | | For the Year Ended September 30, | |
| | | 2020 | | | 2019 | | | 2018 | | | 2017 | | | 2016 | |
| Net asset value, beginning of period | | $ | 9.11 | | | $ | 8.96 | | | $ | 9.12 | | | $ | 9.89 | | | $ | 10.72 | |
| Income from Investment Operations: | | | | | | | | | | | | | | | | | | | | |
| Net investment loss1 | | | (0.06 | ) | | | (0.01 | ) | | | (0.11 | ) | | | (0.18 | ) | | | (0.22 | ) |
| Net realized and unrealized gain (loss) | | | (0.34 | ) | | | 0.16 | | | | (0.05 | ) | | | (0.51 | ) | | | (0.04 | ) |
| Total from investment operations | | | (0.40 | ) | | | 0.15 | | | | (0.16 | ) | | | (0.69 | ) | | | (0.26 | ) |
| | | | | | | | | | | | | | | | | | | | | |
| Less Distributions: | | | | | | | | | | | | | | | | | | | | |
| From net investment income | | | (0.66 | ) | | | - | | | | - | | | | (0.08 | ) | | | (0.14 | ) |
| From net realized gain | | | - | | | | - | | | | - | | | | - | | | | (0.43 | ) |
| From return of capital | | | (0.32 | ) | | | - | | | | - | | | | - | | | | - | |
| Total distributions | | | (0.98 | ) | | | - | | | | - | | | | (0.08 | ) | | | (0.57 | ) |
| | | | | | | | | | | | | | | | | | | | | |
| Net asset value, end of period | | $ | 7.73 | | | $ | 9.11 | | | $ | 8.96 | | | $ | 9.12 | | | $ | 9.89 | |
| | | | | | | | | | | | | | | | | | | | | |
| Total return2 | | | (4.57 | )% | | | 1.67 | % | | | (1.75 | )% | | | (6.99 | )% | | | (2.52 | )% |
| | | | | | | | | | | | | | | | | | | | | |
| Ratios and Supplemental Data: | | | | | | | | | | | | | | | | | | | | |
| Net assets, end of period (in thousands) | | $ | 2,113 | | | $ | 3,406 | | | $ | 2,963 | | | $ | 479 | | | $ | 261 | |
| | | | | | | | | | | | | | | | | | | | | |
| Ratio of expenses to average net assets: | | | | | | | | | | | | | | | | | | | | |
| Before fees waived and expenses absorbed | | | 3.36 | %3 | | | 3.18 | % | | | 2.89 | % | | | 3.17 | % | | | 3.07 | % |
| After fees waived and expenses absorbed | | | 2.47 | %3 | | | 2.45 | % | | | 2.45 | % | | | 2.45 | % | | | 2.45 | % |
| Ratio of net investment loss to average net assets: | | | | | | | | | | | | | | | | | | | | |
| Before fees waived and expenses absorbed | | | (1.62 | )% | | | (0.85 | )% | | | (1.68 | )% | | | (2.68 | )% | | | (2.81 | )% |
| After fees waived and expenses absorbed | | | (0.73 | )% | | | (0.12 | )% | | | (1.24 | )% | | | (1.96 | )% | | | (2.19 | )% |
| | | | | | | | | | | | | | | | | | | | | |
| Portfolio turnover rate | | | 0 | % | | | 59 | % | | | 20 | % | | | 0 | % | | | 0 | % |
| * | Financial information from September 30, 2015 through November 8, 2019 is for the Equinox Aspect Core Diversified Strategy Fund, which was reorganized into the AXS Aspect Core Diversified Strategy Fund as of the close of business on November 8, 2019. See Note 1 in the accompanying Notes to Consolidated Financial Statements. |
| 1 | Based on average shares outstanding for the period. |
| 2 | Total returns would have been higher/lower had expenses not been recovered/waived and absorbed by the Advisor. Returns shown include Rule 12b-1 fees of up to 0.25% and do not reflect the deduction of taxes that a shareholder would pay on Fund distributions or the redemption of Fund shares. Returns shown do not include payment of sales load of 5.75% of offering price which will not apply on sales of $1 million or more. If the sales charge was included total returns would be lower. |
| 3 | If expenses not included in the expense cap had been excluded, the expense ratios would have been lower by 0.02% for the year ended September 30, 2020. |
See accompanying Notes to Consolidated Financial Statements.
AXS Aspect Core Diversified Strategy Fund
CONSOLIDATED FINANCIAL HIGHLIGHTS
Class I*
Per share operating performance.
For a capital share outstanding throughout each period.
| | | For the Year Ended September 30, | |
| | | 2020 | | | 2019 | | | 2018 | | | 2017 | | | 2016 | |
| Net asset value, beginning of period | | $ | 9.45 | | | $ | 9.20 | | | $ | 9.27 | | | $ | 9.99 | | | $ | 10.72 | |
| Income from Investment Operations: | | | | | | | | | | | | | | | | | | | | |
| Net investment income (loss)1 | | | 0.02 | | | | 0.07 | | | | (0.03 | ) | | | (0.09 | ) | | | (0.12 | ) |
| Net realized and unrealized gain (loss) | | | (0.35 | ) | | | 0.18 | | | | (0.04 | ) | | | (0.51 | ) | | | (0.04 | ) |
| Total from investment operations | | | (0.33 | ) | | | 0.25 | | | | (0.07 | ) | | | (0.60 | ) | | | (0.16 | ) |
| | | | | | | | | | | | | | | | | | | | | |
| Less Distributions: | | | | | | | | | | | | | | | | | | | | |
| From net investment income | | | (0.75 | ) | | | - | | | | - | | | | (0.12 | ) | | | (0.14 | ) |
| From net realized gain | | | - | | | | - | | | | - | | | | - | | | | (0.43 | ) |
| From return of capital | | | (0.32 | ) | | | - | | | | - | | | | - | | | | - | |
| Total distributions | | | (1.07 | ) | | | - | | | | - | | | | (0.12 | ) | | | (0.57 | ) |
| | | | | | | | | | | | | | | | | | | | | |
| Net asset value, end of period | | $ | 8.05 | | | $ | 9.45 | | | $ | 9.20 | | | $ | 9.27 | | | $ | 9.99 | |
| | | | | | | | | | | | | | | | | | | | | |
| Total return2 | | | (3.62 | )% | | | 2.72 | % | | | (0.76 | )% | | | (6.05 | )% | | | (1.54 | )% |
| | | | | | | | | | | | | | | | | | | | | |
| Ratios and Supplemental Data: | | | | | | | | | | | | | | | | | | | | |
| Net assets, end of period (in thousands) | | $ | 19,638 | | | $ | 19,317 | | | $ | 33,838 | | | $ | 31,991 | | | $ | 33,464 | |
| | | | | | | | | | | | | | | | | | | | | |
| Ratio of expenses to average net assets: | | | | | | | | | | | | | | | | | | | | |
| Before fees waived and expenses absorbed | | | 2.36 | %3 | | | 2.10 | % | | | 1.89 | % | | | 2.18 | % | | | 2.06 | % |
| After fees waived and expenses absorbed | | | 1.47 | %3 | | | 1.45 | % | | | 1.45 | % | | | 1.45 | % | | | 1.45 | % |
| Ratio of net investment income (loss) to average net assets: | | | | | | | | | | | | | | | | | | | | |
| Before fees waived and expenses absorbed | | | (0.62 | )% | | | 0.19 | % | | | (0.77 | )% | | | (1.69 | )% | | | (1.81 | )% |
| After fees waived and expenses absorbed | | | 0.27 | % | | | 0.84 | % | | | (0.33 | )% | | | (0.96 | )% | | | (1.20 | )% |
| | | | | | | | | | | | | | | | | | | | | |
| Portfolio turnover rate | | | 0 | % | | | 59 | % | | | 20 | % | | | 0 | % | | | 0 | % |
| * | Financial information from September 30, 2015 through November 8, 2019 is for the Equinox Aspect Core Diversified Strategy Fund, which was reorganized into the AXS Aspect Core Diversified Strategy Fund as of the close of business on November 8, 2019. See Note 1 in the accompanying Notes to Consolidated Financial Statements. |
| 1 | Based on average shares outstanding for the period. |
| 2 | Total returns would have been higher/lower had expenses not been recovered/waived and absorbed by the Advisor. Returns shown do not reflect the deduction of taxes that a shareholder would pay on Fund distributions or the redemption of Fund shares. |
| 3 | If expenses not included in the expense cap had been excluded, the expense ratios would have been lower by 0.02% for the year ended September 30, 2020. |
See accompanying Notes to Consolidated Financial Statements.
AXS Chesapeake Strategy Fund
CONSOLIDATED FINANCIAL HIGHLIGHTS
Class A*
Per share operating performance.
For a capital share outstanding throughout each period.
| | | For the Year Ended September 30, | |
| | | 2020 | | | 2019 | | | 2018 | | | 2017 | | | 2016 | |
| Net asset value, beginning of period | | $ | 11.26 | | | $ | 12.54 | | | $ | 11.77 | | | $ | 11.90 | | | $ | 11.88 | |
| Income from Investment Operations: | | | | | | | | | | | | | | | | | | | | |
| Net investment income (loss)1 | | | (0.02 | ) | | | 0.03 | | | | (0.11 | ) | | | (0.10 | ) | | | (0.11 | ) |
| Net realized and unrealized gain (loss) | | | (1.45 | ) | | | (1.21 | ) | | | 0.88 | | | | (0.03 | ) | | | 0.13 | |
| Total from investment operations | | | (1.47 | ) | | | (1.18 | ) | | | 0.77 | | | | (0.13 | ) | | | 0.02 | |
| | | | | | | | | | | | | | | | | | | | | |
| Less Distributions: | | | | | | | | | | | | | | | | | | | | |
| From net investment income | | | (0.37 | ) | | | (0.05 | ) | | | - | | | | - | | | | - | |
| From net realized gain | | | - | | | | (0.05 | ) | | | - | | | | - | | | | - | |
| Total distributions | | | (0.37 | ) | | | (0.10 | ) | | | - | | | | - | | | | - | |
| | | | | | | | | | | | | | | | | | | | | |
| Net increase from payment by affiliates (Note 3) | | | - | 2 | | | - | | | | - | | | | - | | | | - | |
| | | | | | | | | | | | | | | | | | | | | |
| Net asset value, end of period | | $ | 9.42 | | | $ | 11.26 | | | $ | 12.54 | | | $ | 11.77 | | | $ | 11.90 | |
| | | | | | | | | | | | | | | | | | | | | |
| Total return3 | | | (13.31 | )% | | | (9.40 | )% | | | 6.54 | % | | | (1.09 | )% | | | 0.17 | % |
| | | | | | | | | | | | | | | | | | | | | |
| Ratios and Supplemental Data: | | | | | | | | | | | | | | | | | | | | |
| Net assets, end of period (in thousands) | | $ | 3,376 | | | $ | 5,048 | | | $ | 5,799 | | | $ | 1,181 | | | $ | 3,678 | |
| | | | | | | | | | | | | | | | | | | | | |
| Ratio of expenses to average net assets: | | | | | | | | | | | | | | | | | | | | |
| Before fees waived and expenses absorbed4 | | | 2.35 | % | | | 2.24 | % | | | 2.04 | % | | | 1.86 | % | | | 1.43 | % |
| After fees waived and expenses absorbed4 | | | 2.12 | % | | | 2.10 | % | | | 2.10 | % | | | 1.42 | % | | | 1.36 | % |
| Ratio of net investment income (loss) to average net assets: | | | | | | | | | | | | | | | | | | | | |
| Before fees waived and expenses absorbed | | | (0.44 | )% | | | 0.11 | % | | | (0.84 | )% | | | (1.32 | )% | | | (1.03 | )% |
| After fees waived and expenses absorbed | | | (0.21 | )% | | | 0.25 | % | | | (0.90 | )% | | | (0.88 | )% | | | (0.96 | )% |
| | | | | | | | | | | | | | | | | | | | | |
| Portfolio turnover rate | | | 0 | % | | | 36 | % | | | 13 | % | | | 0 | % | | | 0 | % |
| * | Financial information from September 30, 2015 through November 8, 2019 is for the Equinox Chesapeake Strategy Fund, which was reorganized into the AXS Chesapeake Strategy Fund as of the close of business on November 8, 2019. See Note 1 in the accompanying Notes to Consolidated Financial Statements. |
| 1 | Based on average shares outstanding for the period. |
| 2 | Amount represents less than $0.005 per share. |
| 3 | Total returns would have been higher/lower had expenses not been recovered/waived and absorbed by the Advisor. Returns shown include Rule 12b-1 fees of up to 0.25% and do not reflect the deduction of taxes that a shareholder would pay on Fund distributions or the redemption of Fund shares. Returns shown do not include payment of sales load of 5.75% of offering price which will not apply on sales of $1 million or more. If the sales charge was included total returns would be lower. |
| 4 | If reorganizational costs and interest expense had been excluded, the expense ratios would have been lowered by 0.02%, 0%, 0%, 0% and 0.01% for the years ended September 30, 2020, 2019, 2018, 2017 and 2016, respectively. |
See accompanying Notes to Consolidated Financial Statements.
AXS Chesapeake Strategy Fund
CONSOLIDATED FINANCIAL HIGHLIGHTS
Class C*
Per share operating performance.
For a capital share outstanding throughout each period.
| | | For the Year Ended September 30, | |
| | | 2020 | | | 2019 | | | 2018 | | | 2017 | | | 2016 | |
| Net asset value, beginning of period | | $ | 10.98 | | | $ | 12.26 | | | $ | 11.59 | | | $ | 11.81 | | | $ | 11.87 | |
| Income from Investment Operations: | | | | | | | | | | | | | | | | | | | | |
| Net investment loss1 | | | (0.10 | ) | | | (0.05 | ) | | | (0.20 | ) | | | (0.19 | ) | | | (0.20 | ) |
| Net realized and unrealized gain (loss) | | | (1.41 | ) | | | (1.18 | ) | | | 0.87 | | | | (0.03 | ) | | | 0.14 | |
| Total from investment operations | | | (1.51 | ) | | | (1.23 | ) | | | 0.67 | | | | (0.22 | ) | | | (0.06 | ) |
| | | | | | | | | | | | | | | | | | | | | |
| Less Distributions: | | | | | | | | | | | | | | | | | | | | |
| From net investment income | | | (0.26 | ) | | | - | | | | - | | | | - | | | | - | |
| From net realized gain | | | - | | | | (0.05 | ) | | | - | | | | - | | | | - | |
| Total distributions | | | (0.26 | ) | | | (0.05 | ) | | | - | | | | - | | | | - | |
| | | | | | | | | | | | | | | | | | | | | |
| Net increase from payment by affiliates (Note 3) | | | - | 2 | | | - | | | | - | | | | - | | | | - | |
| | | | | | | | | | | | | | | | | | | | | |
| Net asset value, end of period | | $ | 9.21 | | | $ | 10.98 | | | $ | 12.26 | | | $ | 11.59 | | | $ | 11.81 | |
| | | | | | | | | | | | | | | | | | | | | |
| Total return3 | | | (13.96 | )% | | | (10.04 | )% | | | 5.78 | % | | | (1.86 | )% | | | (0.51 | )% |
| | | | | | | | | | | | | | | | | | | | | |
| Ratios and Supplemental Data: | | | | | | | | | | | | | | | | | | | | |
| Net assets, end of period (in thousands) | | $ | 309 | | | $ | 592 | | | $ | 931 | | | $ | 514 | | | $ | 359 | |
| | | | | | | | | | | | | | | | | | | | | |
| Ratio of expenses to average net assets: | | | | | | | | | | | | | | | | | | | | |
| Before fees waived and expenses absorbed4 | | | 3.10 | % | | | 2.99 | % | | | 2.81 | % | | | 2.90 | % | | | 2.16 | % |
| After fees waived and expenses absorbed4 | | | 2.87 | % | | | 2.85 | % | | | 2.85 | % | | | 2.24 | % | | | 2.11 | % |
| Ratio of net investment loss to average net assets: | | | | | | | | | | | | | | | | | | | | |
| Before fees waived and expenses absorbed | | | (1.19 | )% | | | (0.63 | )% | | | (1.61 | )% | | | (2.34 | )% | | | (1.75 | )% |
| After fees waived and expenses absorbed | | | (0.96 | )% | | | (0.49 | )% | | | (1.65 | )% | | | (1.68 | )% | | | (1.70 | )% |
| | | | | | | | | | | | | | | | | | | | | |
| Portfolio turnover rate | | | 0 | % | | | 36 | % | | | 13 | % | | | 0 | % | | | 0 | % |
| * | Financial information from September 30, 2015 through November 8, 2019 is for the Equinox Chesapeake Strategy Fund, which was reorganized into the AXS Chesapeake Strategy Fund as of the close of business on November 8, 2019. See Note 1 in the accompanying Notes to Consolidated Financial Statements. |
| 1 | Based on average shares outstanding for the period. |
| 2 | Amount represents less than $0.005 per share. |
| 3 | Total returns would have been higher/lower had expenses not been recovered/waived and absorbed by the Advisor. Returns shown do not reflect the deduction of taxes that a shareholder would pay on Fund distributions or the redemption of Fund shares. |
| 4 | If reorganizational costs and interest expense had been excluded, the expense ratios would have been lowered by 0.02%, 0%, 0%, 0% and 0.01% for the years ended September 30, 2020, 2019, 2018, 2017 and 2016, respectively. |
See accompanying Notes to Consolidated Financial Statements.
AXS Chesapeake Strategy Fund
CONSOLIDATED FINANCIAL HIGHLIGHTS
Class I*
Per share operating performance.
For a capital share outstanding throughout each period.
| | | For the Year Ended September 30, | |
| | | 2020 | | | 2019 | | | 2018 | | | 2017 | | | 2016 | |
| Net asset value, beginning of period | | $ | 11.35 | | | $ | 12.65 | | | $ | 11.83 | | | $ | 11.93 | | | $ | 11.88 | |
| Income from Investment Operations: | | | | | | | | | | | | | | | | | | | | |
| Net investment income (loss)1 | | | - | 2 | | | 0.05 | | | | (0.08 | ) | | | (0.08 | ) | | | (0.09 | ) |
| Net realized and unrealized gain (loss) | | | (1.45 | ) | | | (1.22 | ) | | | 0.90 | | | | (0.02 | ) | | | 0.14 | |
| Total from investment operations | | | (1.45 | ) | | | (1.17 | ) | | | 0.82 | | | | (0.10 | ) | | | 0.05 | |
| | | | | | | | | | | | | | | | | | | | | |
| Less Distributions: | | | | | | | | | | | | | | | | | | | | |
| From net investment income | | | (0.40 | ) | | | (0.08 | ) | | | - | | | | - | | | | - | |
| From net realized gain | | | - | | | | (0.05 | ) | | | - | | | | - | | | | - | |
| Total distributions | | | (0.40 | ) | | | (0.13 | ) | | | - | | | | - | | | | - | |
| | | | | | | | | | | | | | | | | | | | | |
| Net increase from payment by affiliates (Note 3) | | | - | 2 | | | - | | | | - | | | | - | | | | - | |
| | | | | | | | | | | | | | | | | | | | | |
| Net asset value, end of period | | $ | 9.50 | | | $ | 11.35 | | | $ | 12.65 | | | $ | 11.83 | | | $ | 11.93 | |
| | | | | | | | | | | | | | | | | | | | | |
| Total return3 | | | (13.07 | )% | | | (9.23 | )% | | | 6.93 | % | | | (0.84 | )% | | | 0.42 | % |
| | | | | | | | | | | | | | | | | | | | | |
| Ratios and Supplemental Data: | | | | | | | | | | | | | | | | | | | | |
| Net assets, end of period (in thousands) | | $ | 11,955 | | | $ | 90,105 | | | $ | 158,876 | | | $ | 51,427 | | | $ | 58,438 | |
| | | | | | | | | | | | | | | | | | | | | |
| Ratio of expenses to average net assets: | | | | | | | | | | | | | | | | | | | | |
| Before fees waived and expenses absorbed4 | | | 2.10 | % | | | 1.98 | % | | | 1.81 | % | | | 1.87 | % | | | 1.18 | % |
| After fees waived and expenses absorbed4 | | | 1.87 | % | | | 1.85 | % | | | 1.85 | % | | | 1.24 | % | | | 1.11 | % |
| Ratio of net investment income (loss) to average net assets: | | | | | | | | | | | | | | | | | | | | |
| Before fees waived and expenses absorbed | | | (0.19 | )% | | | 0.36 | % | | | (0.56 | )% | | | (1.31 | )% | | | (0.81 | )% |
| After fees waived and expenses absorbed | | | 0.04 | % | | | 0.49 | % | | | (0.60 | )% | | | (0.68 | )% | | | (0.74 | )% |
| | | | | | | | | | | | | | | | | | | | | |
| Portfolio turnover rate | | | 0 | % | | | 36 | % | | | 13 | % | | | 0 | % | | | 0 | % |
| * | Financial information from September 30, 2015 through November 8, 2019 is for the Equinox Chesapeake Strategy Fund, which was reorganized into the AXS Chesapeake Strategy Fund as of the close of business on November 8, 2019. See Note 1 in the accompanying Notes to Consolidated Financial Statements. |
| 1 | Based on average shares outstanding for the period. |
| 2 | Amount represents less than $0.005 per share. |
| 3 | Total returns would have been higher/lower had expenses not been recovered/waived and absorbed by the Advisor. Returns shown do not reflect the deduction of taxes that a shareholder would pay on Fund distributions or the redemption of Fund shares. |
| 4 | If reorganizational costs and interest expense had been excluded, the expense ratios would have been lowered by 0.02%, 0%, 0%, 0% and 0.01% for the years ended September 30, 2020, 2019, 2018, 2017 and 2016, respectively. |
See accompanying Notes to Consolidated Financial Statements.
AXS Managed Futures Strategy Fund
CONSOLIDATED FINANCIAL HIGHLIGHTS
Class A*
Per share operating performance.
For a capital share outstanding throughout each period.
| | | For the Year Ended September 30, | |
| | | 2020 | | | 2019 | | | 2018 | | | 2017 | | | 2016 | |
| Net asset value, beginning of period | | $ | 9.24 | | | $ | 8.08 | | | $ | 8.05 | | | $ | 8.82 | | | $ | 9.57 | |
| Income from Investment Operations: | | | | | | | | | | | | | | | | | | | | |
| Net investment income (loss)1 | | | (0.04 | ) | | | 0.02 | | | | (0.08 | ) | | | (0.12 | ) | | | (0.07 | ) |
| Net realized and unrealized gain (loss) | | | (2.05 | ) | | | 1.14 | | | | 0.11 | | | | (0.36 | ) | | | 0.44 | |
| Total from investment operations | | | (2.09 | ) | | | 1.16 | | | | 0.03 | | | | (0.48 | ) | | | 0.37 | |
| | | | | | | | | | | | | | | | | | | | | |
| Less Distributions: | | | | | | | | | | | | | | | | | | | | |
| From net investment income | | | (1.02 | ) | | | - | | | | - | | | | (0.11 | ) | | | (1.11 | ) |
| From net realized gain | | | - | | | | - | | | | - | | | | (0.04 | ) | | | (0.01 | ) |
| From return of capital | | | (0.06 | ) | | | - | | | | - | | | | (0.14 | ) | | | - | |
| Total distributions | | | (1.08 | ) | | | - | | | | - | | | | (0.29 | ) | | | (1.12 | ) |
| | | | | | | | | | | | | | | | | | | | | |
| Redemption fee proceeds1 | | | - | 2 | | | - | 2 | | | - | 2 | | | - | 2 | | | - | 2 |
| | | | | | | | | | | | | | | | | | | | | |
| Net asset value, end of period | | $ | 6.07 | | | $ | 9.24 | | | $ | 8.08 | | | $ | 8.05 | | | $ | 8.82 | |
| | | | | | | | | | | | | | | | | | | | | |
| Total return3 | | | (25.22 | )% | | | 14.36 | % | | | 0.37 | % | | | (5.67 | )% | | | 4.48 | % |
| | | | | | | | | | | | | | | | | | | | | |
| Ratios and Supplemental Data: | | | | | | | | | | | | | | | | | | | | |
| Net assets, end of period (in thousands) | | $ | 13,632 | | | $ | 33,150 | | | $ | 31,434 | | | $ | 72,169 | | | $ | 116,245 | |
| | | | | | | | | | | | | | | | | | | | | |
| Ratio of expenses to average net assets: | | | | | | | | | | | | | | | | | | | | |
| Before fees waived and expenses absorbed | | | 2.02 | % | | | 1.91 | % | | | 1.93 | % | | | 1.97 | % | | | 2.00 | % |
| After fees waived and expenses absorbed | | | 1.94 | % | | | 1.94 | % | | | 1.95 | % | | | 1.95 | % | | | 1.88 | % |
| Ratio of net investment income (loss) to average net assets: | | | | | | | | | | | | | | | | | | | | |
| Before fees waived and expenses absorbed | | | (0.62 | )% | | | 0.24 | % | | | (0.99 | )% | | | (1.48 | )% | | | (0.93 | )% |
| After fees waived and expenses absorbed | | | (0.54 | )% | | | 0.21 | % | | | (1.01 | )% | | | (1.46 | )% | | | (0.81 | )% |
| | | | | | | | | | | | | | | | | | | | | |
| Portfolio turnover rate | | | 15 | % | | | 11 | % | | | 75 | % | | | 78 | % | | | 20 | % |
| * | Financial information from September 30, 2015 through January 24, 2020 is for the Equinox MutualHedge Futures Strategy Fund, which was reorganized into the AXS Managed Futures Strategy Fund as of the close of business on January 24, 2020. See Note 1 in the accompanying Notes to Consolidated Financial Statements. |
| 1 | Based on average shares outstanding for the period. |
| 2 | Amount represents less than $0.005 per share. |
| 3 | Total returns would have been higher/lower had expenses not been recovered/waived and absorbed by the Advisor. Returns shown include Rule 12b-1 fees of up to 0.25% and do not reflect the deduction of taxes that a shareholder would pay on Fund distributions or the redemption of Fund shares. Returns shown do not include payment of sales load of 5.75% of offering price which will not apply on sales of $1 million or more. If the sales charge was included total returns would be lower. |
See accompanying Notes to Consolidated Financial Statements.
AXS Managed Futures Strategy Fund
CONSOLIDATED FINANCIAL HIGHLIGHTS
Class C*
Per share operating performance.
For a capital share outstanding throughout each period.
| | | For the Year Ended September 30, | |
| | | 2020 | | | 2019 | | | 2018 | | | 2017 | | | 2016 | |
| Net asset value, beginning of period | | $ | 8.77 | | | $ | 7.72 | | | $ | 7.75 | | | $ | 8.50 | | | $ | 9.26 | |
| Income from Investment Operations: | | | | | | | | | | | | | | | | | | | | |
| Net investment loss1 | | | (0.09 | ) | | | (0.04 | ) | | | (0.13 | ) | | | (0.18 | ) | | | (0.14 | ) |
| Net realized and unrealized gain (loss) | | | (1.95 | ) | | | 1.09 | | | | 0.10 | | | | (0.35 | ) | | | 0.43 | |
| Total from investment operations | | | (2.04 | ) | | | 1.05 | | | | (0.03 | ) | | | (0.53 | ) | | | 0.29 | |
| | | | | | | | | | | | | | | | | | | | | |
| Less Distributions: | | | | | | | | | | | | | | | | | | | | |
| From net investment income | | | (0.94 | ) | | | - | | | | - | | | | (0.04 | ) | | | (1.04 | ) |
| From net realized gain | | | - | | | | - | | | | - | | | | (0.04 | ) | | | (0.01 | ) |
| From return of capital | | | (0.06 | ) | | | - | | | | - | | | | (0.14 | ) | | | - | |
| Total distributions | | | (1.00 | ) | | | - | | | | - | | | | (0.22 | ) | | | (1.05 | ) |
| | | | | | | | | | | | | | | | | | | | | |
| Redemption fee proceeds1 | | | - | 2 | | | - | 2 | | | - | 2 | | | - | 2 | | | - | 2 |
| | | | | | | | | | | | | | | | | | | | | |
| Net asset value, end of period | | $ | 5.73 | | | $ | 8.77 | | | $ | 7.72 | | | $ | 7.75 | | | $ | 8.50 | |
| | | | | | | | | | | | | | | | | | | | | |
| Total return3 | | | (25.80 | )% | | | 13.60 | % | | | (0.39 | )% | | | (6.41 | )% | | | 3.69 | % |
| | | | | | | | | | | | | | | | | | | | | |
| Ratios and Supplemental Data: | | | | | | | | | | | | | | | | | | | | |
| Net assets, end of period (in thousands) | | $ | 10,945 | | | $ | 20,892 | | | $ | 27,921 | | | $ | 32,203 | | | $ | 45,572 | |
| | | | | | | | | | | | | | | | | | | | | |
| Ratio of expenses to average net assets: | | | | | | | | | | | | | | | | | | | | |
| Before fees waived and expenses absorbed | | | 2.77 | % | | | 2.66 | % | | | 2.68 | % | | | 2.73 | % | | | 2.75 | % |
| After fees waived and expenses absorbed | | | 2.69 | % | | | 2.69 | % | | | 2.70 | % | | | 2.70 | % | | | 2.63 | % |
| Ratio of net investment loss to average net assets: | | | | | | | | | | | | | | | | | | | | |
| Before fees waived and expenses absorbed | | | (1.37 | )% | | | (0.51 | )% | | | (1.67 | )% | | | (2.24 | )% | | | (1.69 | )% |
| After fees waived and expenses absorbed | | | (1.29 | )% | | | (0.54 | )% | | | (1.69 | )% | | | (2.21 | )% | | | (1.57 | )% |
| | | | | | | | | | | | | | | | | | | | | |
| Portfolio turnover rate | | | 15 | % | | | 11 | % | | | 75 | % | | | 78 | % | | | 20 | % |
| * | Financial information from September 30, 2015 through January 24, 2020 is for the Equinox MutualHedge Futures Strategy Fund, which was reorganized into the AXS Managed Futures Strategy Fund as of the close of business on January 24, 2020. See Note 1 in the accompanying Notes to Consolidated Financial Statements. |
| 1 | Based on average shares outstanding for the period. |
| 2 | Amount represents less than $0.005 per share. |
| 3 | Total returns would have been higher/lower had expenses not been recovered/waived and absorbed by the Advisor. Returns shown include Rule 12b-1 fees of up to 1.00% and do not reflect the deduction of taxes that a shareholder would pay on Fund distributions or the redemption of Fund shares. Returns do not include payment of Contingent Deferred Sales Charge ("CDSD" of 1.00% on certain redemptions of Class C shares made within 12 months of purchase. If the Sales charge was included, total returns would be lower. |
See accompanying Notes to Consolidated Financial Statements.
AXS Managed Futures Strategy Fund
CONSOLIDATED FINANCIAL HIGHLIGHTS
Class I*
Per share operating performance.
For a capital share outstanding throughout each period.
| | | For the Year Ended September 30, | |
| | | 2020 | | | 2019 | | | 2018 | | | 2017 | | | 2016 | |
| Net asset value, beginning of period | | $ | 9.36 | | | $ | 8.16 | | | $ | 8.12 | | | $ | 8.89 | | | $ | 9.64 | |
| Income from Investment Operations: | | | | | | | | | | | | | | | | | | | | |
| Net investment income (loss)1 | | | (0.02 | ) | | | 0.04 | | | | (0.05 | ) | | | (0.10 | ) | | | (0.05 | ) |
| Net realized and unrealized gain (loss) | | | (2.08 | ) | | | 1.16 | | | | 0.09 | | | | (0.36 | ) | | | 0.45 | |
| Total from investment operations | | | (2.10 | ) | | | 1.20 | | | | 0.04 | | | | (0.46 | ) | | | 0.40 | |
| | | | | | | | | | | | | | | | | | | | | |
| Less Distributions: | | | | | | | | | | | | | | | | | | | | |
| From net investment income | | | (1.04 | ) | | | - | | | | - | | | | (0.13 | ) | | | (1.14 | ) |
| From net realized gain | | | - | | | | - | | | | - | | | | (0.04 | ) | | | (0.01 | ) |
| From return of capital | | | (0.06 | ) | | | - | | | | - | | | | (0.14 | ) | | | - | |
| Total distributions | | | (1.10 | ) | | | - | | | | - | | | | (0.31 | ) | | | (1.15 | ) |
| | | | | | | | | | | | | | | | | | | | | |
| Redemption fee proceeds1 | | | - | 2 | | | - | 2 | | | - | 2 | | | - | 2 | | | - | 2 |
| | | | | | | | | | | | | | | | | | | | | |
| Net asset value, end of period | | $ | 6.16 | | | $ | 9.36 | | | $ | 8.16 | | | $ | 8.12 | | | $ | 8.89 | |
| | | | | | | | | | | | | | | | | | | | | |
| Total return3 | | | (25.01 | )% | | | 14.71 | % | | | 0.49 | % | | | (5.37 | )% | | | 4.73 | % |
| | | | | | | | | | | | | | | | | | | | | |
| Ratios and Supplemental Data: | | | | | | | | | | | | | | | | | | | | |
| Net assets, end of period (in thousands) | | $ | 91,638 | | | $ | 200,948 | | | $ | 202,274 | | | $ | 152,690 | | | $ | 159,985 | |
| | | | | | | | | | | | | | | | | | | | | |
| Ratio of expenses to average net assets: | | | | | | | | | | | | | | | | | | | | |
| Before fees waived and expenses absorbed | | | 1.77 | % | | | 1.66 | % | | | 1.67 | % | | | 1.74 | % | | | 1.74 | % |
| After fees waived and expenses absorbed | | | 1.69 | % | | | 1.69 | % | | | 1.70 | % | | | 1.70 | % | | | 1.63 | % |
| Ratio of net investment income (loss) to average net assets: | | | | | | | | | | | | | | | | | | | | |
| Before fees waived and expenses absorbed | | | (0.37 | )% | | | 0.49 | % | | | (0.59 | )% | | | (1.26 | )% | | | (0.70 | )% |
| After fees waived and expenses absorbed | | | (0.29 | )% | | | 0.46 | % | | | (0.62 | )% | | | (1.22 | )% | | | (0.59 | )% |
| | | | | | | | | | | | | | | | | | | | | |
| Portfolio turnover rate | | | 15 | % | | | 11 | % | | | 75 | % | | | 78 | % | | | 20 | % |
| * | Financial information from September 30, 2015 through January 24, 2020 is for the Equinox MutualHedge Futures Strategy Fund, which was reorganized into the AXS Managed Futures Strategy Fund as of the close of business on January 24, 2020. See Note 1 in the accompanying Notes to Consolidated Financial Statements. |
| 1 | Based on average shares outstanding for the period. |
| 2 | Amount represents less than $0.005 per share. |
| 3 | Total returns would have been higher/lower had expenses not been recovered/waived and absorbed by the Advisor. Returns shown do not reflect the deduction of taxes that a shareholder would pay on Fund distributions or the redemption of Fund shares. |
See accompanying Notes to Consolidated Financial Statements.
AXS Multi-Strategy Alternatives Fund
FINANCIAL HIGHLIGHTS
Class R-1*
Per share operating performance.
For a capital share outstanding throughout each period.
| | | For the Period May 1, 2020 through | | | For the Year Ended April 30, | |
| | | September 30, 2020** | | | 2020 | | | 2019 | | | 2018 | | | 2017 | | | 2016 | |
| Net asset value, beginning of period | | $ | 9.95 | | | $ | 11.49 | | | $ | 13.28 | | | $ | 12.80 | | | $ | 11.56 | | | $ | 12.57 | |
| Income from Investment Operations: | | | | | | | | | | | | | | | | | | | | | | | | |
| Net investment income (loss)1 | | | (0.03 | ) | | | (0.03 | ) | | | - | 2 | | | 0.03 | | | | 0.04 | | | | (0.04 | ) |
| Net realized and unrealized gain (loss) | | | 1.20 | | | | (1.41 | ) | | | 0.61 | | | | 2.15 | | | | 1.64 | | | | (0.90 | ) |
| Total from investment operations | | | 1.17 | | | | (1.44 | ) | | | 0.61 | | | | 2.18 | | | | 1.68 | | | | (0.94 | ) |
| | | | | | | | | | | | | | | | | | | | | | | | | |
| Less Distributions: | | | | | | | | | | | | | | | | | | | | | | | | |
| From net investment income | | | - | | | | - | | | | - | | | | (0.05 | ) | | | - | | | | (0.02 | ) |
| From net realized gain | | | - | | | | (0.10 | ) | | | (2.40 | ) | | | (1.65 | ) | | | (0.44 | ) | | | (0.05 | ) |
| Total distributions | | | - | | | | (0.10 | ) | | | (2.40 | ) | | | (1.70 | ) | | | (0.44 | ) | | | (0.07 | ) |
| | | | | | | | | | | | | | | | | | | | | | | | | |
| Net asset value, end of period | | $ | 11.12 | | | $ | 9.95 | | | $ | 11.49 | | | $ | 13.28 | | | $ | 12.80 | | | $ | 11.56 | |
| | | | | | | | | | | | | | | | | | | | | | | | | |
| Total return3 | | | 11.76 | %5 | | | (12.66 | )%4 | | | 5.34 | % | | | 17.25 | % | | | 14.70 | % | | | (7.50 | )% |
| | | | | | | | | | | | | | | | | | | | | | | | | |
| Ratios and Supplemental Data: | | | | | | | | | | | | | | | | | | | | | | | | |
| Net assets, end of period (in thousands) | | $ | 12,941 | | | $ | 14,586 | | | $ | 97,281 | | | $ | 84,790 | | | $ | 81,999 | | | $ | 83,291 | |
| | | | | | | | | | | | | | | | | | | | | | | | | |
| Ratio of expenses to average net assets | | | 1.66 | %6 | | | 1.58 | % | | | 1.68 | % | | | 1.64 | % | | | 1.62 | % | | | 1.55 | % |
| Ratio of net investment income (loss) to average net assets | | | (0.75 | )%6 | | | (0.30 | )% | | | (0.02 | )% | | | 0.24 | % | | | 0.31 | % | | | (0.30 | )% |
| | | | | | | | | | | | | | | | | | | | | | | | | |
| Portfolio turnover rate | | | 193 | %5 | | | 727 | % | | | 838 | % | | | 534 | % | | | 318 | % | | | 437 | % |
| * | Financial information from April 30, 2015 through October 18, 2019 is for the KCM Macro Trends Fund, which was reorganized into the AXS Multi-Strategy Alternatives Fund as of the close of business on October 18, 2019. See Note 1 in the accompanying Notes to Consolidated Financial Statements. |
| ** | Fiscal year end changed to September 30, effective May 1, 2020. |
| 1 | Based on average daily shares outstanding for the period. |
| 2 | Amount represents less than $0.005 per share. |
| 3 | Total returns are historic in nature and assume the reinvestment of all dividends and capital gain distributions if any. |
| 4 | A predecessor affiliate reimbursed the Fund $43,948 for losses on pricing error. The payment had a positive 0.09% impact to the total return. |
See accompanying Notes to Consolidated Financial Statements.
AXS Multi-Strategy Alternatives Fund
FINANCIAL HIGHLIGHTS
Class I*
Per share operating performance.
For a capital share outstanding throughout each period.
| | | For the Period May 1, 2020 through September 30, | | | For the Year Ended April 30, | | | For the Period March 20, 2017** through April 30, | |
| | | 2020*** | | | 2020 | | | 2019 | | | 2018 | | | 2017 | |
| Net asset value, beginning of period | | $ | 9.97 | | | $ | 11.53 | | | $ | 13.28 | | | $ | 12.80 | | | $ | 12.77 | |
| Income from Investment Operations: | | | | | | | | | | | | | | | | | | | | |
| Net investment income (loss)1 | | | (0.02 | ) | | | - | 2 | | | 0.02 | | | | 0.04 | | | | - | 2 |
| Net realized and unrealized gain (loss) | | | 1.21 | | | | (1.41 | ) | | | 0.63 | | | | 2.18 | | | | 0.03 | |
| Total from investment operations | | | 1.19 | | | | (1.41 | ) | | | 0.65 | | | | 2.22 | | | | 0.03 | |
| | | | | | | | | | | | | | | | | | | | | |
| Less Distributions: | | | | | | | | | | | | | | | | | | | | |
| From net investment income | | | - | | | | (0.05 | ) | | | - | | | | (0.09 | ) | | | - | |
| From net realized gain | | | - | | | | (0.10 | ) | | | (2.40 | ) | | | (1.65 | ) | | | - | |
| Total distributions | | | - | | | | (0.15 | ) | | | (2.40 | ) | | | (1.74 | ) | | | - | |
| | | | | | | | | | | | | | | | | | | | | |
| Net asset value, end of period | | $ | 11.16 | | | $ | 9.97 | | | $ | 11.53 | | | $ | 13.28 | | | $ | 12.80 | |
| | | | | | | | | | | | | | | | | | | | | |
| Total return3 | | | 11.94 | %4 | | | (12.43 | )%7 | | | 5.65 | % | | | 17.49 | % | | | 0.23 | %4 |
| | | | | | | | | | | | | | | | | | | | | |
| Ratios and Supplemental Data: | | | | | | | | | | | | | | | | | | | | |
| Net assets, end of period6 | | $ | 49,924,822 | | | $ | 43,876,547 | | | $ | 467,278 | | | $ | 563,187 | | | $ | 15 | |
| | | | | | | | | | | | | | | | | | | | | |
| Ratio of expenses to average net assets | | | 1.41 | %5 | | | 1.31 | % | | | 1.51 | % | | | 1.63 | % | | | 1.37 | %5 |
| Ratio of net investment income (loss) to average net assets | | | (0.50 | )%5 | | | (0.03 | )% | | | 0.18 | % | | | 0.31 | % | | | 0.00 | %5 |
| | | | | | | | | | | | | | | | | | | | | |
| Portfolio turnover rate | | | 193 | %4 | | | 727 | % | | | 838 | % | | | 534 | % | | | 318 | %4 |
| * | Financial information from March 20, 2017 through October 18, 2019 is for the KCM Macro Trends Fund, which was reorganized into the AXS Multi-Strategy Alternatives Fund as of the close of business on October 18, 2019. On October 21, 2019, Institutional Class shares were re-designated into Class I Shares. See Note 1 in the accompanying Notes to Consolidated Financial Statements. |
| ** | Commencement of operations. |
| *** | Fiscal year end changed to September 30, effective May 1, 2020. |
| 1 | Based on average daily shares outstanding for the period. |
| 2 | Amount represents less than $0.005 per share. |
| 3 | Total returns are historic in nature and assume the reinvestment of all dividends and capital gain distributions if any. |
| 6 | Amount is actual; not presented in thousands. |
| 7 | Payment by a predecessor affiliate had no impact to the total return (Note 3). |
See accompanying Notes to Consolidated Financial Statements.
AXS Funds
NOTES TO CONSOLIDATED FINANCIAL STATEMENTS
September 30, 2020
Note 1 – Organization
AXS Alternative Growth Fund (the ‘‘Alternative Growth Fund’’), AXS Aspect Core Diversified Strategy Fund (the “Aspect Core Diversified Strategy Fund”), AXS Chesapeake Strategy Fund (the “Chesapeake Strategy Fund”), AXS Managed Futures Strategy Fund (the “Managed Futures Strategy Fund”) and AXS Multi-Strategy Alternatives Fund (the “Multi-Strategy Alternatives Fund”) (each a “Fund” and collectively the ‘‘Funds’’) are organized as a diversified series of Investment Managers Series Trust II, a Delaware statutory trust (the “Trust”) which is registered as an open-end management investment company under the Investment Company Act of 1940, as amended (the “1940 Act”).
The Alternative Growth Fund’s investment objective is to seek to achieve returns and volatility comparable to the S&P 500® Total Return Index, while seeking to avoid the full impact of downside risk. Effective July 1, 2020, the Alternative Growth Fund changed fiscal year end from June 30th to September 30th.
The Alternative Growth Fund commenced investment operations on November 11, 2019 with Class A shares and Class I shares. Prior to that date, the Alternative Growth Fund acquired the assets and assumed the liabilities of the Equinox Ampersand Strategy Fund (the "Alternative Growth Predecessor Fund"), a series of Equinox Funds Trust, which offered two classes of shares, Class A shares and Class I shares, in a tax-free reorganization as set out in the Agreement and Plan of Reorganization. The proposed Plan of Reorganization was approved by the Trust’s Board on June 14, 2019, by the Board of Equinox Funds Trust on July 1, 2019, and by beneficial owners of the Alternative Growth Predecessor Fund on October 17, 2019. The tax-free reorganization was accomplished on November 8, 2019. As a result of the reorganization, the Alternative Growth Fund assumed the performance and accounting history of the Alternative Growth Predecessor Fund. Financial information included for the dates prior to the reorganization is that of the Alternative Growth Predecessor Fund.
The reorganization was accomplished by the following tax-free exchange in which each shareholder of the Alternative Growth Predecessor Fund received the same aggregate share net asset value in the corresponding classes as noted below:
| | | Shares Issued | | | Net Assets | |
| Class A | | | 146,943 | | | $ | 1,754,296 | |
| Class I | | | 1,488,202 | | | $ | 18,014,396 | |
The net unrealized appreciation of investments transferred was $653,641 as of the date of the acquisition.
The Aspect Core Diversified Strategy Fund’s investment objective is to achieve long term capital appreciation.
The Aspect Core Diversified Strategy Fund commenced investment operations on November 11, 2019 with Class A shares, Class C Shares and Class I shares. Prior to that date, the Aspect Core Diversified Strategy Fund acquired the assets and assumed the liabilities of the Equinox Aspect Core Diversified Strategy Fund (the “Aspect Core Diversified Strategy Predecessor Fund”), a series of Equinox Funds Trust, which offered three class of shares, Class A, Class C, and Class I shares. On October 15, 2019, beneficial owners of the Aspect Core Diversified Strategy Predecessor Fund approved a proposed Agreement and Plan of Reorganization that provided for the reorganization into the AXS Aspect Core Diversified Strategy Fund. The Plan of Reorganization was approved by the Trust’s Board on June 14, 2019 and by the Equinox Funds Trust Board on July 1, 2019. The tax-free reorganization was accomplished on November 8, 2019. As a result of the reorganization, the Aspect Core Diversified Strategy Fund assumed the performance and accounting history of the Aspect Core Diversified Strategy Predecessor Fund. Financial information included for the dates prior to the reorganization is that of the Aspect Core Diversified Strategy Predecessor Fund Predecessor Fund.
AXS Funds
NOTES TO CONSOLIDATED FINANCIAL STATEMENTS - Continued
September 30, 2020
The reorganization was accomplished by the following tax-free exchange in which each shareholder of the Aspect Core Diversified Strategy Predecessor Fund received the same aggregate share net asset value in the corresponding classes as noted below:
| | | Shares Issued | | | Net Assets | |
| Class A | | | 78,751 | | | $ | 722,915 | |
| Class C | | | 365,100 | | | $ | 3,238,610 | |
| Class I | | | 2,041,750 | | | $ | 18,804,907 | |
The net unrealized appreciation of investments transferred was $27,284 as of the date of the acquisition.
The Chesapeake Strategy Fund’s investment objective is to achieve long-term capital appreciation.
The Chesapeake Strategy Fund commenced investment operations on November 11, 2019 with Class A shares, Class C Shares and Class I shares. Prior to that date, the Chesapeake Strategy Fund acquired the assets and assumed the liabilities of the Equinox Chesapeake Strategy Fund (the “Chesapeake Strategy Predecessor Fund”), a series of Equinox Funds Trust, which offered three class of shares, Class A, Class C, and Class I shares. On November 6, 2019, beneficial owners of the Chesapeake Strategy Predecessor Fund approved a proposed Agreement and Plan of Reorganization that provided for the reorganization into the AXS Chesapeake Strategy Fund. The Plan of Reorganization was approved by the Trust’s Board on June 14, 2019 and by the Equinox Funds Trust Board on July 1, 2019. The tax-free reorganization was accomplished on November 8, 2019. As a result of the reorganization, the Chesapeake Strategy Fund assumed the performance and accounting history of the Chesapeake Strategy Predecessor Fund. Financial information included for the dates prior to the reorganization is that of the Chesapeake Strategy Predecessor Fund.
The reorganization was accomplished by the following tax-free exchange in which each shareholder of the Chesapeake Strategy Predecessor Fund received the same aggregate share net asset value in the corresponding classes as noted below:
| | | Shares Issued | | | Net Assets | |
| Class A | | | 455,380 | | | $ | 4,835,786 | |
| Class C | | | 52,298 | | | $ | 541,044 | |
| Class I | | | 7,369,196 | | | $ | 78,929,398 | |
The net unrealized depreciation of investments transferred was $2,540,824 as of the date of the acquisition.
The Managed Futures Strategy Fund’s investment objective is to seek capital appreciation in both rising and falling (bull and bear) equity markets with an annualized level of volatility that is generally lower than the historic level of volatility experienced by the S&P 500 Index.
The Managed Futures Strategy Fund commenced investment operations on January 27, 2020 with Class A shares, Class C shares, and Class I shares. Prior to that date, the Managed Futures Strategy Fund acquired the assets and assumed the liabilities of the Equinox MutualHedge Futures Strategy Fund (the "Managed Futures Strategy Predecessor Fund"), a series of Northern Lights Fund Trust, which offered three classes of shares, Class A shares, Class C shares, and Class I shares, in a tax-free reorganization as set out in the Agreement and Plan of Reorganization. The proposed Plan of Reorganization was approved by the Trust’s Board on June 14, 2019, by the Board of Equinox Funds Trust on June 17, 2019, and by beneficial owners of the Managed Futures Strategy Predecessor Fund on December 20, 2019. The tax-free reorganization was accomplished on January 24, 2020. As a result of the reorganization, the Managed Futures Strategy Fund assumed the performance and accounting history of the Managed Futures Strategy Predecessor Fund. Financial information included for the dates prior to the reorganization is that of the Managed Futures Strategy Predecessor Fund.
AXS Funds
NOTES TO CONSOLIDATED FINANCIAL STATEMENTS - Continued
September 30, 2020
The reorganization was accomplished by the following tax-free exchange in which each shareholder of the Managed Futures Strategy Predecessor Fund received the same aggregate share net asset value in the corresponding classes as noted below:
| | | Shares Issued | | | Net Assets | |
| Class A | | | 3,732,844 | | | $ | 29,812,110 | |
| Class C | | | 2,500,224 | | | | 18,932,788 | |
| Class I | | | 24,003,504 | | | | 194,134,986 | |
The net unrealized appreciation of investments transferred was $27,079,696 as of the date of the acquisition.
The Multi-Strategy Alternatives Fund’s investment objective is long-term growth of capital. As a secondary goal, the Fund seeks to manage volatility and market risk. Effective May 1, 2020, the Multi-Strategy Alternatives Fund changed fiscal year end from April 30th to September 30th.
The Multi-Strategy Alternatives Fund commenced investment operations on October 21, 2019 with Class R-1 and Class I shares. Prior to that date, the Multi-Strategy Alternatives Fund acquired the assets and assumed the liabilities of the KCM Macro Trends Fund (the "Multi-Strategy Alternatives Predecessor Fund"), a series of Northern Lights Fund Trust, which offered two classes of shares, Class R-1 and Institutional Class, in a tax-free reorganization as set out in the Agreement and Plan of Reorganization. The proposed Plan of Reorganization was approved by the Trusts Board on June 14, 2019, by the Board of Northern Lights Fund Trust on June 17, 2019, and by beneficial owners of the Multi-Strategy Alternatives Predecessor Fund on October 17, 2019. The tax-free reorganization was accomplished on October 18, 2019. Upon closing of the Plan of Reorganization, Institutional Class shares were designated to Class I shares. As a result of the reorganization, the Multi-Strategy Alternatives Fund assumed the performance and accounting history of the Multi-Strategy Alternatives Predecessor Fund. Financial information included for the dates prior to the reorganization is that of the Multi-Strategy Alternatives Predecessor Fund.
The reorganization was accomplished by the following tax-free exchange in which each shareholder of the Multi-Strategy Alternatives Predecessor Fund received the same aggregate share net asset value in the corresponding classes as noted below:
| | | Shares Issued | | | Net Assets | |
| Class R-1 | | | 7,643,433 | | | $ | 84,119,077 | |
| Class I | | | 67,002 | | | $ | 740,865 | |
The net unrealized appreciation of investments transferred was $2,594,449 as of the date of the acquisition.
The shares of each class of each Fund represent an interest in the same portfolio of investments of each particular Fund and have equal rights as to voting, redemptions, dividends and liquidation, subject to the approval of the Trustees. Income, expenses (other than expenses attributable to a specific class) and realized and unrealized gains and losses on investments are allocated to each class of shares in proportion to their relative net assets. Shareholders of a class that bears distribution and service expenses under the terms of a distribution plan have exclusive voting rights to that distribution plan.
Each Fund is an investment company and accordingly follows the investment company accounting and reporting guidance of the Financial Accounting Standards Board (FASB) Accounting Standard Codification Topic 946 “Financial Services—Investment Companies.”
AXS Funds
NOTES TO CONSOLIDATED FINANCIAL STATEMENTS - Continued
September 30, 2020
(a) Consolidation of Subsidiary
The Alternative Growth Fund may invest up to 25% of its total assets in its subsidiary, AXS Alternative Growth Fund Limited, a wholly-owned and controlled subsidiary formed under the laws of the Cayman Islands. The Consolidated Schedule of Investments, Statement of Assets and Liabilities, Statement of Operations, Statements of Changes in Net Assets and Financial Highlights of the Fund include the accounts of the AXS Alternative Growth Fund Limited. All inter-company accounts and transactions have been eliminated in the consolidation for the Alternative Growth Fund. The AXS Alternative Growth Fund Limited is advised by Ampersand Investment Management LLC (“Ampersand” or the “Sub-Advisor”) and acts as an investment vehicle in order to effect certain investments consistent with the Alternative Growth Fund’s investment objectives and policies specified in the Alternative Growth Fund’s prospectus and statement of additional information. The AXS Alternative Growth Fund Limited will generally invest in derivatives, including swaps, and other investments intended to serve as margin or collateral for swap positions. The inception date of the AXS Alternative Growth Fund Limited was June 27, 2018. As of September 30, 2020, total net assets of the Alternative Growth Fund were $7,971,933, of which $1,703,618, or approximately 21.4%, represented the Alternative Growth Fund’s ownership of the shares of the AXS Alternative Growth Fund Limited.
The Aspect Core Diversified Strategy Fund may invest up to 25% of its total assets in its subsidiary, Aspect Core Diversified Strategy Fund Limited, a wholly-owned and controlled subsidiary formed under the laws of the Cayman Islands. The Consolidated Schedule of Investments, Statement of Assets and Liabilities, Statement of Operations, Statements of Changes in Net Assets and Financial Highlights of the Aspect Core Diversified Strategy Fund include the accounts of the Aspect Core Diversified Strategy Fund Limited. All inter-company accounts and transactions have been eliminated in the consolidation for the Aspect Core Diversified Strategy Fund. The Aspect Core Diversified Strategy Fund Limited is advised by Aspect Capital Limited (“Aspect” or the “Sub-Advisor”) and acts as an investment vehicle in order to effect certain investments consistent with the Aspect Core Diversified Strategy Fund’s investment objectives and policies specified in the Aspect Core Diversified Strategy Fund’s prospectus and statement of additional information. The Aspect Core Diversified Strategy Fund Limited will generally invest in derivatives, including commodity futures, and other investments intended to serve as margin or collateral for derivative positions. The inception date of the Aspect Core Diversified Strategy Fund Limited was November 6, 2014. As of September 30, 2020, net assets of the Aspect Core Diversified Strategy Fund were $22,381,996, of which $480,123, or approximately 2.1%, represented the Aspect Core Diversified Strategy Fund’s ownership of the shares of the Aspect Core Diversified Strategy Fund Limited.
The Chesapeake Strategy Fund may invest up to 25% of its total assets in its subsidiary, AXS Chesapeake Strategy Fund Limited, a wholly-owned and controlled subsidiary formed under the laws of the Cayman Islands. The Consolidated Schedule of Investments, Statement of Assets and Liabilities, Statement of Operations, Statements of Changes in Net Assets and Financial Highlights of the Chesapeake Strategy Fund include the accounts of the AXS Chesapeake Strategy Fund Limited. All inter-company accounts and transactions have been eliminated in the consolidation for the Chesapeake Strategy Fund. The AXS Chesapeake Strategy Fund Limited is advised by Chesapeake Investment Management LLC (“Chesapeake” or the “Sub-Advisor”) and acts as an investment vehicle in order to effect certain investments consistent with the Chesapeake Strategy Fund’s investment objectives and policies specified in the Chesapeake Strategy Fund’s prospectus and statement of additional information. The AXS Chesapeake Strategy Fund Limited will generally invest in derivatives, including commodity futures, and other investments intended to serve as margin or collateral for derivative positions. The inception date of the AXS Chesapeake Strategy Fund Limited was April 19, 2012. As of September 30, 2020, net assets of the Chesapeake Strategy Fund were $15,640,061 of which $575,382, or approximately 3.7%, represented the Chesapeake Strategy Fund’s ownership of the shares of the AXS Chesapeake Strategy Fund Limited.
The Managed Futures Strategy Fund may invest up to 25% of its total assets in its subsidiary, AXS Managed Futures Fund Limited, a wholly-owned and controlled subsidiary formed under the laws of the Cayman Islands. The Consolidated Schedule of Investments, Statement of Assets and Liabilities, Statement of Operations, Statements of Changes in Net Assets and Financial Highlights of the Managed Futures Strategy Fund include the accounts of the AXS Managed Futures Fund Limited. All inter-company accounts and transactions have been eliminated in the consolidation for the Managed Futures Strategy Fund. The AXS Managed Futures Fund Limited is advised by Ampersand Investment Management LLC (“Ampersand” or the “Sub-Advisor”) and acts as an investment vehicle in order to effect certain investments consistent with the Managed Futures Strategy Fund’s investment objectives and policies specified in the Managed Futures Strategy Fund’s prospectus and statement of additional information. The AXS Managed Futures Fund Limited will generally invest in derivatives, including swaps, and other investments intended to serve as margin or collateral for swap positions. The inception date of the AXS Managed Futures Fund Limited was January 12, 2010. As of September 30, 2020, net assets of the Managed Futures Strategy Fund were $116,215,228, of which $28,273,917, or approximately 24.3%, represented the Managed Futures Strategy Fund’s ownership of the shares of the AXS Managed Futures Fund Limited.
AXS Funds
NOTES TO CONSOLIDATED FINANCIAL STATEMENTS - Continued
September 30, 2020
For tax purposes, the AXS Alternative Growth Fund Limited, Aspect Core Diversified Strategy Fund Limited, AXS Chesapeake Strategy Fund Limited and AXS Managed Futures Fund Limited are each an exempted Cayman investment company. Each subsidiary has received an undertaking from the Government of the Cayman Islands exempting it from all local income, profits and capital gains taxes. No such taxes are levied in the Cayman Islands at the present time. For U.S. income tax purposes, each subsidiary is a CFC and as such is not subject to U.S. income tax. However, as a wholly-owned CFC, each subsidiary’s net income and capital gains, to the extent of its earnings and profits, will be included each year in the Funds’ investment company taxable income.
Note 2 – Accounting Policies
The following is a summary of the significant accounting policies consistently followed by the Funds in the preparation of their financial statements. The preparation of financial statements in conformity with accounting principles generally accepted in the United States of America (“GAAP”) requires management to make estimates and assumptions that affect the reported amounts and disclosures in the financial statements. Actual results could differ from these estimates.
(a) Valuation of Investments
The Funds value equity securities at the last reported sale price on the principal exchange or in the principal over the counter (“OTC”) market in which such securities are traded, as of the close of regular trading on the NYSE on the day the securities are being valued or, if the last-quoted sales price is not readily available, the securities will be valued at the last bid or the mean between the last available bid and ask price. Securities traded on the NASDAQ are valued at the NASDAQ Official Closing Price (“NOCP”). Investments in open-end investment companies are valued at the daily closing net asset value of the respective investment company. Debt securities are valued by utilizing a price supplied by independent pricing service providers. The independent pricing service providers may use various valuation methodologies including matrix pricing and other analytical pricing models as well as market transactions and dealer quotations. These models generally consider such factors as yields or prices of bonds of comparable quality, type of issue, coupon, maturity, ratings and general market conditions. If a price is not readily available for a portfolio security, the security will be valued at fair value (the amount which the Funds might reasonably expect to receive for the security upon its current sale) as determined in good faith by the Funds’ advisor, subject to review and approval by the Valuation Committee, pursuant to procedures adopted by the Board of Trustees. The actions of the Valuation Committee are subsequently reviewed by the Board at its next regularly scheduled board meeting. The Valuation Committee meets as needed. The Valuation Committee is comprised of all the Trustees, but action may be taken by any one of the Trustees.
(b) Foreign Currency Translation
The Funds’ records are maintained in U.S. dollars. The value of securities, currencies and other assets and liabilities denominated in currencies other than U.S. dollars are translated into U.S. dollars based upon foreign exchange rates prevailing at the end of the reporting period. The currencies are translated into U.S. dollars by using the exchange rates quoted as of 4:00 PM Eastern Standard Time. Purchases and sales of investment securities, income and expenses are translated on the respective dates of such transactions.
AXS Funds
NOTES TO CONSOLIDATED FINANCIAL STATEMENTS - Continued
September 30, 2020
The Funds do not isolate that portion of their net realized and unrealized gains and losses on investments resulting from changes in foreign exchange rates from the impact arising from changes in market prices. Such fluctuations are included with net realized and unrealized gain or loss from investments and foreign currency.
Net realized foreign currency transaction gains and losses arise from sales of foreign currencies, currency gains or losses realized between the trade and settlement dates on securities transactions, and the differences between the amounts of dividends, interest, and foreign withholding taxes recorded on the Funds’ books and the U.S. dollar equivalent of the amounts actually received or paid. Net unrealized foreign currency translation gains and losses arise from changes in the value of assets and liabilities, other than investments in securities, resulting from changes in the exchange rates.
(c) Exchange Traded Funds (“ETFs”)
ETFs typically trade on securities exchanges and their shares may, at times, trade at a premium or discount to their net asset values. In addition, an ETF may not replicate exactly the performance of the benchmark index it seeks to track for a number of reasons, including transaction costs incurred by the ETF, the temporary unavailability of certain index securities in the secondary market or discrepancies between the ETF and the index with respect to the weighting of securities or the number of securities held. Investing in ETFs, which are investment companies, may involve duplication of advisory fees and certain other expenses. As a result, Fund shareholders indirectly bear their proportionate share of these incurred expenses. Therefore, the cost of investing in the Funds will be higher than the cost of investing directly in ETFs and may be higher than other mutual funds that invest directly in securities.
Each ETF in which the Funds invest is subject to specific risks, depending on the nature of the ETF. Each ETF is subject to the risks associated with direct ownership of the securities comprising the index on which the ETF is based. These risks could include liquidity risk, sector risk, and risks associated with fixed-income securities.
(d) Total Return Swaps
The Alternative Growth Fund and Managed Futures Strategy Fund are subject to equity price risk, interest rate risk and/or commodity risk in the normal course of pursuing its investment objective. The Funds enter into various swap transactions for investment purposes and to manage interest rate, equity, foreign exchange (currency), or credit risk. These two-party contracts are entered into primarily to exchange the returns (or differentials in rates of returns) earned or realized on particular pre-determined investments or instruments.
To help to reduce counterparty risk on the Managed Futures Strategy Fund, the Advisor has the right to reduce the Managed Futures Strategy Fund’s exposure and remove cash from the Managed Futures Strategy Fund’s total return swap with Deutsche Bank AG. This cash holding shall be in excess of $250,000 and may not exceed 40% of the Index exposure in total. The Managed Futures Strategy Fund is charged interest on this cash holding and any amount removed will be offset against the final settlement value of the swap. As of September 30, 2020, the Managed Futures Strategy Fund at the request of the Advisor had $6,891,854 in cash holdings as shown in the Consolidated Statements of Assets and Liabilities under advance on unrealized appreciation.
The gross returns exchanged or “swapped” between parties are calculated with respect to a notional amount, i.e., the return on or increase in value of a particular dollar amount invested at a particular interest rate, in a particular foreign currency, or in a “basket” of securities representing a particular index or market segment. Changes in the value of swap agreements are recognized as net change in unrealized appreciation or depreciation in the Consolidated Statements of Operations by “marking to market” on a daily basis to reflect the value of the swap agreement at the end of each trading day. A liquidation payment received or made at the termination of the swap agreement is recorded as a realized gain or loss on the Consolidated Statements of Operations. Realized gains and losses from a decrease in the notional value swap are recognized on trade date. Swap agreements may also involve fees, commissions and other costs that may reduce the value of the swap agreement. These costs are not reflected in the Consolidated Statements of Operations, are deducted from the return of any such derivative instrument and, therefore, represent an indirect cost of investment in the Funds.
AXS Funds
NOTES TO CONSOLIDATED FINANCIAL STATEMENTS - Continued
September 30, 2020
(e) Equity Swaps (Total Return Swaps)
The Multi-Strategy Alternatives Fund may enter into equity swap contracts for hedging or investment purposes. Equity swap contracts may be structured in different ways. The counterparty may agree to pay the Fund the amount, if any, by which the notional amount of the equity swap contract would have increased in value had it been invested in particular stocks (or an index of stocks), plus the dividends that would have been received on those stocks. In these cases, the Fund may agree to pay to the counterparty a floating-rate of interest on the notional amount of the equity swap contract plus the amount, if any, by which that notional amount would have decreased in value had it been invested in such stocks. In these cases, the return to the Fund on any equity swap contract should be the gain or loss on the notional amount plus dividends on the stocks less the interest paid by the Fund on the notional amount. In other cases, the counterparty and the Fund may agree to pay the other the difference between the relative investment performance that would have been achieved if the notional amount of the equity swap contract had been invested in different stocks (or indices of stocks).
Total return swap contracts are agreements between counterparties to exchange cash flow, one based on a market-linked return of an individual asset or group of assets (such as an index), and the other on a fixed or floating rate. As a total return swap, an equity swap may be structured in different ways. When the Fund enters into a “long” equity swap, the counterparty may agree to pay the Fund the amount, if any, by which the notional amount of the equity swap would have increased in value had it been invested in a particular referenced security or securities, plus the dividends that would have been received on those securities. In return, the Fund will generally agree to pay the counterparty interest on the notional amount of the equity swap plus the amount, if any, by which that notional amount would have decreased in value had it been invested in such referenced security or securities, plus, in certain instances, commissions or trading spreads on the notional amounts. Therefore, the Fund’ return on the equity swap generally should equal the gain or loss on the notional amount, plus dividends on the referenced security or securities less the interest paid by the Fund on the notional amount. Alternatively, when the Fund enters into a “short” equity swap, the counterparty will generally agree to pay the Fund the amount, if any, by which the notional amount of the equity swap would have decreased in value had the Fund sold a particular referenced security or securities short, less the dividend expense that the Fund would have incurred on the referenced security or securities, as adjusted for interest payments or other economic factors. In this situation, the Fund will generally be obligated to pay the amount, if any, by which the notional amount of the swap would have increased in value had it been invested directly in the referenced security or securities.
Equity swaps generally do not involve the delivery of securities or other referenced assets. Accordingly, the risk of loss with respect to equity swaps is normally limited to the net amount of payments that the Fund is contractually obligated to make. If the other party to an equity swap defaults, the Fund’s risk of loss consists of the net amount of payments that the Fund is contractually entitled to receive, if any. The Fund will segregate cash or liquid assets, enter into offsetting transactions or use other measures permitted by applicable law to “cover” the Fund’ current obligations.
Equity swaps are derivatives and their value can be very volatile. The Fund may engage in total return swaps to gain exposure to securities, along with offsetting long total return swap positions to maintain appropriate currency balances and risk exposures across all swap positions. To the extent that the Advisor does not accurately analyze and predict future market trends, the values or assets or economic factors, the Fund may suffer a loss, which may be substantial. As of September 30, 2020, open swap agreements are shown in the Schedules of Investments.
(f) Futures Contracts
The Funds purchase and sell futures contracts to pursue its investment objective and to gain exposure to, or hedge against, change in the value of equities, interest rates, foreign currency, or commodities. Initial margin deposits required upon entering into futures contracts are satisfied by the segregation of specific securities or cash as collateral for the account of the broker (the Portfolio’s agent in acquiring the futures position). During the period the futures contracts are open, changes in the value of the contracts are recognized as unrealized gains or losses by “marking to market” on a daily basis to reflect the market value of the contracts at the end of each day’s trading. Variation margin payments are received or made depending upon whether unrealized gains or losses are incurred. When the contracts are closed, the Fund recognizes a realized gain or loss equal to the difference between the proceeds from, or cost of, the closing transaction and the Fund’s basis in the contract. If a Fund was unable to liquidate a futures contract and/or enter into an offsetting closing transaction, the Fund would continue to be subject to market risk with respect to the value of the contracts and continue to be required to maintain the margin deposits on the futures contracts. The Funds segregate liquid securities having a value at least equal to the amount of the current obligation under any open futures contract. Risks may exceed amounts recognized in the Consolidated Statements of Assets and Liabilities. With futures, there is minimal counterparty credit risk to a Fund since futures are exchange traded and the exchange’s clearinghouse, as counterparty to all exchange traded futures, guarantees the futures against default.
AXS Funds
NOTES TO CONSOLIDATED FINANCIAL STATEMENTS - Continued
September 30, 2020
(g) Forward Foreign Currency Contracts
The Aspect Core Diversified Strategy Fund and the Chesapeake Strategy Fund may enter into forward currency exchange contracts in order to hedge against foreign currency exchange rate risks. A forward involves an obligation to purchase or sell a specific currency at a future date, which may be any fixed number of days from the date of the contract agreed upon by the parties, at a price set at the time of the contract. The market value of the contract fluctuates with changes in currency exchange rates. The contract is marked-to-market daily and the change in market value is recorded by the Fund as an unrealized gain or loss. As foreign securities are sold, a portion of the contract is generally closed and the Funds record a realized gain or loss equal to the difference between the value of the contract at the time it was opened and the value at the time it was closed. Realized gains and losses from contract transactions are included as a component of net realized gains/(losses) from forward foreign currency contracts in the Consolidated Statements of Operations.
(h) Short-Term Investments
The Aspect Core Diversified Strategy Fund invests a significant amount (47.6% as of September 30, 2020) in the Fidelity Investments Money Market Treasury Portfolio (“FISXX”). FISXX Invests in U.S. Treasury securities and/or repurchase agreements that are collateralized fully, U.S. Government securities issued by entities that are chartered or sponsored by Congress but whose securities are neither issued nor guaranteed by the U.S. Treasury, and investing in compliance with industry-standard regulatory requirements for money market funds for the quality, maturity, liquidity, and diversification of investments. FISXX may invest at least 80% of its assets in U.S. Treasury securities and repurchase agreements for those securities.
(i) Investment Transactions, Investment Income and Expenses
Investment transactions are accounted for on the trade date. Realized gains and losses on investments are determined on the identified cost basis. Dividend income is recorded net of applicable withholding taxes on the ex-dividend date and interest income is recorded on an accrual basis. Withholding taxes on foreign dividends, if applicable, are paid (a portion of which may be reclaimable) or provided for in accordance with the applicable country’s tax rules and rates and are disclosed in the Consolidated Statement of Operations. Withholding tax reclaims are filed in certain countries to recover a portion of the amounts previously withheld. The Funds record a reclaim receivable based on a number of factors, including a jurisdiction’s legal obligation to pay reclaims as well as payment history and market convention. Income and expenses of the Funds are allocated on a pro rata basis to each class of shares, except for distribution and service fees which are unique to each class of shares. Expenses incurred by the Trust with respect to more than one fund are allocated in proportion to the net assets of the fund except where allocation of direct expenses to the fund or an alternative allocation method can be more appropriately made.
AXS Funds
NOTES TO CONSOLIDATED FINANCIAL STATEMENTS - Continued
September 30, 2020
(j) Federal Income Tax
The Funds intend to comply with the requirements of Subchapter M of the Internal Revenue Code applicable to regulated investment companies and to distribute substantially all of their net investment income and any net realized gains to their shareholders. Therefore, no provision is made for federal income or excise taxes. Due to the timing of dividend distributions and the differences in accounting for income and realized gains and losses for financial statement and federal income tax purposes, the fiscal year in which amounts are distributed may differ from the year in which the income and realized gains and losses are recorded by the Funds.
Accounting for Uncertainty in Income Taxes (the “Income Tax Statement”) requires an evaluation of tax positions taken (or expected to be taken) in the course of preparing a Fund’s tax returns to determine whether these positions meet a “more-likely-than-not” standard that, based on the technical merits, have a more than fifty percent likelihood of being sustained by a taxing authority upon examination. A tax position that meets the “more-likely-than-not” recognition threshold is measured to determine the amount of benefit to recognize in the financial statements. The Funds recognize interest and penalties, if any, related to unrecognized tax benefits as income tax expense in the Consolidated Statements of Operations.
The Income Tax Statement requires management of the Funds to analyze tax positions taken in the prior three open tax years, if any, and tax positions expected to be taken in the Funds’ current tax year, as defined by the IRS statute of limitations for all major jurisdictions, including federal tax authorities and certain state tax authorities. As of September 30, 2020, and during the prior three open tax years, the Funds did not have a liability for any unrecognized tax benefits. The Funds have no examinations in progress and is not aware of any tax positions for which it is reasonably possible that the total amounts of unrecognized tax benefits will significantly change in the next twelve months.
(k) Distributions to Shareholders
Dividends from net investment income, if any, are declared and paid at least annually. Distributable net realized capital gains, if any, are declared and distributed annually. Distributions to shareholders are recorded on the ex-dividend date. The amount and timing of distributions are determined in accordance with federal income tax regulations, which may differ from GAAP.
The character of distributions made during the year from net investment income or net realized gains may differ from the characterization for federal income tax purposes due to differences in the recognition of income, expense and gain (loss) items for financial statement and tax purposes.
(l) Illiquid Securities
Pursuant to Rule 22e-4 under the 1940 Act, the Funds have adopted a Liquidity Risk Management Program (“LRMP”) that requires, among other things, that the Funds limit their illiquid investments that are assets to no more than 15% of net assets. An illiquid investment is any security which may not reasonably be expected to be sold or disposed of in current market conditions in seven calendar days or less without the sale or disposition significantly changing the market value of the investment. If the Advisor, at any time, determines that the value of illiquid securities held by the Fund exceed 15% of its net asset value, the Advisor will take such steps as it considers appropriate to reduce them as soon as reasonably practicable in accordance with the Funds’ written LRMP.
AXS Funds
NOTES TO CONSOLIDATED FINANCIAL STATEMENTS - Continued
September 30, 2020
Note 3 – Investment Advisory and Other Agreements
The Trust, on behalf of the Funds, entered into an Investment Advisory Agreement (the “Agreement”) with AXS Investments LLC (the “Advisor”). Under the terms of the Agreement, the Funds pay twice a month investment advisory fee to the Advisor. The rates are listed by Fund in the table below.
| Fund | Investment Advisory Fees | Subsidiary | Investment Advisory Fees |
| Alternative Growth Fund | 0.75% | Alternative Growth Fund Limited | 0.75% |
| Aspect Core Diversified Strategy Fund | 1.30% | Aspect Core Diversified Strategy Fund Limited | 1.30% |
| Chesapeake Strategy Fund | 1.50% | Chesapeake Strategy Fund Limited | 1.50% |
| Managed Futures Strategy Fund | 1.45% | Managed Futures Strategy Fund Limited | 1.45% |
| Multi-Strategy Alternatives Fund | 1.00% | | |
The investment management fees included a management fee paid to the Advisor by each Fund’s subsidiary at an annual rate listed above of the subsidiary’s average daily net assets. The Advisor had contractually agreed, for so long as each Fund invests in each subsidiary, to waive the management fee it received from the Fund in an amount equal to the management fee paid to the Advisor by each subsidiary. This undertaking may not be terminated by the advisor as long as the investment advisory agreement between the Subsidiary and the Advisor is in place unless the Advisor obtains the prior approval of the Fund’s Board of Trustees. The Advisor has contractually agreed to waive its fee and, if necessary, to absorb other operating expenses to ensure that total annual operating expenses (excluding any taxes, leverage interest, brokerage commissions, dividend and interest expenses on short sales, acquired fund fees and expenses as determined in accordance with Form N-1A, expenses incurred in connection with any merger or reorganization, and extraordinary expenses such as litigation expenses) in order to limit total annual operating expenses of each fund. For the Alternative Growth Fund, the Aspect Core Diversified Strategy Fund, the Chesapeake Strategy Fund, and the Managed Futures Strategy Fund, this agreement is effective until November 9, 2021. For the Multi-Strategy Alternatives Fund, this agreement is effective until October 19, 2021. These agreements may be terminated before that date only by the Trust’s Board of Trustees. The table below contains the expense cap by Fund and by Class.
| | Total Limit on Annual Operating Expenses |
| | Class A Shares | Class C Shares | Class I Shares | Class R-1 Shares |
| Alternative Growth Fund | 1.24% | - | 0.99% | - |
| Aspect Core Diversified Strategy Fund | 1.70% | 2.45% | 1.45% | - |
| Chesapeake Strategy Fund | 2.10% | 2.85% | 1.85% | - |
| Managed Futures Strategy Fund | 1.95% | 2.70% | 1.70% | - |
| Multi-Strategy Alternatives Fund | - | - | 1.51% | 1.68% |
The Advisor has engaged Ampersand Investment Management LLC (the “Ampersand”), a Sub-Advisor, to manage the Alternative Growth Fund and Managed Futures Strategy Fund and pays Ampersand from its advisory fees.
The Advisor has engaged Aspect Capital Limited (“Aspect”), a Sub-Advisor, to manage the Aspect Core Diversified Strategy Fund and pays Aspect from its advisory fees.
The Advisor has engaged Chesapeake Capital Corporation (“Chesapeake”), a Sub-Advisor, to manage the Chesapeake Strategy Fund’s overall investment program, and pays Chesapeake from its advisory fees.
AXS Funds
NOTES TO CONSOLIDATED FINANCIAL STATEMENTS - Continued
September 30, 2020
The Advisor has engaged Kerns Capital Management, Inc. (“KCM”), a Sub-Advisor, to manage the Multi-Strategy Alternatives Fund’s overall investment program, and pays KCM from its advisory fees.
Prior to the close of business on November 8, 2019, investment advisory services were provided to the Alternative Growth Predecessor Fund, the Aspect Core Diversified Strategy Predecessor Fund, and the Chesapeake Strategy Predecessor Fund by Equinox Institutional Asset Management, LP (“Equinox”), which received investment management fees for their services pursuant to the terms of the investment advisory agreements for the Alternative Growth Predecessor Fund, the Aspect Core Diversified Strategy Predecessor Fund, and the Chesapeake Strategy Predecessor Fund. The investment advisory fees were computed and accrued daily and paid monthly at an annual rate of 0.75% of the Alternative Growth Predecessor Fund’s average daily net assets, 1.30% of the Aspect Core Diversified Strategy Predecessor Fund’s average daily net assets, and 1.50% of the Chesapeake Strategy Predecessor Fund’s, average daily net assets. Equinox had contractually agreed to waive its fee and, if necessary, to absorb other operating expenses to ensure that total annual operating expenses (excluding any taxes, leverage interest, brokerage commissions, dividend and interest expenses on short sales, acquired fund fees and expenses as determined in accordance with Form N-1A, expenses incurred in connection with any merger or reorganization, and extraordinary expenses such as litigation expenses) do not exceed 1.24% and 0.99% of the average daily net assets of Class A and Class I shares, respectively, of the Alternative Growth Predecessor Fund. Equinox had contractually agreed to waive its fee and, if necessary, to absorb other operating expenses to ensure that total annual operating expenses (excluding any taxes, leverage interest, brokerage commissions, dividend and interest expenses on short sales, acquired fund fees and expenses as determined in accordance with Form N-1A, expenses incurred in connection with any merger or reorganization, and extraordinary expenses such as litigation expenses) do not exceed 1.70%, 2.45% and 1.45% of the average daily net assets of Class A, Class C and Class I shares, respectively, of the Aspect Core Diversified Strategy Predecessor Fund. Equinox had contractually agreed to waive its fee and, if necessary, to absorb other operating expenses to ensure that total annual operating expenses (excluding any taxes, leverage interest, brokerage commissions, dividend and interest expenses on short sales, acquired fund fees and expenses as determined in accordance with Form N-1A, expenses incurred in connection with any merger or reorganization, and extraordinary expenses such as litigation expenses) do not exceed 2.10%, 2.85% and 1.85% of the average daily net assets of Class A, Class C and Class I shares, respectively, of the Chesapeake Strategy Predecessor Fund.
Prior to the close of business on January 24, 2020, investment advisory services were provided to the Managed Futures Strategy Predecessor Fund by Equinox, which received investment management fees for their services pursuant to the terms of the investment advisory agreements for the Managed Futures Strategy Predecessor Fund. The investment advisory fees were computed and accrued daily and paid monthly at an annual rate of 1.45% of the Managed Futures Strategy Predecessor Fund’s average daily net assets. Equinox had contractually agreed to waive its fee and, if necessary, to absorb other operating expenses to ensure that total annual operating expenses (excluding any taxes, leverage interest, brokerage commissions, dividend and interest expenses on short sales, acquired fund fees and expenses as determined in accordance with Form N-1A, expenses incurred in connection with any merger or reorganization, and extraordinary expenses such as litigation expenses) do not exceed 1.95%, 2.70%, and 1.70% of the average daily net assets of Class A, Class C, and Class I shares, respectively, of the Managed Futures Strategy Predecessor Fund.
Prior to the close of business on October 18, 2019, investment advisory services were provided to the Multi-Strategy Alternatives Predecessor Fund by Kerns Capital Management, Inc. (the “Previous Advisor”), which received investment management fees for their services pursuant to the terms of the investment advisory agreements for the Multi-Strategy Alternatives Predecessor Fund. The investment advisory fees, which were computed and accrued daily and paid monthly, at an annual rate of 1.00% of the Fund’s average daily net assets.
The Funds’ Advisor may recover from the Fund’s fees and/or expenses previously waived and/or absorbed if the Funds’ expense ratio, including the recovered expenses, falls below the expense limit at which it was waived. The Funds’ advisor is permitted to seek reimbursement from the Fund, subject to certain limitations, of fees waived or payments made to the Fund for a period ending three years after the date of the waiver or payment. This reimbursement may be requested from the Funds if the reimbursement will not cause the Funds’ annual expense ratio to exceed the lesser of (a) the expense limitation amount in effect at the time such fees were waived or payments made, or (b) the expense limitation amount in effect at the time of the reimbursement. The Advisor may recapture all or a portion of this amount no later than the dates stated below:
AXS Funds
NOTES TO CONSOLIDATED FINANCIAL STATEMENTS - Continued
September 30, 2020
| | | Alternative Growth Fund | | | Aspect Core Diversified Strategy Fund | | | Chesapeake Strategy Fund | | | Managed Futures Strategy Fund | |
| June 30, 2023 | | $ | 121,818 | | | $ | - | | | $ | - | | | $ | - | |
| September 30, 2023 | | | 69,919 | | | | 164,898 | | | | 120,589 | | | | 120,251 | |
| Total | | $ | 191,737 | | | $ | 164,898 | | | $ | 120,589 | | | $ | 120,251 | |
Equinox is permitted to seek reimbursement, subject to certain limitations, of fees waived or payments made by Equinox to the Alternative Growth Predecessor Fund prior to the Alternative Growth Predecessor Fund’s reorganization on November 8, 2019, for a period ending three years after the date of the waiver of payment for the Alternative Growth Fund. This reimbursement may be requested from the Alternative Growth Fund if the reimbursement will not cause the Alternative Growth Fund’s annual expense ratio to exceed the lesser of (a) the expense limitation amount in effect at the time such fees were waived or payments made, or (b) the expense limitation amount in effect at the time of the reimbursement. Reimbursements of fees waived or payments made will be made on a “first in, first out” basis so that the oldest fees waived or payments are satisfied first. Any reimbursement of fees waived or payments made by Equinox to the Alternative Growth Predecessor Fund prior to the reorganization must be approved by the Trust’s Board of Trustees. Equinox may recapture all or a portion of this amount no later than June 30 of the years of the dates stated below for the Alternative Growth Fund:
| 2021 | | $ | 211,146 | |
| 2022 | | | 231,363 | |
| 2023 | | | 45,463 | |
| Total | | $ | 487,972 | |
Equinox is permitted to seek reimbursement, subject to certain limitations, of fees waived or payments made by Equinox to the Aspect Core Diversified Strategy Predecessor Fund prior to the Aspect Core Diversified Strategy Predecessor Fund’s reorganization on November 8, 2019, for a period ending three years after the date of the waiver of payment. This reimbursement may be requested from the Aspect Core Diversified Strategy Fund if the reimbursement will not cause the Aspect Core Diversified Strategy Fund’s annual expense ratio to exceed the lesser of (a) the expense limitation amount in effect at the time such fees were waived or payments made, or (b) the expense limitation amount in effect at the time of the reimbursement. Reimbursements of fees waived or payments made will be made on a “first in, first out” basis so that the oldest fees waived or payments are satisfied first. Any reimbursement of fees waived or payments made by Equinox to the Aspect Core Diversified Strategy Predecessor Fund prior to the reorganization must be approved by the Trust’s Board of Trustees. Equinox may recapture all or a portion of this amount no later than September 30 of the years stated below for the Aspect Core Diversified Strategy Fund:
| 2021 | | $ | 160,460 | |
| 2022 | | | 179,344 | |
| 2023 | | | 22,266 | |
| Total | | $ | 362,070 | |
AXS Funds
NOTES TO CONSOLIDATED FINANCIAL STATEMENTS - Continued
September 30, 2020
Equinox is permitted to seek reimbursement, subject to certain limitations, of fees waived or payments made by Equinox to the Chesapeake Strategy Predecessor Fund prior to the Chesapeake Strategy Predecessor Fund’s reorganization on November 8, 2019, for a period ending three years after the date of the waiver of payment. This reimbursement may be requested from the Chesapeake Strategy Fund if the reimbursement will not cause the Chesapeake Strategy Fund’s annual expense ratio to exceed the lesser of (a) the expense limitation amount in effect at the time such fees were waived or payments made, or (b) the expense limitation amount in effect at the time of the reimbursement. Reimbursements of fees waived or payments made will be made on a “first in, first out” basis so that the oldest fees waived or payments are satisfied first. Any reimbursement of fees waived or payments made by Equinox to the Chesapeake Strategy Predecessor Fund prior to the reorganization must be approved by the Trust’s Board of Trustees. Equinox may recapture all or a portion of this amount no later than September 30 of the years stated below for the Chesapeake Strategy Fund:
| 2022 | | $ | 148,881 | |
| 2023 | | | 9,685 | |
| Total | | $ | 158,566 | |
For the year ended September 30, 2020, Equinox waived advisory fees totaling $29,810 for the Managed Futures Strategy Fund. This amount is not recoupable.
The Advisor reimbursed the Chesapeake Strategy Fund $457 for losses from a trade error during this fiscal period. This amount is reported on the Chesapeake Strategy Fund’s Consolidated Statements of Operations and Statements of Changes under the caption “Net increase from payment by affiliates.” This reimbursement had no impact to the total return.
UMB Fund Services, Inc. (“UMBFS”) serves as the Funds’ fund accountant, transfer agent and co-administrator; and Mutual Fund Administration, LLC (“MFAC”) serves as the Funds’ other co-administrator. UMB Bank, N.A., an affiliate of UMBFS, serves as the Funds’ custodian. Deutsche Bank Trust Company America (“DBTCA”) acts as the custodian with respect to certain collateral arrangements between the Alternative Growth Fund and Managed Futures Strategy Fund and counter-parties. DBTCA also acts as the custodian for the Alternative Growth Fund’s and Managed Futures Strategy Fund’s subsidiaries, Alternative Growth Fund Limited and Managed Futures Strategy Fund Limited, respectively, including certain collateral arrangements between the Subsidiaries and counter-parties.
Prior to the close of business on November 8, 2019, Gemini Fund Services, LLC (“GFS”), an affiliate of Northern Lights Distributors, LLC (“NLD”), served as the Alternative Growth Predecessor Fund’s, the Aspect Core Diversified Strategy Predecessor Fund’s, and Chesapeake Strategy Predecessor Fund’s administrator, fund accountant, and transfer agent and U.S. Bank N.A. served as the Alternative Growth Fund’s Predecessor Fund’s, the Aspect Core Diversified Strategy Predecessor Fund’s, and Chesapeake Strategy Predecessor Fund’s Custodian. Prior to the close of business on January 24, 2020, GFS, served as the Managed Futures Strategy Predecessor Fund’s administrator, fund accountant, and transfer agent and U.S. Bank N.A. served as the Managed Futures Strategy Predecessor Fund’s Custodian. Prior to the close of business on October 18, 2019, GFS served as the Multi-Strategy Predecessor Fund’s administrator, fund accountant, and transfer agent and Fifth Third Bank served as the Multi-Strategy Predecessor Fund’s Custodian. The Funds’ allocated fees incurred for fund accounting, fund administration, transfer agency and custody services for the periods ended September 30, 2020, are reported on the Consolidated Statements of Operations.
IMST Distributors, LLC serves as the Funds’ distributor (the “Distributor”).
Prior to the close of business on November 8, 2019, NLD served as the Alternative Growth Predecessor Fund’s, the Aspect Core Diversified Strategy Predecessor Fund’s, and the Chesapeake Strategy Predecessor Fund’s distributor. Prior to the close of business on January 24, 2020, NLD served as the Managed Futures Strategy Predecessor Fund’s distributor. Prior to the close of business on October 18, 2019, NLD served as the Multi-Strategy Alternative Predecessor Fund’s distributor.
AXS Funds
NOTES TO CONSOLIDATED FINANCIAL STATEMENTS - Continued
September 30, 2020
The Funds have a fee arrangement with its custodian, UMB Bank, n.a., which provides for custody fees to be reduced by earning credits based on cash balances left on deposit with the custodian. For the periods ended September 30, 2020, the total fees reduced by earning credits were as follows in the table below. Such amount is shown as a reduction of expenses, "Fees paid indirectly", on the Consolidated Statements of Operations.
| Alternative Growth Fund | | | Aspect Core Diversified Strategy Fund | | | Chesapeake Strategy Fund | | | Managed Futures Strategy Fund | | | Multi-Strategy Alternatives Fund | |
| $ | 237 | | | $ | 1,796 | | | $ | 5,868 | | | $ | 8,617 | | | $ | 1,963 | |
Certain trustees and officers of the Trust are employees of UMBFS or MFAC. The Funds do not compensate trustees and officers affiliated with the Funds’ co-administrators. For the periods ended September 30, 2020, the Funds’ allocated fees incurred to Trustees who are not affiliated with the Funds’ co-administrators are reported on the Consolidated Statements of Operations. A portion of the fees were paid by the Trust’s Co-Administrators. Such amount is shown as a reduction of expenses, “Fees paid indirectly”, on the Consolidated Statements of Operations.
The Funds’ Board of Trustees has adopted a Deferred Compensation Plan (the “Plan”) for the Independent Trustees that enables Trustees to elect to receive payment in cash or the option to select various fund(s) in the Trust in which their deferred accounts shall be deemed to be invested. If a trustee elects to defer payment, the Plan provides for the creation of a deferred payment account. The Funds’ liability for these amounts is adjusted for market value changes in the invested fund and remains a liability to the Funds until distributed in accordance with the Plan. The Trustees’ Deferred compensation liability under the Plan constitutes a general unsecured obligation of the Funds and is disclosed in the Consolidated Statements of Assets and Liabilities. Contributions made under the plan and the change in unrealized appreciation/depreciation and income are included in the Trustees’ fees and expenses in the Consolidated Statements of Operations.
Dziura Compliance Consulting, LLC provides Chief Compliance Officer (“CCO”) services to the Trust. Prior to the close of business on November 8, 2019, Cipperman Compliance Services served as the CCO to the Alternative Growth Predecessor Fund, the Aspect Core Diversified Strategy Predecessor Fund, and Chesapeake Strategy Predecessor Fund. Prior to the close of business on January 24, 2020, Northern Lights Compliance Services, LLC (“NLCS”), an affiliate of GFS and NLD served as the CCO to the Managed Futures Strategy Predecessor Fund. Prior to the close of business on October 18, 2019, NLCS served as the CCO to Multi-Strategy Alternative Predecessor Fund. The Funds’ allocated fees incurred for CCO services for the periods ended September 30, 2020, are reported on the Consolidated Statements of Operations.
The Multi-Strategy Alternatives Predecessor’s Fund administrator reimbursed the Fund $43,948 for losses incurred by the Fund related to an operational error during the year ended April 30, 2020. The amounts are reported on the Fund’s Statement of Changes under the caption “Capital contribution from a predecessor affiliate".
AXS Funds
NOTES TO CONSOLIDATED FINANCIAL STATEMENTS - Continued
September 30, 2020
Note 4 – Federal Income Taxes
At September 30, 2020, gross unrealized appreciation (depreciation) of investments based on cost for federal income tax purposes were as follows:
| | | Alternative Growth Fund | | | Aspect Core Diversified Strategy Fund | | | Chesapeake Strategy Fund | | | Managed Futures Strategy Fund | |
| Cost of investments | | $ | 6,898,069 | | | $ | 21,895,615 | | | $ | 26,861,818 | | | $ | 190,982,981 | |
| | | | | | | | | | | | | | | | | |
| Gross unrealized appreciation | | $ | 13,677 | | | $ | 58,542 | | | $ | 73,475 | | | $ | 4,735,238 | |
| Gross unrealized depreciation | | | (283,788 | ) | | | (2,860,434 | ) | | | (12,561,687 | ) | | | (120,503,010 | ) |
| Net unrealized depreciation on investments | | $ | (270,111 | ) | | $ | (2,801,892 | ) | | $ | (12,488,212 | ) | | $ | (115,767,772 | ) |
| | | Multi-Strategy Alternatives Fund | |
| Cost of investments | | $ | 58,522,568 | |
| | | | | |
| Gross unrealized appreciation | | $ | 6,039,879 | |
| Gross unrealized depreciation | | | (1,437,031 | ) |
| Net unrealized appreciation) on investments | | $ | 4,602,848 | |
The difference between cost amounts for financial statement and federal income tax purposes is due primarily to timing differences in recognizing certain gains and losses in security transactions.
AXS Funds
NOTES TO CONSOLIDATED FINANCIAL STATEMENTS - Continued
September 30, 2020
GAAP requires that certain components of net assets be reclassified between financial and tax reporting. These reclassifications have no effect on net assets or net asset value per share. For the periods ended September 30, 2020, permanent differences in book and tax accounting have been reclassified to paid-in capital and total distributable earnings (loss) as follows:
| | | Increase (Decrease) | |
| | | Paid-in Capital | | | Total Distributable Earnings (Loss) | |
| Alternative Growth Fund | | $ | (23,699 | ) | | $ | 23,699 | |
| Aspect Core Diversified Strategy Fund | | | - | | | | - | |
| Chesapeake Strategy Fund | | | 457 | | | | (457 | ) |
| Managed Futures Strategy Fund | | | (592,708 | ) | | | 592,708 | |
| Multi-Strategy Alternatives Fund | | | (301,619 | ) | | | 301,619 | |
As of September 30, 2020, the components of accumulated earnings (deficit) on a tax basis were as follows:
| | | Alternative Growth Fund | | | Aspect Core Diversified Strategy Fund | | | Chesapeake Strategy Fund | |
| Undistributed ordinary income | | $ | - | | | $ | - | | | $ | - | |
| Undistributed long-term capital gains | | | - | | | | - | | | | - | |
| Tax accumulated earnings | | | - | | | | - | | | | - | |
| | | | | | | | | | | | | |
| Accumulated capital and other losses | | | (2,261,400 | ) | | | (3,344,191 | ) | | | (18,239,715 | ) |
| Unrealized depreciation on investments | | | (270,111 | ) | | | (2,801,892 | ) | | | (12,488,212 | ) |
| Unrealized depreciation on open swap contracts | | | (810,634 | ) | | | - | | | | - | |
| Unrealized appreciation (depreciation) on futures contracts | | | - | | | | 93,579 | | | | (135,794 | ) |
| Unrealized appreciation on forward foreign currency exchange contracts | | | - | | | | 78,694 | | | | - | |
| Unrealized appreciation on foreign currency translations | | | - | | | | 995 | | | | 18,922 | |
| Unrealized Trustees’ deferred compensation | | | (606 | ) | | | (873 | ) | | | (2,254 | ) |
| Total accumulated deficit | | $ | (3,342,751 | ) | | $ | (5,973,688 | ) | | $ | (30,847,053 | ) |
AXS Funds
NOTES TO CONSOLIDATED FINANCIAL STATEMENTS - Continued
September 30, 2020
| | | Managed Futures Strategy Fund | | | Multi-Strategy Alternatives Fund | |
| Undistributed ordinary income | | $ | - | | | $ | - | |
| Undistributed long-term capital gains | | | - | | | | - | |
| Tax accumulated earnings | | | - | | | | - | |
| | | | | | | | | |
| Accumulated capital and other losses | | | (36,665,992 | ) | | | (3,733,071 | ) |
| Unrealized appreciation (depreciation) on investments | | | (115,767,772 | ) | | | 4,602,848 | |
| Unrealized depreciation on open swap contracts | | | (13,301,542 | ) | | | (207,160 | ) |
| Unrealized appreciation (depreciation) on futures contracts | | | - | | | | - | |
| Unrealized appreciation on forward foreign currency exchange contracts | | | - | | | | - | |
| Unrealized appreciation on foreign currency translations | | | - | | | | - | |
| Unrealized Trustees’ deferred compensation | | | (4,586 | ) | | | (2,795 | ) |
| Total accumulated earnings (deficit) | | $ | (165,739,892 | ) | | $ | 659,822 | |
The tax character of the distributions paid during the periods ended September 30, 2020, June 30, 2020, April 30, 2020, June 30, 2019 and April 30, 2019 were as follows:
| | | Alternative Growth Fund | |
| | | September 30, 2020 | | | June 30, 2020 | | | June 30, 2019 | |
| Distributions paid from: | | | | | | | | | | | | |
| Ordinary income | | $ | - | | | $ | 614,316 | | | $ | 30,437 | |
| Net long-term capital gains | | | - | | | | 211,019 | | | | 366,567 | |
| Return of capital | | | - | | | | 700,069 | | | | - | |
| Total distributions paid | | $ | - | | | $ | 1,525,404 | | | $ | 397,004 | |
| | | Aspect Core Diversified Strategy Fund | | | Chesapeake Strategy Fund | |
| Distributions paid from: | | September 30, 2020 | | | September 30, 2019 | | | September 30, 2020 | | | September 30, 2019 | |
| Ordinary income | | $ | 1,575,322 | | | $ | - | | | $ | 3,146,191 | | | $ | 1,698,338 | |
| Net long-term capital gains | | | - | | | | - | | | | - | | | | - | |
| Return of capital | | | 696,719 | | | | - | | | | - | | | | - | |
| Total distributions paid | | $ | 2,272,041 | | | $ | - | | | $ | 3,146,191 | | | $ | 1,698,338 | |
AXS Funds
NOTES TO CONSOLIDATED FINANCIAL STATEMENTS - Continued
September 30, 2020
| | | Managed Futures Strategy Fund | |
| Distributions paid from: | | September 30, 2020 | | | September 30, 2019 | |
| Ordinary income | | $ | 27,725,036 | | | $ | - | |
| Net long-term capital gains | | | - | | | | - | |
| Return of capital | | | 1,660,265 | | | | - | |
| Total distributions paid | | $ | 29,385,301 | | | $ | - | |
| | | Multi-Strategy Alternatives Fund | |
| | | September 30, 2020 | | | April 30, 2020 | | | April 30, 2019 | |
| Distributions paid from: | | | | | | | | | | | | |
| Ordinary income | | $ | - | | | $ | - | | | $ | 10,948,056 | |
| Net long-term capital gains | | | - | | | | 625,829 | | | | 4,133,286 | |
| Return of capital | | | - | | | | 193,247 | | | | - | |
| Total distributions paid | | $ | - | | | $ | 819,076 | | | $ | 15,081,342 | |
As of September 30, 2020, the Alternative Growth Fund, the Aspect Core Diversified Strategy Fund, the Chesapeake Strategy Fund, the Managed Futures Strategy Fund and the Multi-Strategy Alternatives Fund had $0, $146,846, $209,158, $36,486,701 and $0, respectively, of qualified late-year ordinary losses, which are deferred until fiscal year 2020 for tax purposes. Net late-year ordinary losses incurred after December 31, and within the taxable year, are deemed to arise on the first day of each Fund’s next taxable year.
As of September 30, 2020, the Funds had net capital loss carryovers as follows:
| | | Alternative Growth Fund | | | Aspect Core Diversified Strategy Fund | | | Chesapeake Strategy Fund | | | Managed Futures Strategy Fund | | | Multi-Strategy Alternatives Fund | |
| Not subject to expiration: | | | | | | | | | | | | | | | | | | | | |
| Short-term | | $ | 870,091 | | | $ | 1,698,635 | | | $ | 15,931,841 | | | $ | 58,445 | | | $ | 3,733,071 | |
| Long-Term | | | 1,391,309 | | | | 1,498,710 | | | | 2,098,716 | | | | 120,846 | | | | - | |
| Total | | $ | 2,261,400 | | | $ | 3,197,345 | | | $ | 18,030,557 | | | $ | 179,291 | | | $ | 3,733,071 | |
The Managed Futures Strategy Fund and Multi-Strategy Alternatives Fund utilized capital loss carry overs totaling $170,773 and $2,005,644, respectively.
Note 5 – Redemption Fee
The Alternative Growth Fund and Managed Futures Strategy Fund may impose a redemption fee of 1.00% of the total redemption amount on all shares redeemed within 30 days of purchase. For the periods ended September 30, 2020, June 30, 2020 and 2019, the Alternative Growth Fund received $119, $13,013 and $1,481, respectively, in redemption fees. For the periods ended September 30, 2020 and 2019, the Managed Futures Strategy Fund received $27,967 and $3,863, respectively, in redemption fees.
AXS Funds
NOTES TO CONSOLIDATED FINANCIAL STATEMENTS - Continued
September 30, 2020
Note 6 – Investment Transactions
For the periods ended September 30, 2020, cost of purchases and proceeds from sales of portfolio securities, other than short-term investments and short-term U.S. Government securities were as follows:
| | | Purchases | | | Sales | |
| Alternative Growth Fund | | $ | - | | | $ | 600,000 | |
| Aspect Core Diversified Strategy Fund | | | - | | | | 900,453 | |
| Chesapeake Strategy Fund | | | - | | | | 58,965,439 | |
| Managed Futures Strategy Fund | | | 16,116,157 | | | | 119,048,937 | |
| Multi-Strategy Alternatives Fund | | | 114,054,955 | | | | 78,908,524 | |
Note 7 – Distribution Plan
The Trust, on behalf of each Fund, has adopted a Distribution Plan (the “Plan”) pursuant to Rule 12b-1 under the 1940 Act that allows each Fund to pay distribution fees for the sale and distribution of its shares. With respect to Class A shares and Class R-1, the Plan provides for the payment of distribution fees at the annual rate of up to 0.25% of average daily net assets. For Class C shares, the maximum annual fees payable to the Distributor for distribution services and administrative services are 0.75% and 0.25%, respectively, of the average daily net assets of such shares. Class I Shares are not subject to any distribution or service fees under the Plan.
Prior to the close of business on November 8, 2019, the Alternative Growth Predecessor Fund adopted a distribution plan pursuant to Rule 12b-1 with respect to Class A shares. Pursuant to the Plan, the Alternative Growth Predecessor Fund paid NLD at the annual rate of up to 0.25% of average daily net assets attributable to Class A shares. Class I shares did not pay any distribution fees. For the period July 1, 2019 to November 8, 2019, the Alternative Growth Predecessor Fund paid NLD $1,312 with respect to Class A shares under the Alternative Growth Fund’s Predecessor distribution plan. For the periods ended September 30, 2020 and June 30, 2020, the total of distribution fees incurred are disclosed on the Consolidated Statements of Operations.
Prior to the close of business on November 8, 2019, the Aspect Core Diversified Strategy Predecessor Fund adopted a distribution plan pursuant to Rule 12b-1 with respect to Class A shares and Class C shares. Pursuant to the Plan, the Aspect Core Diversified Strategy Predecessor Fund paid NLD at the annual rate of up to 0.25% of average daily net assets attributable to Class A shares and annual rate of up to 1.00% of average daily net assets attributable to Class C shares. Class I shares did not pay any distribution fees. For the period October 1, 2019 to November 8, 2019, the Aspect Core Diversified Strategy Predecessor Fund paid NLD $191 with respect to Class A shares and $3,533 with respect to Class C shares under the Aspect Core Diversified Strategy Predecessor Fund’s distribution plan. For the periods ended September 30, 2020, distribution fees incurred are disclosed on the Consolidated Statements of Operations.
Prior to the close of business on November 8, 2019, the Chesapeake Strategy Predecessor Fund adopted a distribution plan pursuant to Rule 12b-1 with respect to Class A shares and Class C shares. Pursuant to the Plan, the Chesapeake Strategy Predecessor Fund paid NLD at the annual rate of up to 0.25% of average daily net assets attributable to Class A shares and annual rate of up to 1.00% of average daily net assets attributable to Class C shares. Class I shares did not pay any distribution fees. For the period October 1, 2019 to November 8, 2019, the Chesapeake Strategy Predecessor Fund paid NLD $1,318 with respect to Class A shares and $607 with respect to Class C shares under the Chesapeake Strategy Predecessor Fund’s distribution plan. For the periods ended September 30, 2020, distribution fees incurred are disclosed on the Consolidated Statements of Operations.
Prior to the close of business on January 24, 2020, the Managed Futures Strategy Predecessor Fund adopted a distribution plan pursuant to Rule 12b-1 with respect to Class A and C shares. Pursuant to the Plan, the Predecessor Fund paid NLD at the annual rate of up to 0.25% and 1.00% of average daily net assets attributable to Class A and C shares, respectively. Class I shares did not pay any distribution fees. For the period October 1, 2019 to January 24, 2020, the Predecessor Fund paid NLD $86,654 with respect to Class A and Class C shares under the Predecessor Fund’s distribution plan. For the periods ended September 30, 2020, distribution fees incurred are disclosed on the Consolidated Statements of Operations.
AXS Funds
NOTES TO CONSOLIDATED FINANCIAL STATEMENTS - Continued
September 30, 2020
Prior to the close of business on October 18, 2019, the Multi-Strategy Alternatives Predecessor Fund adopted a distribution plan pursuant to Rule 12b-1 with respect to Class R-1 and Institutional Class shares. Pursuant to the Plan, the Multi-Strategy Alternatives Fund’s Predecessor Fund paid NLD 0.25% and 0.00% of average daily net assets attributable to Class R-1 and Institutional Class shares, respectively. For the period May 1, 2019 to October 18, 2019, the Predecessor Fund paid NLD $106,413 with respect to Class R-1 shares under the distribution plan. Subsequently, the Fund paid IMST Distributors, LLC $40,354. For the periods ended September 30, 2020 and April 30, 2020, the total of distribution fees incurred are disclosed on the Statement of Operations.
The Chesapeake Strategy Fund has adopted a Shareholder Servicing Plan to pay a fee at an annual rate of up to 0.25% of average daily net assets of Class A shares serviced by shareholder servicing agents who provide administrative and support services to their customers. For the period ended September 30, 2020, the Class A shares did not pay any shareholder servicing fees.
Note 8 – Indemnifications
In the normal course of business, the Funds enter into contracts that contain a variety of representations, which provide general indemnifications. The Funds’ maximum exposure under these arrangements is unknown, as this would involve future claims that may be made against the Funds that have not yet occurred. However, the Funds expect the risk of loss to be remote.
Note 9 – Fair Value Measurements and Disclosure
Fair Value Measurements and Disclosures defines fair value, establishes a framework for measuring fair value in accordance with GAAP, and expands disclosure about fair value measurements. It also provides guidance on determining when there has been a significant decrease in the volume and level of activity for an asset or a liability, when a transaction is not orderly, and how that information must be incorporated into a fair value measurement.
Under Fair Value Measurements and Disclosures, various inputs are used in determining the value of the Funds’ investments. These inputs are summarized into three broad Levels as described below:
| · | Level 1 – Unadjusted quoted prices in active markets for identical assets or liabilities that the Funds have the ability to access. |
| · | Level 2 – Observable inputs other than quoted prices included in level 1 that are observable for the asset or liability, either directly or indirectly. These inputs may include quoted prices for the identical instrument on an inactive market, prices for similar instruments, interest rates, prepayment speeds, credit risk, yield curves, default rates and similar data. |
| · | Level 3 – Unobservable inputs for the asset or liability, to the extent relevant observable inputs are not available; representing the Funds’ own assumptions about the assumptions a market participant would use in valuing the asset or liability and would be based on the best information available. |
The availability of observable inputs can vary from security to security and is affected by a wide variety of factors, including, for example, the type of security, whether the security is new and not yet established in the marketplace, the liquidity of markets, and other characteristics particular to the security. To the extent that valuation is based on models or inputs that are less observable or unobservable in the market, the determination of fair value requires more judgment. Accordingly, the degree of judgment exercised in determining fair value is greatest for instruments categorized in Level 3.
AXS Funds
NOTES TO CONSOLIDATED FINANCIAL STATEMENTS - Continued
September 30, 2020
The inputs used to measure fair value may fall into different Levels of the fair value hierarchy. In such cases, for disclosure purposes, the Level in the fair value hierarchy within which the fair value measurement falls in its entirety, is determined based on the lowest Level input that is significant to the fair value measurement in its entirety.
The inputs or methodology used for valuing securities are not an indication of the risk associated with investing in those securities. The following is a summary of the inputs used, as of September 30, 2020, in valuing the Funds’ assets carried at fair value:
| Alternative Growth Fund | | Level 1 | | | Level 2 | | | Level 3* | | | Total | |
| Assets | | | | | | | | | | | | |
| Investments | | | | | | | | | | | | | | | | |
| Exchange-Traded Funds | | $ | 70,080 | | | $ | - | | | $ | - | | | $ | 70,080 | |
| Short-Term Investments | | | 1,247,441 | | | | - | | | | - | | | | 1,247,441 | |
| U.S. Treasury Notes | | | - | | | | 5,310,437 | | | | - | | | | 5,310,437 | |
| Total Assets | | $ | 1,317,521 | | | $ | 5,310,437 | | | $ | - | | | $ | 6,627,958 | |
| Liabilities | | | | | | | | | | | | | | | | |
| Other Financial Instruments** | | | | | | | | | | | | | | | | |
| Futures Contracts | | $ | 73,115 | | | $ | - | | | $ | - | | | $ | 73,115 | |
| Swap Contract | | | - | | | | 810,634 | | | | - | | | | 810,634 | |
| Total Liabilities | | $ | 73,115 | | | $ | 810,634 | | | $ | - | | | $ | 883,749 | |
| Aspect Core Diversified Strategy Fund | | Level 1 | | | Level 2 | | | Level 3* | | | Total | |
| Assets | | | | | | | | | | | | |
| Investments | | | | | | | | | | | | |
| U.S. Treasury Notes | | $ | - | | | $ | 8,443,957 | | | $ | - | | | $ | 8,443,957 | |
| Short-Term Investments | | | 10,649,766 | | | | - | | | | - | | | | 10,649,766 | |
| Total Investments | | | 10,649,766 | | | | 8,443,957 | | | | - | | | | 19,093,723 | |
| Other Financial Instruments** | | | | | | | | | | | | | | | | |
| Futures Contracts | | | 286,082 | | | | - | | | | - | | | | 286,082 | |
| Forward Foreign Currency Contracts | | | - | | | | 144,837 | | | | - | | | | 144,837 | |
| Total Assets | | $ | 10,935,848 | | | $ | 8,588,794 | | | $ | - | | | $ | 19,524,642 | |
| | | | | | | | | | | | | | | | | |
| Liabilities | | | | | | | | | | | | | | | | |
| Other Financial Instruments** | | | | | | | | | | | | | | | | |
| Futures Contracts | | $ | 192,503 | | | $ | - | | | $ | - | | | $ | 192,503 | |
| Forward Foreign Currency Contracts | | | - | | | | 66,143 | | | | - | | | | 66,143 | |
| Total Liabilities | | $ | 192,503 | | | $ | 66,143 | | | $ | - | | | $ | 258,646 | |
AXS Funds
NOTES TO CONSOLIDATED FINANCIAL STATEMENTS - Continued
September 30, 2020
| Chesapeake Strategy Fund | | Level 1 | | | Level 2 | | | Level 3* | | | Total | |
| Assets | | | | | | | | | | | | |
| Investments | | | | | | | | | | | | |
| U.S. Treasury Notes | | $ | - | | | $ | 12,057,328 | | | $ | - | | | $ | 12,057,328 | |
| Short-Term Investments | | | 2,316,278 | | | | - | | | | - | | | | 2,316,278 | |
| Total Investments | | | 2,316,278 | | | | 12,057,328 | | | | - | | | | 14,373,606 | |
| Other Financial Instruments** | | | | | | | | | | | | | | | | |
| Futures Contracts | | | 393,828 | | | | - | | | | - | | | | 393,828 | |
| Total Assets | | $ | 2,710,106 | | | $ | 12,057,328 | | | $ | - | | | $ | 14,767,434 | |
| | | | | | | | | | | | | | | | | |
| Liabilities | | | | | | | | | | | | | | | | |
| Other Financial Instruments** | | | | | | | | | | | | | | | | |
| Futures Contracts | | $ | 529,622 | | | $ | - | | | $ | - | | | $ | 529,622 | |
| Total Liabilities | | $ | 529,622 | | | $ | - | | | $ | - | | | $ | 529,622 | |
| Managed Futures Strategy Fund | | Level 1 | | | Level 2 | | | Level 3* | | | Total | |
| Assets | | | | | | | | | | | | |
| Investments | | | | | | | | | | | | | | | | |
| U.S. Treasury Bills | | $ | - | | | $ | 9,998,650 | | | $ | - | | | $ | 9,998,650 | |
| U.S. Treasury Notes | | | - | | | | 46,661,586 | | | | - | | | | 46,661,586 | |
| Short-Term Investments | | | 18,554,973 | | | | - | | | | - | | | | 18,554,973 | |
| Total Investments | | $ | 18,554,973 | | | $ | 56,660,236 | | | $ | - | | | $ | 75,215,209 | |
| Other Financial Instruments** | | | | | | | | | | | | | | | | |
| Swap Contracts | | $ | - | | | $ | 1,025,354 | | | $ | - | | | $ | 1,025,354 | |
| Total Assets | | $ | - | | | $ | 1,025,354 | | | $ | - | | | $ | 1,025,354 | |
| | | | | | | | | | | | | | | | | |
| Liabilities | | | | | | | | | | | | | | | | |
| Other Financial Instruments** | | | | | | | | | | | | | | | | |
| Swap Contracts | | $ | - | | | $ | 14,326,897 | | | $ | - | | | $ | 14,326,897 | |
| Total Liabilities | | $ | - | | | $ | 14,326,897 | | | $ | - | | | $ | 14,326,897 | |
AXS Funds
NOTES TO CONSOLIDATED FINANCIAL STATEMENTS - Continued
September 30, 2020
| Multi-Strategy Alternatives Fund | | Level 1 | | | Level 2 | | | Level 3* | | | Total | |
| Assets | | | | | | | | | | | | | | | | |
| Investments | | | | | | | | | | | | | | | | |
| Investments1 | | $ | 46,603,361 | | | $ | - | | | $ | - | | | $ | 46,603,361 | |
| Exchange-Traded Funds | | | 7,603,331 | | | | - | | | | - | | | | 7,603,331 | |
| Short-Term Investments | | | 8,918,724 | | | | - | | | | - | | | | 8,918,724 | |
| Total Investments | | $ | 63,125,416 | | | $ | - | | | $ | - | | | $ | 63,125,416 | |
| Other Financial Instruments** | | | | | | | | | | | | | | | | |
| Swap Contracts | | | - | | | | 384,687 | | | | - | | | | 384,687 | |
| Total Assets | | $ | 63,125,416 | | | $ | 384,687 | | | $ | - | | | $ | 63,510,103 | |
| | | | | | | | | | | | | | | | | |
| Liabilities | | | | | | | | | | | | | | | | |
| Other Financial Instruments** | | | | | | | | | | | | | | | | |
| Swap Contracts | | $ | - | | | $ | 591,847 | | | $ | - | | | $ | 591,847 | |
| Total Liabilities | | $ | - | | | $ | 591,847 | | | $ | - | | | $ | 591,847 | |
| 1 | For a detailed break-out of common stocks by major industry classification, please refer to the Schedules of Investments. |
| * | The Funds did not hold any Level 3 securities at period end. |
| ** | Other financial instruments are derivative instruments such as swap contracts, futures contracts and forward foreign currency contracts. Swap contracts, futures contracts and forward foreign currency contracts are valued at the unrealized appreciation (depreciation) on the instrument. |
Note 10 – Derivative and Hedging Disclosure
Derivatives and Hedging requires enhanced disclosures about the Funds’ derivative and hedging activities, including how such activities are accounted for and their effects on the Funds’ financial position and performance. The Funds invested in futures contracts, swap contracts and forward foreign currency contracts during the periods ended September 30, 2020.
The effects of these derivative instruments on the Funds’ financial position and financial performance as reflected in the Consolidated Statements of Assets and Liabilities and Consolidated Statements of Operations are presented in the tables below. The fair values of derivative instruments, as of September 30, 2020, by risk category are as follows:
| Alternative Growth Fund |
| | | | | Liability Derivatives | |
| Derivatives not designated as hedging instruments | | Consolidated Statements of Assets and
Liabilities | | Value | |
| Equity contracts | | Unrealized depreciation on open futures contracts | | $ | 73,115 | |
| Mixed: Interest rate, equity and foreign exchange contracts | | Unrealized depreciation on open swap contract | | | 810,634 | |
| Total | | | | $ | 883,749 | |
AXS Funds
NOTES TO CONSOLIDATED FINANCIAL STATEMENTS - Continued
September 30, 2020
| Aspect Core Diversified Strategy Fund |
| | Asset Derivatives | | Liability Derivatives |
| Derivatives not designated as hedging instruments | | Consolidated Statements of Assets and
Liabilities | | | Value | | | Consolidated Statements of Assets and
Liabilities | | | Value | |
| Commodity contracts | | Unrealized appreciation on open futures contracts | | $ | 122,215 | | | Unrealized depreciation on open futures contracts | | $ | 90,030 | |
| Foreign exchange contracts | | Unrealized appreciation on open futures contracts
Unrealized appreciation on forward foreign currency exchange contracts | | | - 144,837 | | | Unrealized depreciation on open futures contracts
Unrealized depreciation on forward foreign currency exchange contracts | | | 86,893 66,143 | |
| Interest rate contracts | | Unrealized appreciation on open futures contracts | | | 118,024 | | | Unrealized depreciation on open futures contracts | | | 11,789 | |
| Equity contracts | | Unrealized appreciation on open futures contracts | | | 45,843 | | | Unrealized depreciation on open futures contracts | | | 3,791 | |
| Total | | | | $ | 430,919 | | | | | $ | 258,646 | |
AXS Funds
NOTES TO CONSOLIDATED FINANCIAL STATEMENTS - Continued
September 30, 2020
| Chesapeake Strategy Fund |
| | Asset Derivatives | | Liability Derivatives |
| Derivatives not designated as hedging instruments | | Consolidated
Statements of Assets
and Liabilities | | | Value | | | Consolidated
Statements of Assets
and Liabilities | | | Value | |
| Commodity contracts | | Unrealized appreciation on open futures contracts | | $ | 165,629 | | | Unrealized depreciation on open futures contracts | | $ | 205,966 | |
| Currency contracts | | Unrealized appreciation on open futures contracts | | | 66,503 | | | Unrealized depreciation on open futures contracts | | | 280,677 | |
| Interest rate contracts | | Unrealized appreciation on open futures contracts | | | 88,606 | | | Unrealized depreciation on open futures contracts | | | 42,979 | |
| Index contracts | | Unrealized appreciation on open futures contracts | | | 73,090 | | | Unrealized depreciation on open futures contracts | | | - | |
| Total | | | | $ | 393,828 | | | | | $ | 529,622 | |
| | | Managed Futures Strategy Fund |
| | | Asset Derivatives | | Liability Derivatives |
| Derivatives not designated as hedging instruments | | Consolidated
Statements of Assets
and Liabilities | | | Value | | | Consolidated
Statements of Assets
and Liabilities | | | Value | |
| Mixed: Interest rate, equity and foreign exchange contracts | | Unrealized appreciation on open swap contracts | | $ | 1,025,354 | | | Unrealized depreciation on open swap contracts | | $ | 14,326,897 | |
| | | Multi-Strategy Alternatives Fund |
| | | Asset Derivatives | | Liability Derivatives |
| Derivatives not designated as hedging instruments | | Consolidated
Statements of Assets
and Liabilities | | | Value | | | Consolidated
Statements of Assets
and Liabilities | | | Value | |
| Equity contracts | | Unrealized appreciation on open swap contracts | | $ | 384,687 | | | Unrealized depreciation on open swap contracts | | $ | 591,847 | |
AXS Funds
NOTES TO CONSOLIDATED FINANCIAL STATEMENTS - Continued
September 30, 2020
The effects of derivative instruments on the Consolidated Statements of Operations for the periods ended September 30, 2020, are as follows:
| Alternative Growth Fund |
| Amount of Realized Gain or (Loss) on Derivatives Recognized in the Consolidated Statements of Operations |
| Derivatives not designated as hedging instruments | | Futures Contracts | |
| Equity contracts | | $ | 815,897 | |
| Aspect Core Diversified Strategy Fund |
| Amount of Realized Gain or (Loss) on Derivatives Recognized in the Consolidated Statements of Operations |
| Derivatives not designated as hedging instruments | | Futures Contracts | | | Forward Foreign Currency Exchange Contracts | | | Total | |
| Commodity contracts | | $ | (376,721 | ) | | $ | - | | | $ | (376,721 | ) |
| Equity contracts | | | (1,092,259 | ) | | | - | | | | (1,092,259 | ) |
| Foreign exchange contracts | | | (324,221 | ) | | | (158,480 | ) | | | (472,701 | ) |
| Interest rate contracts | | | 765,465 | | | | - | | | | 765,465 | |
| Volatility contracts | | | - | | | | - | | | | - | |
| Total | | $ | (1,027,736 | ) | | $ | (158,480 | ) | | $ | (1,186,216 | ) |
| Chesapeake Strategy Fund |
| Amount of Realized Gain or (Loss) on Derivatives Recognized in the Consolidated Statements of Operations |
| Derivatives not designated as hedging instruments | | Futures Contracts | |
| Commodity contracts | | $ | (2,125,384 | ) |
| Currency contracts | | | (2,189,130 | ) |
| Equity contracts | | | (4,632,543 | ) |
| Index contracts | | | (3,569,081 | ) |
| Interest rate contracts | | | 3,216,955 | |
| Total | | $ | (9,299,183 | ) |
| Managed Futures Strategy Fund |
| Amount of Realized Gain or (Loss) on Derivatives Recognized in the Consolidated Statements of Operations |
| Derivatives not designated as hedging instruments | | Open Swap Contracts | |
| Mixed: Interest rate, equity and foreign exchange contracts | | $ | (12,309,920 | ) |
AXS Funds
NOTES TO CONSOLIDATED FINANCIAL STATEMENTS - Continued
September 30, 2020
| Multi-Strategy Alternatives Fund |
| Amount of Realized Gain or (Loss) on Derivatives Recognized in the Consolidated Statements of Operations |
| Derivatives not designated as hedging instruments | | Open Swap Contracts | |
| Equity contracts | | $ | (454,525 | ) |
| Alternative Growth Fund |
| Change in Unrealized Appreciation/Depreciation on Derivatives Recognized in the Consolidated Statements of Operations |
| Derivatives not designated as hedging instruments | | Futures Contracts | | | Open Swap Contract | | | Total | |
| Equity contracts | | $ | (59,771 | ) | | $ | - | | | $ | (59,771 | ) |
| Mixed: Interest rate, equity and foreign exchange contracts | | | - | | | | (207,399 | ) | | | (207,399 | ) |
| Aspect Core Diversified Strategy Fund |
| Change in Unrealized Appreciation/Depreciation on Derivatives Recognized in the Consolidated Statements of Operations |
| Derivatives not designated as hedging instruments | | Futures Contracts | | | Forward Foreign Currency Exchange Contracts | | | Total | |
| Commodity contracts | | $ | 114,775 | | | $ | - | | | $ | 114,775 | |
| Equity contracts | | | 19,385 | | | | - | | | | 19,385 | |
| Foreign exchange contracts | | | (201,737 | ) | | | 76,986 | | | | (124,751 | ) |
| Interest rate contracts | | | 179,845 | | | | - | | | | 179,845 | |
| Total | | $ | 112,268 | | | $ | 76,986 | | | $ | 189,254 | |
| Chesapeake Strategy Fund |
| Change in Unrealized Appreciation/Depreciation on Derivatives Recognized in the Consolidated Statements of Operations |
| Derivatives not designated as hedging instruments | | Futures Contracts | |
| Commodity contracts | | $ | (176,841 | ) |
| Currency contracts | | | (1,311,482 | ) |
| Equity contracts | | | (393,355 | ) |
| Index contracts | | | 73,090 | |
| Interest rate contracts | | | 435,984 | |
| Total | | $ | (1,372,604 | ) |
| Managed Futures Strategy Fund |
| Change in Unrealized Appreciation/Depreciation on Derivatives Recognized in the Consolidated Statements of Operations |
| Derivatives not designated as hedging instruments | | Open Swap Contracts | |
| Mixed: Interest rate, equity and foreign exchange contracts | | $ | (44,014,165 | ) |
AXS Funds
NOTES TO CONSOLIDATED FINANCIAL STATEMENTS - Continued
September 30, 2020
| Multi-Strategy Alternatives Fund |
| Change in Unrealized Appreciation/Depreciation on Derivatives Recognized in the Consolidated Statements of Operations |
| Derivatives not designated as hedging instruments | | Open Swap Contracts | |
| Equity contracts | | $ | 184,518 | |
The average quarterly volume of derivative instruments held by the Funds during the periods ended September 30, 2020 are as follows:
| Alternative Growth Fund |
| | | | | Futures Contracts | | | Open Swap Contract | |
| Equity contracts | | Notional Value | | $ | 8,669,490 | | | $ | - | |
| Mixed: Interest Rate, Equity and Foreign Exchange Contracts | | Notional Value | | | - | | | | 13,452,795 | |
| Aspect Core Diversified Strategy Fund |
| | | | | Long Futures Contracts | | | Short Futures Contracts | |
| Commodity contracts | | Notional Value | | $ | 1,542,435 | | | $ | 2,777,590 | |
| Currency contracts | | Notional Value | | | 3,482,991 | | | | 4,321,324 | |
| Index contracts | | Notional Value | | | 3,187,661 | | | | 6,396,478 | |
| Interest rate contracts | | Notional Value | | | 114,267,962 | | | | 32,624,779 | |
| Chesapeake Strategy Fund |
| | | | | Long Futures Contracts | | | Short Futures Contracts | |
| Commodity contracts | | Notional Value | | $ | 13,720,823 | | | $ | 13,097,752 | |
| Currency contracts | | Notional Value | | | 53,392,209 | | | | 38,561,040 | |
| Equity contracts | | Notional Value | | | 16,380,314 | | | | 1,141,220 | |
| Index contracts | | Notional Value | | | 103,234,204 | | | | 698,213 | |
| Interest rate contracts | | Notional Value | | | 61,310,996 | | | | - | |
| Managed Futures Strategy Fund |
| | | | | Open Swap Contract | |
| Mixed: Interest Rate, Equity and Foreign Exchange Contracts | | Notional Value | | $ | 574,889,935 | |
| Multi-Strategy Alternatives Fund |
| | | | | Open Swap Contracts - Long | | | Open Swap Contracts - Short | |
| Equity contracts | | Notional Value | | $ | 11,595,937 | | | $ | (11,642,021 | ) |
AXS Funds
NOTES TO CONSOLIDATED FINANCIAL STATEMENTS - Continued
September 30, 2020
The value of the forward foreign currency contracts outstanding as of September 30, 2020 as disclosed in the Consolidated Schedules of Investments and the amounts of realized gains and losses and changes in unrealized appreciation/(depreciation) on derivative instruments during the period as disclosed above and within the Consolidated Statement of Operations serve as indicators of the volume of derivative activity for the Aspect Core Diversified Strategy Fund.
Note 11 - Disclosures about Offsetting Assets and Liabilities
Disclosures about Offsetting Assets and Liabilities requires an entity to disclose information about offsetting and related arrangements to enable users of its financial statements to understand the effect of those arrangements on its financial position. The guidance requires retrospective application for all comparative periods presented.
A Fund mitigates credit risk with respect to OTC derivative counterparties through credit support annexes included with International Swaps and Derivative Association (“ISDA”) Master Agreements or other Master Netting Agreements which are the standard contracts governing most derivative transactions between the Funds and each of its counterparties. These agreements allow the Funds and each counterparty to offset certain derivative financial instruments’ payables and/or receivables against each other and/or with collateral, which is generally held by the Funds’ custodian. The amount of collateral moved to/from applicable counterparties is based upon minimum transfer amounts specified in the agreement. To the extent amounts due to the Funds from its counterparties are not fully collateralized contractually or otherwise, the Funds bear the risk of loss from counterparty non-performance.
It is the Funds’ policy to recognize a net asset or liability equal to the unrealized appreciation (depreciation) of futures, forward foreign currency exchange and swap contracts. As of September 30, 2020, the Funds are subject to a master netting arrangement for the futures and swap contracts. The following table shows additional information regarding the offsetting of assets and liabilities as of September 30, 2020:
| | | Alternative Growth Fund |
| | | | | | | | | | | | | | Amounts Not Offset in Statement of Assets and Liabilities | | | | |
| Description | | Counterparty | | Gross Amounts of Recognized Liabilities | | | Gross Amounts Offset in the Statement of Assets and Liabilities | | | Net Amounts of Liabilities Presented in the Statement of Assets and Liabilities | | | Financial Instruments* | | | Cash Collateral* | | | Net Amount | |
| Unrealized depreciation on open futures contracts | | Morgan Stanley | | $ | (73,115 | ) | | $ | - | | | $ | (73,115 | ) | | $ | - | | | $ | 73,115 | | | $ | - | |
| Unrealized depreciation on open swap contract | | Deutsche Bank | | | (810,634 | ) | | | - | | | | (810,634 | ) | | | - | | | | 810,634 | | | | - | |
AXS Funds
NOTES TO CONSOLIDATED FINANCIAL STATEMENTS - Continued
September 30, 2020
| | | Aspect Core Diversified Strategy Fund |
| | | | | | | | | | | | | | Amounts Not Offset in Statement of Assets and Liabilities | | | | |
| Description | | Counterparty | | Gross Amounts of Recognized Assets | | | Gross Amounts Offset in the Statement of Assets and Liabilities | | | Net Amounts of Assets Presented in the Statement of Assets and Liabilities | | | Financial Instruments* | | | Cash Collateral* | | | Net Amount | |
| Unrealized appreciation on open futures contracts | | Morgan Stanley | | $ | 286,082 | | | $ | (192,503 | ) | | $ | 93,579 | | | $ | - | | | $ | - | | | $ | - | |
| Unrealized appreciation on forward foreign currency exchange contracts | | Morgan Stanley | | | 144,837 | | | | (66,143 | ) | | | 78,694 | | | | - | | | | - | | | | - | |
| | | Chesapeake Strategy Fund |
| | | | | | | | | | | | | | Amounts Not Offset in Statement of Assets and Liabilities | | | | |
| Description | | Counterparty | | Gross Amounts of Recognized Liabilities | | | Gross Amounts Offset in the Statement of Assets and Liabilities | | | Net Amounts of Liabilities Presented in the Statement of Assets and Liabilities | | | Financial Instruments* | | | Cash Collateral* | | | Net Amount | |
| Unrealized depreciation on open futures contracts | | Morgan Stanley | | $ | (529,622 | ) | | $ | 393,828 | | | $ | (135,794 | ) | | $ | - | | | $ | 135,794 | | | $ | - | |
AXS Funds
NOTES TO CONSOLIDATED FINANCIAL STATEMENTS - Continued
September 30, 2020
| Managed Futures Strategy Fund |
| | | | | | | | | | | | | | Amounts Not Offset in Statement of Assets and Liabilities | | | | |
| Description | | Counterparty | | Gross Amounts of Recognized Liabilities | | | Gross Amounts Offset in the Statement of Assets and Liabilities | | | Net Amounts of Liabilities Presented in the Statement of Assets and Liabilities | | | Financial Instruments* | | | Cash Collateral* | | | Net Amount | |
| Unrealized depreciation on open swap contracts | | Deutsche Bank | | $ | (14,188,524 | ) | | $ | 1,015,513 | | | $ | (13,173,011 | ) | | $ | - | | | $ | 13,173,011 | | | $ | - | |
| Unrealized depreciation on open swap contracts | | Morgan Stanley | | | (138,373 | ) | | | 9,841 | | | | (128,532 | ) | | | - | | | | 128,532 | | | | - | |
| | | Multi-Strategy Alternatives Fund |
| | | | | | | | | | | | | | Amounts Not Offset in Statement of Assets and Liabilities | | | | |
| Description | | Counterparty | | Gross Amounts of Recognized Liabilities | | | Gross Amounts Offset in the Statement of Assets and Liabilities | | | Net Amounts of Liabilities Presented in the Statement of Assets and Liabilities | | | Financial Instruments* | | | Cash Collateral* | | | Net Amount | |
| Unrealized depreciation on open swap contracts | | Cowen | | $ | (591,847 | ) | | $ | 384,687 | | | $ | (207,160 | ) | | $ | 207,160 | | | $ | - | | | $ | - | |
| * | Amounts relate to master netting agreements and collateral agreements which have been determined by the Advisor to be legally enforceable in the event of default but where certain other criteria are not met in accordance with applicable offsetting accounting guidance. The collateral amounts may exceed the related net amounts of financial assets and liabilities presented in the Consolidated Statements of Assets and Liabilities. Where this is the case, the total amount reported is limited to the net amounts of financial assets and liabilities with that counterparty. |
AXS Funds
NOTES TO CONSOLIDATED FINANCIAL STATEMENTS - Continued
September 30, 2020
Note 12 – Control Ownership
The beneficial ownership, either directly or indirectly, of more than 25% of the voting securities of a Fund creates presumption of control of the Fund, under Section 2(a) 9 of the Act. As of September 30, 2020, beneficial ownership in excess of 25% is as follows:
| Fund | Beneficial Owner | % of Outstanding Shares |
| Alternative Growth Fund | National Financial Services, LLC | 54% |
| Aspect Core Diversified Strategy Fund | Alyssum Investments Limited | 42% |
| Chesapeake Strategy Fund | National Financial Services, LLC | 36% |
| Managed Futures Strategy Fund | Raymond James | 62% |
The Trust has no knowledge as to whether all or any portion of the shares owned of record are also owned beneficially.
Note 13 – New Accounting Pronouncement
In August 2018, FASB issued Accounting Standards Update No. 2018-13 ("ASU 2018-13"), "Disclosure Framework - Changes to the Disclosure Requirements for Fair Value Measurement," which amends the fair value measurement disclosure requirements of ASC Topic 820 ("ASC 820"), "Fair Value Measurement." ASU 2018-13 includes new, eliminated, and modified disclosure requirements for ASC 820. In addition, ASU 2018-13 clarifies that materiality is an appropriate consideration of entities when evaluating disclosure requirements. ASU 2018-13 is effective for all entities for fiscal years beginning after December 15, 2019, including interim periods therein. Early adoption is permitted, and the Funds have adopted ASU 2018-13 with these financial statements.
Note 14 – COVID-19 Risks
In early 2020, an outbreak of a novel strain of coronavirus (COVID-19) emerged globally. This coronavirus has resulted in closing international borders, enhanced health screenings, healthcare service preparation and delivery, quarantines, cancellations, disruptions to supply chains and customer activity, as well as general public concern and uncertainty. The impact of this outbreak has negatively affected the worldwide economy, as well as the economies of individual countries, the financial health of individual companies and the market in general in significant and unforeseen ways. The future impact of COVID-19 is currently unknown, and it may exacerbate other risks that apply to the Funds, including political, social and economic risks. Any such impact could adversely affect the Funds’ performance, the performance of the securities in which the Funds invest and may lead to losses on your investment in the Funds. The ultimate impact of COVID-19 on the financial performance of the Funds’ investments is not reasonably estimable at this time.
Note 15 – Events Subsequent to the Fiscal Period End
The Funds have adopted financial reporting rules regarding subsequent events which require an entity to recognize in the financial statements the effects of all subsequent events that provide additional evidence about conditions that existed at the date of the balance sheet. Management has evaluated the Funds’ related events and transactions that occurred through the date of issuance of the Funds’ consolidated financial statements. There were no events or transactions that occurred during this period that materially impacted the amounts or disclosures in the Funds’ consolidated financial statements.
Report of Independent Registered Public Accounting Firm
To the Board of Trustees of Investment Managers Series Trust II
and the Shareholders of AXS Alternative Growth Fund
Opinion on the Financial Statements
We have audited the accompanying consolidated statement of assets and liabilities of AXS Alternative Growth Fund (the Fund), including the consolidated schedule of investments, as of September 30, 2020, the related consolidated statements of operations for the period from July 1, 2020 through September 30, 2020 and the year ended June 30, 2020, the consolidated statements of changes in net assets for the period from July 1, 2020 through September 30, 2020 and for the years ended June 30, 2020 and June 30, 2019, the financial highlights for the period from July 1, 2020 through September 30, 2020 and the years ended June 30, 2020, 2019, 2018, 2017 and 2016 and the related notes to the consolidated financial statements (collectively, the financial statements). In our opinion, the financial statements present fairly, in all material respects, the financial position of the Fund as of September 30, 2020, the results of its operations for the period from July 1, 2020 through September 30, 2020 and the year ended June 30, 2020, the changes in net assets for the period from July 1, 2020 through September 30, 2020 and years ended June 30, 2020 and June 30, 2019, and the financial highlights for the period from July 1, 2020 through September 30, 2020 and the years ended June 30, 2020, 2019, 2018, 2017 and 2016, in conformity with accounting principles generally accepted in the United States of America.
Basis for Opinion
These financial statements are the responsibility of the Fund’s management. Our responsibility is to express an opinion on the Fund’s financial statements based on our audits. We are a public accounting firm registered with the Public Company Accounting Oversight Board (United States) (PCAOB) and are required to be independent with respect to the Fund in accordance with U.S. federal securities laws and the applicable rules and regulations of the Securities and Exchange Commission and the PCAOB.
We conducted our audits in accordance with the standards of the PCAOB. Those standards require that we plan and perform the audit to obtain reasonable assurance about whether the financial statements are free of material misstatement, whether due to error or fraud. The Fund is not required to have, nor were we engaged to perform, an audit of its internal control over financial reporting. As part of our audits, we are required to obtain an understanding of internal control over financial reporting but not for the purpose of expressing an opinion on the effectiveness of the Fund’s internal control over financial reporting. Accordingly, we express no such opinion.
Our audits included performing procedures to assess the risks of material misstatement of the financial statements, whether due to error or fraud, and performing procedures that respond to those risks. Such procedures included examining, on a test basis, evidence regarding the amounts and disclosures in the financial statements. Our procedures included confirmation of investments owned as of September 30, 2020, by correspondence with the custodian, broker and swap counterparty. Our audits also included evaluating the accounting principles used and significant estimates made by management, as well as evaluating the overall presentation of the financial statements. We believe that our audits provide a reasonable basis for our opinion.
/s/ RSM US LLP
We have served as the auditor of one or more AXS Investments LLC advised investment companies since 2010.
Denver, Colorado
November 30, 2020
Report of Independent Registered Public Accounting Firm
To the Board of Trustees of Investment Managers Series Trust II
and the Shareholders of AXS Aspect Core Diversified Strategy Fund, AXS Chesapeake Strategy Fund, and AXS Managed Futures Strategy Fund
Opinion on the Financial Statements
We have audited the accompanying consolidated statements of assets and liabilities of AXS Aspect Core Diversified Strategy Fund (formerly Equinox Aspect Core Diversified Strategy Fund), AXS Chesapeake Strategy Fund (formerly Equinox Chesapeake Strategy Fund), and AXS Managed Futures Strategy Fund (formerly Equinox MutualHedge Futures Strategy Fund) (collectively, the Funds), including the consolidated schedules of investments, as of September 30, 2020, the related consolidated statements of operations for the year then ended, the consolidated statements of changes in net assets for each of the two years in the period then ended, the financial highlights for each of the five years in the period then ended and the related notes to the consolidated financial statements (collectively, the financial statements). In our opinion, the financial statements present fairly, in all material respects, the financial position of the Funds as of September 30, 2020, the results of their operations for the year then ended, the changes in net assets for each of the two years in the period then ended, and the financial highlights for each of the five years in the period then ended, in conformity with accounting principles generally accepted in the United States of America.
Basis for Opinion
These financial statements are the responsibility of the Funds’ management. Our responsibility is to express an opinion on the Funds’ financial statements based on our audits. We are a public accounting firm registered with the Public Company Accounting Oversight Board (United States) (PCAOB) and are required to be independent with respect to the Funds in accordance with U.S. federal securities laws and the applicable rules and regulations of the Securities and Exchange Commission and the PCAOB.
We conducted our audits in accordance with the standards of the PCAOB. Those standards require that we plan and perform the audits to obtain reasonable assurance about whether the financial statements are free of material misstatement, whether due to error or fraud. The Funds are not required to have, nor were we engaged to perform, audits of their internal control over financial reporting. As part of our audits, we are required to obtain an understanding of internal control over financial reporting but not for the purpose of expressing an opinion on the effectiveness of the Funds’ internal control over financial reporting. Accordingly, we express no such opinion.
Our audits included performing procedures to assess the risks of material misstatement of the financial statements, whether due to error or fraud, and performing procedures that respond to those risks. Such procedures included examining, on a test basis, evidence regarding the amounts and disclosures in the financial statements. Our procedures included confirmation of investments owned as of September 30, 2020, by correspondence with the custodians, brokers, and swap counterparties. Our audits also included evaluating the accounting principles used and significant estimates made by management, as well as evaluating the overall presentation of the financial statements. We believe that our audits provide a reasonable basis for our opinion.
/s/ RSM US LLP
We have served as the auditor of one or more AXS Investments LLC advised investment companies since 2010.
Denver, Colorado
November 30, 2020
Report of Independent Registered Public Accounting Firm
To the Board of Trustees of Investment Managers Series Trust II
and the Shareholders of AXS Multi-Strategy Alternatives Fund
Opinion on the Financial Statements
We have audited the accompanying statement of assets and liabilities of AXS Multi-Strategy Alternatives Fund (the Fund), including the schedule of investments, as of September 30, 2020, the related statements of operations for the period from May 1, 2020 through September 30, 2020 and the year ended April 30, 2020, the statements of changes in net assets for the period from May 1, 2020 through September 30, 2020 and the years ended April 30, 2020 and April 30, 2019, the financial highlights for the period from May 1, 2020 through September 30, 2020 and the years ended April 30, 2020 and April 30, 2019 and the related notes to the financial statements (collectively, the financial statements). In our opinion, the financial statements present fairly, in all material respects, the financial position of the Fund as of September 30, 2020, the results of its operations for the period from May 1, 2020 through September 30, 2020 and the year ended April 30, 2020, the changes in net assets for the period from May 1, 2020 through September 30, 2020 and for the years ended April 30, 2020 and 2019, and the financial highlights for the period from May 1, 2020 through September 30, 2020 and the years ended April 30, 2020 and 2019, in conformity with accounting principles generally accepted in the United States of America.
The financial highlights for the years ended April 30, 2018, April 30, 2017 and April 30, 2016, for the Fund were audited by other auditors. Those auditors expressed an unqualified opinion on those financial statements and financial highlights in their report dated June 27, 2018.
Basis for Opinion
These financial statements are the responsibility of the Fund’s management. Our responsibility is to express an opinion on the Fund’s financial statements based on our audits. We are a public accounting firm registered with the Public Company Accounting Oversight Board (United States) (PCAOB) and are required to be independent with respect to the Fund in accordance with U.S. federal securities laws and the applicable rules and regulations of the Securities and Exchange Commission and the PCAOB.
We conducted our audits in accordance with the standards of the PCAOB. Those standards require that we plan and perform the audit to obtain reasonable assurance about whether the financial statements are free of material misstatement, whether due to error or fraud. The Fund is not required to have, nor were we engaged to perform, an audit of its internal control over financial reporting. As part of our audits, we are required to obtain an understanding of internal control over financial reporting but not for the purpose of expressing an opinion on the effectiveness of the Fund’s internal control over financial reporting. Accordingly, we express no such opinion.
Our audits included performing procedures to assess the risks of material misstatement of the financial statements, whether due to error or fraud, and performing procedures that respond to those risks. Such procedures included examining, on a test basis, evidence regarding the amounts and disclosures in the financial statements. Our procedures included confirmation of investments owned as of September 30, 2020, by correspondence with the custodian and swap counterparty. Our audits also included evaluating the accounting principles used and significant estimates made by management, as well as evaluating the overall presentation of the financial statements. We believe that our audits provide a reasonable basis for our opinion.
/s/ RSM US LLP
We have served as the auditor of one or more AXS Investments LLC advised investment companies since 2010.
Denver, Colorado
November 30, 2020
AXS Funds
SUPPLEMENTAL INFORMATION (Unaudited)
Trustees and Officers Information
Additional information about the Trustees is included in the Funds’ Statement of Additional Information which is available, without charge, upon request by calling (833) 297-2587. The Trustees and officers of the Fund and their principal occupations during the past five years are as follows:
| Name, Address, Year of Birth and Position(s) held with Trust | Term of Officec and Length of Time Served | Principal Occupation During the Past Five Years and Other Affiliations | Number of Portfolios in the Fund Complex Overseen by Trusteed | Other Directorships Held by Trustee During the Past Five Yearse |
| Independent Trustees: | | |
Thomas Knipper, CPA a (Born 1957) Trustee | Since September 2013 | Vice President and Chief Compliance Officer, Ameritas Investment Partners, a registered investment advisor (1995 – present). | 5 | None. |
Kathleen K. Shkuda a (born 1951) Trustee | Since September 2013 | Zigzag Consulting, a financial services consulting firm (2008 – present). Director, Managed Accounts, Merrill Lynch (2007-2008). | 5 | None. |
Larry D. Tashjian a (born 1953) Trustee and Chairman of the Board | Since September 2013 | Principal, CAM Capital Advisors, a family office (2001 – present). | 5 | General Finance Corporation. |
John P. Zader a (born 1961) Trustee | Since September 2013 | Retired (June 2014 – present); CEO, UMB Fund Services, Inc., a mutual fund and hedge fund service provider, and the transfer agent, fund accountant, and co-administrator for the Fund (December 2006 – June 2014); President, Investment Managers Series Trust (December 2007 - June 2014). | 5 | Investment Managers Series Trust, a registered investment company (includes 55 portfolios), and 361 Social Infrastructure Fund, a closed-end investment company. |
| Interested Trustee: | | |
Eric M. Banhazl b† (born 1957) Trustee | Since September 2013 | Chairman (2016 – present), and President (2006 – 2015), Mutual Fund Administration, LLC, co-administrator for the Fund. Trustee and Vice President, Investment Managers Series Trust (September 2013 – January 2016). Chairman (2018 – present), Foothill Capital Management, LLC, a registered investment advisor. | 5 | Investment Managers Series Trust, a registered investment company (includes 55 portfolios), and 361 Social Infrastructure Fund, a closed-end investment company. |
AXS Funds
SUPPLEMENTAL INFORMATION (Unaudited) – Continued
| Interested Trustee: | | | | |
Terrance P. Gallagher a* (born 1958) Trustee and President | Since July 2019 | President, Investment Managers Series Trust II (September 2013 – present); Executive Vice President, UMB Fund Services, Inc. (2007 – present). Director of Compliance, Unified Fund Services Inc. (now Huntington Fund Services), a mutual fund service provider (2004 – 2007). | 5 | Cliffwater Corporate Lending Fund, a registered investment company; GAI Corbin Multi Strategy Fund, a closed-end investment company; and GAI Agility Income Fund, a closed-end investment company. |
| Officers of the Trust: | | | | |
Rita Dam b (born 1966) Treasurer and Assistant Secretary | Since September 2013 | Co-President, Foothill Capital Management, LLC, a registered investment advisor (2018 – present); Co-Chief Executive Officer (2016 – present), and Vice President (2006 – 2015), Mutual Fund Administration, LLC. | N/A | N/A |
Joy Ausili b (born 1966) Vice President and Assistant Secretary | Since January 2016 | Co-President, Foothill Capital Management, LLC, a registered investment advisor (2018 – present); Co-Chief Executive Officer (2016 – present), and Vice President (2006 – 2015), Mutual Fund Administration, LLC; Secretary and Assistant Treasurer, Investment Managers Series Trust (September 2013 – January 2016). | N/A | N/A |
Diane Drake b (born 1967) Secretary | Since January 2016 | Senior Counsel, Mutual Fund Administration, LLC (October 2015 – present). Managing Director and Senior Counsel, BNY Mellon Investment Servicing (US) Inc. (2010 – 2015). Chief Compliance Officer (2018 – 2019), Foothill Capital Management, LLC, a registered investment advisor. | N/A | N/A |
Martin Dziura b (born 1959) Chief Compliance Officer | Since September 2013 | Principal, Dziura Compliance Consulting, LLC (October 2014 - present). Managing Director, Cipperman Compliance Services (2010 – September 2014). Chief Compliance Officer, Hanlon Investment Management (2009 - 2010). Vice President − Compliance, Morgan Stanley Investment Management (2000 − 2009). | N/A | N/A |
| a | Address for certain Trustees and certain officers: 235 West Galena Street, Milwaukee, Wisconsin 53212. |
| b | Address for Mr. Banhazl, Ms. Ausili, Ms. Dam and Ms. Drake: 2220 E. Route 66, Suite 226, Glendora, California 91740. Address for Mr. Dziura: 309 Woodridge Lane, Media, Pennsylvania 19063. |
| c | Trustees and officers serve until their successors have been duly elected. |
| d | The Trust is comprised of 16 series managed by unaffiliated investment advisors. The term “Fund Complex” applies only to the Fund managed by the same investment advisor. The Fund’s investment advisor also serves as the investment advisor to the AXS Multi-Strategy Alternatives Fund, AXS Chesapeake Strategy Fund, AXS Aspect Core Diversified Strategy Fund and AXS Managed Futures Strategy Fund which are offered in separate prospectus. The Fund does not hold itself out as related to any other series within the Trust, for purposes of investment and investor services. |
AXS Funds
SUPPLEMENTAL INFORMATION (Unaudited) – Continued
| e | “Other Directorships Held” includes only directorship of companies required to register or file reports with the SEC under the Securities Exchange Act of 1934, as amended (that is, “public companies”) or other investment companies registered under the 1940 Act. |
| † | Mr. Banhazl is an “interested person” of the Trust by virtue of his position with Mutual Fund Administration, LLC and Foothill Capital Management, LLC. |
| * | Mr. Gallagher is an “interested person” of the Trust by virtue of his position with UMB Fund Services, Inc. |
AXS Funds
EXPENSE EXAMPLE
For the Six Months Ended September 30, 2020 (Unaudited)
Expense Example
As a shareholder of the Funds, you incur two types of costs: (1) transaction costs; and (2) ongoing costs, including management fees; distribution and/or 12b-1 fees (Class A, Class C, and Class R-1 shares only) and other Fund expenses. The examples below are intended to help you understand your ongoing costs (in dollars) of investing in the Funds and to compare these costs with the ongoing costs of investing in other mutual funds.
These examples are based on an investment of $1,000 invested at the beginning of the period and held for the entire period from April 1, 2020 to September 30, 2020.
Actual Expenses
The information in the row titled “Actual Performance” of the table below provides actual account values and actual expenses. You may use the information in these columns, together with the amount you invested, to estimate the expenses that you paid over the period. Simply divide your account value by $1,000 (for example, an $8,600 account value divided by $1,000 = 8.6), then multiply the result by the number in the appropriate row for your share class, under the column titled “Expenses Paid During Period” to estimate the expenses you paid on your account during this period.
Hypothetical Example for Comparison Purposes
The information in the row titled “Hypothetical (5% annual return before expenses)” of the table below provides hypothetical account values and hypothetical expenses based on the Fund’s actual expense ratios and an assumed rate of return of 5% per year before expenses, which is not the Fund’s actual return. The hypothetical account values and expenses may not be used to estimate the actual ending account balance or expenses you paid for the period. You may use this information to compare the ongoing costs of investing in the Fund and other funds. To do so, compare these 5% hypothetical examples with the 5% hypothetical examples that appear in the shareholder reports of the other funds.
Please note that the expenses shown in the table are meant to highlight your ongoing costs only and do not reflect any transaction costs, such as sales charges (load) or contingent deferred sales charges. Therefore, the information in the row titled “Hypothetical (5% annual return before expenses)” is useful in comparing ongoing costs only, and will not help you determine the relative total costs of owning different funds. In addition, if these transactional costs were included, your costs would have been higher.
| Alternative Growth Fund | | Beginning Account Value | | | Ending Account Value | | | Expenses Paid During Period* | |
| | | | | 4/1/20 | | | 9/30/20 | | | 4/1/20 – 9/30/20 | |
| Class A | | Actual Performance | | $ | 1,000.00 | | | $ | 1,235.20 | | | $ | 6.94 | |
| | | Hypothetical (5% annual return before expenses) | | | 1,000.00 | | | | 1,018.86 | | | | 6.27 | |
| Class I | | Actual Performance | | | 1,000.00 | | | | 1,238.40 | | | | 5.55 | |
| | | Hypothetical (5% annual return before expenses) | | | 1,000.00 | | | | 1,020.16 | | | | 5.01 | |
| * | Expenses are equal to the Fund’s annualized expense ratios of 1.24% and 0.99% for Class A shares and Class I shares, respectively, multiplied by the average account values over the period, multiplied by 183/365 (to reflect the six month period). The expense ratios reflect an expense waiver. Assumes all dividends and distributions were reinvested. |
AXS Funds
EXPENSE EXAMPLE - Continued
For the Six Months Ended September 30, 2020 (Unaudited)
| Aspect Core Diversified Strategy Fund | | Beginning Account Value | | | Ending Account Value | | | Expenses Paid During Period* | |
| | | | | 4/1/20 | | | 9/30/20 | | | 4/1/20 – 9/30/20 | |
| Class A | | Actual Performance | | $ | 1,000.00 | | | $ | 937.00 | | | $ | 8.21 | |
| | | Hypothetical (5% annual return before expenses) | | | 1,000.00 | | | | 1,016.52 | | | | 8.55 | |
| Class C | | Actual Performance | | | 1,000.00 | | | | 932.40 | | | | 11.73 | |
| | | Hypothetical (5% annual return before expenses) | | | 1,000.00 | | | | 1,012.86 | | | | 12.22 | |
| Class I | | Actual Performance | | | 1,000.00 | | | | 937.10 | | | | 7.03 | |
| | | Hypothetical (5% annual return before expenses) | | | 1,000.00 | | | | 1,017.74 | | | | 7.33 | |
| * | Expenses are equal to the Fund’s annualized expense ratios of 1.70%, 2.43%, and 1.45% for Class A shares, Class C share, and Class I shares, respectively, multiplied by the average account values over the period, multiplied by 183/366 (to reflect the six month period). The expense ratios reflect an expense waiver. Assumes all dividends and distributions were reinvested. |
| Chesapeake Strategy Fund | | Beginning Account Value | | | Ending Account Value | | | Expenses Paid During Period* | |
| | | | | 4/1/20 | | | 9/30/20 | | | 4/1/20 – 9/30/20 | |
| Class A | | Actual Performance | | $ | 1,000.00 | | | $ | 989.50 | | | $ | 10.56 | |
| | | Hypothetical (5% annual return before expenses) | | | 1,000.00 | | | | 1,014.39 | | | | 10.69 | |
| Class C | | Actual Performance | | | 1,000.00 | | | | 986.10 | | | | 14.28 | |
| | | Hypothetical (5% annual return before expenses) | | | 1,000.00 | | | | 1,010.62 | | | | 14.46 | |
| Class I | | Actual Performance | | | 1,000.00 | | | | 990.60 | | | | 9.20 | |
| | | Hypothetical (5% annual return before expenses) | | | 1,000.00 | | | | 1,015.76 | | | | 9.31 | |
| * | Expenses are equal to the Fund’s annualized expense ratios of 2.12%, 2.88% and 1.85% for Class A shares, Class C shares and Class I shares, respectively, multiplied by the average account values over the period, multiplied by 183/366 (to reflect the six month period). The expense ratios reflect an expense waiver. Assumes all dividends and distributions were reinvested. |
| Managed Futures Strategy Fund | | Beginning Account Value | | | Ending Account Value | | | Expenses Paid During Period* | |
| | | | | 4/1/20 | | | 9/30/20 | | | 4/1/20 – 9/30/20 | |
| Class A | | Actual Performance | | $ | 1,000.00 | | | $ | 881.00 | | | $ | 9.20 | |
| | | Hypothetical (5% annual return before expenses) | | | 1,000.00 | | | | 1,015.22 | | | | 9.85 | |
| Class I | | Actual Performance | | | 1,000.00 | | | | 878.80 | | | | 12.70 | |
| | | Hypothetical (5% annual return before expenses) | | | 1,000.00 | | | | 1,011.48 | | | | 13.60 | |
| Class I | | Actual Performance | | | 1,000.00 | | | | 882.50 | | | | 8.03 | |
| | | Hypothetical (5% annual return before expenses) | | | 1,000.00 | | | | 1,016.47 | | | | 8.60 | |
| * | Expenses are equal to the Fund’s annualized expense ratios of 1.95%, 2.70%, and 1.70% for Class A shares, Class C share, and Class I shares, respectively, multiplied by the average account values over the period, multiplied by 183/366 (to reflect the six month period). The expense ratios reflect an expense waiver. Assumes all dividends and distributions were reinvested. |
AXS Funds
EXPENSE EXAMPLE - Continued
For the Six Months Ended September 30, 2020 (Unaudited)
| Multi-Strategy Alternatives Fund | | Beginning Account Value | | | Ending Account Value | | | Expenses Paid During Period* | |
| | | | | 4/1/20 | | | 9/30/20 | | | 4/1/20 – 9/30/20 | |
| Class R-1 | | Actual Performance | | $ | 1,000.00 | | | $ | 1,089.10 | | | $ | 8.71 | |
| | | Hypothetical (5% annual return before expenses) | | | 1,000.00 | | | | 1,016.73 | | | | 8.41 | |
| Class I | | Actual Performance | | | 1,000.00 | | | | 1,089.80 | | | | 7.32 | |
| | | Hypothetical (5% annual return before expenses) | | | 1,000.00 | | | | 1,018.06 | | | | 7.07 | |
* Expenses are equal to the Fund’s annualized expense ratios of 1.66% and 1.40% for Class R-1 shares and Class I shares, respectively, multiplied by the average account values over the period, multiplied by 183/365 (to reflect the six month period). Assumes all dividends and distributions were reinvested.
This page is intentionally left blank
This page is intentionally left blank
This page is intentionally left blank
AXS Funds
Each a series of Investment Managers Series Trust II
Investment Advisor
AXS Investments LLC
181 Westchester Avenue, Unit 402
Port Chester, New York 10573
Sub-Advisor
Ampersand Investment Management, LLC
47 Hulfish Street, Suite 510
Princeton, New Jersey 08542
Sub-Advisor
Kerns Capital Management, Inc.
9821 Katy Freeway, Suite 400
Houston, Texas 77024
Sub-Advisor
Aspect Capital Limited
10 Portman Square
London W1H 6AZ United Kingdom
Sub-Advisor
Chesapeake Capital Corporation
1721 Summit Avenue
Richmond, Virginia 23220
Independent Registered Public Accounting Firm
RSM US LLP
555 17th Street, Suite 1200
Denver, Colorado 80202
Custodian
UMB Bank, n.a.
928 Grand Boulevard, 5th Floor
Kansas City, Missouri 64106
Fund Co-Administrator
Mutual Fund Administration, LLC
2220 E. Route 66, Suite 226
Glendora, California 91740
Fund Co-Administrator, Transfer Agent and Fund Accountant
UMB Fund Services, Inc.
235 W. Galena Street
Milwaukee, Wisconsin 53212
Distributor
IMST Distributors, LLC
Three Canal Plaza, Suite 100
Portland, Maine 04101
www.foreside.com
FUND INFORMATION
| TICKER | CUSIP |
| AXS Alternative Growth Fund – Class A | EEHAX | 46141T 430 |
| AXS Alternative Growth Fund – Class I | EEHIX | 46141T 380 |
| AXS Aspect Core Diversified Strategy Fund – Class A | EQAAX | 46141T 422 |
| AXS Aspect Core Diversified Strategy Fund – Class C | EQACX | 46141T 414 |
| AXS Aspect Core Diversified Strategy Fund – Class I | EQAIX | 46141T 398 |
| AXS Chesapeake Strategy Fund – Class A | ECHAX | 46141T 471 |
| AXS Chesapeake Strategy Fund – Class C | ECHCX | 46141T 463 |
| AXS Chesapeake Strategy Fund – Class I | EQCHX | 46141T 372 |
| AXS Managed Futures Strategy Fund – Class A | MHFAX | 46141T 521 |
| AXS Managed Futures Strategy Fund – Class C | MHFCX | 46141T 513 |
| AXS Managed Futures Strategy Fund – Class I | MHFIX | 46141T 489 |
| AXS Multi-Strategy Alternatives Fund – Class I | KCMIX | 46141T 455 |
| AXS Multi-Strategy Alternatives Fund – Class R-1 | KCMTX | 46141T 448 |
Privacy Principles of the AXS Funds for Shareholders
The Funds are committed to maintaining the privacy of its shareholders and to safeguarding its non-public personal information. The following information is provided to help you understand what personal information the Funds collect, how we protect that information and why, in certain cases, we may share information with select other parties.
Generally, the Funds do not receive any non-public personal information relating to its shareholders, although certain non-public personal information of its shareholders may become available to the Funds. The Funds do not disclose any non-public personal information about its shareholders or former shareholders to anyone, except as permitted by law or as is necessary in order to service shareholder accounts (for example, to a transfer agent or third party administrator).
This report is sent to shareholders of the AXS Funds for their information. It is not a Prospectus, circular or representation intended for use in the purchase or sale of shares of the Funds or of any securities mentioned in this report.
Proxy Voting
The Funds’ proxy voting policies and procedures, as well as information regarding how the Funds voted proxies for portfolio securities, if applicable, during the most recent 12-month period ended June 30, are available, without charge and upon request by calling (833) 297-2587 or on the SEC’s website at www.sec.gov.
Fund Portfolio Holdings
The Funds file a complete schedule of their portfolio holdings with the SEC for the first and third quarters of each fiscal year on Form N-PORT within 60 days of the end of such fiscal quarter. Shareholders may obtain the Funds’ Form N-PORT on the SEC’s website at www.sec.gov.
Prior to their use of Form N-PORT, the Funds file their complete schedule of portfolio holdings with the SEC on Form N-Q, which is available online at www.sec.gov.
Householding
The Funds will mail only one copy of shareholder documents, including prospectuses, annual and semi-annual reports and proxy statements, to shareholders with multiple accounts at the same address. This practice is commonly called “householding” and is intended to reduce expenses and eliminate duplicate mailings of shareholder documents. Mailings of your shareholder documents may be householded indefinitely unless you instruct us otherwise. If you do not want the mailing of these documents to be combined with those for other members of your household, please call the Funds at (833) 297-2587.
AXS Funds
P.O. Box 2175
Milwaukee, WI 53201
Toll Free: (833) 297-2587
Item 2. Code of Ethics.
The registrant has adopted a code of ethics that applies to the registrant's principal executive officer and principal financial officer. The registrant has not made any amendments to its code of ethics during the period covered by this report. The registrant has not granted any waivers from any provisions of the code of ethics during the period covered by this report.
The registrant undertakes to provide to any person without charge, upon request, a copy of its code of ethics by mail when they call the registrant at 1-833-297-2587.
Item 3. Audit Committee Financial Expert.
The Board of Trustees of the Registrant has determined that the Registrant has the following “audit committee financial experts” as defined in Item 3(b) of Form N-CSR serving on its Audit Committee: Messrs. Thomas Knipper and John P. Zader. The audit committee financial experts are “independent” as that term is defined in Item 3(a)(2) of Form N-CSR.
Item 4. Principal Accountant Fees and Services.
The registrant has engaged its principal accountant to perform audit services, audit-related services, tax services and other services during the past two fiscal years. "Audit services" refer to performing an audit of the registrant's annual financial statements or services that are normally provided by the accountant in connection with statutory and regulatory filings or engagements for those fiscal years. "Audit-related services" refer to the assurance and related services by the principal accountant that are reasonably related to the performance of the audit. "Tax services" refer to professional services rendered by the principal accountant for tax compliance, tax advice, and tax planning. There were no "other services" provided by the principal accountant. The following table details the aggregate fees billed or expected to be billed for each of the last two fiscal years for audit fees, audit-related fees, tax fees and other fees by the principal accountant.
| AXS Alternative Growth Fund | FYE 9/30/2020 | FYE 6/30/2020 |
| Audit Fees | $21,000 | $26,000 |
| Audit-Related Fees | N/A | N/A |
| Tax Fees | $4,500 | $4,000 |
| All Other Fees | N/A | N/A |
| AXS Aspect Core Diversified Strategy Fund | FYE 9/30/2020 | FYE 9/30/2019 |
| Audit Fees | $18,750 | N/A |
| Audit-Related Fees | N/A | N/A |
| Tax Fees | $4,000 | N/A |
| All Other Fees | N/A | N/A |
| AXS Chesapeake Strategy Fund | FYE 9/30/2020 | FYE 9/30/2019 |
| Audit Fees | $18,750 | N/A |
| Audit-Related Fees | N/A | N/A |
| Tax Fees | $4,000 | N/A |
| All Other Fees | N/A | N/A |
| AXS Managed Futures Strategy Fund | FYE 9/30/2020 | FYE 9/30/2019 |
| Audit Fees | $32,500 | N/A |
| Audit-Related Fees | N/A | N/A |
| Tax Fees | $4,000 | N/A |
| All Other Fees | N/A | N/A |
| AXS Multi-Strategy Alternatives Fund | FYE 9/30/2020 | FYE 4/30/2020 |
| Audit Fees | $12,000 | $14,000 |
| Audit-Related Fees | N/A | N/A |
| Tax Fees | $4,500 | $4,000 |
| All Other Fees | N/A | N/A |
The audit committee has adopted pre-approval policies and procedures that require the audit committee to pre-approve all audit and non-audit services of the registrant, including services provided to any entity affiliated with the registrant.
Prior to the reorganization, the aggregate audit and tax fees billed by RSM US LLP, for Equinox Ampersand Strategy Fund, were $26,250 for the year ended June 30, 2019. Prior to the reorganization, the aggregate audit and tax fees billed by RSM US LLP, for Equinox Aspect Core Diversified Strategy Fund, Equinox Chesapeake Strategy Fund and Equinox MutualHedge Futures Strategy Fund, were $23,250, $28,000 and $41,200, respectively, for the year ended September 30, 2019. Prior to the reorganization, the aggregate audit and tax fees billed by RSM US LLP, for KCM Macro Trends Fund, were $17,300 for the year ended April 30, 2019.
The percentage of fees billed by RSM US LLP applicable to non-audit services pursuant to waiver of pre-approval requirement were as follows:
| AXS Alternative Growth Fund | FYE 9/30/2020 | FYE 6/30/2020 |
| Audit-Related Fees | 0% | N/A |
| Tax Fees | 0% | N/A |
| All Other Fees | 0% | N/A |
| AXS Aspect Core Diversified Strategy Fund, AXS Chesapeake Strategy Fund, AXS Managed Futures Strategy Fund | FYE 9/30/2020 | FYE 9/30/2019 |
| Audit-Related Fees | 0% | N/A |
| Tax Fees | 0% | N/A |
| All Other Fees | 0% | N/A |
| AXS Multi-Strategy Alternatives Fund | FYE 9/30/2020 | FYE 4/30/2020 |
| Audit-Related Fees | 0% | N/A |
| Tax Fees | 0% | N/A |
| All Other Fees | 0% | N/A |
All of the principal accountant's hours spent on auditing the registrant's financial statements were attributed to work performed by full-time permanent employees of the principal accountant.
Prior to the reorganization, there were no percentage of fees billed by RSM US LLP, for Equinox Ampersand Strategy Fund for the year ended June 30, 2019. Prior to the reorganization, there were no percentage of fees billed by RSM US LLP, for Equinox Aspect Core Diversified Strategy Fund, Equinox Chesapeake Strategy Fund and Equinox MutualHedge Futures Strategy Fund for the year ended September 30, 2019. Prior to the reorganization, there were no percentage of fees billed by RSM US LLP, for KCM Macro Trends Fund for the year ended April 30, 2019.
The following table indicates the non-audit fees billed or expected to be billed by the registrant's accountant for services to the registrant and to the registrant's investment advisor (and any other controlling entity, etc.—not sub-advisor) for the last two years. The audit committee of the Board of Trustees has considered whether the provision of non-audit services that were rendered to the registrant's investment advisor is compatible with maintaining the principal accountant's independence and has concluded that the provision of such non-audit services by the accountant has not compromised the accountant's independence.
| AXS Alternative Growth Fund | | |
| Non-Audit Related Fees | FYE 9/30/2020 | FYE 6/30/2020 |
| Registrant | N/A | N/A |
| Registrant’s Investment Advisor | N/A | N/A |
| AXS Aspect Core Diversified Strategy Fund, AXS Chesapeake Strategy Fund, AXS Managed Futures Strategy Fund | | |
| Non-Audit Related Fees | FYE 9/30/2020 | FYE 9/30/2019 |
| Registrant | N/A | N/A |
| Registrant’s Investment Advisor | N/A | N/A |
| AXS Multi-Strategy Alternatives Fund | | |
| Non-Audit Related Fees | FYE 9/30/2020 | FYE 4/30/2020 |
| Registrant | N/A | N/A |
| Registrant’s Investment Advisor | N/A | N/A |
Prior to the reorganization, there were no non-audit related fees billed by RSM US LLP, for Equinox Ampersand Strategy Fund for the year ended June 30, 2019. Prior to the reorganization, there were no non-audit related fees billed by RSM US LLP, for Equinox Aspect Core Diversified Strategy Fund, Equinox Chesapeake Strategy Fund and Equinox MutualHedge Futures Strategy Fund for the year ended September 30, 2019. Prior to the reorganization, there were no non-audit related fees billed by RSM US LLP, for KCM Macro Trends Fund for the year ended April 30, 2019.
Item 5. Audit Committee of Listed Registrants.
| (a) | Not applicable to registrants who are not listed issuers (as defined in Rule 10A-3 under the Securities Exchange Act of 1934). |
Item 6. Schedule of Investments.
| (a) | Schedule of Investments is included as part of the report to shareholders filed under Item 1 of this Form. |
Item 7. Disclosure of Proxy Voting Policies and Procedures for Closed-End Management Investment Companies.
Not applicable to open-end investment companies.
Item 8. Portfolio Managers of Closed-End Management Investment Companies.
Not applicable to open-end investment companies.
Item 9. Purchases of Equity Securities by Closed-End Management Investment Company and Affiliated Purchasers.
Not applicable.
Item 10. Submission of Matters to a Vote of Security Holders.
The registrant has not made any material changes to the procedures by which shareholders may recommend nominees to the registrant’s Board of Trustees.
Item 11. Controls and Procedures.
| (a) | The Registrant’s President/Chief Executive Officer and Treasurer/Chief Financial Officer have reviewed the Registrant's disclosure controls and procedures (as defined in Rule 30a-3(c) under the Investment Company Act of 1940 (the “Act”)) as of a date within 90 days of the filing of this report, as required by Rule 30a-3(b) under the Act and Rules 13a-15(b) or 15d-15(b) under the Securities Exchange Act of 1934. Based on their review, such officers have concluded that the disclosure controls and procedures are effective in ensuring that information required to be disclosed in this report is appropriately recorded, processed, summarized and reported and made known to them by others within the Registrant and by the Registrant’s service provider. |
| (b) | There were no changes in the Registrant's internal control over financial reporting (as defined in Rule 30a-3(d) under the Act) that occurred during the period covered by this report that has materially affected, or is reasonably likely to materially affect, the Registrant's internal control over financial reporting. |
Item 12. Disclosure of Securities Lending Activities for Closed-End Management Investment Companies.
Not applicable to open-end investment companies.
Item 13. Exhibits.
(2) Certifications pursuant to Section 302 of the Sarbanes-Oxley Act of 2002. Filed herewith.
(3) Any written solicitation to purchase securities under Rule 23c-1 under the Act sent or given during the period covered by the report by or on behalf of the registrant to 10 or more persons. Not applicable to open-end investment companies.
(4) Change in the registrant’s independent public accountant. There was no change in the registrant’s independent public accountant for the period covered by this report.
SIGNATURES
Pursuant to the requirements of the Securities Exchange Act of 1934 and the Investment Company Act of 1940, the registrant has duly caused this report to be signed on its behalf by the undersigned, thereunto duly authorized.
| (Registrant) | Investment Managers Series Trust II | |
| | | |
| | |
| By (Signature and Title) | /s/ Terrance Gallagher | |
| Terrance Gallagher, President/Chief Executive Officer | |
| | | |
| | |
| Date | 12/9/2020 | |
Pursuant to the requirements of the Securities Exchange Act of 1934 and the Investment Company Act of 1940, this report has been signed below by the following persons on behalf of the registrant and in the capacities and on the dates indicated.
| By (Signature and Title) | /s/ Terrance Gallagher | |
| Terrance Gallagher, President/Chief Executive Officer | |
| | | |
| | |
| Date | 12/9/2020 | |
| | | |
| | |
| By (Signature and Title) | /s/ Rita Dam | |
| Rita Dam, Treasurer/Chief Financial Officer | |
| | | |
| | |
| Date | 12/9/2020 | |