UNITED STATES
SECURITIES AND EXCHANGE COMMISSION
Washington, D.C. 20549
FORM N-CSR
CERTIFIED SHAREHOLDER REPORT OF REGISTERED
MANAGEMENT INVESTMENT COMPANIES
Investment Company Act file number 811-22894
INVESTMENT MANAGERS SERIES TRUST II
(Exact name of registrant as specified in charter)
235 W. Galena Street
Milwaukee, WI 53212
(Address of principal executive offices) (Zip code)
Diane J. Drake
Mutual Fund Administration, LLC
2220 E. Route 66, Suite 226
Glendora, CA 91740
(Name and address of agent for service)
(414) 299-2295
Registrant's telephone number, including area code
Date of fiscal year end: November 30
Date of reporting period: November 30, 2020
Item 1. Report to Stockholders.
| (a) | The registrant’s annual report transmitted to shareholders pursuant to Rule 30e-1 under the Investment Company Act of 1940, as amended (the “Investment Company Act”), is as follows: |
ACR Multi-Strategy Quality Return (MQR) Fund
Class A Shares
(Ticker Symbol: MQRAX)
Class I Shares
(Ticker Symbol: MQRIX)
ACR International Quality Return (IQR) Fund
Class A Shares
(Ticker Symbol: IQRAX)
Class I Shares
(Ticker Symbol: IQRIX)
ANNUAL REPORT
November 30, 2020
ACR Funds
Each a series of Investment Managers Series Trust II
Table of Contents
| Shareholder Letters | 1 |
| Fund Performance | 27 |
| Schedule of Investments | 31 |
| Statements of Assets and Liabilities | 37 |
| Statements of Operations | 38 |
| Statements of Changes in Net Assets | 39 |
| Financial Highlights | 41 |
| Notes to Financial Statements | 45 |
| Report of Independent Registered Public Accounting Firm | 56 |
| Supplemental Information | 58 |
| Expense Examples | 67 |
This report and the financial statements contained herein are provided for the general information of the shareholders of the ACR Funds. This report is not authorized for distribution to prospective investors in the Funds unless preceded or accompanied by an effective prospectus.
www.acr-investfunds.com
November 30, 2020
Dear Shareholders:
The ACR Alpine Capital Research investment team is pleased to present its sixth annual investment letter for the ACR Multi-Strategy Quality Return (MQR) Fund (“MQR” or “MQR Fund,” or “the Fund”).
Our aim with this annual report is to provide a summary and discussion of the MQR Fund’s performance and positioning, plus its audited financial statements. ACR’s fund website, www.acr-investfunds.com, also provides information about the Fund and connects you to ACR’s firm website, which includes quarterly firm commentaries that explain our investment philosophy, view of market conditions, and investment strategies.
ACR understands that the trust and confidence of MQR Fund shareholders is contingent upon integrity between ACR’s words and actions and, ultimately, the MQR Fund’s investment results. The ACR investment team strives to earn and keep that trust and confidence, and we look forward to partnering with shareholders for many years of prosperity and intelligent decision-making.
8000 Maryland Avenue, Suite 700 | St. Louis, MO 63105
t 314.932.7600 | f 314.932.1111 | 877.849.7733 | acr-invest.com
Management’s Discussion of Fund Performance
| Total Fund Market Return | Fiscal Year Ended 11/30/2020 | Inception To Date Return1 |
| MQRAX with Maximum Sales Load2 | 7.24% | 3.10% |
| MQRAX at NAV | 13.76% | 4.14% |
| MQRIX at NAV | 13.91% | 4.32% |
| MSCI ACWI (Gross) Index | 15.58% | 9.57% |
| HFRI Equity Hedge (Total) Index | 14.72% | 5.83% |
| 1 | Reflects 71 months of performance, annualized, as fund was launched 12/31/2014. |
| 2 | Reflects a deduction for the fund’s maximum front-end sales charge of 5.75%. |
Per the current prospectus, gross and net expense ratios for the Class I Shares were 1.70% and 1.31% respectively and for the Class A Shares were 1.91% and 1.52% respectively.
The Fund’s Advisor has contractually agreed to waive its fees and/or pay for operating expenses to ensure that total annual fund operating expenses do not exceed 1.40% and 1.25% of the average daily net assets of Class A and Class I shares of the Fund, respectively. This agreement is in effect until March 31, 2021, and it may be terminated before that date only by the Trust’s Board of Trustees. The Fund’s advisor is permitted to seek reimbursement from the Fund, subject to certain limitations, of fees waived or payments made to the Fund for a period of three years from the date of the waiver or payment.
The performance data quoted here represents past performance, which is not a guarantee of future results. Investment return and principal value will fluctuate so that an investor's shares when redeemed may be worth more or less than their original cost. Current performance may be lower or higher than the performance information quoted. The most recent month end performance may be obtained by calling (855) 955-9552.
The MQR Fund Class I generated a 13.91% return in Fiscal 2020 versus a return of 15.58% for the MSCI ACWI (Gross) Index.
Although MQR modestly underperformed its benchmark, the Fund had a good year as it generated returns above its investee companies’ cost of capital. As market volatility grew, the investment team deployed substantial capital in fiscal year 2020 as the Fund’s net long exposure increased to approximately 97% from 78% at the prior year end. Finally, the price-to-value ratio of the Fund declined to 0.72x from 0.74x at the end of the prior year, suggesting that the Fund’s net asset value is well supported and that there is the potential for strong returns in the periods ahead.
This following will provide an overview of the Fund’s Fiscal 2020 performance, discuss the market conditions that have caused the Fund to underperform since inception, and discuss why the investment team’s research indicates that the Fund is well positioned going forward.
MQR Objectives
The investment objectives of the MQR Fund are to preserve capital during periods of economic decline and provide above-average absolute and relative returns in the long run. “Long run” is defined as an investment performance period that includes a full economic cycle of expansion and contraction in output and equity market prices.
“Above-average absolute returns” means higher than a “fair” equity-like return (i.e., stock market returns over a full market cycle) commensurate with the risk of investing in equities in the long run. The term “absolute return” in no way implies there will be positive returns in any period other than in the “long run” as defined above. Market value fluctuations are expected to produce significant negative returns in certain short-term periods. Annual market returns are expected to be both positive and negative.
“Above-average relative returns” means returns higher than returns of an equity-market benchmark in the long run. The equity market benchmark is the MSCI ACWI Index because it is a broad proxy for the world equity market.
ACR achieves each of these objectives by seeking securities that (a) have reliable cash flows and (b) are priced at a discount to a conservative estimate of the present value of these cash flows. The investment team refrains from putting capital to work in a security unless the investment, at fundamental value, is expected to generate at least a 5-7% annualized return over inflation. We believe the discipline to purchase the security at a discount to our estimate of fundamental value should allow us to earn an excess return over this minimum hurdle. More importantly, the discount to fundamental value helps protect capital against permanent impairment, thereby increasing the likelihood that the Fund meets its return hurdles.
Overview of Fiscal 2020 Performance
The MQR Fund Class I generated a 13.91% return in Fiscal 2020 versus a return of 15.58% for the MSCI ACWI (Gross) Index.
Though modestly underperforming its benchmark, the Fund had a good year, generating returns above its investee companies’ cost of capital.
The investment team believes these market returns were solid in view of the fact that growth stocks continued to outperform value stocks throughout the year. In fact, the Russell 1000 Growth Index was up an astonishing 36.4%, while the Russell 1000 value index was up just 1.7% in the period!1
Our fundamental investment approach relies upon our team investing in industries in which our research can drive an understanding of future margin structures for businesses, the opportunity for those companies to redeploy capital in their businesses at attractive returns, and ultimately an understanding of the terminal economics of each business we analyze. In general, our investments hew closer to the types of companies found in value indices versus those of growth indices. This is because companies in growth industries tend to have embedded pricing expectations that force one to speculate on the long-term structure of each of the items above rather than establish a high-quality understanding of those items. Given this value bent, we were pleased to see that the Fund performed within earshot of its benchmark’s return while also giving Fund shareholders an opportunity to own very inexpensive securities.
| 1 | The Russell 1000® Growth Index measures the performance of the large cap growth segment of the US equity universe. It includes those Russell 1000® companies with higher price-to-book ratios and higher forecasted growth values. The Russell 1000® Value Index measures the performance of the large cap value segment of the US equity universe. It includes those Russell 1000® companies with lower price-to-book ratios and lower expected growth values. |
In each of our commentaries since Fund’s inception, we have written about the high-priced market environment that has caused us to remain cautious in deploying Fund capital. Indeed, in last year’s letter, we discussed how the Fund closed the year with just 77% net long exposure. In FY2020, market volatility around COVID-19 lockdowns in March caused intra-market discrepancies to widen and allowed ACR’s investment team to take off the majority of its hedges against small-cap stock indices and increase exposures to certain holdings, such that we ended the year with a 97% net long position.
The chart below illustrates that as markets reached their peak in February 2020, our net exposure drifted down modestly from the fiscal year, and then as markets declined in March and April, we materially added to our net exposures—ultimately becoming nearly fully invested by year end as equity prices in the portfolio appreciated.
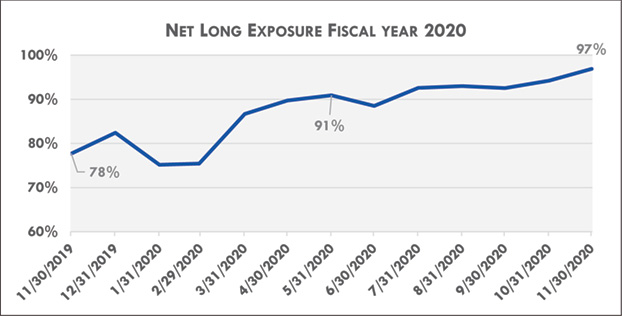
As of November 30, 2020
Source: ACR
In addition to increasing the Fund’s net exposures, the Price to Value (P/V) ratio of the Fund declined modestly in the period to 0.72x from 0.74x in the prior year. Note that the P/V statistic measures the discount at which our portfolio trades to intrinsic value, and its reciprocal, 1/0.72x, or 39%, is the amount by which these holdings would appreciate if the Fund’s holdings were all to immediately reach intrinsic value. The chart below shows the Fund’s P/V since we began recording it in November 2017. One can see the significant volatility caused by COVID-19 dislocations this year and then the Fund’s material recovery.
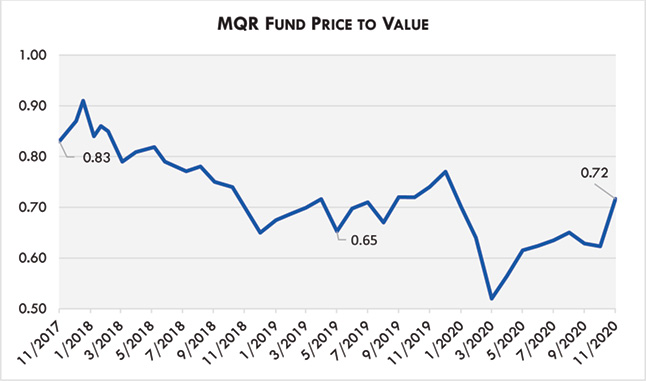
As of November 30, 2020
Source: ACR
Detractors and Contributors Fiscal 2020
The three largest detractors for the Fund in FY2020 were Embraer, Fairfax Financial and Howard Hughes.
Embraer, a Brazilian company and the world’s third largest manufacturer of commercial aircraft, was impacted by two events. COVID-19 caused aircraft orders to falter, and then, unexpectedly, Boeing cancelled a planned joint venture with Embraer. The combination of these two items weakened Embraer’s balance sheet and future prospects. We re-evaluated our investment thesis based on these items and concluded that Embraer’s business quality was impaired, and we sold at a material loss.
Fairfax Financial declined in the period with other insurers given the company’s insured exposure to COVID-19 claims as well as material mark-to-market losses in its investment book, which is made up of a number of deep-value equity investments. The Fund continues to hold its shares in Fairfax as the investment team believes the company is well positioned to administrate COVID-19 claims, and that the fair value of its investment holdings is well in excess of their current market prices. A “hard market,” which is a period of higher insurance pricing, also appears to have started, and we believe this bodes well for Fairfax’s future profitability.
Howard Hughes, a real estate operating company and developer, declined because of two factors. First, in December 2019 and January 2020, the company was reviewing strategic options that included the potential for selling the entire company outright. In January, the company announced that it had opted not to move forward with a sale, and the market sold the shares off some 25% on disappointment that no deal occurred. In February and March, Howard Hughes declined materially as COVID-19 impacted lease revenue at the company’s operating assets while also forcing the company to push out its plans to develop more of its real estate assets. The investment team believes that the market overreacted to the situation at Howard Hughes and that the company’s shares trade at a material discount to their intrinsic value.
The three largest contributors to the Fund in FY2020 were Naked Wines, Ashtead and General Motors.
The largest positive contributor to performance was the Fund’s investment in Naked Wines. Although Naked Wines is a U.K.-based company it is considered the largest winery in the U.S. selling wine online only, direct to consumer. The business was already well positioned with a superior product at a better value for money than retail wine merchants and was growing approximately 15% per year. The COVID-19 induced lockdowns in all its markets (i.e., U.S., U.K., Australia), however, further improved the company’s market opportunity. Individuals hesitant to order wine online were convinced to try the product during this lockdown period. This led to Naked Wines’ revenue increasing by 80% year over year for the six-month period ending September 2020. While it is uncertain how many of the newly acquired customers will remain loyal post the COVID-19 environment, the step change in the company’s revenue generation, name recognition and product awareness has materially improved its operating efficiency and prospects. We have increased our estimate of value for the business and remain shareholders.
The second largest contributor to Fund performance was the Fund’s investment in Ashtead Group plc. Ashtead is a U.K.-based general equipment rental business most well-known for its U.S.-based equipment rental subsidiary, Sunbelt Rentals. As the U.S.’s second largest equipment rental company, just behind United Rentals, we had admired Sunbelt Rentals, its strategy and its management team for many years. The items that kept us from investing in the business before were its high share price and our view on the sustainability of its market share gains. The opportunity to finally invest in the business came during the COVID-19 pandemic as Ashtead’s share price dropped approximately 40% from the end of 2019 to mid-March 2020. In addition to the more attractive share price, our market share gain concerns were alleviated as we estimated that the company’s competitive positioning would improve during the COVID-19 pandemic. The COVID-19 pandemic required equipment tool rental businesses to shift to digital order intake, have contactless equipment pick-up, maintain a well serviced and available equipment inventory, and abide by all the newly introduced health and safety protocols. Local and even regional competitors appeared less able to satisfy these new customer demands and hence our confidence in Ashtead’s continued market share gains from its current 10% position increased. The stock market, eventually, appeared to see a similar improvement in Ashtead’s long-term business prospects, as its share price appreciated materially from the date of the Fund’s initial investment through the end of fiscal 2020. The Fund remains a shareholder of the company at fiscal year-end 2020.
General Motors, the third largest contributor to Fund performance, outperformed in the period as the company surprised Wall Street with very low losses in its calendar second quarter due to COVID-19 production stoppages. Additionally, throughout the third and fourth quarter new auto sales recovered dramatically, and stimulus from the CARES Act kept non-performing auto loans to low levels while also helping to drive unprecedented used vehicle pricing and demand. GM continues to trade at a substantial discount to the sum of its parts and it ended the fiscal year as the Fund’s largest holding.
Market Conditions that Have Caused Underperformance Since Inception
Two phenomena have impacted the MQR Fund since inception. First, as discussed briefly above, ACR’s analysis generally has a “value” tilt to it, and value stocks have been exceptionally out of favor. Second, the Fund has a global investment mandate and has overweighted ex-US since inception due to lower valuations found in international markets.
ACR’s investment team has come to call the past several years the “Value Depression,” as generally those companies with established business models and lower price/earnings (P/E) ratios have underperformed, while those in nascent businesses have seen their share prices rise exponentially. One example of this is in the U.S., where the Russell 1000 Growth Index is up 171% since the inception of the Fund, while the Russell 1000 Value Index is up just 50%.
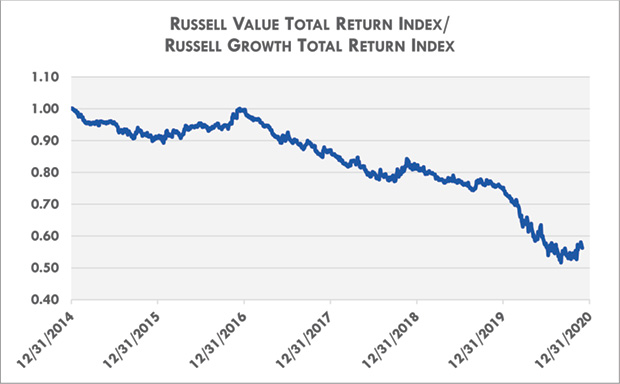
As of November 30, 2020
Source: Bloomberg
Secondarily, ACR has been overweight ex-U.S. holdings since the MQR Fund’s inception. This overweight has been driven in part by low P/E ratios internationally relative to that of the U.S. Due to the technology sector’s low weighting outside of the U.S., international benchmarks have underperformed the U.S. during this Value Depression. Specifically, the S&P 500 is up 98% since inception of the Fund versus a 37% return for the MSCI ACWI Ex-US. MQR has generally held 30-40% of its holdings in U.S. stocks, while the U.S. weighting in the MSCI is over 50%.
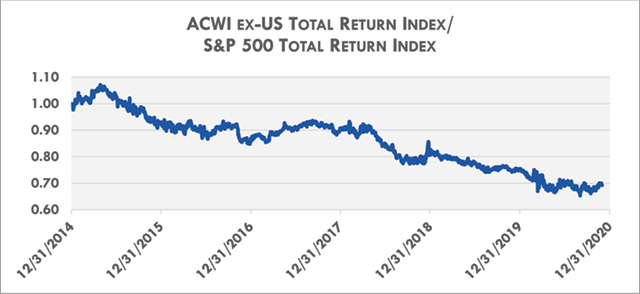
As of November 30, 2020
Source: Bloomberg
As we discuss in the section below, ACR does not expect these trends to persist forever, and our research shows that our companies are well positioned relative to those in the ACWI.
Current Positioning of the MQR Fund
The MQR Fund is concentrated in a select number of opportunities with characteristics that the ACR investment team believes are substantially different than that of the market. In order to outperform, a manager must develop a portfolio of ideas that is differentiated from the market and be willing to underperform (as we have recently) for periods of time as the underlying characteristics of the manager’s holdings are recognized. ACR is excited about the makeup of its portfolio today relative to that of the market.
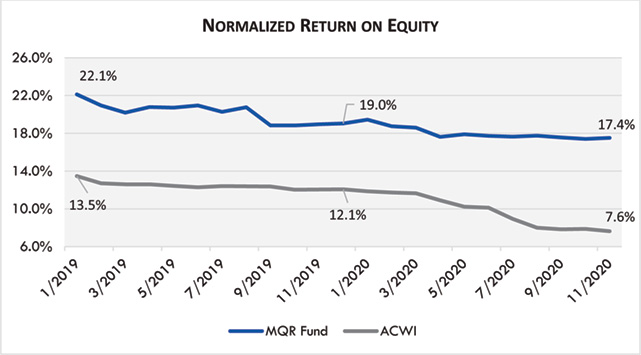
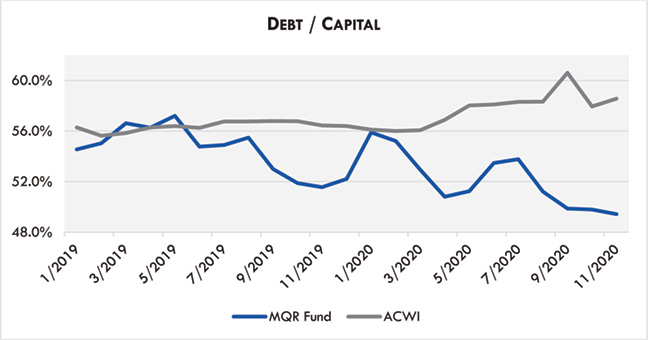
Today, as is shown graphically in the charts below, MQR is structured with a portfolio that has a weighted average P/E that is well below that of the ACWI with returns on equity that are well above and price to book (P/B) values that are well below those of the index.2 Plus, with debt to capital that is below that of the average company in the index, we believe that our Fund as a whole has greater financial flexibility than that of the index.3
2 Price to Book compares the market capitalization of a company to its common shareholders’ equity.
3 Debt to Capital compares the debt of a company to the total of its debt plus its shareholders’ equity.
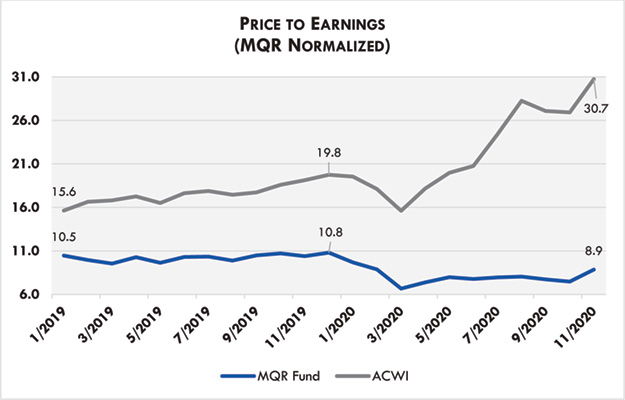
As of November 30, 2020
Source: Bloomberg
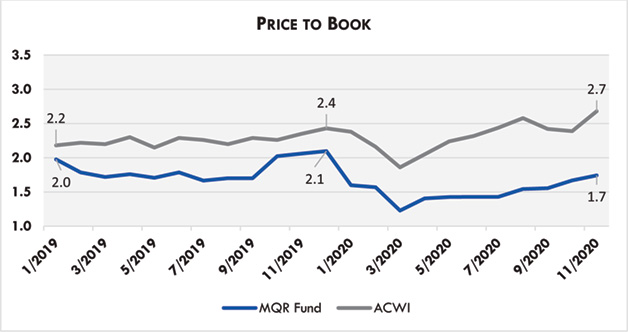
As of November 30, 2020
Source: Bloomberg
As of November 30, 2020
Source: Bloomberg
As of November 30, 2020
Source: Bloomberg
Though we don’t know when the market will appreciate the characteristics of our portfolio companies, we believe that the substantial discrepancy between each of the figures above bodes very well for future relative and absolute returns in MQR Fund.
Conclusion
MQR’s performance in the just completed fiscal year was good from an intrinsic value and market price growth perspective. However, the Fund’s longer-term performance has been constrained by the Value Depression and an overweight to international holdings. Given the low P/E, low P/B, high ROE and low debt to capital statistics of the MQR Fund in both absolute terms and relative to that of its benchmark, the ACR investment team is confident that the MQR fund is well positioned to generate attractive returns in future periods.
Thank you for your continued trust,
The ACR Investment Team
Appendix: ACR’s Investment Principles
Investment Principles
Intrinsic value and risk is our focus when evaluating investments
Intrinsic (or fundamental) value is the cash generated by an enterprise or asset over its useful life. Intrinsic value is earned in the future as dividends, interest, and principal are paid or as retained earnings are successfully reinvested.
Risk is the likelihood and potential magnitude of a permanent decline in the earning power or asset value of an enterprise, or the payment of a market price at purchase which is higher than intrinsic value. Our objective is to mitigate risk through integrity with our investment principles and investment process excellence.
When buying, we never confuse intrinsic value with market price. Market price is what we pay. Intrinsic value is what we get. Market price may be found quoted daily from news services or ascertained from past transaction records. Intrinsic value is determined by enterprise cash flows.
Market price, it follows, is not a barometer we would use to evaluate corporate performance. Our evaluation of corporate performance is based on items such as income, assets, and return on capital. We view the price of a security simply as a record of what others – well informed or not – were willing to pay for it at various times in the past.
Intrinsic value is such a critical concept because it is the only reference point for what an investment is actually worth, and therefore, whether or not the market price is fair, high, or low. Two facts support this view. First, the theoretical point that an investment is worth the present value of its future cash flows is self-evident and undisputed. Second, new era theories that have driven market prices to speculative levels in the short run have always succumbed to intrinsic value in the long run.
We insist on quality with a margin of safety
The quality of a security is defined by the reliability of the cash flows or assets which comprise its intrinsic value. The quality of an investment is defined by the price paid for the intrinsic value received.
A quantifiable margin of safety is the hallmark of a quality investment. For higher rated fixed income investments, an issuer’s available resources must be significantly greater than the interest and principal due the investor. For lower rated fixed income investments selling below their principal value, the assets backing an issue must be significantly greater than its price. For equity investments, the intrinsic value of a company must be significantly greater than its price. For other types of investments and as a general rule, the probability of achieving a return commensurate with the risk taken must be very high.
We only invest in what we understand
True understanding is built upon high probability statements about security values. It requires a dogged determination to get to the bottom of things and an equally dogged honesty about whether or not we did.
Understanding is also relative. Achieving better-than-average returns requires understanding security values better-than-average. The problem is most investment managers believe they are better-than-average.
Competence and honesty are the keys to assuring that we are not fooling ourselves. Competence means that we are capable of estimating security values and returns for both our portfolios and the markets in which we participate. Honesty means that we are candid about our relative return advantage or lack thereof, and only commit capital when we have an advantage.
Diversification and concentration are balanced with knowledge
Proper diversification is paramount to quality at the portfolio level. Proper diversification is achieved when the overall portfolio return is protected from unexpected adverse results in individual holdings, industries, countries, or other risk factors.
Proper concentration can be risk reducing as well as value enhancing. Concentration refers to making greater commitments to more attractive investments. The greater the difference between intrinsic value and market price, the more robust our knowledge of an investment’s value, and the lower the risk of the investment, the more capital we are willing to concentrate in that investment.
Successfully executed, concentration has three benefits: (a) returns are enhanced by selecting investments with the highest probability of success, (b) risk is reduced by avoiding mediocre and poor commitments, and (c) knowledge is improved by concentrating the analytical effort.
A concentrated portfolio with fewer holdings is desirable when value-to-price, understanding, and quality are high. A low-cost, more widely diversified approach to a market is appropriate when there are no clear advantages in understanding, and therefore, in our ability to evaluate quality or estimate value-to-price.
Communication is essential for intelligent investor decision-making
One of the greatest risks investors face is selling low in a panic. Education and communication can greatly reduce this risk. We explain to investors the difference between intrinsic and market value and openly share the rationale behind our investment decision-making. We believe this significantly reduces the risk of investors selling at market bottoms or buying at market tops.
Communication is also important for evaluating an investment manager’s abilities. Luck, risk, and a bull market can make an incompetent manager look brilliant. Conversely, every brilliant manager will under-perform at some time, and usually this is the best time to invest with them. Investors must look beyond performance to evaluate manager competence. To aid current and prospective investors in this endeavor, we regularly discuss the strategy and holdings behind our performance, and candidly address both our successes and mistakes.
The views in this letter were as of November 30th 2020 and may not necessarily reflect the same views on the date this letter is first published or any time thereafter. These views are intended to help shareholders in understanding the fund’s investment methodology and do not constitute investment advice.

November 30, 2020
Dear Shareholders:
The ACR Alpine Capital Research investment team is pleased to present our fourth annual investment report for the ACR International Quality Return (IQR) Fund (“IQR” or “IQR Fund” or “the Fund”) covering the period November 30, 2019 through November 30, 2020.
Communication is one of ACR’s core principles, and we firmly believe that clear communication is essential for intelligent shareholder decision-making. Without clear communication and an understanding of the Fund’s investment process, shareholders risk making suboptimal financial decisions. ACR seeks a shareholder base who remains committed to a long-term investment holding horizon and makes investment decisions based on logic and relevant facts rather than impulse or fear. A more stable shareholder base with a longer holding horizon allows the ACR investment team to appropriately execute the IQR Fund investment process.
Our aim with this annual report is to provide you the information you need to understand the performance and positioning of the IQR Fund. This report includes a summary and discussion of the Fund’s performance and its audited financial statements. In addition, our website, www.acr-investfunds.com, provides a wealth of information about the Fund and ACR. We would also encourage you to read ACR’s investment principles (attached as an appendix to this letter) as these underpin the IQR investment process.
We understand that your trust and confidence in ACR, and the IQR Fund, is contingent upon the integrity between ACR’s words and actions, and ultimately the IQR Fund’s investment results. The ACR investment team will strive to earn and keep that trust and confidence, and we look forward to partnering with shareholders for many years of prosperity and intelligent decision- making.
Sincerely,
Willem Schilpzand, CFA ®
Portfolio Manager
8000 Maryland Avenue, Suite 700 | St. Louis, MO 63105
t 314.932.7600 | f 314.932.1111 | 877.849.7733 | acr-invest.com
Management’s Discussion of Fund’s Performance
The net performance of the Fund’s I Class shares for fiscal year 2020, from November 30, 2019 to November 30, 2020, was 20.23% vs. 9.52% for the Fund’s benchmark, the MSCI All Country World Index Ex-U.S. This letter will give an overview of the Fund’s 2020 performance, highlight the Fund’s advantages that allowed for this satisfactory performance, provide a macro-overview of the global environment, present data on the overall valuation levels of the financial markets we participate in and provide clarity into the Fund’s positioning entering fiscal year 2021. We will start the shareholder letter by providing the Fund’s investment objective and will end it with our conclusions.
IQR Fund Investment Objective
“The IQR Fund’s investment objective is to protect capital from permanent impairment while providing a return above the Fund’s cost of capital and the Fund’s benchmark over a full market cycle.”
Please reference the appendix for a discussion on the Fund’s investment objective.
| I. | Fiscal Year 2020 in Review |
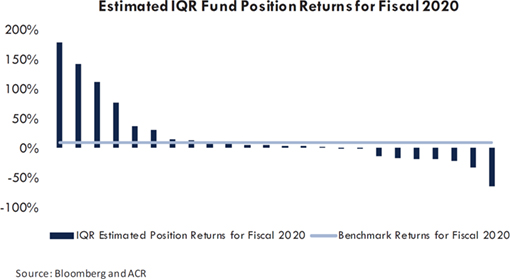
The net performance of the Fund’s I Class shares for fiscal year 2020 was 20.23% vs. 9.52% for the Fund’s benchmark. While we did not predict the Covid-19 pandemic, we were prepared for increased volatility and opportunity. In the 2019 annual letter we discussed the Fund’s defensive positioning in an environment with potentially inflated asset prices and heightened uncertainty. In the 2018 annual letter we mentioned that the Fund’s investment performance was not reflective of underlying fundamentals and that we believed the underperformance of that year would be transitory. Both statements proved prescient. The Fund’s defensive position (i.e., the approximate 28% cash balance) coming into March 2020 allowed the Fund to be opportunistic during the March 2020 market sell-off. Further, the investments the Fund already owned outperformed during the April to November 2020 market rebound and hereby unwound a portion of the “transitory” underperformance referenced in the 2018 letter. The chart below highlights the estimated position returns for fiscal 2020. Below we will describe in more detail the main contributors and detractors that comprised the fiscal 2020 performance.
The largest detractor for the Fund was our investment in the Brazilian company Embraer. Embraer is the world’s third largest aircraft manufacturer, and this business was negatively impacted by the intersection of two events. Firstly, Covid-19 brought air traffic to a stop and secondly, Boeing, the U.S. based aircraft manufacturer and defense business, backed out of an agreed to joint venture with the company. The combination of these events weakened Embraer’s balance sheet and reduced its prospects. We re-evaluated our investment thesis based on the new facts and concluded the business was now of insufficient quality and we sold at a material loss. The second largest detractor was Liberty Latin America. Liberty Latin America is a telecommunication company with exposure to various countries in Latin America and the Caribbean. Although the company’s services (e.g., cable internet, mobile phone, landline phone, pay tv) became more important during the Covid-19 pandemic, payment holidays on the company’s services and a large Chilean Peso devaluation versus the U.S. dollar lowered earnings. We believe the company’s negative share price performance is an overreaction to a temporary issue. The Fund remains a shareholder in the company and we anticipate attractive forward going returns on the investment.
The largest positive contributor to performance was the Fund’s investment in Naked Wines. Naked Wines is a U.K. based company but is considered the largest winery in the U.S. that only sells wine online, direct to consumer. The business was already well positioned with a superior product at a better value for money than retail wine merchants and was growing approximately 15% per year. The Covid-19 induced lockdowns in all its markets (e.g., U.S., U.K., Australia), however, further improved the company’s market opportunity. Individuals hesitant to order wine online were convinced to try the product during this lockdown period. This led to Naked Wine’s revenue increasing by 80% year over year for the six-month period ending September 2020. While it is uncertain how many of the newly acquired customers will remain loyal customers post the Covid-19 environment, the step change in the company’s revenue generation, name recognition and product awareness has materially improved the company’s operating efficiency and prospects. We have increased our estimate of value for the business and remain shareholders. The second largest contributor was G4S Plc, a manned security provider based in the U.K. The Fund was a prior investor in the company, and we opportunistically reinvested in the business after its share price fell 50%+ during the Covid-19 market selloff. The sharper decline relative to the market appeared related to the company’s higher than desired debt balance. What the market appeared to miss was that G4S is a noncyclical business that would most likely hold up reasonably well during a Covid-19 lockdown environment. This view was validated as the company reported that its revenue was reduced by less than 3% year over year for the six-month period ending June 2020. Our view of the company’s undervalued share price and quality underlying business was further supported when the company received competing buyout offers from two of its rivals. G4S’ share price appreciated materially, and the Fund sold its investment at a sizeable gain.
Fiscal 2020 was a satisfactory year for the Fund, but we believe a much longer time horizon is needed to validate whether an investment manager has added value to investors. We believe that the Fund’s four-year historical track record is insufficient to come to a valid conclusion on this, but since this is all we have, we provide the below information.

The above table highlights the large performance differences between the Fund Class I Shares and the benchmark in any given year. The IQR Fund is unique in its strategy (more on this in the next section titled “IQR Fund’s Advantages”) and therefore divergences from the benchmark are to be expected. 2017 was the inception year of the Fund and we consider this year the start-up phase. The Fund held an abnormally high 51% average cash balance as the Fund got off the ground, and therefore we exclude it from the below performance analysis. Starting at fiscal 2018 we consider the Fund’s performance illustrative.

The Fund’s Class I Shares trailing three-year performance is ahead of its benchmark, but still not up to our objective of the total return annualizing 6% real + inflation. We believe the IQR Fund is invested in a group of quality companies that have solid growth opportunities, generate attractive returns on equity and are available in the public markets at attractive prices (more on this in the “IQR Fund’s Positioning” part of the letter). We continue to have confidence that the prospective returns for the Fund will be satisfactory and we remain confident in obtaining the Fund’s investment objective.
Fiscal 2020 was a good illustration of the Fund’s advantages.
Most investment funds are fully invested. This implies that nearly all funds play the “relative” versus the “absolute” game. The goal for these funds is to do better than the benchmark. The IQR Fund’s objective is to do better than the benchmark and provide a satisfactory return over a full market cycle. We, at ACR, analyze and value businesses as a passion and for a living. We find it reasonable to believe that at times opportunities in the public markets are plentiful, hence you can invest nearly indiscriminately, and at times opportunities are scarce, hence you should be selective and hold cash in the absence of good investment opportunities. The benefit of this process implementation was highlighted in 2020. The Fund came into the March 2020 market selloff with approximately 28% of the Fund’s assets in cash and we were able to bring this cash balance down to high single digits during the depth of the March 2020 selloff. The approximate 20% of capital deployed during this period generated significant returns as the market rebounded from April through fiscal year end 2020.
| (b) | Balancing Concentration with Diversification |
Most investment funds own significantly more than 20 investments. This makes these investment vehicles more a closet index fund and less an active manager. Further, we wonder about the special insights that are possible over so many holdings. The IQR Fund strives to invest in a select group of approximately 20 companies that we know well. This level of knowledge proved vital this year as the Covid-19 pandemic created a recession and business environment without a historical parallel. No longer could an investment manager refer to the last recession and extrapolate those outcomes for each business to this Covid-19 environment. If you did not intimately know your investments and did not understand their end markets and competitive positions, you probably made incorrect investment decisions or were late making potentially correct ones. The IQR Fund was quickly able to sell (Embraer), add to (most of the portfolio) and newly acquire (G4S, Ashtead and Thales) investments. We believe that without our intimate knowledge of our investments and of several companies we have been following for a long time we would not have had the conviction to deploy 20% of the Fund’s capital during this uncertain Covid-19 period.
| (c) | Ability to Invest Across Market Capitalization Ranges |
It is a tremendous advantage for the Fund to be able to invest in any company regardless of market cap size. The Fund’s investment in a sub $500 million market cap company was the biggest contributor to returns in fiscal 2020. Two new investments during the Covid-19 induced market selloff were in the $10 billion market cap range and the other new investment in fiscal 2020 was in the sub $2 billion range. At fiscal year-end 2020, the Fund’s three largest market cap companies (average market cap of approximately $39 billion) had an average price-to-value (P/V) of 0.66 versus 0.76 for the entire portfolio. Hence, the largest contributor to performance in 2020 was a small cap, two out of the three new purchases in fiscal 2020 were from the mid cap space and the three largest companies in the portfolio are cheaper than the overall portfolio and are expected to drive the Fund’s future performance.
| (d) | Focus on Long Term Fundamentals |
In the short run, market prices can move up and down for any number of reasons. In the long run, however, equity total returns appear to approximate the dividends paid out and the growth in earnings per share (i.e., fundamentals). The oddity about markets is that nearly everyone can agree that fundamentals like dividends and earnings per share growth matter, but market participants appear to disagree on when these fundamentals should be reflected in prices. This dynamic can create market prices that diverge wildly from underlying fundamentals and has created a market that appears increasingly myopic, focused on speculating in stocks based on potential short-term outcomes. The IQR Fund does not play these short-term speculation games. Instead, we focus on investing shareholder (and our own) capital in businesses that should generate satisfactory long-term returns. The benefit of this process implementation was also highlighted in 2020. We deployed capital in businesses that were negatively impacted by the Covid-19 pandemic and whose short-term corporate performance would be uncertain. Exactly the type of companies the myopic market appeared interested in selling at nearly any price. We were, and are, confident in making these investment decisions because we know the companies well and have validated their investment quality under various scenarios. The timing of when the market prices of our investments will approximately reflect the value we ascribe to them is always uncertain, but the Fund’s strong absolute and relative performance since April 2020 validates our approach. As we will discuss in the IQR Fund’s Positioning section, we continue to have confidence in satisfactory forward going absolute and relative returns as well.
| III. | Global Macro and Market Overview |
The current global macro environment is one of extremes. The IMF’s October 2020 World Economic Outlook projected global GDP growth at -4.4% for 2020, the lowest growth since the Second World War. Governments reacted quickly to the Covid-19 pandemic by providing large fiscal stimulus in the form of grants to businesses, tax payment holidays, low-cost loans, wage payments, spending on growth projects (e.g., infrastructure, green initiatives) and direct cash payments to individuals. These measures were needed to keep global GDP growth from becoming more negative, but the cost of these measures has been higher debt balances. Global debt balances are now at a historical high.

The fiscal stimulus was, and perhaps remains, necessary but the levels of debt leave less room to maneuver for future potential crises. Will current debt balances be manageable if interest rates rise? Will markets decide at some point that debt balances are too high? Can government programs last long enough to create a soft landing for the economy or could an increase in business bankruptcies and payment delinquencies lead to a more traditional recession post the Covid-19 induced recession? Could inflation return and create havoc in global bond markets? Could increased inequality cause further social unrest? We do not know. We believe, however, that with interest rates near zero globally and with high global debt balances the scope for monetary and fiscal policy intervention is diminished versus what it was before. We will repeat what we stated in our 2019 annual letter, we, at ACR, are not doomsayers and are firm believers in the continued increase in future living standards globally. We, however, do not stick our head in the sand when thinking about the macro backdrop. We acknowledge that risks remain high.
With a backdrop of high uncertainty, we view the global opportunity set as fully valued to overvalued. The U.S. market appears overvalued versus its own valuation history as we have found no reason to believe that U.S. growth is set to be greater than it was in the past. The developed markets ex the U.S., to us, appear approximately fully valued as there are indications that the lower growth environment of the past decade will continue. Lower levels of productivity and lower growth in the working age population (in many countries this is negative) warrant a cyclically adjusted price to earnings (PE) ratio near the bottom of the historical range.
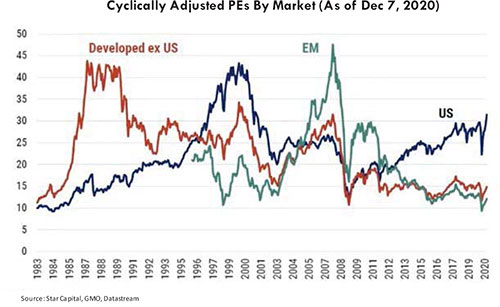
The global markets excluding the U.S. appear reasonably valued but perhaps less attractive considering the state of the global macro environment. Thankfully, the IQR Fund has many advantages (discussed in a prior section) and we believe the Fund is positioned to perform well from an absolute and relative perspective in the future.
| IV. | IQR Fund’s Positioning |
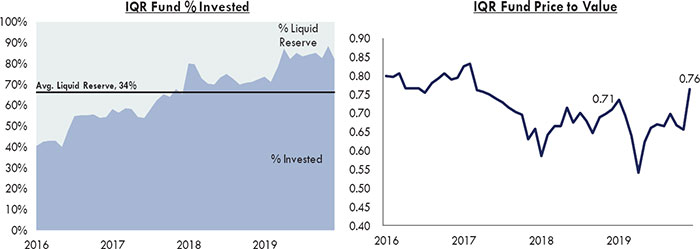
The IQR Fund is well suited for the current environment with investments in a select group of quality companies available at attractive prices. The Fund managed to decrease its cash balance from approximately 28% at the start of fiscal year 2020 to end the year with a cash balance of approximately 18%. More importantly, the Fund generated a 20.23% return in fiscal 2020 and only saw its portfolio P/V increase from approximately 0.71 at fiscal year-end 2019 to 0.76 at the 2020 fiscal year end. In other words, the Fund generated a strong return in fiscal 2020 but still managed to become more invested and retain an overall portfolio with a sizeable discount to our estimate of fair value. A satisfactory discount to our estimate of value underpins our confidence in generating a satisfactory forward going return.
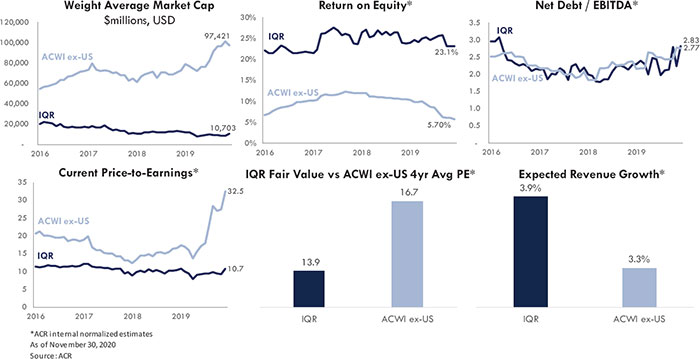
The Fund accomplished the solid fiscal 2020 return while retaining an attractive forward going portfolio by being opportunistic during the March 2020 market selloff and being highly selective in the normal course of business. The IQR Fund held 20 investments with the below weighted average statistics. Our all-cap mandate allows the Fund to be invested in several smaller cap companies where market prices appear more favorable. The Fund has similar debt leverage (net debt / EBITDA) and slightly higher normalized growth expectation than the benchmark but with a better return on equity (ROE) and at a much lower valuation. The quality of our companies gives us confidence in their resilience during a potentially volatile macro environment and the attractive fundamental statistics give us confidence in an attractive forward going absolute and relative investment return.
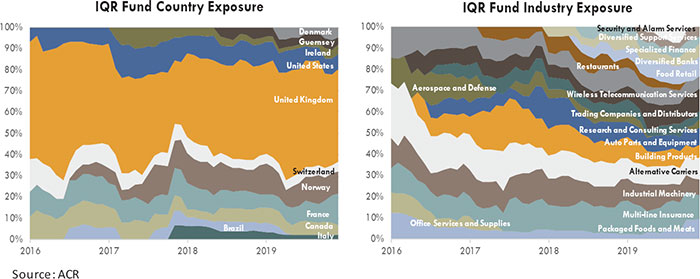
The Fund continues to balance concentration with diversification to accomplish the favorable portfolio statistics. The Fund has more concentration in one of the cheaper global markets (i.e., the U.K.) but remains significantly diversified across industries.
Fiscal 2020 highlighted the advantages of the Fund’s process and implementation. The Fund’s ability to hold cash, balancing concentration with diversification, investing across market capitalization ranges and focusing on long term fundamentals of businesses all contributed to the satisfactory absolute and relative fiscal 2020 performance. The current macro environment remains uncertain and market valuation levels approximate fair value, but we continue to believe the IQR advantages will bear fruit in the future as well. The Fund holds investments in a select group of companies with attractive absolute statistics and ones favorable to the Fund’s benchmark. In addition, the Fund holds approximately 18% in cash to take advantage of future opportunities as they arise. The Fund’s investment team looks towards the future with confidence in attaining the Fund’s investment objective.
Thank you for your continued trust,
The ACR Investment Team

Willem Schilpzand, CFA ®
Portfolio Manager
Appendix: Notes on the IQR Fund Investment Objectives
IQR Fund Investment Objective
“The IQR Fund’s investment objective is to protect capital from permanent impairment while providing a return above the Fund’s cost of capital and the Fund’s benchmark over a full market cycle.”
It is important to note that “providing a return above the Fund’s cost of capital and the Fund’s benchmark” are performance objectives the Fund expects to meet. We consider the “cost of capital” of the Fund to be approximately 6% real + inflation (the opportunity cost for our Fund shareholders). The Fund’s benchmark is the MSCI All Country World Index Ex-U.S. The timeframe of “over a full market cycle” remains purposefully undefined as market prices can vary widely from fundamental value over the short to medium term. The IQR Fund has no control over when prices start to converge towards underlying fundamental value (as determined by actual cash flows of companies), but history and corporate financial theory give us significant confidence that prices will eventually converge with value. This is the Fund’s advantage. We make the trade-off for short to medium term uncertainty for the opportunity to outperform over the longer term (i.e., “a full market cycle”). “Protect capital from permanent impairment” is a philosophical objective that signals to Fund shareholders that the IQR Fund is resolutely focused on risk and will not allocate capital (i.e., will build a cash balance) in the absence of satisfactory risk/reward investment opportunities. This is a similar methodology to what private equity firms deploy, but IQR executes this strategy in the public markets. “Risk” does not mean volatility as the IQR Fund portfolio is expected to move around similarly to markets, but “risk” means taking equity risk and not getting an equity like return over a sufficiently long investment period.
Appendix: ACR’s Investment Principles
Investment Principles
Intrinsic value and risk is our focus when evaluating investments
Intrinsic (or fundamental) value is the cash generated by an enterprise or asset over its useful life. Intrinsic value is earned in the future as dividends, interest, and principal are paid or as retained earnings are successfully reinvested.
Risk is the likelihood and potential magnitude of a permanent decline in the earning power or asset value of an enterprise, or the payment of a market price at purchase which is higher than intrinsic value. Our objective is to mitigate risk through integrity with our investment principles and investment process excellence.
When buying, we never confuse intrinsic value with market price. Market price is what we pay. Intrinsic value is what we get. Market price may be found quoted daily from news services or ascertained from past transaction records. Intrinsic value is determined by enterprise cash flows.
Market price, it follows, is not a barometer we would use to evaluate corporate performance. Our evaluation of corporate performance is based on items such as income, assets, and return on capital. We view the price of a security simply as a record of what others – well informed or not – were willing to pay for it at various times in the past.
Intrinsic value is such a critical concept because it is the only reference point for what an investment is actually worth, and therefore, whether or not the market price is fair, high, or low. Two facts support this view. First, the theoretical point that an investment is worth the present value of its future cash flows is self-evident and undisputed. Second, new era theories that have driven market prices to speculative levels in the short run have always succumbed to intrinsic value in the long run.
We insist on quality with a margin of safety
The quality of a security is defined by the reliability of the cash flows or assets which comprise its intrinsic value. The quality of an investment is defined by the price paid for the intrinsic value received.
A quantifiable margin of safety is the hallmark of a quality investment. For higher rated fixed income investments, an issuer’s available resources must be significantly greater than the interest and principal due the investor. For lower rated fixed income investments selling below their principal value, the assets backing an issue must be significantly greater than its price. For equity investments, the intrinsic value of a company must be significantly greater than its price. For other types of investments and as a general rule, the probability of achieving a return commensurate with the risk taken must be very high.
We only invest in what we understand
True understanding is built upon high probability statements about security values. It requires a dogged determination to get to the bottom of things and an equally dogged honesty about whether or not we did.
Understanding is also relative. Achieving better-than-average returns requires understanding security values better-than-average. The problem is most investment managers believe they are better-than-average.
Competence and honesty are the keys to assuring that we are not fooling ourselves. Competence means that we are capable of estimating security values and returns for both our portfolios and the markets in which we participate. Honesty means that we are candid about our relative return advantage or lack thereof, and only commit capital when we have an advantage.
Diversification and concentration are balanced with knowledge
Proper diversification is paramount to quality at the portfolio level. Proper diversification is achieved when the overall portfolio return is protected from unexpected adverse results in individual holdings, industries, countries, or other risk factors.
Proper concentration can be risk reducing as well as value enhancing. Concentration refers to making greater commitments to more attractive investments. The greater the difference between intrinsic value and market price, the more robust our knowledge of an investment’s value, and the lower the risk of the investment, the more capital we are willing to concentrate in that investment.
Successfully executed, concentration has three benefits: (a) returns are enhanced by selecting investments with the highest probability of success, (b) risk is reduced by avoiding mediocre and poor commitments, and (c) knowledge is improved by concentrating the analytical effort.
A concentrated portfolio with fewer holdings is desirable when value-to-price, understanding, and quality are high. A low-cost, more widely diversified approach to a market is appropriate when there are no clear advantages in understanding, and therefore, in our ability to evaluate quality or estimate value-to-price.
Communication is essential for intelligent investor decision-making
One of the greatest risks investors face is selling low in a panic. Education and communication can greatly reduce this risk. We explain to investors the difference between intrinsic and market value and openly share the rationale behind our investment decision-making. We believe this significantly reduces the risk of investors selling at market bottoms or buying at market tops.
Communication is also important for evaluating an investment manager’s abilities. Luck, risk, and a bull market can make an incompetent manager look brilliant. Conversely, every brilliant manager will under-perform at some time, and usually this is the best time to invest with them. Investors must look beyond performance to evaluate manager competence. To aid current and prospective investors in this endeavor, we regularly discuss the strategy and holdings behind our performance, and candidly address both our successes and mistakes.
The views in this letter were as of November 30th, 2020 and may not necessarily reflect the same views on the date this letter is first published or any time thereafter. These views are intended to help shareholders in understanding the fund’s investment methodology and do not constitute investment advice.
ACR Multi-Strategy Quality Return (MQR) Fund
FUND PERFORMANCE at November 30, 2020 (Unaudited)

This graph compares a hypothetical $10,000 investment in the Fund’s Class I shares, made at its inception, with a similar investment in the HFRI Equity Hedge (Total) Index and the MSCI ACWI Index. The performance graph above is shown for the Fund Class I shares, Class A shares performance may vary. Results include the reinvestment of all dividends and capital gains.
HFRI Equity Hedge Index consists of Investment Managers who maintain positions both long and short in primarily equity and equity derivative securities.
MSCI ACWI Index captures large and mid cap representation across 23 Developed Markets (DM) and 23 Emerging Markets (EM) countries. With 2,469 constituents, the index covers approximately 85% of the global investable equity opportunity set.
These indices do not reflect expenses, fees or sales charge, which would lower performance. The indices are unmanaged and they are not available for investment.
| Average Annual Total Returns as of November 30, 2020 | 1 Year | 5 Years | Since Inception | Inception Date |
| Before deducting maximum sales charge | | | | |
| Class A1 | 13.76% | 5.25% | 4.14% | 12/31/14 |
| Class I | 13.91% | 5.45% | 4.32% | 12/31/14 |
| After deducting maximum sales charge | | | | |
| Class A1 | 7.24% | 4.01% | 3.10% | 12/31/14 |
| HFRI Equity Hedge (Total) Index | 14.72% | 6.90% | 5.83% | 12/31/14 |
| MSCI ACWI Index | 15.58% | 11.44% | 9.57% | 12/31/14 |
| ¹ | Maximum sales charge for Class A shares is 5.75%. |
The performance data quoted here represents past performance and past performance is not a guarantee of future results. Investment return and principal value will fluctuate so that an investor's shares, when redeemed, may be worth more or less than their original cost. Current performance may be lower or higher than the performance information quoted. The most recent month end performance may be obtained by calling (855) 955-9552.
ACR Multi-Strategy Quality Return (MQR) Fund
FUND PERFORMANCE at November 30, 2020 (Unaudited) - Continued
Gross and net expense ratios for Class A shares were 1.91% and 1.52%, respectively, and for Class I shares were 1.70% and 1.31%, respectively, which were the amounts stated in the current prospectus dated April 1, 2020. For the Fund’s current one-year expense ratios, please refer to the Financial Highlights. The Fund’s advisor has contractually agreed to waive its fees and/or pay for operating expenses of the Fund to ensure that total annual fund operating expenses do not exceed 1.40% and 1.25% of the average daily net assets of Class A and Class I shares of the Fund, respectively. This agreement is in effect until March 31, 2021, and it may be terminated before that date only by the Trust’s Board of Trustees. In the absence of such waivers, the Fund’s returns would be lower.
Returns reflect the reinvestment of distributions made by the Fund, if any. The graph and the performance table above do not reflect the deduction of taxes that a shareholder would pay on Fund distributions or the redemption of Fund shares. Shares redeemed within 90 days of purchase will be charged 2.00% redemption fee.
ACR International Quality Return (IQR) Fund
FUND PERFORMANCE at November 30, 2020 (Unaudited)
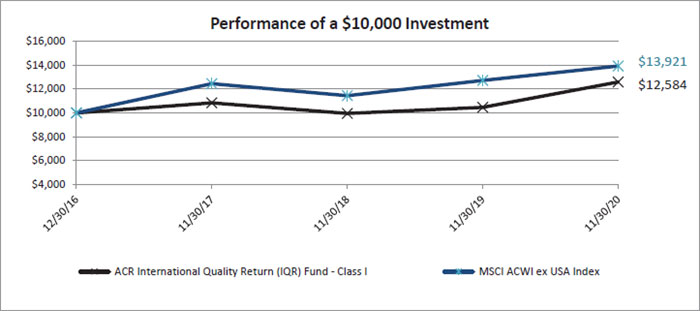
This graph compares a hypothetical $10,000 investment in the Fund’s Class I shares, made at its inception, with a similar investment in the MSCI ACWI ex USA Index. The performance graph above is shown for the Fund Class I shares, Class A shares performance may vary. Results include the reinvestment of all dividends and capital gains.
The MSCI ACWI ex USA Index captures large and mid cap representation across 22 of 23 Developed Markets (DM) countries (excluding the US) and 24 Emerging Markets (EM) countries. With 1,866 constituents, the index covers approximately 85% of the global equity opportunity set outside the US.
This index does not reflect expenses, fees or sales charge, which would lower performance. The index is unmanaged and it is not available for investment.
Average Annual Total Returns as of November 30, 2020 | 1 Year | 3 Years | Since
Inception | Inception Date |
Before deducting maximum sales charge Class A1 | 19.99% | 4.94% | 5.87% | 12/30/16 |
| Class I | 20.23% | 5.10% | 6.04% | 12/30/16 |
After deducting maximum sales charge Class A1 | 13.09% | 2.89% | 4.28% | 12/30/16 |
| MSCI ACWI ex USA Index | 9.52% | 3.82% | 8.81% | 12/30/16 |
| ¹ | Maximum sales charge for Class A shares is 5.75%. |
The performance data quoted here represents past performance and past performance is not a guarantee of future results. Investment return and principal value will fluctuate so that an investor's shares, when redeemed, may be worth more or less than their original cost. Current performance may be lower or higher than the performance information quoted. The most recent month end performance may be obtained by calling (855) 955-9552.
ACR International Quality Return (IQR) Fund
FUND PERFORMANCE at November 30, 2020 (Unaudited) - Continued
Gross and net expense ratios for Class A shares were 2.41% and 1.37%, respectively, and for Class I shares were 2.26% and 1.22%, respectively, which were the amounts stated in the current prospectus dated April 1, 2020. For the Fund’s current one-year expense ratios, please refer to the Financial Highlights. The Fund’s advisor has contractually agreed to waive its fees and/or pay for operating expenses of the Fund to ensure that total annual fund operating expenses do not exceed 1.40% and 1.25% of the average daily net assets of Class A and Class I shares of the Fund, respectively. This agreement is in effect until March 31, 2021, and it may be terminated before that date only by the Trust’s Board of Trustees. In the absence of such waivers, the Fund’s returns would be lower.
Returns reflect the reinvestment of distributions made by the Fund, if any. The graph and the performance table above do not reflect the deduction of taxes that a shareholder would pay on Fund distributions or the redemption of Fund shares. Shares redeemed within 90 days of purchase will be charged 2.00% redemption fee.
ACR Multi-Strategy Quality Return (MQR) Fund
SCHEDULE OF INVESTMENTS
As of November 30, 2020
Number
of Shares | | | | | Value | |
| | | | | COMMON STOCKS — 97.9% | | | | |
| | | | | COMMUNICATIONS — 16.4% | | | | |
| | 112,000 | | | CenturyLink, Inc.1 | | $ | 1,170,400 | |
| | 80,000 | | | Liberty Global PLC - Class C*1,2 | | | 1,731,200 | |
| | 61,000 | | | Liberty Latin America Ltd. - Class C*2 | | | 689,910 | |
| | 110,000 | | | Vodafone Group PLC - ADR1 | | | 1,823,800 | |
| | | | | | | | 5,415,310 | |
| | | | | | | | | |
| | | | | CONSUMER DISCRETIONARY — 20.9% | | | | |
| | 61,000 | | | Cie Plastic Omnium S.A. | | | 2,101,135 | |
| | 52,000 | | | General Motors Co.1 | | | 2,279,680 | |
| | 67,000 | | | Howden Joinery Group PLC* | | | 560,751 | |
| | 22,500 | | | Lennar Corp. | | | 1,365,750 | |
| | 9,750 | | | Magna International, Inc.2 | | | 598,845 | |
| | | | | | | | 6,906,161 | |
| | | | | | | | | |
| | | | | CONSUMER STAPLES — 5.8% | | | | |
| | 260,000 | | | Greencore Group PLC | | | 404,125 | |
| | 198,000 | | | Naked Wines PLC | | | 1,525,716 | |
| | | | | | | | 1,929,841 | |
| | | | | | | | | |
| | | | | ENERGY — 7.2% | | | | |
| | 13,454 | | | Chevron Corp. | | | 1,172,920 | |
| | 246,676 | | | Comstock Resources, Inc.* | | | 1,201,312 | |
| | | | | | | | 2,374,232 | |
| | | | | | | | | |
| | | | | FINANCIALS — 33.0% | | | | |
| | 15,000 | | | Affiliated Managers Group, Inc. | | | 1,306,800 | |
| | 220,000 | | | Barclays PLC - ADR*1 | | | 1,566,400 | |
| | 100,753 | | | Burford Capital Ltd. | | | 1,004,709 | |
| | 26,980 | | | Citigroup, Inc.1 | | | 1,485,788 | |
| | 2,900 | | | Fairfax Financial Holdings Ltd.1,2 | | | 994,294 | |
| | 73,000 | | | Jefferies Financial Group, Inc.1 | | | 1,659,290 | |
| | 30,000 | | | Kingstone Cos., Inc. | | | 198,900 | |
| | 40,000 | | | Power Corp. of Canada | | | 900,593 | |
| | 328,847 | | | Protector Forsikring A.S.A.* | | | 1,806,598 | |
| | | | | | | | 10,923,372 | |
| | | | | | | | | |
| | | | | INDUSTRIALS — 5.5% | | | | |
| | 17,000 | | | Ashtead Group PLC | | | 717,547 | |
| | 40,000 | | | ISS A/S* | | | 729,357 | |
| | 7,000 | | | SPX FLOW, Inc.*1 | | | 375,060 | |
| | | | | | | | 1,821,964 | |
| | | | | | | | | |
| | | | | MATERIALS — 5.3% | | | | |
| | 510,000 | | | Eurocell PLC* | | | 1,489,001 | |
ACR Multi-Strategy Quality Return (MQR) Fund
SCHEDULE OF INVESTMENTS - Continued
As of November 30, 2020
Number
of Shares | | | | | Value | |
| | | | COMMON STOCKS (Continued) | | | |
| | | | MATERIALS (Continued) | | | |
| | 48,000 | | | Resolute Forest Products, Inc.*1 | | $ | 263,040 | |
| | | | | | | | 1,752,041 | |
| | | | | | | | | |
| | | | | REAL ESTATE — 3.8% | | | | |
| | 17,000 | | | Howard Hughes Corp.* | | | 1,236,410 | |
| | | | | TOTAL COMMON STOCKS | | | | |
| | | | | (Cost $32,295,073) | | | 32,359,331 | |
| | | | | PREFERRED STOCKS — 1.3% | | | | |
| | | | | ENERGY — 1.3% | | | | |
| | 3,357 | | | Elk Petroleum, Inc. Series A3,4,5 | | | 136,560 | |
| | 3,073 | | | Elk Petroleum, Inc. Series B3,4,5 | | | 292,629 | |
| | | | | | | | 429,189 | |
| | | | | | | | | |
| | | | | TOTAL PREFERRED STOCKS | | | | |
| | | | | (Cost $3,357,427) | | | 429,189 | |
| | | | | SHORT-TERM INVESTMENTS — 0.3% | | | | |
| | 106,203 | | | Federated Treasury Obligations Fund - Institutional Class, 0.01%6 | | | 106,203 | |
| | | | | TOTAL SHORT-TERM INVESTMENTS | | | | |
| | | | | (Cost $106,203) | | | 106,203 | |
| | | | | | | | | |
| | | | | TOTAL INVESTMENTS — 99.5% | | | | |
| | | | | (Cost $35,758,703) | | | 32,894,723 | |
| | | | | Other Assets in Excess of Liabilities — 0.5% | | | 175,934 | |
| | | | | TOTAL NET ASSETS — 100.0% | | $ | 33,070,657 | |
| | | | | SECURITIES SOLD SHORT — (1.4)% | | | | |
| | | | | EXCHANGE-TRADED FUNDS — (1.4)% | | | | |
| | (2,500 | ) | | iShares Russell 2000 ETF | | | (452,550 | ) |
| | | | | TOTAL EXCHANGE-TRADED FUNDS | | | | |
| | | | | (Proceeds $382,871) | | | (452,550 | ) |
| | | | | TOTAL SECURITIES SOLD SHORT | | | | |
| | | | | (Proceeds $382,871) | | $ | (452,550 | ) |
| ADR – American Depository Receipt |
| ETF – Exchange-Traded Fund |
| PLC – Public Limited Company |
| * | Non-income producing security. |
| 1 | All or a portion of this security is segregated as collateral for securities sold short. The market value of the securities pledged as collateral was $9,940,471, which represents 30.06% of total net assets of the Fund. |
| 2 | Foreign security denominated in U.S. Dollars. |
| 3 | Level 3 securities fair valued under procedures established by the Board of Trustees, represent 1.3% of Net Assets. The aggregate value of these securities is $429,189. |
| 4 | Security in a privately owned company. |
| 6 | The rate is the annualized seven-day yield at period end. |
See accompanying Notes to Financial Statements.
ACR Multi-Strategy Quality Return (MQR) Fund
SUMMARY OF INVESTMENTS
As of November 30, 2020
| Security Type/Industry | Percent of Total
Net Assets |
| Common Stocks | |
| Financials | 33.0% |
| Consumer Discretionary | 20.9% |
| Communications | 16.4% |
| Energy | 7.2% |
| Consumer Staples | 5.8% |
| Industrials | 5.5% |
| Materials | 5.3% |
| Real Estate | 3.8% |
| Total Common Stocks | 97.9% |
| Preferred Stocks | 1.3% |
| Short-Term Investments | 0.3% |
| Total Investments | 99.5% |
| Other Assets in Excess of Liabilities | 0.5% |
| Total Net Assets | 100.0% |
See accompanying Notes to Financial Statements.
ACR International Quality Return (IQR) Fund
SCHEDULE OF INVESTMENTS
As of November 30, 2020
Number
of Shares | | | | | Value | |
| | | | | COMMON STOCKS — 82.2% | | | | |
| | | | | CANADA — 3.8% | | | | |
| | 3,353 | | | Fairfax Financial Holdings Ltd. | | $ | 1,149,939 | |
| | | | | | | | | |
| | | | | DENMARK — 3.8% | | | | |
| | 62,886 | | | ISS A/S* | | | 1,146,658 | |
| | | | | | | | | |
| | | | | FRANCE — 12.0% | | | | |
| | 43,142 | | | Cie Plastic Omnium S.A. | | | 1,486,019 | |
| | 18,659 | | | Danone S.A. | | | 1,203,273 | |
| | 10,567 | | | Thales S.A. | | | 968,483 | |
| | | | | | | | 3,657,775 | |
| | | | | | | | | |
| | | | | IRELAND — 3.8% | | | | |
| | 734,724 | | | Greencore Group PLC | | | 1,142,001 | |
| | | | | | | | | |
| | | | | ITALY — 1.9% | | | | |
| | 44,885 | | | Brembo S.p.A.* | | | 581,149 | |
| | | | | | | | | |
| | | | | NORWAY — 8.8% | | | | |
| | 72,887 | | | Multiconsult A.S.A.*1 | | | 1,042,666 | |
| | 295,370 | | | Protector Forsikring A.S.A.* | | | 1,622,684 | |
| | | | | | | | 2,665,350 | |
| | | | | SWITZERLAND — 3.5% | | | | |
| | 10,778 | | | Sulzer A.G. | | | 1,079,217 | |
| | | | | | | | | |
| | | | | UNITED KINGDOM — 41.7% | | | | |
| | 28,661 | | | Ashtead Group PLC | | | 1,209,742 | |
| | 213,426 | | | Barclays PLC - ADR* | | | 1,519,593 | |
| | 82,715 | | | Burford Capital Ltd. | | | 824,834 | |
| | 504,684 | | | Eurocell PLC* | | | 1,473,481 | |
| | 167,511 | | | Howden Joinery Group PLC* | | | 1,401,970 | |
| | 73,021 | | | Liberty Global PLC - Class C*2 | | | 1,580,174 | |
| | 83,848 | | | Liberty Latin America Ltd. - Class C*2 | | | 948,321 | |
| | 300,177 | | | Naked Wines PLC | | | 2,313,056 | |
| | 83,230 | | | Vodafone Group PLC - ADR | | | 1,379,953 | |
| | | | | | | | 12,651,124 | |
| | | | | | | | | |
| | | | | UNITED STATES — 2.9% | | | | |
| | 16,301 | | | SPX FLOW, Inc.* | | | 873,408 | |
| | | | | TOTAL COMMON STOCKS | | | | |
| | | | | (Cost $20,645,943) | | | 24,946,621 | |
ACR International Quality Return (IQR) Fund
SCHEDULE OF INVESTMENTS - Continued
As of November 30, 2020
Number
of Shares | | | | | Value | |
| | | | | SHORT-TERM INVESTMENTS — 17.8% | | | | |
| | 5,392,000 | | | Federated Treasury Obligations Fund - Institutional Class, 0.01%3 | | $ | 5,392,000 | |
| | | | | TOTAL SHORT-TERM INVESTMENTS | | | | |
| | | | | (Cost $5,392,000) | | | 5,392,000 | |
| | | | | | | | | |
| | | | | TOTAL INVESTMENTS — 100.0% | | | | |
| | | | | (Cost $26,037,943) | | | 30,338,621 | |
| | | | | Liabilities in Excess of Other Assets — (0.0)% | | | (3,428 | ) |
| | | | | TOTAL NET ASSETS — 100.0% | | $ | 30,335,193 | |
| ADR – American Depository Receipt |
| PLC – Public Limited Company |
| * | Non-income producing security. |
| 1 | Security exempt from registration under Rule 144A of the Securities Act of 1933. These securities are restricted and may be resold in transactions exempt from registration normally to qualified institutional buyers. The total value of these securities is $1,042,666 which represents 3.4% of Net Assets. |
| 2 | Foreign security denominated in U.S. Dollars. |
| 3 | The rate is the annualized seven-day yield at period end. |
See accompanying Notes to Financial Statements.
ACR International Quality Return (IQR) Fund
SUMMARY OF INVESTMENTS
As of November 30, 2020
| Security Type/Industry | Percent of Total
Net Assets |
| Common Stocks | |
| Industrials | 20.8% |
| Financials | 16.9% |
| Consumer Staples | 15.3% |
| Communications | 12.9% |
| Consumer Discretionary | 11.4% |
| Materials | 4.9% |
| Total Common Stocks | 82.2% |
| Short-Term Investments | 17.8% |
| Total Investments | 100.0% |
| Liabilities in Excess of Other Assets | (0.0)% |
| Total Net Assets | 100.0% |
See accompanying Notes to Financial Statements.
STATEMENTS OF ASSETS AND LIABILITIES
As of November 30, 2020
| | | ACR Multi-Strategy Quality Return (MQR) Fund | | | ACR International Quality Return (IQR) Fund | |
| Assets: | | | | | | |
| Investments, at value (cost $35,758,703 and $26,037,943, respectively) | | $ | 32,894,723 | | | $ | 30,338,621 | |
| Cash | | | - | | | | 23,719 | |
| Cash deposited with broker for securities sold short | | | 530,862 | | | | - | |
| Receivables: | | | | | | | | |
| Investment securities sold | | | 151,968 | | | | - | |
| Fund shares sold | | | 20 | | | | - | |
| Dividends and interest | | | 49,871 | | | | 21,037 | |
| Prepaid expenses | | | 18,838 | | | | 18,786 | |
| Total assets | | | 33,646,282 | | | | 30,402,163 | |
| | | | | | | | | |
| Liabilities: | | | | | | | | |
| Securities sold short, at value (proceeds $382,871 and $0, respectively) | | | 452,550 | | | | - | |
| Payables: | | | | | | | | |
| Fund shares redeemed | | | 31,050 | | | | 5,525 | |
| Advisory fees | | | 5,110 | | | | 2,750 | |
| Shareholder servicing fees (Note 8) | | | 3,112 | | | | 2,838 | |
| Distribution fees - Class A (Note 7) | | | 855 | | | | 9 | |
| Fund administration and accounting fees | | | 15,200 | | | | 12,370 | |
| Transfer agent fees and expenses | | | 9,595 | | | | 5,536 | |
| Custody fees | | | 4,247 | | | | 1,420 | |
| Trustees' deferred compensation (Note 3) | | | 16,729 | | | | 15,882 | |
| Auditing fees | | | 15,022 | | | | 15,001 | |
| Legal fees | | | 6,538 | | | | 2,981 | |
| Chief Compliance Officer fees | | | 2,384 | | | | 1,128 | |
| Trustees' fees and expenses | | | 1,432 | | | | 277 | |
| Interest expense | | | 899 | | | | - | |
| Due to broker | | | - | | | | 22 | |
| Accrued other expenses | | | 10,902 | | | | 1,231 | |
| Total Liabilities | | | 575,625 | | | | 66,970 | |
| | | | | | | | | |
| Net Assets | | $ | 33,070,657 | | | $ | 30,335,193 | |
| | | | | | | | | |
| Components of Net Assets: | | | | | | | | |
| Paid-in capital (par value of $0.01 per share with an unlimited number of shares authorized) | | $ | 36,099,812 | | | $ | 26,400,444 | |
| Total distributable earnings (accumulated deficit) | | | (3,029,155 | ) | | | 3,934,749 | |
| Net Assets | | $ | 33,070,657 | | | $ | 30,335,193 | |
| | | | | | | | | |
| Maximum Offering Price per Share: | | | | | | | | |
| Class A Shares: | | | | | | | | |
| Net assets applicable to shares outstanding | | $ | 4,355,888 | | | $ | 6,251 | |
| Shares of beneficial interest issued and outstanding | | | 385,284 | | | | 515 | |
| Redemption price per share | | | 11.31 | | | | 12.13 | |
| Maximum sales charge (5.75% of offering price)* | | | 0.69 | | | | 0.74 | |
| Maximum offering price to public | | $ | 12.00 | | | $ | 12.87 | |
| Class I Shares: | | | | | | | | |
| Net assets applicable to shares outstanding | | $ | 28,714,769 | | | $ | 30,328,942 | |
| Shares of beneficial interest issued and outstanding | | | 2,522,555 | | | | 2,498,866 | |
| Redemption price per share | | $ | 11.38 | | | $ | 12.14 | |
| * | On sales of $25,000 or more, the sales charge will be reduced and no initial sales charge is applied to purchases of $1 million or more. |
See accompanying Notes to Financial Statements.
STATEMENTS OF OPERATIONS
For the Year Ended November 30, 2020
| | | ACR Multi-Strategy Quality Return (MQR) Fund | | | ACR International Quality Return (IQR) Fund | |
| Investment income: | | | | | | |
| Dividends (net of foreign withholdings taxes of $31,128 and $18,490, respectively) | | $ | 699,701 | | | $ | 197,953 | |
| Interest | | | 28,697 | | | | 27,670 | |
| Total investment income | | | 728,398 | | | | 225,623 | |
| | | | | | | | | |
| Expenses: | | | | | | | | |
| Advisory fees | | | 410,906 | | | | 225,232 | |
| Shareholder servicing fees - Class I (Note 8) | | | 25,799 | | | | 20,232 | |
| Shareholder servicing fees - Class A (Note 8) | | | 943 | | | | - | |
| Distribution fees - Class A (Note 7) | | | 11,783 | | | | 12 | |
| Fund administration and accounting fees | | | 101,254 | | | | 83,838 | |
| Trustees' fees and expenses | | | 16,512 | | | | 15,135 | |
| Legal fees | | | 76,743 | | | | 15,768 | |
| Transfer agent fees and expenses | | | 47,115 | | | | 39,112 | |
| Dividends on securities sold short | | | 44,101 | | | | - | |
| Registration fees | | | 28,186 | | | | 32,202 | |
| Custody fees | | | 16,674 | | | | 25,602 | |
| Auditing fees | | | 15,001 | | | | 15,001 | |
| Shareholder reporting fees | | | 14,230 | | | | 4,845 | |
| Interest expense | | | 13,296 | | | | - | |
| Chief Compliance Officer fees | | | 11,264 | | | | 8,989 | |
| Miscellaneous | | | 7,053 | | | | 7,194 | |
| Insurance fees | | | 3,660 | | | | 3,192 | |
| Total expenses | | | 844,520 | | | | 496,354 | |
| Advisory fees waived | | | (289,883 | ) | | | (222,043 | ) |
| Fees paid indirectly (Note 3) | | | (6,717 | ) | | | (6,309 | ) |
| Net expenses | | | 547,920 | | | | 268,002 | |
| Net investment income (loss) | | | 180,478 | | | | (42,379 | ) |
| | | | | | | | | |
| Realized and Unrealized Gain (Loss): | | | | | | | | |
| Net realized gain (loss) on: | | | | | | | | |
| Investments | | | (449,848 | ) | | | 52,477 | |
| Securities sold short | | | 333,071 | | | | - | |
| Written options contracts | | | 42,994 | | | | - | |
| Foreign currency transactions | | | (1,926 | ) | | | (9,223 | ) |
| Net realized gain (loss) | | | (75,709 | ) | | | 43,254 | |
| Net change in unrealized appreciation/depreciation on: | | | | | | | | |
| Investments | | | 197,726 | | | | 4,875,694 | |
| Securities sold short | | | 367,858 | | | | - | |
| Foreign currency translations | | | (32 | ) | | | 1,621 | |
| Net change in unrealized appreciation/depreciation | | | 565,552 | | | | 4,877,315 | |
| Net increase from reimbursement by affiliates (Note 3) | | | - | | | | 4,202 | |
| Net realized and unrealized gain | | | 489,843 | | | | 4,924,771 | |
| | | | | | | | | |
| Net Increase in Net Assets from Operations | | $ | 670,321 | | | $ | 4,882,392 | |
See accompanying Notes to Financial Statements.
ACR Multi-Strategy Quality Return (MQR) Fund
STATEMENTS OF CHANGES IN NET ASSETS
| | | For the
Year Ended
November 30, 2020 | | | For the
Year Ended
November 30, 2019 | |
| Increase (Decrease) in Net Assets from: | | | | | | | | |
| Operations: | | | | | | | | |
| Net investment income | | $ | 180,478 | | | $ | 1,508,181 | |
| Net realized gain (loss) | | | (75,709 | ) | | | 419,388 | |
| Net change in unrealized appreciation/depreciation on investments, securities sold short and foreign currency translations | | | 565,552 | | | | (5,250,214 | ) |
| Net increase (decrease) in net assets resulting from operations | | | 670,321 | | | | (3,322,645 | ) |
| | | | | | | | | |
| Distributions to Shareholders: | | | | | | | | |
| Distributions: | | | | | | | | |
| Class A | | | (163,031 | ) | | | (433,929 | ) |
| Class I | | | (1,465,816 | ) | | | (5,366,781 | ) |
| Total distributions to shareholders | | | (1,628,847 | ) | | | (5,800,710 | ) |
| | | | | | | | | |
| Capital Transactions: | | | | | | | | |
| Net proceeds from shares sold: | | | | | | | | |
| Class A | | | 5,681 | | | | 690,572 | |
| Class I | | | 2,903,377 | | | | 17,877,674 | |
| Reinvestment of distributions: | | | | | | | | |
| Class A | | | 146,750 | | | | 396,622 | |
| Class I | | | 1,404,966 | | | | 4,971,785 | |
| Cost of shares redeemed: | | | | | | | | |
| Class A1 | | | (2,426,130 | ) | | | (1,679,610 | ) |
| Class I2 | | | (32,728,848 | ) | | | (62,806,048 | ) |
| Net decrease in net assets from capital transactions | | | (30,694,204 | ) | | | (40,549,005 | ) |
| | | | | | | | | |
| Total decrease in net assets | | | (31,652,730 | ) | | | (49,672,360 | ) |
| | | | | | | | | |
| Net Assets: | | | | | | | | |
| Beginning of period | | | 64,723,387 | | | | 114,395,747 | |
| End of period | | $ | 33,070,657 | | | $ | 64,723,387 | |
| | | | | | | | | |
| Capital Share Transactions: | | | | | | | | |
| Shares sold: | | | | | | | | |
| Class A | | | 592 | | | | 68,101 | |
| Class I | | | 296,194 | | | | 1,745,404 | |
| Shares reinvested: | | | | | | | | |
| Class A | | | 14,401 | | | | 41,401 | |
| Class I | | | 137,204 | | | | 516,281 | |
| Shares redeemed: | | | | | | | | |
| Class A | | | (257,054 | ) | | | (170,370 | ) |
| Class I | | | (3,592,249 | ) | | | (6,182,136 | ) |
| Net decrease in capital share transactions | | | (3,400,912 | ) | | | (3,981,319 | ) |
| 1 | Net redemption fee proceeds of $22 and $72, respectively. |
| 2 | Net redemption fee proceeds of $2,082 and $4,107, respectively. |
See accompanying Notes to Financial Statements.
ACR International Quality Return (IQR) Fund
STATEMENTS OF CHANGES IN NET ASSETS
| | | For the
Year Ended
November 30, 2020 | | | For the
Year Ended
November 30, 2019 | |
| Increase (Decrease) in Net Assets from: | | | | | | | | |
| Operations: | | | | | | | | |
| Net investment income (loss) | | $ | (42,379 | ) | | $ | 195,071 | |
| Net realized gain (loss) | | | 43,254 | | | | (358,815 | ) |
| Net change in unrealized appreciation/depreciation on investments and foreign currency translations | | | 4,877,315 | | | | 984,082 | |
| Net increase from reimbursement by affiliates (Note 3) | | | 4,202 | | | | 1,272 | |
| Net increase in net assets resulting from operations | | | 4,882,392 | | | | 821,610 | |
| | | | | | | | | |
| Distributions to Shareholders: | | | | | | | | |
| Distributions: | | | | | | | | |
| Class A | | | (32 | ) | | | (78 | ) |
| Class I | | | (204,998 | ) | | | (306,175 | ) |
| Total distributions to shareholders | | | (205,030 | ) | | | (306,253 | ) |
| | | | | | | | | |
| Capital Transactions: | | | | | | | | |
| Net proceeds from shares sold: | | | | | | | | |
| Class I | | | 5,008,074 | | | | 5,366,748 | |
| Reinvestment of distributions: | | | | | | | | |
| Class A | | | 32 | | | | 78 | |
| Class I | | | 204,998 | | | | 306,175 | |
| Cost of shares redeemed: | | | | | | | | |
| Class I1 | | | (1,442,217 | ) | | | (2,881,544 | ) |
| Net increase in net assets from capital transactions | | | 3,770,887 | | | | 2,791,457 | |
| | | | | | | | | |
| Total increase in net assets | | | 8,448,249 | | | | 3,306,814 | |
| | | | | | | | | |
| Net Assets: | | | | | | | | |
| Beginning of period | | | 21,886,944 | | | | 18,580,130 | |
| End of period | | $ | 30,335,193 | | | $ | 21,886,944 | |
| | | | | | | | | |
| Capital Share Transactions: | | | | | | | | |
| Shares sold: | | | | | | | | |
| Class I | | | 485,258 | | | | 542,247 | |
| Shares reinvested: | | | | | | | | |
| Class A | | | 3 | | | | 9 | |
| Class I | | | 19,807 | | | | 33,683 | |
| Shares redeemed: | | | | | | | | |
| Class I | | | (153,359 | ) | | | (312,361 | ) |
| Net increase in capital share transactions | | | 351,709 | | | | 263,578 | |
| 1 | Net redemption fee proceeds of $41 and $1,200, respectively. |
See accompanying Notes to Financial Statements.
ACR Multi-Strategy Quality Return (MQR) Fund
FINANCIAL HIGHLIGHTS
Class A
Per share operating performance.
For a capital share outstanding throughout each period.
| | | For the Year Ended November 30, | |
| | | 2020 | | | 2019 | | | 2018 | | | 2017 | | | 2016 | |
| Net asset value, beginning of period | | $ | 10.20 | | | $ | 11.05 | | | $ | 11.26 | | | $ | 10.31 | | | $ | 9.84 | |
| Income from Investment Operations: | | | | | | | | | | | | | | | | | | | | |
| Net investment income (loss) 1 | | | 0.02 | | | | 0.18 | | | | 0.19 | | | | (0.01 | ) | | | (0.02 | ) |
| Net realized and unrealized gain (loss) | | | 1.36 | | | | (0.40 | ) | | | (0.26 | ) | | | 1.12 | | | | 0.49 | |
| Net increase from reimbursement by affiliates | | | - | | | | - | | | | - | 2,3 | | | - | | | | - | |
| Total from investment operations | | | 1.38 | | | | (0.22 | ) | | | (0.07 | ) | | | 1.11 | | | | 0.47 | |
| | | | | | | | | | | | | | | | | | | | | |
| Less Distributions: | | | | | | | | | | | | | | | | | | | | |
| From net investment income | | | (0.20 | ) | | | (0.24 | ) | | | - | | | | - | | | | - | |
| From net realized gain | | | (0.07 | ) | | | (0.39 | ) | | | (0.14 | ) | | | (0.16 | ) | | | - | 2 |
| Total distributions | | | (0.27 | ) | | | (0.63 | ) | | | (0.14 | ) | | | (0.16 | ) | | | - | 2 |
| | | | | | | | | | | | | | | | | | | | | |
| Redemption fee proceeds1 | | | - | 2 | | | - | 2 | | | - | 2 | | | - | 2 | | | - | 2 |
| Net asset value, end of period | | $ | 11.31 | | | $ | 10.20 | | | $ | 11.05 | | | $ | 11.26 | | | $ | 10.31 | |
| | | | | | | | | | | | | | | | | | | | | |
| Total return4 | | | 13.76 | % | | | (1.64 | )% | | | (0.68 | )% | | | 10.90 | % | | | 4.79 | % |
| | | | | | | | | | | | | | | | | | | | | |
| Ratios and Supplemental Data: | | | | | | | | | | | | | | | | | | | | |
| Net assets, end of period (in thousands) | | $ | 4,356 | | | $ | 6,397 | | | $ | 7,607 | | | $ | 4,748 | | | $ | 2,333 | |
| | | | | | | | | | | | | | | | | | | | | |
| Ratios of expenses to average net assets (including dividends on securities sold short and interest expense): | | | | | | | | | | | | | | | | | | | | |
| Before fees waived, expenses absorbed and fees paid indirectly | | | 2.23 | %5 | | | 1.90 | %5 | | | 1.89 | %5 | | | 2.07 | %5 | | | 2.25 | %5 |
| After fees waived, expenses absorbed and fees paid indirectly | | | 1.51 | %5 | | | 1.51 | %5 | | | 1.62 | %5 | | | 1.66 | %5 | | | 1.61 | %5 |
| Ratio of net investment income (loss) to average net assets (including dividends on securities sold short and interest expense): | | | | | | | | | | | | | | | | | | | | |
| Before fees waived, expenses absorbed and fees paid indirectly | | | (0.46 | )% | | | 1.37 | % | | | 1.43 | % | | | (0.49 | )% | | | (0.85 | )% |
| After fees waived, expenses absorbed and fees paid indirectly | | | 0.26 | % | | | 1.76 | % | | | 1.70 | % | | | (0.08 | )% | | | (0.21 | )% |
| | | | | | | | | | | | | | | | | | | | | |
| Portfolio turnover rate | | | 33 | % | | | 18 | % | | | 48 | % | | | 33 | % | | | 14 | % |
| 1 | Based on average daily shares outstanding for the period. |
| 2 | Amount represents less than $0.01 per share. |
| 3 | During the year ended November 30, 2018, the Advisor reimbursed the Fund $3,826 for errors during processing. The reimbursement had no impact to the Fund's performance. |
| 4 | Total returns would have been lower had expenses not been waived or absorbed by the Advisor. Returns shown include Rule 12b-1 fees of up to 0.25% and do not reflect the deduction of taxes that a shareholder would pay on Fund distributions or the redemption of Fund shares. |
| 5 | If interest expense and dividends on securities sold short had been excluded, the expense ratios would have been lowered by 0.14% for the year ended November 30, 2020. For the years ended November 30, 2019, 2018, 2017 and 2016, the ratios would have been lowered by 0.13%, 0.24%, 0.29% and 0.24%, respectively. |
See accompanying Notes to Financial Statements.
ACR Multi-Strategy Quality Return (MQR) Fund
FINANCIAL HIGHLIGHTS
Class I
Per share operating performance.
For a capital share outstanding throughout each period.
| | | For the Year Ended November 30, | |
| | | 2020 | | | 2019 | | | 2018 | | | 2017 | | | 2016 | |
| Net asset value, beginning of period | | $ | 10.27 | | | $ | 11.12 | | | $ | 11.32 | | | $ | 10.33 | | | $ | 9.85 | |
| Income from Investment Operations: | | | | | | | | | | | | | | | | | | | | |
| Net investment income1 | | | 0.04 | | | | 0.20 | | | | 0.22 | | | | 0.01 | | | | - | 2 |
| Net realized and unrealized gain (loss) | | | 1.36 | | | | (0.40 | ) | | | (0.27 | ) | | | 1.14 | | | | 0.48 | |
| Net increase from reimbursement by affiliates | | | - | | | | - | | | | - | 2,3 | | | - | | | | - | |
| Total from investment operations | | | 1.40 | | | | (0.20 | ) | | | (0.05 | ) | | | 1.15 | | | | 0.48 | |
| | | | | | | | | | | | | | | | | | | | | |
| Less Distributions: | | | | | | | | | | | | | | | | | | | | |
| From net investment income | | | (0.22 | ) | | | (0.26 | ) | | | (0.01 | ) | | | - | | | | - | |
| From net realized gain | | | (0.07 | ) | | | (0.39 | ) | | | (0.14 | ) | | | (0.16 | ) | | | - | 2 |
| Total distributions | | | (0.29 | ) | | | (0.65 | ) | | | (0.15 | ) | | | (0.16 | ) | | | - | 2 |
| | | | | | | | | | | | | | | | | | | | | |
| Redemption fee proceeds1 | | | - | 2 | | | - | 2 | | | - | 2 | | | - | 2 | | | - | 2 |
| Net asset value, end of period | | $ | 11.38 | | | $ | 10.27 | | | $ | 11.12 | | | $ | 11.32 | | | $ | 10.33 | |
| | | | | | | | | | | | | | | | | | | | | |
| Total return4 | | | 13.91 | % | | | (1.44 | )% | | | (0.50 | )% | | | 11.27 | % | | | 4.89 | % |
| | | | | | | | | | | | | | | | | | | | | |
| Ratios and Supplemental Data: | | | | | | | | | | | | | | | | | | | | |
| Net assets, end of period (in thousands) | | $ | 28,715 | | | $ | 58,326 | | | $ | 106,789 | | | $ | 90,046 | | | $ | 49,574 | |
| | | | | | | | | | | | | | | | | | | | | |
| Ratios of expenses to average net assets (including dividends on securities sold short and interest expense): | | | | | | | | | | | | | | | | | | | | |
| Before fees waived, expenses absorbed and fees paid indirectly | | | 2.03 | %5 | | | 1.69 | %5 | | | 1.67 | %5 | | | 1.86 | %5 | | | 2.05 | %5 |
| After fees waived, expenses absorbed and fees paid indirectly | | | 1.31 | %5 | | | 1.30 | %5 | | | 1.40 | %5 | | | 1.45 | %5 | | | 1.41 | %5 |
| Ratio of net investment income (loss) to average net assets (including dividends on securities sold short and interest expense): | | | | | | | | | | | | | | | | | | | | |
| Before fees waived, expenses absorbed and fees paid indirectly | | | (0.26 | )% | | | 1.58 | % | | | 1.65 | % | | | (0.28 | )% | | | (0.65 | )% |
| After fees waived, expenses absorbed and fees paid indirectly | | | 0.46 | % | | | 1.97 | % | | | 1.92 | % | | | 0.13 | % | | | (0.01 | )% |
| | | | | | | | | | | | | | | | | | | | | |
| Portfolio turnover rate | | | 33 | % | | | 18 | % | | | 48 | % | | | 33 | % | | | 14 | % |
| 1 | Based on average daily shares outstanding for the period. |
| 2 | Amount represents less than $0.01 per share. |
| 3 | During the year ended November 30, 2018, the Advisor reimbursed the Fund $3,826 for errors during processing. The reimbursement had no impact to the Fund's performance. |
| 4 | Total returns would have been lower had expenses not been waived or absorbed by the Advisor. Returns shown do not reflect the deduction of taxes that a shareholder would pay on Fund distributions or the redemption of Fund shares. |
| 5 | If interest expense and dividends on securities sold short had been excluded, the expense ratios would have been lowered by 0.14% for the year ended November 30, 2020. For the years ended November 30, 2019, 2018, 2017 and 2016, the ratios would have been lowered by 0.13%, 0.24%, 0.29% and 0.24%, respectively. |
See accompanying Notes to Financial Statements.
ACR International Quality Return (IQR) Fund
FINANCIAL HIGHLIGHTS
Class A
Per share operating performance.
For a capital share outstanding throughout each period.
| | | For the Year Ended November 30, | | | For the Period
December 30, 2016*
through November 30, 2017 | |
| | | 2020 | | | 2019 | | | 2018 | | | | |
| Net asset value, beginning of period | | $ | 10.17 | | | $ | 9.85 | | | $ | 10.82 | | | $ | 10.00 | |
| Income from Investment Operations: | | | | | | | | | | | | | | | | |
| Net investment income (loss) 1 | | | (0.03 | ) | | | 0.08 | | | | 0.06 | | | | 0.01 | |
| Net realized and unrealized gain (loss) | | | 2.05 | | | | 0.40 | | | | (0.95 | ) | | | 0.81 | |
| Net increase from reimbursement by affiliates (Note 3) | | | - | 2,3 | | | - | 2,3 | | | - | 2,4 | | | - | |
| Total from investment operations | | | 2.02 | | | | 0.48 | | | | (0.89 | ) | | | 0.82 | |
| | | | | | | | | | | | | | | | | |
| Less Distributions: | | | | | | | | | | | | | | | | |
| From net investment income | | | (0.06 | ) | | | (0.06 | ) | | | (0.01 | ) | | | - | |
| From net realized gain | | | - | | | | (0.10 | ) | | | (0.07 | ) | | | - | |
| Total distributions | | | (0.06 | ) | | | (0.16 | ) | | | (0.08 | ) | | | - | |
| Net asset value, end of period | | $ | 12.13 | | | $ | 10.17 | | | $ | 9.85 | | | $ | 10.82 | |
| | | | | | | | | | | | | | | | | |
| Total return5 | | | 19.99 | % | | | 5.00 | % | | | (8.27 | )% | | | 8.20 | %6 |
| | | | | | | | | | | | | | | | | |
| Ratios and Supplemental Data: | | | | | | | | | | | | | | | | |
| Net assets, end of period (in thousands) | | $ | 6 | | | $ | 5 | | | $ | 5 | | | $ | 6 | |
| | | | | | | | | | | | | | | | | |
| Ratio of expenses to average net assets (including interest expense): | | | | | | | | | | | | | | | | |
| Before fees waived, expenses absorbed and fees paid indirectly | | | 2.36 | % | | | 2.39 | % | | | 2.74 | % | | | 4.22 | %7 |
| After fees waived, expenses absorbed and fees paid indirectly | | | 1.35 | % | | | 1.35 | % | | | 1.35 | % | | | 1.35 | %7 |
| Ratio of net investment income (loss) to average net assets (including interest expense): | | | | | | | | | | | | | | | | |
| Before fees waived, expenses absorbed and fees paid indirectly | | | (1.35 | )% | | | (0.22 | )% | | | (0.84 | )% | | | (2.79 | )%7 |
| After fees waived, expenses absorbed and fees paid indirectly | | | (0.34 | )% | | | 0.82 | % | | | 0.55 | % | | | 0.08 | %7 |
| | | | | | | | | | | | | | | | | |
| Portfolio turnover rate | | | 44 | % | | | 32 | % | | | 52 | % | | | 9 | %6 |
| * | Commencement of operations. |
| 1 | Based on average daily shares outstanding for the period. |
| 2 | Amount represents less than $0.01 per share. |
| 3 | Reimbursement had no impact to the Fund's performance (Note 3). |
| 4 | During the year ended November 30, 2018, the Advisor reimbursed the Fund $1,010 for errors during processing. The reimbursement had no impact to the Fund's performance. |
| 5 | Total returns would have been lower had expenses not been waived or absorbed by the Advisor. Returns shown include Rule 12b-1 fees of up to 0.25% and do not reflect the deduction of taxes that a shareholder would pay on Fund distributions or the redemption of Fund shares. |
See accompanying Notes to Financial Statements.
ACR International Quality Return (IQR) Fund
FINANCIAL HIGHLIGHTS
Class I
Per share operating performance.
For a capital share outstanding throughout each period.
| | | For the Year Ended November 30, | | | For the Period
December 30, 2016*
through November 30, 2017 | |
| | | 2020 | | | 2019 | | | 2018 | | | | |
| Net asset value, beginning of period | | $ | 10.19 | | | $ | 9.86 | | | $ | 10.84 | | | $ | 10.00 | |
| Income from Investment Operations: | | | | | | | | | | | | | | | | |
| Net investment income (loss) 1 | | | (0.02 | ) | | | 0.10 | | | | 0.08 | | | | 0.02 | |
| Net realized and unrealized gain (loss) | | | 2.07 | | | | 0.40 | | | | (0.96 | ) | | | 0.82 | |
| Net increase from reimbursement by affiliates (Note 3) | | | - | 2,3 | | | - | 2,3 | | | - | 2,4 | | | - | |
| Total from investment operations | | | 2.05 | | | | 0.50 | | | | (0.88 | ) | | | 0.84 | |
| | | | | | | | | | | | | | | | | |
| Less Distributions: | | | | | | | | | | | | | | | | |
| | | | | | | | | | | | | | | | | |
| From net investment income | | | (0.10 | ) | | | (0.07 | ) | | | (0.03 | ) | | | - | |
| From net realized gain | | | - | | | | (0.10 | ) | | | (0.07 | ) | | | - | |
| Total distributions | | | (0.10 | ) | | | (0.17 | ) | | | (0.10 | ) | | | - | |
| | | | | | | | | | | | | | | | | |
| Redemption fee proceeds1 | | | - | 2 | | | - | 2 | | | - | 2 | | | - | 2 |
| Net asset value, end of period | | $ | 12.14 | | | $ | 10.19 | | | $ | 9.86 | | | $ | 10.84 | |
| | | | | | | | | | | | | | | | | |
| Total return5 | | | 20.23 | % | | | 5.18 | % | | | (8.20 | )% | | | 8.40 | %6 |
| | | | | | | | | | | | | | | | | |
| Ratios and Supplemental Data: | | | | | | | | | | | | | | | | |
| Net assets, end of period (in thousands) | | $ | 30,329 | | | $ | 21,882 | | | $ | 18,575 | | | $ | 14,316 | |
| | | | | | | | | | | | | | | | | |
| Ratio of expenses to average net assets (including interest expense): | | | | | | | | | | | | | | | | |
| Before fees waived, expenses absorbed and fees paid indirectly | | | 2.20 | % | | | 2.24 | % | | | 2.59 | % | | | 4.06 | %7 |
| After fees waived, expenses absorbed and fees paid indirectly | | | 1.19 | % | | | 1.20 | % | | | 1.20 | % | | | 1.19 | %7 |
| Ratio of net investment income (loss) to average net assets (including interest expense): | | | | | | | | | | | | | | | | |
| Before fees waived, expenses absorbed and fees paid indirectly | | | (1.20 | )% | | | (0.07 | )% | | | (0.69 | )% | | | (2.62 | )%7 |
| After fees waived, expenses absorbed and fees paid indirectly | | | (0.19 | )% | | | 0.97 | % | | | 0.70 | % | | | 0.25 | %7 |
| | | | | | | | | | | | | | | | | |
| Portfolio turnover rate | | | 44 | % | | | 32 | % | | | 52 | % | | | 9 | %6 |
| * | Commencement of operations. |
| 1 | Based on average daily shares outstanding for the period. |
| 2 | Amount represents less than $0.01 per share. |
| 3 | Reimbursement had no impact to the Fund's performance (Note 3). |
| 4 | During the year ended November 30, 2018, the Advisor reimbursed the Fund $1,010 for errors during processing. The reimbursement had no impact to the Fund's performance. |
| 5 | Total returns would have been lower had expenses not been waived or absorbed by the Advisor. Returns shown do not reflect the deduction of taxes that a shareholder would pay on Fund distributions or the redemption of Fund shares. |
See accompanying Notes to Financial Statements.
ACR Funds
NOTES TO FINANCIAL STATEMENTS
November 30, 2020
Note 1 – Organization
ACR Multi-Strategy Quality Return (MQR) Fund and ACR International Quality Return (IQR) Fund (each a “Fund” and collectively the ‘‘Funds’’) are organized as a non-diversified series of Investment Managers Series Trust II, a Delaware statutory trust (the “Trust”) which is registered as an open-end management investment company under the Investment Company Act of 1940, as amended (the “1940 Act”).
The ACR Multi-Strategy Quality Return (MQR) Fund seeks to preserve capital from permanent loss during periods of economic decline, and to provide above average absolute and relative returns in the long run. The Fund commenced investment operations on December 31, 2014, with two classes of shares, Class A and Class I.
The ACR International Quality Return (IQR) Fund seeks to protect capital from permanent impairment while providing a return above both the Fund’s cost of capital and above the Fund’s benchmark over a full market cycle. The Fund commenced investment operations on December 30, 2016, with two classes of shares, Class A and Class I.
The shares of each class represent an interest in the same portfolio of investments of the Funds and have equal rights as to voting, redemptions, dividends and liquidation, subject to the approval of the Trustees. Income, expenses (other than expenses attributable to a specific class) and realized and unrealized gains and losses on investments are allocated to each class of shares in proportion to their relative net assets. Shareholders of a class that bears distribution and service expenses under the terms of a distribution plan have exclusive voting rights to that distribution plan.
Each Fund is an investment company and accordingly follows the investment company accounting and reporting guidance of the Financial Accounting Standards Board (FASB) Accounting Standard Codification Topic 946 “Financial Services—Investment Companies.”
Note 2 – Accounting Policies
The following is a summary of the significant accounting policies consistently followed by the Funds in the preparation of their financial statements. The preparation of financial statements in conformity with accounting principles generally accepted in the United States of America (“GAAP”) requires management to make estimates and assumptions that affect the reported amounts and disclosures in the financial statements. Actual results could differ from these estimates.
(a) Valuation of Investments
The Funds value equity securities at the last reported sale price on the principal exchange or in the principal over the counter (“OTC”) market in which such securities are traded, as of the close of regular trading on the NYSE on the day the securities are being valued or, if the last-quoted sales price is not readily available, the securities will be valued at the last bid or the mean between the last available bid and ask price. Securities traded on the NASDAQ are valued at the NASDAQ Official Closing Price (“NOCP”). Investments in open-end investment companies are valued at the daily closing net asset value of the respective investment company. Options are valued at the mean between the last available bid and asked prices used. Debt securities are valued by utilizing a price supplied by independent pricing service providers. The independent pricing service providers may use various valuation methodologies including matrix pricing and other analytical pricing models as well as market transactions and dealer quotations. These models generally consider such factors as yields or prices of bonds of comparable quality, type of issue, coupon, maturity, ratings and general market conditions. If a price is not readily available for a portfolio security, the security will be valued at fair value (the amount which the Funds might reasonably expect to receive for the security upon its current sale) as determined in good faith by the Funds’ advisor, subject to review and approval by the Valuation Committee, pursuant to procedures adopted by the Board of Trustees. The actions of the Valuation Committee are subsequently reviewed by the Board at its next regularly scheduled board meeting. The Valuation Committee meets as needed. The Valuation Committee is comprised of all the Trustees, but action may be taken by any one of the Trustees.
ACR Funds
NOTES TO FINANCIAL STATEMENTS - Continued
November 30, 2020
(b) Short Sales
Short sales are transactions under which the Funds sell a security it does not own in anticipation of a decline in the value of that security. To complete such a transaction, the Funds must borrow the security to make delivery to the buyer. The Funds then are obligated to replace the security borrowed by purchasing the security at market price at the time of replacement. The price at such time may be more or less than the price at which the security was sold by the Funds. When a security is sold short a decrease in the value of the security will be recognized as a gain and an increase in the value of the security will be recognized as a loss, which is potentially limitless. Until the security is replaced, the Funds are required to pay the lender amounts equal to dividend or interest that accrue during the period of the loan which is recorded as an expense. To borrow the security, the Funds also may be required to pay a premium or an interest fee, which are recorded as interest expense. Cash or securities are segregated for the broker to meet the necessary margin requirements. The Funds are subject to the risk that it may not always be able to close out a short position at a particular time or at an acceptable price.
(c) Options
The Funds may write or purchase options contracts primarily to enhance the Funds’ returns or reduce volatility. In addition, the Funds may utilize options in an attempt to generate gains from option premiums or to reduce overall portfolio risk. When a Fund writes or purchases an option, an amount equal to the premium received or paid by a Fund is recorded as a liability or an asset and is subsequently adjusted to the current market value of the option written or purchased. Premiums received or paid from writing or purchasing options which expire unexercised are treated by a Fund on the expiration date as realized gains or losses. The difference between the premium and the amount paid or received on effecting a closing purchase or sale transaction, including brokerage commissions, is also treated as a realized gain or loss. If an option is exercised, the premium paid or received is added to the cost of the purchase or proceeds from the sale in determining whether a Fund has realized a gain or a loss on investment transactions. A Fund, as a writer of an option, may have no control over whether the underlying securities may be sold (call) or purchased (put) and as a result bears the market risk of an unfavorable change in the price of the security underlying the written option.
(d) Investment Transactions, Investment Income and Expenses
Investment transactions are accounted for on the trade date. Realized gains and losses on investments are determined on the identified cost basis. Dividend income is recorded net of applicable withholding taxes on the ex-dividend date and interest income is recorded on an accrual basis. Withholding taxes on foreign dividends, if applicable, are paid (a portion of which may be reclaimable) or provided for in accordance with the applicable country’s tax rules and rates and are disclosed in the Statements of Operations. Withholding tax reclaims are filed in certain countries to recover a portion of the amounts previously withheld. The Funds record a reclaim receivable based on a number of factors, including a jurisdiction’s legal obligation to pay reclaims as well as payment history and market convention. Discounts or premiums on debt securities are accreted or amortized to interest income over the lives of the respective securities using the effective interest method. Income and expenses of the Funds are allocated on a pro rata basis to each class of shares, except for distribution and service fees which are unique to each class of shares. Expenses incurred by the Trust with respect to more than one Fund are allocated in proportion to the net assets of each Fund except where allocation of direct expenses to each Fund or an alternative allocation method can be more appropriately made.
While not significant to the total portfolio, the ACR Multi-Strategy Quality Return (MQR) Fund holds preferred equity instruments in its investment portfolio that contain payment-in-kind (“PIK”) interest. The PIK interest, computed at the contractual rate specified in each debt agreement, is periodically added to the principal balance of the debt and is recorded as interest income. Thus, the actual collection of this interest may be deferred until the time of debt principal repayment. These non-cash sources of income may need to be paid out to stockholders in the form of distributions, even though the Fund may not have collected the PIK interest in cash. The Fund will stop accruing PIK interest and will write off any accrued and uncollected interest when it is determined that such PIK interest is no longer collectible.
ACR Funds
NOTES TO FINANCIAL STATEMENTS - Continued
November 30, 2020
(e) Federal Income Taxes
Each Fund intends to comply with the requirements of Subchapter M of the Internal Revenue Code applicable to regulated investment companies and to distribute substantially all of its net investment income and any net realized gains to its shareholders. Therefore, no provision is made for federal income or excise taxes. Due to the timing of dividend distributions and the differences in accounting for income and realized gains and losses for financial statement and federal income tax purposes, the fiscal year in which amounts are distributed may differ from the year in which the income and realized gains and losses are recorded by the Funds.
Accounting for Uncertainty in Income Taxes (the “Income Tax Statement”) requires an evaluation of tax positions taken (or expected to be taken) in the course of preparing a Fund’s tax returns to determine whether these positions meet a “more-likely-than-not” standard that, based on the technical merits, have a more than fifty percent likelihood of being sustained by a taxing authority upon examination. A tax position that meets the “more-likely-than-not” recognition threshold is measured to determine the amount of benefit to recognize in the financial statements. The Funds recognize interest and penalties, if any, related to unrecognized tax benefits as income tax expense in the Statements of Operations.
The Income Tax Statement requires management of the Funds to analyze tax positions taken in the prior three open tax years, if any, and tax positions expected to be taken in the Funds’ current tax year, as defined by the IRS statute of limitations for all major jurisdictions, including federal tax authorities and certain state tax authorities. As of November 30, 2020 and during the prior three tax years, the Funds did not have a liability for any unrecognized tax benefits. The Funds have no examination in progress and are not aware of any tax positions for which it is reasonably possible that the total amounts of unrecognized tax benefits will significantly change in the next twelve months.
(f) Distributions to Shareholders
The Funds will make distributions of net investment income and capital gains, if any, at least annually. Distributions to shareholders are recorded on the ex-dividend date. The amount and timing of distributions are determined in accordance with federal income tax regulations, which may differ from GAAP.
The character of distributions made during the year from net investment income or net realized gains may differ from the characterization for federal income tax purposes due to differences in the recognition of income expense and gain (loss) items for financial statement and tax purposes.
(g) Illiquid Securities
Pursuant to Rule 22e-4 under the 1940 Act, the Funds have adopted a Liquidity Risk Management Program (“LRMP”) that requires, among other things, that the Funds limit their illiquid investments that are assets to no more than 15% of net assets. An illiquid investment is any security which may not reasonably be expected to be sold or disposed of in current market conditions in seven calendar days or less without the sale or disposition significantly changing the market value of the investment. If the Advisor, at any time, determines that the value of illiquid securities held by a Fund exceeds 15% of its net asset value, the Advisor will take such steps as it considers appropriate to reduce them as soon as reasonably practicable in accordance with the Funds’ written LRMP.
ACR Funds
NOTES TO FINANCIAL STATEMENTS - Continued
November 30, 2020
(h) Use of Estimates
The presentation of financial statements in conformity with GAAP requires management to make estimates and assumptions that affect the reported amounts of assets and liabilities at the date of the financial statements and the reported amounts of income and expenses during the reporting period. Actual results could differ from those estimates.
Note 3 – Investment Advisory and Other Agreements
The Trust, on behalf of the Funds, entered into an Investment Advisory Agreement (the “Agreement”) with ACR Alpine Capital Research, LLC (the “Advisor”). Under the terms of the Agreement, the Funds pay a monthly investment advisory fee to the Advisor based on each Fund’s average daily net assets. The annual rates are listed by Fund in the table below. The Advisor has contractually agreed to waive its fee and/or pay for operating expenses (excluding any taxes, leverage interest, acquired fund fees and expenses (as determined in accordance with Form N-1A), dividend and interest expense on short sales, brokerage commissions, expenses incurred in connection with any merger or reorganization and extraordinary expenses such as litigation expenses) in order to limit total annual operating expenses of each fund. This agreement is in effect until March 31, 2021 for the Funds, and it may be terminated before that date only by the Trust’s Board of Trustees. The table below contains the expense cap by Fund and by Class.
| | Investment Advisory Fees | Total Limit on Annual
Operating Expenses Class A Shares† | Total Limit on Annual Operating Expenses Class I Shares† |
| ACR Multi-Strategy Quality Return (MQR) Fund | 1.00% | 1.40% | 1.25% |
| ACR International Quality Return (IQR) Fund | 1.00% | 1.40% | 1.25% |
†The total limit on annual operating expenses is calculated based on each Fund’s average daily net assets.
For the year ended November 30, 2020, the Advisor waived a portion of its advisory fees totaling $289,883 for the ACR Multi-Strategy Quality Return (MQR) Fund and $222,043 for the ACR International Quality Return (IQR) Fund, respectively. The Funds’ advisor is permitted to seek reimbursement from the Funds, subject to certain limitations, of fees waived or payments made to the Funds for a period ending three full fiscal years after the date of the waiver or payment. This reimbursement may be requested from the Funds if the reimbursement will not cause the Funds’ annual expense ratio to exceed the lesser of (a) the expense limitation amount in effect at the time such fees were waived or payments made, or (b) the expense limitation amount in effect at the time of the reimbursement. At November 30, 2020, the amount of these potentially recoverable expenses was $875,084 and $660,426, respectively. The Advisor may recapture all or a portion of this amount no later than November 30 of the years stated below:
| | ACR Multi-Strategy Quality Return (MQR) Fund | ACR International Quality Return (IQR) Fund |
| 2021 | | 295,373 | | 242,254 |
| 2022 | | 289,828 | | 196,129 |
| 2023 | | 289,883 | | 222,043 |
| Total | $ | 875,084 | $ | 660,426 |
ACR Funds
NOTES TO FINANCIAL STATEMENTS - Continued
November 30, 2020
UMB Fund Services, Inc. (“UMBFS”) serves as the Funds’ fund accountant, transfer agent and co-administrator; and Mutual Fund Administration, LLC (“MFAC”) serves as the Funds’ other co-administrator. UMB Bank, n.a., an affiliate of UMBFS, serves as the Funds’ custodian. The Funds’ allocated fees incurred for fund accounting, fund administration, transfer agency and custody services for the year ended November 30, 2020, are reported on the Statements of Operations.
IMST Distributors, LLC serves as the Funds’ distributor (the “Distributor”). The Distributor does not receive compensation from the Funds for its distribution services; the Advisor pays the Distributor a fee for its distribution-related services.
Certain trustees and officers of the Trust are employees of UMBFS or MFAC. The Fund does not compensate trustees and officers affiliated with the Funds’ co-administrators. For the year ended November 30, 2020, the Funds’ allocated fees incurred to Trustees who are not affiliated with the Funds’ co-administrators are reported on the Statements of Operations. A portion of the fees were paid by the Trust's Co-Administrators. Such amount is shown as a reduction of expenses, "Fees paid indirectly", on the Statements of Operations.
The Funds’ Board of Trustees has adopted a Deferred Compensation Plan (the “Plan”) for the Independent Trustees that enables Trustees to elect to receive payment in cash or the option to select various fund(s) in the Trust in which their deferred accounts shall be deemed to be invested. If a trustee elects to defer payment, the Plan provides for the creation of a deferred payment account. The Funds’ liability for these amounts is adjusted for market value changes in the invested fund(s) and remains a liability to the Funds until distributed in accordance with the Plan. The Trustees Deferred compensation liability under the Plan constitutes a general unsecured obligation of each Fund and is disclosed in the Statements of Assets and Liabilities. Contributions made under the plan and the change in unrealized appreciation/depreciation and income are included in the Trustees’ fees and expenses in the Statements of Operations.
Dziura Compliance Consulting, LLC provides Chief Compliance Officer (“CCO”) services to the Trust. The Funds’ allocated fees incurred for CCO services for the year ended November 30, 2020, are reported on the Statements of Operations.
During the year ended November 30, 2020, UMB Bank reimbursed the ACR International Quality Return (IQR) Fund $4,202 for FX loss. This amount is reported on the Fund’s Statements of Operations and Statements of Changes in Net Assets under the caption “Net increase from reimbursement by affiliates.” These reimbursements had no impact on the Fund’s performance. During the year ended November 30, 2019, the Advisor reimbursed the ACR International Quality Return (IQR) Fund $1,272 for errors during processing. This amount is reported on the Fund’s Statements of Changes in Net Assets under the caption “Net increase from reimbursement by affiliates.” These reimbursements had no impact on the Fund’s performance.
ACR Funds
NOTES TO FINANCIAL STATEMENTS - Continued
November 30, 2020
Note 4 – Federal Income Taxes
At November 30, 2020, the cost of securities and the proceeds from securities sold short, on a tax basis and gross unrealized appreciation and depreciation of investments and securities sold short for federal income tax purposes were as follows:
| | | ACR Multi-Strategy Quality Return (MQR) Fund | | | ACR International Quality Return (IQR) Fund | |
| Cost of investments | | $ | 35,511,025 | | | $ | 26,497,783 | |
| | | | | | | | | |
| Gross unrealized appreciation | | $ | 4,548,818 | | | $ | 5,591,597 | |
| Gross unrealized depreciation | | | (7,617,670 | ) | | | (1,750,759 | ) |
| | | | | | | | | |
| Net unrealized appreciation (depreciation) on investments and securities sold short | | $ | (3,068,852 | ) | | $ | 3,840,838 | |
The difference between cost amounts for financial statement and federal income tax purposes is due primarily to timing differences in recognizing certain gains and losses in security transactions.
GAAP requires that certain components of net assets be reclassified between financial and tax reporting. These reclassifications have no effect on net assets or net asset value per share. For the year ended November 30, 2020, permanent differences in book and tax accounting have been reclassified to paid-in capital and total distributable earnings (accumulated deficit) as follows:
| | Increase (Decrease) | |
| Fund | | | Paid-in Capital | | | | Total Distributable Earnings (Accumulated Deficit) | |
| ACR Multi-Strategy Quality Return (MQR) Fund | | $ | 701 | | | $ | (701 | ) |
| ACR International Quality Return (IQR) Fund | | | 1,377 | | | | (1,377 | ) |
As of November 30, 2020, the components of accumulated earnings (deficit) on a tax basis were as follows:
| | | ACR Multi-Strategy Quality Return (MQR) Fund | | | ACR International Quality Return (IQR) Fund | |
| Undistributed ordinary income | | $ | 174,424 | | | $ | 108,251 | |
| Undistributed long-term capital gains | | | - | | | | - | |
| Accumulated earnings | | | 174,424 | | | | 108,251 | |
| | | | | | | | | |
| Accumulated capital and other losses | | | (117,998 | ) | | | - | |
| Unrealized appreciation (depreciation) on investments and securities sold short | | | (3,068,852 | ) | | | 3,840,838 | |
| Unrealized appreciation on foreign currency translations | | | - | | | | 1,542 | |
| Unrealized deferred compensation | | | (16,729 | ) | | | (15,882 | ) |
| Total accumulated earnings (deficit) | | $ | (3,029,155 | ) | | $ | 3,934,749 | |
ACR Funds
NOTES TO FINANCIAL STATEMENTS - Continued
November 30, 2020
At November 30, 2020, the Funds had non-expiring capital loss carryforwards as follows:
| | | | Not Subject to Expiration: | |
| Fund | | | Short-Term | | | | Long-Term | |
| ACR Multi-Strategy Quality Return (MQR) Fund | | $ | - | | | | 117,998 | |
| ACR International Quality Return (IQR) Fund | | | - | | | | - | |
During the period ended November 30, 2020, the International Quality Return (IQR) Fund utilized $574 and $102,325 of short-term and long-term capital loss carryforwards, respectively.
The tax character of distributions paid during the periods ended November 30, 2020 and November 30, 2019, respectively, was as follows:
| | | | ACR Multi-Strategy Quality Return (MQR) Fund | | | | ACR International Quality Return (IQR) Fund | |
| Distribution paid from: | | | 2020 | | | | 2019 | | | | 2020 | | | | 2019 | |
| Ordinary income | | $ | 1,251,781 | | | $ | 3,146,471 | | | $ | 205,030 | | | $ | 123,214 | |
| Net long-term capital gains | | | 377,066 | | | | 2,654,239 | | | | - | | | | 183,039 | |
| Total taxable distributions | | $ | 1,628,847 | | | $ | 5,800,710 | | | $ | 205,030 | | | $ | 306,253 | |
Note 5 – Redemption Fee
The Funds may impose a redemption fee of 2.00% of the total redemption amount on all shares redeemed within 90 days of purchase. For the year ended November 30, 2020 and the year ended November 30, 2019, respectively, the ACR Multi-Strategy Quality Return (MQR) Fund received $2,104 and $4,179 in redemption fees, and the ACR International Quality Return (IQR) Fund received $41 and $1,200 in redemption fees.
Note 6 – Investment Transactions
For the year ended November 30, 2020, purchases and sales of investments, excluding short-term investments, were as follows:
| | | Purchases | | | Sales | | | Proceeds from Securities Sold Short | | | Cover Short Securities | |
| ACR Multi-Strategy Quality Return (MQR) Fund | | $ | 12,397,576 | | | $ | 36,399,685 | | | $ | 1,179,032 | | | $ | 6,705,797 | |
| ACR International Quality Return (IQR) Fund | | | 12,350,570 | | | | 8,201,196 | | | | - | | | | - | |
Note 7 – Distribution Plan
The Trust, on behalf of the Funds, has adopted a Distribution Plan (the “Plan”) pursuant to Rule 12b-1 under the 1940 Act that allows the Funds to pay distribution fees for the sale and distribution of their Class A shares. With respect to Class A shares, the Plan provides for the payment of distribution fees at the annual rate of up to 0.25% of average daily net assets. Class I shares do not pay any distribution fees.
For the year ended November 30, 2020, distribution fees incurred are disclosed on the Statements of Operations.
ACR Funds
NOTES TO FINANCIAL STATEMENTS - Continued
November 30, 2020
Note 8 – Shareholder Servicing Plan
The Trust, on behalf of the Funds, has adopted a Shareholder Servicing Plan to pay a fee at an annual rate of up to 0.05% of average daily net assets of Class A shares and 0.15% of average daily net assets of Class I shares serviced by shareholder servicing agents who provide administrative and support services to their customers.
For the year ended November 30, 2020, shareholder servicing fees incurred are disclosed on the Statements of Operations.
Note 9 – Indemnifications
In the normal course of business, the Funds enter into contracts that contain a variety of representations which provide general indemnifications. The Funds’ maximum exposure under these arrangements is unknown, as this would involve future claims that may be made against the Funds that have not yet occurred. However, the Funds expect the risk of loss to be remote.
Note 10 – Fair Value Measurements and Disclosure
Fair Value Measurements and Disclosures defines fair value, establishes a framework for measuring fair value in accordance with GAAP, and expands disclosure about fair value measurements. It also provides guidance on determining when there has been a significant decrease in the volume and level of activity for an asset or a liability, when a transaction is not orderly, and how that information must be incorporated into a fair value measurement.
Under Fair Value Measurements and Disclosures, various inputs are used in determining the value of the Funds’ investments. These inputs are summarized into three broad Levels as described below:
| ● | Level 1 – Unadjusted quoted prices in active markets for identical assets or liabilities that the Funds have the ability to access. |
| ● | Level 2 – Observable inputs other than quoted prices included in Level 1 that are observable for the asset or liability, either directly or indirectly. These inputs may include quoted prices for the identical instrument on an inactive market, prices for similar instruments, interest rates, prepayment speeds, credit risk, yield curves, default rates and similar data. |
| ● | Level 3 – Unobservable inputs for the asset or liability, to the extent relevant observable inputs are not available, representing the Funds’ own assumptions about the assumptions a market participant would use in valuing the asset or liability, and would be based on the best information available. |
The availability of observable inputs can vary from security to security and is affected by a wide variety of factors, including for example, the type of security, whether the security is new and not yet established in the marketplace, the liquidity of markets, and other characteristics particular to the security. To the extent that valuation is based on models or inputs that are less observable or unobservable in the market, the determination of fair value requires more judgment. Accordingly, the degree of judgment exercised in determining fair value is greatest for instruments categorized in Level 3.
The inputs to measure fair value may fall into different Levels of the fair value hierarchy. In such cases, for disclosure purposes, the Level in the fair value hierarchy within which the fair value measurement falls in its entirety, is determined based on the lowest Level input that is significant to the fair value measurement in its entirety.
ACR Funds
NOTES TO FINANCIAL STATEMENTS - Continued
November 30, 2020
The inputs or methodology used for valuing securities are not an indication of the risk associated with investing in those securities. The following is a summary of the inputs used, as of November 30, 2020, in valuing the Funds’ assets carried at fair value:
| ACR Multi-Strategy Return (MQR) Fund | | Level 1 | | | Level 2 | | | Level 3 | | | Total |
| Assets | | | | | | | | | | | |
| Common Stock | | | | | | | | | | | | | | | | |
| Communications | | $ | 5,415,310 | | | $ | - | | | $ | - | | | $ | 5,415,310 | |
| Consumer Discretionary | | | 4,244,275 | | | | 2,661,886 | | | | - | | | | 6,906,161 | |
| Consumer Staples | | | 1,525,716 | | | | 404,125 | | | | - | | | | 1,929,841 | |
| Energy | | | 2,374,232 | | | | - | | | | - | | | | 2,374,232 | |
| Financials | | | 9,116,774 | | | | 1,806,598 | | | | - | | | | 10,923,372 | |
| Industrials | | | 375,060 | | | | 1,446,904 | | | | - | | | | 1,821,964 | |
| Materials | | | 1,752,041 | | | | - | | | | - | | | | 1,752,041 | |
| Real Estate | | | 1,236,410 | | | | - | | | | - | | | | 1,236,410 | |
| Preferred Stocks | | | - | | | | - | | | | 429,189 | | | | 429,189 | |
| Short-Term Investments | | | 106,203 | | | | - | | | | - | | | | 106,203 | |
| Total Assets | | $ | 26,146,021 | | | $ | 6,319,513 | | | $ | 429,189 | | | $ | 32,894,723 | |
| | | | | | | | | | | | | | | | | |
| Liabilities | | | | | | | | | | | | | | | | |
| Securities Sold Short | | | | | | | | | | | | | | | | |
| Exchange-Traded Funds | | | 452,550 | | | | - | | | | - | | | | 452,550 | |
| Total Liabilities | | $ | 452,550 | | | $ | - | | | $ | - | | | $ | 452,550 | |
| ACR International Quality Return (IQR) Fund | | | Level 1 | | | | Level 2 | | | | Level 3* | | | | Total | |
| Assets | | | | | | | | | | | | | | | | |
| Common Stock | | | | | | | | | | | | | | | | |
| Canada | | $ | 1,149,939 | | | $ | - | | | $ | - | | | $ | 1,149,939 | |
| Denmark | | | - | | | | 1,146,658 | | | | - | | | | 1,146,658 | |
| France | | | - | | | | 3,657,775 | | | | - | | | | 3,657,775 | |
| Ireland | | | - | | | | 1,142,001 | | | | - | | | | 1,142,001 | |
| Italy | | | - | | | | 581,149 | | | | - | | | | 581,149 | |
| Norway | | | - | | | | 2,665,350 | | | | - | | | | 2,665,350 | |
| Switzerland | | | - | | | | 1,079,217 | | | | - | | | | 1,079,217 | |
| United Kingdom | | | 10,039,412 | | | | 2,611,712 | | | | - | | | | 12,651,124 | |
| United States | | | 873,408 | | | | - | | | | - | | | | 873,408 | |
| Short-Term Investments | | | 5,392,000 | | | | - | | | | - | | | | 5,392,000 | |
| Total Assets | | $ | 17,454,759 | | | $ | 12,883,862 | | | $ | - | | | $ | 30,338,621 | |
| * | The Fund did not hold any Level 3 securities at period end. |
ACR Funds
NOTES TO FINANCIAL STATEMENTS - Continued
November 30, 2020
The following is a reconciliation of assets in which significant unobservable inputs (Level 3) were used in determining value:
| | | ACR Multi-Strategy Quality Return (MQR) Fund | |
| Beginning balance November 30, 2019 | | $ | 487,733 | |
| Transfers into Level 3 during the period | | | 487,716 | |
| Transfers out of Level 3 during the period | | | (487,733 | ) |
| Total realized gain/(loss) | | | - | |
| Change in unrealized appreciation/(depreciation) | | | (58,527 | ) |
| Net purchases | | | - | |
| Payment-in-Kind (PIK) Interest | | | - | |
| Net sales | | | - | |
| Balance as of November 30, 2020 | | $ | 429,189 | |
The following table presents additional quantitative information about valuation methodologies and inputs used for investments that are measured at fair value and categorized within Level 3 as of November 30, 2020:
| ACR Multi-Strategy Quality Return (MQR) Fund |
| Asset Class | | Fair Value at 11/30/2020 | | | Valuation Technique(s) | | Unobservable Input(1) | | Range of Input | | | Weighted Average of Input | | | Impact to Valuation from an Increase in Input(2) |
| Preferred Stocks | | $ | 429,189 | | | Asset Approach | | Estimated Recovery Proceeds | | $ | 40.674 | | | $ | 95.226 | | | $ | 77.87 | | | Increase |
| (1) | The investment sub-advisor considers relevant indications of value that are reasonably and timely available to it in determining the fair value to be assigned to a particular security, such as the type and cost of the security; contractual or legal restrictions on resale of the security; relevant financial or business developments of the issuer; actively traded related securities; conversion or exchange rights on the security; related corporate actions; significant events occurring after the close of trading in the security; and changes in overall market conditions. The Fund’s use of fair value pricing may cause the net asset value of Fund shares to differ from the net asset value that would be calculated using market quotations. Fair value pricing involves subjective judgments and it is possible that the fair value determined for a security may be materially different than the value that could be realized upon the sale of that security. |
| (2) | This column represents the directional change in the fair value of the Level 3 investments that would result from an increase to the corresponding unobservable input. A decrease to the unobservable input would have the opposite effect. |
Note 11 – Covid-19 Risks
In early 2020, an outbreak of a novel strain of coronavirus (COVID-19) emerged globally. This coronavirus has resulted in closing international borders, enhanced health screenings, healthcare service preparation and delivery, quarantines, cancellations, disruptions to supply chains and customer activity, as well as general public concern and uncertainty. The impact of this outbreak has negatively affected the worldwide economy, as well as the economies of individual countries, the financial health of individual companies and the market in general in significant and unforeseen ways. The future impact of COVID-19 is currently unknown, and it may exacerbate other risks that apply to the Funds, including political, social and economic risks. Any such impact could adversely affect the Funds’ performance, the performance of the securities in which the Funds invest and may lead to losses on your investment in the Funds. The ultimate impact of COVID-19 on the financial performance of the Funds’ investments is not reasonably estimable at this time.
ACR Funds
NOTES TO FINANCIAL STATEMENTS - Continued
November 30, 2020
Note 12 – Events Subsequent to the Fiscal Period End
The Funds have adopted financial reporting rules regarding subsequent events which require an entity to recognize in the financial statements the effects of all subsequent events that provide additional evidence about conditions that existed at the date of the balance sheet. Management has evaluated the Funds’ related events and transactions that occurred through the date of issuance of the Funds’ financial statements.
The Funds each declared the payment of distributions to be paid, on December 17, 2020, to shareholders of record on December 16, 2020 as follows:
| | | Short Term Capital Gain | Long Term Capital Gain | Income |
| ACR Multi-Strategy Quality Return (MQR) Fund | Class A Shares | None | None | $0.05926 |
| ACR Multi-Strategy Quality Return (MQR) Fund | Class I Shares | None | None | 0.08176 |
| ACR International Quality Return (IQR) Fund | Class A Shares | $0.05356 | None | None |
| ACR International Quality Return (IQR) Fund | Class I Shares | 0.05356 | None | None |
There were no other events or transactions that occurred during this period that materially impacted the amounts or disclosures in the Funds’ financial statements.
REPORT OF INDEPENDENT REGISTERED PUBLIC ACCOUNTING FIRM
To the Shareholders of the ACR Funds and
the Board of Trustees of
Investment Managers Series Trust II
Opinion on the Financial Statements
We have audited the accompanying statements of assets and liabilities of ACR Multi-Strategy Quality Return (MQR) Fund and ACR International Quality Return (IQR) Fund (the “Funds”), each a series of Investment Managers Series Trust II, including the schedules of investments, as of November 30, 2020, the related statements of operations, the statements of changes, and the financial highlights for the periods stated in the table below, and the related notes (collectively referred to as the “financial statements”). In our opinion, the financial statements present fairly, in all material respects, the financial position of the Funds as of November 30, 2020, the results of their operations, the changes in their net assets, and the financial highlights for the periods stated in the table below, in conformity with accounting principles generally accepted in the United States of America.
Individual Funds Constituting Investment Managers Series Trust II | Statement Of Operations | Statements Of Changes In Net Assets | Financial Highlights |
MQR | For the year ended November 30, 2020 | For each of the two years in period ended November 30, 2020 | For each of the five years in the period ended November 30, 2020 |
IQR | For the year ended November 30, 2020 | For each of the two years in period ended November 30, 2020 | For each of the three years in the period ended November 30, 2020 and for the period December 30, 2016 (commencement of operations) to November 30, 2017 |
Basis for Opinion
These financial statements are the responsibility of the Funds’ management. Our responsibility is to express an opinion on the Funds financial statements based on our audits. We are a public accounting firm registered with the Public Company Accounting Oversight Board (United States) (“PCAOB”) and are required to be independent with respect to the Funds in accordance with the U.S. federal securities laws and the applicable rules and regulations of the Securities and Exchange Commission and the PCAOB. We have served as the auditor of one or more of the funds in the Trust since 2013.
We conducted our audits in accordance with the standards of the PCAOB. Those standards require that we plan and perform the audits to obtain reasonable assurance about whether the financial statements are free of material misstatement, whether due to error or fraud. The Funds are not required to have, nor were we engaged to perform, an audit of their internal control over financial reporting. As part of our audits we are required to obtain an understanding of internal control over financial reporting, but not for the purpose of expressing an opinion on the effectiveness of the Funds internal control over financial reporting. Accordingly, we express no such opinion.
Our audits included performing procedures to assess the risks of material misstatement of the financial statements, whether due to error or fraud, and performing procedures that respond to those risks. Such procedures included examining, on a test basis, evidence regarding the amounts and disclosures in the financial statements. Our audits also included evaluating the accounting principles used and significant estimates made by management, as well as evaluating the overall presentation of the financial statements. Our procedures included confirmation of securities owned as of November 30, 2020 by correspondence with the custodian and counter party. We believe that our audits provide a reasonable basis for our opinion.
| |  |
| | TAIT, WELLER & BAKER LLP |
Philadelphia, Pennsylvania
January 29, 2021
ACR Funds
SUPPLEMENTAL INFORMATION (Unaudited)
Long-Term Capital Gain Designation
For the year ended November 30, 2020, the Multi-Strategy Quality Return (MQR) designates $377,066 as a 20% rate gain distribution for purposes of the dividends paid deduction.
Qualified Dividend Income
For the year ended November 30, 2020, 100% and 100%, respectively, of dividends to be paid from net investment income, including short-term capital gains (if any), for the Multi-Strategy Quality Return (MQR) Fund and the International Quality Return (IQR) Fund, is designated as qualified dividend income.
Corporate Dividends Received Deduction
For the year ended November 30, 2020, 100% of the dividends paid from net investment income, including short-term capital gains, (if any), for the Multi-Strategy Quality Return (MQR) Fund, is designated as dividends received deduction available to corporate shareholders.
Trustees and Officers Information
Additional information about the Trustees is included in the Funds’ Statement of Additional Information which is available, without charge, upon request by calling (855) 955-9552. The Trustees and officers of the Funds and their principal occupations during the past five years are as follows:
Name, Address, Year of Birth and Position(s) held with Trust | Term of Officec and Length of Time Served | Principal Occupation During the Past Five Years and Other Affiliations | Number of Portfolios in the Fund Complex Overseen by Trusteed | Other Directorships Held by Trustee During the Past Five Years |
| “Independent” Trustees: | | | |
Thomas Knipper, CPA a (Born 1957) Trustee | Since September 2013 | Vice President and Chief Compliance Officer, Ameritas Investment Partners, a registered investment advisor (1995 – present). | 2 | None. |
Kathleen K. Shkuda a (born 1951) Trustee | Since September 2013 | Zigzag Consulting, a financial services consulting firm (2008 – present); Director, Managed Accounts, Merrill Lynch (2007 – 2008). | 2 | None. |
Larry D. Tashjian a (born 1953) Trustee and Chairman of the Board | Since September 2013 | Principal, CAM Capital Advisors, a family office (2001 – present). | 2 | General Finance Corporation. |
John P. Zader a (born 1961) Trustee | Since September 2013 | Retired (June 2014 – present); CEO, UMB Fund Services, Inc., a mutual fund and hedge fund service provider, and the transfer agent, fund accountant, and co-administrator for the Fund (December 2006 – June 2014); President, Investment Managers Series Trust (December 2007 – June 2014). | 2 | Investment Managers Series Trust, a registered investment company (includes 55 portfolios); 361 Social Infrastructure Fund, a closed-end investment company. |
ACR Funds
SUPPLEMENTAL INFORMATION (Unaudited) - Continued
Name, Address, Year of Birth and Position(s) held with Trust | Term of Officec and Length of Time Served | Principal Occupation During the Past Five Years and Other Affiliations | Number of Portfolios in the Fund Complex Overseen by Trusteed | Other Directorships Held by Trustee During the Past Five Years |
| Interested Trustee: | | | |
Eric M. Banhazl b† (born 1957) Trustee | Since September 2013 | Chairman, Foothill Capital Management, LLC, a registered investment advisor (2018 – present); Chairman (2016 – present), and President (2006 – 2015), Mutual Fund Administration, LLC, co-administrator for the Fund; Trustee and Vice President, Investment Managers Series Trust (September 2013 – January 2016). | 2 | Investment Managers Series Trust, a registered investment company (includes 55 portfolios); 361 Social Infrastructure Fund, a closed-end investment company. |
ACR Funds
SUPPLEMENTAL INFORMATION (Unaudited) - Continued
Name, Address, Year of Birth and Position(s) held with Trust | Term of Officec and Length of Time Served | Principal Occupation During the Past Five Years and Other Affiliations | Number of Portfolios in the Fund Complex Overseen by Trusteed | Other Directorships Held by Trustee During the Past Five Years |
| Interested Trustee: |
Terrance P. Gallagher a* (born 1958) Trustee and President | Since July 2019 | President, Investment Managers Series Trust II (September 2013 – present); Executive Vice President, UMB Fund Services, Inc. (2007 – present); and Director of Compliance, Unified Fund Services Inc. (now Huntington Fund Services), a mutual fund service provider (2004 – 2007). | 2 | Cliffwater Corporate Lending Fund, a registered investment company; Agility Multi-Asset Income Fund, a closed-end investment company; Corbin Multi-Strategy Fund, a closed-end investment company; Aspiriant Risk-Managed Real Asset Fund, a closed-end investment company; Aspiriant Risk-Managed Capital Appreciation Fund, a closed-end investment company; Infinity Core Alternative Fund, a closed-end investment company; Infinity Long/Short Equity Fund, LLC, a closed-end investment company; Keystone Private Income Fund, a closed-end investment company; Relative Value Fund, a closed-end investment company; Variant Alternative Income Fund, a closed-end investment company. |
ACR Funds
SUPPLEMENTAL INFORMATION (Unaudited) - Continued
Name, Address, Year of Birth and Position(s) held with Trust | Term of Officec and Length of Time Served | Principal Occupation During the Past Five Years and Other Affiliations | Number of Portfolios in the Fund Complex Overseen by Trusteed | Other Directorships Held by Trustee During the Past Five Years |
| Officers of the Trust: | | |
Rita Dam b (born 1966) Treasurer and Assistant Secretary | Since September 2013 | Co-President, Foothill Capital Management, LLC, a registered investment advisor (2018 – present); Co-Chief Executive Officer (2016 – present), and Vice President (2006 – 2015), Mutual Fund Administration, LLC. | N/A | N/A |
Joy Ausili b (born 1966) Vice President and Assistant Secretary | Since January 2016 | Co-President, Foothill Capital Management, LLC, a registered investment advisor (2018 – present); Co-Chief Executive Officer (2016 – present), and Vice President (2006 – 2015), Mutual Fund Administration, LLC; Secretary and Assistant Treasurer, Investment Managers Series Trust (September 2013 – January 2016). | N/A | N/A |
Diane Drake b (born 1967) Secretary | Since January 2016 | Senior Counsel, Mutual Fund Administration, LLC (October 2015 – present); Chief Compliance Officer, Foothill Capital Management, LLC, a registered investment advisor (2018 – 2019); Managing Director and Senior Counsel, BNY Mellon Investment Servicing (US) Inc. (2010 – 2015). | N/A | N/A |
Martin Dziura b (born 1959) Chief Compliance Officer | Since September 2013 | Principal, Dziura Compliance Consulting, LLC (October 2014 - present); Managing Director, Cipperman Compliance Services (2010 – September 2014); Chief Compliance Officer, Hanlon Investment Management (2009 - 2010); Vice President − Compliance, Morgan Stanley Investment Management (2000 − 2009). | N/A | N/A |
| a | Address for certain Trustees and certain officers: 235 West Galena Street, Milwaukee, Wisconsin 53212. |
| b | Address for Mr. Banhazl, Ms. Ausili, Ms. Dam and Ms. Drake: 2220 E. Route 66, Suite 226, Glendora, California 91740. |
Address for Mr. Dziura: 309 Woodridge Lane, Media, Pennsylvania 19063.
| c | Trustees and officers serve until their successors have been duly elected. |
| d | The Trust is comprised of 19 series managed by unaffiliated investment advisors. Each Trustee serves as Trustee of each series of the Trust. The term “Fund Complex” applies only to the Fund(s) managed by the same investment advisor. The Funds do not hold themselves out as related to any other series within the Trust, for purposes of investment and investor services, nor do they share the same investment advisor with any other series. |
| † | Mr. Banhazl is an “interested person” of the Trust by virtue of his position with Mutual Fund Administration, LLC and Foothill Capital Management, LLC. |
| * | Mr. Gallagher is an “interested person” of the Trust by virtue of his position with UMB Fund Services, Inc. |
ACR Funds
SUPPLEMENTAL INFORMATION (Unaudited) - Continued
Board Consideration of Investment Advisory Agreement
At a meeting held on October 19-20, 2020, the Board of Trustees (the “Board”) of Investment Managers Series Trust II (the “Trust”), including the trustees who are not “interested persons” of the Trust (the “Independent Trustees”) as defined in the Investment Company Act of 1940, as amended (the “1940 Act”), reviewed and unanimously approved the renewal of the investment advisory agreement (the “Advisory Agreement”) between the Trust and ACR Alpine Capital Research, LLC (the “Investment Advisor”) with respect to the ACR Multi-Strategy Quality Return (MQR) Fund (the “MQR Fund”) and the ACR International Quality Return (IQR) Fund (the “IQR Fund” and together with the MQR Fund, the “Funds”) series of the Trust for an additional one-year term from when it otherwise would expire. In approving renewal of the Advisory Agreement, the Board, including the Independent Trustees, determined that such renewal was in the best interests of each Fund and its shareholders. The Board acknowledged that in accordance with exemptive relief granted by the U.S. Securities and Exchange Commission, due to unforeseen emergency circumstances related to the COVID-19 pandemic, the meeting was being held by videoconference, and that as required by the relief, the Board would ratify the renewal of the Advisory Agreement at its next in-person meeting.
Background
In advance of the meeting, the Board received information about the Funds and the Advisory Agreement from the Investment Advisor and from Mutual Fund Administration, LLC and UMB Fund Services, Inc., the Trust’s co-administrators, certain portions of which are discussed below. The materials, among other things, included information about the Investment Advisor’s organization and financial condition; information regarding the background, experience, and compensation structure of relevant personnel providing services to the Funds; information about the Investment Advisor’s compliance policies and procedures, disaster recovery and contingency planning, and policies with respect to portfolio execution and trading; information regarding the profitability of the Investment Advisor’s overall relationship with the Funds; reports comparing the performance of each Fund with returns of its benchmark index and a group of comparable funds (each a “Peer Group”) selected by Broadridge Financial Solutions, Inc. (“Broadridge”) from Morningstar, Inc.’s relevant fund universe (each a “Fund Universe”) for various periods ended July 31, 2020; and reports comparing the investment advisory fee and total expenses of each Fund with those of its Peer Group and Fund Universe. The Board also received a memorandum from legal counsel to the Trust and the Independent Trustees discussing the legal standards under the 1940 Act and other applicable law for their consideration of the proposed renewal of the Advisory Agreement. In addition, the Board considered information reviewed by the Board during the year at other Board and Board committee meetings. No representatives of the Investment Advisor were present during the Board’s consideration of the Advisory Agreement, and the Independent Trustees were represented by their legal counsel with respect to the matters considered.
In renewing the Advisory Agreement, the Board and the Independent Trustees considered a variety of factors, including those discussed below. In their deliberations, the Board and the Independent Trustees did not identify any particular factor that was controlling, and each Trustee may have attributed different weights to the various factors.
Nature, Extent and Quality of Services
The Board considered information included in the meeting materials regarding the performance of each Fund. The materials they reviewed indicated the following:
| ● | The MQR Fund’s annualized total return for the five-year period was below the HFRI Equity Hedge (Total) Index return, the Peer Group and Tactical Allocation Fund Universe median returns, and the MSCI All Country World Index return by 0.99%, 1.44%, 3.01%, and 7.02%, respectively. The Fund’s annualized total return for the three-year period was below the HFRI Index return by 2.21%, the Peer Group median return by 4.39%, the Fund Universe median return by 5.18%, and the MSCI Index return by 9.57%. The Fund’s total return for the one-year period was below the HFRI Index return, the Fund Universe and Peer Group median returns, and the MSCI Index return by 4.27%, 6.66%, 8.46%, and 14.38%, respectively. The Trustees considered the Investment Advisor’s belief that the Fund’s underperformance relative to the Peer Group was due to the Fund’s relatively low net long position and the underperformance of companies in the real estate development, aerospace, and automotive industries, and in the telecommunications and financial sectors. The Trustees also noted the Investment Advisor’s assertion that the Fund’s recent performance was negatively impacted by the COVID-19 pandemic, and that based on the Investment Advisor’s estimates of the intrinsic values of the Fund’s underlying holdings, the Fund is well positioned to generate satisfactory absolute returns in excess of its cost of capital and relative returns in excess of its benchmark over a full market cycle. |
ACR Funds
SUPPLEMENTAL INFORMATION (Unaudited) - Continued
| ● | The IQR Fund’s total return for the one-year period was above the Peer Group median return, but below the MSCI All Country World Ex-USA Index return and the Foreign Large Blend Fund Universe median return by 2.87% and 3.12%, respectively. The Fund’s annualized total return for the three-year period was the same as the Peer Group median return, but below the Fund Universe median return by 2.98% and the MSCI Index return by 3.84%. The Trustees considered the Investment Advisor’s assertion that the Fund’s underperformance relative to the MSCI Index was due to the Fund’s fees and two specific portfolio holdings, one of which was negatively impacted to a significant degree by the COVID-19 pandemic. |
The Board also considered the overall quality of services provided by the Investment Advisor to the Funds. In doing so, the Board considered the Investment Advisor’s specific responsibilities in day-to-day management and oversight of the Funds, as well as the qualifications, experience, and responsibilities of the personnel involved in the activities of the Funds. The Board also considered the overall quality of the organization and operations of the Investment Advisor, as well as its compliance structure. The Board and the Independent Trustees concluded that based on the various factors they had reviewed, the nature, overall quality, and extent of the management and oversight services provided by the Investment Advisor to each Fund were satisfactory.
Advisory Fees and Expense Ratios
With respect to the advisory fees and expenses paid by the Funds, the meeting materials indicated the following:
| ● | The MQR Fund’s annual investment advisory fee (gross of fee waivers) was higher than the Peer Group and Tactical Allocation Fund Universe medians by 0.10% and 0.25%, respectively. The Trustees noted, however, that the Fund’s fee was not in the top quartile of funds in the Peer Group. The Trustees also considered the Investment Advisor’s representation that the Fund’s fee is commensurate with the anticipated incentive-based fees earned by the Investment Advisor from a private fund it manages using similar strategies as the Fund. The Trustees observed, however, that management of mutual fund assets requires compliance with certain requirements under the 1940 Act that do not apply to private funds. The Trustees also noted that the Fund’s advisory fee was the same as that of the other series of the Trust managed by the Investment Advisor. |
The annual total expenses paid by the Fund (net of fee waivers) for the Fund’s most recent fiscal year were lower than the Peer Group median, but higher than the Fund Universe median by 0.18%. The Trustees noted, however, that the average net assets of the Fund’s class considered by Broadridge were significantly lower than the average net assets of corresponding classes of funds in the Fund Universe, and that certain of those other funds also had significant assets in other classes.
| ● | The IQR Fund’s annual investment advisory fee (gross of fee waivers) was higher than the Peer Group and Foreign Large Blend Fund Universe medians by 0.05% and 0.25%, respectively. The Trustees noted, however, that the Fund’s fee was not in the top quartile of funds in the Peer Group. The Trustees considered that the Investment Advisor does not manage any other client accounts with the same objectives and policies as the Fund, and therefore they did not have a good basis for comparing the Fund’s advisory fee with those of other similar accounts of the Investment Advisor. The Trustees also noted that the Fund’s advisory fee was the same as that of the other series of the Trust managed by the Investment Advisor. |
ACR Funds
SUPPLEMENTAL INFORMATION (Unaudited) - Continued
The annual total expenses paid by the Fund (net of fee waivers) for the Fund’s most recent fiscal year were higher than the Peer Group and Fund Universe medians by 0.16% and 0.33%, respectively. The Trustees noted, however, that the average net assets of the Fund’s class considered by Broadridge were significantly lower than the average net assets of corresponding classes of funds in the Peer Group and Fund Universe, and that certain of those other funds also had significant assets in other classes.
The Board and the Independent Trustees concluded that based on the factors they had reviewed, the compensation payable to the Investment Advisor under the Advisory Agreement was fair and reasonable in light of the nature and quality of the services the Investment Advisor provides to the Funds.
Profitability and Economies of Scale
The Board next considered information prepared by the Investment Advisor relating to its costs and profits with respect to each Fund for the year ended July 31, 2020, noting that the Investment Advisor had waived almost its entire advisory fee for the IQR Fund, had waived a significant portion of its advisory fee for the MQR Fund, and had not realized a profit with respect to the IQR Fund. Recognizing the difficulty in evaluating an investment advisor’s profitability with respect to the funds it manages in the context of an advisor with multiple lines of business, and noting that other profitability methodologies might also be reasonable, the Board and the Independent Trustees concluded that the profit of the Investment Advisor from its relationship with the MQR Fund was reasonable.
The Board also considered the benefits received by the Investment Advisor as a result of the Investment Advisor’s relationship with the Funds, other than the receipt of its investment advisory fees, including any research received from broker-dealers providing execution services to the Funds, the beneficial effects from the review by the Trust’s Chief Compliance Officer of the Investment Advisor’s compliance program, and the intangible benefits of the Investment Advisor’s association with the Funds generally and any favorable publicity arising in connection with the Funds’ performance. The Board noted that although there were no advisory fee breakpoints, the asset levels of the Funds were not currently likely to lead to significant economies of scale, and that any such economies would be considered in the future as the Funds’ assets grow.
Conclusion
Based on these and other factors, the Board and the Independent Trustees concluded that renewal of the Advisory Agreement was in the best interests of each Fund and its shareholders and, accordingly, approved the renewal of the Advisory Agreement with respect to each Fund.
ACR Funds
SUPPLEMENTAL INFORMATION (Unaudited) - Continued
Statement Regarding Liquidity Risk Management Program
The Securities and Exchange Commission adopted Rule 22e-4 under the Investment Company Act of 1940, as amended (the “Liquidity Rule”), to promote effective liquidity risk management throughout the open-end investment company industry, thereby reducing the risk that funds will be unable to meet their redemption obligations and mitigating dilution of the interests of fund shareholders.
The Board of Trustees (the “Board”) of Investment Managers Series Trust II (the “Trust”) met on October 19-20, 2020 (the “Meeting”), to review the liquidity risk management program (the “Fund Program”) applicable to the following series of the Trust (each, a “Fund” and together, the “Funds”) pursuant to the Liquidity Rule:
ACR International Quality Return (IQR) Fund
ACR Multi-Strategy Quality Return (MQR) Fund
The Board has appointed ACR Alpine Capital Research, LLC, the investment adviser to the Funds, as the program administrator (“Program Administrator”) for the Fund Program. Under the Trust’s liquidity risk management program (the “Trust Program”), the Board has delegated oversight of the Trust Program to the Liquidity Oversight Committee (the “Oversight Committee”). At the Meeting, the Oversight Committee, on behalf of Program Administrator and the Funds, provided the Board with a written report (the “Report”) that addressed the operation, adequacy, and effectiveness of implementation of the Fund Program, and any material changes to it for the period from December 1, 2019 through July 31, 2020 (the “Program Reporting Period”).
In assessing the adequacy and effectiveness of implementation of the Fund Program, the Report discussed the following, among other things:
| ● | The Fund Program’s liquidity classification methodology for categorizing each Fund’s investments (including derivative transactions); |
| ● | An overview of market liquidity for each Fund during the Program Reporting Period; |
| ● | Each Fund’s ability to meet redemption requests; |
| ● | Each Fund’s cash management; |
| ● | Each Fund’s borrowing activity, if any, in order to meet redemption requests; |
| ● | Each Fund’s compliance with the 15% limit of illiquid investments; and |
| ● | Each Fund’s status as a primarily highly liquid fund (“PHLF”), the effectiveness of the implementation of the PHLF standard, and whether it would be appropriate for each Fund to adopt a highly liquid investment minimum (“HLIM”). |
The Report stated that the Funds primarily hold assets that are defined under the Liquidity Rule as "highly liquid investments," and therefore each Fund is not required to establish an HLIM. Highly liquid investments are defined as cash and any investment reasonably expected to be convertible to cash in current market conditions in three business days or less without the conversion to cash significantly changing the market value of the investment. The Report also stated that there were no material changes made to the Fund Program during the Program Reporting Period.
In the Report, the Program Administrator concluded that (i) the Fund Program, as adopted and implemented, remains reasonably designed to assess and manage each Fund’s liquidity risk; (ii) each Fund continues to qualify as a PHLF and therefore is not required to adopt an HLIM; (iii) during the Program Reporting Period, each Fund was able to meet redemption requests without significant dilution of remaining investors’ interests; and (iv) there were no weaknesses in the design or implementation of the Fund Program during the Program Reporting Period.
ACR Funds
SUPPLEMENTAL INFORMATION (Unaudited) - Continued
There can be no assurance that the Fund Program will achieve its objectives in the future. Please refer to the Funds’ prospectus for more information regarding each Fund’s exposure to liquidity risk and other principal risks to which an investment in the Funds may be subject.
ACR Funds |
|---|
EXPENSE EXAMPLES For the Six Months Ended November 30, 2020 (Unaudited) |
|---|
Expense Examples
As a shareholder of the Funds, you incur two types of costs: (1) transaction costs including sales charges (loads) on purchase payments on certain classes, and (2) ongoing costs, including management fees; distribution and/or service (12b-1) fees (Class A shares only) and other Fund expenses. The examples below are intended to help you understand your ongoing costs (in dollars) of investing in the Funds and to compare these costs with the ongoing costs of investing in other mutual funds.
These examples are based on an investment of $1,000 invested at the beginning of the period and held for the entire period from June 1, 2020 to November 30, 2020.
Actual Expenses
The information in the row titled “Actual Performance” of the table below provides actual account values and actual expenses. You may use the information in these columns, together with the amount you invested, to estimate the expenses that you paid over the period. Simply divide your account value by $1,000 (for example, an $8,600 account value divided by $1,000 = 8.6), then multiply the result by the number in the appropriate row for your share class, under the column titled “Expenses Paid During Period” to estimate the expenses you paid on your account during this period.
Hypothetical Example for Comparison Purposes
The information in the row titled “Hypothetical (5% annual return before expenses)” of the table below provides hypothetical account values and hypothetical expenses based on the Fund’s actual expense ratios and an assumed rate of return of 5% per year before expenses, which is not the Fund’s actual return. The hypothetical account values and expenses may not be used to estimate the actual ending account balance or expenses you paid for the period. You may use this information to compare the ongoing costs of investing in the Fund and other funds. To do so, compare these 5% hypothetical examples with the 5% hypothetical examples that appear in the shareholder reports of the other funds.
Please note that the expenses shown in the table are meant to highlight your ongoing costs only and do not reflect any transaction costs, such as sales charges (loads) or redemption fees. Therefore, the information in the row titled “Hypothetical (5% annual return before expenses)” is useful in comparing ongoing costs only, and will not help you determine the relative total costs of owning different funds. In addition, if these transactional costs were included, your costs would have been higher.
| ACR Multi-Strategy Quality Return (MQR) Fund | Beginning Account Value | Ending Account Value | Expenses Paid During Period* |
| 6/1/20 | 11/30/20 | 6/1/20 – 11/30/20 |
| Class A | Actual Performance | $1,000.00 | $1,327.50 | $8.80 |
| | Hypothetical (5% annual return before expenses) | 1,000.00 | 1,017.44 | 7.63 |
| Class I | Actual Performance | 1,000.00 | 1,327.90 | 7.64 |
| | Hypothetical (5% annual return before expenses) | 1,000.00 | 1,018.43 | 6.63 |
| * | Expenses are equal to the Fund’s annualized expense ratios of 1.51% and 1.31% for the Class A and Class I shares, respectively, multiplied by the average account values over the period, multiplied by 183/366 for Class A shares and Class I shares. The expense ratios reflect an expense waiver. Assume all dividends and distributions were reinvested. |
ACR Funds
EXPENSE EXAMPLES – Continued
For the Six Months Ended November 30, 2020 (Unaudited)
| ACR International Quality Return (IQR) Fund | Beginning Account Value | Ending Account Value | Expenses Paid During Period* |
| 6/1/20 | 11/30/20 | 6/1/20 – 11/30/20 |
| Class A | Actual Performance | $1,000.00 | $1,338.90 | $7.83 |
| | Hypothetical (5% annual return before expenses) | 1,000.00 | 1,018.31 | 6.75 |
| Class I | Actual Performance | 1,000.00 | 1,340.00 | 6.96 |
| | Hypothetical (5% annual return before expenses) | 1,000.00 | 1,019.05 | 6.00 |
| * | Expenses are equal to the Fund’s annualized expense ratios of 1.34% and 1.19% for the Class A and Class I shares, respectively, multiplied by the average account values over the period, multiplied by 183/366 for Class A shares and Class I shares. The expense ratios reflect an expense waiver. Assume all dividends and distributions were reinvested. |
ACR Funds
Each a series of Investment Managers Series Trust II
Investment Advisor
ACR Alpine Capital Research, LLC
8000 Maryland Avenue, Suite 700
Saint Louis, Missouri 63105
Independent Registered Public Accounting Firm
Tait, Weller & Baker LLP
Two Liberty Place
50 South 16th Street, Suite 2900
Philadelphia, Pennsylvania 19102
Custodian
UMB Bank, n.a.
928 Grand Boulevard, 5th Floor
Kansas City, Missouri 64106
Fund Co-Administrator
Mutual Fund Administration, LLC
2220 East Route 66, Suite 226
Glendora, California 91740
Fund Co-Administrator, Transfer Agent and Fund Accountant
UMB Fund Services, Inc.
235 West Galena Street
Milwaukee, Wisconsin 53212
Distributor
IMST Distributors, LLC
Three Canal Plaza, Suite 100
Portland, Maine 04101
www.foreside.com
FUND INFORMATION
| | TICKER | CUSIP |
| ACR Multi-Strategy Quality Return (MQR) Fund – Class A | MQRAX | 46141T 703 |
| ACR Multi-Strategy Quality Return (MQR) Fund – Class I | MQRIX | 46141T 802 |
| ACR International Quality Return (IQR) Fund – Class A | IQRAX | 46141T 661 |
| ACR International Quality Return (IQR) Fund – Class I | IQRIX | 46141T 653 |
Privacy Principles of the ACR Funds for Shareholders
The Funds are committed to maintaining the privacy of their shareholders and to safeguarding their non-public personal information. The following information is provided to help you understand what personal information the Funds collect, how we protect that information and why, in certain cases, we may share information with select other parties.
Generally, the Funds do not receive any non-public personal information relating to their shareholders, although certain non-public personal information of their shareholders may become available to the Funds. The Funds do not disclose any non-public personal information about their shareholders or former shareholders to anyone, except as permitted by law or as is necessary in order to service shareholder accounts (for example, to a transfer agent or third party administrator).
This report is sent to shareholders of the ACR Funds for their information. It is not a Prospectus, circular or representation intended for use in the purchase or sale of shares of the Funds or of any securities mentioned in this report.
Proxy Voting
The Funds’ proxy voting policies and procedures, as well information regarding how the Funds voted proxies for portfolio securities, if applicable, during the most recent 12-month period ended June 30, are also available, without charge and upon request by calling the Funds at (855) 955-9552, on the Funds’ website or on the SEC’s website at www.sec.gov.
Fund Portfolio Holdings
The Funds file their complete schedule of portfolio holdings with the SEC for the first and third quarters of each fiscal year on Form N-PORT within 60 days of the end of such fiscal quarter. Shareholders may obtain the Funds’ Form N-PORT on the SEC’s website at www.sec.gov.
Prior to their use of Form N-PORT, the Funds filed their complete schedule of portfolio holdings with the SEC on Form N-Q, which is available online at www.sec.gov.
Householding
The Funds will mail only one copy of shareholder documents, including prospectuses, and notice of annual and semi-annual reports availability and proxy statements, to shareholders with multiple accounts at the same address. This practice is commonly called “householding” and is intended to reduce expenses and eliminate duplicate mailings of shareholder documents. Mailings of your shareholder documents may be householded indefinitely unless you instruct us otherwise. If you do not want the mailing of these documents to be combined with those for other members of your household, please call the Funds at (855) 955-9552.
ACR Funds
P.O. Box 2175
Milwaukee, WI 53201
Toll Free: (855) 955-9552
Item 1. Report to Stockholders (Continued).
Item 2. Code of Ethics.
The registrant has adopted a code of ethics that applies to the registrant's principal executive officer and principal financial officer. The registrant has not made any amendments to its code of ethics during the period covered by this report. The registrant has not granted any waivers from any provisions of the code of ethics during the period covered by this report.
The registrant undertakes to provide to any person without charge, upon request, a copy of its code of ethics by mail when they call the registrant at 1-855-955-9552.
Item 3. Audit Committee Financial Expert.
The Board of Trustees of the Registrant has determined that the Registrant has the following “audit committee financial experts” as defined in Item 3(b) of Form N-CSR serving on its Audit Committee: Messrs. Thomas Knipper and John P. Zader. The audit committee financial experts are “independent” as that term is defined in Item 3(a)(2) of Form N-CSR.
Item 4. Principal Accountant Fees and Services.
The registrant has engaged its principal accountant to perform audit services, audit-related services, tax services and other services during the past two fiscal years. "Audit services" refer to performing an audit of the registrant's annual financial statements or services that are normally provided by the accountant in connection with statutory and regulatory filings or engagements for those fiscal years. "Audit-related services" refer to the assurance and related services by the principal accountant that are reasonably related to the performance of the audit. "Tax services" refer to professional services rendered by the principal accountant for tax compliance, tax advice, and tax planning. There were no "other services" provided by the principal accountant. The following table details the aggregate fees billed or expected to be billed for each of the last two fiscal years for audit fees, audit-related fees, tax fees and other fees by the principal accountant.
| | FYE 11/30/2020 | FYE 11/30/2019 |
| Audit Fees | $12,500 | $12,500 |
| Audit-Related Fees | N/A | N/A |
| Tax Fees | $2,500 | $2,500 |
| All Other Fees | N/A | N/A |
The audit committee has adopted pre-approval policies and procedures that require the audit committee to pre-approve all audit and non-audit services of the registrant, including services provided to any entity affiliated with the registrant.
The percentage of fees billed by Tait Weller applicable to non-audit services pursuant to waiver of pre-approval requirement were as follows:
| | FYE 11/30/2020 | FYE 11/30/2019 |
| Audit-Related Fees | 0% | 0% |
| Tax Fees | 0% | 0% |
| All Other Fees | 0% | 0% |
All of the principal accountant's hours spent on auditing the registrant's financial statements were attributed to work performed by full-time permanent employees of the principal accountant.
The following table indicates the non-audit fees billed or expected to be billed by the registrant's accountant for services to the registrant and to the registrant's investment advisor (and any other controlling entity, etc.—not sub-advisor) for the last two years. The audit committee of the Board of Trustees has considered whether the provision of non-audit services that were rendered to the registrant's investment advisor is compatible with maintaining the principal accountant's independence and has concluded that the provision of such non-audit services by the accountant has not compromised the accountant's independence.
| Non-Audit Related Fees | FYE 11/30/2020 | FYE 11/30/2019 |
| Registrant | N/A | N/A |
| Registrant’s Investment Advisor | N/A | N/A |
Item 5. Audit Committee of Listed Registrants.
| (a) | Not applicable to registrants who are not listed issuers (as defined in Rule 10A-3 under the Securities Exchange Act of 1934). |
Item 6. Schedule of Investments.
| (a) | Schedule of Investments is included as part of the report to shareholders filed under Item 1 of this Form. |
Item 7. Disclosure of Proxy Voting Policies and Procedures for Closed-End Management Investment Companies.
Not applicable to open-end investment companies.
Item 8. Portfolio Managers of Closed-End Management Investment Companies.
Not applicable to open-end investment companies.
Item 9. Purchases of Equity Securities by Closed-End Management Investment Company and Affiliated Purchasers.
Not applicable.
Item 10. Submission of Matters to a Vote of Security Holders.
The registrant has not made any material changes to the procedures by which shareholders may recommend nominees to the registrant’s Board of Trustees.
Item 11. Controls and Procedures.
| (a) | The Registrant’s President/Chief Executive Officer and Treasurer/Chief Financial Officer have reviewed the Registrant's disclosure controls and procedures (as defined in Rule 30a-3(c) under the Investment Company Act of 1940 (the “Act”)) as of a date within 90 days of the filing of this report, as required by Rule 30a-3(b) under the Act and Rules 13a-15(b) or 15d-15(b) under the Securities Exchange Act of 1934. Based on their review, such officers have concluded that the disclosure controls and procedures are effective in ensuring that information required to be disclosed in this report is appropriately recorded, processed, summarized and reported and made known to them by others within the Registrant and by the Registrant’s service provider. |
| (c) | There were no changes in the Registrant's internal control over financial reporting (as defined in Rule 30a-3(d) under the Act) that occurred during the period covered by this report that has materially affected, or is reasonably likely to materially affect, the Registrant's internal control over financial reporting. |
Item 12. Disclosure of Securities Lending Activities for Closed-End Management Investment Companies.
Not applicable to open-end investment companies.
Item 13. Exhibits.
(2) Certifications pursuant to Section 302 of the Sarbanes-Oxley Act of 2002. Filed herewith.
(3) Any written solicitation to purchase securities under Rule 23c-1 under the Act sent or given during the period covered by the report by or on behalf of the registrant to 10 or more persons. Not applicable to open-end investment companies.
(4) Change in the registrant’s independent public accountant. There was no change in the registrant’s independent public accountant for the period covered by this report.
SIGNATURES
Pursuant to the requirements of the Securities Exchange Act of 1934 and the Investment Company Act of 1940, the registrant has duly caused this report to be signed on its behalf by the undersigned, thereunto duly authorized.
| (Registrant) | Investment Managers Series Trust II | |
| | | |
| By (Signature and Title) | /s/ Terrance Gallagher | |
| | Terrance Gallagher, President/Chief Executive Officer | |
| | | |
| Date | 02/08/2021 | |
Pursuant to the requirements of the Securities Exchange Act of 1934 and the Investment Company Act of 1940, this report has been signed below by the following persons on behalf of the registrant and in the capacities and on the dates indicated.
| By (Signature and Title) | /s/ Terrance Gallagher | |
| | Terrance Gallagher, President/Chief Executive Officer | |
| | | |
| Date | 02/08/2021 | |
| | | |
| By (Signature and Title) | /s/ Rita Dam | |
| | Rita Dam, Treasurer/Chief Financial Officer | |
| | | |
| Date | 02/08/2021 | |