UNITED STATES
SECURITIES AND EXCHANGE COMMISSION
Washington, D.C. 20549
FORM N-CSR
CERTIFIED SHAREHOLDER REPORT OF REGISTERED
MANAGEMENT INVESTMENT COMPANIES
Investment Company Act file number 811-22894
INVESTMENT MANAGERS SERIES TRUST II
(Exact name of registrant as specified in charter)
235 W. Galena Street
Milwaukee, WI 53212
(Address of principal executive offices) (Zip code)
Diane J. Drake
Mutual Fund Administration, LLC
2220 E. Route 66, Suite 226
Glendora, CA 91740
(Name and address of agent for service)
(626) 385-5777
Registrant's telephone number, including area code
Date of fiscal year end: December 31
Date of reporting period: December 31, 2023
Item 1. Report to Stockholders.
| (a) | The registrant’s annual report transmitted to shareholders pursuant to Rule 30e-1 under the Investment Company Act of 1940, as amended (the “Investment Company Act”), is as follows: |
Kennedy Capital ESG SMID Cap Fund
(Institutional Class: KESGX)
Kennedy Capital Small Cap Growth Fund
(Institutional Class: KGROX)
Kennedy Capital Small Cap Value Fund
(Institutional Class: KVALX)
ANNUAL REPORT
DECEMBER 31, 2023
Kennedy Capital Funds
Each a series of Investment Managers Series Trust II
Table of Contents
| Shareholder Letter | 1 |
| Fund Performance | 11 |
| Schedule of Investments | 17 |
| Statements of Assets and Liabilities | 31 |
| Statements of Operations | 32 |
| Statements of Changes in Net Assets | 33 |
| Financial Highlights | 36 |
| Notes to Financial Statements | 39 |
| Report of Independent Registered Public Accounting Firm | 49 |
| Supplemental Information | 51 |
| Expense Example | 58 |
This report and the financial statements contained herein are provided for the general information of the shareholders of the Kennedy Capital Funds. This report is not authorized for distribution to prospective investors in the Fund unless preceded or accompanied by an effective prospectus.
www.kennedycapital.com

Executive Summary
The Kennedy Capital ESG SMID Cap Fund gained 16.56% (net of fees) in 2023, underperforming the Russell 2500™ benchmark by 86 basis points (bps). The underperformance in 2023 was driven by unfavorable stock selection in the Consumer Staples, Financials, and Consumer Discretionary sectors, partially offset by favorable selection in Industrials and Health Care, and favorable sector allocation in Industrials. The portfolio is fossil fuel free, has significantly lower greenhouse gas emissions in comparison to the benchmark*, and has no exposure to the producers of tobacco, civil firearms, or controversial weapons. The portfolio has broad exposure across the growth-to-value style spectrum, with modest under- and over-weight positioning across sectors.
Strategy Overview
We seek to outperform the Russell 2500™ Index, while optimizing the portfolio for financially material Environmental, Social, and Governance (ESG) considerations. Our approach to stock selection and portfolio construction is both inclusionary and exclusionary in nature. The inclusionary component of our process is based on identifying small and mid-cap companies that leverage an environmental advantage or offer a solution to a societal problem as part of the company’s product or service offerings. As part of our long-term risk management framework, we also consider each investment candidate’s governance framework and greenhouse gas emissions as part of our analysis. The exclusionary component of our process results in a portfolio that is fossil fuel free (defined as having no carbon reserves on the balance sheet), and has no exposure to producers of tobacco, civil firearms, or controversial weapons. The end result is a portfolio with exposure to many compelling, financially material societal and environmental trends, a significantly lower carbon footprint*, and favorable governance characteristics. We believe thoughtful integration of these material ESG considerations has the potential to manage long-term risk and optimize alpha generation.
Performance Review
2023 was a volatile year for Small- and Mid-Cap US equities. The regional banking crisis took center stage early in the year, and tightening actions from the US Federal Reserve gave way to an outlook for stable to declining interest rates as the year concluded. The fund underperformed its benchmark during the first half of 2023, which we believe was tied to fundamentals taking a backseat to some degree of emotional trading in the equity markets. Performance improved in the second half of the year, as fundamentals came back into focus, resulting in modest underperformance for the year as a whole.
Lingering effects of the COVID-19 pandemic were also at play in 2023, with healing supply chains leading to significant inventory destocking in certain sectors and industries. This caused a temporary negative impact on company fundamentals, but also created some buying opportunities for businesses with attractive long-term prospects.
We were especially pleased with the favorable relative performance in the Health Care sector in 2023. The market’s focus on GLP-1 weight loss drugs resulted in an assumption of radically changing prospects for a number of companies. This negativity in the sector drove valuations of some businesses to unusually attractive levels, and we took advantage of several opportunities for new Health Care buys as the year progressed. In certain instances, we’ve already observed the market taking a more realistic view of the intermediate-term impact of GLP-1’s reflected in improved share price performance.
| 10829 Olive Boulevard, Suite 100, St. Louis, MO 63141 | www.kennedycapital.com | (314) 432 – 0400 |
Portfolio Characteristics and Positioning
*As of 12/31/23, the fund had weighted average carbon emissions (Scope 1, reported and estimated) of 85,631 metric tons, an 89% reduction from the weighted average emissions of the benchmark. The portfolio had zero carbon reserves, while the benchmark had reserves that equate to over 672 million metric tons of potential future emissions. The weighted average governance score of the portfolio (based on Institutional Shareholder Services’ Quality Score metric) was 3.39 compared with 4.29 for the Russell 2500TM, or 21% more attractive (lower score is better).
Sector weightings in the portfolio are determined based on where we see the most compelling stock ideas and are not driven by a top-down forecast or macroeconomic model. As of 12/31/23, the portfolio was overweight the Industrials and Health Care sectors, and underweight Energy and Consumer Discretionary.
Outlook
Similar to the sentiment at the start of 2022 and 2023, we enter 2024 with the US economy on generally stable footing and unemployment at low levels, but ongoing concerns about a potential recession. Unique to 2024, however, the starting point for interest rates is much higher, allowing for more flexibility in monetary policy. Now more than ever, we believe market sentiment and the outlook for interest rates are inextricably linked.
The significant rally experienced in small- and mid-cap stocks in the last several weeks of 2023 is indicative of the valuation gap in comparison to large cap equities, and investors’ perception regarding the sensitivity of smaller companies’ values to changes in interest rates. We continue to see attractive values in our investable universe, but stock selection will be increasingly important given the recent move higher in equity valuations. We continue to prioritize balance in the portfolio construction and stock selection process, striving to create a portfolio where performance is not tied to one particular economic backdrop.
We remain confident in our ability to construct a portfolio with attractive ESG characteristics that strives to deliver relative investment outperformance over the long term. As always, we appreciate the confidence you place in our team.
Sincerely,

Christian McDonald
Portfolio Manager
*Source: Factset Research Systems Inc.
*Based on Global Industry Classification Standard (GICS), which was developed by and is the exclusive property and a service mark of MSCI Inc. (MSCI) and Standard & Poor’s, a division of The McGraw-Hill Companies, Inc.(S&P). Excludes cash.
| 10829 Olive Boulevard, Suite 100, St. Louis, MO 63141 | www.kennedycapital.com | (314) 432 – 0400 |
*Carbon Emissions (Scope 1 Wtd. Avg., mt.) is a weighted average of companies’ reported or estimated Scope 1 greenhouse gas emissions measured in metric tons. Scope 1 emissions are those from sources owned or controlled by the company, typically direct combustion of fuel as in a furnace or vehicle. Exposure to Fossil Fuels is a measurement of how much of a company’s business model is invested in or tied to fossil fuels. The Governance Score is the ISS Governance QualityScore, which is derived from publicly disclosed data on a company’s governance practices and for which a lower score is preferable and a score 10 is considered high risk.
The views in this letter were as of 12/31/2023 and may not necessarily reflect the same views on the date this letter is first published or any time thereafter. These views are intended to help shareholders in understanding the fund’s investment methodology and do not constitute investment advice.
Important Information: There can be no guarantee that any strategy (risk management or otherwise) will be successful. All investing involves risk, including potential loss of principal. Equity securities (stocks) are generally more volatile and carry more risk than fixed income securities (bonds) and money market investments. The net asset value per share of the ESG SMID Cap fund (the Fund) will fluctuate as the value of the securities in the portfolio changes. Common stocks, and funds investing in common stocks, generally provide greater returns over long time periods than fixed income securities. The Fund is comprised primarily of equity securities and is subject to market risk. Stocks may decline due to general market and economic conditions or due to company specific circumstances. The Fund is comprised of small-mid capitalization (“SMID cap”) stocks. SMID cap stocks typically carry additional risk, since smaller companies generally have a higher risk of failure, and historically have experienced a greater degree of volatility. ESG criteria may affect the Fund’s exposure to risks associated with certain issuers, industries and sectors, which may impact the Fund’s investment performance. The Fund may forgo some market opportunities available to funds that do not use these criteria. Small-mid capitalization companies generally have a greater risk of failure, and their stocks generally have greater volatility than large companies. Must be preceded or accompanied by a prospectus.
| 10829 Olive Boulevard, Suite 100, St. Louis, MO 63141 | www.kennedycapital.com | (314) 432 – 0400 |
Summary
The Kennedy Capital Small Cap Growth Fund returned +16.53% (net of fees) for the calendar year 2023. This compares to a gain of +18.66% for the Russell 2000® Growth benchmark.
Equity markets returns in 2023 were ultimately quite constructive but the path was very volatile and dominated by expectations for interest rates. All year long, market participants were hyper-focused on every nuanced bit of news that might indicate the future path of the Fed Funds Rate, a key macro factor that will impact the depth and duration of this business cycle. While the Federal Reserve steadily increased the Fed Funds Rate during the year, from 4.5% at the start to the current 5.25-5.50% level, it is the longer term 2 & 10-year Treasury yields that imbed the market’s expectations of the future Fed Fund path (and thus the economy as well). Simply looking at the 10-year Treasury yield’s small increase between the year’s beginning & ending levels (3.5% and 3.9%, respectively), one might have thought that 2023 bore few surprises. However, the path of this yield was much more volatile, peaking at 5% in October and then dropping dramatically in the last two months of the year, largely explaining the hyper-volatile moves in the equity markets. Commentary from the Fed Chair indicating that we have seen the end of rate hikes this cycle was the catalyst for the most recent Q4 rally.
Negative earnings revisions were the other primary driver of both individual company and overall market returns in 2023, as the impacts of normalizing inventory levels, slowing inflation, and weaker pockets of demand became fully realized. These impacts were more acutely felt by smaller-capitalization companies which comparatively skew more cyclical and/or are impacted by physical supply chains.
Overall, despite the volatility, the macro-economic backdrop ending up being roughly as we originally expected (i.e., settling around 4%ish long-term rates & a “soft landing” for the economy) and a reasonable environment for investing for growth. However, while the absolute performance for the strategy was good, the relative performance was slightly disappointing with the delta entirely self-inflicted due to several stock specific missteps in the Health Care sector.
Performance Review and Positioning
For calendar year 2023, the Kennedy Small Cap Growth fund returned +16.53% (net of fees), underperforming the Russell 2000® Growth Benchmark by 213 basis points. Relative underperformance in the fund was driven primarily by weak stock selection in Health Care and Industrials. This was partially offset by strong relative returns from holdings in the Consumer Staples sector, as well as the positive relative impact of not owning any companies in the Energy sector, which underperformed during this time period.
Sector weightings in the portfolio are determined based on where we see the most compelling stock ideas and are not driven by a top-down forecast or macroeconomic model. Our investment process seeks to identify companies with high current and/or future returns on investment with opportunities to invest in higher-than-average growth. As of 12/31/23, this resulted in our largest overweight sectors in the portfolio (relative to the Russell 2000® Growth Benchmark) being Industrials, Information Technology, and Real Estate. The largest underweight sectors relative to the benchmark were Energy, Materials, and Health Care.
| 10829 Olive Boulevard, Suite 100, St. Louis, MO 63141 | www.kennedycapital.com | (314) 432 – 0400 |
Outlook
Entering 2024 there is improved visibility on the key macro inputs, which should enable investors to return the focus to individual company earnings execution and longer-term growth opportunities. We believe the next meaningful leg of market performance will require improving corporate earnings and this should also lead to a broadening out of the market, benefiting small-capitalization stocks. While incremental macro-economic data continues to support the consensus view that “peak rates” are in, we do anticipate some continued volatility relating to the exact timing and realization of future rate reductions vs. expectations. This makes any short-term relative performance difficult to predict, but we believe that our strategy of investing in companies with higher *CFROIs (cash flow return on investment) and higher asset growth (i.e., re-investment opportunities) will mean that they are better positioned to deliver on earnings growth expectations over the next couple of years. Assuming our companies can execute against these growth opportunities, we believe this should be a recipe for longer term outperformance.
Thank you for your continued confidence in the Kennedy Capital team.
Sincerely,

Jean Barnard, CFA®
Portfolio Manager

Ryan Dunnegan, CPA
Assistant Portfolio Manager

Alex Mosman, CFA®
Assistant Portfolio Manager
| 10829 Olive Boulevard, Suite 100, St. Louis, MO 63141 | www.kennedycapital.com | (314) 432 – 0400 |
The views in this letter were as of December 31, 2023, and may not necessarily reflect the same views on the date this letter is first published or any time thereafter. These views are intended to help shareholders in understanding the fund’s investment methodology and do not constitute investment advice.
* A cash flow return on investment (CFROI) is a valuation metric that acts as a proxy for a company's economic return. CFROI is defined as the average economic return on all of a company's investment projects in a given year. This return is compared to the cost of capital, or discount rate, to determine value-added potential.
Important Information: There can be no guarantee that any strategy (risk management or otherwise) will be successful. All investing involves risk, including potential loss of principal. Equity securities (stocks) are generally more volatile and carry more risk than fixed income securities (bonds) and money market investments. The net asset value per share of the Kennedy Capital Small Cap Growth fund (the Fund) will fluctuate as the value of the securities in the portfolio changes. Common stocks, and funds investing in common stocks, generally provide greater returns over long time periods than fixed income securities. The Fund is comprised primarily of equity securities and is subject to market risk. Stocks may decline due to general market and economic conditions or due to company specific circumstances. The Fund is comprised of small capitalization (“Small cap”) stocks. Small cap stocks typically carry additional risk, since smaller companies generally have a higher risk of failure, and historically have experienced a greater degree of volatility. Small-mid capitalization companies generally have a greater risk of failure, and their stocks generally have greater volatility than large companies. Must be preceded or accompanied by a prospectus.
| 10829 Olive Boulevard, Suite 100, St. Louis, MO 63141 | www.kennedycapital.com | (314) 432 – 0400 |
Summary
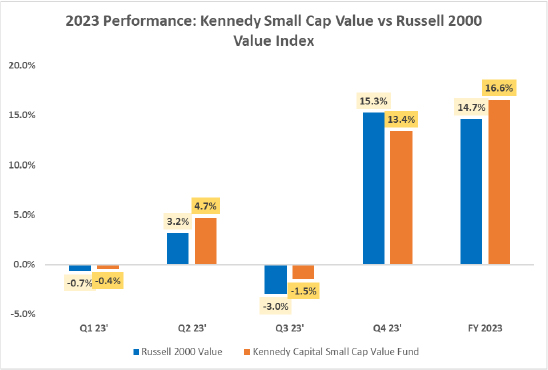
The Kennedy Capital Small Cap Value Fund returned 16.55% (net of fees) over the 12-month period ending 12/31/2023. This compares to a 14.65% return for the Russell 2000® Value benchmark.
2023 ended much differently than it started. A quick rehash of key market events/themes in 2023:
| - | Rising interest rates: In an effort to combat inflation, the Federal Reserve further raised the Federal Funds rate to 5.25 – 5.50% from 4.50% at the start of the year (and from 0.25% at the beginning of 2022). The yield on the 10-year treasury rose from 3.50% to a peak of 5.0% in October. As discussed in prior commentaries, rising interest rates are a headwind to equity valuations, which helps explain subdued market performance in the first three quarters of 2023. |
| - | Turbulence in the Regional Banking sector: The sharp rise in interest rates created an asset/liability mismatch issue within the banking sector, prompting the failure of three large regional banks: Silicon Valley Bank (SIVB), Signature Bank (SBNY), and First Republic (FRCB). Fears of a widespread banking “crisis” sent regional Bank equities (within the Russell 2000® Value Index) down over 18% in the month of March. |
| - | (Generally) Stable economic environment: All things considered – rising interest rates, problems in the banking sector, inflationary pressures -- US economic performance was generally steady in 2023. A healthy labor market has been a key factor, with the unemployment rate hovering near multi-decade lows. |
| 10829 Olive Boulevard, Suite 100, St. Louis, MO 63141 | www.kennedycapital.com | (314) 432 – 0400 |
| - | Growing Expectations of a Fed Pivot: Equity markets rose sharply in the fourth quarter as softer inflation data, falling treasury yields, and more favorable commentary from the Federal Reserve points to a less restrictive monetary backdrop in 2024. |
Performance Review and Positioning
Over the 12-month period ended 12/31/2023, the Kennedy Small Cap Value fund returned 16.55% (net of fees), outperforming the Russell 2000® Value Benchmark by 190 basis points. Relative outperformance in the fund was driven primarily by positive stock selection in the Materials, Industrials, and Consumer Discretionary sectors. This was partially offset by weaker relative returns from holdings in the Healthcare, Energy, and Real Estate sectors.
Sector weightings in the portfolio are determined based on where we see the most compelling stock ideas and are not driven by a top-down forecast or macroeconomic model. As of 12/31/23, the largest overweight sectors in the portfolio (relative to the Russell 2000® Value Benchmark) were Industrials, Materials, and Information Technology. The largest underweight sectors relative to the benchmark were Communication Services, Financials, and Energy.
Outlook
The volatility experienced in 2023 (and for the last 4 years!) reinforces the advantages of being a fundamentals-based, process-oriented investor in an increasingly uncertain world. Our greatest strength lies in our ability to adhere to a consistent process that emphasizes corporate performance and valuation discipline. This sounds simple, but it’s not easy. Short-term fluctuations in securities prices – caused by excitement around new technologies and themes, changes in financial conditions, etc. -- creates misleading narratives and distorts true underlying business value. Anchoring our investment process to proven value creation drivers, as well as maintaining a long-term investment horizon, is paramount to distinguishing between winners and losers.
Compounding franchise value over the long-term requires the combination of two key elements: 1) The ability to generate above-average returns on capital through an economic cycle, and 2) Opportunities to reinvest cash flows back into the business at attractive rates of return. In our opinion, companies that consistently generate substandard (or negative) returns – regardless of narratives and short-term price movements -- are destined to destroy shareholder value over time. The poor share price performance of money-losing companies over the last 20+ years – as shown in the chart below – confirms this view.
| 10829 Olive Boulevard, Suite 100, St. Louis, MO 63141 | www.kennedycapital.com | (314) 432 – 0400 |

By staying disciplined to our process, we believe we can construct a portfolio of companies that in aggregate have superior fundamental attributes relative to the overall market, but at valuation levels that give us a sufficient margin of safety. We believe this is a winning recipe for portfolio returns over the long term.
We welcome the opportunity to discuss any questions or concerns you may have, and we thank you for the opportunity you have given us to manage your account.
Sincerely,

Frank Latuda, Jr., CFA®
Chief Investment Officer & Portfolio Manager

McAfee Burke, CFA®
Portfolio Manager, Research Analyst
| 10829 Olive Boulevard, Suite 100, St. Louis, MO 63141 | www.kennedycapital.com | (314) 432 – 0400 |
The views in this letter were as of December 31, 2023, and may not necessarily reflect the same views on the date this letter is first published or any time thereafter. These views are intended to help shareholders in understanding the fund’s investment methodology and do not constitute investment advice.
Important Information: There can be no guarantee that any strategy (risk management or otherwise) will be successful. All investing involves risk, including potential loss of principal. Equity securities (stocks) are generally more volatile and carry more risk than fixed income securities (bonds) and money market investments. The net asset value per share of the Kennedy Capital Small Cap Value fund (the Fund) will fluctuate as the value of the securities in the portfolio changes. Common stocks, and funds investing in common stocks, generally provide greater returns over long time periods than fixed income securities. The Fund is comprised primarily of equity securities and is subject to market risk. Stocks may decline due to general market and economic conditions or due to company specific circumstances. The Fund is comprised of small capitalization (“Small cap”) stocks. Small cap stocks typically carry additional risk, since smaller companies generally have a higher risk of failure, and historically have experienced a greater degree of volatility. Small-mid capitalization companies generally have a greater risk of failure, and their stocks generally have greater volatility than large companies. Must be preceded or accompanied by a prospectus.
| 10829 Olive Boulevard, Suite 100, St. Louis, MO 63141 | www.kennedycapital.com | (314) 432 – 0400 |
Kennedy Capital ESG SMID Cap Fund
FUND PERFORMANCE at December 31, 2023 (Unaudited)

This graph compares a hypothetical $10,000 investment in the Fund’s Institutional Class shares, made at its inception, with a similar investment in the Russell 2500™ Index. Results include the reinvestment of all dividends and capital gains.
Russell 2500™ Index measures the performance of the small to mid-cap segment of the U.S. equity universe, commonly referred to as “smid” cap. The Russell 2500™ index is a subset of the Russell 3000® Index. It includes approximately 2500 of the smallest securities based on a combination of their market cap and current index membership. The Russell 2500™ index is constructed to provide a comprehensive and unbiased barometer for the small to mid-cap segment. The index is completely reconstituted annually to ensure larger stocks do not distort the performance characteristics of the true small to mid-cap opportunity set. The index does not reflect expenses, fees, or sales charge, which would lower performance. The index is unmanaged and it is not available for investment.
| Average Annual Total Returns as of December 31, 2023 | 1 Year | Since Inception | Inception Date |
| Institutional Class | 16.56% | 10.71% | 06/28/19 |
| Russell 2500™ Index | 17.42% | 8.69% | 06/28/19 |
The performance data quoted here represents past performance and past performance is not a guarantee of future results. Investment return and principal value will fluctuate so that an investor's shares, when redeemed, may be worth more or less than their original cost. Current performance may be lower or higher than the performance information quoted. The most recent month end performance may be obtained by calling (877) 882-8825.
Gross and net expense ratios for the Institutional Class shares were 1.52% and 0.82%, respectively, which were the amounts stated in the current prospectus dated April 30, 2023. For the Fund’s current one year expense ratios, please refer to the Financial Highlights section of this report. The Fund’s advisor has contractually agreed to waive fees and/or pay for operating expenses of the Fund to ensure that total annual fund operating expenses do not exceed 0.82% of the average daily net assets of the Institutional Class shares of the Fund. This agreement is in effect until April 30, 2024, and it may be terminated before that date only by the Trust’s Board of Trustees. In the absence of such waivers, the Fund’s returns would be lower.
Kennedy Capital ESG SMID Cap Fund
FUND PERFORMANCE at December 31, 2023 (Unaudited) - Continued
Returns reflect the reinvestment of distributions made by the Fund, if any. The graph and the performance table above do not reflect the deduction of taxes that a shareholder would pay on Fund distributions or the redemption of Fund shares.
Kennedy Capital Small Cap Growth Fund
FUND PERFORMANCE at December 31, 2023 (Unaudited)
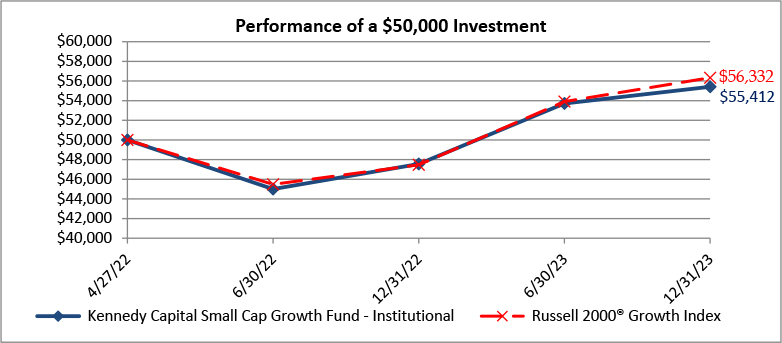
This graph compares a hypothetical $50,000 investment in the Fund’s Institutional Class shares, made at its inception, with a similar investment in the Russell 2000® Growth Index. Results include the reinvestment of all dividends and capital gains.
Russell 2000® Growth Index measures the performance of the small-cap growth segment of the U.S. equity universe. It includes those Russell 2000 companies with higher price-to-value ratios and higher forecasted growth values. The Russell 2000® Growth Index is constructed to provide a comprehensive and unbiased barometer for the small-cap growth segment. The Russell 2000® Growth Index is completely reconstituted annually to ensure larger stocks do not distort the performance and characteristics of the true small-cap opportunity set and that the represented companies continue to reflect growth characteristics. The index does not reflect expenses, fees, or sales charge, which would lower performance. The index is unmanaged and it is not available for investment.
| Average Annual Total Returns as of December 31, 2023 | 1 Year | Since Inception | Inception Date |
| Institutional Class | 16.53% | 6.31% | 04/27/22 |
| Russell 2000® Growth Index | 18.66% | 7.36% | 04/27/22 |
The performance data quoted here represents past performance and past performance is not a guarantee of future results. Investment return and principal value will fluctuate so that an investor's shares, when redeemed, may be worth more or less than their original cost. Current performance may be lower or higher than the performance information quoted. The most recent month end performance may be obtained by calling (877) 882-8825. The Fund has been in existence for less than one year; cumulative performance may not be indicative of the Fund’s long-term potential. The Fund returns will fluctuate over long and short-term period. Periods over one year are annualized.
Gross and net expense ratio for the Institutional Class shares were 37.88% and 0.89%, respectively, which were the amounts stated in the current prospectus dated April 30, 2023. For the Fund’s current one year expense ratios, please refer to the Financial Highlights section of this report. The Fund’s advisor has contractually agreed to waive fees and/or pay for operating expenses of the Fund to ensure that total annual fund operating expenses do not exceed 0.89% of the average daily net assets of the Institutional Class shares of the Fund. This agreement is in effect until April 30, 2024, and it may be terminated before that date only by the Trust’s Board of Trustees. In the absence of such waivers, the Fund’s returns would be lower.
Kennedy Capital Small-Cap Growth Fund
FUND PERFORMANCE at December 31, 2023 (Unaudited) - Continued
Returns reflect the reinvestment of distributions made by the Fund, if any. The graph and the performance table above do not reflect the deduction of taxes that a shareholder would pay on Fund distributions or the redemption of Fund shares.
Kennedy Capital Small Cap Value Fund
FUND PERFORMANCE at December 31, 2023 (Unaudited)
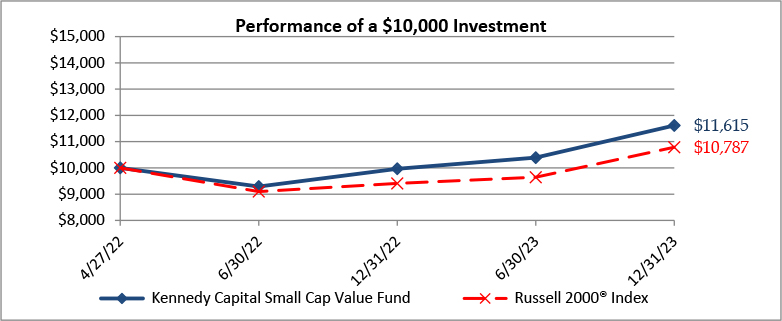
This graph compares a hypothetical $10,000 investment in the Fund’s Institutional Class shares, made at its inception, with a similar investment in the Russell 2000® Value Index. Results include the reinvestment of all dividends and capital gains.
Russell 2000® Value Index measures the performance of the small-cap value segment of the U.S. equity universe. It includes those Russell 2000 companies with lower price-to-book ratios and lower forecasted growth values. The Russell 2000® Value Index is constructed to provide a comprehensive and unbiased barometer for the small-cap value segment. The Russell 2000® Value Index is completely reconstituted annually to ensure larger stocks do not distort the performance and characteristics of the true small-cap opportunity set and that the represented companies continue to reflect value characteristics. The index does not reflect expenses, fees, or sales charge, which would lower performance. The index is unmanaged and it is not available for investment.
| Average Annual Total Returns as of December 31, 2023 | 1 Year | Since Inception Inception | Inception Date |
| Institutional Class | 16.55% | 9.32% | 04/27/22 |
| Russell 2000® Value Index | 14.65% | 4.62% | 04/27/22 |
The performance data quoted here represents past performance and past performance is not a guarantee of future results. Investment return and principal value will fluctuate so that an investor's shares, when redeemed, may be worth more or less than their original cost. Current performance may be lower or higher than the performance information quoted. The most recent month end performance may be obtained by calling (877) 882-8825. The Fund has been in existence for less than one year; cumulative performance may not be indicative of the Fund’s long-term potential. The Fund returns will fluctuate over long and short-term period. Periods over one year are annualized.
Gross and net expense ratio for the Institutional Class shares were 10.08% and 0.89%, respectively, which were the amounts stated in the current prospectus dated April 30, 2023. For the Fund’s current one year expense ratios, please refer to the Financial Highlights section of this report. The Fund’s advisor has contractually agreed to waive fees and/or pay for operating expenses of the Fund to ensure that total annual fund operating expenses do not exceed 0.89% of the average daily net assets of the Institutional Class shares of the Fund. This agreement is in effect until April 30, 2024, and it may be terminated before that date only by the Trust’s Board of Trustees. In the absence of such waivers, the Fund’s returns would be lower.
Kennedy Capital Small-Cap Value Fund
FUND PERFORMANCE at December 31, 2023 (Unaudited) - Continued
Returns reflect the reinvestment of distributions made by the Fund, if any. The graph and the performance table above do not reflect the deduction of taxes that a shareholder would pay on Fund distributions or the redemption of Fund shares.
Kennedy Capital ESG SMID Cap Fund
SCHEDULE OF INVESTMENTS
As of December 31, 2023
Number
of Shares | | | | | Value | |
| | | | | COMMON STOCKS — 97.1% | | | | |
| | | | | CONSUMER DISCRETIONARY — 10.9% | | | | |
| | 5,026 | | | Brunswick Corp. | | $ | 486,265 | |
| | 1,125 | | | Cavco Industries, Inc.* | | | 389,948 | |
| | 2,839 | | | Columbia Sportswear Co. | | | 225,814 | |
| | 4,685 | | | Helen of Troy, Ltd.*,1 | | | 565,995 | |
| | 1,888 | | | Lithia Motors, Inc. - Class A | | | 621,681 | |
| | 11,446 | | | LKQ Corp. | | | 547,004 | |
| | 3,153 | | | Papa John's International, Inc. | | | 240,353 | |
| | 934 | | | Pool Corp. | | | 372,395 | |
| | 13,281 | | | Steven Madden Ltd. | | | 557,802 | |
| | 2,104 | | | TopBuild Corp.* | | | 787,443 | |
| | 1,216 | | | Ulta Beauty, Inc.* | | | 595,828 | |
| | 1,502 | | | Vail Resorts, Inc. | | | 320,632 | |
| | 7,493 | | | Wyndham Hotels & Resorts, Inc. | | | 602,512 | |
| | | | | | | | 6,313,672 | |
| | | | | CONSUMER STAPLES — 1.3% | | | | |
| | 9,279 | | | Darling Ingredients, Inc.* | | | 462,466 | |
| | 53,030 | | | SunOpta, Inc.*,1 | | | 290,074 | |
| | | | | | | | 752,540 | |
| | | | | ENERGY — 1.7% | | | | |
| | 13,703 | | | ChampionX Corp. | | | 400,265 | |
| | 29,661 | | | DMC Global, Inc.* | | | 558,220 | |
| | | | | | | | 958,485 | |
| | | | | FINANCIALS — 14.7% | | | | |
| | 3,413 | | | Assurant, Inc. | | | 575,056 | |
| | 9,153 | | | Brown & Brown, Inc. | | | 650,870 | |
| | 7,237 | | | Commerce Bancshares, Inc. | | | 386,528 | |
| | 9,763 | | | East West Bancorp, Inc. | | | 702,448 | |
| | 3,353 | | | Euronet Worldwide, Inc.* | | | 340,296 | |
| | 926 | | | FactSet Research Systems, Inc. | | | 441,748 | |
| | 5,351 | | | Globe Life, Inc. | | | 651,324 | |
| | 7,955 | | | Hannon Armstrong Sustainable Infrastructure Capital, Inc. - REIT | | | 219,399 | |
| | 2,740 | | | Jack Henry & Associates, Inc. | | | 447,743 | |
| | 1,343 | | | LPL Financial Holdings, Inc. | | | 305,694 | |
| | 7,058 | | | Popular, Inc.1 | | | 579,250 | |
| | 7,140 | | | SouthState Corp. | | | 602,973 | |
| | 8,137 | | | Stifel Financial Corp. | | | 562,674 | |
| | 10,025 | | | Voya Financial, Inc. | | | 731,424 | |
| | 10,150 | | | Western Alliance Bancorp | | | 667,768 | |
| | 6,830 | | | Wintrust Financial Corp. | | | 633,483 | |
| | | | | | | | 8,498,678 | |
Kennedy Capital ESG SMID Cap Fund
SCHEDULE OF INVESTMENTS - Continued
As of December 31, 2023
Number
of Shares | | | | | Value | |
| | | | | COMMON STOCKS (Continued) | | | | |
| | | | | HEALTH CARE — 15.6% | | | | |
| | 43,257 | | | AdaptHealth Corp.* | | $ | 315,344 | |
| | 12,358 | | | Avantor, Inc.* | | | 282,133 | |
| | 15,792 | | | Axonics, Inc.* | | | 982,736 | |
| | 2,738 | | | Axsome Therapeutics, Inc.* | | | 217,917 | |
| | 2,852 | | | Charles River Laboratories International, Inc.* | | | 674,213 | |
| | 1,296 | | | Chemed Corp. | | | 757,836 | |
| | 9,552 | | | Encompass Health Corp. | | | 637,310 | |
| | 10,461 | | | Enovis Corp.* | | | 586,025 | |
| | 23,244 | | | Evolent Health, Inc. - Class A* | | | 767,749 | |
| | 5,135 | | | Globus Medical, Inc., Class A* | | | 273,644 | |
| | 8,142 | | | Halozyme Therapeutics, Inc.* | | | 300,928 | |
| | 1,902 | | | ICON PLC*,1 | | | 538,399 | |
| | 4,149 | | | ICU Medical, Inc.* | | | 413,821 | |
| | 3,757 | | | Integer Holdings Corp.* | | | 372,244 | |
| | 8,620 | | | Ionis Pharmaceuticals, Inc.* | | | 436,086 | |
| | 1,597 | | | Krystal Biotech, Inc.* | | | 198,124 | |
| | 10,134 | | | LivaNova PLC*,1 | | | 524,333 | |
| | 3,155 | | | Neurocrine Biosciences, Inc.* | | | 415,703 | |
| | 17,561 | | | Zimvie, Inc.* | | | 311,708 | |
| | | | | | | | 9,006,253 | |
| | | | | INDUSTRIALS — 26.1% | | | | |
| | 8,217 | | | Albany International Corp. - Class A | | | 807,074 | |
| | 7,724 | | | Arcosa, Inc. | | | 638,311 | |
| | 1,067 | | | Axon Enterprise, Inc.* | | | 275,638 | |
| | 17,643 | | | Barnes Group, Inc. | | | 575,691 | |
| | 1,539 | | | CACI International, Inc. - Class A* | | | 498,420 | |
| | 2,062 | | | Carlisle Cos., Inc. | | | 644,231 | |
| | 5,821 | | | Casella Waste Systems, Inc. - Class A* | | | 497,463 | |
| | 2,991 | | | Chart Industries, Inc.* | | | 407,763 | |
| | 4,248 | | | Crane Co. | | | 501,859 | |
| | 24,185 | | | Enerpac Tool Group Corp. - Class A | | | 751,912 | |
| | 4,304 | | | ESCO Technologies, Inc. | | | 503,697 | |
| | 32,412 | | | Gates Industrial Corp. PLC*,1 | | | 434,969 | |
| | 5,506 | | | Hexcel Corp. | | | 406,067 | |
| | 2,278 | | | IDEX Corp. | | | 494,577 | |
| | 4,721 | | | Middleby Corp.* | | | 694,789 | |
| | 4,211 | | | MSA Safety, Inc. | | | 710,943 | |
| | 2,018 | | | Nordson Corp. | | | 533,075 | |
| | 2,922 | | | Paylocity Holding Corp.* | | | 481,692 | |
| | 5,832 | | | Regal Rexnord Corp. | | | 863,253 | |
| | 17,787 | | | Shoals Technologies Group, Inc. - Class A* | | | 276,410 | |
| | 6,605 | | | SPX Technologies, Inc.* | | | 667,171 | |
| | 4,470 | | | Stanley Black & Decker, Inc. | | | 438,507 | |
| | 4,333 | | | Tetra Tech, Inc. | | | 723,308 | |
Kennedy Capital ESG SMID Cap Fund
SCHEDULE OF INVESTMENTS - Continued
As of December 31, 2023
Number
of Shares | | | | | Value | |
| | | | | COMMON STOCKS (Continued) | | | | |
| | | | | INDUSTRIALS (Continued) | | | | |
| | 26,200 | | | Thermon Group Holdings, Inc.* | | $ | 853,334 | |
| | 8,448 | | | Trex Co., Inc.* | | | 699,410 | |
| | 4,267 | | | WNS Holdings Ltd. ADR* | | | 269,674 | |
| | 14,340 | | | Zurn Elkay Water Solutions Corp. | | | 421,739 | |
| | | | | | | | 15,070,977 | |
| | | | | INFORMATION TECHNOLOGY — 13.0% | | | | |
| | 12,875 | | | Allegro MicroSystems, Inc.* | | | 389,726 | |
| | 9,706 | | | Coherent Corp.* | | | 422,502 | |
| | 3,792 | | | CyberArk Software Ltd.*,1 | | | 830,638 | |
| | 10,148 | | | Descartes Systems Group, Inc.*,1 | | | 853,041 | |
| | 13,465 | | | Everbridge, Inc.* | | | 327,334 | |
| | 1,597 | | | F5, Inc.* | | | 285,831 | |
| | 5,133 | | | Kulicke & Soffa Industries, Inc. | | | 280,878 | |
| | 4,185 | | | OSI Systems, Inc.* | | | 540,074 | |
| | 2,706 | | | Perficient, Inc.* | | | 178,109 | |
| | 2,205 | | | Rogers Corp.* | | | 291,214 | |
| | 5,284 | | | TD SYNNEX Corp. | | | 568,611 | |
| | 2,558 | | | Teledyne Technologies, Inc.* | | | 1,141,610 | |
| | 3,297 | | | Teradyne, Inc. | | | 357,790 | |
| | 13,873 | | | Trimble, Inc.* | | | 738,044 | |
| | 8,037 | | | Vishay Precision Group, Inc.* | | | 273,821 | |
| | | | | | | | 7,479,223 | |
| | | | | MATERIALS — 4.6% | | | | |
| | 10,676 | | | Avient Corp. | | | 443,801 | |
| | 4,959 | | | Crown Holdings, Inc. | | | 456,674 | |
| | 3,692 | | | Knife River Corp.* | | | 244,337 | |
| | 14,089 | | | Livent Corp.* | | | 253,320 | |
| | 3,114 | | | Reliance Steel & Aluminum Co. | | | 870,924 | |
| | 3,702 | | | RPM International, Inc. | | | 413,254 | |
| | | | | | | | 2,682,310 | |
| | | | | REAL ESTATE — 6.8% | | | | |
| | 10,903 | | | Cousins Properties, Inc. - REIT | | | 265,488 | |
| | 2,558 | | | EastGroup Properties, Inc. - REIT | | | 469,495 | |
| | 19,659 | | | Independence Realty Trust, Inc. - REIT | | | 300,783 | |
| | 2,512 | | | Jones Lang LaSalle, Inc.* | | | 474,441 | |
| | 19,278 | | | Kite Realty Group Trust - REIT | | | 440,695 | |
| | 32,709 | | | Macerich Co. - REIT | | | 504,700 | |
| | 5,535 | | | National Storage Affiliates Trust - REIT | | | 229,536 | |
| | 6,995 | | | Rexford Industrial Realty, Inc. - REIT | | | 392,420 | |
| | 3,021 | | | Sun Communities, Inc. - REIT | | | 403,757 | |
| | 31,931 | | | Xenia Hotels & Resorts, Inc., REIT | | | 434,900 | |
| | | | | | | | 3,916,215 | |
Kennedy Capital ESG SMID Cap Fund
SCHEDULE OF INVESTMENTS - Continued
As of December 31, 2023
Number
of Shares | | | | | Value | |
| | | | | COMMON STOCKS (Continued) | | | | |
| | | | | UTILITIES — 2.4% | | | | |
| | 33,527 | | | Atlantica Sustainable Infrastructure PLC1 | | $ | 720,831 | |
| | 17,887 | | | Essential Utilities, Inc. | | | 668,079 | |
| | | | | | | | 1,388,910 | |
| | | | | TOTAL COMMON STOCKS | | | | |
| | | | | (Cost $49,755,105) | | | 56,067,263 | |
Principal
Amount | | | | | | |
| | | | | SHORT-TERM INVESTMENTS — 3.6% | | | | |
| $ | 2,059,218 | | | Goldman Sachs FS Government Fund - Institutional Class, 5.17%2 | | | 2,059,218 | |
| | | | | TOTAL SHORT-TERM INVESTMENTS | | | | |
| | | | | (Cost $2,059,218) | | | 2,059,218 | |
| | | | | | | | | |
| | | | | TOTAL INVESTMENTS — 100.7% | | | | |
| | | | | (Cost $51,814,323) | | | 58,126,481 | |
| | | | | Liabilities in Excess of Other Assets — (0.7)% | | | (383,466 | ) |
| | | | | NET ASSETS — 100.0% | | $ | 57,743,015 | |
REIT – Real Estate Investment Trusts
PLC – Public Limited Company
ADR – American Depository Receipt
| * | Non-income producing security. |
| 1 | Foreign security denominated in U.S. Dollars. |
| 2 | The rate is the annualized seven-day yield at period end. |
See accompanying Notes to Financial Statements.
Kennedy Capital ESG SMID Cap Fund
SUMMARY OF INVESTMENTS
As of December 31, 2023
| Security Type/Sector | | Percent of Total
Net Assets | |
| Common Stocks | | | | |
| Industrials | | | 26.1 | % |
| Health Care | | | 15.6 | % |
| Financials | | | 14.7 | % |
| Information Technology | | | 13.0 | % |
| Consumer Discretionary | | | 10.9 | % |
| Real Estate | | | 6.8 | % |
| Materials | | | 4.6 | % |
| Utilities | | | 2.4 | % |
| Energy | | | 1.7 | % |
| Consumer Staples | | | 1.3 | % |
| Total Common Stocks | | | 97.1 | % |
| Short-Term Investments | | | 3.6 | % |
| Total Investments | | | 100.7 | % |
| Liabilities in Excess of Other Assets | | | (0.7 | )% |
| Total Net Assets | | | 100.0 | % |
See accompanying Notes to Financial Statements.
Kennedy Capital Small Cap Growth Fund
SCHEDULE OF INVESTMENTS
As of December 31, 2023
Number
of Shares | | | | | Value | |
| | | | | COMMON STOCKS — 103.1% | | | | |
| | | | | COMMUNICATION SERVICES — 2.1% | | | | |
| | 1,224 | | | Magnite, Inc.* | | $ | 11,432 | |
| | | | | | | | | |
| | | | | CONSUMER DISCRETIONARY — 11.4% | | | | |
| | 42 | | | Installed Building Products, Inc. | | | 7,678 | |
| | 34 | | | Lithia Motors, Inc. - Class A | | | 11,196 | |
| | 49 | | | Marriott Vacations Worldwide Corp. | | | 4,160 | |
| | 158 | | | Planet Fitness, Inc. - Class A* | | | 11,534 | |
| | 191 | | | Skyline Champion Corp.* | | | 14,184 | |
| | 56 | | | Wingstop, Inc. | | | 14,368 | |
| | | | | | | | 63,120 | |
| | | | | CONSUMER STAPLES — 5.4% | | | | |
| | 121 | | | elf Beauty, Inc.* | | | 17,465 | |
| | 181 | | | Performance Food Group Co* | | | 12,516 | |
| | | | | | | | 29,981 | |
| | | | | FINANCIALS — 6.8% | | | | |
| | 131 | | | Axos Financial, Inc.* | | | 7,152 | |
| | 397 | | | BRP Group, Inc. - Class A* | | | 9,536 | |
| | 143 | | | Shift4 Payments, Inc. - Class A* | | | 10,631 | |
| | 133 | | | Triumph Financial, Inc.* | | | 10,664 | |
| | | | | | | | 37,983 | |
| | | | | HEALTH CARE — 20.7% | | | | |
| | 595 | | | ADMA Biologics, Inc.* | | | 2,689 | |
| | 317 | | | Artivion, Inc.* | | | 5,668 | |
| | 199 | | | Avadel Pharmaceuticals PLC - ADR* | | | 2,810 | |
| | 391 | | | Avid Bioservices, Inc.* | | | 2,541 | |
| | 174 | | | Axonics, Inc.* | | | 10,828 | |
| | 171 | | | Bicycle Therapeutics PLC - ADR* | | | 3,092 | |
| | 106 | | | Bruker Corp. | | | 7,789 | |
| | 836 | | | DocGo, Inc.* | | | 4,673 | |
| | 253 | | | Edgewise Therapeutics, Inc.* | | | 2,768 | |
| | 283 | | | Evolent Health, Inc. - Class A* | | | 9,347 | |
| | 218 | | | Fortrea Holdings, Inc.* | | | 7,608 | |
| | 154 | | | Globus Medical, Inc., Class A* | | | 8,207 | |
| | 179 | | | Halozyme Therapeutics, Inc.* | | | 6,616 | |
| | 72 | | | Ionis Pharmaceuticals, Inc.* | | | 3,642 | |
| | 40 | | | Ligand Pharmaceuticals, Inc.* | | | 2,857 | |
| | 98 | | | LivaNova PLC*,1 | | | 5,071 | |
| | 42 | | | MoonLake Immunotherapeutics*,1 | | | 2,536 | |
| | 11 | | | OmniAb, Inc. Earnout Shares2 | | | — | |
| | 11 | | | OmniAb, Inc. Earnout Shares2 | | | — | |
| | 212 | | | Option Care Health, Inc.* | | | 7,142 | |
| | 220 | | | Phathom Pharmaceuticals, Inc.* | | | 2,009 | |
Kennedy Capital Small Cap Growth Fund
SCHEDULE OF INVESTMENTS - Continued
As of December 31, 2023
Number
of Shares | | | | | Value | |
| | | | | COMMON STOCKS (Continued) | | | | |
| | | | | HEALTH CARE (Continued) | | | | |
| | 131 | | | Protagonist Therapeutics, Inc.* | | $ | 3,004 | |
| | 245 | | | Surgery Partners, Inc.* | | | 7,838 | |
| | 176 | | | Verona Pharma PLC - ADR* | | | 3,499 | |
| | 122 | | | Viking Therapeutics, Inc.* | | | 2,270 | |
| | | | | | | | 114,504 | |
| | | | | INDUSTRIALS — 29.4% | | | | |
| | 409 | | | ACV Auctions, Inc. - Class A* | | | 6,196 | |
| | 502 | | | Array Technologies, Inc.* | | | 8,434 | |
| | 120 | | | ASGN, Inc.* | | | 11,541 | |
| | 42 | | | Axon Enterprise, Inc.* | | | 10,850 | |
| | 148 | | | Casella Waste Systems, Inc. - Class A* | | | 12,648 | |
| | 79 | | | Chart Industries, Inc.* | | | 10,770 | |
| | 44 | | | Comfort Systems USA, Inc. | | | 9,050 | |
| | 58 | | | Crane Co. | | | 6,852 | |
| | 466 | | | Leonardo DRS, Inc.* | | | 9,339 | |
| | 78 | | | MasTec, Inc.* | | | 5,906 | |
| | 67 | | | NV5 Global, Inc.* | | | 7,445 | |
| | 44 | | | Paylocity Holding Corp.* | | | 7,253 | |
| | 69 | | | Tetra Tech, Inc. | | | 11,518 | |
| | 133 | | | Trex Co., Inc.* | | | 11,011 | |
| | 98 | | | UFP Industries, Inc. | | | 12,304 | |
| | 306 | | | WillScot Mobile Mini Holdings Corp.* | | | 13,617 | |
| | 127 | | | WNS Holdings Ltd. ADR* | | | 8,026 | |
| | | | | | | | 162,760 | |
| | | | | INFORMATION TECHNOLOGY — 24.9% | | | | |
| | 79 | | | Ambarella, Inc.*,1 | | | 4,842 | |
| | 71 | | | BILL Holdings, Inc.* | | | 5,793 | |
| | 37 | | | CyberArk Software Ltd.*,1 | | | 8,105 | |
| | 159 | | | Five9, Inc.* | | | 12,512 | |
| | 522 | | | Harmonic, Inc.* | | | 6,807 | |
| | 72 | | | Impinj Inc* | | | 6,482 | |
| | 505 | | | Informatica, Inc. - Class A* | | | 14,337 | |
| | 59 | | | Insight Enterprises, Inc.* | | | 10,454 | |
| | 125 | | | MACOM Technology Solutions Holdings, Inc.* | | | 11,619 | |
| | 230 | | | Napco Security Technologies, Inc. | | | 7,877 | |
| | 36 | | | Onto Innovation, Inc.* | | | 5,504 | |
| | 219 | | | PagerDuty, Inc.* | | | 5,070 | |
| | 90 | | | Perficient, Inc.* | | | 5,924 | |
| | 382 | | | SentinelOne, Inc. - Class A* | | | 10,482 | |
| | 44 | | | SiTime Corp.* | | | 5,372 | |
| | 55 | | | Synaptics, Inc.* | | | 6,274 | |
| | 393 | | | Vertex, Inc.* | | | 10,587 | |
| | | | | | | | 138,041 | |
Kennedy Capital Small Cap Growth Fund
SCHEDULE OF INVESTMENTS - Continued
As of December 31, 2023
Number
of Shares | | | | | Value | |
| | | | | COMMON STOCKS (Continued) | | | | |
| | | | | REAL ESTATE — 2.4% | | | | |
| | 357 | | | Independence Realty Trust, Inc. - REIT | | $ | 5,462 | |
| | 81 | | | Innovative Industrial Properties, Inc. - REIT | | | 8,167 | |
| | | | | | | | 13,629 | |
| | | | | TOTAL COMMON STOCKS | | | | |
| | | | | (Cost $493,052) | | | 571,450 | |
| | | | | EXCHANGE-TRADED FUNDS — 2.3% | | | | |
| | 50 | | | iShares Russell 2000 Growth ETF | | | 12,611 | |
| | | | | TOTAL EXCHANGE-TRADED FUNDS | | | | |
| | | | | (Cost $11,380) | | | 12,611 | |
Principal
Amount | | | | | | |
| | | | | SHORT-TERM INVESTMENTS — 3.9% | | | | |
| $ | 21,525 | | | Goldman Sachs FS Government Fund - Institutional Class, 5.17%3 | | | 21,525 | |
| | | | | TOTAL SHORT-TERM INVESTMENTS | | | | |
| | | | | (Cost $21,525) | | | 21,525 | |
| | | | | | | | | |
| | | | | TOTAL INVESTMENTS — 109.3% | | | | |
| | | | | (Cost $525,957) | | | 605,586 | |
| | | | | Liabilities in Excess of Other Assets — (9.3)% | | | (51,496 | ) |
| | | | | NET ASSETS — 100.0% | | $ | 554,090 | |
ADR – American Depository Receipt
PLC – Public Limited Company
REIT – Real Estate Investment Trusts
ETF – Exchange-Traded Fund
| * | Non-income producing security. |
| 1 | Foreign security denominated in U.S. Dollars. |
| 2 | Level 3 securities fair valued under procedures established by the Board of Trustees, represents 0.00% of Net Assets. The total value of these securities is $0. |
| 3 | The rate is the annualized seven-day yield at period end. |
See accompanying Notes to Financial Statements.
Kennedy Capital Small Cap Growth Fund
SUMMARY OF INVESTMENTS
As of December 31, 2023
| Security Type/Sector | | Percent of Total
Net Assets | |
| Common Stocks | | | | |
| Industrials | | | 29.4 | % |
| Information Technology | | | 24.9 | % |
| Health Care | | | 20.7 | % |
| Consumer Discretionary | | | 11.4 | % |
| Financials | | | 6.8 | % |
| Consumer Staples | | | 5.4 | % |
| Real Estate | | | 2.4 | % |
| Communication Services | | | 2.1 | % |
| Total Common Stocks | | | 103.1 | % |
| Exchange-Traded Funds | | | 2.3 | % |
| Short-Term Investments | | | 3.9 | % |
| Total Investments | | | 109.3 | % |
| Liabilities in Excess of Other Assets | | | (9.3 | )% |
| Total Net Assets | | | 100.0 | % |
See accompanying Notes to Financial Statements.
Kennedy Capital Small Cap Value Fund
SCHEDULE OF INVESTMENTS
As of December 31, 2023
Number
of Shares | | | | | Value | |
| | | | | COMMON STOCKS — 98.7% | | | | |
| | | | | CONSUMER DISCRETIONARY — 8.9% | | | | |
| | 641 | | | America's Car-Mart, Inc.* | | $ | 48,569 | |
| | 5,673 | | | Bloomin' Brands, Inc. | | | 159,695 | |
| | 2,861 | | | Brinker International, Inc.* | | | 123,538 | |
| | 260 | | | Cavco Industries, Inc.* | | | 90,121 | |
| | 12,890 | | | Dana, Inc. | | | 188,323 | |
| | 1,095 | | | Green Brick Partners, Inc.* | | | 56,874 | |
| | 834 | | | Installed Building Products, Inc. | | | 152,472 | |
| | 1,432 | | | J. Jill, Inc.* | | | 36,917 | |
| | 1,010 | | | Johnson Outdoors, Inc. - Class A | | | 53,954 | |
| | 561 | | | LCI Industries | | | 70,523 | |
| | 3,418 | | | Modine Manufacturing Co.* | | | 204,055 | |
| | 420 | | | Mohawk Industries, Inc.* | | | 43,470 | |
| | 3,198 | | | Steven Madden Ltd. | | | 134,316 | |
| | | | | | | | 1,362,827 | |
| | | | | CONSUMER STAPLES — 2.6% | | | | |
| | 3,089 | | | BellRing Brands, Inc. - Class A* | | | 171,223 | |
| | 5,156 | | | Calavo Growers, Inc. | | | 151,638 | |
| | 7,819 | | | Duckhorn Portfolio, Inc.* | | | 77,017 | |
| | | | | | | | 399,878 | |
| | | | | ENERGY — 6.9% | | | | |
| | 4,134 | | | ChampionX Corp. | | | 120,754 | |
| | 2,582 | | | Civitas Resources, Inc. | | | 176,557 | |
| | 1,881 | | | Helmerich & Payne, Inc. | | | 68,130 | |
| | 5,063 | | | Northern Oil and Gas, Inc. | | | 187,685 | |
| | 11,324 | | | Oil States International, Inc.* | | | 76,890 | |
| | 15,178 | | | ProPetro Holding Corp.* | | | 127,192 | |
| | 3,908 | | | SM Energy Co. | | | 151,318 | |
| | 21,369 | | | Southwestern Energy Co.* | | | 139,967 | |
| | | | | | | | 1,048,493 | |
| | | | | FINANCIALS — 25.2% | | | | |
| | 4,024 | | | 1st Source Corp. | | | 221,119 | |
| | 1,582 | | | American Equity Investment Life Holding Co.* | | | 88,276 | |
| | 9,253 | | | Banc of California, Inc. | | | 124,268 | |
| | 5,362 | | | Bank OZK | | | 267,188 | |
| | 3,410 | | | BankUnited, Inc. | | | 110,586 | |
| | 3,235 | | | Cadence Bank | | | 95,724 | |
| | 3,483 | | | Columbia Banking System, Inc. | | | 92,926 | |
| | 2,897 | | | Enterprise Financial Services Corp. | | | 129,351 | |
| | 18,281 | | | Heritage Commerce Corp. | | | 181,347 | |
| | 9,818 | | | Home BancShares, Inc. | | | 248,690 | |
| | 2,411 | | | Horace Mann Educators Corp. | | | 78,840 | |
| | 355 | | | Houlihan Lokey, Inc. | | | 42,568 | |
Kennedy Capital Small Cap Value Fund
SCHEDULE OF INVESTMENTS - Continued
As of December 31, 2023
Number
of Shares | | | | | Value | |
| | | | | COMMON STOCKS (Continued) | | | | |
| | | | | FINANCIALS (Continued) | | | | |
| | 2,154 | | | Lakeland Financial Corp. | | $ | 140,355 | |
| | 6,746 | | | National Bank Holdings Corp. - Class A | | | 250,884 | |
| | 4,051 | | | Origin Bancorp, Inc. | | | 144,094 | |
| | 6,891 | | | Peapack-Gladstone Financial Corp. | | | 205,490 | |
| | 2,451 | | | Pinnacle Financial Partners, Inc. | | | 213,776 | |
| | 980 | | | Piper Sandler Cos. | | | 171,373 | |
| | 1,350 | | | SouthState Corp. | | | 114,007 | |
| | 3,702 | | | Stifel Financial Corp. | | | 255,993 | |
| | 3,224 | | | Texas Capital Bancshares, Inc.* | | | 208,367 | |
| | 5,254 | | | WaFd, Inc. | | | 173,172 | |
| | 3,098 | | | Wintrust Financial Corp. | | | 287,339 | |
| | | | | | | | 3,845,733 | |
| | | | | HEALTH CARE — 8.1% | | | | |
| | 11,246 | | | AdaptHealth Corp.* | | | 81,983 | |
| | 1,579 | | | Addus HomeCare Corp.* | | | 146,610 | |
| | 2,453 | | | ANI Pharmaceuticals, Inc.* | | | 135,259 | |
| | 12,125 | | | Catalyst Pharmaceuticals, Inc.* | | | 203,821 | |
| | 4,656 | | | Halozyme Therapeutics, Inc.* | | | 172,086 | |
| | 2,338 | | | LeMaitre Vascular, Inc. | | | 132,705 | |
| | 1,177 | | | Mesa Laboratories, Inc. | | | 123,314 | |
| | 4,204 | | | Owens & Minor, Inc.* | | | 81,011 | |
| | 3,357 | | | Simulations Plus, Inc. | | | 150,226 | |
| | | | | | | | 1,227,015 | |
| | | | | INDUSTRIALS — 20.9% | | | | |
| | 483 | | | Acuity Brands, Inc. | | �� | 98,933 | |
| | 1,540 | | | Alamo Group, Inc. | | | 323,693 | |
| | 13,065 | | | Aris Water Solutions, Inc. - Class A | | | 109,615 | |
| | 2,067 | | | Astec Industries, Inc. | | | 76,892 | |
| | 3,235 | | | AZZ, Inc. | | | 187,921 | |
| | 3,838 | | | Barnes Group, Inc. | | | 125,234 | |
| | 1,067 | | | Chart Industries, Inc.* | | | 145,464 | |
| | 4,984 | | | Enerpac Tool Group Corp. - Class A | | | 154,952 | |
| | 855 | | | EnPro, Inc. | | | 134,013 | |
| | 4,104 | | | Gibraltar Industries, Inc.* | | | 324,134 | |
| | 2,252 | | | Helios Technologies, Inc. | | | 102,128 | |
| | 1,565 | | | IES Holdings, Inc.* | | | 123,979 | |
| | 5,493 | | | Insteel Industries, Inc. | | | 210,327 | |
| | 805 | | | Miller Industries, Inc. | | | 34,043 | |
| | 704 | | | Oshkosh Corp. | | | 76,321 | |
| | 632 | | | Regal Rexnord Corp. | | | 93,549 | |
| | 1,311 | | | Simpson Manufacturing Co., Inc. | | | 259,552 | |
| | 1,037 | | | UFP Industries, Inc. | | | 130,195 | |
| | 286 | | | Valmont Industries, Inc. | | | 66,784 | |
Kennedy Capital Small Cap Value Fund
SCHEDULE OF INVESTMENTS - Continued
As of December 31, 2023
Number
of Shares | | | | | Value | |
| | | | | COMMON STOCKS (Continued) | | | | |
| | | | | INDUSTRIALS (Continued) | | | | |
| | 8,085 | | | Wabash National Corp. | | $ | 207,138 | |
| | 1,124 | | | WESCO International, Inc. | | | 195,441 | |
| | | | | | | | 3,180,308 | |
| | | | | INFORMATION TECHNOLOGY — 6.4% | | | | |
| | 14,789 | | | Cambium Networks Corp.*,1 | | | 88,734 | |
| | 1,996 | | | Coherent Corp.* | | | 86,886 | |
| | 1,508 | | | Diodes, Inc.* | | | 121,424 | |
| | 5,063 | | | Ichor Holdings Ltd.*,1 | | | 170,269 | |
| | 1,313 | | | Insight Enterprises, Inc.* | | | 232,651 | |
| | 3,203 | | | MaxLinear, Inc.* | | | 76,135 | |
| | 1,031 | | | Plexus Corp.* | | | 111,482 | |
| | 1,581 | | | Progress Software Corp. | | | 85,848 | |
| | | | | | | | 973,429 | |
| | | | | MATERIALS — 7.0% | | | | |
| | 2,422 | | | Carpenter Technology Corp. | | | 171,478 | |
| | 965 | | | Eagle Materials, Inc. | | | 195,741 | |
| | 1,908 | | | H.B. Fuller Co. | | | 155,330 | |
| | 3,254 | | | Hawkins, Inc. | | | 229,147 | |
| | 901 | | | Materion Corp. | | | 117,247 | |
| | 913 | | | Quaker Chemical Corp. | | | 194,852 | |
| | | | | | | | 1,063,795 | |
| | | | | REAL ESTATE — 9.2% | | | | |
| | 5,767 | | | Alpine Income Property Trust, Inc. - REIT | | | 97,520 | |
| | 4,050 | | | American Assets Trust, Inc. - REIT | | | 91,165 | |
| | 4,019 | | | Community Healthcare Trust, Inc. - REIT | | | 107,066 | |
| | 3,495 | | | COPT Defense Properties - REIT | | | 89,577 | |
| | 636 | | | EastGroup Properties, Inc. - REIT | | | 116,731 | |
| | 2,677 | | | Essential Properties Realty Trust, Inc. - REIT | | | 68,424 | |
| | 8,325 | | | Kite Realty Group Trust - REIT | | | 190,309 | |
| | 9,263 | | | Macerich Co. - REIT | | | 142,928 | |
| | 2,714 | | | National Storage Affiliates Trust - REIT | | | 112,550 | |
| | 2,771 | | | NexPoint Residential Trust, Inc. - REIT | | | 95,406 | |
| | 3,009 | | | PotlatchDeltic Corp. - REIT | | | 147,742 | |
| | 11,038 | | | Xenia Hotels & Resorts, Inc., REIT | | | 150,338 | |
| | | | | | | | 1,409,756 | |
| | | | | UTILITIES — 3.5% | | | | |
| | 1,875 | | | ALLETE, Inc. | | | 114,675 | |
| | 1,186 | | | American States Water Co. | | | 95,378 | |
| | 3,689 | | | Avista Corp. | | | 131,845 | |
| | 1,209 | | | IDACORP, Inc. | | | 118,869 | |
Kennedy Capital Small Cap Value Fund
SCHEDULE OF INVESTMENTS - Continued
As of December 31, 2023
Number
of Shares | | | | | Value | |
| | | | | COMMON STOCKS (Continued) | | | | |
| | | | | UTILITIES (Continued) | | | | |
| | 2,658 | | | UGI Corp. | | $ | 65,387 | |
| | | | | | | | 526,154 | |
| | | | | TOTAL COMMON STOCKS | | | | |
| | | | | (Cost $13,131,213) | | | 15,037,388 | |
Principal
Amount | | | | | | |
| | | | | SHORT-TERM INVESTMENTS — 2.0% | | | | |
| $ | 307,806 | | | Goldman Sachs FS Government Fund - Institutional Class, 5.17%2 | | | 307,806 | |
| | | | | TOTAL SHORT-TERM INVESTMENTS | | | | |
| | | | | (Cost $307,806) | | | 307,806 | |
| | | | | | | | | |
| | | | | TOTAL INVESTMENTS — 100.7% | | | | |
| | | | | (Cost $13,439,019) | | | 15,345,194 | |
| | | | | Liabilities in Excess of Other Assets — (0.7)% | | | (102,352 | ) |
| | | | | NET ASSETS — 100.0% | | $ | 15,242,842 | |
REIT – Real Estate Investment Trusts
| * | Non-income producing security. |
| 1 | Foreign security denominated in U.S. Dollars. |
| 2 | The rate is the annualized seven-day yield at period end. |
See accompanying Notes to Financial Statements.
Kennedy Capital Small Cap Value Fund
SUMMARY OF INVESTMENTS
As of December 31, 2023
| Security Type/Sector | | Percent of Total
Net Assets | |
| Common Stocks | | | | |
| Financials | | | 25.2 | % |
| Industrials | | | 20.9 | % |
| Real Estate | | | 9.2 | % |
| Consumer Discretionary | | | 8.9 | % |
| Health Care | | | 8.1 | % |
| Materials | | | 7.0 | % |
| Energy | | | 6.9 | % |
| Information Technology | | | 6.4 | % |
| Utilities | | | 3.5 | % |
| Consumer Staples | | | 2.6 | % |
| Total Common Stocks | | | 98.7 | % |
| Short-Term Investments | | | 2.0 | % |
| Total Investments | | | 100.7 | % |
| Liabilities in Excess of Other Assets | | | (0.7 | )% |
| Total Net Assets | | | 100.0 | % |
See accompanying Notes to Financial Statements.
Kennedy Capital Funds
STATEMENTS OF ASSETS AND LIABILITIES
As of December 31, 2023
| | | Kennedy Capital ESG SMID Cap Fund | | | Kennedy Capital Small Cap Growth Fund | | | Kennedy Capital Small Cap Value Fund | |
| Assets: | | | | | | | | | | | | |
| Investments, at value (cost $51,814,323, $525,957 and $13,439,019, respectively) | | $ | 58,126,481 | | | $ | 605,586 | | | $ | 15,345,194 | |
| Receivables: | | | | | | | | | | | | |
| Investment securities sold | | | 138,377 | | | | - | | | | - | |
| Fund shares sold | | | 321 | | | | - | | | | - | |
| Dividends and interest | | | 44,190 | | | | 344 | | | | 10,963 | |
| Due from Advisor | | | - | | | | 13,464 | | | | 4,700 | |
| Prepaid expenses | | | 8,348 | | | | 1,172 | | | | 3,643 | |
| Total assets | | | 58,317,717 | | | | 620,566 | | | | 15,364,500 | |
| | | | | | | | | | | | | |
| Liabilities: | | | | | | | | | | | | |
| Payables: | | | | | | | | | | | | |
| Investment securities purchased | | | 484,391 | | | | - | | | | 57,819 | |
| Offering costs - Advisor | | | - | | | | 16,685 | | | | 16,685 | |
| Advisory fees | | | 18,033 | | | | - | | | | - | |
| Fund administration and accounting fees | | | 13,576 | | | | 7,574 | | | | 3,741 | |
| Transfer agent fees and expenses | | | 5,557 | | | | 2,657 | | | | 2,114 | |
| Custody fees | | | 2,514 | | | | 2,586 | | | | 4,538 | |
| Trustees' deferred compensation (Note 3) | | | 17,117 | | | | 5,337 | | | | 5,524 | |
| Auditing fees | | | 16,780 | | | | 16,101 | | | | 17,101 | |
| Legal fees | | | 7,032 | | | | 8,326 | | | | 6,196 | |
| Chief Compliance Officer fees | | | 4,269 | | | | 693 | | | | 697 | |
| Trustees' fees and expenses | | | - | | | | 2,008 | | | | 741 | |
| Accrued other expenses | | | 5,433 | | | | 4,509 | | | | 6,502 | |
| Total liabilities | | | 574,702 | | | | 66,476 | | | | 121,658 | |
| Commitments and contingencies (Note 3) | | | | | | | | | | | | |
| | | | | | | | | | | | | |
| Net Assets | | $ | 57,743,015 | | | $ | 554,090 | | | $ | 15,242,842 | |
| | | | | | | | | | | | | |
| Components of Net Assets: | | | | | | | | | | | | |
| Paid-in capital (par value of $0.01 per share with an unlimited number of shares authorized) | | $ | 53,636,871 | | | $ | 506,370 | | | $ | 13,224,629 | |
| Total distributable earnings (accumulated deficit) | | | 4,106,144 | | | | 47,720 | | | | 2,018,213 | |
| Net Assets | | $ | 57,743,015 | | | $ | 554,090 | | | $ | 15,242,842 | |
| | | | | | | | | | | | | |
| Maximum Offering Price per Share: | | | | | | | | | | | | |
| Institutional Class: | | | | | | | | | | | | |
| Net assets applicable to shares outstanding | | $ | 57,743,015 | | | $ | 554,090 | | | $ | 15,242,842 | |
| Shares of beneficial interest issued and outstanding | | | 3,945,629 | | | | 50,697 | | | | 1,353,252 | |
| Net asset value, offering and redemption price per share | | $ | 14.63 | | | $ | 10.93 | | | $ | 11.26 | |
See accompanying Notes to Financial Statements.
Kennedy Capital Funds
STATEMENTS OF OPERATIONS
For the Year Ended December 31, 2023
| | | Kennedy Capital ESG SMID Cap Fund | | | Kennedy Capital Small Cap Growth Fund | | | Kennedy Capital Small Cap Value Fund | |
| Investment income: | | | | | | | | | | | | |
| Dividends (net of foreign withholding taxes of $388, $0 and $0, respectively) | | $ | 463,006 | | | $ | 2,129 | | | $ | 201,533 | |
| Interest | | | 79,791 | | | | 986 | | | | 20,892 | |
| Total investment income | | | 542,797 | | | | 3,115 | | | | 222,425 | |
| Expenses: | | | | | | | | | | | | |
| Advisory fees | | | 341,480 | | | | 4,128 | | | | 89,249 | |
| Fund administration and accounting fees | | | 97,039 | | | | 71,151 | | | | 70,527 | |
| Transfer agent fees and expenses | | | 36,363 | | | | 8,587 | | | | 10,669 | |
| Custody fees | | | 8,574 | | | | 6,154 | | | | 17,172 | |
| Registration fees | | | 25,081 | | | | 13,953 | | | | 8,953 | |
| Legal fees | | | 16,518 | | | | 21,098 | | | | 16,536 | |
| Auditing fees | | | 16,002 | | | | 11,101 | | | | 12,102 | |
| Trustees' fees and expenses | | | 12,913 | | | | 10,369 | | | | 9,369 | |
| Miscellaneous | | | 9,001 | | | | 5,522 | | | | 8,038 | |
| Chief Compliance Officer fees | | | 7,924 | | | | 8,085 | | | | 8,085 | |
| Shareholder reporting fees | | | 6,001 | | | | 4,140 | | | | 4,665 | |
| Insurance fees | | | 3,693 | | | | 1,408 | | | | 4,089 | |
| Offering costs | | | - | | | | 2,700 | | | | 2,700 | |
| Total expenses | | | 580,589 | | | | 168,396 | | | | 262,154 | |
| Advisory fees recovered (waived) | | | (207,238 | ) | | | (4,128 | ) | | | (89,249 | ) |
| Other expenses reimbursed | | | - | | | | (159,787 | ) | | | (76,038 | ) |
| Net expenses | | | 373,351 | | | | 4,481 | | | | 96,867 | |
| Net investment income (loss) | | | 169,446 | | | | (1,366 | ) | | | 125,558 | |
| Realized and Unrealized Gain (Loss): | | | | | | | | | | | | |
| Net realized gain (loss) on investments | | | (1,703,470 | ) | | | (22,863 | ) | | | 237,364 | |
| Net change in unrealized appreciation (depreciation) on investments | | | 9,143,891 | | | | 102,832 | | | | 1,987,899 | |
| Net realized and unrealized gain (loss) | | | 7,440,421 | | | | 79,969 | | | | 2,225,263 | |
| Net Increase (Decrease) in Net Assets from Operations | | $ | 7,609,867 | | | $ | 78,603 | | | $ | 2,350,821 | |
See accompanying Notes to Financial Statements.
Kennedy Capital ESG SMID Cap Fund
STATEMENTS OF CHANGES IN NET ASSETS
| | | For the
Year Ended
December 31, 2023 | | | For the
Year Ended
December 31, 2022 | |
| Increase (Decrease) in Net Assets from: | | | | | | | | |
| Operations: | | | | | | | | |
| Net investment income (loss) | | $ | 169,446 | | | $ | (2,449 | ) |
| Net realized gain (loss) on investments | | | (1,703,470 | ) | | | (453,594 | ) |
| Net change in unrealized appreciation (depreciation) on investments | | | 9,143,891 | | | | (4,608,674 | ) |
| Net increase (decrease) in net assets resulting from operations | | | 7,609,867 | | | | (5,064,717 | ) |
| Distributions to Shareholders: | | | | | | | | |
| Institutional Class | | | (164,162 | ) | | | (178,033 | ) |
| Total distributions to shareholders | | | (164,162 | ) | | | (178,033 | ) |
| Capital Transactions: | | | | | | | | |
| Net proceeds from shares sold: | | | | | | | | |
| Institutional Class | | | 12,627,508 | | | | 31,318,748 | |
| Reinvestment of distributions: | | | | | | | | |
| Institutional Class | | | 135,105 | | | | 173,506 | |
| Cost of shares redeemed: | | | | | | | | |
| Institutional Class | | | (1,355,821 | ) | | | (685,560 | ) |
| Net increase (decrease) in net assets from capital transactions | | | 11,406,792 | | | | 30,806,694 | |
| Total increase (decrease) in net assets | | | 18,852,497 | | | | 25,563,944 | |
| Net Assets: | | | | | | | | |
| Beginning of period | | | 38,890,518 | | | | 13,326,574 | |
| End of period | | $ | 57,743,015 | | | $ | 38,890,518 | |
| Capital Share Transactions: | | | | | | | | |
| Shares sold: | | | | | | | | |
| Institutional Class | | | 949,939 | | | | 2,260,237 | |
| Shares reinvested: | | | | | | | | |
| Institutional Class | | | 9,869 | | | | 13,461 | |
| Shares redeemed: | | | | | | | | |
| Institutional Class | | | (103,303 | ) | | | (50,411 | ) |
| Net increase (decrease) in capital share transactions | | | 856,505 | | | | 2,223,287 | |
See accompanying Notes to Financial Statements.
Kennedy Capital Small Cap Growth Fund
STATEMENTS OF CHANGES IN NET ASSETS
| | | For the
Year Ended
December 31, 2023 | | | For the Period
April 27, 2022*
through
December 31, 2022 | |
| Increase (Decrease) in Net Assets from: | | | | | | | | |
| Operations: | | | | | | | | |
| Net investment income (loss) | | $ | (1,366 | ) | | $ | (1,948 | ) |
| Net realized gain (loss) on investments | | | (22,863 | ) | | | 638 | |
| Net change in unrealized appreciation (depreciation) on investments | | | 102,832 | | | | (23,203 | ) |
| Net increase (decrease) in net assets resulting from operations | | | 78,603 | | | | (24,513 | ) |
| Distributions to Shareholders: | | | | | | | | |
| Institutional Class | | | (2,185 | ) | | | (4,670 | ) |
| Total distributions to shareholders | | | (2,185 | ) | | | (4,670 | ) |
| Capital Transactions: | | | | | | | | |
| Net proceeds from shares sold: | | | | | | | | |
| Institutional Class | | | - | | | | 500,000 | |
| Reinvestment of distributions: | | | | | | | | |
| Institutional Class | | | 2,185 | | | | 4,670 | |
| Net increase (decrease) in net assets from capital transactions | | | 2,185 | | | | 504,670 | |
| Total increase (decrease) in net assets | | | 78,603 | | | | 475,487 | |
| Net Assets: | | | | | | | | |
| Beginning of period | | | 475,487 | | | | - | |
| End of period | | $ | 554,090 | | | $ | 475,487 | |
| Capital Share Transactions: | | | | | | | | |
| Shares sold: | | | | | | | | |
| Institutional Class | | | - | | | | 50,000 | |
| Shares reinvested: | | | | | | | | |
| Institutional Class | | | 217 | | | | 480 | |
| Net increase (decrease) in capital share transactions | | | 217 | | | | 50,480 | |
| * | Commencement of operations. |
See accompanying Notes to Financial Statements.
Kennedy Capital Small Cap Value Fund
STATEMENTS OF CHANGES IN NET ASSETS
| | | For the
Year Ended
December 31, 2023 | | | For the Period
April 27, 2022*
through
December 31, 2022 | |
| Increase (Decrease) in Net Assets from: | | | | | | | | |
| Operations: | | | | | | | | |
| Net investment income (loss) | | $ | 125,558 | | | $ | 14,851 | |
| Net realized gain (loss) on investments | | | 237,364 | | | | 67,387 | |
| Net change in unrealized appreciation (depreciation) on investments | | | 1,987,899 | | | | (81,724 | ) |
| Net increase (decrease) in net assets resulting from operations | | | 2,350,821 | | | | 514 | |
| Distributions to Shareholders: | | | | | | | | |
| Institutional Class | | | (260,461 | ) | | | (72,993 | ) |
| Total distributions to shareholders | | | (260,461 | ) | | | (72,993 | ) |
| Capital Transactions: | | | | | | | | |
| Net proceeds from shares sold: | | | | | | | | |
| Institutional Class | | | 7,798,896 | | | | 5,618,769 | |
| Reinvestment of distributions: | | | | | | | | |
| Institutional Class | | | 257,531 | | | | 71,045 | |
| Cost of shares redeemed: | | | | | | | | |
| Institutional Class | | | (518,558 | ) | | | (2,722 | ) |
| Net increase (decrease) in net assets from capital transactions | | | 7,537,869 | | | | 5,687,092 | |
| Total increase (decrease) in net assets | | | 9,628,229 | | | | 5,614,613 | |
| Net Assets: | | | | | | | | |
| Beginning of period | | | 5,614,613 | | | | - | |
| End of period | | $ | 15,242,842 | | | $ | 5,614,613 | |
| Capital Share Transactions: | | | | | | | | |
| Shares sold: | | | | | | | | |
| Institutional Class | | | 809,454 | | | | 564,097 | |
| Shares reinvested: | | | | | | | | |
| Institutional Class | | | 24,387 | | | | 7,000 | |
| Shares redeemed: | | | | | | | | |
| Institutional Class | | | (51,418 | ) | | | (268 | ) |
| Net increase (decrease) in capital share transactions | | | 782,423 | | | | 570,829 | |
| * | Commencement of operations. |
See accompanying Notes to Financial Statements.
FINANCIAL HIGHLIGHTS
Kennedy Capital ESG SMID Cap Fund
Institutional Class
Per share operating performance.
For a capital share outstanding throughout each period.
| | | For the
Year Ended
December 31, | | | For the Period
June 28, 2019*
through
December 31, | |
| | | 2023 | | | 2022 | | | 2021 | | | 2020 | | | 2019 | |
| Net asset value, beginning of period | | $ | 12.59 | | | $ | 15.39 | | | $ | 13.11 | | | $ | 10.86 | | | $ | 10.00 | |
| Income from Investment Operations: | | | | | | | | | | | | | | | | | | | | |
| Net investment income (loss)1 | | | 0.05 | | | | - | 2 | | | (0.01 | ) | | | - | 2 | | | 0.01 | |
| Net realized and unrealized gain (loss) | | | 2.03 | | | | (2.74 | ) | | | 3.31 | | | | 2.28 | | | | 0.87 | |
| Total from investment operations | | | 2.08 | | | | (2.74 | ) | | | 3.30 | | | | 2.28 | | | | 0.88 | |
| | | | | | | | | | | | | | | | | | | | | |
| Less Distributions: | | | | | | | | | | | | | | | | | | | | |
| From net investment income | | | (0.04 | ) | | | (0.01 | ) | | | - | | | | (0.03 | ) | | | (0.02 | ) |
| From net realized gain | | | - | | | | (0.05 | ) | | | (1.02 | ) | | | - | | | | - | |
| Total distributions | | | (0.04 | ) | | | (0.06 | ) | | | (1.02 | ) | | | (0.03 | ) | | | (0.02 | ) |
| Net asset value, end of period | | $ | 14.63 | | | $ | 12.59 | | | $ | 15.39 | | | $ | 13.11 | | | $ | 10.86 | |
| Total return3 | | | 16.56 | % | | | (17.82 | )% | | | 25.47 | % | | | 20.98 | % | | | 8.83 | %4 |
| | | | | | | | | | | | | | | | | | | | | |
| Ratios and Supplemental Data: | | | | | | | | | | | | | | | | | | | | |
| Net assets, end of period (in thousands) | | $ | 57,743 | | | $ | 38,891 | | | $ | 13,327 | | | $ | 6,368 | | | $ | 1,390 | |
| Ratio of expenses to average net assets: | | | | | | | | | | | | | | | | | | | | |
| Before fees waived and expenses absorbed/recovered | | | 1.28 | % | | | 1.52 | % | | | 2.49 | % | | | 15.92 | % | | | 19.45 | %5 |
| After fees waived and expenses absorbed/recovered | | | 0.82 | % | | | 0.82 | % | | | 0.82 | % | | | 0.82 | % | | | 0.82 | %5 |
| Ratio of net investment income (loss) to average net assets: | | | | | | | | | | | | | | | | | | | | |
| Before fees waived and expenses absorbed/recovered | | | (0.08 | )% | | | (0.71 | )% | | | (1.75 | )% | | | (15.08 | )% | | | (18.53 | )%5 |
| After fees waived and expenses absorbed/recovered | | | 0.38 | % | | | (0.01 | )% | | | (0.08 | )% | | | 0.02 | % | | | 0.10 | %5 |
| Portfolio turnover rate | | | 58 | % | | | 50 | % | | | 87 | % | | | 63 | % | | | 27 | %4 |
| * | Commencement of operations. |
| 1 | Based on average shares outstanding for the period. |
| 2 | Amount represents less than $0.01 per share. |
| 3 | Total returns would have been lower had certain expenses not been waived or absorbed by the Advisor. Returns shown do not reflect the deduction of taxes that a shareholder would pay on Fund distributions or redemption of Fund shares. |
See accompanying Notes to Financial Statements.
FINANCIAL HIGHLIGHTS
Kennedy Capital Small Cap Growth Fund
Institutional Class
Per share operating performance.
For a capital share outstanding throughout each period.
| | | For the
Year Ended
December 31,
2023 | | | For the Period
April 27, 2022*
through
December 31,
2022 | |
| Net asset value, beginning of period | | $ | 9.42 | | | $ | 10.00 | |
| Income from Investment Operations: | | | | | | | | |
| Net investment income (loss)1 | | | (0.03 | ) | | | (0.04 | ) |
| Net realized and unrealized gain (loss) | | | 1.58 | | | | (0.45 | ) |
| Total from investment operations | | | 1.55 | | | | (0.49 | ) |
| Less Distributions: | | | | | | | | |
| From net investment income | | | (0.04 | ) | | | (- | )2 |
| From net realized gain | | | - | | | | (0.09 | ) |
| Total distributions | | | (0.04 | ) | | | (0.09 | ) |
| Net asset value, end of period | | $ | 10.93 | | | $ | 9.42 | |
| Total return3 | | | 16.53 | % | | | (4.89 | )%4 |
| Ratios and Supplemental Data: | | | | | | | | |
| Net assets, end of period (in thousands) | | $ | 554 | | | $ | 475 | |
| Ratio of expenses to average net assets: | | | | | | | | |
| Before fees waived and expenses absorbed/recovered | | | 33.44 | % | | | 37.88 | %5 |
| After fees waived and expenses absorbed/recovered | | | 0.89 | % | | | 0.89 | %5 |
| Ratio of net investment income (loss) to average net assets: | | | | | | | | |
| Before fees waived and expenses absorbed/recovered | | | (32.82 | )% | | | (37.59 | )%5 |
| After fees waived and expenses absorbed/recovered | | | (0.27 | )% | | | (0.60 | )%5 |
| Portfolio turnover rate | | | 37 | % | | | 17 | %4 |
| * | Commencement of operations. |
| 1 | Based on average shares outstanding for the period. |
| 2 | Amount represents less than $0.01 per share. |
| 3 | Total returns would have been lower had certain expenses not been waived or absorbed by the Advisor. Returns shown do not reflect the deduction of taxes that a shareholder would pay on Fund distributions or redemption of Fund shares. |
See accompanying Notes to Financial Statements.
FINANCIAL HIGHLIGHTS
Kennedy Capital Small Cap Value Fund
Institutional Class
Per share operating performance.
For a capital share outstanding throughout each period.
| | | For the
Year Ended
December 31,
2023 | | | For the Period
April 27, 2022*
through
December 31,
2022 | |
| Net asset value, beginning of period | | $ | 9.84 | | | $ | 10.00 | |
| Income from Investment Operations: | | | | | | | | |
| Net investment income (loss)1 | | | 0.12 | | | | 0.08 | |
| Net realized and unrealized gain (loss) | | | 1.50 | | | | (0.11 | ) |
| Total from investment operations | | | 1.62 | | | | (0.03 | ) |
| Less Distributions: | | | | | | | | |
| From net investment income | | | (0.09 | ) | | | (0.03 | ) |
| From net realized gain | | | (0.11 | ) | | | (0.10 | ) |
| Total distributions | | | (0.20 | ) | | | (0.13 | ) |
| Net asset value, end of period | | $ | 11.26 | | | $ | 9.84 | |
| Total return2 | | | 16.55 | % | | | (0.34 | )%3 |
| Ratios and Supplemental Data: | | | | | | | | |
| Net assets, end of period (in thousands) | | $ | 15,243 | | | $ | 5,615 | |
| Ratio of expenses to average net assets: | | | | | | | | |
| Before fees waived and expenses absorbed/recovered | | | 2.41 | % | | | 10.08 | %4 |
| After fees waived and expenses absorbed/recovered | | | 0.89 | % | | | 0.89 | %4 |
| Ratio of net investment income (loss) to average net assets: | | | | | | | | |
| Before fees waived and expenses absorbed/recovered | | | (0.37 | )% | | | (8.06 | )%4 |
| After fees waived and expenses absorbed/recovered | | | 1.15 | % | | | 1.13 | %4 |
| Portfolio turnover rate | | | 50 | % | | | 220 | %3 |
| * | Commencement of operations. |
| 1 | Based on average shares outstanding for the period. |
| 2 | Total returns would have been lower had certain expenses not been waived or absorbed by the Advisor. Returns shown do not reflect the deduction of taxes that a shareholder would pay on Fund distributions or redemption of Fund shares. |
See accompanying Notes to Financial Statements.
Kennedy Capital Funds
NOTES TO FINANCIAL STATEMENTS
December 31, 2023
Note 1 – Organization
Kennedy Capital ESG SMID Cap Fund (the ‘‘ESG SMID Cap Fund”), Kennedy Capital Small Cap Growth Fund (the “Small Cap Growth Fund”), and Kennedy Capital Small Cap Value Fund (the “Small Cap Value Fund”) are organized as a diversified series of Investment Managers Series Trust II, a Delaware statutory trust (the “Trust”) which is registered as an open-end management investment company under the Investment Company Act of 1940, as amended (the “1940 Act”).
The Kennedy Capital ESG SMID Cap Fund’s investment objective is capital appreciation. The Fund currently offers two classes of shares: Investor Class and Institutional Class. The Fund’s Institutional Class shares commenced operations on June 28, 2019. The Fund’s Investor Class shares are not currently available for purchase.
The Kennedy Capital Small Cap Growth Fund’s investment objective is capital appreciation. The Fund currently offers two classes of shares: Investor Class and Institutional Class. The Fund’s Institutional Class shares commenced operations on April 27, 2022. The Fund’s Investor Class shares are not currently available for purchase.
The Kennedy Capital Small Cap Value Fund’s investment objective is capital appreciation. The Fund currently offers two classes of shares: Investor Class and Institutional Class. The Fund’s Institutional Class shares commenced operations on April 27, 2022. The Fund’s Investor Class shares are not currently available for purchase.
With regards to the ESG SMID Cap Fund, the Small Cap Growth Fund, and the Small Cap Value Fund, the shares of each class represent an interest in the same portfolio of investments of the Fund and have equal rights as to voting, redemptions, dividends and liquidation, subject to the approval of the Trustees. Income, expenses (other than expenses attributable to a specific class) and realized and unrealized gains and losses on investments are allocated to each class of shares in proportion to their relative net assets. Shareholders of a class that bears distribution and service expenses under the terms of a distribution plan have exclusive voting rights to that distribution plan.
Each Fund is an investment company and accordingly follows the investment company accounting and reporting guidance of the Financial Accounting Standards Board (FASB) Accounting Standard Codification Topic 946 “Financial Services—Investment Companies”.
Note 2 – Accounting Policies
The following is a summary of the significant accounting policies consistently followed by the Funds in the preparation of its financial statements. The preparation of financial statements in conformity with accounting principles generally accepted in the United States of America (“GAAP”) requires management to make estimates and assumptions that affect the reported amounts and disclosures in the financial statements. Actual results could differ from these estimates.
(a) Valuation of Investments
The Funds value equity securities at the last reported sale price on the principal exchange or in the principal over the counter (“OTC”) market in which such securities are traded, as of the close of regular trading on the NYSE on the day the securities are being valued or, if the last-quoted sales price is not readily available, the securities will be valued at the last bid or the mean between the last available bid and ask price. Securities traded on the NASDAQ are valued at the NASDAQ Official Closing Price (“NOCP”). Investments in open-end investment companies are valued at the daily closing net asset value of the respective investment company. Debt securities are valued by utilizing a price supplied by independent pricing service providers. The independent pricing service providers may use various valuation methodologies including matrix pricing and other analytical pricing models as well as market transactions and dealer quotations. These models generally consider such factors as yields or prices of bonds of comparable quality, type of issue, coupon, maturity, ratings and general market conditions. If a price is not readily available for a portfolio security, the security will be valued at fair value (the amount which the Funds’ might reasonably expect to receive for the security upon its current sale). The Board of Trustees has designated the Advisor as the Funds’ valuation designee (the “Valuation Designee”) to make all fair value determinations with respect to the Funds’ portfolio investments, subject to the Board’s oversight. As the Valuation Designee, the Advisor has adopted and implemented policies and procedures to be followed when the Funds’ must utilize fair value pricing. Prior to September 8, 2022, securities were valued at fair value as determined in good faith by the Funds’ advisor, subject to review and approval by the Valuation Committee, pursuant to procedures adopted by the Board of Trustees. The actions of the Valuation Committee were subsequently reviewed by the Board at its next regularly scheduled board meeting. The Valuation Committee met as needed. The Valuation Committee was comprised of all the Trustees, but action may had been taken by any one of the Trustees.
Kennedy Capital Funds
NOTES TO FINANCIAL STATEMENTS - Continued
December 31, 2023
(b) Investment Transactions, Investment Income and Expenses
Investment transactions are accounted for on the trade date. Realized gains and losses on investments are determined on the identified cost basis. Dividend income is recorded net of applicable withholding taxes on the ex-dividend date and interest income is recorded on an accrual basis. Withholding taxes on foreign dividends, if applicable, are paid (a portion of which may be reclaimable) or provided for in accordance with the applicable country’s tax rules and rates and are disclosed in the Statements of Operations. Withholding tax reclaims are filed in certain countries to recover a portion of the amounts previously withheld. The Funds record a reclaim receivable based on a number of factors, including a jurisdiction’s legal obligation to pay reclaims as well as payment history and market convention. Income and expenses of the Funds are allocated on a pro rata basis to each class of shares relative net assets, except for distribution and service fees which are unique to each class of shares. Expenses incurred by the Trust with respect to more than one Fund are allocated in proportion to the net assets of each Fund except where allocation of direct expenses to each Fund or an alternative allocation method can be more appropriately made.
The Small Cap Growth Fund and the Small Cap Value Fund each incurred offering costs of $16,496, respectively, which was amortized over a one-year period from April 27, 2022 (commencement of operations).
(c) Federal Income Taxes
The Funds intend to comply with the requirements of Subchapter M of the Internal Revenue Code applicable to regulated investment companies and to distribute substantially all of their net investment income and any net realized gains to their shareholders. Therefore, no provision is made for federal income or excise taxes. Due to the timing of dividend distributions and the differences in accounting for income and realized gains and losses for financial statement and federal income tax purposes, the fiscal year in which amounts are distributed may differ from the year in which the income and realized gains and losses are recorded by the Funds.
Accounting for Uncertainty in Income Taxes (the “Income Tax Statement”) requires an evaluation of tax positions taken (or expected to be taken) in the course of preparing a Fund’s tax returns to determine whether these positions meet a “more-likely-than-not” standard that, based on the technical merits, have a more than fifty percent likelihood of being sustained by a taxing authority upon examination. A tax position that meets the “more-likely-than-not” recognition threshold is measured to determine the amount of benefit to recognize in the financial statements. The Funds recognize interest and penalties, if any, related to unrecognized tax benefits as income tax expense in the Statements of Operations.
The Income Tax Statement requires management of the Funds to analyze tax positions taken in the prior three open tax years, if any, and tax positions expected to be taken in the Funds’ current tax year, as defined by the IRS statute of limitations for all major jurisdictions, including federal tax authorities and certain state tax authorities.
Kennedy Capital Funds
NOTES TO FINANCIAL STATEMENTS - Continued
December 31, 2023
As of and during the years ended December 31, 2020 through December 31, 2023, the Funds did not have a liability for any unrecognized tax benefits. The Funds have no examinations in progress and are not aware of any tax positions for which it is reasonably possible that the total amounts of unrecognized tax benefits will significantly change in the next twelve months.
(d) Distributions to Shareholders
The Funds will make distributions of net investment income and net capital gains, if any, at least annually, typically in December. Distributions to shareholders are recorded on the ex-dividend date. The amount and timing of distributions are determined in accordance with federal income tax regulations, which may differ from GAAP.
The character of distributions made during the year from net investment income or net realized gains may differ from the characterization for federal income tax purposes due to differences in the recognition of income, expense and gain (loss) items for financial statement and tax purposes.
(e) Illiquid Securities
Pursuant to Rule 22e-4 under the 1940 Act, the Funds have adopted a Liquidity Risk Management Program (“LRMP”) that requires, among other things, that the Funds limit their illiquid investments that are assets to no more than 15% of net assets. An illiquid investment is any security which may not reasonably be expected to be sold or disposed of in current market conditions in seven calendar days or less without the sale or disposition significantly changing the market value of the investment. If the Advisor, at any time, determines that the value of illiquid securities held by a Fund exceeds 15% of its net asset value, the Advisor will take such steps as it considers appropriate to reduce them as soon as reasonably practicable in accordance with the Fund’s written LRMP.
Note 3 – Investment Advisory and Other Agreements
The Trust, on behalf of the Funds, entered into an Investment Advisory Agreement (the “Agreement”) with Kennedy Capital Management LLC (the “Advisor”). Under the terms of the Agreement, the Funds pay a monthly investment advisory fee to the Advisor based on each Fund’s average daily net assets. The annual rates are listed by Fund in the table below. The Advisor has contractually agreed to waive its fees and/or pay for operating expenses of the Funds to ensure that total annual fund operating expenses (excluding any taxes, leverage interest, brokerage commissions, dividend and interest expenses on short sales, acquired fund fees and expenses (as determined in accordance with SEC Form N-1A), expenses incurred in connection with any merger or reorganization, and extraordinary expenses such as litigation expenses) do not exceed the following levels of each Fund’s average daily net assets of the Institutional Class shares of the Fund. This agreement is in effect until April 30, 2024, and it may be terminated before that date only by the Trust’s Board of Trustees. The table below contains the investment advisory fee annual rate and the expense cap by Fund and by Class:
| | Investment
Advisory | Total Limit on Annual
Operating Expenses |
| | Fees | Institutional Class |
| ESG SMID Cap Fund | 0.75% | 0.82% |
| Small Cap Growth Fund | 0.82% | 0.89% |
| Small Cap Value Fund | 0.82% | 0.89% |
For the year ended December 31 2023, the Advisor waived its advisory fees and absorbed other expenses totaling $207,238, $163,915, and $165,287 for the ESG SMID Cap Fund, Small Cap Growth Fund, and Small Cap Value Fund, respectively. The Advisor is permitted to seek reimbursement from each Fund, subject to certain limitations, of fees waived or payments made to the Fund for a period ending three full years after the date of the waiver or payment. This reimbursement may be requested from the Fund if the reimbursement will not cause the Fund’s annual expense ratio to exceed the lesser of (a) the expense limitation amount in effect at the time such fees were waived or payments made, or (b) the expense limitation amount in effect at the time of the reimbursement. At December 31, 2023, the amount of these potentially recoverable expenses was $638,931, $283,985, and $285,706 for the ESG SMID Cap Fund, Small Cap Growth Fund, and Small Cap Value Fund, respectively. The potential recoverable amount is noted as "Commitments and contingencies" as reported on the Statements of Assets and Liabilities. The Advisor may recapture all or a portion of this amount no later than December 31 of the years stated below:
Kennedy Capital Funds
NOTES TO FINANCIAL STATEMENTS - Continued
December 31, 2023
| | | ESG SMID Cap Fund | | | Small Cap Growth Fund | | | Small Cap Value Fund | |
| 2024 | | | 214,965 | | | | - | | | | - | |
| 2025 | | | 216,728 | | | | 120,070 | | | | 120,419 | |
| 2026 | | | 207,238 | | | | 163,915 | | | | 165,287 | |
| Total | | $ | 638,931 | | | $ | 283,985 | | | $ | 285,706 | |
UMB Fund Services, Inc. (“UMBFS”) serves as the Funds’ fund accountant, transfer agent and co-administrator; and Mutual Fund Administration, LLC (“MFAC”) serves as the Funds’ other co-administrator. UMB Bank, n.a., an affiliate of UMBFS, serves as the Funds’ custodian.
IMST Distributors, LLC, a wholly owned subsidiary of Foreside Financial Group, LLC (d/b/a ACA Group), serves as the Funds’ distributor (the “Distributor”). The Distributor does not receive compensation from the Funds for its distribution services; the Advisor pays the Distributor a fee for its distribution-related services.
Certain trustees and officers of the Trust are employees of UMBFS or MFAC. The Funds do not compensate trustees and officers affiliated with the Funds’ co-administrators. For the year ended December 31, 2023, the Funds’ allocated fees incurred to Trustees who are not affiliated with the Funds’ co-administrators are reported on the Statements of Operations.
The Funds’ Board of Trustees has adopted a Deferred Compensation Plan (the “Plan”) for the Independent Trustees that enables Trustees to elect to receive payment in cash or the option to select various fund(s) in the Trust in which their deferred accounts shall be deemed to be invested. If a trustee elects to defer payment, the Plan provides for the creation of a deferred payment account. The Funds’ liability for these amounts is adjusted for market value changes in the invested fund(s) and remains a liability to the Fund until distributed in accordance with the Plan. The Trustees Deferred compensation liability under the Plan constitutes a general unsecured obligation of each Fund and will be disclosed in the Statements of Assets and Liabilities. Contributions made under the plan and the change in unrealized appreciation/depreciation and income will be included in the Trustees’ fees and expenses in the Statements of Operations.
Dziura Compliance Consulting, LLC provides Chief Compliance Officer (“CCO”) services to the Trust. The Funds’ allocated fees incurred for CCO services for the year ended December 31, 2023 are reported on the Statements of Operations.
Kennedy Capital Funds
NOTES TO FINANCIAL STATEMENTS - Continued
December 31, 2023
Note 4 – Federal Income Taxes
At December 31, 2023, gross unrealized appreciation and depreciation of investments owned by the funds, based on cost for federal income tax purposes were as follows:
| | | ESG SMID Cap
Fund | | | Small Cap Growth
Fund | | | Small Cap Value
Fund | |
| | | | | | | | | | |
| Cost of investments | | $ | 52,207,226 | | | $ | 526,304 | | | $ | 13,447,521 | |
| | | | | | | | | | | | | |
| Gross unrealized appreciation | | $ | 8,018,330 | | | $ | 121,502 | | | $ | 2,463,923 | |
| Gross unrealized depreciation | | | (2,099,075 | ) | | | (42,220 | ) | | | (566,250 | ) |
| Net unrealized appreciation (depreciation) on investments | | $ | 5,919,255 | | | $ | 79,282 | | | $ | 1,897,673 | |
The difference between cost amounts for financial statements and federal income tax purposes is due primarily to timing differences in recognizing certain gains and losses in security transactions.
GAAP requires that certain components of net assets be reclassified between financial and tax reporting. These reclassifications have no effect on net assets or net asset value per share. For the year ended December 31, 2023, permanent differences in book and tax accounting have been reclassified to paid-in capital and total distributable earnings as follows:
| Increase (Decrease) |
| | | Paid-in Capital | | | Total Distributable Earnings (Loss) | |
| ESG SMID Cap Fund | | $ | 1,766 | | | $ | (1,766 | ) |
| Small Cap Growth Fund | | | (13 | ) | | | 13 | |
| Small Cap Value Fund | | | - | | | | - | |
As of December 31, 2023, the components of accumulated earnings (deficit) on a tax basis were as follows:
| | | ESG SMID Cap
Fund | | | Small Cap
Growth Fund | | | Small Cap Value
Fund | |
| | | | | | | | | | |
| Undistributed ordinary income | | $ | 1,027 | | | $ | 716 | | | $ | 30,948 | |
| Undistributed long-term gains | | | - | | | | - | | | | 95,116 | |
| Tax accumulated earnings | | | 1,027 | | | | 716 | | | | 126,064 | |
| | | | | | | | | | | | | |
| Accumulated capital and other losses | | $ | (1,797,021 | ) | | $ | (26,941 | ) | | $ | - | |
| | | | | | | | | | | | | |
| Unrealized appreciation (depreciation) on investments | | | 5,919,255 | | | | 79,282 | | | | 1,897,673 | |
| Unrealized deferred compensation | | | (17,117 | ) | | | (5,337 | ) | | | (5,524 | ) |
| | | | | | | | | | | | | |
| Total accumulated earnings (deficit) | | $ | 4,106,144 | | | $ | 47,720 | | | $ | 2,018,213 | |
Kennedy Capital Funds
NOTES TO FINANCIAL STATEMENTS - Continued
December 31, 2023
As of December 31, 2023 the Funds had net capital loss carryovers as follows:
| Not Subject to Expiration |
| | | ST | | | LT | |
| ESG SMID Cap Fund | | $ | - | | | $ | 1,797,021 | |
| Small Cap Growth Fund | | | - | | | | 26,941 | |
| Small Cap Value Fund | | | - | | | | - | |
To the extent that a fund may realize future net capital gains, those gains will be offset by any of its unused capital loss carryforward. Future capital loss carryover utilization in any given year may be subject to Internal Revenue Code limitations.
The tax character of the distributions paid during the fiscal years ended December 31, 2023 and December 31, 2022 were as follows:
| | | ESG SMID Cap Fund | | | Small Cap Growth Fund | | | Small Cap Value Fund | |
| | | 2023 | | | 2022 | | | 2023 | | | 2022 | | | 2023 | | | 2022 | |
| Distributions paid from: | | | | | | | | | | | | | | | | | | | | | | | | |
| Ordinary income | | $ | 164,162 | | | $ | 118,992 | | | $ | 2,185 | | | $ | 4,488 | | | $ | 245,119 | | | $ | 72,700 | |
| Long-term capital gains | | | - | | | | 59,041 | | | | - | | | | 222 | | | | 15,342 | | | | 292 | |
| Total distributions paid | | $ | 164,162 | | | $ | 178,033 | | | $ | 2,185 | | | $ | 4,670 | | | $ | 260,461 | | | $ | 72,992 | |
Note 5 – Investment Transactions
For the year ended December 31, 2023, purchases and sales of investments, excluding short-term investments, were as follows:
| | | Purchases | | | Sales | |
| ESG SMID Cap Fund | | $ | 36,759,100 | | | $ | 25,726,729 | |
| Small Cap Growth Fund | | | 214,750 | | | | 196,817 | |
| Small Cap Value Fund | | | 12,653,777 | | | | 5,286,917 | |
Note 6 – Distribution Plan
The Trust, on behalf of each Fund, has adopted a Rule 12b-1 plan with respect to its Investor Class shares. Under the plan, the Fund pays to the Distributor distribution fees in connection with the sale and distribution of the Fund’s Investor Class shares and/or administrative service fees in connection with the provision of ongoing services to shareholders and the maintenance of shareholder accounts.
For Investor Class shares, the maximum annual fee payable to the Distributor for such distribution and/or administrative services is 0.25% of the average daily net assets of such shares. As of December 31, 2023, the Investor Class shares had not commenced operations. Institutional Class shares are not subject to any distribution or service fees under the plan.
Note 7 – Indemnifications
In the normal course of business, the Funds enter into contracts that contain a variety of representations, which provide general indemnifications. The Funds’ maximum exposure under these arrangements is unknown, as this would involve future claims that may be made against the Funds that have not yet occurred. However, the Funds expects the risk of loss to be remote.
Kennedy Capital Funds
NOTES TO FINANCIAL STATEMENTS - Continued
December 31, 2023
Note 8 – Fair Value Measurements and Disclosure
Fair Value Measurements and Disclosures defines fair value, establishes a framework for measuring fair value in accordance with GAAP, and expands disclosure about fair value measurements. It also provides guidance on determining when there has been a significant decrease in the volume and level of activity for an asset or a liability, when a transaction is not orderly, and how that information must be incorporated into a fair value measurement.
Under Fair Value Measurements and Disclosures, various inputs are used in determining the value of each Fund’s investments. These inputs are summarized into three broad Levels as described below:
| · | Level 1 – Unadjusted quoted prices in active markets for identical assets or liabilities that the Fund has the ability to access. |
| · | Level 2 – Observable inputs other than quoted prices included in level 1 that are observable for the asset or liability, either directly or indirectly. These inputs may include quoted prices for the identical instrument on an inactive market, prices for similar instruments, interest rates, prepayment speeds, credit risk, yield curves, default rates and similar data. |
| · | Level 3 – Unobservable inputs for the asset or liability, to the extent relevant observable inputs are not available; representing the Fund’s own assumptions about the assumptions a market participant would use in valuing the asset or liability, and would be based on the best information available. |
The availability of observable inputs can vary from security to security and is affected by a wide variety of factors, including, for example, the type of security, whether the security is new and not yet established in the marketplace, the liquidity of markets, and other characteristics particular to the security. To the extent that valuation is based on models or inputs that are less observable or unobservable in the market, the determination of fair value requires more judgment. Accordingly, the degree of judgment exercised in determining fair value is greatest for instruments categorized in Level 3.
The inputs used to measure fair value may fall into different Levels of the fair value hierarchy. In such cases, for disclosure purposes, the Level in the fair value hierarchy within which the fair value measurement falls in its entirety, is determined based on the lowest Level input that is significant to the fair value measurement in its entirety.
Kennedy Capital Funds
NOTES TO FINANCIAL STATEMENTS - Continued
December 31, 2023
The inputs or methodology used for valuing securities are not an indication of the risk associated with investing in those securities. The following is a summary of the inputs used, as of December 31, 2023, in valuing the Funds’ assets carried at fair value:
| ESG SMID Cap Fund | | Level 1 | | | Level 2* | | | Level 3* | | | Total | |
| Assets | | | | | | | | | | | | | | | | |
| Investments | | | | | | | | | | | | | | | | |
| Common Stocks1 | | $ | 56,067,263 | | | $ | - | | | $ | - | | | $ | 56,067,263 | |
| Short-Term Investments | | | 2,059,218 | | | | - | | | | - | | | | 2,059,218 | |
| Total Assets | | $ | 58,126,481 | | | $ | - | �� | | $ | - | | | $ | 58,126,481 | |
| 1 | For a detailed break-out of common stocks by sector, please refer to the Schedule of Investments. |
| * | The Fund did not hold any Level 2 or Level 3 securities at period end. |
| Small Cap Growth Fund | | Level 1 | | | Level 2* | | | Level 3** | | | Total | |
| Assets | | | | | | | | | | | | | | | | |
| Investments | | | | | | | | | | | | | | | | |
| Common Stocks | | | | | | | | | | | | | | | | |
| Communication Services | | $ | 11,432 | | | $ | - | | | $ | - | | | $ | 11,432 | |
| Consumer Discretionary | | | 63,120 | | | | - | | | | - | | | | 63,120 | |
| Consumer Staples | | | 29,981 | | | | - | | | | - | | | | 29,981 | |
| Financials | | | 37,983 | | | | - | | | | - | | | | 37,983 | |
| Health Care | | | 114,504 | | | | - | | | | 0 | | | | 114,504 | |
| Industrials | | | 162,760 | | | | - | | | | - | | | | 162,760 | |
| Information Technology | | | 138,041 | | | | - | | | | - | | | | 138,041 | |
| Real Estate | | | 13,629 | | | | - | | | | - | | | | 13,629 | |
| Exchange-Traded Funds | | | 12,611 | | | | - | | | | - | | | | 12,611 | |
| Short-Term Investments | | | 21,525 | | | | - | | | | - | | | | 21,525 | |
| Total Assets | | $ | 605,586 | | | $ | - | | | $ | - | | | $ | 605,586 | |
| * | The Fund did not hold any Level 2 securities at period end. |
| ** | The Fund held Level 3 securities valued at zero at period end. |
| Small Cap Value Fund | | Level 1 | | | Level 2* | | | Level 3* | | | Total | |
| Assets | | | | | | | | | | | | | | | | |
| Investments | | | | | | | | | | | | | | | | |
| Common Stocks1 | | $ | 15,037,388 | | | $ | - | | | $ | - | | | $ | 15,037,388 | |
| Short-Term Investments | | | 307,806 | | | | - | | | | - | | | | 307,806 | |
| Total Assets | | $ | 15,345,194 | | | $ | - | | | $ | - | | | $ | 15,345,194 | |
| 1 | For a detailed break-out of common stocks by sector, please refer to the Schedule of Investments. |
| * | The Fund did not hold any Level 2 or Level 3 securities at period end. |
Kennedy Capital Funds
NOTES TO FINANCIAL STATEMENTS - Continued
December 31, 2023
The following is a reconciliation of assets in which significant unobservable inputs (Level 3) were used in determining value:
| | | Small Cap Growth Fund | |
| Beginning balance December 31, 2022 | | $ | 0 | |
| Transfers into Level 3 during the period | | | - | |
| Transfers out of Level 3 during the period | | | - | |
| Total realized gain/(loss) | | | - | |
| Change in unrealized appreciation/(depreciation) | | | - | |
| Net purchases | | | - | |
| Return of Capital | | | - | |
| Net sales | | | - | |
| Balance as of December 31, 2023 | | $ | 0 | |
The following table presents additional quantitative information about valuation methodologies and inputs used for investments that are measured at fair value and categorized within Level 3 as of December 31, 2023:
| Small Cap Growth Fund |
| Asset Class | | Fair Value at
12/31/2023 | | | Valuation
Technique(s) | | Unobservable
Input | | Range of Input | | | Weighted
Average of
Input | | Impact to
Valuation
from an
Increase in
Input(1) |
| Common Stock | | $ | 0 | | | Market Approach | | Discount for lack of marketability | | $ | 0 | | | N/A | | Increase |
| (1) | This column represents the directional change in the fair value of the Level 3 investments that would result from an increase to the corresponding unobservable input. A decrease to the unobservable input would have the opposite effect. |
Note 9 – Market Disruption and Geopolitical Risks
Certain local, regional or global events such as war, acts of terrorism, the spread of infectious illnesses and/or other public health issues, financial institution instability or other events may have a significant impact on a security or instrument. These types of events and other like them are collectively referred to as “Market Disruptions and Geopolitical Risks” and they may have adverse impacts on the worldwide economy, as well as the economies of individual countries, the financial health of individual companies and the market in general in significant and unforeseen ways. Some of the impacts noted in recent times include but are not limited to embargos, political actions, supply chain disruptions, bank failures, restrictions to investment and/or monetary movement including the forced selling of securities or the inability to participate impacted markets. The duration of these events could adversely affect the Fund’s performance, the performance of the securities in which the Fund invests and may lead to losses on your investment. The ultimate impact of “Market Disruptions and Geopolitical Risks” on the financial performance of the Fund’s investments is not reasonably estimable at this time. Management is actively monitoring these events
Note 10- New Accounting Pronouncements and Regulatory Updates
Effective January 24, 2023, the SEC adopted rule and form amendments to require mutual funds and exchange-traded funds (ETFs) to transmit concise and visually engaging streamlined annual and semiannual reports to shareholders that highlight key information deemed important for retail investors to assess and monitor their fund investments. Other information, including financial statements, will no longer appear in the funds’ streamlined shareholder reports but must be available online, delivered free of charge upon request, and filed on a semiannual basis on Form N-CSR. The rule and form amendments have a compliance date of July 24, 2024. At this time, management is evaluating the impact of these rule and form amendment changes on the content of the current shareholder report and the newly created annual and semiannual streamlined shareholder reports.
Kennedy Capital Funds
NOTES TO FINANCIAL STATEMENTS - Continued
December 31, 2023
In December 2020, the SEC adopted a new rule providing a framework for fund valuation practices (“Rule 2a-5”). Rule 2a-5 establishes requirements for determining fair value in good faith for purposes of the 1940 Act. Rule 2a-5 will permit fund boards to designate certain parties to perform fair value determinations, subject to board oversight and certain other conditions. Rule 2a-5 also defines when market quotations are “readily available” for purposes of the 1940 Act and the threshold for determining whether a fund must fair value a security. In connection with Rule 2a-5, the SEC also adopted related recordkeeping requirements and is rescinding previously issued guidance, including with respect to the role of a board in determining fair value and the accounting and auditing of fund investments. The Funds have adopted procedures in accordance with Rule 2a-5.
In March 2020, the Financial Accounting Standards Board (FASB) issued Accounting Standards Update (ASU) No. 2020-04, Reference Rate Reform (Topic 848) – Facilitation of the Effects of Reference Rate Reform on Financial Reporting. The amendments in the ASU provide optional temporary financial reporting relief from the effect of certain types of contract modifications due to the planned discontinuation of the London Interbank Offered Rate and other interbank-offered based reference rates as of the end of 2021. The ASU is effective for certain reference rate-related contract modifications that occur during the period March 12, 2020 through December 31, 2022. In December 2022, the FASB issued ASU No. 2022-06, Reference Rate Reform (Topic 848) - Deferral of the Sunset Date of Topic 848, which extends the period through December 31, 2024. Management has reviewed the requirements and believes the adoption of these ASUs will not have a material impact on the financial statements.
Note 11 – Events Subsequent to the Fiscal Period End
The Funds have adopted financial reporting rules regarding subsequent events which require an entity to recognize in the financial statements the effects of all subsequent events that provide additional evidence about conditions that existed at the date of the balance sheet. Management has evaluated the Funds’ related events and transactions that occurred through the date of issuance of the Funds’ financial statements. There were no events or transactions that occurred during this period that materially impacted the amounts or disclosures in the Funds’ financial statements.
There were no events or transactions that occurred during this period that materially impacted the amounts or disclosures in the Funds’ financial statements.
REPORT OF INDEPENDENT REGISTERED PUBLIC ACCOUNTING FIRM
To the Board of Trustees of Investment Managers Series Trust II and
Shareholders of Kennedy Capital Management
Opinion on the Financial Statements
We have audited the accompanying statements of assets and liabilities of Kennedy Capital ESG SMID Cap Fund, Kennedy Capital Small Cap Growth Fund, Kennedy Capital Small Cap Value Fund (the “Funds”), each a series of Investment Managers Series Trust II (the “Trust”), including the schedules of investments, as of December 31, 2023, the related statements of operations, the statements of changes in net assets and the financial highlights for the periods indicated in the table below, and the related notes (collectively referred to as the “financial statements”). In our opinion, the financial statements present fairly, in all material respects, the financial position of the Funds as of December 31, 2023, the results of their operations, the changes in their net assets and their financial highlights for each of the periods indicated in the table below, in conformity with accounting principles generally accepted in the United States of America.
| Fund | Statement of Operations | Statements of Changes in Net Assets | Financial Highlights |
| Kennedy Capital ESG SMID Cap Fund | For the year ended December 31, 2023 | For each of the two years in the period ended December 31, 2023 | For each of the four years in the period ended December 31, 2023 and for the period June 28, 2019 (commencement of operations) through December 31, 2019 |
| Kennedy Capital Small Cap Growth Fund and Kennedy Capital Small Cap Value Fund | For the year ended December 31, 2023 | For the year ended December 31, 2023 and for the period April 27, 2022 (commencement of operations) through December 31, 2022 | For the year ended December 31, 2023 and for the period April 27, 2022 (commencement of operations) through December 31, 2022 |
Basis for Opinion
These financial statements are the responsibility of the Funds’ management. Our responsibility is to express an opinion on the Funds’ financial statements based on our audits. We are a public accounting firm registered with the Public Company Accounting Oversight Board (United States) (“PCAOB”) and are required to be independent with respect to the Funds in accordance with the U.S. federal securities laws and the applicable rules and regulations of the Securities and Exchange Commission and the PCAOB. We have served as the auditor of one or more of the funds in the Trust since 2013.
We conducted our audits in accordance with the standards of the PCAOB. Those standards require that we plan and perform the audits to obtain reasonable assurance about whether the financial statements are free of material misstatement, whether due to error or fraud. The Funds are not required to have, nor were we engaged to perform, an audit of the Funds’ internal control over financial reporting. As part of our audits we are required to obtain an understanding of internal control over financial reporting, but not for the purpose of expressing an opinion on the effectiveness of the Funds’ internal control over financial reporting. Accordingly, we express no such opinion.
Our audits included performing procedures to assess the risks of material misstatement of the financial statements, whether due to error or fraud, and performing procedures that respond to those risks. Such procedures included examining, on a test basis, evidence regarding the amounts and disclosures in the financial statements. Our audits also included evaluating the accounting principles used and significant estimates made by management, as well as evaluating the overall presentation of the financial statements. Our procedures included confirmation of securities owned as of December 31, 2023 by correspondence with the custodian and brokers; when replies were not received from brokers, we performed other auditing procedures. We believe that our audits provide a reasonable basis for our opinion.
| |  |
| | TAIT, WELLER & BAKER LLP |
Philadelphia, Pennsylvania
February 29, 2024
Kennedy Capital Funds
SUPPLEMENTAL INFORMATION (Unaudited)
Results of Shareholder Meeting
At the meeting held on March 29, 2023, shareholders of each Fund approved the new investment advisory agreement between the Trust, on behalf of the Funds, and Kennedy Capital Management LLC, pursuant to which Kennedy Capital Management LLC will continue to serve as investment advisor to the Funds. The results of the shareholder meeting are as follows:
| Fund | For | Against | Abstain | Total |
| ESG SMID Cap Fund | 2,300,836 | - | 1,446 | 2,302,282 |
| Small Cap Growth Fund | 50,480 | - | - | 50,480 |
| Small Cap Value Fund | 448,356 | - | - | 448,356 |
Long-Term Capital Gain Designation
For the fiscal year ended December 31, 2023, the Small Cap Value Fund designates $15,342 as a 20% rate gain distribution for purposes of the dividends paid deduction.
Corporate Dividends Received Deduction
For the fiscal year ended December 31, 2023, 100%, 49.41% and 62.90%, respectively, of the dividends to be paid from net investment income, including short-term capital gains (if any) from the Kennedy Capital ESG SMID Cap, Kennedy Capital Small Cap Growth and Kennedy Capital Small Cap Value Funds, are designated as dividends received deduction available to corporate shareholders.
Qualified Dividend Income
For the fiscal year ended December 31, 2023, 100%, 53.20% and 63.98% of dividends to be paid from net investment income, including short-term capital gains (if any) from the Kennedy Capital ESG SMID Cap, Kennedy Capital Small Cap Growth and Kennedy Capital Small Cap Value Funds, are designated as qualified dividend income.
Trustees and Officers Information
Additional information about the Trustees is included in the Fund’s Statement of Additional Information which is available, without charge, upon request by calling (877) 882-8825. The Trustees and officers of the Fund and their principal occupations during the past five years are as follows:
| Name, Address, Year of Birth and Position(s) held with Trust | Term of Officec and Length of Time Served | Principal Occupation During the Past Five Years and Other Affiliations | Number of Portfolios in the Fund Complex Overseen by Trusteed | Other Directorships Held by Trustee e |
| “Independent” Trustees: | | | |
Thomas Knipper, CPA a (Born 1957) Trustee | Since September 2013 | Retired (April 2022 – present); Independent Consulting, financial services organizations (March 2021 – March 2022); Vice President and Chief Compliance Officer, Ameritas Investment Partners, a registered investment advisor (1995 – March 2021). | 3 | Monachil Credit Income Fund, a closed-end investment company. |
Kennedy Capital Funds
SUPPLEMENTAL INFORMATION (Unaudited) - Continued
| Name, Address, Year of Birth and Position(s) held with Trust | Term of Officec and Length of Time Served | Principal Occupation During the Past Five Years and Other Affiliations | Number of Portfolios in the Fund Complex Overseen by Trusteed | Other Directorships Held by Trustee e |
| “Independent” Trustees: | | | |
Kathleen K. Shkuda a (born 1951) Trustee | Since September 2013 | Zigzag Consulting, a financial services consulting firm (2008 – present); Director, Managed Accounts, Merrill Lynch (2007 – 2008). | 3 | None. |
Larry D. Tashjian a (born 1953) Trustee and Chairman of the Board | Since September 2013 | Principal, CAM Capital Advisors, a family office (2001 – present). | 3 | General Finance Corporation. |
John P. Zader a (born 1961) Trustee | Since September 2013 | Retired (June 2014 – present); CEO, UMB Fund Services, Inc., a mutual fund and hedge fund service provider, and the transfer agent, fund accountant, and co-administrator for the Fund(s) (December 2006 – June 2014); President, Investment Managers Series Trust (December 2007 – June 2014). | 3 | Investment Managers Series Trust III, a registered investment company (includes 5 portfolios), Source Capital, Inc., a closed-end investment company. |
| Interested Trustees: | | | |
Terrance P. Gallagher a* (born 1958) Trustee and President | Since July 2019 | President, Investment Managers Series Trust II (September 2013 – present); Executive Vice President and Trust Platform Director, (2024 – present); Executive Vice President and Director of Fund Accounting, Administration and Tax, UMB Fund Services, Inc. (2007 – 2023). | 3 | Agility Multi-Asset Income Fund, Aspiriant Risk-Managed Real Asset Fund, Aspiriant Risk-Managed Capital Appreciation Fund, AFA Multi-Manager Credit Fund, Infinity Core Alternative Fund, |
| Name, Address, Year of Birth and Position(s) held with Trust | Term of Officec and Length of Time Served | Principal Occupation During the Past Five Years and Other Affiliations | Number of Portfolios in the Fund Complex Overseen by Trusteed | Other Directorships Held by Trustee e |
|
| | | Keystone Private Income Fund, First Trust Alternative Opportunities Fund, Variant Alternative Income Fund, Variant Impact Fund, First Trust Private Assets Fund, First Trust Private Credit Fund, First Trust Real Assets Fund, Destiny Alternative Fund LLC, Destiny Alternative Fund (TEI) LLC, Pender Real Estate Credit Fund, First Trust Hedged Strategies Fund, and Felicitas Private Markets Fund, each a closed-end investment company. |
Kennedy Capital Funds
SUPPLEMENTAL INFORMATION (Unaudited) - Continued
| Name, Address, Year of Birth and Position(s) held with Trust | Term of Officec and Length of Time Served | Principal Occupation During the Past Five Years and Other Affiliations | Number of Portfolios in the Fund Complex Overseen by Trusteed | Other Directorships Held by Trustee e |
| Interested Trustees: | | | |
Joy Ausili b† (born 1966) Trustee, Vice President and Assistant Secretary | Since January 2023 | Co-Chief Executive Officer (2016 – present), and Vice President (2006 – 2015), Mutual Fund Administration, LLC; Vice President and Assistant Secretary (January 2016 – present), Investment Managers Series Trust II; Vice President and Secretary, Investment Managers Series Trust (March 2016 – present); Co-President, Foothill Capital Management, LLC, a registered investment advisor (2018 – 2022). | 3 | None. |
| Officers of the Trust: | | |
Rita Dam b (born 1966) Treasurer and Assistant Secretary | Since September 2013 | Co-Chief Executive Officer (2016 – present), and Vice President (2006 – 2015), Mutual Fund Administration, LLC; Co-President, Foothill Capital Management, LLC, a registered investment advisor (2018 – 2022). | N/A | N/A |
Diane Drake b (born 1967) Secretary | Since January 2016 | Senior Counsel, Mutual Fund Administration, LLC (October 2015 – present); Chief Compliance Officer, Foothill Capital Management, LLC, a registered investment advisor (2018 – 2019). | N/A | N/A |
Martin Dziura b (born 1959) Chief Compliance Officer | Since September 2013 | Principal, Dziura Compliance Consulting, LLC (October 2014 – present); Managing Director, Cipperman Compliance Services (2010 – September 2014); Chief Compliance Officer, Hanlon Investment Management (2009 – 2010); Vice President − Compliance, Morgan Stanley Investment Management (2000 − 2009). | N/A | N/A |
| a | Address for certain Trustees and certain officers: 235 West Galena Street, Milwaukee, Wisconsin 53212. |
| b | Address for Ms. Ausili, Ms. Dam and Ms. Drake: 2220 E. Route 66, Suite 226, Glendora, California 91740. |
Address for Mr. Dziura: 309 Woodridge Lane, Media, Pennsylvania 19063.
| c | Trustees and officers serve until their successors have been duly elected. |
| d | The Trust is comprised of 48 series managed by unaffiliated investment advisors. Each Trustee serves as Trustee of each series of the Trust. The term “Fund Complex” applies only to the Fund(s) managed by the same investment advisor. The Funds do not hold themselves out as related to any other series within the Trust, for purposes of investment and investor services, nor does it share the same investment advisor with any other series. |
| e | “Other Directorships Held” includes only directorships of companies required to register or file reports with the SEC under the Securities Exchange Act of 1934, as amended (that is, “public companies”), or other investment companies registered under the 1940 Act. |
Kennedy Capital Funds
SUPPLEMENTAL INFORMATION (Unaudited) - Continued
| † | Ms. Ausili is an “interested person” of the Trust by virtue of her position with Mutual Fund Administration, LLC. |
| * | Mr. Gallagher is an “interested person” of the Trust by virtue of his position with UMB Fund Services, Inc. |
Effective January 19, 2023, Eric M. Banhazl, who served as a Trustee of the Trust from September 2013 to January 19, 2023, is serving as a Trustee Emeritus of the Trust. As a Trustee Emeritus, Mr. Banhazl may attend the meetings of the Board of Trustees or any of its committees, but has no duties, powers or responsibilities with respect to the Trust.
Kennedy Capital Funds
SUPPLEMENTAL INFORMATION (Unaudited) - Continued
Statement Regarding Liquidity Risk Management Program
The Securities and Exchange Commission adopted Rule 22e-4 under the Investment Company Act of 1940, as amended (the “Liquidity Rule”), to promote effective liquidity risk management throughout the open-end investment company industry, thereby reducing the risk that funds will be unable to meet their redemption obligations and mitigating dilution of the interests of fund shareholders.
The Board of Trustees (the “Board”) of Investment Managers Series Trust II (the “Trust”) met on July 19, 2023 (the “Meeting”), to review the liquidity risk management program (the “Fund Program”) applicable to the following series of the Trust (each, a “Fund” and together, the “Funds”) pursuant to the Liquidity Rule:
Kennedy Capital ESG SMID Cap Fund
Kennedy Capital Small Cap Growth Fund
Kennedy Capital Small Cap Value Fund
The Board has appointed Kennedy Capital Management, Inc., the investment adviser to the Funds, as the program administrator (“Program Administrator”) for the Fund Program. Under the Trust’s liquidity risk management program (the “Trust Program”), the Board has delegated oversight of the Trust Program to the Liquidity Oversight Committee (the “Oversight Committee”). At the Meeting, the Oversight Committee, on behalf of Program Administrator and the Funds, provided the Board with a written report (the “Report”) that addressed the operation, adequacy, and effectiveness of implementation of the Fund Program, and any material changes to it for the period from May 1, 2022 through April 30, 2023 (the “Program Reporting Period”).
In assessing the adequacy and effectiveness of implementation of the Fund Program, the Report discussed the following, among other things:
| · | The Fund Program’s liquidity classification methodology for categorizing each Fund’s investments; |
| · | An overview of market liquidity for each Fund during the Program Reporting Period; |
| · | Each Fund’s ability to meet redemption requests; |
| · | Each Fund’s cash management; |
| · | Each Fund’s borrowing activity, if any, in order to meet redemption requests; |
| · | Each Fund’s compliance with the 15% limit of illiquid investments; and |
| · | Each Fund’s status as a primarily highly liquid fund (“PHLF”), the effectiveness of the implementation of the PHLF standard, and whether it would be appropriate for each Fund to adopt a highly liquid investment minimum (“HLIM”). |
The Report stated that the Funds primarily hold assets that are defined under the Liquidity Rule as “highly liquid investments,” and therefore each Fund is not required to establish an HLIM. Highly liquid investments are defined as cash and any investment reasonably expected to be convertible to cash in current market conditions in three business days or less without the conversion to cash significantly changing the market value of the investment. The Report also stated that there were no material changes made to the Fund Program during the Program Reporting Period.
In the Report, the Program Administrator concluded that (i) the Fund Program, as adopted and implemented, remains reasonably designed to assess and manage each Fund’s liquidity risk; (ii) each Fund continues to qualify as a PHLF and therefore is not required to adopt an HLIM; (iii) during the Program Reporting Period, each Fund was able to meet redemption requests without significant dilution of remaining investors’ interests; and (iv) there were no weaknesses in the design or implementation of the Fund Program during the Program Reporting Period.
Kennedy Capital Funds
SUPPLEMENTAL INFORMATION (Unaudited) - Continued
There can be no assurance that the Fund Program will achieve its objectives in the future. Please refer to the Funds’ prospectus for more information regarding each Fund’s exposure to liquidity risk and other principal risks to which an investment in the Funds may be subject.
Kennedy Capital Funds
EXPENSE EXAMPLES
For the Six Months Ended December 31, 2023 (Unaudited)
Expense Examples
As a shareholder of the Funds, you incur two types of costs: (1) transaction costs, including redemption fees; and (2) ongoing costs, including management fees; distribution and other Fund expenses. The examples below are intended to help you understand your ongoing costs (in dollars) of investing in the Funds and to compare these costs with the ongoing costs of investing in other mutual funds.
These examples are based on an investment of $1,000 invested at the beginning of the period and held for the entire period from July 1, 2023 to December 31, 2023.
Actual Expenses
The information in the rows titled “Actual Performance” of the tables below provides actual account values and actual expenses. You may use the information in these columns, together with the amount you invested, to estimate the expenses that you paid over the period. Simply divide your account value by $1,000 (for example, an $8,600 account value divided by $1,000 = 8.6), then multiply the result by the number in the appropriate row for your share class, under the column titled “Expenses Paid During Period” to estimate the expenses you paid on your account during this period.
Hypothetical Example for Comparison Purposes
The information in the rows titled “Hypothetical (5% annual return before expenses)” of the table below provides hypothetical account values and hypothetical expenses based on the Funds’ actual expense ratios and an assumed rate of return of 5% per year before expenses, which is not the Funds’ actual return. The hypothetical account values and expenses may not be used to estimate the actual ending account balance or expenses you paid for the period. You may use this information to compare the ongoing costs of investing in the Funds and other funds. To do so, compare these 5% hypothetical examples with the 5% hypothetical examples that appear in the shareholder reports of the other funds.
Please note that the expenses shown in the table are meant to highlight your ongoing costs only and do not reflect any transaction costs, such as sales charges (load) or contingent deferred sales charges. Therefore, the information in the row titled “Hypothetical (5% annual return before expenses)” is useful in comparing ongoing costs only, and will not help you determine the relative total costs of owning different funds. In addition, if these transactional costs were included, your costs would have been higher.
| Kennedy Capital ESG SMID Cap Fund | Beginning
Account Value | Ending
Account Value | Expense Paid
During Period* |
| 7/1/23 | 12/31/23 | 7/1/23–12/31/23 |
| Actual Performance | $1,000.00 | $1,087.90 | $4.32 |
| Hypothetical (5% annual return before expenses) | 1,000.00 | 1,021.07 | 4.18 |
| * | Expenses are equal to the Fund’s annualized expense ratio of 0.82%, multiplied by the average account values over the period, multiplied by 184/365 (to reflect the six month period). The expense ratio reflects an expense waiver. Assumes all dividends and distributions were reinvested. |
Kennedy Capital Funds
EXPENSE EXAMPLES - Continued
For the Six Months Ended December 31, 2023 (Unaudited)
| Kennedy Capital Small Cap Growth Fund | Beginning
Account Value | Ending
Account Value | Expense Paid
During Period* |
| 7/1/23 | 12/31/23 | 7/1/23–12/31/23 |
| Actual Performance | $1,000.00 | $1,031.70 | $4.56 |
| Hypothetical (5% annual return before expenses) | 1,000.00 | 1,020.72 | 4.53 |
| * | Expenses are equal to the Fund’s annualized expense ratio of 0.89%, multiplied by the average account values over the period, multiplied by 184/365 (to reflect the six month period). The expense ratio reflects an expense waiver. Assumes all dividends and distributions were reinvested. |
| Kennedy Capital Small Cap Value Fund | Beginning
Account Value | Ending
Account Value | Expense Paid
During Period* |
| 7/1/23 | 12/31/23 | 7/1/23–12/31/23 |
| Actual Performance | $1,000.00 | $1,117.80 | $4.75 |
| Hypothetical (5% annual return before expenses) | 1,000.00 | 1,020.72 | 4.54 |
| * | Expenses are equal to the Fund’s annualized expense ratio of 0.89%, multiplied by the average account values over the period, multiplied by 184/365 (to reflect the six month period). The expense ratio reflects an expense waiver. Assumes all dividends and distributions were reinvested. |
This page is intentionally left blank
Kennedy Capital Funds
Each a series of Investment Managers Series Trust II
Investment Advisor
Kennedy Capital Management LLC
10829 Olive Boulevard, Suite 100
St. Louis, Missouri 63141
Independent Registered Public Accounting Firm
Tait, Weller & Baker LLP
Two Liberty Place
50 South 16th Street, Suite 2900
Philadelphia, Pennsylvania 19102
Custodian
UMB Bank, n.a.
928 Grand Boulevard, 5th Floor
Kansas City, Missouri 64106
Fund Co-Administrator
Mutual Fund Administration, LLC
2220 East Route 66, Suite 226
Glendora, California 91740
Fund Co-Administrator, Transfer Agent and Fund Accountant
UMB Fund Services, Inc.
235 West Galena Street
Milwaukee, Wisconsin 53212
Distributor
IMST Distributors, LLC
Three Canal Plaza, Suite 100
Portland, Maine 04101
www.acaglobal.com
FUND INFORMATION
| | TICKER | CUSIP |
| Kennedy Capital ESG SMID Cap Fund – Institutional Class | KESGX | 46141T562 |
| Kennedy Capital Small Cap Growth Fund – Institutional Class | KGROX | 46144X305 |
| Kennedy Capital Small Cap Value Fund – Institutional Class | KVALX | 46144X503 |
Privacy Principles of the Kennedy Capital Funds for Shareholders
The Funds are committed to maintaining the privacy of their shareholders and to safeguarding their non-public personal information. The following information is provided to help you understand what personal information the Funds collect, how we protect that information and why, in certain cases, we may share information with select other parties.
Generally, the Funds do not receive any non-public personal information relating to its shareholders, although certain non-public personal information of its shareholders may become available to the Funds. The Funds do not disclose any non-public personal information about its shareholders or former shareholders to anyone, except as permitted by law or as is necessary in order to service shareholder accounts (for example, to a transfer agent or third party administrator).
This report is sent to shareholders of the Kennedy Capital Funds for their information. It is not a Prospectus, circular or representation intended for use in the purchase or sale of shares of the Funds or of any securities mentioned in this report.
Proxy Voting Policies and Procedures
A description of the Funds’ proxy voting policies and procedures related to portfolio securities is available without charge, upon request, by calling the Funds at (877) 882-8825 or on the U.S. Securities and Exchange Commission’s (“SEC”) website at www.sec.gov.
Proxy Voting Record
Information regarding how the Funds voted proxies for portfolio securities, if applicable, during the most recent 12-month period ended June 30, is also available, without charge and upon request by calling (877) 882-8825 or by accessing the Funds’ Form N-PX on the SEC’s website at www.sec.gov.
Fund Portfolio Holdings
The Funds file a complete schedule of their portfolio holdings with the SEC for the first and third quarters of each fiscal year on Form N-PORT within 60 days of the end of such fiscal quarter. Shareholders may obtain the Funds’ Form N-PORT on the SEC’s website at www.sec.gov.
Prior to the use of Form N-PORT, the Kennedy Capital ESG SMID Cap Fund filed its complete schedule of portfolio holdings with the SEC on Form N-Q, which is available online at www.sec.gov
Householding
The Funds will mail only one copy of shareholder documents, including prospectuses and notice of annual and semi-annual reports availability and proxy statements, to shareholders with multiple accounts at the same address. This practice is commonly called “householding” and is intended to reduce expenses and eliminate duplicate mailings of shareholder documents. Mailings of your shareholder documents may be householded indefinitely unless you instruct us otherwise. If you do not want the mailing of these documents to be combined with those for other members of your household, please call the Funds at (877) 882-8825.
Kennedy Capital Funds
P.O. Box 2175
Milwaukee, WI 53201
Toll Free: (877) 882-8825
Item 1. Report to Stockholders (Continued).
Item 2. Code of Ethics.
The registrant has adopted a code of ethics that applies to the registrant's principal executive officer and principal financial officer. The registrant has not made any amendments to its code of ethics during the period covered by this report. The registrant has not granted any waivers from any provisions of the code of ethics during the period covered by this report.
The registrant undertakes to provide to any person without charge, upon request, a copy of its code of ethics by mail when they call the registrant at 1-877-882-8825.
Item 3. Audit Committee Financial Expert.
The Board of Trustees of the Registrant has determined that the Registrant has the following “audit committee financial experts” as defined in Item 3(b) of Form N-CSR serving on its Audit Committee: Messrs. Thomas Knipper and John P. Zader. The audit committee financial experts are “independent” as that term is defined in Item 3(a)(2) of Form N-CSR.
Item 4. Principal Accountant Fees and Services.
The registrant has engaged its principal accountant to perform audit services, audit-related services, tax services and other services during the past two fiscal years. "Audit services" refer to performing an audit of the registrant's annual financial statements or services that are normally provided by the accountant in connection with statutory and regulatory filings or engagements for those fiscal years. "Audit-related services" refer to the assurance and related services by the principal accountant that are reasonably related to the performance of the audit. "Tax services" refer to professional services rendered by the principal accountant for tax compliance, tax advice, and tax planning. There were no "other services" provided by the principal accountant. The following table details the aggregate fees billed or expected to be billed for each of the last two fiscal years for audit fees, audit-related fees, tax fees and other fees by the principal accountant.
| | FYE 12/31/2023 | FYE 12/31/2022 |
| Audit Fees | $40,500 | $28,000 |
| Audit-Related Fees | N/A | N/A |
| Tax Fees | $7,500 | $7,500 |
| All Other Fees | N/A | N/A |
The audit committee has adopted pre-approval policies and procedures that require the audit committee to pre-approve all audit and non-audit services of the registrant, including services provided to any entity affiliated with the registrant.
The percentage of fees billed by Tait Weller applicable to non-audit services pursuant to waiver of pre-approval requirement were as follows:
| | FYE 12/31/2023 | FYE 12/31/2022 |
| Audit-Related Fees | 0% | 0% |
| Tax Fees | 0% | 0% |
| All Other Fees | 0% | 0% |
All of the principal accountant's hours spent on auditing the registrant's financial statements were attributed to work performed by full-time permanent employees of the principal accountant.
The following table indicates the non-audit fees billed or expected to be billed by the registrant's accountant for services to the registrant and to the registrant's investment advisor (and any other controlling entity, etc.—not sub-advisor) for the last two years. The audit committee of the Board of Trustees has considered whether the provision of non-audit services that were rendered to the registrant's investment advisor is compatible with maintaining the principal accountant's independence and has concluded that the provision of such non-audit services by the accountant has not compromised the accountant's independence.
| Non-Audit Related Fees | FYE 12/31/2023 | FYE 12/31/2022 |
| Registrant | N/A | N/A |
| Registrant’s Investment Advisor | N/A | N/A |
Item 5. Audit Committee of Listed Registrants.
| (a) | Not applicable to registrants who are not listed issuers (as defined in Rule 10A-3 under the Securities Exchange Act of 1934). |
Item 6. Schedule of Investments.
| (a) | Schedule of Investments is included as part of the report to shareholders filed under Item 1 of this Form. |
Item 7. Disclosure of Proxy Voting Policies and Procedures for Closed-End Management Investment Companies.
Not applicable to open-end investment companies.
Item 8. Portfolio Managers of Closed-End Management Investment Companies.
Not applicable to open-end investment companies.
Item 9. Purchases of Equity Securities by Closed-End Management Investment Company and Affiliated Purchasers.
Not applicable.
Item 10. Submission of Matters to a Vote of Security Holders.
The registrant has not made any material changes to the procedures by which shareholders may recommend nominees to the registrant’s Board of Trustees.
Item 11. Controls and Procedures.
| (a) | The Registrant’s President/Chief Executive Officer and Treasurer/Chief Financial Officer have reviewed the Registrant's disclosure controls and procedures (as defined in Rule 30a-3(c) under the Investment Company Act of 1940 (the “Act”)) as of a date within 90 days of the filing of this report, as required by Rule 30a-3(b) under the Act and Rules 13a-15(b) or 15d-15(b) under the Securities Exchange Act of 1934. Based on their review, such officers have concluded that the disclosure controls and procedures are effective in ensuring that information required to be disclosed in this report is appropriately recorded, processed, summarized and reported and made known to them by others within the Registrant and by the Registrant’s service provider. |
| (b) | There were no changes in the Registrant's internal control over financial reporting (as defined in Rule 30a-3(d) under the Act) that occurred during the period covered by this report that has materially affected, or is reasonably likely to materially affect, the Registrant's internal control over financial reporting. |
Item 12. Disclosure of Securities Lending Activities for Closed-End Management Investment Companies.
Not applicable to open-end investment companies.
Item 13. Exhibits.
(2) Certifications pursuant to Section 302 of the Sarbanes-Oxley Act of 2002. Filed herewith.
(3) Any written solicitation to purchase securities under Rule 23c-1 under the Act sent or given during the period covered by the report by or on behalf of the registrant to 10 or more persons. Not applicable to open-end investment companies.
(4) Change in the registrant’s independent public accountant. There was no change in the registrant’s independent public accountant for the period covered by this report.
SIGNATURES
Pursuant to the requirements of the Securities Exchange Act of 1934 and the Investment Company Act of 1940, the registrant has duly caused this report to be signed on its behalf by the undersigned, thereunto duly authorized.
| (Registrant) | Investment Managers Series Trust II | |
| | | |
| By (Signature and Title) | /s/ Terrance Gallagher | |
| | Terrance Gallagher, President/Chief Executive Officer | |
| | | |
| Date | 03/08/2024 | |
Pursuant to the requirements of the Securities Exchange Act of 1934 and the Investment Company Act of 1940, this report has been signed below by the following persons on behalf of the registrant and in the capacities and on the dates indicated.
| By (Signature and Title) | /s/ Terrance Gallagher | |
| | Terrance Gallagher, President/Chief Executive Officer | |
| | | |
| Date | 03/08/2024 | |
| | | |
| By (Signature and Title) | /s/ Rita Dam | |
| | Rita Dam, Treasurer/Chief Financial Officer | |
| | | |
| Date | 03/08/2024 | |