Item 1. Report to Stockholders.
(a) The registrant’s semi-annual report transmitted to shareholders pursuant to Rule 30e-1 under the Investment Company Act of 1940, as amended (the “Investment Company Act”), is as follows:
ESG SMID Cap Fund
| Fund (Class) | Costs of a $10,000 investment | Costs paid as a percentage of a $10,000 investment |
| Kennedy Capital ESG SMID Cap Fund (Institutional Class/KESGX) | $41 | 0.82% |
| Fund net assets | $59,276,555% |
| Total number of portfolio holdings | $94% |
| Total advisory fee paid/(reimbursed) | $119,076% |
| Portfolio turnover rate as of the end of the reporting period | $35% |
| Teledyne Technologies, Inc. | 1.9% |
| CyberArk Software Ltd. | 1.8% |
| Descartes Systems Group, Inc. | 1.6% |
| Globus Medical, Inc., Class A | 1.6% |
| SPX Technologies, Inc. | 1.6% |
| Reliance, Inc. | 1.5% |
| Carlisle Cos., Inc. | 1.5% |
| TD SYNNEX Corp. | 1.5% |
| Tetra Tech, Inc. | 1.5% |
| Barnes Group, Inc. | 1.5% |
Small Cap Growth Fund
| Fund (Class) | Costs of a $10,000 investment | Costs paid as a percentage of a $10,000 investment |
| Kennedy Capital Small Cap Growth Fund (Institutional Class/KGROX) | $46 | 0.89% |
| Fund net assets | $587,425)% |
| Total number of portfolio holdings | $76)% |
| Total advisory fee paid/(reimbursed) | $(88,369)% |
| Portfolio turnover rate as of the end of the reporting period | $21)% |
| Wingstop, Inc. | 3.4% |
| Globus Medical, Inc., Class A | 2.7% |
| Informatica, Inc. - Class A | 2.6% |
| Vertex, Inc. | 2.6% |
| Casella Waste Systems, Inc. - Class A | 2.5% |
| Chefs' Warehouse, Inc. | 2.5% |
| Baldwin Insurance Group, Inc. | 2.4% |
| MACOM Technology Solutions Holdings, Inc. | 2.4% |
| Tetra Tech, Inc. | 2.4% |
| Shift4 Payments, Inc. - Class A | 2.3% |
Small Cap Value Fund
| Fund (Class) | Costs of a $10,000 investment | Costs paid as a percentage of a $10,000 investment |
| Kennedy Capital Small Cap Value Fund (Institutional Class/KVALX) | $45 | 0.89% |
| Fund net assets | $19,794,932)% |
| Total number of portfolio holdings | $111)% |
| Total advisory fee paid/(reimbursed) | $(14,786)% |
| Portfolio turnover rate as of the end of the reporting period | $28)% |
| Stifel Financial Corp. | 1.9% |
| Hawkins, Inc. | 1.8% |
| Wintrust Financial Corp. | 1.7% |
| Bank OZK | 1.7% |
| Carpenter Technology Corp. | 1.7% |
| National Bank Holdings Corp. - Class A | 1.6% |
| Insight Enterprises, Inc. | 1.6% |
| Halozyme Therapeutics, Inc. | 1.5% |
| Alamo Group, Inc. | 1.5% |
| AZZ, Inc. | 1.5% |
(b) Not applicable.
Item 2. Code of Ethics.
Not applicable.
Item 3. Audit Committee Financial Expert.
Not applicable.
Item 4. Principal Accountant Fees and Services.
Not applicable.
Item 5. Audit Committee of Listed Registrants.
Not applicable.
Item 6. Investments.
| (a) | Schedule of Investments is included as part of the report to shareholders filed under Item 7 of this Form. |
| (b) | Not Applicable. |
Item 7. Financial Statements and Financial Highlights for Open-End Management Investment Companies.

Kennedy Capital ESG SMID Cap Fund
(Institutional Class: KESGX)
Kennedy Capital Small Cap Growth Fund
(Institutional Class: KGROX)
Kennedy Capital Small Cap Value Fund
(Institutional Class: KVALX)
SEMI-ANNUAL FINANCIALS AND OTHER INFORMATION
June 30, 2024
Kennedy Capital ESG SMID Cap Fund
Kennedy Capital Small Cap Growth Fund
Kennedy Capita Small Cap Value Fund
Each a series of Investment Managers Series Trust II
Table of Contents
| Item 7. Financial Statements and Financial Highlights | |
| Schedule of Investments | |
| Kennedy Capital ESG SMID Cap Fund | 1 |
| Kennedy Capital Small Cap Growth Fund | 5 |
| Kennedy Capital Small Cap Value Fund | 8 |
| Statements of Assets and Liabilities | 12 |
| Statements of Operations | 13 |
| Statements of Changes in Net Assets | |
| Kennedy Capital ESG SMID Cap Fund | 14 |
| Kennedy Capital Small Cap Growth Fund | 15 |
| Kennedy Capital Small Cap Value Fund | 16 |
| Financial Highlights | |
| Kennedy Capital ESG SMID Cap Fund | 17 |
| Kennedy Capital Small Cap Growth Fund | 18 |
| Kennedy Capital Small Cap Value Fund | 19 |
| Notes to Financial Statements | 20 |
This report and the financial statements contained herein are provided for the general information of the shareholders of the Kennedy Capital Funds. This report is not authorized for distribution to prospective investors in the Funds unless preceded or accompanied by an effective shareholder report and prospectus.
www.kennedycapital.com
Item 7. Financial Statements and Financial Highlights for Open-End Management Investment Companies.
Kennedy Capital ESG SMID Cap Fund
SCHEDULE OF INVESTMENTS
As of June 30, 2024 (Unaudited)
| Number of Shares | Value | |||||||
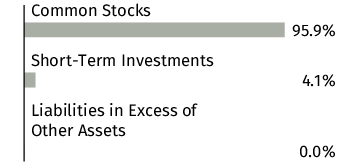
| COMMON STOCKS — 95.9% | ||||||||
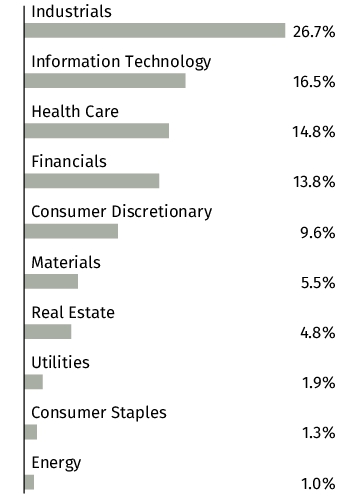
| CONSUMER DISCRETIONARY — 9.6% | ||||||||
| 7,240 | Brunswick Corp. | $ | 526,855 | |||||
| 1,194 | Cavco Industries, Inc.* | 413,327 | ||||||
| 6,741 | Helen of Troy, Ltd.*,1 | 625,160 | ||||||
| 11,940 | LKQ Corp. | 496,585 | ||||||
| 5,911 | Marriott Vacations Worldwide Corp. | 516,149 | ||||||
| 1,688 | Pool Corp. | 518,773 | ||||||
| 16,455 | Steven Madden Ltd. | 696,046 | ||||||
| 1,697 | TopBuild Corp.* | 653,803 | ||||||
| 1,601 | Ulta Beauty, Inc.* | 617,778 | ||||||
| 7,963 | Wyndham Hotels & Resorts, Inc. | 589,262 | ||||||
| 5,653,738 | ||||||||
| CONSUMER STAPLES — 1.3% | ||||||||
| 7,574 | Post Holdings, Inc.* | 788,908 | ||||||
| ENERGY — 1.0% | ||||||||
| 13,703 | ChampionX Corp. | 455,076 | ||||||
| 10,090 | DMC Global, Inc.* | 145,498 | ||||||
| 600,574 | ||||||||
| FINANCIALS — 13.8% | ||||||||
| 3,070 | Assurant, Inc. | 510,388 | ||||||
| 8,581 | Brown & Brown, Inc. | 767,227 | ||||||
| 8,280 | East West Bancorp, Inc. | 606,344 | ||||||
| 1,379 | FactSet Research Systems, Inc. | 563,004 | ||||||
| 3,817 | Jack Henry & Associates, Inc. | 633,698 | ||||||
| 2,788 | LPL Financial Holdings, Inc. | 778,688 | ||||||
| 7,803 | Popular, Inc.1 | 690,019 | ||||||
| 5,268 | Selective Insurance Group, Inc. | 494,297 | ||||||
| 7,140 | SouthState Corp. | 545,639 | ||||||
| 8,137 | Stifel Financial Corp. | 684,729 | ||||||
| 10,025 | Voya Financial, Inc. | 713,279 | ||||||
| 8,098 | Western Alliance Bancorp | 508,716 | ||||||
| 7,146 | Wintrust Financial Corp. | 704,310 | ||||||
| 8,200,338 | ||||||||
| HEALTH CARE — 14.8% | ||||||||
| 15,796 | AtriCure, Inc.* | 359,675 | ||||||
| 19,150 | Avantor, Inc.* | 405,980 | ||||||
| 3,555 | Axsome Therapeutics, Inc.* | 286,177 | ||||||
| 3,028 | Charles River Laboratories International, Inc.* | 625,524 | ||||||
| 1,376 | Chemed Corp. | 746,590 | ||||||
| 9,120 | Encompass Health Corp. | 782,405 | ||||||
| 13,603 | Enovis Corp.* | 614,856 | ||||||
| 26,036 | Evolent Health, Inc. - Class A* | 497,808 |
| |||||
1
Kennedy Capital ESG SMID Cap Fund
SCHEDULE OF INVESTMENTS - Continued
As of June 30, 2024 (Unaudited)
| Number of Shares | Value | |||||||
| COMMON STOCKS (Continued) | ||||||||
| HEALTH CARE (Continued) | ||||||||
| 14,116 | Globus Medical, Inc., Class A* | $ | 966,805 | |||||
| 65,678 | Health Catalyst, Inc.* | 419,682 | ||||||
| 1,831 | ICON PLC*,1 | 573,964 | ||||||
| 6,104 | ICU Medical, Inc.* | 724,850 | ||||||
| 2,446 | Inspire Medical Systems, Inc.* | 327,348 | ||||||
| 9,179 | Ionis Pharmaceuticals, Inc.* | 437,471 | ||||||
| 10,134 | LivaNova PLC*,1 | 555,546 | ||||||
| 3,155 | Neurocrine Biosciences, Inc.* | 434,349 | ||||||
| 8,759,030 | ||||||||
| INDUSTRIALS — 26.7% | ||||||||
| 8,914 | Albany International Corp. - Class A | 752,787 | ||||||
| 9,217 | Arcosa, Inc. | 768,790 | ||||||
| 24,296 | Atmus Filtration Technologies, Inc.* | 699,239 | ||||||
| 20,875 | Barnes Group, Inc. | 864,434 | ||||||
| 1,844 | CACI International, Inc. - Class A* | 793,160 | ||||||
| 2,190 | Carlisle Cos., Inc. | 887,410 | ||||||
| 2,576 | Casella Waste Systems, Inc. - Class A* | 255,591 | ||||||
| 2,475 | Chart Industries, Inc.* | 357,241 | ||||||
| 5,480 | Crane Co. | 794,490 | ||||||
| 15,456 | Enerpac Tool Group Corp. - Class A | 590,110 | ||||||
| 2,789 | ESCO Technologies, Inc. | 292,957 | ||||||
| 44,341 | Gates Industrial Corp. PLC*,1 | 701,031 | ||||||
| 12,284 | Hexcel Corp. | 767,136 | ||||||
| 3,304 | IDEX Corp. | 664,765 | ||||||
| 28,331 | Leonardo DRS, Inc.* | 722,724 | ||||||
| 4,060 | MSA Safety, Inc. | 762,021 | ||||||
| 2,799 | Nordson Corp. | 649,200 | ||||||
| 5,920 | Regal Rexnord Corp. | 800,502 | ||||||
| 17,305 | REV Group, Inc. | 430,721 | ||||||
| 6,605 | SPX Technologies, Inc.* | 938,835 | ||||||
| 4,263 | Tetra Tech, Inc. | 871,698 | ||||||
| 12,746 | Thermon Group Holdings, Inc.* | 392,067 | ||||||
| 7,114 | Trex Co., Inc.* | 527,290 | ||||||
| 19,124 | Zurn Elkay Water Solutions Corp. | 562,246 | ||||||
| 15,846,445 | ||||||||
| INFORMATION TECHNOLOGY — 16.5% | ||||||||
| 18,923 | Allegro MicroSystems, Inc.* | 534,385 | ||||||
| 1,928 | Badger Meter, Inc. | 359,283 | ||||||
| 6,611 | Blackbaud, Inc.* | 503,560 | ||||||
| 8,953 | Coherent Corp.* | 648,734 | ||||||
| 3,975 | CyberArk Software Ltd.*,1 | 1,086,844 | ||||||
| 10,006 | Descartes Systems Group, Inc.*,1 | 968,981 | ||||||
| 1,696 | F5, Inc.* | 292,102 | ||||||
2
Kennedy Capital ESG SMID Cap Fund
SCHEDULE OF INVESTMENTS - Continued
As of June 30, 2024 (Unaudited)
| Number of Shares | Value | |||||||
| COMMON STOCKS (Continued) | ||||||||
| INFORMATION TECHNOLOGY (Continued) | ||||||||
| 1,428 | Fabrinet*,1 | $ | 349,560 | |||||
| 2,573 | Manhattan Associates, Inc.* | 634,708 | ||||||
| 4,388 | OSI Systems, Inc.* | 603,438 | ||||||
| 6,046 | Silicon Motion Technology Corp. ADR | 489,666 | ||||||
| 3,475 | SPS Commerce, Inc.* | 653,856 | ||||||
| 7,577 | TD SYNNEX Corp. | 874,386 | ||||||
| 2,893 | Teledyne Technologies, Inc.* | 1,122,426 | ||||||
| 11,191 | Trimble, Inc.* | 625,801 | ||||||
| 9,747,730 | ||||||||
| MATERIALS — 5.5% | ||||||||
| 2,778 | Avery Dennison Corp. | 607,410 | ||||||
| 15,031 | Avient Corp. | 656,103 | ||||||
| 6,393 | Knife River Corp.* | 448,405 | ||||||
| 3,114 | Reliance, Inc. | 889,358 | ||||||
| 6,208 | RPM International, Inc. | 668,478 | ||||||
| 3,269,754 | ||||||||
| REAL ESTATE — 4.8% | ||||||||
| 2,512 | Jones Lang LaSalle, Inc.* | 515,664 | ||||||
| 27,075 | Kite Realty Group Trust - REIT | 605,939 | ||||||
| 4,664 | Mid-America Apartment Communities, Inc., REIT | 665,133 | ||||||
| 13,709 | Rexford Industrial Realty, Inc. - REIT | 611,284 | ||||||
| 31,931 | Xenia Hotels & Resorts, Inc. - REIT | 457,571 | ||||||
| 2,855,591 | ||||||||
| UTILITIES — 1.9% | ||||||||
| 20,253 | Atlantica Sustainable Infrastructure PLC1 | 444,553 | ||||||
| 17,887 | Essential Utilities, Inc. | 667,722 | ||||||
| 1,112,275 | ||||||||
| TOTAL COMMON STOCKS | ||||||||
| (Cost $49,921,802) | 56,834,383 | |||||||
| Principal Amount | ||||||||
| SHORT-TERM INVESTMENTS — 4.1% | ||||||||
| $ | 2,463,401 | Goldman Sachs FS Government Fund - Institutional Class, 5.14%2 | 2,463,401 | |||||
| TOTAL SHORT-TERM INVESTMENTS | ||||||||
| (Cost $2,463,401) | 2,463,401 | |||||||
| TOTAL INVESTMENTS — 100.0% | ||||||||
| (Cost $52,385,203) | 59,297,784 | |||||||
| Liabilities in Excess of Other Assets — (0.0)% | (21,229 | ) | ||||||
| NET ASSETS — 100.0% | $ | 59,276,555 | ||||||
3
Kennedy Capital ESG SMID Cap Fund
SCHEDULE OF INVESTMENTS - Continued
As of June 30, 2024 (Unaudited)
| PLC – Public Limited Company |
| ADR – American Depository Receipt |
| REIT – Real Estate Investment Trusts |
| * | Non-income producing security. |
| 1 | Foreign security denominated in U.S. Dollars. |
| 2 | The rate is the annualized seven-day yield at period end. |
See accompanying Notes to Financial Statements.
4
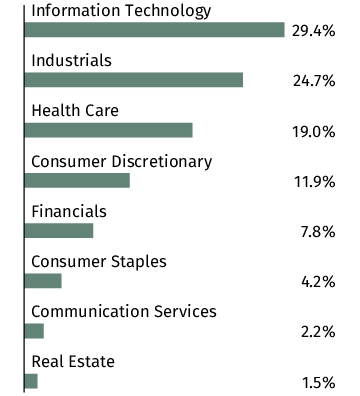
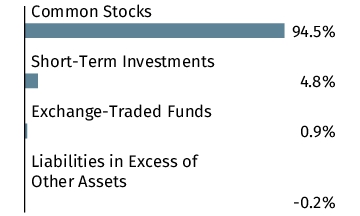
Kennedy Capital Small Cap Growth Fund
SCHEDULE OF INVESTMENTS
As of June 30, 2024 (Unaudited)
| Number of Shares | Value | |||||||
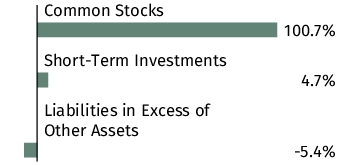
| COMMON STOCKS — 100.7% | ||||||||
| COMMUNICATION SERVICES — 2.2% | ||||||||
| 983 | Magnite, Inc.* | $ | 13,064 | |||||
| CONSUMER DISCRETIONARY — 11.9% | ||||||||
| 161 | Dutch Bros, Inc. - Class A* | 6,665 | ||||||
| 41 | Installed Building Products, Inc. | 8,433 | ||||||
| 48 | Marriott Vacations Worldwide Corp. | 4,191 | ||||||
| 157 | Planet Fitness, Inc. - Class A* | 11,554 | ||||||
| 179 | Skyline Champion Corp.* | 12,127 | ||||||
| 446 | Universal Technical Institute, Inc.* | 7,016 | ||||||
| 47 | Wingstop, Inc. | 19,865 | ||||||
| 69,851 | ||||||||
| CONSUMER STAPLES — 4.2% | ||||||||
| 364 | Chefs' Warehouse, Inc.* | 14,236 | ||||||
| 48 | elf Beauty, Inc.* | 10,115 | ||||||
| 24,351 | ||||||||
| FINANCIALS — 7.8% | ||||||||
| 131 | Axos Financial, Inc.* | 7,487 | ||||||
| 394 | Baldwin Insurance Group, Inc.* | 13,975 | ||||||
| 184 | Shift4 Payments, Inc. - Class A* | 13,496 | ||||||
| 133 | Triumph Financial, Inc.* | 10,873 | ||||||
| 45,831 | ||||||||
| HEALTH CARE — 19.0% | ||||||||
| 111 | 4D Molecular Therapeutics, Inc.* | 2,330 | ||||||
| 52 | Apogee Therapeutics, Inc.* | 2,046 | ||||||
| 86 | Arvinas, Inc.* | 2,289 | ||||||
| 197 | Avadel Pharmaceuticals PLC - ADR* | 2,770 | ||||||
| 388 | Avid Bioservices, Inc.* | 2,770 | ||||||
| 125 | Bicycle Therapeutics PLC - ADR* | 2,530 | ||||||
| 65 | Biohaven, Ltd.*,1 | 2,256 | ||||||
| 105 | Bruker Corp. | 6,700 | ||||||
| 203 | Catalyst Pharmaceuticals, Inc.* | 3,144 | ||||||
| 184 | Edgewise Therapeutics, Inc.* | 3,314 | ||||||
| 99 | Enovis Corp.* | 4,475 | ||||||
| 281 | Evolent Health, Inc. - Class A* | 5,373 | ||||||
| 406 | Fortrea Holdings, Inc.* | 9,476 | ||||||
| 230 | Globus Medical, Inc., Class A* | 15,753 | ||||||
| 86 | Halozyme Therapeutics, Inc.* | 4,503 | ||||||
| 88 | Ionis Pharmaceuticals, Inc.* | 4,194 | ||||||
| 122 | LivaNova PLC*,1 | 6,688 | ||||||
| 281 | Neumora Therapeutics, Inc.* | 2,762 | ||||||
| 11 | OmniAb, Inc. Earnout Shares2 | — | ||||||
| 11 | OmniAb, Inc. Earnout Shares2 | — | ||||||
5
Kennedy Capital Small Cap Growth Fund
SCHEDULE OF INVESTMENTS - Continued
As of June 30, 2024 (Unaudited)
| Number of Shares | Value | |||||||
| COMMON STOCKS (Continued) | ||||||||
| HEALTH CARE (Continued) | ||||||||
| 211 | Option Care Health, Inc.* | $ | 5,845 | |||||
| 219 | Phathom Pharmaceuticals, Inc.* | 2,256 | ||||||
| 130 | Protagonist Therapeutics, Inc.* | 4,504 | ||||||
| 71 | SpringWorks Therapeutics, Inc.* | 2,674 | ||||||
| 243 | Surgery Partners, Inc.* | 5,781 | ||||||
| 208 | Verona Pharma PLC - ADR* | 3,008 | ||||||
| 81 | Viking Therapeutics, Inc.* | 4,294 | ||||||
| 111,735 | ||||||||
| INDUSTRIALS — 24.7% | ||||||||
| 95 | AAON, Inc. | 8,288 | ||||||
| 542 | ACV Auctions, Inc. - Class A* | 9,891 | ||||||
| 556 | Array Technologies, Inc.* | 5,705 | ||||||
| 148 | Casella Waste Systems, Inc. - Class A* | 14,685 | ||||||
| 79 | Chart Industries, Inc.* | 11,403 | ||||||
| 44 | Comfort Systems USA, Inc. | 13,381 | ||||||
| 64 | Crane Co. | 9,279 | ||||||
| 462 | Leonardo DRS, Inc.* | 11,786 | ||||||
| 77 | MasTec, Inc.* | 8,238 | ||||||
| 83 | NV5 Global, Inc.* | 7,716 | ||||||
| 44 | Paylocity Holding Corp.* | 5,801 | ||||||
| 68 | Tetra Tech, Inc. | 13,905 | ||||||
| 92 | Trex Co., Inc.* | 6,819 | ||||||
| 80 | UFP Industries, Inc. | 8,960 | ||||||
| 244 | WillScot Mobile Mini Holdings Corp.* | 9,184 | ||||||
| 145,041 | ||||||||
| INFORMATION TECHNOLOGY — 29.4% | ||||||||
| 120 | ASGN, Inc.* | 10,580 | ||||||
| 36 | CyberArk Software Ltd.*,1 | 9,843 | ||||||
| 319 | DoubleVerify Holdings, Inc.* | 6,211 | ||||||
| 38 | Fabrinet*,1 | 9,302 | ||||||
| 158 | Five9, Inc.* | 6,968 | ||||||
| 631 | Harmonic, Inc.* | 7,427 | ||||||
| 71 | Impinj Inc* | 11,131 | ||||||
| 502 | Informatica, Inc. - Class A* | 15,502 | ||||||
| 59 | Insight Enterprises, Inc.* | 11,703 | ||||||
| 125 | MACOM Technology Solutions Holdings, Inc.* | 13,934 | ||||||
| 229 | Napco Security Technologies, Inc. | 11,896 | ||||||
| 36 | Onto Innovation, Inc.* | 7,904 | ||||||
| 290 | PagerDuty, Inc.* | 6,650 | ||||||
| 295 | SentinelOne, Inc. - Class A* | 6,210 | ||||||
| 70 | SiTime Corp.* | 8,706 | ||||||
| 315 | SMART Global Holdings, Inc.*,1 | 7,204 | ||||||
| 152 | Smartsheet, Inc. - Class A* | 6,700 | ||||||
6
Kennedy Capital Small Cap Growth Fund
SCHEDULE OF INVESTMENTS - Continued
As of June 30, 2024 (Unaudited)
| Number of Shares | Value | |||||||
| COMMON STOCKS (Continued) | ||||||||
| INFORMATION TECHNOLOGY (Continued) | ||||||||
| 418 | Vertex, Inc.* | $ | 15,069 | |||||
| 172,940 | ||||||||
| REAL ESTATE — 1.5% | ||||||||
| 80 | Innovative Industrial Properties, Inc. - REIT | 8,738 | ||||||
| TOTAL COMMON STOCKS | ||||||||
| (Cost $494,199) | 591,551 | |||||||
| Principal Amount | ||||||||
| SHORT-TERM INVESTMENTS — 4.7% | ||||||||
| $ | 27,856 | Goldman Sachs FS Government Fund - Institutional Class, 5.14%3 | 27,856 | |||||
| TOTAL SHORT-TERM INVESTMENTS | ||||||||
| (Cost $27,856) | 27,856 | |||||||
| TOTAL INVESTMENTS — 105.4% | ||||||||
| (Cost $522,055) | 619,407 | |||||||
| Liabilities in Excess of Other Assets — (5.4)% | (31,982 | ) | ||||||
| NET ASSETS — 100.0% | $ | 587,425 | ||||||
| ADR – American Depository Receipt |
| PLC – Public Limited Company |
| REIT – Real Estate Investment Trusts |
| * | Non-income producing security. |
| 1 | Foreign security denominated in U.S. Dollars. |
| 2 | The value of these securities was determined using significant unobservable inputs. These are reported as Level 3 securities in the Fair Value Hierarchy. |
| 3 | The rate is the annualized seven-day yield at period end. |
See accompanying Notes to Financial Statements.
7
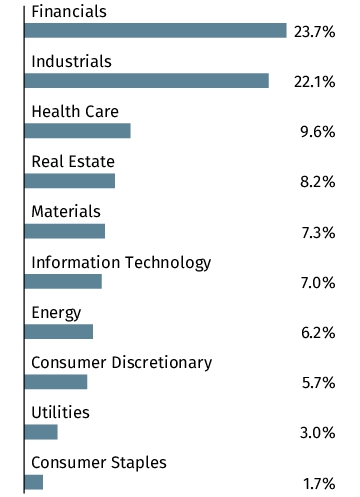
Kennedy Capital Small Cap Value Fund
SCHEDULE OF INVESTMENTS
As of June 30, 2024 (Unaudited)
| Number of Shares | Value | |||||||
| COMMON STOCKS — 94.5% | ||||||||
| CONSUMER DISCRETIONARY — 5.7% | ||||||||
| 1,347 | Brinker International, Inc.* | $ | 97,509 | |||||
| 289 | Cavco Industries, Inc.* | 100,043 | ||||||
| 15,521 | Dana, Inc. | 188,114 | ||||||
| 2,671 | Green Brick Partners, Inc.* | 152,888 | ||||||
| 1,053 | Helen of Troy, Ltd.*,1 | 97,655 | ||||||
| 1,029 | Installed Building Products, Inc. | 211,645 | ||||||
| 2,124 | Johnson Outdoors, Inc. - Class A | 74,298 | ||||||
| 436 | Patrick Industries, Inc. | 47,328 | ||||||
| 3,922 | Steven Madden Ltd. | 165,901 | ||||||
| 1,135,381 | ||||||||
| CONSUMER STAPLES — 1.7% | ||||||||
| 3,731 | BellRing Brands, Inc. - Class A* | 213,189 | ||||||
| 5,232 | Calavo Growers, Inc. | 118,767 | ||||||
| 331,956 | ||||||||
| ENERGY — 6.2% | ||||||||
| 5,156 | ChampionX Corp. | 171,231 | ||||||
| 3,161 | Civitas Resources, Inc. | 218,109 | ||||||
| 2,312 | Helmerich & Payne, Inc. | 83,556 | ||||||
| 6,206 | Northern Oil & Gas, Inc. | 230,677 | ||||||
| 23,150 | Oil States International, Inc.* | 102,786 | ||||||
| 20,636 | ProPetro Holding Corp.* | 178,914 | ||||||
| 5,544 | SM Energy Co. | 239,667 | ||||||
| 1,224,940 | ||||||||
| FINANCIALS — 23.7% | ||||||||
| 4,937 | 1st Source Corp. | 264,722 | ||||||
| 14,160 | Banc of California, Inc. | 180,965 | ||||||
| 8,236 | Bank OZK | 337,676 | ||||||
| 4,182 | BankUnited, Inc. | 122,407 | ||||||
| 2,826 | Cadence Bank | 79,919 | ||||||
| 4,280 | Columbia Banking System, Inc. | 85,129 | ||||||
| 3,552 | Enterprise Financial Services Corp. | 145,312 | ||||||
| 12,368 | First Foundation, Inc. | 81,010 | ||||||
| 4,585 | Five Star Bancorp | 108,435 | ||||||
| 22,375 | Heritage Commerce Corp. | 194,663 | ||||||
| 8,382 | Home BancShares, Inc. | 200,833 | ||||||
| 436 | Houlihan Lokey, Inc. | 58,799 | ||||||
| 2,638 | Lakeland Financial Corp. | 162,290 | ||||||
| 8,279 | National Bank Holdings Corp. - Class A | 323,295 | ||||||
| 6,436 | Origin Bancorp, Inc. | 204,150 | ||||||
| 7,986 | Peapack-Gladstone Financial Corp. | 180,883 | ||||||
| 3,007 | Pinnacle Financial Partners, Inc. | 240,680 | ||||||
| 818 | Piper Sandler Cos. | 188,279 | ||||||
8
Kennedy Capital Small Cap Value Fund
SCHEDULE OF INVESTMENTS - Continued
As of June 30, 2024 (Unaudited)
| Number of Shares | Value | |||||||
| COMMON STOCKS (Continued) | ||||||||
| FINANCIALS (Continued) | ||||||||
| 1,293 | Preferred Bank | $ | 97,609 | |||||
| 2,544 | Selective Insurance Group, Inc. | 238,704 | ||||||
| 1,652 | SouthState Corp. | 126,246 | ||||||
| 4,535 | Stifel Financial Corp. | 381,620 | ||||||
| 3,246 | Texas Capital Bancshares, Inc.* | 198,460 | ||||||
| 5,292 | WaFd, Inc. | 151,245 | ||||||
| 3,462 | Wintrust Financial Corp. | 341,215 | ||||||
| 4,694,546 | ||||||||
| HEALTH CARE — 9.6% | ||||||||
| 15,302 | AdaptHealth Corp.* | 153,020 | ||||||
| 1,446 | Addus HomeCare Corp.* | 167,895 | ||||||
| 11,218 | ADMA Biologics, Inc.* | 125,417 | ||||||
| 2,993 | ANI Pharmaceuticals, Inc.* | 190,594 | ||||||
| 17,759 | Catalyst Pharmaceuticals, Inc.* | 275,087 | ||||||
| 5,725 | Halozyme Therapeutics, Inc.* | 299,761 | ||||||
| 3,212 | LeMaitre Vascular, Inc. | 264,284 | ||||||
| 1,825 | Mesa Laboratories, Inc. | 158,355 | ||||||
| 9,485 | Owens & Minor, Inc.* | 128,048 | ||||||
| 3,013 | Simulations Plus, Inc. | 146,492 | ||||||
| 1,908,953 | ||||||||
| INDUSTRIALS — 22.1% | ||||||||
| 594 | Acuity Brands, Inc. | 143,415 | ||||||
| 1,717 | Alamo Group, Inc. | 297,041 | ||||||
| 18,188 | Aris Water Solutions, Inc. - Class A | 285,006 | ||||||
| 2,536 | Astec Industries, Inc. | 75,218 | ||||||
| 3,719 | AZZ, Inc. | 287,293 | ||||||
| 6,436 | Barnes Group, Inc. | 266,515 | ||||||
| 11,728 | BrightView Holdings, Inc.* | 155,982 | ||||||
| 1,321 | Chart Industries, Inc.* | 190,673 | ||||||
| 5,292 | Enerpac Tool Group Corp. - Class A | 202,049 | ||||||
| 1,050 | Enpro, Inc. | 152,848 | ||||||
| 11,095 | Gates Industrial Corp. PLC*,1 | 175,412 | ||||||
| 4,082 | Gibraltar Industries, Inc.* | 279,821 | ||||||
| 2,889 | Hexcel Corp. | 180,418 | ||||||
| 992 | Huron Consulting Group, Inc.* | 97,712 | ||||||
| 1,863 | IES Holdings, Inc.* | 259,572 | ||||||
| 2,997 | Insteel Industries, Inc. | 92,787 | ||||||
| 851 | Miller Industries, Inc. | 46,822 | ||||||
| 1,710 | Oshkosh Corp. | 185,022 | ||||||
| 1,272 | Simpson Manufacturing Co., Inc. | 214,370 | ||||||
| 1,254 | UFP Industries, Inc. | 140,448 | ||||||
| 675 | Valmont Industries, Inc. | 185,254 | ||||||
| 9,869 | Wabash National Corp. | 215,539 | ||||||
9
Kennedy Capital Small Cap Value Fund
SCHEDULE OF INVESTMENTS - Continued
As of June 30, 2024 (Unaudited)
| Number of Shares | Value | |||||||
| COMMON STOCKS (Continued) | ||||||||
| INDUSTRIALS (Continued) | ||||||||
| 1,595 | WESCO International, Inc. | $ | 252,839 | |||||
| 4,382,056 | ||||||||
| INFORMATION TECHNOLOGY — 7.0% | ||||||||
| 1,360 | Axcelis Technologies, Inc.* | 193,378 | ||||||
| 723 | Belden, Inc. | 67,817 | ||||||
| 17,928 | Cambium Networks Corp.*,1 | 50,019 | ||||||
| 2,018 | Coherent Corp.* | 146,224 | ||||||
| 1,820 | Diodes, Inc.* | 130,913 | ||||||
| 6,164 | Ichor Holdings Ltd.*,1 | 237,622 | ||||||
| 1,611 | Insight Enterprises, Inc.* | 319,558 | ||||||
| 1,265 | Plexus Corp.* | 130,523 | ||||||
| 1,934 | Progress Software Corp. | 104,939 | ||||||
| 1,380,993 | ||||||||
| MATERIALS — 7.3% | ||||||||
| 2,972 | Carpenter Technology Corp. | 325,672 | ||||||
| 1,196 | Eagle Materials, Inc. | 260,082 | ||||||
| 2,307 | H.B. Fuller Co. | 177,547 | ||||||
| 3,978 | Hawkins, Inc. | 361,998 | ||||||
| 1,103 | Materion Corp. | 119,267 | ||||||
| 1,119 | Quaker Chemical Corp. | 189,894 | ||||||
| 1,434,460 | ||||||||
| REAL ESTATE — 8.2% | ||||||||
| 7,067 | Alpine Income Property Trust, Inc. - REIT | 109,963 | ||||||
| 4,972 | American Assets Trust, Inc. - REIT | 111,273 | ||||||
| 5,024 | Community Healthcare Trust, Inc. - REIT | 117,511 | ||||||
| 4,285 | COPT Defense Properties - REIT | 107,254 | ||||||
| 784 | EastGroup Properties, Inc. - REIT | 133,359 | ||||||
| 3,280 | Essential Properties Realty Trust, Inc. - REIT | 90,889 | ||||||
| 10,259 | Hudson Pacific Properties, Inc. - REIT | 49,346 | ||||||
| 10,203 | Kite Realty Group Trust - REIT | 228,343 | ||||||
| 3,324 | National Storage Affiliates Trust - REIT | 137,015 | ||||||
| 3,002 | Phillips Edison & Co., Inc., REIT | 98,196 | ||||||
| 3,683 | PotlatchDeltic Corp. - REIT | 145,073 | ||||||
| 6,065 | UMH Properties, Inc. - REIT | 96,979 | ||||||
| 13,640 | Xenia Hotels & Resorts, Inc. - REIT | 195,461 | ||||||
| 1,620,662 | ||||||||
| UTILITIES — 3.0% | ||||||||
| 1,271 | ALLETE, Inc. | 79,247 | ||||||
| 2,036 | American States Water Co. | 147,753 | ||||||
| 4,539 | Avista Corp. | 157,095 | ||||||
| 1,480 | IDACORP, Inc. | 137,862 | ||||||
10
Kennedy Capital Small Cap Value Fund
SCHEDULE OF INVESTMENTS - Continued
As of June 30, 2024 (Unaudited)
| Number of Shares | Value | |||||||
| COMMON STOCKS (Continued) | ||||||||
| UTILITIES (Continued) | ||||||||
| 3,265 | UGI Corp. | $ | 74,768 | |||||
| 596,725 | ||||||||
| TOTAL COMMON STOCKS | ||||||||
| (Cost $16,798,398) | 18,710,672 | |||||||
| EXCHANGE-TRADED FUNDS — 0.9% | ||||||||
| 1,191 | iShares Russell 2000 Value ETF | 181,389 | ||||||
| TOTAL EXCHANGE-TRADED FUNDS | ||||||||
| (Cost $184,907) | 181,389 | |||||||
| Principal Amount | ||||||||
| SHORT-TERM INVESTMENTS — 4.8% | ||||||||
| $ | 935,338 | Goldman Sachs FS Government Fund - Institutional Class, 5.14%2 | 935,338 | |||||
| TOTAL SHORT-TERM INVESTMENTS | ||||||||
| (Cost $935,338) | 935,338 | |||||||
| TOTAL INVESTMENTS — 100.2% | ||||||||
| (Cost $17,918,643) | 19,827,399 | |||||||
| Liabilities in Excess of Other Assets — (0.2)% | (32,467 | ) | ||||||
| NET ASSETS — 100.0% | $ | 19,794,932 | ||||||
| PLC – Public Limited Company |
| REIT – Real Estate Investment Trusts |
| ETF – Exchange-Traded Fund |
| * | Non-income producing security. |
| 1 | Foreign security denominated in U.S. Dollars. |
| 2 | The rate is the annualized seven-day yield at period end. |
See accompanying Notes to Financial Statements.
11
Kennedy Capital Funds
STATEMENTS OF ASSETS AND LIABILITIES
As of June 30, 2024 (Unaudited)
Kennedy Capital ESG SMID Cap Fund | Kennedy Capital Small Cap Growth Fund | Kennedy Capital Small Cap Value Fund | ||||||||||
| Assets: | ||||||||||||
| Investments, at value (cost $52,385,203, $522,055 and $17,918,643, respectively) | $ | 59,297,784 | $ | 619,407 | $ | 19,827,399 | ||||||
| Receivables: | ||||||||||||
| Investment securities sold | - | - | 45,194 | |||||||||
| Fund shares sold | 16,627 | - | - | |||||||||
| Dividends and interest | 31,618 | 276 | 14,820 | |||||||||
| Due from Advisor | - | 14,933 | 2,072 | |||||||||
| Prepaid expenses | 18,648 | 11,405 | 14,375 | |||||||||
| Total assets | 59,364,677 | 646,021 | 19,903,860 | |||||||||
| Liabilities: | ||||||||||||
| Payables: | ||||||||||||
| Investment securities purchased | - | - | 53,761 | |||||||||
| Offering costs - Advisor | - | 16,685 | 16,685 | |||||||||
| Advisory fees | 18,519 | - | - | |||||||||
| Fund administration and accounting fees | 14,424 | 9,533 | 7,690 | |||||||||
| Transfer agent fees and expenses | 6,262 | 2,470 | 1,883 | |||||||||
| Custody fees | 5,948 | 3,443 | 4,225 | |||||||||
| Trustees' deferred compensation (Note 3) | 19,465 | 7,455 | 7,674 | |||||||||
| Auditing fees | 9,258 | 8,079 | 9,079 | |||||||||
| Legal fees | 5,980 | 8,672 | 4,499 | |||||||||
| Chief Compliance Officer fees | 3,418 | 681 | 699 | |||||||||
| Trustees' fees and expenses | 336 | 887 | 1,296 | |||||||||
| Accrued other expenses | 4,512 | 691 | 1,437 | |||||||||
| Total liabilities | 88,122 | 58,596 | 108,928 | |||||||||
| Commitments and contingencies (Note 3) | ||||||||||||
| Net Assets | $ | 59,276,555 | $ | 587,425 | $ | 19,794,932 | ||||||
| Components of Net Assets: | ||||||||||||
| Paid-in capital (par value of $0.01 per share with an unlimited number of shares authorized) | $ | 54,421,215 | $ | 506,370 | $ | 17,232,191 | ||||||
| Total distributable earnings (accumulated deficit) | 4,855,340 | 81,055 | 2,562,741 | |||||||||
| Net Assets | $ | 59,276,555 | $ | 587,425 | $ | 19,794,932 | ||||||
| Maximum Offering Price per Share: | ||||||||||||
| Institutional Class: | ||||||||||||
| Net assets applicable to shares outstanding | $ | 59,276,555 | $ | 587,425 | $ | 19,794,932 | ||||||
| Shares of beneficial interest issued and outstanding | 3,999,552 | 50,697 | 1,716,098 | |||||||||
| Net asset value, offering and redemption price per share | $ | 14.82 | $ | 11.59 | $ | 11.53 | ||||||
See accompanying Notes to Financial Statements.
12
Kennedy Capital Funds
STATEMENTS OF OPERATIONS
For the Six Months Ended June 30, 2024 (Unaudited)
| Kennedy Capital ESG SMID Cap Fund | Kennedy Capital Small Cap Growth Fund | Kennedy Capital Small Cap Value Fund | ||||||||||
| Investment income: | ||||||||||||
| Dividends (net of foreign withholding taxes of $96, $0 and $0, respectively) | $ | 268,250 | $ | 830 | $ | 148,250 | ||||||
| Interest | 46,573 | 532 | 13,896 | |||||||||
| Total investment income | 314,823 | 1,362 | 162,146 | |||||||||
| Expenses: | ||||||||||||
| Advisory fees | 223,954 | 2,338 | 74,757 | |||||||||
| Fund administration and accounting fees | 50,244 | 45,073 | 47,762 | |||||||||
| Transfer agent fees and expenses | 17,494 | 6,007 | 7,078 | |||||||||
| Custody fees | 7,472 | 3,717 | 4,327 | |||||||||
| Registration fees | 14,129 | 4,395 | 6,835 | |||||||||
| Auditing fees | 8,477 | 7,979 | 7,979 | |||||||||
| Trustees' fees and expenses | 7,465 | 5,121 | 6,895 | |||||||||
| Miscellaneous | 7,462 | 2,992 | 2,839 | |||||||||
| Shareholder reporting fees | 6,296 | 5,492 | 5,530 | |||||||||
| Chief Compliance Officer fees | 3,155 | 3,991 | 4,006 | |||||||||
| Insurance fees | 1,976 | 2,712 | 1,794 | |||||||||
| Legal fees | 1,610 | 3,428 | 879 | |||||||||
| Excise tax expense | 188 | 1 | 10 | |||||||||
| Total expenses | 349,922 | 93,246 | 170,691 | |||||||||
| Advisory fees recovered (waived) | (104,878 | ) | (2,338 | ) | (74,757 | ) | ||||||
| Other expenses reimbursed | - | (88,369 | ) | (14,786 | ) | |||||||
| Net expenses | 245,044 | 2,539 | 81,148 | |||||||||
| Net investment income (loss) | 69,779 | (1,177 | ) | 80,998 | ||||||||
| Realized and Unrealized Gain (Loss): | ||||||||||||
| Net realized gain (loss) on investments | 78,995 | 16,789 | 460,950 | |||||||||
| Net change in unrealized appreciation (depreciation) on investments | 600,423 | 17,723 | 2,581 | |||||||||
| Net realized and unrealized gain (loss) | 679,418 | 34,512 | 463,531 | |||||||||
| Net Increase (Decrease) in Net Assets from Operations | $ | 749,197 | $ | 33,335 | $ | 544,529 | ||||||
See accompanying Notes to Financial Statements.
13
Kennedy Capital ESG SMID Cap Fund
STATEMENTS OF CHANGES IN NET ASSETS
| For the Six Months Ended June 30, 2024 (Unaudited) | For the Year Ended December 31, 2023 | |||||||
| Increase (Decrease) in Net Assets from: | ||||||||
| Operations: | ||||||||
| Net investment income (loss) | $ | 69,779 | $ | 169,446 | ||||
| Net realized gain (loss) on investments | 78,995 | (1,703,470 | ) | |||||
| Net change in unrealized appreciation (depreciation) on investments | 600,423 | 9,143,891 | ||||||
| Net increase (decrease) in net assets resulting from operations | 749,197 | 7,609,867 | ||||||
| Distributions to Shareholders: | ||||||||
| Institutional Class | - | (164,162 | ) | |||||
| Total distributions to shareholders | - | (164,162 | ) | |||||
| Capital Transactions: | ||||||||
| Net proceeds from shares sold: | ||||||||
| Institutional Class | 4,119,953 | 12,627,508 | ||||||
| Reinvestment of distributions: | ||||||||
| Institutional Class | - | 135,105 | ||||||
| Cost of shares redeemed: | ||||||||
| Institutional Class | (3,335,610 | ) | (1,355,821 | ) | ||||
| Net increase (decrease) in net assets from capital transactions | 784,343 | 11,406,792 | ||||||
| Total increase (decrease) in net assets | 1,533,540 | 18,852,497 | ||||||
| Net Assets: | ||||||||
| Beginning of period | 57,743,015 | 38,890,518 | ||||||
| End of period | $ | 59,276,555 | $ | 57,743,015 | ||||
| Capital Share Transactions: | ||||||||
| Shares sold: | ||||||||
| Institutional Class | 279,148 | 949,939 | ||||||
| Shares reinvested: | ||||||||
| Institutional Class | - | 9,869 | ||||||
| Shares redeemed: | ||||||||
| Institutional Class | (225,225 | ) | (103,303 | ) | ||||
| Net increase (decrease) in capital share transactions | 53,923 | 856,505 | ||||||
See accompanying Notes to Financial Statements.
14
Kennedy Capital Small Cap Growth Fund
STATEMENTS OF CHANGES IN NET ASSETS
| For the Six Months Ended June 30, 2024 (Unaudited) | For the Year Ended December 31, 2023 | |||||||
| Increase (Decrease) in Net Assets from: | ||||||||
| Operations: | ||||||||
| Net investment income (loss) | $ | (1,177 | ) | $ | (1,366 | ) | ||
| Net realized gain (loss) on investments | 16,789 | (22,863 | ) | |||||
| Net change in unrealized appreciation (depreciation) on investments | 17,723 | 102,832 | ||||||
| Net increase (decrease) in net assets resulting from operations | 33,335 | 78,603 | ||||||
| Distributions to Shareholders: | ||||||||
| Institutional Class | - | (2,185 | ) | |||||
| Total distributions to shareholders | - | (2,185 | ) | |||||
| Capital Transactions: | ||||||||
| Reinvestment of distributions: | ||||||||
| Institutional Class | - | 2,185 | ||||||
Net increase (decrease) in net assets from capital transactions | - | 2,185 | ||||||
| Total increase (decrease) in net assets | 33,335 | 78,603 | ||||||
| Net Assets: | ||||||||
| Beginning of period | 554,090 | 475,487 | ||||||
| End of period | $ | 587,425 | $ | 554,090 | ||||
| Capital Share Transactions: | ||||||||
| Shares reinvested: | ||||||||
| Institutional Class | - | 217 | ||||||
| Net increase (decrease) in capital share transactions | - | 217 | ||||||
See accompanying Notes to Financial Statements.
15
Kennedy Capital Small Cap Value Fund
STATEMENTS OF CHANGES IN NET ASSETS
For the | For the | |||||||
| Increase (Decrease) in Net Assets from: | ||||||||
| Operations: | ||||||||
| Net investment income (loss) | $ | 80,998 | $ | 125,558 | ||||
| Net realized gain (loss) on investments | 460,950 | 237,364 | ||||||
| Net change in unrealized appreciation (depreciation) on investments | 2,581 | 1,987,899 | ||||||
| Net increase (decrease) in net assets resulting from operations | 544,529 | 2,350,821 | ||||||
| Distributions to Shareholders: | ||||||||
| Institutional Class | - | (260,461 | ) | |||||
| Total distributions to shareholders | - | (260,461 | ) | |||||
| Capital Transactions: | ||||||||
| Net proceeds from shares sold: | ||||||||
| Institutional Class | 4,054,934 | 7,798,896 | ||||||
| Reinvestment of distributions: | ||||||||
| Institutional Class | - | 257,531 | ||||||
| Cost of shares redeemed: | ||||||||
| Institutional Class | (47,373 | ) | (518,558 | ) | ||||
| Net increase (decrease) in net assets from capital transactions | 4,007,561 | 7,537,869 | ||||||
| Total increase (decrease) in net assets | 4,552,090 | 9,628,229 | ||||||
| Net Assets: | ||||||||
| Beginning of period | 15,242,842 | 5,614,613 | ||||||
| End of period | $ | 19,794,932 | $ | 15,242,842 | ||||
| Capital Share Transactions: | ||||||||
| Shares sold: | ||||||||
| Institutional Class | 367,081 | 809,454 | ||||||
| Shares reinvested: | ||||||||
| Institutional Class | - | 24,387 | ||||||
| Shares redeemed: | ||||||||
| Institutional Class | (4,235 | ) | (51,418 | ) | ||||
| Net increase (decrease) in capital share transactions | 362,846 | 782,423 | ||||||
See accompanying Notes to Financial Statements.
16
FINANCIAL HIGHLIGHTS
Kennedy Capital ESG SMID Cap Fund
Institutional Class
Per share operating performance.
For a capital share outstanding throughout each period.
For the | For the Year Ended December 31, | For the Period | ||||||||||||||||||||||
2023 | 2022 | 2021 | 2020 | 2019 | ||||||||||||||||||||
| Net asset value, beginning of period | $ | 14.63 | $ | 12.59 | $ | 15.39 | $ | 13.11 | $ | 10.86 | $ | 10.00 | ||||||||||||
| Income from Investment Operations: | ||||||||||||||||||||||||
| Net investment income (loss)1 | 0.02 | 0.05 | - | 2 | (0.01 | ) | - | 2 | 0.01 | |||||||||||||||
| Net realized and unrealized gain (loss) | 0.17 | 2.03 | (2.74 | ) | 3.31 | 2.28 | 0.87 | |||||||||||||||||
| Total from investment operations | 0.19 | 2.08 | (2.74 | ) | 3.30 | 2.28 | 0.88 | |||||||||||||||||
| Less Distributions: | ||||||||||||||||||||||||
| From net investment income | - | (0.04 | ) | (0.01 | ) | - | (0.03 | ) | (0.02 | ) | ||||||||||||||
| From net realized gain | - | - | (0.05 | ) | (1.02 | ) | - | - | ||||||||||||||||
| Total distributions | - | (0.04 | ) | (0.06 | ) | (1.02 | ) | (0.03 | ) | (0.02 | ) | |||||||||||||
| Net asset value, end of period | $ | 14.82 | $ | 14.63 | $ | 12.59 | $ | 15.39 | $ | 13.11 | $ | 10.86 | ||||||||||||
| Total return3 | 1.30 | %4 | 16.56 | % | (17.82 | )% | 25.47 | % | 20.98 | % | 8.83 | %4 | ||||||||||||
| Ratios and Supplemental Data: | ||||||||||||||||||||||||
| Net assets, end of period (in thousands) | $ | 59,277 | $ | 57,743 | $ | 38,891 | $ | 13,327 | $ | 6,368 | $ | 1,390 | ||||||||||||
| Ratio of expenses to average net assets (including excise tax expense): | ||||||||||||||||||||||||
| Before fees waived and expenses absorbed/recovered | 1.17 | %5,6 | 1.28 | % | 1.52 | % | 2.49 | % | 15.92 | % | 19.45 | %5 | ||||||||||||
| After fees waived and expenses absorbed/recovered | 0.82 | %5,6 | 0.82 | % | 0.82 | % | 0.82 | % | 0.82 | % | 0.82 | %5 | ||||||||||||
| Ratio of net investment income (loss) to average net assets (including excise tax expense): | ||||||||||||||||||||||||
| Before fees waived and expenses absorbed/recovered | (0.12 | )%5 | (0.08 | )% | (0.71 | )% | (1.75 | )% | (15.08 | )% | (18.53 | )%5 | ||||||||||||
| After fees waived and expenses absorbed/recovered | 0.23 | %5 | 0.38 | % | (0.01 | )% | (0.08 | )% | 0.02 | % | 0.10 | %5 | ||||||||||||
| Portfolio turnover rate | 35 | %4 | 58 | % | 50 | % | 87 | % | 63 | % | 27 | %4 | ||||||||||||
| * | Commencement of operations. |
| 1 | Based on average shares outstanding for the period. |
| 2 | Amount represents less than $0.01 per share. |
| 3 | Total returns would have been lower had certain expenses not been waived or absorbed by the Advisor. Returns shown do not reflect the deduction of taxes that a shareholder would pay on Fund distributions or redemption of Fund shares. |
| 4 | Not annualized. |
| 5 | Annualized. |
| 6 | If excise tax expense had been excluded, the expense ratios would have been lowered by 0.00% for the six months ended June 30, 2024. |
See accompanying Notes to Financial Statements.
17
FINANCIAL HIGHLIGHTS
Kennedy Capital Small Cap Growth Fund
Institutional Class
Per share operating performance.
For a capital share outstanding throughout each period.
For the | For the Year | For the Period | ||||||||||
| Net asset value, beginning of period | $ | 10.93 | $ | 9.42 | $ | 10.00 | ||||||
| Income from Investment Operations: | ||||||||||||
| Net investment income (loss)1 | (0.02 | ) | (0.03 | ) | (0.04 | ) | ||||||
| Net realized and unrealized gain (loss) | 0.68 | 1.58 | (0.45 | ) | ||||||||
| Total from investment operations | 0.66 | 1.55 | (0.49 | ) | ||||||||
| Less Distributions: | ||||||||||||
| From net investment income | - | (0.04 | ) | (- | )2 | |||||||
| From net realized gain | - | - | (0.09 | ) | ||||||||
| Total distributions | - | (0.04 | ) | (0.09 | ) | |||||||
| Net asset value, end of period | $ | 11.59 | $ | 10.93 | $ | 9.42 | ||||||
| Total return3 | 6.04 | %4 | 16.53 | % | (4.89 | )%4 | ||||||
| Ratios and Supplemental Data: | ||||||||||||
| Net assets, end of period (in thousands) | $ | 587 | $ | 554 | $ | 475 | ||||||
| Ratio of expenses to average net assets (including excise tax expense): | ||||||||||||
| Before fees waived and expenses absorbed/recovered | 32.68 | %5,6 | 33.44 | % | 37.88 | %5 | ||||||
| After fees waived and expenses absorbed/recovered | 0.89 | %5,6 | 0.89 | % | 0.89 | %5 | ||||||
| Ratio of net investment income (loss) to average net assets (including excise tax expense): | ||||||||||||
| Before fees waived and expenses absorbed/recovered | (32.21 | )%5 | (32.82 | )% | (37.59 | )%5 | ||||||
| After fees waived and expenses absorbed/recovered | (0.42 | )%5 | (0.27 | )% | (0.60 | )%5 | ||||||
| Portfolio turnover rate | 21 | %4 | 37 | % | 17 | %4 | ||||||
| * | Commencement of operations. |
| 1 | Based on average shares outstanding for the period. |
| 2 | Amount represents less than $0.01 per share. |
| 3 | Total returns would have been lower had certain expenses not been waived or absorbed by the Advisor. Returns shown do not reflect the deduction of taxes that a shareholder would pay on Fund distributions or redemption of Fund shares. |
| 4 | Not annualized. |
| 5 | Annualized. |
| 6 | If excise tax expense had been excluded, the expense ratios would have been lowered by 0.00% for the six months ended June 30, 2024. |
See accompanying Notes to Financial Statements.
18
FINANCIAL HIGHLIGHTS
Kennedy Capital Small Cap Value Fund
Institutional Class
Per share operating performance.
For a capital share outstanding throughout each period.
For the | For the | For the Period | ||||||||||
| Net asset value, beginning of period | $ | 11.26 | $ | 9.84 | $ | 10.00 | ||||||
| Income from Investment Operations: | ||||||||||||
| Net investment income (loss)1 | 0.05 | 0.12 | 0.08 | |||||||||
| Net realized and unrealized gain (loss) | 0.22 | 1.50 | (0.11 | ) | ||||||||
| Total from investment operations | 0.27 | 1.62 | (0.03 | ) | ||||||||
| Less Distributions: | ||||||||||||
| From net investment income | - | (0.09 | ) | (0.03 | ) | |||||||
| From net realized gain | - | (0.11 | ) | (0.10 | ) | |||||||
| Total distributions | - | (0.20 | ) | (0.13 | ) | |||||||
| Net asset value, end of period | $ | 11.53 | $ | 11.26 | $ | 9.84 | ||||||
| Total return2 | 2.40 | %3 | 16.55 | % | (0.34 | )%3 | ||||||
| Ratios and Supplemental Data: | ||||||||||||
| Net assets, end of period (in thousands) | $ | 19,795 | $ | 15,243 | $ | 5,615 | ||||||
| Ratio of expenses to average net assets (including excise tax expense): | ||||||||||||
| Before fees waived and expenses absorbed/recovered | 1.87 | %4,5 | 2.41 | % | 10.08 | %4 | ||||||
| After fees waived and expenses absorbed/recovered | 0.89 | %4,5 | 0.89 | % | 0.89 | %4 | ||||||
| Ratio of net investment income (loss) to average net assets (including excise tax expense): | ||||||||||||
| Before fees waived and expenses absorbed/recovered | (0.09 | )%4 | (0.37 | )% | (8.06 | )%4 | ||||||
| After fees waived and expenses absorbed/recovered | 0.89 | %4 | 1.15 | % | 1.13 | %4 | ||||||
| Portfolio turnover rate | 28 | %3 | 50 | % | 220 | %3 | ||||||
| * | Commencement of operations. |
| 1 | Based on average shares outstanding for the period. |
| 2 | Total returns would have been lower had certain expenses not been waived or absorbed by the Advisor. Returns shown do not reflect the deduction of taxes that a shareholder would pay on Fund distributions or redemption of Fund shares. |
| 3 | Not annualized. |
| 4 | Annualized. |
| 5 | If excise tax expense had been excluded, the expense ratios would have been lowered by 0.00% for the six months ended June 30, 2024. |
See accompanying Notes to Financial Statements.
19
Kennedy Capital Funds
NOTES TO FINANCIAL STATEMENTS
June 30, 2024 (Unaudited)
Note 1 – Organization
Kennedy Capital ESG SMID Cap Fund (the ‘‘ESG SMID Cap Fund”), Kennedy Capital Small Cap Growth Fund (the “Small Cap Growth Fund”), and Kennedy Capital Small Cap Value Fund (the “Small Cap Value Fund”) are organized as a diversified series of Investment Managers Series Trust II, a Delaware statutory trust (the “Trust”) which is registered as an open-end management investment company under the Investment Company Act of 1940, as amended (the “1940 Act”).
The Kennedy Capital ESG SMID Cap Fund’s investment objective is capital appreciation. The Fund currently offers two classes of shares: Investor Class and Institutional Class. The Fund’s Institutional Class shares commenced operations on June 28, 2019. The Fund’s Investor Class shares are not currently available for purchase.
The Kennedy Capital Small Cap Growth Fund’s investment objective is capital appreciation. The Fund currently offers two classes of shares: Investor Class and Institutional Class. The Fund’s Institutional Class shares commenced operations on April 27, 2022. The Fund’s Investor Class shares are not currently available for purchase.
The Kennedy Capital Small Cap Value Fund’s investment objective is capital appreciation. The Fund currently offers two classes of shares: Investor Class and Institutional Class. The Fund’s Institutional Class shares commenced operations on April 27, 2022. The Fund’s Investor Class shares are not currently available for purchase.
With regards to the ESG SMID Cap Fund, the Small Cap Growth Fund, and the Small Cap Value Fund, the shares of each class represent an interest in the same portfolio of investments of the Fund and have equal rights as to voting, redemptions, dividends and liquidation, subject to the approval of the Trustees. Income, expenses (other than expenses attributable to a specific class) and realized and unrealized gains and losses on investments are allocated to each class of shares in proportion to their relative net assets. Shareholders of a class that bears distribution and service expenses under the terms of a distribution plan have exclusive voting rights to that distribution plan.
Each Fund is an investment company and accordingly follows the investment company accounting and reporting guidance of the Financial Accounting Standards Board (FASB) Accounting Standard Codification Topic 946 “Financial Services—Investment Companies”.
Note 2 – Accounting Policies
The following is a summary of the significant accounting policies consistently followed by the Funds in the preparation of its financial statements. The preparation of financial statements in conformity with accounting principles generally accepted in the United States of America (“GAAP”) requires management to make estimates and assumptions that affect the reported amounts and disclosures in the financial statements. Actual results could differ from these estimates.
(a) Valuation of Investments
The Funds value equity securities at the last reported sale price on the principal exchange or in the principal over the counter (“OTC”) market in which such securities are traded, as of the close of regular trading on the NYSE on the day the securities are being valued or, if the last-quoted sales price is not readily available, the securities will be valued at the last bid or the mean between the last available bid and ask price. Securities traded on the NASDAQ are valued at the NASDAQ Official Closing Price (“NOCP”). Investments in open-end investment companies are valued at the daily closing net asset value of the respective investment company. Debt securities are valued by utilizing a price supplied by independent pricing service providers. The independent pricing service providers may use various valuation methodologies including matrix pricing and other analytical pricing models as well as market transactions and dealer quotations. These models generally consider such factors as yields or prices of bonds of comparable quality, type of issue, coupon, maturity, ratings and general market conditions. If a price is not readily available for a portfolio security, the security will be valued at fair value (the amount which the Funds’ might reasonably expect to receive for the security upon its current sale). The Board of Trustees has designated the Advisor as the Funds’ valuation designee (the “Valuation Designee”) to make all fair value determinations with respect to the Funds’ portfolio investments, subject to the Board’s oversight. As the Valuation Designee, the Advisor has adopted and implemented policies and procedures to be followed when the Funds’ must utilize fair value pricing.
20
Kennedy Capital Funds
NOTES TO FINANCIAL STATEMENTS - Continued
June 30, 2024 (Unaudited)
(b) Investment Transactions, Investment Income and Expenses
Investment transactions are accounted for on the trade date. Realized gains and losses on investments are determined on the identified cost basis. Dividend income is recorded net of applicable withholding taxes on the ex-dividend date and interest income is recorded on an accrual basis. Withholding taxes on foreign dividends, if applicable, are paid (a portion of which may be reclaimable) or provided for in accordance with the applicable country’s tax rules and rates and are disclosed in the Statements of Operations. Withholding tax reclaims are filed in certain countries to recover a portion of the amounts previously withheld. The Funds record a reclaim receivable based on a number of factors, including a jurisdiction’s legal obligation to pay reclaims as well as payment history and market convention. Income and expenses of the Funds are allocated on a pro rata basis to each class of shares relative net assets, except for distribution and service fees which are unique to each class of shares. Expenses incurred by the Trust with respect to more than one Fund are allocated in proportion to the net assets of each Fund except where allocation of direct expenses to each Fund or an alternative allocation method can be more appropriately made.
(c) Federal Income Taxes
The Funds intend to comply with the requirements of Subchapter M of the Internal Revenue Code applicable to regulated investment companies and to distribute substantially all of their net investment income and any net realized gains to their shareholders. Therefore, no provision is made for federal income or excise taxes. Due to the timing of dividend distributions and the differences in accounting for income and realized gains and losses for financial statement and federal income tax purposes, the fiscal year in which amounts are distributed may differ from the year in which the income and realized gains and losses are recorded by the Funds.
Accounting for Uncertainty in Income Taxes (the “Income Tax Statement”) requires an evaluation of tax positions taken (or expected to be taken) in the course of preparing a Fund’s tax returns to determine whether these positions meet a “more-likely-than-not” standard that, based on the technical merits, have a more than fifty percent likelihood of being sustained by a taxing authority upon examination. A tax position that meets the “more-likely-than-not” recognition threshold is measured to determine the amount of benefit to recognize in the financial statements. The Funds recognize interest and penalties, if any, related to unrecognized tax benefits as income tax expense in the Statements of Operations.
The Income Tax Statement requires management of the Funds to analyze tax positions taken in the prior three open tax years, if any, and tax positions expected to be taken in the Funds’ current tax year, as defined by the IRS statute of limitations for all major jurisdictions, including federal tax authorities and certain state tax authorities. As of and during the years ended December 31, 2020 through December 31, 2023, the Funds did not have a liability for any unrecognized tax benefits. The Funds have no examinations in progress and are not aware of any tax positions for which it is reasonably possible that the total amounts of unrecognized tax benefits will significantly change in the next twelve months.
21
Kennedy Capital Funds
NOTES TO FINANCIAL STATEMENTS - Continued
June 30, 2024 (Unaudited)
(d) Distributions to Shareholders
The Funds will make distributions of net investment income and net capital gains, if any, at least annually, typically in December. Distributions to shareholders are recorded on the ex-dividend date. The amount and timing of distributions are determined in accordance with federal income tax regulations, which may differ from GAAP.
The character of distributions made during the year from net investment income or net realized gains may differ from the characterization for federal income tax purposes due to differences in the recognition of income, expense and gain (loss) items for financial statement and tax purposes.
(e) Illiquid Securities
Pursuant to Rule 22e-4 under the 1940 Act, the Funds have adopted a Liquidity Risk Management Program (“LRMP”) that requires, among other things, that the Funds limit their illiquid investments that are assets to no more than 15% of net assets. An illiquid investment is any security which may not reasonably be expected to be sold or disposed of in current market conditions in seven calendar days or less without the sale or disposition significantly changing the market value of the investment. If the Advisor, at any time, determines that the value of illiquid securities held by a Fund exceeds 15% of its net asset value, the Advisor will take such steps as it considers appropriate to reduce them as soon as reasonably practicable in accordance with the Fund’s written LRMP.
Note 3 – Investment Advisory and Other Agreements
The Trust, on behalf of the Funds, entered into an Investment Advisory Agreement (the “Agreement”) with Kennedy Capital Management LLC (the “Advisor”). Under the terms of the Agreement, the Funds pay a monthly investment advisory fee to the Advisor based on each Fund’s average daily net assets. The annual rates are listed by Fund in the table below. The Advisor has contractually agreed to waive its fees and/or pay for operating expenses of the Funds to ensure that total annual fund operating expenses (excluding any taxes, leverage interest, brokerage commissions, dividend and interest expenses on short sales, acquired fund fees and expenses (as determined in accordance with SEC Form N-1A), expenses incurred in connection with any merger or reorganization, and extraordinary expenses such as litigation expenses) do not exceed the following levels of each Fund’s average daily net assets of the Institutional Class shares. This agreement is in effect until April 30, 2025, and it may be terminated before that date only by the Trust’s Board of Trustees. The table below contains the investment advisory fee annual rate and the expense cap by Fund and by Class:
Investment Advisory | Total Limit on Annual Operating Expenses | |
| Fees | Institutional Class | |
| ESG SMID Cap Fund | 0.75% | 0.82% |
| Small Cap Growth Fund | 0.82% | 0.89% |
| Small Cap Value Fund | 0.82% | 0.89% |
For the six months ended June 30, 2024, the Advisor waived its advisory fees and absorbed other expenses totaling $104,878, $90,707, and $89,543 for the ESG SMID Cap Fund, Small Cap Growth Fund, and Small Cap Value Fund, respectively. The Advisor is permitted to seek reimbursement from each Fund, subject to certain limitations, of fees waived or payments made to the Fund for a period ending three full years after the date of the waiver or payment. This reimbursement may be requested from the Fund if the reimbursement will not cause the Fund’s annual expense ratio to exceed the lesser of (a) the expense limitation amount in effect at the time such fees were waived or payments made, or (b) the expense limitation amount in effect at the time of the reimbursement. At June 30, 2024, the amount of these potentially recoverable expenses was $743,809, $374,692, and $375,249 for the ESG SMID Cap Fund, Small Cap Growth Fund, and Small Cap Value Fund, respectively. The potential recoverable amount is noted as "Commitments and contingencies" as reported on the Statements of Assets and Liabilities. The Advisor may recapture all or a portion of this amount no later than December 31 of the years stated below:
22
Kennedy Capital Funds
NOTES TO FINANCIAL STATEMENTS - Continued
June 30, 2024 (Unaudited)
| ESG SMID Cap Fund | Small Cap Growth Fund | Small Cap Value Fund | |||||||||||
| 2024 | 214,965 | - | - | ||||||||||
| 2025 | 216,728 | 120,070 | 120,419 | ||||||||||
| 2026 | 207,238 | 163,915 | 165,287 | ||||||||||
| 2027 | 104,878 | 90,707 | 89,543 | ||||||||||
| Total | $ | 743,809 | $ | 374,692 | $ | 375,249 | |||||||
UMB Fund Services, Inc. (“UMBFS”) serves as the Funds’ fund accountant, transfer agent and co-administrator; and Mutual Fund Administration, LLC (“MFAC”) serves as the Funds’ other co-administrator. UMB Bank, n.a., an affiliate of UMBFS, serves as the Funds’ custodian.
IMST Distributors, LLC, a wholly owned subsidiary of Foreside Financial Group, LLC (d/b/a ACA Group), serves as the Funds’ distributor (the “Distributor”). The Distributor does not receive compensation from the Funds for its distribution services; the Advisor pays the Distributor a fee for its distribution-related services.
Certain trustees and officers of the Trust are employees of UMBFS or MFAC. The Funds do not compensate trustees and officers affiliated with the Funds’ co-administrators. For the six months ended June 30, 2024, the Funds’ allocated fees incurred to Trustees who are not affiliated with the Funds’ co-administrators are reported on the Statements of Operations.
The Funds’ Board of Trustees has adopted a Deferred Compensation Plan (the “Plan”) for the Independent Trustees that enables Trustees to elect to receive payment in cash or the option to select various fund(s) in the Trust in which their deferred accounts shall be deemed to be invested. If a trustee elects to defer payment, the Plan provides for the creation of a deferred payment account. The Funds’ liability for these amounts is adjusted for market value changes in the invested fund(s) and remains a liability to the Fund until distributed in accordance with the Plan. The Trustees Deferred compensation liability under the Plan constitutes a general unsecured obligation of each Fund and will be disclosed in the Statements of Assets and Liabilities. Contributions made under the plan and the change in unrealized appreciation/depreciation and income will be included in the Trustees’ fees and expenses in the Statements of Operations.
Dziura Compliance Consulting, LLC provides Chief Compliance Officer (“CCO”) services to the Trust. The Funds’ allocated fees incurred for CCO services for the six months ended June 30, 2024 are reported on the Statements of Operations.
23
Kennedy Capital Funds
NOTES TO FINANCIAL STATEMENTS - Continued
June 30, 2024 (Unaudited)
Note 4 – Federal Income Taxes
At June 30, 2024, gross unrealized appreciation and depreciation on investments based on cost for federal income tax purposes were as follows:
ESG SMID Cap Fund | Small Cap Growth Fund | Small Cap Value Fund | ||||||||||
| Cost of investments | $ | 52,778,106 | $ | 522,073 | $ | 17,927,145 | ||||||
| Gross unrealized appreciation | $ | 8,655,638 | $ | 151,345 | $ | 2,869,669 | ||||||
| Gross unrealized depreciation | (2,135,960 | ) | (54,011 | ) | (969,415 | ) | ||||||
| Net unrealized appreciation (depreciation) on investments | $ | 6,519,678 | $ | 97,334 | $ | 1,900,254 | ||||||
The difference between cost amounts for financial statements and federal income tax purposes is due primarily to timing differences in recognizing certain gains and losses in security transactions.
As of December 31, 2023, the components of accumulated earnings (deficit) on a tax basis were as follows:
ESG SMID Cap Fund | Small Cap Growth Fund | Small Cap Value Fund | ||||||||||
| Undistributed ordinary income | $ | 1,027 | $ | 716 | $ | 30,948 | ||||||
| Undistributed long-term gains | - | - | 95,116 | |||||||||
| Tax accumulated earnings | 1,027 | 716 | 126,064 | |||||||||
| Accumulated capital and other losses | $ | (1,797,021 | ) | $ | (26,941 | ) | $ | - | ||||
| Unrealized appreciation (depreciation) on investments | 5,919,255 | 79,282 | 1,897,673 | |||||||||
| Unrealized deferred compensation | (17,117 | ) | (5,337 | ) | (5,524 | ) | ||||||
| Total accumulated earnings (deficit) | $ | 4,106,144 | $ | 47,720 | $ | 2,018,213 | ||||||
The tax character of the distributions paid during the fiscal years ended December 31, 2023 and December 31, 2022 were as follows:
| ESG SMID Cap Fund | Small Cap Growth Fund | Small Cap Value Fund | ||||||||||||||||||||||
| 2023 | 2022 | 2023 | 2022 | 2023 | 2022 | |||||||||||||||||||
| Distributions paid from: | ||||||||||||||||||||||||
| Ordinary income | $ | 164,162 | $ | 118,992 | $ | 2,185 | $ | 4,488 | $ | 245,119 | $ | 72,700 | ||||||||||||
| Long-term capital gains | - | 59,041 | - | 222 | 15,342 | 292 | ||||||||||||||||||
| Total distributions paid | $ | 164,162 | $ | 178,033 | $ | 2,185 | $ | 4,670 | $ | 260,461 | $ | 72,992 | ||||||||||||
24
Kennedy Capital Funds
NOTES TO FINANCIAL STATEMENTS - Continued
June 30, 2024 (Unaudited)
Note 5 – Investment Transactions
For the six months ended June 30, 2024, purchases and sales of investments, excluding short-term investments, were as follows:
| Purchases | Sales | |||||||
| ESG SMID Cap Fund | $ | 20,739,584 | $ | 20,631,424 | ||||
| Small Cap Growth Fund | 126,166 | 153,265 | ||||||
| Small Cap Value Fund | 8,397,090 | 4,993,161 | ||||||
Note 6 – Distribution Plan
The Trust, on behalf of each Fund, has adopted a Rule 12b-1 plan with respect to its Investor Class shares. Under the plan, the Fund pays to the Distributor distribution fees in connection with the sale and distribution of the Fund’s Investor Class shares and/or administrative service fees in connection with the provision of ongoing services to shareholders and the maintenance of shareholder accounts.
For Investor Class shares, the maximum annual fee payable to the Distributor for such distribution and/or administrative services is 0.25% of the average daily net assets of such shares. As of June 30, 2024, the Investor Class shares had not commenced operations. Institutional Class shares are not subject to any distribution or service fees under the plan.
Note 7 – Indemnifications
In the normal course of business, the Funds enter into contracts that contain a variety of representations, which provide general indemnifications. The Funds’ maximum exposure under these arrangements is unknown, as this would involve future claims that may be made against the Funds that have not yet occurred. However, the Funds expects the risk of loss to be remote.
Note 8 – Fair Value Measurements and Disclosure
Fair Value Measurements and Disclosures defines fair value, establishes a framework for measuring fair value in accordance with GAAP, and expands disclosure about fair value measurements. It also provides guidance on determining when there has been a significant decrease in the volume and level of activity for an asset or a liability, when a transaction is not orderly, and how that information must be incorporated into a fair value measurement.
Under Fair Value Measurements and Disclosures, various inputs are used in determining the value of each Fund’s investments. These inputs are summarized into three broad Levels as described below:
| ● | Level 1 – Unadjusted quoted prices in active markets for identical assets or liabilities that the Fund has the ability to access. | |
| ● | Level 2 – Observable inputs other than quoted prices included in level 1 that are observable for the asset or liability, either directly or indirectly. These inputs may include quoted prices for the identical instrument on an inactive market, prices for similar instruments, interest rates, prepayment speeds, credit risk, yield curves, default rates and similar data. | |
| ● | Level 3 – Unobservable inputs for the asset or liability, to the extent relevant observable inputs are not available; representing the Fund’s own assumptions about the assumptions a market participant would use in valuing the asset or liability, and would be based on the best information available. |
The availability of observable inputs can vary from security to security and is affected by a wide variety of factors, including, for example, the type of security, whether the security is new and not yet established in the marketplace, the liquidity of markets, and other characteristics particular to the security. To the extent that valuation is based on models or inputs that are less observable or unobservable in the market, the determination of fair value requires more judgment. Accordingly, the degree of judgment exercised in determining fair value is greatest for instruments categorized in Level 3.
25
Kennedy Capital Funds
NOTES TO FINANCIAL STATEMENTS - Continued
June 30, 2024 (Unaudited)
The inputs used to measure fair value may fall into different Levels of the fair value hierarchy. In such cases, for disclosure purposes, the Level in the fair value hierarchy within which the fair value measurement falls in its entirety, is determined based on the lowest Level input that is significant to the fair value measurement in its entirety.
The inputs or methodology used for valuing securities are not an indication of the risk associated with investing in those securities. The following is a summary of the inputs used, as of June 30, 2024, in valuing the Funds’ assets carried at fair value:
| ESG SMID Cap Fund | Level 1 | Level 2* | Level 3* | Total | ||||||||||||
| Assets | ||||||||||||||||
| Investments | ||||||||||||||||
| Common Stocks1 | $ | 56,834,383 | $ | - | $ | - | $ | 56,834,383 | ||||||||
| Short-Term Investments | 2,463,401 | - | - | 2,463,401 | ||||||||||||
| Total Assets | $ | 59,297,784 | $ | - | $ | - | $ | 59,297,784 | ||||||||
| 1 | For a detailed break-out of common stocks by sector, please refer to the Schedule of Investments. |
| * | The Fund did not hold any Level 2 or Level 3 securities at period end. |
| Small Cap Growth Fund | Level 1 | Level 2* | Level 3** | Total | ||||||||||||
| Assets | ||||||||||||||||
| Investments | ||||||||||||||||
| Common Stocks | ||||||||||||||||
| Communication Services | $ | 13,064 | $ | - | $ | - | $ | 13,064 | ||||||||
| Consumer Discretionary | 69,851 | - | - | 69,851 | ||||||||||||
| Consumer Staples | 24,351 | - | - | 24,351 | ||||||||||||
| Financials | 45,831 | - | - | 45,831 | ||||||||||||
| Health Care | 111,735 | - | 0 | 111,735 | ||||||||||||
| Industrials | 155,621 | - | - | 155,621 | ||||||||||||
| Information Technology | 162,360 | - | - | 162,360 | ||||||||||||
| Real Estate | 8,738 | - | - | 8,738 | ||||||||||||
| Short-Term Investments | 27,856 | - | - | 27,856 | ||||||||||||
| Total Assets | $ | 619,407 | $ | - | $ | 0 | $ | 619,407 | ||||||||
| * | The Fund did not hold any Level 2 securities at period end. |
| ** | The Fund held Level 3 securities valued at zero at period end. |
26
Kennedy Capital Funds
NOTES TO FINANCIAL STATEMENTS - Continued
June 30, 2024 (Unaudited)
| Small Cap Value Fund | Level 1 | Level 2* | Level 3* | Total | ||||||||||||
| Assets | ||||||||||||||||
| Investments | ||||||||||||||||
| Common Stocks1 | $ | 18,710,672 | $ | - | $ | - | $ | 18,710,672 | ||||||||
| Exchange-Traded Funds | 181,389 | 181,389 | ||||||||||||||
| Short-Term Investments | 935,338 | - | - | 935,338 | ||||||||||||
| Total Assets | $ | 19,827,399 | $ | - | $ | - | $ | 19,827,399 | ||||||||
| 1 | For a detailed break-out of common stocks by sector, please refer to the Schedule of Investments. |
| * | The Fund did not hold any Level 2 or Level 3 securities at period end. |
The following is a reconciliation of assets in which significant unobservable inputs (Level 3) were used in determining value:
| Small Cap Growth Fund | ||||
| Beginning balance December 31, 2023 | $ | 0 | ||
| Transfers into Level 3 during the period | - | |||
| Transfers out of Level 3 during the period | - | |||
| Total realized gain/(loss) | - | |||
| Change in unrealized appreciation/(depreciation) | - | |||
| Net purchases | - | |||
| Return of Capital | - | |||
| Net sales | - | |||
| Balance as of June 30, 2024 | $ | 0 | ||
The following table presents additional quantitative information about valuation methodologies and inputs used for investments that are measured at fair value and categorized within Level 3 as of June 30, 2024:
| Small Cap Growth Fund | |||||||
| Asset Class | Fair Value at 6/30/24 | Valuation Technique(s) | Unobservable Input | Range of Input | Weighted Average of Input | Impact to Valuation from an Increase in Input(1) | |
Common Stock | $ 0 | Market Approach | Discount for lack of marketability | $ 0 | N/A | Increase | |
| (1) | This column represents the directional change in the fair value of the Level 3 investments that would result from an increase to the corresponding unobservable input. A decrease to the unobservable input would have the opposite effect. |
Note 9 – Market Disruption and Geopolitical Risks
Certain local, regional or global events such as war, acts of terrorism, the spread of infectious illnesses and/or other public health issues, financial institution instability or other events may have a significant impact on a security or instrument. These types of events and other like them are collectively referred to as “Market Disruptions and Geopolitical Risks” and they may have adverse impacts on the worldwide economy, as well as the economies of individual countries, the financial health of individual companies and the market in general in significant and unforeseen ways. Some of the impacts noted in recent times include but are not limited to embargos, political actions, supply chain disruptions, bank failures, restrictions to investment and/or monetary movement including the forced selling of securities or the inability to participate impacted markets. The duration of these events could adversely affect the Fund’s performance, the performance of the securities in which the Fund invests and may lead to losses on your investment. The ultimate impact of “Market Disruptions and Geopolitical Risks” on the financial performance of the Fund’s investments is not reasonably estimable at this time. Management is actively monitoring these events.
27
Kennedy Capital Funds
NOTES TO FINANCIAL STATEMENTS - Continued
June 30, 2024 (Unaudited)
Note 10- New Accounting Pronouncements and Regulatory Updates
Effective January 24, 2023, the SEC adopted rule and form amendments to require mutual funds and exchange-traded funds (ETFs) to transmit concise and visually engaging streamlined annual and semiannual reports to shareholders that highlight key information deemed important for retail investors to assess and monitor their fund investments. Other information, including financial statements, will no longer appear in the funds’ streamlined shareholder reports but must be available online, delivered free of charge upon request, and filed on a semiannual basis on Form N-CSR. The rule and form amendments have a compliance date of July 24, 2024. The Funds have adopted procedures in accordance with the SEC’s rules and form amendments.
Note 11 – Events Subsequent to the Fiscal Period End
The Funds have adopted financial reporting rules regarding subsequent events which require an entity to recognize in the financial statements the effects of all subsequent events that provide additional evidence about conditions that existed at the date of the balance sheet. Management has evaluated the Funds’ related events and transactions that occurred through the date of issuance of the Funds’ financial statements. There were no events or transactions that occurred during this period that materially impacted the amounts or disclosures in the Funds’ financial statements.
There were no events or transactions that occurred during this period that materially impacted the amounts or disclosures in the Funds’ financial statements.
28
Item 8. Changes in and Disagreements with Accountants for Open-End Management Investment Companies.
Not Applicable.
Item 9. Proxy Disclosures for Open-End Management Investment Companies.
Not Applicable.
Item 10. Remuneration Paid to Directors, Officers, and Others of Open-End Management Investment Companies.
This information is included in Item 7, as part of the financial statements.
Item 11. Statement Regarding Basis for Approval of Investment Advisory Contract.
Kennedy Capital ESG SMID Cap Fund, Kennedy Capital Small Cap Growth Fund, and Kennedy Capital Small Cap Value Fund
Board Consideration of Investment Advisory Agreement (Unaudited)
At an in-person meeting held on April 17, 2024, the Board of Trustees (the “Board”) of Investment Managers Series Trust II (the “Trust”), including the trustees who are not “interested persons” of the Trust (the “Independent Trustees”) as defined in the Investment Company Act of 1940, as amended (the “1940 Act”), reviewed and unanimously approved the renewal of the investment advisory agreement (the “Advisory Agreement”) between the Trust and Kennedy Capital Management LLC (the “Advisor”) for an additional one-year term from when it otherwise would expire, with respect to the following series of the Trust (each a “Fund” and collectively, the “Funds”):
| ● | Kennedy Capital ESG SMID Cap Fund (the “ESG SMID Cap Fund”), |
| ● | Kennedy Capital Small Cap Growth Fund (the “Small Cap Growth Fund”), and |
| ● | Kennedy Capital Small Cap Value Fund (the “Small Cap Value Fund”). |
In approving renewal of the Advisory Agreement, the Board, including the Independent Trustees, determined that such renewal was in the best interests of each Fund and its shareholders.
Background
In advance of the meeting, the Board received information about the Funds and the Advisory Agreement from the Advisor and from Mutual Fund Administration, LLC and UMB Fund Services, Inc., the Trust’s co-administrators, certain portions of which are discussed below. The materials, among other things, included information about the Advisor’s organization and financial condition; information regarding the background, experience, and compensation structure of relevant personnel providing services to the Funds; information about the Advisor’s compliance policies and procedures, disaster recovery and contingency planning, and policies with respect to portfolio execution and trading; information regarding the profitability of the Advisor’s overall relationship with the Funds; reports comparing the performance of each Fund with returns of its benchmark index and a group of comparable funds (each a “Peer Group”) selected by Broadridge Financial Solutions, Inc. (“Broadridge”) from Morningstar, Inc.’s relevant fund universe (each a “Fund Universe”) for various periods ended January 31, 2024; and reports comparing the investment advisory fee and total expenses of each Fund with those of its Peer Group and Fund Universe. The Board also received a memorandum from legal counsel to the Trust and the Independent Trustees discussing the legal standards under the 1940 Act and other applicable law for their consideration of the proposed renewal of the Advisory Agreement. In addition, the Board considered information reviewed by the Board during the year at other Board and Board committee meetings. No representatives of the Advisor were present during the Board’s consideration of the Advisory Agreement, and the Independent Trustees were represented by their legal counsel with respect to the matters considered.
In renewing the Advisory Agreement, the Board and the Independent Trustees considered a variety of factors, including those discussed below. In their deliberations, the Board and the Independent Trustees did not identify any particular factor that was controlling, and each Trustee may have attributed different weights to the various factors.
Nature, Extent, and Quality of Services
The Board considered information included in the meeting materials regarding the performance of each Fund. The materials they reviewed indicated the following:
| ● | The ESG SMID Cap Fund’s annualized total return for the three-year period was above the Peer Group median return and the Russell 2500 Index return, but below the Small Blend Fund Universe median return by 0.05%. The Fund’s total return for the one-year period was below Fund Universe median return, the Russell 2500 Index return, and the Peer Group median return by 0.24%, 0.54%, and 0.79%, respectively. The Trustees noted the Advisor’s assertion that the Fund’s underperformance for the one-year period was driven by unfavorable stock selection in the consumer staples, financials, and information technology sectors, including the lack of exposure to the commercial and residential mortgage finance industry within the financials sector. |
Kennedy Capital ESG SMID Cap Fund, Kennedy Capital Small Cap Growth Fund, and Kennedy Capital Small Cap Value Fund
Board Consideration of Investment Advisory Agreement (Unaudited)
| ● | The Small Cap Growth Fund’s total return for the one-year period was below the Peer Group and Small Growth Fund Universe median returns and the Russell 2000 Growth Index return by 0.22%, 0.70%, and 1.22%, respectively. The Trustees noted the Advisor’s assertion that the Fund’s underperformance during the period was primarily driven by the significant declines of three holdings in the biotechnology industry, each due to company-specific reasons. The Trustees also considered that the Fund had been operating for a relatively short period, and that performance over longer periods would be more meaningful. |
| ● | The Small Cap Value Fund’s total return for the one-year period was above the Small Value Fund Universe median return and the Russell 2000 Value Index return, and was the same as the Peer Group median return. |
The Board considered the overall quality of services provided by the Advisor to the Funds. In doing so, the Board considered the Advisor’s specific responsibilities in day-to-day management and oversight of the Funds, as well as the qualifications, experience, and responsibilities of the personnel involved in the activities of the Funds. The Board also considered the overall quality of the Advisor’s organization and operations, the Advisor’s commitment to the maintenance and growth of the Funds’ assets, and the Advisor’s compliance structure and compliance procedures. The Board and the Independent Trustees concluded that based on the various factors they had reviewed, the nature, overall quality, and extent of the management and oversight services provided by the Advisor to each Fund were satisfactory.
Advisory Fees and Expense Ratios
With respect to the advisory fees and expenses paid by the Funds, the meeting materials indicated the following:
| ● | The ESG SMID Cap Fund’s annual investment advisory fee (gross of fee waivers) was the same as the Peer Group and Small Blend Fund Universe medians. The Trustees considered that the Fund’s advisory fee was within the range of advisory fees that the Advisor charges institutional clients to manage separate accounts with similar objectives and policies as the Fund. The Trustees observed, however, that management of mutual fund assets requires compliance with certain requirements under the 1940 Act that do not apply to the Advisor’s separate account clients. The Trustees also considered that the Fund’s advisory fee was lower than the advisory fees paid by the other series of the Trust managed by the Advisor. |
The annual total expenses paid by the Fund (net of fee waivers) for the Fund’s most recent fiscal year were lower than the Peer Group and Fund Universe medians.
| ● | The Small Cap Growth Fund’s annual investment advisory fee (gross of fee waivers) was below the Peer Group median, but slightly higher than the Small Growth Fund Universe median by 0.01%. The Trustees considered that the Fund’s advisory fee was within the range of advisory fees that the Advisor charges institutional clients to manage separate accounts with similar objectives and policies as the Fund. The Trustees observed, however, that management of mutual fund assets requires compliance with certain requirements under the 1940 Act that do not apply to the Advisor’s separate account clients. The Trustees also considered that the Fund’s advisory fee was within the range of the advisory fees paid by the other series of the Trust managed by the Advisor. |
Kennedy Capital ESG SMID Cap Fund, Kennedy Capital Small Cap Growth Fund, and Kennedy Capital Small Cap Value Fund
Board Consideration of Investment Advisory Agreement (Unaudited)
The annual total expenses paid by the Fund (net of fee waivers) for the Fund’s most recent fiscal year were lower than the Peer Group and Fund Universe medians.
| ● | The Small Cap Value Fund’s annual investment advisory fee (gross of fee waivers) was slightly above both the Peer Group and Small Value Fund Universe medians by 0.02%. The Trustees considered that the Fund’s advisory fee was not in the highest quartile of advisory fees of those funds in the Peer Group or the Fund Universe. The Trustees noted that the Fund’s advisory fee was within the range of advisory fees that the Advisor charges institutional clients to manage separate accounts with similar objectives and policies as the Fund. The Trustees observed, however, that management of mutual fund assets requires compliance with certain requirements under the 1940 Act that do not apply to the Advisor’s separate account clients. The Trustees also considered that the Fund’s advisory fee was within the range of the advisory fees paid by the other series of the Trust managed by the Advisor. |
The annual total expenses paid by the Fund (net of fee waivers) for the Fund’s most recent fiscal year were lower than the Peer Group and Fund Universe medians.
The Board and the Independent Trustees concluded that based on the factors they had reviewed, the compensation payable to the Advisor under the Advisory Agreement was fair and reasonable in light of the nature and quality of the services the Advisor provides to the Funds.
Profitability, Benefits to the Advisor, and Economies of Scale
The Board next considered information prepared by the Advisor relating to its costs and profits with respect to each Fund for the year ended January 31, 2024. The Board noted that the Advisor had waived its entire advisory fee and subsidized certain of the operating expenses for the Small Cap Growth Fund and Small Cap Value Fund, had waived a majority of its advisory fee for the ESG SMID Cap Fund, and had not realized a profit with respect to any of the Funds.
The Board also considered the benefits received by the Advisor as a result of the Advisor’s relationship with the Funds, other than the receipt of its investment advisory fees, including any research received from broker-dealers providing execution services to the Funds, the beneficial effects from the review by the Trust’s Chief Compliance Officer of the Advisor’s compliance program, the intangible benefits of the Advisor’s association with the Funds generally, and any favorable publicity arising in connection with the Funds’ performance. The Board noted that although there were no advisory fee breakpoints, the asset levels of the Funds were not currently likely to lead to significant economies of scale, and that any such economies would be considered in the future as the assets of the Funds grow.
Conclusion
Based on these and other factors, the Board and the Independent Trustees concluded that renewal of the Advisory Agreement was in the best interests of each Fund and its shareholders and, accordingly, approved the renewal of the Advisory Agreement with respect to each Fund.
Item 12. Disclosure of Proxy Voting Policies and Procedures for Closed-End Management Investment Companies.
Not applicable to open-end investment companies.
Item 13. Portfolio Managers of Closed-End Management Investment Companies.
Not applicable to open-end investment companies.
Item 14. Purchases of Equity Securities by Closed-End Management Investment Company and Affiliated Purchasers.
Not applicable to open-end investment companies.
Item 15. Submission of Matters to a Vote of Security Holders.
The registrant has not made any material changes to the procedures by which shareholders may recommend nominees to the registrant’s Board of Trustees.
Item 16. Controls and Procedures.
| (a) | The Registrant’s Principal Executive Officer and Principal Financial Officer have reviewed the Registrant's disclosure controls and procedures (as defined in Rule 30a-3(c) under the Investment Company Act of 1940 (the “Act”)) as of a date within 90 days of the filing of this report, as required by Rule 30a-3(b) under the Act and Rules 13a-15(b) or 15d-15(b) under the Securities Exchange Act of 1934. Based on their review, such officers have concluded that the disclosure controls and procedures are effective in ensuring that information required to be disclosed in this report is appropriately recorded, processed, summarized and reported and made known to them by others within the Registrant and by the Registrant’s service provider. |
| (b) | There were no changes in the Registrant's internal control over financial reporting (as defined in Rule 30a-3(d) under the Act) that occurred during the period covered by this report that has materially affected, or is reasonably likely to materially affect, the Registrant's internal control over financial reporting. |
Item 17. Disclosure of Securities Lending Activities for Closed-End Management Investment Companies.
Not applicable to open-end investment companies.
Item 18. Recovery of Erroneously Awarded Compensation.
(a) Not applicable.
(b) Not applicable.
Item 19. Exhibits.
| (a) | (1) Any code of ethics or amendment thereto, that is subject of the disclosure required by Item 2, to the extent that the registrant intends to satisfy Item 2 requirements through filing an exhibit. Not applicable. |
(a) (2) Any policy required by the listing standards adopted pursuant to Rule 10D-1 under the Exchange Act (17 CFR 240.10D-1) by the registered national securities exchange or registered national securities association upon which the registrant’s securities are listed. Instruction to paragraph (a)(2). – Not Applicable.
| (b) | Certification pursuant to Section 906 of the Sarbanes-Oxley Act of 2002. Filed herewith. |
SIGNATURES
Pursuant to the requirements of the Securities Exchange Act of 1934 and the Investment Company Act of 1940, the registrant has duly caused this report to be signed on its behalf by the undersigned, thereunto duly authorized.
| (Registrant) | Investment Managers Series Trust II | |
| By (Signature and Title) | /s/ Terrance Gallagher | |
| Terrance Gallagher, President and Principal Executive Officer | ||
| Date | 9/9/2024 |
Pursuant to the requirements of the Securities Exchange Act of 1934 and the Investment Company Act of 1940, this report has been signed below by the following persons on behalf of the registrant and in the capacities and on the dates indicated.
| By (Signature and Title) | /s/ Terrance Gallagher | |
| Terrance Gallagher, President and Principal Executive Officer | ||
| Date | 9/9/2024 | |
| By (Signature and Title) | /s/ Rita Dam | |
| Rita Dam, Treasurer and Principal Financial Officer | ||
| Date | 9/9/2024 |