 www.thesba.com Newtek Business Services Corp. “The Small Business Authority®” NASDAQ: NEWT Hosted by: Barry Sloane, President & CEO Jennifer Eddelson, EVP & CAO Investor Relations Public Relations Newtek Investor Relations Hayden Investor Relations Newtek Public Relations Jayne Cavuoto Director of Investor Relations jcavuoto@thesba.com (212) 273-8179 Brett Maas brett@haydenir.com (646) 536-7331 Simrita Singh Director of Marketing ssingh@thesba.com (212) 356-9566 Third Quarter 2014 Financial Results Conference Call November 19, 2014 4:15pm ET Exhibit 99.2 |
 www.thesba.com 1 Safe Harbor Statement The following discussion of our financial condition and results of operations is intended to assist in the understanding and assessment of significant changes and trends related to the results of operations and financial position of the Company together with its subsidiaries. This discussion and analysis should be read in conjunction with the condensed consolidated financial statements and the accompanying notes contained in the Company’s Quarterly Report on Form 10-Q for the period ending September 30, 2014. The statements contained herein may contain forward-looking statements relating to such matters as anticipated future financial performance, business prospects, legislative developments and similar matters. The Private Securities Litigation Reform Act of 1995 provides a safe harbor for forward- looking statements. In order to comply with the terms of the safe harbor, we note that a variety of factors could cause our actual results to differ materially from the anticipated results expressed in the forward-looking statements such as intensified competition and/or operating problems in its operating business projects and their impact on revenues and profit margins or additional factors as described in the Company’s Annual Report on Form 10-K and other filings with the Securities and Exchange Commission. |
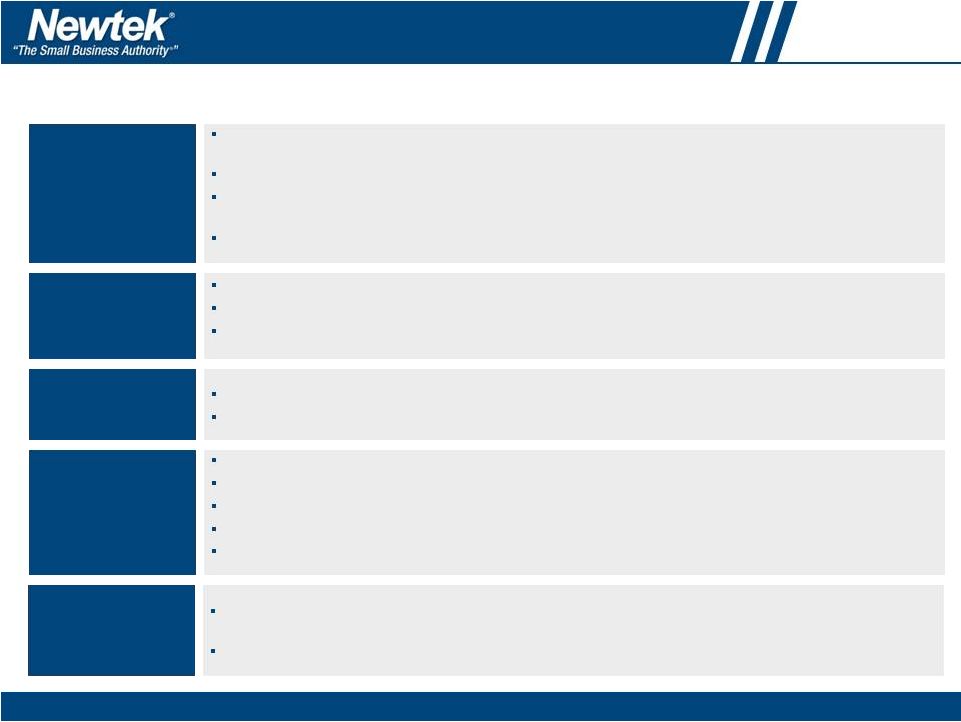
 www.thesba.com 2 Pretax income was $4.5 million; an increase of 132.0% over $2.0 million in Q3 2013 Net income attributable to Newtek Business Services, Inc. was $2.6 million; an increase of 45.3% over $1.8 million in Q3 2013 Diluted EPS were $0.34; an increase of 41.7% over diluted EPS of $0.24 Q3 2013 Operating revenue was $38.2 million; an increase of 9.8% over $34.8 million in Q3 2013 Adjusted EBITDA* was $6.7 million; an increase of 52.3% over $4.4 million in Q3 2013 For the nine months ended September 30, 2014, adjusted** diluted EPS were $0.86; an increase of 26.5% over GAAP diluted EPS of $0.68 for the nine months ended September 30, 2013 For the nine months ended September 30, 2014, GAAP diluted EPS were $0.71; an increase of 4.4% over GAAP diluted EPS of $0.68 for the nine months ended September 30, 2013 Small business finance segment pretax income was $4.2 million; an increase of 145.6% over $1.7 million in Q3 2013 Small business finance segment revenue was $10.9 million; an increase of 44.5% over $7.6 million in Q3 2013 *See slide 21 for definition of Adjusted EBITDA **GAAP financial results for the nine months ended September 30, 2014 include the impact of a one-time non-cash charge of $1.9 million, which occurred in the second quarter of 2014, related to the extinguishment of the Company’s mezzanine debt with Summit Partners Credit Advisors, L.P. NEWT effected a 1 for 5 reverse stock split on October 22, 2014 and all share data has been adjusted to reflect the reverse stock split; closing stock price as of 11/18/14: $13.12 Q3 2014 Financial Highlights – Newtek Business Services, Inc. |
 www.thesba.com 3 Q3 2014 Operational Highlights Originated $48.7 million in loans; an increase of 15.1% over $42.3 million in the Q3 2013 Funded approximately $25.0 million in loans during October 2014; an increase of approximately 47% over $16.9 million in October 2013 Small business finance segment closed an additional $23 million in financing with Capital One, N.A. in October 2014, increasing its existing revolving credit facility to $50 million for the Lender – Company's total financing through Capital One N.A. equals $70 million *According to data published by the U.S. Small Business Administration Newtek Small Business Finance, Inc. maintained its position as the largest non-bank SBA 7(a) lender by dollar volume of approved loans for the 12-month period ended September 30, 2014* Newtek entered into a new partnership with SEQR, by Seamless (OMX: SEAM) which, according to Seamless, is one of the world’s largest suppliers of payment systems for mobile phones – According to Seamless, SEQR is Sweden’s and Europe’s most used mobile payment solution in stores and online $10 million term loan was used to refinance $10 million of mezzanine debt, which reduced cash interest expense on an annual basis by more than $1.0 million, or 1000 basis points, for a total of approximately $4.2 million over the remaining term of the retired mezzanine debt $70 million consists of a $10 million term loan, which will be fully amortized over four years, and up to $60 million in revolving lines of credit |
 www.thesba.com 4 Reaffirmed 2014 Adjusted* Consolidated Operating Company Guidance Operating Revenue: Midpoint of $161.0 million, with a range of $154.0 million and $168.0 million Increase of 12.1% over 2013 revenue of $143.6 million Adjusted Pretax Income*: Midpoint of $13.5 million, with a range of $12.5 million and $14.5 million Increase of 21.6% over 2013 GAAP pretax income $11.1 million Adjusted Diluted EPS*: Midpoint of $1.15, with a range of $1.05 and $1.25 per share Increase of 15.0% over 2013 GAAP diluted EPS of $1.00 Adjusted EBITDA*: Midpoint of $26.0 million, with a range of $24.5 million and $27.5 million Increase of 26.2% over 2013 Adjusted EBITDA* of $20.6 million *As of 11/19/2014: Adjusted pretax income and Adjusted diluted EPS guidance reflect reversal of $1.9 million one-time non-cash charge. See slide 21 for definition of Adjusted pretax income, Adjusted diluted EPS and Adjusted EBITDA Expect double-digit top- and bottom-line percentage growth in 2014 – – – – – – – – |
 www.thesba.com 5 BDC Conversion – Newtek Business Services Corp. NEWT converted to a business development company (a “BDC”) which is expected to result in significant tax efficiencies and allow the Company to pay an attractive dividend to shareholders – Initial Q1 2015 dividend of $0.38/share – Anticipate average quarterly dividend payout for 2015 of $0.45 per share representing a dividend yield of 13.7%* – In connection with the conversion, NEWT expects to declare a special dividend to distribute it’s accumulated pre- conversion taxable earnings – Anticipate paying the special dividend 80% in stock and 20% in cash in Q4 2015 Special dividend anticipated to be treated as a “Qualified Dividend” for tax purposes – Internally managed BDC public comparables currently trade at a median price to NAV of approximately 1.5x** – Proforma NAV of $15.50 at June 30, 2014 after the capital raise (including the overallotment) *Based on November 18, 2014 closing price of $13.12 **As of October 30, 2014. Based on the following public comparable companies: HTGC, KCAP, MAIN, TCAP As part of the conversion to a BDC, Newtek Business Services, Inc. (the “Company” or “Newtek”) merged with and into Newtek Business Services Corp. (the “Successor Company”) effective as of November 12, 2014 NEWT is an internally managed BDC with no base or incentive fees paid to an external manager |
 www.thesba.com 6 Recent Equity Transaction Sold 2.53 million shares (100% primary shares plus underwriter option) of common stock – Public offering price of $12.50 per share – Total gross proceeds of $31.625 million Plan to use proceeds to expand financing activities and primarily increase activity in SBA 7(a) lending, and make direct investments in portfolio companies Syndicate Structure – Joint Book-Runners: JMP Securities LLC, Ladenburg Thalmann – Co-Manager: Lebenthal & Co., LLC |
 www.thesba.com 7 The Conversion – New Business Structure Newtek Business Services, Inc.: Existing 14-Year Old Publicly Traded Company Merging into Newtek Business Services Corp.; A Maryland Shell Corporation Newtek Business Services Corp. (Business Development Company) Newtek Small Business Finance (Consolidated Subsidiary) SBA 7(a) Loan Portfolio Newtek Business Credit (100% Owned) (CDS Business Services, Inc.) (Portfolio Company) Newtek Merchant Solutions (100% Owned) (Universal Processing Services of Wisconsin, LLC ) (Portfolio Company) Newtek Managed Technology Solutions (100% Owned) CrystalTech Web Hosting, Inc. (Portfolio Company) Other Portfolio Companies Newtek Payroll Solutions (90% Owned) Newtek Insurance Agency (100% Owned) |
 www.thesba.com 8 Newtek Small Business Finance Q3 2014 SBF pretax income increased by 145.6% to $4.2 million Q3 2014 SBF revenue increased by 44.5% to $10.9 million Originated $48.7 million in loans; an increase of 15.1% over $42.3 million in Q3 2013 Funded approximately $25.0 million in loans during October 2014; an increase of approximately 47% over $16.9 million in October 2013 Closed an additional $23 million in financing with Capital One N.A. in October 2014, which increased our total revolving credit facility to $50 million for Lender, and total financing to $70 million through Capital One N.A. on a company-wide basis Maintained position as largest non-bank SBA 1(a) lender by dollar volume of approved loans for the 12-month period ended September 30, 2014* – 10 th largest SBA 7(a) lender including banks NEWT estimates significant loan funding and balance sheet growth in 2015, in conjunction with conversion to a BDC and recent capital raise New referral partners in pipeline: Union Bank of Switzerland, Randolph-Brooks Credit Union and others *According to the U.S. Small Business Administration |
 www.thesba.com 9 Return on Capital Newtek Small Business Finance, Inc. For the year ended 12/31/2013 ($ thousands) Total Capital at 12/31/2012 $25,428 2013 Pre-Tax Income $9,291 Total Pre-Tax Return on Capital 36.5% |
 www.thesba.com 10 Newtek Small Business Finance One of 14 Non-Bank SBA Government-Guaranteed Lender Licenses (these licenses are no longer being issued) Small balance, industry and geographically diversified portfolio of 732 loans – Average loan size is $150K of average Newtek uninsured retained loan balance Typical $1 million loan is: – 75% ($750,000) Full Faith and Credit Government Guaranteed Loan Participation Liquid market netting a 113% premium to par – 25% ($250,000) Uninsured but not subordinate to government participations Currently financing at 3.75% through securitization Floating rate at Prime plus 2.75% with no caps; equivalent to 6% cost to borrower No origination fees with 7- to 25-year amortization schedules and are receiving high-quality loan product Secondary market established for SBA 7(a) government-guaranteed lending for over 61 years and Newtek establishes liquidity for uninsured portions through securitizations After securitization of uninsured and sale of government participation, principal in the loan is returned • • |
 www.thesba.com 11 Loan Sale Transaction (1) Premiums above 10% split 50/50 with SBA. This example assumes guaranteed balance is sold at 15%. The additional 5% (15%-10%) is split with SBA. Newtek nets 12.5% (2) Assumes 12.5% of the Guaranteed balance (3) Value determined by GAAP servicing value; a present value of future servicing income (4) Net risk-adjusted profit recognized per $1 million of loan originations (5) Uninsured piece gets immediately written down at origination to reflect cumulative estimate of default frequency and severity (6) Assuming the loan is sold in a securitization in 12 months (7) Net cash created pre-tax per $1 million of loan originations Direct Revenue / Expense of a Loan Sale Transaction – An Example Key Variables in Loan Sale Transaction Loan Amount $1,000,000 Guaranteed Balance (75%) $750,000 Unguaranteed Balance (25%) $250,000 Premium (1) 12.5% Resulting Revenue (Expense) Associated Premium (2) $93,750 Servicing Asset (3) $18,630 Total Premium Income $112,380 Packaging Fee Income $2,500 FV Non-Cash Discount on Uninsured Loan Participations $(12,500) Referral Fees Paid to Alliance Partners $(7,500) Total Direct Expenses $(20,000) Net Risk-Adjusted Profit Recognized (4,5) $94,880 Net Cash Created Pre-Tax (Post Securitization) (6,7) $11,250 |
 www.thesba.com 12 Comparative Loan Portfolio Data 12/31/2010 vs. 9/30/2014 Since 2010, the credit quality and diversification of loan portfolio has steadily improved Loan Characteristic As of 12/31/10 As of 9/30/14 Business Type: Existing Business 53.9% 79.6% Business Acquisition 25.9% 13.8% Start-Ups 20.2% 6.6% Primary Collateral: Commercial RE 45.3% 58.9% Machinery & Equipment 22.8% 20.5% Residential RE 22.3% 9.8% Other 9.6% 6.5% Percentage First Lien on RE: Commercial RE 84.8% 95.7% Residential RE 9.9% 19.5% Loan Characteristic As of 12/31/10 Loan Characteristic As of 9/30/14 Industry: Restaurant 10.6% Restaurant 7.8% Hotels & Motels 7.6% Amusement & Recreation 5.8% State Concentration: Florida 21.6% New York 11.7% New York 12.7% Florida 11.4% Georgia 14.1% Connecticut 8.4% Other: Total Portfolio ($mm) $31 $107 Avg. Balance ($mm) $0.076 $0.165 Wtd. Avg. Mean FICO 675 704 Wtd. Avg. Current LTV 78.2% 73.5% |
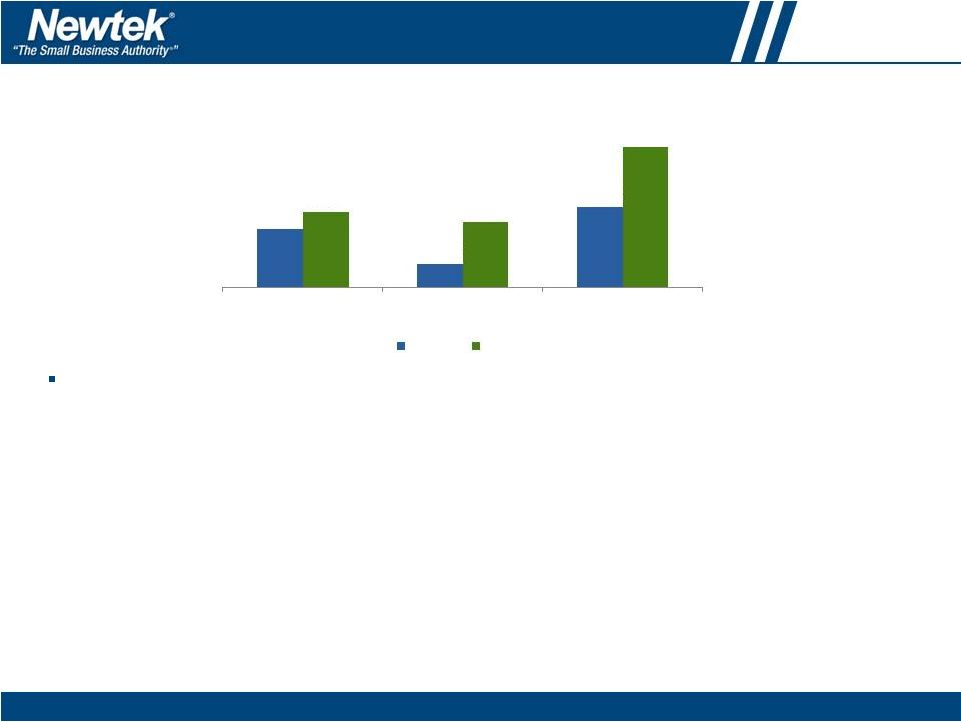 www.thesba.com 13 Servicing Portfolio The SBF servicing portfolio – Q3 2013 vs. Q3 2014 – S&P-rated commercial small balance loan servicer – Total servicing portfolio increased by 74.1% to $1.1 billion • Newtek portfolio increased by 30.0% • Third-party servicing portfolio increased by 186.5% • Plan to continue to grow the loan servicing aspect of the business both organically, through growth in loan originations, as well as through acquisition of third-party loan servicing portfolios • Currently have numerous third-party opportunities in the pipeline Have a 4-year FDIC contract to service and special-service conventional and government-guaranteed loans including USDA, Department of Energy, Farm Credit, etc. *Principal balance of loans serviced (dollars in millions) $444.7 $174.6 $619.3 $578.3 $500.2 $1,078.5 NEWT Loans* Servicing Other Loans* Total Loans* Q3 2013 Q3 2014 – |
 www.thesba.com 14 Electronic Payment Processing (1) Estimates via Bloomberg. Publicly Traded Comparable Companies Name (Symbol) Enterprise Value / 2015E EBITDA (1) Heartland Payment Systems (HPY) 9.10x Vantiv, Inc. (VNTV) 10.24x Valuation & Financial Performance Valued at 4.75x EBITDA Valued at $44 million 2013 Revenue: $89.7 million 2013 Pretax Income: $8.3 million 2013 Adjusted EBITDA: $8.7 million Q3 2014 pretax income increased by 17.6% to $2.2 million Increased transaction volumes, July price increase, and the new merchant security programs contributed to Q3 2014 growth in pretax income Entered into new partnership with SEQR, by Seamless (OMX: SEAM) which, according to Seamless, is one of the world’s largest suppliers of payment systems for mobile phones We are a registered Independent Sales Organization (ISO) with Visa and MasterCard We are the “State-of-the-Art Merchant Processor” Point of sale (POS) in the Cloud, Gateway and Switch, CyberScan 15,000 business accounts; realized over $4.5 billion in electronic payment processing volume in 2013 Growth and acquisition story One-of-a-kind eCommerce capability Secured mobile wallet |
 www.thesba.com 15 (1) Estimates via Bloomberg. (2) According to Gartner "...in the next five years enterprises will spend $921 billion on public cloud services (2013-2017)." Excerpt from Gartner Presentation: Cloud Computing 2014: ready for real business? Darryl Carlton, October 2013 (3) "The use of cloud computing is growing, and by 2016 this growth will increase to become the bulk of new IT spend." Excerpt from Gartner Press Release, Oct. 24, 2013; Managed Technology Solutions http://www.gartner.com/newsroom/id/2613015 We have 100% owned and operated this business since mid-2004 We host and manage SMBs computer hardware, software and their technology solutions in our Level-4, 5,000 square foot data center in Phoenix, Arizona Over 106,000 business accounts manage solutions of hardware and software for business clients; manage over 77,000 domain names Q3 2014 MTS pretax income decreased by 8.7% to $804 thousand This segment is being transformed to take advantage of shift to cloud-based business trends including: eCommerce, Payroll and Insurance According to Gartner 2,3 , cloud computing is expected to have a very promising future and experience significant growth; enterprises will spend $921 billion on public cloud services over the five-year period (2013-2017) Implementing cost-reduction measures and new product introductions as part of repositioning strategy Several changes with MTS senior management team Publicly Traded Comparable Companies Name (Symbol) Enterprise Value / 2015E EBITDA (1) Endurance (EIGI) 12.07x Rackspace Holdings, Inc. (RAX) 7.12x Valuation & Financial Performance Valued at 3.75x EBITDA Valued at $22 million 2013 Revenue: $17.6 million 2013 Pretax Income: $3.6 million 2013 Adjusted EBITDA: $5.0 million |
 www.thesba.com 16 Internally Managed BDC Public Comparables Internally managed BDC public comparables currently trade at a median price to NAV of approximately 1.5x* – Hercules Technology Growth Capital (NASDAQ: HTGC) – KCAP Financial (NASDAQ: KCAP) – Main Street Capital (NASDAQ: MAIN) – Triangle Capital (NASDAQ: TCAP) *As of October 30, 2014. Based on the following public comparable companies: HTGC, KCAP, MAIN, TCAP |
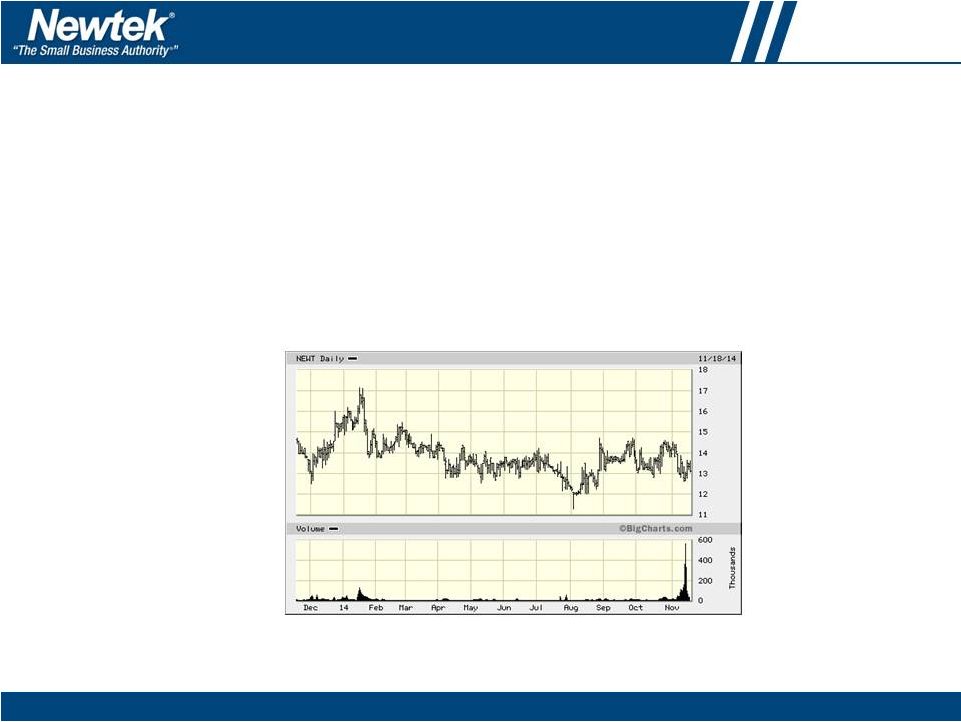 www.thesba.com 17 Key Statistics: NASDAQ-NEWT Stock Price $13.12 52-Week Range $11.30-$17.15 Common Shares O/S 10.2M Market Cap $133.9M Share Statistics 1 (USD) ………………………................. 2014 Adjusted Consolidated Operating Company Guidance 2 ………………………..................... Revenue $161.0M Adjusted Pre-tax Income 3 $13.5M Adjusted Diluted EPS 4 $1.15 Adjusted EBITDA 4 $26.0M (1) As of close of trading on 11/18/2014 (2) As of 11/19/2014. Represents midpoint of expected range. Adjusted pretax income and Adjusted diluted EPS guidance reflect reversal of $1.9 million one-time non-cash charge (3) See slide 21 for definition of Adjusted pretax income, Adjusted diluted EPS and Adjusted EBITDA |
 www.thesba.com 18 Investment Highlights (1) As of September 30, 2014 (2) As of August 13, 2014. (3) Based on November 18, 2014 closing price of $13.12. Based on expected average quarterly distributions during NEWT’s first full year of operations as a BDC. No assurance can be provided that such results will be achieved (4) As of October 30, 2014. Based on the following public comparable companies: HTGC, KCAP, MAIN, TCAP Largest Non-Bank SBA Lender in U.S. NEWT is currently the largest non-bank institution U.S. Small Business Administration (SBA) licensed lender under the federal Section 7(a) loan program based on annual origination volume (national PLP status) 10 th largest SBA 7(a) lender including banks (1) ROI in SBA 7(a) lending in excess of 30% Following this capital raise and BDC conversion, NEWT is estimating significant loan funding and balance sheet growth in 2015 Proven Track Record Established in 1998 Publically traded since September 2000 National SBA 7(a) lender to small business since 2003; 11-year history of loan default frequency and severity statistics Issued four S&P Rated AA & A Securitizations since 2010 Highly Experienced Management Team Management’s interests aligned with shareholders CEO alone owns approximately 13.4% of outstanding shares (2) Founders, Management and Board combined own over 25% of outstanding shares (2) Attractive Pro Forma Dividend Yield Initial Q1 2015 dividend of $0.38 / share The Company currently anticipates the average quarterly dividend payout for 2015 to be $0.45 per share representing a dividend yield of 13.7% (3) Internally Managed NEWT is internally managed with no base or incentive fees paid to an external manager Internally managed BDC public comparables currently trade at a median price to NAV of approximately 1.5x (4) – – |
 www.thesba.com 19 Investment Highlights (Cont.) Loan Portfolio Characteristics: SBA 7(a) loans S&P-Rated Servicer Large, Attractive Market Opportunity Unique Financial Technology Platform Portfolio Companies Small balance (average loan size is $150K of average Newtek uninsured retained loan balance), industry and geographically diversified portfolio of 732 loans All SBA 7(a) loans are floating rate, indexed to Prime and have no caps Borrowers pay a current maximum 6% interest rate; no origination fees with 7- to 25-year amortization schedules and are receiving a high-quality loan product Secondary market established for SBA 7(a) government-guaranteed lending for over 61 years and Newtek establishes liquidity for uninsured portions through securitizations S&P Rated Commercial Small Balance Loan Servicer Servicing over $1 billion of small business loans as of September 30, 2014 Newtek Business Services has a 4 year FDIC contract to service and special-service conventional and government- guaranteed loans including USDA, Department of Energy, Farm Credit, etc. Currently over 27 million SMBs in the U.S. We believe the market is largely underserved and searching for alternative financing solutions NEWT’s proprietary NewTracker referral system is a key differentiating component of its business model NewTracker allows the processing of new business by utilizing a web-based, centralized processing point Significantly lowers cost of client acquisition Processes lending business much more efficiently with better credits at lower cost Helps market payment processing, payroll, cloud computing at the same time, allowing partners and borrowers to cross-sell other products We 100% own and have operated our electronic payment processing, cloud computing and insurance businesses for over 10 years We own 90% and have operated our payroll business for over 4 years |
 www.thesba.com Financial Review – Jennifer C. Eddelson, Chief Accounting Officer |
 www.thesba.com 21 Non-GAAP Financial Measures In evaluating its business, Newtek considers and uses adjusted EBITDA as a supplemental measure of its operating performance. The Company defines adjusted EBITDA as earnings before income from tax credits, interest expense, taxes, depreciation and amortization, stock compensation expense, other than temporary decline in value of investments, Capco fair value change and the amortization of the 2011 accrued loss on the lease restructure. Newtek uses adjusted EBITDA as a supplemental measure to review and assess its operating performance. The Company also presents adjusted EBITDA because it believes it is frequently used by securities analysts, investors and other interested parties as a measure of financial performance. The terms Adjusted EBITDA, Adjusted pretax income and Adjusted diluted EPS are not defined under U.S. generally accepted accounting principles, or U.S. GAAP, and is not a measure of operating income, operating performance or liquidity presented in accordance with U.S. GAAP. Adjusted EBITDA, Adjusted pretax income and Adjusted diluted EPS have limitations as analytical tools and, when assessing the Company’s operating performance, investors should not consider Adjusted EBITDA, Adjusted pretax income and Adjusted diluted EPS in isolation, or as a substitute for net income (loss) or other consolidated income statement data prepared in accordance with U.S. GAAP. Among other things, Adjusted EBITDA, does not reflect the Company’s actual cash expenditures. Other companies may calculate similar measures differently than Newtek, limiting their usefulness as comparative tools. The Company compensates for these limitations by relying primarily on its GAAP results supplemented by Adjusted EBITDA, Adjusted pretax income and Adjusted diluted EPS. Beginning in the second quarter of 2014, the Company included two new non-GAAP financial measures, Adjusted pretax income and Adjusted diluted EPS, to reflect the Company’s pretax earnings and diluted EPS as adjusted for a non-recurring charge to income related to the refinancing of debt. The Company incurred a one time, non-cash charge to income of $1.9 million which represented the remaining deferred financing costs and debt discount. Our Capcos operate under a different set of rules in each of the 7 jurisdictions and these place varying requirements on the structure of our investments. In some cases, particularly in Louisiana or in certain situations in New York, we do not control the equity or management of a qualified business, but that cannot always be presented orally or in written presentations. |
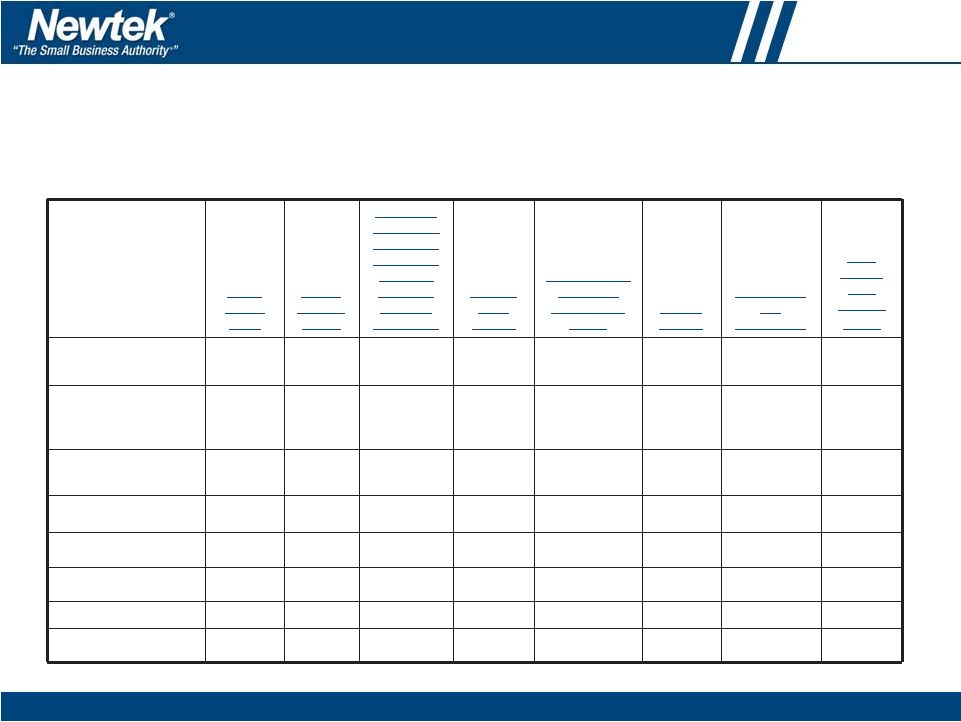
 www.thesba.com 22 Q3 2014 vs. Q3 2013 Actual Results Revenue For The Quarter Ended September 30, 2014 Revenue For The Quarter Ended September 30, 2013 Pretax Income (Loss) For The Quarter Ended September 30, 2014 Pretax Income (Loss) For The Quarter Ended September 30, 2013 ADJUSTED EBITDA For The Quarter Ended September 30, 2014 ADJUSTED EBITDA For The Quarter Ended September 30, 2013 Electronic Payment Processing 22.777 22.177 2.210 1.879 2.283 1.972 Small Business Finance 10.949 7.575 4.244 1.728 5.776 3.472 Managed Technology Solutions 3.818 4.455 0.804 0.881 1.149 1.267 All Other 0.739 0.689 (0.368) (0.311) (0.313) (0.251) Corporate Activities 0.272 0.250 (2.037) (1.847) (1.810) (1.722) CAPCO 0.102 0.042 (0.229) (0.377) (0.219) (0.366) Interco Eliminations (0.491) (0.414) (0.101) – (0.100) – Total 38.166 34.774 4.523 1.953 6.766 4.372 In millions of dollars |
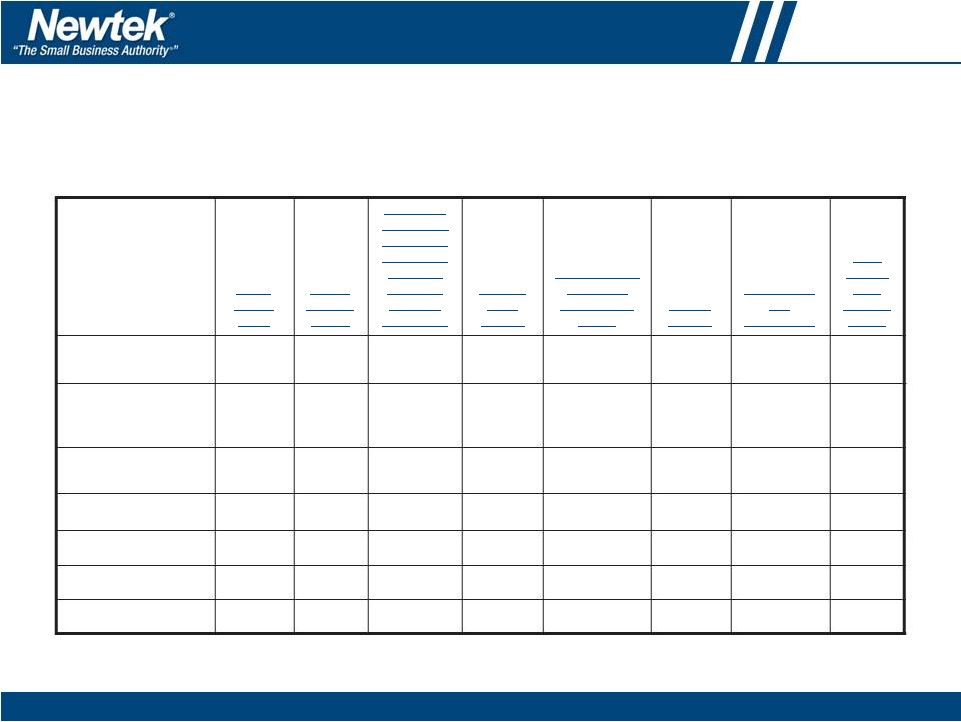
 www.thesba.com 23 2014 Adjusted* Operating Company Segment Guidance Electronic Small Managed Total Inter- Payment Business Technology All Corporate Business CAPCO Company Processing Finance Solutions Other Activities Segments Segment Eliminations Total Low High Low High Low High Low High Low High Low High Low High Low High 2014 Full Year Revenue 90.2 99.2 44.0 47.0 17.4 19.2 2.6 2.8 0.8 0.8 155.0 169.0 0.2 0.2 (1.2) 154.0 168.0 Pretax Income (Loss) 8.3 9.2 14.2 14.7 3.3 3.7 (1.1) (1.1) (10.9) (10.7) 13.8 15.8 (1.3) (1.3) - 12.5 14.5 Income from tax credits - - - - - - - - - - - - (0.1) (0.1) - (0.1) (0.1) Net change in fair value of credits in lieu of cash and notes payable in credits in lieu of cash - - - - - - - - - - - - - - - - - Deferred compensation expense - - 0.1 0.1 0.1 - - - 0.6 0.5 0.9 0.7 - - - 0.9 0.7 Lease loss amortization - - - - - - - - (0.3) (0.3) (0.3) (0.3) - - - (0.3) (0.3) Interest Expense - - 8.5 8.3 0.1 0.1 - - - - 8.6 8.4 0.2 0.2 - 8.8 8.6 Depreciation and Amortization 0.4 0.4 1.5 1.5 1.3 1.3 0.2 0.2 0.1 0.1 3.5 3.5 - - - 3.5 3.5 Adjusted EBITDA 8.7 9.5 23.8 25.1 4.8 5.2 (0.9) (0.8) (10.5) (10.2) 26.8 28.8 (1.4) (1.2) - 24.5 27.5 Note: totals may not add due to rounding *As of 11/19/2014; consolidated pretax income guidance adjusted to reflect reversal of $1.9 million one-time non-cash charge In millions of dollars |
 www.thesba.com Appendix |
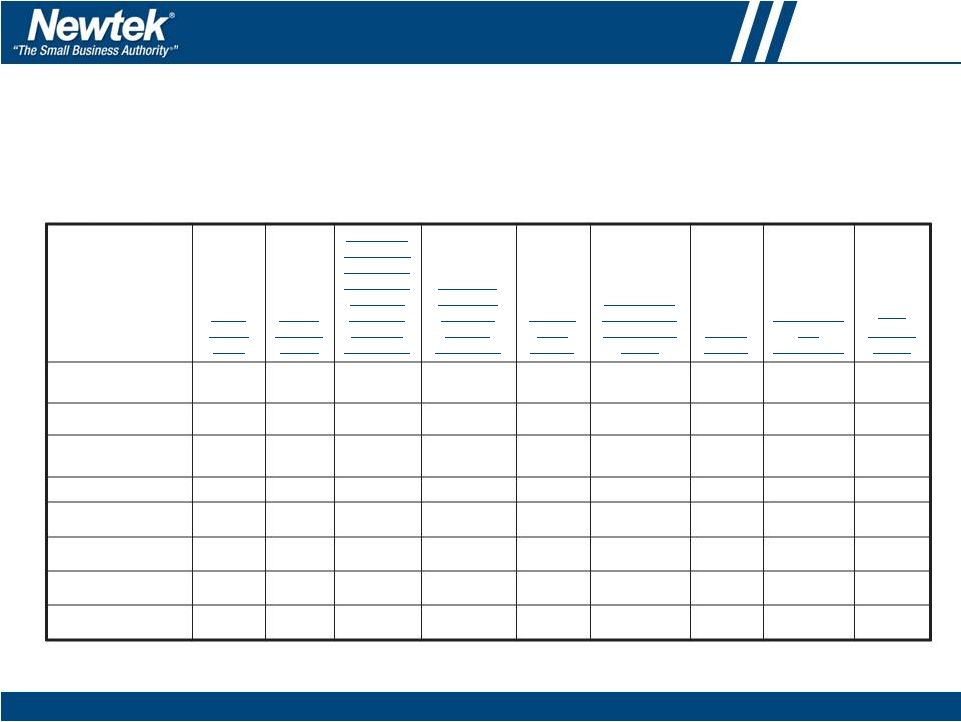
 www.thesba.com 25 Adjusted EBITDA Reconciliation Adjusted EBITDA Reconciliation from Pretax Income (Loss) For the three months ended September 30, 2014 Note: totals may not add due to rounding In millions of dollars Pretax Income (Loss) Income from Tax Credits Net Change in Fair Value of Credits in Lieu of Cash and Notes Payable in Credits in Lieu of Cash Deferred Comp Expense Amortization of 2011 Lease Restructuring Charge Interest Expense Depreciation and Amortization Third Quarter 2014 Adjusted EBITDA Electronic Payment Processing 2.210 - - - - - 0.073 2.283 Small Business Finance 4.244 - - 0.013 - 1.100 0.419 5.776 Managed Technology Solutions 0.804 - - 0.003 - 0.006 0.336 1.149 All Other (0.368) - - 0.004 - - 0.051 (0.313) Corporate Activities (2.037) - - 0.058 (0.073) 0.205 0.037 (1.810) CAPCO (0.229) (0.011) 0.002 - - 0.019 - (0.219) Eliminations (0.100) (0.100) Total 4.523 (0.011) 0.002 0.078 (0.073) 1.33 0.916 6.766 |
 www.thesba.com 26 Adjusted EBITDA Reconciliation Adjusted EBITDA Reconciliation from Pretax Income (Loss) For the three months ended September 30, 2013 Pretax Income (Loss) Income from Tax Credits Net Change in Fair Value of Credits in Lieu of Cash and Notes Payable in Credits in Lieu of Cash Deferred Comp Expense Amortization of 2011 Lease Restructuring Charge Interest Expense Depreciation and Amortization Third Quarter 2013 Adjusted EBITDA Electronic Payment Processing 1.879 - - 0.009 - - 0.084 1.972 Small Business Finance 1.728 - - 0.028 - 1.387 0.329 3.472 Managed Technology Solutions 0.881 - - 0.015 - 0.044 0.327 1.267 All Other (0.311) - - 0.010 - - 0.050 (0.251) Corporate Activities (1.847) - - 0.152 (0.073) 0.007 0.039 (1.722) CAPCO (0.377) (0.031) - - - 0.041 0.001 (0.366) Total 1.953 (0.031) - 0.214 (0.073) 1.479 0.830 4.372 Note: totals may not add due to rounding In millions of dollars |
 www.thesba.com 27 Adjusted EBITDA Reconciliation Adjusted EBITDA Reconciliation from Pretax Income (Loss) For the year ended December 31, 2013 Pretax Income (Loss) Income from Tax Credits Net Change in Fair Value of Credits in Lieu of Cash and Notes Payable in Credits in Lieu of Cash Other than Temporary Decline in Value of Investments Deferred Comp Expense Amortization of 2011 Lease Restructuring Charge Interest Expense Depreciation and Amortization 2013 Adjusted EBITDA Electronic Payment Processing 8.304 - - - 0.019 - - 0.358 8.681 Small Business Finance 10.143 - - - 0.103 - 5.568 1.242 17.055 Managed Technology Solutions 3.564 - - - 0.051 - 0.094 1.316 5.025 All Other (1.606) - - - 0.035 - - 0.202 (1.366) Corporate Activities (8.002) - - - 0.575 (0.291) 0.027 0.161 (7.529) CAPCO (1.284) (0.113) (0.021) 0.017 - - 0.174 0.005 (1.222) Interco Eliminations (0.050) (0.051) Total 11.069 (0.113) (0.021) 0.017 0.784 (0.291) 5.863 3.284 20.593 In millions of dollars Note: totals may not add due to rounding |
 www.thesba.com 28 Adjusted Earnings Reconciliation NEWTEK BUSINESS SERVICES, INC. AND SUBSIDIARIES RECONCILIATION OF ADJUSTED PRETAX INCOME AND DILUTED EPS FOR THE THREE AND NINE MONTHS ENDED SEPTEMBER 30, 2014 (In Thousands, except for Per Share Data) For the three months ended September 30, 2014 For the nine months ended September 30, 2014 Pretax income reconciliation: GAAP pretax income $ 4,523 $ 9,028 Add: Interest expense charge related to repayment of Summit debt - 1,905 Adjusted pretax income $ 4,523 $ 10,933 Diluted EPS reconciliation: Net income attributable to Newtek $ 2,644 $ 5,429 Add: Interest expense charge related to repayment of Summit debt - 1,905 Deduct: Tax effect of interest expense charge related to repayment of Summit debt - (744) Adjusted net income attributable to Newtek Business Services, Inc. $ 2,644 $ 6,590 Weighted average common shares outstanding – diluted 7,699 7,688 Adjusted EPS – diluted $ 0.34 $ 0.86 |