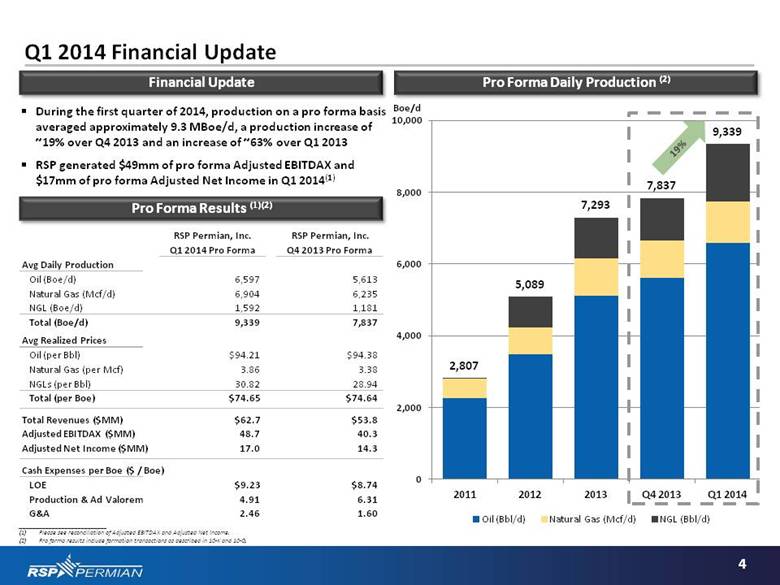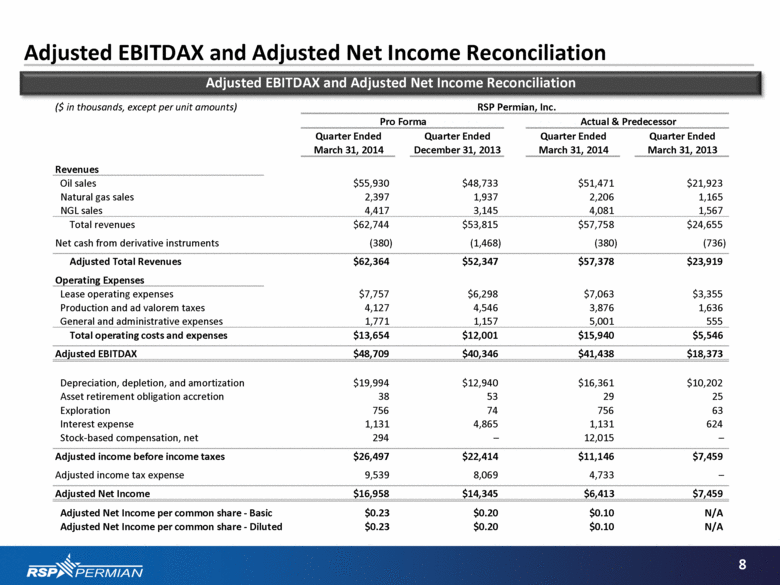
| 8 Adjusted EBITDAX and Adjusted Net Income Reconciliation Adjusted EBITDAX and Adjusted Net Income Reconciliation ($ in thousands, except per unit amounts) RSP Permian, Inc. Pro Forma Actual & Predecessor Quarter Ended Quarter Ended Quarter Ended Quarter Ended March 31, 2014 December 31, 2013 March 31, 2014 March 31, 2013 Revenues Oil sales $55,930 $48,733 $51,471 $21,923 Natural gas sales 2,397 1,937 2,206 1,165 NGL sales 4,417 3,145 4,081 1,567 Total revenues $62,744 $53,815 $57,758 $24,655 Net cash from derivative instruments (380) (1,468) (380) (736) Adjusted Total Revenues $62,364 $52,347 $57,378 $23,919 Operating Expenses Lease operating expenses $7,757 $6,298 $7,063 $3,355 Production and ad valorem taxes 4,127 4,546 3,876 1,636 General and administrative expenses 1,771 1,157 5,001 555 Total operating costs and expenses $13,654 $12,001 $15,940 $5,546 Adjusted EBITDAX $48,709 $40,346 $41,438 $18,373 Depreciation, depletion, and amortization $19,994 $12,940 $16,361 $10,202 Asset retirement obligation accretion 38 53 29 25 Exploration 756 74 756 63 Interest expense 1,131 4,865 1,131 624 Stock-based compensation, net 294 – 12,015 – Adjusted income before income taxes $26,497 $22,414 $11,146 $7,459 Adjusted income tax expense 9,539 8,069 4,733 – Adjusted Net Income $16,958 $14,345 $6,413 $7,459 Adjusted Net Income per common share - Basic $0.23 $0.20 $0.10 N/A Adjusted Net Income per common share - Diluted $0.23 $0.20 $0.10 N/A |