
December 22, 2016
VIA EDGAR
Brad Skinner
Senior Assistant Chief Accountant
Office of Natural Resources
United States Securities and Exchange Commission
Division of Corporation Finance
100 F Street, N.E.
Washington, D.C. 20549
| Re: | Rice Energy Inc. |
Form10-K for the Year Ended December 31, 2015
Filed February 25, 2016
Response Letter Dated October 11, 2016
FileNo. 001-36273
Dear Mr. Skinner:
This letter responds to the letter dated December 9, 2016 regarding the comments of the staff of the Division of Corporation Finance (the “Staff”) of the Securities and Exchange Commission (the “Commission”) with respect to the above referenced Annual Report on Form10-K for the year ended December 31, 2015 of Rice Energy Inc. (the “Company”, “we” or “our”) and the above referenced Response Letter dated October 11, 2016 of the Company. For the convenience of the Staff, we have reproduced the Staff’s comments in bold type and have followed each comment with the Company’s response.
Form10-K for the Fiscal Year Ended December 31, 2015
Risk Factors, page 20
| 1. | The revised risk factor provided in response to prior comment number 1 indicates that, if undiscounted cash flows from your properties are less than their carrying values, you may be required to take write-downs. Explain to us the circumstances under which undiscounted cash flows from your properties would be less than the carrying values and you would conclude that you did not need to take a write-down. Tell us how such a conclusion would meet the requirements of FASB ASC paragraph360-10-35-17. |
Securities and Exchange Commission
December 22, 2016
Page 2
Response: We acknowledge the Staff’s comment and propose to revise the risk factor in future filings as illustrated below. As we discuss in greater detail under Critical Accounting Policies and Estimates in Item 7 as well as Note 2 in Item 8 of the Form10-K, we periodically review the carrying values of our properties when events or circumstances indicate that the remaining carrying amount may not be recoverable. Consistent with ASC 360, we utilize our own assumptions as to the use of the underlying properties to estimate undiscounted cash flows. However, if undiscounted cash flows were below carrying value, we would be required to fair value the properties using market participant assumptions as opposed to our own assumptions. The intent of the risk factor is to disclose that the carrying value of our properties could be at risk of impairment as a result of commodity price decreases, which would reduce the estimated future cash flows of our properties. We respectfully submit that the risk factor with the proposed revisions and our broader description of our accounting policies appearing elsewhere in the Form10-K comply with the requirements of FASB ASC paragraph360-10-35-17.
If commodity prices decrease to a level such that our future undiscounted cash flows from our properties are less than their carrying valuefor a significant period of time, we will likelymay be required to take write-downs of the carrying values of our properties.
Accounting rules require that we periodically review the carrying value of our properties for possible impairment. Based on prevailing commodity prices and specific market factors and circumstances at the time of prospective impairment reviews, and the continuing evaluation of development plans, production data, economics and other factors, we may be required to write-down the carrying value of our properties. A write-down constitutes anon-cash charge to earnings. The current downward trend in oil and natural gas prices may result in impairments of our properties, which could have a material adverse effect on our results of operations for the periods in which such charges are taken.
Properties, page 38
Production, Revenues and Price History, page 43
| 2. | We have read your response to prior comment 8 and note your interpretation of the disclosure requirements under Item 1204(a) of RegulationS-K in terms of a basin does not appear to give consideration to the additional threshold for disclosure of each field that contains 15% or more of total proved reserves. Please refer to the definition of a field in Rule4-10(a)(15) of RegulationS-X and modify the tabular disclosure on page 44 accordingly. |
Response: We respectfully submit to the Staff that it was not the intent of our prior response to comment 8 to imply that Item 1204(a) of RegulationS-K treated a basin as synonymous with a “field” and acknowledge that the entirety of the Appalachian Basin
Securities and Exchange Commission
December 22, 2016
Page 3
should not be considered a single “field” as defined in Rule4-10(a)(15) of RegulationS-X. However, we believe that the operations of the Company are in fact within a single “field” as defined.
Rule4-10(a)(15) defines a “field” as
An area consisting of a single reservoiror multiple reservoirs all grouped on or related to the same individual geological structural feature and/or stratigraphic condition. There may be two or more reservoirs in a field that are separated . . . laterally by local geological barriers . . ... Reservoirs that are associated by being in overlapping or adjacent fields may be treated as a single orcommon operational field. The geological terms structural feature and stratigraphic condition are intended to identifylocalized geological features as opposed to the broader terms of basins, trends, provinces, plays,areas-of-interest, etc. [Emphasis added]
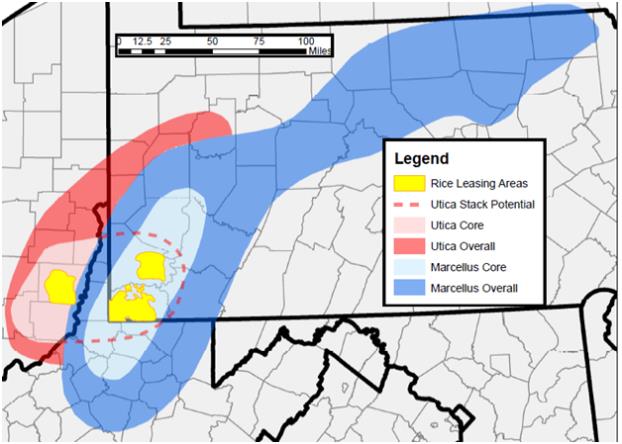
Shale plays can extend over vast, relatively indistinct portions of the country. The Marcellus Shale extends along a southwest-northeast trend across seven states, and the Utica Shale extends along a slightly more west-east trend across seven states. Within these Shale plays are pockets of increased productivity commonly referred to as “cores”. In the Marcellus Shale, for instance, dry gas cores have emerged in both southwestern and northeastern Pennsylvania.
All of the operated andnon-operated properties of the Company are located within two counties in Pennsylvania and one county in Ohio. These properties are located above the nexus of the southwestern Pennsylvania dry gas Marcellus Shale core and the dry gas Utica Shale core which overlap underneath common surface geography. As displayed in the presentation below, the Company’s properties in Washington and Greene Counties, Pennsylvania, sit atop three formations: the cores of the Marcellus and Utica dry gas Shales and the less economic dry gas Upper Devonian Shale (which generally overlies the footprint of the Marcellus Shale). In Belmont County, Ohio, the Company’s assets are located in the core of the Utica Shale. These assets are at most separated by a single county (though the geological structures are agnostic to state or county borders).
Securities and Exchange Commission
December 22, 2016
Page 4
With respect to the Company’s assets, there is substantial overlap over the cores of the respective formations. We believe that in situations where there is substantial overlap of formations in similar geologic structures (such as is the case with the Company’s assets), the best indication of the existence of a single or multiple “fields” is the resulting operational approach taken by the subject company.
The Company respectfully submits that it operates in a single, multi-reservoir common operational field and that the Company in fact operates its assets consistent with this belief. As indicated in response below to comment 3, the Company operates its properties as a single asset base with all decision-making being made centrally by a singular operations team. This operation is both a result of the consistency, concentration and close proximity of the assets, the overlapping of a multitude of sales options and the consistency of service costs. The Company respectfully submits that there are no distinguishable “fields” among its assets, and that treatment of its asset base as a single field is consistent with Rule4-10(a)(15) insofar as it contemplates fields consisting of multiple reservoirs.
Securities and Exchange Commission
December 22, 2016
Page 5
Management’s Discussion and Analysis of Financial Condition and Results of Operations, page 52
Critical Accounting Policies and Estimates, page 70
Natural Gas Properties, page 71
| 3. | Your response to prior comment number 10 indicates that grouping assets at the formation level results in discrete geographical groupings and identifiable cash flows that are largely discrete for each formation. Your response also indicates that certain inputs are provided by one provider at fixed rates in each formation, and that certain services are provided based on terms negotiated at the formation level. It is not clear why you believe these factors support a conclusion that the formation represents the lowest level for which cash flows are largely independent of the cash flows of other assets and liabilities. Please address the following: |
| • | Provide us with maps or other diagrams which show your operated andnon-operated properties in each formation and the infrastructure through which production is gathered, processed and transported to final delivery points. Clearly indicate the point(s) at which title to production is permanently transferred and final sales occur. |
| • | Tell us whether production from any particular well is delivered and sold to particular locations only or if you have a practice of delivering and selling gas from particular wells to multiple locations. |
| • | Describe for us, in reasonable detail, the management structure for your exploration and production activities. As part of your response, describe the process through which decisions to drill, complete, produce,shut-in, workover or abandon wells are made, including the management level at which these decisions are made. |
| • | Describe for us, in reasonable detail, the level at which you calculate depletion and depreciation for oil and gas assets in Pennsylvania and Ohio. As part of your response, clarify for us whether total costs in each formation are depleted or depreciated based on total reserves in that formation. |
Response:
We respectfully submit that the purpose of our response to prior comment number 10 insofar as it presented the uniformity of both productivity and costs of our assets was to provide the Staff with an understanding of the significant cash inflows and outflows of our proved properties. The following is intended to further clarify for the Staff the most significant cash inflows and outflows of our assets and our rationale in determining that the lowest level of which these cash flows are independent of one another is at the formation level.
Securities and Exchange Commission
December 22, 2016
Page 6
In 2015, despite the overlapping shale cores, all of the Company’s producing Marcellus Shale and Upper Devonian Shale wells were located in Washington and Greene Counties, Pennsylvania, and all of its producing Utica Shale wells were in Belmont County, Ohio. As such, the formations were synonymous with the states of operation.
In identifying the level at which independent cash inflows existed for purposes of our impairment analysis in 2015, we primarily evaluated gas marketing and sales activity. Through firm transportation takeaway capacity to access natural gas markets outside of the Appalachian Basin, substantially all of our Marcellus Shale and Upper Devonian Shale production was delivered to the southern United States via interstate pipelines or to local Pennsylvania markets, whereas substantially all of our Utica Shale production was delivered to the midwest or western part of the United States via interstate pipelines or to local Ohio markets. Title to production typically passed to a third party upon reaching the applicable interstate pipeline or the local sales point. Accordingly, the primary distinction among cash inflows existed at the formation level.
The most significant ongoing cash outflows over the lives of the Company’s natural gas properties, with the exception of the capital development costs incurred prior to hydrocarbon production, are gathering and compression costs, lease operating costs and general and administrative costs.
Substantially all of the Company’s production flows through gathering and compression assets owned and operated by its subsidiaries with one gathering agreement separately negotiated and existing for each of its Ohio and Pennsylvania systems, including distinct gathering and compression fees. Hydrocarbons from multiple wells are comingled immediately after flowing throughon-pad production facilities and flow through meter readings to our subsidiaries’ gathering lines and then to ultimate sales points. While individual wells may produce different volumes of molecules, the gathering and compression costs are based on total hydrocarbon volumes flowed through the gathering and compression system and not distinctly at a lower level.
Lease operating costs primarily consist of theday-to-day operating costs to maintain production of our producing natural gas wells. The substantial portion of our lease operating costs consist of labor associated with our field operations and safety teams, a variety of rentals including trucks and other leased equipment, water hauling and disposal costs, and road repairs and maintenance. While certain of these lease operating costs relate to activities performed for specific properties, the substantial majority of lease operating costs are incurred on a daily basis and serve to support the operations for all properties across each of the respective formations. For example, a significant portion of our lease operating costs relate to our field operations team, which is comprised of individuals with focused efforts in either the Ohio Utica Shale or the Pennsylvania Marcellus Shale while performing a multitude of functions across each respective formation that do not pertain to any individual properties.
Securities and Exchange Commission
December 22, 2016
Page 7
Lastly, general and administrative costs represent activities that are indirect to our natural gas production operations and relate to broad management activities that are incurred at the corporate level and include general employee costs and professional services costs. These costs are incurred at the corporate level and are allocated to the Company’s business units based upon various allocation metrics.
Accordingly, in analyzing the cash inflows and outflows of the Company, the only meaningfully distinct level of identifiable cash flows is at the formation level.
Next, we have provided the below information to address the specific matters of interest to the Staff as listed in the respective bullet points above.
In response to the first bullet, we refer to the below map which shows our operated andnon-operated properties in the Appalachian Basin, as well as an overlay of the gathering and compression system operated by subsidiaries of the Company. Approximately 99.3% of the Company’s production is dry natural gas which does not require processing prior to transportation on interstate pipelines. Once produced, natural gas from individual wells located on a multi-well pad is aggregated and transported through gathering pipelines for ultimate delivery to interstate pipelines. Sitting atop and in close proximity to the Company’s assets are gathering assets that connect to a number of interstate pipelines capable of transporting dry natural gas production to end markets. Additionally, such map depicts sales points whereby title to our production is transferred to a third party, typically at the receipt point of an interstate pipeline.
Securities and Exchange Commission
December 22, 2016
Page 8
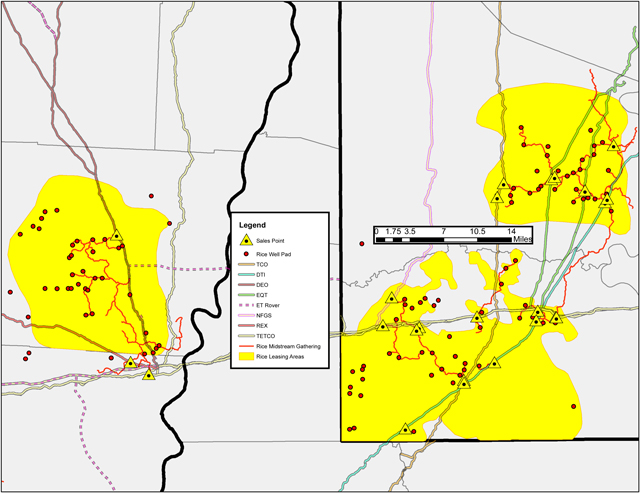
When combined with overlapping interstate pipelines and the ability to satisfy firm transportation volumes on certain pipelines with production from each of our concentrated acreage footprints, these gathering and compression systems create a web of pipelines capable of accessing multiple downstream markets. Given that substantially all of the Company’s production is pipeline quality dry gas, the pipeline web allows for any molecule of natural gas from a single well pad to access multiple sales points with no bias towards hydrocarbon molecules produced on awell-to-well basis.
In response to the second bullet, we do not have a practice of delivering and selling our production from particular wells only to particular locations as none of our sales contracts are tied to a specific well or group of wells.
In response to the third bullet, and as noted in our response to comment 2 above, the Company operates its properties as a single asset base as a result of the consistency, concentration and close proximity of the assets, and the similarity in technology being used across the asset base. We do not employ separate executive or management teams based on formation, and our development schedule, including but not limited to drilling, completion and production of well pads, is planned and coordinated amongst a common group of managers. Given the consistency of its high return Marcellus Shale and Utica Shale properties, the Company is able to structure its development plan while primarily focusing on minimizing lease expirations in each respective area of development. To that end, the Company has at times shifted rigs between the Marcellus Shale and the Utica
Securities and Exchange Commission
December 22, 2016
Page 9
Shale with the primary purpose of addressing near-term lease expirations. Inputs to these decisions include both the overall commodity environment (and its associated impact on the number of rigs the Company operates) and acquisitions (with new leasehold expiration issues). Ultimately, all significant final decisions on our development plans and operations, including other decisions such asshut-ins, workovers or plugging and abandonment, are made by our Chief Operating Officer for all areas of development. Management does not review separate cash flows at a level lower than the Marcellus Shale and Utica Shale, respectively.
In response to the fourth bullet, capitalized acquisition and development costs of proved properties are tracked at the well level. ASC932-360 provides oil and gas producing entities the option to deplete capitalized costs at either the well level or at a reasonable level of aggregation. We currently deplete proved properties at the well level and depletion is calculated under the units of production method whereby costs are depleted based upon volumes produced from these properties. To the extent that new wells commence production throughout the year, the total accumulated costs for the wells are depleted using the most recently estimated reserve quantities. Depletion rates are revised at least annually with the revision of our reserve base and changes in depletion rates factored in prospectively as a change in estimate, or more frequently than annually such as when there are indicators of a substantial change in the estimated reserves or costs of our proved properties.
The Company respectfully submits that, for the aforementioned reasons and the reasons set forth in our previous response, the asset groups identified by the Company represent the lowest level for which identifiable cash flows are largely independent of one another.
| 4. | Remarks attributed to your Chief Executive Officer as part of the conference call to discuss your December 31, 2015 operating results appear to indicate that you evaluate results on a “single well return(s)” basis. Explain to us how the cost assumptions underlying a single-well analysis reflect your belief that the formation is the lowest level for which there are cash flows that are largely independent of the cash flows of other assets and liabilities. |
Response:As mentioned in our response to comment 3, the assets of the Company have substantial similarity within each formation. The Company typically discusses its production in terms of Utica Shale and Marcellus Shale development. This is in part a result of the fact that investors historically have viewed the Marcellus Shale as a more seasoned play with less associated geological uncertainty.
When we discuss “single-well returns”, we are discussing the average returns of our assets in each of the Marcellus and Utica Shales reduced to an average single-well return. In other words, they are not the returns of a single well, but rather a reduction of the overall returns that result from applying assumptions regarding sales price (typically Henry Hub strip pricing), basis differentials, development costs and post-production costs to present to investors a returns assumption on aper-well basis. Additionally, average
Securities and Exchange Commission
December 22, 2016
Page 10
single-well returns are hypothetical in nature and require the Company to include allocations of costs that are in fact captured at a much higher level than the well level as in many cases the activities that generate these costs are not specific to an individual well. Describing single-well returns in such a manner allows investors to model returns based on the Company’s anticipated development program (regarding of wells in each formation and their own internal assumptions, including commodity price). Such internal assumptions are highlighted in our investor presentations to investors as periodically published by the Company to give the user an understanding of the general assumptions built into our depiction of estimated average “single-well returns.”
Accordingly, when Mr. Rice stated that “our development and just the pace of development is really dictated by . . . single well returns and the health of our balance sheet”, he is not referring to targeting individual well pads for development based on anticipated different returns from said pad. Rather, he is making a statement on full-field development.
Given that the Company’s production profile wasright-sized to its delivery commitments, the decision to increase development to produce volumes in excess of committed volumes would be one of opportunity. In a fluctuating commodity price environment, the two primary inputs used by exploration and production companies in making a decision on development are single-well returns (as portrayed above) and balance sheet condition. The incremental development must make economic sense from a returns standpoint and must be done in a manner that does not impair the balance sheet by incurring significant upfront capital in the form of debt to ramp development, as the returns inherently lag capital expenditure. Mr. Rice’s statements were merely an acknowledgement that there must be an understanding of both the short-term and long-term economics of development in determining development pace at the corporate level.
As Mr. Rice noted, the Company’s Marcellus Shale assets can be developed at a faster pace than its Utica Shale assets (primarily as result of drilling times required in the deeper Utica Shale). This timing difference is reflected in the Company’s single-well returns for the Marcellus and Utica Shales. However, when trying to access a favorable commodity market (which could be short-lived), speed to development is a consideration in where to allocate incremental, temporal capital on top of the Company’s existing development program.
Accordingly, the Company respectfully submits that statements by Mr. Rice should not be read to indicate a development plan that targets specific individual well returns. As noted in response 3, the returns across the Company’s asset base are substantially consistent to allow it to focus more on maintaining an optimal development program to manage leasehold expiry. Accordingly, we believe that these statements coupled with the manner in which we manage and discuss our development plan support the Company’s position that the formation is the lowest level at which independent cash flows exist.
Securities and Exchange Commission
December 22, 2016
Page 11
Financial Statements and Supplementary Data, page 78
Notes to Consolidated Financial Statements, page 86
Note 3. Goodwill, page 91
| 5. | Regarding your response to prior comment number 12, address the following: |
| • | Tell us the specific values used for all material assumptions in both the 2015 annual goodwill impairment test and the purchase price and goodwill allocation at the time of the 2014 Marcellus JVbuy-in, and; |
| • | Provide a reasonably detailed summary of the 2015 annual test valuation which shows the final value and how it was determined, including the extent to which you relied on market, cost or income approaches. |
Response: As stated in our initial response to prior comment number 12, the pricing assumptions, discount rate and terminal growth rate represented the most significant assumptions in estimating the fair value of our Exploration and Production reporting unit in the 2015 annual goodwill impairment test (“Annual Test”) and also in the purchase price and goodwill allocation at the time of the 2014 Marcellus JVbuy-in (“Initial Valuation”).
In the Initial Valuation, we calculated fair value of Exploration and Production primarily under the discounted cash flow method under the income approach. In calculating the fair value of the Exploration and Production reporting unit in the Annual Test, we calculated fair value using both the discounted cash flow method under the income approach and the guideline public company method under the market approach in determining the fair value of the Exploration and Production reporting unit. The discounted cash flow method took into account factors and results specific to the Exploration and Production reporting unit, and the guideline public company method took into account performance of relevant guideline companies that comprise our peer group. As we were equally confident in the quantity and quality of data used in each method as well as the applicability of each method, we used an equal weighting of values calculated under each method in determining the fair value of the Exploration and Production reporting unit for purposes of the first step of the Annual Test.
The below table provides the significant assumptions used in the Annual Test and the Initial Valuation.
| Pricing Assumptions | ||||||||||||||||||||||||||||||||||||
| 2016 | 2017 | 2018 | 2019 | 2020 | 2021 | 2022 | Discount Rate | Terminal Growth Rate | ||||||||||||||||||||||||||||
Annual Test | $ | 2.30 | $ | 2.45 | $ | 2.50 | $ | 2.75 | $ | 3.00 | $ | 3.10 | $ | 3.15 | 13.5 | % | -2.0 | % | ||||||||||||||||||
Initial Valuation | $ | 3.82 | $ | 3.91 | $ | 3.99 | $ | 4.13 | $ | 4.30 | $ | 4.45 | $ | 4.60 | 9.0 | % | -1.5 | % | ||||||||||||||||||
|
|
|
|
|
|
|
|
|
|
|
|
|
| |||||||||||||||||||||||
% Change | -40 | % | -37 | % | -37 | % | -33 | % | -30 | % | -30 | % | -32 | % | ||||||||||||||||||||||
Securities and Exchange Commission
December 22, 2016
Page 12
We respectfully submit the below table to the Staff which represents a summary of the concluded fair value of the Exploration and Production reporting unit calculated in the Annual Test.
| (in millions) | ||||
Discounted Cash Flow Method | $ | 340 | ||
% Weight | 50 | % | ||
Guideline Public Company Method | $ | 781 | ||
% Weight | 50 | % | ||
Determined Fair Value | $ | 560 | ||
Carrying Value | $ | 1,553 | ||
* * * *
Once you have had time to review our responses to the Staff’s comments, we would appreciate the opportunity to discuss any additional questions or concerns that you may have. Please feel free to call me at (832)708-3432. Written correspondence to the Company may be directed to my attention at 333 Clay Street, Suite 4150, Houston, Texas 77002, email Will.Jordan@RiceEnergy.com.
| Sincerely, | ||
| Rice Energy Inc. | ||
/s/ William E. Jordan | ||
| Name: | William E. Jordan | |
| Title: | Senior Vice President, General Counsel and Corporate Secretary | |
| cc: | Joseph Klinko, the Commission |
John Hodgin, the Commission