UNITED STATES
SECURITIES AND EXCHANGE COMMISSION
Washington, D.C. 20549
FORM N-CSR
CERTIFIED SHAREHOLDER REPORT OF REGISTERED MANAGEMENT INVESTMENT COMPANIES
Investment Company Act file number 811-22902
First Trust New Opportunities MLP & Energy Fund
(Exact name of registrant as specified in charter)
10 Westport Road, Suite C101a
Wilton, CT 06897
(Address of principal executive offices) (Zip code)
W. Scott Jardine, Esq.
First Trust Portfolios L.P.
120 East Liberty Drive, Suite 400
Wheaton, IL 60187
(Name and address of agent for service)
Registrant’s telephone number, including area code: 630-765-8000
Date of fiscal year end: October 31
Date of reporting period: April 30, 2023
Form N-CSR is to be used by management investment companies to file reports with the Commission not later than 10 days after the transmission to stockholders of any report that is required to be transmitted to stockholders under Rule 30e-1 under the Investment Company Act of 1940 (17 CFR 270.30e-1). The Commission may use the information provided on Form N-CSR in its regulatory, disclosure review, inspection, and policymaking roles.
A registrant is required to disclose the information specified by Form N-CSR, and the Commission will make this information public. A registrant is not required to respond to the collection of information contained in Form N-CSR unless the Form displays a currently valid Office of Management and Budget (“OMB”) control number. Please direct comments concerning the accuracy of the information collection burden estimate and any suggestions for reducing the burden to Secretary, Securities and Exchange Commission, 100 F Street, NE, Washington, DC 20549. The OMB has reviewed this collection of information under the clearance requirements of 44 U.S.C. § 3507.
Item 1. Reports to Stockholders.
| (a) | | The Report to Shareholders is attached herewith. |

First Trust
New Opportunities MLP & Energy Fund (FPL)
Semi-Annual Report
For the Six Months Ended
April 30, 2023
First Trust New Opportunities MLP & Energy Fund (FPL)
Semi-Annual Report
April 30, 2023
Caution Regarding Forward-Looking Statements
This report contains certain forward-looking statements within the meaning of the Securities Act of 1933, as amended, and the Securities Exchange Act of 1934, as amended. Forward-looking statements include statements regarding the goals, beliefs, plans or current expectations of First Trust Advisors L.P. (“First Trust” or the “Advisor”) and/or Energy Income Partners, LLC (“EIP” or the “Sub-Advisor”) and their respective representatives, taking into account the information currently available to them. Forward-looking statements include all statements that do not relate solely to current or historical fact. For example, forward-looking statements include the use of words such as “anticipate,” “estimate,” “intend,” “expect,” “believe,” “plan,” “may,” “should,” “would” or other words that convey uncertainty of future events or outcomes.
Forward-looking statements involve known and unknown risks, uncertainties and other factors that may cause the actual results, performance or achievements of First Trust New Opportunities MLP & Energy Fund (the “Fund”) to be materially different from any future results, performance or achievements expressed or implied by the forward-looking statements. When evaluating the information included in this report, you are cautioned not to place undue reliance on these forward-looking statements, which reflect the judgment of the Advisor and/or Sub-Advisor and their respective representatives only as of the date hereof. We undertake no obligation to publicly revise or update these forward-looking statements to reflect events and circumstances that arise after the date hereof.
Performance and Risk Disclosure
There is no assurance that the Fund will achieve its investment objective. The Fund is subject to market risk, which is the possibility that the market values of securities owned by the Fund will decline and that the value of the Fund’s shares may therefore be less than what you paid for them. Accordingly, you can lose money by investing in the Fund. See “Principal Risks” in the Additional Information section of this report for a discussion of certain other risks of investing in the Fund.
Performance data quoted represents past performance, which is no guarantee of future results, and current performance may be lower or higher than the figures shown. For the most recent month-end performance figures, please visit www.ftportfolios.com or speak with your financial advisor. Investment returns, net asset value and common share price will fluctuate and Fund shares, when sold, may be worth more or less than their original cost.
The Advisor may also periodically provide additional information on Fund performance on the Fund’s web page at www.ftportfolios.com.
How to Read This Report
This report contains information that may help you evaluate your investment in the Fund. It includes details about the Fund and presents data and analysis that provide insight into the Fund’s performance and investment approach.
By reading the portfolio commentary by the portfolio management team of the Fund, you may obtain an understanding of how the market environment affected the Fund’s performance. The statistical information that follows may help you understand the Fund’s performance compared to that of relevant market benchmarks.
It is important to keep in mind that the opinions expressed by personnel of First Trust and EIP are just that: informed opinions. They should not be considered to be promises or advice. The opinions, like the statistics, cover the period through the date on the cover of this report. The material risks of investing in the Fund are spelled out in the prospectus, the statement of additional information, this report and other Fund regulatory filings.
First Trust New Opportunities MLP & Energy Fund (FPL)
Semi-Annual Letter from the Chairman and CEO
April 30, 2023
Dear Shareholders,
First Trust is pleased to provide you with the semi-annual report for the First Trust New Opportunities MLP & Energy Fund (the “Fund”), which contains detailed information about the Fund for the six months ended April 30, 2023.
It pleases me to write that on May 5, 2023, the World Health Organization officially declared that the coronavirus (“COVID-19”) pandemic no longer qualified as a global health emergency. While the virus officially no longer poses an immediate threat, its full impact on the world economy remains to be seen, in my opinion. Recall, if you will, those early days of the pandemic; companies sent workers home, consumers were afraid or unwilling to leave their homes, supply chains dried up, and grocery shelves were left bare. Hoping to provide relief to their constituents and to bolster economic activity, governments across the globe funneled trillions of dollars in stimulus directly into the hands of their citizens. Unfortunately, economist Milton Friedman’s age-old economic adage “there’s no such thing as a free lunch” still holds. As a result of the U.S. government stimulus, gross domestic product rebounded quickly, but so did inflation.
As many investors are aware, the Federal Reserve (the “Fed”) has been locked in a battle with stubbornly high inflation for several years now. Inflation, as measured by the trailing 12-month rate of change in the Consumer Price Index (“CPI”), surged from 1.4% on December 31, 2020, to 9.1% as of June 30, 2022. Since then, the trailing rate on the CPI has come down, but remains elevated. On April 30, 2023, the CPI stood at 4.9%, well above the Fed’s goal of 2.0%. Surging prices have not been restricted to the U.S. Headline inflation rates in each of the countries that make up the so-called Group of Ten (G-10) stand above the targets set by their central banks, according to data from Bloomberg.
From the Fed’s perspective, monetary policy is the most efficient means to combat rising prices. From December 31, 2020 through May 3, 2023, the Fed increased the Federal Funds target rate (upper bound) a total of ten times, raising the rate from 0.25% to 5.25%. As mentioned, tighter monetary policy resulted in a decrease in the CPI, but there have been casualties in the Fed’s battle with rising prices. The most recent banking turmoil is one example. Another is the spike in mortgage rates. According to Bankrate, the national average for a 30-year mortgage stood at just 2.87% on December 31, 2020. As of May 1, 2023, the average 30-year mortgage rate had surged to 6.88%. Not all the news is negative, however. Driven by a strong U.S. labor market, consumer spending remained robust in April 2023. Notably, American corporations added 253,000 jobs during the month, and the unemployment rate stood at a 53-year low. Bob Carey, Chief Market Strategist at First Trust, recently summed up the current situation, noting that “we’re not out of the woods yet.” That said, even the most difficult situations don’t last forever. In my opinion, like the COVID-19 pandemic, inflation, and the tighter monetary policy it ushered in, will pass with time.
Thank you for giving First Trust the opportunity to play a role in your financial future. We value our relationship with you and will report on the Fund again in six months.
Sincerely,
James A. Bowen
Chairman of the Board of Trustees
Chief Executive Officer of First Trust Advisors L.P.
First Trust New Opportunities MLP & Energy Fund (FPL)
“AT A GLANCE”
As of April 30, 2023 (Unaudited)
| Fund Statistics | |
| Symbol on New York Stock Exchange | FPL |
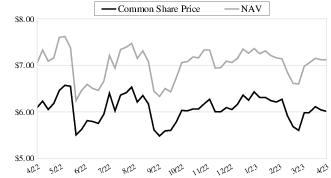
| Common Share Price | $6.01 |
| Common Share Net Asset Value (“NAV”) | $7.12 |
| Premium (Discount) to NAV | (15.59)% |
| Net Assets Applicable to Common Shares | $166,831,334 |
| Current Distribution per Common Share(1) | $0.0375 |
| Current Annualized Distribution per Common Share | $0.4500 |
| Current Distribution Rate on Common Share Price(2) | 7.49% |
| Current Distribution Rate on NAV(2) | 6.32% |
Common Share Price & NAV (weekly closing price)
| Performance | | | | |
| | | | Average Annual
Total Returns |
| | 6 Months
Ended
4/30/23 | 1 Year
Ended
4/30/23 | 5 Years
Ended
4/30/23 | Inception
(3/26/14)
to 4/30/23 |
| Fund Performance(3) | | | | |
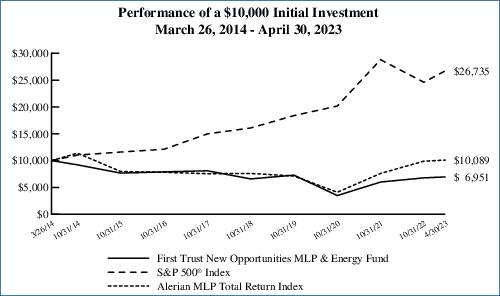
| NAV | 3.91% | 8.75% | 2.46% | -1.61% |
| Market Value | 2.57% | 6.27% | -3.16% | -3.92% |
| Index Performance | | | | |
| S&P 500® Index | 8.63% | 2.66% | 11.45% | 11.42% |
| Alerian MLP Total Return Index | 1.98% | 16.78% | 6.12% | 0.10% |
| Industry Classification | % of Total
Long-Term
Investments |
| Petroleum Product Transmission | 31.2% |
| Natural Gas Transmission | 26.2 |
| Electric Power & Transmission | 19.1 |
| Crude Oil Transmission | 10.3 |
| Gathering & Processing | 4.2 |
| Propane | 0.9 |
| Other | 8.1 |
| Total | 100.0% |
| Top Ten Holdings | % of Total
Long-Term
Investments |
| Enterprise Products Partners, L.P. | 9.0% |
| Magellan Midstream Partners, L.P. | 8.7 |
| Energy Transfer, L.P. | 7.8 |
| Cheniere Energy Partners, L.P. | 4.9 |
| Williams (The) Cos., Inc. | 4.8 |
| MPLX, L.P. | 4.2 |
| Plains All American Pipeline, L.P. | 4.0 |
| Hess Midstream, L.P., Class A | 3.7 |
| ONEOK, Inc. | 3.2 |
| Sempra Energy | 3.1 |
| Total | 53.4% |
| Fund Allocation | % of Net Assets |
| Common Stocks | 62.0% |
| Master Limited Partnerships | 59.7 |
| Money Market Funds | 3.9 |
| Call Options Written | (0.2) |
| Outstanding Loan | (25.7) |
| Net Other Assets and Liabilities | 0.3 |
| Total | 100.0% |
| (1) | Most recent distribution paid through April 30, 2023. Subject to change in the future. |
| (2) | Distribution rates are calculated by annualizing the most recent distribution paid through the report date and then dividing by Common Share Price or NAV, as applicable, as of April 30, 2023. Subject to change in the future. |
| (3) | Total return is based on the combination of reinvested dividend, capital gain, and return of capital distributions, if any, at prices obtained by the Dividend Reinvestment Plan and changes in NAV per share for NAV returns and changes in Common Share Price for market value returns. Total returns do not reflect sales load and are not annualized for periods of less than one year. Past performance is not indicative of future results. |
Portfolio Commentary
First Trust New Opportunities MLP & Energy Fund (FPL)
Semi-Annual Report
April 30, 2023 (Unaudited)
Advisor
First Trust Advisors L.P. (“First Trust” or the “Advisor”) serves as the investment advisor to the First Trust New Opportunities MLP & Energy Fund (the “Fund”). First Trust is responsible for the ongoing monitoring of the Fund’s investment portfolio, managing the Fund’s business affairs and providing certain administrative services necessary for the management of the Fund.
Sub-Advisor
Energy Income Partners, LLC
Energy Income Partners, LLC (“EIP”), located in Westport, CT, was founded in 2003 to provide professional asset management services in publicly traded energy-related infrastructure companies with above average dividend payout ratios operating pipelines and related storage and handling facilities, electric power transmission and distribution as well as long contracted or regulated power generation from renewables and other sources. The corporate structure of the portfolio companies includes C-corporations, partnerships and energy infrastructure real estate investment trusts. EIP mainly focuses on investments in assets that receive steady fee-based or regulated income from their corporate and individual customers. EIP manages or supervises approximately $5.2 billion of assets as of April 30, 2023. EIP advises two privately offered partnerships for U.S. high net worth individuals and an open-end mutual fund. EIP also manages separately managed accounts and provides its model portfolio to unified managed accounts. Finally, EIP serves as a sub-advisor to three closed-end management investment companies in addition to the Fund, three actively managed exchange-traded funds and a sleeve of a series of a variable insurance trust. EIP is a registered investment advisor with the Securities and Exchange Commission.
Portfolio Management Team
James J. Murchie – Co-Portfolio Manager, Founder and CEO of Energy Income Partners, LLC
Eva Pao – Co-Portfolio Manager, Principal of Energy Income Partners, LLC
John Tysseland – Co-Portfolio Manager, Principal of Energy Income Partners, LLC
The portfolio managers are primarily and jointly responsible for the day-to-day management of the Fund’s portfolio.
Commentary
First Trust New Opportunities MLP & Energy Fund
The Fund’s investment objective is to seek a high level of total return with an emphasis on current distributions paid to common shareholders. The Fund seeks to provide its common shareholders with a vehicle to invest in a portfolio of cash-generating securities, with a focus on investing in publicly traded master limited partnerships (“MLPs”), MLP-related entities and other companies in the energy sector and energy utility industries that are weighted towards non-cyclical, fee-for-service revenues. Under normal market conditions, the Fund invests at least 85% of its “Managed Assets” in equity and debt securities of MLPs, MLP-related entities and other energy sector and energy utilities companies that the Fund’s Sub-Advisor believes offer opportunities for growth and income. There can be no assurance that the Fund’s investment objective will be achieved. The Fund may not be appropriate for all investors.
Market Recap
As measured by the Alerian MLP Total Return Index (“AMZX” or “MLP Benchmark”), the total return for the MLP Benchmark for the six-month period ended April 30, 2023 was 1.98%. For AMZX, this return reflects a positive 3.93% from distribution payments, while the remaining returns are due to share price depreciation. These figures are according to data collected from Bloomberg. While in the short term, market share price appreciation can be volatile, we believe that over the long term, such share price appreciation will approximate growth in per share earnings and quarterly cash distributions paid by the companies in the portfolio.
Portfolio Commentary (Continued)
First Trust New Opportunities MLP & Energy Fund (FPL)
Semi-Annual Report
April 30, 2023 (Unaudited)
Performance Analysis
| | | | Average Annual
Total Returns |
| | 6 Months
Ended
4/30/23 | 1 Year
Ended
4/30/23 | 5 Years
Ended
4/30/23 | Inception
(3/26/14)
to 4/30/23 |
| Fund Performance(1) | | | | |
| NAV | 3.91% | 8.75% | 2.46% | -1.61% |
| Market Value | 2.57% | 6.27% | -3.16% | -3.92% |
| Index Performance | | | | |
| S&P 500® Index | 8.63% | 2.66% | 11.45% | 11.42% |
| Alerian MLP Total Return Index | 1.98% | 16.78% | 6.12% | 0.10% |
Performance figures assume reinvestment of all distributions and do not reflect the deduction of taxes that a shareholder would pay on Fund distributions or the redemption or sale of Fund shares. An index is a statistical composite that tracks a specified financial market or sector. Unlike the Fund, the indices do not actually hold a portfolio of securities and therefore do not incur the expenses incurred by the Fund. These expenses negatively impact the performance of the Fund. The Fund’s past performance does not predict future performance.
On a net asset value (“NAV”) basis, for the six-month period ended April 30, 2023, the Fund provided a total return(1) of 3.91%, including the reinvestment of distributions. This compares, according to collected data, to a total return of 8.63% for the S&P 500® Index (the “Index”) and 1.98% for AMZX. On a market value basis, the Fund had a total return(1) including the reinvestment of distributions, of 2.57% for the same period. At the end of the period, the Fund was priced at $6.01 per Common Share, while the NAV was $7.12 per Common Share, a discount of 15.59%. On October 31, 2022, the Fund was priced at $6.08 per Common Share, while the NAV was $7.11 per Common Share, a discount of 14.49%.
For the six-month period ended April 30, 2023, the Fund’s NAV outperformed the MLP Benchmark by 193 basis points (“bps”). The outperformance of the Fund over this period reflects our diversified approach to investing in non-cyclical energy infrastructure. Specifically, the Fund’s overweight positions in Utilities (not in AMZX) helped drive performance. EIP has sought to consistently run a more conservative portfolio compared to the MLP Benchmark. This conservatism, in EIP’s opinion, is reflected in holding a more diversified set of higher quality companies that themselves have more conservative balance sheets, lower dividend payout ratios, less exposure to commodity prices and more stable cash flows. While the Fund’s portfolio predominantly holds companies that own natural and legal monopolies operating transport infrastructure in both the pipeline and power sectors, the Fund selectively owns more diversified energy companies where EIP believes valuations indicate the cyclical, non-infrastructure portion of their assets are grossly
| (1) | Total return is based on the combination of reinvested dividend, capital gain and return of capital distributions, if any, at prices obtained by the Dividend Reinvestment Plan and changes in NAV per Common Share for NAV returns and changes in Common Share price for market value returns. Total returns do not reflect sales load and are not annualized for periods of less than one year. |
Portfolio Commentary (Continued)
First Trust New Opportunities MLP & Energy Fund (FPL)
Semi-Annual Report
April 30, 2023 (Unaudited)
mispriced. EIP believes integrated oil and gas companies (IOCs) possess those characteristics today and so EIP initiated positions in some of these companies over the last few quarters. At the end of the six-month period, IOCs represented about 4.6% of the Fund’s portfolio.
Two important factors affecting the return of the Fund, relative to the MLP Benchmark, are the Fund’s accrual for taxes and the use of financial leverage through a line of credit. The Fund uses leverage because its portfolio managers believe that, over time, leverage can enhance total return for common shareholders. However, the use of leverage can also increase the volatility of the NAV and, therefore, the share price. For example, if the prices of securities held by the Fund decline, the effect of changes in common share NAV and common share total return loss would be magnified by the use of leverage. Conversely, leverage may enhance common share returns during periods when the prices of securities held by the Fund generally are rising. Unlike the Fund, the MLP Benchmark is not leveraged, nor are its returns net of an accrual for taxes. Leverage had a positive impact on the performance of the Fund over the period. Derivatives also had a positive impact on the performance of the Fund over the reporting period.
The Fund has a practice of seeking to maintain a relatively stable monthly distribution, which may be changed at any time. The practice has no impact on the Fund’s investment strategy and may reduce the Fund’s NAV. However, the Advisor believes the practice helps maintain the Fund’s competitiveness and may benefit the Fund’s market price and premium/discount to the Fund’s NAV. The monthly distribution rate began and ended the period at $0.0375 per share. At the $0.0375 per share monthly distribution rate, the annualized distribution rate at April 30, 2023 was 6.32% at NAV and 7.49% at market price. The final determination of the source and tax status of all 2023 distributions will be made after the end of 2023 and will be provided on Form 1099-DIV. The foregoing is not to be construed as tax advice. Please consult your tax advisor for further information regarding tax matters.
Market and Fund Outlook
Energy infrastructure companies in the portfolio have generally had stable earnings historically, but negative sentiment around energy stocks in general weighed on valuations. Over the last nine years, energy has seen multiple compression of nearly 30%, while MLPs have seen multiple compression of 60%. This negative sentiment began to fade with a sharp jump in the price of oil and natural gas in the first quarter of 2022. Despite improved sentiment, the companies in the portfolio were still trading at a 36% discount at the end of the period compared to the Index based on forward 12-month earnings expectations (11.8x vs 18.5x) (Source: Bloomberg as of April 30, 2023) with arithmetic average yields that are 3.7x the yield of the Index (6.1% vs 1.7%). EIP’s view is optimistic regarding the portfolio based on continued earnings growth among the energy infrastructure companies coupled with low valuations relative to the Index based on forward 12-month earnings expectations. Equities that trade at lower yields and higher P/E multiples have longer durations than equities that trade at higher yields and lower P/E multiples, so it makes sense to us that moderately higher inflation expectations and interest rates should favor the stocks in the portfolio relative to the Index.
EIP views the current level of capital discipline among conventional oil and gas producers as well as pipeline and midstream energy companies as a bullish development for investors in the space. Global capital spending for upstream oil and gas has collapsed due to, in EIP’s opinion, previous over-investment, poor historical returns and ESG (environmental, social, and corporate governance) pressures. Starting in 2021, as oil and natural gas prices began to go up following the low price levels experienced in 2020, the resulting increased cash flow was redirected to share repurchase, debt reduction, special dividends and in some cases renewable investments.(2) EIP views these trends as positive for investors, but EIP does not view the current amount of capital spending as being sufficient to meet natural production declines nor to grow capacity. Fossil fuels such as natural gas, oil, and coal still account for more than 82% of global primary energy use.(3) Global real gross domestic product (“GDP”) has a strong historical relationship to global primary energy use. Over the last fifty plus years there has never been a five-year period where average global GDP or average global primary energy use has been negative.(3)(4) In EIP’s opinion, the lack of conventional oil and gas supply growth and what appears to be inevitable demand growth over the next five plus years provides solid fundamentals for conventional energy investors.
EIP also believes regulated pipeline and power utilities in the portfolio offer a measurable degree of inflation protection.(5) Traditional businesses, like consumer staples, absorb increasing input costs then pass those costs onto customers by raising prices. There is often a lag effect as this occurs leading to margin compression. On the other hand, regulated pipeline and power utilities are cost-plus businesses that charge a price to customers equal to the sum-total of their costs, including the cost of debt and an allowed return on equity.
In EIP’s opinion, the long-term outlook for electricity and natural gas infrastructure is positive as the infrastructure is necessary to connect increasingly diverse sources of energy supply to consumers. In EIP’s view, while spikes in natural gas prices may continue to
| (2) | Source: FactSet, Bloomberg. |
| (3) | Source: BP Statistical Review of World Energy – June 2022. |
| (4) | Source: World Bank, EIP Estimates. |
| (5) | There is no guarantee that any investment strategy will successfully protect against inflation or will even be profitable. |
Portfolio Commentary (Continued)
First Trust New Opportunities MLP & Energy Fund (FPL)
Semi-Annual Report
April 30, 2023 (Unaudited)
drive sporadic switching to coal-fired power generation over the near term, the longer-term trend away from coal-fired power generation seems likely to continue. Publicly owned utilities’ five-year integrated resource plans and continued announcements of coal plant retirements support this view. In most cases these retirements are being replaced with natural gas and/or renewables requiring new transport infrastructure and, in EIP’s opinion, driving further growth in earnings.
EIP is optimistic about the technological breakthroughs in energy and invests in companies like renewable developers and network utilities that, where renewable resources are abundant, benefit from the lower cost and higher performance of renewables, batteries, and other new grid-related innovations. But EIP is not a venture capitalist; companies in the Fund’s portfolio must have a track record of profitability and a willingness to share some portion of that profitability through distributions. While the names in the portfolio change over time, the strategy and the sources of earnings stability and growth remain the same: investing in monopoly infrastructure that provides the low-cost way of shipping the lowest cost form of energy.
First Trust New Opportunities MLP & Energy Fund (FPL)
Portfolio of Investments
April 30, 2023 (Unaudited)
| Shares | | Description | | Value |
| COMMON STOCKS – 62.0% |
| | | Electric Utilities – 12.5% | | |
| 32,400 | | Alliant Energy Corp. (a)
| | $1,786,536 |
| 35,270 | | American Electric Power Co., Inc. (a)
| | 3,259,654 |
| 13,933 | | Constellation Energy Corp.
| | 1,078,414 |
| 4,800 | | Duke Energy Corp.
| | 474,624 |
| 7,300 | | Emera, Inc. (CAD) (b)
| | 310,621 |
| 247,250 | | Enel S.p.A., ADR
| | 1,673,883 |
| 20,200 | | Eversource Energy (b)
| | 1,567,722 |
| 65,800 | | Exelon Corp. (a)
| | 2,792,552 |
| 4,400 | | Fortis, Inc. (CAD) (b)
| | 193,199 |
| 6,200 | | Iberdrola S.A., ADR
| | 322,338 |
| 10,200 | | IDACORP, Inc.
| | 1,133,424 |
| 13,480 | | NextEra Energy, Inc. (a)
| | 1,032,972 |
| 6,490 | | Orsted A/S, ADR
| | 193,727 |
| 58,520 | | PPL Corp. (a)
| | 1,680,694 |
| 31,080 | | Southern (The) Co.
| | 2,285,934 |
| 14,800 | | Xcel Energy, Inc. (a)
| | 1,034,668 |
| | | | | 20,820,962 |
| | | Energy Equipment & Services – 0.8% | | |
| 133,800 | | Archrock, Inc. (b)
| | 1,376,802 |
| | | Gas Utilities – 7.0% | | |
| 54,620 | | AltaGas Ltd. (CAD) (b)
| | 955,452 |
| 17,900 | | Atmos Energy Corp.
| | 2,043,106 |
| 88,900 | | National Fuel Gas Co. (b)
| | 4,969,510 |
| 35,670 | | New Jersey Resources Corp.
| | 1,841,999 |
| 19,200 | | ONE Gas, Inc.
| | 1,477,440 |
| 12,840 | | UGI Corp.
| | 435,019 |
| | | | | 11,722,526 |
| | | Independent Power & Renewable Electricity Producers – 1.2% | | |
| 37,300 | | AES (The) Corp. (a) (b)
| | 882,518 |
| 33,390 | | Clearway Energy, Inc., Class A (b)
| | 967,642 |
| 8,000 | | EDP Renovaveis S.A. (EUR) (c)
| | 177,822 |
| | | | | 2,027,982 |
| | | Multi-Utilities – 9.1% | | |
| 60,000 | | Atco Ltd., Class I (CAD) (b)
| | 1,982,655 |
| 7,170 | | CenterPoint Energy, Inc. (b)
| | 218,470 |
| 16,450 | | CMS Energy Corp. (b)
| | 1,024,177 |
| 17,380 | | DTE Energy Co. (b)
| | 1,953,685 |
| 54,370 | | Public Service Enterprise Group, Inc. (a)
| | 3,436,184 |
| 40,400 | | Sempra Energy (a)
| | 6,281,796 |
| 3,130 | | WEC Energy Group, Inc.
| | 301,012 |
| | | | | 15,197,979 |
| | | Oil, Gas & Consumable Fuels – 31.0% | | |
| 30,000 | | BP PLC, ADR (a)
| | 1,208,400 |
| 9,410 | | Cheniere Energy, Inc. (a)
| | 1,439,730 |
| 117,040 | | DT Midstream, Inc. (b)
| | 5,766,561 |
| 103,085 | | Enbridge, Inc.
| | 4,098,660 |
| 130,664 | | Keyera Corp. (CAD) (b)
| | 3,074,560 |
| 363,998 | | Kinder Morgan, Inc. (b)
| | 6,242,566 |
| 100,006 | | ONEOK, Inc. (a) (b)
| | 6,541,392 |
| 53,000 | | Shell PLC, ADR (a)
| | 3,284,940 |
| 45,500 | | Targa Resources Corp. (b)
| | 3,436,615 |
See Notes to Financial Statements
Page 7
First Trust New Opportunities MLP & Energy Fund (FPL)
Portfolio of Investments (Continued)
April 30, 2023 (Unaudited)
| Shares | | Description | | Value |
| COMMON STOCKS (Continued) |
| | | Oil, Gas & Consumable Fuels (Continued) | | |
| 75,109 | | TC Energy Corp.
| | $3,120,028 |
| 58,800 | | TotalEnergies SE, ADR (a)
| | 3,759,084 |
| 320,178 | | Williams (The) Cos., Inc. (a)
| | 9,688,586 |
| | | | | 51,661,122 |
| | | Semiconductors & Semiconductor Equipment – 0.1% | | |
| 800 | | Enphase Energy, Inc. (d)
| | 131,360 |
| | | Water Utilities – 0.3% | | |
| 3,200 | | American Water Works Co., Inc.
| | 474,400 |
| | | Total Common Stocks
| | 103,413,133 |
| | | (Cost $102,702,025) | | |
| Units | | Description | | Value |
| MASTER LIMITED PARTNERSHIPS – 59.7% |
| | | Chemicals – 2.8% | | |
| 210,988 | | Westlake Chemical Partners, L.P. (b)
| | 4,734,571 |
| | | Energy Equipment & Services – 0.4% | | |
| 31,000 | | USA Compression Partners, L.P.
| | 647,900 |
| | | Gas Utilities – 0.8% | | |
| 88,500 | | Suburban Propane Partners, L.P. (b)
| | 1,391,220 |
| | | Independent Power & Renewable Electricity Producers – 1.3% | | |
| 37,319 | | NextEra Energy Partners, L.P. (b) (e)
| | 2,146,216 |
| | | Oil, Gas & Consumable Fuels – 54.4% | | |
| 217,269 | | Cheniere Energy Partners, L.P. (b)
| | 9,909,639 |
| 1,232,960 | | Energy Transfer, L.P. (b)
| | 15,880,525 |
| 16,000 | | EnLink Midstream, LLC (b) (e)
| | 156,960 |
| 692,564 | | Enterprise Products Partners, L.P. (b)
| | 18,221,359 |
| 253,830 | | Hess Midstream, L.P., Class A (b) (e)
| | 7,447,372 |
| 171,190 | | Holly Energy Partners, L.P. (b)
| | 2,852,025 |
| 315,819 | | Magellan Midstream Partners, L.P. (b)
| | 17,622,700 |
| 245,000 | | MPLX, L.P. (b)
| | 8,572,550 |
| 631,720 | | Plains All American Pipeline, L.P. (b)
| | 8,149,188 |
| 41,070 | | TXO Energy Partners L.P. (d)
| | 914,629 |
| 35,000 | | Western Midstream Partners, L.P. (b)
| | 926,450 |
| | | | | 90,653,397 |
| | | Total Master Limited Partnerships
| | 99,573,304 |
| | | (Cost $72,961,515) | | |
| Shares | | Description | | Value |
| MONEY MARKET FUNDS – 3.9% |
| 6,479,015 | | Morgan Stanley Institutional Liquidity Funds - Treasury Portfolio - Institutional Class - 4.71% (f)
| | 6,479,015 |
| | | (Cost $6,479,015) | | |
| | | Total Investments – 125.6%
| | 209,465,452 |
| | | (Cost $182,142,555) | | |
| Number of Contracts | | Description | | Notional Amount | | Exercise Price | | Expiration Date | | Value |
| CALL OPTIONS WRITTEN – (0.2)% |
| (187) | | AES (The) Corp.
| | $(442,442) | | $26.00 | | 06/16/23 | | (5,423) |
| (324) | | Alliant Energy Corp.
| | (1,786,536) | | 57.50 | | 06/16/23 | | (27,540) |
Page 8
See Notes to Financial Statements
First Trust New Opportunities MLP & Energy Fund (FPL)
Portfolio of Investments (Continued)
April 30, 2023 (Unaudited)
| Number of Contracts | | Description | | Notional Amount | | Exercise Price | | Expiration Date | | Value |
| CALL OPTIONS WRITTEN (Continued) |
| (352) | | American Electric Power Co., Inc.
| | $(3,253,184) | | $97.50 | | 05/19/23 | | $(3,872) |
| (300) | | BP PLC, ADR
| | (1,208,400) | | 43.00 | | 05/19/23 | | (4,800) |
| (94) | | Cheniere Energy, Inc.
| | (1,438,200) | | 160.00 | | 05/19/23 | | (14,570) |
| (658) | | Exelon Corp.
| | (2,792,552) | | 45.00 | | 05/19/23 | | (6,580) |
| (134) | | NextEra Energy, Inc.
| | (1,026,842) | | 82.50 | | 05/19/23 | | (1,340) |
| (874) | | ONEOK, Inc.
| | (5,716,834) | | 70.00 | | 06/16/23 | | (54,188) |
| (585) | | PPL Corp.
| | (1,680,120) | | 29.00 | | 05/19/23 | | (25,155) |
| (543) | | Public Service Enterprise Group, Inc.
| | (3,431,760) | | 65.00 | | 05/19/23 | | (27,150) |
| (404) | | Sempra Energy
| | (6,281,796) | | 160.00 | | 05/19/23 | | (48,480) |
| (530) | | Shell PLC, ADR
| | (3,284,940) | | 65.00 | | 05/19/23 | | (16,960) |
| (588) | | TotalEnergies SE, ADR
| | (3,759,084) | | 67.50 | | 05/19/23 | | (17,640) |
| (1,601) | | Williams (The) Cos., Inc.
| | (4,844,626) | | 32.00 | | 05/19/23 | | (16,010) |
| (148) | | Xcel Energy, Inc.
| | (1,034,668) | | 70.00 | | 05/19/23 | | (17,760) |
| | | Total Call Options Written
| | (287,468) |
| | | (Premiums received $431,943) | | | | | | | | |
| Outstanding Loan – (25.7)%
| | (42,900,000) |
| | Net Other Assets and Liabilities – 0.3%
| | 553,350 |
| | Net Assets – 100.0%
| | $166,831,334 |
| (a) | All or a portion of this security’s position represents cover for outstanding options written. |
| (b) | All or a portion of this security serves as collateral on the outstanding loan. At April 30, 2023, the segregated value of these securities amounts to $97,495,666. |
| (c) | This security is fair valued by the Advisor’s Pricing Committee in accordance with procedures approved by the Fund’s Board of Trustees and in accordance with provisions of the Investment Company Act of 1940 and rules thereunder, as amended. At April 30, 2023, the security noted as such is valued at $177,822 or 0.1% of net assets. The security is fair valued using a factor provided by a third-party pricing service due to the change in value between the foreign markets’ close and the New York Stock Exchange close exceeding a certain threshold. On days when this threshold is not exceeded, the security is typically valued at the last sale price on the exchange on which it is principally traded. |
| (d) | Non-income producing security. |
| (e) | This security is taxed as a “C” corporation for federal income tax purposes. |
| (f) | Rate shown reflects yield as of April 30, 2023. |
| ADR | American Depositary Receipt |
| CAD | Canadian Dollar |
| EUR | Euro |
See Notes to Financial Statements
Page 9
First Trust New Opportunities MLP & Energy Fund (FPL)
Portfolio of Investments (Continued)
April 30, 2023 (Unaudited)
Valuation Inputs
A summary of the inputs used to value the Fund’s investments as of April 30, 2023 is as follows (see Note 2A - Portfolio Valuation in the Notes to Financial Statements):
| ASSETS TABLE |
| | Total
Value at
4/30/2023 | Level 1
Quoted
Prices | Level 2
Significant
Observable
Inputs | Level 3
Significant
Unobservable
Inputs |
| Common Stocks: | | | | |
Independent Power & Renewable Electricity Producers
| $ 2,027,982 | $ 1,850,160 | $ 177,822 | $ — |
Other Industry Categories*
| 101,385,151 | 101,385,151 | — | — |
Master Limited Partnerships*
| 99,573,304 | 99,573,304 | — | — |
Money Market Funds
| 6,479,015 | 6,479,015 | — | — |
Total Investments
| $ 209,465,452 | $ 209,287,630 | $ 177,822 | $— |
| |
| LIABILITIES TABLE |
| | Total
Value at
4/30/2023 | Level 1
Quoted
Prices | Level 2
Significant
Observable
Inputs | Level 3
Significant
Unobservable
Inputs |
Call Options Written
| $ (287,468) | $ (287,468) | $ — | $ — |
| * | See Portfolio of Investments for industry breakout. |
Page 10
See Notes to Financial Statements
First Trust New Opportunities MLP & Energy Fund (FPL)
Statement of Assets and Liabilities
April 30, 2023 (Unaudited)
| ASSETS: | |
Investments, at value
(Cost $182,142,555)
| $ 209,465,452 |
| Receivables: | |
Dividends
| 861,697 |
Income taxes
| 86,019 |
Interest
| 25,277 |
Dividend reclaims
| 5,989 |
Prepaid expenses
| 18,512 |
Total Assets
| 210,462,946 |
| LIABILITIES: | |
Outstanding loan
| 42,900,000 |
Options written, at value (Premiums received $431,943)
| 287,468 |
| Payables: | |
Investment advisory fees
| 171,622 |
Interest and fees on loan
| 154,387 |
Audit and tax fees
| 87,912 |
Administrative fees
| 10,156 |
Trustees’ fees and expenses
| 6,056 |
Shareholder reporting fees
| 5,877 |
Custodian fees
| 3,203 |
Legal fees
| 2,093 |
Transfer agent fees
| 1,326 |
Financial reporting fees
| 732 |
Other liabilities
| 780 |
Total Liabilities
| 43,631,612 |
NET ASSETS
| $166,831,334 |
| NET ASSETS consist of: | |
Paid-in capital
| $ 303,542,008 |
Par value
| 234,477 |
Accumulated distributable earnings (loss)
| (136,945,151) |
NET ASSETS
| $166,831,334 |
NET ASSET VALUE, per Common Share (par value $0.01 per Common Share)
| $7.12 |
Number of Common Shares outstanding (unlimited number of Common Shares has been authorized)
| 23,447,660 |
See Notes to Financial Statements
Page 11
First Trust New Opportunities MLP & Energy Fund (FPL)
Statement of Operations
For the Six Months Ended April 30, 2023 (Unaudited)
| INVESTMENT INCOME: | |
Dividends (net of foreign withholding tax of $108,791)
| $ 2,033,721 |
Interest
| 87,571 |
Total investment income
| 2,121,292 |
| EXPENSES: | |
Investment advisory fees
| 1,039,278 |
Interest and fees on loan
| 919,300 |
Audit and tax fees
| 50,241 |
Administrative fees
| 48,879 |
Shareholder reporting fees
| 31,586 |
Legal fees
| 15,883 |
Listing expense
| 12,022 |
Trustees’ fees and expenses
| 9,115 |
Transfer agent fees
| 8,946 |
Custodian fees
| 8,629 |
Financial reporting fees
| 4,587 |
Other
| 10,896 |
Total expenses
| 2,159,362 |
NET INVESTMENT INCOME (LOSS) BEFORE TAXES
| (38,070) |
Current federal income tax benefit (expense)
| 480,710 | |
Current state income tax benefit (expense)
| 20,326 | |
Deferred federal income tax benefit (expense)
| 574,007 | |
Deferred state income tax benefit (expense)
| 33,148 | |
Total income tax benefit (expense)
| 1,108,191 |
NET INVESTMENT INCOME (LOSS)
| 1,070,121 |
| NET REALIZED AND UNREALIZED GAIN (LOSS): | |
| Net realized gain (loss) before taxes on: | |
Investments
| 1,429,101 |
Written options contracts
| 870,796 |
Foreign currency transactions
| (10,803) |
Net realized gain (loss) before taxes
| 2,289,094 |
Current federal income tax benefit (expense)
| (480,710) | |
Current state income tax benefit (expense)
| (27,760) | |
Total income tax benefit (expense)
| (508,470) |
Net realized gain (loss) on investments, written options contracts and foreign currency transactions
| 1,780,624 |
| Net change in unrealized appreciation (depreciation) before taxes on: | |
Investments
| 3,048,059 |
Written options contracts
| 13,027 |
Foreign currency translation
| (68) |
Net change in unrealized appreciation (depreciation) before taxes
| 3,061,018 |
Deferred federal income tax benefit (expense)
| (574,007) | |
Deferred state income tax benefit (expense)
| (33,148) | |
Total income tax benefit (expense)
| (607,155) |
Net change in unrealized appreciation (depreciation) on investments, written options contracts and foreign currency translation
| 2,453,863 |
NET REALIZED AND UNREALIZED GAIN (LOSS)
| 4,234,487 |
NET INCREASE (DECREASE) IN NET ASSETS RESULTING FROM OPERATIONS
| $ 5,304,608 |
Page 12
See Notes to Financial Statements
First Trust New Opportunities MLP & Energy Fund (FPL)
Statements of Changes in Net Assets
| | Six Months
Ended
4/30/2023
(Unaudited) | | Year
Ended
10/31/2022 |
| OPERATIONS: | | | |
Net investment income (loss)
| $ 1,070,121 | | $ 6,444,372 |
Net realized gain (loss)
| 1,780,624 | | 10,172,548 |
Net change in unrealized appreciation (depreciation)
| 2,453,863 | | 9,665,186 |
Net increase (decrease) in net assets resulting from operations
| 5,304,608 | | 26,282,106 |
| DISTRIBUTIONS TO SHAREHOLDERS FROM: | | | |
Investment operations
| (5,288,937) | | (10,940,992) |
| CAPITAL TRANSACTIONS: | | | |
Repurchase of Common Shares *
| (1,310,482) | | (6,372,428) |
Net increase (decrease) in net assets resulting from capital transactions
| (1,310,482) | | (6,372,428) |
Total increase (decrease) in net assets
| (1,294,811) | | 8,968,686 |
| NET ASSETS: | | | |
Beginning of period
| 168,126,145 | | 159,157,459 |
End of period
| $ 166,831,334 | | $ 168,126,145 |
| CAPITAL TRANSACTIONS were as follows: | | | |
Common Shares at beginning of period
| 23,662,968 | | 24,720,592 |
Common Shares repurchased *
| (215,308) | | (1,057,624) |
Common Shares at end of period
| 23,447,660 | | 23,662,968 |
| * | On September 15, 2020, the Fund commenced a share repurchase program. For the six months ended April 30, 2023 and the fiscal year ended October 31, 2022, the Fund repurchased 215,308 and 1,057,624 Common Shares, respectively, at a weighted-average discount of 14.01% and 12.95%, respectively, from net asset value per share. The Fund’s share repurchase program ended on March 15, 2023. |
See Notes to Financial Statements
Page 13
First Trust New Opportunities MLP & Energy Fund (FPL)
Statement of Cash Flows
For the Six Months Ended April 30, 2023 (Unaudited)
| Cash flows from operating activities: | | |
Net increase (decrease) in net assets resulting from operations
| $5,304,608 | |
| Adjustments to reconcile net increase (decrease) in net assets resulting from operations to net cash provided by operating activities: | | |
Purchases of investments
| (43,223,856) | |
Sales of investments
| 40,968,644 | |
Proceeds from written options
| 1,176,088 | |
Return of capital received from investment in MLPs
| 4,161,549 | |
Net realized gain/loss on investments and written options
| (2,299,897) | |
Net change in unrealized appreciation/depreciation on investments and written options
| (3,061,086) | |
| Changes in assets and liabilities: | | |
Increase in income taxes receivable
| (488) | |
Increase in interest receivable
| (25,277) | |
Increase in dividend reclaims receivable
| (4,101) | |
Increase in dividends receivable
| (50,880) | |
Increase in prepaid expenses
| (10,788) | |
Increase in interest and fees payable on loan
| 20,209 | |
Increase in investment advisory fees payable
| 1,662 | |
Decrease in audit and tax fees payable
| (50,945) | |
Increase in legal fees payable
| 1,507 | |
Decrease in shareholder reporting fees payable
| (13,216) | |
Increase in administrative fees payable
| 546 | |
Increase in custodian fees payable
| 6 | |
Decrease in transfer agent fees payable
| (1,682) | |
Increase in trustees’ fees and expenses payable
| 4,521 | |
Decrease in financial reporting fees payable
| (39) | |
Increase in other liabilities payable
| 379 | |
Cash provided by operating activities
| | $2,897,464 |
| Cash flows from financing activities: | | |
Repurchase of Common Shares
| (1,310,482) | |
Distributions to Common Shareholders from investment operations
| (5,288,937) | |
Cash used in financing activities
| | (6,599,419) |
Decrease in cash and foreign currency (a)
| | (3,701,955) |
Cash at beginning of period
| | 3,701,955 |
Cash at end of period
| | $— |
| Supplemental disclosure of cash flow information: | | |
Cash paid during the period for interest and fees
| | $924,368 |
Cash paid during the period for taxes
| | $7,921 |
| (a) | Includes net change in unrealized appreciation (depreciation) on foreign currency of $(68). |
Page 14
See Notes to Financial Statements
First Trust New Opportunities MLP & Energy Fund (FPL)
Financial Highlights
For a Common Share outstanding throughout each period
| | Six Months
Ended
4/30/2023
(Unaudited) | | Year Ended October 31, |
| | 2022 | | 2021 | | 2020 | | 2019 | | 2018 | |
Net asset value, beginning of period
| $ 7.11 | | $ 6.44 | | $ 4.73 | | $ 9.41 | | $ 9.43 | | $ 11.95 |
| Income from investment operations: | | | | | | | | | | | |
Net investment income (loss)
| 0.05 | | 0.26 | | 0.48 | | (1.07) | | 0.12 | | (0.28) |
Net realized and unrealized gain (loss)
| 0.18 | | 0.82 | | 1.65 | | (2.93) | | 0.76 (a) | | (1.04) (a) |
Total from investment operations
| 0.23 | | 1.08 | | 2.13 | | (4.00) | | 0.88 | | (1.32) |
| Distributions paid to shareholders from: | | | | | | | | | | | |
Net investment income
| — | | (0.03) | | (0.03) | | — | | — | | — |
Net realized gain
| (0.23) | | (0.42) | | (0.42) | | — | | (0.25) | | — |
Return of capital
| — | | — | | — | | (0.68) | | (0.65) | | (1.20) |
Total distributions paid to Common Shareholders
| (0.23) | | (0.45) | | (0.45) | | (0.68) | | (0.90) | | (1.20) |
Common Share repurchases
| 0.01 | | 0.04 | | 0.03 | | 0.00 (b) | | — | | — |
Net asset value, end of period
| $7.12 | | $7.11 | | $6.44 | | $4.73 | | $9.41 | | $9.43 |
Market value, end of period
| $6.01 | | $6.08 | | $5.80 | | $3.66 | | $8.66 | | $8.65 |
Total return based on net asset value (c)
| 3.91% | | 19.00% | | 48.22% | | (43.24)% | | 10.34% (a) | | (11.66)% (a) |
Total return based on market value (c)
| 2.57% | | 12.99% | | 72.51% | | (52.28)% | | 10.70% | | (18.70)% |
Net assets, end of period (in 000’s)
| $ 166,831 | | $ 168,126 | | $ 159,157 | | $ 121,183 | | $ 241,815 | | $ 242,226 |
Portfolio turnover rate
| 8% | | 57% | | 126% | | 113% | | 74% | | 64% |
| Ratios of expenses to average net assets: | | | | | | | | | | | |
Including current and deferred income taxes (d)
| 2.62% (e) | | 2.15% | | 2.34% | | 5.51% (f) | | 2.89% | | 2.81% |
Excluding current and deferred income taxes
| 2.61% (e) | | 2.22% | | 2.14% | | 5.34% (f) | | 2.86% | | 2.79% |
Excluding current and deferred income taxes and interest expense
| 1.50% (e) | | 1.49% | | 1.50% | | 1.58% | | 1.58% | | 1.57% |
| Ratios of net investment income (loss) to average net assets: | | | | | | | | | | | |
Net investment income (loss) ratio before tax expenses
| (0.05)% (e) | | 0.17% | | (0.13)% | | (3.40)% (f) | | (0.90)% | | (0.40)% |
Net investment income (loss) ratio including tax expenses (d)
| (0.06)% (e) | | 0.24% | | (0.32)% | | (3.57)% (f) | | (0.93)% | | (0.41)% |
| Indebtedness: | | | | | | | | | | | |
Total loan outstanding (in 000’s)
| $ 42,900 | | $ 42,900 | | $ 40,400 | | $ 33,400 | | $ 89,000 | | $ 87,500 |
Asset coverage per $1,000 of indebtedness (g)
| $ 4,889 | | $ 4,919 | | $ 4,940 | | $ 4,628 | | $ 3,717 | | $ 3,768 |
| (a) | During the fiscal years ended October 31, 2019 and 2018, the Fund received reimbursements from the sub-advisor in the amounts of $228 and $12,533, respectively, in connection with trade errors, which represent less than $0.01 per share. Since the sub-advisor reimbursed the Fund, there was no effect on the Fund’s total return. |
| (b) | Amount represents less than $0.01 per share. |
| (c) | Total return is based on the combination of reinvested dividend, capital gain and return of capital distributions, if any, at prices obtained by the Dividend Reinvestment Plan, and changes in net asset value per share for net asset value returns and changes in Common Share Price for market value returns. Total returns do not reflect sales load and are not annualized for periods of less than one year. Past performance is not indicative of future results. |
| (d) | Includes current and deferred income taxes associated with each component of the Statement of Operations. |
| (e) | Annualized. |
| (f) | This ratio includes breakage fees. If breakage fees had not been included, these expense ratios would have been 2.81% lower and the net investment income ratios would have been 2.81% higher. |
| (g) | Calculated by subtracting the Fund’s total liabilities (not including the loan outstanding) from the Fund’s total assets, and dividing by the outstanding loan balance in 000’s. |
See Notes to Financial Statements
Page 15
Notes to Financial Statements
First Trust New Opportunities MLP & Energy Fund (FPL)
April 30, 2023 (Unaudited)
1. Organization
First Trust New Opportunities MLP & Energy Fund (the “Fund”) is a non-diversified, closed-end management investment company organized as a Massachusetts business trust on October 15, 2013, and is registered with the Securities and Exchange Commission under the Investment Company Act of 1940, as amended (the “1940 Act”). The Fund trades under the ticker symbol “FPL” on the New York Stock Exchange (“NYSE”).
The Fund’s investment objective is to seek a high level of total return with an emphasis on current distributions paid to common shareholders. The Fund seeks to provide its Common Shareholders with a vehicle to invest in a portfolio of cash-generating securities, with a focus on investing in publicly-traded master limited partnerships (“MLPs”), MLP-related entities and other companies in the energy sector and energy utility industries that are weighted towards non-cyclical, fee-for-service revenues. Under normal market conditions, the Fund invests at least 85% of its managed assets in equity and debt securities of MLPs, MLP-related entities and other energy sector and energy utilities companies that Energy Income Partners, LLC (“EIP” or the “Sub-Advisor”) believes offer opportunities for growth and income. There can be no assurance that the Fund will achieve its investment objective. The Fund may not be appropriate for all investors.
2. Significant Accounting Policies
The Fund is considered an investment company and follows accounting and reporting guidance under Financial Accounting Standards Board Accounting Standards Codification (“ASC”) Topic 946, “Financial Services-Investment Companies.” The following is a summary of significant accounting policies consistently followed by the Fund in the preparation of the financial statements. The preparation of the financial statements in accordance with accounting principles generally accepted in the United States of America (“U.S. GAAP”) requires management to make estimates and assumptions that affect the reported amounts and disclosures in the financial statements. Actual results could differ from those estimates.
A. Portfolio Valuation
The net asset value (“NAV”) of the Common Shares of the Fund is determined daily as of the close of regular trading on the NYSE, normally 4:00 p.m. Eastern time, on each day the NYSE is open for trading. If the NYSE closes early on a valuation day, the NAV is determined as of that time. Foreign securities are priced using data reflecting the earlier closing of the principal markets for those securities. The Fund’s NAV per Common Share is calculated by dividing the value of all assets of the Fund (including accrued interest and dividends), less all liabilities (including accrued expenses, the value of call options written (sold), dividends declared but unpaid, deferred income taxes and any borrowings of the Fund), by the total number of Common Shares outstanding.
The Fund’s investments are valued daily at market value or, in the absence of market value with respect to any portfolio securities, at fair value. Market value prices represent readily available market quotations such as last sale or official closing prices from a national or foreign exchange (i.e., a regulated market) and are primarily obtained from third-party pricing services. Fair value prices represent any prices not considered market value prices and are either obtained from a third-party pricing service or are determined by the Pricing Committee of the Fund’s investment advisor, First Trust Advisors L.P. (“First Trust” or the “Advisor”), in accordance with valuation procedures approved by the Fund’s Board of Trustees, and in accordance with provisions of the 1940 Act and rules thereunder. Investments valued by the Advisor’s Pricing Committee, if any, are footnoted as such in the footnotes to the Portfolio of Investments. The Fund’s investments are valued as follows:
Common stocks, real estate investment trusts, MLPs, and other equity securities listed on any national or foreign exchange (excluding The Nasdaq Stock Market LLC (“Nasdaq”) and the London Stock Exchange Alternative Investment Market (“AIM”)) are valued at the last sale price on the exchange on which they are principally traded or, for Nasdaq and AIM securities, the official closing price. Securities traded on more than one securities exchange are valued at the last sale price or official closing price, as applicable, at the close of the securities exchange representing the primary exchange for such securities.
Securities trading on foreign exchanges or over-the-counter markets that close prior to the NYSE close may be valued using a systematic fair valuation model provided by a third-party pricing service. If these foreign securities meet certain criteria in relation to the valuation model, their valuation is systematically adjusted to reflect the impact of movement in the U.S. market after the close of the foreign markets.
Exchange-traded options contracts are valued at the closing price in the market where such contracts are principally traded. If no closing price is available, exchange-traded options contracts are valued at the mean of their most recent bid and asked price, if available, and otherwise at their closing bid price. Over-the-counter options contracts are valued at the mean of their most recent bid and asked price, if available, and otherwise at their closing bid price.
Securities traded in an over-the-counter market are valued at the mean of their most recent bid and asked price, if available, and otherwise at their last trade price.
Notes to Financial Statements (Continued)
First Trust New Opportunities MLP & Energy Fund (FPL)
April 30, 2023 (Unaudited)
Certain securities may not be able to be priced by pre-established pricing methods. Such securities may be valued by the Advisor’s Pricing Committee at fair value. These securities generally include, but are not limited to, restricted securities (securities which may not be publicly sold without registration under the Securities Act of 1933, as amended) for which a third-party pricing service is unable to provide a market price; securities whose trading has been formally suspended; a security whose market or fair value price is not available from a pre-established pricing source; a security with respect to which an event has occurred that is likely to materially affect the value of the security after the market has closed but before the calculation of the Fund’s NAV or make it difficult or impossible to obtain a reliable market quotation; and a security whose price, as provided by the third-party pricing service, does not reflect the security’s fair value. As a general principle, the current fair value of a security would appear to be the amount which the owner might reasonably expect to receive for the security upon its current sale. When fair value prices are used, generally they will differ from market quotations or official closing prices on the applicable exchanges. A variety of factors may be considered in determining the fair value of such securities, including, but not limited to, the following:
| 1) | the last sale price on the exchange on which they are principally traded or, for Nasdaq and AIM securities, the official closing price; |
| 2) | the type of security; |
| 3) | the size of the holding; |
| 4) | the initial cost of the security; |
| 5) | transactions in comparable securities; |
| 6) | price quotes from dealers and/or third-party pricing services; |
| 7) | relationships among various securities; |
| 8) | information obtained by contacting the issuer, analysts, or the appropriate stock exchange; |
| 9) | an analysis of the issuer’s financial statements; |
| 10) | the existence of merger proposals or tender offers that might affect the value of the security; and |
| 11) | other relevant factors. |
If the securities in question are foreign securities, the following additional information may be considered:
| 1) | the value of similar foreign securities traded on other foreign markets; |
| 2) | ADR trading of similar securities; |
| 3) | closed-end fund or exchange-traded fund trading of similar securities; |
| 4) | foreign currency exchange activity; |
| 5) | the trading prices of financial products that are tied to baskets of foreign securities; |
| 6) | factors relating to the event that precipitated the pricing problem; |
| 7) | whether the event is likely to recur; |
| 8) | whether the effects of the event are isolated or whether they affect entire markets, countries or regions; and |
| 9) | other relevant factors. |
The Fund is subject to fair value accounting standards that define fair value, establish the framework for measuring fair value and provide a three-level hierarchy for fair valuation based upon the inputs to the valuation as of the measurement date. The three levels of the fair value hierarchy are as follows:
| • | Level 1 – Level 1 inputs are quoted prices in active markets for identical investments. An active market is a market in which transactions for the investment occur with sufficient frequency and volume to provide pricing information on an ongoing basis. |
| • | Level 2 – Level 2 inputs are observable inputs, either directly or indirectly, and include the following: |
| o | Quoted prices for similar investments in active markets. |
| o | Quoted prices for identical or similar investments in markets that are non-active. A non-active market is a market where there are few transactions for the investment, the prices are not current, or price quotations vary substantially either over time or among market makers, or in which little information is released publicly. |
| o | Inputs other than quoted prices that are observable for the investment (for example, interest rates and yield curves observable at commonly quoted intervals, volatilities, prepayment speeds, loss severities, credit risks, and default rates). |
| o | Inputs that are derived principally from or corroborated by observable market data by correlation or other means. |
| • | Level 3 – Level 3 inputs are unobservable inputs. Unobservable inputs may reflect the reporting entity’s own assumptions about the assumptions that market participants would use in pricing the investment. |
Notes to Financial Statements (Continued)
First Trust New Opportunities MLP & Energy Fund (FPL)
April 30, 2023 (Unaudited)
The inputs or methodologies used for valuing investments are not necessarily an indication of the risk associated with investing in those investments. A summary of the inputs used to value the Fund’s investments as of April 30, 2023, is included with the Fund’s Portfolio of Investments.
B. Option Contracts
The Fund is subject to equity price risk in the normal course of pursuing its investment objective and may write (sell) options to hedge against changes in the value of equities. Also, the Fund seeks to generate additional income, in the form of premiums received, from writing (selling) the options. The Fund may write (sell) covered call or put options (“options”) on all or a portion of the MLPs and common stocks held in the Fund’s portfolio as determined to be appropriate by the Sub-Advisor. The number of options the Fund can write (sell) is limited by the amount of MLPs and common stocks the Fund holds in its portfolio. The Fund will not write (sell) “naked” or uncovered options. When the Fund writes (sells) an option, an amount equal to the premium received by the Fund is included in “Options written, at value” on the Fund’s Statement of Assets and Liabilities. Options are marked-to-market daily and their value will be affected by changes in the value and dividend rates of the underlying equity securities, changes in interest rates, changes in the actual or perceived volatility of the securities markets and the underlying equity securities and the remaining time to the options’ expiration. The value of options may also be adversely affected if the market for the options becomes less liquid or trading volume diminishes.
The options that the Fund writes (sells) will either be exercised, expire or be canceled pursuant to a closing transaction. If the price of the underlying equity security exceeds the option’s exercise price, it is likely that the option holder will exercise the option. If an option written (sold) by the Fund is exercised, the Fund would be obligated to deliver the underlying equity security to the option holder upon payment of the strike price. In this case, the option premium received by the Fund will be added to the amount realized on the sale of the underlying security for purposes of determining gain or loss and is included in “Net realized gain (loss) before taxes on investments” on the Statement of Operations. If the price of the underlying equity security is less than the option’s strike price, the option will likely expire without being exercised. The option premium received by the Fund will, in this case, be treated as short-term capital gain on the expiration date of the option. The Fund may also elect to close out its position in an option prior to its expiration by purchasing an option of the same series as the option written (sold) by the Fund. Gain or loss on options is presented separately as “Net realized gain (loss) before taxes on written options contracts” on the Statement of Operations.
The options that the Fund writes (sells) give the option holder the right, but not the obligation, to purchase a security from the Fund at the strike price on or prior to the option’s expiration date. The ability to successfully implement the writing (selling) of covered call options depends on the ability of the Sub-Advisor to predict pertinent market movements, which cannot be assured. Thus, the use of options may require the Fund to sell portfolio securities at inopportune times or for prices other than current market value, which may limit the amount of appreciation the Fund can realize on an investment, or may cause the Fund to hold a security that it might otherwise sell. As the writer (seller) of a covered option, the Fund foregoes, during the option’s life, the opportunity to profit from increases in the market value of the security covering the option above the sum of the premium and the strike price of the option, but has retained the risk of loss should the price of the underlying security decline. The writer (seller) of an option has no control over the time when it may be required to fulfill its obligation as a writer (seller) of the option. Once an option writer (seller) has received an exercise notice, it cannot effect a closing purchase transaction in order to terminate its obligation under the option and must deliver the underlying security to the option holder at the exercise price.
Over-the-counter options have the risk of the potential inability of counterparties to meet the terms of their contracts. The Fund’s maximum equity price risk for purchased options is limited to the premium initially paid. In addition, certain risks may arise upon entering into option contracts including the risk that an illiquid secondary market will limit the Fund’s ability to close out an option contract prior to the expiration date and that a change in the value of the option contract may not correlate exactly with changes in the value of the securities hedged.
C. Securities Transactions and Investment Income
Securities transactions are recorded as of the trade date. Realized gains and losses from securities transactions are recorded on the identified cost basis. Dividend income is recorded on the ex-dividend date. Interest income is recorded daily on the accrual basis, including amortization of premiums and accretion of discounts. The Fund will rely to some extent on information provided by the MLPs, which is not necessarily timely, to estimate taxable income allocable to the MLP units held in the Fund’s portfolio and to estimate the associated deferred tax asset or liability. From time to time, the Fund will modify its estimates and/or assumptions regarding its deferred tax liability as new information becomes available. To the extent the Fund modifies its estimates and/or assumptions, the NAV of the Fund will likely fluctuate.
Distributions received from the Fund’s investments in MLPs generally are comprised of return of capital and investment income. The Fund records estimated return of capital and investment income based on historical information available from each MLP. These estimates may subsequently be revised based on information received from the MLPs after their tax reporting periods are concluded.
Notes to Financial Statements (Continued)
First Trust New Opportunities MLP & Energy Fund (FPL)
April 30, 2023 (Unaudited)
The United Kingdom’s Financial Conduct Authority (the “FCA”), which regulates the London Interbank Offered Rates (“LIBOR”), announced on March 5, 2021 that it intended to phase-out all LIBOR reference rates, beginning December 31, 2021. Since that announcement, the FCA has ceased publication of all non-USD LIBOR reference rates and the 1-week and 2-month USD LIBOR reference rates as of December 31, 2021. The remaining USD LIBOR settings will cease to be published or no longer be representative immediately after June 30, 2023. The International Swaps and Derivatives Association, Inc. (“ISDA”) confirmed that the FCA’s March 5, 2021 announcement of its intention to cease providing LIBOR reference rates, constituted an index cessation event under the Interbank Offered Rates (“IBOR”) Fallbacks Supplement and the ISDA 2020 IBOR Fallbacks Protocol for all 35 LIBOR settings and confirmed that the spread adjustment to be used in ISDA fallbacks was fixed as of the date of the announcement.
In the United States, the Alternative Reference Rates Committee (the “ARRC”), a group of market participants convened by the Board of Governors of the Federal Reserve System and the Federal Reserve Bank of New York in cooperation with other federal and state government agencies, has since 2014 undertaken efforts to identify U.S. dollar reference interest rates as alternatives to LIBOR and to facilitate the mitigation of LIBOR-related risks. In June 2017, the ARRC identified the Secured Overnight Financing Rate (“SOFR”), a broad measure of the cost of cash overnight borrowing collateralized by U.S. Treasury securities, as the preferred alternative for U.S. dollar LIBOR. The Federal Reserve Bank of New York began daily publishing of SOFR in April 2018. There is no assurance that any alternative reference rate, including SOFR, will be similar to or produce the same value or economic equivalence as LIBOR or that instruments using an alternative rate will have the same volume or liquidity.
At this time, it is not possible to predict the full impact of the elimination of LIBOR and the establishment of an alternative reference rate on the Fund or its investments.
D. Foreign Currency
The books and records of the Fund are maintained in U.S. dollars. Foreign currencies, investments and other assets and liabilities are translated into U.S. dollars at the exchange rates prevailing at the end of the period. Purchases and sales of investments and items of income and expense are translated on the respective dates of such transactions. Unrealized gains and losses on assets and liabilities, other than investments in securities, which result from changes in foreign currency exchange rates have been included in “Net change in unrealized appreciation (depreciation) before taxes on foreign currency translation” on the Statement of Operations. Unrealized gains and losses on investments in securities which result from changes in foreign exchange rates are included with fluctuations arising from changes in market price and are included in “Net change in unrealized appreciation (depreciation) before taxes on investments” on the Statement of Operations. Net realized foreign currency gains and losses include the effect of changes in exchange rates between trade date and settlement date on investment security transactions, foreign currency transactions and interest and dividends received and are included in “Net realized gain (loss) before taxes on foreign currency transactions” on the Statement of Operations. The portion of foreign currency gains and losses related to fluctuations in exchange rates between the initial purchase settlement date and subsequent sale trade date is included in “Net realized gain (loss) before taxes on investments” on the Statement of Operations.
E. Distributions to Shareholders
The Fund intends to make monthly distributions to Common Shareholders. The Fund’s distributions generally will consist of cash and paid-in kind distributions from MLPs or their affiliates, dividends from common stocks, and income from other investments held by the Fund less operating expenses, including taxes. Distributions to Common Shareholders are recorded on the ex-date and are based on U.S. GAAP, which may differ from their ultimate characterization for federal income tax purposes.
Distributions made from current or accumulated earnings and profits of the Fund will be taxable to shareholders as dividend income. Distributions that are in an amount greater than the Fund’s current and accumulated earnings and profits will represent a tax-deferred return of capital to the extent of a shareholder’s basis in the Common Shares, and such distributions will correspondingly increase the realized gain upon the sale of the Common Shares. Additionally, distributions not paid from current or accumulated earnings and profits that exceed a shareholder’s tax basis in the Common Shares will generally be taxed as a capital gain.
Distributions of $5,288,937 paid during the six months ended April 30, 2023 are anticipated to be characterized as taxable dividends for federal income tax purposes. The amounts may be eligible to be taxed as qualified dividend income at the reduced capital gains rates, subject to shareholder period requirements. However, the ultimate determination of the character of the distributions will be made after the 2023 calendar year. Distributions will automatically be reinvested in additional Common Shares pursuant to the Fund’s Dividend Reinvestment Plan unless cash distributions are elected by the shareholder.
F. Income Taxes
The Fund is treated as a regular C corporation for U.S. federal income tax purposes and as such will be obligated to pay federal and applicable state and foreign corporate taxes on its taxable income. The Fund’s tax expense or benefit is included in the Statement of Operations based on the component of income or gains (losses) to which such expense or benefit relates. This differs from most
Notes to Financial Statements (Continued)
First Trust New Opportunities MLP & Energy Fund (FPL)
April 30, 2023 (Unaudited)
investment companies, which elect to be treated as “regulated investment companies” under the U.S. Internal Revenue Code of 1986, as amended. The various investments of the Fund may cause the Fund to be subject to state income taxes on a portion of its income at various rates.
The tax deferral benefit the Fund derives from its investment in MLPs results largely because the MLPs are treated as partnerships for federal income tax purposes. As a partnership, an MLP has no income tax liability at the entity level. As a limited partner in the MLPs in which it invests, the Fund will be allocated its pro rata share of income, gains, losses, deductions and credits from the MLPs, regardless of whether or not any cash is distributed from the MLPs.
To the extent that the distributions received from the MLPs exceed the net taxable income realized by the Fund from its investment, a tax liability results. This tax liability is a deferred liability to the extent that MLP distributions received have not exceeded the Fund’s adjusted tax basis in the respective MLPs. To the extent that distributions from an MLP exceed the Fund’s adjusted tax basis, the Fund will recognize a taxable capital gain. For the six months ended April 30, 2023, distributions of $3,654,412 received from MLPs have been reclassified as a return of capital. The cost basis of applicable MLPs has been reduced accordingly.
The Fund’s provision for income taxes consists of the following:
Current federal income tax benefit (expense)
| $ — |
Current state income tax benefit (expense)
| (7,434) |
Current foreign income tax benefit (expense)
| — |
Deferred federal income tax benefit (expense)
| — |
Deferred state income tax benefit (expense)
| — |
Total income tax benefit (expense)
| $(7,434) |
Deferred income taxes reflect the net tax effect of temporary differences between the carrying amount of assets and liabilities for financial reporting purposes and the amounts used for tax purposes. To the extent a Fund has a deferred tax asset, consideration is given to whether or not a valuation allowance is required. The determination of whether a valuation is required is based on the evaluation criterion provided by ASC 740, Income Taxes (“ASC 740”) that it is more-likely-than not that some portion or all of the deferred tax asset will not be realized. Among the factors considered in assessing each Fund’s valuation allowance: the nature, frequency, and severity of current and cumulative losses, forecasts of future profitability, the duration of statutory carryforward periods and the associated risk that operating and capital loss carryforwards may expire unused. At April 30, 2023, the Fund had a net
operating loss carryforward for federal and state income tax purposes of $9,939,752 and $33,813,755, respectively. The Fund’s 2023 income tax provision includes a full valuation allowance against the deferred tax assets associated with the federal and state net operating losses. Components of the Fund’s deferred tax assets and liabilities as of April 30, 2023 are as follows:
Deferred tax assets:
Federal net operating loss
| $2,087,348 |
State net operating loss
| 2,226,652 |
State income taxes
| — |
Federal and state capital loss carryforward
| 18,033,504 |
Other
| — |
Total deferred tax assets
| 22,347,504 |
Less: federal valuation allowance
| (8,637,170) |
Less: state valuation allowance
| (2,962,689) |
Net deferred tax assets
| $10,747,645 |
| Deferred tax liabilities: | |
Unrealized gains on investment securities
| $(10,747,645) |
Total deferred tax liabilities
| (10,747,645) |
Total net deferred tax liabilities
| $— |
Total income taxes differ from the amount computed by applying the federal income tax rate of 21% to net investment income and realized and unrealized gains on investments.
Notes to Financial Statements (Continued)
First Trust New Opportunities MLP & Energy Fund (FPL)
April 30, 2023 (Unaudited)
Application of statutory income tax rate
| $ 1,115,529 |
State income taxes, net
| 38,646 |
Change in valuation allowance
| (996,568) |
Current year change in tax rate
| — |
Other
| (150,173) |
Total
| $ 7,434 |
The Fund intends to utilize provisions of the federal income tax laws, which allow it to carry realized capital losses forward for five years following the year of the loss and offset such loss against any future realized capital gains. The Fund is subject to certain limitations under U.S. tax rules on the use of capital loss carryforwards and net unrealized built-in losses. These limitations apply when there has been a 50% change in ownership. At October 31, 2022, the Fund had a capital loss carryforward of $81,739,699 that will expire according to the following schedule:
| Fiscal Year | | Amount Generated | | Prior Year
Amount Utilized | | Current Year
Amount Utilized | | Amount Expired | | Remaining | | Expiration |
| 2017 | | $ 7,889,835 | | $ — | | $ (7,889,835) | | $ — | | $ — | | 10/31/2022 |
| 2018 | | 7,227,948 | | — | | (2,145,851) | | — | | 5,082,097 | | 10/31/2023 |
| 2020 | | 76,657,602 | | — | | — | | — | | 76,657,602 | | 10/31/2025 |
| | | $ 91,775,385 | | $ — | | $ (10,035,686) | | $ — | | $ 81,739,699 | | |
The Fund is subject to accounting standards that establish a minimum threshold for recognizing, and a system for measuring, the benefits of a tax position taken or expected to be taken in a tax return. Taxable years ended 2019, 2020, 2021, and 2022 remain open to federal and state audit. As of April 30, 2023, management has evaluated the application of these standards to the Fund and has determined that no provision for income tax is required in the Fund’s financial statements for uncertain tax positions.
As of April 30, 2023, the aggregate cost, gross unrealized appreciation, gross unrealized depreciation, and net unrealized appreciation/(depreciation) on investments (including short positions and derivatives, if any) for federal income tax purposes were as follows:
| Tax Cost | | Gross
Unrealized
Appreciation | | Gross
Unrealized
(Depreciation) | | Net Unrealized
Appreciation
(Depreciation) |
| $160,626,651 | | $54,139,215 | | $(5,587,882) | | $48,551,333 |
G. Expenses
The Fund will pay all expenses directly related to its operations.
3. Investment Advisory Fee, Affiliated Transactions and Other Fee Arrangements
First Trust, the investment advisor to the Fund, is a limited partnership with one limited partner, Grace Partners of DuPage L.P., and one general partner, The Charger Corporation. The Charger Corporation is an Illinois corporation controlled by James A. Bowen, Chief Executive Officer of First Trust. First Trust is responsible for the ongoing monitoring of the Fund’s investment portfolio, managing the Fund’s business affairs and providing certain administrative services necessary for the management of the Fund. For these services, First Trust is entitled to a monthly fee calculated at an annual rate of 1.00% of the Fund’s Managed Assets (the average daily total asset value of the Fund minus the sum of the Fund’s liabilities other than the principal amount of borrowings). First Trust also provides fund reporting services to the Fund for a flat annual fee in the amount of $9,250.
EIP serves as the Fund’s sub-advisor and manages the Fund’s portfolio subject to First Trust’s supervision. The Sub-Advisor receives a monthly sub-advisory fee calculated at an annual rate of 0.50% of the Fund’s Managed Assets that is paid by First Trust out of its investment advisory fee.
First Trust Capital Partners, LLC (“FTCP”), an affiliate of First Trust, owns, through a wholly-owned subsidiary, a 15% ownership interest in each of EIP and EIP Partners, LLC, an affiliate of EIP.
Notes to Financial Statements (Continued)
First Trust New Opportunities MLP & Energy Fund (FPL)
April 30, 2023 (Unaudited)
Computershare, Inc. (“Computershare”) serves as the Fund’s transfer agent in accordance with certain fee arrangements. As transfer agent, Computershare is responsible for maintaining shareholder records for the Fund.
The Bank of New York Mellon (“BNYM”) serves as the Fund’s administrator, fund accountant, and custodian in accordance with certain fee arrangements. As administrator and fund accountant, BNYM is responsible for providing certain administrative and accounting services to the Fund, including maintaining the Fund’s books of account, records of the Fund’s securities transactions, and certain other books and records. As custodian, BNYM is responsible for custody of the Fund’s assets. BNYM is a subsidiary of The Bank of New York Mellon Corporation, a financial holding company.
Each Trustee who is not an officer or employee of First Trust, any sub-advisor or any of their affiliates (“Independent Trustees”) is paid a fixed annual retainer that is allocated equally among each fund in the First Trust Fund Complex. Each Independent Trustee is also paid an annual per fund fee that varies based on whether the fund is a closed-end or other actively managed fund, a target outcome fund or an index fund.
Additionally, the Lead Independent Trustee and the Chairs of the Audit Committee, Nominating and Governance Committee and Valuation Committee are paid annual fees to serve in such capacities, with such compensation allocated pro rata among each fund in the First Trust Fund Complex based on net assets. Independent Trustees are reimbursed for travel and out-of-pocket expenses in connection with all meetings. The Lead Independent Trustee and Committee Chairs rotate every three years. The officers and “Interested” Trustee receive no compensation from the Fund for acting in such capacities.
4. Purchases and Sales of Securities
The cost of purchases and proceeds from sales of securities, excluding short-term investments, for the six months ended April 30, 2023, were $16,298,548 and $20,547,605, respectively.
5. Derivative Transactions
The following table presents the types of derivatives held by the Fund at April 30, 2023, the primary underlying risk exposure and the location of these instruments as presented on the Statement of Assets and Liabilities.
| | | | | Asset Derivatives | | Liability Derivatives |
Derivative
Instrument | | Risk
Exposure | | Statement of Assets and
Liabilities Location | | Value | | Statement of Assets and
Liabilities Location | | Value |
| Written Options | | Equity Risk | | — | | $ — | | Options written, at value | | $ 287,468 |
The following table presents the amount of net realized gain (loss) and change in net unrealized appreciation (depreciation) recognized for the six months ended April 30, 2023, on derivative instruments, as well as the primary underlying risk exposure associated with each instrument.
| Statement of Operations Location | |
| Equity Risk Exposure | |
| Net realized gain (loss) before taxes on written options contracts | $870,796 |
| Net change in unrealized appreciation (depreciation) before taxes on written options contracts | 13,027 |
During the six months ended April 30, 2023, the premiums for written options opened were $1,176,088, and the premiums for written options closed, exercised and expired were $951,987.
The Fund does not have the right to offset financial assets and liabilities related to option contracts on the Statement of Assets and Liabilities.
6. Borrowings
The Fund has a committed facility agreement (the “Agreement”) with BNP Paribas Prime Brokerage International, Ltd. (“PBL”). Absent certain events of default or failure to maintain certain collateral requirements, PBL may not terminate the Agreement except upon 179 calendar days’ prior notice. The maximum commitment amount is $51,000,000, which comprises a floating rate financing amount and a fixed rate financing amount. The borrowing rate under the Agreement on the floating rate financing amount is equal to SOFR plus 95 basis points and the borrowing rate on the fixed rate financing amount of $23,650,000 is 3.46%. The fixed rate financing amount is for a ten-year period ending in 2024. In addition, under the Agreement, the Fund pays a commitment fee of 0.55%
Notes to Financial Statements (Continued)
First Trust New Opportunities MLP & Energy Fund (FPL)
April 30, 2023 (Unaudited)
annually on the undrawn amount of the facility; provided, however, that such commitment fee is waived on any day in which the amount drawn on the facility is 80% or more of the maximum commitment amount.
The average amount outstanding for the six months ended April 30, 2023 was $42,900,000, with a weighted average interest rate of 4.28%. As of April 30, 2023, the Fund had outstanding borrowings of $42,900,000, which approximates fair value, under the Agreement. The borrowings are categorized as Level 2 within the fair value hierarchy. On the floating rate financing amount, the high and low annual interest rates for the six months ended April 30, 2023 were 5.82% and 4.00%, respectively. The weighted average interest rate at April 30, 2023 was 4.49%.
7. Indemnification
The Fund has a variety of indemnification obligations under contracts with its service providers. The Fund’s maximum exposure under these arrangements is unknown. However, the Fund has not had prior claims or losses pursuant to these contracts and expects the risk of loss to be remote.
8. Industry Concentration Risk
Under normal market conditions, the Fund invests at least 85% of its managed assets in equity and debt securities of MLPs, MLP-related entities and other energy sector and energy utility companies. Given this industry concentration, the Fund is more susceptible to adverse economic or regulatory occurrences affecting that industry than an investment company that is not concentrated in a single industry. Energy issuers may be subject to a variety of factors that may adversely affect their business or operations, including high interest costs in connection with capital construction programs, high leverage costs associated with environmental and other regulations, regulatory risk associated with the changes in the methodology of determining prices that energy companies may charge for their products and services, the effects of economic slowdown, surplus capacity, increased competition from other service providers, uncertainties concerning the availability of fuel at reasonable prices, the effects of energy conservation policies and other factors.
9. Subsequent Events
Management has evaluated the impact of all subsequent events on the Fund through the date the financial statements were issued and has determined that there was the following subsequent event:
On May 23, 2023, the Advisor’s Pricing Committee approved changes to the Advisor’s Valuation Procedures for the First Trust Funds, including clarifications to certain pricing methodologies. These changes will be reflected in future reports’ Notes to Financial Statements.
Additional Information
First Trust New Opportunities MLP & Energy Fund (FPL)
April 30, 2023 (Unaudited)
Dividend Reinvestment Plan
If your Common Shares are registered directly with the Fund or if you hold your Common Shares with a brokerage firm that participates in the Fund’s Dividend Reinvestment Plan (the “Plan”), unless you elect, by written notice to the Fund, to receive cash distributions, all dividends, including any capital gain distributions, on your Common Shares will be automatically reinvested by Computershare Trust Company N.A. (the “Plan Agent”), in additional Common Shares under the Plan. If you elect to receive cash distributions, you will receive all distributions in cash paid by check mailed directly to you by the Plan Agent, as the dividend paying agent.
If you decide to participate in the Plan, the number of Common Shares you will receive will be determined as follows:
| (1) | If Common Shares are trading at or above net asset value (“NAV”) at the time of valuation, the Fund will issue new shares at a price equal to the greater of (i) NAV per Common Share on that date or (ii) 95% of the market price on that date. |
| (2) | If Common Shares are trading below NAV at the time of valuation, the Plan Agent will receive the dividend or distribution in cash and will purchase Common Shares in the open market, on the NYSE or elsewhere, for the participants’ accounts. It is possible that the market price for the Common Shares may increase before the Plan Agent has completed its purchases. Therefore, the average purchase price per share paid by the Plan Agent may exceed the market price at the time of valuation, resulting in the purchase of fewer shares than if the dividend or distribution had been paid in Common Shares issued by the Fund. The Plan Agent will use all dividends and distributions received in cash to purchase Common Shares in the open market within 30 days of the valuation date except where temporary curtailment or suspension of purchases is necessary to comply with federal securities laws. Interest will not be paid on any uninvested cash payments. |
You may elect to opt-out of or withdraw from the Plan at any time by giving written notice to the Plan Agent, or by telephone at (866) 340-1104, in accordance with such reasonable requirements as the Plan Agent and the Fund may agree upon. If you withdraw or the Plan is terminated, you will receive a certificate for each whole share in your account under the Plan, and you will receive a cash payment for any fraction of a share in your account. If you wish, the Plan Agent will sell your shares and send you the proceeds, minus brokerage commissions.
The Plan Agent maintains all Common Shareholders’ accounts in the Plan and gives written confirmation of all transactions in the accounts, including information you may need for tax records. Common Shares in your account will be held by the Plan Agent in non-certificated form. The Plan Agent will forward to each participant any proxy solicitation material and will vote any shares so held only in accordance with proxies returned to the Fund. Any proxy you receive will include all Common Shares you have received under the Plan.
There is no brokerage charge for reinvestment of your dividends or distributions in Common Shares. However, all participants will pay a pro rata share of brokerage commissions incurred by the Plan Agent when it makes open market purchases.
Automatically reinvesting dividends and distributions does not mean that you do not have to pay income taxes due upon receiving dividends and distributions. Capital gains and income are realized although cash is not received by you. Consult your financial advisor for more information.
If you hold your Common Shares with a brokerage firm that does not participate in the Plan, you will not be able to participate in the Plan and any dividend reinvestment may be effected on different terms than those described above.
The Fund reserves the right to amend or terminate the Plan if in the judgment of the Board of Trustees the change is warranted. There is no direct service charge to participants in the Plan; however, the Fund reserves the right to amend the Plan to include a service charge payable by the participants. Additional information about the Plan may be obtained by writing Computershare, Inc., P.O. Box 505000, Louisville, KY 40233-5000.
Proxy Voting Policies and Procedures
A description of the policies and procedures that the Fund uses to determine how to vote proxies and information on how the Fund voted proxies relating to portfolio investments during the most recent 12-month period ended June 30 is available (1) without charge, upon request, by calling (800) 988-5891; (2) on the Fund’s website at www.ftportfolios.com; and (3) on the Securities and Exchange Commission’s (“SEC”) website at www.sec.gov.
Portfolio Holdings
The Fund files portfolio holdings information for each month in a fiscal quarter within 60 days after the end of the relevant fiscal quarter on Form N-PORT. Portfolio holdings information for the third month of each fiscal quarter will be publicly available on the
Additional Information (Continued)
First Trust New Opportunities MLP & Energy Fund (FPL)
April 30, 2023 (Unaudited)
SEC’s website at www.sec.gov. The Fund’s complete schedule of portfolio holdings for the second and fourth quarters of each fiscal year is included in the semi-annual and annual reports to shareholders, respectively, and is filed with the SEC on Form N-CSR. The semi-annual and annual report for the Fund is available to investors within 60 days after the period to which it relates. The Fund’s Forms N-PORT and Forms N-CSR are available on the SEC’s website listed above.
Submission of Matters to a Vote of Shareholders
The Fund held its Annual Meeting of Shareholders (the “Annual Meeting”) on April 17, 2023. At the Annual Meeting, Denise M. Keefe and Robert F. Keith were elected by the Common Shareholders of First Trust New Opportunities MLP & Energy Fund as Class I Trustees for a three-year term expiring at the Fund’s annual meeting of shareholders in 2026. The number of votes cast in favor of Ms. Keefe was 16,067,903 and the number of votes withheld was 1,783,826. The number of votes cast in favor of Mr. Keith was 15,929,210 and the number of votes withheld was 1,922,519. Richard E. Erickson, Thomas R. Kadlec, James A. Bowen and Niel B. Nielson are the other current and continuing Trustees.
Principal Risks
The Fund is a closed-end management investment company designed primarily as a long-term investment and not as a trading vehicle. The Fund is not intended to be a complete investment program and, due to the uncertainty inherent in all investments, there can be no assurance that the Fund will achieve its investment objective.
The following discussion summarizes the principal risks associated with investing in the Fund, which includes the risk that you could lose some or all of your investment in the Fund. The Fund is subject to the informational requirements of the Securities Exchange Act of 1934 and the Investment Company Act of 1940 and, in accordance therewith, files reports, proxy statements and other information that is available for review. The order of the below risk factors does not indicate the significance of any particular risk factor.
Covered Call Options Risk. As the writer (seller) of a call option, the Fund forgoes, during the life of the option, the opportunity to profit from increases in the market value of the portfolio security covering the option above the sum of the premium and the strike price of the call option but retains the risk of loss should the price of the underlying security decline. The value of call options written by the Fund, which are priced daily, are determined by trading activity in the broad options market and will be affected by, among other factors, changes in the value of the underlying security in relation to the strike price, changes in dividend rates of the underlying security, changes in interest rates, changes in actual or perceived volatility of the stock market and the underlying security, and the time remaining until the expiration date. The value of call options written by the Fund may be adversely affected if the market for the option is reduced or becomes illiquid. There can be no assurance that a liquid market will exist when the Fund seeks to close out an option position.
Cyber Security Risk. The Fund is susceptible to potential operational risks through breaches in cyber security. A breach in cyber security refers to both intentional and unintentional events that may cause the Fund to lose proprietary information, suffer data corruption or lose operational capacity. Such events could cause the Fund to incur regulatory penalties, reputational damage, additional compliance costs associated with corrective measures and/or financial loss. Cyber security breaches may involve unauthorized access to the Fund’s digital information systems through “hacking” or malicious software coding, but may also result from outside attacks such as denial-of-service attacks through efforts to make network services unavailable to intended users. In addition, cyber security breaches of the Fund’s third-party service providers, such as its administrator, transfer agent, custodian, or sub-advisor, as applicable, or issuers in which the Fund invests, can also subject the Fund to many of the same risks associated with direct cyber security breaches. The Fund has established risk management systems designed to reduce the risks associated with cyber security. However, there is no guarantee that such efforts will succeed, especially because the Fund does not directly control the cyber security systems of issuers or third party service providers. Substantial costs may be incurred by the Fund in order to resolve or prevent cyber incidents in the future.
Energy Infrastructure Companies Risk. Energy infrastructure companies, such as those structured as MLPs or utility companies, may be directly affected by energy commodity prices, especially those companies which own the underlying energy commodity. A decrease in the production or availability of natural gas, natural gas liquids, crude oil, coal or other energy commodities or a decrease in the volume of such commodities available for transportation, processing, storage or distribution may adversely impact the financial performance of energy infrastructure companies. Energy infrastructure companies are subject to significant federal, state and local government regulation in virtually every aspect of their operations, including how facilities are constructed, maintained and operated, environmental and safety controls, and the prices they may charge for products and services. Various governmental authorities have the power to enforce compliance with these regulations and the permits issued under them and violators are subject to administrative, civil and criminal penalties, including civil fines, injunctions or both. Stricter laws, regulations or enforcement policies could be enacted in the future which would likely increase compliance costs and may adversely affect the financial performance of energy infrastructure companies. Natural disasters, such as hurricanes in the Gulf of Mexico, also may impact energy infrastructure companies.
Additional Information (Continued)
First Trust New Opportunities MLP & Energy Fund (FPL)
April 30, 2023 (Unaudited)
Certain energy infrastructure companies are subject to the imposition of rate caps, increased competition due to deregulation, counterparties to contracts defaulting or going bankrupt, the difficulty in obtaining an adequate return on invested capital or in financing large construction projects, the limitations on operations and increased costs and delays attributable to environmental considerations, and the capital market’s ability to absorb utility debt. In addition, taxes, government regulation, international politics, price and supply fluctuations, volatile interest rates and energy conservation may cause difficulties for these companies.
Equity Securities Risk. The value of the Fund’s shares will fluctuate with changes in the value of the equity securities in which the Fund invests. Prices of equity securities fluctuate for several reasons, including changes in investors’ perceptions of the financial condition of an issuer or the general condition of the relevant stock market, such as market volatility, or when political or economic events affecting the issuers occur. In addition, common stock prices may be particularly sensitive to rising interest rates, as the cost of capital rises and borrowing costs increase. Equity securities may decline significantly in price over short or extended periods of time, and such declines may occur in the equity market as a whole, or they may occur in only a particular country, company, industry or sector of the market.
Interest Rate Swaps Risk. If short-term interest rates are lower than the Fund’s fixed rate of payment on an interest rate swap, the swap will reduce common share net earnings. In addition, a default by the counterparty to a swap transaction could also negatively impact the performance of the common shares.
Leverage Risk. The use of leverage by the Fund can magnify the effect of any losses. If the income and gains from the securities and investments purchased with leverage proceeds do not cover the cost of leverage, the return to the common shares will be less than if leverage had not been used. Leverage involves risks and special considerations for common shareholders including: (i) the likelihood of greater volatility of net asset value and market price of the common shares than a comparable portfolio without leverage; (ii) the risk that fluctuations in interest rates on borrowings will reduce the return to the common shareholders or will result in fluctuations in the dividends paid on the common shares; (iii) in a declining market, the use of leverage is likely to cause a greater decline in the net asset value of the common shares than if the Fund were not leveraged, which may result in a greater decline in the market price of the common shares; and (iv) when the Fund uses certain types of leverage, the investment advisory fee payable to the Advisor and by the Advisor to the Sub-Advisor will be higher than if the Fund did not use leverage.
Liquidity Risk. Certain securities in which the Fund may invest may trade less frequently, particularly those of issuers with smaller capitalizations. Securities with limited trading volumes may display volatile or erratic price movements. The Fund may have difficulty selling these investments in a timely manner, be forced to sell them for less than it otherwise would have been able to realize, or both.
Management Risk and Reliance on Key Personnel. The implementation of the Fund’s investment strategy depends upon the continued contributions of certain key employees of the Advisor and Sub-Advisor, some of whom have unique talents and experience and would be difficult to replace. The loss or interruption of the services of a key member of the portfolio management team could have a negative impact on the Fund.
Market Discount from Net Asset Value. Shares of closed-end investment companies such as the Fund frequently trade at a discount from their net asset value. The Fund cannot predict whether its common shares will trade at, below or above net asset value.
Market Risk. Securities held by the Fund, as well as shares of the Fund itself, are subject to market fluctuations caused by factors such as general economic conditions, political events, regulatory or market developments, changes in interest rates and perceived trends in securities prices. Shares of the Fund could decline in value or underperform other investments as a result of the risk of loss associated with these market fluctuations. In addition, local, regional or global events such as war, acts of terrorism, spread of infectious diseases or other public health issues, recessions, or other events could have a significant negative impact on the Fund and its investments. For example, the coronavirus (COVID-19) global pandemic and the aggressive responses taken by many governments, including closing borders, restricting international and domestic travel, and the imposition of prolonged quarantines or similar restrictions, had negative impacts, and in many cases severe impacts, on markets worldwide. While the development of vaccines has slowed the spread of the virus and allowed for the resumption of reasonably normal business activity in the United States, many countries continue to impose lockdown measures in an attempt to slow the spread. Additionally, there is no guarantee that vaccines will be effective against emerging variants of the disease. Also, in February 2022, Russia invaded Ukraine which has caused and could continue to cause significant market disruptions and volatility across markets globally, including the United States. The hostilities and sanctions resulting from those hostilities could have a significant impact on certain Fund investments as well as Fund performance. As the global pandemic and conflict in Ukraine have illustrated, such events may affect certain geographic regions, countries, sectors and industries more significantly than others. Recent and potential future bank failures could result in disruption to the broader banking industry or markets generally and reduce confidence in financial institutions and the economy as a whole, which may also heighten market volatility and reduce liquidity. These events also may adversely affect the prices and liquidity of the Fund’s portfolio securities or other instruments and could result in disruptions in the trading markets. Any of such circumstances could have a materially negative
Additional Information (Continued)
First Trust New Opportunities MLP & Energy Fund (FPL)
April 30, 2023 (Unaudited)
impact on the value of the Fund’s shares and result in increased market volatility. During any such events, the Fund’s shares may trade at increased premiums or discounts to their net asset value and the bid/ask spread on the Fund’s shares may widen.
MLP and Investment Concentration Risks. The Fund’s investments are concentrated in the group of industries that are part of the energy sector, with a particular focus on MLPs, MLP-related entities and other companies in the energy sector and energy utility industries. The Fund’s concentration in the group of industries that are part of the energy sector may present more risk than if the Fund were broadly diversified over multiple sectors of the economy. A downturn in one or more industries within the energy sector, material declines in energy-related commodity prices, adverse political, legislative or regulatory developments or other events could have a larger impact on the Fund than on an investment company that does not concentrate in the group of industries that are part of the energy sector. Certain risks inherent in investing in the business of the types of securities that the Fund may invest include: commodity pricing risk, commodity supply and demand risk, lack of diversification of and reliance on MLP customers and suppliers risk, commodity depletion and exploration risk, energy sector and energy utility industry regulatory risk including risks associated with the prices and methodology of determining prices that energy companies may charge for their products and services, interest rate risk, risk of lack of acquisition or reinvestment opportunities for MLPs, risk of lacking of funding for MLPs, dependency on MLP affiliate risk, weather risk, catastrophe risk, terrorism and MLP market disruption risk, and technology risk.
Companies that own interstate pipelines are subject to regulation by the Federal Energy Regulatory Commission (FERC) with respect to the tariff rates that they may charge customers and may change policies to no longer permit such companies to include certain costs in their costs of services. This may lower the tariff rates charged to customers which will in turn negatively affect performance.
Other factors which may reduce the amount of cash an MLP, MLP-related entity and other energy sector and energy utility company has available to pay its debt and equity holders include increased operating costs, maintenance capital expenditures, acquisition costs, expansion or construction costs and borrowing costs (including increased borrowing costs as a result of additional collateral requirements as a result of ratings downgrades by credit agencies).
Non-Diversification. The Fund is a non-diversified investment company under the 1940 Act and will not be treated as a regulated investment company under the Internal Revenue Code of 1986. Accordingly, the diversification-specific regulatory requirements under the 1940 Act and the Internal Revenue Code of 1986 regarding the minimum number or size of portfolio securities do not apply to the Fund, and the Fund’s investments may be more heavily concentrated in, and thus more sensitive to changes in the prices of, securities of particular issuers.
Non-U.S. Securities and Currency Risk. Investing in non-U.S. securities involves certain risks not involved in domestic investments, including, but not limited to: fluctuations in currency exchange rates; future foreign economic, financial, political and social developments; different legal systems; the possible imposition of exchange controls or other foreign governmental laws or restrictions; lower trading volume; withholding taxes; greater price volatility and illiquidity; different trading and settlement practices; less governmental supervision; high and volatile rates of inflation; fluctuating interest rates; less publicly available information; and different accounting, auditing and financial recordkeeping standards and requirements. Because the Fund may invest in securities denominated or quoted in non-U.S. currencies, changes in the non-U.S. currency/United States dollar exchange rate may affect the value of the Fund’s securities and the unrealized appreciation or depreciation of investments.
Operational Risk. The Fund is subject to risks arising from various operational factors, including, but not limited to, human error, processing and communication errors, errors of the Fund’s service providers, counterparties or other third-parties, failed or inadequate processes and technology or systems failures. The Fund relies on third-parties for a range of services, including custody. Any delay or failure relating to engaging or maintaining such service providers may affect the Fund’s ability to meet its investment objective. Although the Fund and Advisor seek to reduce these operational risks through controls and procedures, there is no way to completely protect against such risks.
Renewable Energy Company Risk. Renewable energy companies are a subset of Energy Infrastructure Companies and, as such, are subject to many of the same risks as Energy Infrastructure Companies. In addition, the future growth of renewable energy companies may be dependent upon government policies that support renewable power generation and enhance the economic viability of owning renewable electric generation assets. Such policies can include renewable portfolio standard programs, which mandate that a specified percentage of electricity sales come from eligible sources of renewable energy, accelerated cost-recovery systems of depreciation and tax credits.
A portion of revenues from investments in renewable energy companies will be tied, either directly or indirectly, to the wholesale market price for electricity in the markets served. Wholesale market electricity prices are impacted by a number of factors including: the price of fuel (for example, natural gas) that is used to generate electric power; the cost of and management of generation and the amount of excess generating capacity relative to load in a particular market; and conditions (such as extremely hot or cold weather) that impact electrical system demand. Owners of renewable energy companies may attempt to secure fixed prices for their
Additional Information (Continued)
First Trust New Opportunities MLP & Energy Fund (FPL)
April 30, 2023 (Unaudited)
power production through the use of financial hedges; but may not be able to deliver power to collect such fixed price, rendering those hedges ineffective or creating economic losses for renewable energy companies. In addition, there is uncertainty surrounding the trend in electricity demand growth, which is influenced by macroeconomic conditions; absolute and relative energy prices; and energy conservation and demand management. This volatility and uncertainty in power markets could have a material adverse effect on the assets, liabilities, financial condition, results of operations and cash flow of the companies in which the Fund may invest.
Potential Conflicts of Interest Risk. First Trust, EIP and the portfolio managers have interests which may conflict with the interests of the Fund. In particular, First Trust and EIP currently manage and may in the future manage and/or advise other investment funds or accounts with the same or substantially similar investment objective and strategies as the Fund. In addition, while the Fund is using leverage, the amount of the fees paid to First Trust (and by First Trust to EIP) for investment advisory and management services are higher than if the Fund did not use leverage because the fees paid are calculated based on Managed Assets. Therefore, First Trust and EIP have a financial incentive to leverage the Fund.
Recent Market and Economic Developments. In recent years, prices of oil and other energy commodities have experienced significant volatility. During such periods, such volatility has adversely impacted many of the MLPs, MLP-related entities and other companies in the energy sector and energy utility industries in which the Fund has invested or may invest. For example, many MLPs, MLP-related entities and other companies in the energy sector and energy utility industries have in recent years experienced eroding growth prospects, reduced distribution levels or, in some cases, bankruptcy. These conditions have impacted, and may in the future impact, the NAV of the Fund and its ability to pay distributions to shareholders at current or historic levels.
Tax Risk. Changes in tax laws or regulations, or interpretations thereof in the future, could adversely affect the Fund or the MLPs, MLP-related entities and other energy sector and energy utility companies in which the Fund invests. A change in current tax law, a change in the business of a given MLP, or a change in the types of income earned by a given MLP could result in an MLP being treated as a corporation for United States federal income tax purposes, which would result in such MLP being required to pay United States federal income tax on its taxable income. In the past, certain events have caused some MLPs to be reclassified or restructured as corporations. The classification of an MLP as a corporation for United States federal income tax purposes has the effect of reducing the amount of cash available for distribution by the MLP and causing any such distributions received by the Fund to be taxed as dividend income to the extent of the MLP’s current or accumulated earnings and profits.
A reduction in the percentage of the income offset by tax deductions or an increase in sales of the Fund’s MLP holdings that result in capital gains will reduce that portion of the Fund’s distribution from an MLP treated as a return of capital and increase that portion treated as income, and may result in lower after-tax distributions to the Fund’s common shareholders. On the other hand, to the extent a distribution received by the Fund from an MLP is treated as a return of capital, the Fund’s adjusted tax basis in the interests of the MLP may be reduced, which will result in an increase in the amount of income or gain or decrease in the amount of loss that will be recognized by the Fund for tax purposes upon the sale of any such interests.
Utilities Risk. Utility companies include companies producing or providing gas, electricity or water. These companies are subject to the risk of the imposition of rate caps, increased competition due to deregulation, the difficulty in obtaining an adequate return on invested capital or in financing large construction projects, the limitations on operations and increased costs and delays attributable to environmental considerations and the capital market’s ability to absorb utility debt. In addition, in many regions, including the United States, the utility industry is experiencing increasing competitive pressures, primarily in wholesale markets, as a result of consumer demand, technological advances, greater availability of natural gas with respect to electric utility companies and other factors. Taxes, government regulation, international politics, price and supply fluctuations, volatile interest rates and energy conservation also may negatively affect utility companies.
Valuation Risk. Market prices generally will not be available for subordinated units, direct ownership of general partner interests, restricted securities or unregistered securities of certain MLPs or MLP-related entities, and the value of such investments will ordinarily be determined based on fair valuations determined pursuant to procedures adopted by the Board of Trustees. The value of these securities typically requires more reliance on the judgment of the Sub-Advisor than that required for securities for which there is an active trading market. In addition, the Fund relies on information provided by certain MLPs, which may not be received by the Fund in a timely manner, to calculate taxable income allocable to the MLP units held in the Fund’s portfolio and to determine the tax character of distributions to common shareholders. From time to time the Fund will modify its estimates and/or assumptions as new information becomes available. To the extent the Fund modifies its estimates and/or assumptions, the net asset value of the Fund would likely fluctuate.
INVESTMENT ADVISOR
First Trust Advisors L.P.
120 East Liberty Drive, Suite 400
Wheaton, IL 60187
INVESTMENT SUB-ADVISOR
Energy Income Partners, LLC
10 Wright Street
Westport, CT 06880
ADMINISTRATOR,
FUND ACCOUNTANT,
AND CUSTODIAN
The Bank of New York Mellon
240 Greenwich Street
New York, NY 10286
TRANSFER AGENT
Computershare, Inc.
P.O. Box 505000
Louisville, KY 40233
INDEPENDENT REGISTERED
PUBLIC ACCOUNTING FIRM
Deloitte & Touche LLP
111 South Wacker Drive
Chicago, IL 60606
LEGAL COUNSEL
Chapman and Cutler LLP
320 South Canal Street
Chicago, IL 60606
Item 2. Code of Ethics.
Not applicable.
Item 3. Audit Committee Financial Expert.
Not applicable.
Item 4. Principal Accountant Fees and Services.
Not applicable.
Item 5. Audit Committee of Listed Registrants.
Not applicable.
Item 6. Investments.
| (a) | | Schedule of Investments in securities of unaffiliated issuers as of the close of the reporting period is included as part of the report to shareholders filed under Item 1 of this form. |
Item 7. Disclosure of Proxy Voting Policies and Procedures for Closed-End Management Investment Companies.
Not applicable.
Item 8. Portfolio Managers of Closed-End Management Investment Companies.
| (b) | | There has been no change, as of the date of this filing, in any of the portfolios managers identified in response to paragraph (a)(1) of this Item in the registrant’s most recently filed annual report on Form N-CSR. |
Item 9. Purchases of Equity Securities by Closed-End Management Investment Company and Affiliated Purchasers.
REGISTRANT PURCHASES OF EQUITY SECURITIES
| Period | (a) Total Number of Shares (or Units) Purchased | (b) Average Price Paid per Share (or Unit) | (c) Total Number of Shares (or Units) Purchased as Part of Publicly Announced Plans or Programs | (d) Maximum Number (or Approximate Dollar Value) of Shares (or Units) that May Yet Be Purchased Under the Plans or Programs |
Month #1
(11/01/2022– 11/30/2022) | 78,261 | 6.04 | 2,130,674 | 181,828 |
Month #2
(12/01/2022– 12/31/2022) | 137,047 | 6.11 | 2,267,721 | 44,781 |
Month #3
(01/01/2023– 01/31/2023) | 0 | 0 | 0 | 0 |
Month #4
(02/01/2023– 02/28/2023) | 0 | 0 | 0 | 0 |
Month #5
(03/01/2023– 03/31/2023) | 0 | 0 | 0 | 0 |
Month #6
(04/01/2023– 04/30/2023) | 0 | 0 | 0 | 0 |
Month #7
(05/01/2023– 05/31/2023) | 0 | 0 | 0 | 0 |
Month #8
(06/01/2023– 06/30/2023) | 0 | 0 | 0 | 0 |
Month #9
(07/01/2023– 07/31/2023) | 0 | 0 | 0 | 0 |
Month #10
(08/01/2023– 08/31/2023) | 0 | 0 | 0 | 0 |
Month #11
(09/01/2023– 09/30/2023) | 0 | 0 | 0 | 0 |
Month #12
(10/01/2023– 10/31/2023) | 0 | 0 | 0 | 0 |
| Total | 215,308 | $6.09 | 2,267,721 | 44,781 |
On September 15, 2020, the Fund commenced a share repurchase program. For the six months ended April 30, 2023, and the fiscal year ended October 31, 2022, the Fund repurchased 215,308 and 1,057,624 Commons Shares, respectively, at a weighted-average discount of 14.01% and 12.95%, respectively, from net asset value per share. The Fund’s share repurchase program ended on March 15, 2023.
Item 10. Submission of Matters to a Vote of Security Holders.
There have been no material changes to the procedures by which the shareholders may recommend nominees to the registrant’s board of directors, where those changes were implemented after the registrant last provided disclosure in response to the requirements of Item 407(c)(2)(iv) of Regulation S-K (17 CFR 229.407) (as required by Item 22(b)(15) of Schedule 14A (17 CFR 240.14a-101)), or this Item.
Item 11. Controls and Procedures.
| (a) | | The registrant’s principal executive and principal financial officers, or persons performing similar functions, have concluded that the registrant’s disclosure controls and procedures (as defined in Rule 30a-3(c) under the Investment Company Act of 1940, as amended (the “1940 Act”) (17 CFR 270.30a-3(c))) are effective, as of a date within 90 days of the filing date of the report that includes the disclosure required by this paragraph, based on their evaluation of these controls and procedures required by Rule 30a-3(b) under the 1940 Act (17 CFR 270.30a-3(b)) and Rules 13a-15(b) or 15d-15(b) under the Securities Exchange Act of 1934, as amended (17 CFR 240.13a-15(b) or 240.15d-15(b)). |
| (b) | | There were no changes in the registrant's internal control over financial reporting (as defined in Rule 30a-3(d) under the 1940 Act (17 CFR 270.30a-3(d)) that occurred during the period covered by this report that have materially affected, or are reasonably likely to materially affect, the registrant's internal control over financial reporting. |
Item 12. Disclosure of Securities Lending Activities for Closed-End Management Investment Companies.
Item 13. Exhibits.
SIGNATURES
Pursuant to the requirements of the Securities Exchange Act of 1934 and the Investment Company Act of 1940, the registrant has duly caused this report to be signed on its behalf by the undersigned, thereunto duly authorized.
| (registrant) | | First Trust New Opportunities MLP & Energy Fund |
| By (Signature and Title)* | | /s/ James M. Dykas |
| | | James M. Dykas, President and Chief Executive Officer
(principal executive officer) |
Pursuant to the requirements of the Securities Exchange Act of 1934 and the Investment Company Act of 1940, this report has been signed below by the following persons on behalf of the registrant and in the capacities and on the dates indicated.
| By (Signature and Title)* | | /s/ James M. Dykas |
| | | James M. Dykas, President and Chief Executive Officer
(principal executive officer) |
| By (Signature and Title)* | | /s/ Donald P. Swade |
| | | Donald P. Swade, Treasurer, Chief Financial Officer
and Chief Accounting Officer
(principal financial officer) |
* Print the name and title of each signing officer under his or her signature.