Table of Contents
UNITED STATES
SECURITIES AND EXCHANGE COMMISSION
Washington, D.C. 20549
FORM N-CSR
CERTIFIED SHAREHOLDER REPORT OF REGISTERED MANAGEMENT
INVESTMENT COMPANIES
Investment Company Act file number 811-22906
Virtus Alternative Solutions Trust
(Exact name of registrant as specified in charter)
101 Munson Street
Greenfield, MA 01301
(Address of principal executive offices) (Zip code)
Jennifer Fromm, Esq.
Vice President, Chief Legal Officer, Counsel and Secretary for Registrant
100 Pearl Street
Hartford, CT 06103-4506
(Name and address of agent for service)
Registrant’s telephone number, including area code: (800)-243-1574
Date of fiscal year end: October 31
Date of reporting period: October 31, 2014
Form N-CSR is to be used by management investment companies to file reports with the Commission not later than 10 days after the transmission to stockholders of any report that is required to be transmitted to stockholders under Rule 30e-1 under the Investment Company Act of 1940 (17 CFR 270.30e-1). The Commission may use the information provided on Form N-CSR in its regulatory, disclosure review, inspection, and policymaking roles.
A registrant is required to disclose the information specified by Form N-CSR, and the Commission will make this information public. A registrant is not required to respond to the collection of information contained in Form N-CSR unless the Form displays a currently valid Office of Management and Budget (“OMB”) control number. Please direct comments concerning the accuracy of the information collection burden estimate and any suggestions for reducing the burden to Secretary, Securities and Exchange Commission, 100 F Street, NE, Washington, DC 20549. The OMB has reviewed this collection of information under the clearance requirements of 44 U.S.C. § 3507.
Table of Contents
Item 1. Reports to Stockholders.
The Report to Shareholders is attached herewith.
Table of Contents

ANNUAL REPORT
Virtus Alternative Income Solution Fund
Virtus Alternative Inflation Solution Fund
Virtus Alternative Total Solution Fund
Virtus Strategic Income Fund
Table of Contents
Proxy Voting Procedures and Voting Record (Form N-PX)
The subadvisers vote proxies relating to portfolio securities in accordance with procedures that have been approved by the Board of Trustees of the Trust (“Trustees”, or the “Board”). You may obtain a description of these procedures, along with information regarding how the Funds voted proxies during the most recent 12-month period ended June 30, free of charge, by calling toll-free 1-800-243-1574. This information is also available through the Securities and Exchange Commission’s (the “SEC”) website at http://www.sec.gov.
Form N-Q Information
The Trust files a complete schedule of portfolio holdings for each Fund with the SEC for the first and third quarters of each fiscal year on Form N-Q. Form N-Q is available on the SEC’s website at http://www.sec.gov. Form N-Q may be reviewed and copied at the SEC’s Public Reference Room. Information on the operation of the SEC’s Public Reference Room can be obtained by calling toll-free 1-800-SEC-0330.
This report is not authorized for distribution to prospective investors in the Funds presented in this book unless preceded or accompanied by an effective prospectus which includes information concerning the sales charge, each Fund’s record and other pertinent information.
Table of Contents
Dear Fellow Shareholders of Virtus Mutual Funds:
 | I am pleased to present this first annual shareholder report of Virtus Alternative Solutions Trust, which comprises four alternative mutual funds. These are the Virtus Alternative Solutions Funds, introduced in April 2014 and subadvised by Cliffwater Investments LLC, and a new fund, Virtus Strategic Income Fund, introduced in September 2014 and subadvised by Newfleet Asset Management. This report contains portfolio commentary for the three funds that have been in existence for more than six months, as well as a listing of each fund’s investments and audited financial statements for the period ended October 31, 2014. |
The current market environment may pose challenges to investors. A traditional core portfolio consisting of equity and fixed income allocations may no longer be sufficient to deliver, on an aggregate basis, inflation-beating returns over time. This far into a bull market, many investors may be reluctant to increase their equity exposure. At the same time, with interest rates at historic lows, traditional fixed income may not offer the return potential many investors need to meet their long-term financial goals.
Alternative investments, which include asset classes such as hedge funds, private equity, and real assets, are attractive to many investors because historically they have not correlated with traditional asset classes. Historically, an allocation to alternative strategies has helped to mitigate volatility and generate more consistent returns in diversified portfolios. Large institutional investors, such as pension funds, have been diversifying with alternative investments for years.
Market uncertainty is an ever-present reminder of the importance of portfolio diversification. While diversification cannot guarantee a profit or prevent loss, owning a variety of asset classes may cushion your portfolio against inevitable market fluctuations. Incorporating alternative investments has been a time-tested approach to reduce portfolio volatility and generate more consistent results through market cycles. Your financial advisor can help you ensure that your portfolio is adequately diversified across asset classes and investment strategies.
Thank you for choosing to invest with Virtus. We appreciate the opportunity to serve you and look forward to supporting your investment needs in the year to come. Should you have questions or require assistance, our customer service team is here to help at 1-866-270-7788.
| Sincerely, |
 |
George R. Aylward |
| President, Virtus Mutual Funds |
| December 2014 |
Whenever you have questions about your account, or require additional information, please visit us on the Web at www.virtus.com or call our shareowner service group toll-free at 1-800-243-1574.
Performance data quoted represents past results. Past performance is no guarantee of future results.
1
Table of Contents
VIRTUS ALTERNATIVE SOLUTIONS TRUST
Disclosure of Fund Expenses
For the period ended October 31, 2014
We believe it is important for you to understand the impact of costs on your investment. All mutual funds have operating expenses. As a shareholder of a Virtus Alternative Solutions Trust Fund (each, a “Fund”) you may incur two types of costs: (1) transaction costs, including sales charges on purchases of Class A shares and contingent deferred sales charges on Class A and Class C shares; and (2) ongoing costs, including investment advisory fees, distribution and service fees, and other expenses. Class I shares are sold without sales charges. For further information regarding applicable sales charges, see Note 1 in the Notes to Financial Statements. These examples are intended to help you understand your ongoing costs (in dollars) of investing in a Fund and to compare these costs with the ongoing costs of investing in other mutual funds. These examples are based on an investment of $1,000 invested from May 1, 2014 through October 31, 2014, and held for the entire period. The following Expense Table illustrates your Fund’s costs in two ways.
Actual Expenses
The first section of the accompanying table provides information about actual account values and actual expenses. You may use the information in this section, together with the amount you invested, to estimate the expenses that you paid over the period. Simply divide your account value by $1,000 (for example, an $8,600 account value divided by $1,000 = 8.6), then multiply the result by the number given for your Fund under the heading “Expenses Paid During Period” to estimate the expenses you paid on your account during the period.
Hypothetical Example for Comparison Purposes
The second section of the accompanying table provides information about hypothetical account values and hypothetical expenses based on the Fund’s actual expense ratio and an assumed rate of return of 5% per year before expenses, which is not your Fund’s actual return. The hypothetical account values and expenses may not be used to estimate the actual ending account balance or expenses you paid for the period. You may use this information to compare the ongoing costs of investing in your Fund and other funds. To do so, compare these 5% hypothetical examples with the 5% hypothetical examples that appear in the shareholder reports of the other funds.
Please note that the expenses shown in the accompanying table are meant to highlight your ongoing costs only and do not reflect any transactional costs, such as sales charges or contingent deferred sales charges. Therefore, the second section of the accompanying table is useful in comparing ongoing costs only, and will not help you determine the relative total costs of owning different funds. In addition, if these transactional costs were included, your costs would have been higher. The calculations assume no shares were bought or sold during the period. Your actual costs may have been higher or lower, depending on the amount of your investment and the timing of any purchases or redemptions.
| Expense Table | ||||||||||||||||
Beginning Account Value May 1, 2014 | Ending Account Value October 31, 2014 | Annualized Expense Ratio* | Expenses Paid Period** | |||||||||||||
Virtus Alternative Income Solution Fund |
| |||||||||||||||
Actual | ||||||||||||||||
Class A | $1,000.00 | $1,017.18 | 2.66% | $13.52 | ||||||||||||
Class C | 1,000.00 | 1,013.80 | 3.41 | 17.31 | ||||||||||||
Class I | 1,000.00 | 1,017.96 | 2.43 | 12.36 | ||||||||||||
Hypothetical (5% return before expenses) |
| |||||||||||||||
Class A | $1,000.00 | $1,011.63 | 2.66% | $13.58 | ||||||||||||
Class C | 1,000.00 | 1,007.80 | 3.41 | 17.41 | ||||||||||||
Class I | 1,000.00 | 1,012.80 | 2.43 | 12.40 | ||||||||||||
Virtus Alternative Inflation Solution Fund |
| |||||||||||||||
Actual | ||||||||||||||||
Class A | $1,000.00 | $1,011.00 | 2.69% | $13.65 | ||||||||||||
Class C | 1,000.00 | 1,007.00 | 3.46 | 17.50 | ||||||||||||
Class I | 1,000.00 | 1,012.00 | 2.47 | 12.53 | ||||||||||||
Hypothetical (5% return before expenses) |
| |||||||||||||||
Class A | $1,000.00 | $1,011.46 | 2.69% | $13.75 | ||||||||||||
Class C | 1,000.00 | 1,007.55 | 3.46 | 17.66 | ||||||||||||
Class I | 1,000.00 | 1,012.60 | 2.47 | 12.61 | ||||||||||||
Virtus Alternative Total Solution Fund |
| |||||||||||||||
Actual | ||||||||||||||||
Class A | $1,000.00 | $1,014.97 | 3.02% | $15.33 | ||||||||||||
Class C | 1,000.00 | 1,010.98 | 3.76 | 19.06 | ||||||||||||
Class I | 1,000.00 | 1,015.97 | 2.77 | 14.08 | ||||||||||||
Hypothetical (5% return before expenses) |
| |||||||||||||||
Class A | $1,000.00 | $1,009.80 | 3.02% | $15.41 | ||||||||||||
Class C | 1,000.00 | 1,006.01 | 3.76 | 19.19 | ||||||||||||
Class I | 1,000.00 | 1,011.07 | 2.77 | 14.14 | ||||||||||||
Virtus Strategic Income Fund*** |
| |||||||||||||||
Actual | ||||||||||||||||
Class A | $1,000.00 | $996.74 | 1.40% | $1.99 | ||||||||||||
Class C | 1,000.00 | 995.71 | 2.15 | 3.06 | ||||||||||||
Class I | 1,000.00 | 997.10 | 1.15 | 1.64 | ||||||||||||
Hypothetical (5% return before expenses) |
| |||||||||||||||
Class A | $1,000.00 | $1,018.06 | 1.40% | $7.15 | ||||||||||||
Class C | 1,000.00 | 1,014.23 | 2.15 | 10.97 | ||||||||||||
Class I | 1,000.00 | 1,019.34 | 1.15 | 5.87 | ||||||||||||
| * | Annualized expense ratios include dividends on short sales. |
| ** | Expenses are equal to the relevant Fund’s annualized expense ratio, which is net of waived fees and reimbursed expenses, if applicable, multiplied by the average account value over the period, multiplied by the number of days (184) expenses were accrued in the most recent fiscal half-year, then divided by 365 to reflect the one half-year period. |
| *** | September 10, 2014 is the date the Fund started accruing expenses. Expenses are equal to the relevant Fund’s annualized expense ratio, which is net of waived fees and reimbursed expenses, if applicable, multiplied by the average account value over the period, multiplied by the number of days (52 for actual and 184 for hypothetical) expenses were accrued in the most recent fiscal half-year, then divided by 365 to reflect the one half-year period. |
For Funds which may invest in other funds, the annualized expense ratios noted above do not reflect fees and expenses associated with the underlying funds. If such fees and expenses had been included, the expenses would have been higher.
You can find more information about the Funds’ expenses in the Financial Statements section that follows. For additional information on operating expenses and other shareholder costs, refer to the prospectus.
| 2 |
Table of Contents
ADR (American Depositary Receipt)
Represents shares of foreign companies traded in U.S. dollars on U.S. exchanges that are held by a U.S. bank or a trust. Foreign companies use ADRs in order to make it easier for Americans to buy their shares.
Alerian MLP Index
The Alerian MLP Index is a composite of the 50 most prominent energy master limited partnerships (MLPs) that provides investors with an unbiased, comprehensive benchmark for this emerging asset class. The index, which is calculated using a float-adjusted, capitalization-weighted methodology, is disseminated real-time on a price-return basis (NYSE: AMZ) and on a total-return basis (NYSE:AMZX). The index is unmanaged, its returns do not reflect any fees, expenses, or sales charges, and it is not available for direct investment.
Barclays U.S. Aggregate Bond Index
The Barclays U.S. Aggregate Bond Index measures the U.S. investment grade fixed rate bond market. The index is calculated on a total return basis. The index is unmanaged, its returns do not reflect any fees, expenses, or sales charges, and it is not available for direct investment.
Barclays U.S. Treasury Inflation Protected Securities (TIPS) Index
The Barclays U.S. TIPS Index includes all publicly issued, U.S. Treasury inflation-protected securities that have at least one year remaining to maturity, are rated investment grade, and have $250 million or more of outstanding face value. The index is unmanaged, its returns do not reflect any fees, expenses, or sales charges, and it is not available for direct investment.
Barclays U.S. 10 year Breakeven Inflation Index
The Barclays U.S. 10 Year breakeven inflation benchmark index provides exposure to U.S. Breakeven Inflation, which are inflation expectations implied by the difference between nominal treasury securities and Treasury Inflation Protected Securities. The index is unmanaged and it is not available for direct investment.
Bloomberg Commodity Index
The Bloomberg Commodity Index is designed to be a highly liquid and diversified benchmark for commodities investments. It provides broad-based exposure to commodities as an asset class, since no single commodity or commodity sector dominates the Index. Rather than being driven by micro-economic events affecting one commodity market or sector, the diversified commodity exposure of BCOM potentially reduces volatility in comparison to non-diversified commodity baskets. The index is unmanaged, its returns do not reflect any fees, expenses, or sales charges, and it is not available for direct investment.
BofA Merrill Lynch U.S. Dollar 3-Month LIBOR Constant Maturity Index
The BofA Merrill Lynch U.S. Dollar 3-Month LIBOR Constant Maturity Index is based on the assumed purchase of a synthetic instrument having 3 months to maturity and with a coupon equal to the closing quote for 3-Month LIBOR. That issue is sold the following day (priced at a yield equal to the current day closing 3-Month LIBOR rate) and is rolled into a new 3-Month instrument. The index, therefore, will always have a constant maturity equal to exactly 3 months. The index is unmanaged, its returns do not reflect any fees, expenses, or sales charges, and it is not available for direct investment.
Collateralized Loan Obligation (CLO)
A security backed by a pool of debt, often low-rated corporate loans.
Exchange–Traded Funds (ETF)
Portfolios of stocks or bonds that track a specific market index.
Exchange–Traded Notes (ETN)
Senior, unsecured, unsubordinated debt securities whose returns are linked to the performance of a particular market benchmark or strategy minus applicable fees.
3
Table of Contents
KEY INVESTMENT TERMS (Continued)
Federal Farm Credit Bank (FFCB)
Institution backed by the government to manage and merge the financing transactions of the Federal Intermediate Credit Banks and the Federal Land Banks. The institution must abide by rules set forth in the Farm Credit Act, which are enforced by an independent federal regulatory agency.
Federal Home Loan Bank (FHLB)
One of 12 regional banks that comprise the Federal Home Loan Bank System (FHLBank System). The FHLBank System provides stable, on-demand, low-cost funding to American financial institutions (not individuals) for home mortgage loans, small business, rural, agricultural, and economic development lending.
Federal Home Loan Mortgage Company (FHLMC)
A public government-sponsored enterprise which buys mortgages on the secondary market, pools them and sells them as mortgage-backed securities to investors on the open market. Monthly principal and interest payments are guaranteed by FHLMC but not by the U.S. Government. Also called Freddie Mac.
Federal National Mortgage Association (FNMA)
A congressionally chartered corporation which buys mortgages on the secondary market, pools them and sells them as mortgage-backed securities to investors on the open market. Monthly principal and interest payments are guaranteed by FNMA but not by the U.S. Government. Also called Fannie Mae.
Federal Reserve (the “Fed”)
The central bank of the United States, responsible for controlling the money supply, interest rates and credit with the goal of keeping the U.S. economy and currency stable. Governed by a seven-member board, the system includes 12 regional Federal Reserve Banks, 25 branches and all national and state banks that are part of the system.
FTSE NAREIT All Equity REITs Index
The FTSE NAREIT Equity REITs Index is a free-float market capitalization-weighted index containing all tax-qualified REITs with more than 50 percent of total assets in qualifying real estate assets other than mortgages secured by real property that also meet minimum size and liquidity criteria. The index is calculated on a total return basis with dividends reinvested. The index is unmanaged, its returns do not reflect any fees, expenses, or sales charges, and it is not available for direct investment.
Global Depositary Receipt (GDR)
A negotiable certificate held in the bank of one country representing a specific number of shares of a stock traded on an exchange of another country. Global Depositary Receipts make it easier for individuals to invest in foreign companies, due to the widespread availability of price information, lower transaction costs, and timely dividend distributions.
HFRX Fixed Income–Credit Index
The HFRX Fixed Income–Credit Index includes strategies with exposure to credit across a broad continuum of credit sub-strategies, including corporate, sovereign, distressed, convertible, asset backed, capital structure arbitrage, multi-strategy, and other relative value and event driven sub-strategies. The investment thesis across all strategies is predicated on realization of a valuation discrepancy between the related credit instruments. Strategies may also include and utilize equity securities, credit derivatives, government fixed income, commodities, currencies, or other hybrid securities. The index is unmanaged, its returns do not reflect any fees, expenses, or sales charges, and it is not available for direct investment.
HFRX Global Hedge Fund Index
The HFRX Global Hedge Fund Index is designed to be representative of the overall composition of the hedge fund universe. It is comprised of all eligible hedge fund strategies, including but not limited to, convertible arbitrage, distressed securities, equity hedge, equity market neutral, event driven, macro, merger arbitrage, and relative value arbitrage. The strategies are asset weighted based on the distribution of assets in the hedge fund industry. The index is unmanaged, its returns do not reflect any fees, expenses, or sales charges, and it is not available for direct investment.
Intercontinental Exchange (ICE)
An American network of exchanges and clearing houses for financial and commodity markets.
4
Table of Contents
KEY INVESTMENT TERMS (Continued)
iShares®
Represents shares of an open-end exchange-traded fund.
London Interbank Offered Rate (LIBOR)
A benchmark rate that some of the world’s leading banks charge each other for short-term loans.
Master Limited Partnership (MLP)
Investment which combines the tax benefits of a limited partnership with the liquidity of publicly traded securities. To be classified as an MLP, a partnership must derive most of its cash flows from real estate, natural resources and commodities.
MSCI EAFE® Index
The MSCI EAFE® Index is a free float-adjusted market capitalization-weighted index that measures developed foreign market equity performance, excluding the U.S. and Canada. The index is calculated on a total return basis with gross dividends reinvested. The index is unmanaged, its returns do not reflect any fees, expenses, or sales charges, and it is not available for direct investment.
MSCI Emerging Markets Index
The MSCI Emerging Markets Index is a free float-adjusted market capitalization-weighted index designed to measure equity market performance in the global emerging markets. The index is calculated on a total return basis with gross dividends reinvested. The index is unmanaged, its returns do not reflect any fees, expenses, or sales charges, and it is not available for direct investment.
Over–the–Counter (OTC)
Trading that is done directly between two parties, without any supervision of an exchange.
Payment–in–Kind Security (PIK)
A bond which pays interest in the form of additional bonds, or preferred stock which pays dividends in the form of additional preferred stock.
Real Estate Investment Trust (REIT)
A publicly traded company that owns, develops and operates income-producing real estate such as apartments, office buildings, hotels, shopping centers and other commercial properties.
Russell 2000® Index
The Russell 2000® Index is a market capitalization-weighted index that measures the performance of the smallest 2,000 companies in the Russell Universe which comprises the 3,000 largest U.S. companies. The index is calculated on a total return basis with dividends reinvested. The index is unmanaged, its returns do not reflect any fees, expenses, or sales charges, and it is not available for direct investment.
S&P 500® Index
The S&P 500® Index is a free-float market capitalization-weighted index of 500 of the largest U.S. companies. The index is calculated on a total return basis with dividends reinvested. The index is unmanaged, its returns do not reflect any fees, expenses or sales charges, and it is not available for direct investment.
Standard & Poor’s Depositary Receipt (SPDR)
Shares of a security designed to track the value of the S&P 500® Index. SPDRs trade on the American Stock Exchange under the symbol SPY. One SPDR unit is valued at approximately one-tenth of the value of the S&P 500® Index. Dividends are distributed quarterly, and are based on the accumulated stock dividends held in trust, less any expenses of the trust.
UBS Global Infrastructure/Utilities 50/50 Index
The UBS Global Infrastructure/Utilities 50/50 Index is a derivative of the UBS Developed Infrastructure & Utilities Index. The infrastructure sector and the utilities sector each have a 50% weighting in terms of free-float market capitalization, which removes the skew towards utilities found in the UBS Developed Infrastructure & Utilities Index. Constituents of the index are all listed in developed markets. The index is unmanaged, its returns do not reflect any fees, expenses or sales charges, and it is not available for direct investment.
5
Table of Contents
Alternative Income Solution Fund
Fund Summary | Ticker Symbols: Class A: VAIAX Class C: VAICX Class I : VAIIX |
| ¢ | The Fund is non-diversified and has an investment objective of maximizing current income while considering capital appreciation. |
| ¢ | For the fiscal period April 23, 2014 (inception date) through October 31, 2014, the Fund’s Class A shares at NAV returned 1.82%*, Class C shares returned 1.38%*, and Class I shares returned 1.90%*. For the same period, the HFRX Fixed Income–Credit Index, which serves as the broad-based and style-specific benchmark index appropriate for comparison, returned -1.88%*. |
| * | Returns less than 1 year are not annualized. |
All performance figures assume reinvestment of distributions and exclude the effect of sales charges. Past performance is no guarantee of future results and current performance may be higher or lower than the performance shown above.
How did the markets perform during the Fund’s partial fiscal year?
| ¢ | Most global equity markets saw strong performance during the Fund’s partial fiscal year, from its inception date of April 23, 2014 through October 31, 2014. The S&P 500® Index, which measures the performance of large company stocks, finished the period up 9.02% and saw a number of new closing highs. In contrast, the Russell 2000® Index, a metric of small-cap stock performance, returned 0.77%, showing the dispersion of returns between large- and small-cap stocks. Non-U.S. stocks in developed markets did not perform well, with the MSCI EAFE® Index returning -3.17% for the partial fiscal year due to European stocks being down 6.49%. Emerging market stocks, as measured by the MSCI Emerging Markets Index, ended the period up 4.08%. The partial fiscal year saw a flurry of corporate merger activity, including Twenty-First Century Fox’s $80 billion offer for Time Warner, online real estate company Zillow’s $2.6 billion bid for Trulia, and speculation regarding a number of potential tax inversion deals. A highlight in September was the initial public offering (“IPO”) of Alibaba, the China-based e-commerce giant, whose blockbuster public debut at $21.8 billion was the largest U.S. IPO ever. |
| ¢ | The economic divergence among the United States, the United Kingdom, the eurozone, and |
Japan has become increasingly stark, and markets were heavily dominated by remarks from their central banks over the partial fiscal year. The timing of any Federal Reserve interest rate increase remains an issue of strong debate. While hawks argue that the interest rate cycle should be normalized before creating another bubble, the doves argue the economy is not yet strong enough to stand on its own. Geopolitical instability in Ukraine, the Middle East, a widening war against ISIS, protests in Hong Kong, the Ebola scare, as well as Argentina’s selective default, dominated headlines. New sanctions imposed by the U.S. and EU on Russia ushered in the winds of a new “Cold War,” which weighed heavily on Russian equity markets. In Europe, all eyes were on Scotland. Its September 18 referendum, in which the citizens chose to remain part of the United Kingdom, created volatility in European equity markets. |
| ¢ | Long-dated U.S. bonds have been one of the biggest bull markets this year, against the nearly unanimous consensus at the start of the year that interest rates would rise. U.S. 10-year Treasury yields finished October at 2.34%, down from a yield of 3.03% at year-end 2013. As a result, the Barclays U.S. Aggregate Bond Index finished the partial fiscal year up 3.22%. Credit spreads widened across the board, but particularly for lower quality issues. Selling pressure in the high yield market intensified in September as a confluence of factors such as abundant supply, strapped cash balances, tepid equities, rate concerns, and decreased risk appetite all weighed on demand. The European Central Bank (ECB) surprised the market in September by lowering its interest rates across the board. The ECB also announced it would buy asset-backed securities and bonds issued by eurozone banks. This contributed to the third calendar quarter’s massive euro sell-off of -7.9% versus the U.S. dollar. Additionally, the Bank of Japan’s surprise Halloween announcement regarding a big boost to its quantitative easing stimulus program contributed to the Japanese reflation theme, pushing Japanese equities higher and the yen lower versus the U.S. dollar. |
| ¢ | Real assets, with the exception of commodities, delivered the strongest gains for the partial fiscal year with U.S. REITs, as |
measured by the FTSE NAREIT® All Equity REIT Index, posting a +13.84% return. Earnings reports and company statements showed good cash flow growth across most property sectors, driven by improving demand, limited new supply, and the continued availability of low-cost financing. Master limited partnerships (MLPs) also had a strong partial fiscal year with the Alerian MLP IndexSM delivering a +11.88% return. Falling Treasury yields were particularly beneficial for the more interest rate-sensitive and bond-like MLPs. Increased mergers/consolidation activity, most notably the announcement of the Kinder Morgan restructuring deal, provided additional stock-specific catalysts. Commodities, as measured by the Bloomberg Commodity Index, declined 12.47% in the partial fiscal year with weakness across the board, as inflation concerns waned and there were concerns regarding global growth prospects. Global infrastructure stocks had gains for the partial fiscal year but were negatively affected during the third calendar quarter due to faltering economic growth, especially in Europe and China. |
| ¢ | Hedge fund strategies posted modest gains for the partial fiscal year, with losses in event-driven and convertible strategies offset by slight positive gains in equity long/short and credit strategies, as well as large gains in global macro strategies, which benefited from the rising U.S. dollar and fluctuating U.S. interest rates. Credit and convertible strategies were buffeted by spread widening, and event-driven strategies were negatively impacted by a number of merger and acquisition deals (most notably Sprint/T-Mobile, 21st Century Fox/Time Warner, and Shire/AbbVie) breaking down, as well as the cessation of a number of anticipated tax inversion mergers after the U.S. Treasury announced new rules to curtail such deals. |
What factors affected the Fund’s performance during its partial fiscal year?
| ¢ | The Fund generated a positive return for its partial fiscal year and outperformed its benchmark, the HFRXSM Fixed Income Credit Index. Each of the Fund’s six underlying strategies were either flat or generated a positive return. The largest contributors to the Fund’s total return were the real asset |
For information regarding the indexes and certain investment terms, see the Key Investment Terms starting on page 3.
6
Table of Contents
Alternative Income Solution Fund (Continued)
| strategies, benefiting from the market dynamics in their respective asset classes. The MLP and REIT strategies performed well due to portfolio positioning, while MLPs also benefited from merger and acquisition activity in the sector. Although global stocks were positive during the period, driven primarily by the performance of the U.S. stock market, the income-oriented equities strategy underperformed due to country market exposures. |
| ¢ | With respect to the credit-oriented strategies, two of the three had flat returns for the partial fiscal year, reflecting general credit spread widening. The third strategy, focusing on emerging market debt, had modest positive gains for the period, driven by gains in the second calendar quarter attributable to security selection and the overall strong performance of emerging market debt. Gains were pared back in the third calendar quarter as the strategy was affected by volatility in emerging market debt, which has largely been driven by events in Argentina and Brazil as well as a cooling Chinese economy. Several of the strategies have been layering on interest rate and credit hedges in order to offset future declines, but overall, derivatives had a negligible impact on the total portfolio. These strategies are diversified across both high yield bonds and bank loans emphasizing middle market companies. |
| ¢ | No changes were made to the roster of managers subadvising the underlying strategies during the partial fiscal year. The credit (-5%) and MLP (-5%) target allocations were modestly lowered during the fiscal year due to valuation concerns, while there were offsetting modest increases in the allocation targets to emerging market debt (+5%) and income-oriented equities (+5%) due to the more attractive market opportunity set in emerging market debt, as well as the more attractive valuations in developed non-U.S. equities, in particular European and emerging market equities. |
The preceding information is the opinion of portfolio management. Any such opinions are subject to change at any time based upon market or other conditions and should not be relied upon as investment advice. Past performance is no guarantee of future results, and there is no guarantee that market forecasts will be realized.
There is no guarantee that the Fund will meet its objective.
Alternative investments are not suitable for all investors.
Debt securities are subject to various risks, the most prominent of which are credit and interest rate risk. The issuer of a security may fail to make payments in a timely manner. Values of debt securities may rise and fall in response to changes in interest rates. This risk may be enhanced with longer-term maturities.
There is a greater level of credit risk and price volatility involved with high-yield securities than investment-grade securities.
There may be no ready market for loan participation interests. The Fund may have to sell the interests at a substantial discount. Such interests are subject to the credit risk of the underlying corporate borrower.
Investing internationally involves additional risks such as currency, political, accounting, economic, and market risk.
The market price of equity securities may be affected by financial market, industry, or issuer-specific events. Focus on a particular style or on small or medium-sized companies may enhance that risk.
The Fund may engage in short sales, and may experience a loss if the price of a borrowed security increases before the date on which the Fund replaces the security.
When a fund leverages its portfolio, the value of its shares may be more volatile and all other risks may be compounded.
Investments in derivatives such as futures, options, forwards, and swaps may increase volatility or cause a loss greater than the principal investment.
Investments in Master Limited Partnerships may be impacted by tax law changes, regulation, or factors affecting underlying assets.
The Fund may be negatively affected by factors specific to the real estate market, including interest rates, leverage, property, and management.
The Fund is non-diversified and may be more susceptible to factors negatively impacting its holdings to the extent that each security represents a larger portion of the Fund’s assets.
The Fund’s principal investments strategies will result in a consistently high portfolio turnover rate. A higher portfolio turnover rate may indicate higher transaction costs and may result in higher taxes when Fund shares are held in a taxable account.
| Asset Allocation | ||
| The following table presents asset allocations within certain sectors and as a percentage of total investments as of October 31, 2014. | ||
Corporate Bonds | 36% | |
Loan Agreement | 18% | |
Master Limited Partnerships | 13% | |
Common Stocks | 12% | |
Real Estate Investment Trusts | 12% | |
Foreign Government Securities | 3% | |
Municipal Bonds | 1% | |
Preferred Stock | 1% | |
Asset-Backed Securities | 1% | |
Other (includes short-term investments) | 3% | |
| ||
Total | 100% | |
| ||
| ||
For information regarding the indexes and certain investment terms, see the Key Investment Terms starting on page 3.
7
Table of Contents
Alternative Income Solution Fund (Continued)
Total Returns1 for periods ended October 31, 2014
| ||||||||
Since Inception | Inception Date | |||||||
| Class A Shares at NAV2 | 1.82% | 4/23/14 | ||||||
| Class A Shares at POP3,4 | -4.04 | 4/23/14 | ||||||
| Class C Shares at NAV2 | 1.38 | 4/23/14 | ||||||
| Class C Shares with CDSC4 | 0.38 | 4/23/14 | ||||||
| Class I Shares at NAV | 1.90 | 4/23/14 | ||||||
| HFRX Fixed Income–Credit Index | -1.885 | — | ||||||
Fund Expense Ratios6: A Shares: Gross 3.50%, Net 2.60%; C Shares: Gross 4.25%, Net 3.35%; I Shares: Gross 3.25%, Net 2.35%.
|
| |||||||
All returns represent past performance which is no guarantee of future results. Current performance may be higher or lower than the performance shown. The investment return and principal value of an investment will fluctuate so that an investor’s shares, when redeemed, may be worth more or less than their original cost. The above table and graph below do not reflect the deduction of taxes that a shareholder would pay on fund distributions or the redemption of shares. Please visit Virtus.com for performance data current to the most recent month-end.
1 Total returns are historical and include changes in share price and the reinvestment of both dividends and capital gains distributions. Total returns are not annualized.
2 “NAV” (Net Asset Value) total returns do not include the effect of any sales charge.
3 “POP” (Public Offering Price) total returns include the effect of the maximum front-end 5.75% sales charge.
4 “CDSC” (Contingent Deferred Sales Charge) is applied to redemptions of certain classes of shares that do not have a sales charge applied at the time of purchase. CDSC charges for certain redemptions of Class A shares made within 18 months of purchase in which a finder’s fee was paid and all redemptions of Class C shares within the first year are 1% and 0% thereafter.
5 The since inception index returns are from the Fund’s inception date.
6 The expense ratios of the Fund are set forth according to the prospectus for the Fund effective April 22, 2014, as supplemented and revised, and may differ from the expense ratios disclosed in the Financial Highlights tables in this report. See the Financial Highlights for more current expense ratios. Net Expense: Expenses reduced by the contractual fee waiver in effect through April 30, 2015. Gross Expense: Does not reflect the effect of the fee waiver.
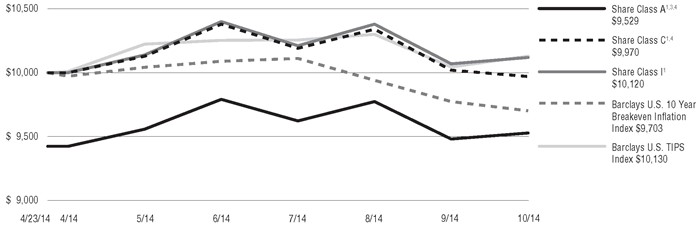
Growth of $10,000 For period ended 10/31
This chart assumes an initial investment of $10,000 made on April 23, 2014 (inception date of the Fund), for Class A, Class C, and Class I shares including any applicable sales charges or fees. Performance assumes reinvestment of dividends and capital gain distributions.

The indexes are unmanaged and not available for direct investment; therefore, their performance does not reflect the expenses associated with active management of an actual portfolio.
For information regarding the indexes and certain investment terms, see the Key Investment Terms starting on page 3.
8
Table of Contents
Alternative Inflation Solution Fund
Fund Summary | Ticker Symbols: Class A: VSAIX Class C: VSICX Class I : VIASX |
| ¢ | The Fund is non-diversified and has an investment objective of total return that exceeds the rate of inflation. |
| ¢ | For the fiscal period April 23, 2014 (inception date) through October 31, 2014, the Fund’s Class A shares at NAV returned 1.10%*, Class C shares at NAV returned 0.70%*~ and Class I shares returned 1.20%*. For the same period, the Barclays U.S. TIPS Index, a broad-based fixed income index, returned 1.30%* and the Barclays U.S. 10 Year Breakeven Inflation Benchmark Index, which is the Fund’s style-specific benchmark appropriate for comparison, returned -2.97%*. |
| * | Returns less than 1 year are not annualized. |
| ~ | See Footnote 7 on page 11. |
All performance figures assume reinvestment of distributions and exclude the effect of sales charges. Past performance is no guarantee of future results, and current performance may be higher or lower than the performance shown above.
How did the markets perform during the Fund’s partial fiscal year?
| ¢ | Most global equity markets saw strong performance during the Fund’s partial fiscal year, from its inception date of April 23, 2014 through October 31, 2014. The S&P 500® Index, which measures the performance of large company stocks, finished the period up 9.02% and saw a number of new closing highs. In contrast, the Russell 2000® Index, a metric of small-cap stock performance, returned 0.77%, showing the dispersion of returns between large- and small-cap stocks. Non-U.S. stocks in developed markets did not perform well, with the MSCI EAFE® Index returning -3.17% for the partial fiscal year due to European stocks being down 6.49%. Emerging market stocks, as measured by the MSCI Emerging Markets Index, ended the period up 4.08%. The partial fiscal year saw a flurry of corporate merger activity, including Twenty-First Century Fox’s $80 billion offer for Time Warner, online real estate company Zillow’s $2.6 billion bid for Trulia, and speculation regarding a number of potential tax inversion deals. A highlight in September was the IPO of Alibaba, the China-based e-commerce giant, whose blockbuster public debut at $21.8 billion was the largest U.S. IPO ever. |
| ¢ | The economic divergence among the United States, the United Kingdom, the eurozone, and Japan has become increasingly stark, and markets were heavily dominated by remarks from their central banks over the partial fiscal year. The timing of any Federal Reserve interest rate increase remains an issue of strong debate. While hawks argue that the |
interest rate cycle should be normalized before creating another bubble, the doves argue the economy is not yet strong enough to stand on its own. Geopolitical instability in Ukraine, the Middle East, a widening war against ISIS, protests in Hong Kong, the Ebola scare, as well as Argentina’s selective default, dominated headlines. New sanctions imposed by the U.S. and EU on Russia ushered in the winds of a new “Cold War,” which weighed heavily on Russian equity markets. In Europe, all eyes were on Scotland. Its September 18 referendum, in which the citizens chose to remain part of the United Kingdom, created volatility in European equity markets. |
| ¢ | Long-dated U.S. bonds have been one of the biggest bull markets this year, against the nearly unanimous consensus at the start of the year that interest rates would rise. U.S. 10-year Treasury yields finished October at 2.34%, down from a yield of 3.03% at year-end 2013. As a result, the Barclays U.S. Aggregate Bond Index finished the partial fiscal year up 3.22%. Credit spreads widened across the board, but particularly for lower quality issues. Selling pressure in the high yield market intensified in September as a confluence of factors such as abundant supply, strapped cash balances, tepid equities, rate concerns, and decreased risk appetite all weighed on demand. The European Central Bank (ECB) surprised the market in September by lowering its interest rates across the board. The ECB also announced it would buy asset-backed securities and bonds issued by eurozone banks. This contributed to the third calendar quarter’s massive euro sell-off of -7.9% versus the U.S. dollar. Additionally, the Bank of Japan’s surprise Halloween announcement regarding a big boost to its quantitative easing stimulus program contributed to the Japanese reflation theme, pushing Japanese equities higher and the yen lower versus the U.S. dollar. |
| ¢ | Real assets, with the exception of commodities, delivered the strongest gains for the partial fiscal year with U.S. REITs, as measured by the FTSE NAREIT® All Equity REIT Index, posting a +13.84% return. Earnings reports and company statements showed good cash flow growth across most property sectors, driven by improving demand, limited new supply, and the continued availability of low-cost financing. Master limited partnerships (MLPs) also had a strong partial fiscal year with the Alerian MLP IndexSM delivering a +11.88% return. Falling Treasury yields were particularly beneficial for the more interest rate-sensitive and bond-like MLPs. Increased mergers/consolidation activity, most notably the announcement of the Kinder Morgan restructuring deal, provided additional stock-specific catalysts. Commodities, as measured by the Bloomberg |
Commodity Index, declined 12.47% in the partial fiscal year with weakness across the board, as inflation concerns waned and there were concerns regarding global growth prospects. Global infrastructure stocks had gains for the partial fiscal year but were negatively affected during the third calendar quarter due to faltering economic growth, especially in Europe and China. |
| ¢ | Hedge fund strategies posted modest gains for the partial fiscal year, with losses in event-driven and convertible strategies offset by slight positive gains in equity long/short and credit strategies, as well as large gains in global macro strategies, which benefited from the rising U.S. dollar and fluctuating U.S. interest rates. Credit and convertible strategies were buffeted by spread widening, and event-driven strategies were negatively impacted by a number of merger and acquisition deals (most notably Sprint/T-Mobile, 21st Century Fox/Time Warner, and Shire/AbbVie) breaking down, as well as the cessation of a number of anticipated tax inversion mergers after the U.S. Treasury announced new rules to curtail such deals. |
What factors affected the Fund’s performance during its partial fiscal year?
| ¢ | The Fund generated a positive return for its partial fiscal year and outperformed its benchmark, the Barclays U.S. 10 Year Breakeven Inflation Index. Four of the Fund’s six underlying strategies generated a flat or positive return for the partial fiscal year. The largest contributors to the Fund’s total return were the MLP and REIT strategies, benefiting from the market dynamics in their respective asset classes. The MLP and REIT strategies performed well due to portfolio positioning, while MLPs also benefited from merger and acquisition activity in the sector. |
| ¢ | The largest negative return for the partial fiscal year was the commodity portion of the portfolio – which consists of exposure to the Bloomberg Commodity Index, implemented via derivatives – as commodities across the board had declines in the wake of lowered global growth projections. While global infrastructure stocks in general had modest gains for the partial fiscal year, they also were negatively affected during the third calendar quarter due to slowing global economic growth prospects. Additionally, the infrastructure strategy performed below its benchmark, the UBS Global Infrastructure/ Utilities 50/50 Index, due to country market exposures. |
| ¢ | The strategy that focuses on U.S. credit had flat returns for the partial fiscal year, reflecting general credit spread widening. The strategy is diversified across both high-yield bonds and |
For information regarding the indexes and certain investment terms, see the Key Investment Terms starting on page 3.
9
Table of Contents
Alternative Inflation Solution Fund (Continued)
bank loans, and the manager of the strategy has been layering on interest rate and credit hedges in order to offset future declines. The global inflation-linked strategy replicates the Barclays U.S. 10 Year Breakeven Index using a combination of inflation-linked bonds and Treasury futures, and as expected, had losses in Treasury futures in doing so. However, although this strategy had negative absolute returns due to lowered U.S. inflation expectations, it outperformed the Barclays U.S. 10 Year Breakeven Index return due to currency positioning and security selection. |
| ¢ | No changes were made to the roster of managers subadvising the Fund’s underlying strategies during the partial fiscal year. The MLP (-5%) target allocation was modestly lowered during the fiscal year due to valuation concerns, while there was an offsetting modest increase in the target allocation to infrastructure equities (+5%) due to the more attractive valuations in developed market non-U.S. equities, in particular European equities. |
The preceding information is the opinion of portfolio management. Any such opinions are subject to change at any time based upon market or other conditions and should not be relied upon as investment advice. Past performance is no guarantee of future results, and there is no guarantee that market forecasts will be realized.
There is no guarantee that the Fund will meet its objective.
Alternative investments are not suitable for all investors.
Debt securities are subject to various risks, the most prominent of which are credit and interest rate risk. The issuer of a security may fail to make payments in a timely manner. Values of debt securities may rise and fall in response to changes in interest rates. This risk may be enhanced with longer-term maturities.
Inflation-linked securities will react differently from other fixed income securities to changes in interest rates. Generally, the value of an inflation-linked security will fall when real interest rates rise and will rise when real interest rates fall.
The market price of equity securities may be affected by financial market, industry, or issuer-specific events. Focus on a particular style or on small or medium-sized companies may enhance that risk.
Investments in Master Limited Partnerships may be impacted by tax law changes, regulation, or factors affecting underlying assets.
The Fund may be negatively affected by factors specific to the real estate market, including interest rates, leverage, property, and management.
A fund that focuses its investments in infrastructure-related companies will be more sensitive to conditions affecting their business or operations.
There is a greater level of credit risk and price volatility involved with high-yield securities than investment-grade securities.
There may be no ready market for loan participation interests. The Fund may have to sell the interests at a substantial discount. Such interests are subject to the credit risk of the underlying corporate borrower.
Events negatively affecting a particular commodity in which the Fund focuses its investments may cause the value of the Fund’s shares to decrease, perhaps significantly.
The Fund may engage in short sales, and may experience a loss if the price of a borrowed security increases before the date on which the Fund replaces the security.
When a fund leverages its portfolio, the value of its shares may be more volatile and all other risks may be compounded.
Investments in derivatives such as futures, options, forwards, and swaps may increase volatility or cause a loss greater than the principal investment.
Investing internationally involves additional risks such as currency, political, accounting, economic, and market risk.
The Fund is non-diversified and may be more susceptible to factors negatively impacting its holdings to the extent that each security represents a larger portion of the Fund’s assets.
The Fund’s principal investments strategies will result in a consistently high portfolio turnover rate. A higher portfolio turnover rate may indicate higher transaction costs and may result in higher taxes when Fund shares are held in a taxable account.
Alternative Inflation Solution Fund
| ||
| The following table presents asset allocations within certain sectors and as a percentage of total investments as of October 31, 2014. | ||
U.S. Government Securities | 21% | |
Common Stocks | 19% | |
Master Limited Partnerships | 18% | |
Real Estate Investment Trusts | 18% | |
Corporate Bonds | 13% | |
Loan Agreements | 7% | |
Municipal Bonds | 1% | |
Asset-Backed Securities | 1% | |
Preferred Stock | 1% | |
Other (includes short-term investments) | 1% | |
| ||
Total | 100% | |
| ||
| ||
For information regarding the indexes and certain investment terms, see the Key Investment Terms starting on page 3.
10
Table of Contents
Alternative Inflation Solution Fund (Continued)
Total Returns1 for period ended 10/31/14
| ||||||||
Since Inception | Inception Date | |||||||
| Class A Shares at NAV2 | 1.10% | 4/23/14 | ||||||
| Class A Shares at POP3,4 | -4.71 | 4/23/14 | ||||||
| Class C Shares at NAV2,7 | 0.70 | 4/23/14 | ||||||
| Class C Shares with CDSC4 | -0.30 | 4/23/14 | ||||||
| Class I Shares at NAV | 1.20 | 4/23/14 | ||||||
| Barclays U.S. TIPS Index | 1.305 | — | ||||||
| Barclays U.S. 10 Year Breakeven Inflation Benchmark Index | -2.975 | — | ||||||
| Fund Expense Ratios6: A Shares: Gross 3.76%, Net 2.64%; C Shares: Gross 4.51%, Net 3.39%, I Shares: Gross 3.51%, Net 2.39%. | ||||||||
All returns represent past performance which is no guarantee of future results. Current performance may be higher or lower than the performance shown. The investment return and principal value of an investment will fluctuate so that an investor’s shares, when redeemed, may be worth more or less than their original cost. The above table and graph below do not reflect the deduction of taxes that a shareholder would pay on fund distributions or the redemption of shares. Please visit Virtus.com for performance data current to the most recent month-end.
1 Total returns are historical and include changes in share price and the reinvestment of both dividends and capital gains distributions. Total returns are not annualized.
2 “NAV” (Net Asset Value) total returns do not include the effect of any sales charge.
3 “POP” (Public Offering Price) total returns include the effect of the maximum front-end 5.75% sales charge.
4 “CDSC” (Contingent Deferred Sales Charge) is applied to redemptions of certain classes of shares that do not have a sales charge applied at the time of purchase. CDSC charges for certain redemptions of Class A shares made within 18 months of purchase in which a finder’s fee was paid are 1% and 0% thereafter.
5 The since inception index returns are from the Fund’s inception date.
6 The expense ratios of the Fund are set forth according to the prospectus for the Fund effective April 22, 2014, as supplemented and revised, and may differ from the expense ratios disclosed in the Financial Highlights tables in this report. See the Financial Highlights for more current expense ratios. Net Expense: Expenses reduced by the contractual fee waiver in effect through April 30, 2015. Gross Expense: Does not reflect the effect of the fee waiver.
7 Total Return for the report period presented in the table differs from the return in the Financial Highlights. The total return presented in the above table is calculated based on the NAV at which shareholder transactions were processed. The total return presented in the Financial Highlights section of the report is calculated in the same manner, but also takes into account certain adjustments that are necessary under generally accepted accounting principles required in the annual report and semi-annual report.
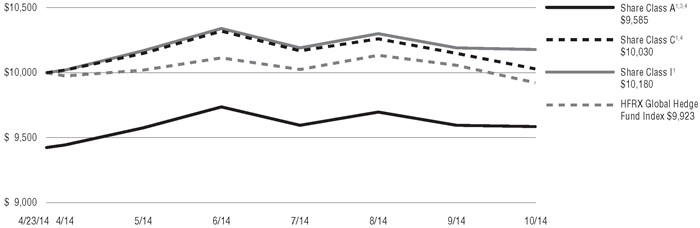
Growth of $10,000 For period ended 10/31
This chart assumes an initial investment of $10,000 made on April 23, 2014 (inception date of the Fund), for Class A shares including any applicable sales charges or fees. Performance assumes reinvestment of dividends and capital gain distributions.
The indexes are unmanaged and not available for direct investment; therefore, their performance does not reflect the expenses associated with active management of an actual portfolio.
For information regarding the indexes and certain investment terms, see the Key Investment Terms starting on page 3.
11
Table of Contents
Alternative Total Solution Fund
Fund Summary | Ticker Symbols: Class A: VATAX Class C: VATCX Class I : VATIX |
| ¢ | The Fund is non-diversified and has an investment objective of long-term capital appreciation through investments that have a low correlation to traditional asset classes. |
| ¢ | For the fiscal period April 23, 2014 (inception date) through October 31, 2014, the Fund’s Class A shares at NAV returned 1.70%*, Class C shares returned 1.30%*, and Class I shares returned 1.80%.* For the same period, the HFRX Global Hedge Fund Index, which serves as the broad-based index and style-specific benchmark appropriate for comparison, returned -0.77%*. |
| * | Returns less than 1 year are not annualized. |
All performance figures assume reinvestment of distributions and exclude the effect of sales charges. Past performance is no guarantee of future results, and current performance may be higher or lower than the performance shown above.
How did the markets perform during the Fund’s partial fiscal year?
| ¢ | Most global equity markets saw strong performance during the Fund’s partial fiscal year, from its inception date of April 23, 2014 through October 31, 2014. The S&P 500® Index, which measures the performance of large company stocks, finished the period up 9.02% and saw a number of new closing highs. In contrast, the Russell 2000® Index, a metric of small-cap stock performance, returned 0.77%, showing the dispersion of returns between large- and small-cap stocks. Non-U.S. stocks in developed markets did not perform well, with the MSCI EAFE® Index returning -3.17% for the partial fiscal year due to European stocks being down 6.49%. Emerging market stocks, as measured by the MSCI Emerging Markets Index, ended the period up 4.08%. The partial fiscal year saw a flurry of corporate merger activity, including Twenty-First Century Fox’s $80 billion offer for Time Warner, online real estate company Zillow’s $2.6 billion bid for Trulia, and speculation regarding a number of potential tax inversion deals. A highlight in September was the IPO of Alibaba, the China-based e-commerce giant, whose blockbuster public debut at $21.8 billion was the largest U.S. IPO ever. |
| ¢ | The economic divergence among the United States, the United Kingdom, the eurozone, and Japan has become increasingly stark, and markets were heavily dominated by remarks from their central banks over the partial fiscal year. The timing of any Federal Reserve interest rate increase remains an issue of strong debate. While hawks argue that the interest rate cycle should be normalized before creating another bubble, the doves argue the economy is not yet strong enough to stand on its own. Geopolitical instability in Ukraine, the Middle East, a widening war against ISIS, protests in Hong Kong, the Ebola scare, as well as Argentina’s selective default, dominated headlines. New sanctions imposed by the U.S. and EU on Russia ushered in the winds of a new “Cold War,” which weighed heavily on Russian equity markets. In Europe, all eyes were on Scotland. Its September 18 referendum, in which the citizens chose to remain part of the United Kingdom, created volatility in European equity markets. |
| ¢ | Long-dated U.S. bonds have been one of the biggest bull markets this year, against the nearly unanimous consensus at the start of the year that interest rates would rise. U.S. 10-year Treasury yields finished October at 2.34%, down from a yield of 3.03% at year-end 2013. As a result, the Barclays U.S. Aggregate Bond Index finished the partial fiscal year up 3.22%. Credit spreads widened across the board, but particularly for lower quality issues. Selling pressure in the high yield market intensified in September as a confluence of factors such as abundant supply, strapped cash balances, tepid equities, rate concerns, and decreased risk appetite all weighed on demand. The European Central Bank (ECB) surprised the market in September by lowering its interest rates across the board. The ECB also announced it would buy asset-backed securities and bonds issued by eurozone banks. This contributed to the third calendar quarter’s massive euro sell-off of -7.9% versus the U.S. dollar. Additionally, the Bank of Japan’s surprise Halloween announcement regarding a big boost to its quantitative easing stimulus program contributed to the Japanese reflation theme, pushing Japanese equities higher and the yen lower versus the U.S. dollar. |
| ¢ | Real assets, with the exception of commodities, delivered the strongest gains for the partial fiscal year with U.S. REITs, as measured by the FTSE NAREIT ® All Equity REIT Index, posting a +13.84% return. Earnings reports and company statements showed good cash flow growth across most property sectors, driven by improving demand, limited new supply, and the continued availability of low-cost financing. Master limited partnerships (MLPs) also had a strong partial fiscal year with the Alerian MLP IndexSM delivering a +11.88% return. Falling Treasury yields were particularly beneficial for the more interest rate-sensitive and bond-like MLPs. Increased mergers/consolidation activity, most notably the announcement of the Kinder Morgan restructuring deal, provided additional stock-specific catalysts. Commodities, as measured by the Bloomberg Commodity Index, declined 12.47% in the partial fiscal year with weakness across the board, as inflation concerns waned and there were concerns regarding global growth prospects. Global infrastructure stocks had gains for the partial fiscal year but were negatively affected during the third calendar quarter due to faltering economic growth, especially in Europe and China. |
| ¢ | Hedge fund strategies posted modest gains for the partial fiscal year, with losses in event-driven and convertible strategies offset by slight positive gains in equity long/short and credit strategies, as well as large gains in global macro strategies, which benefited from the rising U.S. dollar and fluctuating U.S. interest rates. Credit and convertible strategies were buffeted by spread widening, and event-driven strategies were negatively impacted by a number of merger and acquisition deals (most notably Sprint/T-Mobile, 21st Century Fox/Time Warner, and Shire/AbbVie) breaking down, as well as the cessation of a number of anticipated tax inversion mergers after the U.S. Treasury announced new rules to curtail such deals. |
What factors affected the Fund’s performance during its partial fiscal year?
| ¢ | The Fund generated a positive return for its partial fiscal year and outperformed its benchmark, the HFRXSM Global Hedge Fund Index. Although performance of the Fund’s |
For information regarding the indexes and certain investment terms, see the Key Investment Terms starting on page 3.
12
Table of Contents
Alternative Total Solution Fund (Continued)
underlying strategies was mixed, a number generated positive results. Overall, the Fund’s diversified exposure to a broad range of alternative strategies allowed it to capture returns from strategies that were performing well, such as global macro, equity long/short, MLPs, and REITs, while mitigating losses when there was a pullback in the U.S. stock market, such as there was in September when the Fund outperformed the S&P 500® Index. The overall impact of derivatives on the portfolio was minimal for the partial fiscal year. |
| ¢ | The largest contributors to the Fund’s total return were the real asset strategies, which benefited from the market dynamics in their respective asset classes. The MLP and REIT strategies performed well due to portfolio positioning, while MLPs also benefited from merger and acquisition activity in the sector. In contrast, global infrastructure stocks in general had modest gains for the partial fiscal year but were negatively affected during the third calendar quarter due to slowing global economic growth prospects. The infrastructure strategy performed below its benchmark, the UBS Global Infrastructure/ Utilities 50/50 Index, due to country market exposures. |
| ¢ | With respect to the credit-oriented strategies, two of the three had flat returns for the partial fiscal year, reflecting general credit spread widening. The third strategy, focusing on emerging market debt, had modest positive gains for the period, driven by gains in the second calendar quarter, attributable to security selection and the overall strong performance of emerging market debt. Gains were pared back in the third calendar quarter as the strategy was affected by volatility in emerging market debt, which has largely been driven by events in Argentina and Brazil, as well as a cooling Chinese economy. Several of the strategies have been layering on interest rate and credit hedges in order to offset future declines. The portfolios are diversified across both high-yield bonds and bank loans emphasizing middle market companies. |
| ¢ | The hedge fund strategies had mixed returns during the partial fiscal year with positive gains from the manager of the equity long/ short strategy, who added value via stock selection, although their hedges, via derivatives, detracted value for the fiscal year |
in an overall rising U.S. stock market. The global macro exposure, implemented via derivatives, also benefited the Fund, especially during a period of U.S. stock market losses in September, as the strategy had gains in currency and rate trading. The convertible bond market was negatively affected by volatile equity markets, spread widening, and heavy new issuance during the third calendar quarter, resulting in modest losses, while the strategy was also negatively affected by security selection. The event-driven strategy posted a negative return for the partial fiscal year due to several telecom merger and acquisition deal-breaks in the third calendar quarter. |
| ¢ | No changes were made to the roster of managers subadvising the underlying strategies during the partial fiscal year. The credit (-4%) and MLP (-2%) target allocations were modestly lowered during the period due to valuation concerns, while there were offsetting modest increases in the target allocations to emerging market debt (+4%) and equity long/short (+2%) due to the more attractive market opportunity set and to increase the hedged exposure in the portfolio. |
The preceding information is the opinion of portfolio management. Any such opinions are subject to change at any time based upon market or other conditions and should not be relied upon as investment advice. Past performance is no guarantee of future results, and there is no guarantee that market forecasts will be realized.
There is no guarantee that the Fund will meet its objective.
Alternative investments are not suitable for all investors.
The Fund may engage in short sales, and may experience a loss if the price of a borrowed security increases before the date on which the Fund replaces the security.
When a fund leverages its portfolio, the value of its shares may be more volatile and all other risks may be compounded.
The market price of equity securities may be affected by financial market, industry, or issuer-specific events. Focus on a particular style or on small or medium-sized companies may enhance that risk.
Investments in derivatives such as futures, options, forwards, and swaps may increase volatility or cause a loss greater than the principal investment.
Investing internationally, especially in emerging markets, involves additional risks such as currency, political, accounting, economic, and market risk.
Debt securities are subject to various risks, the most prominent of which are credit and interest rate risk. The issuer of a security may fail to make payments in a timely manner. Values of debt securities may rise and fall in response to changes in interest rates. This risk may be enhanced with longer-term maturities.
There is a greater level of credit risk and price volatility involved with high-yield securities than investment-grade securities.
There may be no ready market for loan participation interests. The Fund may have to sell the interests at a substantial discount. Such interests are subject to the credit risk of the underlying corporate borrower.
A convertible security may be called for redemption at a time and price unfavorable to the fund.
Investments in Master Limited Partnerships may be impacted by tax law changes, regulation, or factors affecting underlying assets.
The Fund may be negatively affected by factors specific to the real estate market, including interest rates, leverage, property, and management.
A fund that focuses its investments in infrastructure-related companies will be more sensitive to conditions affecting their business or operations.
Commodity-linked instruments may experience a return different than the commodity they attempt to track and may also be exposed to counterparty risk.
The Fund’s principal investments strategies will result in a consistently high portfolio turnover rate. A higher portfolio turnover rate may indicate higher transaction costs and may result in higher taxes when Fund shares are held in a taxable account.
For information regarding the indexes and certain investment terms, see the Key Investment Terms starting on page 3.
13
Table of Contents
Alternative Total Solution Fund (Continued)
| Asset Allocation | ||
| The following table presents asset allocations within certain sectors and as a percentage of total investments as of October 31, 2014. | ||
Common Stocks | 34% | |
Corporate Bonds | 18% | |
Convertible Bonds | 11% | |
Master Limited Partnerships | 8% | |
Loan Agreements | 8% | |
Real Estate Investment Trusts | 6% | |
Foreign Government Securities | 2% | |
Preferred Stock | 1% | |
Municipal Bonds | 1% | |
Asset-Backed Securities | 1% | |
Other (includes short-term investments) | 10% | |
| ||
Total | 100% | |
| ||
| �� | ||
| ||
| Total Returns1 for period ended 10/31/14 | ||||||||
Since Inception | Inception Date | |||||||
Class A Shares at NAV2
| 1.70% | 4/23/14 | ||||||
Class A Shares at POP3,4
| -4.15 | 4/23/14 | ||||||
Class C Shares at NAV2
| 1.30 | 4/23/14 | ||||||
Class C Shares with CDSC4
| 0.30 | 4/23/14 | ||||||
Class I Shares at NAV
| 1.80 | 4/23/14 | ||||||
HFRX Global Hedge Fund Index
| -0.775 | — | ||||||
Fund Expense Ratios6: A Shares: Gross 3.98%, Net 3.18%; C Shares: Gross 4.73%, Net 3.93%; I Shares: Gross 3.73%, Net 2.93%.
|
| |||||||
All returns represent past performance which is no guarantee of future results. Current performance may be higher or lower than the performance shown. The investment return and principal value of an investment will fluctuate so that an investor’s shares, when redeemed, may be worth more or less than their original cost. The above table and graph below do not reflect the deduction of taxes that a shareholder would pay on fund distributions or the redemption of shares. Please visit Virtus.com for performance data current to the most recent month-end.
1 Total returns are historical and include changes in share price and the reinvestment of both dividends and capital gains distributions. Total returns are not annualized.
2 “NAV” (Net Asset Value) total returns do not include the effect of any sales charge.
3 “POP” (Public Offering Price) total returns include the effect of the maximum front-end 5.75% sales charge.
4 “CDSC” (Contingent Deferred Sales Charge) is applied to redemptions of certain classes of shares that do not have a sales charge applied at the time of purchase. CDSC charges for certain redemptions of Class A shares made within 18 months of purchase in which a finder’s fee was paid and all redemptions of Class C shares within the first year are 1% and 0% thereafter.
5 The since inception index return is from the Fund’s inception date.
6 The expense ratios of the Fund are set forth according to the prospectus for the Fund effective April 22, 2014, as supplemented and revised, and may differ from the expense ratios disclosed in the Financial Highlights tables in this report. See the Financial Highlights for more current expense ratios. Net Expense: Expenses reduced by the contractual fee waiver in effect through April 30, 2015. Gross Expense: Does not reflect the effect of the fee waiver.
For information regarding the indexes and certain investment terms, see the Key Investment Terms starting on page 3.
14
Table of Contents
Alternative Total Solution Fund (Continued)
Growth of $10,000 For periods ended 10/31
This chart assumes an initial investment of $10,000 made on April 23, 2014 (inception date of the Fund), for Class A, Class C, and Class I shares including any applicable sales charges or fees. Performance assumes reinvestment of dividends and capital gain distributions.
The indexes are unmanaged and not available for direct investment; therefore their performance does not reflect the expenses associated with active management of an actual portfolio.
For information regarding the indexes and certain investment terms, see the Key Investment Terms starting on page 3.
15
Table of Contents
Fund Summary | Ticker Symbols: Class A: VASBX Class C: VSBCX Class I : VISBX |
| ¢ | The Fund is diversified and has an investment objective of seeking total return comprised of income and capital appreciation. |
| ¢ | For the fiscal period from September 8, 2014 (inception date) through October 31, 2014, the Fund’s Class A shares at NAV returned -0.33%*, Class C shares returned -0.43%*, and Class I shares returned -0.29%*. For the same period, the Barclays U.S. Aggregate Bond Index, a broad-based fixed income index, returned 0.77%* and the BofA Merrill Lynch U.S. Dollar 3-Month LIBOR Constant Maturity Index, which is the Fund’s style-specific benchmark index appropriate for comparison, returned 0.03%*. |
| * Returns less than 1 year are not annualized. |
| All performance figures assume reinvestment of distributions and exclude the effect of sales charges. Past performance is no guarantee of future results, and current performance may be higher or lower than the performance shown above. |
There is no guarantee that the Fund will meet its objective.
† The Fund is less than six months old - No commentary required.
Debt securities are subject to various risks, the most prominent of which are credit and interest rate risk. The issuer of a security may fail to make payments in a timely manner. Values of debt securities may rise and fall in response to changes in interest rates. This risk may be enhanced with longer-term maturities.
There is a greater level of credit risk and price volatility involved with high-yield securities than investment-grade securities.
Investing internationally, especially in emerging markets, involves additional risks such as currency, political, accounting, economic, and market risk.
There may be no ready market for loan participation interests. The Fund may have to sell the interests at a substantial discount. Such interests are subject to the credit risk of the underlying corporate borrower.
Changes in interest rates can cause both extension and prepayment risks for asset and mortgage-backed securities. These securities are also subject to risks associated with the repayment of underlying collateral.
Investments in derivatives such as futures, options, forwards, and swaps may increase volatility or cause a loss greater than the principal investment.
The value of an ETF may be more volatile than the underlying portfolio of securities the ETF is designed to track. The costs of owning the ETF may exceed the cost of investing directly in the underlying securities.
| Asset Allocation | ||
The following table presents asset allocations within certain sectors and as a percentage of total investments as of October 31, 2014. | ||
Corporate Bonds | 45% | |
U.S. Government Securities | 18% | |
Loan Agreements | 13% | |
Mortgaged-Backed Securities | 8% | |
Asset-Backed Securities | 7% | |
Foreign Government Securities | 3% | |
Preferred Stock | 1% | |
Other (includes short-term investments) | 5% | |
| ||
Total |
100% | |
| ||
| ||
For information regarding the indexes and certain investment terms, see the Key Investment Terms starting on page 3.
16
Table of Contents
Strategic Income Fund (Continued)
| Total Returns1 for periods ended 10/31/14 | ||||||||
Since Inception
| Inception Date
| |||||||
Class A Shares at NAV2
| -0.33% | 9/08/14 | ||||||
Class A Shares at POP3,4
| -4.06 | 9/08/14 | ||||||
Class C Shares at NAV2
| -0.43 | 9/08/14 | ||||||
Class C Shares with CDSC4
| -1.42 | 9/08/14 | ||||||
Class I Shares at NAV
| -0.29 | 9/08/14 | ||||||
Barclays U.S. Aggregate Bond Index
| 0.775 | — | ||||||
BofA Merrill Lynch U.S. Dollar 3-Month LIBOR Constant Maturity Index
| 0.035 | — | ||||||
Fund Expense Ratios6: A Shares: Gross 2.12%, Net 1.41%; C Shares: Gross 2.87%, Net 2.16%; I Shares: Gross 1.87%, Net 1.16%.
All returns represent past performance which is no guarantee of future results. Current performance may be higher or lower than the performance shown. The investment return and principal value of an investment will fluctuate so that an investor’s shares, when redeemed, may be worth more or less than their original cost. The above table and graph below do not reflect the deduction of taxes that a shareholder would pay on fund distributions or the redemption of shares. Please visit Virtus.com for performance data current to the most recent month-end.
1 Total returns are historical and include changes in share price and the reinvestment of both dividends and capital gains distributions. Total returns are not annualized.
2 “NAV” (Net Asset Value) total returns do not include the effect of any sales charge.
3 “POP” (Public Offering Price) total returns include the effect of the maximum front-end 3.75% sales charge.
4 “CDSC” (Contingent Deferred Sales Charge) is applied to redemptions of certain classes of shares that do not have a sales charge applied at the time of purchase. CDSC charges for certain redemptions of Class A shares made within 18 months of purchase in which a finder’s fee was paid and all redemptions of Class C shares within the first year. Class A shares charge is 0.50% and Class C shares within the first year are 1% and 0% thereafter.
5 The since inception index return is from the Fund’s inception date.
6 The expense ratios of the Fund are set forth according to the prospectus for the Fund effective September 8, 2014, as supplemented and revised, and may differ from the expense ratios disclosed in the Financial Highlights tables in this report. See the Financial Highlights for more current expense ratios. Net Expense: Expenses reduced by the contractual fee waiver in effect through February 29, 2016. Gross Expense: Does not reflect the effect of the fee waiver.
Growth of $10,000 For period ended 10/31
This chart assumes an initial investment of $10,000 made on September 8, 2014 (inception date of the Fund), for Class A, Class C, and Class I shares including any applicable sales charges or fees. Performance assumes reinvestment of dividends and capital gain distributions.
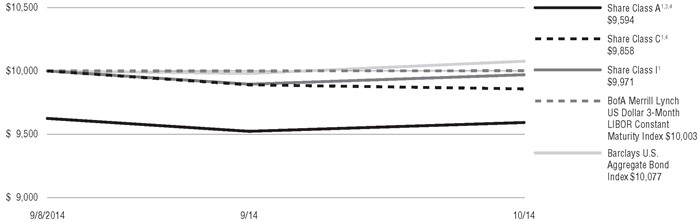
The indexes are unmanaged and not available for direct investment; therefore, their performance does not reflect the expenses associated with active management of an actual portfolio.
For information regarding the indexes and certain investment terms, see the Key Investment Terms starting on page 3.
17
Table of Contents
VIRTUS ALTERNATIVE INCOME SOLUTION FUND
SCHEDULE OF INVESTMENTS AND SECURITIES SOLD SHORT
OCTOBER 31, 2014
($ are reported in thousands)
| PAR VALUE | VALUE | |||||||||
FOREIGN GOVERNMENT SECURITIES—2.8% |
| |||||||||
Argentine Republic Government International Bond 0.000%, 12/15/35 |
| 2,580 | EUR |
| $239 |
| ||||
Brazil Notas do | 320 | BRL | 128 | |||||||
Hellenic Republic | 21 | EUR | 19 | |||||||
2.000%, 2/24/24(2) | 21 | EUR | 19 | |||||||
2.000%, 2/24/25(2) | 21 | EUR | 18 | |||||||
2.000%, 2/24/26(2) | 21 | EUR | 17 | |||||||
2.000%, 2/24/27(2) | 21 | EUR | 17 | |||||||
2.000%, 2/24/28(2) | 21 | EUR | 16 | |||||||
2.000%, 2/24/29(2) | 21 | EUR | 16 | |||||||
2.000%, 2/24/30(2) | 21 | EUR | 16 | |||||||
2.000%, 2/24/31(2) | 21 | EUR | 15 | |||||||
2.000%, 2/24/32(2) | 21 | EUR | 15 | |||||||
2.000%, 2/24/33(2) | 21 | EUR | 15 | |||||||
2.000%, 2/24/34(2) | 21 | EUR | 15 | |||||||
2.000%, 2/24/35(2) | 21 | EUR | 15 | |||||||
2.000%, 2/24/36(2) | 21 | EUR | 15 | |||||||
2.000%, 2/24/37(2) | 21 | EUR | 14 | |||||||
2.000%, 2/24/38(2) | 21 | EUR | 14 | |||||||
2.000%, 2/24/39(2) | 21 | EUR | 14 | |||||||
2.000%, 2/24/40(2) | 21 | EUR | 14 | |||||||
2.000%, 2/24/41(2) | 21 | EUR | 14 | |||||||
2.000%, 2/24/42(2) | 21 | EUR | 14 | |||||||
Indonesia Treasury | 1,400,000 | IDR | 116 | |||||||
Instituto Costarricense de Electricidad | $ | 200 | 173 | |||||||
Kenya Treasury Bonds | 250 | 237 | ||||||||
| ||||||||||
TOTAL FOREIGN GOVERNMENT SECURITIES |
| |||||||||
| (Identified Cost $1,242) | 1,205 | |||||||||
| ||||||||||
| MUNICIPAL BONDS—1.2% | ||||||||||
| New Jersey—0.3% | ||||||||||
Tobacco Settlement | ||||||||||
4.750%, 6/1/34 | 110 | 82 | ||||||||
5.000%, 6/1/41 | 55 | 41 | ||||||||
|
| |||||||||
| 123 | ||||||||||
| PAR VALUE | VALUE | |||||||||
Puerto Rico—0.7% |
| |||||||||
Commonwealth of Puerto Rico, Series A | $ | 320 | $ | 279 | ||||||
5.000%, 7/1/41 | 5 | 4 | ||||||||
Puerto Rico Sales Tax Financing Corp. | 330 | 24 | ||||||||
|
| |||||||||
| 307 | ||||||||||
Texas—0.2% | ||||||||||
Texas Public Finance | 100 | 100 | ||||||||
| ||||||||||
TOTAL MUNICIPAL BONDS |
| |||||||||
| (Identified Cost $542) | 530 | |||||||||
| ||||||||||
ASSET-BACKED SECURITIES—0.8% |
| |||||||||
Cutwater Ltd. CLO | 100 | 91 | ||||||||
Gallatin CLO VII Ltd. | 40 | 38 | ||||||||
Gallatin CLO VII Ltd. | 35 | 33 | ||||||||
Madison Park Funding
|
| 200
|
|
| 182
|
| ||||
| ||||||||||
| TOTAL ASSET-BACKED SECURITIES | ||||||||||
| (Identified Cost $359) | 344 | |||||||||
| ||||||||||
| CORPORATE BONDS—34.4% | ||||||||||
| Consumer Discretionary—3.3% | ||||||||||
American | 60 | 59 | ||||||||
APX Group, Inc. | 10 | 10 | ||||||||
8.750%, 12/1/20 | 145 | 127 | ||||||||
Bon-Ton Department Stores, Inc. (The) | 55 | 48 | ||||||||
Caesars Entertainment | 180 | 137 | ||||||||
9.000%, 2/15/20 | 70 | 53 | ||||||||
| PAR VALUE | VALUE | |||||||
Consumer Discretionary—continued |
| |||||||
Clear Channel | $ | 30 | $ 26 | |||||
Edcon Pty Ltd. RegS | 180 | 148 | ||||||
Guitar Center, Inc. | 85 | 63 | ||||||
JC Penney Corp., Inc. | 180 | 149 | ||||||
Liberty Interactive LLC | 90 | 98 | ||||||
Mohegan Tribal | 90 | 94 | ||||||
PF Chang’s China | 20 | 20 | ||||||
Shingle Springs Tribal | 85 | 95 | ||||||
Toys R Us, Inc. | 155 | 122 | ||||||
7.375%, 10/15/18 | 90 | 55 | ||||||
William Lyon Homes, | 30 | 31 | ||||||
WMG Acquisition | 60 | 59 | ||||||
|
| |||||||
| 1,394 | ||||||||
|
| |||||||
Consumer Staples—1.1% | ||||||||
Albertsons Holdings | 70 | 70 | ||||||
Kissner Milling Co., | 175 | 179 | ||||||
New Albertson’s, Inc. | 155 | 147 | ||||||
7.450%, 8/1/29 | 15 | 14 | ||||||
8.700%, 5/1/30 | 5 | 5 | ||||||
SUPERVALU, Inc. | 50 | 49 | ||||||
|
| |||||||
| 464 | ||||||||
|
| |||||||
Energy—9.3% | ||||||||
Alpha Natural | 25 | 13 | ||||||
See Notes to Financial Statements.
18
Table of Contents
VIRTUS ALTERNATIVE INCOME SOLUTION FUND
SCHEDULE OF INVESTMENTS AND SECURITIES SOLD SHORT (Continued)
OCTOBER 31, 2014
($ are reported in thousands)
| PAR | ||||||||
| VALUE | VALUE | |||||||
| Energy—continued | ||||||||
American Energy - | ||||||||
9.000%, 9/15/22(4) | $ | 35 | $ | 31 | ||||
American | ||||||||
7.125%, 11/1/20(4) | 65 | 57 | ||||||
7.375%, 11/1/21(4) | 44 | 39 | ||||||
Berau Coal Energy Tbk | ||||||||
7.250%, 3/13/17(3) | 200 | 138 | ||||||
Bumi Investment Pte, | 250 | 97 | ||||||
Energy Transfer Equity LP | 100 | 106 | ||||||
EXCO Resources, Inc. | 50 | 44 | ||||||
Forbes Energy | 243 | 236 | ||||||
Linn Energy LLC / Linn | 15 | 14 | ||||||
6.500%, 9/15/21 | 20 | 18 | ||||||
MIE Holdings Corp. | 200 | 196 | ||||||
Odebrecht Offshore | 191 | 200 | ||||||
Offshore Drilling | 200 | 211 | ||||||
ONGC Videsh, Ltd. | 200 | 200 | ||||||
Pacific Rubiales | 100 | 95 | ||||||
Pan American Energy | 60 | 64 | ||||||
Petroleos de | 73 | 55 | ||||||
6.000%, 11/15/26(3) | 253 | 125 | ||||||
QGOG Constellation | 200 | 197 | ||||||
| PAR | ||||||||||
| VALUE | VALUE | |||||||||
| Energy—continued | ||||||||||
Rockies Express | $ | 145 | $ | 154 | ||||||
Sabine Pass | 300 | 312 | ||||||||
SandRidge Energy, | 190 | 171 | ||||||||
Sanjel Corp. 144A | 450 | 410 | ||||||||
Seitel, Inc. | 295 | 288 | ||||||||
Teine Energy, Ltd. | 65 | 62 | ||||||||
Venoco, Inc. | 411 | 343 | ||||||||
Walter Energy, Inc. | 50 | 44 | ||||||||
YPF SA RegS | 45 | 47 | ||||||||
|
| |||||||||
|
3,967 |
| ||||||||
|
| |||||||||
| Financials—3.4% | ||||||||||
Banco Btg Pactual | 200 | 208 | ||||||||
Banco do Brasil SA | 200 | 157 | ||||||||
Earls Thirteen Ltd. | 149 | 148 | ||||||||
Financiera de | 129,000 | COP | 64 | |||||||
Financiera | 200 | 205 | ||||||||
Greektown Holdings | 494 | 499 | ||||||||
Ukreximbank Via Biz | 200 | 162 | ||||||||
|
| |||||||||
| 1,443 | ||||||||||
|
| |||||||||
| PAR | ||||||||
| VALUE | VALUE | |||||||
| Health Care—0.4% | ||||||||
Aurora Diagnostics | $ | 65 | $ | 55 | ||||
Kindred Healthcare, | 100 | 99 | ||||||
Mallinckrodt | 40 | 42 | ||||||
|
| |||||||
|
196 |
| ||||||
|
| |||||||
| Industrials—7.5% | ||||||||
Cenveo Corp. 144A | 50 | 46 | ||||||
CEVA Group PLC 144A | 442 | 432 | ||||||
Harland Clarke | 110 | 112 | ||||||
Lansing Trade Group | 469 | 448 | ||||||
Michael Baker | 322 | 329 | ||||||
Monitronics | 95 | 98 | ||||||
Navigator Holdings | 472 | 504 | ||||||
Red de Carreteras de | 2,000 | MXN | 143 | |||||
Ridgebury Crude | 442 | 451 | ||||||
ServiceMaster Co., | 50 | 51 | ||||||
See Notes to Financial Statements.
19
Table of Contents
VIRTUS ALTERNATIVE INCOME SOLUTION FUND
SCHEDULE OF INVESTMENTS AND SECURITIES SOLD SHORT (Continued)
OCTOBER 31, 2014
($ are reported in thousands)
| PAR VALUE | VALUE | |||||||||
| Industrials—continued | ||||||||||
Signode Industrial Group Lux SA/Signode Industrial Group US, Inc. 144A | $ 100 | $ | 97 | |||||||
Tervita Corp. 144A | 442 | 427 | ||||||||
TransDigm, Inc. | 25 | 25 | ||||||||
6.500%, 7/15/24 | 30 | 31 | ||||||||
|
| |||||||||
|
3,194 |
| ||||||||
|
| |||||||||
| Information Technology—0.4% | ||||||||||
BMC Software | 105 | 101 | ||||||||
Boxer Parent Co., Inc. PIK 144A | 30 | 27 | ||||||||
Zebra Technologies Corp. 144A | 35 | 37 | ||||||||
|
| |||||||||
|
165 |
| ||||||||
|
| |||||||||
| Materials—3.2% | ||||||||||
AK Steel Corp. | 40 | 40 | ||||||||
Cimento Tupi SA 144A | 60 | 60 | ||||||||
Cornerstone Chemical Co. 144A | 50 | 50 | ||||||||
Evraz, Inc. NA Canada 144A | 45 | 45 | ||||||||
Ferrexpo Finance PLC RegS | 200 | 191 | ||||||||
First Quantum Minerals Ltd. RegS | 60 | 59 | ||||||||
Gold Fields Orogen Holding BVI Ltd. RegS | 200 | 179 | ||||||||
IAMGOLD Corp. 144A | 100 | 83 | ||||||||
Momentive Performance Materials Escrow | 85 | 1 | ||||||||
Momentive Performance Materials, Inc. | 85 | 75 | ||||||||
| PAR VALUE | VALUE | |||||||||
| Materials—continued | ||||||||||
Rain CII Carbon LLC / | $ 95 | $ | 98 | |||||||
Turkiye Sise ve Cam | 200 | 197 | ||||||||
Vedanta Resources PLC RegS | 300 | 306 | ||||||||
|
| |||||||||
|
1,384 |
| ||||||||
|
| |||||||||
| Telecommunication Services—5.0% | ||||||||||
Avanti Communications | 642 | 623 | ||||||||
Axtel SAB de CV RegS | 180 | 182 | ||||||||
Empresa de Telecomunicaciones de Bogota RegS | 20,000 | COP | 9 | |||||||
Sprint Capital Corp. | 125 | 122 | ||||||||
8.750%, 3/15/32 | 80 | 90 | ||||||||
Sprint Corp. 144A | 75 | 77 | ||||||||
Telefonica del Peru | 250 | PEN | 89 | |||||||
T-Mobile USA, Inc. | 25 | 26 | ||||||||
Trilogy International | 880 | 896 | ||||||||
|
| |||||||||
|
2,114 |
| ||||||||
|
| |||||||||
| Utilities—0.8% | ||||||||||
Dynegy Finance I, Inc. / Dynegy Finance II, | 40 | 42 | ||||||||
7.625%, 11/1/24(4) | 35 | 37 | ||||||||
Empresas Publicas de | 52,000 | COP | 25 | |||||||
GenOn Americas | 125 | 118 | ||||||||
Illinois Power | 55 | 51 | ||||||||
| PAR VALUE | VALUE | |||||||
| Utilities—continued | ||||||||
RJS Power Holdings | $ 60 | $ 60 | ||||||
|
| |||||||
|
333
|
| ||||||
| ||||||||
| TOTAL CORPORATE BONDS (Identified Cost $15,210) | 14,654 | |||||||
| ||||||||
| LOAN AGREEMENTS—17.1% | ||||||||
| Consumer Discretionary—2.9% | ||||||||
1011778 B.C. | 65 | 65 | ||||||
Adria Topco B.V. | 25 | 31 | ||||||
AMF Bowling Centers, | 50 | 50 | ||||||
AP NMT Acquisition | 60 | 59 | ||||||
AP NMT Acquisition | 5 | 6 | ||||||
Clear Channel | 210 | 199 | ||||||
Dave & Buster’s, Inc. | 41 | 41 | ||||||
Hoffmaster Group, | 45 | 45 | ||||||
Indra Holdings Corp. | 35 | 35 | ||||||
JC Penney Corp., Inc. | 45 | 44 | ||||||
Mohegan Tribal | 50 | 48 | ||||||
Nine West Holdings, | 35 | 33 | ||||||
Red Lobster | 75 | 75 | ||||||
See Notes to Financial Statements.
20
Table of Contents
VIRTUS ALTERNATIVE INCOME SOLUTION FUND
SCHEDULE OF INVESTMENTS AND SECURITIES SOLD SHORT (Continued)
OCTOBER 31, 2014
($ are reported in thousands)
| PAR VALUE | VALUE | |||||||||
Consumer Discretionary—continued |
| |||||||||
Scientific Games International, Inc. Term Loan B-2 | $ | 45 | $ | 44 | ||||||
Spencer Gifts LLC | 60 | 59 | ||||||||
Toys ’R’ US-Delaware, | 50 | 46 | ||||||||
Tribune Publishing Co. | 105 | 104 | ||||||||
Tyrol Acquisition 2 SAS | 81 | 98 | ||||||||
Visant Corp. (fka Jostens) | 50 | 49 | ||||||||
Wilton Brands LLC | 108 | 102 | ||||||||
|
| |||||||||
|
1,233 |
| ||||||||
|
| |||||||||
Consumer Staples—1.2% |
| |||||||||
Albertson’s LLC, Term Loan B-4 | 100 | 100 | ||||||||
Albertson’s LLC, Term | 10 | 10 | ||||||||
New Albertson’s, Inc., | 75 | 75 | ||||||||
North Atlantic Trading Co., Inc. First Lien | 294 | 296 | ||||||||
Vogue International LLC Tranche B, | 20 | 20 | ||||||||
|
| |||||||||
|
501 |
| ||||||||
|
| |||||||||
| Energy—0.8% | ||||||||||
KCA Deutag US Finance LLC (KCA Deutag GMBH) | 35 | 34 | ||||||||
OSG Bulk Ships, Inc. | 105 | 104 | ||||||||
OSG International, Inc. (OIN Delaware LLC) | 105 | 104 | ||||||||
| PAR VALUE | VALUE | |||||||||
Energy—continued |
| |||||||||
Preferred Proppants LLC | $ | 80 | $ | 76 | ||||||
|
| |||||||||
|
318 |
| ||||||||
|
| |||||||||
| Financials—2.8% | ||||||||||
Datapipe, Inc., Second Lien | 737 | 714 | ||||||||
Omnitracs, LLC (Coronado Holdings, LLC) Second Lien | 442 | 439 | ||||||||
Sears Roebuck Acceptance Corp. (KMART Corp.) | 50 | 49 | ||||||||
|
| |||||||||
|
1,202 |
| ||||||||
|
| |||||||||
| Health Care—1.5% | ||||||||||
American Pacific Corp. | 235 | 236 | ||||||||
CCS Intermediate Holdings LLC, First Lien | 105 | 104 | ||||||||
Curo Health Services Holdings, Inc., First Lien | 75 | 74 | ||||||||
Kindred Healthcare, Inc. | 45 | 45 | ||||||||
Onex Carestream Finance LP, Second Lien | 105 | 104 | ||||||||
Surgery Center | 40 | 40 | ||||||||
Surgery Center | 35 | 34 | ||||||||
|
| |||||||||
|
637 |
| ||||||||
|
| |||||||||
| Industrials—0.6% | ||||||||||
Aquilex LLC (Aquilex Intermediate Corp. Holdings LLC), Term Loan B | 75 | 74 | ||||||||
Gemini HDPE LLC | 50 | 50 | ||||||||
| PAR VALUE | VALUE | |||||||
Industrials—continued |
| |||||||
Koosharem, LLC | $ | 70 | $ | 69 | ||||
NN, Inc. | 35 | 35 | ||||||
Photonis Technologies SAS, First Lien | 35 | 34 | ||||||
|
| |||||||
|
262 |
| ||||||
|
| |||||||
| Information Technology—5.8% | ||||||||
Active Network Bank | 440 | 442 | ||||||
Aricent Technologies | 35 | 35 | ||||||
BMC Software Finance, Inc. | 48 | 48 | ||||||
Dell International LLC, Term Loan B | 154 | 155 | ||||||
Greenway Health, LLC | 881 | 878 | ||||||
GTCR Valor Companies, Inc. First Lien | 50 | 49 | ||||||
TelX Group, Inc., (The), Second Lien | 885 | 869 | ||||||
|
| |||||||
|
2,476 |
| ||||||
|
| |||||||
| Materials—0.5% | ||||||||
Albaugh, LLC | 74 | 73 | ||||||
AZ Chem US Inc. First Lien | 96 | 96 | ||||||
Styrolution U.S. Holdings LLC Term Loan B | 50 | 49 | ||||||
|
| |||||||
|
218 |
| ||||||
|
| |||||||
See Notes to Financial Statements.
21
Table of Contents
VIRTUS ALTERNATIVE INCOME SOLUTION FUND
SCHEDULE OF INVESTMENTS AND SECURITIES SOLD SHORT (Continued)
OCTOBER 31, 2014
($ are reported in thousands)
| PAR VALUE | VALUE | |||||||||
| Utilities—1.0% | ||||||||||
Energy Future Intermediate | $ | 150 | $ | 150 | ||||||
Texas Competitive | 355 | 258 | ||||||||
4.650%, 10/10/17(10) | 30 | 22 | ||||||||
|
| |||||||||
|
430
|
| ||||||||
TOTAL LOAN AGREEMENTS |
| 7,277 | ||||||||
CONVERTIBLE BONDS—0.4% |
| |||||||||
Consumer Discretionary—0.1% |
| |||||||||
Liberty Interactive LLC | 81 | 51 | ||||||||
|
| |||||||||
Energy—0.1% |
| |||||||||
Alpha Natural Resources, Inc. | 40 | 26 | ||||||||
|
| |||||||||
Financials—0.2% |
| |||||||||
Bank of New York Mellon Luxembourg SA/The
|
| 100
| EUR
|
| 81
|
| ||||
TOTAL CONVERTIBLE BONDS |
| 158 | ||||||||
SHARES | ||||||||||
WARRANTS—0.1% |
| |||||||||
Financials—0.1% |
| |||||||||
Piraeus Bank SA(12)
|
| 51,299
|
|
| 30
|
| ||||
TOTAL WARRANTS |
| 30 | ||||||||
PREFERRED STOCK—0.9% |
| |||||||||
Financials—0.9% |
| |||||||||
Ally Financial, Inc. | 250 | 251 | ||||||||
Capital One Financial Corp. Series B 6.000% | 2,268 | 55 | ||||||||
JPMorgan Chase & | 1,583 | 36 | ||||||||
| SHARES | VALUE | |||||||||
| Financials—continued | ||||||||||
Regions Financial Corp. Series A | 1,127 | $ | 28 | |||||||
|
| |||||||||
|
370
|
| ||||||||
TOTAL PREFERRED STOCK |
| 370 | ||||||||
COMMON STOCKS—11.6% |
| |||||||||
Consumer Discretionary—1.3% |
| |||||||||
Cia Hering | 1,800 | 18 | ||||||||
Direcional Engenharia SA | 7,300 | 30 | ||||||||
Eutelsat Communications SA | 2,741 | 89 | ||||||||
Grendene SA | 5,300 | 37 | ||||||||
MGM China Holdings Ltd. | 13,200 | 42 | ||||||||
NagaCorp., Ltd. | 34,000 | 29 | ||||||||
RTL Group SA | 640 | 60 | ||||||||
Sands China Ltd. | 17,600 | 110 | ||||||||
Tofas Turk Otomobil Fabrikasi AS | 5,462 | 34 | ||||||||
Wynn Macau Ltd. | 29,200 | 105 | ||||||||
|
| |||||||||
|
554 |
| ||||||||
|
| |||||||||
Consumer Staples—0.1% |
| |||||||||
Natura Cosmeticos SA | 3,300 | 48 | ||||||||
|
| |||||||||
Energy—3.3% |
| |||||||||
China Shenhua Energy Co. Ltd. | 13,000 | 37 | ||||||||
ConocoPhillips | 826 | 60 | ||||||||
Diamond Offshore Drilling, Inc. | 1,048 | 39 | ||||||||
Eni SpA | 2,974 | 63 | ||||||||
Exterran Holdings, Inc. | 1,659 | 65 | ||||||||
Gaslog Ltd. | 2,087 | 43 | ||||||||
Gaztransport Et Technigaz SA | 1,156 | 65 | ||||||||
HollyFrontier Corp. | 712 | 32 | ||||||||
Kinder Morgan Management LLC(12) | 2,552 | 243 | ||||||||
Kinder Morgan, Inc. | 1,440 | 56 | ||||||||
Phillips 66 | 271 | 21 | ||||||||
Royal Dutch Shell PLC | 2,399 | 86 | ||||||||
SemGroup Corp. Class A | 22 | 2 | ||||||||
Targa Resources Corp. | 645 | 83 | ||||||||
Total SA | 2,211 | 131 | ||||||||
Transocean Ltd. | 1,411 | 42 | ||||||||
Tupras Turkiye Petrol Rafinerileri AS | 1,367 | 30 | ||||||||
| SHARES | VALUE | |||||||
| Energy—continued | ||||||||
Williams Cos, Inc. | 5,433 | $ | 302 | |||||
|
| |||||||
|
1,400 |
| ||||||
|
| |||||||
Financials—2.8% |
| |||||||
Agricultural Bank of China Ltd. | 181,000 | 84 | ||||||
Alaris Royalty Corp. | 1,924 | 58 | ||||||
Allianz SE | 330 | 52 | ||||||
Alpha Bank AE(12) | 47,450 | 31 | ||||||
Artisan Partners Asset Management, Inc. Class A | 928 | 45 | ||||||
AXA SA | 5,291 | 122 | ||||||
Banco do Brasil SA | 7,600 | 85 | ||||||
Cembra Money Bank AG | 814 | 46 | ||||||
China Construction Bank Corp. | 92,000 | 69 | ||||||
Foxtons Group PLC | 10,373 | 28 | ||||||
Industrial & Commercial Bank of China Ltd. | 37,000 | 24 | ||||||
Krung Thai Bank PCL | 24,900 | 18 | ||||||
National Bank of Greece SA(12) | 35,317 | 85 | ||||||
People’s United Financial, Inc. | 4,526 | 66 | ||||||
Sampo, Class A | 907 | 43 | ||||||
Sberbank of Russia ADR | 2,426 | 18 | ||||||
St James’s Place PLC | 5,940 | 71 | ||||||
Swedbank AB, Class A | 3,596 | 95 | ||||||
Swiss Re AG | 939 | 76 | ||||||
UNIQA Insurance Group AG | 4,304 | 48 | ||||||
United Bankshares, Inc. | 1,508 | 52 | ||||||
|
| |||||||
|
1,216 |
| ||||||
|
| |||||||
Health Care—0.1% |
| |||||||
Teva Pharmaceutical Industries Ltd. ADR | 929 | 53 | ||||||
|
| |||||||
Industrials—0.8% |
| |||||||
bpost SA | 2,907 | 72 | ||||||
Dynasty Ceramic PCL | 17,600 | 32 | ||||||
Globaltrans Investment PLC GDR | 3,759 | 28 | ||||||
Macquarie Infrastructure Co. LLC | 1,064 | 76 | ||||||
Rexel SA | 2,843 | 48 | ||||||
TAL International Group, Inc. | 957 | 41 | ||||||
See Notes to Financial Statements.
22
Table of Contents
VIRTUS ALTERNATIVE INCOME SOLUTION FUND
SCHEDULE OF INVESTMENTS AND SECURITIES SOLD SHORT (Continued)
OCTOBER 31, 2014
($ are reported in thousands)
| SHARES | VALUE | |||||||||
| Industrials—continued | ||||||||||
Transurban Group | 6,641 | $ | 48 | |||||||
|
| |||||||||
|
345 |
| ||||||||
|
| |||||||||
Information Technology—1.3% |
| |||||||||
Canon, Inc. | 2,200 | 66 | ||||||||
Cisco Systems, Inc. | 5,843 | 143 | ||||||||
Intel Corp. | 2,060 | 70 | ||||||||
Maxim Integrated Products, Inc. | 2,435 | 71 | ||||||||
Microsoft Corp. | 1,161 | 55 | ||||||||
Radiant | 17,000 | 59 | ||||||||
Siliconware Precision Industries Co. ADR | 10,068 | 72 | ||||||||
|
| |||||||||
|
536 |
| ||||||||
|
| |||||||||
| Materials—0.4% | ||||||||||
International Paper Co. | 1,194 | 60 | ||||||||
Koppers Holdings, Inc. | 697 | 28 | ||||||||
Tronox Ltd. | 2,002 | 48 | ||||||||
Vale SA | 3,100 | 27 | ||||||||
|
| |||||||||
|
163 |
| ||||||||
|
| |||||||||
| Telecommunication Services—1.0% | ||||||||||
Bezeq The Israeli Telecommunication Corp. Ltd. | 44,314 | 75 | ||||||||
CenturyLink, Inc. | 2,159 | 89 | ||||||||
MegaFon OAO GDR | 1,211 | 28 | ||||||||
Mobile Telesystems OJSC ADR | 4,874 | 70 | ||||||||
Vodacom Group Ltd. | 6,233 | 76 | ||||||||
Vodafone Group PLC | 26,366 | 87 | ||||||||
|
| |||||||||
|
425 |
| ||||||||
|
| |||||||||
| Utilities—0.5% | ||||||||||
DUET Group | 23,716 | 51 | ||||||||
Infinis Energy PLC | 20,903 | 72 | ||||||||
Pattern Energy Group, Inc. | 2,668 | 77 | ||||||||
|
| |||||||||
|
200
|
| ||||||||
| ||||||||||
TOTAL COMMON STOCKS |
| 4,940 | ||||||||
| ||||||||||
MASTER LIMITED PARTNERSHIPS—12.1% |
| |||||||||
Chemicals-Specialty—0.2% |
| |||||||||
Westlake Chemical Partners LP | 2,434 | 74 | ||||||||
|
| |||||||||
Energy—0.1% | ||||||||||
Tallgrass Energy Partners LP | 170 | 7 | ||||||||
| SHARES | VALUE | |||||||||
| Energy—continued | ||||||||||
VTTI Energy Partners LP | 1,263 | $ | 31 | |||||||
|
| |||||||||
|
38 |
| ||||||||
|
| |||||||||
| Gas-Distribution—0.5% | ||||||||||
AmeriGas Partners LP | 194 | 9 | ||||||||
Enable Midstream Partners LP | 7,105 | 172 | ||||||||
NGL Energy Partners LP | 1,684 | 58 | ||||||||
|
| |||||||||
|
239 |
| ||||||||
|
| |||||||||
| Gas-Transportation—0.0% | ||||||||||
PBF Logistics LP | 938 | 23 | ||||||||
|
| |||||||||
Oil Components-Exploration and Production—0.4% |
| |||||||||
Memorial Production Partners LP | 412 | 8 | ||||||||
Summit Midstream Partners LP | 3,249 | 153 | ||||||||
|
| |||||||||
|
161 |
| ||||||||
|
| |||||||||
| Oil-Field Services—0.6% | ||||||||||
CrossAmerica Partners LP | 2,116 | 72 | ||||||||
Exterran Partners LP | 6,109 | 170 | ||||||||
Sprague Resources LP | 378 | 8 | ||||||||
|
| |||||||||
|
250 |
| ||||||||
|
| |||||||||
| Oil-Refining and Marketing—0.2% | ||||||||||
Northern Tier Energy LP | 3,178 | 80 | ||||||||
|
| |||||||||
| Pipelines—9.9% | ||||||||||
Access Midstream Partners LP | 2,818 | 176 | ||||||||
Buckeye Partners LP | 3,678 | 277 | ||||||||
Cone Midstream Partners LP(12) | 951 | 29 | ||||||||
Dominion Midstream Partners LP(12) | 432 | 13 | ||||||||
Energy Transfer Equity LP | 10,333 | 603 | ||||||||
Energy Transfer Partners LP | 8,387 | 540 | ||||||||
Enterprise Products Partners LP(13) | 20,976 | 774 | ||||||||
EQT Midstream | 1,588 | 141 | ||||||||
JP Energy Partners | 237 | 4 | ||||||||
Kinder Morgan Energy Partners LP | 705 | 66 | ||||||||
Magellan Midstream Partners LP | 2,933 | 240 | ||||||||
| SHARES | VALUE | |||||||
| Pipelines—continued | ||||||||
MarkWest Energy Partners LP | 2,744 | $ | 192 | |||||
MPLX LP | 2,190 | 146 | ||||||
Plains All American Pipeline LP | 4,536 | 256 | ||||||
Plains GP Holdings LP Class A | 3,694 | 106 | ||||||
QEP Midstream Partners LP | 3,655 | 59 | ||||||
Rose Rock Midstream LP | 2,047 | 112 | ||||||
Shell Midstream Partners LP(12) | 4,713 | 159 | ||||||
Sunoco Logistics Partners LP | 858 | 41 | ||||||
Tesoro Logistics LP | 2,659 | 150 | ||||||
Williams Partners LP | 2,411 | 124 | ||||||
|
| |||||||
|
4,208 |
| ||||||
|
| |||||||
| Transportation-Marine—0.2% | ||||||||
Teekay LNG Partners Ltd. | 2,066 | 81 | ||||||
USD Partners LP(12) | 114 | 2 | ||||||
|
| |||||||
|
83
|
| ||||||
| ||||||||
TOTAL MASTER LIMITED PARTNERSHIPS |
| |||||||
| (Identified Cost $4,786) | 5,156 | |||||||
| ||||||||
REAL ESTATE INVESTMENT TRUSTS—11.4% |
| |||||||
| Apartments—2.0% | ||||||||
AvalonBay Communities, Inc. | 2,219 | 346 | ||||||
Camden Property Trust | 2,092 | 160 | ||||||
Equity Residential | 4,891 | 340 | ||||||
|
| |||||||
|
846 |
| ||||||
|
| |||||||
| Diversified—0.7% | ||||||||
Fibra Uno Administration SA de CV | 16,200 | 56 | ||||||
Lexington Realty Trust | 2,088 | 23 | ||||||
Vornado Realty Trust | 1,881 | 206 | ||||||
|
| |||||||
|
285 |
| ||||||
|
| |||||||
| Health Care—1.2% | ||||||||
Aviv REIT, Inc. | 928 | 31 | ||||||
HCP, Inc. | 4,495 | 198 | ||||||
Medical Properties Trust, Inc. | 3,549 | 48 | ||||||
Senior Housing Properties Trust | 1,219 | 27 | ||||||
Ventas, Inc. | 2,946 | 202 | ||||||
|
| |||||||
|
506 |
| ||||||
|
| |||||||
See Notes to Financial Statements.
23
Table of Contents
VIRTUS ALTERNATIVE INCOME SOLUTION FUND
SCHEDULE OF INVESTMENTS AND SECURITIES SOLD SHORT (Continued)
OCTOBER 31, 2014
($ are reported in thousands)
| SHARES | VALUE | |||||||||
| Industrial—0.3% | ||||||||||
Prologis, Inc. | 2,621 | $ | 109 | |||||||
Terreno Realty Corp. | 969 | 21 | ||||||||
|
| |||||||||
| 130 | ||||||||||
|
| |||||||||
| Infrastructure—1.0% | ||||||||||
American Tower Corp. | 4,213 | 411 | ||||||||
|
| |||||||||
| Lodging/Resort—0.7% | ||||||||||
DiamondRock | 3,995 | 57 | ||||||||
LaSalle Hotel | 3,405 | 134 | ||||||||
RLJ Lodging Trust | 3,285 | 106 | ||||||||
Sunstone Hotel | 868 | 13 | ||||||||
|
| |||||||||
| 310 | ||||||||||
|
| |||||||||
| Mixed—0.1% | ||||||||||
Duke Realty Corp. | 3,656 | 69 | ||||||||
|
| |||||||||
| Mortgage—0.3% | ||||||||||
Blackstone Mortgage | 4,640 | 130 | ||||||||
|
| |||||||||
| Office—1.1% | ||||||||||
Alexandria Real Estate | 771 | 64 | ||||||||
BioMed Realty | 2,138 | 46 | ||||||||
Boston Properties, Inc. | 2,762 | 350 | ||||||||
|
| |||||||||
| 460 | ||||||||||
|
| |||||||||
| Regional Malls—2.1% | ||||||||||
CBL & Associates | 6,900 | 132 | ||||||||
General Growth | 3,096 | 80 | ||||||||
Simon Property | 3,196 | 573 | ||||||||
Taubman Centers, Inc. | 1,393 | 106 | ||||||||
|
| |||||||||
| 891 | ||||||||||
|
| |||||||||
| Self Storage—0.7% | ||||||||||
CubeSmart | 2,730 | 58 | ||||||||
Public Storage | 1,266 | 233 | ||||||||
|
| |||||||||
|
291 |
| ||||||||
|
| |||||||||
| Shopping Centers—0.7% | ||||||||||
Acadia Realty Trust | 1,258 | 39 | ||||||||
DDR Corp. | 3,658 | 67 | ||||||||
Federal Realty | 1,360 | 179 | ||||||||
| SHARES | VALUE | |||||||||
| Shopping Centers—continued | ||||||||||
Ramco-Gershenson | 1,096 | $ | 19 | |||||||
|
| |||||||||
| 304 | ||||||||||
|
| |||||||||
Timber—0.5% |
| |||||||||
Rayonier, Inc. | 1,188 | 40 | ||||||||
Weyerhaeuser Co. | 5,159 | 174 | ||||||||
|
| |||||||||
| 214 | ||||||||||
| ||||||||||
TOTAL REAL ESTATE INVESTMENT TRUSTS |
| |||||||||
| (Identified Cost $4,356) | 4,847 | |||||||||
| ||||||||||
PURCHASED OPTIONS—0.0% |
| |||||||||
Put Options—0.0% |
| |||||||||
Markit CDX North America High Yield Index | 150 | 2 | ||||||||
|
| |||||||||
| ||||||||||
| TOTAL PURCHASED OPTIONS | ||||||||||
| (Identified Cost $10) | 2 | |||||||||
| ||||||||||
| TOTAL LONG TERM INVESTMENTS — 92.8% | ||||||||||
| (Identified Cost $39,609) | 39,513 | |||||||||
| ||||||||||
SHARES | ||||||||||
| SHORT-TERM INVESTMENTS—7.4% | ||||||||||
Money Market Mutual Funds—7.4% |
| |||||||||
BlackRock Liquidity | 3,146,486 | 3,146 | ||||||||
|
| |||||||||
| ||||||||||
| TOTAL SHORT-TERM INVESTMENTS | ||||||||||
| (Identified Cost $3,146) | 3,146 | |||||||||
| ||||||||||
TOTAL INVESTMENTS, BEFORE SECURITIES SOLD SHORT — 100.2% |
| |||||||||
| (Identified Cost $42,755) | 42,659 | (1) | ||||||||
| ||||||||||
SECURITIES SOLD SHORT—(4.9)% |
| |||||||||
Exchange Traded Funds—(4.9)% |
| |||||||||
Energy Select Sector | (813 | ) | (71 | ) | ||||||
iShares 7-10 Year | (6,101 | ) | (641 | ) | ||||||
JPMorgan Alerian | (19,953 | ) | (1,011 | ) | ||||||
SPDR S&P 500 ETF Trust | (1,479 | ) | (298 | ) | ||||||
| SHARES | VALUE | |||||||
| Exchange Traded Funds—continued | ||||||||
SPDR S&P Oil & Gas | (1,138 | ) | $ | (69 | ) | |||
|
| |||||||
| (2,090 | ) | |||||||
| ||||||||
| TOTAL SECURITIES SOLD SHORT | ||||||||
| (Proceeds $2,003) | (2,090 | ) (1) | ||||||
| ||||||||
TOTAL INVESTMENTS NET OF SECURITIES SOLD SHORT — 95.3% |
| |||||||
| (Identified Cost $40,752) | 40,569 | |||||||
Other assets and liabilities, |
| 2,011 | ||||||
|
| |||||||
| NET ASSETS — 100.0% | $ | 42,580 | ||||||
|
| |||||||
Footnote Legend:
| (1) | Federal Income Tax Information: For tax information at October 31, 2014, see Note 10 Federal Income Tax Information in the Notes to Financial Statements. |
| (2) | Variable or step coupon security; interest rate shown reflects the rate in effect at October 31, 2014. |
| (3) | Regulation S security. Security is offered and sold outside of the United States, therefore, it is exempt from registration with the SEC under rules 903 and 904 of the Securities Act of 1933. |
| (4) | Security exempt from registration under Rule 144A of the Securities Act of 1933. These securities may be resold in transactions exempt from registration, normally to qualified institutional buyers. At October 31, 2014, these securities amounted to a value of $8,867 or 20.8% of net assets. |
| (5) | 99% of the income received was in cash and 1% in PIK. |
| (6) | Illiquid security. |
| (7) | This note was issued for the sole purpose of funding a loan agreement between the issuer and the borrower. As the credit risk for this security lies solely with the borrower, the name represented here is that of the borrower. |
| (8) | 100% of the income received was in cash. |
| (9) | Security valued at fair value as determined in good faith by or under the direction of the Trustees. This security is disclosed as a level 3 security in the disclosure table located after the Schedule of Investments and Securities Sold Short. |
| (10) | Security in default. |
| (11) | This loan will settle after October 31, 2014, at which time the interest rate, based on the London Interbank Offered Rate (“LIBOR”) and the agreed upon spread on trade date, will be known. |
| (12) | Non-income producing. |
| (13) | All or a portion segregated as collateral for securities sold short. |
See Notes to Financial Statements.
24
Table of Contents
VIRTUS ALTERNATIVE INCOME SOLUTION FUND
SCHEDULE OF INVESTMENTS AND SECURITIES SOLD SHORT (Continued)
OCTOBER 31, 2014
($ are reported in thousands)
| Abbreviations: | ||||
| ADR | American Depositary Receipt | |||
| CLO | Collateralized Loan Obligation | |||
| ETF | Exchange Traded Fund | |||
| ETN | Exchange Traded Note | |||
| GDR | Global Depositary Receipt | |||
| LLC | Limited Liability Company | |||
| LP | Limited Partnership | |||
| MLP | Master Limited Partnership | |||
| PCL | Public Company Limited | |||
| PIK | Payment in Kind | |||
| PLC | Public Limited Company | |||
| REIT | Real Estate Investment Trusts | |||
| S&P | Standard & Poor’s | |||
| SPDR | Standard & Poor’s Depositary Receipt | |||
| Foreign Currencies: | ||||
| BRL | Brazilian Real | |||
| COP | Colombian Peso | |||
| EUR | European Currency Unit | |||
| IDR | Indonesian Rupiah | |||
| MXN | Mexican Peso | |||
| PEN | Peruvian Nuevo Sol | |||
| USD | United States Dollar | |||
Country Weightings (Unaudited)† |
| |||
United States | 69 | % | ||
United Kingdom | 5 | |||
Canada | 4 | |||
Cayman Islands | 3 | |||
Marshall Islands | 2 | |||
Other | 17 | |||
Total | 100 | % | ||
| †% of total investments, net of securities sold short, as of October 31, 2014 | ||||
Futures contracts as of October 31, 2014 were as follows:
| Issue | Expiration | Contracts Purchased/(Sold) | Notional Value | Unrealized Appreciation (Depreciation) | ||||||||||
U.S. 10 Year Treasury Note | December 2014 | (1) | $ (126) | $ (2) | ||||||||||
U.S. 5 Year Treasury Note (CBT) | December 2014 | (22) | (2,627) | (24) | ||||||||||
Total | $ (26) | |||||||||||||
Forward foreign currency exchange contracts as of October 31, 2014 were as follows:
Currency Purchased | Value | Currency Sold | Value | Counterparty | Settlement Date | Unrealized Appreciation | ||||||||
EUR | 93 | USD | 125 | JPMorgan Chase Bank N.A. | 11/03/14 | $ (8) | ||||||||
USD | 128 | EUR | 93 | JPMorgan Chase Bank N.A. | 11/03/14 | 12 | ||||||||
USD | 157 | EUR | 120 | JPMorgan Chase Bank N.A. | 12/04/14 | 7 | ||||||||
USD | 24 | EUR | 19 | JPMorgan Chase Bank N.A. | 12/04/14 | — (a) | ||||||||
USD | 19 | EUR | 15 | JPMorgan Chase Bank N.A. | 12/04/14 | — (a) | ||||||||
USD | 14 | EUR | 11 | JPMorgan Chase Bank N.A. | 12/04/14 | — (a) | ||||||||
USD | 12 | EUR | 9 | JPMorgan Chase Bank N.A. | 12/04/14 | — (a) | ||||||||
USD | 10 | EUR | 8 | JPMorgan Chase Bank N.A. | 12/04/14 | — (a) | ||||||||
USD | 5 | EUR | 4 | JPMorgan Chase Bank N.A. | 12/04/14 | — (a) | ||||||||
USD | 44 | EUR | 35 | BNY Mellon Capital Markets LLC | 12/15/14 | — (a) | ||||||||
USD | 92 | EUR | 71 | JPMorgan Chase Bank N.A. | 12/16/14 | 3 | ||||||||
USD | 130 | EUR | 102 | JPMorgan Chase Bank N.A. | 1/02/15 | 3 | ||||||||
USD | 73 | EUR | 58 | JPMorgan Chase Bank N.A. | 1/02/15 | 1 | ||||||||
USD | 68 | EUR | 54 | JPMorgan Chase Bank N.A. | 1/02/15 | — (a) | ||||||||
USD | 65 | EUR | 51 | JPMorgan Chase Bank N.A. | 1/02/15 | 1 | ||||||||
USD | 106 | EUR | 83 | JPMorgan Chase Bank N.A. | 1/23/15 | 2 | ||||||||
USD | 44 | EUR | 35 | JPMorgan Chase Bank N.A. | 1/23/15 | 1 | ||||||||
USD | 37 | EUR | 29 | JPMorgan Chase Bank N.A. | 1/23/15 | 1 | ||||||||
Total | $ 23 |
Footnote Legend:
| (a) | Amount is less than $500. |
See Notes to Financial Statements.
25
Table of Contents
VIRTUS ALTERNATIVE INCOME SOLUTION FUND
SCHEDULE OF INVESTMENTS AND SECURITIES SOLD SHORT (Concluded)
OCTOBER 31, 2014
($ are reported in thousands)
The following table provides a summary of inputs used to value the Fund’s investments as of October 31, 2014 (See Security Valuation Note 2B in the Notes to Financial Statements):
| Total Value at October 31, 2014 | Level 1 Quoted Prices | Level 2 Significant Observable Inputs | Level 3 Significant Unobservable Inputs | |||||||||||||
Assets: | ||||||||||||||||
Debt Securities: | ||||||||||||||||
Foreign Government Securities | $ 1,205 | $ — | $ 968 | $237 | ||||||||||||
Municipal Bonds | 530 | — | 530 | — | ||||||||||||
Asset-Backed Securities | 344 | — | 344 | — | ||||||||||||
Corporate Bonds | 14,654 | — | 14,505 | 149 | ||||||||||||
Loan Agreements | 7,277 | — | 7,277 | — | ||||||||||||
Convertible Bonds | 158 | — | 158 | — | ||||||||||||
Equity Securities: | ||||||||||||||||
Warrants | 30 | 30 | — | — | ||||||||||||
Preferred Stock | 370 | 119 | 251 | — | ||||||||||||
Common Stocks | 4,940 | 4,940 | — | — | ||||||||||||
Master Limited Partnerships | 5,156 | 5,156 | — | — | ||||||||||||
Real Estate Investment Trusts | 4,847 | 4,847 | — | — | ||||||||||||
Short-Term Investments | 3,146 | 3,146 | — | — | ||||||||||||
Purchased Options | 2 | 2 | — | — | ||||||||||||
Forward foreign Currency Exchange Contracts | 31 | — | 31 | — | ||||||||||||
|
|
|
|
|
|
|
| |||||||||
Total Assets | 42,690 | 18,240 | 24,064 | 386 | ||||||||||||
|
|
|
|
|
|
|
| |||||||||
Liabilities: | ||||||||||||||||
Securities Sold Short | (2,090) | (2,090) | — | — | ||||||||||||
Futures Contracts | (26) | (26) | — | — | ||||||||||||
Forward foreign Currency Exchange Contracts | (8) | — | (8) | — | ||||||||||||
|
|
|
|
|
|
|
| |||||||||
Total Liabilities | $(2,124) | $(2,116) | $ (8) | $ — | ||||||||||||
|
|
|
|
|
|
|
| |||||||||
There were no transfers between levels for the period.
The following is a reconciliation of assets of the Fund for Level 3 investments which significant unobservable inputs were used to determine fair value:
| Total | Foreign Government Securities | Corporate Bonds | ||||||||||
Investments in Securities | ||||||||||||
Balance as of April 23, 2014(a) | $ — | $ — | $ — | |||||||||
Accrued discount/(premium) | — | — | — | |||||||||
Realized gain (loss) | — | — | — | |||||||||
Change in unrealized appreciation (depreciation)(b) | (13) | (13) | — (c) | |||||||||
Purchases | 400 | 250 | 150 | |||||||||
Sales | — | — | — | |||||||||
Transfers into Level 3(d) | — | — | — | |||||||||
Transfers from Level 3(d) | — | — | — | |||||||||
Paydowns | (1) | — | (1) | |||||||||
|
|
|
|
|
| |||||||
Balance as of October 31, 2014 | $ 386 | $ 237 (e) | $ 149 (e) | |||||||||
|
|
|
|
|
| |||||||
Footnote Legend:
| (a) | Inception date. |
| (b) | Included in the related net change in unrealized appreciation (depreciation) in the Statement of Operations. The change in unrealized appreciation (depreciation) on investments still held as of October 31, 2014 was $(13). |
| (c) | Amount is less than $500. |
| (d) | “Transfers into and/or from” represent the ending value as of October 31, 2014, for any investment security where a change in the pricing level occurred from the beginning to the end of the period. |
| (e) | The Fund’s investments that are categorized as Level 3 were valued utilizing third party pricing information without adjustment. Such valuations are based on unobservable inputs. A significant change in third party information inputs could result in a significantly lower or higher value of such Level 3 investments. |
See Notes to Financial Statements.
26
Table of Contents
VIRTUS ALTERNATIVE INFLATION SOLUTION FUND
SCHEDULE OF INVESTMENTS AND SECURITIES SOLD SHORT
OCTOBER 31, 2014
($ reported in thousands)
| PAR VALUE | VALUE | |||||||||
U.S. GOVERNMENT SECURITIES—19.9% |
| |||||||||
Agency—3.9% |
| |||||||||
FFCB | $ | 600 | $ 601 | |||||||
FHLB | 600 | 601 | ||||||||
FHLMC | 100 | 100 | ||||||||
|
| |||||||||
| 1,302 | ||||||||||
|
| |||||||||
Non-Agency—16.0% |
| |||||||||
United States Treasury Inflation Indexed Bonds | 4,078 | 4,140 | ||||||||
1.375%, 2/15/44 | 1,021 | 1,124 | ||||||||
|
| |||||||||
| 5,264 | ||||||||||
| ||||||||||
TOTAL U.S. GOVERNMENT SECURITIES |
| |||||||||
(Identified Cost $6,509) |
| 6,566 | ||||||||
| ||||||||||
MUNICIPAL BONDS—1.2% |
| |||||||||
New Jersey—0.3% |
| |||||||||
Tobacco Settlement Financing Corp. Series 1-A | 70 | 52 | ||||||||
5.000%, 6/1/41 | 40 | 30 | ||||||||
|
| |||||||||
| 82 | ||||||||||
|
| |||||||||
Puerto Rico—0.6% |
| |||||||||
Commonwealth of Puerto Rico, Series A | 210 | 183 | ||||||||
5.000%, 7/1/41 | 5 | 4 | ||||||||
Puerto Rico Sales Tax Financing Corp. Series A | 210 | 15 | ||||||||
|
| |||||||||
| 202 | ||||||||||
|
| |||||||||
Texas—0.3% |
| |||||||||
Texas Public Finance Authority | 100 | 100 | ||||||||
| ||||||||||
TOTAL MUNICIPAL BONDS |
| |||||||||
(Identified Cost $392) |
| 384 | ||||||||
| ||||||||||
ASSET-BACKED SECURITIES—1.0% |
| |||||||||
Cutwater Ltd. CLO | 100 | 91 | ||||||||
Gallatin CLO VII Ltd. | 25 | 24 | ||||||||
| PAR VALUE | VALUE | |||||||||
Gallatin CLO VII Ltd. | $ | 25 | $ 23 | |||||||
Madison Park Funding XIV Ltd. CLO
|
| 200
|
|
| 182
|
| ||||
| ||||||||||
TOTAL ASSET-BACKED SECURITIES |
| |||||||||
(Identified Cost $334) |
| 320 | ||||||||
| ||||||||||
CORPORATE BONDS—12.4% |
| |||||||||
Consumer Discretionary—2.4% |
| |||||||||
American Achievement Corp. 144A | 35 | 34 | ||||||||
APX Group, Inc. | 15 | 15 | ||||||||
8.750%, 12/1/20 | 95 | 83 | ||||||||
Bon-Ton Department Stores, Inc. (The) | 35 | 31 | ||||||||
Caesars Entertainment Operating Co., Inc. | 120 | 91 | ||||||||
9.000%, 2/15/20 | 40 | 30 | ||||||||
Clear Channel Communications, Inc. PIK Interest Capitalization | 20 | 18 | ||||||||
Guitar Center, Inc. 144A | 55 | 40 | ||||||||
JC Penney Corp., Inc. | 115 | 95 | ||||||||
Liberty Interactive LLC | 55 | 60 | ||||||||
Mohegan Tribal Gaming Authority | 60 | 62 | ||||||||
PF Chang’s China Bistro, Inc. 144A | 15 | 15 | ||||||||
Shingle Springs Tribal Gaming Authority 144A | 60 | 67 | ||||||||
Toys R Us, Inc. | 100 | 79 | ||||||||
7.375%, 10/15/18 | 60 | 37 | ||||||||
William Lyon Homes, Inc. 144A | 20 | 21 | ||||||||
|
| |||||||||
| 778 | ||||||||||
|
| |||||||||
| PAR VALUE | VALUE | |||||||
Consumer Staples—0.5% |
| |||||||
Albertsons Holdings LLC/Saturn Acquisition Merger Sub, Inc. 144A | $ | 45 | $ 45 | |||||
New Albertson’s, Inc. | 100 | 95 | ||||||
7.450%, 8/1/29 | 5 | 5 | ||||||
8.700%, 5/1/30 | 5 | 5 | ||||||
SUPERVALU, Inc. | 30 | 29 | ||||||
|
| |||||||
| 179 | ||||||||
|
| |||||||
Energy—1.9% |
| |||||||
Alpha Natural Resources, Inc. | 15 | 8 | ||||||
American Energy - Woodford LLC/AEW Finance Corp. 144A | 20 | 18 | ||||||
American Energy-Permian Basin LLC / AEPB Finance Corp. 144A | 50 | 44 | ||||||
7.375%, 11/1/21(3) | 20 | 18 | ||||||
Energy Transfer Equity LP | 60 | 63 | ||||||
EXCO Resources, Inc. | 30 | 26 | ||||||
Linn Energy LLC / Linn Energy Finance Corp. | 10 | 9 | ||||||
6.500%, 9/15/21 | 15 | 14 | ||||||
Rockies Express Pipeline LLC 144A | 95 | 101 | ||||||
Sabine Pass Liquefaction LLC | 190 | 198 | ||||||
SandRidge Energy, Inc. | 120 | 108 | ||||||
Walter Energy, Inc. 144A | 35 | 30 | ||||||
|
| |||||||
| 637 | ||||||||
|
| |||||||
Financials—4.2% |
| |||||||
Armor Re Ltd. 144A | 200 | 204 | ||||||
See Notes to Financial Statements.
27
Table of Contents
VIRTUS ALTERNATIVE INFLATION SOLUTION FUND
SCHEDULE OF INVESTMENTS AND SECURITIES SOLD SHORT (Continued)
OCTOBER 31, 2014
($ reported in thousands)
| PAR VALUE | VALUE | |||||||||
Financials—continued |
| |||||||||
Earls Thirteen Ltd. | $ | 149 | $ 148 | |||||||
Golden State RE II, | 250 | 251 | ||||||||
Royal Bank of Canada | 450 | 452 | ||||||||
Societe Generale SA | 530 | 312 | ||||||||
|
| |||||||||
| 1,367 | ||||||||||
|
| |||||||||
Health Care—0.4% |
| |||||||||
Aurora Diagnostics | 45 | 38 | ||||||||
Kindred Healthcare, | 65 | 65 | ||||||||
Mallinckrodt | 25 | 26 | ||||||||
|
| |||||||||
| 129 | ||||||||||
|
| |||||||||
Industrials—0.9% |
| |||||||||
Harland Clarke | 70 | 71 | ||||||||
Monitronics | 60 | 62 | ||||||||
ServiceMaster Co., | 50 | 51 | ||||||||
Signode Industrial | 65 | 63 | ||||||||
TransDigm, Inc. | 15 | 15 | ||||||||
6.500%, 7/15/24 | 20 | 21 | ||||||||
|
| |||||||||
| 283 | ||||||||||
|
| |||||||||
| PAR VALUE | VALUE | |||||||||
Information Technology—0.3% |
| |||||||||
BMC Software | $ | 70 | $ 67 | |||||||
Boxer Parent Co., Inc. | 20 | 18 | ||||||||
Zebra Technologies | 20 | 21 | ||||||||
|
| |||||||||
| 106 | ||||||||||
|
| |||||||||
Materials—0.7% |
| |||||||||
AK Steel Corp. | 25 | 25 | ||||||||
Cornerstone Chemical | 35 | 35 | ||||||||
IAMGOLD Corp. 144A | 65 | 54 | ||||||||
Momentive Performance Materials Escrow | 50 | 1 | ||||||||
Momentive | 50 | 44 | ||||||||
Rain CII Carbon LLC / CII Carbon Corp. 144A | 65 | 66 | ||||||||
|
| |||||||||
| 225 | ||||||||||
|
| |||||||||
Telecommunication Services—0.6% |
| |||||||||
Sprint Capital Corp. | 80 | 78 | ||||||||
8.750%, 3/15/32 | 55 | 62 | ||||||||
Sprint Corp. 144A | 45 | 46 | ||||||||
T-Mobile USA, Inc. | 15 | 16 | ||||||||
|
| |||||||||
| 202 | ||||||||||
|
| |||||||||
Utilities—0.5% |
| |||||||||
Dynegy Finance I, Inc. | 25 | 26 | ||||||||
7.625%, 11/1/24(3) | 25 | 27 | ||||||||
GenOn Americas | 100 | 94 | ||||||||
| PAR VALUE | VALUE | |||||||
Utilities—continued |
| |||||||
Illinois Power | $ | 35 | $ 32 | |||||
|
| |||||||
|
179
|
| ||||||
| ||||||||
TOTAL CORPORATE BONDS (Identified Cost $4,403) |
| 4,085 | ||||||
| ||||||||
CONVERTIBLE BONDS—0.2% |
| |||||||
| Consumer Discretionary—0.1% | ||||||||
Liberty Interactive LLC | 57 | 36 | ||||||
|
| |||||||
| Energy—0.1% | ||||||||
Alpha Natural | 25 | 16 | ||||||
| ||||||||
TOTAL CONVERTIBLE BONDS (Identified Cost $59) |
| 52 | ||||||
| ||||||||
LOAN AGREEMENTS—6.7% |
| |||||||
Consumer Discretionary—2.5% |
| |||||||
1011778 B.C. | 40 | 40 | ||||||
Adria Topco B.V. | 20 | 25 | ||||||
AMF Bowling Centers, | 30 | 30 | ||||||
AP NMT Acquisition | 40 | 39 | ||||||
AP NMT Acquisition | 5 | 6 | ||||||
Clear Channel | 140 | 132 | ||||||
Dave & Buster’s, Inc. | 28 | 28 | ||||||
Hoffmaster Group, | 30 | 30 | ||||||
Indra Holdings Corp. | 20 | 20 | ||||||
See Notes to Financial Statements.
28
Table of Contents
VIRTUS ALTERNATIVE INFLATION SOLUTION FUND
SCHEDULE OF INVESTMENTS AND SECURITIES SOLD SHORT (Continued)
OCTOBER 31, 2014
($ reported in thousands)
| PAR VALUE | VALUE | |||||||||
Consumer Discretionary—continued |
| |||||||||
JC Penney Corp., Inc. | $ 25 | $ 24 | ||||||||
Mohegan Tribal Gaming Authority, Term Loan B | 30 | 29 | ||||||||
Nine West Holdings, Inc. | 25 | 23 | ||||||||
Red Lobster Management LLC, First Lien | 50 | 50 | ||||||||
Scientific Games International, Inc. Term Loan B-2 | 35 | 34 | ||||||||
Spencer Gifts LLC (Spirit Halloween Superstores LLC) | 40 | 40 | ||||||||
Toys ’R’ US-Delaware, Inc. Term Loan B-4 | 35 | 32 | ||||||||
Tribune Publishing Co. | 70 | 70 | ||||||||
Tyrol Acquisition 2 SAS | 49 | 60 | ||||||||
Visant Corp. (fka Jostens) | 35 | 35 | ||||||||
Wilton Brands LLC (fka Wilton Brands, Inc.) Tranche B, | 69 | 65 | ||||||||
|
| |||||||||
| 812 | ||||||||||
|
| |||||||||
Consumer Staples—0.4% |
| |||||||||
Albertson’s LLC, Term Loan B-4 | 65 | 65 | ||||||||
Albertson’s LLC, Term Loan B-4-1 | 5 | 5 | ||||||||
New Albertson’s, Inc., Term Loan B | 50 | 50 | ||||||||
Vogue International LLC Tranche B, | 10 | 10 | ||||||||
|
| |||||||||
| 130 | ||||||||||
|
| |||||||||
| PAR VALUE | VALUE | |||||||||
Energy—0.6% |
| |||||||||
KCA Deutag US Finance LLC (KCA Deutag GMBH) | $ 20 | $ 19 | ||||||||
OSG Bulk Ships, Inc. | 65 | 65 | ||||||||
OSG International, Inc. (OIN Delaware LLC) | 65 | 65 | ||||||||
Preferred Proppants LLC | 55 | 52 | ||||||||
|
| |||||||||
| 201 | ||||||||||
|
| |||||||||
Financials—0.1% |
| |||||||||
Sears Roebuck Acceptance Corp. (KMART Corp.) | 35 | 34 | ||||||||
|
| |||||||||
Health Care—0.8% |
| |||||||||
CCS Intermediate Holdings LLC, First Lien | 65 | 64 | ||||||||
Curo Health Services Holdings, Inc., First Lien | 50 | 49 | ||||||||
Kindred Healthcare, Inc. | 30 | 30 | ||||||||
Onex Carestream Finance LP, Second Lien | 70 | 69 | ||||||||
Surgery Center Holdings, Inc. First Lien | 30 | 30 | ||||||||
Surgery Center Holdings, Inc., Second Lien | 20 | 20 | ||||||||
|
| |||||||||
| 262 | ||||||||||
|
| |||||||||
Industrials—0.5% |
| |||||||||
Aquilex LLC (Aquilex Intermediate Corp. Holdings LLC), Term Loan B | 50 | 49 | ||||||||
Gemini HDPE LLC | 30 | 30 | ||||||||
| PAR VALUE | VALUE | |||||||
Industrials—continued |
| |||||||
Koosharem, LLC | $ 50 | $ 49 | ||||||
NN, Inc. | 25 | 25 | ||||||
Photonis Technologies SAS, First Lien | 25 | 25 | ||||||
|
| |||||||
| 178 | ||||||||
|
| |||||||
Information Technology—0.5% |
| |||||||
Aricent Technologies (Aricent US, Inc.) First Lien | 20 | 20 | ||||||
BMC Software Finance, Inc. | 29 | 29 | ||||||
Dell International LLC, Term Loan B | 100 | 100 | ||||||
GTCR Valor Companies, Inc. First Lien | 30 | 29 | ||||||
|
| |||||||
| 178 | ||||||||
|
| |||||||
Materials—0.5% |
| |||||||
Albaugh, LLC | 49 | 49 | ||||||
AZ Chem US Inc. First Lien | 62 | 62 | ||||||
Styrolution U.S. Holdings LLC Term Loan B | 35 | 35 | ||||||
|
| |||||||
| 146 | ||||||||
|
| |||||||
Utilities—0.8% |
| |||||||
Energy Future Intermediate Holding Company LLC (EFIH Finance, Inc.) | 95 | 95 | ||||||
Texas Competitive Electric Holdings Co., LLC (TXU) | 230 | 167 | ||||||
4.647%, 10/10/17(9) | 20 | 15 | ||||||
|
| |||||||
| 277 | ||||||||
| ||||||||
TOTAL LOAN AGREEMENTS |
| |||||||
(Identified Cost $2,304) |
| 2,218 | ||||||
| ||||||||
See Notes to Financial Statements.
29
Table of Contents
VIRTUS ALTERNATIVE INFLATION SOLUTION FUND
SCHEDULE OF INVESTMENTS AND SECURITIES SOLD SHORT (Continued)
OCTOBER 31, 2014
($ reported in thousands)
| SHARES | VALUE | |||||||||
PREFERRED STOCK—0.6% |
| |||||||||
Financials—0.6% |
| |||||||||
Ally Financial, Inc. Series G 144A | 210 | 210 | ||||||||
|
| |||||||||
| ||||||||||
TOTAL PREFERRED STOCK |
| |||||||||
(Identified Cost $210) |
| 210 | ||||||||
| ||||||||||
COMMON STOCKS—17.6% |
| |||||||||
Consumer Discretionary—1.4% |
| |||||||||
Eutelsat Communications SA | 7,000 | 227 | ||||||||
SES SA | 6,344 | 219 | ||||||||
|
| |||||||||
|
446 |
| ||||||||
|
| |||||||||
Energy—2.5% |
| |||||||||
Exterran Holdings, Inc. | 1,750 | 69 | ||||||||
Gaslog Ltd. | 2,200 | 46 | ||||||||
Kinder Morgan Management | 2,691 | 256 | ||||||||
Kinder Morgan, Inc. | 588 | 23 | ||||||||
Phillips 66 | 286 | 22 | ||||||||
SemGroup Corp. Class A | 24 | 2 | ||||||||
Targa Resources Corp. | 681 | 88 | ||||||||
Williams Cos, Inc. (The)(12) | 5,730 | 318 | ||||||||
|
| |||||||||
|
824 |
| ||||||||
|
| |||||||||
Industrials—7.0% |
| |||||||||
Aeroports de Paris | 830 | 98 | ||||||||
ASTM SpA | 3,700 | 44 | ||||||||
Atlantia SpA | 17,100 | 403 | ||||||||
CSX Corp. | 8,981 | 320 | ||||||||
Flughafen Wien AG | 300 | 28 | ||||||||
Flughafen Zuerich AG | 165 | 105 | ||||||||
Fraport AG Frankfurt Airport Services Worldwide | 2,031 | 126 | ||||||||
Macquarie Atlas Roads Group | 19,300 | 51 | ||||||||
Macquarie Infrastructure Co. LLC | 1,122 | 80 | ||||||||
Norfolk Southern Corp. | 2,105 | 233 | ||||||||
Societa Iniziative Autostradali e Servizi SpA | 6,700 | 67 | ||||||||
Transurban Group | 49,501 | 354 | ||||||||
Vinci SA | 7,100 | 405 | ||||||||
|
| |||||||||
|
2,314 |
| ||||||||
|
| |||||||||
| SHARES | VALUE | |||||||||
Utilities—6.7% |
| |||||||||
AusNet Services | 103,800 | $ | 126 | |||||||
California Water Service Group | 3,400 | 88 | ||||||||
DUET Group | 93,100 | 202 | ||||||||
Hera SpA | 48,700 | 128 | ||||||||
Pennon Group PLC | 13,853 | 185 | ||||||||
PG&E Corp. | 7,600 | 382 | ||||||||
SJW Corp. | 800 | 26 | ||||||||
Snam SpA | 40,800 | 220 | ||||||||
Spark Infrastructure Group | 80,400 | 134 | ||||||||
Terna Rete Elettrica Nazionale SpA | 58,100 | 293 | ||||||||
Toho Gas Co. Ltd. | 20,000 | 106 | ||||||||
Tokyo Gas Co. Ltd. | 59,000 | 334 | ||||||||
|
| |||||||||
|
2,224
|
| ||||||||
| ||||||||||
TOTAL COMMON STOCKS |
| |||||||||
(Identified Cost $5,726) |
| 5,808 | ||||||||
| ||||||||||
MASTER LIMITED PARTNERSHIPS—16.5% |
| |||||||||
Chemicals-Specialty—0.2% |
| |||||||||
Westlake Chemical Partners LP | 2,566 | 77 | ||||||||
|
| |||||||||
Energy—0.1% |
| |||||||||
Tallgrass Energy Partners LP | 179 | 8 | ||||||||
VTTI Energy Partners LP | 1,333 | 32 | ||||||||
|
| |||||||||
|
40 |
| ||||||||
|
| |||||||||
Gas-Distribution—0.8% |
| |||||||||
AmeriGas Partners LP | 205 | 9 | ||||||||
Enable Midstream Partners LP | 7,492 | 181 | ||||||||
NGL Energy Partners LP | 1,777 | 61 | ||||||||
|
| |||||||||
|
251 |
| ||||||||
|
| |||||||||
Gas-Transportation—0.1% |
| |||||||||
PBF Logistics LP | 989 | 24 | ||||||||
|
| |||||||||
Oil Components-Exploration and Production—0.5% |
| |||||||||
Memorial Production Partners LP | 434 | 9 | ||||||||
Summit Midstream Partners LP | 3,426 | 161 | ||||||||
|
| |||||||||
|
170 |
| ||||||||
|
| |||||||||
Oil-Field Services—0.8% |
| |||||||||
CrossAmerica Partners LP | 2,231 | 76 | ||||||||
| SHARES | VALUE | |||||||
Oil-Field Services—continued |
| |||||||
Exterran Partners LP | 6,441 | $ | 179 | |||||
Sprague Resources LP | 398 | 9 | ||||||
|
| |||||||
|
264 |
| ||||||
|
| |||||||
Oil-Refining and Marketing—0.2% |
| |||||||
Northern Tier Energy LP | 3,350 | 85 | ||||||
|
| |||||||
Pipelines—13.5% |
| |||||||
Access Midstream Partners LP | 2,971 | 185 | ||||||
Buckeye Partners LP | 3,878 | 292 | ||||||
Cone Midstream Partners LP(11) | 1,003 | 30 | ||||||
Dominion Midstream Partners LP(11) | 456 | 14 | ||||||
Energy Transfer Equity LP | 10,895 | 636 | ||||||
Energy Transfer Partners LP | 8,844 | 570 | ||||||
Enterprise Products Partners LP(12) | 22,117 | 816 | ||||||
EQT Midstream Partners LP | 1,675 | 148 | ||||||
JP Energy Partners LP(11) | 249 | 4 | ||||||
Kinder Morgan Energy Partners LP | 742 | 70 | ||||||
Magellan Midstream Partners LP | 3,093 | 253 | ||||||
MarkWest Energy Partners LP | 2,893 | 203 | ||||||
MPLX LP | 2,309 | 154 | ||||||
Plains All American Pipeline LP | 4,784 | 270 | ||||||
Plains GP Holdings LP Class A | 3,895 | 112 | ||||||
QEP Midstream Partners LP | 3,854 | 62 | ||||||
Rose Rock Midstream LP | 2,159 | 119 | ||||||
Shell Midstream Partners LP(11) | 4,970 | 167 | ||||||
Sunoco Logistics Partners LP | 905 | 43 | ||||||
Tesoro Logistics LP | 2,804 | 158 | ||||||
Williams Partners LP | 2,542 | 131 | ||||||
|
| |||||||
|
4,437 |
| ||||||
|
| |||||||
Transportation-Marine—0.3% |
| |||||||
Teekay LNG Partners Ltd. | 2,178 | 86 | ||||||
USD Partners LP(11) | 120 | 2 | ||||||
|
| |||||||
|
88
|
| ||||||
| ||||||||
TOTAL MASTER LIMITED PARTNERSHIPS |
| |||||||
(Identified Cost $5,044) |
| 5,436 | ||||||
| ||||||||
See Notes to Financial Statements.
30
Table of Contents
VIRTUS ALTERNATIVE INFLATION SOLUTION FUND
SCHEDULE OF INVESTMENTS AND SECURITIES SOLD SHORT (Continued)
OCTOBER 31, 2014
($ reported in thousands)
| SHARES | VALUE | |||||||||
REAL ESTATE INVESTMENT TRUSTS—16.5% |
| |||||||||
Apartments—3.1% |
| |||||||||
AvalonBay Communities, Inc. | 2,669 | $ 416 | ||||||||
Camden Property Trust | 2,516 | 193 | ||||||||
Equity Residential | 5,883 | 409 | ||||||||
|
| |||||||||
|
1,018 |
| ||||||||
|
| |||||||||
Diversified—0.7% |
| |||||||||
Vornado Realty Trust | 2,263 | 248 | ||||||||
|
| |||||||||
Health Care—1.6% |
| |||||||||
HCP, Inc. | 5,407 | 238 | ||||||||
Senior Housing Properties Trust | 1,466 | 33 | ||||||||
Ventas, Inc. | 3,543 | 242 | ||||||||
|
| |||||||||
|
513 |
| ||||||||
|
| |||||||||
Industrial—0.5% |
| |||||||||
Prologis, Inc. | 3,153 | 131 | ||||||||
Terreno Realty Corp. | 1,166 | 25 | ||||||||
|
| |||||||||
|
156 |
| ||||||||
|
| |||||||||
Infrastructure—1.5% |
| |||||||||
American Tower Corp. | 5,067 | 494 | ||||||||
|
| |||||||||
Lodging/Resort—1.1% |
| |||||||||
DiamondRock Hospitality Co. | 4,805 | 69 | ||||||||
LaSalle Hotel Properties | 4,095 | 161 | ||||||||
RLJ Lodging Trust | 3,951 | 127 | ||||||||
Sunstone Hotel Investors, Inc. | 1,043 | 16 | ||||||||
|
| |||||||||
|
373 |
| ||||||||
|
| |||||||||
Mixed—0.2% |
| |||||||||
Duke Realty Corp. | 4,398 | 83 | ||||||||
|
| |||||||||
Office—1.7% |
| |||||||||
Alexandria Real Estate Equities, Inc. | 927 | 77 | ||||||||
BioMed Realty Trust, Inc. | 2,572 | 56 | ||||||||
Boston Properties, Inc. | 3,321 | 421 | ||||||||
|
| |||||||||
|
554 |
| ||||||||
|
| |||||||||
Regional Malls—3.1% |
| |||||||||
CBL & Associates Properties, Inc. | 5,090 | 97 | ||||||||
General Growth Properties, Inc. | 3,725 | 97 | ||||||||
Simon Property | 3,844 | 689 | ||||||||
| SHARES | VALUE | |||||||||
Regional Malls—continued |
| |||||||||
Taubman Centers, Inc. | 1,676 | $ 127 | ||||||||
|
| |||||||||
|
1,010 |
| ||||||||
|
| |||||||||
Self Storage—1.1% |
| |||||||||
CubeSmart | 3,284 | 69 | ||||||||
Public Storage | 1,522 | 281 | ||||||||
|
| |||||||||
|
350 |
| ||||||||
|
| |||||||||
Shopping Centers—1.1% |
| |||||||||
Acadia Realty Trust | 1,514 | 47 | ||||||||
DDR Corp. | 4,400 | 80 | ||||||||
Federal Realty Investment Trust | 1,636 | 216 | ||||||||
Ramco-Gershenson Properties Trust | 1,319 | 23 | ||||||||
|
| |||||||||
|
366 |
| ||||||||
|
| |||||||||
Timber—0.8% |
| |||||||||
Rayonier, Inc. | 1,429 | 48 | ||||||||
Weyerhaeuser Co. | 6,206 | 210 | ||||||||
|
| |||||||||
|
258
|
| ||||||||
| ||||||||||
TOTAL REAL ESTATE INVESTMENT TRUSTS |
| |||||||||
(Identified Cost $4,849) |
| 5,423 | ||||||||
| ||||||||||
PURCHASED OPTIONS—0.0% |
| |||||||||
Put Options—0.0% |
| |||||||||
Markit CDX North America High Yield Index Expiring 12/17/14 Strike price $102 | 100 | 2 | ||||||||
| ||||||||||
TOTAL PURCHASED OPTIONS |
| |||||||||
(Identified Cost $7) |
| 2 | ||||||||
| ||||||||||
TOTAL LONG TERM INVESTMENTS — 92.6% |
| |||||||||
(Identified Cost $29,837) |
| 30,504 | ||||||||
| ||||||||||
SHORT-TERM INVESTMENTS—8.0% |
| |||||||||
Money Market Mutual Funds—8.0% |
| |||||||||
BlackRock Liquidity Funds TempFund Portfolio - Institutional Shares (Seven-day effective yield 0.030%) | 2,643,346 | 2,643 | ||||||||
| ||||||||||
TOTAL SHORT-TERM INVESTMENTS |
| |||||||||
(Identified Cost $2,643) |
| 2,643 | ||||||||
| ||||||||||
TOTAL INVESTMENTS, BEFORE SECURITIES SOLD SHORT — 100.6% |
| |||||||||
(IDENTIFIED COST $32,480) |
| $ | 33,147 | (1) | ||||||
| ||||||||||
| SHARES | VALUE | |||||||
SECURITIES SOLD SHORT—(6.7)% |
| |||||||
Exchange Traded Funds—(6.7)% |
| |||||||
Energy Select Sector SPDR Fund | (857 | ) | (75 | ) | ||||
iShares 7-10 Year Treasury Bond ETF | (6,433 | ) | (676 | ) | ||||
JPMorgan Alerian | (21,038 | ) | (1,066 | ) | ||||
SPDR S&P 500 ETF Trust | (1,560 | ) | (314 | ) | ||||
SPDR S&P Oil & Gas Exploration & Production ETF | (1,200 | ) | (73 | ) | ||||
|
| |||||||
|
(2,204
|
)
| ||||||
| ||||||||
TOTAL SECURITIES SOLD SHORT |
| |||||||
(Proceeds $2,111) | (2,204 | )(1) | ||||||
| ||||||||
TOTAL INVESTMENTS NET OF SECURITIES SOLD SHORT — 93.9% |
| |||||||
(Identified Cost $30,369) |
| $30,943 | ||||||
Other assets and liabilities, |
| 2,002 | ||||||
|
| |||||||
NET ASSETS — 100.0% |
|
|
$32,945 |
| ||||
|
| |||||||
Footnote Legend:
| (1) | Federal Income Tax Information: For tax information at October 31, 2014, see Note 10 Federal Income Tax Information in the Notes to Financial Statements. |
| (2) | Variable or step coupon security; interest rate shown reflects the rate in effect at October 31, 2014. |
| (3) | Security exempt from registration under Rule 144A of the Securities Act of 1933. These securities may be resold in transactions exempt from registration, normally to qualified institutional buyers. At October 31, 2014, these securities amounted to a value of $2,951 or 8.9% of net assets. |
| (4) | 99% of the income received was in cash and 1% in PIK. |
| (5) | Illiquid security. |
| (6) | Commodity-linked note. |
| (7) | 100% of the income received was in cash. |
| (8) | Security valued at fair value as determined in good faith by or under the direction of the Trustees. This security is disclosed as a level 3 security in the disclosure table located after the Schedule of Investments and Securities Sold Short. |
| (9) | Security in default. |
| (10) | This loan will settle after October 31, 2014, at which time the interest rate, based on the London Interbank Offered Rate (“LIBOR”) and the agreed upon spread on trade date, will be known. |
| (11) | Non-income producing. |
| (12) | All or a portion segregated as collateral for securities sold short. |
See Notes to Financial Statements.
31
Table of Contents
VIRTUS ALTERNATIVE INFLATION SOLUTION FUND
SCHEDULE OF INVESTMENTS AND SECURITIES SOLD SHORT (Continued)
OCTOBER 31, 2014
($ reported in thousands)
| Abbreviations: | ||||
CLO | Collateralized Loan Obligation | |||
ETF | Exchange Traded Fund | |||
ETN | Exchange Traded Note | |||
FFCB | Federal Farm Credit Bank | |||
FHLB | Federal Home Loan Bank | |||
FHLMC | Federal Home Loan Mortgage Corp. | |||
LLC | Limited Liability Company | |||
LP | Limited Partnership | |||
MLP | Master Limited Partnership | |||
PIK | Payment-in-Kind Security | |||
S&P | Standard & Poor’s | |||
SPDR | Standard & Poor’s Depositary Receipt | |||
Foreign Currencies:
| EUR | European Currency Unit |
| USD | United States Dollar |
Country Weightings (Unaudited)† |
| |||
United States | 81 | % | ||
Italy | 4 | |||
France | 4 | |||
Australia | 3 | |||
Canada | 2 | |||
Bermuda | 2 | |||
Other | 4 | |||
Total | 100 | % | ||
| †% of total investments, net of securities sold short, as of October 31, 2014 | ||||
Futures contracts as of October 31, 2014 were as follows:
| Issue | Expiration | Contracts Purchased/(Sold) | Notional Value | Unrelized Appreciation (Depreciation) | ||||
Euro FX Currency Future | December 2014 | (2) | $ (313) | $ 10 | ||||
U.S. 10 Year Treasury Note | December 2014 | (17) | (2,148) | (15) | ||||
U.S. 5 Year Treasury Note (CBT) | December 2014 | (6) | (717) | (8) | ||||
U.S. Ultra Bond | December 2014 | (20) | (3,136) | (52) | ||||
Total | $ (65) |
Forward foreign currency exchange contracts as of October 31, 2014 were as follows:
Currency Purchased | Value | Currency Sold | Value | Counterparty | Settlement Date | Unrealized Appreciation (Depreciation) | ||||||
USD | 32 | EUR | 25 | BNY Mellon Capital Markets LLC | 12/15/14 | $ —(a) | ||||||
Total | $ —(a) |
Footnote Legend:
| (a) | Amount is less than $500. |
The following table provides a summary of inputs used to value the Fund’s investments as of October 31, 2014 (See Security Valuation Note 2B in the Notes to Financial Statements):
| Total Value at October 31, 2014 | Level 1 Quoted Prices | Level 2 Significant Observable Inputs | Level 3 Significant Unobservable Inputs | |||||
Assets: | ||||||||
Debt Securities: | ||||||||
U.S. Government Securities | $ 6,566 | $ — | $ 6,566 | $ — | ||||
Municipal Bonds | 384 | — | 384 | — | ||||
Asset-Backed Securities | 320 | — | 320 | — | ||||
Corporate Bonds | 4,085 | — | 3,936 | 149 | ||||
Convertible Bonds | 52 | — | 52 | — | ||||
Loan Agreements | 2,218 | — | 2,218 | — | ||||
Equity Securities: | ||||||||
Preferred Stock | 210 | — | 210 | — | ||||
Common Stocks | 5,808 | 5,808 | — | — | ||||
Master Limited Partnerships | 5,436 | 5,436 | — | — | ||||
Real Estate Investment Trusts | 5,423 | 5,423 | — | — | ||||
Short-Term Investments | 2,643 | 2,643 | — | — |
See Notes to Financial Statements.
32
Table of Contents
VIRTUS ALTERNATIVE INFLATION SOLUTION FUND
SCHEDULE OF INVESTMENTS AND SECURITIES SOLD SHORT (Continued)
OCTOBER 31, 2014
($ reported in thousands)
| Total Value at October 31, 2014 | Level 1 Quoted Prices | Level 2 Significant Observable Inputs | Level 3 Significant Unobservable Inputs | |||||||||||||
Purchased Options | $ | 2 | $ | 2 | $ | — | $ | — | ||||||||
Futures Contracts | 10 | 10 | — | — | ||||||||||||
Forward foreign Currency Exchange Contracts | —(a) | — | —(a) | — | ||||||||||||
|
|
|
|
|
|
|
| |||||||||
Total Assets | 33,157 | 19,322 | 13,686 | 149 | ||||||||||||
|
|
|
|
|
|
|
| |||||||||
Liabilities: | ||||||||||||||||
Securities Sold Short | (2,204) | (2,204) | — | — | ||||||||||||
Futures Contracts | (75) | (75) | — | — | ||||||||||||
|
|
|
|
|
|
|
| |||||||||
Total Liabilities | $ | (2,279) | $ | (2,279) | $ | — | $ | — | ||||||||
|
|
|
|
|
|
|
| |||||||||
Footnote Legend:
| (a) | Amount is less than $500. |
There were no transfers between levels for the period.
The following is a reconciliation of assets of the Fund for Level 3 investments which significant unobservable inputs were used to determine fair value.
| Corporate Bonds | |||||
Investments in Securities | |||||
Balance as of April 23, 2014(a) | $ | — | |||
Accrued discount/(premium) | — | ||||
Realized gain (loss) | — | ||||
Change in unrealized appreciation (depreciation)(b) | — (c) | ||||
Purchases | 150 | ||||
Sales | — | ||||
Transfers into Level 3(d) | — | ||||
Transfers from Level 3(d) | — | ||||
Paydowns | (1) | ||||
|
| ||||
Balance as of October 31, 2014 | $ | 149 (e) | |||
|
| ||||
Footnote Legend:
| (a) | Inception date. |
| (b) | Included in the related net change in unrealized appreciation (depreciation) in the Statement of Operations. The change in unrealized appreciation (depreciation) on investments still held as of October 31, 2014 was $0. |
| (c) | Amount is less than $500. |
| (d) | “Transfers into and/or from” represent the ending value as of October 31, 2014, for any investment security where a change in the pricing level occurred from the beginning to the end of the period. |
| (e) | The Fund’s investments that are categorized as Level 3 were valued utilizing third party pricing information without adjustment. Such valuations are based on unobservable inputs. A significant change in third party information inputs could result in a significantly lower or higher value of such Level 3 investments. |
See Notes to Financial Statements.
33
Table of Contents
VIRTUS ALTERNATIVE TOTAL SOLUTION FUND
CONSOLIDATED SCHEDULE OF INVESTMENTS AND SECURITIES SOLD SHORT
OCTOBER 31, 2014
($ reported in thousands)
| PAR VALUE | VALUE | |||||||||
| FOREIGN GOVERNMENT SECURITIES—1.7% | ||||||||||
Argentine Republic Government | 2,650 | EUR | $ | 246 | ||||||
Brazil Notas do Tesouro Nacional Serie F | 320 | BRL | 128 | |||||||
Hellenic Republic Government Bond | ||||||||||
2.000%, 2/24/23(2) | 22 | EUR | 19 | |||||||
2.000%, 2/24/24(2) | 22 | EUR | 19 | |||||||
2.000%, 2/24/25(2) | 22 | EUR | 18 | |||||||
2.000%, 2/24/26(2) | 22 | EUR | 18 | |||||||
2.000%, 2/24/27(2) | 22 | EUR | 17 | |||||||
2.000%, 2/24/28(2) | 22 | EUR | 17 | |||||||
2.000%, 2/24/29(2) | 22 | EUR | 16 | |||||||
2.000%, 2/24/30(2) | 22 | EUR | 16 | |||||||
2.000%, 2/24/31(2) | 22 | EUR | 16 | |||||||
2.000%, 2/24/32(2) | 22 | EUR | 15 | |||||||
2.000%, 2/24/33(2) | 22 | EUR | 15 | |||||||
2.000%, 2/24/34(2) | 22 | EUR | 15 | |||||||
2.000%, 2/24/35(2) | 22 | EUR | 15 | |||||||
2.000%, 2/24/36(2) | 22 | EUR | 15 | |||||||
2.000%, 2/24/37(2) | 22 | EUR | 15 | |||||||
2.000%, 2/24/38(2) | 22 | EUR | 15 | |||||||
2.000%, 2/24/39(2) | 22 | EUR | 15 | |||||||
2.000%, 2/24/40(2) | 22 | EUR | 15 | |||||||
2.000%, 2/24/41(2) | 22 | EUR | 15 | |||||||
2.000%, 2/24/42(2) | 22 | EUR | 15 | |||||||
Indonesia Treasury Bond | 1,400,000 | IDR | 116 | |||||||
Instituto Costarricense de Electricidad RegS | $ | 200 | 173 | |||||||
Kenya Treasury Bonds 144A
|
| 250
|
|
| 236
|
| ||||
| ||||||||||
TOTAL FOREIGN GOVERNMENT SECURITIES |
| |||||||||
(Identified Cost $1,256) |
| 1,220 | ||||||||
| ||||||||||
| MUNICIPAL BONDS—0.6% | ||||||||||
| New Jersey—0.1% | ||||||||||
Tobacco Settlement Financing Corp. Series 1-A | 80 | 60 | ||||||||
5.000%, 6/1/41 | 40 | 30 | ||||||||
| PAR VALUE | VALUE | |||||||||
| Puerto Rico—0.3% | ||||||||||
Commonwealth of Puerto Rico, Series A | $ | 220 | $ | 192 | ||||||
5.000%, 7/1/41 | 5 | 3 | ||||||||
Puerto Rico Sales Tax Financing Corp. Series A | 230 | 17 | ||||||||
| Texas—0.2% | ||||||||||
Texas Public Finance Authority | 100 | 100 | ||||||||
| ||||||||||
TOTAL MUNICIPAL BONDS |
| |||||||||
(Identified Cost $409) |
| 402 | ||||||||
| ||||||||||
| ASSET-BACKED SECURITIES—0.4% | ||||||||||
Cutwater Ltd. CLO | 100 | 91 | ||||||||
Gallatin CLO VII Ltd. | 30 | 28 | ||||||||
Gallatin CLO VII Ltd. | 25 | 24 | ||||||||
Madison Park Funding XIV Ltd. CLO
|
| 200
|
|
| 182
|
| ||||
| ||||||||||
TOTAL ASSET-BACKED SECURITIES |
| |||||||||
(Identified Cost $339) |
| 325 | ||||||||
| ||||||||||
| CORPORATE BONDS—16.1% | ||||||||||
| Consumer Discretionary—1.4% | ||||||||||
American Achievement Corp. 144A | 40 | 38 | ||||||||
APX Group, Inc. | 15 | 15 | ||||||||
8.750%, 12/1/20 | 100 | 87 | ||||||||
Bon-Ton Department Stores, Inc. (The) | 40 | 35 | ||||||||
Caesars Entertainment Operating Co., Inc. | 130 | 99 | ||||||||
9.000%, 2/15/20 | 45 | 34 | ||||||||
| ||||||||||
| ||||||||||
| ||||||||||
| ||||||||||
| ||||||||||
| PAR VALUE | VALUE | |||||||
Consumer Discretionary—continued |
| |||||||
Clear Channel Communications, Inc. PIK Interest Capitalization | $ 20 | $ 18 | ||||||
Edcon Pty Ltd. RegS 9.500%, 3/1/18(3) | 150 | 123 | ||||||
Guitar Center, Inc. 144A 9.625%, 4/15/20(4) | 60 | 44 | ||||||
JC Penney Corp., Inc. | 125 | 103 | ||||||
Liberty Interactive LLC | 60 | 66 | ||||||
Mohegan Tribal Gaming Authority | 65 | 67 | ||||||
PF Chang’s China Bistro, Inc. 144A | 15 | 15 | ||||||
Shingle Springs Tribal Gaming Authority 144A 9.750%, 9/1/21(4) | 65 | 73 | ||||||
Toys R Us, Inc. | 110 | 86 | ||||||
7.375%, 10/15/18 | 65 | 40 | ||||||
William Lyon Homes, Inc. 144A 7.000%, 8/15/22(4) | 20 | 21 | ||||||
WMG Acquisition Corp. 144A | 30 | 30 | ||||||
|
| |||||||
| 994 | ||||||||
|
| |||||||
| Consumer Staples—0.7% | ||||||||
Albertsons Holdings LLC/Saturn Acquisition Merger Sub, Inc. 144A | 55 | 54 | ||||||
Kissner Milling Co., Ltd. 144A | 325 | 332 | ||||||
New Albertson’s, Inc. | 110 | 105 | ||||||
7.450%, 8/1/29 | 5 | 5 | ||||||
8.700%, 5/1/30 | 5 | 5 | ||||||
SUPERVALU, Inc. | 35 | 34 | ||||||
|
| |||||||
| 535 | ||||||||
|
| |||||||
| Energy—4.4% | ||||||||
Alpha Natural Resources, Inc. | 25 | 13 | ||||||
See Notes to Financial Statements.
34
Table of Contents
VIRTUS ALTERNATIVE TOTAL SOLUTION FUND
CONSOLIDATED SCHEDULE OF INVESTMENTS AND SECURITIES SOLD SHORT (Continued)
OCTOBER 31, 2014
($ reported in thousands)
PAR | VALUE | |||||||
| Energy—continued | ||||||||
American Energy - | $ 20 | $ 18 | ||||||
American Energy-Permian Basin LLC / AEPB Finance Corp. 144A | 45 | 40 | ||||||
7.375%, 11/1/21(4) | 30 | 26 | ||||||
Berau Coal Energy Tbk PT RegS | 200 | 138 | ||||||
Bumi Investment Pte, Ltd. RegS | 250 | 97 | ||||||
Energy Transfer Equity LP | 70 | 74 | ||||||
EXCO Resources, Inc. | 35 | 31 | ||||||
Forbes Energy Services Ltd. | 257 | 249 | ||||||
Linn Energy LLC / Linn Energy Finance Corp. | 10 | 9 | ||||||
6.500%, 9/15/21 | 15 | 14 | ||||||
MIE Holdings Corp. 144A 7.500%, 4/25/19(4) | 200 | 197 | ||||||
Offshore Drilling Holding SA RegS | 200 | 211 | ||||||
ONGC Videsh, Ltd. RegS 3.250%, 7/15/19(3) | 200 | 200 | ||||||
Pacific Rubiales Energy Corp. 144A | 100 | 95 | ||||||
Pan American Energy LLC/Argentine Branch RegS | 60 | 64 | ||||||
Petroleos de Venezuela SA RegS | 77 | 59 | ||||||
6.000%, 11/15/26(3) | 253 | 125 | ||||||
QGOG Constellation SA RegS | 200 | 197 | ||||||
Rockies Express Pipeline LLC 144A | 100 | 106 | ||||||
| PAR VALUE | VALUE | |||||||||
| Energy—continued | ||||||||||
Sabine Pass Liquefaction LLC | $ 205 | $ 213 | ||||||||
SandRidge Energy, Inc. 7.500%, 2/15/23 | 130 | 117 | ||||||||
Sanjel Corp. 144A | 350 | 318 | ||||||||
Seitel, Inc. | 205 | 200 | ||||||||
Teine Energy, Ltd. 144A | 66 | 63 | ||||||||
Venoco, Inc. | 289 | 241 | ||||||||
Walter Energy, Inc. 144A | 35 | 31 | ||||||||
YPF SA RegS | 47 | 49 | ||||||||
| ||||||||||
| 3,195 | ||||||||||
| ||||||||||
| Financials—1.5% | ||||||||||
Banco Btg Pactual SA/Luxembourg 144A | 200 | 208 | ||||||||
Banco do Brasil SA RegS 6.250%, 10/29/49(2)(3) | 200 | 158 | ||||||||
Earls Thirteen Ltd. 144A | 149 | 148 | ||||||||
Financiera de Desarrollo Territorial SA Findeter 144A | 83,00 | 0COP | 41 | |||||||
Greektown Holdings LLC/Greektown Mothership Corp. 144A | 344 | 347 | ||||||||
Ukreximbank Via Biz Finance PLC | 200 | 162 | ||||||||
| ||||||||||
| 1,064 | ||||||||||
| ||||||||||
| Health Care—0.2% | ||||||||||
Aurora Diagnostics Holdings / Aurora Diagnostics Financing, Inc. | 50 | 42 | ||||||||
| PAR VALUE | VALUE | |||||
| Health Care—continued | ||||||
Kindred Healthcare, Inc. 144A | $ | 70 | $ 69 | |||
Mallinckrodt International Finance SA/Mallinckrodt CB LLC 144A | 30 | 32 | ||||
| ||||||
| 143 | ||||||
| ||||||
| Industrials—3.4% | ||||||
Cenveo Corp. 144A | 35 | 33 | ||||
CEVA Group PLC 144A 7.000%, 3/1/21(4) | 308 | 301 | ||||
Harland Clarke Holdings Corp. 144A | 75 | 76 | ||||
Lansing Trade Group LLC / Lansing Finance Co., Inc. 144A | 331 | 316 | ||||
Michael Baker International LLC / CDL Acquisition Co., Inc. 144A | 223 | 228 | ||||
Monitronics International, Inc. | 65 | 67 | ||||
Navigator Holdings Ltd. 144A | 328 | 350 | ||||
Odebrecht Offshore Drilling Finance Ltd. RegS | 191 | 200 | ||||
Red de Carreteras de Occidente SAPIB de CV RegS | 2,000 | MXN | 143 | |||
Ridgebury Crude Tankers LLC 144A | 308 | 314 | ||||
ServiceMaster Co., LLC (The) | 50 | 51 | ||||
Signode Industrial Group Lux SA/Signode Industrial Group US, Inc. 144A | 70 | 68 | ||||
See Notes to Financial Statements.
35
Table of Contents
VIRTUS ALTERNATIVE TOTAL SOLUTION FUND
CONSOLIDATED SCHEDULE OF INVESTMENTS AND SECURITIES SOLD SHORT (Continued)
OCTOBER 31, 2014
($ reported in thousands)
| PAR VALUE | VALUE | |||||||||
| Industrials—continued | ||||||||||
Tervita Corp. 144A | $ | 308 | $ 297 | |||||||
TransDigm, Inc. | 15 | 15 | ||||||||
6.500%, 7/15/24 | 20 | 21 | ||||||||
|
| |||||||||
| 2,480 | ||||||||||
|
| |||||||||
| Information Technology—0.2% | ||||||||||
BMC Software | 75 | 72 | ||||||||
Boxer Parent Co., Inc. | 20 | 18 | ||||||||
Zebra Technologies | 25 | 27 | ||||||||
|
| |||||||||
| 117 | ||||||||||
|
| |||||||||
| Materials—1.8% | ||||||||||
AK Steel Corp. | 30 | 30 | ||||||||
Cimento Tupi SA 144A | 60 | 60 | ||||||||
Cornerstone Chemical | 40 | 40 | ||||||||
Evraz, Inc. NA Canada | 45 | 45 | ||||||||
Ferrexpo Finance PLC | 200 | 191 | ||||||||
First Quantum | 30 | 30 | ||||||||
Gold Fields Orogen | 200 | 179 | ||||||||
IAMGOLD Corp. 144A | 75 | 62 | ||||||||
Momentive Performance Materials Escrow | 60 | 1 | ||||||||
Momentive Performance Materials, Inc. | 60 | 53 | ||||||||
Rain CII Carbon LLC / CII Carbon Corp. 144A | 75 | 77 | ||||||||
| PAR VALUE | VALUE | |||||||||
| Materials—continued | ||||||||||
Turkiye Sise ve Cam Fabrikalari AS RegS | $ | 200 | $ 197 | |||||||
Vedanta Resources PLC RegS | 300 | 306 | ||||||||
|
| |||||||||
| 1,271 | ||||||||||
|
| |||||||||
| Telecommunication Services—2.1% | ||||||||||
Avanti Communications Group PLC 144A | 608 | 590 | ||||||||
Axtel SAB de CV 144A | 15 | 15 | ||||||||
Axtel SAB de CV RegS | 90 | 91 | ||||||||
Empresa de Telecomunicaciones de Bogota RegS | 20,000 | COP | 9 | |||||||
Sprint Capital Corp. | 90 | 88 | ||||||||
8.750%, 3/15/32 | 55 | 62 | ||||||||
Sprint Corp. 144A | 50 | 51 | ||||||||
T-Mobile USA, Inc. | 20 | 21 | ||||||||
Trilogy International Partners LLC / Trilogy International Finance, Inc. 144A | 620 | 632 | ||||||||
|
| |||||||||
| 1,559 | ||||||||||
|
| |||||||||
| Utilities—0.4% | ||||||||||
Dynegy Finance I, Inc. / Dynegy Finance II, Inc. 144A | 30 | 32 | ||||||||
7.625%, 11/1/24(4) | 25 | 26 | ||||||||
Empresas Publicas de Medellin ESP 144A | 102,000 | COP | 50 | |||||||
GenOn Americas Generation LLC | 100 | 94 | ||||||||
Illinois Power Generating Co. | 40 | 37 | ||||||||
| PAR VALUE | VALUE | |||||||
| Utilities—continued | ||||||||
RJS Power Holdings LLC 144A | $ | 30 | $ 30 | |||||
|
| |||||||
| 269 | ||||||||
| ||||||||
TOTAL CORPORATE BONDS (Identified Cost $12,060) |
| 11,627 | ||||||
| ||||||||
| CONVERTIBLE BONDS—10.1% | ||||||||
| Consumer Discretionary—0.8% | ||||||||
Ascent Capital Group, Inc. | 110 | 100 | ||||||
Blucora, Inc. | 125 | 129 | ||||||
Carriage Services, Inc. 144A | 90 | 97 | ||||||
Griffon Corp. 144A | 100 | 111 | ||||||
JAKKS Pacific, Inc. 144A | 60 | 51 | ||||||
Liberty Interactive LLC | 62 | 39 | ||||||
Navistar International Corp. 144A | 90 | 90 | ||||||
|
| |||||||
| 617 | ||||||||
|
| |||||||
| Consumer Staples—0.3% | ||||||||
Chiquita Brands International, Inc. | 95 | 96 | ||||||
Vector Group Ltd. | 90 | 97 | ||||||
|
| |||||||
| 193 | ||||||||
|
| |||||||
| Energy—0.8% | ||||||||
Alon USA Energy, Inc. 144A | 95 | 118 | ||||||
Alpha Natural Resources, Inc. | 25 | 16 | ||||||
4.875%, 12/15/20(11) | 135 | 63 | ||||||
Cobalt International Energy, Inc. | 55 | 43 | ||||||
InterOil Corp. | 90 | 91 | ||||||
Peabody Energy Corp. | 130 | 87 | ||||||
See Notes to Financial Statements.
36
Table of Contents
VIRTUS ALTERNATIVE TOTAL SOLUTION FUND
CONSOLIDATED SCHEDULE OF INVESTMENTS AND SECURITIES SOLD SHORT (Continued)
OCTOBER 31, 2014
($ reported in thousands)
| PAR VALUE | VALUE | |||||||
| Energy—continued | ||||||||
Scorpio Tankers, Inc. | $ | 170 | $ 165 | |||||
|
| |||||||
| 583 | ||||||||
|
| |||||||
| Financials—2.6% | ||||||||
American Residential | 90 | 97 | ||||||
Apollo Commercial | 90 | 89 | ||||||
Bank of New York | 100 | EUR | 81 | |||||
Campus Crest | 95 | 90 | ||||||
CBIZ, Inc. 144A | 70 | 91 | ||||||
Colony Financial, Inc. | 90 | 92 | ||||||
Cowen Group, Inc. | 120 | 122 | ||||||
Element Financial | 95 | CAD | 91 | |||||
Euronet Worldwide, | 5 | 5 | ||||||
Ezcorp, Inc. 144A | 60 | 55 | ||||||
Forest City | 100 | 106 | ||||||
FXCM, Inc. | 115 | 122 | ||||||
GPT Property Trust LP | 90 | 100 | ||||||
IAS Operating | 85 | 81 | ||||||
iStar Financial, Inc. | 125 | 129 | ||||||
| PAR VALUE | VALUE | |||||||
| Financials—continued | ||||||||
New Mountain Finance | $ | 125 | $ 127 | |||||
Prospect Capital Corp. | 95 | 92 | ||||||
Redwood Trust, Inc. | 100 | 100 | ||||||
Resource Capital | 90 | 89 | ||||||
Starwood Waypoint | 105 | 103 | ||||||
|
| |||||||
| 1,862 | ||||||||
|
| |||||||
| Health Care—1.6% | ||||||||
Accuray, Inc. | 85 | 86 | ||||||
Acorda Therapeutics, | 95 | 101 | ||||||
Anacor | 30 | 35 | ||||||
Corsicanto Ltd | 110 | 67 | ||||||
Depomed, Inc. | 130 | 139 | ||||||
Healthways, Inc. | 70 | 72 | ||||||
Insulet Corp. | 90 | 103 | ||||||
Integra LifeSciences | 86 | 92 | ||||||
NuVasive, Inc. | 140 | 169 | ||||||
Sequenom, Inc. | 95 | 92 | ||||||
Spectrum | 120 | 119 | ||||||
Synergy | 20 | 23 | ||||||
TESARO, Inc. | 90 | 96 | ||||||
|
| |||||||
| 1,194 | ||||||||
|
| |||||||
| PAR VALUE | VALUE | |||||||
| Industrials—0.7% | ||||||||
AAR Corp. Series B | $ | 115 | $ 118 | |||||
Cenveo Corp. | 140 | 143 | ||||||
Encore Capital Group, | 65 | 64 | ||||||
InvenSense, Inc. 144A | 65 | 62 | ||||||
Sandisk Corp. | 85 | 101 | ||||||
|
| |||||||
| 488 | ||||||||
|
| |||||||
| Information Technology—2.0% | ||||||||
AOL, Inc. 144A | 105 | 109 | ||||||
Electronic Arts, Inc. | 75 | 102 | ||||||
Electronics For | 50 | 53 | ||||||
Intel Corp. | 70 | 89 | ||||||
Lam Research Corp. | 140 | 196 | ||||||
Monster Worldwide, | 20 | 20 | ||||||
NetSuite, Inc. | 25 | 28 | ||||||
NVIDIA Corp. 144A | 85 | 97 | ||||||
Photronics, Inc. | 80 | 86 | ||||||
Priceline Group , Inc. | 140 | 194 | ||||||
Red Hat, Inc. 144A | 70 | 75 | ||||||
Rudolph Technologies, | 65 | 68 | ||||||
TiVo, Inc. 144A | 100 | 98 | ||||||
TTM Technologies, | 101 | 96 | ||||||
Violin Memory, Inc. | 90 | 97 | ||||||
Vishay | 90 | 79 | ||||||
|
| |||||||
| 1,487 | ||||||||
|
| |||||||
See Notes to Financial Statements.
37
Table of Contents
VIRTUS ALTERNATIVE TOTAL SOLUTION FUND
CONSOLIDATED SCHEDULE OF INVESTMENTS AND SECURITIES SOLD SHORT (Continued)
OCTOBER 31, 2014
($ reported in thousands)
| PAR | ||||||||||
| VALUE | VALUE | |||||||||
| Materials—0.2% | ||||||||||
Silver Standard Resources, Inc. 144A | $ | 75 | $ 54 | |||||||
Stillwater Mining Co. | 75 | 86 | ||||||||
|
| |||||||||
| 140 | ||||||||||
|
| |||||||||
| Telecommunication Services—0.1% | ||||||||||
Akamai Technologies, Inc. 144A | 70 | 71 | ||||||||
|
| |||||||||
| Utilities—1.0% | ||||||||||
Amyris, Inc. 144A | 90 | 82 | ||||||||
Green Plains, Inc. | 45 | 78 | ||||||||
Renewable Energy Group, Inc. | 90 | 93 | ||||||||
SolarCity Corp. | 85 | 101 | ||||||||
SolarCity Corp. 144A | 90 | 88 | ||||||||
Solazyme, Inc. | 160 | 126 | ||||||||
SunEdison, Inc. 144A | 125 | 125 | ||||||||
|
| |||||||||
| 693 | ||||||||||
| ||||||||||
TOTAL CONVERTIBLE BONDS |
| |||||||||
| (Identified Cost $7,450) | 7,328 | |||||||||
| ||||||||||
| LOAN AGREEMENTS—7.1% | ||||||||||
| Consumer Discretionary—1.2% | ||||||||||
1011778 B.C. Unlimited Liability Co. (New Red Finance, Inc.) (aka Burger King/Tim Horton’s) Term Loan B | 45 | 45 | ||||||||
Adria Topco B.V. | 20 | 25 | ||||||||
AMF Bowling Centers, Inc. Term Loan B | 40 | 40 | ||||||||
AP NMT Acquisition B.V. First Lien Term Loan B | 45 | 44 | ||||||||
| PAR | ||||||||||
| VALUE | VALUE | |||||||||
| Consumer Discretionary—continued | ||||||||||
AP NMT Acquisition B.V. First Lien Term Loan B Euro | $ | 5 | $ 6 | |||||||
Clear Channel Communications, Inc. Tranche D, | 150 | 142 | ||||||||
Dave & Buster’s, Inc. | 28 | 28 | ||||||||
Hoffmaster Group, Inc., First Lien | 30 | 30 | ||||||||
Indra Holdings Corp. First Lien | 25 | 25 | ||||||||
JC Penney Corp., Inc. | 30 | 29 | ||||||||
Mohegan Tribal Gaming Authority, Term Loan B | 35 | 34 | ||||||||
Nine West Holdings, Inc. | 25 | 23 | ||||||||
Red Lobster Management LLC, First Lien | 55 | 55 | ||||||||
Scientific Games International, Inc. Term Loan B-2 | 40 | 39 | ||||||||
Spencer Gifts LLC (Spirit Halloween Superstores LLC) | 40 | 39 | ||||||||
Toys ’R’ US-Delaware, Inc. Term Loan B-4 | 40 | 37 | ||||||||
Tribune Publishing Co. | 75 | 75 | ||||||||
Tyrol Acquisition 2 SAS | 54 | 66 | ||||||||
Visant Corp. (fka Jostens) | 35 | 35 | ||||||||
Wilton Brands LLC (fka Wilton Brands, Inc.) Tranche B, | 74 | 70 | ||||||||
|
| |||||||||
| 887 | ||||||||||
|
| |||||||||
| PAR | ||||||||||
| VALUE | VALUE | |||||||||
| Consumer Staples—0.5% | ||||||||||
Albertson’s LLC, Term Loan B-4 | $ | 70 | $ 70 | |||||||
Albertson’s LLC, Term Loan B-4-1 | 15 | 15 | ||||||||
New Albertson’s, Inc. Term Loan B | 55 | 54 | ||||||||
North Atlantic Trading Co., Inc. First Lien | 204 | 206 | ||||||||
Vogue International LLC Tranche B, | 15 | 15 | ||||||||
|
| |||||||||
| 360 | ||||||||||
|
| |||||||||
| Energy—0.3% | ||||||||||
KCA Deutag US Finance LLC (KCA Deutag GMBH) | 25 | 24 | ||||||||
OSG Bulk Ships, Inc. | 75 | 74 | ||||||||
OSG International, Inc. (OIN Delaware LLC) | 75 | 74 | ||||||||
Preferred Proppants LLC | 55 | 53 | ||||||||
|
| |||||||||
| 225 | ||||||||||
|
| |||||||||
| Financials—1.2% | ||||||||||
Datapipe, Inc., Second Lien Second Lien | 513 | 497 | ||||||||
Omnitracs, LLC (Coronado Holdings, LLC) Second Lien | 308 | 305 | ||||||||
Sears Roebuck Acceptance Corp. (KMART Corp.) | 35 | 34 | ||||||||
|
| |||||||||
| 836 | ||||||||||
|
| |||||||||
| Health Care—0.6% | ||||||||||
American Pacific Corp. | 163 | 164 | ||||||||
CCS Intermediate Holdings, LLC First Lien | 75 | 74 | ||||||||
See Notes to Financial Statements.
38
Table of Contents
VIRTUS ALTERNATIVE TOTAL SOLUTION FUND
CONSOLIDATED SCHEDULE OF INVESTMENTS AND SECURITIES SOLD SHORT (Continued)
OCTOBER 31, 2014
($ reported in thousands)
| PAR VALUE | VALUE | |||||||
Health Care—continued |
| |||||||
Curo Health Services Holdings, Inc. First Lien | $ | 55 | $ 54 | |||||
Kindred Healthcare, Inc. | 35 | 35 | ||||||
Onex Carestream Finance LP Second Lien | 75 | 74 | ||||||
Surgery Center Holdings, Inc. First Lien | 30 | 30 | ||||||
Surgery Center Holdings, Inc., Second Lien | 25 | 25 | ||||||
|
| |||||||
| 456 | ||||||||
|
| |||||||
Industrials—0.3% |
| |||||||
Aquilex LLC (Aquilex Intermediate Corp. Holdings LLC) Term Loan B | 55 | 54 | ||||||
Gemini HDPE LLC | 35 | 35 | ||||||
Koosharem, LLC | 50 | 49 | ||||||
NN, Inc. | 25 | 25 | ||||||
Photonis Technologies SAS First Lien | 25 | 25 | ||||||
|
| |||||||
| 188 | ||||||||
|
| |||||||
Information Technology—2.4% |
| |||||||
Active Network Bank Debt | 310 | 312 | ||||||
Aricent Technologies (Aricent US, Inc.) First Lien | 25 | 25 | ||||||
BMC Software Finance, Inc. | 34 | 33 | ||||||
Dell International LLC, Term Loan B | 110 | 110 | ||||||
| PAR VALUE | VALUE | |||||||||
| Information Technology—continued | ||||||||||
Greenway Health, LLC (fka Vitera Healthcare Solutions, LLC) First Lien | $ | 612 | $ 610 | |||||||
GTCR Valor Companies, Inc. First Lien | 35 | 34 | ||||||||
TelX Group, Inc., (The) Second Lien | 615 | 604 | ||||||||
|
| |||||||||
| 1,728 | ||||||||||
|
| |||||||||
Materials—0.2% |
| |||||||||
Albaugh, LLC | 54 | 53 | ||||||||
AZ Chem US Inc. First Lien | 67 | 67 | ||||||||
Styrolution U.S. Holdings LLC Term Loan B | 40 | 40 | ||||||||
|
| |||||||||
| 160 | ||||||||||
|
| |||||||||
Utilities—0.4% |
| |||||||||
Energy Future Intermediate Holding Company LLC (EFIH Finance, Inc.) | 105 | 105 | ||||||||
Texas Competitive Electric Holdings Co., LLC (TXU) | 250 | 182 | ||||||||
4.647%, 10/10/17(10) | 25 | 18 | ||||||||
|
| |||||||||
| 305 | ||||||||||
| ||||||||||
TOTAL LOAN AGREEMENTS (Identified Cost $5,280) |
| 5,145 | ||||||||
| ||||||||||
| SHARES | ||||||||||
PREFERRED STOCK—1.3% |
| |||||||||
Consumer Discretionary—0.1% |
| |||||||||
Barnes & Noble, Inc. Series J 144A | 50 | 70 | ||||||||
|
| |||||||||
| Consumer Staples—0.3% | ||||||||||
Bunge Ltd. | 850 | 95 | ||||||||
| SHARES | VALUE | |||||||
Consumer Staples—continued |
| |||||||
Post Holdings, Inc. 144A | 620 | $ 55 | ||||||
Universal Corp. /VA | 60 | 63 | ||||||
|
| |||||||
| 213 | ||||||||
|
| |||||||
Energy—0.5% |
| |||||||
Chesapeake Energy Corp. 144A | 80 | 88 | ||||||
PetroQuest Energy, Inc. Series B | 2,325 | 93 | ||||||
Rex Energy Corp. | 820 | 63 | ||||||
SandRidge Energy, Inc. | 985 | 83 | ||||||
|
| |||||||
| 327 | ||||||||
|
| |||||||
Financials—0.3% |
| |||||||
Ally Financial, Inc. Series G 144A | 225 | 226 | ||||||
|
| |||||||
Retail—0.1% |
| |||||||
Ramco-Gershenson Properties Trust. Series D REIT | 1,455 | 93 | ||||||
| ||||||||
TOTAL PREFERRED STOCK (Identified Cost $988) |
| 929 | ||||||
| ||||||||
COMMON STOCKS—30.4% |
| |||||||
Consumer Discretionary—3.8% |
| |||||||
Advance Auto Parts, Inc. | 606 | 89 | ||||||
DISH Network Corp.(13) | 4,030 | 257 | ||||||
Eutelsat Communications SA | 5,200 | 169 | ||||||
Garmin, Ltd. | 2,963 | 164 | ||||||
H&R Block, Inc. | 2,534 | 82 | ||||||
Hanesbrands, Inc. | 1,303 | 138 | ||||||
Harley-Davidson, Inc. | 2,967 | 195 | ||||||
Jarden Corp.(13) | 1,956 | 127 | ||||||
Liberty Global PLC. Class A(13) | 5,382 | 245 | ||||||
Liberty Global PLC. Series C(13) | 5,650 | 251 | ||||||
Liberty Media Corp. Class C(13) | 5,632 | 270 | ||||||
See Notes to Financial Statements.
39
Table of Contents
VIRTUS ALTERNATIVE TOTAL SOLUTION FUND
CONSOLIDATED SCHEDULE OF INVESTMENTS AND SECURITIES SOLD SHORT (Continued)
OCTOBER 31, 2014
($ reported in thousands)
| SHARES | VALUE | |||||||||
| Consumer Discretionary—continued | ||||||||||
Liberty Media Corp. | 5,647 | $ 271 | ||||||||
Pandora A/S | 2,285 | 192 | ||||||||
SES SA | 5,208 | 180 | ||||||||
Travelport Worldwide, Ltd. | 491 | 7 | ||||||||
Yum! Brands, Inc. | 1,160 | 83 | ||||||||
|
| |||||||||
| 2,720 | ||||||||||
|
| |||||||||
| Consumer Staples—1.8% | ||||||||||
Cott Corp. | 2,740 | 17 | ||||||||
Hormel Foods Corp. | 3,223 | 174 | ||||||||
Molson Coors Brewing Co. | 1,247 | 93 | ||||||||
Nu Skin Enterprises, Inc. Class A | 17,132 | 905 | ||||||||
Tyson Foods, Inc. Class A | 3,580 | 144 | ||||||||
|
| |||||||||
| 1,333 | ||||||||||
|
| |||||||||
| Energy—3.8% | ||||||||||
Exterran Holdings, Inc. | 1,694 | 67 | ||||||||
Gaslog Ltd. | 2,131 | 44 | ||||||||
Golar LNG Ltd | 548 | 31 | ||||||||
Halliburton Co. | 4,423 | 244 | ||||||||
Hess Corp.(11) | 10,718 | 909 | ||||||||
Kinder Morgan Management LLC(13) | 2,606 | 248 | ||||||||
Kinder Morgan, Inc. | 570 | 22 | ||||||||
Phillips 66 | 2,576 | 202 | ||||||||
SandRidge Energy, Inc.(13) | 7,500 | 29 | ||||||||
SemGroup Corp. Class A | 23 | 2 | ||||||||
Targa Resources Corp. | 658 | 85 | ||||||||
Tesoro Corp. | 5,137 | 367 | ||||||||
Weatherford International PLC(13) | 4,045 | 66 | ||||||||
Williams Cos, Inc. | 7,969 | 442 | ||||||||
|
| |||||||||
| 2,758 | ||||||||||
|
| |||||||||
| Financials—2.2% | ||||||||||
Ally Financial, Inc.(13) | 395 | 9 | ||||||||
Alpha Bank AE(13) | 29,050 | 19 | ||||||||
American Express Co. | 781 | 70 | ||||||||
AON PLC | 743 | 64 | ||||||||
Bank of America Corp. | 3,726 | 64 | ||||||||
Berkshire Hathaway, Inc. Class B(13) | 1,134 | 159 | ||||||||
Capital One Financial Corp. | 521 | 43 | ||||||||
Charles Schwab Corp. (The) | 853 | 24 | ||||||||
| SHARES | VALUE | |||||||||
| Financials—continued | ||||||||||
Chubb Corp. (The) | 259 | $ 26 | ||||||||
Great Western Bancorp, Inc.(13) | 189 | 4 | ||||||||
Invesco Ltd. | 2,274 | 92 | ||||||||
JPMorgan Chase & Co. | 3,695 | 224 | ||||||||
Macquarie Korea Infrastructure Fund | 3,500 | 23 | ||||||||
National Bank of Greece SA(13) | 36,593 | 88 | ||||||||
Navient Corp. | 4,501 | 89 | ||||||||
Ocwen Financial | 19,417 | 458 | ||||||||
Prudential Financial, Inc. | 896 | 79 | ||||||||
Santander Consumer USA Holdings, Inc. | 1,684 | 31 | ||||||||
|
| |||||||||
| 1,566 | ||||||||||
|
| |||||||||
| Health Care—2.5% | ||||||||||
Actavis PLC | 907 | 220 | ||||||||
Allergan Inc/United States | 700 | 133 | ||||||||
Biogen Idec, Inc.(13) | 397 | 127 | ||||||||
Bristol-Myers Squibb Co. | 662 | 39 | ||||||||
Community Health Systems, Inc.(13) | 974 | 54 | ||||||||
Gilead Sciences Inc(13) | 658 | 74 | ||||||||
Mallinckrodt PLC(13) | 1,122 | 103 | ||||||||
Medtronic Inc | 1,193 | 81 | ||||||||
Omnicare, Inc. | 1,417 | 94 | ||||||||
Pfizer, Inc. | 16,780 | 503 | ||||||||
Salix Pharmaceuticals, Ltd.(13) | 2,327 | 335 | ||||||||
Valeant Pharmaceuticals International, Inc.(13) | 173 | 23 | ||||||||
|
| |||||||||
| 1,786 | ||||||||||
|
| |||||||||
| Industrials—5.5% | ||||||||||
Aeroports de Paris | 650 | 77 | ||||||||
Air Canada Class B(13) | 1,503 | 12 | ||||||||
American Airlines Group, Inc. | 4,858 | 201 | ||||||||
ASTM SpA | 2,500 | 30 | ||||||||
Atlantia SpA | 13,150 | 310 | ||||||||
Avis Budget Group, Inc.(13) | 16,105 | 898 | ||||||||
B/E Aerospace, Inc.(13) | 882 | 66 | ||||||||
Boeing Co. (The) | 660 | 82 | ||||||||
CSX Corp. | 6,899 | 246 | ||||||||
Delta Air Lines, Inc. | 1,714 | 69 | ||||||||
Fastenal Co. | 994 | 44 | ||||||||
Flughafen Wien AG | 250 | 23 | ||||||||
| SHARES | VALUE | |||||||
| Industrials—continued | ||||||||
Flughafen Zuerich AG | 125 | $ 79 | ||||||
Fraport AG Frankfurt Airport Services Worldwide | 1,458 | 90 | ||||||
Hertz Global Holdings, Inc.(11)(13) | 25,322 | 555 | ||||||
Honeywell International, Inc. | 1,758 | 169 | ||||||
Macquarie Atlas Roads Group | 14,200 | 38 | ||||||
Macquarie Infrastructure Co. LLC | 1,086 | 78 | ||||||
Metalico, Inc.(13) | 15,700 | 10 | ||||||
Norfolk Southern Corp. | 1,600 | 177 | ||||||
Societa Iniziative Autostradali e Servizi SpA | 5,350 | 53 | ||||||
Spirit AeroSystems Holdings, Inc. Class A(13) | 2,297 | 90 | ||||||
Transurban Group | 36,533 | 261 | ||||||
Vinci SA | 5,310 | 303 | ||||||
|
| |||||||
| 3,961 | ||||||||
|
| |||||||
| Information Technology—6.5% | ||||||||
Alliance Data Systems Corp.(13) | 398 | 113 | ||||||
ARM Holdings PLC | 1,492 | 64 | ||||||
ASML Holding NV | 2,486 | 248 | ||||||
Avnet, Inc. | 1,493 | 65 | ||||||
Broadcom Corp. Class A | 6,643 | 278 | ||||||
eBay, Inc.(11)(13) | 17,102 | 898 | ||||||
Facebook, Inc.(13) | 3,297 | 247 | ||||||
FleetCor Technologies, Inc.(13) | 594 | 89 | ||||||
InvenSense, Inc.(13) | 650 | 11 | ||||||
Juniper Networks, Inc. | 1,638 | 34 | ||||||
Microsoft Corp. | 10,610 | 498 | ||||||
Motorola Solutions, Inc. | 3,302 | 213 | ||||||
Samsung Electronics Co., Ltd. GDR | 1,476 | 849 | ||||||
TTM Technologies, Inc.(13) | 1,405 | 10 | ||||||
VeriSign, Inc.(13) | 2,826 | 169 | ||||||
Web.com Group, Inc.(13) | 1,430 | 29 | ||||||
Yahoo!, Inc.(11)(13) | 19,511 | 898 | ||||||
|
| |||||||
| 4,713 | ||||||||
|
| |||||||
| Materials—2.0% | ||||||||
AK Steel Holding Corp.(13) | 8,109 | 61 | ||||||
See Notes to Financial Statements.
40
Table of Contents
VIRTUS ALTERNATIVE TOTAL SOLUTION FUND
CONSOLIDATED SCHEDULE OF INVESTMENTS AND SECURITIES SOLD SHORT (Continued)
OCTOBER 31, 2014
($ reported in thousands)
| SHARES | VALUE | |||||||||
| Materials—continued | ||||||||||
B2Gold Corp.(13) | 11,445 | $ 19 | ||||||||
BASF SE | 704 | 62 | ||||||||
CF Industries Holdings, Inc. | 457 | 119 | ||||||||
Crown Holdings, | 2,250 | 108 | ||||||||
Eastman Chemical Co. | 2,213 | 179 | ||||||||
LyondellBasell Industries NV, Class A | 2,029 | 186 | ||||||||
Methanex Corp. | 5,323 | 316 | ||||||||
Rockwood Holdings, Inc. | 4,354 | 335 | ||||||||
Severstal OAO GDR | 4,354 | 46 | ||||||||
Thompson Creek Metals Co., Inc.(13) | 11,389 | 21 | ||||||||
|
| |||||||||
|
1,452 |
| ||||||||
|
| |||||||||
| Utilities—2.3% | ||||||||||
AusNet Services | 77,300 | 94 | ||||||||
California Water Service Group | 2,620 | 68 | ||||||||
DUET Group | 69,000 | 149 | ||||||||
Hera SpA | 37,200 | 98 | ||||||||
Pennon Group PLC | 9,915 | 132 | ||||||||
PG&E Corp. | 5,200 | 262 | ||||||||
SJW Corp. | 730 | 23 | ||||||||
Snam SpA | 33,900 | 183 | ||||||||
Spark Infrastructure Group | 55,500 | 93 | ||||||||
Terna Rete Elettrica | 49,489 | 249 | ||||||||
Toho Gas Co. Ltd. | 14,000 | 75 | ||||||||
Tokyo Gas Co. Ltd. | 49,000 | 277 | ||||||||
|
| |||||||||
|
1,703 |
| ||||||||
| ||||||||||
TOTAL COMMON STOCKS (Identified Cost $21,453) |
| 21,992 | ||||||||
| ||||||||||
| RIGHTS—0.0% | ||||||||||
| Health Care—0.0% | ||||||||||
Community Health | 6,335 | — | (14) | |||||||
| ||||||||||
TOTAL RIGHTS (Identified Cost $1) |
| — | (14) | |||||||
| ||||||||||
| WARRANTS—0.0% | ||||||||||
| Financials—0.0% | ||||||||||
Piraeus Bank SA(13) | 49,522 | 29 | ||||||||
| ||||||||||
TOTAL WARRANTS (Identified Cost $43) |
|
| 29 |
| ||||||
| ||||||||||
| SHARES | VALUE | |||||||||
| EXCHANGE-TRADED FUNDS—0.1% | ||||||||||
| Exchange Traded Funds—0.1% | ||||||||||
ProShares Short 20+ Year Treasury(13) |
| 3,050 |
|
| $ 82 |
| ||||
| ||||||||||
TOTAL EXCHANGE-TRADED FUNDS (Identified Cost $90) |
| 82 | ||||||||
| ||||||||||
| MASTER LIMITED PARTNERSHIPS—7.3% | ||||||||||
| Chemicals-Specialty—0.1% | ||||||||||
Westlake Chemical | 2,485 | 75 | ||||||||
|
| |||||||||
| Energy—0.1% | ||||||||||
Tallgrass Energy | 174 | 8 | ||||||||
VTTI Energy | 1,289 | 31 | ||||||||
|
| |||||||||
|
39 |
| ||||||||
|
| |||||||||
| Gas-Distribution—0.3% | ||||||||||
AmeriGas Partners LP | 198 | 9 | ||||||||
Enable Midstream | 7,254 | 175 | ||||||||
NGL Energy | 1,719 | 59 | ||||||||
|
| |||||||||
|
243 |
| ||||||||
|
| |||||||||
| Gas-Transportation—0.0% | ||||||||||
PBF Logistics LP | 958 | 23 | ||||||||
|
| |||||||||
Oil Components-Exploration and Production—0.2% |
| |||||||||
Memorial Production Partners LP | 421 | 9 | ||||||||
Summit Midstream Partners LP | 3,317 | 156 | ||||||||
|
| |||||||||
|
165 |
| ||||||||
|
| |||||||||
| Oil-Field Services—0.4% | ||||||||||
CrossAmerica | 2,160 | 73 | ||||||||
Exterran Partners LP | 6,237 | 173 | ||||||||
Sprague Resources LP | 385 | 9 | ||||||||
|
| |||||||||
|
255 |
| ||||||||
|
| |||||||||
| Oil-Refining and Marketing—0.1% | ||||||||||
Northern Tier Energy LP | 3,244 | 82 | ||||||||
|
| |||||||||
| Pipelines—6.0% | ||||||||||
Access Midstream Partners LP | 2,877 | 179 | ||||||||
| SHARES | VALUE | |||||||
| Pipelines—continued | ||||||||
Buckeye Partners LP | 3,755 | $ 283 | ||||||
Cone Midstream | 971 | 29 | ||||||
Dominion Midstream | 441 | 13 | ||||||
Energy Transfer Equity LP | 10,549 | 616 | ||||||
Energy Transfer | 8,562 | 552 | ||||||
Enterprise Products Partners LP(11) | 21,415 | 790 | ||||||
EQT Midstream Partners LP | 1,621 | 144 | ||||||
JP Energy Partners | 242 | 4 | ||||||
Kinder Morgan Energy | 720 | 68 | ||||||
Magellan Midstream | 2,994 | 245 | ||||||
MarkWest Energy | 2,801 | 196 | ||||||
MPLX LP | 2,236 | 149 | ||||||
Plains All American | 4,631 | 261 | ||||||
Plains GP Holdings LP Class A | 3,771 | 108 | ||||||
QEP Midstream | 3,731 | 60 | ||||||
Rose Rock Midstream LP | 2,090 | 115 | ||||||
Shell Midstream | 4,812 | 162 | ||||||
Sunoco Logistics | 876 | 42 | ||||||
Tesoro Logistics LP | 2,715 | 153 | ||||||
Williams Partners LP | 2,461 | 127 | ||||||
|
| |||||||
|
4,296 |
| ||||||
|
| |||||||
| Transportation-Marine—0.1% | ||||||||
Teekay LNG Partners Ltd. | 2,109 | 83 | ||||||
USD Partners LP(13) | 116 | 2 | ||||||
|
| |||||||
|
85 |
| ||||||
| ||||||||
| TOTAL MASTER LIMITED PARTNERSHIPS | ||||||||
| (Identified Cost $4,915) | 5,263 | |||||||
| ||||||||
| REAL ESTATE INVESTMENT TRUSTS—5.6% | ||||||||
| Apartments—1.0% | ||||||||
AvalonBay Communities, Inc. | 1,968 | 307 | ||||||
Camden Property Trust | 1,882 | 144 | ||||||
Equity Residential | 4,341 | 302 | ||||||
|
| |||||||
|
753 |
| ||||||
|
| |||||||
See Notes to Financial Statements.
41
Table of Contents
VIRTUS ALTERNATIVE TOTAL SOLUTION FUND
CONSOLIDATED SCHEDULE OF INVESTMENTS AND SECURITIES SOLD SHORT (Continued)
OCTOBER 31, 2014
($ reported in thousands)
| SHARES | VALUE | |||||||||
| Diversified—0.2% | ||||||||||
Vornado Realty Trust | 1,690 | $ 185 | ||||||||
|
| |||||||||
| Health Care—0.5% | ||||||||||
HCP, Inc. | 4,065 | 179 | ||||||||
Senior Housing Properties Trust | 1,079 | 24 | ||||||||
Ventas, Inc. | 2,607 | 179 | ||||||||
|
| |||||||||
| 382 | ||||||||||
|
| |||||||||
| Industrial—0.2% | ||||||||||
Prologis, Inc. | 2,324 | 97 | ||||||||
Terreno Realty Corp. | 887 | 18 | ||||||||
|
| |||||||||
| 115 | ||||||||||
|
| |||||||||
| Infrastructure—0.5% | ||||||||||
American Tower Corp. | 3,777 | 368 | ||||||||
|
| |||||||||
| Lodging/Resort—0.4% | ||||||||||
DiamondRock Hospitality Co. | 3,563 | 51 | ||||||||
LaSalle Hotel Properties | 3,058 | 120 | ||||||||
RLJ Lodging Trust | 2,951 | 95 | ||||||||
Sunstone Hotel Investors, Inc. | 780 | 12 | ||||||||
|
| |||||||||
| 278 | ||||||||||
|
| |||||||||
| Mixed—0.1% | ||||||||||
Duke Realty Corp. | 3,265 | 62 | ||||||||
|
| |||||||||
| Office—0.6% | ||||||||||
Alexandria Real Estate Equities, Inc. | 688 | 57 | ||||||||
BioMed Realty Trust, Inc. | 1,946 | 42 | ||||||||
Boston Properties, Inc. | 2,473 | 314 | ||||||||
|
| |||||||||
| 413 | ||||||||||
|
| |||||||||
| Regional Malls—1.0% | ||||||||||
CBL & Associates Properties, Inc. | 3,914 | 75 | ||||||||
General Growth Properties, Inc. | 2,668 | 69 | ||||||||
Simon Property Group, Inc. | 2,871 | 515 | ||||||||
Taubman Centers, Inc. | 1,255 | 95 | ||||||||
|
| |||||||||
| 754 | ||||||||||
|
| |||||||||
| Self Storage—0.4% | ||||||||||
CubeSmart | 2,568 | 54 | ||||||||
Public Storage | 1,150 | 212 | ||||||||
|
| |||||||||
| 266 | ||||||||||
|
| |||||||||
SHARES | VALUE | |||||||
| Shopping Centers—0.4% | ||||||||
Acadia Realty Trust | 1,140 | $ 36 | ||||||
DDR Corp. | 3,367 | 61 | ||||||
Federal Realty Investment Trust | 1,205 | 159 | ||||||
Ramco-Gershenson Properties Trust | 976 | 17 | ||||||
|
| |||||||
| 273 | ||||||||
|
| |||||||
| Timber—0.3% | ||||||||
Rayonier, Inc. | 1,111 | 37 | ||||||
Weyerhaeuser Co. | 4,584 | 155 | ||||||
|
| |||||||
| 192 | ||||||||
| ||||||||
| TOTAL REAL ESTATE INVESTMENT TRUSTS | ||||||||
| (Identified Cost $3,634) | 4,041 | |||||||
| ||||||||
CONTRACTS | ||||||||
| PURCHASED OPTIONS—0.0% | ||||||||
| Call Options—0.0% | ||||||||
AAR Corp. | 2 | $ | — | (14) | ||||
Ally Financial, Inc. | 7 | — | (14) | |||||
Alpha Natural Resources, Inc. | 50 | — | (14) | |||||
Delta Air Lines, Inc. | 11 | 3 | ||||||
DryShips, Inc. | 25 | — | (14) | |||||
Hewlett-Packard Co. | 6 | 1 | (14) | |||||
Life Lock, Inc. | 10 | 4 | ||||||
Peabody Energy Corp. | 13 | — | (14) | |||||
Terex Corp. | 7 | — | (14) | |||||
Weatherford International, Inc. | 5 | — | (14) | |||||
|
| |||||||
| 8 | ||||||||
|
| |||||||
CONTRACTS | VALUE | |||||||
| Put Options—0.0% | ||||||||
Markit CDX North America High Yield Index | 100 | $ 2 | ||||||
Synergy Pharmaceuticals, Inc. | 9 | — | (14) | |||||
|
| |||||||
| 2 | ||||||||
| ||||||||
| TOTAL PURCHASED OPTIONS (Identified Cost $16) | 10 | |||||||
| ||||||||
| TOTAL LONG TERM INVESTMENTS — 80.7% | ||||||||
| (Identified Cost $57,934) | 58,393 | |||||||
| ||||||||
SHARES | ||||||||
| SHORT-TERM INVESTMENTS—20.3% | ||||||||
| Money Market Mutual Funds—20.3% | ||||||||
BlackRock Liquidity Funds TempFund Portfolio - Institutional Shares (Seven-day effective yield 0.030%) | 14,717,249 | 14,717 | ||||||
|
| |||||||
| ||||||||
| TOTAL SHORT-TERM INVESTMENTS | ||||||||
| (Identified Cost $14,717) | 14,717 | |||||||
| ||||||||
TOTAL INVESTMENTS, BEFORE SECURITIES SOLD SHORT AND WRITTEN OPTIONS — 101.0% |
| |||||||
| (Identified Cost $72,651) | 73,110 | (1) | ||||||
| ||||||||
See Notes to Financial Statements.
42
Table of Contents
VIRTUS ALTERNATIVE TOTAL SOLUTION FUND
CONSOLIDATED SCHEDULE OF INVESTMENTS AND SECURITIES SOLD SHORT (Continued)
OCTOBER 31, 2014
($ reported in thousands)
| SHARES | VALUE | |||||||||
| SECURITIES SOLD SHORT—(11.5)% | ||||||||||
| Consumer Discretionary—(0.2)% | ||||||||||
Barnes & Noble, Inc.(13) | (1,950 | ) | $ | (42 | ) | |||||
Carriage Services, Inc. | (1,044 | ) | (21 | ) | ||||||
LifeLock, Inc.(13) | (595 | ) | (10 | ) | ||||||
Priceline Group , Inc. (The) | (37 | ) | (45 | ) | ||||||
TiVo, Inc. | (1,145 | ) | (15 | ) | ||||||
|
| |||||||||
| (133 | ) | |||||||||
|
| |||||||||
| Consumer Staples—0.0% | ||||||||||
Bunge Ltd. | (227 | ) | (20 | ) | ||||||
|
| |||||||||
| Energy—(0.2)% | ||||||||||
Alon USA Energy, Inc. | (1,050 | ) | (17 | ) | ||||||
Alpha Natural Resources, Inc.(13) | (884 | ) | (2 | ) | ||||||
Amyris, Inc. | (450 | ) | (1 | ) | ||||||
Chesapeake Energy Corp. | (435 | ) | (10 | ) | ||||||
Cobalt International Energy, Inc.(13) | (1,670 | ) | (20 | ) | ||||||
Green Plains, Inc. | (1,127 | ) | (38 | ) | ||||||
SandRidge Energy, Inc.(13) | (7,500 | ) | (29 | ) | ||||||
|
| |||||||||
| (117 | ) | |||||||||
|
| |||||||||
| Exchange Traded Funds—(7.8)% | ||||||||||
Energy Select Sector SPDR Fund | (11,237 | ) | (982 | ) | ||||||
iShares 7-10 Year Treasury Bond ETF | (6,229 | ) | (654 | ) | ||||||
iShares Russell 2000 ETF | (22,192 | ) | (2,587 | ) | ||||||
JPMorgan Alerian MLP Index ETN | (20,370 | ) | (1,032 | ) | ||||||
SPDR S&P 500 ETF Trust | (1,510 | ) | (304 | ) | ||||||
SPDR S&P Oil & Gas Exploration & Production ETF | (1,162 | ) | (71 | ) | ||||||
|
| |||||||||
| (5,630 | ) | |||||||||
|
| |||||||||
| Financials—(0.1)% | ||||||||||
CBIZ, Inc.(13) | (3,033 | ) | (28 | ) | ||||||
FXCM, Inc. | (1,582 | ) | (26 | ) | ||||||
|
| |||||||||
| (54 | ) | |||||||||
|
| |||||||||
| Health Care—(0.2)% | ||||||||||
Acorda Therapeutics, | (1,424 | ) | (50 | ) | ||||||
Amarin Corp. PLC ADR(13) | (25,949 | ) | (24 | ) | ||||||
Insulet Corp.(13) | (628 | ) | (27 | ) | ||||||
NuVasive, Inc.(13) | (1,022 | ) | (42 | ) | ||||||
|
| |||||||||
| (143 | ) | |||||||||
|
| |||||||||
| SHARES | VALUE | |||||||||
| Information Technology—(1.0)% | ||||||||||
Akamai Technologies, | (187 | ) | $ | (11 | ) | |||||
Alibaba Group | (4,739 | ) | (467 | ) | ||||||
Electronic Arts, Inc.(13) | (1,227 | ) | (50 | ) | ||||||
Electronics For | (203 | ) | (9 | ) | ||||||
Intel Corp. | (512 | ) | (18 | ) | ||||||
Lam Research | (552 | ) | (43 | ) | ||||||
Monster Worldwide, Inc.(13) | (78 | ) | — | (14) | ||||||
NetSuite, Inc.(13) | (140 | ) | (15 | ) | ||||||
NVIDIA Corp.(13) | (781 | ) | (15 | ) | ||||||
Photronics, Inc.(13) | (2,263 | ) | (21 | ) | ||||||
SanDisk Corp. | (210 | ) | (20 | ) | ||||||
Violin Memory, Inc.(13) | (6,600 | ) | (32 | ) | ||||||
Vishay Intertechnology, Inc. | (1,708 | ) | (23 | ) | ||||||
|
| |||||||||
| (724 | ) | |||||||||
|
| |||||||||
| Retail—0.0% | ||||||||||
Ramco-Gershenson Properties Trust (REIT) | (2,045 | ) | (36 | ) | ||||||
|
| |||||||||
| Telecommunication Services—(1.3)% | ||||||||||
AT&T, Inc. | (19,252 | ) | (671 | ) | ||||||
Verizon Communications, Inc. | (6,170 | ) | (310 | ) | ||||||
|
| |||||||||
| (981 | ) | |||||||||
|
| |||||||||
| PAR VALUE | ||||||||||
| U.S. Government Securities—(0.7)% | ||||||||||
United States Treasury | (485 | ) | (493 | ) | ||||||
| ||||||||||
| TOTAL SECURITIES SOLD SHORT (Proceeds $8,063) | (8,331 | )(1) | ||||||||
| ||||||||||
| CONTRACTS | ||||||||||
| WRITTEN OPTIONS—0.0% | ||||||||||
| Put Options—0.0% | ||||||||||
Hewlett-Packard Co. Expiring 02/20/15 Strike Price $34 | (6 | ) | $ | (1 | ) | |||||
Terex Corp. Expiring | (7 | ) | — | (14) | ||||||
|
| |||||||||
| (1 | ) | |||||||||
| ||||||||||
TOTAL WRITTEN OPTIONS (Proceeds $1) |
| (1 | )(1) | |||||||
| ||||||||||
| VALUE | ||||
| TOTAL INVESTMENTS NET OF SECURITIES SOLD SHORT AND WRITTEN OPTIONS — 89.5% (Identified Cost $64,587) | $64,778 | |||
Other assets and liabilities, | 7,583 | |||
|
| |||
| NET ASSETS — 100.0% | $72,361 | |||
|
| |||
Footnote Legend:
| (1) | Federal Income Tax Information: For tax |
| information at October 31, 2014, see Note 10 |
| Federal Income Tax Information in the Notes |
| to Financial Statements. |
| (2) | Variable or step coupon security; interest rate |
| shown reflects the rate in effect at |
| October 31, 2014. |
| (3) | Regulation S security. Security is offered and |
| sold outside of the United States, therefore, it |
| is exempt from registration with the SEC |
| under rules 903 and 904 of the Securities Act |
| of 1933. |
| (4) | Security exempt from registration under |
| Rule 144A of the Securities Act of 1933. These |
| securities may be resold in transactions |
| exempt from registration, normally to |
| qualified institutional buyers. At October 31, |
| 2014, these securities amounted to a value of |
| $10,390 or 14.4% of net assets. |
| (5) | 99% of the income received was in cash |
| and 1% in PIK. |
| (6) | Illiquid security. |
| (7) | This note was issued for the sole purpose of |
| funding a loan agreement between the issuer |
| and the borrower. As the credit risk for this |
| security lies solely with the borrower, the |
| name represented here is that of the |
| borrower. |
| (8) | 100% of the income received was in cash. |
| (9) | Security valued at fair value as determined in |
| good faith by or under the direction of the |
| Trustees. This security is disclosed as a level |
| 3 security in the disclosure table located after |
| the Schedule of Investments and Securities |
| Sold Short. |
| (10) | Security in default. |
| (11) | All or a portion segregated as collateral for |
| securities sold short. |
| (12) | This loan will settle after October 31, 2014, at |
| which time the interest rate, based on the |
| London Interbank Offered Rate (“LIBOR”) and |
| the agreed upon spread on trade date, will be |
| known. |
| (13) | Non-income producing. |
| (14) | Amount is less than $500. |
See Notes to Financial Statements.
43
Table of Contents
VIRTUS ALTERNATIVE TOTAL SOLUTION FUND
CONSOLIDATED SCHEDULE OF INVESTMENTS AND SECURITIES SOLD SHORT (Continued)
OCTOBER 31, 2014
($ reported in thousands)
Abbreviations: | ||||
| ADR | American Depositary Receipt | |||
| CLO | Collateralized Loan Obligation | |||
| ETF | Exchange Traded Fund | |||
| ETN | Exchange Traded Note | |||
| GDR | Global Depositary Receipt | |||
| LLC | Limited Liability Company | |||
| LP | Limited Partnership | |||
| MLP | Master Limited Partnership | |||
| PIK | Payment in Kind | |||
| PLC | Public Limited Company | |||
| REIT | Real Estate Investment Trusts | |||
| S&P | Standard & Poor’s | |||
| SPDR | Standard & Poor’s Depositary Receipt | |||
Currencies: | ||||
| AUD | Australian Dollar | |||
| BRL | Brazilian Real | |||
| CAD | Canadian Dollar | |||
| CHF | Swiss Franc | |||
| COP | Colombian Peso | |||
| EUR | European Currency Unit | |||
| GBP | British Pound | |||
| IDR | Indonesian Rupiah | |||
| JPY | Japanese Yen | |||
| MXN | Mexican Peso | |||
| NZD | New Zealand Dollar | |||
| USD | United States Dollar | |||
Country Weightings (Unaudited)† |
| |||
United States | 79 | % | ||
United Kingdom | 3 | |||
Canada | 3 | |||
Italy | 2 | |||
Marshall Islands | 1 | |||
Luxembourg | 1 | |||
Republic of Korea | 1 | |||
Other | 10 | |||
Total | 100 | % | ||
† % of total investments, net of securities sold short, as of October 31, 2014 |
| |||
Futures contracts as of October 31, 2014 were as follows:
|
| |||||||||||||||
| Issue | Expiration | Contracts Purchased/(Sold) | Notional Value | Unrealized Appreciation/(Depreciation) | ||||||||||||
| ||||||||||||||||
Brent Crude Futures | November 2014 | (4) | $ (343) | $ 28 | ||||||||||||
Hang Seng Index Futures | November 2014 | 3 | 463 | 17 | ||||||||||||
10-Year Mini JGB Future | December 2014 | 14 | 1,832 | 11 | ||||||||||||
Euro - Bund Future | December 2014 | 5 | 945 | 10 | ||||||||||||
Nikkei 225 | December 2014 | 7 | 514 | 24 | ||||||||||||
TOPIX Index Future | December 2014 | 2 | 239 | 8 | ||||||||||||
Australian 10-Year Bond Future | December 2014 | 7 | 5,540 | 15 | ||||||||||||
Cocoa Futures | December 2014 | 3 | 92 | (6) | ||||||||||||
Corn Future | December 2014 | (6) | (113) | (4) | ||||||||||||
Soybean Meal Future | December 2014 | (1) | (39) | (8) | ||||||||||||
Wheat Future (CBT) | December 2014 | (3) | (80) | (1) | ||||||||||||
LME Electrolytic Copper Futures | December 2014 | 1 | 168 | (9) | ||||||||||||
LME Electrolytic Copper Futures | December 2014 | (1) | (168) | — (a) | ||||||||||||
LME Primary Aluminum Futures | December 2014 | 4 | 207 | (4) | ||||||||||||
LME Primary Aluminum Futures | December 2014 | (1) | (52) | (3) | ||||||||||||
LME Zinc | December 2014 | 1 | 58 | — (a) | ||||||||||||
LME Zinc | December 2014 | (1) | (58) | 2 | ||||||||||||
DJIA E-Mini | December 2014 | 8 | 692 | 20 | ||||||||||||
Euro STOXX 50 | December 2014 | 5 | 194 | (4) | ||||||||||||
NASDAQ 100 E-Mini | December 2014 | 8 | 664 | 20 | ||||||||||||
Russell 2000 Mini Index | December 2014 | 3 | 351 | 12 | ||||||||||||
S&P 500 E-Mini Future | December 2014 | 4 | 402 | 8 | ||||||||||||
FTSE 100 Index Futures | December 2014 | (1) | (104) | (4) | ||||||||||||
Soybean Oil Future | December 2014 | (3) | (63) | (4) | ||||||||||||
Gasoline Rbob Future | December 2014 | (1) | (90) | 7 | ||||||||||||
NY Harbor/Heating Oil | December 2014 | (2) | (211) | 4 | ||||||||||||
Canada 10-Year Bond Future | December 2014 | 1 | 122 | 1 | ||||||||||||
Gas Oil Future (Ice) | December 2014 | (2) | (148) | 9 | ||||||||||||
Gold 100 Ounce Future | December 2014 | (2) | (234) | 11 | ||||||||||||
Long Gilt Future | December 2014 | 1 | 184 | 4 | ||||||||||||
Natural Gas Futures | December 2014 | (5) | (194) | (1) | ||||||||||||
Silver Future | December 2014 | (4) | (322) | 51 | ||||||||||||
U.S. 5 Year Treasury Note (CBT) | December 2014 | (7) | (836) | (9) | ||||||||||||
U.S. Long Bond (CBT) | December 2014 | 11 | 1,552 | 19 | ||||||||||||
WTI Crude Futures | December 2014 | (2) | (161) | 5 | ||||||||||||
Soybean Future | March 2015 | (2) | (105) | (10) | ||||||||||||
Cotton No. 2 | March 2015 | (1) | (31) | — (a) | ||||||||||||
Coffee ’C’ Future | March 2015 | 2 | 144 | — (a) | ||||||||||||
3-Month Euro Euribor | March 2016 | 44 | 13,763 | 2 | ||||||||||||
90 Days Euro Bond | March 2016 | 71 | 17,559 | 4 | ||||||||||||
90 Days Sterling Bond | March 2016 | 50 | 9,868 | 20 | ||||||||||||
| ||||||||||||||||
Total | $ 245 | |||||||||||||||
Footnote Legend:
| (a) | Amount is less than $500. |
See Notes to Financial Statements.
44
Table of Contents
VIRTUS ALTERNATIVE TOTAL SOLUTION FUND
CONSOLIDATED SCHEDULE OF INVESTMENTS AND SECURITIES SOLD SHORT (Continued)
OCTOBER 31, 2014
($ reported in thousands)
Forward foreign currency exchange contracts as of October 31, 2014 were as follows:
| ||||||||||||||||||||||||||||||
| Currency Purchased | Value | Currency Sold | Value | Counterparty | Settlement Date |
Unrealized Appreciation | ||||||||||||||||||||||||
| ||||||||||||||||||||||||||||||
AUD* | 775 | USD | 703 | Bank of America N.A. | 12/19/14 | $ (23) | ||||||||||||||||||||||||
AUD* | 64 | USD | 56 | Bank of America N.A. | 12/19/14 | — (a) | ||||||||||||||||||||||||
AUD* | 45 | USD | 40 | Bank of America N.A. | 12/19/14 | — (a) | ||||||||||||||||||||||||
AUD* | 43 | USD | 37 | Bank of America N.A. | 12/19/14 | — (a) | ||||||||||||||||||||||||
AUD* | 36 | USD | 31 | Bank of America N.A. | 12/19/14 | — (a) | ||||||||||||||||||||||||
AUD* | 25 | USD | 22 | Bank of America N.A. | 12/19/14 | — (a) | ||||||||||||||||||||||||
AUD* | 14 | USD | 13 | Bank of America N.A. | 12/19/14 | — (a) | ||||||||||||||||||||||||
AUD* | 14 | USD | 12 | Bank of America N.A. | 12/19/14 | — (a) | ||||||||||||||||||||||||
AUD* | 10 | USD | 9 | Bank of America N.A. | 12/19/14 | — (a) | ||||||||||||||||||||||||
AUD* | — | (a) | USD | — | (a) | Bank of America N.A. | 12/19/14 | — (a) | ||||||||||||||||||||||
CAD* | 22 | USD | 20 | Bank of America N.A. | 12/19/14 | — (a) | ||||||||||||||||||||||||
CAD* | 15 | USD | 13 | Bank of America N.A. | 12/19/14 | — (a) | ||||||||||||||||||||||||
CAD* | 7 | USD | 6 | Bank of America N.A. | 12/19/14 | — (a) | ||||||||||||||||||||||||
CAD* | 2 | USD | 2 | Bank of America N.A. | 12/19/14 | — (a) | ||||||||||||||||||||||||
CAD* | 1 | USD | 1 | Bank of America N.A. | 12/19/14 | — (a) | ||||||||||||||||||||||||
CAD* | — | (a) | USD | — | (a) | Bank of America N.A. | 12/19/14 | — (a) | ||||||||||||||||||||||
CAD* | — | (a) | USD | — | (a) | Bank of America N.A. | 12/19/14 | — (a) | ||||||||||||||||||||||
CHF* | 27 | USD | 28 | Bank of America N.A. | 12/19/14 | — (a) | ||||||||||||||||||||||||
CHF* | 24 | USD | 25 | Bank of America N.A. | 12/19/14 | — (a) | ||||||||||||||||||||||||
CHF* | 24 | USD | 25 | Bank of America N.A. | 12/19/14 | — (a) | ||||||||||||||||||||||||
CHF* | 17 | USD | 17 | Bank of America N.A. | 12/19/14 | — (a) | ||||||||||||||||||||||||
CHF* | 16 | USD | 17 | Bank of America N.A. | 12/19/14 | — (a) | ||||||||||||||||||||||||
CHF* | 14 | USD | 15 | Bank of America N.A. | 12/19/14 | — (a) | ||||||||||||||||||||||||
CHF* | 5 | USD | 5 | Bank of America N.A. | 12/19/14 | — (a) | ||||||||||||||||||||||||
CHF* | 3 | USD | 3 | Bank of America N.A. | 12/19/14 | — (a) | ||||||||||||||||||||||||
CHF* | 2 | USD | 2 | Bank of America N.A. | 12/19/14 | — (a) | ||||||||||||||||||||||||
CHF* | — | (a) | USD | — | (a) | Bank of America N.A. | 12/19/14 | — (a) | ||||||||||||||||||||||
EUR | 55 | USD | 73 | JPMorgan Chase Bank N.A. | 11/03/14 | (5) | ||||||||||||||||||||||||
EUR* | 211 | USD | 267 | Bank of America N.A. | 12/19/14 | (2) | ||||||||||||||||||||||||
EUR* | 152 | USD | 194 | Bank of America N.A. | 12/19/14 | (3) | ||||||||||||||||||||||||
EUR* | 119 | USD | 151 | Bank of America N.A. | 12/19/14 | (3) | ||||||||||||||||||||||||
EUR* | 117 | USD | 149 | Bank of America N.A. | 12/19/14 | (1) | ||||||||||||||||||||||||
EUR* | 95 | USD | 120 | Bank of America N.A. | 12/19/14 | (1) | ||||||||||||||||||||||||
EUR* | 90 | USD | 113 | Bank of America N.A. | 12/19/14 | (1) | ||||||||||||||||||||||||
EUR* | 82 | USD | 103 | Bank of America N.A. | 12/19/14 | (1) | ||||||||||||||||||||||||
EUR* | 71 | USD | 89 | Bank of America N.A. | 12/19/14 | (1) | ||||||||||||||||||||||||
EUR* | 64 | USD | 80 | Bank of America N.A. | 12/19/14 | — (a) | ||||||||||||||||||||||||
EUR* | 60 | USD | 77 | Bank of America N.A. | 12/19/14 | (1) | ||||||||||||||||||||||||
EUR* | 58 | USD | 74 | Bank of America N.A. | 12/19/14 | (1) | ||||||||||||||||||||||||
EUR* | 57 | USD | 73 | Bank of America N.A. | 12/19/14 | (2) | ||||||||||||||||||||||||
EUR* | 40 | USD | 52 | Bank of America N.A. | 12/19/14 | (1) | ||||||||||||||||||||||||
EUR* | 28 | USD | 37 | Bank of America N.A. | 12/19/14 | (1) | ||||||||||||||||||||||||
EUR* | 22 | USD | 28 | Bank of America N.A. | 12/19/14 | (1) | ||||||||||||||||||||||||
EUR* | 20 | USD | 25 | Bank of America N.A. | 12/19/14 | — (a) | ||||||||||||||||||||||||
EUR* | 15 | USD | 19 | Bank of America N.A. | 12/19/14 | — (a) | ||||||||||||||||||||||||
EUR* | 13 | USD | 16 | Bank of America N.A. | 12/19/14 | — (a) | ||||||||||||||||||||||||
EUR* | 7 | USD | 9 | Bank of America N.A. | 12/19/14 | — (a) | ||||||||||||||||||||||||
EUR* | 1 | USD | 1 | Bank of America N.A. | 12/19/14 | — (a) | ||||||||||||||||||||||||
GBP* | 454 | USD | 738 | Bank of America N.A. | 12/19/14 | (12) | ||||||||||||||||||||||||
GBP* | 75 | USD | 120 | Bank of America N.A. | 12/19/14 | — (a) | ||||||||||||||||||||||||
GBP* | 46 | USD | 74 | Bank of America N.A. | 12/19/14 | — (a) | ||||||||||||||||||||||||
GBP* | 43 | USD | 71 | Bank of America N.A. | 12/19/14 | (1) | ||||||||||||||||||||||||
GBP* | 30 | USD | 48 | Bank of America N.A. | 12/19/14 | — (a) | ||||||||||||||||||||||||
GBP* | 20 | USD | 32 | Bank of America N.A. | 12/19/14 | — (a) | ||||||||||||||||||||||||
GBP* | 12 | USD | 20 | Bank of America N.A. | 12/19/14 | (1) | ||||||||||||||||||||||||
See Notes to Financial Statements.
45
Table of Contents
VIRTUS ALTERNATIVE TOTAL SOLUTION FUND
CONSOLIDATED SCHEDULE OF INVESTMENTS AND SECURITIES SOLD SHORT (Continued)
OCTOBER 31, 2014
($ reported in thousands)
Forward foreign currency exchange contracts as of October 31, 2014 were as follows: (continued)
| ||||||||||||||||
| Currency Purchased | Value | Currency Sold | Value | Counterparty | Settlement Date |
Unrealized Appreciation | ||||||||||
| ||||||||||||||||
GBP* | 5 | USD | 9 | Bank of America N.A. | 12/19/14 | $ — (a) | ||||||||||
GBP* | 5 | USD | 8 | Bank of America N.A. | 12/19/14 | — (a) | ||||||||||
GBP* | 1 | USD | 1 | Bank of America N.A. | 12/19/14 | — (a) | ||||||||||
JPY* | 15,920 | USD | 146 | Bank of America N.A. | 12/19/14 | (4) | ||||||||||
JPY* | 10,823 | USD | 101 | Bank of America N.A. | 12/19/14 | (5) | ||||||||||
JPY* | 10,819 | USD | 102 | Bank of America N.A. | 12/19/14 | (5) | ||||||||||
JPY* | 9,512 | USD | 89 | Bank of America N.A. | 12/19/14 | (4) | ||||||||||
JPY* | 9,355 | USD | 86 | Bank of America N.A. | 12/19/14 | (3) | ||||||||||
JPY* | 7,144 | USD | 66 | Bank of America N.A. | 12/19/14 | (2) | ||||||||||
JPY* | 6,298 | USD | 59 | Bank of America N.A. | 12/19/14 | (3) | ||||||||||
JPY* | 5,854 | USD | 55 | Bank of America N.A. | 12/19/14 | (3) | ||||||||||
JPY* | 2,892 | USD | 26 | Bank of America N.A. | 12/19/14 | (1) | ||||||||||
JPY* | 2,797 | USD | 26 | Bank of America N.A. | 12/19/14 | (1) | ||||||||||
JPY* | 2,538 | USD | 24 | Bank of America N.A. | 12/19/14 | (1) | ||||||||||
JPY* | 1,912 | USD | 18 | Bank of America N.A. | 12/19/14 | (1) | ||||||||||
JPY* | 1,861 | USD | 17 | Bank of America N.A. | 12/19/14 | — (a) | ||||||||||
JPY* | 1,067 | USD | 10 | Bank of America N.A. | 12/19/14 | — (a) | ||||||||||
JPY* | 1,054 | USD | 10 | Bank of America N.A. | 12/19/14 | — (a) | ||||||||||
JPY* | 978 | USD | 9 | Bank of America N.A. | 12/19/14 | — (a) | ||||||||||
JPY* | 894 | USD | 8 | Bank of America N.A. | 12/19/14 | — (a) | ||||||||||
MXN* | 5,443 | USD | 410 | Bank of America N.A. | 12/19/14 | (7) | ||||||||||
MXN* | 286 | USD | 22 | Bank of America N.A. | 12/19/14 | — (a) | ||||||||||
MXN* | 114 | USD | 9 | Bank of America N.A. | 12/19/14 | — (a) | ||||||||||
MXN* | 63 | USD | 5 | Bank of America N.A. | 12/19/14 | — (a) | ||||||||||
MXN* | 11 | USD | 1 | Bank of America N.A. | 12/19/14 | — (a) | ||||||||||
MXN* | 7 | USD | 1 | Bank of America N.A. | 12/19/14 | — (a) | ||||||||||
NZD* | 49 | USD | 38 | Bank of America N.A. | 12/19/14 | — (a) | ||||||||||
NZD* | 33 | USD | 27 | Bank of America N.A. | 12/19/14 | (1) | ||||||||||
NZD* | 30 | USD | 24 | Bank of America N.A. | 12/19/14 | — (a) | ||||||||||
NZD* | 25 | USD | 19 | Bank of America N.A. | 12/19/14 | — (a) | ||||||||||
NZD* | 19 | USD | 15 | Bank of America N.A. | 12/19/14 | (1) | ||||||||||
NZD* | 15 | USD | 12 | Bank of America N.A. | 12/19/14 | — (a) | ||||||||||
NZD* | 12 | USD | 9 | Bank of America N.A. | 12/19/14 | — (a) | ||||||||||
NZD* | 9 | USD | 7 | Bank of America N.A. | 12/19/14 | — (a) | ||||||||||
NZD* | 7 | USD | 5 | Bank of America N.A. | 12/19/14 | — (a) | ||||||||||
NZD* | 2 | USD | 1 | Bank of America N.A. | 12/19/14 | — (a) | ||||||||||
NZD* | 1 | USD | 1 | Bank of America N.A. | 12/19/14 | — (a) | ||||||||||
USD | 75 | EUR | 55 | JPMorgan Chase Bank N.A. | 11/03/14 | 7 | ||||||||||
USD | 157 | EUR | 120 | JPMorgan Chase Bank N.A. | 12/04/14 | 7 | ||||||||||
USD | 29 | EUR | 23 | JPMorgan Chase Bank N.A. | 12/04/14 | 1 | ||||||||||
USD | 19 | EUR | 15 | JPMorgan Chase Bank N.A. | 12/04/14 | — (a) | ||||||||||
USD | 14 | EUR | 11 | JPMorgan Chase Bank N.A. | 12/04/14 | — (a) | ||||||||||
USD | 13 | EUR | 11 | JPMorgan Chase Bank N.A. | 12/04/14 | — (a) | ||||||||||
USD | 10 | EUR | 8 | JPMorgan Chase Bank N.A. | 12/04/14 | — (a) | ||||||||||
USD | 5 | EUR | 4 | JPMorgan Chase Bank N.A. | 12/04/14 | — (a) | ||||||||||
USD | 32 | EUR | 25 | BNY Mellon Capital Markets LLC | 12/15/14 | — (a) | ||||||||||
USD | 92 | EUR | 71 | JPMorgan Chase Bank N.A. | 12/16/14 | 3 | ||||||||||
USD* | 227 | AUD | 254 | Bank of America N.A. | 12/19/14 | 4 | ||||||||||
USD* | 203 | AUD | 227 | Bank of America N.A. | 12/19/14 | 4 | ||||||||||
USD* | 177 | AUD | 196 | Bank of America N.A. | 12/19/14 | 5 | ||||||||||
USD* | 151 | AUD | 170 | Bank of America N.A. | 12/19/14 | 2 | ||||||||||
USD* | 87 | AUD | 98 | Bank of America N.A. | 12/19/14 | 1 | ||||||||||
USD* | 70 | AUD | 78 | Bank of America N.A. | 12/19/14 | 2 | ||||||||||
USD* | 63 | AUD | 71 | Bank of America N.A. | 12/19/14 | 1 | ||||||||||
USD* | 43 | AUD | 48 | Bank of America N.A. | 12/19/14 | 1 | ||||||||||
See Notes to Financial Statements.
46
Table of Contents
VIRTUS ALTERNATIVE TOTAL SOLUTION FUND
CONSOLIDATED SCHEDULE OF INVESTMENTS AND SECURITIES SOLD SHORT (Continued)
OCTOBER 31, 2014
($ reported in thousands)
Forward foreign currency exchange contracts as of October 31, 2014 were as follows: (continued)
| ||||||||||||||||||
| Currency Purchased | Value | Currency Sold | Value | Counterparty | Settlement Date |
Unrealized Appreciation | ||||||||||||
| ||||||||||||||||||
USD* | 34 | AUD | 39 | Bank of America N.A. | 12/19/14 | $ — (a) | ||||||||||||
USD* | 33 | AUD | 38 | Bank of America N.A. | 12/19/14 | — (a) | ||||||||||||
USD* | 32 | AUD | 37 | Bank of America N.A. | 12/19/14 | — (a) | ||||||||||||
USD* | 11 | AUD | 12 | Bank of America N.A. | 12/19/14 | — (a) | ||||||||||||
USD* | 4 | AUD | 5 | Bank of America N.A. | 12/19/14 | — (a) | ||||||||||||
USD* | 4 | AUD | 4 | Bank of America N.A. | 12/19/14 | — (a) | ||||||||||||
USD* | 3 | AUD | 3 | Bank of America N.A. | 12/19/14 | — (a) | ||||||||||||
USD* | — | (a) | AUD | — | (a) | Bank of America N.A. | 12/19/14 | — (a) | ||||||||||
USD* | — | (a) | AUD | — | (a) | Bank of America N.A. | 12/19/14 | — (a) | ||||||||||
USD* | 263 | CAD | 290 | Bank of America N.A. | 12/19/14 | 6 | ||||||||||||
USD* | 105 | CAD | 118 | Bank of America N.A. | 12/19/14 | — (a) | ||||||||||||
USD* | 49 | CAD | 55 | Bank of America N.A. | 12/19/14 | — (a) | ||||||||||||
USD* | 45 | CAD | 50 | Bank of America N.A. | 12/19/14 | 1 | ||||||||||||
USD* | 40 | CAD | 45 | Bank of America N.A. | 12/19/14 | — (a) | ||||||||||||
USD* | 39 | CAD | 43 | Bank of America N.A. | 12/19/14 | 1 | ||||||||||||
USD* | 19 | CAD | 21 | Bank of America N.A. | 12/19/14 | — (a) | ||||||||||||
USD* | 16 | CAD | 18 | Bank of America N.A. | 12/19/14 | — (a) | ||||||||||||
USD* | 10 | CAD | 11 | Bank of America N.A. | 12/19/14 | — (a) | ||||||||||||
USD* | 6 | CAD | 7 | Bank of America N.A. | 12/19/14 | — (a) | ||||||||||||
USD* | 5 | CAD | 5 | Bank of America N.A. | 12/19/14 | — (a) | ||||||||||||
USD* | 4 | CAD | 5 | Bank of America N.A. | 12/19/14 | — (a) | ||||||||||||
USD* | 4 | CAD | 5 | Bank of America N.A. | 12/19/14 | — (a) | ||||||||||||
USD* | 4 | CAD | 4 | Bank of America N.A. | 12/19/14 | — (a) | ||||||||||||
USD* | 2 | CAD | 2 | Bank of America N.A. | 12/19/14 | — (a) | ||||||||||||
USD* | 2 | CAD | 2 | Bank of America N.A. | 12/19/14 | — (a) | ||||||||||||
USD* | — | (a) | CAD | — | (a) | Bank of America N.A. | 12/19/14 | — (a) | ||||||||||
USD* | — | (a) | CAD | — | (a) | Bank of America N.A. | 12/19/14 | — (a) | ||||||||||
USD* | 617 | CHF | 576 | Bank of America N.A. | 12/19/14 | 18 | ||||||||||||
USD* | 117 | CHF | 109 | Bank of America N.A. | 12/19/14 | 3 | ||||||||||||
USD* | 113 | CHF | 107 | Bank of America N.A. | 12/19/14 | 2 | ||||||||||||
USD* | 75 | CHF | 71 | Bank of America N.A. | 12/19/14 | 1 | ||||||||||||
USD* | 53 | CHF | 50 | Bank of America N.A. | 12/19/14 | — (a) | ||||||||||||
USD* | 48 | CHF | 45 | Bank of America N.A. | 12/19/14 | 1 | ||||||||||||
USD* | 39 | CHF | 36 | Bank of America N.A. | 12/19/14 | 1 | ||||||||||||
USD* | 28 | CHF | 27 | Bank of America N.A. | 12/19/14 | — (a) | ||||||||||||
USD* | 21 | CHF | 20 | Bank of America N.A. | 12/19/14 | — (a) | ||||||||||||
USD* | 18 | CHF | 17 | Bank of America N.A. | 12/19/14 | — (a) | ||||||||||||
USD* | 15 | CHF | 14 | Bank of America N.A. | 12/19/14 | — (a) | ||||||||||||
USD* | 12 | CHF | 11 | Bank of America N.A. | 12/19/14 | — (a) | ||||||||||||
USD* | 11 | CHF | 10 | Bank of America N.A. | 12/19/14 | — (a) | ||||||||||||
USD* | 10 | CHF | 9 | Bank of America N.A. | 12/19/14 | — (a) | ||||||||||||
USD* | 7 | CHF | 7 | Bank of America N.A. | 12/19/14 | — (a) | ||||||||||||
USD* | 7 | CHF | 6 | Bank of America N.A. | 12/19/14 | — (a) | ||||||||||||
USD* | 4 | CHF | 3 | Bank of America N.A. | 12/19/14 | — (a) | ||||||||||||
USD* | 1,675 | EUR | 1,292 | Bank of America N.A. | 12/19/14 | 55 | ||||||||||||
USD* | 59 | EUR | 46 | Bank of America N.A. | 12/19/14 | 1 | ||||||||||||
USD* | 51 | EUR | 40 | Bank of America N.A. | 12/19/14 | 1 | ||||||||||||
USD* | 49 | EUR | 38 | Bank of America N.A. | 12/19/14 | 2 | ||||||||||||
USD* | 46 | EUR | 36 | Bank of America N.A. | 12/19/14 | 1 | ||||||||||||
USD* | 28 | EUR | 22 | Bank of America N.A. | 12/19/14 | 1 | ||||||||||||
USD* | 17 | EUR | 13 | Bank of America N.A. | 12/19/14 | — (a) | ||||||||||||
USD* | 6 | EUR | 5 | Bank of America N.A. | 12/19/14 | — (a) | ||||||||||||
USD* | 4 | EUR | 3 | Bank of America N.A. | 12/19/14 | — (a) | ||||||||||||
USD* | 261 | GBP | 163 | Bank of America N.A. | 12/19/14 | 1 | ||||||||||||
USD* | 209 | GBP | 130 | Bank of America N.A. | 12/19/14 | — (a) | ||||||||||||
See Notes to Financial Statements.
47
Table of Contents
VIRTUS ALTERNATIVE TOTAL SOLUTION FUND
CONSOLIDATED SCHEDULE OF INVESTMENTS AND SECURITIES SOLD SHORT (Continued)
OCTOBER 31, 2014
($ reported in thousands)
Forward foreign currency exchange contracts as of October 31, 2014 were as follows: (continued)
| ||||||||||||||||||
| Currency Purchased | Value | Currency Sold | Value | Counterparty | Settlement Date |
Unrealized Appreciation | ||||||||||||
| ||||||||||||||||||
USD* | 192 | GBP | 120 | Bank of America N.A. | 12/19/14 | $ (1) | ||||||||||||
USD* | 141 | GBP | 87 | Bank of America N.A. | 12/19/14 | 2 | ||||||||||||
USD* | 105 | GBP | 65 | Bank of America N.A. | 12/19/14 | 1 | ||||||||||||
USD* | 96 | GBP | 59 | Bank of America N.A. | 12/19/14 | 1 | ||||||||||||
USD* | 87 | GBP | 53 | Bank of America N.A. | 12/19/14 | 1 | ||||||||||||
USD* | 65 | GBP | 40 | Bank of America N.A. | 12/19/14 | 1 | ||||||||||||
USD* | 53 | GBP | 33 | Bank of America N.A. | 12/19/14 | 1 | ||||||||||||
USD* | 50 | GBP | 30 | Bank of America N.A. | 12/19/14 | 1 | ||||||||||||
USD* | 35 | GBP | 21 | Bank of America N.A. | 12/19/14 | 1 | ||||||||||||
USD* | 31 | GBP | 19 | Bank of America N.A. | 12/19/14 | 1 | ||||||||||||
USD* | 29 | GBP | 18 | Bank of America N.A. | 12/19/14 | — (a) | ||||||||||||
USD* | 28 | GBP | 17 | Bank of America N.A. | 12/19/14 | — (a) | ||||||||||||
USD* | 24 | GBP | 15 | Bank of America N.A. | 12/19/14 | — (a) | ||||||||||||
USD* | 11 | GBP | 7 | Bank of America N.A. | 12/19/14 | — (a) | ||||||||||||
USD* | 5 | GBP | 3 | Bank of America N.A. | 12/19/14 | — (a) | ||||||||||||
USD* | 3 | GBP | 2 | Bank of America N.A. | 12/19/14 | — (a) | ||||||||||||
USD* | 2 | GBP | 1 | Bank of America N.A. | 12/19/14 | — (a) | ||||||||||||
USD* | 1 | GBP | 1 | Bank of America N.A. | 12/19/14 | — (a) | ||||||||||||
USD* | — | (a) | GBP | — | (a) | Bank of America N.A. | 12/19/14 | — (a) | ||||||||||
USD* | 913 | JPY | 97,355 | Bank of America N.A. | 12/19/14 | 46 | ||||||||||||
USD* | 203 | JPY | 21,928 | Bank of America N.A. | 12/19/14 | 8 | ||||||||||||
USD* | 54 | JPY | 5,878 | Bank of America N.A. | 12/19/14 | 2 | ||||||||||||
USD* | 40 | JPY | 4,396 | Bank of America N.A. | 12/19/14 | 1 | ||||||||||||
USD* | 34 | JPY | 3,644 | Bank of America N.A. | 12/19/14 | 2 | ||||||||||||
USD* | 34 | JPY | 3,626 | Bank of America N.A. | 12/19/14 | 2 | ||||||||||||
USD* | 29 | JPY | 3,109 | Bank of America N.A. | 12/19/14 | 1 | ||||||||||||
USD* | 18 | JPY | 1,976 | Bank of America N.A. | 12/19/14 | 1 | ||||||||||||
USD* | 18 | JPY | 1,978 | Bank of America N.A. | 12/19/14 | 1 | ||||||||||||
USD* | 13 | JPY | 1,362 | Bank of America N.A. | 12/19/14 | 1 | ||||||||||||
USD* | 13 | JPY | 1,377 | Bank of America N.A. | 12/19/14 | — (a) | ||||||||||||
USD* | 11 | JPY | 1,195 | Bank of America N.A. | 12/19/14 | — (a) | ||||||||||||
USD* | 10 | JPY | 1,131 | Bank of America N.A. | 12/19/14 | — (a) | ||||||||||||
USD* | 9 | JPY | 1,009 | Bank of America N.A. | 12/19/14 | — (a) | ||||||||||||
USD* | 2 | JPY | 187 | Bank of America N.A. | 12/19/14 | — (a) | ||||||||||||
USD* | 73 | MXN | 989 | Bank of America N.A. | 12/19/14 | — (a) | ||||||||||||
USD* | 68 | MXN | 918 | Bank of America N.A. | 12/19/14 | — (a) | ||||||||||||
USD* | 62 | MXN | 847 | Bank of America N.A. | 12/19/14 | — (a) | ||||||||||||
USD* | 58 | MXN | 784 | Bank of America N.A. | 12/19/14 | — (a) | ||||||||||||
USD* | 55 | MXN | 734 | Bank of America N.A. | 12/19/14 | — (a) | ||||||||||||
USD* | 50 | MXN | 668 | Bank of America N.A. | 12/19/14 | — (a) | ||||||||||||
USD* | 19 | MXN | 250 | Bank of America N.A. | 12/19/14 | — (a) | ||||||||||||
USD* | 5 | MXN | 72 | Bank of America N.A. | 12/19/14 | — (a) | ||||||||||||
USD* | 5 | MXN | 61 | Bank of America N.A. | 12/19/14 | — (a) | ||||||||||||
USD* | 2 | MXN | 28 | Bank of America N.A. | 12/19/14 | — (a) | ||||||||||||
USD* | — | (a) | MXN | 3 | Bank of America N.A. | 12/19/14 | — (a) | |||||||||||
USD* | — | (a) | MXN | — | (a) | Bank of America N.A. | 12/19/14 | — (a) | ||||||||||
USD* | 205 | NZD | 252 | Bank of America N.A. | 12/19/14 | 9 | ||||||||||||
USD* | 72 | NZD | 91 | Bank of America N.A. | 12/19/14 | 1 | ||||||||||||
USD* | 25 | NZD | 32 | Bank of America N.A. | 12/19/14 | 1 | ||||||||||||
USD* | 23 | NZD | 30 | Bank of America N.A. | 12/19/14 | — (a) | ||||||||||||
USD* | 16 | NZD | 20 | Bank of America N.A. | 12/19/14 | 1 | ||||||||||||
USD* | 16 | NZD | 21 | Bank of America N.A. | 12/19/14 | — (a) | ||||||||||||
USD* | 13 | NZD | 16 | Bank of America N.A. | 12/19/14 | — (a) | ||||||||||||
USD* | 13 | NZD | 16 | Bank of America N.A. | 12/19/14 | — (a) | ||||||||||||
USD* | 12 | NZD | 15 | Bank of America N.A. | 12/19/14 | — (a) | ||||||||||||
See Notes to Financial Statements.
48
Table of Contents
VIRTUS ALTERNATIVE TOTAL SOLUTION FUND
CONSOLIDATED SCHEDULE OF INVESTMENTS AND SECURITIES SOLD SHORT (Continued)
OCTOBER 31, 2014
($ reported in thousands)
| Forward foreign currency exchange contracts as of October 31, 2014 were as follows: (continued) | ||||||||||||||||||||
Currency Purchased | Value | Currency Sold | Value | Counterparty | Settlement Date |
Unrealized Appreciation (Depreciation) | ||||||||||||||
USD* | 11 | NZD | 14 | Bank of America N.A. | 12/19/14 | $ — (a) | ||||||||||||||
USD* | 6 | NZD | 8 | Bank of America N.A. | 12/19/14 | — (a) | ||||||||||||||
USD* | 4 | NZD | 5 | Bank of America N.A. | 12/19/14 | — (a) | ||||||||||||||
USD* | 1 | NZD | 2 | Bank of America N.A. | 12/19/14 | — (a) | ||||||||||||||
USD* | 1 | NZD | 2 | Bank of America N.A. | 12/19/14 | — (a) | ||||||||||||||
USD* | 1 | NZD | 1 | Bank of America N.A. | 12/19/14 | — (a) | ||||||||||||||
USD* | 1 | NZD | 1 | Bank of America N.A. | 12/19/14 | — (a) | ||||||||||||||
USD* | 1 | NZD | 1 | Bank of America N.A. | 12/19/14 | — (a) | ||||||||||||||
USD* | —(a) | NZD | —(a) | Bank of America N.A. | 12/19/14 | — (a) | ||||||||||||||
USD* | —(a) | NZD | —(a) | Bank of America N.A. | 12/19/14 | — (a) | ||||||||||||||
USD | 135 | EUR | 105 | JPMorgan Chase Bank N.A. | 1/02/15 | 3 | ||||||||||||||
USD | 73 | EUR | 58 | JPMorgan Chase Bank N.A. | 1/02/15 | 1 | ||||||||||||||
USD | 69 | EUR | 54 | JPMorgan Chase Bank N.A. | 1/02/15 | 1 | ||||||||||||||
USD | 68 | EUR | 54 | JPMorgan Chase Bank N.A. | 1/02/15 | — (a) | ||||||||||||||
USD | 110 | EUR | 86 | JPMorgan Chase Bank N.A. | 1/23/15 | 2 | ||||||||||||||
USD | 36 | EUR | 28 | JPMorgan Chase Bank N.A. | 1/23/15 | 1 | ||||||||||||||
USD | 27 | EUR | 21 | JPMorgan Chase Bank N.A. | 1/23/15 | — (a) | ||||||||||||||
Total | $ 124 | |||||||||||||||||||
Footnote Legend:
| (a) | Amount is less than $500. |
| * | Non deliverable forward. See Note 3B in the Notes to Financial Statements. |
Over-the-counter total return swap outstanding as of October 31, 2014 was as follows:
| Reference Entity | Floating Rate | Counterparty | Expiration Date | Notional Amount | Market Value | Premiums Paid (Received) | Unrealized Appreciation (Depreciation) | |||||||||||||||||
Ingenico | Federal Funds Effective Rate Plus 0.60% (a) | Morgan Stanley | 4/25/16 | $64 | $ | USD | $ | —(b | ) | $ | — | $ | — | (b) | ||||||||||
Total | $ | —(b | ) | $ | — | $ | — | (b) | ||||||||||||||||
|
|
|
|
|
| |||||||||||||||||||
Footnote Legend:
(a)The Fund pays the floating rate and receives the total return of the reference entity.
(b)Amount is less than $500.
Over-the-counter total return basket swap(a) outstanding at October 31, 2014 was as follows:
Counterparty | Description | Notional | Termination Date | Value | ||||||
Morgan Stanley | The Fund pays the total return on a portfolio of short positions and receives the Federal Funds Effective Rate (+/- a spread), which is denominated in U.S. Dollars based on the local currencies of the positions within the swap. The portfolio consists of about 200 short positions in U.S. Equities and ADRs which are diversified across all sectors and have a market cap restricted to the top 700 positions in the Russell 3000. There are no embedded fees. | 5,652 | 4/28/16 | $ | (3 | ) | ||||
|
| |||||||||
Footnote Legend:
(a)Net payment made at reset date.
See Notes to Financial Statements.
49
Table of Contents
VIRTUS ALTERNATIVE TOTAL SOLUTION FUND
CONSOLIDATED SCHEDULE OF INVESTMENTS AND SECURITIES SOLD SHORT (Continued)
OCTOBER 31, 2014
($ reported in thousands)
The following table provides a summary of inputs used to value the Fund’s investments as of October 31, 2014 (See Security Valuation Note 2B in the Notes to Financial Statements):
| Total Value at October 31, 2014 | Level 1 Quoted Prices | Level 2 Significant Observable Inputs | Level 3 Significant Unobservable Inputs | |||||
Assets: | ||||||||
Debt Securities: | ||||||||
Foreign Government Securities | $ 1,220 | $ — | $ 984 | $ 236 | ||||
Municipal Bonds | 402 | — | 402 | — | ||||
Asset-Backed Securities | 325 | — | 325 | — | ||||
Corporate Bonds | 11,627 | — | 11,478 | 149 | ||||
Convertible Bonds | 7,328 | — | 7,261 | 67 | ||||
Loan Agreements | 5,145 | — | 5,145 | — | ||||
Equity Securities: | ||||||||
Preferred Stock | 929 | 186 | 743 | — | ||||
Common Stocks | 21,992 | 21,992 | — | — | ||||
Rights | —(a) | — (a) | — | — | ||||
Warrants | 29 | 29 | — | — | ||||
Exchange-Traded Funds | 82 | 82 | — | — | ||||
Master Limited Partnerships | 5,263 | 5,263 | — | — | ||||
Real Estate Investment Trusts | 4,041 | 4,041 | — | — | ||||
Short-Term Investments | 14,717 | 14,717 | — | — | ||||
Purchased Options | 10 | 10 | — (a) | — | ||||
Futures Contracts | 312 | 312 | — | — | ||||
Foreign currency exchange contracts | 236 | — | 236 | — | ||||
Over-the-Counter Total Return Swap | —(a) | — | — (a) | — | ||||
|
|
|
| |||||
Total Assets | 73,658 | 46,632 | 26,574 | 452 | ||||
|
|
|
| |||||
Liabilities: | ||||||||
Securities Sold Short | (8,331) | (7,838) | (493) | — | ||||
Written Options | (1) | (1) | — | — | ||||
Futures Contracts | (67) | (67) | — | — | ||||
Foreign currency exchange contracts | (112) | — | (112) | — | ||||
Over-the-Counter Total Return Basket Swap | (3) | — | (3) | — | ||||
|
|
|
| |||||
Total Liabilities | $(8,514) | $(7,906) | $ (608) | $ — | ||||
|
|
|
| |||||
Footnote Legend:
| (a) | Amount is less than $500. |
There were no transfers between levels for the period.
See Notes to Financial Statements.
50
Table of Contents
VIRTUS ALTERNATIVE TOTAL SOLUTION FUND
CONSOLIDATED SCHEDULE OF INVESTMENTS AND SECURITIES SOLD SHORT (Continued)
OCTOBER 31, 2014
($ reported in thousands)
The following is a reconciliation of assets of the Fund for Level 3 investments which significant unobservable inputs were used to determine fair value.
| Total | Foreign Government Securities | Corporate Bonds | Convertible Bonds | |||||||||||||
Investments in Securities | ||||||||||||||||
Balance as of April 23, 2014(a) | ||||||||||||||||
Accrued discount/(premium) | $ — (b) | $ — | $ — | $ — (b) | ||||||||||||
Realized gain (loss) | — | — | — | — | ||||||||||||
Change in unrealized appreciation (depreciation)(c) | (36) | (12) | — (b) | (24) | ||||||||||||
Purchases | 489 | 248 | 150 | 91 | ||||||||||||
Sales | — | — | — | — | ||||||||||||
Transfers into Level 3(d) | — | — | — | — | ||||||||||||
Transfers from Level 3(d) | — | — | — | — | ||||||||||||
Paydowns | (1) | — | (1) | — | ||||||||||||
|
|
|
|
|
|
|
| |||||||||
Balance as of October 31, 2014 | $ 452 | $ 236 (e) | $ 149 (e) | $ 67 (e) | ||||||||||||
|
|
|
|
|
|
|
| |||||||||
Footnote Legend:
| (a) | Inception date. |
| (b) | Amount is less than $500. |
| (c) | Included in the related net change in unrealized appreciation (depreciation) in the Statement of Operations. The change in unrealized appreciation (depreciation) on investments still held as of October 31, 2014 was $(36). |
| (d) | “Transfers into and/or from” represent the ending value as of October 31, 2014, for any investment security where a change in the pricing level occurred from the beginning to the end of the period. |
| (e) | The Fund’s investments that are categorized as Level 3 were valued utilizing third party pricing information without adjustment. Such valuations are based on unobservable inputs. A significant change in third party information inputs could result in a significantly lower or higher value of such Level 3 investments. |
See Notes to Financial Statements.
51
Table of Contents
SCHEDULE OF INVESTMENTS
OCTOBER 31, 2014
($ are reported in thousands)
| PAR VALUE | VALUE | |||||||||
| U.S. GOVERNMENT SECURITIES—18.8% | ||||||||||
| Non-Agency—18.8% | ||||||||||
United States Treasury Notes | $ | 4,000 | $4,006 | |||||||
0.625%, 8/31/17
|
| 700
|
|
| 694
|
| ||||
| ||||||||||
| TOTAL U.S. GOVERNMENT SECURITIES | ||||||||||
| (Identified Cost $4,690) | 4,700 | |||||||||
| ||||||||||
| FOREIGN GOVERNMENT SECURITIES—3.3% | ||||||||||
Croatia Government International Bond 144A | 200 | 221 | ||||||||
El Salvador Government International Bond 144A | 125 | 129 | ||||||||
Kazakhstan Government International Bond 144A | 200 | 193 | ||||||||
Sri Lanka Government International Bond 144A | 200 | 212 | ||||||||
Venezuela Government International Bond
|
| 120
|
|
| 73
|
| ||||
| ||||||||||
| TOTAL FOREIGN GOVERNMENT SECURITIES | ||||||||||
| (Identified Cost $825) | 828 | |||||||||
| ||||||||||
| MORTGAGED-BACKED SECURITIES—7.9% | ||||||||||
| Non-Agency—7.9% | ||||||||||
Bear Stearns Commercial Mortgage Securities Trust 07-PW15, AM | 125 | 130 | ||||||||
CD Commercial Mortgage Trust 07-CD4, AMFX | 240 | 251 | ||||||||
Citigroup Mortgage Loan Trust, Inc. 03-UP3, A2 | 55 | 58 | ||||||||
| PAR VALUE | VALUE | |||||||||
| Non-Agency—continued | ||||||||||
Citigroup Mortgage Loan Trust, Inc. 04-UST1, A3 | $ | 20 | $ 20 | |||||||
Colony Multifamily | 250 | 250 | ||||||||
Credit Suisse Commercial Mortgage Trust 07-C5, A1AM | 300 | 309 | ||||||||
FNMA Connecticut Avenue Securities 14-C02, 2M2 | 250 | 225 | ||||||||
GSMPS Mortgage Loan Trust 06-RP1, 1A4 144A | 108 | 116 | ||||||||
GSR Mortgage Loan Trust 07-1F, 2A2 | 31 | 30 | ||||||||
Hilton USA Trust 13-HLT, EFX 144A | 250 | 255 | ||||||||
Morgan Stanley Capital I Trust 07-IQ14, AM | 300 | 313 | ||||||||
Structured Asset Securities Corp. Mortgage Pass-Through Certificates 03-34A, 6A
|
| 13
|
|
| 12
|
| ||||
| ||||||||||
| TOTAL MORTGAGED-BACKED SECURITIES | ||||||||||
| (Identified Cost $1,981) | 1,969 | |||||||||
| ||||||||||
| ASSET-BACKED SECURITIES—7.6% | ||||||||||
American Homes 4 Rent 14-SFR2, C 144A | 280 | 281 | ||||||||
Carnow Auto Receivables Trust 14-1A, D 144A | 250 | 250 | ||||||||
CKE Restaurant Holdings, Inc. 13-1A, A2 144A | 367 | 373 | ||||||||
| PAR VALUE | VALUE | |||||||
| ASSET-BACKED SECURITIES—continued | ||||||||
Domino’s Pizza Master Issuer LLC 12-1A, A2 144A | $ | 290 | $ 306 | |||||
Exeter Automobile Receivables Trust 14-3A, D 144A | 125 | 125 | ||||||
Foursight Capital Automobile Receivables Trust 14-1, B 144A | 250 | 252 | ||||||
New Century Home Equity Loan Trust 05-A, A4W | 44 | 46 | ||||||
Santander Drive Auto Receivables Trust 14-4, D
|
| 250
|
|
| 252
|
| ||
| ||||||||
| TOTAL ASSET-BACKED SECURITIES | ||||||||
| (Identified Cost $1,878) | 1,885 | |||||||
| ||||||||
| CORPORATE BONDS—47.6% | ||||||||
| Consumer Discretionary—7.1% | ||||||||
Boyd Gaming Corp. | 135 | 146 | ||||||
CCOH Safari LLC | 150 | 151 | ||||||
Cequel Communications Holdings I LLC / Cequel Capital Corp. 144A | 105 | 103 | ||||||
5.125%, 12/15/21(3) | 45 | 44 | ||||||
Clear Channel Worldwide Holdings, Inc. | 145 | 155 | ||||||
Cumulus Media Holdings, Inc. | 155 | 160 | ||||||
Isle of Capri Casinos, Inc. | 140 | 144 | ||||||
JC Penney Corp., Inc. | 35 | 34 | ||||||
Landry’s, Inc. 144A | 175 | 188 | ||||||
Meritor, Inc. | 125 | 133 | ||||||
MPG Holdco I, Inc. 144A | 20 | 21 | ||||||
See Notes to Financial Statements.
52
Table of Contents
VIRTUS STRATEGIC INCOME FUND
SCHEDULE OF INVESTMENTS (Continued)
OCTOBER 31, 2014
($ are reported in thousands)
| PAR VALUE | VALUE | |||||||
| Consumer Discretionary—continued | ||||||||
Pinnacle Entertainment, Inc. | $ | 150 | $ 161 | |||||
Sinclair Television Group, Inc. | 135 | 136 | ||||||
Station Casinos LLC | 150 | 158 | ||||||
Taylor Morrison Communities, Inc. / Monarch Communities, Inc. 144A | 30 | 30 | ||||||
|
| |||||||
| 1,764 | ||||||||
|
| |||||||
| Consumer Staples—0.2% | ||||||||
WhiteWave Foods Co. (The) | 40 | 42 | ||||||
|
| |||||||
| Energy—8.4% | ||||||||
BreitBurn Energy Partners LP / BreitBurn Finance Corp. | 130 | 125 | ||||||
California Resources Corp. 144A | 45 | 46 | ||||||
6.000%, 11/15/24(3) | 75 | 77 | ||||||
Carrizo Oil & Gas, Inc. | 60 | 61 | ||||||
Carrizo Oil & Gas, Inc. 144A | 100 | 101 | ||||||
Endeavor Energy Resources LP / EER Finance, Inc. 144A | 49 | 50 | ||||||
Freeport-McMoran Oil & Gas LLC / FCX Oil & Gas, Inc. | 110 | 124 | ||||||
Gulfport Energy Corp. 144A | 140 | 144 | ||||||
Halcon Resources Corp. | 155 | 128 | ||||||
Laredo Petroleum, Inc. | 70 | 73 | ||||||
| PAR VALUE | VALUE | |||||||
| Energy—continued | ||||||||
Memorial Production Partners LP / Memorial Production Finance Corp. | $ | 150 | $ 146 | |||||
NGL Energy Partners LP / NGL Energy Finance Corp. 144A 5.125%, 7/15/19(3) | 20 | 20 | ||||||
Odebrecht Offshore Drilling Finance Ltd. 144A | 200 | 210 | ||||||
Pacific Rubiales Energy Corp. 144A | 155 | 156 | ||||||
Petroleos de Venezuela SA 144A | 220 | 113 | ||||||
Petroleos Mexicanos 144A | 100 | 101 | ||||||
5.500%, 6/27/44(3) | 100 | 104 | ||||||
QGOG Constellation SA 144A | 200 | 198 | ||||||
Transocean, Inc. | 135 | 122 | ||||||
|
| |||||||
| 2,099 | ||||||||
|
| |||||||
| Financials—10.8% | ||||||||
Aircastle, Ltd. | 155 | 157 | ||||||
Allstate Corp. (The) | 115 | 122 | ||||||
Ashtead Capital, Inc. 144A | 200 | 209 | ||||||
Avis Budget Car Rental LLC / Avis Budget Finance, Inc. | 145 | 147 | ||||||
Banco Bradesco SA/Cayman Islands 144A | 115 | 122 | ||||||
Banco Internacional del Peru SAA 144A | 115 | 124 | ||||||
Bank of America Corp. | 60 | 60 | ||||||
Corpbanca SA 144A | 200 | 202 | ||||||
| PAR VALUE | VALUE | |||||||
| Financials—continued | ||||||||
First Niagara Financial Group, Inc. | $ | 130 | $ 149 | |||||
General Motors Financial Co., Inc. | 120 | 129 | ||||||
Hospitality Properties Trust | 125 | 124 | ||||||
ICICI Bank Ltd/Dubai 144A | 200 | 212 | ||||||
Nationstar Mortgage LLC / Nationstar Capital Corp. | 155 | 145 | ||||||
Nordea Bank AB 144A | 200 | 208 | ||||||
PennantPark Investment Corp. | 130 | 131 | ||||||
PKO Finance AB (PKO Bank PL) 144A | 200 | 210 | ||||||
Sabra Health Care LP / Sabra Capital Corp. | 40 | 42 | ||||||
TIAA Asset Management Finance Co. LLC 144A | 110 | 111 | ||||||
York Risk Services Holding Corp. 144A | 80 | 82 | ||||||
|
| |||||||
| 2,686 | ||||||||
|
| |||||||
| Health Care—1.6% | ||||||||
HCA, Inc. | 55 | 61 | ||||||
7.500%, 2/15/22 | 85 | 99 | ||||||
Owens & Minor, Inc. | 20 | 20 | ||||||
Tenet Healthcare Corp. | 75 | 77 | ||||||
8.125%, 4/1/22 | 65 | 75 | ||||||
Tenet Healthcare Corp. 144A | 75 | 77 | ||||||
|
| |||||||
| 409 | ||||||||
|
| |||||||
| Industrials—6.2% | ||||||||
AECOM Technology Corp. 144A | 60 | 63 | ||||||
See Notes to Financial Statements.
53
Table of Contents
VIRTUS STRATEGIC INCOME FUND
SCHEDULE OF INVESTMENTS (Continued)
OCTOBER 31, 2014
($ are reported in thousands)
| PAR VALUE | VALUE | |||||||
| Industrials—continued | ||||||||
Ahern Rentals, Inc. 144A | $ | 135 | $ 145 | |||||
Air Canada 144A | 140 | 148 | ||||||
Air Canada Pass-Through-Trust 13-1, B 144A | 154 | 156 | ||||||
American Airlines Pass Through Trust 14-1, B | 250 | 254 | ||||||
Anna Merger Sub, Inc. 144A | 125 | 129 | ||||||
Bombardier, Inc. 144A | 150 | 155 | ||||||
Builders FirstSource, Inc. 144A | 70 | 73 | ||||||
Building Materials Corp. of America 144A | 60 | 60 | ||||||
Masco Corp. | 135 | 148 | ||||||
Rexel SA 144A | 200 | 202 | ||||||
|
| |||||||
| 1,533 | ||||||||
|
| |||||||
| Information Technology—2.0% | ||||||||
Avaya, Inc. 144A | 150 | 148 | ||||||
First Data Corp. | 160 | 189 | ||||||
First Data Corp. 144A | 115 | 125 | ||||||
First Data Holdings, Inc. PIK 144A | 35 | 37 | ||||||
|
| |||||||
| 499 | ||||||||
|
| |||||||
| Materials—7.3% | ||||||||
Alpek SAB de CV 144A | 200 | 212 | ||||||
Beverage Packaging Holdings Luxembourg II SA / Beverage Packaging Holdings II 144A | 150 | 150 | ||||||
Cemex SAB de CV 144A | 200 | 216 | ||||||
| PAR VALUE | VALUE | |||||||
| Materials—continued | ||||||||
FMG Resources August 2006 Property Ltd. 144A | $ | 140 | $ 146 | |||||
Gerdau Trade, Inc. 144A | 150 | 160 | ||||||
Samarco Mineracao SA 144A | 200 | 200 | ||||||
Sappi Papier Holding GmbH 144A | 200 | 209 | ||||||
Tronox Finance LLC | 55 | 57 | ||||||
United States Steel Corp. | 115 | 125 | ||||||
Vale Overseas Ltd. | 140 | 142 | ||||||
Vedanta Resources PLC 144A | 200 | 205 | ||||||
|
| |||||||
| 1,822 | ||||||||
|
| |||||||
| Telecommunication Services—3.1% | ||||||||
CenturyLink, Inc. | 145 | 154 | ||||||
Level 3 Financing, Inc. | 145 | 156 | ||||||
Sprint Communications, Inc. | 175 | 175 | ||||||
T-Mobile USA, Inc. | 120 | 125 | ||||||
Windstream Corp. | 150 | 160 | ||||||
|
| |||||||
| 770 | ||||||||
|
| |||||||
| Utilities—0.9% | ||||||||
AmeriGas Finance LLC / AmeriGas Finance Corp. 7.000%, 5/20/22 | 135 | 147 | ||||||
Dynegy Finance I, Inc. / Dynegy Finance II, Inc. 144A | 55 | 58 | ||||||
7.625%, 11/1/24(3) | 30 | 32 | ||||||
|
| |||||||
| 237 | ||||||||
| ||||||||
TOTAL CORPORATE BONDS (Identified Cost $11,864) |
| 11,861 | ||||||
| ||||||||
| PAR VALUE | VALUE | |||||||
| LOAN AGREEMENTS—14.0% | ||||||||
| Consumer Discretionary—4.5% | ||||||||
Aristocrat Leisure Ltd. | $ | 125 | $ 124 | |||||
BBB Industries US Holdings, Inc., First Lien | 42 | 41 | ||||||
Caesars Entertainment Operating Company, Inc. (fka Harrah’s Operating Company, Inc.), Term Loan B-7 | 160 | 148 | ||||||
Caesars Entertainment Resort Properties LLC, Term Loan B | 65 | 62 | ||||||
CBAC Borrower LLC, Term Loan B | 145 | 147 | ||||||
Clear Channel Communications, Inc. Tranche D, | 155 | 147 | ||||||
Inventiv Health, Inc. (fka Ventive Health, Inc), Term Loan B-4 | 155 | 154 | ||||||
Shingle Springs Tribal Gaming Authority | 149 | 151 | ||||||
TWCC Holding Corp., Second Lien | 150 | 147 | ||||||
|
| |||||||
| 1,121 | ||||||||
|
| |||||||
| Consumer Staples—0.4% | ||||||||
Albertson’s LLC, Term Loan B-4-1 | 101 | 101 | ||||||
|
| |||||||
Energy—1.7% | ||||||||
Fieldwood Energy LLC, Second Lien | 145 | 140 | ||||||
Jonah Energy LLC, Second Lien | 155 | 150 | ||||||
Templar Energy LLC, Second Lien | 155 | 141 | ||||||
|
| |||||||
| 431 | ||||||||
|
| |||||||
See Notes to Financial Statements.
54
Table of Contents
VIRTUS STRATEGIC INCOME FUND
SCHEDULE OF INVESTMENTS (Continued)
OCTOBER 31, 2014
($ are reported in thousands)
| PAR | ||||||||
| VALUE | VALUE | |||||||
| Financials—1.9% | ||||||||
Asurion LLC (fka Asurion Corp.) | $ | 150 | $ 153 | |||||
Capital Automotive LP, Second Lien | 40 | 40 | ||||||
Drillships Financing Holding, Inc. (Ocean Rig), Tranche B-1 0.000%, 3/31/21(7) | 125 | 120 | ||||||
Walter Investment Management Corp., Tranche B | 160 | 151 | ||||||
|
| |||||||
| 464 | ||||||||
|
| |||||||
| Industrials—1.4% | ||||||||
CHG Healthcare Services, Inc. (fka CHG Buyer Corp.), Second Lien | 141 | 143 | ||||||
DynCorp International, Inc. | 92 | 92 | ||||||
Sedgwick Claims Management Services, Inc. | 125 | 122 | ||||||
|
| |||||||
| 357 | ||||||||
|
| |||||||
Information Technology—3.0% |
| |||||||
Applied Systems, Inc., Second Lien | 61 | 61 | ||||||
Blue Coat Systems, Inc., Second Lien | 150 | 150 | ||||||
Evergreen Skills Lux S.À R.L., First Lien | 66 | 65 | ||||||
Kronos, Inc., Second Lien | 150 | 154 | ||||||
Mitchell International, Inc., Second Lien 8.500%, 10/11/21 | 150 | 150 | ||||||
Wall Street Systems Delaware, Inc. | 160 | 159 | ||||||
|
| |||||||
| 739 | ||||||||
|
| |||||||
| PAR | ||||||||
| VALUE | VALUE | |||||||
| Materials—0.5% | ||||||||
Noranda Aluminum Acquisition Corp., Term Loan B 5.750%, 2/28/19 | $ | 130 | $ 127 | |||||
|
| |||||||
| Telecommunication Services—0.6% | ||||||||
Global Tel*Link Corp., Second Lien | 160 | 159 | ||||||
| ||||||||
TOTAL LOAN AGREEMENTS (Identified Cost $3,556) |
| 3,499 | ||||||
| ||||||||
SHARES | ||||||||
| PREFERRED STOCK—1.0% | ||||||||
| Financials—1.0% | ||||||||
Citigroup, Inc. | 125 | (8) | 126 | |||||
JPMorgan Chase & Co. | 130 | (8) | 123 | |||||
|
| |||||||
| 249 | ||||||||
| ||||||||
TOTAL PREFERRED STOCK (Identified Cost $251) |
| 249 | ||||||
| ||||||||
CONTRACTS | ||||||||
| PURCHASED OPTIONS—0.1% | ||||||||
| Call Options—0.0% | ||||||||
S&P 500 Index Expiring 11/07/14 Strike Price $2,110 | 82 | 3 | ||||||
S&P 500 Index Expiring 11/14/14 Strike Price $2,135 | 99 | 3 | ||||||
|
| |||||||
| 6 | ||||||||
|
| |||||||
| Put Options—0.1% | ||||||||
S&P 500 Index Expiring 11/07/14 Strike Price $1,800 | 82 | 1 | ||||||
S&P 500 Index Expiring 11/14/14 Strike Price $1,885 | 99 | 14 | ||||||
|
| |||||||
| 15 | ||||||||
| ||||||||
TOTAL PURCHASED OPTIONS (Identified Cost $32) |
| 21 | ||||||
| ||||||||
TOTAL LONG TERM INVESTMENTS — 100.3% |
| |||||||
| (Identified Cost $25,077) | 25,012 | |||||||
| ||||||||
| SHARES | VALUE | |||||||
| SHORT-TERM INVESTMENTS—5.7% | ||||||||
| Money Market Mutual Funds—5.7% | ||||||||
BlackRock Liquidity Funds TempFund Portfolio - Institutional Shares (Seven-day effective yield 0.030%) | 1,433,321 | $ 1,433 | ||||||
| ||||||||
TOTAL SHORT-TERM INVESTMENTS (Identified Cost $1,433) |
| 1,433 | ||||||
| ||||||||
TOTAL INVESTMENTS, BEFORE WRITTEN |
| |||||||
| (Identified Cost $26,510) | 26,445 | (1) | ||||||
| ||||||||
CONTRACTS | ||||||||
| WRITTEN OPTIONS—(0.2)% | ||||||||
| Call Options—(0.1)% | ||||||||
S&P 500 Index | (82 | ) | (19) | |||||
S&P 500 Index | (99 | ) | (9) | |||||
|
| |||||||
| (28) | ||||||||
|
| |||||||
Put Options—(0.1)% | ||||||||
S&P 500 Index | (82 | ) | (2) | |||||
S&P 500 Index | (99 | ) | (32) | |||||
|
| |||||||
| (34) | ||||||||
| ||||||||
TOTAL WRITTEN OPTIONS (Proceeds $78) |
| (62) | (1) | |||||
| ||||||||
TOTAL INVESTMENTS NET OF WRITTEN |
| |||||||
(Identified Cost $26,432) |
| 26,383 | ||||||
Other assets and liabilities, net — (5.8)% |
| (1,443) | ||||||
|
| |||||||
| NET ASSETS — 100.0% | $24,940 | |||||||
|
| |||||||
Footnote Legend:
| (1) | Federal Income Tax Information: For tax information at October 31, 2014, see Note 10 Federal Income Tax Information in the Notes to Financial Statements. |
| (2) | All or a portion segregated as collateral for written options and over-the-counter credit default swaps. |
| (3) | Security exempt from registration under Rule 144A of the Securities Act of 1933. These securities may be resold in transactions exempt from registration, normally to qualified institutional buyers. At October 31, |
See Notes to Financial Statements.
55
Table of Contents
VIRTUS STRATEGIC INCOME FUND
SCHEDULE OF INVESTMENTS (Continued)
OCTOBER 31, 2014
($ are reported in thousands)
2014, these securities amounted to a value of $9,005 or 36.1% of net assets.
(4) Variable or step coupon security; interest rate shown reflects the rate in effect at October 31, 2014.
(5) This note was issued for the sole purpose of funding a loan agreement between the issuer and the borrower. As the credit risk for this security lies solely with the borrower, the name represented here is that of the borrower.
(6) 100% of the income received was in cash.
(7) This loan will settle after October 31, 2014, at which time the interest rate, based on the London Interbank Offered Rate (“LIBOR”) and the agreed upon spread on trade date, will be known.
(8) Amount shown is par value. |
| Abbreviations: | ||
LLC LP PIK PLC S&P ICE | Limited Liability Company Limited Partnership Payment in Kind Public Limited Company Standard & Poor’s Intercontinental Exchange | |
| Foreign Currencies: | ||
| USD | United States Dollar
| |
| Country Weightings (Unaudited)† | ||||
United States | 79 | % | ||
Brazil | 3 | |||
Mexico | 2 | |||
Canada | 2 | |||
Sweden | 2 | |||
Cayman Islands | 1 | |||
Australia | 1 | |||
Other | 10 | |||
Total | 100 | % | ||
| †% of total investments, net of securities sold short, as of October 31, 2014 | ||||
Over-the-counter credit default swaps- sell protection(1) outstanding as of October 31, 2014 were as follows:
| Reference Entity | Counterparty | Fixed Receive Rate | Expiration Date | Notional Amount(2) | Market Value | Premiums (Received) | Unrealized Appreciation (Depreciation) | |||||||||||||
iHeartCommunications, Inc. | JPMorgan Chase Bank N.A. | 5% | 12/20/16 | 100 | USD | $ (8 | ) | $ (10 | ) | $ 2 | ||||||||||
Total | $ (8 | ) | $ (10 | ) | $ 2 | |||||||||||||||
Centrally cleared credit default swaps- sell protection(1) outstanding as of October 31, 2014 were as follows: | ||||||||||||||||||||
| Reference Entity | Clearinghouse | Fixed Receive Rate | Expiration Date | Notional Amount(2) | Market Value(3) | Premiums Paid | Unrealized Appreciation (Depreciation) | |||||||||||||
CDX North America | ||||||||||||||||||||
High-Yield Index | ICE | 5% | 12/20/19 | 1,500 | USD | $114 | $ 85 | $ 29 | ||||||||||||
Total | $114 | $ 85 | $ 29 | |||||||||||||||||
| (1) | If the Fund is a seller of protection and a credit event occurs, as defined under the terms of that particular swap agreement, the Fund will either (i) pay to the buyer of protection an amount equal to the notional amount of the swap and take delivery of the referenced obligation or underlying investments comprising the referenced index or (ii) pay a net settlement amount in the form of cash or investments equal to the notional amount of the swap less the recovery value of the referenced obligation or underlying investments comprising the referenced index. |
| (2) | The maximum potential amount the Fund could be required to pay as a seller of credit protection or receive as a buyer of credit protection if a credit event occurs as defined under the terms of that particular swap agreement. |
| (3) | The quoted market prices and resulting values for credit default swap agreements on credit indices serve as an indicator of the current status of the payment/ performance risk and represents the likelihood of an expected liability (or profit) for the credit derivative had the notional amount of the swap agreement been closed/sold as of period end. Increasing values, in absolute terms when compared to the notional amount of the swap, represent a deterioration of the referenced entity’s credit soundness and a greater likelihood of risk of default or other credit event occurring as defined under the terms of the agreement. |
See Notes to Financial Statements.
56
Table of Contents
VIRTUS STRATEGIC INCOME FUND
SCHEDULE OF INVESTMENTS (Concluded)
OCTOBER 31, 2014
($ are reported in thousands)
The table that follows shows the undiscounted maximum potential payment by the Fund related to selling credit protection in credit default swaps:
Type of Reference Asset of which the Fund Sold Protection | Total Maximum for Selling Credit Protection | Amount Recoverable* | Reference Asset Rating Range** | |||||||||||||
Markit CDX North America High-Yield Index | $1,500 | $ — | BB,B | |||||||||||||
iHeartCommunications, Inc. 2 Year CDS | 100 | — | CCC+ | |||||||||||||
| * | The Fund has no amounts recoverable from related purchased protection. In addition, the Fund has no recourse provisions under the credit derivatives and holds collateral which can offset or reduce potential payments under a triggering event. |
| ** | The period end reference asset security ratings, as rated by any rating organization, are included in the equivalent Standard & Poor’s rating category. The reference asset rating represents the likelihood of a potential credit event on the reference asset which would result in a related payment by the Fund. |
The following table provides a summary of inputs used to value the Fund’s investments as of October 31, 2014 (See Security Valuation Note 2B in the Notes to Financial Statements):
| Total Value at October 31, 2014 | Level 1 Quoted Prices | Level 2 Significant Observable Inputs | Level 3 Significant Unobservable Inputs | |||||||||||||
Assets: | ||||||||||||||||
Debt Securities: | ||||||||||||||||
U.S. Government Securities | $ 4,700 | $ — | $ 4,700 | $ — | ||||||||||||
Foreign Government Securities | 828 | — | 828 | — | ||||||||||||
Mortgaged-Backed Securities | 1,969 | — | 1,969 | |||||||||||||
Asset-Backed Securities | 1,885 | — | 1,885 | — | ||||||||||||
Corporate Bonds | 11,861 | — | 11,861 | — | ||||||||||||
Loan Agreements | 3,499 | — | 3,499 | — | ||||||||||||
Equity Securities: | ||||||||||||||||
Preferred Stock | 249 | — | 249 | — | ||||||||||||
Purchased Options | 21 | 21 | — | — | ||||||||||||
Short-Term Investments | 1,433 | 1,433 | — | — | ||||||||||||
Credit Default Swaps | 114 | — | 114 | — | ||||||||||||
|
|
|
|
|
|
|
| |||||||||
Total Assets | 26,559 | 1,454 | 25,105 | — | ||||||||||||
|
|
|
|
|
|
|
| |||||||||
Liabilities: | ||||||||||||||||
Written Options | $ (62) | $ (62) | $ — | $ — | ||||||||||||
Credit Default Swaps | (8) | — | (8) | — | ||||||||||||
|
|
|
|
|
|
|
| |||||||||
Total Liabilities | $ (70) | $ (62) | $ (8) | $ — | ||||||||||||
|
|
|
|
|
|
|
| |||||||||
There are no level 3 (significant unobservable inputs) priced securities.
There were no transfers between levels for the period.
See Notes to Financial Statements.
57
Table of Contents
VIRTUS ALTERNATIVE SOLUTIONS TRUST
STATEMENTS OF ASSETS AND LIABILITIES
October 31, 2014
(Reported in thousands except shares and per share amounts)
| Virtus Alternative Income Solution Fund | Virtus Alternative Inflation Solution Fund | Virtus Alternative Total Solution Fund(1) | Virtus Strategic Income | |||||||||||||
| Assets | ||||||||||||||||
Investment in securities at value(2) | $ | 42,659 | $ | 33,147 | $ | 73,110 | $ | 26,445 | ||||||||
Foreign currency at value(3) | 7 | — | (a) | 7 | — | |||||||||||
Cash | 11 | — | 8 | 3 | ||||||||||||
Cash pledged for futures contracts | 64 | 269 | 665 | — | ||||||||||||
Cash pledged as collateral for swaps | — | — | 1,090 | — | ||||||||||||
Cash pledged as collateral for securities sold short | 9 | 10 | 37 | — | ||||||||||||
Deposits with prime broker | 1,951 | 2,055 | 5,746 | 20 | ||||||||||||
Variation margin receivable on futures contracts | 4 | 19 | 74 | — | ||||||||||||
Swaps at value(7) | — | — | — | 114 | ||||||||||||
Unrealized appreciation on forward foreign currency exchange contracts | 31 | — | (a) | 236 | — | |||||||||||
Receivables | ||||||||||||||||
Investment securities sold | 284 | 92 | 1,454 | 123 | ||||||||||||
Swaps premium receivable | — | — | — | 10 | ||||||||||||
Fund shares sold | 10 | 10 | 184 | — | ||||||||||||
Dividends and interest receivable | 396 | 137 | 368 | 211 | ||||||||||||
From adviser | — | — | — | 44 | ||||||||||||
Tax Reclaims | 2 | 2 | 2 | — | ||||||||||||
Prepaid expenses | 12 | 6 | 13 | 3 | ||||||||||||
|
|
|
|
|
|
|
| |||||||||
Total assets | 45,440 | 35,747 | 82,994 | 26,973 | ||||||||||||
|
|
|
|
|
|
|
| |||||||||
| Liabilities | ||||||||||||||||
Cash overdraft | — | 2 | — | — | ||||||||||||
Options written at value(4) | — | — | 1 | 62 | ||||||||||||
Securities sold short at value(5) | 2,090 | 2,204 | 8,331 | — | ||||||||||||
Dividends payable for securities sold short | — | — | 1 | — | ||||||||||||
Variation margin payable | — | — | — | 13 | ||||||||||||
Variation margin payable on futures contracts | — | — | 19 | — | ||||||||||||
Swaps at value (6) | — | — | 3 | 8 | ||||||||||||
Unrealized depreciation on forward foreign currency exchange contracts | 8 | — | 112 | — | ||||||||||||
Payables | ||||||||||||||||
Fund shares repurchased | — | 10 | 24 | — | ||||||||||||
Investment securities purchased | 567 | 412 | 1,720 | 1,905 | ||||||||||||
Swap reset payable | — | — | 133 | — | ||||||||||||
Dividend expense | — | — | 12 | — | ||||||||||||
Investment advisory fee | 69 | 59 | 95 | — | ||||||||||||
Distribution and service fees | — | (a) | — | (a) | 2 | — | (a) | |||||||||
Administration fee | 30 | 29 | 40 | 11 | ||||||||||||
Transfer agent fees and expenses | 1 | 1 | 2 | 1 | ||||||||||||
Trustees’ fees and expenses | 2 | 1 | 3 | 1 | ||||||||||||
Professional fees | 67 | 67 | 88 | 27 | ||||||||||||
Other accrued expenses | 26 | 17 | 47 | 5 | ||||||||||||
|
|
|
|
|
|
|
| |||||||||
Total liabilities | 2,860 | 2,802 | 10,633 | 2,033 | ||||||||||||
|
|
|
|
|
|
|
| |||||||||
| Net Assets | $ | 42,580 | $ | 32,945 | $ | 72,361 | $ | 24,940 | ||||||||
|
|
|
|
|
|
|
| |||||||||
| Net Assets Consist of: | ||||||||||||||||
Capital paid in on shares of beneficial interest | $ | 42,507 | $ | 32,554 | $ | 71,370 | $ | 25,072 | ||||||||
Accumulated undistributed net investment income (loss) | (8) | 50 | 159 | 27 | ||||||||||||
Accumulated undistributed net realized gain (loss) | 262 | (173) | 471 | (141) | ||||||||||||
Net unrealized appreciation (depreciation) on investments | (181) | 514 | 361 | (18) | ||||||||||||
|
|
|
|
|
|
|
| |||||||||
| Net Assets | $ | 42,580 | $ | 32,945 | $ | 72,361 | $ | 24,940 | ||||||||
|
|
|
|
|
|
|
| |||||||||
See Notes to Financial Statements
58
Table of Contents
VIRTUS ALTERNATIVE SOLUTIONS TRUST
STATEMENTS OF ASSETS AND LIABILITIES (Continued)
October 31, 2014
(Reported in thousands except shares and per share amounts)
| Virtus Alternative Income Solution Fund | Virtus Alternative Inflation Solution Fund | Virtus Alternative Total Solution Fund(1) | Virtus Strategic Income | |||||||||||||
Class A | ||||||||||||||||
Net asset value (net assets/shares outstanding) per share* | $ | 10.03 | $ | 10.11 | $ | 10.17 | $ | 9.95 | ||||||||
Maximum offering price per share NAV/(1-5.75%) (NAV/(1-3.75%) for Strategic Income) | $ | 10.64 | $ | 10.73 | $ | 10.64 | $ | 10.34 | ||||||||
Shares of beneficial interest outstanding, no par value, unlimited authorization | 74,470 | 49,430 | 701,878 | 11,970 | ||||||||||||
Net Assets | $ | 747 | $ | 500 | $ | 7,136 | $ | 119 | ||||||||
Class C | ||||||||||||||||
Net asset value (net assets/shares outstanding) and offering price per share* | $ | 10.01 | $ | 10.08 | $ | 10.13 | $ | 9.95 | ||||||||
Shares of beneficial interest outstanding, no par value, unlimited authorization | 38,679 | 15,060 | 130,800 | 10,007 | ||||||||||||
Net Assets | $ | 387 | $ | 152 | $ | 1,325 | $ | 100 | ||||||||
Class I | ||||||||||||||||
Net asset value (net assets/shares outstanding), offering price and redemption per share | $ | 10.03 | $ | 10.12 | $ | 10.18 | $ | 9.95 | ||||||||
Shares of beneficial interest outstanding, no par value, unlimited authorization | 4,131,678 | 3,189,699 | 6,277,352 | 2,485,233 | ||||||||||||
Net Assets | $ | 41,446 | $ | 32,293 | $ | 63,900 | $ | 24,721 | ||||||||
(1) Consolidated Statement of Assets and Liabilities | ||||||||||||||||
(2) Investment in unaffiliated securities at cost | $ | 42,755 | $ | 32,480 | $ | 72,651 | $ | 26,510 | ||||||||
(3) Foreign currency at cost | 7 | — | (a) | 7 | — | |||||||||||
(4) Proceeds from options written | — | — | (1 | ) | 78 | |||||||||||
(5) Proceeds from securities sold short | (2,003 | ) | (2,111 | ) | (8,063 | ) | — | |||||||||
(6) Includes premiums received on over-the-counter swaps | — | — | — | (10 | ) | |||||||||||
(7) Includes premiums paid on centrally cleared swaps | — | — | — | 85 | ||||||||||||
* Redemption price per share is equal to the Net Asset Value per share, less any applicable contingent deferred sales charges.
Footnote Legend:
| (a) | Amount is less than $500. |
See Notes to Financial Statements
59
Table of Contents
VIRTUS ALTERNATIVE SOLUTIONS TRUST
STATEMENTS OF OPERATIONS
For the Period Ended October 31, 2014
($ reported in thousands)
| Virtus Alternative Income Solution Fund(1) | Virtus Alternative Inflation Solution Fund(1) | Virtus Alternative Total Solution Fund(1)(2) | Virtus Strategic Income(3) | |||||||||||||
| Investment Income | ||||||||||||||||
Dividends | $ 214 | $ 169 | $ 211 | $ — | (4) | |||||||||||
Interest | 931 | 311 | 695 | 114 | ||||||||||||
Foreign taxes withheld | (12) | (10) | (7) | — | ||||||||||||
|
|
|
|
|
|
|
| |||||||||
Total investment income | 1,133 | 470 | 899 | 114 | ||||||||||||
|
|
|
|
|
|
|
| |||||||||
| Expenses | ||||||||||||||||
Investment advisory fees | 391 | 299 | 652 | 28 | ||||||||||||
Distribution and service fees, Class A | 1 | — | (4) | 3 | — | (4) | ||||||||||
Distribution and service fees, Class C | 1 | 1 | 2 | — | (4) | |||||||||||
Administration fees | 22 | 17 | 33 | 4 | ||||||||||||
Sub-administration Fees | 126 | 126 | 165 | 21 | ||||||||||||
Transfer agent fees and expenses | 9 | 7 | 15 | 2 | ||||||||||||
Registration fees | 33 | 31 | 36 | 7 | ||||||||||||
Printing fees and expenses | 8 | 6 | 12 | 2 | ||||||||||||
Custodian fees | 9 | 5 | 16 | — | (4) | |||||||||||
Professional fees | 84 | 81 | 109 | 41 | ||||||||||||
Trustee’s fees and expenses | 34 | 27 | 50 | 25 | ||||||||||||
Offering expenses | 5 | 5 | 5 | — | ||||||||||||
Miscellaneous expenses | 33 | 22 | 45 | 5 | ||||||||||||
|
|
|
|
|
|
|
| |||||||||
Total expenses | 756 | 627 | 1,143 | 135 | ||||||||||||
|
|
|
|
|
|
|
| |||||||||
Dividend expense on securities sold short | 49 | 52 | 130 | — | ||||||||||||
|
|
|
|
|
|
|
| |||||||||
Interest expense on securities sold short | — | — | 4 | — | ||||||||||||
|
|
|
|
|
|
|
| |||||||||
Total expenses, including dividend and interest expense on short sales | 805 | 679 | 1,277 | 135 | ||||||||||||
|
|
|
|
|
|
|
| |||||||||
Less expenses reimbursed and/or waived by investment adviser | (234) | (215) | (324) | (86) | ||||||||||||
Less expenses waived by sub-administrator | (42) | (44) | (37) | (9) | ||||||||||||
|
|
|
|
|
|
|
| |||||||||
Net expenses | 529 | 420 | 916 | 40 | ||||||||||||
|
|
|
|
|
|
|
| |||||||||
Net investment income (loss) | 604 | 50 | (17) | 74 | ||||||||||||
|
|
|
|
|
|
|
| |||||||||
| Net Realized and Unrealized Gain (Loss) on Investments | ||||||||||||||||
Net realized gain (loss) on investments | 315 | 69 | 496 | (167) | ||||||||||||
Net realized gain (loss) on foreign currency transactions | 3 | 1 | 6 | — | ||||||||||||
Net realized gain (loss) on futures | (2) | (242) | 205 | — | ||||||||||||
Net realized gain (loss) on options written | — | — | 72 | 34 | ||||||||||||
Net realized gain (loss) on swaps | — | — | (329) | (6) | ||||||||||||
Net change in unrealized appreciation (depreciation) on investments | (96) | 667 | 459 | (65) | ||||||||||||
Net change in unrealized appreciation (depreciation) on securities sold short | (87) | (93) | (268) | — | ||||||||||||
Net change in unrealized appreciation (depreciation) on foreign currency transactions | 28 | 5 | 126 | — | ||||||||||||
Net change in unrealized appreciation (depreciation) on futures | (26) | (65) | 245 | — | ||||||||||||
Net change in unrealized appreciation (depreciation) on options written | — | — | — | (4) | 16 | |||||||||||
Net change in unrealized appreciation (depreciation) on swaps | — | — | (3) | 31 | ||||||||||||
|
|
|
|
|
|
|
| |||||||||
| Net gain (loss) on investments | 135 | 342 | 1,009 | (157) | ||||||||||||
|
|
|
|
|
|
|
| |||||||||
Net increase (decrease) in net assets resulting from operations | $ 739 | $ 392 | $ 992 | $ (83 | ) | |||||||||||
|
|
|
|
|
|
|
| |||||||||
Footnote Legend:
| (1) | From inception date April 23, 2014. |
| (2) | Consolidated Statement of Operations. |
| (3) | From inception date September 8, 2014. |
| (4) | Amount is less than $500. |
See Notes to Financial Statements
60
Table of Contents
VIRTUS ALTERNATIVE SOLUTIONS TRUST
STATEMENTS OF CHANGES IN NET ASSETS
($ reported in thousands)
| Virtus Alternative Income Solution Fund | Virtus Alternative Inflation Solution Fund | Virtus Alternative Total Solution Fund(1) | Virtus Stategic Income Fund | |||||||||||||
| From Inception April 23, 2014 to October 31, 2014 | From Inception April 23, 2014 to October 31, 2014 | From Inception April 23, 2014 to October 31, 2014 | From Inception September 8, 2014 to October 31, 2014 | |||||||||||||
| INCREASE/(DECREASE) IN NET ASSETS | ||||||||||||||||
| From Operations | ||||||||||||||||
Net investment income (loss) | $604 | $50 | $(17) | $74 | ||||||||||||
Net realized gain (loss) | 316 | (172) | 450 | (139) | ||||||||||||
Net change in unrealized appreciation (depreciation) | (181) | 514 | 559 | (18) | ||||||||||||
|
|
|
|
|
|
|
| |||||||||
Increase (decrease) in net assets resulting from operations | 739 | 392 | 992 | (83) | ||||||||||||
|
|
|
|
|
|
|
| |||||||||
| From Distributions to Shareholders | ||||||||||||||||
Net investment income, Class A | (7) | — | — | — | (2) | |||||||||||
Net investment income, Class C | (3) | — | — | — | (2) | |||||||||||
Net investment income, Class I | (592) | — | — | (49) | ||||||||||||
Net realized short-term gains, Class A | (1) | — | — | — | ||||||||||||
Net realized short-term gains, Class C | — | (2) | — | — | — | |||||||||||
Net realized short-term gains, Class I | (62) | — | — | — | ||||||||||||
|
|
|
|
|
|
|
| |||||||||
Decrease in net assets from distributions to shareholders | (665) | — | — | (49) | ||||||||||||
|
|
|
|
|
|
|
| |||||||||
| From Share Transactions (See Note 6) | ||||||||||||||||
Change in net assets from share transactions, Class A | 759 | 503 | 7,142 | 120 | ||||||||||||
Change in net assets from share transactions, Class C | 392 | 151 | 1,328 | 100 | ||||||||||||
Change in net assets from share transactions, Class I | 41,355 | 31,899 | 62,899 | 24,852 | ||||||||||||
|
|
|
|
|
|
|
| |||||||||
Increase (decrease) in net assets from share transactions | 42,506 | 32,553 | 71,369 | 25,072 | ||||||||||||
|
|
|
|
|
|
|
| |||||||||
Net increase (decrease) in net assets | 42,580 | 32,945 | 72,361 | 24,940 | ||||||||||||
| Net Assets | ||||||||||||||||
Beginning of period | — | — | — | — | ||||||||||||
|
|
|
|
|
|
|
| |||||||||
End of period | $42,580 | $32,945 | $72,361 | $24,940 | ||||||||||||
|
|
|
|
|
|
|
| |||||||||
Accumulated undistributed net investment income (loss) at end of period | $(8 | ) | $50 | $159 | $27 | |||||||||||
Footnote Legend:
| (1) | Consolidated Statement of Changes in Net Assets. |
| (2) | Amount is less than $500. |
See Notes to Financial Statements
61
Table of Contents
VIRTUS ALTERNATIVE SOLUTIONS TRUST
FINANCIAL HIGHLIGHTS
SELECTED PER SHARE DATA AND RATIOS FOR A SHARE OUTSTANDING
THROUGHOUT EACH PERIOD
Net Asset Beginning | Net Investment Income (Loss)(1) | Net Unrealized | Total from Investment Operations | Dividends Net | Distributions Realized Gains | Total Distributions | Change in Net Asset Value | Net Asset Value, End of Period | Total Return(2) | Net (in | Ratio of and interest on expense waivers to Average Net | Ratio of and interest on expense waivers to Average Net | Ratio of Net Investment Income (Loss) to Average Net Assets | Portfolio Turnover Rate | |||||||||||||||||||||||||||||||||||||||||||||||||||||||||||||
Virtus Alternative Income Solution Fund | |||||||||||||||||||||||||||||||||||||||||||||||||||||||||||||||||||||||||||
Class A | |||||||||||||||||||||||||||||||||||||||||||||||||||||||||||||||||||||||||||
10/31/14(6) | $10.00 | $ 0.14 | $0.04 | $0.18 | $ (0.14 | ) | $ (0.01 | ) | $ (0.15 | ) | $0.03 | $10.03 | 1.82 | %(7) | $747 | 2.65 | %(8) | 3.76 | %(8) | 2.56 | %(8) | 49 | %(7) | ||||||||||||||||||||||||||||||||||||||||||||||||||||
Class C | |||||||||||||||||||||||||||||||||||||||||||||||||||||||||||||||||||||||||||
10/31/14(6) | 10.00 | 0.10 | 0.04 | 0.14 | (0.12 | ) | (0.01 | ) | (0.13 | ) | 0.01 | 10.01 | 1.38 | (7) | 387 | 3.40 | (8) | 4.39 | (8) | 1.81 | (8) | 49 | (7) | ||||||||||||||||||||||||||||||||||||||||||||||||||||
Class I | |||||||||||||||||||||||||||||||||||||||||||||||||||||||||||||||||||||||||||
10/31/14(6) | 10.00 | 0.15 | 0.04 | 0.19 | (0.14 | ) | (0.02 | ) | (0.16 | ) | 0.03 | 10.03 | 1.90 | (7) | 41,446 | 2.43 | (8) | 3.70 | (8) | 2.79 | (8) | 49 | (7) | ||||||||||||||||||||||||||||||||||||||||||||||||||||
Virtus Alternative Inflation Solution Fund | |||||||||||||||||||||||||||||||||||||||||||||||||||||||||||||||||||||||||||
Class A | |||||||||||||||||||||||||||||||||||||||||||||||||||||||||||||||||||||||||||
10/31/14(6) | $10.00 | $ — (9) | $0.11 | $0.11 | $ — | $ — | $ — | $0.11 | $10.11 | 1.10 | %(7) | $500 | 2.69 | %(8) | 4.03 | %(8) | 0.04 | %(8) | 31 | %(7) | |||||||||||||||||||||||||||||||||||||||||||||||||||||||
Class C | |||||||||||||||||||||||||||||||||||||||||||||||||||||||||||||||||||||||||||
10/31/14(6) | 10.00 | (0.04 | ) | 0.12 | 0.08 | — | — | — | 0.08 | 10.08 | 0.80 | (7) | 152 | 3.45 | (8) | 4.88 | (8) | (0.71 | )(8) | 31 | (7) | ||||||||||||||||||||||||||||||||||||||||||||||||||||||
Class I | |||||||||||||||||||||||||||||||||||||||||||||||||||||||||||||||||||||||||||
10/31/14(6) | 10.00 | 0.02 | 0.10 | 0.12 | — | — | — | 0.12 | 10.12 | 1.20 | (7) | 32,293 | 2.46 | (8) | 3.97 | (8) | 0.29 | (8) | 31 | (7) | |||||||||||||||||||||||||||||||||||||||||||||||||||||||
Virtus Alternative Total Solution Fund(10) | |||||||||||||||||||||||||||||||||||||||||||||||||||||||||||||||||||||||||||
Class A | |||||||||||||||||||||||||||||||||||||||||||||||||||||||||||||||||||||||||||
10/31/14(6) | $10.00 | $(0.02 | ) | $0.19 | $0.17 | $ — | $ — | $ — | $0.17 | $10.17 | 1.70 | %(7) | $7,136 | 3.02 | %(8) | 3.93 | %(8) | (0.30 | )%(8) | 195 | %(7) | ||||||||||||||||||||||||||||||||||||||||||||||||||||||
Class C | |||||||||||||||||||||||||||||||||||||||||||||||||||||||||||||||||||||||||||
10/31/14(6) | 10.00 | (0.06 | ) | 0.19 | 0.13 | — | — | — | 0.13 | 10.13 | 1.30 | (7) | 1,325 | 3.76 | (8) | 4.66 | (8) | (1.04 | )(8) | 195 | (7) | ||||||||||||||||||||||||||||||||||||||||||||||||||||||
Class I | |||||||||||||||||||||||||||||||||||||||||||||||||||||||||||||||||||||||||||
| 10/31/14(6) | 10.00 | — (9) | 0.18 | 0.18 | — | — | — | 0.18 | 10.18 | 1.80 | (7) | 63,900 | 2.75 | (8) | 3.85 | (8) | (0.04 | )(8) | 195 | (7) | |||||||||||||||||||||||||||||||||||||||||||||||||||||||
See Notes to Financial Statements
62
Table of Contents
VIRTUS ALTERNATIVE SOLUTIONS TRUST
FINANCIAL HIGHLIGHTS
SELECTED PER SHARE DATA AND RATIOS FOR A SHARE OUTSTANDING
THROUGHOUT EACH PERIOD
Net Asset of Period
| Net
| Net Realized
| Total from
| Dividends
| Distributions
| Total
| Change in
| Net Asset
| Total
| Net Assets, End of Period
| Ratio of waivers and
| Ratio of Assets
| Ratio of Net Net Assets
| Portfolio
| ||||||||||||||||||||||||||||||||||||||||||||||||||||||||||
Virtus Strategic Income | ||||||||||||||||||||||||||||||||||||||||||||||||||||||||||||||||||||||||
Class A | ||||||||||||||||||||||||||||||||||||||||||||||||||||||||||||||||||||||||
10/31/14(11) | $10.00 | $0.03 | $(0.06 | ) | $(0.03 | ) | $(0.02 | ) | $ — | $(0.02 | ) | $(0.05 | ) | $9.95 | (0.33 | )%(7) | $119 | 1.40 | %(8) | 3.71 | %(8) | 1.84 | %(8) | 83 | %(7) | |||||||||||||||||||||||||||||||||||||||||||||||
Class C | ||||||||||||||||||||||||||||||||||||||||||||||||||||||||||||||||||||||||
10/31/14(11) | 10.00 | 0.02 |
| (0.06 | ) | (0.04 | ) | (0.01 | ) | — | (0.01 | ) | (0.05 | ) | 9.95 | (0.43 | )(7) | 100 | 2.15 | (8) | 4.85 | (8) | 1.09 | (8) | 83 | (7) | ||||||||||||||||||||||||||||||||||||||||||||||
Class I | ||||||||||||||||||||||||||||||||||||||||||||||||||||||||||||||||||||||||
10/31/14(11) | 10.00 | 0.03 | (0.06 | ) | (0.03 | ) | (0.02 | ) | — | (0.02 | ) | (0.05 | ) | 9.95 | (0.29 | )(7) | 24,721 | 1.15 | (8) | 3.85 | (8) | 2.09 | (8) | 83 | (7) | |||||||||||||||||||||||||||||||||||||||||||||||
Footnote Legend
| (1) | Computed using average shares outstanding. |
| (2) | Sales charges, where applicable, are not reflected in the total return calculation. |
| (3) | The ratio of net expenses to average net assets excluding dividend and interest expense on securities sold short for the Alternative Income Solution Fund for Class A is 2.45%, for Class C is 3.20% and for Class I is 2.20% for the period ended October 31, 2014. |
| (4) | The ratio of net expenses to average net assets excluding dividend and interest expense on securities sold short for the Alternative Inflation Solution Fund for Class A is 2.40%, for Class C is 3.15% and for Class I is 2.15% for the period ended October 31, 2014. |
| (5) | The ratio of net expenses to average net assets excluding dividend and interest expense on securities sold short for the Alternative Total Solution Fund for Class A is 2.60%, for Class C is 3.35% and for Class I is 2.35% for the period ended October 31, 2014. |
| (6) | Inception date April 23, 2014. |
| (7) | Not annualized. |
| (8) | Annualized. |
| (9) | Amount is less than $0.005 or 0.005%. |
| (10) | Consolidated Financial Highlights. |
| (11) | Inception date September 8, 2014. |
See Notes to Financial Statements
63
Table of Contents
VIRTUS ALTERNATIVE SOLUTIONS TRUST
NOTES TO FINANCIAL STATEMENTS
October 31, 2014
| Note 1. | Organization |
Virtus Alternative Solutions Trust (the “Trust”) is organized as a Delaware statutory trust and is registered under the Investment Company Act of 1940, as amended (the “1940 Act”), as an open-end management investment company. As of the date of this report the Trust is comprised of three non-diversified funds (Alternative Income Solution Fund, Alternative Inflation Solution Fund and Alternative Total Solution Fund) and one diversified fund (Strategic Income Fund) each having a distinct investment objective outlined in their respective Fund summary pages.
There is no guarantee that a Fund will achieve its objective(s).
All of the Funds offer Class A shares, Class C shares and Class I shares.
Class A shares are sold with a front-end sales charge of up to 5.75% (up to 3.75% for Strategic Income Fund) with some exceptions. Generally, Class A shares are not subject to any charges by the Funds when redeemed; however, a 1% (0.50% for Strategic Income Fund) contingent deferred sales charge (“CDSC”) may be imposed on certain redemptions made within a certain period following purchases on which a finder’s fee has been paid. The period for which the CDSC applies for the Funds is 18 months. The CDSC period begins on the last day of the month preceding the month in which the purchase was made.
Class C shares are generally sold with a 1% CDSC, applicable if redeemed within one year of purchase. Class I shares are sold without a sales charge or CDSC.
Virtus Mutual Funds may impose an annual fee on accounts having balances of less than $2,500. The small account fee may be waived In certain circumstances, as disclosed in the prospectus and/or statement of additional information. The fees collected will be used to offset certain expenses of the Funds.
Each class of shares has identical voting, dividend, liquidation and other rights and the same terms and conditions, except that each class bears different distribution and/or service fees under a Rule 12b-1 and/or shareholder service plan (“12b-1 plan”) approved by the Trust’s Board of Trustees (the “Board”) and has exclusive voting rights with respect to such plan(s). Class I shares are not subject to a 12b-1 plan. Income and other expenses and realized and unrealized gains and losses of each Fund are borne pro rata by the holders of each class of shares.
| Note 2. | Significant Accounting Policies |
The Trust is an investment company that follows the accounting and reporting guidance of Accounting Standards Codification Topic 946 applicable to Investment Companies. The following is a summary of significant accounting policies consistently followed by the Trust in the preparation of its financial statements. The preparation of financial statements in conformity with accounting principles generally accepted in the United States of America requires management to make estimates and assumptions that affect the reported amounts of assets and liabilities, and disclosure of contingent assets and liabilities at the date of the financial statements and the reported amounts of increases and decreases in net assets from operations during the reporting period. Actual results could differ from those estimates, and those differences could be significant.
| A. | Basis of Consolidation |
The accompanying consolidated financial statements of Alternative Total Solution Fund include the account of VATS Offshore Fund, Ltd (the “Subsidiary”), which is a wholly-owned subsidiary of Alternative Total Solution Fund and is organized as a company under the laws of the Cayman Islands and primarily invests in commodity-related instruments. The Subsidiary is not registered under the 1940 Act. The Subsidiary enables Alternative Total Solution Fund to hold these commodity-related instruments and satisfy regulated investment company tax requirements. Alternative Total Solution Fund may invest up to 25% of its total assets in the Subsidiary. The net assets of the Subsidiary at October 31, 2014 were $7,240 and 10% of Alternative Total Solution Fund’s consolidated net assets. Intercompany accounts and transactions, if any, have been eliminated. The Subsidiary is subject to the same investment policies and restrictions that apply to Alternative Total Solution Fund, except that the Subsidiary may invest without limitation in commodity-related instruments.
| B. | Security Valuation |
Security valuation procedures for each Fund, which include nightly price variance as well as back-testing such as bi-weekly unchanged price, monthly secondary source and transaction analysis, have been approved by the Board. All internally fair valued securities are approved by a valuation committee (the “Valuation Committee”) appointed by the Board. The Valuation Committee is comprised of certain members of management as identified by the Board, and convenes independently from portfolio management. All internally fair valued securities, are updated daily and reviewed in detail by the Valuation Committee monthly unless changes occur within the period. The Valuation Committee reviews the validity of any model inputs and any changes to the model. Fair valuations are reviewed by the Board at least quarterly.
64
Table of Contents
VIRTUS ALTERNATIVE SOLUTIONS TRUST
NOTES TO FINANCIAL STATEMENTS
October 31, 2014
— | Level 1 — | quoted prices in active markets for identical securities (security types generally include listed equities) | ||
— | Level 2 — | prices determined using other significant observable inputs (including quoted prices for similar securities, interest rates, prepayment speeds, credit risk, etc.) | ||
— | Level 3 — | prices determined using significant unobservable inputs (including the Valuation Committee’s own assumptions in determining the fair value of investments) |
A description of the valuation techniques applied to a Fund’s major categories of assets and liabilities measured at fair value on a recurring basis is as follows:
Equity securities are valued at the official closing price (typically last sale) on the exchange on which the securities are primarily traded, or if no closing price is available, at the last bid price and are categorized as Level 1 in the hierarchy. Restricted equity securities and private placements that are not widely traded, are illiquid or are internally fair valued by the Valuation Committee, are generally categorized as Level 3 in the hierarchy.
Certain non-U.S. securities may be fair valued in cases where closing prices are not readily available or are deemed not reflective of readily available market prices. For example, significant events (such as movement in the U.S. securities market, or other regional and local developments) may occur between the time that non-U.S. markets close (where the security is principally traded) and the time that a Fund calculates its net asset value (“NAV”) at the close of regular trading on the New York Stock Exchange (“NYSE”) (generally, 4 p.m. Eastern time) that may impact the value of securities traded in these non-U.S. markets. In such cases the Funds fair value non-U.S. securities using an independent pricing service which considers the correlation of the trading patterns of the non-U.S. security to the intraday trading in the U.S. markets for investments such as ADRs, financial futures, ETFs and certain indexes as well as prices for similar securities. Such fair valuations are categorized as Level 2 in the hierarchy. Because the frequency of significant events is not predictable, fair valuation of certain non-U.S. common stocks may occur on a frequent basis.
Debt securities, including restricted securities, are valued based on evaluated quotations received from independent pricing services or from dealers who make markets in such securities. For most bond types, the pricing service utilizes matrix pricing that considers one or more of the following factors: yield or price of bonds of comparable quality, coupon, maturity, current cash flows, type, and current day trade information, as well as dealer supplied prices. These valuations are generally categorized as Level 2 in the hierarchy. Structured debt instruments such as mortgage-backed and asset-backed securities may also incorporate collateral analysis and utilize cash flow models for valuation and are generally categorized as Level 2 in the hierarchy. Pricing services do not provide pricing for all securities and therefore indicative bids from dealers are utilized which are based on pricing models used by market makers in the security and are generally categorized as Level 2 in the hierarchy. Debt securities that are not widely traded, are illiquid, or are internally fair valued by the Valuation Committee are generally categorized as Level 3 in the hierarchy.
Listed derivatives that are actively traded are valued based on quoted prices from the exchange and are categorized as Level 1 in the hierarchy. Over-the-counter (OTC) derivative contracts, which include forward currency contracts, swaps and equity linked instruments, do not require material subjectivity as pricing inputs are observed from actively quoted markets and are categorized as Level 2 in the hierarchy.
Investments in open-end mutual funds are valued at NAV. Investments in closed-end mutual funds are valued as of the close of regular trading on the NYSE, generally 4 p.m. Eastern time, each business day. Both are categorized as Level 1 in the hierarchy.
Short-term notes having a remaining maturity of 60 days or less are valued at amortized cost, which approximates market, and are generally categorized as Level 2 in the hierarchy.
A summary of the inputs used to value the Funds’ net assets by each major security type is disclosed at the end of the Schedule of Investments for each Fund. The inputs or methodologies used for valuing securities are not necessarily an indication of the risk associated with investing in those securities.
65
Table of Contents
VIRTUS ALTERNATIVE SOLUTIONS TRUST
NOTES TO FINANCIAL STATEMENTS
October 31, 2014
| C. | Security Transactions and Investment Income |
Security transactions are recorded on the trade date. Realized gains and losses from sales of securities for the Alternative Income Solution Fund, Alternative Inflation Solution Fund and Alternative Total Solution Fund are determined on the first-in, first-out basis. Realized gains and losses from sales of securities for the Strategic Income Fund are determined on the highest-in, first-out basis. Dividend income is recognized on the ex-dividend date or, in the case of certain foreign securities, as soon as a Fund is notified. Interest income is recorded on the accrual basis. Each Fund amortizes premiums and accretes discounts using the effective interest method.
Dividend income from REIT and MLP investments is recorded using Management’s estimate of the percentage of income included in distributions received from such investments based on historical dividend results. Distributions received in excess of this estimated amount are recorded as a reduction of the cost of investments (i.e. a return of capital) or reclassified to capital gains. The actual amounts of income, return of capital, and capital gains are only determined by each REIT and MLP after its fiscal year-end, and may differ from the estimated amounts.
| D. | Income Taxes |
Each Fund is treated as a separate taxable entity. It is the intention of each Fund in the Trust to comply with the requirements of Subchapter M of the Internal Revenue Code and to distribute substantially all of its taxable income to its shareholders. Therefore, no provision for federal income taxes or excise taxes has been made. The Subsidiary is classified as a controlled foreign corporation under Subchapter M of the Internal Revenue Code. Therefore, the Fund is required to increase its taxable income by its share of the Subsidiary’s income. Net investment losses of the Subsidiary cannot be deducted by the Fund in the current period nor carried forward to offset taxable income in future periods.
Certain Funds may be subject to foreign taxes on income, gains on investments or currency repatriation, a portion of which may be recoverable. Each Fund will accrue such taxes and recoveries as applicable based upon current interpretations of the tax rules and regulations that exist in the markets in which it invests.
Management of the Funds has concluded that there are no significant uncertain tax positions that would require recognition in the financial statements. In the normal course of business, the Funds are subject to examination by federal, state and local jurisdictions, where applicable, for tax years for which applicable statutes of limitations have not expired.
| E. | Distributions to Shareholders |
Distributions are recorded by each Fund on the ex-dividend date and distributed quarterly for the Alternative Income Solution Fund, semi-annually for the Alternative Inflation Solution Fund and Alternative Total Solution Fund and monthly for the Strategic Income Fund. Income and capital gain distributions are determined in accordance with income tax regulations that may differ from accounting principles generally accepted in the United States of America. These differences may include the treatment of non-taxable dividends, market premium and discount, non-deductible expenses, expiring capital loss carryovers, foreign currency gain or loss, gain or loss on futures contracts, partnerships, operating losses and losses deferred due to wash sales. Permanent book and tax basis differences relating to shareholder distributions will result in reclassifications to capital paid in on shares of beneficial interest.
| F. | Expenses |
Expenses incurred together by a Fund and other affiliated mutual funds are allocated in proportion to the net assets of each such fund, except where allocation of direct expense to each fund or an alternative allocation method can be more appropriately used.
In addition to the net annual operating expenses that a Fund bears directly, the shareholders of a Fund indirectly bear the pro-rata expenses of any underlying mutual funds in which a Fund invests.
| G. | Foreign Currency Translation |
Non-U.S. investment securities and other assets and liabilities denominated in foreign currencies are translated into U.S. dollar amounts at the foreign currency exchange rate effective at the end of the reporting period. Cost of investments is translated at the currency exchange rate effective at the trade date. The gain or loss resulting from a change in currency exchange rates between the trade and settlement date of a portfolio transaction is treated as a gain or loss on foreign currency. Likewise, the gain or loss resulting from a change in currency exchange rates between the date income is accrued and the date it is paid is treated as a gain or loss on foreign currency. The Funds do not isolate that portion of the results of operations arising from changes in foreign exchange rates on investments from the fluctuations arising from changes in the market prices of securities held. Such fluctuations are included with the net realized and unrealized gain or loss on investments.
| H. | When-issued Purchases and Forward Commitments (Delayed Delivery) |
Certain Funds may engage in when-issued or forward commitment transactions. Transactions on a when-issued or forward commitment basis are also known as delayed delivery transactions. Delayed delivery transactions involve a commitment by a Fund to purchase or sell a security at a future date (ordinarily up to 90 days later). When-issued or forward commitments enable a Fund to lock in what is believed to be an attractive price or yield on a particular security for a period of time, regardless of future changes in interest rates. Each Fund records when-issued and delayed delivery securities on the trade date. Each Fund maintains collateral for the securities purchased. Securities purchased on a when-issued or delayed delivery basis begin earning interest on the settlement date.
66
Table of Contents
VIRTUS ALTERNATIVE SOLUTIONS TRUST
NOTES TO FINANCIAL STATEMENTS
October 31, 2014
| I. | Short Sales |
Certain Funds may sell securities short. A short sale is a transaction in which a Fund sells a security it does not own in anticipation of a decline in market price. To sell a security short, a Fund must borrow the security. The Fund’s obligation to replace the security borrowed and sold short will be fully collateralized at all times by the proceeds from the short sale retained by the broker and by cash and securities deposited in a segregated account with the Fund’s custodian. If the price of the security sold short increases between the time of the short sale and the time the Fund replaces the borrowed security, the Fund will realize a loss, and if the price declines during the period, the Fund will realize a gain. Any realized gain will be decreased, and any realized loss increased, by the amount of transaction costs. On ex-dividend date, dividends on short sales are recorded as an expense to the Fund.
In accordance with the terms of its prime brokerage agreement, the Alternative Income Solution Fund, Alternative Inflation Solution Fund and Alternative Total Solution Fund may receive rebate income or be charged a fee on borrowed securities which is under Interest expense on short sales on the Statements of Operations. Such income or fee is calculated on a daily basis based upon the market value of each borrowed security and a variable rate that is dependent upon the availability of such security.
| J. | Loan Agreements |
Certain Funds may invest in direct debt instruments which are interests in amounts owed by a corporate, governmental, or other borrower to lenders or lending syndicates. Loan agreements are generally non-investment grade, and often involve borrowers that are highly leveraged. A Fund may invest in obligations of borrowers who are in bankruptcy proceedings. Loan agreements are typically senior in the corporate capital structure of the borrower. A loan is often administered by a bank or other financial institution (the “lender”) that acts as agent for all holders. The agent administers the terms of the loan, as specified in the loan agreement. A Fund’s investments in loans may be in the form of participations in loans or assignments of all or a portion of loans from third parties.
When investing in loan participations, the Fund has the right to receive payments of principal, interest and any fees to which it is entitled only from the lender selling the loan participation and only upon receipt by the lender of payments from the borrower. A Fund generally has no right to enforce compliance with the terms of the loan agreement with the borrower. As a result, a Fund may be subject to the credit risk of both the borrower and the lender that is selling the loan agreement. When a Fund purchases assignments from lenders it acquires direct rights against the borrower on the loan.
A Fund may invest in multiple series or tranches of a loan, which may have varying terms and carry different associated risks. Loan agreements may involve foreign borrowers and investments may be denominated in foreign currencies. Direct indebtedness of emerging countries involves a risk that the government entities responsible for the repayment of the debt may be unable, or unwilling, to pay the principal and interest when due.
The loan agreements have floating rate loan interests which generally pay interest at rates that are periodically determined by reference to a base lending rate plus a premium. The base lending rates are generally LIBOR (London Interbank Offered Rate), the prime rate offered by one or more U.S. banks or the certificate of deposit rate. When a loan agreement is purchased the Fund may pay an assignment fee. On an ongoing basis, the Funds may receive a commitment fee based on the undrawn portion of the underlying line of credit portion of a loan agreement. Prepayment penalty fees are received upon the prepayment of a loan agreement by a borrower. Prepayment penalty, facility, commitment, consent and amendment fees are recorded to income as earned or paid.
| K. | Organizational and Offering Costs |
Virtus Alternative Investment Advisers, Inc. (the “Adviser”) has agreed to pay all organizational costs associated with the establishment of the Funds. Offering costs will be paid by the Funds, and are amortized over a 12-month period beginning with the commencement of operations.
| Note | 3. Derivative Financial Instruments |
| A. | Futures Contracts |
A futures contract is an agreement between two parties to purchase (long) or sell (short) a security at a set price for delivery on a future date. Upon entering into a futures contract, a Fund is required to pledge to the broker an amount of cash and/or securities equal to the “initial margin” requirements of the futures exchange on which the contract is traded. Pursuant to the contract, the Fund agrees to receive from or pay to the broker an amount of cash equal to the daily fluctuation in value of the contract. Such receipts or payments are known as variation margin and are recorded by the Fund for financial statement purposes on a daily basis as unrealized appreciation or depreciation. When the contract expires or is closed, gain or loss equal to the difference between the value of the contract at the time it was opened and the value at the time it was closed is realized. This is presented in the Statement of Operations as net realized gain (loss) on futures contracts.
Alternative Income Solution Fund, Alternative Inflation Solution Fund and Alternative Total Solution Fund utilize futures to optimize performance by gaining exposure to broad markets or to hedge the risk of securities within the portfolios. The potential risks to each such Fund are that 1) the use of futures may result in larger losses or smaller gains than the use of more traditional investments, 2) the prices of futures and the price movements of the securities that the future is intended to simulate may not correlate well, 3) the Fund’s success in using futures will be dependent upon the subadviser’s ability to correctly predict such price movements, 4) liquidity of futures can be adversely affected by market factors, and the prices of such securities may move in unexpected ways, and 5) if the Fund cannot close out a futures position, it may be compelled to continue to make daily cash payments to the broker to meet margin requirements, thus increasing transaction costs.
67
Table of Contents
VIRTUS ALTERNATIVE SOLUTIONS TRUST
NOTES TO FINANCIAL STATEMENTS
October 31, 2014
| B. | Forward Foreign Currency Exchange Contracts |
Alternative Income Solution Fund, Alternative Inflation Solution Fund and Alternative Total Solution Fund enter into forward foreign currency exchange contracts as an economic hedge against either specific transactions or portfolio instruments or to obtain exposure to, or hedge exposure away from, foreign currencies (foreign currency exchange rate risk). A forward foreign currency exchange contract is an agreement between two parties to buy and sell a currency at a set exchange rate on a future date. Forward foreign currency exchange contracts, when used by a Fund, help to manage the overall exposure to the currencies in which some of the investments held by the Fund are denominated. The contract is marked-to-market daily and the change in market value is recorded by the Fund as an unrealized appreciation or depreciation. When the contract is closed, the Fund records a realized gain or loss equal to the difference between the value at the time it was opened and the value at the time it was closed. The use of forward foreign currency exchange contracts involves the risk that the value of a forward foreign currency exchange contract changes unfavorably due to movements in the value of the referenced foreign currencies. Non-deliverable forward foreign currency exchange contracts are settled with the counterparty in U.S. dollar without the delivery of foreign currency.
| C. | Options Contracts |
An options contract provides the purchaser with the right, but not the obligation, to buy (call option) or sell (put option) a financial instrument at an agreed upon price. Certain Funds may purchase or write both put and call options on portfolio securities. The Fund is subject to equity price risk in the normal course of pursuing its investment objectives. The Alternative Income Solution Fund, Alternative Inflation Solution Fund and Alternative Total Solution Fund use options contracts to hedge against market and idiosyncratic risk. The Strategic Income Fund pursues an option income strategy whereby it purchases and sells out-of-the-money puts and calls, creating an options spread designed to generate a consistent level of option cash flow which should result in additional yield.
When a Fund purchases an option, it pays a premium and an amount equal to that premium is recorded as an asset. When a Fund writes an option, it receives a premium and an amount equal to that premium is recorded as a liability. The asset or liability is adjusted daily to reflect the current market value of the option. Holdings of the Fund designated to cover outstanding written options are noted in the Schedules of Investments. Purchased options are reported as an asset within “Investment securities at value” in the Statement of Assets and Liabilities. Options written are reported as a liability within “Options written at value”. Changes in value of the purchased option is included in “Net change in unrealized appreciation (depreciation) on investments” in the Statement of Operations. Changes in value of written options is included in “Net change in unrealized appreciation (depreciation) on options written” in the Statement of Operations.
If an option expires unexercised, the Fund realizes a gain or loss to the extent of the premium received or paid. If an option is exercised, the premium received or paid is recorded as an adjustment to the proceeds from the sale or the cost basis of the purchase. The difference between the premium and the amount received or paid on effecting a closing purchase or sale transaction is also treated as a realized gain or loss. Gain or loss on purchased options is included in “Net realized gain (loss) on investments” in the Statement of Operations. Gain or loss on written options is presented separately as “Net realized gain (loss) on written options” in the Statement of Operations.
The risk in writing call options is that the Fund gives up the opportunity for profit if the market price of the security increases and the option is exercised. The risk in writing put options is that the Fund may incur a loss if the market price of the security decreases and the option is exercised. The risk in buying options is that the Fund pays a premium whether or not the option is exercised. The use of such instruments may involve certain additional risks as a result of unanticipated movements in the market. Writers (sellers) of options are subject to unlimited risk of loss, as the seller will be obligated to deliver or take delivery of the security at a predetermined price which may, upon exercise of the option, be significantly different from the then-market value.
68
Table of Contents
VIRTUS ALTERNATIVE SOLUTIONS TRUST
NOTES TO FINANCIAL STATEMENTS
October 31, 2014
The Funds had transactions in options written during the period ended October 31, 2014 as follows:
Alternative Total Solution Fund | ||||||||||
| Numbers of Contracts | Premiums Received | |||||||||
Options outstanding at April 23, 2014 | — | $ — | ||||||||
Options written | 773 | 181 | ||||||||
Options closed | (717) | (174) | ||||||||
Options expired | (40) | (6) | ||||||||
Options exercised | (3) | — (1) | ||||||||
|
|
|
| |||||||
Options outstanding at October 31, 2014 | 13 | $ 1 | ||||||||
|
|
|
| |||||||
Footnote Legend:
| (1) | Amount is less than $500. |
Strategic Income Fund | ||||||||
| Numbers of Contracts | Premiums Received | |||||||
Options outstanding at September 8, 2014 | — | $ — | ||||||
Options written | 1,120 | 274 | ||||||
Options closed | (758) | (196) | ||||||
Options expired | — | — | ||||||
Options exercised | — | — | ||||||
|
|
|
| |||||
Options outstanding at October 31, 2014 | 362 | $ 78 | ||||||
|
|
|
| |||||
| D. | Swaps |
The Funds may enter into swap agreements, in which the Fund and a counterparty agree either to make periodic net payments on a specified notional amount or a net payment upon termination. Swap agreements are negotiated in the OTC market and may be entered into as a bilateral contract (“OTC swaps”) or centrally cleared (“centrally cleared swaps”). The value of the swap is reflected on the Statements of Assets and Liabilities as “Swaps at value”. Swaps are marked-to-market daily and changes in value are recorded as “Net change in unrealized appreciation (depreciation) on swaps” in the Statements of Operations.
Any upfront premiums paid are recorded as assets and any upfront fees received are recorded as liabilities and are shown under “Swaps at value” in the Statements of Assets and Liabilities and amortized over the term of the swap. When a swap is terminated, the Fund records a realized gain or loss equal to the difference between the proceeds from (or cost of) the closing transaction and the Fund’s basis in the contract, if any. Generally, the basis of the contracts is the unamortized premium received or paid. Cash settlements between the Fund and the counterparty are recognized as “Net realized gain (loss) on swaps” in the Statements of Operations. Swap contracts outstanding at period end, if any, are listed after each Fund’s Schedule of Investments and Securities Sold Short.
In a centrally cleared swap, immediately following execution of the swap agreement, the swap agreement is submitted to a central counterparty (the “CCP”) and the Fund’s counterparty on the swap agreement becomes the CCP. The Fund is required to interface with the CCP through a clearing broker. Upon entering into a centrally cleared swap, a Fund is required to deposit initial margin with the clearing broker in the form of cash or securities in an amount that varies depending on the size and risk profile of the particular swap.
Securities deposited as margin are designated on the Schedules of Investments and cash deposited is recorded on the Statements of Assets and Liabilities as “Cash pledged as collateral for swaps”.
Swap transactions involve, to varying degrees, elements of interest rate, credit and market risk in excess of the amounts recognized in the statements of Assets and Liabilities. Such risks involve the possibility that there will be no liquid market for these agreements, that the counterparty to the agreements may default on its obligation to perform or disagree as to the meaning of the contractual terms in the agreements, and that there may be unfavorable changes in interest rates and/or market values associated with these transactions.
Credit default swaps – the Funds may enter into credit default swaps to manage their exposure to the market or certain sectors of the market, to reduce their risk exposure to defaults of corporate and/or sovereign issuers or to create exposure to corporate and/or sovereign issuers to which they are not otherwise exposed (credit risk). A Fund may either buy or sell (write) credit default swaps on single-name issuers (corporate or sovereign), a combination or basket of single-name issuers or traded indexes. Credit default swaps on single-name issuers are agreements in which the buyer pays fixed periodic payments to the seller in consideration for a guarantee from the protection seller to make specific payment should a negative credit event take place with respect to the referenced entity (e.g., bankruptcy, failure to pay, obligation accelerators, repudiation, moratorium or restructuring). Credit default swaps on a combination or basket of single-name issuers are agreements in which the buyer pays fixed periodic payments to the seller in consideration for a guarantee from the protection seller to make specific payment should a negative credit event take place with respect to any of the referenced entities (e.g., bankruptcy, failure to pay, obligation accelerators, repudiation, moratorium or restructuring). Credit default swaps on traded indexes are agreements in which the buyer pays fixed periodic payments to the seller in consideration for a guarantee from the seller to make a specific payment should a write-down, principal or interest shortfall or default of all or individual underlying securities included in the index occurs. As a buyer, if an underlying credit event occurs, the Fund will either receive from the seller an amount equal to the notional amount of the swap and deliver the referenced security or underlying securities comprising the index or receive a net
69
Table of Contents
VIRTUS ALTERNATIVE SOLUTIONS TRUST
NOTES TO FINANCIAL STATEMENTS
October 31, 2014
The Strategic Income Fund may utilize both single name credit default swaps and credit index swaps to gain exposure to short individual securities or to gain exposure to a credit or asset-backed index.
Total return swaps – Certain Funds may enter into total return swaps to obtain exposure to a security or market without owning such security or investing directly in that market or to transfer the risk/return of one market (e.g., fixed income) to another market (e.g., equity) (equity risk and/or interest rate risk). Total return swaps are agreements in which there is an exchange of cash flows whereby one party commits to make payments based on the total return (coupons plus capital gains/losses) of an underlying instrument in exchange for fixed or floating rate interest payments. To the extent the total return of the instrument or index underlying the transaction exceeds or falls short of the offsetting interest rate obligation, the Fund will receive a payment from or make a payment to the counterparty.
Certain Funds may enter into equity basket swaps to obtain exposure to a portfolio of long and short securities. Under the terms of the agreement, the swap is designed to function as a portfolio of direct investments in long and short equity or fixed income positions. This means that the Fund has the ability to trade in and out of long and short positions within the swap and will receive all of the economic benefits and risks equivalent to direct investments in these positions such as: capital appreciation (depreciation), corporate actions, and dividends and interest received and paid, all of which are reflected in the swap value. The swap value also includes interest charges and credits related to the notional values of the long and short positions and cash balances within the swap. These interest charges and credits are based on defined market rates plus or minus a specified spread and are referred to herein as “financing costs”. Positions within the swap are reset periodically, and financing costs are reset monthly.
During a reset, any unrealized gains (losses) on positions and accrued financing costs become available for cash settlement between the Fund and the swap counterparty. Cash settlement in and out of the swap may occur at a reset date or any other date, at the discretion of the Fund and the counterparty, over the life of the agreement, and is generally determined based on limits and thresholds established as part of the ISDA Master Agreement (defined below in “Derivative Risks”) between the Fund and the counterparty.
The value of the swap is derived from a combination of (i) the net value of the underlying positions, which are valued daily using the last sale or closing prices on the principal exchange on which the securities are traded; (ii) financing costs; (iii) the value of dividends or accrued interest; (iv) cash balances within the swap; and (v) other factors, as applicable. The swap involves additional risks than if the Fund has invested in the underlying positions directly, including: the risk that changes in the swap may not correlate perfectly with the underlying long and short securities; credit risk related to the counterparty’s failure to perform under contract terms; and liquidity risk related to the lack of a liquid market for the swap contract, which may limit the ability of the Fund to close out its position(s).
The Alternative Total Solution Fund may utilize total return swaps to gain exposure to broad markets or to hedge the risk of individual securities within the portfolios, obtain long or short exposure to the underlying reference instrument, obtain leverage and gain exposure to restricted markets in order to avoid the operational burden of ownership filing requirements. Swap Baskets are entered into to implement custom index exposure in one convenient trading instrument.
Interest rate swaps – Certain Funds may enter into interest rate swaps to gain or reduce exposure to interest rates or to manage duration, the yield curve or interest rate risk by economically hedging the value of the fixed rate bonds which may decrease when interest rates rise (interest rate risk). Interest rate swaps are agreements in which one party pays a stream of interest payments, either fixed or floating, for another party’s stream of interest payments, either fixed or floating, on the same notional amount for a specified period of time. The Funds did not enter into any interest rate swaps during the current reporting period.
70
Table of Contents
VIRTUS ALTERNATIVE SOLUTIONS TRUST
NOTES TO FINANCIAL STATEMENTS
October 31, 2014
($ reported in thousands)
The following is a summary of derivative instruments categorized by primary risk exposure as of October 31, 2014:
| Fair Values of Derivative Financial Instruments as of October 31, 2014 | ||||||||||||||||||||
| Derivative Assets | ||||||||||||||||||||
| Alternative Income Solution Fund | Alternative Inflation Solution Fund | Alternative Total Solution Fund | Strategic Income Fund | |||||||||||||||||
| Primary Risk | Statements of Assets and Liabilities Location | Value | Value | Value | Value | |||||||||||||||
Interest rate contracts | Net unrealized appreciation/depreciation on investments1; Investment in securities at value2 | $ — | $ — | $ 75 | $ — | |||||||||||||||
| ||||||||||||||||||||
Foreign Currency exchange contracts | Net unrealized appreciation/depreciation on investments1; Unrealized appreciation on forward foreign currency exchange contracts | 31 | 10 | 236 | — | |||||||||||||||
| ||||||||||||||||||||
Equity Contracts | Net unrealized appreciation/depreciation on investments1; Investment in securities at value2; Swaps at value | — | — | 128 | 21 | |||||||||||||||
| ||||||||||||||||||||
Commodity Contracts | Net unrealized appreciation/depreciation on investments1 | — | — | 117 | — | |||||||||||||||
| ||||||||||||||||||||
Credit Contracts | Investment in Securities at value2; Swaps at value3 | 2 | 2 | 2 | 114 | |||||||||||||||
| ||||||||||||||||||||
Total | $ 33 | $ 12 | $ 558 | $ 135 | ||||||||||||||||
|
|
|
|
|
|
|
| |||||||||||||
| Fair Values of Derivative Financial Instruments as of October 31, 2014 | ||||||||||||||||||||
| Derivative Liabilities | ||||||||||||||||||||
| Alternative Income Solution Fund | Alternative Inflation Solution Fund | Alternative Total Solution Fund | Strategic Income Fund | |||||||||||||||||
| Primary Risk | Statements of Assets and Liabilities Location | Value | Value | Value | Value | |||||||||||||||
Interest rate contracts | Net unrealized appreciation/depreciation on investments1 | $ 26 | $ 75 | $ 9 | $ — | |||||||||||||||
| ||||||||||||||||||||
Foreign currency exchange contracts | Net unrealized appreciation/depreciation on investments1; Unrealized depreciation on forward foreign currency exchange contracts | 8 | — | 112 | — | |||||||||||||||
| ||||||||||||||||||||
Equity Contracts | Net unrealized appreciation/depreciation on investments1; Investment in securities at value2; Written options at value; Swaps at value | — | — | 12 | 62 | |||||||||||||||
| ||||||||||||||||||||
Commodity | Net unrealized appreciation/depreciation on investments1 | — | — | 50 | — | |||||||||||||||
| ||||||||||||||||||||
Credit Contracts | Swaps at value | — | — | — | 8 | |||||||||||||||
| ||||||||||||||||||||
Total | $ 34 | $ 75 | $ 183 | $ 70 | ||||||||||||||||
|
|
|
|
|
|
|
| |||||||||||||
1Includes cumulative appreciation/depreciation on futures contracts and options purchased as reported in the Schedules of Investments. For futures contracts only current day’s variation margin is reported within the Statements of Assets and Liabilities.
2Includes options purchased at value as reported in the Schedules of Investments.
3Includes cumulative appreciation/depreciation on centrally cleared swaps as reported in the Schedule of Investments.
71
Table of Contents
VIRTUS ALTERNATIVE SOLUTIONS TRUST
NOTES TO FINANCIAL STATEMENTS
October 31, 2014
($ reported in thousands)
The Effect of Derivative Financial Instruments in the Statement of Operations Period Ended October 31, 2014 | ||||||||||||||||||
| Net Realized Gain (Loss) From | ||||||||||||||||||
| Alternative Income Solution Fund | Alternative Inflation Solution Fund | Alternative Total Solution Fund | Strategic Income Fund | |||||||||||||||
Interest rate contracts: | ||||||||||||||||||
Futures contracts6 | $ | (2 | ) | $ | (242 | ) | $ | 187 | $ | — | ||||||||
Foreign Currency exchange contracts: | ||||||||||||||||||
Forward foreign currency transactions1 | 9 | 2 | 22 | — | ||||||||||||||
Equity Contracts: | ||||||||||||||||||
Futures contracts6 | — | — | 43 | — | ||||||||||||||
Options Purchased2 | — | — | (88 | ) | (77 | ) | ||||||||||||
Options Written4 | — | — | 72 | 34 | ||||||||||||||
Swaps5 | — | — | (329 | ) | — | |||||||||||||
Commodity Contracts: | ||||||||||||||||||
Futures contracts6 | — | — | (25 | ) | — | |||||||||||||
Credit Contracts: | ||||||||||||||||||
Swaps5 | — | — | — | (6 | ) | |||||||||||||
|
|
|
|
|
|
|
| |||||||||||
Total | $ | 7 | $ | (240 | ) | $ | (118 | ) | $ | (49 | ) | |||||||
|
|
|
|
|
|
|
| |||||||||||
The Effect of Derivative Financial Instruments in the Statement of Operations Period Ended October 31, 2014 |
| |||||||||||||||||
| Net Change in Unrealized Appreciation/(Depreciation) on | ||||||||||||||||||
| Alternative Income Solution Fund | Alternative Inflation Solution Fund | Alternative Total Solution Fund | Strategic Income Fund | |||||||||||||||
Interest rate contracts: | ||||||||||||||||||
Futures contracts6 | $ | (26 | ) | $ | (75 | ) | $ | 66 | $ | — | ||||||||
Foreign currency exchange contracts: | ||||||||||||||||||
Futures contracts6 | — | 10 | — | — | ||||||||||||||
Forward foreign currency transactions1 | 23 | — | 124 | — | ||||||||||||||
Equity contracts: | ||||||||||||||||||
Futures contracts 6 | — | — | 112 | — | ||||||||||||||
Options Purchased2 | — | — | (1 | ) | (11 | ) | ||||||||||||
Options Written4 | — | — | — | 3 | 16 | |||||||||||||
Swaps5 | — | — | (3 | ) | — | |||||||||||||
Commodity contracts: | ||||||||||||||||||
Futures contracts6 | — | — | 67 | — | ||||||||||||||
Credit Contracts: | ||||||||||||||||||
Options Purchased2 | (8 | ) | (5 | ) | (5 | ) | — | |||||||||||
Swaps5 | — | — | — | 31 | ||||||||||||||
|
|
|
|
|
|
|
| |||||||||||
Total | $ | (11 | ) | $ | (70 | ) | $ | 360 | $ | 36 | ||||||||
|
|
|
|
|
|
|
| |||||||||||
1Included in net realized gain (loss) on foreign currency transactions and net change in unrealized appreciation (depreciation) on foreign currency transactions within the Statement of Operations.
2Included in net realized gain (loss) on investments and net change in unrealized appreciation (depreciation) on investments within the Statement of Operations.
3Amount less than $500.
4Included in net realized gain (loss) on options written and net change in unrealized appreciation (depreciation) on options written within the Statement of Operations.
5Included in net realized gain (loss) on swaps and net change in unrealized appreciation (depreciation) on swaps within the Statement of Operations.
6Included in net realized gain (loss) on futures and net change in unrealized appreciation (depreciation) on futures within the Statement of Operations.
The derivative investments held as of October 31, 2014 as disclosed in the Schedule of Investments and Securities Sold Short, and the amounts of realized gains and losses and changes in unrealized appreciation and depreciation on derivative investments as disclosed in the Statements of Operations, serve as indicators of the volume of derivative activity for each applicable Fund for the period ended October 31, 2014.
72
Table of Contents
VIRTUS ALTERNATIVE SOLUTIONS TRUST
NOTES TO FINANCIAL STATEMENTS
October 31, 2014
($ reported in thousands)
| E. | Derivative Risks |
A derivative contract may suffer a mark-to-market loss if the value of the contract decreases due to an unfavorable change in the market rates or values of the underlying instrument. Losses can also occur if the counterparty does not perform under the contract.
A Fund’s risk of loss from counterparty credit risk on OTC derivatives is generally limited to the aggregate unrealized gain netted against any collateral held by such Fund. For OTC options purchased, each Fund bears the risk of loss of the amount of the premiums paid plus the positive change in market values net of any collateral held by such Fund should the counterparty fail to perform under the contracts. Options written by a Fund do not typically give rise to counterparty credit risk, as options written generally obligate the Fund, and not the counterparty to perform.
With exchange traded purchased options and futures and centrally cleared swaps, there is less counterparty credit risk to the Fund since the exchange or clearinghouse, as counterparty to such instruments, guarantees against a possible default. The clearinghouse stands between the buyer and the seller of the contract; therefore, credit risk is limited to failure of the clearinghouse. While offset rights may exist under applicable law, a Fund does not have a contractual right of offset against a clearing broker or clearinghouse in the event of a default (including the bankruptcy or insolvency) of the clearing broker or clearinghouse. Additionally, credit risk exists in exchange traded futures and centrally cleared swaps with respect to initial and variation margin that is held in a clearing broker’s customer accounts. While clearing brokers are required to segregate customer margin from their own assets, in the event that a clearing broker becomes insolvent or goes into bankruptcy and at that time there is a shortfall in the aggregate amount of margin held by the clearing broker for all its clients, typically the shortfall would be allocated on a pro rata basis across all the clearing broker’s customers, potentially resulting in losses to the Fund.
In order to better define its contractual rights and to secure rights that will help a Fund mitigate its counterparty risk, each Fund may enter into an International Swaps and Derivatives Association, Inc. Master Agreement (“ISDA Master Agreement”) or similar agreement with its derivative contract counterparties. An ISDA Master Agreement is a bilateral agreement between a Fund and a counterparty that governs certain OTC derivatives and typically contains, among other things, collateral posting terms and netting provisions in the event of a default and/or termination event. Under an ISDA Master Agreement, a Fund may, under certain circumstances, offset with the counterparty certain derivative financial instruments’ payables and/or receivables with collateral held and/or posted and create one single net payment. The provisions of the ISDA Master Agreement typically permit a single net payment in the event of default including the bankruptcy or insolvency of the counterparty. However, bankruptcy or insolvency laws of a particular jurisdiction may impose restrictions on or prohibitions against the right of offset in bankruptcy, insolvency or other events. In addition, certain ISDA Master Agreements allow counterparties to OTC derivatives to terminate derivative contracts prior to maturity in the event a Fund’s net assets decline by a stated percentage or the Fund fails to meet the terms of its ISDA Master Agreements, which would cause the Fund to accelerate payment of any net liability owed to the counterparty.
| F. | Collateral Requirements and Master Netting Agreements (“MNA”) |
For derivatives traded under an ISDA Master Agreement, the collateral requirements are typically calculated by netting the mark-to-market amount for each transaction under such agreement and comparing that amount to the value of any collateral currently pledged by the Funds and the counterparty.
Cash collateral that has been pledged to cover obligations of a Fund and cash collateral received from the counterparty, if any, is reported separately on the Statements of Assets and Liabilities as cash pledged as collateral and cash received as collateral, respectively. Non-cash collateral pledged by a Fund, if any, is noted in the Schedules of Investments. Typically, the Funds and counterparties are not permitted to sell, re-pledge or use the collateral they receive. To the extent amounts due to a Fund from its counterparties are not fully collateralized, contractually or otherwise, the Fund bears the risk of loss from counterparty non-performance. The Funds attempt to mitigate counterparty risk by only entering into agreements with counterparties that they believe have the financial resources to honor their obligations and by monitoring the financial stability of those counterparties.
For financial reporting purposes, the Funds do not offset derivative assets and derivative liabilities that are subject to netting arrangements in the Statements of Assets and Liabilities.
73
Table of Contents
VIRTUS ALTERNATIVE SOLUTIONS TRUST
NOTES TO FINANCIAL STATEMENTS
October 31, 2014
($ reported in thousands)
At October 31, 2014, the Funds’ derivative assets and liabilities (by type) are as follows:
| Alternative Income Solution Fund | Alternative Inflation Solution Fund | Alternative Total Solution Fund | Strategic Income Fund | |||||||||||||||||||||||||||||
| Assets | Liabilities | Assets | Liabilities | Assets | Liabilities | Assets | Liabilities | |||||||||||||||||||||||||
Derivative Financial Instruments: | ||||||||||||||||||||||||||||||||
Futures contracts | $ | 4 | $ | — | $ | 19 | $ | — | $ | 74 | $ | 19 | $ | — | $ | — | ||||||||||||||||
Forward foreign currency exchange contracts | 31 | 8 | — | 1 | — | 236 | 112 | — | — | |||||||||||||||||||||||
Swaps | — | — | — | — | — | 3 | 114 | 8 | ||||||||||||||||||||||||
Options Purchased2 | 2 | — | 2 | — | 10 | — | 21 | — | ||||||||||||||||||||||||
Options Written | — | — | — | — | — | 1 | — | 62 | ||||||||||||||||||||||||
|
|
|
|
|
|
|
|
|
|
|
|
|
|
|
| |||||||||||||||||
Total derivative assets and liabilities in the Statement of Assets and Liabilities | $ | 37 | $ | 8 | $ | 21 | $ | — | $ | 320 | $ | 135 | $ | 135 | $ | 70 | ||||||||||||||||
|
|
|
|
|
|
|
|
|
|
|
|
|
|
|
| |||||||||||||||||
Derivatives not subject to a MNA or similar agreement | (4 | ) | — | (19 | ) | — | (82 | ) | (20 | ) | (135 | ) | (62 | ) | ||||||||||||||||||
|
|
|
|
|
|
|
|
|
|
|
|
|
|
|
| |||||||||||||||||
Total assets and liabilities subject to a MNA | $ | 33 | $ | 8 | $ | 2 | $ | — | $ | 238 | $ | 115 | $ | — | $ | 8 | ||||||||||||||||
|
|
|
|
|
|
|
|
|
|
|
|
|
|
|
| |||||||||||||||||
1 Amount is less than $500.
2Includes options purchased at value as reported in the Schedule of Investments
The following tables present the Funds’ derivative assets and liabilities by counterparty net of amounts available for offset under a MNA and net of the related collateral received/pledged by the Funds as of October 31, 2014:
| Alternative Income Solution Fund | ||||||||||||||||||||
| Counterparty | Derivative Assets Subject to a MNA by | Derivatives for Offset | Non-cash Collateral Received1 | Cash Collateral Received1 | Net Amount of Derivative Assets2 | |||||||||||||||
BNY Mellon Capital Markets LLC | $ | — | (a) | $ | — | $ | — | $ | — | $ | — | (a) | ||||||||
JPMorgan Chase Bank N.A. | 33 | (8) | — | — | 25 | |||||||||||||||
|
|
|
|
|
|
|
|
|
| |||||||||||
Total | $ | 33 | $ | (8) | $ | — | $ | — | $ | 25 | ||||||||||
|
|
|
|
|
|
|
|
|
| |||||||||||
| Counterparty | Derivative a MNA by | Derivatives Available for Offset | Non-cash Collateral Pledged3 | Cash Collateral Pledged3 | Net Amount of Derivative Liabilities4 | |||||||||||||||
JPMorgan Chase Bank N.A. | $ | 8 | $ | (8) | $ | — | $ | — | $ | — | ||||||||||
|
|
|
|
|
|
|
|
|
| |||||||||||
Total | $ | 8 | $ | (8) | $ | — | $ | — | $ | — | ||||||||||
|
|
|
|
|
|
|
|
|
| |||||||||||
Footnote Legend:
| (a) | Amount is less than $500. |
| Alternative Inflation Solution Fund | ||||||||||||||||||||
| Counterparty | Derivative a MNA by | Derivatives Available for Offset | Non-cash Collateral Received1 | Cash Collateral Received1 | Net Amount of Derivative Assets2 | |||||||||||||||
BNY Mellon Capital Markets LLC | $ | — | (a) | $ | — | $ | — | $ | — | $ | — | (a) | ||||||||
JPMorgan Chase Bank N.A. | 2 | — | — | — | 2 | |||||||||||||||
|
|
|
|
|
|
|
|
|
| |||||||||||
Total | $ | 2 | $ | — | $ | — | $ | — | $ | 2 | ||||||||||
|
|
|
|
|
|
|
|
|
| |||||||||||
Footnote Legend:
| (a) | Amount is less than $500. |
74
Table of Contents
VIRTUS ALTERNATIVE SOLUTIONS TRUST
NOTES TO FINANCIAL STATEMENTS
October 31, 2014
($ reported in thousands)
| Alternative Total Solution Fund | ||||||||||||||||||||
| Counterparty | Derivative Assets a MNA by | Derivatives for Offset | Non-cash Collateral Received1 | Cash Collateral | Net Amount of | |||||||||||||||
Bank of America N.A. | $ | 210 | $ | (107) | $ | — | $ | — | $ | 103 | ||||||||||
JPMorgan Chase Bank N.A. | 28 | (5) | — | — | 23 | |||||||||||||||
|
|
|
|
|
|
|
|
|
| |||||||||||
Total | $ | 238 | $ | (112) | $ | — | $ | — | $ | 126 | ||||||||||
|
|
|
|
|
|
|
|
|
| |||||||||||
| Counterparty | Derivative Liabilities Subject to a MNA by | Derivatives for Offset | Non-cash Collateral Pledged3 | Cash Collateral | Net Amount of | |||||||||||||||
Bank of America N.A. | $ | 107 | $ | (107) | $ | — | $ | — | $ | — | ||||||||||
JPMorgan Chase Bank N.A. | 5 | (5) | — | — | — | |||||||||||||||
Morgan Stanley | 3 | — | — | (3) | — | |||||||||||||||
|
|
|
|
|
|
|
|
|
| |||||||||||
Total | $ | 115 | $ | (112) | $ | — | $ | (3) | $ | — | ||||||||||
|
|
|
|
|
|
|
|
|
| |||||||||||
| Strategic Income Fund | ||||||||||||||||||||
| Counterparty | Derivative a MNA by | Derivatives Available for Offset | Non-cash Collateral Pledged3 | Cash Collateral Pledged3 | Net Amount of Derivative Liabilities4 | |||||||||||||||
JPMorgan Chase Bank N.A. | $ | 8 | $ | — | $ | (8) | $ | — | $ | — | ||||||||||
|
|
|
|
|
|
|
|
|
| |||||||||||
Total | $ | 8 | $ | — | $ | (8) | $ | — | $ | — | ||||||||||
|
|
|
|
|
|
|
|
|
| |||||||||||
1Excess of collateral received from the individual counterparty may not be shown for financial reporting purposes.
2Net amount represents the net amount receivable from the counterparty in the event of default.
3Excess of collateral pledged to the individual counterparty may not be shown for financial reporting purposes.
4Net amount represents the net amount payable due to the counterparty in the event of default.
| Note 4. | Investment Advisory Fee and Related Party Transactions |
| A. | Adviser |
Virtus Alternative Investment Advisers, Inc. (“VAIA”) is an indirect wholly-owned subsidiary of Virtus Investment Partners, Inc. (“Virtus”). The Adviser manages the Funds’ investment program and general operations of the Funds, including oversight of the Funds’ subadvisers.
As compensation for its services to the Funds, the Adviser is entitled to a fee based upon the following annual rates as a percentage of the average daily managed assets of each Fund. “Managed assets” means the total assets of the Fund including any assets attributable to borrowings minus the Fund’s accrued liabilities other than such borrowings:
| 1st $5 Billion | $5+ Billion | |||
Alternative Income Solution Fund | 1.80% | 1.75% | ||
Alternative Inflation Solution Fund | 1.75 | 1.70 | ||
Alternative Total Solution Fund | 1.95 | 1.90 | ||
Strategic Income Fund | 0.80 | 0.75 |
For Alternative Total Solution Fund, the assets of the Subsidiary are excluded from the assets on which the above-described management fee is calculated. However, under the terms of a separate investment advisory agreement, the Subsidiary pays the Adviser an investment management fee calculated on the value of the Subsidiary’s average daily managed assets at the same annual rates.
75
Table of Contents
VIRTUS ALTERNATIVE SOLUTIONS TRUST
NOTES TO FINANCIAL STATEMENTS
October 31, 2014
($ reported in thousands)
| B. | Subadvisers |
The Adviser has appointed and oversees the activities of each of the subadvisers for the Funds as listed below. For Alternative Income Solution Fund, Alternative Inflation Solution Fund and Alternative Total Solution Fund, Cliffwater Investments LLC (“Cliffwater”), a joint venture of Cliffwater LLC and Virtus Partners, Inc., an affiliate of VAIA, makes recommendations to the Adviser with respect to hiring and terminating the Funds’ other subadvisers. Based on these recommendations, the Adviser makes decisions of the hiring and termination of subadvisers, and recommends such decisions to the Board. The subadvisers other than Cliffwater each manage a portion of the investments of each Fund, for which they are paid a fee by the Adviser. At October 31, 2014, Subadvisers with respect to the Funds they serve are as follows:
Subadviser | ||||||||||||||||||||||||||
| Fund | Cliffwater (1) | Armored (2) | Ascend (3) | Brigade (4) | Credit Suisse (5) | Graham (6) | Harvest (7) | ICE Canyon (8) | LaSalle (9) | Lazard (10) | MAST (11) | Newfleet (12) | Owl Creek (13) | |||||||||||||
| Alternative Income Solution Fund | X | X | X | X | X | X | X | |||||||||||||||||||
| Alternative Inflation Solution Fund | X | X | X | X | X | X | X | |||||||||||||||||||
| Alternative Total Solution Fund | X | X | X | X | X | X | X | X | X | X | X | |||||||||||||||
| Strategic Income Fund | X | |||||||||||||||||||||||||
(1) Cliffwater Investments LLC (“Cliffwater”)
(2) Armored Wolf, LLC (“Armored Wolf”)
(3) Ascend Capital, LLC (“Ascend”)
(4) Brigade Capital Management, LLC (“Brigade”)
(5) Credit Suisse Asset Management, LLC (“Credit Suisse”)
(6) Graham Capital Management, L.P. (“Graham”)
(7) Harvest Fund Advisors LLC (“Harvest”)
(8) ICE Canyon LLC (“ICE Canyon”)
(9) LaSalle Investment Management Securities, LLC (“LaSalle”)
10) Lazard Asset Management LLC (“Lazard”)
(11) MAST Capital Management, LLC (“MAST”)
(12) Newfleet Asset Management, LLC (“Newfleet”) an indirect wholly-owned subsidiary of Virtus
(13) Owl Creek Asset Management, L.P. (“Owl Creek”)
Out of its investment management fee, the Adviser pays each subadviser a subadvisory fee. For its services to the Alternative Income Solution Fund, Alternative Inflation Solution Fund and Alternative Total Solution Fund, Cliffwater receives as its subadvisory fee 50% of the net investment management fee remaining after the Adviser pays the other subadvisers and waives and/or pays the Funds any amounts applicable under the fee waiver and expense reimbursement arrangements. For its services to the Strategic Income Fund, Newfleet receives as its Subadvisory fee 50% of the net investment management fee.
| C. | Expense Limits and Fee Waivers |
The Adviser has contractually agreed to limit each Fund’s operating expenses (excluding front-end or contingent deferred loads, dividend and interest expenses, taxes, brokerage commissions, expenses incurred in connection with any merger or reorganization, extraordinary expenses and acquired fund fees and expenses, if any), so that such expenses do not exceed, on an annualized basis, the following respective percentages of average daily managed assets from inception through April 30, 2015 (through February 29, 2016 for Strategic Income Fund):
Following the contractual period, the Adviser may discontinue these expense caps and/or fee waivers at any time.
| Fund | Class A | Class C | Class I | |||
Alternative Income Solution Fund | 2.45% | 3.20% | 2.20% | |||
Alternative Inflation Solution Fund | 2.40 | 3.15 | 2.15 | |||
Alternative Total Solution Fund | 2.60 | 3.35 | 2.35 | |||
Strategic Income Fund | 1.40 | 2.15 | 1.15 |
Under certain conditions, the Adviser may recapture operating expenses reimbursed within three fiscal years following the end of the fiscal year in which such waiver or reimbursement occurred. The Fund must pay its ordinary operating expenses before the Adviser is entitled to any reimbursement and must remain in compliance with any applicable expense limitations, or if none, the expense limitation in effect at the time of the waver or reimbursement. All or portion of the following Adviser-reimbursed expenses ($ reported in thousands) may be recaptured by the fiscal year ending:
| Expiration Date | ||
2017 | ||
Alternative Income Solution Fund | $234 | |
Alternative Inflation Solution Fund | 215 | |
Alternative Total Solution Fund | 324 | |
Strategic Income Fund | 86 |
76
Table of Contents
VIRTUS ALTERNATIVE SOLUTIONS TRUST
NOTES TO FINANCIAL STATEMENTS
October 31, 2014
($ reported in thousands)
| D. | Distributor |
VP Distributors, LLC (“VP Distributors”), an indirect wholly-owned subsidiary of Virtus, serves as the distributor of each Fund’s shares. VP Distributors has advised the Funds that for the period ended October 31, 2014, there were no commissions for Class A shares and no CDSC for Class A shares and Class C shares, respectively.
In addition, each Fund pays VP Distributors distribution and/or service fees under a 12b-1 plan as a percentage of the average daily net assets of each respective class at the annual rates as follows: a service fee at a rate of 0.25% for Class A and Class C shares and a distribution fee of 0.75% for Class C shares. Class I shares are not subject to a 12b-1 plan.
Under certain circumstances, shares of certain Virtus Mutual Funds may be exchanged for shares of the same class of certain other Virtus Mutual Funds on the basis of the relative NAV per share at the time of the exchange. On exchanges with share classes that carry a CDSC, the CDSC schedule of the original shares purchased continues to apply.
| E. | Administrator and Transfer Agent |
Virtus Fund Services, LLC, an indirect wholly-owned subsidiary of Virtus, serves as the Administrator and Transfer Agent of the Trust. BNY Mellon Investment Servicing (US) Inc. (“BNY Mellon”) services as Sub-Administrative and Accounting Agent of the Trust.
For the period ended October 31, 2014, the Funds incurred administration fees totaling $76 which are included in the Statements of Operations.
For the period ended October 31, 2014, the Funds incurred sub-administration fees of $438 of which $132 was voluntarily waived by BNY Mellon.
For the period ended October 31, 2014, the Funds incurred transfer agent fees totaling $33 which are included in the Statements of Operations. A portion of these fees was paid to outside entities that also provide services to the Funds.
| F. | Affiliated Shareholders |
At October 31, 2014, Virtus and its affiliates held shares of the Funds which may be redeemed at any time that aggregated the following:
Shares | Aggregate | |||
| Alternative Income Solution Fund | ||||
Class A | 10,151 | $ 102 | ||
Class C | 10,128 | 101 | ||
Class I | 4,043,410 | 40,555 | ||
| Alternative Inflation Solution Fund | ||||
Class A | 10,000 | 101 | ||
Class C | 10,000 | 101 | ||
Class I | 3,180,000 | 32,182 | ||
| Alternative Total Solution Fund | ||||
Class A | 10,000 | 102 | ||
Class C | 10,000 | 101 | ||
Class I | 5,780,000 | 58,840 | ||
| Strategic Income Fund | ||||
Class A | 10,017 | 119 | ||
Class C | 10,007 | 100 | ||
Class I | 2,485,233 | 24,721 |
| Note 5. | Purchase and Sales of Securities |
Purchases and sales of securities (excluding U.S. Government and agency securities, and short-term securities) during the period ended October 31, 2014, were as follows:
| Purchases | Sales | |||
Alternative Income Solution Fund | $ 55,486 | $ 18,277 | ||
Alternative Inflation Solution Fund | 29,875 | 8,608 | ||
Alternative Total Solution Fund | 150,974 | 101,391 | ||
Strategic Income Fund | 20,905 | 544 |
77
Table of Contents
VIRTUS ALTERNATIVE SOLUTIONS TRUST
NOTES TO FINANCIAL STATEMENTS
October 31, 2014
($ reported in thousands)
Purchases and sales of long-term U.S. Government and agency securities for the Funds during the period ended October 31, 2014, were as follows:
| Purchases | Sales | |||
Alternative Income Solution Fund | $ — | $ — | ||
Alternative Inflation Solution Fund | 7,046 | 601 | ||
Alternative Total Solution Fund | — | — | ||
Strategic Income Fund | 24,572 | 19,792 |
| Note 6. | Capital Shares Transactions |
Transactions in shares of capital stock, during the periods ended as indicated below, were as follows:
| Alternative Income Solution Fund | ||||||||
| From Inception April 23, 2014 to October 31, 2014 | ||||||||
| SHARES | AMOUNT | |||||||
| Class A | ||||||||
| Sale of shares | 74 | $ 762 | ||||||
| Reinvestment of distributions | 1 | 8 | ||||||
| Shares repurchased | (1) | (11) | ||||||
|
|
|
| |||||
| Net Increase / (Decrease) | 74 | $ 759 | ||||||
|
|
|
| |||||
| Class C | ||||||||
| Sale of shares | 39 | $ 389 | ||||||
| Reinvestment of distributions | — | (a) | 3 | |||||
| Shares repurchased | — | (a) | — | (a) | ||||
|
|
|
| |||||
| Net Increase / (Decrease) | 39 | $ 392 | ||||||
|
|
|
| |||||
| Class I | ||||||||
| Sale of shares | 4,075 | $40,775 | ||||||
| Reinvestment of distributions | 64 | 654 | ||||||
| Shares repurchased | (7) | (74) | ||||||
|
|
|
| |||||
| Net Increase / (Decrease) | 4,132 | $41,355 | ||||||
|
|
|
| |||||
| Alternative Inflation Solution Fund | ||||||||
| From Inception April 23, 2014 to October 31, 2014 | ||||||||
| SHARES | AMOUNT | |||||||
| Class A | ||||||||
| Sale of shares | 57 | $ 588 | ||||||
| Reinvestment of distributions | — | — | ||||||
| Shares repurchased | (8) | (85) | ||||||
|
|
|
| |||||
| Net Increase / (Decrease) | 49 | $ 503 | ||||||
|
|
|
| |||||
| Class C | ||||||||
| Sale of shares | 15 | $ 151 | ||||||
| Reinvestment of distributions | — | — | ||||||
| Shares repurchased | — | — | ||||||
|
|
|
| |||||
| Net Increase / (Decrease) | 15 | $ 151 | ||||||
|
|
|
| |||||
| Class I | ||||||||
| Sale of shares | 3,190 | $31,899 | ||||||
| Reinvestment of distributions | — | — | ||||||
| Shares repurchased | — | — | ||||||
|
|
|
| |||||
| Net Increase / (Decrease) | 3,190 | $31,899 | ||||||
|
|
|
| |||||
78
Table of Contents
VIRTUS ALTERNATIVE SOLUTIONS TRUST
NOTES TO FINANCIAL STATEMENTS
October 31, 2014
($ reported in thousands)
| Alternative Total Solution Fund | ||||||||
| From Inception April 23, 2014 to October 31, 2014 | ||||||||
| SHARES | AMOUNT | |||||||
| Class A | ||||||||
| Sale of shares | 779 | $7,919 | ||||||
| Reinvestment of distributions | — | — | ||||||
| Shares repurchased | (77) | (777) | ||||||
|
|
|
| |||||
| Net Increase / (Decrease) | 702 | $7,142 | ||||||
|
|
|
| |||||
| Class C | ||||||||
| Sale of shares | 131 | $1,328 | ||||||
| Reinvestment of distributions | — | — | ||||||
| Shares repurchased | — | — | ||||||
|
|
|
| |||||
| Net Increase / (Decrease) | 131 | $1,328 | ||||||
|
|
|
| |||||
| Class I | ||||||||
| Sale of shares | 6,395 | $64,095 | ||||||
| Reinvestment of distributions | — | — | ||||||
| Shares repurchased | (118) | (1,196) | ||||||
|
|
|
| |||||
| Net Increase / (Decrease) | 6,277 | $62,899 | ||||||
|
|
|
| |||||
| Strategic Income Fund | ||||||||
| From Inception September 8, 2014 to October 31, 2014 | ||||||||
| SHARES | AMOUNT | |||||||
| Class A | ||||||||
| Sale of shares | 12 | $ 120 | ||||||
| Reinvestment of distributions | — | — | ||||||
| Shares repurchased | — | — | ||||||
|
|
|
| |||||
| Net Increase / (Decrease) | 12 | $ 120 | ||||||
|
|
|
| |||||
| Class C | ||||||||
| Sale of shares | 10 | $ 100 | ||||||
| Reinvestment of distributions | — | — | ||||||
| Shares repurchased | — | — | ||||||
|
|
|
| |||||
| Net Increase / (Decrease) | 10 | $ 100 | ||||||
|
|
|
| |||||
| Class I | ||||||||
| Sale of shares | 2,480 | $24,800 | ||||||
| Reinvestment of distributions | 5 | 52 | ||||||
| Shares repurchased | — | — | ||||||
|
|
|
| |||||
| Net Increase / (Decrease) | 2,485 | $24,852 | ||||||
|
|
|
| |||||
Footnote Legend:
| (a) | Amount is less than $500. |
79
Table of Contents
VIRTUS ALTERNATIVE SOLUTIONS TRUST
NOTES TO FINANCIAL STATEMENTS
October 31, 2014
($ reported in thousands)
| Note 7. | 10% Shareholders |
As of October 31, 2014, each Fund had individual shareholder account(s) and/or omnibus shareholder account(s) (comprised of a group of individual shareholders), which individually amounted to more than 10% of the total shares outstanding of each such Fund as detailed below:
| % of Shares Outstanding | Number of Accounts | |||
Alternative Income Solution Fund | 96% | 1* | ||
Alternative Inflation Solution Fund | 98 | 1* | ||
Alternative Total Solution Fund | 81 | 1* | ||
Strategic Income Fund | 100 | 1* | ||
| * Shareholder account is affiliated. |
| Note 8. | Credit Risk and Asset Concentration |
In countries with limited or developing markets, investments may present greater risks than in more developed markets and the prices of such investments may be volatile. The consequences of political, social or economic changes in these markets may have disruptive effects on the market prices of these investments and the income they generate, as well as a Fund’s ability to repatriate such amounts.
High-yield/high-risk securities typically entail greater price volatility and/or principal and interest rate risk. There is a greater chance that an issuer will not be able to make principal and interest payments on time. Analysis of the creditworthiness of issuers of high-yield/high-risk securities may be complex, and as a result, it may be more difficult for the Adviser and/or subadvisers to accurately predict risk.
Many municipalities insure repayment for their obligations. Although bond insurance reduces the risk of loss due to default by an issuer, such bonds remain subject to the risk that the market may fluctuate for other reasons, and there is no assurance that the insurance company will meet its obligations. Insured securities have been identified in the Schedule of Investments. A real or perceived decline in creditworthiness of a bond insurer can have an adverse impact on the value of insured bonds held in the Funds.
Certain Funds may invest a high percentage of their assets in specific sectors or countries of the market in their pursuit of a greater investment return. Fluctuations in these sectors of concentration may have a greater impact on a Fund, positive or negative, than if the Fund did not concentrate its investments in such sectors.
| Note 9. | Illiquid and Restricted Securities |
Investments are generally considered illiquid if they cannot be disposed of within seven days in the ordinary course of business at the approximate amount at which such securities have been valued by the Fund. Additionally, the following information is also considered in determining liquidity: the frequency of trades and quotes for the investment, whether the investment is listed for trading on a recognized domestic exchange and/or whether two or more brokers are willing to purchase or sell the security at a comparable price, the extent of market making activity in the investment and the nature of the market for investment. Illiquid securities are footnoted as such at the end of each Fund’s Schedule of Investments where applicable. However, a portion of such footnoted securities could be liquid where the subadviser determines that some, though not all, of the position could be disposed of within seven days in the ordinary course of business at the approximate amount at which such securities have been valued by the Fund.
Restricted securities are illiquid securities, as defined above, not registered under the Securities Act of 1933, as amended (the “1933 Act”). Generally, 144A securities are excluded from this category, except where defined as illiquid.
Each Fund will bear any costs, including those involved in registration under the 1933 Act, in connection with the disposition of such securities.
At October 31, 2014, the Funds did not hold any securities that are both illiquid and restricted.
| Note 10. | Federal Income Tax Information |
At October 31, 2014, federal tax cost and aggregate gross unrealized appreciation (depreciation) of securities held by the Funds were as follows:
Fund | Federal Tax Cost (Proceeds) | Unrealized Appreciation | Unrealized (Depreciation) | Net Unrealized Appreciation (Depreciation) | ||||||||||||
Alternative Income Solution Fund - Investments | $42,784 | $1,283 | $(1,408) | $(125) | ||||||||||||
Alternative Income Solution Fund - Short Sales | (2,003) | — | (87) | (87) | ||||||||||||
Alternative Inflation Solution Fund - Investments | 32,490 | 1,587 | (930) | 657 | ||||||||||||
Alternative Inflation Solution Fund - Short Sales | (2,111) | — | (93) | (93) | ||||||||||||
Alternative Total Solution Fund - Investments | 74,126 | 1,787 | (1,675) | 112 | ||||||||||||
Alternative Total Solution Fund - Short Sales and Written Options | (8,047) | 69 | (354) | (285) | ||||||||||||
Strategic Income Fund - Investments | 26,498 | 133 | (186) | (53) | ||||||||||||
Strategic Income Fund - Written Options | (62) | — | — | — | ||||||||||||
The differences between book basis cost and tax basis cost were attributable primarily to the tax deferral of losses on wash sales, passive activity losses and the investment in the wholly-owned Subsidiary.
80
Table of Contents
VIRTUS ALTERNATIVE SOLUTIONS TRUST
NOTES TO FINANCIAL STATEMENTS
October 31, 2014
($ reported in thousands)
Certain Funds have capital-loss carryforwards available to offset future realized capital gains.
| Short-Term | Long-Term | |||||
Alternative Inflation Solution Fund | 62 | 165 | ||||
Strategic Income Fund | 106 | 23 |
Under the Regulated Investment Company Modernization Act of 2010 (the “Act”), net capital losses recognized for tax years beginning after December 22, 2010, may be carried forward indefinitely, and their character is retained as short-term and/or long-term losses.
The components of distributable earnings on a tax basis (excluding unrealized appreciation (depreciation) which are disclosed in the beginning of this note) consist of the following:
| Undistributed Ordinary Income | Undistributed Long-Term Capital Gains | |||
Alternative Income Solution Fund | $ 263 | $ 17 | ||
Alternative Inflation Solution Fund | 49 | — | ||
Alternative Total Solution Fund | 1,138 | 29 | ||
Strategic Income Fund | 49 | — |
The differences between the book and tax basis components of distributable earnings relate principally to the timing of recognition of income and gains for federal income tax purposes. Short-term gain distributions reported in the Statements of Changes in Net Assets, if any, are reported as ordinary income for federal tax purposes, reversal of consolidation entries, disallowed expenses from short sales, swap income reclass and gain/loss reclass of forward contracts. Distributions are determined on a tax basis and may differ from net investment income and realized capital gains for financial reporting purposes.
The tax character of dividends and distributions paid during the period ended October 31, 2014 was as follows:
| Ordinary Income | ||||
Alternative Income Solution Fund | 2014 | $665 | ||
Strategic Income Fund | 2014 | 49 |
| Note | 11. Reclassification of Capital Accounts |
For financial reporting purposes, book basis capital accounts are adjusted to reflect the tax character of permanent book/tax differences. Permanent reclassifications can arise from differing treatment of certain income and gain transactions, nondeductible current year net operating losses, expiring capital loss carryovers and investments in passive foreign investment companies. The reclassifications have no impact on the net assets or NAV of a Fund. As of October 31, 2014, each Fund recorded reclassifications to increase (decrease) the accounts as listed below:
| Undistributed Net Investment Income (Loss) | Accumulated Realized (Loss) | Net Unrealized Appreciation (Depreciation) | Paid in Capital on shares of Beneficial Interest | |||||
Alternative Income Solution Fund | $ (10) | $ 9 | $ — | $ 1 | ||||
Alternative Inflation Solution Fund | — (a) | (1) | — | 1 | ||||
Alternative Total Solution Fund | 176 | 21 | (198) | 1 | ||||
Strategic Income Fund | 2 | (2) | — | — |
Footnote Legend:
| (a) | Amount is less than $500. |
| Note | 12. Indemnifications |
Under the Trust’s organizational documents, its Trustees and officers are indemnified against certain liabilities arising out of the performance of their duties to the Funds. Each Trustee has entered into an indemnification agreement with the Trust. In addition, in the normal course of business, the Funds enter into contracts that provide a variety of indemnifications to other parties. The Funds’ maximum exposure under these arrangements is unknown as this would involve future claims that may be made against the Funds and that have not occurred. However, the Funds have not had prior claims or losses pursuant to these arrangements and expect the risk of loss to be remote.
| Note | 13. Subsequent Event Evaluation |
Management has evaluated the impact of all subsequent events on the Funds through the date the financial statements were available for issuance, and has determined that the following subsequent event requires recognition or disclosure in the financial statements.
Effective November 19, 2014, the Alternative Total Solution Fund began offering Class R6 Shares.
81
Table of Contents
REPORT OF INDEPENDENT REGISTERED PUBLIC ACCOUNTING FIRM
To the Board of Trustees and Shareholders of Virtus Alternative Solutions Trust:
In our opinion, the accompanying statements of assets and liabilities, including the schedules of investments and securities sold short of Virtus Alternative Income Solution Fund and Virtus Alternative Inflation Solution Fund and the schedule of investments of Virtus Strategic Income Fund, and the related statements of operations and of changes in net assets and the financial highlights of Virtus Alternative Income Solution Fund, Virtus Alternative Inflation Solution Fund and Virtus Strategic Income Fund and the accompanying consolidated statement of assets and liabilities, including the consolidated schedule of investments and securities sold short, and the related consolidated statements of operations and of changes in net assets and the financial highlights of Virtus Alternative Total Solution Fund and its subsidiary present fairly, in all material respects, the financial position of Virtus Alternative Income Solution Fund, Virtus Alternative Inflation Solution Fund, Virtus Alternative Total Solution Fund and Virtus Strategic Income Fund (constituting Virtus Alternative Solutions Trust, hereafter referred to as the “Funds”) at October 31, 2014, and the results of each of their operations, the changes in each of their net assets and the financial highlights for the period April 23, 2014 (commencement of operations) through October 31, 2014 for Virtus Alternative Income Solution Fund, Virtus Alternative Inflation Solution Fund and Virtus Alternative Total Solution Fund and for the period September 8, 2014 (commencement of operations) through October 31, 2014 for Virtus Strategic Income Fund, in conformity with accounting principles generally accepted in the United States of America. These financial statements and financial highlights (hereafter referred to as “financial statements”) are the responsibility of the Funds’ management; our responsibility is to express an opinion on these financial statements based on our audits. We conducted our audits of these financial statements in accordance with the standards of the Public Company Accounting Oversight Board (United States). Those standards require that we plan and perform the audit to obtain reasonable assurance about whether the financial statements are free of material misstatement. An audit includes examining, on a test basis, evidence supporting the amounts and disclosures in the financial statements, assessing the accounting principles used and significant estimates made by management, and evaluating the overall financial statement presentation. We believe that our audits, which included confirmation of securities at October 31, 2014 by correspondence with the custodian and brokers, provide a reasonable basis for our opinion.
PricewaterhouseCoopers LLP
Philadelphia, Pennsylvania
December 23, 2014
82
Table of Contents
VIRTUS ALTERNATIVE SOLUTIONS TRUST
TAX INFORMATION NOTICE
October 31, 2014
For the fiscal period ended October 31, 2014, the Funds make the following disclosures for federal income tax purposes. Below is listed the percentages, or the maximum amount allowable, of its ordinary income dividends (“QDI”) to qualify for the lower tax rates applicable to individual shareholders, and the percentage of ordinary income dividends earned by the Funds which qualifies for the dividends received deduction (“DRD”) for corporate shareholders. The Funds designate the amounts below as long-term capital gains dividends (“LTCG”) ($ reported in thousands), or if subsequently different, the amounts will be designated in the next annual report. The actual percentage for the calendar year will be designated in year-end tax statements.
Fund | QDI | DRD | LTCG | |||||||
Alternative Income Solution Fund | 14.90 | % | 5.08 | % | $ 17 | |||||
Alternative Inflation Solution Fund | 100.00 | % | 60.86 | % | — | |||||
Alternative Total Solution Fund | 12.14 | % | 7.77 | % | 29 | |||||
83
Table of Contents
CONSIDERATION OF ADVISORY AND SUBADVISORY AGREEMENTS FOR
STRATEGIC INCOME FUND (THE “FUND”) BY THE BOARD OF TRUSTEES
The Board of Trustees (the “Board”) of Virtus Alternative Solutions Trust (the “Trust”) is responsible for determining whether to approve the establishment and continuation of the investment advisory agreement (the “Advisory Agreement”) between the Fund and Virtus Alternative Investment Advisers, Inc. (“VAIA”) and the subadvisory agreement (the “Subadvisory Agreement” and together with the Advisory Agreement, the “Agreements”) among the Fund, VAIA and Newfleet Asset Management, LLC (“Newfleet” or the “Subadviser”). At an in-person meeting held July 17, 2014, the Board, including a majority of the Trustees who are not interested persons of the Trust as defined in Section 2(a)(19) of the Investment Company Act of 1940, as amended (the “Independent Trustees”), considered and approved the establishment of the Agreements, as further discussed below.
In connection with the approval of the Agreements, the Board requested and evaluated information provided by VAIA and the Subadviser which, in the Board’s view, constituted information necessary for the Board to form a judgment as to whether approval of each of the Agreements would be in the best interests of the Fund and its shareholders.
The Board was separately advised by independent legal counsel throughout the process. For each Agreement, the Board considered all the criteria separately with respect to the Fund and its shareholders. In its deliberations, the Board considered various factors, including those discussed below, none of which were controlling, and each Trustee may have attributed different weights to the various factors. The Board also discussed the proposed approval of the Agreements in private sessions with its independent legal counsel at which no representatives of management were present.
In considering whether to approve the Agreements with respect to the Fund, the Board reviewed and analyzed the factors it deemed relevant, including: (1) the nature, extent and quality of the services to be provided to the Fund by VAIA and the Subadviser; (2) applicable comparative model performance information; (3) the level and method of computing the Fund’s advisory and subadvisory fees, and comparisons of the Fund’s proposed advisory fee rates with those of a group of other funds with similar investment objectives; (4) the projected profitability of VAIA and its affiliates under the Advisory Agreement; (5) any “fall-out” benefits to VAIA, the Subadviser and their affiliates (i.e., ancillary benefits realized by VAIA, the Subadviser or their affiliates from VAIA’s or the Subadviser’s relationship with the Fund); (6) possible conflicts of interest; and (7) the terms of the Agreements.
Nature, Extent, and Quality of the Services
The Trustees received in advance of the meeting information provided by VAIA and the Subadviser, concerning a number of topics, including such company’s investment philosophy, resources, operations and compliance structure. The Trustees also received a presentation by VAIA’s senior management personnel, during which among other items, VAIA’s history, investment process, investment strategies, personnel, compliance procedures and the firm’s overall performance were reviewed and discussed. The Trustees noted that the Fund would be managed using a “manager of managers” structure that generally involves the use of one or more subadvisers to manage some or all of the Fund’s portfolio. Under this structure, VAIA is responsible for oversight of the Fund’s investment programs and day-to-day operations and for evaluating and selecting subadvisers on an ongoing basis and making any recommendations to the Board regarding hiring, retaining or replacing subadvisers. In considering the Agreement with VAIA, the Board considered VAIA’s process for supervising and managing the Fund’s subadviser, including (a) VAIA’s ability to select and monitor the subadviser; (b) VAIA’s ability to provide the services necessary to monitor the subadviser’s compliance with the Fund’s investment objectives, policies and restrictions as well as provide other oversight activities; and (c) VAIA’s ability and willingness to identify instances in which a subadviser should be replaced and to carry out the required changes. The Trustees also considered: (a) the experience and capability of VAIA’s management and other personnel; (b) the financial condition of VAIA, and whether it had the financial wherewithal to provide a high level and quality of services to the Fund; (c) the quality of VAIA’s own regulatory and legal compliance policies, procedures and systems; (d) the nature, extent and quality of administrative and other services expected to be provided by VAIA and its affiliates to the Fund; (e) VAIA’s expected supervision of the Fund’s other service providers; and (f) VAIA’s risk management processes. It was noted that Virtus Fund Services, LLC, an affiliate of VAIA, was expected to serve as administrator and transfer agent and that VP Distributors, LLC (“VP Distributors”), an affiliate of VAIA, was expected to serve as distributor to the Fund. The Board also took into account its knowledge of VAIA’s management and the quality of the performance of its duties with respect to other Virtus Funds through Board meetings, discussions and reports, as well as information from the Trust’s Chief Compliance Officer regarding the Fund’s compliance policies and procedures proposed to be established pursuant to Rule 38a-1 under the Investment Company Act of 1940, as amended.
With respect to the services to be provided by the Subadviser, the Board considered information provided to the Board by the Subadviser, including the Subadviser’s Form ADV, as well as a presentation provided by portfolio management personnel of the Subadviser. With respect to the Subadvisory Agreement, the Board noted that the Subadviser would provide portfolio management, compliance with the Fund’s investment policies and procedures, compliance with applicable securities laws and assurances thereof. In considering approval of the Subadvisory Agreement, the Board also considered the Subadviser’s investment management process, including (a) the experience and capability of the Subadviser’s management and other personnel committed by the Subadviser to the Fund; (b) the financial condition of the Subadviser; (c) the quality of the Subadviser’s regulatory and legal compliance policies, procedures and systems; and (d) the Subadviser’s brokerage and trading practices, including with respect to best execution and soft dollars. The Board also took into account the Subadviser’s risk assessment and monitoring process. The Board noted the Subadviser’s regulatory history, including whether it was currently involved in any regulatory actions or investigations as well as material litigation, and any settlements and amelioratory actions undertaken, as appropriate.
After considering all of the information provided to them, the Trustees concluded that the nature, extent and quality of the services expected to be provided by VAIA and the Subadviser were satisfactory and that there was a reasonable basis on which to conclude that each would provide a high quality of investment services to the Fund.
84
Table of Contents
CONSIDERATION OF ADVISORY AND SUBADVISORY AGREEMENTS FOR
STRATEGIC INCOME FUND (THE “FUND”) BY THE BOARD OF TRUSTEES
Investment Performance
Because the Fund had not commenced operations, the Board could not evaluate prior investment performance for the Fund. The Board reviewed and was satisfied with certain model performance information provided that was based upon the Fund’s proposed investment strategies.
Management Fees and Total Expenses
The Board considered the fees proposed to be charged to the Fund for advisory services as well as the expected total expense levels of the Fund. Among other data provided, the Board noted that the proposed management fee and total expenses for the Fund were within the range of other funds deemed to be comparable to the Fund by management. The Board noted that the Fund was expected to have an expense cap in place to limit the total expenses incurred by the Fund and its shareholders. The Board also noted that the subadvisory fee for the Fund would be paid by VAIA out of its advisory fee rather than paid separately by the Fund. In this regard, the Board took into account management’s discussion with respect to the advisory/subadvisory fee structure, including the amount of the advisory fee retained by VAIA after payment of the subadvisory fee. The Board also took into account the expected size of the Fund and the impact on expenses.
The Board concluded that the proposed advisory and subadvisory fees for the Fund were fair and reasonable in light of the usual and customary charges made for services of the same nature and quality and the other factors considered.
Projected Profitability
The Board also considered certain information relating to projected profitability that had been provided by VAIA. In this regard, the Board considered information regarding the projected profitability of VAIA for its management of the Fund, as well as the projected profitability of its affiliates providing other services to the Fund, such as distribution and administrative services provided to the Fund by a VAIA affiliate. In addition to the fees paid to VAIA and its affiliates, the Board considered any other benefits derived by VAIA or its affiliates from their relationship with the Fund. The Board concluded that the projected profitability to VAIA and its affiliates from the Fund was reasonable in light of the quality of the services to be rendered to the Fund by VAIA and its affiliates.
In considering the projected profitability to the Subadviser in connection with its relationship to the Fund, the Board noted that the fees under the Subadvisory Agreement would be paid by VAIA out of the fees that VAIA received under the Advisory Agreement, so that Fund shareholders would not be directly impacted by those fees. In considering the reasonableness of the fees payable by VAIA to the affiliated Subadviser, the Board noted that, because the Subadviser is an affiliate of VAIA, such profitability might be directly or indirectly shared by VAIA. For each of the above reasons, the Board concluded that the projected profitability to the Subadviser and its affiliates from their relationship with the Fund was not a material factor in approval of the Subadvisory Agreement.
Economies of Scale
The Board received and discussed information concerning whether VAIA should be expected to realize economies of scale as the Fund’s assets grow. The Board noted that expense caps were expected to be implemented for the Fund. The Board also took into account management’s discussion of the Fund’s management fee and subadvisory fee structure. The Board also took into account the expected size of the Fund. The Board noted that VAIA and the Fund may realize certain economies of scale if the assets of the Fund were to be materially higher than anticipated, particularly in relationship to certain fixed costs, and that shareholders of the Fund would have an opportunity to benefit from these economies of scale.
For similar reasons as stated above with respect to the Subadviser’s profitability, and based upon the expected size of the Fund to be managed by the Subadviser, the Board concluded that the potential for economies of scale in the Subadviser’s management of the Fund was not a material factor in the approval of the Subadvisory Agreements at this time.
Other Benefits
The Board considered other benefits that may be realized by VAIA and the Subadviser and their respective affiliates from their relationships with the Fund. Among them, the Board recognized that VP Distributors, LLC, an affiliate of VAIA, serves as the distributor for the Trust, and, as such, was expected to receive payments pursuant to Rule 12b-1 from the Fund to compensate it for providing shareholder services and selling activities, which could lead to growth in the Fund’s assets and corresponding benefits from such growth, including economies of scale. The Board also noted that Virtus Fund Services, LLC also was expected to provide administrative and transfer agency services to the Fund. The Board noted management’s discussion of the fact that there were no other direct benefits to the Subadviser or VAIA in providing investment advisory services to the Fund, other than the fees to be earned under the Agreements, although there may be certain indirect benefits gained, including to the extent that serving the Fund could provide the opportunity to provide advisory services to additional portfolios of the Trust or certain reputational benefits.
Conclusion
Based on all of the foregoing considerations, the Board, including a majority of the Independent Trustees, determined that approval of each Agreement was in the best interests of the Fund and its shareholders. Accordingly, the Board, and the Independent Trustees voting separately, approved the Agreements with respect to the Fund.
85
Table of Contents
(Unaudited)
Information pertaining to the trustees and officers of the Trust as of October 31, 2014, is set forth below. The statement of additional information (SAI) includes additional information about the trustees and is available without charge, upon request, by calling (800) 243-1574. The address of each individual, unless otherwise noted, is 100 Pearl Street, Hartford, CT 06103-4506. There is no stated term of office for trustees of the Trust.
Independent Trustees
Name, Year of Birth, Year Elected and Number of Funds Overseen
| Principal Occupation(s) During Past 5 Years and Other Directorships Held by Trustee
| |
Thomas F. Mann Jr. YOB: 1950 Elected: 2013 7 Funds
|
Managing Director and Group Head Financial Institutions Group (2003 to 2012), Societe Generale Sales of Capital Market Solutions and Products; Founder, MannMaxx Management (since 2010); Trustee (since 2002), The Hatteras Funds (20 portfolios); Trustee/Director (since 2011), Virtus Closed-End Funds (3 portfolios); and Trustee (since 2013), Virtus Alternative Solutions Trust (4 portfolios).
| |
Philip R. McLoughlin Chairman YOB: 1946 Elected: 2013 66 Funds
|
Partner (since 2006), Cross Pond Partners, LLC (strategy consulting firm); Managing Director (2009 to 2010), SeaCap Asset Management Fund I, L.P. and SeaCap Partners, LLC (investment management); Director (since 1991) and Chairman (since 2010), World Trust Fund (closed-end investment firm in Luxembourg); Director (since 1995), closed-end funds managed by Duff & Phelps Investment Management Co. (4 portfolios); Chairman (since 2002) and Trustee (since 1989), Virtus Mutual Fund Complex (46 portfolios); Chairman and Trustee (since 2003), Virtus Variable Insurance Trust (9 portfolios); Trustee/Director and Chairman (since 2011), Virtus Closed-End Funds (3 portfolios); Trustee and Chairman (since 2013), Virtus Alternative Solutions Trust (4 portfolios); and Director (1985 to 2009), Argo Group International Holdings Inc. and its predecessor, PXRE Corporation (insurance).
| |
William R. Moyer YOB: 1944 Elected: 2013 7 Funds
|
Financial and Operations Principal (2006 to present), Newcastle Distributors LLC (broker dealer); Partner (2006 to 2012), CrossPond Partners, LLC (strategy consulting firm); Partner (2008 to 2010), Seacap Partners, LLC (investment management); former Chief Financial Officer, Phoenix Investment Partners; Trustee/Director (since 2011), Virtus Closed-End Funds (3 portfolios); and Trustee (since 2013), Virtus Alternative Solutions Trust (4 portfolios).
| |
James M. Oates YOB: 1946 Elected: 2013 53 Funds
|
Managing Director (since 1994), Wydown Group (consulting firm); Trustee (since 1987), Virtus Mutual Fund Complex (46 portfolios); Director (since 1996), Stifel Financial; Director (since 1998), Connecticut River Bancorp; Chairman and Director (since 1999), Connecticut River Bank; Chairman (since 2000), Emerson Investment Management, Inc.; Director (since 2002), New Hampshire Trust Company; Chairman and Trustee (since 2005), John Hancock Fund Complex (228 portfolios); Non-Executive Chairman (2007 to 2011), Hudson Castle Group, Inc. (formerly IBEX Capital Markets, Inc.) (financial services); Trustee/Director (since 2013), Virtus Closed-End Funds (3 portfolios); and Trustee (since 2013), Virtus Alternative Solutions Trust (4 portfolios).
| |
Interested Trustee
The individual listed below is an “interested person” of the Trust, as defined in Section 2(a)(19) of the 1940 Act, as amended, and the rules and regulations thereunder.
Name, Year of Birth, Year Elected and Number of Funds Overseen
| Principal Occupation(s) During Past 5 Years and Other Directorships Held by Trustee
| |
George R. Aylward YOB: 1964 Elected: 2013 64 Funds
|
Trustee (since 2013), Virtus Alternative Solutions Trust (4 portfolios); Director, President and Chief Executive Officer (since 2008), Virtus Investment Partners, Inc. and/or certain of its subsidiaries; various senior officer positions with Virtus affiliates (since 2005); Trustee (since 2006), Virtus Mutual Funds (46 portfolios); Chairman, President and Chief Executive Officer (since 2006), The Zweig Closed-End Funds (2 portfolios); Trustee (since 2012) and President (since 2010), Virtus Variable Insurance Trust (9 portfolios); Trustee and President (since 2011), Virtus Closed-End Funds (3 portfolios); and Director (since 2013), Virtus Global Funds, PLC (2 portfolios).
| |
86
Table of Contents
FUND MANAGEMENT TABLES
(Unaudited)
(Continued)
Officers of the Trust Who Are Not Trustees
Name, Address and Year of Birth
| Principal Occupation(s) During Past 5 Years
| |
Patrick W. Bradley YOB: 1972
|
Senior Vice President, Chief Financial Officer and Treasurer (since 2013), Virtus Alternative Solutions Trust; Senior Vice President, Fund Services (since 2010), Virtus Investment Partners, Inc. and/or certain of its subsidiaries; various officer positions (since 2006) with Virtus affiliates; Senior Vice President (since 2013), Vice President (2011 to 2013), Chief Financial Officer and Treasurer (since 2004), Virtus Variable Insurance Trust; Senior Vice President (since 2013), Vice President (2011 to 2013), Chief Financial Officer and Treasurer (since 2006), Virtus Mutual Fund Complex; Senior Vice President (since 2013), Vice President (2012 to 2013) and Treasurer (Chief Financial Officer) (since 2007), The Zweig Closed-End Funds; Senior Vice President (since 2013), Vice President (2011 to 2013), Chief Financial Officer and Treasurer (since 2011), Virtus Closed-End Funds; Vice President and Assistant Treasurer (since 2011), Duff & Phelps Global Utility Income Fund Inc.; Director (since 2013), Virtus Global Funds, PLC
| |
Nancy J. Engberg YOB: 1956
|
Vice President and Chief Compliance Officer (since 2013), Virtus Alternative Solutions Trust; Vice President (since 2008) and Chief Compliance Officer (2008 to 2011), Virtus Investment Partners, Inc. and/or certain of its subsidiaries; various officer positions (since 2003) with Virtus affiliates; Vice President and Chief Compliance Officer (since 2011), Virtus Mutual Fund Complex; Vice President (since 2010), Chief Compliance Officer (since 2011), Virtus Variable Insurance Trust; Vice President and Chief Compliance Officer (since 2011), Virtus Closed-End Funds; Vice President and Chief Compliance Officer (since 2012), The Zweig Closed-End Funds.
| |
Jennifer Fromm YOB: 1973
|
Vice President, Chief Legal Officer, and Secretary (since 2013), Virtus Alternative Solutions Trust; Senior Counsel, Legal, Virtus Investment Partners, Inc. and/or certain of its subsidiaries (since 2007); Assistant Secretary of various Virtus-affiliated open-end funds (since 2008); and Vice President, Chief Legal Officer, and Secretary of Virtus Variable Insurance Trust (since 2013).
| |
Francis G. Waltman YOB: 1962
|
Executive Vice President (since 2013), Virtus Alternative Solutions Trust; Executive Vice President, Product Development (since 2009), Virtus Investment Partners, Inc. and/or certain of its subsidiaries; various senior officer positions (since 2006) with Virtus affiliates; Executive Vice President (since 2013), Senior Vice President (2008 to 2013), Virtus Mutual Fund Complex; Executive Vice President (since 2013), Senior Vice President (2010 to 2013), Virtus Variable Insurance Trust; Executive Vice President (since 2013), Senior Vice President (2011 to 2013), Virtus Closed-End Funds; and Director (since 2013), Virtus Global Funds PLC.
|
87
Table of Contents
THIS PAGE INTENTIONALLY BLANK.
Table of Contents
Virtus Alternative Solutions Trust
101 Munson Street
Greenfield, MA 01301-9668
Trustees
Philip R. McLoughlin, Chairman
George R. Aylward
Thomas F. Mann
William R. Moyer
James M. Oates
Officers
George R. Aylward, President
Francis G. Waltman, Executive Vice President
W. Patrick Bradley, Senior Vice President,
Chief Financial Officer and Treasurer
Jennifer Fromm, Vice President, Chief Legal
Officer, Counsel and Secretary
Nancy J. Engberg, Vice President and
Chief Compliance Officer
Investment Adviser
Virtus Alternative Investment Advisers, Inc.
100 Pearl Street
Hartford, CT 06103-4506
Principal Underwriter
VP Distributors, LLC
100 Pearl Street
Hartford, CT 06103-4506
Administrator and Transfer Agent
Virtus Fund Services, LLC
100 Pearl Street
Hartford, CT 06103-4506
Custodian
Bank of New York Mellon
One Wall Street
New York, NY 10286
How to Contact Us
| Mutual Fund Services | 1-800-243-1574 | |||
| Adviser Consulting Group | 1-800-243-4361 | |||
| Telephone Orders | 1-800-367-5877 | |||
| Text Telephone | 1-800-243-1926 | |||
| Web site | http://Virtus.com | |||
Important Notice to Shareholders
The Securities and Exchange Commission has modified mailing regulations for semiannual and annual shareholder fund reports to allow mutual fund companies to send a single copy of these reports to shareholders who share the same mailing address. If you would like additional copies, please call Mutual Fund Services at 1-800-243-1574.
Table of Contents
 | ||||
P.O. Box 9874 Providence, RI 02940-8074 |
For more information about Virtus Mutual Funds,
please call your financial representative, or contact us
at 1-800-243-1574 or Virtus.com.
8554 | 12-14 |
Table of Contents
Item 2. Code of Ethics.
| (a) | The registrant, as of the end of the period covered by this report, has adopted a code of ethics that applies to the registrant’s principal executive officer, principal financial officer, principal accounting officer or controller, or persons performing similar functions, regardless of whether these individuals are employed by the registrant or a third party. |
| (c) | There have been no amendments, during the period covered by this report, to a provision of the code of ethics that applies to the registrant’s principal executive officer, principal financial officer, principal accounting officer or controller, or persons performing similar functions, regardless of whether these individuals are employed by the registrant or a third party, and that relates to any element of the code of ethics description. |
| (d) | The registrant has not granted any waivers, including an implicit waiver, from a provision of the code of ethics that applies to the registrant’s principal executive officer, principal financial officer, principal accounting officer or controller, or persons performing similar functions, regardless of whether these individuals are employed by the registrant or a third party, that relates to one or more of the items set forth in paragraph (b) of this item’s instructions. |
Item 3. Audit Committee Financial Expert.
| (a)(1) | The Registrant’s Board of Trustees has determined that the Registrant has an “audit committee financial expert” serving on its Audit Committee. |
| (a)(2) | The Registrant’s Board of Trustees has determined that William Moyer possesses the technical attributes identified in Instruction 2(b) of Item 3 to Form N-CSR to qualify as an “audit committee financial expert.” Mr. Moyer is an “independent” trustee as defined in paragraph (a)(2) of Item 3 to Form N-CSR. |
| (a)(3) | Not applicable. |
Item 4. Principal Accountant Fees and Services.
Audit Fees
| (a) | The aggregate fees billed for the last fiscal year for professional services rendered by the principal accountant for the audit of the registrant’s annual financial statements or services that are normally provided by the accountant in connection with statutory and regulatory filings or engagements for those fiscal years are $19,780 for 2014. The Registrant was not operational in 2013. |
Table of Contents
Audit-Related Fees
| (b) | The aggregate fees billed in the last fiscal year for assurance and related services by the principal accountant that are reasonably related to the performance of the audit of the registrant’s financial statements and are not reported under paragraph (a) of this Item are $3,075 for 2014. The Registrant was not operational in 2013. Such audit-related fees include cross fund fees. |
Tax Fees
| (c) | The aggregate fees billed in the last fiscal year for professional services rendered by the principal accountant for tax compliance, tax advice, and tax planning are $0 for 2014. The Registrant was not operational in 2013. |
All Other Fees
| (d) | The aggregate fees billed in the last fiscal year for products and services provided by the principal accountant, other than the services reported in paragraphs (a) through (c) of this Item are $0 for 2014. The Registrant was not operational in 2013. |
| (e)(1) | Disclose the audit committee’s pre-approval policies and procedures described in paragraph (c)(7) of Rule 2-01 of Regulation S-X. |
The Board of Trustees of Virtus Alternative Solutions Trust (the “Fund”) has adopted policies and procedures with regard to the pre-approval of services provided by its independent auditors. Audit, audit-related and tax compliance services provided to the Fund on an annual basis require specific pre-approval by the Board. The Audit Committee must approve other non-audit services provided to the Fund and those non-audit services provided to the Fund’s Affiliated Service Providers that relate directly to the operations and financial reporting of the Fund. Certain of these non-audit services that the Audit Committee believes are a) consistent with the SEC’s auditor independence rules and b) routine and recurring services that will not impair the independence of the independent auditors may be approved by the Committee without consideration on a specific case-by-case basis (“general pre-approval”).
The Audit Committee has determined that William Moyer, Chair of the Audit Committee, may provide pre-approval for such services that meet the above requirements in the event such approval is sought between regularly scheduled meetings. In any event, the Audit Committee is informed of each service approved subject to general pre-approval at the next regularly scheduled in-person board meeting.
| (e)(2) | The percentage of services described in each of paragraphs (b) through (d) of this Item that were approved by the audit committee pursuant to paragraph (c)(7)(i)(C) of Rule 2-01 of Regulation S-X are as follows: |
| (b) | 0% |
| (c) | 0% |
| (d) | N/A |
Table of Contents
| (f) | The percentage of hours expended on the principal accountant’s engagement to audit the registrant’s financial statements for the most recent fiscal year that were attributed to work performed by persons other than the principal accountant’s full-time, permanent employees was less than fifty percent. |
| (g) | The aggregate non-audit fees billed by the registrant’s accountant for services rendered to the registrant, and rendered to the registrant’s investment adviser (not including any sub-adviser whose role is primarily portfolio management and is subcontracted with or overseen by another investment adviser), and any entity controlling, controlled by, or under common control with the adviser that provides ongoing services to the registrant for each of the last fiscal year of the registrant was $522,953 for 2014. The Registrant was not operational in 2013. |
| (h) | The registrant’s audit committee of the board of directors has considered whether the provision of non-audit services that were rendered to the registrant’s investment adviser (not including any sub-adviser whose role is primarily portfolio management and is subcontracted with or overseen by another investment adviser), and any entity controlling, controlled by, or under common control with the investment adviser that provides ongoing services to the registrant that were not pre-approved pursuant to paragraph (c)(7)(ii) of Rule 2-01 of Regulation S-X is compatible with maintaining the principal accountant’s independence. |
Item 5. Audit Committee of Listed Registrants.
Not applicable.
Item 6. Investments.
| (a) | Schedule of Investments in securities of unaffiliated issuers as of the close of the reporting period is included as part of the report to shareholders filed under Item 1 of this form. |
| (b) | Not applicable. |
| Item 7. | Disclosure of Proxy Voting Policies and Procedures for Closed-End Management Investment Companies. |
Not applicable.
Item 8. Portfolio Managers of Closed-End Management Investment Companies.
Not applicable.
| Item 9. | Purchases of Equity Securities by Closed-End Management Investment Company and Affiliated Purchasers. |
Not applicable.
Table of Contents
Item 10. Submission of Matters to a Vote of Security Holders.
There have been no material changes to the procedures by which the shareholders may recommend nominees to the registrant’s board of trustees, where those changes were implemented after the registrant last provided disclosure in response to the requirements of Item 407(c)(2)(iv) of Regulation S-K (17 CFR 229.407) (as required by Item 22(b)(15) of Schedule 14A (17 CFR 240.14a-101)), or this Item.
Item 11. Controls and Procedures.
| (a) | The registrant’s principal executive and principal financial officers, or persons performing similar functions, have concluded that the registrant’s disclosure controls and procedures (as defined in Rule 30a-3(c) under the Investment Company Act of 1940, as amended (the “1940 Act”) (17 CFR 270.30a-3(c))) are effective, as of a date within 90 days of the filing date of the report that includes the disclosure required by this paragraph, based on their evaluation of these controls and procedures required by Rule 30a-3(b) under the 1940 Act (17 CFR 270.30a-3(b)) and Rules 13a-15(b) or 15d-15(b) under the Securities Exchange Act of 1934, as amended (17 CFR 240.13a-15(b) or 240.15d-15(b)). |
| (b) | There were no changes in the registrant’s internal control over financial reporting (as defined in Rule 30a-3(d) under the 1940 Act (17 CFR 270.30a-3(d)) that occurred during the registrant’s second fiscal quarter of the period covered by this report that has materially affected, or is reasonably likely to materially affect, the registrant’s internal control over financial reporting. |
Item 12. Exhibits.
| (a)(1) | Code of ethics, or any amendment thereto, that is the subject of disclosure required by Item 2 is attached hereto. |
| (a)(2) | Certifications pursuant to Rule 30a-2(a) under the 1940 Act and Section 302 of the Sarbanes-Oxley Act of 2002 are attached hereto. |
| (a)(3) | Not applicable. |
| (b) | Certifications pursuant to Rule 30a-2(b) under the 1940 Act and Section 906 of the Sarbanes-Oxley Act of 2002 are attached hereto. |
(12.other) Not applicable.
Table of Contents
SIGNATURES
Pursuant to the requirements of the Securities Exchange Act of 1934 and the Investment Company Act of 1940, the registrant has duly caused this report to be signed on its behalf by the undersigned, thereunto duly authorized.
(Registrant) | Virtus Alternative Solutions Trust |
By (Signature and Title)* | /s/ George R. Aylward | |
George R. Aylward, President | ||
(principal executive officer) |
Date | January 8, 2015 |
Pursuant to the requirements of the Securities Exchange Act of 1934 and the Investment Company Act of 1940, this report has been signed below by the following persons on behalf of the registrant and in the capacities and on the dates indicated.
By (Signature and Title)* | /s/ George R. Aylward | |
George R. Aylward, President | ||
(principal executive officer) |
Date | January 8, 2015 |
By (Signature and Title)* | /s/ W. Patrick Bradley | |
W. Patrick Bradley, Senior Vice President, Chief Financial Officer and Treasurer | ||
(principal financial and accounting officer) |
Date | January 8, 2015 |
* Print the name and title of each signing officer under his or her signature.