| FREE WRITING PROSPECTUS | ||
| FILED PURSUANT TO RULE 433 | ||
| REGISTRATION FILE NO.: 333-172366-11 | ||
 |  |
Free Writing Prospectus
Structural and Collateral Term Sheet
$1,037,956,638
(Approximate Aggregate Cut-off Date Balance of Mortgage Pool)
$905,617,000
(Approximate Aggregate Principal Balance of Offered Certificates)
WFRBS Commercial Mortgage Trust 2013-C18
as Issuing Entity
Wells Fargo Commercial Mortgage Securities, Inc.
as Depositor
Wells Fargo Bank, National Association
The Royal Bank of Scotland
Liberty Island Group I LLC
Basis Real Estate Capital II, LLC
NCB, FSB
UBS Real Estate Securities Inc.
C-III Commercial Mortgage LLC
as Sponsors and Mortgage Loan Sellers
Commercial Mortgage Pass-Through Certificates
Series 2013-C18
December 9, 2013
| WELLS FARGO SECURITIES | RBS | |
Co-Lead Manager and Co-Bookrunner | Co-Lead Manager and Co-Bookrunner | |
Deutsche Bank Securities Co-Manager | ||
STATEMENT REGARDING THIS FREE WRITING PROSPECTUS
The depositor has filed a registration statement (including a prospectus) with the Securities and Exchange Commission (‘‘SEC’’) (SEC File No. 333-172366) for the offering to which this communication relates. Before you invest, you should read the prospectus in the registration statement and other documents the depositor has filed with the SEC for more complete information about the depositor, the issuing entity and this offering. You may get these documents for free by visiting EDGAR on the SEC Web site at www.sec.gov. Alternatively, the depositor, any underwriter, or any dealer participating in the offering will arrange to send you the prospectus after filing if you request it by calling toll free 1-800-745-2063 (8 a.m. – 5 p.m. EST) or by emailing wfs.cmbs@wellsfargo.com.
Nothing in this document constitutes an offer of securities for sale in any other jurisdiction where the offer or sale is not permitted. The information contained herein is preliminary as of the date hereof, supersedes any such information previously delivered to you and will be superseded by any such information subsequently delivered and ultimately by the final prospectus relating to the securities. These materials are subject to change, completion, supplement or amendment from time to time.
STATEMENT REGARDING ASSUMPTIONS AS TO SECURITIES, PRICING ESTIMATES AND OTHER INFORMATION
The attached information contains certain tables and other statistical analyses (the “Computational Materials”) which have been prepared in reliance upon information furnished by the Mortgage Loan Sellers. Numerous assumptions were used in preparing the Computational Materials, which may or may not be reflected herein. As such, no assurance can be given as to the Computational Materials’ accuracy, appropriateness or completeness in any particular context; or as to whether the Computational Materials and/or the assumptions upon which they are based reflect present market conditions or future market performance. The Computational Materials should not be construed as either projections or predictions or as legal, tax, financial or accounting advice. You should consult your own counsel, accountant and other advisors as to the legal, tax, business, financial and related aspects of a purchase of these securities. Any weighted average lives, yields and principal payment periods shown in the Computational Materials are based on prepayment and/or loss assumptions, and changes in such prepayment and/or loss assumptions may dramatically affect such weighted average lives, yields and principal payment periods. In addition, it is possible that prepayments or losses on the underlying assets will occur at rates higher or lower than the rates shown in the attached Computational Materials. The specific characteristics of the securities may differ from those shown in the Computational Materials due to differences between the final underlying assets and the preliminary underlying assets used in preparing the Computational Materials. The principal amount and designation of any security described in the Computational Materials are subject to change prior to issuance. None of Wells Fargo Securities, LLC (“WFS”), RBS Securities Inc. (“RBSSI”), Deutsche Bank Securities Inc. or any of their respective affiliates make any representation or warranty as to the actual rate or timing of payments or losses on any of the underlying assets or the payments or yield on the securities. The information in this presentation is based upon management forecasts and reflects prevailing conditions and management’s views as of this date, all of which are subject to change. In preparing this presentation, we have relied upon and assumed, without independent verification, the accuracy and completeness of all information available from public sources or which was provided to us by or on behalf of the Mortgage Loan Sellers or which was otherwise reviewed by us.
This free writing prospectus contains certain forward-looking statements. If and when included in this free writing prospectus, the words “expects”, “intends”, “anticipates”, “estimates” and analogous expressions and all statements that are not historical facts, including statements about our beliefs or expectations, are intended to identify forward-looking statements. Any forward-looking statements are made subject to risks and uncertainties which could cause actual results to differ materially from those stated. Those risks and uncertainties include, among other things, declines in general economic and business conditions, increased competition, changes in demographics, changes in political and social conditions, regulatory initiatives and changes in customer preferences, many of which are beyond our control and the control of any other person or entity related to this offering. The forward-looking statements made in this free writing prospectus are made as of the date stated on the cover. We have no obligation to update or revise any forward-looking statement.
Wells Fargo Securities is the trade name for certain capital markets and investment banking services of Wells Fargo & Company and its subsidiaries, including Wells Fargo Securities, LLC, member FINRA and SIPC, and Wells Fargo Bank, National Association.
RBS is a trade name for the investment banking business of RBSSI. Securities, syndicated loan arranging, financial advisory and other investment banking activities are performed by RBSSI and their securities affiliates. Lending, derivatives and other commercial banking activities are performed by The Royal Bank of Scotland plc and their banking affiliates. RBSSI is a member of SIPC, FINRA and the NYSE.
IRS CIRCULAR 230 NOTICE
THIS TERM SHEET IS NOT INTENDED OR WRITTEN TO BE USED, AND CANNOT BE USED, FOR THE PURPOSE OF AVOIDING U.S. FEDERAL, STATE OR LOCAL TAX PENALTIES. THIS TERM SHEET IS WRITTEN AND PROVIDED BY THE DEPOSITOR IN CONNECTION WITH THE PROMOTION OR MARKETING BY THE DEPOSITOR AND THE CO-LEAD BOOKRUNNING MANAGERS OF THE TRANSACTION OR MATTERS ADDRESSED HEREIN. INVESTORS SHOULD SEEK ADVICE BASED ON THEIR PARTICULAR CIRCUMSTANCES FROM AN INDEPENDENT TAX ADVISOR.
IMPORTANT NOTICE REGARDING THE OFFERED CERTIFICATES
The Offered Certificates referred to in these materials and the asset pool backing them are subject to modification or revision (including the possibility that one or more classes of certificates may be split, combined or eliminated at any time prior to issuance or availability of a final prospectus) and are offered on a “when, as and if issued” basis. Prospective investors should understand that, when considering the purchase of the Offered Certificates, a contract of sale will come into being no sooner than the date on which the relevant class of certificates has been priced and the underwriters have confirmed the allocation of certificates to be made to investors; any “indications of interest” expressed by any prospective investor, and any “soft circles” generated by the underwriters, will not create binding contractual obligations for such prospective investors, on the one hand, or the underwriters, the depositor or any of their respective agents or affiliates, on the other hand.
As a result of the foregoing, a prospective investor may commit to purchase certificates that have characteristics that may change, and each prospective investor is advised that all or a portion of the certificates referred to in these materials may be issued without all or certain of the characteristics described in these materials. The underwriters’ obligation to sell certificates to any prospective investor is conditioned on the certificates and the transaction having the characteristics described in these materials. If the underwriters determine that a condition is not satisfied in any material respect, such prospective investor will be notified, and neither the depositor nor the underwriters will have any obligation to such prospective investor to deliver any portion of the Offered Certificates which such prospective investor has committed to purchase, and there will be no liability between the underwriters, the depositor or any of their respective agents or affiliates, on the one hand, and such prospective investor, on the other hand, as a consequence of the non-delivery.
Each prospective investor has requested that the underwriters provide to such prospective investor information in connection with such prospective investor’s consideration of the purchase of the certificates described in these materials. These materials are being provided to each prospective investor for informative purposes only in response to such prospective investor’s specific request. The underwriters described in these materials may from time to time perform investment banking services for, or solicit investment banking business from, any company named in these materials. The underwriters and/or their affiliates or respective employees may from time to time have a long or short position in any security or contract discussed in these materials.
The information contained herein supersedes any previous such information delivered to any prospective investor and will be superseded by information delivered to such prospective investor prior to the time of sale.
IMPORTANT NOTICE RELATING TO AUTOMATICALLY-GENERATED EMAIL DISCLAIMERS
Any legends, disclaimers or other notices that may appear at the bottom of any email communication to which this free writing prospectus is attached relating to (1) these materials not constituting an offer (or a solicitation of an offer), (2) no representation that these materials are accurate or complete and may not be updated or (3) these materials possibly being confidential, are not applicable to these materials and should be disregarded. Such legends, disclaimers or other notices have been automatically generated as a result of these materials having been sent via Bloomberg or another system.
THE INFORMATION IN THIS STRUCTURAL AND COLLATERAL TERM SHEET IS NOT COMPLETE AND MAY BE AMENDED PRIOR TO THE TIME OF SALE. THIS TERM SHEET IS NOT AN OFFER TO SELL THESE SECURITIES AND IT IS NOT A SOLICITATION OF AN OFFER TO BUY THESE SECURITIES IN ANY JURISDICTION WHERE THE OFFER OR SALE IS NOT PERMITTED.
2
| WFRBS Commercial Mortgage Trust 2013-C18 | Certificate Structure |
I. Certificate Structure
Expected Ratings (DBRS/Fitch/Moody’s)(1) | Approximate Initial Certificate Principal Balance or Notional Amount(2) | Approx. Initial Credit Support(3) | Pass-Through Rate Description | Weighted Average Life (Years)(4) | Expected Principal Window(4) | Certificate Principal to Value Ratio(5) | Certificate Principal U/W NOI Debt Yield(6) | |||
| Offered Certificates | ||||||||||
| A-1 | AAA(sf)/AAA(sf)/Aaa(sf) | $48,516,000 | 30.000% | (7) | 2.74 | 01/14 – 11/18 | 29.8% | 19.7% | ||
| A-2 | AAA(sf)/AAA(sf)/Aaa(sf) | $103,340,000 | 30.000% | (7) | 4.94 | 11/18 – 12/18 | 29.8% | 19.7% | ||
| A-3 | AAA(sf)/AAA(sf)/Aaa(sf) | $140,000,000 | 30.000% | (7) | 6.89 | 11/20 – 11/20 | 29.8% | 19.7% | ||
| A-4 | AAA(sf)/AAA(sf)/Aaa(sf) | $170,000,000 | 30.000% | (7) | 9.96 | 10/23 – 12/23 | 29.8% | 19.7% | ||
| A-5 | AAA(sf)/AAA(sf)/Aaa(sf) | $201,014,000 | 30.000% | (7) | 9.98 | 12/23 – 12/23 | 29.8% | 19.7% | ||
| A-SB | AAA(sf)/AAA(sf)/Aaa(sf) | $63,699,000 | 30.000% | (7) | 7.49 | 12/18 – 10/23 | 29.8% | 19.7% | ||
A-S(8) | AAA(sf)/AAA(sf)/Aaa(sf) | $70,062,000 | 23.250% | (7) | 10.01 | 12/23 – 01/24 | 32.6% | 18.0% | ||
| X-A | AAA(sf)/AAA(sf)/Aaa(sf) | $796,631,000(9) | N/A | Variable(10) | N/A | N/A | N/A | N/A | ||
B(8) | AA(low)(sf)/AA-(sf)/Aa3(sf) | $72,657,000 | 16.250% | (7) | 10.06 | 01/24 – 01/24 | 35.6% | 16.5% | ||
C(8) | A(low)(sf)/A-(sf)/A3(sf) | $36,329,000 | 12.750% | (7) | 10.06 | 01/24 – 01/24 | 37.1% | 15.8% | ||
PEX(8) | A(low)(sf)/A-(sf)/A1(sf) | $179,048,000 | 12.750% | (7) | 10.04 | 12/23 – 01/24 | 37.1% | 15.8% | ||
Non-Offered Certificates | ||||||||||
| D | BBB(low)(sf)/BBB-(sf)/NR | $66,169,000 | 6.375% | (7) | 10.06 | 01/24 – 01/24 | 39.8% | 14.7% | ||
| E | BB(sf)/BB(sf)/NR | $19,462,000 | 4.500% | (7) | 10.06 | 01/24 – 01/24 | 40.6% | 14.4% | ||
| F | B(sf)/B(sf)/NR | $7,785,000 | 3.750% | (7) | 10.06 | 01/24 – 01/24 | 40.9% | 14.3% | ||
| G | NR/NR/NR | $38,923,637 | 0.000% | (7) | 10.06 | 01/24 – 01/24 | 42.5% | 13.8% | ||
Notes:
| (1) | The expected ratings presented are those of DBRS, Inc. (“DBRS”), Fitch Ratings, Inc. (“Fitch”) and Moody’s Investors Service, Inc. (“Moody’s”) which the depositor hired to rate the offered certificates. One or more other nationally recognized statistical rating organizations that were not hired by the depositor may use information they receive pursuant to Rule 17g-5 under the Securities Exchange Act of 1934, as amended (the “Exchange Act”) or otherwise, to rate or provide market reports and/or published commentary related to the offered certificates. We cannot assure you as to what ratings a non-hired nationally recognized statistical rating organization would assign or that its reports will not express differing, possibly negative, views of the mortgage loans and/or the offered certificates. The ratings of each class of offered certificates address the likelihood of the timely distribution of interest and, except in the case of the Class X-A certificate, the ultimate distribution of principal due on those classes on or before the Rated Final Distribution Date. See “Risk Factors—Risks Related to the Offered Certificates—Ratings of the Certificates Have Substantial Limitations and Ratings” in the free writing prospectus, dated December 9, 2013 (the “Free Writing Prospectus”). |
| (2) | The principal balances and notional amounts set forth in the table are approximate. The actual initial principal balances and notional amounts may be larger or smaller depending on the aggregate cut-off date principal balance of the mortgage loans definitively included in the pool of mortgage loans, which aggregate cut-off date principal balance may be as much as 5% larger or smaller than the amount presented in the Free Writing Prospectus. |
| (3) | The approximate initial credit support with respect to the Class A-1, A-2, A-3, A-4, A-5 and A-SB Certificates represents the approximate credit enhancement for the Class A-1, A-2, A-3, A-4, A-5 and A-SB Certificates in the aggregate. The percentage indicated under the column “Approximate Initial Credit Support” with respect to the Class C Certificates and the Class PEX Certificates represents the approximate credit support for the Class C regular interest, which will have an initial outstanding principal balance on the closing date of $36,329,000. |
| (4) | Weighted Average Lives and Expected Principal Windows are calculated based on an assumed prepayment rate of 0% CPR and the “Structuring Assumptions” described on Annex B to the Free Writing Prospectus. |
| (5) | The Certificate Principal to Value Ratio for each Class of Certificates (other than the Class A-1, A-2, A-3, A-4, A-5 and A-SB Certificates and other than the Exchangeable Certificates) is calculated by dividing the aggregate principal balance of such class of certificates and all classes of certificates (other than the Exchangeable Certificates), if any, that are senior to such class, by the aggregate appraised value of approximately $2,440,639,205 (calculated as described in the Free Writing Prospectus) of the mortgaged properties securing the mortgage loans (excluding, with respect to each pari passu loan combination, a pro rata portion of the related appraised value allocated to the related companion loan(s) based on their cut-off date principal balance). The Certificate Principal to Value Ratios for each of the Class A-1, A-2, A-3, A-4, A-5 and A-SB Certificates are calculated by dividing the aggregate principal balance of the Class A-1, A-2, A-3, A-4, A-5 and A-SB Certificates by such aggregate appraised value (excluding, with respect to each pari passu loan combination, a pro rata portion of the related appraised value allocated to the related companion loan(s) based on their cut-off date principal balance). The Certificate Principal to Value Ratio for each of the Class A-S, B and C Certificates is calculated by dividing the aggregate principal balance of the Class A-S regular interest, the Class B regular interest or the Class C regular interest, as applicable, and all other classes of certificates (other than the Exchangeable Certificates) and the regular interests that are senior to such class, by such aggregate appraised value (excluding, with respect to each pari passu loan combination, a pro rata portion of the related appraised value allocated to the related companion loan(s) based on their cut-off date principal balance). The Certificate Principal to Value Ratio of the Class PEX Certificates is equal to the Certificate Principal to Value Ratio of the Class C Certificates. In any event, however, excess mortgaged property value associated with a mortgage loan will not be available to offset losses on any other mortgage loan (unless such mortgage loans are cross-collateralized and the cross-collateralization remains in effect). |
| (6) | The Certificate Principal U/W NOI Debt Yield for each Class of Certificates (other than the Class A-1, A-2, A-3, A-4, A-5 and A-SB Certificates and other than the Exchangeable Certificates) is calculated by dividing the underwritten net operating income (which excludes, with respect to each pari passu loan combination, a pro rata portion of the related underwritten net operating income allocated to the related companion loan(s) based on their cut-off date principal balance) for the mortgage pool of approximately $143,069,615 (calculated as described in the Free Writing Prospectus) by the aggregate certificate principal balance of such class of certificates and all classes of certificates (other than the Exchangeable Certificates), if any, that are senior to such class of certificates. The Underwritten NOI Debt Yield for each of the Class A-1, A-2, A-3, A-4, A-5 and A-SB Certificates is calculated by dividing such mortgage pool underwritten net operating income (which excludes, with respect to each pari passu loan combination, a pro rata portion of the related underwritten net operating income allocated to the related companion loan(s) based on their cut-off date principal balance) by the aggregate principal balance of the Class A-1, A-2, A-3, A-4, A-5 and A-SB Certificates. The Certificate Principal U/W NOI Debt Yield for each of the Class A-S, B and C Certificates is calculated by dividing the underwritten net operating income (which excludes, with respect to each pari passu loan combination, a pro rata portion of the related underwritten net operating income allocated to the related companion loan(s) based on their cut-off date principal balance) for the mortgage pool of approximately $143,069,615 (calculated as described in the Free Writing Prospectus) by the aggregate principal balance of the Class A-S regular interest, the Class B regular interest or the Class C regular interest, as applicable, and all other classes of certificates (other than the Exchangeable Certificates) and the regular interests that are senior to such class. The Certificate Principal U/W NOI Debt Yield of the Class PEX Certificates is equal to the Certificate Principal U/W NOI Debt Yield for the Class C Certificates. In any event, however, cash flow from each mortgaged property supports only the related mortgage loan and will not be available to support any other mortgage loan (unless such mortgage loans are cross-collateralized and the cross-collateralization remains in effect). |
THE INFORMATION IN THIS STRUCTURAL AND COLLATERAL TERM SHEET IS NOT COMPLETE AND MAY BE AMENDED PRIOR TO THE TIME OF SALE. THIS TERM SHEET IS NOT AN OFFER TO SELL THESE SECURITIES AND IT IS NOT A SOLICITATION OF AN OFFER TO BUY THESE SECURITIES IN ANY JURISDICTION WHERE THE OFFER OR SALE IS NOT PERMITTED.
3
| WFRBS Commercial Mortgage Trust 2013-C18 | Certificate Structure |
| (7) | The pass-through rates for the Class A-1, A-2, A-3, A-4, A-5, A-SB, A-S, B, C, D, E, F and G Certificates in each case will be one of the following: (i) a fixed rate per annum, (ii) the weighted average of the net mortgage interest rates on the mortgage loans for the related distribution date, (iii) a variable rate per annum equal to the lesser of (a) a fixed rate and (b) the weighted average of the net mortgage interest rates on the mortgage loans for the related distribution date or (iv) a variable rate per annum equal to the weighted average of the net mortgage interest rates on the mortgage loans for the related distribution date minus a specified percentage. For purposes of the calculation of the weighted average of the net mortgage interest rates on the mortgage loans for each distribution date, the mortgage interest rates will be adjusted as necessary to a 30/360 basis. The Class PEX Certificates will not have a pass-through rate, but will be entitled to receive the sum of the interest distributable on the Class PEX Components. The pass-through rate for the Class A-S Certificates, the Class A-S regular interest and the Class PEX Component A-S will, at all times, be the same. The pass-through rate for the Class B Certificates, the Class B regular interest and the Class PEX Component B will, at all times, be the same. The pass-through rate for the Class C Certificates, the Class C regular interest and the Class PEX Component C will, at all times, be the same. |
| (8) | The Class A-S, Class B, Class C and Class PEX Certificates are “Exchangeable Certificates”. On the closing date, the upper-tier REMIC of the issuing entity will issue the Class A-S, Class B and Class C regular interests (each a “regular interest”) which will have outstanding principal balances on the closing date of $70,062,000, $72,657,000 and $36,329,000, respectively. The regular interests will be held in a grantor trust for the benefit of the holders of the Class A-S, Class B, Class C and Class PEX Certificates. The Class A-S, Class B, Class C and Class PEX Certificates will, at all times, represent undivided beneficial ownership interests in a grantor trust that will hold those regular interests. Each class of the Class A-S, Class B and Class C Certificates will, at all times, represent an undivided beneficial ownership interest in a percentage of the outstanding certificate principal balance of the regular interest with the same alphabetical class designation. The Class PEX Certificates will, at all times, represent an undivided beneficial ownership interest in the remaining percentages of the outstanding certificate principal balances of the Class A-S, Class B and Class C regular interests and which portions of those regular interests are referred to in this Term Sheet as the Class PEX Component A-S, Class PEX Component B and Class PEX Component C (collectively, the “Class PEX Components”). Following any exchange of Class A-S, Class B and Class C Certificates for Class PEX Certificates or any exchange of Class PEX Certificates for Class A-S, Class B and Class C Certificates as described in the Free Writing Prospectus, the percentage interest of the outstanding certificate principal balances of the Class A-S, Class B and Class C regular interest that is represented by the Class A-S, Class B, Class C and Class PEX Certificates will be increased or decreased accordingly. The initial certificate principal balance of each of the Class A-S, Class B and Class C Certificates shown in the table represents the maximum certificate principal balance of such class without giving effect to any exchange. The initial certificate principal balance of the Class PEX Certificates is equal to the aggregate of the initial certificate principal balance of the Class A-S, Class B and Class C Certificates and represents the maximum certificate principal balance of the Class PEX Certificates that could be issued in an exchange. The certificate principal balances of the Class A-S, Class B and Class C Certificates to be issued on the closing date will be reduced, in required proportions, by an amount equal to the certificate principal balance of the Class PEX Certificates issued on the closing date. Distributions and allocations of payments and losses with respect to the Exchangeable Certificates are described in this Term Sheet under “Allocations and Distributions on the Class A-S, Class B, Class C and Class PEX Certificates” and under “Description of the Offered Certificates—Distributions” in the Free Writing Prospectus. The maximum certificate principal balance of the Class PEX Certificates is set forth in the table but is not included in the certificate principal balance of the certificates set forth on the cover page of this Term Sheet or on the top of the cover page of the Free Writing Prospectus. |
| (9) | The Class X-A Certificates are notional amount certificates. The Notional Amount of the Class X-A Certificates will be equal to the aggregate principal balance of the Class A-1, A-2, A-3, A-4, A-5 and A-SB Certificates and the Class A-S Regular Interest outstanding from time to time (without regard to any exchange of Class A-S, B and C Certificates for Class PEX Certificates). The Class X-A Certificates will not be entitled to distributions of principal. |
| (10) | The pass-through rate for the Class X-A Certificates for any distribution date will be a per annum rate equal to the excess, if any, of (a) the weighted average of the net mortgage interest rates on the mortgage loans for the related distribution date, over (b) the weighted average of the pass-through rates on the Class A-1, A-2, A-3, A-4, A-5 and A-SB Certificates and the Class A-S Regular Interest for the related distribution date, weighted on the basis of their respective aggregate principal balances outstanding immediately prior to that distribution date. For purposes of the calculation of the weighted average of the net mortgage interest rates on the mortgage loans for each distribution date, the mortgage interest rates will be adjusted as necessary to a 30/360 basis. |
THE INFORMATION IN THIS STRUCTURAL AND COLLATERAL TERM SHEET IS NOT COMPLETE AND MAY BE AMENDED PRIOR TO THE TIME OF SALE. THIS TERM SHEET IS NOT AN OFFER TO SELL THESE SECURITIES AND IT IS NOT A SOLICITATION OF AN OFFER TO BUY THESE SECURITIES IN ANY JURISDICTION WHERE THE OFFER OR SALE IS NOT PERMITTED.
4
| WFRBS Commercial Mortgage Trust 2013-C18 | Issue Characteristics |
II. Transaction Highlights
Mortgage Loan Sellers:
Mortgage Loan Seller | Number of Mortgage Loans | Number of Mortgaged Properties | Aggregate Cut-off Date Balance | % of Cut-off Date Pool Balance | ||||||||||||
| Wells Fargo Bank, National Association | 13 | 13 | $ | 389,425,000 | 37.5% | |||||||||||
The Royal Bank of Scotland(1) | 12 | 15 | 386,600,000 | 37.2 | ||||||||||||
| Liberty Island Group I LLC | 9 | 10 | 91,887,349 | 8.9 | ||||||||||||
| Basis Real Estate Capital II, LLC | 5 | 6 | 50,300,000 | 4.8 | ||||||||||||
| NCB, FSB | 15 | 15 | 43,924,779 | 4.2 | ||||||||||||
| UBS Real Estate Securities Inc. | 1 | 1 | 38,500,000 | 3.7 | ||||||||||||
C-III Commercial Mortgage LLC | 12 | 13 | 37,319,509 | 3.6 | ||||||||||||
| Total | 67 | 73 | $ | 1,037,956,638 | 100.0% | |||||||||||
| (1) | The mortgage loan seller referred to herein as The Royal Bank of Scotland is comprised of two affiliated companies: The Royal Bank of Scotland plc and RBS Financial Products Inc. With respect to the mortgage loans being sold for deposit into the trust by The Royal Bank of Scotland: (a) nine (9) of the mortgage loans, having an aggregate cut-off date principal balance of $366,650,000 and representing approximately 35.3% of the aggregate principal balance of the pool of mortgage loans as of the cut-off date, were originated by and are being sold to the trust only by The Royal Bank of Scotland plc and (b) three (3) of the mortgage loans, having a cut-off date principal balance of $19,950,000 and representing approximately 1.9% of the aggregate principal balance of the pool of mortgage loans as of the cut-off date are being sold to the trust by RBS Financial Products Inc. |
Loan Pool:
| Cut-off Date Balance: | $1,037,956,638 |
| Number of Mortgage Loans: | 67 |
| Average Cut-off Date Balance per Mortgage Loan: | $15,491,890 |
| Number of Mortgaged Properties: | 73 |
Average Cut-off Date Balance per Mortgaged Property(1): | $14,218,584 |
| Weighted Average Mortgage Interest Rate: | 4.714% |
| Ten Largest Mortgage Loans as % of Cut-off Date Pool Balance: | 67.0% |
| Weighted Average Original Term to Maturity (months): | 109 |
| Weighted Average Remaining Term to Maturity (months): | 109 |
Weighted Average Original Amortization Term (months)(2): | 343 |
Weighted Average Remaining Amortization Term (months)(2): | 343 |
| Weighted Average Seasoning (months): | 0 |
| (1) | Information regarding mortgage loans secured by multiple properties is based on an allocation according to relative appraised values or the allocated loan amounts or property-specific release prices set forth in the related loan documents or such other allocation as the related mortgage loan seller deemed appropriate. |
| (2) | Excludes any mortgage loan that does not amortize. |
Credit Statistics:
Weighted Average U/W Net Cash Flow DSCR(1): | 2.48 | x | ||
Weighted Average U/W Net Operating Income Debt Yield(1): | 13.8 | % | ||
Weighted Average Cut-off Date Loan-to-Value Ratio(1): | 54.4 | % | ||
Weighted Average Balloon Loan-to-Value Ratio(1): | 47.3 | % | ||
% of Mortgage Loans with Additional Subordinate Debt(2): | 6.8 | % | ||
% of Mortgage Loans with Single Tenants(3): | 1.6 | % |
| (1) | With respect to the Garden State Plaza Mortgage Loan, the AmericasMart Mortgage Loan, The Outlet Collection | Jersey Gardens Mortgage Loan and the Sullivan Center Mortgage Loan, each of which is part of a pari passu loan combination, loan-to-value ratio, debt service coverage ratio and debt yield calculations include the related pari passu companion loan(s) unless otherwise stated. Information for each residential cooperative mortgage loan is calculated using underwritten net cash flow for the related residential cooperative property which is the projected net cash flow reflected in the most recent appraisal obtained by or otherwise in the possession of the related mortgage loan seller as of the cut-off date, and the loan-to value ratio information for residential cooperative mortgage loans is based upon the appraised value of the residential cooperative property determined as if such residential cooperative property is operated as a residential cooperative. See Annex A-1 to the Free Writing Prospectus. Debt service coverage ratio, debt yield and loan-to-value ratio information takes no account of subordinate debt (whether or not secured by the mortgaged property), if any, that is allowed under the terms of any mortgage loan. |
| (2) | Ten (10) of the mortgage loans, each of which are secured by residential cooperative properties, currently have in place subordinate secured lines of credit to the related mortgage borrowers that permit future advances (such loans, collectively, the “Subordinate Coop LOCs”). The percentage figure expressed as “% of Mortgage loans with Additional Subordinate Debt” is determined as a percentage of cut-off date principal balance and does not take into account future subordinate debt (whether or not secured by the mortgaged property), if any, that may be permitted under the terms of any mortgage loan or the Pooling and Servicing Agreement. See “Description of the Mortgage Pool—Subordinate and/or Other Financing” and “—Additional Debt Financing for Mortgage Loans Secured by Residential Cooperatives” in the Free Writing Prospectus |
| (3) | Excludes mortgage loans that are secured by multiple single tenant properties. |
THE INFORMATION IN THIS STRUCTURAL AND COLLATERAL TERM SHEET IS NOT COMPLETE AND MAY BE AMENDED PRIOR TO THE TIME OF SALE. THIS TERM SHEET IS NOT AN OFFER TO SELL THESE SECURITIES AND IT IS NOT A SOLICITATION OF AN OFFER TO BUY THESE SECURITIES IN ANY JURISDICTION WHERE THE OFFER OR SALE IS NOT PERMITTED.
5
| WFRBS Commercial Mortgage Trust 2013-C18 | Issue Characteristics |
Loan Structural Features:
Amortization: Based on the Cut-off Date Pool Balance, 67.0% of the mortgage pool (60 mortgage loans) has scheduled amortization, as follows:
34.1% (41 mortgage loans) requires amortization during the entire loan term
32.8% (19 mortgage loans) provides for an interest-only period followed by an amortization period
Interest-Only: Based on the Cut-off Date Pool Balance, 33.0% of the mortgage pool (7 mortgage loans) provides for interest-only payments during the entire loan term. The Weighted Average Cut-off Date Loan-to-Value Ratio and Weighted Average U/W Net Cash Flow DSCR for those mortgage loans is 37.8% and 3.84x, respectively.
Hard Lockboxes: Based on the Cut-off Date Pool Balance, 63.3% of the mortgage pool (17 mortgage loans) has hard lockboxes in place.
Reserves: The mortgage loans require amounts to be escrowed monthly as follows (excluding any mortgage loans with springing provisions):
| Real Estate Taxes: | 63.1% of the pool |
| Insurance: | 38.6% of the pool |
| Capital Replacements: | 51.3% of the pool |
| TI/LC: | 30.7% of the pool(1) |
| (1) | The percentage of Cut-off Date Balance for loans with TI/LC reserves is based on the aggregate principal balance allocable to office, retail and mixed use properties. |
Call Protection/Defeasance: Based on the Cut-off Date Pool Balance, the mortgage pool has the following call protection and defeasance features:
77.2% of the mortgage pool (49 mortgage loans) features a lockout period, then defeasance only until an open period
18.1% of the mortgage pool (2 mortgage loans) features a lockout period, then defeasance or the greater of a prepayment premium or yield maintenance until an open period
4.2% of the mortgage pool (15 mortgage loans) features no lockout period, but requires the greater of a prepayment premium or yield maintenance for a period, then a prepayment premium until an open period
0.4% of the mortgage pool (1 mortgage loan) features a lockout period, then the greater of a prepayment period premium or yield maintenance until an open period
Please refer to Annex A-1 to the Free Writing Prospectus for further description of individual loan call protection.
THE INFORMATION IN THIS STRUCTURAL AND COLLATERAL TERM SHEET IS NOT COMPLETE AND MAY BE AMENDED PRIOR TO THE TIME OF SALE. THIS TERM SHEET IS NOT AN OFFER TO SELL THESE SECURITIES AND IT IS NOT A SOLICITATION OF AN OFFER TO BUY THESE SECURITIES IN ANY JURISDICTION WHERE THE OFFER OR SALE IS NOT PERMITTED.
6
| WFRBS Commercial Mortgage Trust 2013-C18 | Issue Characteristics |
III. Issue Characteristics
| Securities Offered: | $905,617,000 approximate monthly pay, multi-class, commercial mortgage REMIC pass-through certificates consisting of eleven classes (Classes A-1, A-2, A-3, A-4, A-5, A-SB, A-S, B, C, PEX and X-A), which are offered pursuant to a registration statement filed with the SEC. | |
| Mortgage Loan Sellers: | Wells Fargo Bank, National Association (“WFB”); The Royal Bank of Scotland (“RBS”); Liberty Island Group I LLC (“LIG I”); Basis Real Estate Capital II, LLC (“Basis”); NCB, FSB; UBS Real Estate Securities Inc. (“UBSRES”) and C-III Commercial Mortgage LLC (“CIIICM”). | |
| Co-lead Bookrunning Managers: | Wells Fargo Securities, LLC and RBS Securities Inc. | |
| Co-Manager: | Deutsche Bank Securities Inc. | |
| Rating Agencies: | DBRS, Inc., Fitch Ratings, Inc. and Moody’s Investors Service, Inc. | |
| Master Servicers: | Wells Fargo Bank, National Association and NCB, FSB | |
| Special Servicers: | Midland Loan Services, a Division of PNC Bank, National Association and NCB, FSB | |
| Certificate Administrator: | Wells Fargo Bank, National Association | |
| Trustee: | Deutsche Bank Trust Company Americas | |
| Trust Advisor: | Pentalpha Surveillance LLC | |
| Initial Majority Subordinate Certificateholder: | An affiliate of Eightfold Real Estate Capital, L.P. | |
| Cut-off Date: | The Cut-off Date with respect to each mortgage loan is the due date for the monthly debt service payment that is due in December 2013 (or, in the case of any mortgage loan that has its first due date in January 2014 or February 2014, the date that would have been its due date in December 2013 under the terms of that mortgage loan if a monthly debt service payment were scheduled to be due in that month). | |
| Expected Closing Date: | On or about December 23, 2013. | |
| Determination Dates: | The 11th day of each month (or if that day is not a business day, the next succeeding business day), commencing in January 2014. | |
| Distribution Dates: | The fourth business day following the Determination Date in each month, commencing in January 2014. | |
| Rated Final Distribution Date: | The Distribution Date in December 2046. | |
| Interest Accrual Period: | With respect to any Distribution Date, the calendar month preceding the month in which such Distribution Date occurs. | |
| Day Count: | The Offered Certificates will accrue interest on a 30/360 basis. | |
| Minimum Denominations: | $10,000 for each Class of Offered Certificates (other than the Class X-A Certificates) and $1,000,000 for the Class X-A Certificates. Investments may also be made in any whole dollar denomination in excess of the applicable minimum denomination. | |
| Clean-up Call: | 1% | |
| Delivery: | DTC, Euroclear and Clearstream Banking | |
| ERISA/SMMEA Status: | Each Class of Offered Certificates is expected to be eligible for exemptive relief under ERISA. No Class of Offered Certificates will be SMMEA eligible. | |
| Risk Factors: | THE CERTIFICATES INVOLVE CERTAIN RISKS AND MAY NOT BE SUITABLE FOR ALL INVESTORS. SEE THE “RISK FACTORS” SECTION OF THE FREE WRITING PROSPECTUS. | |
| Bond Analytics Information: | The Certificate Administrator will be authorized to make distribution date settlements, CREFC® reports and certain supplemental reports (other than confidential information) available to certain financial modeling and data provision services, including Bloomberg Financial Markets L.P., Trepp LLC, Intex Solutions, Inc., Markit Group Limited, Interactive Data Corp., BlackRock Financial Management, Inc and CMBS.com, Inc. |
THE INFORMATION IN THIS STRUCTURAL AND COLLATERAL TERM SHEET IS NOT COMPLETE AND MAY BE AMENDED PRIOR TO THE TIME OF SALE. THIS TERM SHEET IS NOT AN OFFER TO SELL THESE SECURITIES AND IT IS NOT A SOLICITATION OF AN OFFER TO BUY THESE SECURITIES IN ANY JURISDICTION WHERE THE OFFER OR SALE IS NOT PERMITTED.
7
| WFRBS Commercial Mortgage Trust 2013-C18 | Characteristics of the Mortgage Pool |
IV. Characteristics of the Mortgage Pool(1)
| A. | Ten Largest Mortgage Loans |
Mortgage Loan Seller | Mortgage Loan Name | City | State | Number of Mortgage Loans / Mortgaged Properties | Mortgage Loan Cut-off Date Balance ($) | % of Cut- off Date Pool Balance (%) | Property Type | Number of SF, Rooms, Pads or Beds | Cut-off Date Balance Per SF, Room, Pad or Bed ($) | Cut-off Date LTV Ratio (%) | Balloon LTV Ratio (%) | U/W NCF DSCR (x) | U/W NOI Debt Yield (%) | |
| RBS | Garden State Plaza | Paramus | NJ | 1 / 1 | $150,000,000 | 14.5% | Retail | 2,195,561 | $239 | 25.0% | 25.0% | 4.73x | 19.1% | |
| WFB | AmericasMart | Atlanta | GA | 1 / 1 | 140,000,000 | 13.5 | Other | 4,563,219 | 123 | 60.9 | 46.2 | 1.68 | 12.9 | |
| WFB | The Outlet Collection | Jersey Gardens | Elizabeth | NJ | 1 / 1 | 140,000,000 | 13.5 | Retail | 1,298,801 | 269 | 49.5 | 49.5 | 2.84 | 11.5 | |
| RBS | JFK Hilton | Jamaica | NY | 1 / 1 | 68,500,000 | 6.6 | Hospitality | 356 | 192,416 | 66.3 | 56.2 | 1.53 | 11.5 | |
| RBS | Hotel Felix Chicago | Chicago | IL | 1 / 1 | 47,000,000 | 4.5 | Hospitality | 225 | 208,889 | 68.5 | 59.7 | 1.43 | 10.4 | |
| UBSRES | Sullivan Center | Chicago | IL | 1 / 1 | 38,500,000 | 3.7 | Mixed Use | 943,944 | 120 | 49.6 | 49.6 | 2.80 | 12.2 | |
| RBS | Starwood/Schulte Hotel Portfolio | Various | Various | 1 / 4 | 38,150,000 | 3.7 | Hospitality | 460 | 82,935 | 66.8 | 62.3 | 1.83 | 12.4 | |
| WFB | Hudson Mall | Jersey City | NJ | 1 / 1 | 25,000,000 | 2.4 | Retail | 282,782 | 88 | 53.2 | 43.8 | 1.80 | 12.9 | |
| Basis | Cedar Rapids Office Portfolio | Cedar Rapids | IA | 1 / 2 | 25,000,000 | 2.4 | Office | 227,195 | 110 | 69.2 | 53.1 | 1.28 | 11.3 | |
| RBS | HIE at Magnificent Mile | Chicago | IL | 1 / 1 | 23,500,000 | 2.3 | Hospitality | 174 | 135,057 | 64.7 | 56.4 | 1.43 | 10.9 | |
| Top Three Total/Weighted Average | 3 / 3 | $430,000,000 | 41.4% | 44.7% | 39.9% | 3.12x | 14.6% | |||||||
| Top Five Total/Weighted Average | 5 / 5 | $545,500,000 | 52.6% | 49.4% | 43.6% | 2.78x | 13.9% | |||||||
| Top Ten Total/Weighted Average | 10 / 14 | $695,650,000 | 67.0% | 51.8% | 45.8% | 2.59x | 13.5% | |||||||
| Non-Top Ten Total/Weighted Average | 57 / 59 | $342,306,638 | 33.0% | 59.7% | 50.4% | 2.25x | 14.5% | |||||||
| (1) | With respect to the Garden State Plaza Mortgage Loan, the AmericasMart Mortgage Loan, The Outlet Collection | Jersey Gardens Mortgage Loan and the Sullivan Center Mortgage Loan, each of which is part of a pari passu loan combination, Cut-off Date Balance per square foot, loan-to-value ratio, debt service coverage ratio and debt yield calculations include the related pari passu companion loan(s) (unless otherwise stated) in total debt. With respect to each Mortgage Loan, debt service coverage ratio, debt yield and loan-to-value ratio information takes no account of subordinate debt (whether or not secured by the mortgaged property), if any, that is allowed under the terms of any mortgage loan. |
THE INFORMATION IN THIS STRUCTURAL AND COLLATERAL TERM SHEET IS NOT COMPLETE AND MAY BE AMENDED PRIOR TO THE TIME OF SALE. THIS TERM SHEET IS NOT AN OFFER TO SELL THESE SECURITIES AND IT IS NOT A SOLICITATION OF AN OFFER TO BUY THESE SECURITIES IN ANY JURISDICTION WHERE THE OFFER OR SALE IS NOT PERMITTED.
8
| WFRBS Commercial Mortgage Trust 2013-C18 | Characteristics of the Mortgage Pool |
| B. | Summary of Pari Passu Split Loan Structures |
| Property Name | Mortgage Loan Seller | Related Notes in Loan Group (Original Balance) | Holder of Note | Whether Note is Lead Servicing for the Entire Loan Combination | Current Master Servicer Under Related Securitization Servicing Agreement | Current Special Servicer Under Related Securitization Servicing Agreement | ||||||
| Garden State Plaza | RBS | $150,000,000 | WFRBS 2013-C18 | (1) | Wells Fargo Bank, National Association | Midland Loan Services | ||||||
| RBS | $375,000,000 | (1) | (1) | (1) | (1) | |||||||
| AmericasMart | WFB | $140,000,000(2) | WFRBS 2013-C18 | Yes | Wells Fargo Bank, National Association | Midland Loan Services | ||||||
| WFB | $420,000,000(2) | (2) | No | TBD | TBD | |||||||
| The Outlet Collection | Jersey Gardens | WFB | $140,000,000 | WFRBS 2013-C18 | Yes | Wells Fargo Bank, National Association | Midland Loan Services | ||||||
| WFB | $130,000,000 | WFRBS 2013-UBS1(3) | No | Wells Fargo Bank, National Association | CWCapital Asset Management LLC | |||||||
| WFB | $80,000,000 | (3) | No | TBD | TBD | |||||||
| Sullivan Center | UBSRES | $38,500,000 | WFRBS 2013-C18 | No | Wells Fargo Bank, National Association | Midland Loan Services | ||||||
| UBSRES | $75,000,000 | WFRBS 2013-UBS1 | Yes | Wells Fargo Bank, National Association | CWCapital Asset Management LLC |
| (1) | The Garden State Plaza pari passu loan combination will be serviced under the WFRBS 2013-C18 pooling and servicing agreement until the securitization of the related pari passu companion loan, after which such loan combination will be serviced under the trust and servicing agreement related to the securitization of that pari passu companion loan. That pari passu companion loan is currently held by The Royal Bank of Scotland plc and is expected to be contributed to a single-asset securitization tentatively identified as RBS Commercial Funding Inc. 2013-GSP Trust, Commercial Mortgage Pass-Through Certificates, Series 2013-GSP. Wells Fargo Bank, National Association is expected to be appointed as master servicer and special servicer under that securitization. No assurance can be given that the pari passu companion loan will be contributed to such securitization. The master servicer and special servicer of the Garden State Plaza loan combination and the governing trust and servicing agreement will be identified in a notice, report or statement to holders of the WFRBS 2013-C18 certificates after the securitization of such pari passu companion loan. No assurances can be provided that any non-securitized pari passu notes will not be split further. |
| (2) | The AmericasMart Mortgage Loan is comprised of two separate promissory notes, each in the original principal amount of $70,000,000. These two notes are treated as one mortgage loan for all purposes in this Term Sheet unless otherwise indicated. There are six (6) pari passu companion loans related to such AmericasMart Mortgage Loan, each in the original principal amount of $70,000,000. Three of such pari passu companion loans are currently held by Wells Fargo Bank, National Association, the related mortgage loan seller for the AmericasMart Mortgage Loan for this securitization, and the other three of such pari passu companion loans are currently held by Bank of America, National Association. Each of such pari passu companion loans is expected to be contributed to a future securitization. No assurance can be given that any of such pari passu companion loans will be contributed to a future securitization. No assurances can be provided that any non-securitized pari passu notes will not be split further. |
| (3) | The related pari passu companion loans are currently held by the mortgage loan seller with the Note A-1 expected to be contributed to the WFRBS 2013-UBS1 trust, which is anticipated to close on December 11, 2013; and the Note A-3 is expected to be contributed to a future trust. No assurance can be provided that Note A-3 will not be split further. |
| C. | Mortgage Loans with Additional Secured and Mezzanine Financing(1)(2) |
| Loan No. | Mortgage Loan Seller | Mortgage Loan Name | Mortgage Loan Cut-off Date Balance ($) | % of Cut- off Date Balance (%) | Sub Debt Cut-off Date Balance ($) | Mezzanine Debt Cut- off Date Balance ($) | Total Debt Interest Rate (%) | Mortgage Loan U/W NCF DSCR (x) | Total Debt U/W NCF DSCR (x) | Mortgage Loan Cut- off Date U/W NOI Debt Yield (%) | Total Debt Cut-off Date U/W NOI Debt Yield (%) | Mortgage Loan Cut- off Date LTV Ratio (%) | Total Debt Cut-off Date LTV Ratio (%) | |||||||||||||
| 6 | UBSRES | Sullivan Center | $38,500,000 | 3.7% | $0 | $56,332,069 | 5.625% | 2.80x | 1.31x | 12.2% | 8.2% | 49.6% | 74.2% | |||||||||||||
Total/Weighted Average(3) | $38,500,000 | 3.7% | $0 | $56,332,069 | 5.625% | 2.80x | 1.31x | 12.2% | 8.2% | 49.6% | 74.2% | |||||||||||||||
| (1) | In addition, ten (10) of the mortgage loans, each of which are secured by residential cooperative properties, currently have in place Subordinate Coop LOCs that permit future advances, but as to which there are no present outstanding balances. See “Description of the Mortgage Pool—Subordinate and/or Other Financing” and “—Additional Debt Financing for Mortgage Loans Secured by Residential Cooperatives” in the Free Writing Prospectus. |
| (2) | With respect to the Sullivan Center Mortgage Loan, which is part of a pari passu loan combination, loan-to-value ratio, debt service coverage ratio and debt yield calculations include the pari passu companion loan unless otherwise stated. See Annex A-1 to the Free Writing Prospectus. |
| (3) | All total debt calculations are calculated including the Sullivan Center pari passu companion loan which is not shown in the table above. |
THE INFORMATION IN THIS STRUCTURAL AND COLLATERAL TERM SHEET IS NOT COMPLETE AND MAY BE AMENDED PRIOR TO THE TIME OF SALE. THIS TERM SHEET IS NOT AN OFFER TO SELL THESE SECURITIES AND IT IS NOT A SOLICITATION OF AN OFFER TO BUY THESE SECURITIES IN ANY JURISDICTION WHERE THE OFFER OR SALE IS NOT PERMITTED.
9
WFRBS Commercial Mortgage Trust 2013-C18 | Characteristics of the Mortgage Pool |
| D. | Previous Securitization History(1) |
| Loan No. | Mortgage Loan Seller | Mortgage Loan or Mortgaged Property Name | City | State | Property Type | Mortgage Loan or Mortgaged Property Cut-off Date Balance ($) | % of Cut-off Date Pool Balance (%) | Previous Securitization |
| 1 | RBS | Garden State Plaza | Paramus | NJ | Retail | $150,000,000 | 14.5% | LBUBS 2004-C4, COMM 2004-LB3A, GSMS 2004-GG4 |
| 2 | WFB | AmericasMart | Atlanta | GA | Other | 140,000,000 | 13.5 | WBCMT 2005-C19; WBCMT 2005-C20 |
| 3 | WFB | The Outlet Collection | Jersey Gardens | Elizabeth | NJ | Retail | 140,000,000 | 13.5 | BSCMS 2004-T16; GMACC 2004-C2 |
| 8 | WFB | Hudson Mall | Jersey City | NJ | Retail | 25,000,000 | 2.4 | MSC 2004-T13 |
| 11 | LIG I | 200-400 West 45th | Fargo | ND | Office | 19,050,000 | 1.8 | GECMC 2005-C3 |
| 13 | WFB | Desert Tree Apartments | El Paso | TX | Multifamily | 14,975,000 | 1.4 | BACM 2003-2 |
| 14 | WFB | San Marcos Apartments | El Paso | TX | Multifamily | 14,375,000 | 1.4 | COMM 2004-LB2A |
| 15 | RBS | Hawthorne Valley Shopping Center | Oakwood Village | OH | Retail | 14,000,000 | 1.3 | CSFB 2004-C1 |
| 17.01 | LIG I | Lakeshore Shopping Center | Oklahoma City | OK | Retail | 10,796,703 | 1.0 | BSCMS 2006-PW13 |
| 17.02 | LIG I | Lakewood Shopping Center | Oklahoma City | OK | Retail | 2,303,297 | 0.2 | BSCMS 2004-PWR5 |
| 19 | LIG I | Summit Center | Amarillo | TX | Retail | 11,000,000 | 1.1 | JPMCC 2004-C1 |
| 24 | RBS | La Mesa Village Plaza | La Mesa | CA | Mixed Use | 9,000,000 | 0.9 | CSFB 2004-C1 |
| 25 | LIG I | Lakes at Woodmont | Perrysburg | OH | Multifamily | 9,000,000 | 0.9 | TIAAS 2007-C4 |
| 30 | WFB | Milestone Crossing | Belchertown | MA | Retail | 7,500,000 | 0.7 | WBCMT 2005-C17 |
| 34 | Basis | Greenbriar Crossing | Atlanta | GA | Retail | 5,500,000 | 0.5 | GMACC 2003-C2 |
| 40 | CIIICM | Roxbury & River’s Edge | Various | NY | Manufactured Housing Community | 4,250,000 | 0.4 | MSC 2003-IQ6 |
| 42 | LIG I | Olsen Village | Amarillo | TX | Retail | 4,000,000 | 0.4 | BSCMS 2004-PWR3 |
| 46 | NCB, FSB | Hudson Street Owners Corp. | New York | NY | Multifamily | 3,350,000 | 0.3 | MSC 2006-IQ11 |
| 47 | NCB, FSB | Van Buren Owners, Inc. | Forest Hills | NY | Multifamily | 2,996,107 | 0.3 | CSFB 2004-C4 |
| 49 | WFB | Walgreens – Broken Arrow | Broken Arrow | OK | Retail | 2,700,000 | 0.3 | GECMC 2004-C2 |
| 50 | WFB | Walgreens – Macomb Township | Macomb Township | MI | Retail | 2,525,000 | 0.2 | BSCMS 2004-T14 |
| 51 | CIIICM | Heritage Apartments | Augusta | GA | Multifamily | 2,484,000 | 0.2 | LBUBS 2004-C1 |
| 52 | NCB, FSB | North and South Lewis Place Owners Corp. | Rockville Centre | NY | Multifamily | 2,396,782 | 0.2 | MSC 2003-IQ6 |
| 54 | CIIICM | Fairfield Manor MHC | Bay City | MI | Manufactured Housing Community | 2,250,000 | 0.2 | JPMCC 2004-C1 |
| 57 | NCB, FSB | Inverness Housing Corp. | Bronxville | NY | Multifamily | 1,997,366 | 0.2 | CSFB 2004-C1 |
| 59 | NCB, FSB | Barclay Tenants’ Corporation | Great Neck | NY | Multifamily | 1,897,516 | 0.2 | CSFB 2005-C3 |
| 67 | NCB, FSB | 336 East 50th Street Tenants Corp. | New York | NY | Multifamily | 675,000 | 0.1 | CSFB 2004-C4 |
| Total | $604,021,771 | 58.2% | ||||||
| (1) | The table above represents the most recent securitization with respect to the mortgaged property securing the related mortgage loan, based on information provided by the related borrower or obtained through searches of a third-party database. While the above mortgage loans may have been securitized multiple times in prior transactions, mortgage loans are only listed in the above chart if the mortgage loan paid off a mortgage loan in another securitization. The information has not otherwise been confirmed by the mortgage loan sellers. |
THE INFORMATION IN THIS STRUCTURAL AND COLLATERAL TERM SHEET IS NOT COMPLETE AND MAY BE AMENDED PRIOR TO THE TIME OF SALE. THIS TERM SHEET IS NOT AN OFFER TO SELL THESE SECURITIES AND IT IS NOT A SOLICITATION OF AN OFFER TO BUY THESE SECURITIES IN ANY JURISDICTION WHERE THE OFFER OR SALE IS NOT PERMITTED.
10
| WFRBS Commercial Mortgage Trust 2013-C18 | Characteristics of the Mortgage Pool |
E. Mortgage Loans with Scheduled Balloon Payments and Related Classes |
Class A-2(1) | ||||||||||||||||||||||
| Loan No. | Mortgage Loan Seller | Mortgage Loan Name | State | Property Type | Mortgage Loan Cut-off Date Balance ($) | % of Cut-off Date Pool Balance (%) | Mortgage Loan Balance at Maturity ($) | % of Class A-2 Certificate Principal Balance (%)(2) | SF/ Rooms/ Pads/ Units | Loan per SF /Room/ Pad/Unit ($) | U/W NCF DSCR (x) | U/W NOI Debt Yield (%) | Cut-off Date LTV Ratio (%) | Balloon LTV Ratio (%) | Rem. IO Period (mos.) | Rem. Term to Maturity (mos.) | ||||||
| 6 | UBSRES | Sullivan Center | IL | Mixed Use | $38,500,000 | 3.7 | % | $38,500,000 | 37.3 | % | 943,944 | $120 | 2.80x | 12.2% | 49.6% | 49.6% | 59 | 59 | ||||
| 7 | RBS | Starwood/Schulte Hotel Portfolio | Various | Hospitality | 38,150,000 | 3.7 | 35,587,220 | 34.4 | 460 | 82,935 | 1.83 | 12.4 | 66.8 | 62.3 | 12 | 60 | ||||||
| 12 | WFB | Avilla Apartments | AZ | Multifamily | 16,600,000 | 1.6 | 15,489,032 | 15.0 | 166 | 100,000 | 1.32 | 8.2 | 68.5 | 63.9 | 12 | 60 | ||||||
| 22 | LIG I | Renaissance Walk Apartments | GA | Multifamily | 9,987,349 | 1.0 | 9,182,461 | 8.9 | 142 | 70,333 | 1.43 | 9.3 | 61.7 | 56.7 | 0 | 59 | ||||||
| 48 | CIIICM | Creekside Estates MHC | MI | Manufactured Housing Community | 2,750,000 | 0.3 | 2,456,866 | 2.4 | 165 | 16,667 | 1.77 | 13.0 | 61.1 | 54.6 | 0 | 60 | ||||||
| Total/Weighted Average | $105,987,349 | 10.2% | $101,215,578 | 97.9% | 2.06x | 11.4% | 60.2% | 57.2% | 28 | 60 | ||||||||||||
(1) The table above presents the mortgage loan whose balloon payments would be applied to pay down the principal balance of the Class A-2 Certificates, assuming a 0% CPR and applying the “Structuring Assumptions” described in the Free Writing Prospectus, including the assumptions that (i) none of the mortgage loans in the pool experience prepayments, defaults or losses; (ii) there are no extensions of maturity dates of any mortgage loans in the pool; and (iii) each mortgage loan in the pool is paid in full on its stated maturity date. Each class of Certificates, including the Class A-2 Certificates, evidences undivided ownership interests in the entire pool of mortgage loans. Debt service coverage ratio, debt yield and loan-to-value ratio information takes no account of subordinate debt (whether or not secured by the mortgaged property), if any, that is allowed under the terms of any mortgage loan. See Annex A-1 to the Free Writing Prospectus. (2) Reflects the percentage equal to the Mortgage Loan Balance at Maturity divided by the initial Class A-2 Certificate Principal Balance. |
Class A-3(1) | |||||||||||||||||||||||||||
| Loan No. | Mortgage Loan Seller | Mortgage Loan Name | State | Property Type | Mortgage Loan Cut-off Date Balance ($) | % of Cut-off Date Pool Balance (%) | Mortgage Loan Balance at Maturity ($) | % of Class A-3 Certificate Principal Balance (%)(2) | SF/ Rooms/ Pads/ Units | Loan per SF /Room/ Pad/Unit ($) | U/W NCF DSCR (x) | U/W NOI Debt Yield (%) | Cut-off Date LTV Ratio (%) | Balloon LTV Ratio (%) | Rem. IO Period (mos.) | Rem. Term to Maturity (mos.) | |||||||||||
| 3 | WFB | The Outlet Collection | Jersey Gardens | NJ | Retail | $140,000,000 | 13.5% | $140,000,000 | 100.0% | 1,298,801 | $269 | 2.84x | 11.5% | 49.5% | 49.5% | 83 | 83 | |||||||||||
| Total/Weighted Average | $140,000,000 | 13.5% | $140,000,000 | 100.0% | 2.84x | 11.5% | 49.5% | 49.5% | 83 | 83 | |||||||||||||||||
(1) The table above presents the mortgage loan whose balloon payments would be applied to pay down the principal balance of the Class A-3 Certificates, assuming a 0% CPR and applying the “Structuring Assumptions” described in the Free Writing Prospectus, including the assumptions that (i) none of the mortgage loans in the pool experience prepayments, defaults or losses; (ii) there are no extensions of maturity dates of any mortgage loans in the pool; and (iii) each mortgage loan in the pool is paid in full on its stated maturity date. Each class of Certificates, including the Class A-3 Certificates, evidences undivided ownership interests in the entire pool of mortgage loans. Debt service coverage ratio, debt yield and loan-to-value ratio information takes no account of subordinate debt (whether or not secured by the mortgaged property), if any, that is allowed under the terms of any mortgage loan. See Annex A-1 to the Free Writing Prospectus. (2) Reflects the percentage equal to the Mortgage Loan Balance at Maturity divided by the initial Class A-3 Certificate Principal Balance. |
THE INFORMATION IN THIS STRUCTURAL AND COLLATERAL TERM SHEET IS NOT COMPLETE AND MAY BE AMENDED PRIOR TO THE TIME OF SALE. THIS TERM SHEET IS NOT AN OFFER TO SELL THESE SECURITIES AND IT IS NOT A SOLICITATION OF AN OFFER TO BUY THESE SECURITIES IN ANY JURISDICTION WHERE THE OFFER OR SALE IS NOT PERMITTED.
11
| WFRBS Commercial Mortgage Trust 2013-C18 | Characteristics of the Mortgage Pool |
F. Property Type Distribution(1)
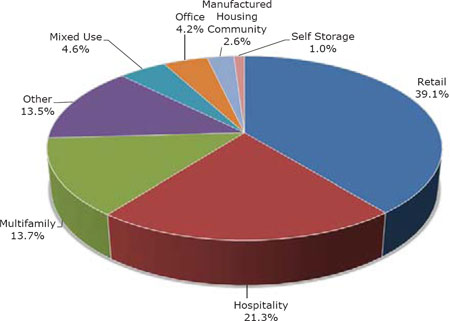
| Property Type | Number of Mortgaged Properties | Aggregate Cut- off Date Balance ($) | % of Cut- off Date Balance (%) | Weighted Average Cut-off Date LTV Ratio (%) | Weighted Average Balloon LTV Ratio (%) | Weighted Average U/W NCF DSCR (x) | Weighted Average U/W NOI Debt Yield (%) | Weighted Average U/W NCF Debt Yield (%) | Weighted Average Mortgage Rate (%) | |
| Retail | 16 | $406,325,000 | 39.1% | 44.3% | 41.4% | 3.19x | 14.3% | 13.6% | 4.165 | % |
| Regional Mall | 2 | 290,000,000 | 27.9 | 36.8 | 36.8 | 3.82 | 15.4 | 14.9 | 3.845 | |
| Anchored | 3 | 43,500,000 | 4.2 | 59.4 | 48.8 | 1.77 | 12.8 | 11.4 | 5.036 | |
| Shadow Anchored | 4 | 30,303,297 | 2.9 | 69.5 | 59.1 | 1.46 | 10.1 | 9.3 | 4.910 | |
| Unanchored | 3 | 25,796,703 | 2.5 | 65.6 | 57.2 | 1.63 | 11.6 | 10.3 | 4.917 | |
| Single Tenant | 4 | 16,725,000 | 1.6 | 56.3 | 44.5 | 1.64 | 11.0 | 10.9 | 4.943 | |
| Hospitality | 13 | 221,050,000 | 21.3 | 66.8 | 57.4 | 1.55 | 11.5 | 10.2 | 5.099 | |
| Limited Service | 8 | 120,400,000 | 11.6 | 67.3 | 57.8 | 1.54 | 11.3 | 10.1 | 5.121 | |
| Full Service | 2 | 78,500,000 | 7.6 | 66.4 | 57.0 | 1.57 | 11.6 | 10.1 | 5.061 | |
| Extended Stay | 3 | 22,150,000 | 2.1 | 65.8 | 56.1 | 1.57 | 11.7 | 10.3 | 5.113 | |
| Multifamily | 25 | 141,746,129 | 13.7 | 49.2 | 43.6 | 3.25 | 19.2 | 18.8 | 4.765 | |
| Garden | 6 | 58,434,000 | 5.6 | 71.4 | 62.6 | 1.39 | 9.6 | 8.9 | 4.909 | |
| Cooperative | 15 | 43,924,779 | 4.2 | 14.3 | 12.2 | 7.18 | 40.3 | 40.3 | 4.472 | |
| Low Rise | 3 | 29,400,000 | 2.8 | 53.2 | 48.5 | 1.68 | 10.0 | 9.8 | 4.934 | |
| Mid Rise | 1 | 9,987,349 | 1.0 | 61.7 | 56.7 | 1.43 | 9.3 | 8.9 | 4.720 | |
| Other | 1 | 140,000,000 | 13.5 | 60.9 | 46.2 | 1.68 | 12.9 | 12.4 | 5.451 | |
| Trade Mart | 1 | 140,000,000 | 13.5 | 60.9 | 46.2 | 1.68 | 12.9 | 12.4 | 5.451 | |
| Mixed Use | 2 | 47,500,000 | 4.6 | 52.3 | 50.1 | 2.55 | 12.0 | 10.9 | 4.135 | |
| Office/Retail | 2 | 47,500,000 | 4.6 | 52.3 | 50.1 | 2.55 | 12.0 | 10.9 | 4.135 | |
| Office | 3 | 44,050,000 | 4.2 | 71.7 | 56.9 | 1.31 | 10.7 | 9.3 | 5.462 | |
| CBD | 2 | 25,000,000 | 2.4 | 69.2 | 53.1 | 1.28 | 11.3 | 9.7 | 5.760 | |
| Suburban | 1 | 19,050,000 | 1.8 | 75.0 | 61.8 | 1.34 | 9.8 | 8.7 | 5.070 | |
| Manufactured Housing Community | 10 | 26,685,509 | 2.6 | 69.2 | 56.5 | 1.46 | 10.4 | 10.1 | 5.342 | |
| Manufactured Housing Community | 10 | 26,685,509 | 2.6 | 69.2 | 56.5 | 1.46 | 10.4 | 10.1 | 5.342 | |
| Self Storage | 3 | 10,600,000 | 1.0 | 65.1 | 53.8 | 1.67 | 11.2 | 11.0 | 5.189 | |
| Self Storage | 3 | 10,600,000 | 1.0 | 65.1 | 53.8 | 1.67 | 11.2 | 11.0 | 5.189 | |
| Total/Weighted Average | 73 | $1,037,956,638 | 100.0% | 54.4% | 47.3% | 2.48x | 13.8% | 13.0% | 4.714 | % |
| (1) | Because this table presents information relating to the mortgaged properties and not the mortgage loans, the information for mortgage loans secured by more than one mortgaged property is based on allocated amounts (allocating the mortgage loan principal balance to each of those properties according to the relative appraised values of the mortgaged properties or the allocated loan amounts or property-specific release prices set forth in the related mortgage loan documents or such other allocation as the related mortgage loan seller deemed appropriate). For mortgaged properties securing residential cooperative mortgage loans, the debt service coverage ratio or debt yield for each such mortgaged property are calculated using underwritten net cash flow for the related residential cooperative property which is the projected net cash flow reflected in the most recent appraisal obtained by or otherwise in the possession of the related mortgage loan seller as of the cut-off date, and the loan-to-value ratio is calculated based upon the appraised value of the residential cooperative property determined as if such residential cooperative property is operated as a residential cooperative. With respect to the Garden State Plaza Mortgage Loan, the AmericasMart Mortgage Loan, The Outlet Collection | Jersey Gardens Mortgage Loan and the Sullivan Center Mortgage Loan, loan-to-value ratio, debt service coverage ratio and debt yield calculations include the related pari passu companion loan(s) (unless otherwise stated) in total debt. Debt service coverage ratio, debt yield and loan-to-value ratio information takes no account of subordinate debt (whether or not secured by the mortgaged property) that is allowed under the terms of any mortgage loan. See Annex A-1 to the Free Writing Prospectus. |
THE INFORMATION IN THIS STRUCTURAL AND COLLATERAL TERM SHEET IS NOT COMPLETE AND MAY BE AMENDED PRIOR TO THE TIME OF SALE. THIS TERM SHEET IS NOT AN OFFER TO SELL THESE SECURITIES AND IT IS NOT A SOLICITATION OF AN OFFER TO BUY THESE SECURITIES IN ANY JURISDICTION WHERE THE OFFER OR SALE IS NOT PERMITTED.
12
| WFRBS Commercial Mortgage Trust 2013-C18 | Characteristics of the Mortgage Pool |
G. Geographic Distribution(1)(2)
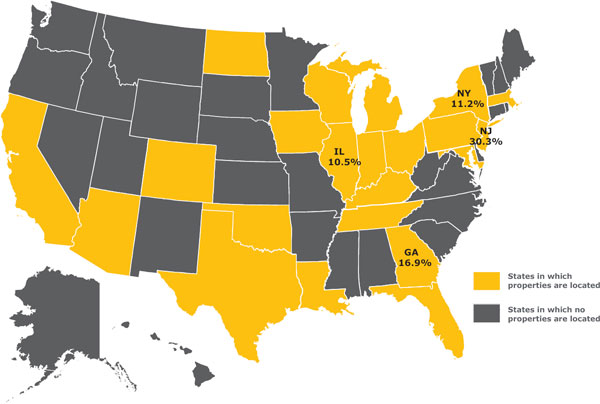
| Location | Number of Mortgaged Properties | Aggregate Cut- off Date Balance ($) | % of Cut- off Date Balance (%) | Weighted Average Cut-off Date LTV Ratio (%) | Weighted Average Balloon LTV Ratio (%) | Weighted Average U/W NCF DSCR (x) | Weighted Average U/W NOI Debt Yield (%) | Weighted Average U/W NCF Debt Yield (%) | Weighted Average Mortgage Rate (%) | |
| New Jersey | 3 | $315,000,000 | 30.3% | 38.1% | 37.4% | 3.66x | 15.2% | 14.6% | 3.942% | |
| Georgia | 6 | 175,321,349 | 16.9 | 61.9 | 48.6 | 1.66 | 12.5 | 11.9 | 5.321 | |
| New York | 18 | 116,674,779 | 11.2 | 46.8 | 39.5 | 3.65 | 22.3 | 21.4 | 4.915 | |
| Illinois | 3 | 109,000,000 | 10.5 | 61.0 | 55.4 | 1.91 | 11.1 | 10.1 | 4.804 | |
Other(3) | 43 | 321,960,509 | 31.0 | 66.7 | 56.4 | 1.54 | 10.9 | 10.0 | 5.035 | |
| Total/Weighted Average | 73 | $1,037,956,638 | 100.0% | 54.4% | 47.3% | 2.48x | 13.8% | 13.0% | 4.714% | |
| (1) | The Mortgaged Properties are located in 22 states. |
| (2) | Because this table presents information relating to the mortgaged properties and not the mortgage loans, the information for mortgage loans secured by more than one mortgaged property is based on allocated amounts (allocating the mortgage loan principal balance to each of those properties according to the relative appraised values of the mortgaged properties or the allocated loan amounts or property-specific release prices set forth in the related mortgage loan documents or such other allocation as the related mortgage loan seller deemed appropriate). For mortgaged properties securing residential cooperative mortgage loans, the debt service coverage ratio or debt yield for each such mortgaged property are calculated using underwritten net cash flow for the related residential cooperative property which is the projected net cash flow reflected in the most recent appraisal obtained by or otherwise in the possession of the related mortgage loan seller as of the cut-off date, and the loan-to-value ratio is calculated based upon the appraised value of the residential cooperative property determined as if such residential cooperative property is operated as a residential cooperative. With respect to the Garden State Plaza Mortgage Loan, the AmericasMart Mortgage Loan, The Outlet Collection | Jersey Gardens Mortgage Loan and the Sullivan Center Mortgage Loan, loan-to-value ratio, debt service coverage ratio and debt yield calculations include the related pari passu companion loan(s) (unless otherwise stated) in total debt. Debt service coverage ratio, debt yield and loan-to-value ratio information takes no account of subordinate debt (whether or not secured by the mortgaged property), if any, that is allowed under the terms of any mortgage loan. See Annex A-1 to the Free Writing Prospectus. |
| (3) | Includes 18 other states. |
THE INFORMATION IN THIS STRUCTURAL AND COLLATERAL TERM SHEET IS NOT COMPLETE AND MAY BE AMENDED PRIOR TO THE TIME OF SALE. THIS TERM SHEET IS NOT AN OFFER TO SELL THESE SECURITIES AND IT IS NOT A SOLICITATION OF AN OFFER TO BUY THESE SECURITIES IN ANY JURISDICTION WHERE THE OFFER OR SALE IS NOT PERMITTED.
13
| WFRBS Commercial Mortgage Trust 2013-C18 | Characteristics of the Mortgage Pool |
H. Characteristics of the Mortgage Pool(1)
| CUT-OFF DATE BALANCE | LOAN PURPOSE | |||||||||||||||||
| Number of | Number of | |||||||||||||||||
| Range of Cut-off Date | Mortgage | Aggregate Cut- | % of Cut-off | Mortgage | Aggregate Cut- | % of Cut-off | ||||||||||||
| Balances ($) | Loans | off Date Balance | Date Balance | Loan Purpose | Loans | off Date Balance | Date Balance | |||||||||||
| 675,000 - 1,000,000 | 3 | $2,543,865 | 0.2 | % | Refinance | 66 | $1,024,456,638 | 98.7 | % | |||||||||
| 1,000,001 - 2,000,000 | 9 | 15,584,071 | 1.5 | Acquisition | 1 | 13,500,000 | 1.3 | |||||||||||
| 2,000,001 - 3,000,000 | 9 | 22,516,888 | 2.2 | Total: | 67 | $1,037,956,638 | 100.0 | % | ||||||||||
| 3,000,001 - 4,000,000 | 5 | 18,275,000 | 1.8 | |||||||||||||||
| 4,000,001 - 5,000,000 | 6 | 26,510,000 | 2.6 | MORTGAGE RATE | ||||||||||||||
| 5,000,001 - 6,000,000 | 2 | 10,750,000 | 1.0 | Number of | ||||||||||||||
| 6,000,001 - 7,000,000 | 3 | 19,150,000 | 1.8 | Range of Mortgage Rates | Mortgage | Aggregate Cut- | % of Cut-off | |||||||||||
| 7,000,001 - 8,000,000 | 3 | 22,989,465 | 2.2 | (%) | Loans | off Date Balance | Date Balance | |||||||||||
| 8,000,001 - 9,000,000 | 4 | 35,550,000 | 3.4 | 3.830 - 4.000 | 3 | $328,500,000 | 31.6 | % | ||||||||||
| 9,000,001 - 10,000,000 | 3 | 29,187,349 | 2.8 | 4.001 - 4.500 | 13 | 92,237,292 | 8.9 | |||||||||||
| 10,000,001 - 15,000,000 | 8 | 103,600,000 | 10.0 | 4.501 - 4.750 | 6 | 29,999,837 | 2.9 | |||||||||||
| 15,000,001 - 20,000,000 | 2 | 35,650,000 | 3.4 | 4.751 - 5.000 | 11 | 88,375,000 | 8.5 | |||||||||||
| 20,000,001 - 30,000,000 | 3 | 73,500,000 | 7.1 | 5.001 - 5.250 | 17 | 209,400,000 | 20.2 | |||||||||||
| 30,000,001 - 50,000,000 | 3 | 123,650,000 | 11.9 | 5.251 - 5.500 | 13 | 253,594,509 | 24.4 | |||||||||||
| 50,000,001 - 70,000,000 | 1 | 68,500,000 | 6.6 | 5.501 - 5.750 | 3 | 10,850,000 | 1.0 | |||||||||||
| 70,000,001 - 150,000,000 | 3 | 430,000,000 | 41.4 | 5.751 - 5.760 | 1 | 25,000,000 | 2.4 | |||||||||||
| Total: | 67 | $1,037,956,638 | 100.0 | % | Total: | 67 | $1,037,956,638 | 100.0 | % | |||||||||
| Average: | $15,491,890 | �� | Weighted Average: | 4.714% | ||||||||||||||
| UNDERWRITTEN NOI DEBT SERVICE COVERAGE RATIO | UNDERWRITTEN NOI DEBT YIELD | |||||||||||||||||
| Number of | Number of | |||||||||||||||||
| Range of U/W NOI | Mortgage | Aggregate Cut- | % of Cut-off | Range of U/W NOI | Mortgage | Aggregate Cut- | % of Cut-off | |||||||||||
| DSCRs (x) | Loans | off Date Balance | Date Balance | Debt Yields (%) | Loans | off Date Balance | Date Balance | |||||||||||
| 1.24 - 1.30 | 1 | $10,250,000 | 1.0 | % | 8.0 | 1 | $10,250,000 | 1.0 | % | |||||||||
| 1.31 - 1.40 | 5 | 40,150,000 | 3.9 | 8.1 - 9.0 | 2 | 22,900,000 | 2.2 | |||||||||||
| 1.41 - 1.50 | 5 | 40,852,349 | 3.9 | 9.1 - 10.0 | 8 | 63,487,349 | 6.1 | |||||||||||
| 1.51 - 1.60 | 8 | 116,500,000 | 11.2 | 10.1 - 11.0 | 16 | 180,940,000 | 17.4 | |||||||||||
| 1.61 - 1.70 | 12 | 102,384,000 | 9.9 | 11.1 - 12.0 | 6 | 249,684,000 | 24.1 | |||||||||||
| 1.71 - 1.80 | 5 | 227,250,000 | 21.9 | 12.1 - 13.0 | 14 | 307,750,000 | 29.6 | |||||||||||
| 1.81 - 1.90 | 6 | 35,045,509 | 3.4 | 13.1 - 14.0 | 4 | 12,280,509 | 1.2 | |||||||||||
| 1.91 - 2.00 | 3 | 43,200,000 | 4.2 | 14.1 - 15.0 | 1 | 1,000,000 | 0.1 | |||||||||||
| 2.01 - 2.25 | 3 | 43,150,000 | 4.2 | 15.1 - 20.0 | 1 | 150,000,000 | 14.5 | |||||||||||
| 2.26 - 2.75 | 2 | 11,010,000 | 1.1 | 20.1 - 110.1 | 14 | 39,664,779 | 3.8 | |||||||||||
| 2.76 - 3.00 | 1 | 140,000,000 | 13.5 | Total: | 67 | $1,037,956,638 | 100.0 | % | ||||||||||
| 3.01 - 3.50 | 1 | 38,500,000 | 3.7 | Weighted Average: | 13.8% | |||||||||||||
| 3.51 – 17.98 | 15 | 189,664,779 | 18.3 | |||||||||||||||
| Total: | 67 | $1,037,956,638 | 100.0 | % | UNDERWRITTEN NCF DEBT YIELD | |||||||||||||
| Weighted Average: | 2.61x | Number of | ||||||||||||||||
| UNDERWRITTEN NCF DEBT SERVICE COVERAGE RATIO | Range of U/W NCF | Mortgage | Aggregate Cut- | % of Cut-off | ||||||||||||||
| Number of | Debt Yields (%) | Loans | off Date Balance | Date Balance | ||||||||||||||
| Range of U/W NCF | Mortgage | Aggregate Cut- | % of Cut-off | 7.9 - 8.0 | 2 | $26,850,000 | 2.6 | % | ||||||||||
| DSCRs (x) | Loans | off Date Balance | Date Balance | 8.1 - 9.0 | 6 | 60,321,349 | 5.8 | |||||||||||
| 1.22 - 1.30 | 4 | $48,500,000 | 4.7 | % | 9.1 - 10.0 | 16 | 254,065,000 | 24.5 | ||||||||||
| 1.31 - 1.40 | 8 | 54,299,000 | 5.2 | 10.1 - 11.0 | 14 | 260,825,000 | 25.1 | |||||||||||
| 1.41 - 1.50 | 12 | 170,987,349 | 16.5 | 11.1 - 12.0 | 5 | 79,250,000 | 7.6 | |||||||||||
| 1.51 - 1.60 | 8 | 104,850,000 | 10.1 | 12.1 - 13.0 | 6 | 159,195,509 | 15.3 | |||||||||||
| 1.61 - 1.70 | 7 | 182,050,000 | 17.5 | 13.1 - 14.0 | 3 | 7,785,000 | 0.8 | |||||||||||
| 1.71 - 1.80 | 5 | 50,745,509 | 4.9 | 14.1 - 19.0 | 1 | 150,000,000 | 14.5 | |||||||||||
| 1.81 - 1.90 | 1 | 38,150,000 | 3.7 | 19.1 - 110.1 | 14 | 39,664,779 | 3.8 | |||||||||||
| 1.91 - 2.00 | 2 | 8,200,000 | 0.8 | Total: | 67 | $1,037,956,638 | 100.0 | % | ||||||||||
| 2.01 - 2.25 | 1 | 1,000,000 | 0.1 | Weighted Average: | 13.0% | |||||||||||||
| 2.26 - 2.75 | 2 | 11,010,000 | 1.1 | |||||||||||||||
| 2.76 - 3.00 | 2 | 178,500,000 | 17.2 | |||||||||||||||
| 3.01 - 17.98 | 15 | 189,664,779 | 18.3 | |||||||||||||||
| Total: | 67 | $1,037,956,638 | 100.0 | % | ||||||||||||||
| Weighted Average: | 2.48x | |||||||||||||||||
| (1) | For mortgaged properties securing residential cooperative mortgage loans, the debt service coverage ratio or debt yield for each such mortgaged property are calculated using underwritten net cash flow for the related residential cooperative property which is the projected net cash flow reflected in the most recent appraisal obtained by or otherwise in the possession of the related mortgage loan seller as of the cut-off date, and the loan-to-value ratio is calculated based upon the appraised value of the residential cooperative property determined as if such residential cooperative property is operated as a residential cooperative. With respect to the Garden State Plaza Mortgage Loan, the AmericasMart Mortgage Loan, The Outlet Collection | Jersey Gardens Mortgage Loan and the Sullivan Center Mortgage Loan, loan-to-value ratio, debt service coverage ratio and debt yield calculations include the related pari passu companion loan (unless otherwise stated) in total debt. Debt service coverage ratio, debt yield and loan-to-value ratio information takes no account of subordinate debt (whether or not secured by the mortgaged property), if any, that is allowed under the terms of any mortgage loan. Debt service coverage ratio, debt yield and loan-to-value ratio information takes no account of subordinate debt (whether or not secured by the mortgaged property), if any, that is allowed under the terms of any mortgage loan. See Annex A-1 to the Free Writing Prospectus. |
THE INFORMATION IN THIS STRUCTURAL AND COLLATERAL TERM SHEET IS NOT COMPLETE AND MAY BE AMENDED PRIOR TO THE TIME OF SALE. THIS TERM SHEET IS NOT AN OFFER TO SELL THESE SECURITIES AND IT IS NOT A SOLICITATION OF AN OFFER TO BUY THESE SECURITIES IN ANY JURISDICTION WHERE THE OFFER OR SALE IS NOT PERMITTED.
14
| WFRBS Commercial Mortgage Trust 2013-C18 | Characteristics of the Mortgage Pool |
| ORIGINAL TERM TO MATURITY | CUT-OFF DATE LOAN-TO-VALUE RATIO | |||||||||||||||||
| Number of | Number of | |||||||||||||||||
| Range of Original Terms to | Mortgage | Aggregate Cut- | % of Cut-off | Range of Cut-off Date LTV | Mortgage | Aggregate Cut- | % of Cut-off | |||||||||||
| Maturity (months) | Loans | off Date Balance | Date Balance | Ratios (%) | Loans | off Date Balance | Date Balance | |||||||||||
| 60 | 5 | $105,987,349 | 10.2 | % | 3.4 - 20.0 | 14 | $39,664,779 | 3.8 | % | |||||||||
| 84 | 1 | 140,000,000 | 13.5 | 20.1 - 25.0 | 1 | 150,000,000 | 14.5 | |||||||||||
| 120 | 51 | 500,348,779 | 48.2 | 25.1 - 40.0 | 1 | 12,400,000 | 1.2 | |||||||||||
| 121 | 10 | 291,620,509 | 28.1 | 40.1 - 45.0 | 1 | 4,260,000 | 0.4 | |||||||||||
| Total: | 67 | $1,037,956,638 | 100.0 | % | 45.1 - 50.0 | 4 | 187,775,000 | 18.1 | ||||||||||
| Weighted Average: | 109 months | 50.1 - 55.0 | 1 | 25,000,000 | 2.4 | |||||||||||||
| REMAINING TERM TO MATURITY | 55.1 - 60.0 | 6 | 29,200,000 | 2.8 | ||||||||||||||
| Number of | 60.1 - 65.0 | 11 | 210,016,859 | 20.2 | ||||||||||||||
| Range of Remaining Terms | Mortgage | Aggregate Cut- | % of Cut-off | 65.1 - 70.0 | 15 | 262,690,000 | 25.3 | |||||||||||
| to Maturity (months) | Loans | off Date Balance | Date Balance | 70.1 - 75.0 | 12 | 103,450,000 | 10.0 | |||||||||||
| 59 - 60 | 5 | $105,987,349 | 10.2 | % | 75.1 - 75.4 | 1 | 13,500,000 | 1.3 | ||||||||||
| 61 - 84 | 1 | 140,000,000 | 13.5 | Total: | 67 | $1,037,956,638 | 100.0 | % | ||||||||||
| 85 - 120 | 52 | 501,844,289 | 48.3 | Weighted Average: | 54.4% | |||||||||||||
| 121 | 9 | 290,125,000 | 28.0 | |||||||||||||||
| Total: | 67 | $1,037,956,638 | 100.0 | % | BALLOON LOAN-TO-VALUE RATIO | |||||||||||||
| Weighted Average: | 109 months | Number of | ||||||||||||||||
ORIGINAL AMORTIZATION TERM(2) | Range of Balloon LTV | Mortgage | Aggregate Cut- | % of Cut-off | ||||||||||||||
| Range of Original | Number of | Ratios (%) | Loans | off Date Balance | Date Balance | |||||||||||||
| Amortization Terms | Mortgage | Aggregate Cut- | % of Cut-off | 2.7 - 20.0 | 14 | $39,664,779 | 3.8 | % | ||||||||||
| (months) | Loans | off Date Balance | Date Balance | 20.1 - 25.0 | 1 | 150,000,000 | 14.5 | |||||||||||
| Interest-Only | 7 | $342,775,000 | 33.0 | % | 25.1 - 30.0 | 1 | 2,525,000 | 0.2 | ||||||||||
| 216 - 240 | 2 | 4,120,868 | 0.4 | 30.1 - 40.0 | 1 | 12,400,000 | 1.2 | |||||||||||
| 241 - 300 | 9 | 194,260,509 | 18.7 | 40.1 - 45.0 | 2 | 29,260,000 | 2.8 | |||||||||||
| 301 - 360 | 46 | 489,142,450 | 47.1 | 45.1 - 50.0 | 11 | 352,995,509 | 34.0 | |||||||||||
| 361 - 480 | 2 | 5,658,956 | 0.5 | 50.1 - 55.0 | 15 | 112,499,000 | 10.8 | |||||||||||
| 481 - 540 | 1 | 1,998,855 | 0.2 | 55.1 - 60.0 | 9 | 173,312,349 | 16.7 | |||||||||||
| Total: | 67 | $1,037,956,638 | 100.0 | % | 60.1 - 64.9 | 13 | 165,300,000 | 15.9 | ||||||||||
Weighted Average(3): | 343 months | Total: | 67 | $1,037,956,638 | 100.0 | % | ||||||||||||
(2) The original amortization term shown for any mortgage loan that is interest-only for part of its term does not include the number of months in its interest-only period and reflects only the number of months as of the commencement of amortization remaining from the end of such interest-only period. (3) Excludes the non-amortizing loans. | Weighted Average: | 47.3% | ||||||||||||||||
| AMORTIZATION TYPE | ||||||||||||||||||
| Number | ||||||||||||||||||
| of | ||||||||||||||||||
| Mortgage | Aggregate Cut- | % of Cut-off | ||||||||||||||||
REMAINING AMORTIZATION TERM(4) | Type of Amortization | Loans | off Date Balance | Date Balance | ||||||||||||||
| Range of Remaining | Number of | Amortizing Balloon | 41 | $354,296,638 | 34.1 | % | ||||||||||||
| Amortization Terms | Mortgage | Aggregate Cut- | % of Cut-off | Interest-only, Balloon | 7 | 342,775,000 | 33.0 | |||||||||||
| (months) | Loans | off Date Balance | Date Balance | Interest-only, Amortizing Balloon | 19 | 340,885,000 | 32.8 | |||||||||||
| Interest-Only | 7 | $342,775,000 | 33.0 | % | Total: | 67 | $1,037,956,638 | 100.0 | % | |||||||||
| 216 - 240 | 2 | 4,120,868 | 0.4 | |||||||||||||||
| 241 - 300 | 9 | 194,260,509 | 18.7 | ORIGINAL TERM OF INTEREST-ONLY PERIOD FOR PARTIAL IO LOANS | ||||||||||||||
| 301 - 360 | 46 | 489,142,450 | 47.1 | Number of | ||||||||||||||
| 361 - 480 | 2 | 5,658,956 | 0.5 | Mortgage | Aggregate Cut- | % of Cut-off | ||||||||||||
| 481 - 539 | 1 | 1,998,855 | 0.2 | IO Term (months) | Loans | off Date Balance | Date Balance | |||||||||||
| Total: | 67 | $1,037,956,638 | 100.0 | % | 1 - 6 | 4 | $40,275,000 | 3.9 | % | |||||||||
Weighted Average(5): | 343 months | 7 - 12 | 4 | 136,750,000 | 13.2 | |||||||||||||
(4) The remaining amortization term shown for any mortgage loan that is interest-only for part of its term does not include the number of months in its interest-only period and reflects only the number of months as of the commencement of amortization remaining from the end of such interest-only period. (5) Excludes the non-amortizing loans. | 13 - 24 | 4 | 31,610,000 | 3.0 | ||||||||||||||
| 25 - 36 | 6 | 119,850,000 | 11.5 | |||||||||||||||
| 37 - 60 | 1 | 12,400,000 | 1.2 | |||||||||||||||
| Total: | 19 | $340,885,000 | 32.8 | % | ||||||||||||||
| Weighted Average: | 19 months | |||||||||||||||||
| LOCKBOXES | ||||||||||||||||||
| Number | SEASONING | |||||||||||||||||
| of | % of Cut-off | Number of | ||||||||||||||||
| Mortgage | Aggregate Cut- | Date | Mortgage | Aggregate Cut- | % of Cut-off | |||||||||||||
| Type of Lockbox | Loans | off Date Balance | Balance | Seasoning (months) | Loans | off Date Balance | Date Balance | |||||||||||
| Hard/Springing Cash Management | 15 | $478,200,000 | 46.1 | % | 0 | 52 | $808,174,000 | 77.9 | % | |||||||||
| Hard/Upfront Cash Management | 2 | 178,500,000 | 17.2 | 1 - 2 | 15 | 229,782,638 | 22.1 | |||||||||||
| Soft/Springing Cash Management | 5 | 134,200,000 | 12.9 | Total: | 67 | $1,037,956,638 | 100.0 | % | ||||||||||
| Springing (W/Out Estab. Account) | 21 | 131,394,509 | 12.7 | Weighted Average: | 0 months | |||||||||||||
| None | 23 | 106,662,129 | 10.3 | |||||||||||||||
| Springing (With Estab. Account) | 1 | 9,000,000 | 0.9 | |||||||||||||||
| Total: | 67 | $1,037,956,638 | 100.0 | % | ||||||||||||||
| PREPAYMENT PROVISION SUMMARY | ||||||||||||||||||
| Number of | % of Cut- | |||||||||||||||||
| Mortgage | Aggregate Cut- | off Date | ||||||||||||||||
| Prepayment Provision | Loans | off Date Balance | Balance | |||||||||||||||
| Lockout/Defeasance/Open | 49 | $801,381,859 | 77.2 | % | ||||||||||||||
| Lockout/Defeasance YM%/Open | 2 | 188,150,000 | 18.1 | |||||||||||||||
| YM%/1%/Open | 15 | 43,924,779 | 4.2 | |||||||||||||||
| Lockout/YM%/Open | 1 | 4,500,000 | 0.4 | |||||||||||||||
| Total: | 67 | $1,037,956,638 | 100.0 | % | ||||||||||||||
THE INFORMATION IN THIS STRUCTURAL AND COLLATERAL TERM SHEET IS NOT COMPLETE AND MAY BE AMENDED PRIOR TO THE TIME OF SALE. THIS TERM SHEET IS NOT AN OFFER TO SELL THESE SECURITIES AND IT IS NOT A SOLICITATION OF AN OFFER TO BUY THESE SECURITIES IN ANY JURISDICTION WHERE THE OFFER OR SALE IS NOT PERMITTED.
15
| WFRBS Commercial Mortgage Trust 2013-C18 | Certain Terms and Conditions |
V. Certain Terms and Conditions
| Interest Entitlements: | The interest entitlement of each Class of Offered Certificates on each Distribution Date generally will be the interest accrued during the related Interest Accrual Period on the related Certificate Principal Balance or Notional Amount at the related pass-through rate, net of any prepayment interest shortfalls allocated to that Class for such Distribution Date as described below. If prepayment interest shortfalls arise from voluntary prepayments (without Special Servicer consent) on particular non-specially serviced mortgage loans during any collection period, the applicable Master Servicer is required to make a compensating interest payment to offset those shortfalls, generally up to an amount equal to the portion of its master servicing fees that accrue at one basis point per annum. The remaining amount of prepayment interest shortfalls will be allocated to reduce the interest entitlement on all Classes of Certificates (other than the Class X-A Certificates), pro rata, based on their respective amounts of accrued interest for the related Distribution Date (except with respect to the allocation among the Class A-S, Class B, Class C and Class PEX Certificates as described below under “Allocations and Distributions on the Class A-S, B, C and PEX Certificates”). If a Class receives less than the entirety of its interest entitlement on any Distribution Date, then the shortfall, excluding any shortfall due to prepayment interest shortfalls, will be added to its interest entitlement for the next succeeding Distribution Date. Interest entitlements on the Class D, C and B Certificates, in that order, may be reduced by certain Trust Advisor expenses (subject to the discussion below under “Allocations and Distributions on the Class A-S, B, C and PEX Certificates”). | ||
| Principal Distribution Amount: | The Principal Distribution Amount for each Distribution Date generally will be the aggregate amount of principal received or advanced in respect of the mortgage loans, net of any non-recoverable advances and interest thereon that are reimbursed to the applicable Master Servicer, the applicable Special Servicer or the Trustee during the related collection period. Non-recoverable advances and interest thereon are reimbursable from principal collections and advances before reimbursement from other amounts. The Principal Distribution Amount may also be reduced, with a corresponding loss, to the Class D Certificates and the Class C, B and A-S regular interests, then to the Class A-1, A-2, A-3, A-4, A-5 and A-SB Certificates (with any losses on the Class A-1, A-2, A-3, A-4, A-5 and A-SB Certificates allocated pro rata according to their respective Certificate Principal Balances immediately prior to that Distribution Date), in that order, in connection with certain Trust Advisor expenses to the extent that interest entitlements on the Class B and C regular interests and the Class D Certificates are insufficient to absorb the effect of the expense on any particular Distribution Date. For a discussion on the allocation of amounts distributable in respect of the Class A-S, B and C regular interests, see “Allocations and Distributions on the Class A-S, B, C and PEX Certificates” below. | ||
| Distributions: | On each Distribution Date, funds available for distribution from the mortgage loans, net of specified trust fees, expenses and reimbursements will generally be distributed in the following amounts and order of priority (in each case to the extent of remaining available funds): | ||
1. Class A-1, A-2, A-3, A-4, A-5, A-SB and X-A Certificates: To interest on the Class A-1, A-2, A-3, A-4, A-5, A-SB and X-A Certificates, pro rata, according to their respective interest entitlements. | |||
| 2. Class A-1, A-2, A-3, A-4, A-5 and A-SB Certificates: To principal on the Class A-1, A-2, A-3, A-4, A-5 and A-SB Certificates in the following amounts and order of priority: (i) first, to principal on the Class A-SB Certificates, in an amount up to the Principal Distribution Amount for such Distribution Date until their Certificate Principal Balance is reduced to the Class A-SB Planned Principal Balance for such Distribution Date; (ii) second, to principal on the Class A-1 Certificates until their Certificate Principal Balance is reduced to zero, up to the remainder of the Principal Distribution Amount for such Distribution Date; (iii) third, to principal on the Class A-2 Certificates until their Certificate Principal Balance is reduced to zero, up to the remainder of the Principal Distribution Amount for such Distribution Date; (iv) fourth, to principal on the Class A-3 Certificates until their Certificate Principal Balance is reduced to zero, up to the remainder of the Principal Distribution Amount for such Distribution Date; (v) fifth, to principal on the Class A-4 Certificates until their Certificate Principal Balance is reduced to zero, up to the remainder of the Principal Distribution Amount for such Distribution Date; (vi) sixth, to principal on the Class A-5 Certificates until their Certificate Principal Balance is reduced to zero, up to the remainder of the Principal Distribution Amount for such Distribution Date; and (vii) seventh, to principal on the Class A-SB Certificates until their Certificate Principal Balance is reduced to zero, up to the remainder of the Principal Distribution Amount for such Distribution Date. However, if the Certificate Principal Balance of each and every Class of Principal Balance Certificates, other than the Class A-1, A-2, A-3, A-4, A-5 and A-SB Certificates, has been reduced to zero as a result of the allocation of Mortgage Loan losses and expenses and any of the Class A-1, A-2, A-3, A-4, A-5 and A-SB Certificates |
THE INFORMATION IN THIS STRUCTURAL AND COLLATERAL TERM SHEET IS NOT COMPLETE AND MAY BE AMENDED PRIOR TO THE TIME OF SALE. THIS TERM SHEET IS NOT AN OFFER TO SELL THESE SECURITIES AND IT IS NOT A SOLICITATION OF AN OFFER TO BUY THESE SECURITIES IN ANY JURISDICTION WHERE THE OFFER OR SALE IS NOT PERMITTED.
16
| WFRBS Commercial Mortgage Trust 2013-C18 | Certain Terms and Conditions |
remains outstanding, then the Principal Distribution Amount will be distributed on the Class A-1, A-2, A-3, A-4, A-5 and A-SB Certificates, pro rata, based on their respective outstanding Certificate Principal Balances, until their Certificate Principal Balances have been reduced to zero. | |||
3. Class A-1, A-2, A-3, A-4, A-5 and A-SB Certificates: To reimburse the holders of the Class A-1, A-2, A-3, A-4, A-5 and A-SB Certificates, pro rata, for any previously unreimbursed losses (other than certain Trust Advisor expenses) on the mortgage loans that were previously allocated in reduction of the Certificate Principal Balances of such Classes. | |||
4. Class A-S regular interest: To make distributions on the Class A-S regular interest as follows: (a) first, to interest on Class A-S regular interest in the amount of the interest entitlement for that Class; (b) next, to the extent of the portion of the Principal Distribution Amount remaining after distributions in respect of principal to each Class with a higher distribution priority (in this case, the Class A-1, A-2, A-3, A-4, A-5 and A-SB Certificates), to principal on the Class A-S regular interest until its principal balance is reduced to zero; and (c) next, to reimburse the holders of the Class A-S regular interest for any previously unreimbursed losses (other than certain Trust Advisor expenses) on the mortgage loans that were previously allocated to that Class in reduction of its principal balance. 5. Class B regular interest: To make distributions on the Class B regular interest as follows: (a) first, to interest on Class B regular interest in the amount of the interest entitlement for that Class; (b) next, to the extent of the portion of the Principal Distribution Amount remaining after distributions in respect of principal to each Class with a higher distribution priority (in this case, the Class A-1, A-2, A-3, A-4, A-5 and A-SB Certificates and the Class A-S regular interest), to principal on the Class B regular interest until its principal balance is reduced to zero; and (c) next, to reimburse the holders of the Class B regular interest for any previously unreimbursed losses (other than certain Trust Advisor expenses) on the mortgage loans that were previously allocated to that Class in reduction of its principal balance. 6. Class C regular interest: To make distributions on the Class C regular interest as follows: (a) first, to interest on Class C regular interest in the amount of the interest entitlement for that Class; (b) next, to the extent of the portion of the Principal Distribution Amount remaining after distributions in respect of principal to each Class with a higher distribution priority (in this case, the Class A-1, A-2, A-3, A-4, A-5 and A-SB Certificates and the Class A-S and B regular interests), to principal on the Class C regular interest until its principal balance is reduced to zero; and (c) next, to reimburse the holders of the Class C regular interest for any previously unreimbursed losses (other than certain Trust Advisor expenses) on the mortgage loans that were previously allocated to that Class in reduction of its principal balance. | |||
7. After the Class A-1, A-2, A-3, A-4, A-5 and A-SB Certificates and Class A-S, B and C regular interests are paid all amounts to which they are entitled, the remaining funds available for distribution will be used to pay interest, principal and loss reimbursement amounts (other than certain Trust Advisor expenses) on the Class D, E, F and G Certificates sequentially in that order in a manner analogous to the Class C regular interest. | |||
| Allocations and Distributions on the Class A-S, B, C and PEX Certificates: | On the closing date, the upper-tier REMIC of the issuing entity will issue the Class A-S, Class B and Class C regular interests (each a “regular interest”) which will have outstanding principal balances on the closing date of $70,062,000, $72,657,000 and $36,329,000, respectively. The regular interests will be held in a grantor trust for the benefit of the holders of the Class A-S, B, C and PEX Certificates. The Class A-S, B, C and PEX Certificates will, at all times, represent undivided beneficial ownership interests in a grantor trust that will hold those regular interests. Each class of the Class A-S, B, C and PEX Certificates will, at all times, represent an undivided beneficial ownership interest in a percentage of the outstanding principal balance of the regular interest with the same alphabetical class designation. The Class PEX Certificates will, at all times, represent an undivided beneficial ownership interest in the remaining percentages of the outstanding principal balances of the Class A-S, B and C regular interests and which percentage interests are referred to in this Term Sheet as the “Class PEX Component A-S, Class PEX Component B and Class PEX Component C” (collectively, the “Class PEX Components”). |
THE INFORMATION IN THIS STRUCTURAL AND COLLATERAL TERM SHEET IS NOT COMPLETE AND MAY BE AMENDED PRIOR TO THE TIME OF SALE. THIS TERM SHEET IS NOT AN OFFER TO SELL THESE SECURITIES AND IT IS NOT A SOLICITATION OF AN OFFER TO BUY THESE SECURITIES IN ANY JURISDICTION WHERE THE OFFER OR SALE IS NOT PERMITTED.
17
| WFRBS Commercial Mortgage Trust 2013-C18 | Certain Terms and Conditions |
Interest, principal, prepayment premiums, yield maintenance charges and voting rights that are allocated to the Class A-S, B or C regular interest will be distributed or allocated, as applicable, as between the Class A-S, B or C Certificates, as applicable, on the one hand, and Class PEX Component A-S, Class PEX Component B or Class PEX Component C, as applicable (and correspondingly, the Class PEX Certificates), on the other hand, pro rata, based on their respective percentage interests in the Class A-S, Class B or Class C regular interest, as applicable. In addition, any losses (including, without limitation, as a result of Trust Advisor expenses) that are allocated to the Class A-S, Class B or Class C regular interest will correspondingly be allocated as between the Class A-S, B or C Certificates, as applicable, on the one hand, and Class PEX Component A-S, Class PEX Component B or Class PEX Component C, as applicable (and correspondingly, the Class PEX Certificates), on the other hand, pro rata, based on their respective percentage interests in the Class A-S, Class B or Class C regular interest, as applicable. For a complete description of the allocations and distributions with respect to the Class A-S regular interest, the Class B regular interest and the Class C regular interest (and correspondingly the Class A-S, B, C and PEX Certificates and the Class PEX Component A-S, Class PEX Component B and Class PEX Component C), see “Description of the Offered Certificates” in the Free Writing Prospectus. See “Material Federal Income Tax Consequences” in the Free Writing Prospectus for a discussion of the tax treatment of the Exchangeable Certificates. | |||
Exchanging Certificates through Combination and Recombination: | If you own Class A-S, B and C Certificates, you will be able to exchange them for a proportionate interest in the Class PEX Certificates, and vice versa, as described in the Free Writing Prospectus. You can exchange your Exchangeable Certificates by notifying the Certificate Administrator. If Exchangeable Certificates are outstanding and held by certificateholders, those certificates will receive principal and interest that would otherwise have been payable on the same proportion of certificates exchanged therefor if those certificates were outstanding and held by certificateholders. Any such allocations of principal and interest between classes of Exchangeable Certificates will have no effect on the principal or interest entitlements of any other class of certificates. The Free Writing Prospectus describes the available combinations of Exchangeable Certificates eligible for exchange. | ||
| Allocation of Yield Maintenance and Prepayment Premiums: | If any yield maintenance charges and prepayment premiums are collected during any particular collection period with respect to any mortgage loan, then on the distribution date corresponding to that collection period, the certificate administrator will pay a portion of the yield maintenance charges and prepayment premiums (net of liquidation fees payable therefrom) in the following manner: (1) pro rata, between (x) the group ( “YM Group A”) of the Class A-1, A-2, A-3, A-4, A-5 and A-SB Certificates and the Class A-S regular interest and (y) the group ( “YM Group B” and, collectively with the YM Group A, “YM Groups”) of Class B and C regular interests and the Class D Certificates, based upon the aggregate amount of principal distributed to the applicable classes of principal balance certificates (other than the Class A-S, B, C and PEX Certificates) and the Class A-S, B and C regular interests, as applicable, in each YM Group for that distribution date, and (2) among the classes of certificates and regular interest(s) in each YM Group, in the following manner, up to an amount equal to the product of (a) the yield maintenance or prepayment premium allocated to such YM Group, (b) the related Base Interest Fraction (as defined in the Free Writing Prospectus), and (c) a fraction, which in no event may be greater than 1.0, the numerator of which is equal to the amount of principal distributed to the holder(s) of such class or regular interest for that distribution date, and the denominator of which is the aggregate amount of principal distributed to all the certificates and the regular interests in that YM Group for that distribution date. Any yield maintenance charges or prepayment premium allocated to such YM Group remaining after such distributions to Principal Balance Certificates or regular interest(s) described above will be distributed to the Class X-A Certificates. | ||
| No prepayment premiums or yield maintenance charges will be distributed to the holders of the Class E, F, G or R Certificates. The Class X-A Certificates will be entitled to receive all yield maintenance charges and prepayment premiums after the Class A-1, A-2, A-3, A-4, A-5, A-SB and D Certificates and the Class A-S, B and C regular interests (and, therefore, the Class A-S, B, C and PEX Certificates) have been retired. For a description of when prepayment premiums and yield maintenance charges are generally required on the mortgage loans, see Annex A-1 to the Free Writing Prospectus. See also “Risk Factors—Prepayments and Repurchases of the Mortgage Assets Will Affect the Timing of Your Cash Flow and May Affect Your Yield” in the prospectus attached to the Free Writing Prospectus. Prepayment premiums and yield maintenance charges will be distributed on each Distribution Date only to the extent they are actually received on the mortgage loans as of the related Determination Date. |
THE INFORMATION IN THIS STRUCTURAL AND COLLATERAL TERM SHEET IS NOT COMPLETE AND MAY BE AMENDED PRIOR TO THE TIME OF SALE. THIS TERM SHEET IS NOT AN OFFER TO SELL THESE SECURITIES AND IT IS NOT A SOLICITATION OF AN OFFER TO BUY THESE SECURITIES IN ANY JURISDICTION WHERE THE OFFER OR SALE IS NOT PERMITTED.
18
| WFRBS Commercial Mortgage Trust 2013-C18 | Certain Terms and Conditions |
| Realized Losses: | The Certificate Principal Balances of the Class A-1, A-2, A-3, A-4, A-5, A-SB, D, E, F and G Certificates, the Class A-S, B and C regular interests will be reduced without distribution on any Distribution Date as a write-off to the extent of any losses realized on the mortgage loans allocated to such Class or regular interest on such Distribution Date. Such losses (other than certain Trust Advisor expenses) will be applied in the following order, in each case until the related Certificate Principal Balance is reduced to zero: first, to Class G; second, to Class F; third, to Class E; fourth, to Class D; fifth, to the Class C regular interest; sixth, to the Class B regular interest; seventh, to the Class A-S regular interest; and, finally, pro rata, to Classes A-1, A-2, A-3, A-4, A-5 and A-SB based on their outstanding Certificate Principal Balances. Certain Trust Advisor expenses (if not absorbed by reductions of interest entitlements on the Class D Certificates and the Class C and B regular interests) will be applied as write-offs in a similar manner, except that such write-offs will be applied only to the Class D Certificates, the Class C, B and A-S regular interests, and the Class A-1, A-2, A-3, A-4, A-5 and A-SB Certificates (with any write-offs on the Class A-1, A-2, A-3, A-4, A-5 and A-SB Certificates to be allocated pro rata according to their respective Certificate Principal Balances immediately prior to that Distribution Date), in that order. Any realized losses allocated to the Class A-S, B and C regular interests will, in turn, be allocated to the Class A-S, B, C and PEX Certificates as described above in “Allocations and Distributions on the Class A-S, B, C and PEX Certificates”. The notional amount of the Class X-A Certificates will be reduced by the amount of all losses that are allocated to the Class A-1, A-2, A-3, A-4, A-5 or A-SB Certificates or the Class A-S regular interest as write-offs in reduction of their Certificate Principal Balances. | ||
| Debt Service Advances: | The related Master Servicer or, if such Master Servicer fails to do so, the Trustee, will be obligated to advance delinquent debt service payments (other than balloon payments and default interest) and assumed debt service payments on the mortgage loans (including each pari passu mortgage loan but not its related pari passu companion loan), except to the extent any such advance is deemed non-recoverable from collections on the related mortgage loan. In addition, if an Appraisal Reduction Amount exists for a given mortgage loan, the interest portion of any debt service advance for such mortgage loan will be reduced, which will have the effect of reducing the amount of interest available for distribution to the Certificates in reverse alphabetical order of their Class designations (except that interest payments on the Class A-1, A-2, A-3, A-4, A-5, A-SB and X-A Certificates would be affected on a pari passu basis). | ||
| Servicing Advances: | Each Master Servicer or, if such Master Servicer fails to do so, the Trustee, will be obligated to make servicing advances with respect to each mortgage loan it services, including the payment of delinquent property taxes, insurance premiums and ground rent, except to the extent that those advances are deemed non-recoverable from collections on the related mortgage loan. The master servicer under the WFRBS 2013-UBS1 securitization will have the primary obligation to make any servicing advances with respect to the Sullivan Center loan combination. Furthermore, after any securitization of the Garden State Plaza pari passu companion loan, the master servicer under that securitization will have the primary obligation to make any servicing advances with respect to the related loan combination. | ||
Appraisal Reduction Amounts: | An Appraisal Reduction Amount generally will be created in the amount, if any, by which the principal balance of a required appraisal loan (which is a mortgage loan with respect to which certain defaults, modifications or insolvency events have occurred as further described in the Free Writing Prospectus) plus other amounts overdue or advanced in connection with such mortgage loan exceeds 90% of the appraised value of the related mortgaged property plus certain escrows and reserves (including letters of credit) held with respect to the mortgage loan. A mortgage loan will cease to be a required appraisal loan when the same has ceased to be a specially serviced mortgage loan (if applicable), has been brought current for at least three consecutive months and no other circumstances exist that would cause such mortgage loan to be a required appraisal loan. Appraisal Reduction Amounts will affect the amount of debt service advances on the related mortgage loan. Appraisal Reduction Amounts will also be taken into account in the determination of the identity of the Class whose majority constitutes the “majority subordinate certificateholder” and is entitled to appoint the subordinate class representative. | ||
Clean-Up Call and Exchange Termination: | On each Distribution Date occurring after the aggregate unpaid principal balance of the mortgage loans is reduced below 1% of the initial aggregate principal balance of the mortgage loans as of the Cut-off Date, certain specified persons will have the option to purchase all of the remaining mortgage loans (and the trust’s interest in all property acquired through exercise of remedies in respect of any mortgage loan) at the price specified in the Free Writing Prospectus. Exercise of the option will terminate the trust and retire the then-outstanding certificates. |
THE INFORMATION IN THIS STRUCTURAL AND COLLATERAL TERM SHEET IS NOT COMPLETE AND MAY BE AMENDED PRIOR TO THE TIME OF SALE. THIS TERM SHEET IS NOT AN OFFER TO SELL THESE SECURITIES AND IT IS NOT A SOLICITATION OF AN OFFER TO BUY THESE SECURITIES IN ANY JURISDICTION WHERE THE OFFER OR SALE IS NOT PERMITTED.
19
| WFRBS Commercial Mortgage Trust 2013-C18 | Certain Terms and Conditions |
If the aggregate Certificate Principal Balances of each of the Class A-1, A-2, A-3, A-4, A-5, A-SB and D Certificates and the Class A-S, B and C regular interests have been reduced to zero, the trust may also be terminated in connection with an exchange of all the then-outstanding certificates, for the mortgage loans and REO properties then remaining in the issuing entity, but all of the holders of those Classes of outstanding certificates would have to voluntarily participate in the exchange. | |||
| Liquidation Loan Waterfall: | Following the liquidation of any loan or property, the net liquidation proceeds generally will be applied (after reimbursement of advances and certain trust fund expenses), first, as a recovery of accrued interest, other than delinquent interest that was not advanced as a result of Appraisal Reduction Amounts, second, as a recovery of principal until all principal has been recovered, and then as a recovery of delinquent interest that was not advanced as a result of Appraisal Reduction Amounts. Please see “Description of the Offered Certificates—Distributions—Application of Mortgage Loan Collections” in the Free Writing Prospectus. | ||
| Majority Subordinate Certificateholder and Subordinate Class Representative: | A subordinate class representative may be appointed by the “majority subordinate certificate-holder”, which will be the holder(s) of a majority of: (a) during a “subordinate control period”, the most subordinate class among the Class E, F and G Certificates that has a Certificate Principal Balance, as notionally reduced by any Appraisal Reduction Amounts allocable to that class, that is at least equal to 25% of its total initial principal balance and (b) during a “collective consultation period”, the most subordinate class among the Class E, F and G Certificates that has a total principal balance, without regard to Appraisal Reduction Amounts, that is at least equal to 25% of its initial Certificate Principal Balance. The majority subordinate certificateholder will have a continuing right to appoint, remove or replace the subordinate class representative in its sole discretion. This right may be exercised at any time and from time to time. See “Servicing of the Mortgage Loans and Administration of the Trust Fund—The Majority Subordinate Certificateholder and the Subordinate Class Representative” in the Free Writing Prospectus. | ||
| Control and Consultation: | The rights of various parties to replace each Special Servicer and approve or consult with respect to major actions of either Special Servicer will vary according to defined periods. A “subordinate control period” will exist as long as the Class E Certificates have a Certificate Principal Balance, net of any Appraisal Reduction Amounts allocable to that class, that is not less than 25% of the initial principal balance of that class (unless a senior consultation period is deemed to occur generally or with respect to a particular mortgage loan, pursuant to clause (ii) of the definition of “senior consultation period”). In general, during a subordinate control period, (i) the subordinate class representative will be entitled to grant or withhold approval of asset status reports prepared, and material servicing actions proposed, by either Special Servicer, and (ii) the majority subordinate certificateholder, or the subordinate class representative on its behalf, will be entitled to terminate and replace each Special Servicer with or without cause, and appoint itself or another person as the applicable successor special servicer (other than with respect to (i) the Sullivan Center loan combination and (ii) the Garden State Plaza loan combination after the securitization of the related pari passu companion loan). It will be a condition to such appointment that DBRS, Fitch and Moody’s confirm that the appointment would not result in a qualification, downgrade or withdrawal of any of their then-current ratings of certificates. A “collective consultation period” will exist as long as the Class E Certificates have a Certificate Principal Balance that both (i) as notionally reduced by any Appraisal Reduction Amounts allocable to that class, is less than 25% of its initial principal balance and (ii) without regard to any Appraisal Reduction Amounts allocable to that class, is 25% or more of its initial Certificate Principal Balance (unless a senior consultation period is deemed to occur generally or with respect to a particular mortgage loan, pursuant to clause (ii) of the definition of “senior consultation period”). In general, during a collective consultation period, each Special Servicer will be required to consult with the Trust Advisor (in addition to the subordinate class representative, during a collective consultation period) in connection with asset status reports and material special servicing actions. A “senior consultation period” will exist as long as either (i) the Class E certificates have an aggregate principal balance, without regard to any Appraisal Reduction Amounts allocable to that class, that is less than 25% of its initial principal balance or (ii) during such time as the Class E certificates are the most subordinate class of control-eligible certificates that have a then outstanding principal balance, net of Appraisal Reduction Amounts, at least equal to 25% of its initial principal balance, the then-majority subordinate certificateholder has irrevocably waived its right to appoint a subordinate class representative and to exercise any of the rights of the majority subordinate certificateholder or cause the exercise of the rights of the subordinate class representative and such rights have not been reinstated to a successor majority subordinate certificateholder as set forth in the pooling and servicing agreement. In general, during a senior consultation period, each Special Servicer must seek to consult with the Trust Advisor in connection with asset status reports and material special servicing actions, and, in general, no subordinate class representative will be recognized or have any right to terminate either Special Servicer or approve, direct or consult with respect to servicing matters. With respect to each of the AmericasMart loan combination and The Outlet Collection | Jersey Gardens loan combination, the rights of the subordinate class representative described above will be |
THE INFORMATION IN THIS STRUCTURAL AND COLLATERAL TERM SHEET IS NOT COMPLETE AND MAY BE AMENDED PRIOR TO THE TIME OF SALE. THIS TERM SHEET IS NOT AN OFFER TO SELL THESE SECURITIES AND IT IS NOT A SOLICITATION OF AN OFFER TO BUY THESE SECURITIES IN ANY JURISDICTION WHERE THE OFFER OR SALE IS NOT PERMITTED.
20
| WFRBS Commercial Mortgage Trust 2013-C18 | Certain Terms and Conditions |
subject to the consultation rights of each holder of a related pari passu companion loan described under “Loan Combinations” below. Also, notwithstanding any contrary description set forth above, with respect to the AmericasMart mortgage loan, (a) each holder of a pari passu companion loan in the related loan combination (including any subordinate class representative or special servicer under any securitization of such pari passu companion loan) will have consultation rights with respect to asset status reports and material special servicing actions involving the related loan combination, as provided for in the related intercreditor agreement and as described in the Free Writing Prospectus, and those rights will be in addition to the rights of the subordinate class representative in this transaction described above; and (b) the existence of a subordinate control period, collective consultation period or senior consultation period under the WFRBS 2013-C18 pooling and servicing agreement will not limit the consultation rights of the holders of the related pari passu companion loans. In addition, notwithstanding any contrary description set forth above, with respect to The Outlet Collection | Jersey Gardens mortgage loan, (a) both (i) the subordinate class representative under the WFRBS 2013-UBS1 pooling and servicing agreement (or, during a senior consultation period under the WFRBS 2013-UBS1 pooling and servicing agreement, the special servicer under such pooling and servicing agreement), and (ii) the holder of the other non-controlling pari passu companion loan in the related loan combination (including any subordinate class representative or special servicer under any securitization of such pari passu companion loan), or in each case any subsequent holder of either such pari passu companion loan or its representative, will have consultation rights with respect to asset status reports and material special servicing actions involving the related loan combination, as provided for in the related intercreditor agreement and as described in the Free Writing Prospectus, and those rights will be in addition to the rights of the subordinate class representative in this transaction described above; and (b) the existence of a subordinate control period, collective consultation period or senior consultation period under the WFRBS 2013-C18 pooling and servicing agreement will not limit the consultation rights of the holders of the related pari passu companion loans. Furthermore, notwithstanding any contrary description set forth above, with respect to the Sullivan Center mortgage loan, in general the loan combination will be serviced under the WFRBS 2013-UBS1 pooling and servicing agreement, which grants to the subordinate class representative control rights that include the right to approve or disapprove various material servicing actions involving the loan combination but the subordinate class representative for this securitization will nonetheless have the right to be consulted on a non-binding basis with respect to such actions. For purposes of the servicing of the Sullivan Center loan combination, the occurrence and continuance of a collective consultation period or senior consultation period with respect to the subordinate class representative under this securitization will not limit the control or other rights of the subordinate class representative under the WFRBS 2013-UBS1 securitization, and any collective consultation period or senior consultation period or similar period under the WFRBS 2013-UBS1 securitization will not limit the consultation rights of the subordinate class representative under this securitization. In general, loan combination control rights also include the right, in certain circumstances, to direct the replacement of the applicable special servicer for the related loan combination only. | |||
| Replacement of Special Servicer by General Vote of Certificateholders: | During any ”collective consultation period” or “senior consultation period”, each Special Servicer may be terminated and replaced upon the affirmative direction of certificate owners holding not less than 75% of the appraisal-reduced voting rights of all certificates, following a proposal from certificate owners holding not less than 25% of the appraisal-reduced voting rights of all certificates. The certificateholders who initiate a vote on a termination and replacement of either Special Servicer without cause must cause DBRS, Fitch and Moody’s to confirm the then-current ratings of the certificates (or decline to review the matter) and cause the payment of the fees and expenses incurred in the replacement. | ||
| Appraisal Remedy: | Solely for purposes of determining whether a “subordinate control period” is in effect, whenever either Special Servicer obtains an appraisal or updated appraisal under the pooling and servicing agreement, the subordinate class representative, with respect to the mortgage loans (other than the Sullivan Center mortgage loan or after a securitization of the Garden State Plaza pari passu companion loan, the Garden State Plaza mortgage loan) serviced by such Special Servicer will have the right (at its or their expense) to direct such Special Servicer to hire a qualified appraiser to prepare a second appraisal of the mortgaged property. The applicable Special Servicer must thereafter determine whether, based on its assessment of such second appraisal, any recalculation of the Appraisal Reduction Amount is warranted. The Appraisal Reduction Amount, whether based on the first or the second appraisal, will become effective following the second appraisal, except that the Appraisal Reduction Amount based on the first appraisal shall become effective if the subordinate class representative declines to demand a second appraisal within a specified number of business days, or if a second appraisal is not received within 90 days after |
THE INFORMATION IN THIS STRUCTURAL AND COLLATERAL TERM SHEET IS NOT COMPLETE AND MAY BE AMENDED PRIOR TO THE TIME OF SALE. THIS TERM SHEET IS NOT AN OFFER TO SELL THESE SECURITIES AND IT IS NOT A SOLICITATION OF AN OFFER TO BUY THESE SECURITIES IN ANY JURISDICTION WHERE THE OFFER OR SALE IS NOT PERMITTED.
21
| WFRBS Commercial Mortgage Trust 2013-C18 | Certain Terms and Conditions |
| the direction of the subordinate class representative. In addition, for the same purposes, if there is a material change in the mortgaged property securing any mortgage loan for which an Appraisal Reduction Amount has been calculated, the majority certificateholder of the Class E, F or G Certificates or other designed certificateholders will be entitled (at its expense) to present an additional appraisal to such Special Servicer, which will generally be required to recalculate the Appraisal Reduction Amount based upon such additional appraisal. This latter right may not be exercised more frequently than once in any 12-month period for each mortgage loan for which an Appraisal Reduction Amount was calculated and can only be exercised during a subordinate control period or a collective consultation period as further described in the Free Writing Prospectus. | |||
| Sale of Defaulted Assets: | There will be no “fair value” purchase option. Instead, the pooling and servicing agreement will authorize each Special Servicer to sell defaulted mortgage loans serviced by such Special Servicer to the highest bidder in a manner generally similar to sales of REO properties. Subject to certain limitations set forth in the related intercreditor agreement, each mortgage loan that is part of a loan combination serviced under the WFRBS 2013-C18 pooling and servicing agreement may not be sold unless that mortgage loan and the related pari passu companion loan(s) are sold together as one whole loan. The sale of a defaulted loan (other than a non-serviced mortgage loan) for less than par plus accrued interest and certain other fees and expenses owed on the loan will be subject to consent or consultation rights of the subordinate class representative and/or Trust Advisor and, in the case of the AmericasMart and The Outlet Collection | Jersey Gardens mortgage loans, consultation rights of the holder of the related pari passu companion loans, as described in the Free Writing Prospectus. After the securitization of the Garden State Plaza pari passu companion loan, pursuant to the respective intercreditor agreement, the party acting as special servicer with respect to the Garden State Plaza loan combination pursuant to the respective trust and servicing agreement of the related securitization, may offer to sell to any person (or may offer to purchase) for cash such loan combination during such time as such loan combination constitutes a defaulted mortgage loan, and, in connection with any such sale, such special servicer is required to sell both the pari passu mortgage loan and related pari passu companion loan in any such loan combination as a whole loan. In the case of the Sullivan Center mortgage loan, pursuant to the respective intercreditor agreement and the WFRBS 2013-UBS1 pooling and servicing agreement, the WFRBS 2013-UBS1 special servicer may offer to sell to any person (or may offer to purchase) for cash such loan combination during such time as such loan combination constitutes a defaulted mortgage loan, and, in connection with any such sale, the WFRBS 2013-UBS1 special servicer is required to sell both the pari passu mortgage loan and related pari passu companion loan in any such loan combination as a whole loan. The subordinate class representative will have consultation rights as the holder of an interest in the related pari passu mortgage loan, as described in the Free Writing Prospectus. | ||
| “As-Is” Appraisals: | Appraisals must be conducted on an “as-is” basis, and must be no more than 9 months old, for purposes of determining Appraisal Reduction Amounts, market value in connection with REO sales, etc. Required appraisals may consist of updates of prior appraisals. Internal valuations by the applicable Special Servicer are permitted if the principal balance of a mortgage loan is less than $2,000,000. | ||
| Trust Advisor: | The Trust Advisor will perform certain review duties that will generally include a limited annual review of and report regarding each Special Servicer to the Certificate Administrator. The review and report generally will be based on: (a) during a collective consultation period or senior consultation period, any asset status reports and additional information delivered to the Trust Advisor by either Special Servicer with respect to any mortgage loan serviced by such Special Servicer, and/or (b) during a senior consultation period, in addition to the applicable information described above, a meeting with each Special Servicer to conduct a limited review of such Special Servicer’s operational practices on a platform basis in light of the servicing standard. In addition, during any collective consultation period or senior consultation period, each Special Servicer must seek to consult with the Trust Advisor (in addition to the subordinate class representative during a collective consultation period) in connection with material special servicing actions with respect to specially serviced mortgage loans serviced by such Special Servicer. Furthermore, under certain circumstances, but only during a senior consultation period, the Trust Advisor may recommend the replacement of either Special Servicer, in which case the Certificate Administrator will deliver notice of such recommendation to the certificateholders, and certificateholders with specified percentages of the voting rights may direct the replacement of such Special Servicer at their expense. |
THE INFORMATION IN THIS STRUCTURAL AND COLLATERAL TERM SHEET IS NOT COMPLETE AND MAY BE AMENDED PRIOR TO THE TIME OF SALE. THIS TERM SHEET IS NOT AN OFFER TO SELL THESE SECURITIES AND IT IS NOT A SOLICITATION OF AN OFFER TO BUY THESE SECURITIES IN ANY JURISDICTION WHERE THE OFFER OR SALE IS NOT PERMITTED.
22
| WFRBS Commercial Mortgage Trust 2013-C18 | Certain Terms and Conditions |
| Notwithstanding any contrary provision described above, the Trust Advisor will have no rights or duties in connection with the Garden State Plaza mortgage loan or the Sullivan Center mortgage loan. The Trust Advisor may be removed and replaced without cause upon the affirmative direction of certificates owners holding not less than 75% of the appraisal-reduced voting rights of all certificates, following a proposal from certificate owners holding not less than 25% of the appraisal-reduced voting rights of all certificates. The certificateholders who initiate a vote on a termination and replacement of the Trust Advisor without cause must cause DBRS, Fitch and Moody’s to confirm the then-current ratings of the certificates (or decline to review the matter) and cause the payment of the fees and expenses incurred in the replacement. During any “subordinate control period”, the proposed replacement trust advisor will be subject to the subordinate class representative’s consent (such consent not to be unreasonably withheld). If a proposed termination and replacement of the Trust Advisor is not consummated within 180 days following the initial request of the certificateholders who requested a vote, the proposed termination and replacement shall have no further force or effect. The Trust Advisor generally may be discharged from its duties if and when the Class A-1, A-2, A-3, A-4, A-5, A-SB, A-S, B, C, PEX and D Certificates are retired. | |||
| Certain Fee Offsets: | If a workout fee is earned by either Special Servicer following a loan default with respect to any mortgage loan that it services, then certain limitations will apply to the collection and retention of a modification fee from the borrower. The modification fee generally must not exceed 1% of the principal balance of the loan as modified. In addition, if the loan re-defaults within a specified period of months and other conditions are satisfied, any subsequent workout or liquidation fee on that loan must be reduced by a portion of the previously-collected modification fee. Furthermore, workout fees, liquidation fees and modification fees collected with respect to any workout, liquidation and/or partial liquidation of a mortgage loan or loan combination that is serviced by a Special Servicer will be subject to an aggregate cap equal to the greater of (i) $1,000,000 and (ii) 1.00% of the stated principal balance of the subject mortgage loan or loan combination. | ||
| Deal Website: | The Certificate Administrator will be required to maintain a deal website which will include, among other items: (a) summaries of asset status reports prepared by each Special Servicer, (b) inspection reports, (c) appraisals, (d) various “special notices” described in the Free Writing Prospectus, (e) the “Investor Q&A Forum” and (f) a voluntary “Investor Registry”. Investors may access the deal website following execution of a certification and confidentiality agreement. | ||
| Initial Majority Subordinate Certificateholder: | It is expected that Eightfold Real Estate Capital Fund III, L.P. or one of its affiliates will be the initial majority subordinate certificateholder. | ||
| Loan Combinations: | Each of the mortgaged properties identified on Annex A-1 to the Free Writing Prospectus as Garden State Plaza, AmericasMart, The Outlet Collection | Jersey Gardens and Sullivan Center secure both a mortgage loan to be included in the trust fund and one or more other mortgage loans that will not be included in the trust fund, which will be pari passu in right of payment with the trust mortgage loan. With respect to each group of mortgage loans, which we refer to as a “loan combination” only the Americas Mart loan combination and The Outlet Collection | Jersey Gardens loan combination will be principally serviced under the pooling and servicing agreement. The Sullivan Center loan combination will be serviced under the pooling and servicing agreement relating to the WFRBS 2013-UBS1 transaction. The Garden State Plaza loan combination will be serviced under the pooling and servicing agreement until a securitization of the related pari passu companion loan, after which the Garden State Plaza loan combination will be serviced under the trust and servicing agreement for such securitization. As of the closing date, the pari passu companion loans in such loan combinations will be held by the parties identified above under “IV. Characteristics of the Mortgage Pool—B. Summary of Pari Passu Split Loan Structures”. |
THE INFORMATION IN THIS STRUCTURAL AND COLLATERAL TERM SHEET IS NOT COMPLETE AND MAY BE AMENDED PRIOR TO THE TIME OF SALE. THIS TERM SHEET IS NOT AN OFFER TO SELL THESE SECURITIES AND IT IS NOT A SOLICITATION OF AN OFFER TO BUY THESE SECURITIES IN ANY JURISDICTION WHERE THE OFFER OR SALE IS NOT PERMITTED.
23
(THIS PAGE INTENTIONALLY LEFT BLANK)
24
| GARDEN STATE PLAZA |
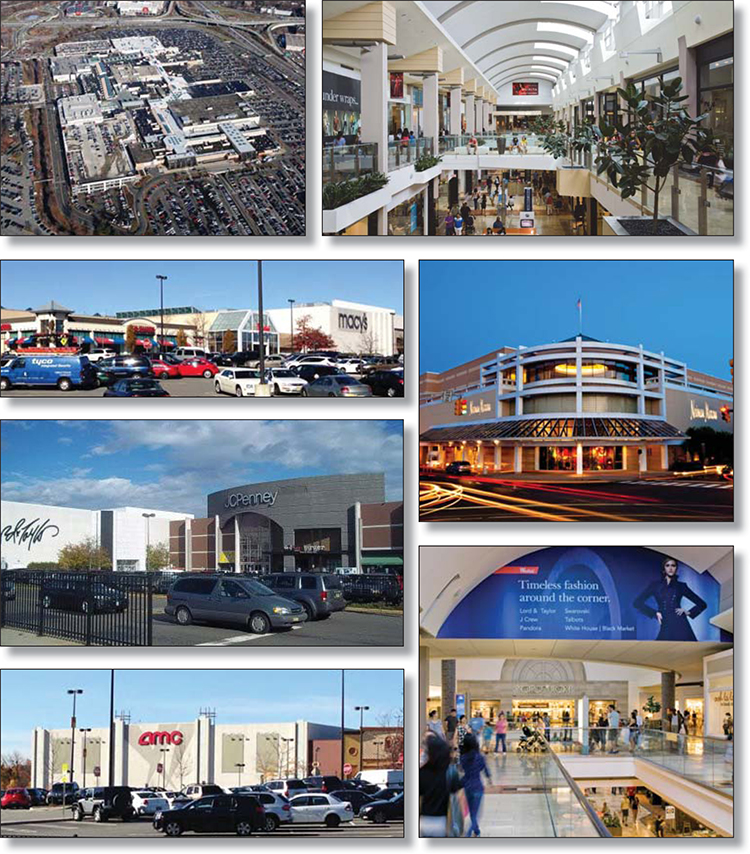
THE INFORMATION IN THIS STRUCTURAL AND COLLATERAL TERM SHEET IS NOT COMPLETE AND MAY BE AMENDED PRIOR TO THE TIME OF SALE. THIS TERM SHEET IS NOT AN OFFER TO SELL THESE SECURITIES AND IT IS NOT A SOLICITATION OF AN OFFER TO BUY THESE SECURITIES IN ANY JURISDICTION WHERE THE OFFER OR SALE IS NOT PERMITTED.
25
| GARDEN STATE PLAZA |

THE INFORMATION IN THIS STRUCTURAL AND COLLATERAL TERM SHEET IS NOT COMPLETE AND MAY BE AMENDED PRIOR TO THE TIME OF SALE. THIS TERM SHEET IS NOT AN OFFER TO SELL THESE SECURITIES AND IT IS NOT A SOLICITATION OF AN OFFER TO BUY THESE SECURITIES IN ANY JURISDICTION WHERE THE OFFER OR SALE IS NOT PERMITTED.
26
| GARDEN STATE PLAZA |
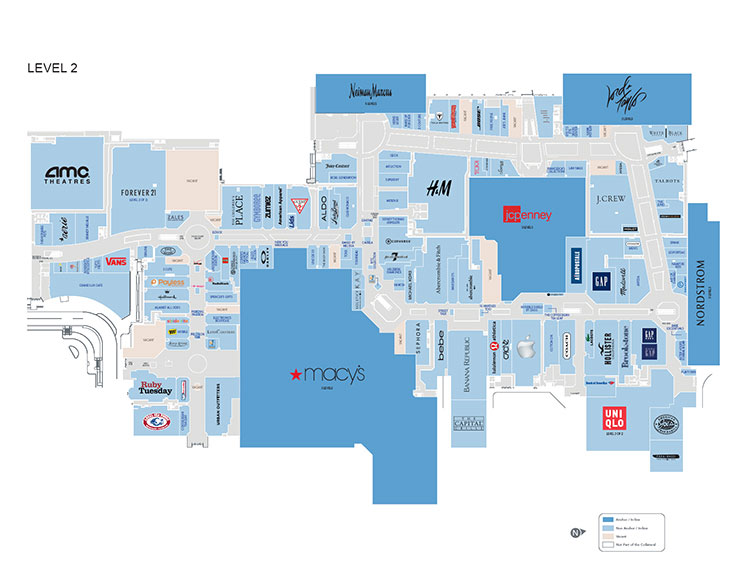
THE INFORMATION IN THIS STRUCTURAL AND COLLATERAL TERM SHEET IS NOT COMPLETE AND MAY BE AMENDED PRIOR TO THE TIME OF SALE. THIS TERM SHEET IS NOT AN OFFER TO SELL THESE SECURITIES AND IT IS NOT A SOLICITATION OF AN OFFER TO BUY THESE SECURITIES IN ANY JURISDICTION WHERE THE OFFER OR SALE IS NOT PERMITTED.
27
| GARDEN STATE PLAZA |
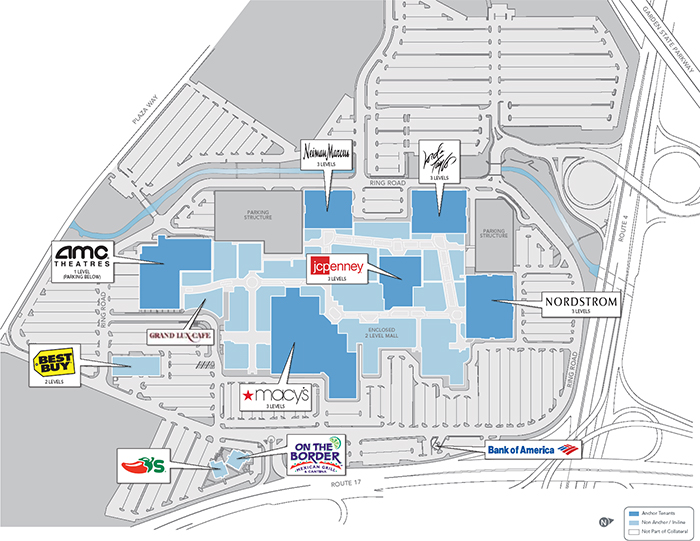
THE INFORMATION IN THIS STRUCTURAL AND COLLATERAL TERM SHEET IS NOT COMPLETE AND MAY BE AMENDED PRIOR TO THE TIME OF SALE. THIS TERM SHEET IS NOT AN OFFER TO SELL THESE SECURITIES AND IT IS NOT A SOLICITATION OF AN OFFER TO BUY THESE SECURITIES IN ANY JURISDICTION WHERE THE OFFER OR SALE IS NOT PERMITTED.
28
| GARDEN STATE PLAZA |
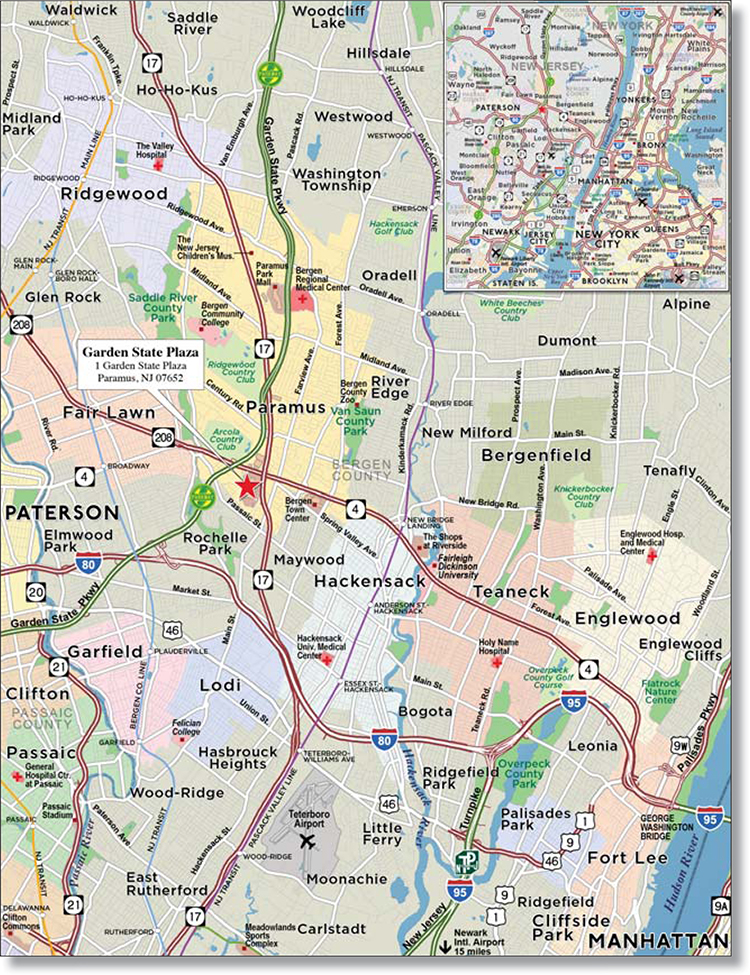
THE INFORMATION IN THIS STRUCTURAL AND COLLATERAL TERM SHEET IS NOT COMPLETE AND MAY BE AMENDED PRIOR TO THE TIME OF SALE. THIS TERM SHEET IS NOT AN OFFER TO SELL THESE SECURITIES AND IT IS NOT A SOLICITATION OF AN OFFER TO BUY THESE SECURITIES IN ANY JURISDICTION WHERE THE OFFER OR SALE IS NOT PERMITTED.
29
| No. 1 – Garden State Plaza | ||||||||
| Loan Information | Property Information | |||||||
| Mortgage Loan Seller: | The Royal Bank of Scotland | Single Asset/Portfolio: | Single Asset | |||||
Credit Assessment (DBRS/Fitch/Moody’s): | AAA/AAA/Aaa | Property Type: | Retail | |||||
Original Principal Balance(1): | $150,000,000 | Specific Property Type: | Regional Mall | |||||
Cut-off Date Principal Balance(1): | $150,000,000 | Location: | Paramus, NJ | |||||
| % of Initial Pool Balance: | 14.5% | Size(3): | 2,195,561 SF | |||||
| Loan Purpose: | Refinance | Cut-off Date Principal Balance Per SF(1): | $239.12 | |||||
| Borrower Name: | Westland Garden State Plaza Limited Partnership and GSP Holdings LLC | Year Built/Renovated: | 1957/2013 | |||||
| Sponsors: | Westfield America Inc. / Prudential Assurance Company Limited | Title Vesting: | Fee | |||||
| Mortgage Rate: | 3.8585% | Property Manager: | Self-managed | |||||
| Note Date: | December 6, 2013 | 3rd Most Recent Occupancy (As of)(4): | 98.6% (12/31/2010) | |||||
| Anticipated Repayment Date: | NAP | 2nd Most Recent Occupancy (As of)(4): | 98.1% (12/31/2011) | |||||
| Maturity Date: | January 1, 2024 | Most Recent Occupancy (As of)(4): | 98.1% (12/31/2012) | |||||
| IO Period: | 121 months | Current Occupancy (As of)(4): | 96.6% (10/31/2013) | |||||
| Loan Term (Original): | 121 months | |||||||
| Seasoning: | 0 months | Underwriting and Financial Information: | ||||||
| Amortization Term (Original): | NAP | |||||||
| Loan Amortization Type: | Interest-only, Balloon | 3rd Most Recent NOI (As of): | $84,713,196 (12/31/2011) | |||||
| Interest Accrual Method: | Actual/360 | 2nd Most Recent NOI (As of): | $90,565,265 (12/31/2012) | |||||
| Call Protection: | L(24),D or GRTR 1% or YM(90),O(7) | Most Recent NOI (As of): | $90,920,212 (TTM 9/30/2013) | |||||
| Lockbox Type: | Hard/Springing Cash Management | |||||||
Additional Debt(1): | Yes | U/W Revenues: | $135,618,503 | |||||
Additional Debt Type(1): | Pari Passu | U/W Expenses: | $35,448,138 | |||||
U/W NOI(5): | $100,170,365 | |||||||
| U/W NCF: | $97,200,339 | |||||||
U/W NOI DSCR(1): | 4.88x | |||||||
Escrows and Reserves(2): | U/W NCF DSCR(1): | 4.73x | ||||||
U/W NOI Debt Yield(1): | 19.1% | |||||||
Type: | Initial | Monthly | Cap (If Any) | U/W NCF Debt Yield(1): | 18.5% | |||
| Taxes | $0 | Springing | NAP | As-Is Appraised Value: | $2,100,000,000 | |||
| Insurance | $0 | Springing | NAP | As-Is Appraisal Valuation Date: | November 4, 2013 | |||
| Replacement Reserves | $0 | Springing | NAP | Cut-off Date LTV Ratio(1): | 25.0% | |||
| TI/LC Reserve | $0 | Springing | NAP | LTV Ratio at Maturity or ARD(1): | 25.0% | |||
| (1) | The Garden State Plaza Loan Combination, totalling $525,000,000, is comprised of two pari passu notes (Notes A-1 and A-2). Note A-2 had an original principal balance of $150,000,000, has an outstanding principal balance as of the Cut-off Date of $150,000,000 and will be contributed to the WFRBS 2013-C18 Trust. Note A-1 had an original principal balance of $375,000,000 and is expected to be contributed to a future trust. All presented statistical information related to balances per square foot, loan-to-value ratios, debt service coverage ratios, and debt yields are based on the Garden State Plaza Loan Combination. |
| (2) | See “Escrows” section. |
| (3) | The square footage at the Garden State Plaza Property includes the 81,330 square feet of additional retail space due to the recent expansion. |
| (4) | Historical and current occupancy excludes temporary and seasonal tenants. As of October 31, 2013, the occupancy inclusive of these tenants was 97.3%. The current occupancy includes the expansion space that has executed leases and leases out for signature for tenants representing 2.2% of the net rentable square feet. |
| (5) | See “Cash Flow Analysis” section. |
The Mortgage Loan. The mortgage loan (the “Garden State Plaza Loan Combination”) is evidenced by two pari passu notes (Note A-1 and Note A-2) secured by a first mortgage encumbering a regional mall located in Paramus, New Jersey (the “Garden State Plaza Property”). The Garden State Plaza Loan Combination was originated on December 6, 2013 by The Royal Bank of Scotland. The Garden State Plaza Loan Combination had an original principal balance of $525,000,000, has an outstanding principal balance as of the Cut-off Date of $525,000,000 and accrues interest at an interest rate of 3.8585% per annum. The Garden State Plaza Loan Combination had an initial term of 121 months, has a remaining term of 121 months as of the Cut-off Date and requires interest-only payments through the term of the Garden State Plaza Loan Combination. The Garden State Plaza Loan Combination matures on January 1, 2024.
Note A-2, which represents the non-controlling interest in the Garden State Plaza Loan Combination and will be contributed to the WFRBS 2013-C18 Trust, had an original principal balance of $150,000,000 and has an outstanding principal balance as of the Cut-off Date of $150,000,000. Note A-1 had an original principal balance of $375,000,000 and will be contributed to a future trust. See “Description of the Mortgage Pool - Additional Indebtedness – Split Loan Structures - The Garden State Plaza Loan Combination”, “Servicing of the Mortgage Loan and Administration of the Trust Fund” and “Servicing of the Mortgage Loan and Administration of the Trust Fund – Additional Matters Relating to the Servicing of the Garden State Plaza Loan Combination” in the Free Writing Prospectus.
THE INFORMATION IN THIS STRUCTURAL AND COLLATERAL TERM SHEET IS NOT COMPLETE AND MAY BE AMENDED PRIOR TO THE TIME OF SALE. THIS TERM SHEET IS NOT AN OFFER TO SELL THESE SECURITIES AND IT IS NOT A SOLICITATION OF AN OFFER TO BUY THESE SECURITIES IN ANY JURISDICTION WHERE THE OFFER OR SALE IS NOT PERMITTED.
30
| GARDEN STATE PLAZA |
Following the lockout period, the borrower has the right to prepay the Garden State Plaza Loan Combination in whole, but not in part, provided the borrower pays the greater of a yield maintenance premium or a prepayment premium equal to 1.0% of the outstanding loan balance. Following the defeasance lockout period, the borrower has the right to defease the Garden State Plaza Loan Combination in whole but not in part, on any payment date before July 1, 2023. In addition, the Garden State Plaza Loan Combination is prepayable without penalty on or after July 1, 2023.
Sources and Uses
| Sources | Uses | |||||||
| Original loan combination amount | $525,000,000 | 100.0% | Loan payoff | $522,158,227 | 99.5% | |||
| Closing costs | 1,851,211 | 0.3 | ||||||
| Return of equity | 990,562 | 0.2 | ||||||
| Total Sources | $525,000,000 | 100.0% | Total Uses | $525,000,000 | 100.0% |
The Property. The Garden State Plaza Property is an approximately 2.2 million square foot, two-level regional mall located in Paramus, New Jersey, approximately 10 miles northwest of downtown Manhattan. The collateral for the Garden State Plaza Loan Combination consists of 2,195,561 square feet. The Garden State Plaza Property is anchored by Neiman Marcus, Nordstrom, Macy’s, AMC Movie Theaters (“AMC”), Lord & Taylor (all of which are ground leased) and JC Penney. The Garden State Plaza Property was built in 1957, was renovated in 2007 and is in the final stages of a $159.0 million re-development that includes a new 1,800 space parking deck and the addition of approximately 81,330 square feet of additional retail space, which renovation is being paid for out of funds provided by the sponsor. Such expansion is expected to be completed and ready for occupancy in March of 2014. As of October 31, 2013, the Garden State Plaza Property was 96.6% occupied by approximately 307 tenants, which includes a recent expansion, excluding seasonal and temporary tenants, and 97.3% leased including seasonal and temporary tenants. The current occupancy includes the expansion space that has executed leases and leases out for signature for tenants representing 2.2% of the net rentable square feet. In-line tenants include Banana Republic, Gap, Forever 21, Apple, Coach, Louis Vuitton, Gucci, J. Crew, Hollister, H&M, Abercrombie & Fitch, Urban Outfitters, Anthropologie and Lululemon Athletica, among others. For the trailing 12-month period ending September 30, 2013, tenants occupying less than 10,000 square feet had comparable in-line sales of $787 per square foot with an average occupancy cost of 17.1%. Excluding Apple, in-line mall shop sales were $678 per square foot with occupancy costs of 20.0%. The Garden State Plaza Property contains 10,854 surface parking spaces (inclusive of the additional 1,800 parking spaces) reflecting a parking ratio of 9.6 spaces per 1,000 square feet of net rentable area.
THE INFORMATION IN THIS STRUCTURAL AND COLLATERAL TERM SHEET IS NOT COMPLETE AND MAY BE AMENDED PRIOR TO THE TIME OF SALE. THIS TERM SHEET IS NOT AN OFFER TO SELL THESE SECURITIES AND IT IS NOT A SOLICITATION OF AN OFFER TO BUY THESE SECURITIES IN ANY JURISDICTION WHERE THE OFFER OR SALE IS NOT PERMITTED.
31
| GARDEN STATE PLAZA |
The following table presents certain information relating to the tenancy at the Garden State Plaza Property:
Major Tenants
| Tenant Name | Credit Rating (Fitch/ Moody’s/ S&P)(1) | Tenant NRSF | % of NRSF | Annual U/W Base Rent PSF(2) | Annual U/W Base Rent(2) | % of Total Annual U/W Base Rent | Sales PSF(3) | Occupancy Cost(3)(4) | Lease Expiration Date | |||||||||
| Anchor Tenants - Collateral | ||||||||||||||||||
Macy’s(5) | (BBB/Baa3/BBB) | 439,632 | 20.0% | $18.07 | 7,945,227 | 8.9% | $245 | 7.4% | 7/31/2021 | |||||||||
Nordstrom(5) | (A-/Baa1/A-) | 245,348 | 11.2% | $10.44 | 2,562,225 | 2.9% | $439 | 2.4% | 7/31/2016(6) | |||||||||
| JC Penney | (B-/Caa1/CCC+) | 176,713 | 8.0% | $6.79 | 1,200,000 | 1.4% | $130 | 5.6% | 11/30/2021 | |||||||||
Lord & Taylor(5) | (NR/NR/NR) | 130,000 | 5.9% | $3.46 | 449,442 | 0.5% | $241 | 2.9% | 1/31/2027 | |||||||||
Neiman Marcus(5) | (NR/B3/B) | 141,139 | 6.4% | $1.22 | 172,460 | 0.2% | $331 | 1.6% | 8/31/2016(7) | |||||||||
| Total Anchor Tenants - Collateral | 1,132,832 | 51.6% | $10.88 | $12,329,354 | 13.9% | |||||||||||||
| Major Tenants - Collateral | ||||||||||||||||||
AMC(5) | (NR/B1/BB) | 95,818 | 4.4% | $31.07 | $2,976,631 | 3.4% | (8) | 14.2% | 5/31/2022 | |||||||||
| Best Buy | (BB-/Baa2/BB) | 50,000 | 2.3% | $45.63 | $2,281,600 | 2.6% | $839 | 5.4% | 11/30/2015 | |||||||||
| Uniqlo | (NR/NR/NR) | 44,171 | 2.0% | $51.48 | $2,273,738 | 2.6% | $317 | 16.2% | 1/31/2023 | |||||||||
| Forever 21 | (NR/NR/NR) | 35,132 | 1.6% | $56.24 | $1,975,824 | 2.2% | $264 | 14.5% | 9/30/2024 | |||||||||
Victoria’s Secret | (BB+/Ba1/BB+) | 20,032 | 0.9% | $76.48 | $1,532,000 | 1.7% | $965 | 7.9% | 1/31/2015 | |||||||||
| H&M | (NR/NR/NR) | 20,473 | 0.9% | $68.37 | $1,399,705 | 1.6% | $486 | 15.2% | 1/31/2022 | |||||||||
| Total Major Tenants - Collateral | 265,626 | 12.1% | $46.83 | $12,439,498 | 14.0% | |||||||||||||
| Non-Major Tenants - Collateral | 722,237 | 32.9% | $88.73 | $64,085,294 | 72.1% | |||||||||||||
Occupied Collateral Total(9) | 2,120,695 | 96.6% | $41.90 | $88,854,146 | 100.0% | |||||||||||||
| Vacant Space | 74,866 | 3.4% | ||||||||||||||||
| Collateral Total | 2,195,561 | 100.0% | ||||||||||||||||
| (1) | Certain ratings are those of the parent company whether or not the parent guarantees the lease. |
| (2) | Annual U/W Base Rent PSF and Annual U/W Base Rent include contractual rent steps through CY 2014. |
| (3) | Sales and Occupancy Costs are for the trailing 12-month period ending September 30, 2013. |
| (4) | Occupancy Costs include base rent, reimbursements and percentage rent, as applicable. |
| (5) | Macy’s, Nordstrom, Lord & Taylor, Neiman Marcus and AMC own their own improvements and are leased under ground leases of the borrower. |
| (6) | Nordstrom has eight, 10-year extension options. |
| (7) | Neiman Marcus has seven, five-year extension options. |
| (8) | AMC operates with 16 screens at the Garden State Plaza Property and had sales per screen of $1,498,938 for the trailing 12-month period ending September 30, 2013. |
| (9) | Occupancy excludes temporary and seasonal tenants. As of October 31, 2013, the occupancy, inclusive of these tenants, was 97.3%. |
The following table presents certain information relating to the historical sales and occupancy costs at the Garden State Plaza Property:
Historical Sales (PSF) and Occupancy Costs(1)
| Tenant Name | 2010 | 2011 | 2012 | TTM 9/30/2013 |
Macy’s | $239 | $248 | $241 | $245 |
| Nordstrom | $420 | $429 | $443 | $439 |
| JC Penney | $183 | $189 | $151 | $130 |
| Neiman Marcus | $321 | $357 | $349 | $331 |
| Lord & Taylor | $234 | $248 | $244 | $241 |
| AMC | (2) | (2) | (2) | (2) |
Victoria’s Secret | $815 | $942 | $954 | $965 |
| Forever 21 | $340 | $386 | $268 | $264 |
Total In-line (<10,000 square feet)(3)(4) | $677 | $746 | $775 | $787 |
Occupancy Costs(5) | NAV | 17.0% | 16.2% | 17.1% |
| (1) | Historical Sales (PSF) and Occupancy Costs are based on historical statements provided by the borrower. |
| (2) | AMC operates 16 screens and reported sales per screen of $1,516,313, $1,463,000, $1,489,563 and $1,498,938 for 2010, 2011, 2012 and TTM 9/30/2013, respectively. |
| (3) | Represents tenants occupying less than 10,000 square feet that reported sales for two years prior to each trailing 12-month reporting period. |
| (4) | Excluding Apple, Total In-line (<10,000 square feet) sales per square foot for 2010, 2011, 2012 and TTM 9/30/2013 were $590, $638, $658 and $678, respectively. |
| (5) | Excluding Apple, Total In-line (<10,000 square feet) occupancy costs for 2011, 2012 and TTM 9/30/2013 were 20.3%, 19.9% and 20.0%, respectively |
THE INFORMATION IN THIS STRUCTURAL AND COLLATERAL TERM SHEET IS NOT COMPLETE AND MAY BE AMENDED PRIOR TO THE TIME OF SALE. THIS TERM SHEET IS NOT AN OFFER TO SELL THESE SECURITIES AND IT IS NOT A SOLICITATION OF AN OFFER TO BUY THESE SECURITIES IN ANY JURISDICTION WHERE THE OFFER OR SALE IS NOT PERMITTED.
32
| GARDEN STATE PLAZA |
The following table presents certain information relating to the lease rollover schedule at the Garden State Plaza Property:
Lease Expiration Schedule(1)(2)
Year Ending December 31, | No. of Leases Expiring | Expiring NRSF | % of Total NRSF | Cumulative Expiring NRSF | Cumulative % of Total NRSF | Annual U/W Base Rent | % of Annual U/W Base Rent | Annual U/W Base Rent PSF(3) | |
| MTM | 0 | 0 | 0.0% | 0 | 0.0% | $0 | 0.0% | $0.00 | |
| 2013 | 0 | 0 | 0.0% | 0 | 0.0% | $0 | 0.0% | $0.00 | |
| 2014 | 25 | 43,082 | 2.0% | 43,082 | 2.0% | $4,065,257 | 4.6% | $94.36 | |
| 2015 | 28 | 114,471 | 5.2% | 157,553 | 7.2% | $7,316,954 | 8.2% | $63.92 | |
| 2016 | 36 | 469,556 | 21.4% | 627,109 | 28.6% | $10,157,156 | 11.4% | $21.63 | |
| 2017 | 37 | 38,703 | 1.8% | 665,812 | 30.3% | $5,049,313 | 5.7% | $130.46 | |
| 2018 | 40 | 81,033 | 3.7% | 746,845 | 34.0% | $6,622,763 | 7.5% | $81.73 | |
| 2019 | 34 | 101,994 | 4.6% | 848,839 | 38.7% | $9,415,582 | 10.6% | $92.32 | |
| 2020 | 22 | 78,788 | 3.6% | 927,627 | 42.3% | $6,033,479 | 6.8% | $76.58 | |
| 2021 | 16 | 665,951 | 30.3% | 1,593,578 | 72.6% | $12,246,057 | 13.8% | $18.39 | |
| 2022 | 15 | 163,945 | 7.5% | 1,757,523 | 80.0% | $8,497,632 | 9.6% | $51.83 | |
| 2023 | 23 | 77,618 | 3.5% | 1,835,141 | 83.6% | $5,963,703 | 6.7% | $76.83 | |
| Thereafter | 31 | 285,554 | 13.0% | 2,120,695 | 96.6% | $13,486,249 | 15.2% | $47.23 | |
Vacant(4) | 0 | 74,866 | 3.4% | 2,195,561 | 100.0% | $0 | 0.0% | $0.00 | |
| Total/Weighted Average | 307 | 2,195,561 | 100.0% | $88,854,146 | $41.90 |
| (1) | Information obtained from the underwritten rent roll. |
| (2) | Certain tenants may have lease termination options that are exercisable prior to the originally stated expiration date of the subject lease and that are not considered in the Lease Expiration Schedule. |
| (3) | Weighted Average Annual U/W Base Rent PSF excludes vacant space. |
| (4) | Occupancy excludes temporary and seasonal tenants. As of October 31, 2013, the occupancy, inclusive of these tenants, was 97.3%. |
The following table presents historical occupancy percentages at the Garden State Plaza Property:
Historical Occupancy(1)(2)
12/31/2008 | 12/31/2009 | 12/31/2010 | 12/31/2011 | 12/31/2012 | 10/31/2013(3) | |||||
| 98.6% | 97.9% | 98.6% | 98.1% | 98.1% | 96.6% |
| (1) | Information obtained from the borrower. |
| (2) | Occupancy excludes temporary and seasonal tenants. As of October 31, 2013, the occupancy, inclusive of these tenants, was 97.3%. |
| (3) | The current occupancy includes the expansion space that has executed leases and leases out for signature for tenants representing 2.2% of the net rentable square feet. |
Historical Average Base Rent (PSF)(1)
12/31/2009 | 12/31/2010 | 12/31/2011 | 12/31/2012 | |||
| $34.31 | $33.54 | $35.58 | $36.99 |
| (1) | Information obtained from the borrower’s operating statements. |
THE INFORMATION IN THIS STRUCTURAL AND COLLATERAL TERM SHEET IS NOT COMPLETE AND MAY BE AMENDED PRIOR TO THE TIME OF SALE. THIS TERM SHEET IS NOT AN OFFER TO SELL THESE SECURITIES AND IT IS NOT A SOLICITATION OF AN OFFER TO BUY THESE SECURITIES IN ANY JURISDICTION WHERE THE OFFER OR SALE IS NOT PERMITTED.
33
| GARDEN STATE PLAZA |
Operating History and Underwritten Net Cash Flow. The following table presents certain information relating to the historical operating performance and the Underwritten Net Cash Flow at the Garden State Plaza Property:
Cash Flow Analysis
| 2011 | 2012 | TTM 9/30/2013 | U/W | U/W $ per SF | |||||||
| Base Rent | $76,407,478 | $81,047,025 | $82,529,638(1) | $88,854,146(1) | $40.47 | ||||||
| Grossed Up Vacant Space | 0 | 0 | 0 | 9,001,139 | 4.10 | ||||||
| Percentage Rent | 729,276 | 1,222,963 | 1,096,104 | 1,155,738(2) | 0.53 | ||||||
| Total Reimbursables | 31,143,571 | 34,742,087 | 36,619,355 | 40,528,972 | 18.46 | ||||||
| Other Income | 10,119,406 | 6,727,973 | 6,085,368 | 5,079,647 | 2.31 | ||||||
| Less Vacancy & Credit Loss | (9,837) | (593,249) | (373,023) | (9,001,139)(3) | (4.10) | ||||||
| Effective Gross Income | $118,389,894 | $123,146,799 | $125,957,442 | $135,618,503 | $61.77 | ||||||
| Total Operating Expenses | $33,676,698 | $32,581,534 | $35,037,230 | $35,448,138 | $16.15 | ||||||
| Net Operating Income | $84,713,196 | $90,565,265 | $90,920,212 | $100,170,365(1) | $45.62 | ||||||
| TI/LC | 0 | 0 | 0 | 2,535,156 | 1.15 | ||||||
| Capital Expenditures | 0 | 0 | 0 | 434,870 | 0.20 | ||||||
| Net Cash Flow | $84,713,196 | $90,565,265 | $90,920,212 | $97,200,339 | $44.27 | ||||||
NOI DSCR(4) | 4.12x | 4.41x | 4.43x | 4.88x | |||||||
NCF DSCR(4) | 4.12x | 4.41x | 4.43x | 4.73x | |||||||
NOI DY(4) | 16.1% | 17.3% | 17.3% | 19.1% | |||||||
NCF DY(4) | 16.1% | 17.3% | 17.3% | 18.5% |
| (1) | The U/W Base Rent and U/W NOI are higher than the TTM 9/30/2013 Base Rent and TTM 9/30/2013 NOI due to recently signed leases in the expansion space at the Garden State Plaza Property. |
| (2) | Underwritten Percentage Rent represents percentage rent overage and does not include percentage rent in lieu of base rent. |
| (3) | The underwritten economic vacancy is 6.3%. The Garden State Plaza Property was 96.6% physically occupied exclusive of seasonal and temporary tenants and 97.3% physically occupied inclusive of seasonal and temporary tenants as of October 31, 2013. |
| (4) | DSCRs and debt yields are based on the Garden State Plaza Loan Combination on an aggregate basis. |
Appraisal. As of the appraisal valuation date of November 4, 2013, the Garden State Plaza Property had an “as-is” appraised value of $2,100,000,000.
Environmental Matters. According to a Phase I environmental site assessment dated November 7, 2013, a recognized environmental conditions was identified. The adjacent parcel to the southeast, which is not part of the collateral for the Garden State Plaza Property, is listed on the leaking underground storage tank (“LUST”) database, and cross-listed on the Historical LUST, underground storage tank (“UST”), and Brownfields databases, regarding a former Exxon gasoline station that was located southeast of the Garden State Plaza Property. Four 15,000-gallon leaded gasoline tanks, two 2,000-gallon #2 heating oil tanks, and one 550-gallon waste oil tank were removed in 1989. The USTs, registered with the New Jersey Department of Environmental Protection (NJDEP) were reported to have leaked. Historical records show that soil and groundwater were impacted, and that the case has not yet been closed. In addition, groundwater contamination in the form of a light non-aqueous phase layer (LNAPL) was identified on the groundwater table at the Garden State Plaza Property in 2012. A private Licensed Site Remediation Professional (LSRP) has been retained to complete the necessary remedial actions in accordance with the provisions of the Site Remediation and Reform Act. According to the letter from URS Corporation (who the LSRP represents) dated October 10, 2013, groundwater contamination exists, but based on concentrations of volatile organic compounds in the well closest to the Garden State Plaza Property, a vapor intrusion investigation is not required. The known LNAPL groundwater contamination onsite represents a recognized environmental condition. While considered a recognized environmental condition, based on the information provided and the fact that the LUST case is being actively remediated under the oversight of an LSRP, no further investigation of this adjoining LUST case is required.
Market Overview and Competition. The Garden State Plaza Property is located in Paramus, New Jersey, at the intersection of Route 4 and Route 17, in Northern New Jersey (“NNJ”). The Garden State Plaza Property is located approximately 10 miles northwest of downtown Manhattan, in central Bergen County, which has the highest population of the six counties in NNJ. NNJ is often referred to as the gateway region due to its proximity across the Hudson River from Manhattan. According to the appraisal, the Garden State Plaza Property has a primary trade area that encompasses 30 zip codes within the New York metropolitan statistical area. Per the appraisal, 2013 population and average household income for the trade area were reported at approximately 549,782 and $90,080, respectively.
The appraiser estimated market rent for in-line suites under 10,000 square feet to be $85.70 per square foot on a triple net basis and used an estimate of $12.00 per square foot for anchor tenants on a modified gross basis. Additionally, based on an average of comparable properties, the appraiser estimated the local market vacancy rate to be 3.0% within the primary trade area.
THE INFORMATION IN THIS STRUCTURAL AND COLLATERAL TERM SHEET IS NOT COMPLETE AND MAY BE AMENDED PRIOR TO THE TIME OF SALE. THIS TERM SHEET IS NOT AN OFFER TO SELL THESE SECURITIES AND IT IS NOT A SOLICITATION OF AN OFFER TO BUY THESE SECURITIES IN ANY JURISDICTION WHERE THE OFFER OR SALE IS NOT PERMITTED.
34
| GARDEN STATE PLAZA |
The following table presents certain information relating to some comparable retail centers for the Garden State Plaza Property:
Competitive Set(1)
Garden State Plaza (Subject) | Paramus Park Mall | The Outlets at Bergen Town Center | The Shops at Riverside | Willowbrook Mall | ||||||
| Location | Paramus, NJ | Paramus, NJ | Paramus, NJ | Hackensack, NJ | Wayne, NJ | |||||
| Distance from Subject | -- | 3.0 miles | 1.6 miles | 2.5 miles | 10.0 miles | |||||
| Property Type | Regional Mall | Regional Mall | Lifestyle Center | Regional Mall | Regional Mall | |||||
| Year Built/Renovated | 1957/2013 | 1974/2002 | 1957/2011 | 1977/2008 | 1969/1988 | |||||
| Anchors | JC Penney, Lord & Taylor, Macy’s, Neiman Marcus, Nordstrom | Macy’s, Sears | Bloomingdales Outlet, Century 21, Homegoods, Marshall’s Nordstrom Rack, Off 5th, Target, Whole Foods | Bloomingdale’s Saks Fifth Avenue | Bloomingdale’s, Lord & Taylor, Macy’s, Sears | |||||
| Total GLA | 2,195,561 SF | 770,000 SF | 1,001,936 SF | 771,000 SF | 1,522,949 SF | |||||
| Total Occupancy | 97% | 92% | 80% | 91% | 97% |
| (1) | Information obtained from the borrower’s rent roll and the appraisal. |
The Borrower. The borrower is Westland Garden State Plaza Limited Partnership, a Delaware limited liability company and a single purpose entity with two independent directors. Legal counsel to the borrower delivered a non-consolidation opinion in connection with the origination of the Garden State Plaza Loan Combination. The borrower is 50.0% owned by Westfield America, Inc. and 50.0% owned by Prudential Assurance Company Limited.
The Sponsors. The sponsor is a joint venture, 50% owned by Westfield America, Inc., a subsidiary of Westfield Group, LLC (“Westfield”) and 50% owned by The Prudential Assurance Company Limited. Westfield is a publicly owned Australian REIT that reported a net worth of approximately $6.3 billion as of December 31, 2012. Prudential Assurance Company Limited is a leading international life insurer in Asia with operations in 13 markets and is a leading life pensions providers in the United Kingdom with approximately seven million customers. Prudential Assurance Company Limited serves more than 23 million customers worldwide and has £234 billion of assets as of June 30, 2013.
Escrows. No upfront reserves are required and no monthly tax, insurance replacement reserve or tenant improvement and leasing commission reserve escrow is required so long as a Reserve DSCR Trigger Period (as defined below) has not occurred or is continuing under the Garden State Plaza Loan Combination. No monthly insurance escrow payments are required so long as (i) no Reserve DSCR Trigger Period has occurred and is continuing under the Garden State Plaza Loan Combination, or (ii) the insurance required to be maintained by the borrower is in effect under an acceptable blanket insurance policy and no event of default is ongoing. During a Reserve DSCR Trigger Period, the borrower has the ability to post a letter of credit or have a credit-worthy entity enter into a guarantee in lieu of making any reserve payments.
A “Reserve DSCR Trigger Period” will commence upon the debt service coverage ratio falling below 1.50x for any calendar quarter. A Reserve DSCR Trigger Period will end when a debt service coverage ratio of at least 1.50x has been achieved for two consecutive calendar quarters or the borrower deposits additional collateral to the lender to achieve a debt service coverage ratio of at least 1.50x.
Lockbox and Cash Management. The Garden State Plaza Loan Combination requires a lender-controlled lockbox account, which is already in place, and that the tenants deposit all revenues into such lockbox account. The loan documents are also expected to require that all rents received by the borrower or the property manager be deposited into the lockbox account within three business days after receipt. Prior to the occurrence of a continuation of an event of default all funds on deposit in the lockbox account are swept into the borrower’s operating account on a daily basis. During a continuation of an event of default, all funds on deposit in the lockbox account are swept on a daily basis to a cash management account under the control of the lender.
Property Management. The Garden State Plaza Property is managed by an affiliate of the borrower.
Assumption. The borrower is expected to have the right to transfer the Garden State Plaza Property, provided that no event of default has occurred and is continuing and certain other conditions are satisfied, including, but not limited to: (i) if requested by the lender, rating agency confirmation from DBRS, Fitch and Moody’s that the transfer will not result in a downgrade, withdrawal or qualification of the respective ratings assigned to the Series 2013-C18 Certificates and similar confirmations with respect to the ratings of any securities backed by the Garden State Plaza Companion Loan; and (ii) the lender reasonably determines that the proposed transferee is majority owned and controlled by a Qualified Transferee (as defined below) and guarantor is acceptable to lender in all respects.
A “Qualified Transferee” is (i) certain affiliates of the sponsor, (ii) Prudential Assurance Company Limited, (iii) a bank, savings and loan association, investment bank, insurance company, trust company, commingled pension trust fund, commercial credit corporation, pension plan, pension fund or pension advisory firm, mutual fund, government entity or plan, sovereign wealth fund, university endowment, real estate company, real estate partnership investment fund, real estate investment trust, or an institution substantially similar to any of the foregoing, provided that in each case under this clause (iii) any such person or entity is regularly engaged in the business of owning interests in at least seven regional malls totaling at least 6,000,000 square feet; and has not been the subject of a material governmental or regulatory investigation in the past seven years; (iv) any direct or indirect wholly owned subsidiary of one or more of the entities described in the clauses (i) through (iii) above; or (v) any other entity, provided that the lender has received written confirmation from DBRS, Fitch and Moody’s that the assumption to such entity will not, in and of itself, result in a downgrade, qualification or withdrawal of the then-current ratings assigned to any class of Series 2013-C18
THE INFORMATION IN THIS STRUCTURAL AND COLLATERAL TERM SHEET IS NOT COMPLETE AND MAY BE AMENDED PRIOR TO THE TIME OF SALE. THIS TERM SHEET IS NOT AN OFFER TO SELL THESE SECURITIES AND IT IS NOT A SOLICITATION OF AN OFFER TO BUY THESE SECURITIES IN ANY JURISDICTION WHERE THE OFFER OR SALE IS NOT PERMITTED.
35
| GARDEN STATE PLAZA |
Certificates and similar confirmations with respect to the ratings of any securities backed by the Garden State Plaza Companion Loan.
Free Release. The borrower will be permitted to obtain a release of certain immaterial or non-income producing portions of the Garden State Plaza Property from the lien of the mortgage upon the satisfaction of certain conditions, including but not limited to: (i) no event of default has occurred and is continuing and (ii) the borrower has certified to the lender that the release of the parcel will not materially and adversely affect the use, operations or economic value of the remaining improvements.
Real Estate Substitution. Not Permitted.
Ground Lease. None.
Terrorism Insurance. The loan documents are expected to require that the “all risk” insurance policy required to be maintained by the borrower provide coverage for damage from terrorism in an amount equal to the full replacement cost of the Garden State Plaza Property as well as business interruption insurance covering no less than the 18-month period following the occurrence of a casualty event, together with a six-month extended period of indemnity.
THE INFORMATION IN THIS STRUCTURAL AND COLLATERAL TERM SHEET IS NOT COMPLETE AND MAY BE AMENDED PRIOR TO THE TIME OF SALE. THIS TERM SHEET IS NOT AN OFFER TO SELL THESE SECURITIES AND IT IS NOT A SOLICITATION OF AN OFFER TO BUY THESE SECURITIES IN ANY JURISDICTION WHERE THE OFFER OR SALE IS NOT PERMITTED.
36
(THIS PAGE INTENTIONALLY LEFT BLANK)
37
| AMERICASMART |

THE INFORMATION IN THIS STRUCTURAL AND COLLATERAL TERM SHEET IS NOT COMPLETE AND MAY BE AMENDED PRIOR TO THE TIME OF SALE. THIS TERM SHEET IS NOT AN OFFER TO SELL THESE SECURITIES AND IT IS NOT A SOLICITATION OF AN OFFER TO BUY THESE SECURITIES IN ANY JURISDICTION WHERE THE OFFER OR SALE IS NOT PERMITTED.
38
| AMERICASMART |
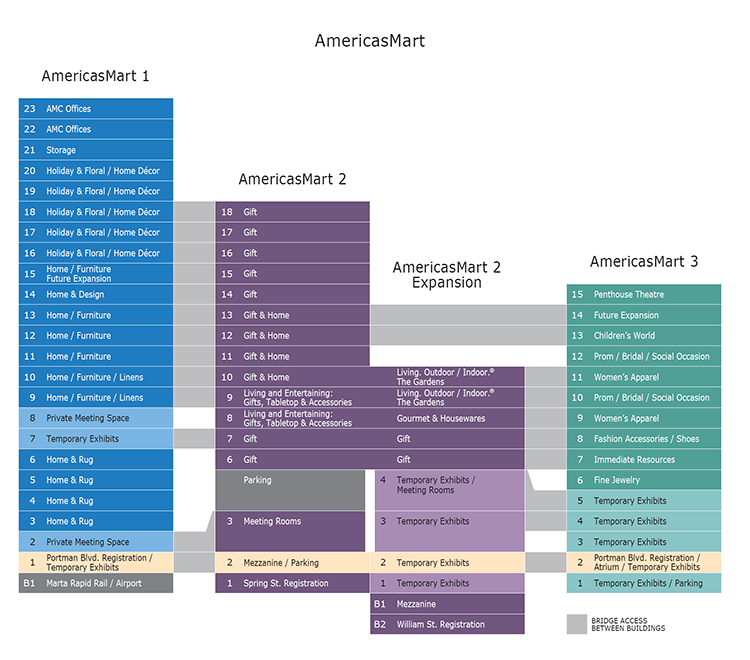
THE INFORMATION IN THIS STRUCTURAL AND COLLATERAL TERM SHEET IS NOT COMPLETE AND MAY BE AMENDED PRIOR TO THE TIME OF SALE. THIS TERM SHEET IS NOT AN OFFER TO SELL THESE SECURITIES AND IT IS NOT A SOLICITATION OF AN OFFER TO BUY THESE SECURITIES IN ANY JURISDICTION WHERE THE OFFER OR SALE IS NOT PERMITTED.
39
| AMERICASMART |
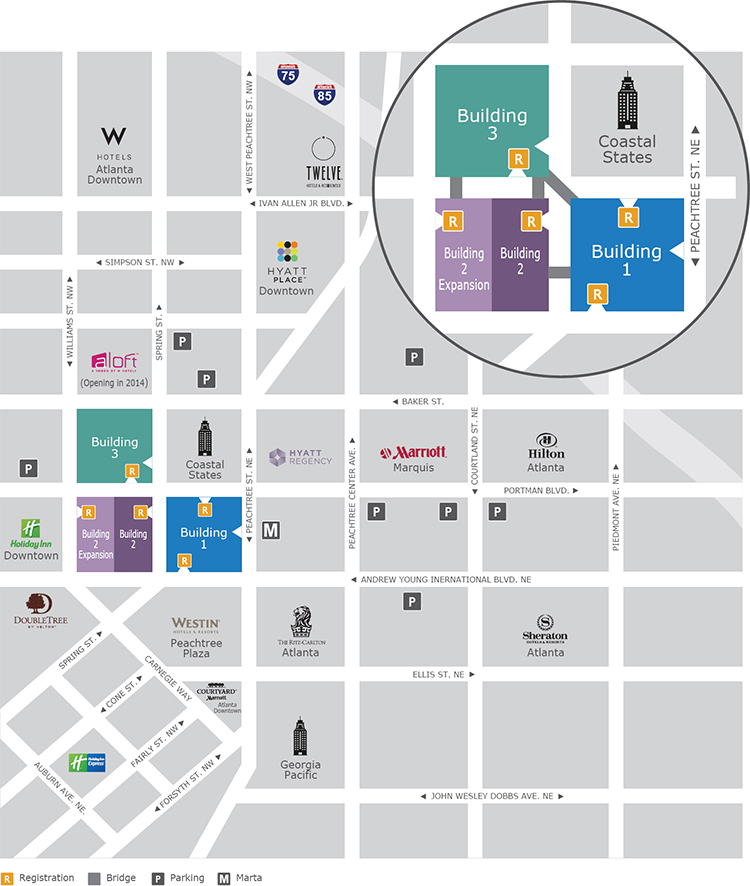
THE INFORMATION IN THIS STRUCTURAL AND COLLATERAL TERM SHEET IS NOT COMPLETE AND MAY BE AMENDED PRIOR TO THE TIME OF SALE. THIS TERM SHEET IS NOT AN OFFER TO SELL THESE SECURITIES AND IT IS NOT A SOLICITATION OF AN OFFER TO BUY THESE SECURITIES IN ANY JURISDICTION WHERE THE OFFER OR SALE IS NOT PERMITTED.
40
| AMERICASMART |

THE INFORMATION IN THIS STRUCTURAL AND COLLATERAL TERM SHEET IS NOT COMPLETE AND MAY BE AMENDED PRIOR TO THE TIME OF SALE. THIS TERM SHEET IS NOT AN OFFER TO SELL THESE SECURITIES AND IT IS NOT A SOLICITATION OF AN OFFER TO BUY THESE SECURITIES IN ANY JURISDICTION WHERE THE OFFER OR SALE IS NOT PERMITTED.
41
| No. 2 – AmericasMart |
| Loan Information | Property Information | |||||||
| Mortgage Loan Seller: | Wells Fargo Bank, National Association | Single Asset/Portfolio: | Single Asset | |||||
| Credit Assessment (DBRS/Fitch/Moody’s): | NR/NR/NR | Property Type: | Other | |||||
Original Principal Balance(1): | $140,000,000 | Specific Property Type: | Trade Mart | |||||
Cut-off Date Principal Balance(1): | $140,000,000 | Location: | Atlanta, GA | |||||
| % of Initial Pool Balance: | 13.5% | Size(3): | 4,563,219 SF | |||||
| Loan Purpose: | Refinance | Cut-off Date Principal Balance Per SF(1): | $122.72 | |||||
| Borrower Names: | AmericasMart Real Estate, LLC | Year Built/Renovated: | 1961/2008 | |||||
| Sponsors: | AMC, Inc.; Portman Financial, Inc. | Title Vesting(4): | Various | |||||
| Mortgage Rate: | 5.451% | Property Manager: | Self-managed | |||||
| Note Date: | November 14, 2013 | 3rd Most Recent Occupancy (As of)(5): | 79.4% (8/31/2010) | |||||
| Anticipated Repayment Date: | NAP | 2nd Most Recent Occupancy (As of)(5): | 78.9% (8/31/2011) | |||||
| Maturity Date: | December 1, 2023 | Most Recent Occupancy (As of)(5): | 79.6% (8/31/2012) | |||||
| IO Period: | None | Current Occupancy (As of)(5): | 84.7% (10/1/2013) | |||||
| Loan Term (Original): | 120 months | |||||||
| Seasoning: | 0 months | Underwriting and Financial Information: | ||||||
| Amortization Term (Original): | 300 months | |||||||
| Loan Amortization Type: | Amortizing Balloon | 3rd Most Recent NOI (As of): | $63,306,995 (FYE 8/31/2011) | |||||
| Interest Accrual Method: | Actual/360 | 2nd Most Recent NOI (As of): | $63,685,942 (FYE 8/31/2012) | |||||
| Call Protection: | L(24),D(92),O(4) | Most Recent NOI (As of): | $69,102,131 (FYE 8/31/2013) | |||||
| Lockbox Type: | Hard/Upfront Cash Management | |||||||
Additional Debt(1): | Yes | |||||||
Additional Debt Type(1): | Pari Passu | |||||||
| U/W Revenues: | $138,877,801 | |||||||
| U/W Expenses: | $66,651,969 | |||||||
Escrows and Reserves(2): | U/W NOI: | $72,225,832 | ||||||
| U/W NCF: | $69,187,095 | |||||||
Type: | Initial | Monthly | Cap (If Any) | U/W NOI DSCR(1): | 1.76x | |||
| Taxes | $1,284,853 | $428,285 | NAP | U/W NCF DSCR(1): | 1.68x | |||
| Insurance | $0 | Springing | NAP | U/W NOI Debt Yield(1): | 12.9% | |||
| Replacement Reserves | $1,557,473 | Springing | $1,557,473 | U/W NCF Debt Yield(1): | 12.4% | |||
| TI/LC Reserve | $2,627,360 | Springing | $2,627,360 | As-Is Appraised Value: | $920,000,000 | |||
| Deferred Maintenance | $352,469 | $0 | NAP | As-Is Appraisal Valuation Date: | October 15, 2013 | |||
| Environmental Reserve | $380,000 | $0 | NAP | Cut-off Date LTV Ratio(1): | 60.9% | |||
| Ground Rent Reserve | $4,144 | Springing | $4,144 | LTV Ratio at Maturity or ARD(1): | 46.2% | |||
| (1) | The AmericasMart Loan Combination, totaling $560,000,000, is comprised of eight pari passu notes. Notes 1-1 and 1-2 had a combined original principal balance of $140,000,000, have a combined outstanding principal balance as of the Cut-off Date of $140,000,000 and will be contributed to the WFRBS 2013-C18 Trust. The remaining six pari passu notes had an aggregate original principal balance of $420,000,000 and are expected be contributed to future trusts. All statistical information related to balances per square foot, loan-to-value ratios, debt service coverage ratios and debt yields are based on the AmericasMart Loan Combination. |
| (2) | See “Escrows” section. |
| (3) | Size includes 3,503,146 square feet of space leased by permanent tenants and 1,060,073 square feet of trade show and exhibition space. |
| (4) | See “Ground Lease and Air Rights Lease” section. |
| (5) | Current and historical occupancy is based on permanent space net rentable square footage. |
The Mortgage Loan. The mortgage loan (the “AmericasMart Loan Combination”) is evidenced by eight pari passu promissory notes (Notes 1-1 through 4-2) secured by the first mortgage encumbering a wholesale trade mart located in Atlanta, Georgia (the “AmericasMart Property”). The AmericasMart Loan Combination was co-originated on November 14, 2013 by Wells Fargo Bank, National Association and Bank of America, National Association. The AmericasMart Loan Combination had an original principal balance of $560,000,000, has an outstanding principal balance as of the Cut-off Date of $560,000,000 and accrues interest at an interest rate of 5.451% per annum. The AmericasMart Loan Combination had an initial term of 120 months, has a remaining term of 120 months as of the Cut-off Date and requires payments of principal and interest based on a 25-year amortization schedule. The AmericasMart Loan Combination matures on December 1, 2023. See “Description of the Mortgage Pool – Split Loan Structures – The AmericasMart Loan Combination” and “Servicing of the Mortgage Loans and Administration of the Trust Fund” in the Free Writing Prospectus.
THE INFORMATION IN THIS STRUCTURAL AND COLLATERAL TERM SHEET IS NOT COMPLETE AND MAY BE AMENDED PRIOR TO THE TIME OF SALE. THIS TERM SHEET IS NOT AN OFFER TO SELL THESE SECURITIES AND IT IS NOT A SOLICITATION OF AN OFFER TO BUY THESE SECURITIES IN ANY JURISDICTION WHERE THE OFFER OR SALE IS NOT PERMITTED.
42
| AMERICASMART |
Notes 1-1 and 1-2, which collectively represent the controlling interest in the AmericasMart Loan Combination and will be contributed to the WFRBS 2013-C18 Trust, had a combined original principal balance of $140,000,000 as of the Cut-off Date. The remaining six pari passu notes, which collectively had an aggregate original principal balance of $420,000,000 and each represent non-controlling interests in the AmericasMart Loan Combination, are each expected to be contributed to future trusts (the “AmericasMart Companion Loans”). As of the loan closing date, each of the remaining pari passu notes had an original principal balance of $70,000,000; however, the lender provides no assurances that any non-securitized pari passu notes will not be split further. The holders of the respective promissory notes evidencing the AmericasMart Loan Combination have entered into a co-lender agreement that sets forth the respective rights of each note holder.
Following the lockout period, the borrower has the right to defease the AmericasMart Loan Combination in whole, but not in part, on any date before September 1, 2023. In addition, the AmericasMart Loan Combination is prepayable without penalty on or after September 1, 2023.
Sources and Uses
| Sources | Uses | |||||||
| Original loan combination amount | $560,000,000 | 92.3% | Loan payoffs(1) | $583,027,371 | 96.1% | |||
| Sponsor’s new cash contribution | $46,660,201 | 7.7% | Acquisition of parcels | 13,212,500 | 2.2 | |||
| Reserves | 6,206,299 | 1.0 | ||||||
| Closing costs | 4,214,031 | 0.7 | ||||||
| Total Sources | $606,660,201 | 100.0% | Total Uses | $606,660,201 | 100.0% |
| (1) | Loan pay-offs include a $382,289,663 loan that was previously securitized in WBCMT 2005-C19 and WBCMT 2005-C20, a $153,100,808 corporate loan made by an affiliate of the borrower and a $47,636,900 construction loan secured by AmericasMart 2 Expansion which was not included as security for the prior loan securitized in WBCMT 2005-C19 and WBCMT 2005-C20. |
The Property. The AmericasMart Property is a wholesale trade mart that consists of four interconnected buildings totaling approximately 4.6 million square feet of rentable area located in Atlanta, Georgia. The four buildings, AmericasMart 1, AmericasMart 2, AmericasMart 2 Expansion and AmericasMart 3, were built in stages from 1961 through 2008 and were each designed as a department store for retailers. Of the total net rentable area, approximately 3.5 million square feet is permanent showroom space occupied by more than 1,500 tenants and approximately 1.1 million square feet is exhibition space temporarily leased to tenants during various trade shows throughout the year. Parking is provided by 1,103 parking spaces situated in parking garages located in AmericasMart 2 (five-story and 710 parking spaces) and AmericasMart 3 (393 ground level parking spaces), resulting in a parking ratio of 0.24 spaces per 1,000 square feet of net rentable square footage. The AmericasMart Property showcases consumer goods and provides a central location where manufacturers and wholesale retail purchasers can meet and transact. The AmericasMart Property also offers manufacturers, or their distributors and sales representatives, year-round centralized permanent showrooms for seasonal exhibitions of their products. By committing to permanent space, in addition to having the availability of a year-round sales facility, a manufacturer (or its distributors and sale representatives) has the ability to customize the build-out of its showroom and the tenant is assured of a specific location and has the ability to participate in trade shows held at the AmericasMart Property.
Also included in the net rentable area is ground floor retail leased to Wells Fargo, Starbucks, the United States Postal Service and Ray’s in the City restaurant. The AmericasMart Property’s average floor plate is approximately 78,000 square feet and the AmericasMart Property features 184 escalators, 27 passenger elevators, 22 freight elevators, 49 loading docks and 25 pedestrian bridges to facilitate the movement of people and merchandise between buildings.
AmericasMart 1 is a 23-story building that was built in 1961 and expanded in 1968 and 1986 and contains approximately 1.8 million square feet of net rentable area. Merchandise categories located at AmericasMart 1 include Home and Rug, Home Accents and Furniture, Home and Design, Holiday and Floral/Home Décor and Home Accents and Fine Linen. In addition, AmericasMart 1 offers four floors of exhibition space and ground floor retail tenants such as Starbucks, Wells Fargo, the United States Postal Service and Ray’s in the City Restaurant. AmericasMart 1 has 13 pedestrian bridges that connect it to AmericasMart 2, AmericasMart 3 and the Westin Peachtree Plaza hotel, located directly south of the AmericasMart Property. AmericasMart 1 accounts for approximately 40.6% of the net rentable square footage and 33.0% of the underwritten base rent of the AmericasMart Loan Combination.
AmericasMart 2 is an 18-story building that was built in 1992 and contains approximately 1.0 million square feet of net rentable area. AmericasMart 2’s merchandise categories include Gift, Living and Entertainment, Tabletops and Accessories and Home Accents and Gifts. AmericasMart 2 is connected to AmericasMart 1 by 13 pedestrian bridges and to AmericasMart 3 by two pedestrian bridges. AmericasMart 2 accounts for approximately 27.7% of the net rentable square footage and 38.0% of the underwritten base rent for the AmericasMart Loan Combination.
AmericasMart 2 Expansion is a 10-story building constructed in 2008 that is directly connected to AmericasMart 2. The AmericasMart 2 Expansion was not part of the collateral for the previously securitized loan in WBCMT 2005–C19 and WBCMT 2005–20. The building contains approximately 465,000 square feet of net rentable area and contains four floors of exhibition space. Merchandise categories located at AmericasMart 2 Expansion include Gift, Gourmet & Housewares and Living, Indoor/Outdoor and the Gardens Industries. AmericasMart 2 Expansion is connected to AmericasMart 3 by seven pedestrian bridges and accounts for approximately 8.1% of the net rentable square footage and 9.7% of the underwritten base rent for the AmericasMart Loan Combination.
AmericasMart 3 is a 15-story building that was built in 1979 and expanded in 1988 and contains approximately 1.3 million square feet of net rentable area. The building has nine floors of permanent space and five floors of exhibition space and has the largest percentage of exhibition space among the four AmericasMart buildings. Merchandise categories include the following product lines: Fine Jewelry, Apparel, Accessories & Jewelry, Fashion Accessories & Shoes, Women’s & Men’s Apparel, Social Occasion, Prom and Bridal and Children’s World (which includes gifts, bedding, home furnishings and apparel). The building features a penthouse
THE INFORMATION IN THIS STRUCTURAL AND COLLATERAL TERM SHEET IS NOT COMPLETE AND MAY BE AMENDED PRIOR TO THE TIME OF SALE. THIS TERM SHEET IS NOT AN OFFER TO SELL THESE SECURITIES AND IT IS NOT A SOLICITATION OF AN OFFER TO BUY THESE SECURITIES IN ANY JURISDICTION WHERE THE OFFER OR SALE IS NOT PERMITTED.
43
| AMERICASMART |
fashion theatre and a 13-story “Grand Atrium” which serves a focal point during trade shows and is often used to host fashion shows, dining and other special events. AmericasMart 3 accounts for approximately 21.8% of the net rentable square footage and 18.3% of the underwritten base rent for the AmericasMart Loan Combination.
As of October 1, 2013, the permanent space of the AmericasMart Property was 84.7% leased to over 1,500 tenants.
The following table presents certain information relating to the permanent space tenancy at the AmericasMart Property:
| Segment | Building | No. of Tenants | Net Rentable Area (SF) | Occupancy | In-Place Base Rent | % of Total Base Rent | In-Place Base Rent PSF |
| Holiday/Floral | 1 | 150 | 467,688 | 92.7% | $14,007,816 | 13.6% | $32.30 |
| Home Furnishings | 1 | 100 | 459,749 | 73.9% | $9,639,780 | 9.4% | $28.37 |
| Rugs | 1 | 74 | 351,215 | 81.2% | $5,867,220 | 5.7% | $20.57 |
| Fine Linens | 1 | 76 | 143,504 | 98.6% | $4,399,608 | 4.3% | $31.10 |
| Gifts | 2 & 2E | 378 | 1,023,909 | 94.1% | $41,031,672 | 39.9% | $42.61 |
| Accessories/Jewelry | 3 | 219 | 249,755 | 97.2% | $9,394,872 | 9.1% | $38.72 |
| Women’s | 3 | 157 | 177,634 | 88.9% | $4,821,684 | 4.7% | $30.55 |
| Bridal/Prom | 3 | 74 | 174,185 | 62.4% | $2,950,584 | 2.9% | $27.16 |
| Children’s | 3 | 82 | 162,192 | 35.0% | $1,591,716 | 1.5% | $28.02 |
| Gardens | 2E | 138 | 106,574 | 89.1% | $4,163,400 | 4.1% | $43.84 |
| Gift & Resort | 2E | 34 | 63,491 | 88.5% | $2,136,600 | 2.1% | $38.02 |
| Gourmet & Housewares | 2E | 62 | 57,860 | 79.4% | $1,673,928 | 1.6% | $36.46 |
| Retail | 1 & 2E | 7 | 65,390 | 64.2% | $1,074,384 | 1.1% | $32.70 |
| Total/Weighted Average | 1,551 | 3,503,146 | 84.7% | $102,753,264 | 100.0% | $34.62 |
The following table presents certain information relating to the lease rollover schedule at the AmericasMart Property:
Lease Expiration Schedule(1)(2)(3)
Year Ending December 31, | No. of Leases Expiring | Expiring NRSF | % of Total NRSF | Cumulative Expiring NRSF | Cumulative % of Total NRSF | Annual U/W Base Rent | % of Annual U/W Base Rent | Annual U/W Base Rent PSF(4) |
| MTM | 28 | 32,521 | 0.9% | 32,521 | 0.9% | $1,049,940 | 1.0% | $32.28 |
| 2013 | 230 | 274,725 | 7.8% | 307,246 | 8.8% | $10,234,176 | 10.0% | $37.25 |
| 2014 | 476 | 784,611 | 22.4% | 1,091,857 | 31.2% | $27,117,756 | 26.4% | $34.56 |
| 2015 | 424 | 770,649 | 22.0% | 1,862,506 | 53.2% | $26,737,200 | 26.0% | $34.69 |
| 2016 | 252 | 587,529 | 16.8% | 2,450,035 | 69.9% | $20,770,980 | 20.2% | $35.35 |
| 2017 | 102 | 348,433 | 9.9% | 2,798,468 | 79.9% | $11,710,980 | 11.4% | $33.61 |
| 2018 | 34 | 146,427 | 4.2% | 2,944,895 | 84.1% | $4,469,508 | 4.3% | $30.52 |
| 2019 | 3 | 9,968 | 0.3% | 2,954,863 | 84.3% | $330,156 | 0.3% | $33.12 |
| 2020 | 0 | 0 | 0.0% | 2,954,863 | 84.3% | $0 | 0.0% | $0.00 |
| 2021 | 0 | 0 | 0.0% | 2,954,863 | 84.3% | $0 | 0.0% | $0.00 |
| 2022 | 2 | 13,213 | 0.4% | 2,968,076 | 84.7% | $332,568 | 0.3% | $25.17 |
| 2023 | 0 | 0 | 0.0% | 2,968,076 | 84.7% | $0 | 0.0% | $0.00 |
| 2024 | 0 | 0 | 0.0% | 2,968,076 | 84.7% | $0 | 0.0% | $0.00 |
| Thereafter | 0 | 0 | 0.0% | 2,968,076 | 84.7% | $0 | 0.0% | $0.00 |
| Vacant | 0 | 535,070 | 15.3% | 3,503,146 | 100.0% | $0 | 0.0% | $0.00 |
| Total/Weighted Average | 1,551 | 3,503,146 | 100.0% | $102,753,264 | 100.0% | $34.62 |
| (1) | Information obtained from the underwritten rent roll. |
| (2) | Excludes trade show and exhibition space. |
| (3) | Certain tenants may have lease termination options that are exercisable prior to the originally stated expiration date of the subject lease and that are not considered in the Lease Expiration Schedule. |
| (4) | The annual and Total/Weighted Average Annual U/W Base Rent PSF excludes vacant space. |
The following table presents historical occupancy of permanent space at the AmericasMart Property:
Historical Occupancy(1)
FYE 8/31/2008(2) | FYE 8/31/2009(3) | FYE 8/31/2010(4) | FYE 8/31/2011(5) | FYE 8/31/2012(6) | 10/1/2013(7) | |||||
| 95.5% | 83.8% | 79.4% | 78.9% | 79.6% | 84.7% |
| (1) | Information obtained from the borrower. Due to the nature of the operations at the AmericasMart Property, leasable square footage varies from year to year. |
| (2) | Based on 3,098,467 net rentable square feet. |
| (3) | Based on 3,466,867 net rentable square feet. The increase of leasable square footage is attributed to the completion of the AmericasMart 2 Expansion in 2008 with leasing commencing during 2009. |
| (4) | Based on 3,458,907 net rentable square feet. |
| (5) | Based on 3,453,018 net rentable square feet. |
| (6) | Based on 3,450,976 net rentable square feet. |
| (7) | Based on 3,503,146 net rentable square feet. |
THE INFORMATION IN THIS STRUCTURAL AND COLLATERAL TERM SHEET IS NOT COMPLETE AND MAY BE AMENDED PRIOR TO THE TIME OF SALE. THIS TERM SHEET IS NOT AN OFFER TO SELL THESE SECURITIES AND IT IS NOT A SOLICITATION OF AN OFFER TO BUY THESE SECURITIES IN ANY JURISDICTION WHERE THE OFFER OR SALE IS NOT PERMITTED.
44
| AMERICASMART |
The following table presents historical base rent per square foot for permanent space tenant leases at the AmericasMart Property:
Historical Average Base Rent (PSF)(1)
FYE 8/31/2010 | FYE 8/31/2011 | FYE 8/31/2012 | FYE 8/31/2013 | |||
| $32.30 | $33.19 | $33.52 | $33.59 |
| (1) | Information obtained from borrower operating statements. The average base rent is based on collected rent divided by the permanent square footage and does not take into account space leased during trade shows or exhibitions. |
Operating History and Underwritten Net Cash Flow. The following table presents certain information relating to the historical operating performance and Underwritten Net Cash Flow at the AmericasMart Property:
Cash Flow Analysis (2006 – 2010)
| FYE 8/31/2006 | FYE 8/31/2007 | FYE 8/31/2008 | FYE 8/31/2009 | FYE 8/31/2010 | ||||||
| In-Place Permanent Revenue | $94,346,200 | $97,611,795 | $100,937,701 | $95,413,044 | $90,841,368 | |||||
| Less Rent Abatements | 0 | 0 | 0 | 0 | 0 | |||||
| Grossed Up Vacant Space | 0 | 0 | 0 | 0 | 0 | |||||
| Trade Show Revenue | 31,117,126 | 34,007,712 | 34,533,367 | 26,451,605 | 24,030,928 | |||||
| Other Income | 7,849,912 | 7,969,525 | 8,353,752 | 6,794,609 | 6,731,016 | |||||
| Less Vacancy & Credit Loss | (379,363) | (503,956) | (1,010,575) | (4,651,069) | (121,715) | |||||
| Effective Gross Income | $132,933,875 | $139,085,076 | $142,814,245 | $124,008,189 | $121,481,597 | |||||
| Total Operating Expenses | $60,818,420 | $64,893,130 | $67,874,476 | $63,997,121 | $59,178,399 | |||||
| Net Operating Income | $72,115,455 | $74,191,946 | $74,939,769 | $60,011,068 | $62,303,198 | |||||
| TI/LC | 0 | 0 | 0 | 0 | 0 | |||||
| Capital Expenditures | 0 | 0 | 0 | 0 | 0 | |||||
| Net Cash Flow | $72,115,455 | $74,191,946 | $74,939,769 | $60,011,068 | $62,303,198 | |||||
NOI DSCR(1) | 1.76x | 1.81x | 1.82x | 1.46x | 1.52x | |||||
NCF DSCR(1) | 1.76x | 1.81x | 1.82x | 1.46x | 1.52x | |||||
NOI DY(1) | 12.9% | 13.2% | 13.4% | 10.7% | 11.1% | |||||
NCF DY(1) | 12.9% | 13.2% | 13.4% | 10.7% | 11.1% |
| (1) | DSCRs and debt yields are based on the AmericasMart Loan Combination. |
Cash Flow Analysis (2011 – 2013)
| FYE 8/31/2011 | FYE 8/31/2012 | FYE 8/31/2013 | U/W | U/W $ per SF | ||||||
| In-Place Permanent Revenue | $92,651,855 | $93,899,496 | $97,527,822 | $102,753,264 | $22.52 | |||||
| Less Rent Abatements | 0 | 0 | 0 | (1,904,943)(1) | (0.42) | |||||
| Grossed Up Vacant Space | 0 | 0 | 0 | 15,649,899 | 3.43 | |||||
| Trade Show Revenue | 25,269,079 | 27,199,382 | 30,517,581 | 30,517,581 | 6.69 | |||||
| Other Income | 7,341,041 | 7,222,521 | 7,511,899 | 7,511,899 | 1.65 | |||||
| Less Vacancy & Credit Loss | 99,323 | (536,610) | (245,940) | (15,649,899)(2) | (3.43) | |||||
| Effective Gross Income | $125,361,298 | $127,784,789 | $135,311,362 | $138,877,801 | $30.43 | |||||
| Total Operating Expenses | $62,054,303 | $64,098,847 | $66,209,231 | $66,651,969 | $14.61 | |||||
| Net Operating Income | $63,306,995 | $63,685,942 | $69,102,131 | $72,225,832 | $15.83 | |||||
| TI/LC | 0 | 0 | 0 | 2,263,158 | 0.50 | |||||
| Straight-line of Upfront TI/LC Reserve | 0 | 0 | 0 | (262,736) | (0.06) | |||||
| Capital Expenditures | 0 | 0 | 0 | 1,038,315 | 0.23 | |||||
| Net Cash Flow | $63,306,995 | $63,685,942 | $69,102,131 | $69,187,095 | $15.16 | |||||
NOI DSCR(3) | 1.54x | 1.55x | 1.68x | 1.76x | ||||||
NCF DSCR(3) | 1.54x | 1.55x | 1.68x | 1.68x | ||||||
NOI DY(3) | 11.3% | 11.4% | 12.3% | 12.9% | ||||||
NCF DY(3) | 11.3% | 11.4% | 12.3% | 12.4% | ||||||
| (1) | Includes all rent abatements through August 31, 2014. |
| (2) | The underwritten economic vacancy for the permanent space is 14.8%. The AmericasMart Property was 84.7% physically occupied (excluding the trade show and exhibition space) as of September 30, 2013. |
| (3) | DSCRs and debt yields are based on the AmericasMart Loan Combination. |
THE INFORMATION IN THIS STRUCTURAL AND COLLATERAL TERM SHEET IS NOT COMPLETE AND MAY BE AMENDED PRIOR TO THE TIME OF SALE. THIS TERM SHEET IS NOT AN OFFER TO SELL THESE SECURITIES AND IT IS NOT A SOLICITATION OF AN OFFER TO BUY THESE SECURITIES IN ANY JURISDICTION WHERE THE OFFER OR SALE IS NOT PERMITTED.
45
| AMERICASMART |
Appraisal. As of the appraisal valuation date of October 15, 2013, the AmericasMart Property had an “as-is” appraised value of $920,000,000.
Environmental Matters. According to a Phase I environmental site assessment dated October 30, 2013, recognized environmental conditions and historical recognized environmental conditions were identified. The AmericasMart Property has regulatory records of a leaking underground storage tank (“LUST”) incident. A 560-gallon diesel underground storage tank (“UST”) was removed from the northwest corner of AmericasMart 3 in 2005. Soil samples from beneath the previously removed UST revealed low levels of contamination and the Georgia Environmental Protection Division (“GEPD”) released a no further action status. A former tenant, the Greyhound Bus Terminal, also had records of a LUST incident in 1984 when Greyhound Lines reported a release in excess of 15,000 gallons of fuel oil from a UST system. The release was beneath the western portion of AmericasMart 2 and in 2005, 43,786 tons of contaminated soil and 56,000 gallons of contaminated ground water were removed. The GEPD reviewed the site and issued a no further action letter on June 26, 2009. The Phase I environmental site assessment recommended removing a 1,000 gallon diesel UST at AmericasMart 1 and replacing it with an aboveground diesel tank and removing a 12,000 gallon diesel UST at AmericasMart 3 and replacing it with a double-wall fiberglass vessel with leak detection, spill prevention and double-wall piping. A $380,000 reserve was escrowed at closing, which represents approximately 200% of the estimated remediation cost.
Market Overview and Competition. The AmericasMart Property is located on three city blocks within Atlanta’s central business district and is accessible via Peachtree Street, the principal north/south street through the immediate area; Spring Street and West Peachtree Street, which provides direct access between downtown and midtown; and Marietta Street, a north/south artery that also connects downtown and midtown as well as to the Buckhead neighborhood. In addition, the AmericasMart Property is accessible via the Metropolitan Atlanta Rapid Transit Authority (“MARTA”) train station, which is located below the AmericasMart 1 building. MARTA provides direct access to and from Atlanta’s Hartsfield-Jackson International Airport. Atlanta’s central business district is home to a mixture of hotels, convention facilities and entertainment venues, which include Phillips Arena and Fox Theater and Georgia Tech and Georgia State University. The AmericasMart Property draws retailers from all 50 states and over 70 international locations and benefits from being approximately 13 miles north of Hartsfield-Jackson International Airport, which is the busiest passenger airport in the world. The AmericasMart Property has more than 10,000 hotel rooms within one mile of the AmericasMart Property and the Westin Peachtree Plaza, the Ritz Carlton Atlanta, the Doubletree by Hilton, Holiday Inn Downtown, Hyatt Regency and an Aloft (opening in 2014) are all within one block of the AmericasMart Property.
According to the appraisal, Atlanta ranks among the top 10 metropolitan areas for job growth. As of August 2013, the Atlanta metropolitan statistical area gained 57,100 jobs year-over-year and according to a third-party research report, as of August 2013, the Atlanta metropolitan statistical area reported an 18.5% year-over-year increase in home prices. According to a third party research report, Atlanta’s MSA population growth averaged 2.0% between 2002 and 2012, which is twice the national. The Atlanta metropolitan statistical area is the headquarters for four global 500 corporations, 13 Fortune 500 corporations and 24 Fortune 1000 corporations. The Home Depot, UPS, Coca-Cola, Delta Airlines, Southern Company, Genuine Parts, SunTrust and First Data are all headquartered in Atlanta and its surrounding suburbs.
Some of the major recently constructed or planned projects within the Atlanta central business district include The Georgia Aquarium, a $200.0 million project that has attracted approximately 3.6 million visitors since opening in 2005; the 30,000 square foot Children’s Museum of Atlanta that opened in 2006; the College Football Hall of Fame, a 94,256 square foot project that is expected to feature approximately 30,000 square feet of exhibit space and a 45-yard indoor football field that is scheduled to open in the fall of 2014; and the National Center for Civil and Human Rights, which is scheduled to open in 2014 and will be adjacent to the World of Coca-Cola and the Georgia Aquarium.
The following table presents certain information relating to comparable trade mart properties to the AmericasMart Property:
Competitive Set(1)
AmericasMart (Subject) | Dallas Market Center | Chicago Merchandise Mart | World Market Center | International Home Furnishings Mart | California Market Center | Decoration & Design Building | Decorative Center of Houston | |
| Location | Atlanta, GA | Dallas, TX | Chicago, IL | Las Vegas, NV | High Point, NC | Los Angeles, CA | New York, NY | Houston, TX |
| Property Type | Trade Mart | Trade Mart | Trade Mart | Trade Mart | Trade Mart | Trade Mart | Trade Mart | Trade Mart |
Year Built/ Renovated | 1961/2008 | 1957/1964 | 1930/NAP | 2005/2008 | 1921-2001/NAV | 1963/1985 | NAV/NAV | 1975& 1985/NAP |
| Merchandise Lines | Holiday/Floral, Home Furnishings, Accessories/Jewelry, Apparel, Gifts, Bridal/Prom, Gourmet & Housewares, Rugs and Fine Linens | Home Décor, Apparel, Gifts, Gourmet | Apparel, Accessories, Gifts, Furniture, Home Furnishing | Home Furnishings, Accessories | Home Furnishings | Apparel, Accessories, Gifts | Home Furnishings, Accessories | Home Furnishings, Accessories, Office |
| Total GLA | 4,563,219 SF | 8,800,000 SF | 4,200,000 SF | 4,900,000 SF | 2,684,373 SF | 1,900,000 SF | 584,000 SF | 650,000 SF |
| Total Occupancy | 85% | 85% | 95% | NAV | 89% | 90% | 92% | 83% |
| (1) | Information obtained from the appraisal. |
THE INFORMATION IN THIS STRUCTURAL AND COLLATERAL TERM SHEET IS NOT COMPLETE AND MAY BE AMENDED PRIOR TO THE TIME OF SALE. THIS TERM SHEET IS NOT AN OFFER TO SELL THESE SECURITIES AND IT IS NOT A SOLICITATION OF AN OFFER TO BUY THESE SECURITIES IN ANY JURISDICTION WHERE THE OFFER OR SALE IS NOT PERMITTED.
46
| AMERICASMART |
The Borrower. The borrower is AmericasMart Real Estate, LLC, a single purpose entity whose managing member has two independent directors. Legal counsel to the borrower delivered a non-consolidation opinion in connection with the origination of the AmericasMart Loan Combination. AMC, Inc. (“AMC”) and Portman Financial, Inc., the sponsors, are the guarantors of certain nonrecourse carveouts under the AmericasMart Loan Combination.
The Sponsors. The loan sponsors are AMC, Inc., a privately held company wholly owned by John C. Portman and members of his immediate family, and Portman Financial Inc. The AmericasMart Property has been owned and managed since its development in 1961 by individuals and entities affiliated with the sponsors. The Portman family also owns Portman Holdings LLC, a real estate development company and John Portman & Associates, a global architectural firm. AMC has operated and developed other properties associated with the trade mart and trade show industry including the Design Center of the Americas in Fort Lauderdale, Florida; Atlanta Decorative Arts Center in Atlanta, Georgia; Brussels International Trade Mart in Brussels, Belgium and San Francisco Fashion Mart in San Francisco, California. Collectively, AMC, Inc., Portman Holdings LLC and John Portman & Associates comprise the Portman Companies. In addition to AmericasMart, the Portman Companies have developed and managed real estate projects around the world that include the Hilton San Diego Bayfront (San Diego, California); Westin Charlotte (Charlotte, North Carolina); The Portman Ritz Carlton (Shanghai, China); Marina Mandarin Hotel (Marina Square, Singapore), Le Meridien (San Francisco, California) and the New York Marriott Marquis (New York, New York).
Escrows. The loan documents provide for upfront reserves in the amount of $1,284,853 for real estate taxes, $352,469 for deferred maintenance, $1,557,473 for replacement reserves, $2,627,360 for tenant improvements and leasing commissions, $380,000 for an environmental reserve and $4,144 for ground rent. The loan documents provide for monthly deposits of $428,285 for real estate taxes. The loan documents do not require monthly escrows for insurance provided (i) no event of default has occurred and is continuing; (ii) the insurance required to be maintained by the borrower is maintained pursuant to one or more blanket insurance policies; and (iii) the borrower provides the lender with timely proof of payment of insurance premiums. The loan documents do not require monthly escrows for replacement reserves as long as the balance of the escrow account equals $1,557,473 (“Replacement Reserve Cap”). If the balance of the replacement reserve account is less than the Replacement Reserve Cap, within 60 days, the borrower is required to deposit an amount that would restore the balance of the replacement reserve account to equal the Replacement Reserve Cap. The loan documents do not require monthly escrows for tenant improvements and leasing commission reserves as long as the balance of the escrow account equals $2,627,360 (“TI/LC Reserve Cap”). If the balance of the tenant improvement and leasing commissions reserve account is less than the TI/LC Reserve Cap, within 60 days, the borrower is required to deposit an amount that would restore the balance of the tenant improvements and leasing commissions reserve account to equal the TI/LC Reserve Cap. The AmericasMart borrower has deposited with the lender one month’s ground rent. If the AmericasMart borrower fails to provide evidence of payment of ground rent, the lender may make payment from the ground rent reserve and the AmericasMart borrower will replenish the reserve within 15 days after disbursement.
Lockbox and Cash Management. The AmericasMart Loan Combination requires a lender-controlled lockbox account, which is already in place, and that the borrower directs permanent tenants to pay their rents directly into such lockbox account (exhibition tenants do not pay directly into the lockbox). The loan documents also require that all rents received by the borrower or the property manager be deposited into the lockbox account within three business days of receipt. Funds are then swept to a cash management account controlled by the lender and prior to the occurrence of a Cash Trap Event Period (as defined below), all excess funds after application in accordance with the loan documents are distributed to the borrower’s operating account. During a Cash Trap Event Period, all excess cash flow is retained in the cash management account.
A “Cash Trap Event Period” will commence upon (i) the occurrence and continuance of an event of default; (ii) the net operating income debt yield falling below 10.0% at the end of any calendar quarter; or (iii) the discontinuation of either of the International Gift and Home Furnishing Market Tradeshows occurring in January and July held at the AmericasMart Property. A Cash Trap Event Period will be cured, with regard to the circumstances in clause (i), upon the cure of such event of default (provided that a Cash Trap Event Period has not occurred pursuant to clause (i) or (ii) above) or, with regard to the circumstances in clause (ii), the net operating income debt yield is equal to or greater than 10.0% for two consecutive calendar quarters (provided that a Cash Trap Event Period has not occurred pursuant to clause (i) or (iii) above).
Property Management. The AmericasMart Property is managed by an affiliate of the borrower.
Assumption. The borrower has a two-time right to transfer the AmericasMart Property, provided that no event of default has occurred and is continuing and certain other conditions are satisfied, including, but not limited to the following: (i) the proposed transferee being a qualified transferee with total assets of $1,000,000,000 and capital or statutory surplus or shareholders equity in excess of $500,000,000 and is regularly engaged in the business of owning and operating comparable properties in major metropolitan areas; (ii) execution of a recourse guaranty and an environmental indemnity by an affiliate of the transferee; and (iii) if requested by the lender, rating agency confirmation from DBRS, Fitch and Moody’s that the transfer will not result in a downgrade, withdrawal or qualification of the respective ratings assigned to the Series 2013-C18 Certificates, and similar confirmations with respect to the ratings of any securities backed by the AmericasMart Companion Loans.
Partial Release. The AmericasMart borrower has the right to release the parcel of the AmericasMart Property consisting of the air rights over the AmericasMart 2 Expansion parcel at no cost other than the lender’s expenses only upon (x) the lender’s prior, written approval, to be granted in the lender’s sole, but reasonable, discretion and (y) receipt of a rating agency confirmation from DBRS, Fitch and Moody’s. Conditions to the release may include, among other conditions, (i) no event of default has occurred and is continuing; (ii) the loan-to-value ratio immediately after the release being equal to or less than the lesser of (a) 60.9% or (b) the loan-to-value ratio immediately prior to the release based on an appraised value at the time of the release; (iii) the net cash flow debt yield being equal to or greater than the greater of (a) 16.5% and (b) the net cash flow debt yield immediately prior to the release of the parcel; and (iv) the release will not adversely affect the liens, security interests and other rights of the lender under the loan documents not being released.
THE INFORMATION IN THIS STRUCTURAL AND COLLATERAL TERM SHEET IS NOT COMPLETE AND MAY BE AMENDED PRIOR TO THE TIME OF SALE. THIS TERM SHEET IS NOT AN OFFER TO SELL THESE SECURITIES AND IT IS NOT A SOLICITATION OF AN OFFER TO BUY THESE SECURITIES IN ANY JURISDICTION WHERE THE OFFER OR SALE IS NOT PERMITTED.
47
| AMERICASMART |
Real Estate Substitution. Not permitted.
Subordinate and Mezzanine Indebtedness. Not permitted.
Ground Leases and Air Rights Lease. The AmericasMart 1 building includes one leasehold parcel totaling 0.2 acres out of total land area of 2.4 acres (the “AmericasMart 1 Ground Lease”), and an air rights parcel lease from MARTA totaling 0.02 acres (the “MARTA Air Rights Lease”). The AmericasMart 1 Ground Lease expires June 30, 2061 and the MARTA Air Rights Lease expires December 16, 2022. The portion of the AmericasMart Property encumbered by the air rights lease is a restaurant, which has a lease with the AmericasMart borrower that expires on February 28, 2022 with an annual rent of $240,312 throughout the lease term. The AmericasMart 3 building includes one leasehold parcel with William Edwards, the Episcopal Church, The University of Georgia and the related borrower, as ground lessors and tenants-in-common, respectively, totaling 0.21 acres out of total land area of 3.7 acres (the “AmericasMart 3 Ground Lease”). The AmericasMart 3 Ground Lease expires August 31, 2071. The loan documents also provide for springing recourse to the borrower and guarantors if any ground lease is terminated, cancelled or otherwise ceases to exist in violation of the loan terms. See “Description of the Mortgage Pool – Certain Terms of the Mortgage Loans – Encumbered Interests” in the Free Writing Prospectus.
Taxable Revenue Bonds/Tax Abatement. The construction of AmericasMart 2 Expansion was financed by the issuance of $180.5 million of taxable municipal bonds (“Bonds”) issued by the Development Authority of Fulton County (“Development Authority”). The Development Authority, as owner of the fee interest in the AmericasMart 2 Expansion, entered into a lease with the AmericasMart borrower. Since the Development Authority is exempt from property taxes, the AmericasMart borrower is only taxed on the leasehold value of the AmericasMart 2 Expansion. The lease payments to the Development Authority pay the principal and interest on the Bonds. The Bonds were pledged as collateral for the AmericasMart Loan Combination. The AmericasMart borrower owns the related Bonds and the Development Authority has encumbered its fee interest to the lien of the AmericasMart Loan Combination. The Bonds mature on January 1, 2019 and the tax abatement will expire at that time. The underwritten property taxes assume the full tax assessment.
Terrorism Insurance. The loan documents require that the “all risk” insurance policy required to be maintained by the borrower provides coverage for terrorism in an amount equal to the full replacement cost of the AmericasMart Property. The loan documents also require business interruption insurance covering no less than the 18-month period following the occurrence of a casualty event, together with a six-month extended period of indemnity.
THE INFORMATION IN THIS STRUCTURAL AND COLLATERAL TERM SHEET IS NOT COMPLETE AND MAY BE AMENDED PRIOR TO THE TIME OF SALE. THIS TERM SHEET IS NOT AN OFFER TO SELL THESE SECURITIES AND IT IS NOT A SOLICITATION OF AN OFFER TO BUY THESE SECURITIES IN ANY JURISDICTION WHERE THE OFFER OR SALE IS NOT PERMITTED.
48
(THIS PAGE INTENTIONALLY LEFT BLANK)
49
| THE OUTLET COLLECTION | JERSEY GARDENS |
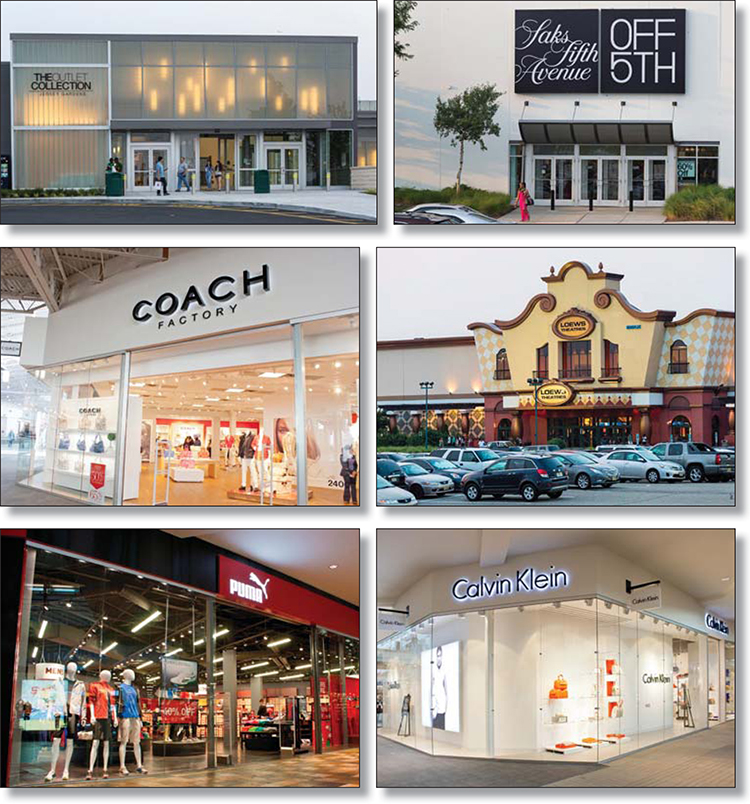
THE INFORMATION IN THIS STRUCTURAL AND COLLATERAL TERM SHEET IS NOT COMPLETE AND MAY BE AMENDED PRIOR TO THE TIME OF SALE. THIS TERM SHEET IS NOT AN OFFER TO SELL THESE SECURITIES AND IT IS NOT A SOLICITATION OF AN OFFER TO BUY THESE SECURITIES IN ANY JURISDICTION WHERE THE OFFER OR SALE IS NOT PERMITTED.
50
| THE OUTLET COLLECTION | JERSEY GARDENS |
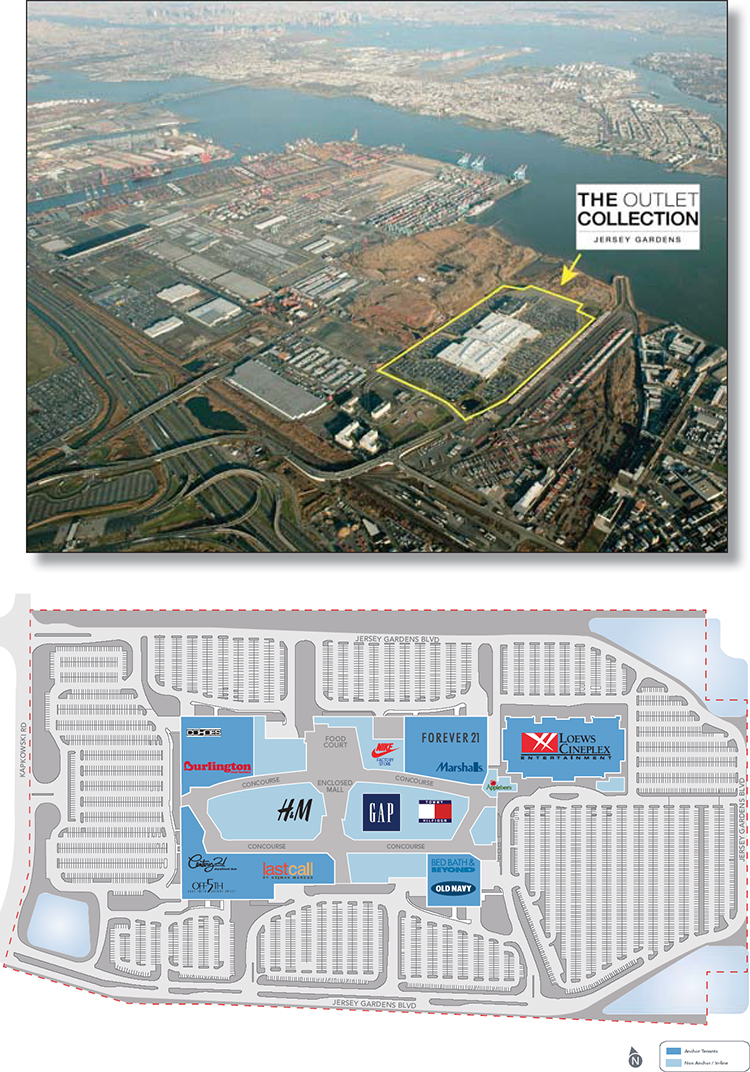
THE INFORMATION IN THIS STRUCTURAL AND COLLATERAL TERM SHEET IS NOT COMPLETE AND MAY BE AMENDED PRIOR TO THE TIME OF SALE. THIS TERM SHEET IS NOT AN OFFER TO SELL THESE SECURITIES AND IT IS NOT A SOLICITATION OF AN OFFER TO BUY THESE SECURITIES IN ANY JURISDICTION WHERE THE OFFER OR SALE IS NOT PERMITTED.
51
| THE OUTLET COLLECTION | JERSEY GARDENS |
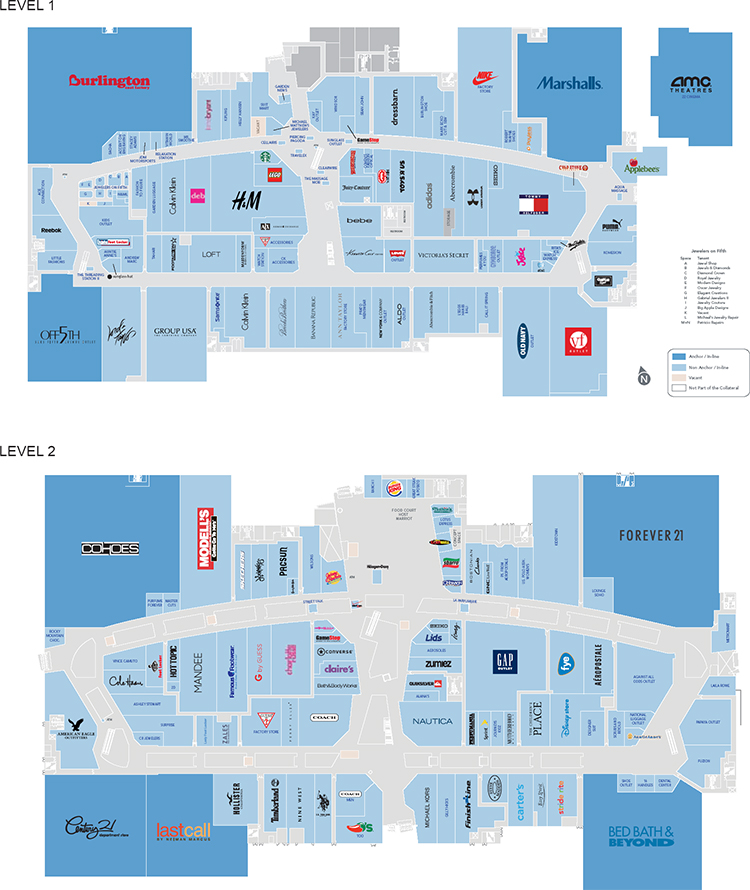
THE INFORMATION IN THIS STRUCTURAL AND COLLATERAL TERM SHEET IS NOT COMPLETE AND MAY BE AMENDED PRIOR TO THE TIME OF SALE. THIS TERM SHEET IS NOT AN OFFER TO SELL THESE SECURITIES AND IT IS NOT A SOLICITATION OF AN OFFER TO BUY THESE SECURITIES IN ANY JURISDICTION WHERE THE OFFER OR SALE IS NOT PERMITTED.
52
| THE OUTLET COLLECTION | JERSEY GARDENS |
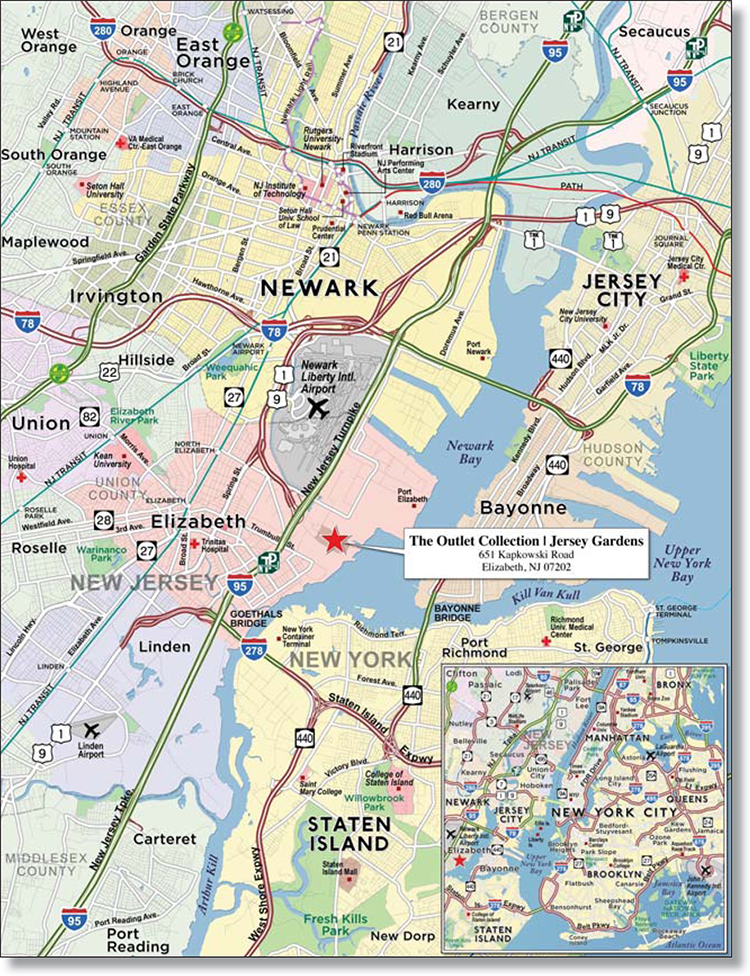
THE INFORMATION IN THIS STRUCTURAL AND COLLATERAL TERM SHEET IS NOT COMPLETE AND MAY BE AMENDED PRIOR TO THE TIME OF SALE. THIS TERM SHEET IS NOT AN OFFER TO SELL THESE SECURITIES AND IT IS NOT A SOLICITATION OF AN OFFER TO BUY THESE SECURITIES IN ANY JURISDICTION WHERE THE OFFER OR SALE IS NOT PERMITTED.
53
| No. 3 – The Outlet Collection | Jersey Gardens |
| Loan Information | Property Information | |||||||
| Mortgage Loan Seller: | Wells Fargo Bank, National Association | Single Asset/Portfolio: | Single Asset | |||||
Credit Assessment (DBRS/Fitch/Moody’s): | BBB-/BBB-/Baa3 | Property Type: | Retail | |||||
Original Principal Balance(1): | $140,000,000 | Specific Property Type: | Regional Mall | |||||
Cut-off Date Principal Balance(1): | $140,000,000 | Location: | Elizabeth, NJ | |||||
| % of Initial Pool Balance: | 13.5% | Size: | 1,298,801 SF | |||||
| Loan Purpose: | Refinance | Cut-off Date Principal Balance Per SF(1): | $269.48 | |||||
Borrower Names(2): | N.J. Metromall Urban Renewal, Inc.; JG Elizabeth II, LLC | Year Built/Renovated: | 1999/2013 | |||||
| Sponsor: | Glimcher Properties, LP | Title Vesting(2): | Fee | |||||
| Mortgage Rate: | 3.830% | Property Manager: | Self-managed | |||||
| Note Date: | October 31, 2013 | 3rd Most Recent Occupancy (As of): | 100.0% (12/31/2010) | |||||
| Anticipated Repayment Date: | NAP | 2nd Most Recent Occupancy (As of): | 99.5% (12/31/2011) | |||||
| Maturity Date: | November 1, 2020 | Most Recent Occupancy (As of): | 100.0% (12/31/2012) | |||||
| IO Period: | 84 months | Current Occupancy (As of)(4): | 99.4% (9/25/2013) | |||||
| Loan Term (Original): | 84 months | |||||||
| Seasoning: | 1 month | Underwriting and Financial Information: | ||||||
| Amortization Term (Original): | NAP | |||||||
| Loan Amortization Type: | Interest-only, Balloon | 3rd Most Recent NOI (As of): | $34,987,662 (12/31/2011) | |||||
| Interest Accrual Method: | Actual/360 | 2nd Most Recent NOI (As of): | $36,646,383 (12/31/2012) | |||||
| Call Protection: | L(25),D(55),O(4) | Most Recent NOI (As of): | $40,192,421 (TTM 9/30/2013) | |||||
| Lockbox Type: | Hard/Springing Cash Management | |||||||
Additional Debt(1): | Yes | |||||||
Additional Debt Type(1): | Pari Passu | |||||||
| U/W Revenues: | $66,662,980 | |||||||
| U/W Expenses: | $26,424,909 | |||||||
Escrows and Reserves(3): | U/W NOI(5): | $40,238,071 | ||||||
| U/W NCF: | $38,650,516 | |||||||
Type: | Initial | Monthly | Cap (If Any) | U/W NOI DSCR(1): | 2.96x | |||
| Taxes | $0 | Springing | NAP | U/W NCF DSCR(1): | 2.84x | |||
| Insurance | $0 | Springing | NAP | U/W NOI Debt Yield(1): | 11.5% | |||
| Replacement Reserves | $0 | Springing | NAP | U/W NCF Debt Yield(1): | 11.0% | |||
| TI/LC Reserve | $0 | Springing | NAP | As-Is Appraised Value: | $707,000,000 | |||
| Ground Lease Reserve | $0 | Springing | NAP | As-Is Appraisal Valuation Date: | October 4, 2013 | |||
| Tenants Specific TI/LC Reserve | $2,593,953 | $0 | NAP | Cut-off Date LTV Ratio(1): | 49.5% | |||
| Rent Concession Reserve | $61,775 | $0 | NAP | LTV Ratio at Maturity or ARD(1): | 49.5% | |||
| (1) | The Outlet Collection | Jersey Gardens Loan Combination, totalling $350,000,000, is comprised of three pari passu notes (Notes A-1, A-2 and A-3). Note A-1 had an original principal balance of $140,000,000, has an outstanding principal balance as of the Cut-off Date of $140,000,000 and will be contributed to the WFRBS 2013-C18 Trust. Note A-2 had an original principal balance of $130,000,000 and was contributed to the WFRBS 2013-UBS1 Trust. Note A-3 had an original balance of $80,000,000 and will be contributed to a future trust. All statistical information related to balances per square foot, loan-to-value ratios, debt service coverage ratios and debt yields are based on The Outlet Collection | Jersey Gardens Loan Combination. |
| (2) | See “Ground Lease and Payment in Lieu of Taxes (“PILOT”)” section. |
| (3) | See “Escrows” section.” |
| (4) | Current Occupancy includes 39,940 square feet attributed to temporary tenants. Excluding temporary tenants, Current Occupancy is 96.4%. |
| (5) | See “Cash Flow Analysis” section. |
The Mortgage Loan. The mortgage loan (“The Outlet Collection | Jersey Gardens Loan Combination”) is evidenced by three pari passu promissory notes (“Note A-1”, “Note A-2” and “Note A-3”) secured by a first mortgage encumbering a regional outlet mall located in Elizabeth, New Jersey (“The Outlet Collection | Jersey Gardens Property”). The Outlet Collection | Jersey Gardens Loan Combination was originated on October 31, 2013 by Wells Fargo Bank, National Association. The Outlet Collection | Jersey Gardens Loan Combination had an original principal balance of $350,000,000, has an outstanding principal balance as of the Cut-off Date of $350,000,000 and accrues interest at an interest rate of 3.830% per annum. The Outlet Collection | Jersey Gardens Loan Combination had an initial term of 84 months, has a remaining term of 83 months as of the Cut-off Date and requires interest-only payments through the term of The Outlet Collection | Jersey Gardens Loan Combination. The Outlet Collection | Jersey Gardens Loan Combination matures on November 1, 2020. See “Description of the Mortgage Pool – Split Loan Structures – The Outlet Collection | Jersey Gardens Loan Combination” and “Servicing of the Mortgage Loans and Administration of the Trust Fund - Additional Matters Relating to the Servicing of The Outlet Collection | Jersey Gardens Loan Combination” in the Free Writing Prospectus. As of the loan closing date, Note A-3 had an original principal balance of $80,000,000.
THE INFORMATION IN THIS STRUCTURAL AND COLLATERAL TERM SHEET IS NOT COMPLETE AND MAY BE AMENDED PRIOR TO THE TIME OF SALE. THIS TERM SHEET IS NOT AN OFFER TO SELL THESE SECURITIES AND IT IS NOT A SOLICITATION OF AN OFFER TO BUY THESE SECURITIES IN ANY JURISDICTION WHERE THE OFFER OR SALE IS NOT PERMITTED.
54
| THE OUTLET COLLECTION | JERSEY GARDENS |
Note A-1, which will be contributed to the WFRBS 2013-C18 Trust, had an original principal balance of $140,000,000 and has an outstanding principal balance as of the Cut-off Date of $140,000,000 and represents the controlling interest in The Outlet Collection | Jersey Gardens Loan Combination. Note A-2, which had an original balance of $130,000,000 was contributed to the WFRBS 2013-UBS1 Trust and Note A-3, which had an original principal balance of $80,000,000 will each be contributed to a future trust (collectively, “The Outlet Collection | Jersey Gardens Companion Loans”). The lender provides no assurances that Note A-3 will not be split further.
Following the lockout period, the borrower has the right to defease The Outlet Collection | Jersey Gardens Loan Combination in whole, but not in part, on any date before August 1, 2020. In addition, The Outlet Collection | Jersey Gardens Loan Combination is prepayable without penalty on or after August 1, 2020.
Sources and Uses
| Sources | Uses | |||||||
| Original loan combination amount | $350,000,000 | 100.0% | Loan payoff(1) | $139,231,383 | 39.8% | |||
| Reserves | 2,655,728 | 0.8 | ||||||
| Closing costs | 3,402,450 | 1.0 | ||||||
| Return of equity | 204,710,439 | 58.5 | ||||||
| Total Sources | $350,000,000 | 100.0% | Total Uses | $350,000,000 | 100.0% |
| (1) | The Outlet Collection | Jersey Gardens Property was previously securitized in BSCMS 2004-T16 and GMACC 2004-C2. |
The Property. The Outlet Collection | Jersey Gardens Property is a two-story regional outlet mall located in Elizabeth, New Jersey that contains approximately 1.3 million square feet, all of which serve as collateral for The Outlet Collection | Jersey Gardens Loan Combination. The Outlet Collection | Jersey Gardens Property is anchored by Loews Theaters, Forever 21, Burlington Coat Factory, Marshalls, Bed Bath & Beyond, Century 21, Cohoes Fashions and Saks Off 5th. The Outlet Collection | Jersey Gardens Property is situated on 98.4 acres and was developed in 1999 by Glimcher Realty Trust (“Glimcher”) for a total cost of $216.3 million and recently renovated in 2013. The sponsor invested approximately $30.0 million in the 2013 renovation, which consisted of remodeling corridors, entrances, restrooms and the food court along with the introduction of brands such as Coach and Tommy Hilfiger. The Outlet Collection | Jersey Gardens Property is the largest outlet mall in New Jersey and the second most visited tourist destination in the state, attracting approximately 18 million shoppers annually from more than 160 countries.
Parking is provided by 5,330 surface parking spaces, resulting in a parking ratio of 4.1 spaces per 1,000 square feet of net rentable area. The Outlet Collection | Jersey Gardens Property boasts a unique mix of over 200 retail and manufacturer outlets, discount and off-price stores, full-price retailers, restaurants and entertainment tenants. Major retailers include Neiman Marcus Last Call, Nike Factory Store, VF Outlet, Old Navy, The Gap Outlet and H&M and for the trailing 12-month period ending June 30, 2013, tenants occupying less than 10,000 square feet had in-line sales of $715 per square foot with an average occupancy cost of 8.8%. For the same time period, gross sales totaled approximately $585.0 million, representing an increase of over 36.2% from 2010. As of September 25, 2013, The Outlet Collection | Jersey Gardens Property was 99.4% leased to 214 tenants (excluding temporary tenants, occupancy was 96.4%).
THE INFORMATION IN THIS STRUCTURAL AND COLLATERAL TERM SHEET IS NOT COMPLETE AND MAY BE AMENDED PRIOR TO THE TIME OF SALE. THIS TERM SHEET IS NOT AN OFFER TO SELL THESE SECURITIES AND IT IS NOT A SOLICITATION OF AN OFFER TO BUY THESE SECURITIES IN ANY JURISDICTION WHERE THE OFFER OR SALE IS NOT PERMITTED.
55
| THE OUTLET COLLECTION | JERSEY GARDENS |
The following table presents certain information relating to the tenancy at The Outlet Collection | Jersey Gardens Property:
Major Tenants
| Tenant Name | Credit Rating (Fitch/ Moody’s/ S&P)(1) | Tenant NRSF | % of NRSF | Annual U/W Base Rent PSF | Annual U/W Base Rent(2) | % of Total Annual U/W Base Rent(2) | Sales PSF(3) | Occupancy Cost(3) | Lease Expiration Date | |||||||||||||||||
| Anchor Tenants | ||||||||||||||||||||||||||
| Loews Theatres | NR/NR/NR | 110,000 | 8.5% | $12.55 | $1,380,119 | 4.4% | $357,401(4) | 24.2% | 12/31/2020 | |||||||||||||||||
| Forever 21 | NR/NR/NR | 58,879 | 4.5% | $16.98 | $1,000,000 | 3.2% | $275 | 6.2% | 1/31/2021 | |||||||||||||||||
| Burlington Coat Factory | NR/B3/NR | 80,259 | 6.2% | $12.12 | $972,739 | 3.1% | $249 | 4.9% | 1/31/2015 | |||||||||||||||||
| Marshalls | NR/A3/A | 49,245 | 3.8% | $15.91 | $783,354 | 2.5% | $397 | 4.6% | 1/31/2015 | |||||||||||||||||
| Bed Bath & Beyond | NR/NR/BBB+ | 41,225 | 3.2% | $17.47 | $720,000 | 2.3% | NAV | NAV | 1/31/2015 | |||||||||||||||||
| Century 21 | NR/NR/NR | 33,124 | 2.6% | $17.17 | $568,836 | 1.8% | NAV | NAV | 1/31/2015 | |||||||||||||||||
| Cohoes Fashions | NR/B3/NR | 58,819 | 4.5% | $7.14 | $420,000 | 1.3% | $167 | 4.3% | 1/1/2015 | |||||||||||||||||
| Saks Off 5th | NR/NR/NR | 30,463 | 2.3% | $12.00 | $365,551 | 1.2% | NAV | NAV | 11/22/2022 | |||||||||||||||||
| Total Anchor Tenants | 462,014 | 35.6% | $13.44 | $6,210,599 | 19.9% | |||||||||||||||||||||
| �� | ||||||||||||||||||||||||||
| Junior Anchor Tenants | ||||||||||||||||||||||||||
| Tommy Hilfiger | NR/NR/NR | 22,878 | 1.8% | $50.00 | $1,143,904 | 3.7% | $920 | 5.4% | 1/31/2023 | |||||||||||||||||
Nike Factory Store(5) | NR/A1/AA- | 25,007 | 1.9% | $29.46 | $736,814 | 2.4% | $816 | 3.8% | 12/31/2024 | |||||||||||||||||
| H&M | NR/NR/NR | 20,000 | 1.5% | $29.76 | $595,200 | 1.9% | $525 | 5.7% | 1/31/2021 | |||||||||||||||||
| Neiman Marcus Last Call | NR/Caa2/B | 27,696 | 2.1% | $17.23 | $477,135 | 1.5% | $388 | 5.0% | 11/30/2014 | |||||||||||||||||
| VF Outlet (Macy’s) | BBB/Baa3/BBB | 22,438 | 1.7% | $20.00 | $448,760 | 1.4% | $116 | 17.2% | 8/31/2015 | |||||||||||||||||
| Old Navy | BBB-/Baa3/BBB- | 21,536 | 1.7% | $20.00 | $430,720 | 1.4% | $531 | 3.8% | 5/31/2015 | |||||||||||||||||
| Group USA | NR/NR/NR | 23,563 | 1.8% | $16.00 | $377,008 | 1.2% | $183 | 9.1% | 12/31/2018 | |||||||||||||||||
| The Gap Outlet | BBB-/Baa3/BBB- | 20,515 | 1.6% | $17.01 | $349,010 | 1.1% | $884 | 1.9% | 1/31/2015 | |||||||||||||||||
| Modell’s Sporting Goods | NR/NR/NR | 21,409 | 1.6% | $13.00 | $278,317 | 0.9% | $235 | 5.5% | 1/31/2017 | |||||||||||||||||
| Total Junior Anchor Tenants | 205,042 | 15.8% | $23.59 | $4,836,868 | 15.5% | |||||||||||||||||||||
Non-Anchor Tenants(6) | 624,545 | 48.1% | $39.02 | $20,195,567 | 64.6% | |||||||||||||||||||||
Occupied Collateral Total(6) | 1,291,601 | 99.4% | $26.37 | $31,243,034 | 100.0% | |||||||||||||||||||||
| Vacant Space | 7,200 | 0.6% | ||||||||||||||||||||||||
| Collateral Total | 1,298,801 | 100.0% | ||||||||||||||||||||||||
| (1) | Certain ratings are those of the parent company whether or not the parent guarantees the lease. |
| (2) | Underwritten base rent includes contractual rent escalations through October 2014 and income from eight tenants, representing approximately 30,764 square feet (2.4% of net rentable area) that either do not have executed leases (leases were out for tenants signature) or were not in occupancy and paying rent on their new space. |
| (3) | Sales PSF and Occupancy Costs represent the trailing 12-month period ending June 30, 2013. Sales PSF and Occupancy Costs do not include utility reimbursement figures, and are not available for tenants who have not reported a full year of sales data. |
| (4) | Sales reflect average sales per screen based on 22 screens. |
| (5) | Nike Factory Store modified their lease in August 2013 to expand by 5,007 square feet and extend the lease term five years. All figures are reflective of the new lease terms. |
| (6) | Includes 39,940 square feet attributed to temporary tenants that were not included in the Annual U/W Base Rent, along with 66,982 square feet attributed to tenants paying a percentage of sales in lieu of base rent, for a total of 106,922 square feet. The Annual U/W Base Rent PSF for Non-Anchor Tenants and Occupied Collateral Total exclude the square footage attributed to these tenants. |
THE INFORMATION IN THIS STRUCTURAL AND COLLATERAL TERM SHEET IS NOT COMPLETE AND MAY BE AMENDED PRIOR TO THE TIME OF SALE. THIS TERM SHEET IS NOT AN OFFER TO SELL THESE SECURITIES AND IT IS NOT A SOLICITATION OF AN OFFER TO BUY THESE SECURITIES IN ANY JURISDICTION WHERE THE OFFER OR SALE IS NOT PERMITTED.
56
| THE OUTLET COLLECTION | JERSEY GARDENS |
The following table presents certain information relating to the historical sales and occupancy costs at The Outlet Collection | Jersey Gardens Property:
Historical Sales (PSF) and Occupancy Costs(1)
| Tenant Name | 2010 | 2011 | 2012 | TTM 6/30/2013 | ||||||||
| Loews Theatres | NAV | NAV | NAV | $357,401(2) | ||||||||
| Forever 21 | NAV | $247 | $252 | $275 | ||||||||
| Burlington Coat Factory | $191 | $198 | $236 | $249 | ||||||||
| Marshalls | $293 | $314 | $351 | $397 | ||||||||
| Bed Bath & Beyond | NAV | NAV | NAV | $193 | ||||||||
| Century 21 | NAV | NAV | NAV | NAV | ||||||||
| Cohoes Fashions | $150 | $160 | $170 | $167 | ||||||||
Saks Off 5th | $354 | $374 | NAV | NAV | ||||||||
Total Anchor(3) | $262 | $321 | $336 | $344 | ||||||||
Total Anchor Occupancy Costs(3) | 5.3% | 5.4% | 5.4% | 5.9% | ||||||||
Total Major(4) | $441 | $461 | $471 | $483 | ||||||||
Total Major Occupancy Costs(4) | 7.8% | 6.1% | 5.7% | 5.6% | ||||||||
Total In-line (<10,000 square feet)(5) | $625 | $685 | $692 | $715 | ||||||||
Total In-line Occupancy Costs(5) | 8.8% | 8.0% | 7.6% | 8.8% | ||||||||
| (1) | Historical Sales (PSF) and Occupancy Costs are based on historical statements provided by the borrower. Occupancy costs do not include utility reimbursements. |
| (2) | Sales reflect average sales per screen based on 22 screens. |
| (3) | Total Anchor Sales PSF and Occupancy Cost include all anchor tenants (except for Loews) listed in the Major Tenants table who reported 12 months of sales figures. |
| (4) | Total Major Tenants (> 10,000 square feet) Sales PSF and Occupancy Cost include in-line tenants greater than 10,000 square feet that have been open for the previous 12-month period, as provided by the borrower. |
| (5) | Total In-Line Tenants (< 10,000 square feet) Sales PSF and Occupancy Cost include in-line tenants less than 10,000 square feet that have been open for the previous 12-month period, as provided by the borrower. |
The following table presents certain information relating to the lease rollover schedule at The Outlet Collection | Jersey Gardens Property:
Lease Expiration Schedule(1)(2)
Year Ending December 31, | No. of Leases Expiring | Expiring NRSF | % of Total NRSF | Cumulative Expiring NRSF | Cumulative % of Total NRSF | Annual U/W Base Rent | % of Annual U/W Base Rent | Annual U/W Base Rent PSF(3) | |||||||||
MTM(4) | 38 | 39,940 | 3.1% | 39,940 | 3.1% | $0 | 0.0% | $0.00 | |||||||||
| 2013 | 6 | 9,140 | 0.7% | 49,080 | 3.8% | $304,640 | 1.0% | $33.46 | |||||||||
| 2014 | 25 | 106,082 | 8.2% | 155,162 | 11.9% | $3,451,861 | 11.0% | $32.54 | |||||||||
| 2015 | 27 | 389,315 | 30.0% | 544,477 | 41.9% | $6,437,350 | 20.6% | $16.93 | |||||||||
| 2016 | 12 | 39,805 | 3.1% | 584,282 | 45.0% | $926,249 | 3.0% | $35.05 | |||||||||
| 2017 | 17 | 98,417 | 7.6% | 682,699 | 52.6% | $2,091,014 | 6.7% | $26.50 | |||||||||
| 2018 | 13 | 49,566 | 3.8% | 732,265 | 56.4% | $1,663,511 | 5.3% | $33.56 | |||||||||
| 2019 | 14 | 57,071 | 4.4% | 789,336 | 60.8% | $1,525,821 | 4.9% | $30.55 | |||||||||
| 2020 | 14 | 156,936 | 12.1% | 946,272 | 72.9% | $2,788,231 | 8.9% | $18.44 | |||||||||
| 2021 | 10 | 138,067 | 10.6% | 1,084,339 | 83.5% | $5,212,731 | 16.7% | $37.76 | |||||||||
| 2022 | 18 | 98,400 | 7.6% | 1,182,739 | 91.1% | $2,507,202 | 8.0% | $29.10 | |||||||||
| 2023 | 12 | 66,055 | 5.1% | 1,248,794 | 96.1% | $2,690,674 | 8.6% | $40.73 | |||||||||
| 2024 | 6 | 42,807 | 3.3% | 1,291,601 | 99.4% | $1,589,114 | 5.1% | $37.12 | |||||||||
| Thereafter | 2 | 0 | 0.0% | 1,291,601 | 99.4% | $54,637 | 0.2% | $0.00 | |||||||||
| Vacant | 0 | 7,200 | 0.6% | 1,298,801 | 100.0% | $0 | 0.0% | $0.00 | |||||||||
| Total/Weighted Average | 214 | 1,298,801 | 100.0% | $31,243,034 | 100.0% | $26.37 |
| (1) | Information obtained from the underwritten rent roll. |
| (2) | Certain tenants may have lease termination options that are exercisable prior to the originally stated expiration date of the subject lease and that are not considered in the Lease Expiration Schedule. |
| (3) | The annual and Total/Weighted Average Annual U/W Base Rent PSF excludes vacant space, Annual U/W Base Rent attributed to tenants paying percentage rent in lieu of base rent and square footage attributed to temporary tenants. These rents were included in the underwritten percentage rent and other income. |
| (4) | Includes 38 temporary tenants. The rent for temporary tenants has been included in the underwritten other income. |
THE INFORMATION IN THIS STRUCTURAL AND COLLATERAL TERM SHEET IS NOT COMPLETE AND MAY BE AMENDED PRIOR TO THE TIME OF SALE. THIS TERM SHEET IS NOT AN OFFER TO SELL THESE SECURITIES AND IT IS NOT A SOLICITATION OF AN OFFER TO BUY THESE SECURITIES IN ANY JURISDICTION WHERE THE OFFER OR SALE IS NOT PERMITTED.
57
| THE OUTLET COLLECTION | JERSEY GARDENS |
The following table presents historical occupancy at The Outlet Collection | Jersey Gardens Property:
Historical Occupancy
12/31/2008(1) | 12/31/2009(1) | 12/31/2010(1) | 12/31/2011(1) | 12/31/2012(1) | 9/25/2013(2) | |||||
| 100.0% | 99.0% | 100.0% | 99.5% | 100.0% | 99.4% |
| (1) | Information obtained from the borrower. |
| (2) | Occupancy includes 39,940 square feet attributed to temporary tenants. As of September 25, 2013, the occupancy excluding temporary tenants was 96.4%. |
The following table presents historical base rent per square foot at The Outlet Collection | Jersey Gardens Property:
Historical Average Base Rent (PSF)(1)
12/31/2010 | 12/31/2011 | 12/31/2012 | 9/30/2013 | |||
| $20.09 | $21.04 | $21.94 | $23.34 |
| (1) | Information obtained from borrower operating statements. The average base rent is based on the gross potential rent divided by the total square footage and does not take into account vacancies, temporary tenants or tenants paying percentage rent in lieu of base rent. |
Operating History and Underwritten Net Cash Flow. The following table presents certain information relating to the historical operating performance and Underwritten Net Cash Flow at The Outlet Collection | Jersey Gardens Property:
Cash Flow Analysis
| 2011 | 2012 | TTM 9/30/2013 | U/W | U/W $ per SF | |||||||||||
| Base Rent | $27,320,757 | $28,491,353 | $30,309,606 | $31,243,034 | $24.06 | ||||||||||
| Grossed Up Vacant Space | 0 | 0 | 0 | 250,932 | 0.19 | ||||||||||
| Percentage Rent | 4,080,168 | 4,685,424 | 5,802,622 | 6,033,369 | 4.65 | ||||||||||
| Total Reimbursables | 20,527,216 | 20,702,521 | 21,192,737 | 23,887,463 | 18.39 | ||||||||||
| Other Income | 6,078,270 | 5,765,033 | 6,007,541 | 6,193,001 | 4.77 | ||||||||||
| Less Vacancy & Credit Loss | 0 | 0 | (516,500) | (944,819)(1) | (0.73) | ||||||||||
| Effective Gross Income | $58,006,411 | $59,644,331 | $62,796,006 | $66,662,980(2) | $51.33 | ||||||||||
| Total Operating Expenses | $23,018,749 | $22,997,948 | $22,603,585 | $26,424,909 | $20.35 | ||||||||||
| Net Operating Income | $34,987,662 | $36,646,383 | $40,192,421 | $40,238,071(2) | $30.98 | ||||||||||
| TI/LC | 0 | 0 | 0 | 1,327,796 | 1.02 | ||||||||||
| Capital Expenditures | 0 | 0 | 0 | 259,760 | 0.20 | ||||||||||
| Net Cash Flow | $34,987,662 | $36,646,383 | $40,192,421 | $38,650,516 | $29.76 | ||||||||||
NOI DSCR(3) | 2.57x | 2.70x | 2.96x | 2.96x | |||||||||||
NCF DSCR(3) | 2.57x | 2.70x | 2.96x | 2.84x | |||||||||||
NOI DY(3) | 10.0% | 10.5% | 11.5% | 11.5% | |||||||||||
NCF DY(3) | 10.0% | 10.5% | 11.5% | 11.0% | |||||||||||
| (1) | The underwritten economic vacancy is 3.0%. The Outlet Collection | Jersey Gardens Property was 99.4% physically occupied as of September 25, 2013. The Outlet Collection | Jersey Gardens Property has maintained a consistent average occupancy of 98.1% since 2002. |
| (2) | The increase in Effective Gross Income and Net Operating Income from the TTM 9/30/2013 to the U/W is due to the inclusion of contractual rent escalations through October 2014 and recent leasing activity, including 30,764 square feet of renewal/expansion leases and some leases that are out for signature. |
| (3) | DSCRs and debt yields are based on The Outlet Collection | Jersey Gardens Loan Combination. |
Appraisal. As of the appraisal valuation date of October 4, 2013, The Outlet Collection | Jersey Gardens Property had an “as-is” appraised value of $707,000,000.
Environmental Matters. According to a Phase I environmental site assessment dated October 8, 2013, there was no evidence of any current recognized environmental conditions at The Outlet Collection | Jersey Gardens Property; however, one historical recognized environmental condition was noted. The Outlet Collection | Jersey Gardens Property was part of the former Elizabeth Landfill, which was utilized by several municipalities in New Jersey. According to the Phase I environmental consultant, all required landfill closure and remediation work has been completed and a “No Further Action Letter” and “Covenant Not to Sue” was issued in 1999. As part of the ongoing monitoring, the Phase I environmental consultant recommended that the engineering controls (cap, leachate drainage system, storm-water drainage system, gas venting system, etc.) and institutional controls continue to be maintained by the New Jersey Department of Environmental Protection.
THE INFORMATION IN THIS STRUCTURAL AND COLLATERAL TERM SHEET IS NOT COMPLETE AND MAY BE AMENDED PRIOR TO THE TIME OF SALE. THIS TERM SHEET IS NOT AN OFFER TO SELL THESE SECURITIES AND IT IS NOT A SOLICITATION OF AN OFFER TO BUY THESE SECURITIES IN ANY JURISDICTION WHERE THE OFFER OR SALE IS NOT PERMITTED.
58
| THE OUTLET COLLECTION | JERSEY GARDENS |
Market Overview and Competition. The Outlet Collection | Jersey Gardens Property is located adjacent to the New Jersey Turnpike, approximately 17 miles southwest of midtown Manhattan and approximately three miles south of Newark International Airport. Regional access is provided by the New Jersey Turnpike, which is traveled by over 250,000 cars daily and provides direct access to The Outlet Collection | Jersey Gardens Property. With a population of more than 125,000, the city of Elizabeth is New Jersey’s fourth largest city and contains most major governmental offices and courts servicing Union County. Elizabeth is also home to Port Newark, the largest industrial seaport in North America, which provides over 150,000 jobs and is the world’s largest containership port and the largest Foreign Trade Zone in the United States. The largest employers in the area include Newark Airport (24,000), Verizon (17,000), Prudential (16,000), and Public Service Electric and Gas Company (11,000).
The Outlet Collection | Jersey Gardens Property provides a shuttle bus to Newark International Airport, which is located directly across the New Jersey Turnpike from The Outlet Collection | Jersey Gardens Property, and that transports over 10,000 monthly riders, including airport employees, local hotel guests and international travelers. The Outlet Collection | Jersey Gardens Property is also easily accessible via public transportation, with two New Jersey Transit train stations and transit buses providing convenient access throughout the trade area. Another demand driver for The Outlet Collection | Jersey Gardens Property has been its location within Elizabeth’s award-winning Urban Enterprise Zone (“UEZ”) program, which offers a reduced 3.5% sales tax (compared to the 7.0% rate charged statewide). The UEZ was named the number one program in the nation by the National Association of State Development Agencies and has provided more than $50.0 million in additional funds for reinvestment in Elizabeth. Further, the state of New Jersey does not charge a sales tax on clothing or shoes, which creates a unique demand driver given The Outlet Collection | Jersey Gardens Property’s proximity to New York City.
According to the appraisal, The Outlet Collection | Jersey Gardens Property’s trade area encompasses a 40-mile radius. As of 2013, the estimated population within a 20-mile and 40-mile radius of The Outlet Collection | Jersey Gardens Property was approximately 10.7 million and 17.0 million, respectively. The estimated household income within the same 20-mile and 40-mile radius was approximately $84,002 and $93,628, respectively. According to a third party market research report, The Outlet Collection | Jersey Gardens Property is located within the Northern New Jersey retail market, which has an estimated inventory of approximately 196.2 million square feet with a 6.1% vacancy rate, as of the third quarter of 2013. The appraiser concluded a market rent of $24.65 per square foot, on a triple net basis, for The Outlet Collection | Jersey Gardens Property.
The following table presents certain information relating to comparable retail properties for The Outlet Collection | Jersey Gardens Property:
Competitive Set(1)
The Outlet Collection | Jersey Gardens (Subject) | Staten Island Mall | Newport Centre | Woodbridge Center | Menlo Park Mall | The Outlets at Bergen Town Center | Woodbury Commons | |||||||||
| Location | Elizabeth, NJ | Staten Island, NY | Jersey City, NJ | Woodbridge, NJ | Edison, NJ | Paramus, NJ | Central Valley, NY | ||||||||
| Distance from Subject | -- | 11.0 miles | 12.5 miles | 14.0 miles | 14.5 miles | 26.0 miles | 55.0 miles | ||||||||
| Property Type | Regional Mall | Super-Regional Mall | Super-Regional Mall | Super-Regional Mall | Super-Regional Mall | Outlet Center | Outlet Center | ||||||||
| Year Built/Renovated | 1999/2013 | 1973/1993 | 1987/2005 | 1971/2003 | 1960/2003 | 1957/1967, 1973, 2007-2011 | 1985/1998 | ||||||||
| Anchors | Loews Theatres, Forever 21, Burlington Coat Factory, Marshalls, Bed Bath & Beyond, Century 21, Cohoes Fashions, Off Saks Off 5th | Sears, JC Penney, Macy’s | Sears, JC Penney, Kohl’s, Macy’s | Sears, Macy’s, Lord & Taylor, JC Penney, Boscov’s | Macy’s, Nordstrom, AMC Theater, Workout World | Bloomingdales Outlet, Century 21, Homegoods, Marshall’s Nordstrom Rack, Off 5th, Old Navy, Target, Whole Foods | Neiman Marcus Last Call, Off 5th, Barney’s New York, Polo Ralph Lauren, Eddie Bauer | ||||||||
| Total GLA | 1,298,801 SF | 1,274,000 SF | 1,147,000 SF | 1,630,000 SF | 1,243,000 SF | 1,001,916 SF | 848,000 SF | ||||||||
| In-line Sales PSF | $715 | NAV | $550 | $450 | $400 | $560 | $1,400 | ||||||||
| Total Occupancy | 99% | 94% | 98% | 96% | 92% | 92% | 100% |
| (1) | Information obtained from the appraisal. |
The Borrower. The borrower is NJ Metromall Urban Renewal, Inc. (the fee owner) and JG Elizabeth II, LLC (the leasehold owner), as further detailed in the “Ground Lease and Payment in Lieu of Taxes (“PILOT”)” section, both single purpose entities with two independent directors. Legal counsel to the borrower delivered a non-consolidation opinion in connection with the origination of The Outlet Collection | Jersey Gardens Loan Combination. Glimcher Properties Limited Partnership (“GPLP”), the sponsor, is the guarantor of certain nonrecourse carveouts under The Outlet Collection | Jersey Gardens Loan Combination.
THE INFORMATION IN THIS STRUCTURAL AND COLLATERAL TERM SHEET IS NOT COMPLETE AND MAY BE AMENDED PRIOR TO THE TIME OF SALE. THIS TERM SHEET IS NOT AN OFFER TO SELL THESE SECURITIES AND IT IS NOT A SOLICITATION OF AN OFFER TO BUY THESE SECURITIES IN ANY JURISDICTION WHERE THE OFFER OR SALE IS NOT PERMITTED.
59
| THE OUTLET COLLECTION | JERSEY GARDENS |
The Sponsor. The loan sponsor is GPLP, a subsidiary of Glimcher. Based in Columbus, Ohio, Glimcher was formed in 1994 to continue and expand the operations of The Glimcher Company, initially founded in 1959 by Herbert Glimcher. Glimcher owns and/or manages a total of 27 enclosed regional malls, open-air centers or outlet centers in 14 states aggregating approximately 19.1 million square feet of gross leasable area, which was approximately 95.0% occupied as of September 30, 2013. In 2009 and 2012, Glimcher had ownership interests in two malls that either were the subject of deeds in lieu of foreclosure or were modified following default. See “Description of the Mortgage Pool – Default History, Bankruptcy Issues and Other Proceedings” in the Free Writing Prospectus.
Escrows. The loan documents provide for upfront reserves in the amount of $2,593,953 for unfunded TI/LC costs associated with ten tenants and $61,775 for rent concessions associated with The Gap. The loan documents do not require monthly escrows for real estate taxes provided the following conditions are met: (i) no event of default has occurred and is continuing; (ii) the borrower has provided the lender with timely proof of payment; and (iii) a Cash Trap Event Period (as defined below) does not currently exist. The loan documents do not require monthly escrows for insurance provided (i) no event of default has occurred and is continuing; (ii) the insurance required to be maintained by the borrower is maintained pursuant to one or more blanket policies; and (iii) the borrower provides the lender with timely proof of payment of insurance premiums. The loan documents do not require monthly escrows for replacement reserves as long as no Cash Trap Event Period exists and is continuing. During a Cash Trap Event Period, the borrower is required to deposit monthly replacement reserves in an amount equal to $21,647. The loan documents do not require monthly escrows for tenant improvements and leasing commissions as long as no Cash Trap Event Period exists and is continuing. During a Cash Trap Event Period, the borrower is required to deposit monthly tenant improvement and leasing commission reserves in an amount equal to $52,645. In addition, during a Cash Trap Event Period, the borrower is required to make monthly deposits into a ground rent reserve account in an amount equal to one-twelfth of the estimated annual ground rent payment payable during the next ensuing 12 months.
A “Cash Trap Event Period” will commence upon (i) the occurrence and continuance of an event of default or (ii) the debt service coverage ratio (based on a 30-year amortization term) for the trailing 12-month period falling below 1.25x at the end of any calendar quarter. A Cash Trap Event Period will expire, with regard to the circumstances in clause (i), upon the cure of such event of default, or, with regard to the circumstances in clause (ii), the debt service coverage ratio (based on a 30-year amortization term) being equal to or greater than 1.25x for two consecutive calendar quarters.
Lockbox and Cash Management. The Outlet Collection | Jersey Gardens Loan Combination requires a lender-controlled lockbox account, which is already in place, and that the borrower direct tenants to pay their rents directly into such lockbox account. The loan documents also require that all rents received by the borrower or the property manager be deposited into the lockbox account within one business day of receipt. Prior to the occurrence of a Cash Trap Event Period, all funds on deposit in the lockbox account are swept into the borrower’s operating account on a daily basis. During a Cash Trap Event Period, all excess cash flow is swept on a monthly basis to a cash management account under control of the lender.
Property Management. The Outlet Collection | Jersey Gardens Property is managed by an affiliate of the borrower.
Assumption. The borrower has the two-time right to transfer The Outlet Collection | Jersey Gardens Property, provided that no event of default has occurred and is continuing and certain other conditions are satisfied, including, but not limited to the following: (i) the lender’s reasonable determination that the proposed transferee and guarantor satisfy the lender’s credit review and underwriting standards, taking into consideration transferee experience, financial strength and general business standing; (ii) execution of a recourse guaranty and an environmental indemnity by an affiliate of the transferee; and (iii) if requested by the lender, rating agency confirmation from DBRS, Fitch and Moody’s that the transfer will not result in a downgrade, withdrawal or qualification of the respective ratings assigned to the Series 2013-C18 Certificates, and similar confirmations with respect to the ratings of any securities backed by The Outlet Collection | Jersey Gardens Companion Loans.
In addition, transfers of equity interests in the borrower are permitted so long as Glimcher owns more than 30.0% of direct or indirect equity interests in GPLP (and controls GPLP) and the borrower or a Qualified Equity Holder (as defined below) owns more than 51.0% of the direct or indirect equity interests in GPLP (and controls GPLP).
A “Qualified Equity Holder” means an entity which meets certain criteria, including but not limited to (i) an affiliate, or other institution having total assets in excess of $600.0 million and is regularly engaged in the business of owning and operating properties similar to The Outlet Collection | Jersey Gardens Property, or (ii) any party for whom written confirmation from KBRA, Moody’s and S&P has been obtained that the transfer to the entity in question will not result in a downgrade, withdrawal or qualification of the then-current ratings assigned to the Series 2013-C18 Certificates, and similar confirmations with respect to the ratings of any securities backed by The Outlet Collection | Jersey Gardens Companion Loans.
Partial Release. Not permitted.
Real Estate Substitution. Not permitted.
Subordinate and Mezzanine Indebtedness. Not permitted.
THE INFORMATION IN THIS STRUCTURAL AND COLLATERAL TERM SHEET IS NOT COMPLETE AND MAY BE AMENDED PRIOR TO THE TIME OF SALE. THIS TERM SHEET IS NOT AN OFFER TO SELL THESE SECURITIES AND IT IS NOT A SOLICITATION OF AN OFFER TO BUY THESE SECURITIES IN ANY JURISDICTION WHERE THE OFFER OR SALE IS NOT PERMITTED.
60
| THE OUTLET COLLECTION | JERSEY GARDENS |
Additional Indebtedness. GPLP is permitted to pledge its indirect ownership of the borrower to a “Qualified Pledgee” (generally defined as an entity with $600.0 million in assets under management and shareholder equity of at least $250.0 million), subject to certain conditions, including: (i) no more than 49.0% of equity ownership interest in the borrower may be pledged; (ii) the credit facility must be recourse to GPLP and is secured by a substantial portion of its assets; (iii) the repayment of the credit facility relies substantially on cash flow assets other than The Outlet Collection | Jersey Gardens Property; and (iv) no event of default has occurred or is continuing.
Ground Lease and Payment in Lieu of Taxes (“PILOT”). The Outlet Collection | Jersey Gardens Property is subject to a prior lien for amounts required under a PILOT arrangement with the City of Elizabeth, New Jersey. To accommodate statutory requirements for the PILOT structure, the borrowers are comprised of a fee borrower (NJ Metromall Urban Renewal, Inc.) and an affiliated leasehold borrower (JG Elizabeth, LLC), and the lease payments made by the leasehold borrower to the fee borrower equal the required PILOT payments, and are paid by the fee borrower to US Bank Trust (the “PILOT Lender”), as trustee for the PILOT bondholders. The PILOT Lender has a statutory lien on The Outlet Collection | Jersey Gardens Property that is effectively equivalent in priority and character to a municipal tax lien. If the PILOT payments are not made, the City of Elizabeth has a special assessment lien against The Outlet Collection | Jersey Gardens Property in the same amount as the PILOT payments that are due but not yet paid.
The remaining PILOT obligations during the loan term range from $10,799,250 in 2013 through $12,770,113 in 2020, and the PILOT payments continue until February 1, 2031. The borrower affiliate that owns the adjacent retail site, and/or its tenants are contractually obligated to reimburse the borrower for 22.9% of the PILOT obligation.
Terrorism Insurance. The loan documents require that the “all risk” insurance policy required to be maintained by the borrower provides coverage for terrorism in an amount equal to the full replacement cost of The Outlet Collection | Jersey Gardens Property; provided, however, that the borrower will not be required to spend more than 200% of the cost of property coverage immediately prior to the date that TRIA or a similar government backstop is no longer in effect. The loan documents also require business interruption insurance covering no less than the 24-month period following the occurrence of a casualty event, together with an extended period of indemnity, which shall continue for the lesser of (i) the period of time until income returns to the same level as it was prior to loss and (ii) 12 months.
THE INFORMATION IN THIS STRUCTURAL AND COLLATERAL TERM SHEET IS NOT COMPLETE AND MAY BE AMENDED PRIOR TO THE TIME OF SALE. THIS TERM SHEET IS NOT AN OFFER TO SELL THESE SECURITIES AND IT IS NOT A SOLICITATION OF AN OFFER TO BUY THESE SECURITIES IN ANY JURISDICTION WHERE THE OFFER OR SALE IS NOT PERMITTED.
61
| JFK HILTON |
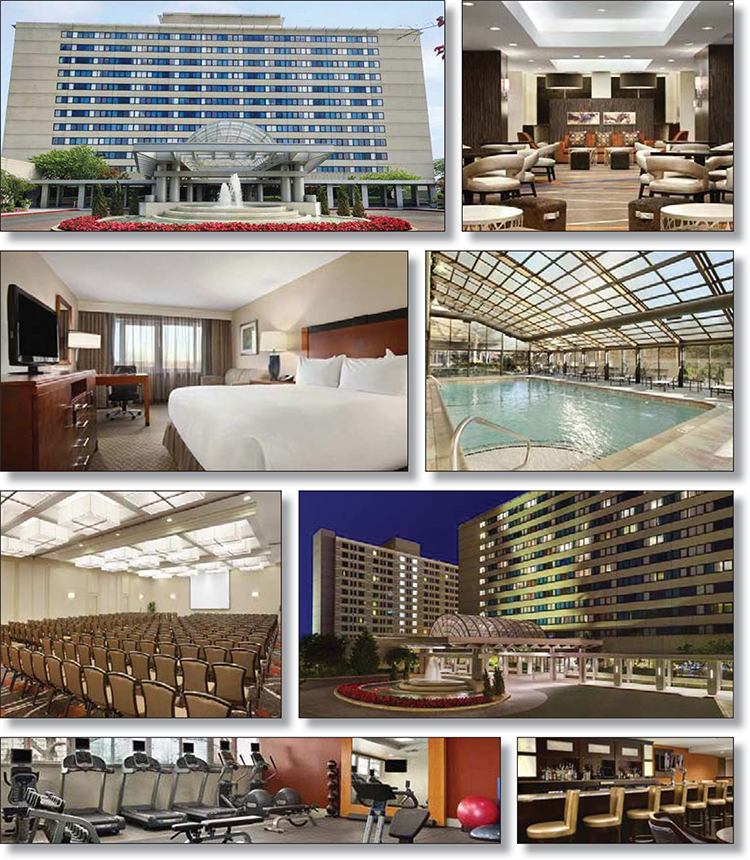
THE INFORMATION IN THIS STRUCTURAL AND COLLATERAL TERM SHEET IS NOT COMPLETE AND MAY BE AMENDED PRIOR TO THE TIME OF SALE. THIS TERM SHEET IS NOT AN OFFER TO SELL THESE SECURITIES AND IT IS NOT A SOLICITATION OF AN OFFER TO BUY THESE SECURITIES IN ANY JURISDICTION WHERE THE OFFER OR SALE IS NOT PERMITTED.
62
| JFK HILTON |

THE INFORMATION IN THIS STRUCTURAL AND COLLATERAL TERM SHEET IS NOT COMPLETE AND MAY BE AMENDED PRIOR TO THE TIME OF SALE. THIS TERM SHEET IS NOT AN OFFER TO SELL THESE SECURITIES AND IT IS NOT A SOLICITATION OF AN OFFER TO BUY THESE SECURITIES IN ANY JURISDICTION WHERE THE OFFER OR SALE IS NOT PERMITTED.
63
| No. 4 – JFK Hilton | |||||||||
| Loan Information | Property Information | ||||||||
| Mortgage Loan Seller: | The Royal Bank of Scotland | Single Asset/Portfolio: | Single Asset | ||||||
Credit Assessment (DBRS/Fitch/Moody’s): | NR/NR/NR | Property Type: | Hospitality | ||||||
| Original Principal Balance: | $68,500,000 | Specific Property Type: | Full Service | ||||||
| Cut-off Date Principal Balance: | $68,500,000 | Location: | Jamaica, NY | ||||||
| % of Initial Pool Balance: | 6.6%% | Size: | 356 rooms | ||||||
| Loan Purpose: | Refinance | Cut-off Date Principal Balance Per Room: | $192,416 | ||||||
| Borrower Name: | JFK Hotel Partners LLC | Year Built/Renovated: | 1987/2012 | ||||||
| Sponsors: | Sam Chang; Soundview Real Estate Partners | Title Vesting: | Fee | ||||||
| Mortgage Rate: | 5.153% | Property Manager: | CH Hospitality Management, LLC | ||||||
| Note Date: | November 25, 2013 | 3rd Most Recent Occupancy (As of)(3): | NAV | ||||||
| Anticipated Repayment Date: | NAP | 2nd Most Recent Occupancy (As of)(3): | NAV | ||||||
| Maturity Date: | December 1, 2023 | Most Recent Occupancy (As of): | 70.5% (12/31/2012) | ||||||
| IO Period: | 12 months | Current Occupancy (As of): | 93.7% (9/30/2013) | ||||||
| Loan Term (Original): | 120 months | ||||||||
| Seasoning: | 0 months | Underwriting and Financial Information: | |||||||
| Amortization Term (Original): | 360 months | ||||||||
| Loan Amortization Type: | Interest-only, Amortizing Balloon | 3rd Most Recent NOI (As of): | NAV | ||||||
| Interest Accrual Method: | Actual/360 | 2nd Most Recent NOI (As of): | $4,341,130 (12/31/2012) | ||||||
| Call Protection: | L(24),D(92),O(4) | Most Recent NOI (As of): | $9,017,219 (TTM 9/30/2013) | ||||||
| Lockbox Type: | Soft/Springing Cash Management | ||||||||
Additional Debt(1): | Yes | U/W Revenues: | $25,059,001 | ||||||
Additional Debt Type(1): | Future Mezzanine | U/W Expenses: | $17,203,970 | ||||||
| U/W NOI: | $7,855,031 | ||||||||
| U/W NCF: | $6,852,671 | ||||||||
| U/W NOI DSCR: | 1.75x | ||||||||
| U/W NCF DSCR: | 1.53x | ||||||||
Escrows and Reserves(2): | U/W NOI Debt Yield: | 11.5% | |||||||
| U/W NCF Debt Yield: | 10.0% | ||||||||
Type: | Initial | Monthly | Cap (If Any) | As-Is Appraised Value: | $103,300,000 | ||||
| Taxes | $609,414 | $121,883 | NAP | As-Is Appraisal Valuation Date: | October 8, 2013 | ||||
| Insurance | $119,224 | $14,903 | NAP | Cut-off Date LTV Ratio: | 66.3% | ||||
| FF&E | $85,324 | $85,324 | $3,000,000 | LTV Ratio at Maturity or ARD: | 56.2% | ||||
| (1) | See “Subordinate and Mezzanine Indebtedness” section. |
| (2) | See “Escrows” section. |
| (3) | Historical information is not available as the JFK Hilton property was renovated and converted to a Hilton in 2012. |
The Mortgage Loan. The mortgage loan (the “JFK Hilton Mortgage Loan”) is evidenced by a single promissory note that is secured by a first mortgage encumbering a full service hotel located in Jamaica, New York (the “JFK Hilton Property”). The JFK Hilton Mortgage Loan was originated on November 25, 2013 by The Royal Bank of Scotland. The JFK Hilton Mortgage Loan had an original principal balance of $68,500,000, has an outstanding principal balance as of the Cut-off Date of $68,500,000 and accrues interest at an interest rate of 5.153% per annum. The JFK Hilton Mortgage Loan had an initial term of 120 months, has a remaining term of 120 months as of the Cut-off Date and requires interest-only payments for the first 12 payments following origination, and thereafter, requires payments of principal and interest based on a 30-year amortization schedule. The JFK Hilton Mortgage Loan matures on December 1, 2023.
Following the lockout period, the borrower has the right to defease the JFK Hilton Mortgage Loan in whole, but not in part, on any date before September 1, 2023. In addition, the JFK Hilton Mortgage Loan is prepayable without penalty on or after September 1, 2023.
Sources and Uses
| Sources | Uses | ||||||||
| Original loan amount | $68,500,000 | 100.0% | Loan payoff | $35,804,348 | 52.3 | % | |||
| Reserves | 813,962 | 1.2 | |||||||
| Closing costs | 1,721,986 | 2.5 | |||||||
| Return of equity | 30,159,704 | 44.0 | |||||||
| Total Sources | $68,500,000 | 100.0% | Total Uses | $68,500,000 | 100.0 | % |
THE INFORMATION IN THIS STRUCTURAL AND COLLATERAL TERM SHEET IS NOT COMPLETE AND MAY BE AMENDED PRIOR TO THE TIME OF SALE. THIS TERM SHEET IS NOT AN OFFER TO SELL THESE SECURITIES AND IT IS NOT A SOLICITATION OF AN OFFER TO BUY THESE SECURITIES IN ANY JURISDICTION WHERE THE OFFER OR SALE IS NOT PERMITTED.
64
| JFK HILTON |
The Property. The JFK Hilton Property is a 356-room, 12-story, full service hotel located in Jamaica, New York, less than one half mile north of John F. Kennedy International Airport (“JFK International Airport”). The JFK Hilton Property was constructed in 1987 and the sponsor recently completed $21.0 million in renovations (property improvement plan or “PIP”) to convert the hotel from an independently operated hotel to a full-service Hilton which opened in February 2012. The PIP included full renovation of all guestrooms, lobby, meeting space, kitchen, restaurant and bar area, elevators, windows and the HVAC system. The JFK Hilton Property is the only full-service Hilton in the JFK market and features 207 queen guestrooms, 104 king guestrooms, 23 executive floor king guestrooms, 11 executive floor queen guestrooms, 9 one-bedroom king suites, and 2 executive floor one-bedroom king suites. Amenities at the JFK Hilton Property include a business center, over 6,300 square feet of meeting space, full-service restaurant that serves breakfast, lunch and dinner, café, pool, fitness center and gift shop. The JFK Hilton Property also benefits from a 24-hour shuttle service to all terminals at the JFK International Airport. The JFK Hilton Property has 225 surface parking spaces. Since opening as a new Hilton hotel in February 2012, the JFK Hilton Property gained market share as reflected in a 115% RevPAR penetration, as of September 2013. The franchise agreement expires in February 2027.
Operating History and Underwritten Net Cash Flow. The following table represents certain information relating to the historical operating performance and the Underwritten Net Cash Flow at the JFK Hilton Property:
Cash Flow Analysis(1)
| 2012 | TTM 9/30/2013 | U/W | U/W $ per Room | ||||||
| Occupancy | 70.5% | 93.7% | 87.0% | ||||||
| ADR | $166.86 | $179.95 | $179.95 | ||||||
| RevPAR | $117.55 | $168.63 | $156.56 | ||||||
| Total Revenue | $19,209,655 | $26,991,328 | $25,059,001 | $70,390 | |||||
| Total Department Expenses | 7,205,392 | 8,796,989 | 8,167,082 | 122,941 | |||||
| Gross Operating Profit | $12,004,263 | $18,194,339 | $16,891,919 | $47,449 | |||||
| Total Undistributed Expenses | 6,070,617 | 7,565,603 | 7,402,258 | 20,793 | |||||
| Profit Before Fixed Charges | $5,933,646 | $10,628,736 | $9,489,661 | $26,656 | |||||
| Total Fixed Charges | 1,592,516 | 1,611,517 | 1,634,630 | 4,592 | |||||
| Net Operating Income | $4,341,130 | $9,017,219 | $7,855,031 | $22,065 | |||||
| FF&E | 0 | 0 | 1,002,360 | 2,816 | |||||
| Net Cash Flow | $4,341,130 | $9,017,219 | $6,852,671 | 19,249 | |||||
| NOI DSCR | 0.97x | 2.01x | 1.75x | ||||||
| NCF DSCR | 0.97x | 2.01x | 1.53x | ||||||
| NOI DY | 6.3% | 13.2% | 11.5% | ||||||
| NCF DY | 6.3% | 13.2% | 10.0% | ||||||
| (1) No additional historical financial information is available as the JFK Hilton Property opened in February 2012. | |||||||||
Appraisal. As of the appraisal valuation date of October 8, 2013, the JFK Hilton Property had an “as-is” appraised value of $103,300,000.
Environmental Matters. According to the Phase I environmental site assessment dated October 17, 2013, there was no evidence of any recognized environmental conditions at the JFK Hilton Property.
Market Overview and Competition. The JFK Hilton Property is located in Queens County, New York, at the intersection of 142nd Street and 135th Avenue, less than one half mile north of the JFK International Airport. The JFK Hilton is located one mile west of Interstate 678. LaGuardia Airport is also located less than nine miles north of the JFK Hilton Property. JFK International Airport and LaGuardia Airport, both located in Queens, serve as two of the airports for the New York City area. New York City is the number one destination for tourism spending in the United States, which had approximately 52 million visitors in 2012 generating approximately $36.9 billion. The JFK Hilton Property benefits from other local demand generators such as the Queens Zoo, the Queens County Farm Museum, Flushing’s USTA National Tennis Center, Resorts World Casino at Aqueduct Racetrack and various retail outlets of New York City.
THE INFORMATION IN THIS STRUCTURAL AND COLLATERAL TERM SHEET IS NOT COMPLETE AND MAY BE AMENDED PRIOR TO THE TIME OF SALE. THIS TERM SHEET IS NOT AN OFFER TO SELL THESE SECURITIES AND IT IS NOT A SOLICITATION OF AN OFFER TO BUY THESE SECURITIES IN ANY JURISDICTION WHERE THE OFFER OR SALE IS NOT PERMITTED.
65
| JFK HILTON |
The following table presents certain information relating to the JFK Hilton Property’s competitive set:
Subject and Market Historical Occupancy, ADR and RevPAR(1)
Competitive Set | JFK Hilton | Penetration Factor | |||||||||||||||||
Year | Occupancy | ADR | RevPAR | Occupancy | ADR | RevPAR | Occupancy | ADR | RevPAR | ||||||||||
| 9/30/2013 TTM | 88.9% | $165.09 | $146.72 | 93.4% | $180.62 | $168.70 | 105.1% | 109.4% | 115.0% | ||||||||||
| 9/30/2012 TTM | 79.5% | $145.26 | $115.53 | 56.4% | $140.10 | $78.99 | 70.9% | 96.5% | 68.4% | ||||||||||
9/30/2011 TTM(2) | NAP | NAP | NAP | NAP | NAP | NAP | NAP | NAP | NAP | ||||||||||
| (1) | Information obtained from a third party hospitality report dated October 17, 2013. According to such third party hospitality report, the competitive set includes the following hotels: Doubletree John F. Kennedy Airport, Garden Inn & Suites, Courtyard New York City JFK Airport, Hampton Inn New York JFK Airport Jamaica, Hilton Garden Inn Queens John F. Kennedy Airport and Sheraton Hotel John F. Kennedy Airport. |
| (2) | The JFK Hilton Property was converted from an independently operated hotel to a full-service Hilton that opened in February 2012. |
The Borrower. The borrower is JFK Hotel Partners LLC, a New York limited liability company and a single purpose entity. The borrower’s sole managing member is JFK Portfolio Manager Subsidiary, LLC, a Delaware limited liability company and a single purpose entity with two independent directors. Legal counsel to the borrower delivered a non-consolidation opinion in connection with the origination of the JFK Hilton Mortgage Loan. Sam Chang is the guarantor of certain nonrecourse carveouts under the JFK Hilton Mortgage Loan. The sponsor purchased the JFK Hilton Property out of bankruptcy in 2007 for approximately $40.3 million, which was then operating as an independently flagged hotel. See “Description of the Mortgage Pool – Default History, Bankruptcy Issues and Other Proceedings” in the Free Writing Prospectus.
The Sponsor. The sponsor for the JFK Hilton Mortgage Loan is 48.0% owned by Sam Chang and 48.5% owned by Soundview Real Estate Partners III LLC. Sam Chang is the founder, Chairman and CEO of McSam Hotel Group LLC based in Great Neck, Long Island, New York. Mr. Chang has over 20 years of experience in the hotel industry and has built and sold more than 60 properties in the New York metro area, totaling over 5,000 rooms. Soundview Real Estate Partners III LLC is a private equity fund formed in 2010, which has invested over $250.0 million in equity over 70 separate transactions and combined real estate valued in excess of $2.0 billion.
Escrows. The loan documents provide for upfront escrows in the amount of $609,414 for real estate taxes, $119,224 for insurance and $85,324 for FF&E. The loan documents provide for monthly escrows in the amount of $121,883 for real estate taxes and $14,903 for insurance. The loan documents also require monthly FF&E escrows in the amount of $85,324 (subject to a cap of $3,000,000).
Lockbox and Cash Management. The JFK Hilton Mortgage Loan requires a lender-controlled lockbox account, which is already in place, where the borrower and property manager will cause all credit card receipts to be deposited directly. The loan documents also require that all revenues received by the borrower or property manager be deposited into the lockbox account within one business day of receipt. Prior to the occurrence of a Cash Management Period (as defined below), all funds on deposit in the lockbox account are swept into the borrower’s operating account on a daily basis. During a Cash Management Period, all funds on deposit in the lockbox account are swept to a lender-controlled cash management account each business day.
A “Cash Management Period” will commence upon: (i) the occurrence and continuance of an event of default; (ii) the amortizing debt service coverage falling below 1.15x at the end of any calendar quarter; (iii) the bankruptcy or insolvency of the property manager; or (iv) if any approved mezzanine debt is outstanding. A Cash Management Period will expire upon, with respect to the matters described in clause (i) above, the cure of such event of default; and with respect to the matters described in clause (ii) above, the amortizing debt service coverage ratio being at least 1.15x on the last day of each calendar quarter.
Property Management. The JFK Hilton Property is managed by CH Hospitality Management, LLC.
Assumption. The borrower has the right to transfer the JFK Hilton Property provided that certain conditions are satisfied, including: (i) no event of default has occurred and is continuing; (ii) the lender reasonably determined that the proposed transferee and guarantor satisfy the lender’s credit review and underwriting standards, taking into consideration transferee experience, financial strength and general business standing; and (iii) the lender has received confirmation from DBRS, Fitch and Moody’s that such assumption will not result in a downgrade, withdrawal or qualification of the respective ratings assigned to the Series 2013-C18 Certificates.
Partial Release. Not permitted.
Real Estate Substitution. Not permitted.
Subordinate and Mezzanine Indebtedness. The borrower has the right to incur mezzanine financing subject to the satisfaction of certain conditions, including: (i) no event of default has occurred and is continuing; (ii) the combined loan-to-value ratio including all debt is not less than 66.3%; (iii) the amortizing debt service coverage ratio including all debt is not less than 1.74x; (iv) mezzanine loan documents that are reasonably acceptable to the lender will have been delivered to the lender; and (v) rating agency confirmation from DBRS, Fitch and Moody’s that the mezzanine financing will not result in a downgrade, withdrawal or qualification of the respective ratings assigned to the Series 2013-C18 Certificates.
Ground Lease. None.
THE INFORMATION IN THIS STRUCTURAL AND COLLATERAL TERM SHEET IS NOT COMPLETE AND MAY BE AMENDED PRIOR TO THE TIME OF SALE. THIS TERM SHEET IS NOT AN OFFER TO SELL THESE SECURITIES AND IT IS NOT A SOLICITATION OF AN OFFER TO BUY THESE SECURITIES IN ANY JURISDICTION WHERE THE OFFER OR SALE IS NOT PERMITTED.
66
| JFK HILTON |
Terrorism Insurance. The loan documents require that the “all risk” insurance policy required to be maintained by the borrower provide coverage for terrorism in an amount equal to the full replacement cost of the JFK Hilton Property, as well as business interruption insurance covering no less than the 18-month period following the occurrence of a casualty event, together with a six-month extended period of indemnity.
THE INFORMATION IN THIS STRUCTURAL AND COLLATERAL TERM SHEET IS NOT COMPLETE AND MAY BE AMENDED PRIOR TO THE TIME OF SALE. THIS TERM SHEET IS NOT AN OFFER TO SELL THESE SECURITIES AND IT IS NOT A SOLICITATION OF AN OFFER TO BUY THESE SECURITIES IN ANY JURISDICTION WHERE THE OFFER OR SALE IS NOT PERMITTED.
67
| HOTEL FELIX CHICAGO |

THE INFORMATION IN THIS STRUCTURAL AND COLLATERAL TERM SHEET IS NOT COMPLETE AND MAY BE AMENDED PRIOR TO THE TIME OF SALE. THIS TERM SHEET IS NOT AN OFFER TO SELL THESE SECURITIES AND IT IS NOT A SOLICITATION OF AN OFFER TO BUY THESE SECURITIES IN ANY JURISDICTION WHERE THE OFFER OR SALE IS NOT PERMITTED.
68
| HOTEL FELIX CHICAGO |
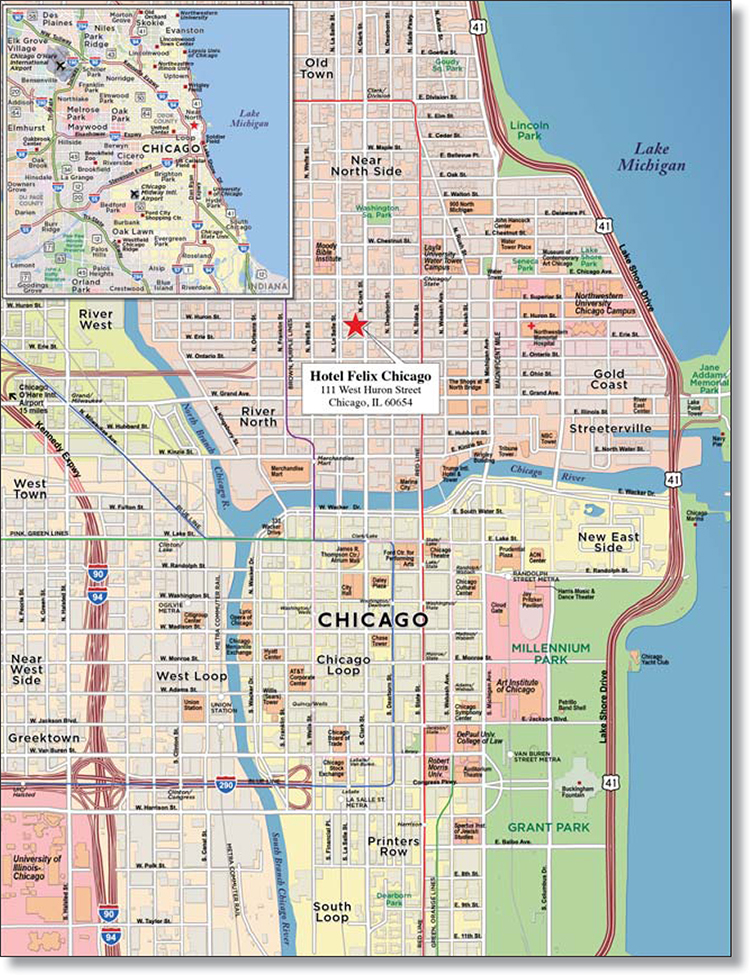
THE INFORMATION IN THIS STRUCTURAL AND COLLATERAL TERM SHEET IS NOT COMPLETE AND MAY BE AMENDED PRIOR TO THE TIME OF SALE. THIS TERM SHEET IS NOT AN OFFER TO SELL THESE SECURITIES AND IT IS NOT A SOLICITATION OF AN OFFER TO BUY THESE SECURITIES IN ANY JURISDICTION WHERE THE OFFER OR SALE IS NOT PERMITTED.
69
| No. 5 – Hotel Felix Chicago | ||||||||
| Loan Information | Property Information | |||||||
| Mortgage Loan Seller: | The Royal Bank of Scotland | Single Asset/Portfolio: | Single Asset | |||||
Credit Assessment (DBRS/Fitch/Moody’s): | NR/NR/NR | Property Type: | Hospitality | |||||
| Original Principal Balance: | $47,000,000 | Specific Property Type: | Limited Service | |||||
| Cut-off Date Principal Balance: | $47,000,000 | Location: | Chicago, IL | |||||
| % of Initial Pool Balance: | 4.5% | Size: | 225 rooms | |||||
| Loan Purpose: | Refinance | Cut-off Date Principal Balance Per Room: | $208,889 | |||||
| Borrower Names: | HCP Oxford OBG Wacker Property Company, LLC and HCP Oxford OBG Felix Sub-Tenant, LLC | Year Built/Renovated: | 1926/2009 | |||||
| Sponsor: | Oxford Capital Group, LLC | Title Vesting: | Fee | |||||
| Mortgage Rate: | 5.277% | Property Manager: | Self-managed | |||||
| Note Date: | December 5, 2013 | 3rd Most Recent Occupancy (As of): | 81.6% (12/31/2010) | |||||
| Anticipated Repayment Date: | NAP | 2nd Most Recent Occupancy (As of): | 86.6% (12/31/2011) | |||||
| Maturity Date: | January 1, 2024 | Most Recent Occupancy (As of): | 87.8% (12/31/2012) | |||||
| IO Period: | 25 months | Current Occupancy (As of): | 88.5% (TTM 9/30/2013) | |||||
| Loan Term (Original): | 121 months | |||||||
| Seasoning: | 0 months | Underwriting and Financial Information: | ||||||
| Amortization Term (Original): | 360 months | |||||||
| Loan Amortization Type: | Interest-only, Amortizing Balloon | 3rd Most Recent NOI (As of): | $4,102,572 (12/31/2011) | |||||
| Interest Accrual Method: | Actual/360 | 2nd Most Recent NOI (As of): | $4,827,614 (12/31/2012) | |||||
| Call Protection: | L(24),D(94),O(3) | Most Recent NOI (As of): | $4,942,843 (9/30/2013) | |||||
| Lockbox Type: | Hard/Springing Cash Management | |||||||
Additional Debt(1): | Yes | U/W Revenues: | $10,569,245 | |||||
Additional Debt Type(1): | Future Mezzanine | U/W Expenses: | $5,693,836 | |||||
| U/W NOI: | $4,875,409 | |||||||
| U/W NCF: | $4,452,639 | |||||||
| U/W NOI DSCR: | 1.56x | |||||||
| U/W NCF DSCR: | 1.43x | |||||||
Escrows and Reserves(2): | U/W NOI Debt Yield: | 10.4% | ||||||
| U/W NCF Debt Yield: | 9.5% | |||||||
Type: | Initial | Monthly | Cap (If Any) | As-Is Appraised Value: | $68,600,000 | |||
| Taxes | $127,095 | $21,183 | NAP | As-Is Appraisal Valuation Date: | November 1, 2013 | |||
| Insurance | $53,719 | $7,674 | NAP | Cut-off Date LTV Ratio: | 68.5% | |||
| FF&E | $35,230 | $35,230 | NAP | LTV Ratio at Maturity or ARD: | 59.7% | |||
| (1) | See “Subordinate and Mezzanine Indebtedness” section. |
| (2) | See “Escrows” section. |
The Mortgage Loan. The mortgage loan (the “Hotel Felix Chicago Mortgage Loan”) is evidenced by a single promissory note that is secured by a first mortgage encumbering a full service hotel located in Chicago, Illinois (the “Hotel Felix Chicago Property”). The Hotel Felix Chicago Mortgage Loan was originated on December 5, 2013 by The Royal Bank of Scotland. The Hotel Felix Chicago Mortgage Loan had an original principal balance of $47,000,000, has an outstanding principal balance as of the Cut-off Date of $47,000,000 and accrues interest at an interest rate of 5.277% per annum. The Hotel Felix Chicago Mortgage Loan had an initial term of 121 months, has a remaining term of 121 months as of the Cut-off Date and requires interest-only payments for the first 25 payments following origination and, thereafter, requires payments of principal and interest based on a 30-year amortization schedule. The Hotel Felix Chicago Mortgage Loan matures on January 1, 2024.
Following the lockout period, the borrowers have the right to defease the Hotel Felix Chicago Mortgage Loan in whole, but not in part, on any due date before November 1, 2023. In addition, the Hotel Felix Chicago Mortgage Loan is prepayable without penalty on or after November 1, 2023.
Sources and Uses
| Sources | Uses | ||||||||
| Original loan amount | $47,000,000 | 100.0% | Loan payoff | $38,482,963 | 81.9 | % | |||
| Reserves | 216,044 | 0.5 | |||||||
| Closing costs | 701,003 | 1.5 | |||||||
| Return of equity | 7,599,990 | 16.2 | |||||||
| Total Sources | $47,000,000 | 100.0% | Total Uses | $47,000,000 | 100.0 | % |
THE INFORMATION IN THIS STRUCTURAL AND COLLATERAL TERM SHEET IS NOT COMPLETE AND MAY BE AMENDED PRIOR TO THE TIME OF SALE. THIS TERM SHEET IS NOT AN OFFER TO SELL THESE SECURITIES AND IT IS NOT A SOLICITATION OF AN OFFER TO BUY THESE SECURITIES IN ANY JURISDICTION WHERE THE OFFER OR SALE IS NOT PERMITTED.
70
| HOTEL FELIX CHICAGO |
The Property. The Hotel Felix Chicago Property is a 225-room, 12-story full service, silver LEED certified, boutique hotel located in downtown Chicago, Illinois. The Hotel Felix Chicago Property was opened as Hotel Wacker in 1926 and reopened as Hotel Felix in 2009 and features 41 king guestrooms and 184 queen guestrooms. Amenities at the Hotel Felix Chicago Property include a business center, over 1,100 square feet of meeting and group space, a full service restaurant that serves breakfast, lunch and dinner, coffee bar, vending areas, complimentary high speed internet access, spa, fitness center and valet parking. The management agreement with Oxford OBG Hospitality Company – Wacker, LLC expires in March, 2019 with no renewal options.
Operating History and Underwritten Net Cash Flow. The following table presents certain information relating to the historical operating performance and the Underwritten Net Cash Flow at the Hotel Felix Chicago Property:
Cash Flow Analysis
| 2011 | 2012 | TTM 9/30/2013 | U/W | U/W $ per Room | |||||||
| Occupancy | 86.6% | 87.8% | 88.5% | 86.0% | |||||||
| ADR | $121.41 | $132.77 | $134.72 | $134.72 | |||||||
| RevPAR | $105.14 | $116.57 | $119.23 | $115.86 | |||||||
| Total Revenue | $9,516,667 | $10,617,839 | $10,871,207 | $10,569,245 | $46,974 | ||||||
| Total Department Expenses | 2,643,392 | 2,819,934 | 2,953,307 | 2,869,509 | 12,753 | ||||||
| Gross Operating Profit | $6,873,275 | $7,797,905 | $7,917,900 | $7,699,736 | $34,221 | ||||||
| Total Undistributed Expenses | 2,559,933 | 2,761,578 | 2,630,165 | 2,493,989 | 11,084 | ||||||
| Profit Before Fixed Charges | $4,313,342 | $5,036,327 | $5,287,735 | $5,205,748 | $23,137 | ||||||
| Total Fixed Charges | 210,770 | 208,713 | 344,892 | 330,339 | 1,468 | ||||||
| Net Operating Income | $4,102,572 | $4,827,614 | $4,942,843 | $4,875,409 | $21,668 | ||||||
| FF&E | 0 | 0 | 0 | 422,770 | 1,879 | ||||||
| Net Cash Flow | $4,102,572 | $4,827,614 | $4,942,843 | $4,452,639 | $19,790 | ||||||
| NOI DSCR | 1.36x | 1.55x | 1.58x | 1.56x | |||||||
| NCF DSCR | 1.36x | 1.55x | 1.58x | 1.43x | |||||||
| NOI DY | 8.7% | 10.3% | 10.5% | 10.4% | |||||||
| NCF DY | 8.7% | 10.3% | 10.5% | 9.5% | |||||||
Appraisal. As of the appraisal valuation date of November 1, 2013, the Hotel Felix Chicago Property had an “as-is” appraised value of $68,600,000.
Environmental Matters. According to the Phase I environmental site assessment dated November 12, 2013, there was no evidence of any recognized environmental conditions at the Hotel Felix Chicago Property.
Market Overview and Competition. The Hotel Felix Chicago Property is located in downtown Chicago, Illinois proximate to Michigan Avenue, at the southwest corner of West Huron Street and North Clark Street. The Hotel Felix Chicago Property is located five blocks west of Michigan Avenue, also referred to as the Magnificent Mile, known for its mixture of upscale department stores, restaurants, high-end retailers and office buildings. The Hotel Felix Chicago Property also benefits from the Shedd Aquarium, the largest indoor aquarium in the world, Millennium Park, Pritzker Pavilion, the Chicago Children’s Museum, as well as two Major League Baseball teams, the Cubs and White Sox. The Hotel Felix Chicago Property also benefits from Navy Pier, a 3,330 foot-long pier located along Lake Michigan. Navy Pier has a 15-story Ferris wheel, IMAX Theatre, many forms of live entertainment as well as restaurants, shopping, dining cruises and boat tours. According to the appraisal, the Chicago area is home to more than two dozen Fortune 500 companies, including Boeing, Walgreen Company, Allstate Corporation, Kraft Foods Incorporated, McDonald’s Corporation, Abbott Laboratories and Exelon. The Hotel Felix Property benefits from McCormick Place, the largest convention center in the United States, with a total of 2.6 million square feet of exhibition space, which in 2012 hosted 110 events and attracted more than 2.2 million visitors. The Hotel Felix Chicago is located less than 20 miles southeast of the O’Hare International Airport, off Interstate 90 and less than 15 miles northeast of Midway Airport, off Interstate 55. O’Hare International Airport and Midway Airport recorded more than 66.7 million and 19.5 million passengers in 2012, respectively.
THE INFORMATION IN THIS STRUCTURAL AND COLLATERAL TERM SHEET IS NOT COMPLETE AND MAY BE AMENDED PRIOR TO THE TIME OF SALE. THIS TERM SHEET IS NOT AN OFFER TO SELL THESE SECURITIES AND IT IS NOT A SOLICITATION OF AN OFFER TO BUY THESE SECURITIES IN ANY JURISDICTION WHERE THE OFFER OR SALE IS NOT PERMITTED.
71
| HOTEL FELIX CHICAGO |
The following table presents certain information relating to the Hotel Felix Chicago Property’s competitive set:
Subject and Market Historical Occupancy, ADR and RevPAR(1)
Competitive Set | Hotel Felix Chicago | Penetration Factor | |||||||||||||||||
Year | Occupancy | ADR | RevPAR | Occupancy | ADR | RevPAR | Occupancy | ADR | RevPAR | ||||||||||
| 9/31/2013 TTM | 79.7% | $170.43 | $135.77 | 88.9% | $136.05 | $121.02 | 111.7% | 79.8% | 89.1% | ||||||||||
| 9/31/2012 TTM | 77.1% | $161.45 | $124.54 | 86.9% | $131.54 | $114.35 | 112.7% | 81.5% | 91.8% | ||||||||||
| 9/31/2011 TTM | 72.4% | $155.50 | $112.63 | 87.3% | $122.21 | $106.71 | 120.6% | 78.6% | 94.7% | ||||||||||
| (1) | Information obtained from a third party hospitality report dated October 17, 2013. According to such third party hospitality report, the competitive set includes the following hotels: MileNorth, A Chicago Hotel, The Allerton Chicago, The Talbott Hotel, Amalfi Hotel Chicago and Dana Hotel. |
The Borrowers. The borrowers are HCP Oxford OBG Wacker Property Company, LLC and HCP Oxford OBG Felix Sub-Tenant, LLC, each a Delaware limited liability company and each a single purpose entity with two independent managers. Legal counsel to the borrowers delivered a non-consolidation opinion in connection with the origination of the Hotel Felix Chicago Mortgage Loan. Edward J. Doherty, John W. Rutledge, Roger G. Hill II and the John W. Rutledge Revocable Trust are the guarantors of certain nonrecourse carveouts under the Hotel Felix Chicago Mortgage Loan, provided that the John W. Rutledge Revocable Trust shall have no obligations or liabilities under the guaranty unless and until the death of John W. Rutledge.
The Sponsor. The sponsor is Oxford Capital Group, LLC, which is headquartered in Chicago and has been run by John W. Rutledge since 1994. The sponsor has participated and developed approximately $2.5 billion of primarily hotel assets in over 12,000 rooms since its inception.
Escrows. The loan documents provide for upfront escrows at closing in the amount of $127,095 for real estate taxes, $53,719 for insurance and $35,230 for FF&E. The loan documents provide for ongoing monthly escrows in the amount of $21,183 for real estate taxes, $7,674 for insurance and $35,230 for FF&E.
Lockbox and Cash Management. The Hotel Felix Chicago Mortgage Loan requires that a lender-controlled lockbox account be established at closing. All tenants of the Hotel Felix Chicago Property and all credit card companies servicing the Hotel Felix Chicago Property are directed to deposit income received from the Hotel Felix Chicago Property directly into the lockbox account. Prior to the occurrence of a Cash Management Period (as defined below), all funds on deposit in the lockbox account are disbursed to the borrowers. During a Cash Management Period, all funds on deposit in the lockbox are swept to a lender-controlled cash management account each business day.
A “Cash Management Period” will commence upon notice from the lender to the cash management bank of: (i) the maturity date, (ii) the occurrence and continuance of an event of default under the loan agreement or (iii) a debt service coverage ratio of less than 1.25x at the end of any calendar quarter. A Cash Management Period will end upon notice from the lender to the cash management bank that the sweeping of funds into the deposit account may cease, which notice the lender will only be required to give if (A) with respect to the matters described in clause (ii) above, such event of default has been cured and no other event of default has occurred and is continuing or (B) with respect to the matter described in clause (iii) above, the debt service coverage ratio being at least 1.25x for two consecutive calendar quarters.
Property Management. The Hotel Felix Chicago Property is managed by an affiliate of the borrowers.
Assumption. The borrowers have the right to transfer the Hotel Felix Chicago Property provided that certain conditions are satisfied, including (i) no event of default has occurred and is continuing; (ii) the lender reasonably determined that the proposed transferee and guarantor satisfy the lender’s credit review and underwriting standards, taking into consideration transferee experience, financial strength and general business standing; and (iii) the lender has received confirmation from DBRS, Fitch and Moody’s and that such assumption will not result in a downgrade, withdrawal or qualification of the respective ratings assigned to the Series 2013-C18 Certificates.
Partial Release. Not permitted.
Real Estate Substitution. Not permitted.
Subordinate and Mezzanine Indebtedness. The borrowers have the right to incur mezzanine financing subject to satisfaction of certain conditions, including: (i) no event of default has occurred and is continuing; (ii) the execution of an intercreditor agreement in form and substance reasonably acceptable to the lender; (iii) the loan-to-value ratio including all debt is not greater than 80%; (iv) the amortizing debt service coverage ratio including all debt is not less than 1.20x; (v) the debt yield including all debt is not less than 8.5%; and (vi) receipt of rating agency confirmation from DBRS, Fitch and Moody’s that the mezzanine financing will not result in a downgrade, withdrawal or qualification of the respective ratings assigned to the Series 2013-C18 Certificates.
Ground Lease. None.
Terrorism Insurance. The loan documents require that the “all risk” insurance policy required to be maintained by the borrowers provide coverage for terrorism in an amount equal to the full replacement cost of the Hotel Felix Chicago Property, as well as business interruption insurance covering no less than the 18-month period following the occurrence of a casualty event, together with a six-month extended period of indemnity.
THE INFORMATION IN THIS STRUCTURAL AND COLLATERAL TERM SHEET IS NOT COMPLETE AND MAY BE AMENDED PRIOR TO THE TIME OF SALE. THIS TERM SHEET IS NOT AN OFFER TO SELL THESE SECURITIES AND IT IS NOT A SOLICITATION OF AN OFFER TO BUY THESE SECURITIES IN ANY JURISDICTION WHERE THE OFFER OR SALE IS NOT PERMITTED.
72
| HOTEL FELIX CHICAGO |
Historical Tax Credits. The Hotel Felix Chicago Property was renovated in part through the use of credits obtained under the Historic Preservation Tax Incentives Program. HCP Oxford OBG Wacker Property Company, LLC entered into a master lease (the “Master Lease”) with HCP Oxford OBG Felix Master Tenant, LLC (the “Tax Credit Entity”) which in turn entered into a master sublease (the “Master Sublease”) with HCP Oxford OBG Felix Sub-Tenant, LLC to create a “credit pass-through” structure to allow U.S. Bancorp Community Development Corporation (“Tax Credit Investor”) to invest in the Hotel Felix Chicago Property through its ownership of equity interests in the Tax Credit Entity, which is managed by HCP Oxford OBG Felix Manager, LLC (“Tax Credit Manager”), an affiliate of the borrowers, and to take advantage of certain tax credits obtained through the approved renovation of the Hotel Felix Chicago Property. Tax Credit Investor has the right to exercise a put option commencing on or about September 20, 2014, whereby it will have the option to require sponsor to buy Tax Credit Investor’s equity investment in the Tax Credit Entity for an amount equal to approximately $1,239,724 (the “Put Option Price”), and the lender expects that this option shall be exercised. If Tax Credit Investor does not elect to exercise its put option, the sponsor has the right to exercise a call option commencing on or about March 20, 2015, pursuant to which the sponsor shall have the right to buy Tax Credit Investor’s equity investment in the Tax Credit Entity for the fair market value of such equity interest. Sponsor’s failure to either satisfy their obligations under the put option or to exercise the call option, as applicable, triggers recourse liability under the Hotel Felix Chicago Loan to the guarantors thereunder in the amount of the Put Option Price. Following the borrowers’ successful completion of the put or call transactions, the borrowers shall have the right to cause the Master Lease and the Master Sublease to be terminated, such that HCP Oxford OBG Wacker Property Company, LLC shall own all right, title and interest in and to the Hotel Felix Chicago Property and shall be in sole possession of the Hotel Felix Chicago Property and shall be the sole operator (on its own behalf or through the property manager) of the hotel located on the Hotel Felix Chicago Property.
THE INFORMATION IN THIS STRUCTURAL AND COLLATERAL TERM SHEET IS NOT COMPLETE AND MAY BE AMENDED PRIOR TO THE TIME OF SALE. THIS TERM SHEET IS NOT AN OFFER TO SELL THESE SECURITIES AND IT IS NOT A SOLICITATION OF AN OFFER TO BUY THESE SECURITIES IN ANY JURISDICTION WHERE THE OFFER OR SALE IS NOT PERMITTED.
73
(THIS PAGE INTENTIONALLY LEFT BLANK)
74
| SULLIVAN CENTER |
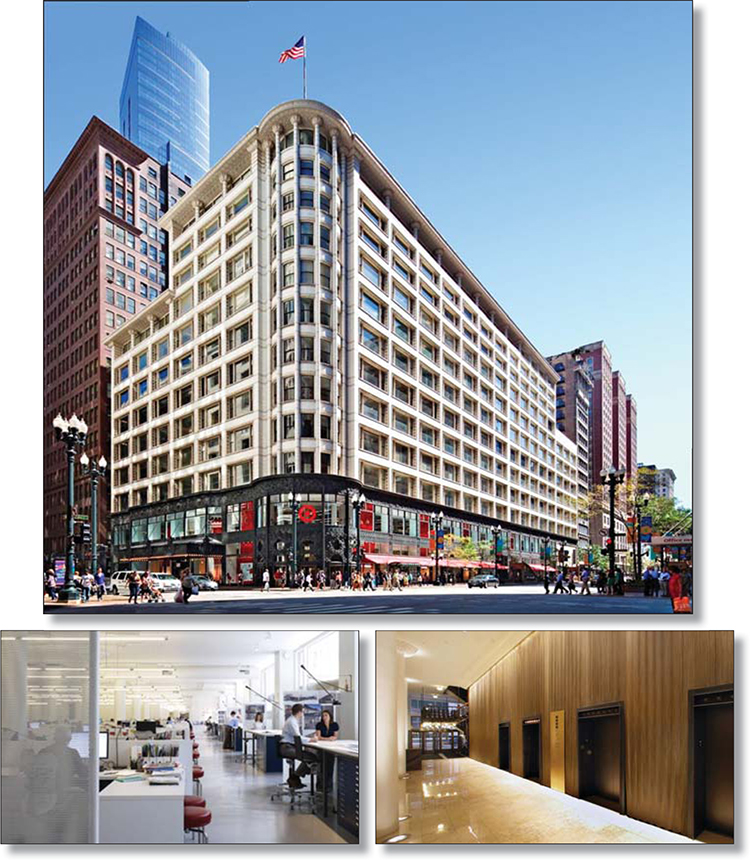
THE INFORMATION IN THIS STRUCTURAL AND COLLATERAL TERM SHEET IS NOT COMPLETE AND MAY BE AMENDED PRIOR TO THE TIME OF SALE. THIS TERM SHEET IS NOT AN OFFER TO SELL THESE SECURITIES AND IT IS NOT A SOLICITATION OF AN OFFER TO BUY THESE SECURITIES IN ANY JURISDICTION WHERE THE OFFER OR SALE IS NOT PERMITTED.
75
| SULLIVAN CENTER |
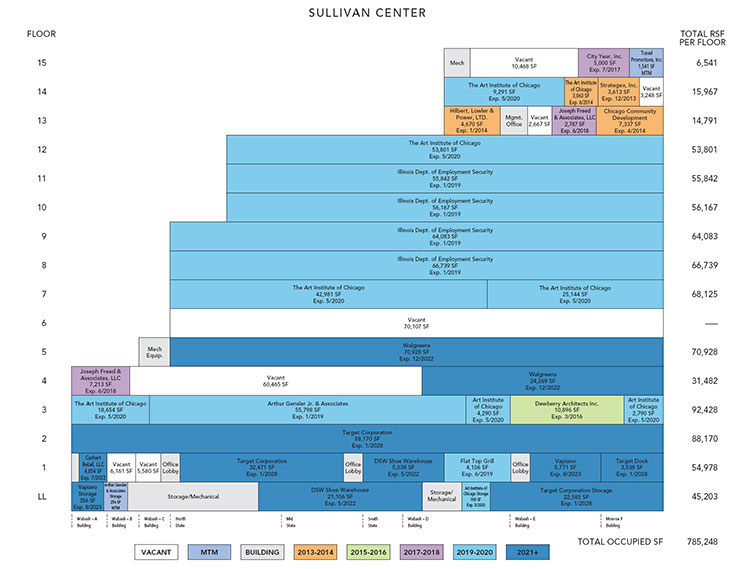
THE INFORMATION IN THIS STRUCTURAL AND COLLATERAL TERM SHEET IS NOT COMPLETE AND MAY BE AMENDED PRIOR TO THE TIME OF SALE. THIS TERM SHEET IS NOT AN OFFER TO SELL THESE SECURITIES AND IT IS NOT A SOLICITATION OF AN OFFER TO BUY THESE SECURITIES IN ANY JURISDICTION WHERE THE OFFER OR SALE IS NOT PERMITTED.
76
| SULLIVAN CENTER |
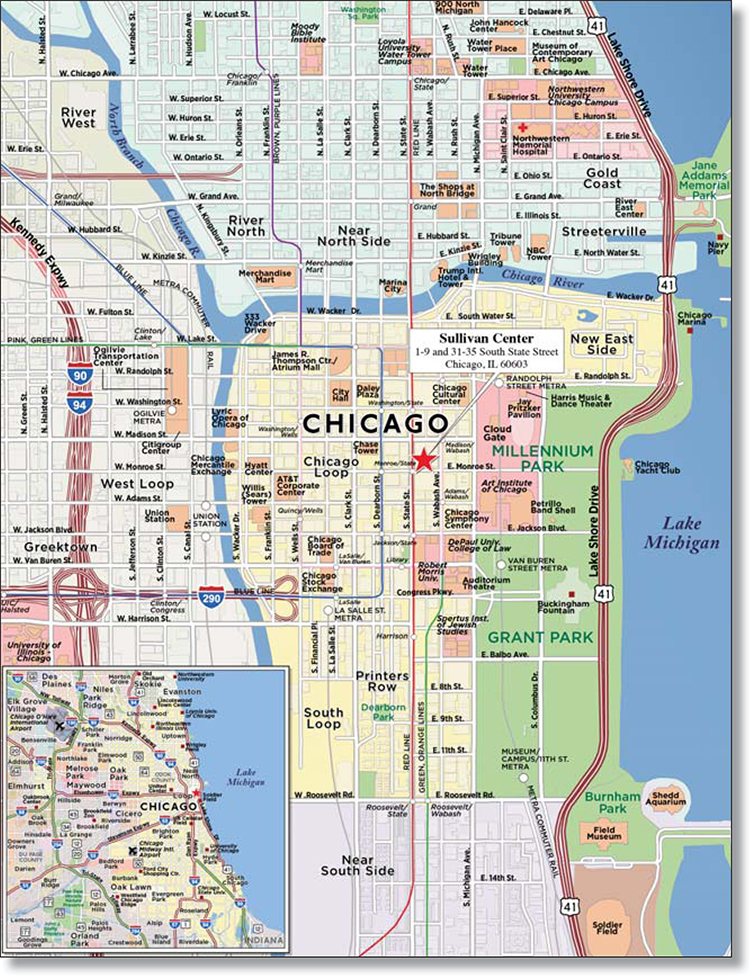
THE INFORMATION IN THIS STRUCTURAL AND COLLATERAL TERM SHEET IS NOT COMPLETE AND MAY BE AMENDED PRIOR TO THE TIME OF SALE. THIS TERM SHEET IS NOT AN OFFER TO SELL THESE SECURITIES AND IT IS NOT A SOLICITATION OF AN OFFER TO BUY THESE SECURITIES IN ANY JURISDICTION WHERE THE OFFER OR SALE IS NOT PERMITTED.
77
| No. 6 – Sullivan Center | ||||||||||
| Loan Information | Property Information | |||||||||
| Mortgage Loan Seller: | UBS Real Estate Securities, Inc. | Single Asset/Portfolio: | Single Asset | |||||||
| Credit Assessment (DBRS/Fitch/Moody’s): | NR/NR/NR | Property Type: | Mixed Use | |||||||
Original Principal Balance(1): | $38,500,000 | Specific Property Type: | Office/Retail | |||||||
Cut-off Date Principal Balance(1): | $38,500,000 | Location: | Chicago, IL | |||||||
| % of Initial Pool Balance: | 3.7% | Size: | 943,944 SF | |||||||
| Loan Purpose: | Refinance | Cut-off Date Principal Balance Per SF(1): | $120.24 | |||||||
| Borrower Name: | One South State PropCo, L.L.C. | Year Built/Renovated: | 1865/2009 | |||||||
| Sponsors: | Joseph Freed and Associates LLC; WRT Realty L.P.; Elad Canada Inc. | Title Vesting: | Fee | |||||||
| Mortgage Rate: | 3.950% | Property Manager: | Joseph Freed and Associates LLC | |||||||
| Note Date: | October 18, 2013 | 3rd Most Recent Occupancy (As of): | 54.2% (12/31/2010) | |||||||
| Anticipated Repayment Date: | NAP | 2nd Most Recent Occupancy (As of)(4): | 57.1% (12/31/2011) | |||||||
| Maturity Date: | November 6, 2018 | Most Recent Occupancy (As of)(4): | 82.8% (12/31/2012) | |||||||
| IO Period: | 60 months | Current Occupancy (As of): | 83.2% (9/1/2013) | |||||||
| Loan Term (Original): | 60 months | |||||||||
| Seasoning: | 1 month | |||||||||
| Amortization Term (Original): | NAP | Underwriting and Financial Information: | ||||||||
| Loan Amortization Type: | Interest-only, Balloon | |||||||||
| Interest Accrual Method: | Actual/360 | 3rd Most Recent NOI (As of)(4): | $7,029,262 (12/31/2011) | |||||||
| Call Protection: | L(25),D(31),O(4) | 2nd Most Recent NOI (As of)(4): | $9,077,937 (12/31/2012) | |||||||
| Lockbox Type: | Hard/Upfront Cash Management | Most Recent NOI (As of)(4): | $12,877,861 (TTM 7/31/2013) | |||||||
Additional Debt(1)(2): | Yes | U/W Revenues: | $23,314,410 | |||||||
Additional Debt Type(1)(2): | Pari Passu and Mezzanine | U/W Expenses: | $9,467,544 | |||||||
| U/W NOI: | $13,846,865 | |||||||||
Escrows and Reserves(3): | U/W NCF: | $12,719,383 | ||||||||
U/W NOI DSCR(1): | 3.05x | |||||||||
Type: | Initial | Monthly | Cap (If Any) | U/W NCF DSCR(5): | 2.80x | |||||
| Taxes | $1,316,573 | $329,143 | NAP | U/W NOI Debt Yield(1): | 12.2% | |||||
| Insurance | $109,624 | $23,831 | NAP | U/W NCF Debt Yield(5): | 11.2% | |||||
| Replacement Reserve | $0 | $19,666 | $1,200,000 | As-Is Appraised Value: | $229,000,000 | |||||
| TI/LC Reserve | $34,041 | $0 | NAP | As-Is Appraisal Valuation Date: | September 4, 2013 | |||||
| Rollover Reserve | $2,000,000 | $0 | NAP | Cut-off Date LTV Ratio(1): | 49.6% | |||||
| Rent Abatement Reserve | $1,197,219 | $0 | NAP | LTV Ratio at Maturity or ARD(1): | 49.6% | |||||
| (1) | The Sullivan Center Loan Combination, totalling $113,500,000, is comprised of two pari passu notes (Notes A-1 and A-2). Note A-2 had an original principal balance of $38,500,000, has an outstanding principal balance as of the Cut-off Date of $38,500,000 and will be contributed to the WFRBS 2013-C18 Trust. Note A-1 had an original principal balance of $75,000,000 and was contributed to the WFRBS 2013-UBS1 Trust. All statistical information related to balances per square foot, loan-to-value ratios, debt service coverage ratios and debt yields are based on the Sullivan Center Loan Combination. |
| (2) | The equity interests in the borrower have been pledged to secure mezzanine indebtedness with a principal balance of $51,716,090 and accrued and unpaid interest of $4,615,978 as of the Cut-off Date (the “Sullivan Center Mezzanine Loan”). See “Subordinate and Mezzanine Indebtedness” section and “Common Control of Equity and Mezzanine Loan” section. |
| (3) | See “Escrows” section. |
| (4) | The increase in NOI from year-end 2011 to the trailing 12 months ended July 31, 2013 and the increase in occupancy from December 31, 2011 to December 31, 2012 is due to new leases being executed in 2012, including Target (15.5% of NRA and 20.3% of total underwritten base rent). |
| (5) | As of the Cut-off Date, taking into account both the Sullivan Center Loan Combination and the Sullivan Center Mezzanine Loan (as defined in the “Subordinate and Mezzanine Indebtedness” section) and based on the current mezzanine loan coupon of 9.000%, the total debt U/W NCF DSCR is 1.31x, the total debt LTV ratio is 74.2%, and the total debt U/W NCF debt yield is 7.5%. |
The Mortgage Loan. The mortgage loan (the “Sullivan Center Loan Combination”) is evidenced by two pari passu notes (“Note A-1” and “Note A-2”) secured by a first mortgage encumbering an office and retail building located in the central business district of Chicago, Illinois (the “Sullivan Center Property”). The Sullivan Center Loan Combination was originated on October 18, 2013 by UBS Real Estate Securities, Inc. The Sullivan Center Loan Combination had an original principal balance of $113,500,000, has an outstanding principal balance as of the Cut-off Date of $113,500,000 and accrues interest at an interest rate of 3.950% per annum. The Sullivan Center Loan Combination had an initial term of 60 months, has a remaining term of 59 months as of the Cut-off Date and requires interest-only payments through the term of the Sullivan Center Loan Combination. The Sullivan Center Loan Combination matures on November 6, 2018. See “Description of the Mortgage Pool – Split Loan Structures – The Sullivan Center Loan Combination”, “Servicing of the Mortgage Loans and Administration of the Trust Fund” and “Servicing of the Mortgage Loans
THE INFORMATION IN THIS STRUCTURAL AND COLLATERAL TERM SHEET IS NOT COMPLETE AND MAY BE AMENDED PRIOR TO THE TIME OF SALE. THIS TERM SHEET IS NOT AN OFFER TO SELL THESE SECURITIES AND IT IS NOT A SOLICITATION OF AN OFFER TO BUY THESE SECURITIES IN ANY JURISDICTION WHERE THE OFFER OR SALE IS NOT PERMITTED.
78
| SULLIVAN CENTER |
and Administration of the Trust Fund – Additional Matters Relating to the Servicing of the Sullivan Center Loan Combination” in the Free Writing Prospectus.
Note A-2, which represents the non-controlling interest in the Sullivan Center Loan Combination, will be contributed to the WFRBS 2013-C18 Trust, had an original principal balance of $38,500,000 and has an outstanding principal balance as of the Cut-off Date of $38,500,000. Note A-1, which had an original principal balance of $75,000,000, was contributed to the WFRBS 2013-UBS1 Trust (the “Sullivan Center Companion Loan”).
Following the lockout period, the borrower has the right to defease the Sullivan Center Loan Combination in whole, but not in part, on any date before August 6, 2018. In addition, the Sullivan Center Loan Combination is prepayable without penalty on or after August 6, 2018.
Sources and Uses(1)
| Sources | Uses | ||||||||
| Original loan amount | $113,500,000 | 97.4% | Loan payoff | $110,567,557 | 94.9 | % | |||
| Sponsor’s new cash contribution | 3,034,501 | 2.6 | Reserves | 4,657,457 | 4.0 | ||||
| Closing costs | 1,309,487 | 1.1 | |||||||
| Total Sources | $116,534,501 | 100.0% | Total Uses | $116,534,501 | 100.0 | % |
| (1) | Excludes mezzanine debt that is under common control with the equity in the Sullivan Center Property. See “Subordinate and Mezzanine Indebtedness” section and “Common Control of Equity and Mezzanine Loan” section. |
The Property. The Sullivan Center Property is comprised of a 15-story, 943,944 square foot, mixed-use, national historic landmark redevelopment located in the central business district of Chicago, Illinois. Originally designed by renowned architect Louis Sullivan and constructed in 1865, the Sullivan Center Property was acquired in 2001 by Joseph Freed and Associates LLC (“JFA”). The Sullivan Center Property was the flagship store of retailer Carson Pirie Scott, who vacated the Sullivan Center Property in 2007. JFA subsequently reconfigured the space into retail and office uses and invested approximately $229.0 million ($243 per square foot) in capital improvements, renovations and soft costs from 2001 to 2011. As a result of this large scale rehabilitation project, the Sullivan Center Property was eligible for historic rehabilitation tax credits; see “Historic Tax Credits” section.
The Sullivan Center Property consists of 175,995 square feet (18.6% of net rentable area) of retail space on the subterranean level and first two floors, 743,852 square feet (78.8% of net rentable area) of office space on floors three to 15, and 24,097 square feet (2.6% of net rentable area) of below-grade storage space. The Sullivan Center Property retail portion includes Target, DSW and Vapiano. Target opened its first City Target store at the Sullivan Center Property in 2012. City Target stores are approximately two-thirds of the size of standard big box Target stores and are designed to attract urban consumers. The City Target store highlights architectural features of the Sullivan Center Property, including the cylindrical rotunda entrance and cast-iron columns, and includes a Pret a Manger coffee and sandwich shop, a pharmacy, groceries, apparel and Chicago-themed merchandise.
Occupying almost a full city block, bordered by State Street, Madison Street, Monroe Street and Wabash Avenue, the Sullivan Center Property is positioned in both size and location to support various office and tenant retail uses. The building offers large floor plates, with the majority of the floors ranging in size from 50,000 to 90,000 square feet. Unique architectural features for which the building is recognized are: the cast iron ornamentation which adorns the first two floors; the large “Chicago windows”; and the cylindrical main entry rotunda which rounds the corner of State and Madison Streets. The Sullivan Center Property achieved the U.S. Green Building LEED Existing Building certification in September 2012. The office space was 80.2% occupied by 12 tenants and the retail space was 93.3% occupied by five tenants; as of September 1, 2013, the Sullivan Center Property was 83.2% leased by 17 tenants.
THE INFORMATION IN THIS STRUCTURAL AND COLLATERAL TERM SHEET IS NOT COMPLETE AND MAY BE AMENDED PRIOR TO THE TIME OF SALE. THIS TERM SHEET IS NOT AN OFFER TO SELL THESE SECURITIES AND IT IS NOT A SOLICITATION OF AN OFFER TO BUY THESE SECURITIES IN ANY JURISDICTION WHERE THE OFFER OR SALE IS NOT PERMITTED.
79
| SULLIVAN CENTER |
The following table presents certain information relating to the tenancy at the Sullivan Center Property:
Major Tenants
| Tenant Name | Credit Rating (Fitch/ Moody’s/ S&P)(1) | Tenant NRSF | % of NRSF | Annual U/W Base Rent PSF | Annual U/W Base Rent | % of Total Annual U/W Base Rent | Lease Expiration Date | |||||||||
| Major Retail Tenants | ||||||||||||||||
| Target Corporation | A-/A2/A+ | 146,764 | 15.5% | $28.48 | $4,179,115 | 20.3% | 1/31/2028 | |||||||||
| DSW | NR/NR/NR | 26,144 | 2.8% | $38.19 | $998,439 | 4.8% | 5/31/2022 | |||||||||
| Total Major Retail Tenants | 172,908 | 18.3% | $29.94 | $5,177,554 | 25.1% | |||||||||||
| Major Office Tenants | ||||||||||||||||
Illinois Department of Employment Security(2) | NR/NR/NR | 242,831 | 25.7% | $24.47 | $5,942,075 | 28.8% | 1/20/2019(3) | |||||||||
| The Art Institute of Chicago | NR/NR/NR | 160,914 | 17.0% | $21.82 | $3,511,411 | 17.0% | 5/31/2020(4) | |||||||||
| Walgreens | NR/Baa1/BBB | 95,197 | 10.1% | $26.82 | $2,553,184 | 12.4% | 12/31/2022(5) | |||||||||
| Arthur Gensler Jr. & Associates | NR/NR/NR | 56,054 | 5.9% | $26.43 | $1,481,719 | 7.2% | 1/31/2019(6) | |||||||||
| Total Major Office Tenants | 554,996 | 58.8% | $24.30 | $13,488,388 | 65.4% | |||||||||||
| Non-Major Tenants | 57,344 | 6.1% | $34.06 | $1,952,851 | 9.5% | |||||||||||
| Occupied Collateral Total | 785,248 | 83.2% | $26.26 | $20,618,793 | 100.0% | |||||||||||
| Vacant Space | 158,696 | 16.8% | ||||||||||||||
| Collateral Total | 943,944 | 100.0% | ||||||||||||||
| (1) | Certain ratings are those of the parent company whether or not the parent guarantees the lease. |
| (2) | The borrower is obligated to complete certain tenant improvements for the Illinois Department of Employment Security not to exceed $1,000,000. If the cost of the tenant improvements is less than $1,000,000, any remaining amount is to be applied as a rent abatement. At closing, $1,197,219 was escrowed for any rent abatements due to the Illinois Department of Employment Security. |
| (3) | The Illinois Department of Employment Security has the right to terminate its lease at any time without penalty if the Illinois General Assembly fails to make an appropriation to pay the rent or other obligations of the tenant under the lease. The obligations of the tenant shall also immediately terminate if any federal funding source upon which the tenant is dependent to pay rent or other charges under the lease fails to appropriate or otherwise make available the funds required. |
| (4) | The Art Institute of Chicago has the right to terminate its lease on its entire premises or on certain portions of its premises with 365 days’ notice and payment of a termination fee equal to the unamortized portion of tenant improvements. A 3,063 square foot portion (1.9% net rentable area) of the Art Institute of Chicago leased premises expires on June 30, 2014. |
| (5) | Walgreens has the right to terminate its lease on the last day of the 60th full calendar month (December 31, 2014) and the last day of the 90th full calendar month (June 30, 2017) following the rent start date with ten months’ notice and payment of a termination fee equal to the unamortized portion of tenant improvements. |
| (6) | Arthur Gensler Jr. & Associates has a one-time right to terminate its lease on July 31, 2015, with notice provided no later than February 1, 2014 and payment of a termination fee equal to the unamortized portion of tenant improvements, leasing commissions and rent allowances. |
The following table presents certain information relating to the lease rollover schedule at the Sullivan Center Property:
Lease Expiration Schedule(1)(2)
Year Ending December 31, | No. of Leases Expiring | Expiring NRSF | % of Total NRSF | Cumulative Expiring NRSF | Cumulative % of Total NRSF | Annual U/W Base Rent | Annual U/W Base Rent PSF(3) | |
| MTM | 2 | 1,797 | 0.2% | 1,797 | 0.2% | $37,272 | $20.74 | |
| 2013 | 1 | 3,613 | 0.4% | 5,410 | 0.6% | $76,921 | $21.29 | |
| 2014 | 3 | 15,070 | 1.6% | 20,480 | 2.2% | $307,822 | $20.43 | |
| 2015 | 0 | 0 | 0.0% | 20,480 | 2.2% | $0 | $0.00 | |
| 2016 | 2 | 10,896 | 1.2% | 31,376 | 3.3% | $305,088 | $28.00 | |
| 2017 | 1 | 5,000 | 0.5% | 36,376 | 3.9% | $134,300 | $26.86 | |
| 2018 | 2 | 10,000 | 1.1% | 46,376 | 4.9% | $260,000 | $26.00 | |
| 2019 | 3 | 302,735 | 32.1% | 349,111 | 37.0% | $7,605,574 | $25.12 | |
| 2020 | 10 | 157,851 | 16.7% | 506,962 | 53.7% | $3,446,323 | $21.83 | |
| 2021 | 0 | 0 | 0.0% | 506,962 | 53.7% | $0 | $0.00 | |
| 2022 | 7 | 125,395 | 13.3% | 632,357 | 67.0% | $3,785,863 | $30.19 | |
| 2023 | 2 | 6,127 | 0.6% | 638,484 | 67.6% | $480,516 | $78.43 | |
| Thereafter | 2 | 146,764 | 15.5% | 785,248 | 83.2% | $4,179,115 | $28.48 | |
| Vacant | 0 | 158,696 | 16.8% | 943,944 | 100.0% | $0 | $0.00 | |
| Total/Weighted Average | 35 | 943,944 | 100.0% | $20,618,793 | $26.26 |
| (1) | Information obtained from the underwritten rent roll. |
| (2) | Certain tenants may have lease termination or contraction options that are exercisable prior to the originally stated expiration date of the subject lease and that are not considered in the Lease Expiration Schedule. |
| (3) | Weighted Average Annual U/W Base Rent PSF excludes vacant space. |
THE INFORMATION IN THIS STRUCTURAL AND COLLATERAL TERM SHEET IS NOT COMPLETE AND MAY BE AMENDED PRIOR TO THE TIME OF SALE. THIS TERM SHEET IS NOT AN OFFER TO SELL THESE SECURITIES AND IT IS NOT A SOLICITATION OF AN OFFER TO BUY THESE SECURITIES IN ANY JURISDICTION WHERE THE OFFER OR SALE IS NOT PERMITTED.
80
| SULLIVAN CENTER |
The following table presents historical occupancy percentages at the Sullivan Center Property:
Historical Occupancy
12/31/2008(1)(2) | 12/31/2009(2) | 12/31/2010(2) | 12/31/2011(2) | 12/31/2012(2) | 9/1/2013 | |||||
| 48.5% | 49.7% | 54.2% | 57.1% | 82.8% | 83.2% |
| (1) | The Sullivan Center Property was 100% occupied by Carson Pirie Scott until 2007. Following Carson Pirie Scott’s vacating the Sullivan Center Property, JFA invested approximately $229.0 million ($243 per square foot) to renovate and re-tenant the building, which subsequently led to an increase in occupancy. |
(2) | Information obtained from the borrower. |
Operating History and Underwritten Net Cash Flow. The following table presents certain information relating to the historical operating performance and the Underwritten Net Cash Flow at the Sullivan Center Property:
Cash Flow Analysis
| 2011 | 2012 | TTM 7/31/2013 | U/W | U/W $ per SF | |||||||
| Base Rent | $14,042,440 | $16,361,646 | $19,777,989 | $20,445,039 | $21.66 | ||||||
| Rent Steps | 0 | 0 | 0 | 390,305 | 0.41 | ||||||
| Grossed Up Vacant Space | 0 | 0 | 0 | 4,453,423 | 4.72 | ||||||
| Total Reimbursables | 412,566 | 1,360,888 | 2,156,351 | 2,372,065 | 2.51 | ||||||
| Other Income | 0 | 0 | 0 | 107,000 | 0.11 | ||||||
| Less Vacancy & Credit Loss | (146,280) | (2,811) | (2,811) | (4,453,423)(1) | (4.72) | ||||||
| Effective Gross Income | $14,308,727 | $17,719,723 | $21,931,529 | $23,314,410 | $24.70 | ||||||
| Total Operating Expenses | $7,279,465 | $8,641,786 | $9,053,668 | $9,467,544 | $10.03 | ||||||
| Net Operating Income | $7,029,262 | $9,077,937 | $12,877,861(2) | $13,846,865(2) | $14.67 | ||||||
| TI/LC | 0 | 0 | 0 | 891,496 | 0.94 | ||||||
| Capital Expenditures | 0 | 0 | 0 | 235,986 | 0.25 | ||||||
| Net Cash Flow | $7,029,262 | $9,077,937 | $12,877,861 | $12,719,383 | $13.47 | ||||||
| NOI DSCR | 1.55x | 2.00x | 2.83x | 3.05x | |||||||
| NCF DSCR | 1.55x | 2.00x | 2.83x | 2.80x | |||||||
| NOI DY | 6.2% | 8.0% | 11.3% | 12.2% | |||||||
| NCF DY | 6.2% | 8.0% | 11.3% | 11.2% |
| (1) | The underwritten economic vacancy is 16.1%. The Sullivan Center Property was 83.2% physically occupied as of September 1, 2013. |
| (2) | The increase in NOI from year-end 2011 to the trailing 12 months ended July 31, 2013 and the increase in occupancy from December 31, 2011 to December 31, 2012 is due to new leases being executed in 2012, including Target (15.5% of net rentable area and 20.3% of total underwritten base rent). |
Appraisal. As of the appraisal valuation date of September 4, 2013, the Sullivan Center Property had an “as-is” appraised value of $229,000,000.
Environmental Matters. According to a Phase I environmental site assessment dated October 10, 2013, there was evidence of a historical recognized environmental condition (“HREC”) at the Sullivan Center Property related to underground storage tanks. Leaking underground storage tank (“LUST”) incidents from 1993 and 2000 were identified at the Sullivan Center Property. The results of prior analytical sampling identified concentrations of petroleum compounds above soil remediation objectives. To address the impact that remains in place, restrictions consisting of the use of the building as an engineered barrier, construction worker caution, and commercial/industrial use were used to eliminate exposure routes. No further remediation letters were issued for the LUST incidents on November 21, 2006. Sampling conducted near the 18,000-gallon tank contained in an underground storage tank vault did not indicate that a release had occurred. The tank was abandoned-in-place on November 30, 2010. Based on available information, it was the environmental firm’s opinion that this represents an HREC. In addition, polychlorinated biphenyl compounds (“PCBs”) containing equipment and fluids are known to have been present at the Sullivan Center Property. However, a majority of mechanical equipment at the Sullivan Center Property has been replaced since 1978 and non-PCB containing hydraulic elevators and escalators were recently installed in connection with redevelopment of the retail spaces. Based on available information, it was the environmental firm’s opinion that this represents a de minimis condition.
Market Overview and Competition. The Sullivan Center Property is located in Chicago, Illinois. Chicago is a major Great Lakes port and is considered the commercial, financial, industrial, and cultural center of the Midwest. According to a market research report, the Chicago metropolitan statistical area had an estimated 2013 population of 9.6 million and average household income of $79,260. The unemployment rate for the Chicago metropolitan statistical area was 9.4% as of March 2013. The Sullivan Center Property is located in the Chicago central business district (“CBD”) within an area known as the loop (the “Loop”), which can be roughly defined as the Chicago River to the north and west, Roosevelt Road to the south and Michigan Avenue to the east. The Loop and surrounding area is an urban mixed-use community featuring office, government, entertainment, shopping, residential and hotels. The Loop comprises the second largest central business district in the United States after New York. The Sullivan Center Property is strategically located along State Street and Wabash Avenue, in the heart of the State Street retail corridor and in close proximity to several educational institutions, such as The Art Institute of Chicago, which also leases space at the Sullivan Center Property, John Marshall Law School, Columbia College, Roosevelt University, DePaul University, and Loyola University, which serve
THE INFORMATION IN THIS STRUCTURAL AND COLLATERAL TERM SHEET IS NOT COMPLETE AND MAY BE AMENDED PRIOR TO THE TIME OF SALE. THIS TERM SHEET IS NOT AN OFFER TO SELL THESE SECURITIES AND IT IS NOT A SOLICITATION OF AN OFFER TO BUY THESE SECURITIES IN ANY JURISDICTION WHERE THE OFFER OR SALE IS NOT PERMITTED.
81
| SULLIVAN CENTER |
as key tenant demand drivers. The State Street retail corridor is one of Chicago’s premier destination-oriented retail shopping districts and features a historic twelve-story Macy’s flagship store as well as anchors Sears, TJ Maxx, Old Navy, Nordstrom Rack, H&M and Forever 21. Small store occupancy in the State Street retail corridor is in excess of 90%. The immediate neighborhood is comprised of a variety of uses including hotels, retail/commercial, and office with ground-level retail establishments, parking garages, and mixed-use buildings. According to a market research report the estimated 2013 population within a one-, three-, and five-mile radius of the Sullivan Center Property is 70,575, 304,657, and 737,005, respectively, and the average income is $117,937, $105,353, and $89,757, respectively.
According to the appraisal, the Sullivan Center Property is located in the East Loop office submarket. As of the second quarter 2013, the East Loop office submarket consisted of 21.1 million square feet of office space with an overall vacancy of 14.3% and asking rental rates of $31.79 per square foot gross. The Sullivan Center Property is also located within the State Street retail submarket. According to the appraisal, ground-level retail rents along State Street range from $50.00 to $100.00 triple net per square foot and ground level vacancy is approximately 5.0%.
The following table presents certain information relating to comparable office properties for the Sullivan Center Property:
Office Competitive Set(1)
Sullivan Center (Subject) | 1 North State Street | 1 North Dearborn | Merchandise Mart-Office | |
| Market | Chicago, IL | Chicago, IL | Chicago, IL | Chicago, IL |
| Distance from Subject | -- | 0.1 miles | 0.2 miles | 1.0 mile |
| Property Subtype | CBD Office | CBD Office | CBD Office | CBD Office |
| Year Built/Renovated | 1865/2009 | 1912/NAV | 1905/NAV | 1929/NAV |
| Total Office GLA | 743,852 SF | 713,423 SF | 884,004 SF | 4,000,000 SF |
| Total Office Occupancy | 80% | 79% | 89% | 98% |
| (1) | Information obtained from the borrower’s rent roll and the appraisal. |
The following table presents certain information relating to comparable retail properties for the Sullivan Center Property:
Retail Competitive Set(1)
Sullivan Center (Subject) | 1 North State Street | Palmer House Retail | Block 37 | |
| Market | Chicago, IL | Chicago, IL | Chicago, IL | Chicago, IL |
| Distance from Subject | -- | 0.1 miles | 0.0 miles | 0.1 miles |
| Property Subtype | Retail (3 levels) | Multi-level Urban Retail | Ground level Retail | Ground level Retail |
| Year Built/Renovated | 1865/2009 | 1907/NAV | 1925/NAV | 2009/NAV |
| Anchors | Target, DSW | None | Agaci | Anthropolgie, Puma |
| Total Retail GLA | 175,995 SF | 151,861 SF | 52,747 SF | 275,365 SF |
| Total Retail Occupancy | 93% | 100% | 84% | 67% |
| (1) | Information obtained from the borrower’s rent roll and the appraisal. |
Historic Tax Credits. In 2001, The Sherwin-Williams Company (the “HTC Investor Member”) was admitted as a member of One South State Street, L.L.C., the borrower’s sole member (the “Sole Member”), to monetize certain historic rehabilitation tax credits (the “Historic Tax Credits”). As of October 18, 2013, the aggregate amount of the Historic Tax Credits claimed by the HTC Investor Member was $50,491,154. The HTC Investor Member is entitled to a 3.0% per annum preferred return on its capital contributions to the Sole Member, but neither the lender nor any purchaser at a foreclosure sale will be responsible for the payment of such preferred return.
The Historic Tax Credits are subject to recapture in the event of a “disposition” prior to January 1, 2018 (the “HTC Recapture Period Expiration Date”). A “disposition” will occur upon, among other things, a sale or transfer of the Sullivan Center Property (including a transfer upon a foreclosure of the mortgage securing the Sullivan Center Loan Combination), certain equity transfers of direct or indirect interests in the Sullivan Center Property, a condemnation of the Sullivan Center Property or a destruction of the Sullivan Center Property due to casualty. Upon such “disposition” prior to January 1, 2018, the tax liability of the HTC Investor Member will increase by an amount equal to the original aggregate amount of the Historic Tax Credit, multiplied by the applicable recapture percentage (100% during 2013 and decreases by 20% each year).
In the event the HTC Investor Member is unable to claim or recognize the Historic Tax Credits due to the occurrence of a recapture event, One South State Street Investors, L.L.C. (the “Freed Equity Member”), an affiliate of JFA that is controlled by Laurance H. Freed, and the Sole Member are obligated to make payments to the HTC Investor Member in an amount equal to the recaptured Historic Tax Credits. Neither the lender nor any purchaser at a foreclosure sale, however, will be subject to any such obligation. The “loss” of the Historic Tax Credits would likewise have no effect on property taxes. See “Description of the Mortgage Pool – Split Loan Structures – The Sullivan Center Loan Combination” in the Free Writing Prospectus.
The Borrower. The borrower is One South State PropCo, L.L.C., a Delaware limited liability company and a single purpose entity with two independent directors. Legal counsel to the borrower delivered a non-consolidation opinion in connection with the origination of the Sullivan Center Loan Combination. WRT Realty L.P. (“WRT”) and Elad Canada Inc. (“Elad”) are the guarantors of certain nonrecourse carveouts under the Sullivan Center Loan Combination.
THE INFORMATION IN THIS STRUCTURAL AND COLLATERAL TERM SHEET IS NOT COMPLETE AND MAY BE AMENDED PRIOR TO THE TIME OF SALE. THIS TERM SHEET IS NOT AN OFFER TO SELL THESE SECURITIES AND IT IS NOT A SOLICITATION OF AN OFFER TO BUY THESE SECURITIES IN ANY JURISDICTION WHERE THE OFFER OR SALE IS NOT PERMITTED.
82
| SULLIVAN CENTER |
One South State Street, L.L.C. is the sole member of the borrower and the members of the Sole Member are WRT-Elad One South State Equity L.P., a 50-50 joint venture between WRT and Elad (the “WRT-Elad Equity Member”), the Freed Equity Member and the HTC Investor Member. Currently, the HTC Investor Member holds a 99% membership interest in the Sole Member and the Freed Equity Member holds the remaining 1% membership interest in the Sole Member. The WRT-Elad Equity Member does not hold any current ownership interest in the Sole Member; however, the WRT-Elad Equity Member possesses extensive, currently exercisable control rights over the Sole Member and the borrower (including the right to approve any lease, any agreement involving more than $15,000 and a broad range of other ordinary and extraordinary operational and non-operational matters, as well as the right to cause any such action or decision to be taken or adopted by the Sole Member or the borrower). In addition, in the absence of any transfers permitted by the loan documents, on the HTC Recapture Period Expiration Date, the WRT-Elad Equity Member will acquire a majority ownership interest in the Sole Member as described in the “Reallocation of Membership Interests on Recapture Period Expiration Date” section. By contrast, notwithstanding its 99% membership interest in the Sole Member, the HTC Investor Member’s primary interest in the Sullivan Center Property consists of its right to claim and recognize the Historic Tax Credits and, accordingly, the HTC Investor Member has no material control rights over the Sole Member (other than with respect to matters that could trigger a recapture of the Historic Tax Credits) and does not participate in the operation of the Sullivan Center Property. Reflective of its limited involvement as an investor of historic rehabilitation tax credits, on the HTC Recapture Period Expiration Date, the HTC Investor Member’s ownership interest in the Sole Member will decrease from its current 99% interest to a de minimis 0.01% interest as described in “Reallocation of Membership Interests on Recapture Period Expiration Date” below.
A number of financings of properties owned by certain affiliates of Laurance H. Freed and JFA, as well as certain affiliates of WRT, have been subject to foreclosures, deeds-in-lieu of foreclosure and discounted pay-offs in the recent past. See “Description of the Mortgage Pool – Default History, Bankruptcy Issues and Other Proceedings” in the Free Writing Prospectus. In addition, in connection with a guarantee relating to one such financing, Laurance H. Freed was accused of forgery by Debra Ruderman, his sibling. Further, Amnon Safran, the incoming CEO of Elad, has been indicted in an Israeli court (with other defendants, including a former prime minister of Israel) in connection with a case alleging bribery of officials to allow developers to build more apartments than were originally permitted in the “Holyland” development. See “Description of the Mortgage Pool – Litigation Considerations” in the Free Writing Prospectus.
The Sponsor. WRT and Elad are the sponsors on the Sullivan Center Loan Combination. WRT is the wholly-owned operating partnership of Winthrop Realty Trust (NYSE: FUR), a real estate investment trust engaged in owning and operating real property and real estate related assets through ownership of assets, loans secured by real property and investments in securities of other publicly traded and privately owned real estate companies. As of December 31, 2012, WRT’s portfolio consisted of 23 commercial properties encompassing over 3.5 million square feet and three multifamily properties totaling 784 units. Elad is a Toronto-based company which owns over 2.5 million square feet of office, retail, and industrial space in the U.S. and Canada. Elad develops condominium and multifamily properties in the Toronto and Montreal metro areas.
Reallocation of Membership Interests on HTC Recapture Period Expiration Date. Currently, the HTC Investor Member holds a 99% membership interest in the Sole Member and the Freed Equity Member holds a 1% membership interest in the Sole Member. The WRT-Elad Equity Member has extensive, currently exercisable control rights over the Sole Member, but no present ownership interest in the Sole Member. On the HTC Recapture Period Expiration Date, the HTC Investor Member’s membership interest will decrease to 0.01%, the Freed Equity Member’s membership interest will increase to 23.99%, and the WRT-Elad Equity Member’s membership interest will increase to 76.0%.
Subordinate and Mezzanine Indebtedness. In connection with their investment in the Sullivan Center Property on February 3, 2012, WRT and Elad structured such investment to avoid triggering a recapture of then outstanding Historic Tax Credits. Accordingly, the WRT-Elad Equity Member acquired no current membership interest in the Sole Member – instead it acquired extensive, currently exercisable control rights over the Sole Member and a future membership interest in the Sole Member that vests on the HTC Recapture Period Expiration Date. Concurrently, WRT One South State Lender, L.P. (f/k/a WRT-Elad One South State Lender, L.P. and, prior to the sale by Elad of its interest in such entity to WRT on or about August 21, 2013, a second joint venture between WRT and Elad) (the “WRT Mezzanine Lender”), provided a much needed capital infusion to pay for, among other things, tenant improvements required under Target’s lease pursuant to the “Sullivan Center Mezzanine Loan” in favor of the Sole Member that is secured by a pledge of 100% of the equity interests in the borrower.
The interest rate under the Sullivan Center Mezzanine Loan is 15.0% per annum, of which 9.0% per annum must be paid when due and 6.0% per annum may accrue in the event of insufficient available cash flows to service the debt. As of October 18, 2013, the Sullivan Center Mezzanine Loan had an outstanding principal balance of $51,716,090 and accrued and unpaid interest in an aggregate amount of $4,615,978, all of which amounts were owed to the WRT Mezzanine Lender under its promissory note. Although New Heights Sullivan LLC, an affiliate of JFA and the Freed Equity Member (the “Freed Mezzanine Lender” and, collectively with the WRT Mezzanine Lender, the “Mezzanine Lender”), is also a lender under the Sullivan Center Mezzanine Loan, as of October 18, 2013, the Freed Mezzanine Lender had not made any advances under the Sullivan Center Mezzanine Loan and no amounts were owed to the Freed Mezzanine Lender under its promissory note.
The WRT Mezzanine Lender is currently the agent for the Mezzanine Lender (the “Agent”) and, in such capacity, controls the actions of the Mezzanine Lender under the Sullivan Center Mezzanine Loan. The WRT Mezzanine Lender is wholly-owned and controlled by WRT. However, in connection with the sale of its 50% interest in the WRT Mezzanine Lender to WRT on or about August 21, 2013, an affiliate of Elad retained the right to re-acquire such 50% interest pursuant to an option agreement (the “Elad Mezzanine Loan Purchase Option”).
In the event the Sullivan Center Property generates insufficient cash flows in the future to satisfy all required payments under the Sullivan Center Loan Combination or to support property operations, the Agent or the Mezzanine Lender may make additional advances under the Sullivan Center Mezzanine Loan. Such future funding mechanism affords WRT, JFA and, upon exercise of the Elad Mezzanine Loan Purchase Option, Elad with the means to support the Sullivan Center Property with additional capital infusions when needed. Such mechanism is, as a practical matter, necessary prior to the HTC Recapture Period Expiration Date and the
THE INFORMATION IN THIS STRUCTURAL AND COLLATERAL TERM SHEET IS NOT COMPLETE AND MAY BE AMENDED PRIOR TO THE TIME OF SALE. THIS TERM SHEET IS NOT AN OFFER TO SELL THESE SECURITIES AND IT IS NOT A SOLICITATION OF AN OFFER TO BUY THESE SECURITIES IN ANY JURISDICTION WHERE THE OFFER OR SALE IS NOT PERMITTED.
83
| SULLIVAN CENTER |
reallocation of membership interests in the Sole Member as described in the “Reallocation of Membership Interests on Recapture Period Expiration Date” section due to the HTC Investor Member’s limited interest in the Sullivan Center Property notwithstanding its 99% membership interest in the Sole Member and the unavailability of ratable contributions by the holders of current ownership interests in the Sole Member as a means for such support.
The Sullivan Center intercreditor agreement fully subordinates the Agent’s and the Mezzanine Lender’s rights to the lender’s rights under the Sullivan Center Loan Combination, and does not provide the Agent or the Mezzanine Lender with certain material customary mezzanine lender rights. See “Description of the Mortgage Pool – Split Loan Structures – The Sullivan Center Loan Combination” in the Free Writing Prospectus.
Common Control of Equity and Mezzanine Loan. Pursuant to the terms of the loan documents and the intercreditor agreement, for so long as the Sullivan Center Mezzanine Loan remains outstanding, a common control of the borrower and the Sullivan Center Mezzanine Loan is required to be maintained. A breach of such covenant is an event of default under the Sullivan Center Loan Combination and triggers full recourse liability under the recourse carveout guaranty. See “Description of the Mortgage Pool – Split Loan Structures – The Sullivan Center Loan Combination” in the Free Writing Prospectus.
Escrows. At closing of the Sullivan Center Loan Combination, the borrower was also required to fund tenant improvements and leasing commissions reserve in the amount of $2,000,000. Such reserve is subject to a security interest in favor of the lender, but the funds in such reserve are held by the borrower. The loan documents provide for upfront reserves in the amount of: $1,316,573 for real estate taxes; $109,624 for insurance; $34,041 for tenant improvements and leasing commissions; and $1,197,219 for certain rent abatements due to Illinois Department of Employment Security. The loan documents also provide for ongoing monthly reserves in the amount of $329,143 for real estate taxes; $23,831 for insurance; and $19,666 for replacement reserves.
Lockbox and Cash Management. The Sullivan Center Loan Combination requires a lender-controlled lockbox account, which is in place, and that the tenants are directed to deposit all rents into such lockbox account. The loan documents also require that all rents received by the borrower or the property manager be deposited into the lockbox account within one business day after receipt. All funds on deposit in the lockbox account are to be swept into the cash management account (the “Cash Management Account”) controlled by the lender on a daily basis. After application of funds, provided no event of default has occurred and is continuing, the “excess cash flow” will be deposited into the borrower’s operating account on a monthly basis. Upon the occurrence and during the continuation of an event of default the excess cash flow is swept to a cash management account controlled by the lender.
Property Management. The Sullivan Center Property is managed by an affiliate of the borrower.
Assumption. The borrower has the right to transfer the Sullivan Center Property, subject to certain terms and conditions set forth in the loan documents, including, but not limited to: (i) no event of default has occurred and is continuing and no event of default shall occur as a result of such transfer; (ii) the proposed transferee shall be a single purpose entity and its organizational documents shall be reasonably acceptable to the lender; (iii) the transferee’s sponsor shall have a net worth and liquidity reasonably satisfactory to the lender; (iv) the borrower shall have delivered a new non-consolidation opinion reflecting such transfer reasonably acceptable to the lender; (v) if required by the lender, a rating agency confirmation from DBRS, Fitch and Moody’s that such transfer will not result in a downgrade, withdrawal or qualification of the respective ratings assigned to the Series 2013-C18 Certificates and similar confirmation with respect to the ratings of any securities backed by the Sullivan Center Companion Loan; and (vi) the Sullivan Center Mezzanine Loan shall have been paid in full.
Partial Release. Not permitted.
Real Estate Substitution. Not permitted.
Terrorism Insurance. The loan documents require that the special form insurance policy required to be maintained by the borrower provides coverage for terrorism in an amount equal to the full replacement cost of the Sullivan Center Property as well as business interruption insurance covering no less than the 18-month period following the occurrence of a casualty event, together with an extended period of indemnity, which shall continue for the lesser of (i) the period of time until income returns to the same level as it was prior to loss and (ii) 12 months.
THE INFORMATION IN THIS STRUCTURAL AND COLLATERAL TERM SHEET IS NOT COMPLETE AND MAY BE AMENDED PRIOR TO THE TIME OF SALE. THIS TERM SHEET IS NOT AN OFFER TO SELL THESE SECURITIES AND IT IS NOT A SOLICITATION OF AN OFFER TO BUY THESE SECURITIES IN ANY JURISDICTION WHERE THE OFFER OR SALE IS NOT PERMITTED.
84
(THIS PAGE INTENTIONALLY LEFT BLANK)
85
| STARWOOD/SCHULTE HOTEL PORTFOLIO |

THE INFORMATION IN THIS STRUCTURAL AND COLLATERAL TERM SHEET IS NOT COMPLETE AND MAY BE AMENDED PRIOR TO THE TIME OF SALE. THIS TERM SHEET IS NOT AN OFFER TO SELL THESE SECURITIES AND IT IS NOT A SOLICITATION OF AN OFFER TO BUY THESE SECURITIES IN ANY JURISDICTION WHERE THE OFFER OR SALE IS NOT PERMITTED.
86
| STARWOOD/SCHULTE HOTEL PORTFOLIO |

THE INFORMATION IN THIS STRUCTURAL AND COLLATERAL TERM SHEET IS NOT COMPLETE AND MAY BE AMENDED PRIOR TO THE TIME OF SALE. THIS TERM SHEET IS NOT AN OFFER TO SELL THESE SECURITIES AND IT IS NOT A SOLICITATION OF AN OFFER TO BUY THESE SECURITIES IN ANY JURISDICTION WHERE THE OFFER OR SALE IS NOT PERMITTED.
87
| No. 7 – Starwood/Schulte Hotel Portfolio | ||||||||
| Loan Information | Property Information | |||||||
| Mortgage Loan Seller: | The Royal Bank of Scotland | Single Asset/Portfolio: | Portfolio | |||||
Credit Assessment (DBRS/Fitch/Moody’s): | NR/NR/NR | Property Type: | Hospitality | |||||
| Original Principal Balance: | $38,150,000 | Specific Property Type: | Various – See Table | |||||
| Cut-off Date Principal Balance: | $38,150,000 | Location: | Various – See Table | |||||
| % of Initial Pool Balance: | 3.7% | Size: | 460 rooms | |||||
| Loan Purpose: | Refinance | Cut-off Date Principal | ||||||
| Hotel Atlanta, L.P.; Hotel Green | Balance Per Room: | $82,935 | ||||||
| Borrower Names: | Bay, L.P.; Hotel Salisbury Centre, | |||||||
| L.P.; Hotel Scranton II, L.P. | ||||||||
| Sponsors: | Starwood Capital Group; Schulte Hospitality Group | Year Built/Renovated: | Various – See Table | |||||
| Mortgage Rate: | 4.429% | Title Vesting: | Fee | |||||
| Note Date: | November 21, 2013 | Property Manager: | Self-managed | |||||
| Anticipated Repayment Date: | NAP | 3rd Most Recent Occupancy (As of): | 62.7% (12/31/2010) | |||||
| Maturity Date: | December 1, 2018 | 2nd Most Recent Occupancy (As of): | 64.4% (12/31/2011) | |||||
| IO Period: | 12 months | Most Recent Occupancy (As of): | 66.1% (12/31/2012) | |||||
| Loan Term (Original): | 60 months | Current Occupancy (As of): | 67.5% (9/30/2013) | |||||
| Seasoning: | 0 months | |||||||
| Amortization Term (Original): | 360 months | Underwriting and Financial Information: | ||||||
| Loan Amortization Type: | Interest-only, Amortizing Balloon | 3rd Most Recent NOI (As of): | $2,484,586 (12/31/2011) | |||||
| Interest Accrual Method: | Actual/360 | 2nd Most Recent NOI (As of): | $3,141,644 (12/31/2012) | |||||
| Call Protection: | L(24),D or GRTR 1% or | Most Recent NOI (As of): | $4,754,720 (TTM 9/30/2013) | |||||
| YM(32),O(4) | ||||||||
Lockbox Type(1): | Soft/Springing Cash Management | U/W Revenues: | $13,066,298 | |||||
| Additional Debt: | None | |||||||
| Additional Debt Type: | NAP | U/W Expenses: | $8,344,470 | |||||
| U/W NOI: | $4,721,828 | |||||||
| U/W NCF: | $4,199,176 | |||||||
| U/W NOI DSCR: | 2.05x | |||||||
Escrows and Reserves(2): | U/W NCF DSCR: | 1.83x | ||||||
| U/W NOI Debt Yield: | 12.4% | |||||||
Type: | Initial | Monthly | Cap (If Any) | U/W NCF Debt Yield: | 11.0% | |||
| Taxes | $0 | Springing | NAP | As-Is Appraised Value: | $57,100,000 | |||
| Insurance | $0 | Springing | NAP | As-Is Appraisal Valuation Date(3): | Various | |||
| FF&E Reserve | $0 | $43,555 | NAP | Cut-off Date LTV Ratio: | 66.8% | |||
| Deferred Maintenance | $402,029 | NAP | NAP | LTV Ratio at Maturity or ARD: | 62.3% | |||
| (1) | See “Lockbox and Cash Management” section. |
| (2) | See “Escrows” section. |
| (3) | See “Appraisal” section. |
The Mortgage Loan. The mortgage loan (the “Starwood/Schulte Hotel Portfolio Mortgage Loan”) is evidenced by a single promissory note that is secured by a first mortgage encumbering a portfolio comprised of four hotels, including a Fairfield Inn located in Atlanta, Georgia, a Holiday Inn located in Green Bay, Wisconsin, a SpringHill Suites located in Moosic, Pennsylvania and a Residence Inn located in Salisbury, Maryland (the “Starwood/Schulte Hotel Portfolio Properties”). The Starwood/Schulte Hotel Portfolio Mortgage Loan was originated on November 21, 2013 by The Royal Bank of Scotland. The Starwood/Schulte Hotel Portfolio Mortgage Loan had an original principal balance of $38,150,000, has an outstanding principal balance as of the Cut-off Date of $38,150,000 and accrues interest at an interest rate of 4.429% per annum. The Starwood/Schulte Hotel Portfolio Mortgage Loan had an initial term of 60 months, has a remaining term of 60 months as of the Cut-off Date and requires interest-only payments for the first 12 months following origination and, thereafter, requires payments of principal and interest based on a 30-year amortization schedule. The Starwood/Schulte Hotel Portfolio Mortgage Loan matures on December 1, 2018.
Following the lockout period, the Starwood/Schulte Hotel Portfolio borrower has the right to either (i) defease the Starwood/Schulte Hotel Portfolio Mortgage Loan in whole, or in part, or (ii) prepay the loan, in whole or in part, provided that such payment is accompanied by the applicable yield maintenance premium. In addition, the Starwood/Schulte Hotel Portfolio Mortgage Loan is prepayable without penalty on or after September 1, 2018.
THE INFORMATION IN THIS STRUCTURAL AND COLLATERAL TERM SHEET IS NOT COMPLETE AND MAY BE AMENDED PRIOR TO THE TIME OF SALE. THIS TERM SHEET IS NOT AN OFFER TO SELL THESE SECURITIES AND IT IS NOT A SOLICITATION OF AN OFFER TO BUY THESE SECURITIES IN ANY JURISDICTION WHERE THE OFFER OR SALE IS NOT PERMITTED.
88
| STARWOOD/SCHULTE HOTEL PORTFOLIO |
Sources and Uses
| Sources | Uses | |||||||
| Original loan amount | $38,150,000 | 100.0% | Reserves | $402,029 | 1.1% | |||
| Closing costs | 536,849 | 1.4 | ||||||
Return of equity(1) | $37,211,122 | 97.5 | ||||||
| Total Sources | $38,150,000 | 100.0% | Total Uses | $38,150,000 | 100.0% |
| (1) | The proceeds from the Starwood/Schulte Hotel Portfolio Mortgage Loan were used to recapitalize the sponsor’s investment in the Starwood/Schulte Hotel Portfolio Properties. The Starwood/Schulte Hotel Portfolio Properties were unencumbered as the sponsor purchased the Starwood/Schulte Hotel Portfolio Properties with all cash for approximately $47.8 million. |
The Properties. The Starwood/Schulte Hotel Portfolio Properties are comprised of the fee interests in two limited service hotels located in Georgia and Pennsylvania, one extended-stay hotel in Maryland and one full service hotel located in Wisconsin. The Starwood/Schulte Hotel Portfolio Properties comprise a total of 460 rooms.
The following table presents certain information relating to the Starwood/Schulte Hotel Portfolio Properties:
| Property Name – Location | Allocated Cut-off Date Principal Balance | % of Portfolio Cut-off Date Principal Balance | Rooms | Cut-off Date Balance Per Room | Year Built/ Renovated | Appraised Value | ||
| Fairfield Inn Atlanta – Atlanta, GA | $12,100,500 | 31.7% | 156 | $77,564 | 1915/2013 | $18,100,000 | ||
| Holiday Inn Green Bay – Green Bay, WI | $10,000,000 | 26.2% | 118 | $84,746 | 2007/2013 | $15,000,000 | ||
| SpringHill Suites Scranton – Moosic, PA | $8,700,000 | 22.8% | 102 | $85,294 | 2012/NAP | $13,000,000 | ||
| Residence Inn Salisbury – Salisbury, MD | $7,350,000 | 19.3% | 84 | $87,500 | 2007/2013 | $11,000,000 | ||
| Total/Weighted Average | $38,150,000 | 100.0% | 460 | $82,935 | $57,100,000 | |||
Fairfield Inn Atlanta (31.7% of Portfolio Cut-off Date Principal Balance)
Fairfield Inn Atlanta is a 156-room, limited service, all-suite hotel located in Atlanta, Georgia. The 16-story hotel was built in 1915 and renovated in 2009. The property sits on a 0.2-acre site situated on Peachtree Street in downtown Atlanta and includes a fitness center, a breakfast and lounge area, approximately 4,100 square feet of meeting space, a business center and a sundry shop. The property contains 71 king guestrooms, 42 double guestrooms, 33 king suites and 10 double suites. The Fairfield Inn Atlanta property was purchased in 2011 and developed into a Comfort Suites before being subsequently renovated and rebranded into a Fairfield Inn & Suites in 2012. The Fairfield Inn Atlanta property is currently undergoing a property improvement plan (“PIP”) estimated at $275,000 and the franchise agreement for Fairfield Inn Atlanta expires on April 19, 2037.
Holiday Inn Green Bay (26.2% of Portfolio Cut-off Date Principal Balance)
Holiday Inn Green Bay is a 118-room, full service hotel located in Green Bay, Wisconsin. The three-story hotel was developed and opened in 2007. The Holiday Inn Green Bay property sits on a 2.4-acre site and is located one mile south of Lambeau Field, home of the Green Bay Packers, and includes a full-service restaurant and lounge, an indoor pool and whirlpool, fitness center, business center and meeting and banquet facilities totaling over 1,400 square feet of area. The Holiday Inn Green Bay property contains 31 studio king rooms, 23 king executive suites, 58 double queen rooms and 6 double queen executive suites. The Holiday Inn Green Bay property provides a complimentary shuttle to and from the Austin Straubel Airport, which is located less than three and a half miles northwest of the Holiday Inn Green Bay Property. The Holiday Inn Green Bay property was acquired by the sponsor in 2013 and is currently undergoing completing a PIP estimated at $315,000. The franchise agreement for Holiday Inn Green Bay expires on July 10, 2028.
SpringHill Suites Scranton (22.8% of Portfolio Cut-off Date Principal Balance)
SpringHill Suites Scranton is a 102-room, limited service hotel located in Moosic, Pennsylvania. The four-story hotel was developed and opened in 2012. The SpringHill Suites Scranton property sits on a 2.0-acre site and includes a sundry shop with convenience items, lobby lounge, an indoor pool, exercise room, and business center. The SpringHill Suites Scranton property contains 66 double queen suites and 36 king suites. The SpringHill Suites Scranton was purchased by the sponsor in 2012 and is located less than four and a half miles northeast of the Wilkes-Barre/Scranton International Airport. The SpringHill Suites Scranton property also offers a complimentary shuttle service to and from the airport. The franchise agreement for Springhill Suites Scranton expires on June 10, 2032.
Residence Inn Salisbury (19.3% of Portfolio Cut-off Date Principal Balance)
Residence Inn Salisbury is an 84-room, extended stay hotel located in Salisbury, Maryland. The three-story hotel was developed and opened in 2007. The property sits on a 2.5-acre site on the west side of Route 13 (Ocean Highway), just north of its intersection with Route 50 (Salisbury Bypass) and includes a sundry shop, breakfast room, fitness center, swimming pool, business center and 500 square feet of meeting space. The Residence Inn Salisbury property contains 38 studio rooms, 38 one bedroom suites and eight two bedroom suites. The Residence Inn Salisbury Property was purchased by the sponsor in 2013 and is currently undergoing a PIP estimated at $550,000. The franchise agreement for Residence Inn Salisbury expires on April 2, 2027.
THE INFORMATION IN THIS STRUCTURAL AND COLLATERAL TERM SHEET IS NOT COMPLETE AND MAY BE AMENDED PRIOR TO THE TIME OF SALE. THIS TERM SHEET IS NOT AN OFFER TO SELL THESE SECURITIES AND IT IS NOT A SOLICITATION OF AN OFFER TO BUY THESE SECURITIES IN ANY JURISDICTION WHERE THE OFFER OR SALE IS NOT PERMITTED.
89
| STARWOOD/SCHULTE HOTEL PORTFOLIO |
Operating History and Underwritten Net Cash Flow. The following table presents certain information relating to the historical operating performance and the Underwritten Net Cash Flow at the Starwood/Schulte Hotel Portfolio Properties:
Cash Flow Analysis
2011(1) | 2012(1) | TTM 9/30/2013 | U/W | U/W $ per Room | ||||||
| Average Annual Room Count | 358 | 358 | 460 | 460 | ||||||
| Occupancy | 64.4% | 66.1% | 67.5% | 68.5% | ||||||
| ADR | $97.62 | $103.33 | $104.18 | $104.18 | ||||||
| RevPAR | $62.67 | $67.91 | $71.10 | $71.10 | ||||||
| Total Revenue | $8,610,055 | $9,650,366 | $13,066,456 | $13,066,298 | $28,405 | |||||
| Total Department Expenses | 2,326,147 | 2,696,272 | 3,392,334 | 3,179,735 | 6,912 | |||||
| Gross Operating Profit | $6,283,908 | $6,954,094 | $9,674,122 | $9,886,563 | $21,493 | |||||
| Total Undistributed Expenses | 3,348,836 | 3,526,638 | 4,482,489 | 4,532,914 | 9,854 | |||||
| Profit Before Fixed Charges | $2,935,072 | $3,427,456 | $5,191,633 | $5,353,649 | $11,638 | |||||
| Total Fixed Charges | 450,486 | 285,812 | 436,913 | 631,821 | 1,374 | |||||
| Net Operating Income | $2,484,586 | $3,141,644 | $4,754,720 | $4,721,828 | $10,265 | |||||
| FF&E | 0 | 0 | 0 | 522,652 | 1,136 | |||||
| Net Cash Flow | $2,484,586 | $3,141,644 | $4,754,720 | $4,199,176 | $9,129 | |||||
| NOI DSCR | 1.08x | 1.37x | 2.07x | 2.05x | ||||||
| NCF DSCR | 1.08x | 1.37x | 2.07x | 1.83x | ||||||
| NOI DY | 6.5% | 8.2% | 12.5% | 12.4% | ||||||
| NCF DY | 6.5% | 8.2% | 12.5% | 11.0% | ||||||
| (1) | The historical cash flows in 2011 and 2012 reflect only the operations of Fairfield Inn Atlanta, Holiday Inn Green Bay and Residence Inn Salisbury, as the SpringHill Suites Scranton was open for business for only the trailing 12-month period ending September 30, 2013. |
Appraisal. According to the related appraisals performed from October 1, 2013 to October 16, 2013 the Starwood/Schulte Hotel Portfolio Properties had an aggregate “as-is” appraised value of $57,100,000.
Environmental Matters. According to the Phase I environmental site assessments dated from October 11, 2013 to October 15, 2013, there was no evidence of any recognized environmental conditions, but the development and implementation of an Asbestos Operations and Maintenance (O&M) Plan is recommended for the Fairfield Inn Atlanta property.
Market Overview and Competition. The Starwood/Schulte Hotel Portfolio Properties are located in Georgia, Wisconsin, Pennsylvania and Maryland and comprise a total of 460 rooms.
Fairfield Inn Atlanta
The Fairfield Inn Atlanta property is located in Atlanta, Georgia at the southeast corner of Peachtree Street SW and Alabama Street, adjacent to the Underground Atlanta retail center in downtown Atlanta. The Fairfield Inn Atlanta property is approximately five blocks west of the intersection of Interstate 75 and Interstate 85. This submarket is dominated by federal office buildings and the Fairfield Inn Atlanta property is positioned approximately two blocks west of Georgia State University and one quarter mile of the State Capitol and the Georgia Dome. Downtown Atlanta benefits from the proximity of Georgia State University and the Georgia Institute of Technology, as well as entertainment facilities including the Phillips Arena and the Fox Theater. The Hartsfield-Jackson Atlanta International Airport is the largest employer in the state of Georgia, which is located approximately 10 miles from the Fairfield Inn Atlanta property.
The following table presents certain information relating to the Fairfield Inn Atlanta’s competitive set:
Subject and Market Historical Occupancy, ADR and RevPAR
(Fairfield Inn Atlanta)(1)
Competitive Set | Fairfield Inn Atlanta | Penetration Factor | |||||||||||||||||
Year | Occupancy | ADR | RevPAR | Occupancy | ADR | RevPAR | Occupancy | ADR | RevPAR | ||||||||||
| 9/30/2013 TTM | 62.9% | $127.11 | $79.94 | 63.6% | $115.26 | $73.28 | 101.1% | 90.7% | 91.7% | ||||||||||
| 9/30/2012 TTM | 62.4% | $119.91 | $74.81 | 48.9% | $103.52 | $50.64 | 78.4% | 86.3% | 67.7% | ||||||||||
| 9/30/2011 TTM | 63.0% | $117.09 | $73.77 | 47.4% | $101.93 | $48.29 | 75.2% | 87.0% | 65.5% | ||||||||||
| (1) | Information obtained from a third party hospitality report dated October 17, 2013. According to the third party research report, the competitive set includes the following hotels: Hyatt Place Atlanta Downtown, Holiday Inn Express & Suites Atlanta Downtown, Holiday Inn Atlanta Downtown Centennial Park, Hampton Inn & Suites Atlanta Downtown and Courtyard Atlanta Downtown. |
THE INFORMATION IN THIS STRUCTURAL AND COLLATERAL TERM SHEET IS NOT COMPLETE AND MAY BE AMENDED PRIOR TO THE TIME OF SALE. THIS TERM SHEET IS NOT AN OFFER TO SELL THESE SECURITIES AND IT IS NOT A SOLICITATION OF AN OFFER TO BUY THESE SECURITIES IN ANY JURISDICTION WHERE THE OFFER OR SALE IS NOT PERMITTED.
90
| STARWOOD/SCHULTE HOTEL PORTFOLIO |
Holiday Inn Green Bay
The Holiday Inn Green Bay property is located in Green Bay, Wisconsin, east of State Highway 41 along the east side of Ramada Way in the southwestern portion of the City of Green Bay. Lambeau Field is located one mile north of the Holiday Inn Green Bay property and the Denis J. Murphy Army Reserve is located one-quarter mile south of the Holiday Inn Green Bay property. The Austin Straubel International Airport is located approximately one mile west of the Holiday Inn Green Bay property. Demand is mainly driven by corporate revenues from organizations headquartered in Green Bay such as Humana Inc. and Oneida Tribe of Wisconsin. State and Local governments are the primary employment engine as the Green Bay area supports nearly 20,000 government officials, the largest component of the labor force.
The following table presents certain information relating to the Holiday Inn Green Bay’s competitive set:
Subject and Market Historical Occupancy, ADR and RevPAR
(Holiday Inn Green Bay)(1)
Competitive Set | Holiday Inn Green Bay | Penetration Factor | |||||||||||||||||
Year | Occupancy | ADR | RevPAR | Occupancy | ADR | RevPAR | Occupancy | ADR | RevPAR | ||||||||||
| 9/30/2013 TTM | 59.1% | $98.97 | $58.54 | 68.8% | $104.71 | $72.07 | 116.4% | 105.8% | 123.1% | ||||||||||
| 9/30/2012 TTM | 66.6% | $95.51 | $63.60 | 72.6% | $108.55 | $78.77 | 109.0% | 113.7% | 123.9% | ||||||||||
| 9/30/2011 TTM | 66.9% | $86.10 | $57.60 | 72.7% | $97.22 | $70.70 | 108.7% | 112.9% | 122.8% | ||||||||||
| (1) | Information obtained from a third party hospitality report dated October 17, 2013. According to the third party research report, the competitive set includes the following hotels: Ramada Plaza Green Bay, Fairfield Inn Green Bay Southwest, Hampton Inn Green Bay, Hilton Garden Inn Green Bay, Springhill Suites Green Bay and Holiday Inn Express & Suites Green Bay East. |
SpringHill Suites Scranton
The SpringHill Suites Scranton property is located in Moosic, Pennsylvania at the intersection of Radcliffe Drive and Barrett Drive. The SpringHill Suites Scranton property is located less than a mile and a half east of US Route 11 and one half mile east of Interstate 81. The SpringHill Suites Scranton property benefits from local demand generators including Glenmaura National Boulevard, PNC Field, Montage Mountain Ski Resort and the Scranton-Wilkes-Barre International Airport is located less than three miles southwest of the SpringHill Suites Scranton property. Additionally, the Mohegan Sun Casino and Racetrack at Pocono Downs is a major source of tourism.
The following table presents certain information relating to the SpringHill Suites Scranton’s competitive set:
Subject and Market Historical Occupancy, ADR and RevPAR
(SpringHill Suites Scranton)(1)
Competitive Set | SpringHill Suites Scranton(2) | Penetration Factor(2) | |||||||||||||||||
Year | Occupancy | ADR | RevPAR | Occupancy | ADR | RevPAR | Occupancy | ADR | RevPAR | ||||||||||
| 9/30/2013 TTM | 71.5% | $110.20 | $78.83 | 63.2% | $100.39 | $63.46 | 88.4% | 91.1% | 80.5% | ||||||||||
| 9/30/2012 TTM | 72.8% | $108.15 | $78.68 | NAV | NAV | NAV | NAV | NAV | NAV | ||||||||||
| 9/30/2011 TTM | 74.3% | $103.24 | $76.69 | NAV | NAV | NAV | NAV | NAV | NAV | ||||||||||
| (1) | Information obtained from a third party hospitality report dated October 17, 2013. According to the third party research report, the competitive set includes the following hotels: Hampton Inn Scranton @ Montage Mountain, Courtyard Scranton Wilkes Barre, Hilton Scranton & Conference Center and Holiday Inn Express & Suites Dickson City Scranton. |
| (2) | Occupancy, ADR and RevPAR statistics for the SpringHill Suites Scranton property are not available for the trailing 12-month periods ending September 30, 2011 and September 30, 2012 as the property opened for operations in 2012. |
Residence Inn Salisbury
The Residence Inn Salisbury property is located in Salisbury, Maryland, on the west side of Route 13, just north of its intersection with Route 50. Major demand generators in the area include Salisbury State University, University of Maryland Eastern Shore, McCready Hospital, Peninsula Regional Medical Center and Atlantic General Hospital which are also major employers within the area. The Centre at Salisbury is adjacent to the Residence Inn Salisbury property, which serves as the largest retail center on Maryland’s Eastern Shore. During the summer months, tourist demand increases significantly as a result of nearby coastal resort towns such as Rehoboth Beach, Delaware and Ocean City, Maryland.
THE INFORMATION IN THIS STRUCTURAL AND COLLATERAL TERM SHEET IS NOT COMPLETE AND MAY BE AMENDED PRIOR TO THE TIME OF SALE. THIS TERM SHEET IS NOT AN OFFER TO SELL THESE SECURITIES AND IT IS NOT A SOLICITATION OF AN OFFER TO BUY THESE SECURITIES IN ANY JURISDICTION WHERE THE OFFER OR SALE IS NOT PERMITTED.
91
| STARWOOD/SCHULTE HOTEL PORTFOLIO |
The following table presents certain information relating to the Residence Inn Salisbury’s competitive set:
Subject and Market Historical Occupancy, ADR and RevPAR
(Residence Inn Salisbury)(1)
Competitive Set | Residence Inn Salisbury | Penetration Factor(2) | |||||||||||||||||
Year | Occupancy | ADR | RevPAR | Occupancy | ADR | RevPAR | Occupancy | ADR | RevPAR | ||||||||||
| 9/30/2013 TTM | 55.4% | $97.71 | $54.12 | 78.7% | $95.94 | $75.54 | 142.1% | 98.2% | 139.6% | ||||||||||
| 9/30/2012 TTM | 51.2% | $98.15 | $50.30 | 71.9% | $95.88 | $68.94 | 140.3% | 97.7% | 137.1% | ||||||||||
| 9/30/2011 TTM | 51.0% | $90.45 | $46.12 | 69.8% | $92.81 | $64.82 | 137.0% | 102.6% | 140.6% | ||||||||||
| (1) | Information obtained from a third party hospitality report dated October 17, 2013. According to the third party research report, the competitive set includes the following hotels: Holiday Inn Downtown Salisbury Area, Hampton Inn Salisbury, Country Inn & Suites Salisbury, Courtyard Salisbury and Hampton Inn & Suites Fruitland Salisbury. |
| (2) | The Residence Inn Salisbury property benefits from being the only extended stay asset in the market. |
The Borrowers. The borrowing entities are comprised of Hotel Atlanta, L.P., Hotel Green Bay, L.P., Hotel Salisbury Centre, L.P. and Hotel Scranton II, L.P. (collectively, the “Starwood/Schulte Hotel Portfolio Borrower”). Each of the entities comprising the Starwood/Schulte Hotel Portfolio Borrower is a single purpose entity and has a single purpose general partner and one independent director. Legal counsel to the Starwood/Schulte Hotel Portfolio Borrower delivered a non-consolidation opinion in connection with the origination of the Starwood/Schulte Hotel Portfolio Mortgage Loan. SHG SCG Ventures, L.P. is the guarantor of certain nonrecourse carveouts under the Starwood/Schulte Hotel Portfolio Mortgage Loan. Starwood Distressed Opportunity Fund IX-I-O.S., L.P. and Starwood Distressed Opportunity Fund IX Global, L.P. are the guarantors for certain completion obligations in connection with the PIPs.
The Sponsors. The sponsor is a joint venture between Starwood Capital Group and Schulte Hospitality Group which also serves as the non-recourse carveout guarantor in the transaction and represents a joint venture between Starwood Capital Group (“SCG”) (95%) and Schulte Hospitality Group (5%). SCG is a privately held global investment firm that manages assets across virtually all real estate asset classes and levels of capital structure. SCG has completed over 500 real estate transactions representing billions of assets as well as sponsoring 12 co-mingled opportunistic funds. Schulte Hospitality Group, is a full service hospitality company with experience in all facets of the hospitality industry, and its current portfolio consists of 17 hotels under management located in Kentucky, Indiana, Illinois, Ohio and Iowa.
Escrows. The loan documents provide for an upfront escrow at closing in the amount of $402,029 for deferred maintenance. The loan documents also require monthly deposits of $43,555 for FF&E. The loan documents do not require ongoing escrows for real estate taxes or insurance so long as the manager pays all taxes and insurance premiums directly before delinquency.
Lockbox and Cash Management. The Starwood/Schulte Hotel Portfolio Mortgage Loan requires a lender-controlled lockbox account, which is already in place. All revenues payable are deposited into an account controlled by the property manager. After application of operating expenses and other items provided for in the respective management agreements, the property manager shall deposit the remaining amount into the lender-controlled lockbox. All funds on deposit in the lockbox account are swept on a daily basis into an account designated by the Starwood/Schulte Hotel Portfolio Borrower unless a Trigger Period (as defined below) is in effect, in which case funds are swept to a cash management account under the control of the lender.
A “Trigger Period” will commence: (i) upon the occurrence and continuance of an event of default under the Starwood/Schulte Hotel Portfolio Mortgage Loan; and (ii) if, as of the last day of any calendar quarter during the Starwood/Schulte Hotel Portfolio Mortgage Loan term, the amortizing debt service coverage ratio is less than 1.10x.
Property Management. The Starwood/Schulte Hotel Portfolio Properties are managed by an affiliate of the borrower.
Assumption. The Starwood/Schulte Hotel Portfolio Borrower has the right to transfer the Starwood/Schulte Hotel Portfolio Properties, with the consent of the lender, subject to customary conditions set forth in the loan documents, including but not limited to: (i) no event of default has occurred and is continuing; (ii) evidence satisfactory to the lender has been provided showing that the transferee borrower complies with the special purpose entity provisions of the loan documents; and (iii) the lender receives written confirmation from DBRS, Fitch and Moody’s that the assumption will not result in a downgrade, qualification or withdrawal of the then current ratings assigned to any class of Series 2013-C18 Certificates.
Partial Release. Following the second anniversary of the issuance of the Series 2013-C18 Certificates, the Starwood/Schulte Hotel Portfolio Borrower may obtain the release of an individual property from the lien of mortgage provided that such property upon the satisfaction of certain conditions including without limitation: (i) no event of default has occurred or is continuing at the time that the release occurs; (ii) the property to be released must be the subject of sale to a bona fide third party purchaser; (iii) if applicable, the borrower must make a payment of principal in an amount such that the loan-to-value ratio is no more than 125%; (iv) receipt of confirmation that the partial release will not result in any ratings of Series 2013-C18 Certificates being downgraded, qualified or withdrawn by DBRS, Fitch and Moody’s; (v) the net cash flow DSCR following the release is no less than the net cash flow DSCR immediately prior to the release; and (vi) the borrower shall either defease or make a payment of the Release Amount (as defined below) for the related property together with the yield maintenance premium.
A “Release Amount” shall mean the allocated loan amount for such individual property being released multiplied by 115%. In the case of the Fairfield Inn Atlanta Property, the release amount is 120% of its allocated loan amount.
THE INFORMATION IN THIS STRUCTURAL AND COLLATERAL TERM SHEET IS NOT COMPLETE AND MAY BE AMENDED PRIOR TO THE TIME OF SALE. THIS TERM SHEET IS NOT AN OFFER TO SELL THESE SECURITIES AND IT IS NOT A SOLICITATION OF AN OFFER TO BUY THESE SECURITIES IN ANY JURISDICTION WHERE THE OFFER OR SALE IS NOT PERMITTED.
92
| STARWOOD/SCHULTE HOTEL PORTFOLIO |
Real Estate Substitution. Not permitted.
Subordinate and Mezzanine Indebtedness. Not permitted.
Ground Lease. None.
Terrorism Insurance. The loan documents require that the “all risk” insurance policy maintained by the Starwood/Schulte Hotel Portfolio Borrower provide coverage for damage from terrorism in an amount equal to the full replacement cost of the Starwood/Schulte Hotel Portfolio Properties, as well as business interruption insurance covering no less than the 18-month period following the occurrence of a casualty event together with a six-month extended period of indemnity.
THE INFORMATION IN THIS STRUCTURAL AND COLLATERAL TERM SHEET IS NOT COMPLETE AND MAY BE AMENDED PRIOR TO THE TIME OF SALE. THIS TERM SHEET IS NOT AN OFFER TO SELL THESE SECURITIES AND IT IS NOT A SOLICITATION OF AN OFFER TO BUY THESE SECURITIES IN ANY JURISDICTION WHERE THE OFFER OR SALE IS NOT PERMITTED.
93
(THIS PAGE INTENTIONALLY LEFT BLANK)
94
| HUDSON MALL |
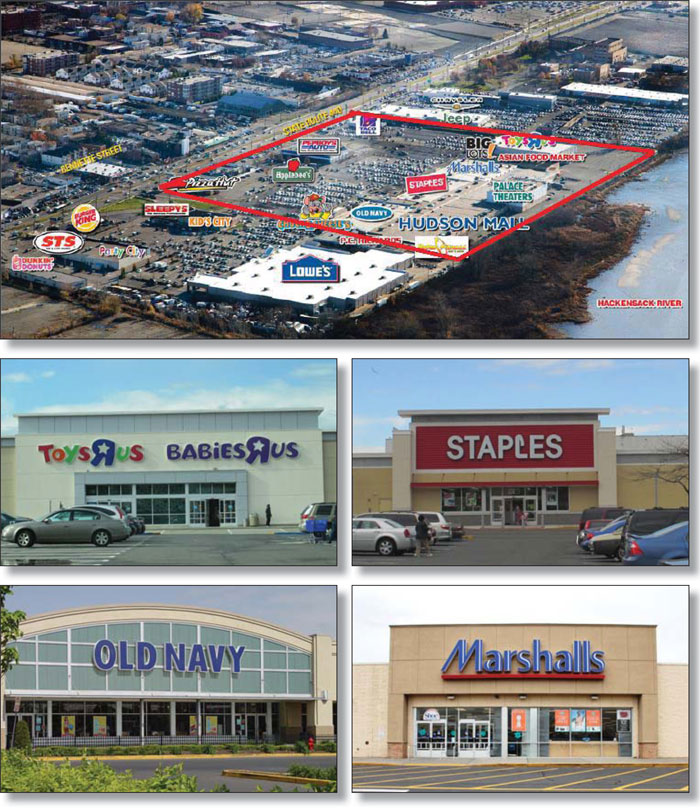
THE INFORMATION IN THIS STRUCTURAL AND COLLATERAL TERM SHEET IS NOT COMPLETE AND MAY BE AMENDED PRIOR TO THE TIME OF SALE. THIS TERM SHEET IS NOT AN OFFER TO SELL THESE SECURITIES AND IT IS NOT A SOLICITATION OF AN OFFER TO BUY THESE SECURITIES IN ANY JURISDICTION WHERE THE OFFER OR SALE IS NOT PERMITTED.
95
| HUDSON MALL |
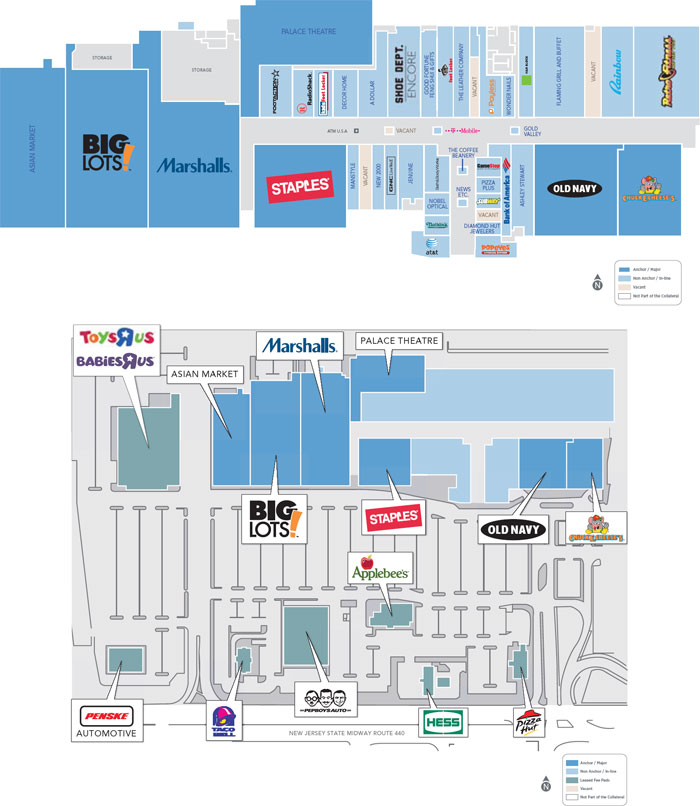
THE INFORMATION IN THIS STRUCTURAL AND COLLATERAL TERM SHEET IS NOT COMPLETE AND MAY BE AMENDED PRIOR TO THE TIME OF SALE. THIS TERM SHEET IS NOT AN OFFER TO SELL THESE SECURITIES AND IT IS NOT A SOLICITATION OF AN OFFER TO BUY THESE SECURITIES IN ANY JURISDICTION WHERE THE OFFER OR SALE IS NOT PERMITTED.
96
| HUDSON MALL |

THE INFORMATION IN THIS STRUCTURAL AND COLLATERAL TERM SHEET IS NOT COMPLETE AND MAY BE AMENDED PRIOR TO THE TIME OF SALE. THIS TERM SHEET IS NOT AN OFFER TO SELL THESE SECURITIES AND IT IS NOT A SOLICITATION OF AN OFFER TO BUY THESE SECURITIES IN ANY JURISDICTION WHERE THE OFFER OR SALE IS NOT PERMITTED.
97
| No. 8 – Hudson Mall |
| Loan Information | Property Information | |||||||
| Mortgage Loan Seller: | Wells Fargo Bank, National Association | Single Asset/Portfolio: | Single Asset | |||||
| Credit Assessment (DBRS/Fitch/Moody’s): | NR/NR/NR | Property Type: | Retail | |||||
| Original Principal Balance: | $25,000,000 | Specific Property Type: | Anchored | |||||
| Cut-off Date Principal Balance: | $25,000,000 | Location: | Jersey City, NJ | |||||
| % of Initial Pool Balance: | 2.4% | Size: | 282,782 SF | |||||
| Loan Purpose: | Refinance | Cut-off Date Principal Balance Per SF: | $88.41 | |||||
| Borrower Name: | Hudson Associates Limited Partnership | Year Built/Renovated: | 1966/2000 | |||||
| Sponsor: | Edward M. Snider | Title Vesting: | Fee | |||||
| Mortgage Rate: | 5.070% | Property Manager: | Preit-Rubin, Inc. | |||||
| Note Date: | November 15, 2013 | 3rd Most Recent Occupancy: | 90.0% (12/31/2010) | |||||
| Anticipated Repayment Date: | NAP | 2nd Most Recent Occupancy (As of): | 76.5% (12/31/2011) | |||||
| Maturity Date: | December 1, 2023 | Most Recent Occupancy (As of): | 63.9% (12/31/2012) | |||||
| IO Period: | None | Current Occupancy (As of)(2): | 95.7% (11/19/2013) | |||||
| Loan Term (Original): | 120 months | |||||||
| Seasoning: | 0 months | Underwriting and Financial Information: | ||||||
| Amortization Term (Original): | 360 months | |||||||
| Loan Amortization Type: | Amortizing Balloon | 3rd Most Recent NOI (As of): | $2,483,348 (12/31/2011) | |||||
| Interest Accrual Method: | Actual/360 | 2nd Most Recent NOI (As of): | $2,056,076 (12/31/2012) | |||||
| Call Protection: | L(24),D(92),O(4) | Most Recent NOI (As of): | $1,907,323 (8/31/2013) | |||||
| Lockbox Type: | Springing (Without Established Account) | |||||||
| Additional Debt: | None | |||||||
| Additional Debt Type: | NAP | |||||||
U/W Revenues: | $7,063,359 | |||||||
Escrows and Reserves(1): | U/W Expenses: | $3,837,346 | ||||||
U/W NOI(3): | $3,226,012 | |||||||
Type: | Initial | Monthly | Cap (If Any) | U/W NCF: | $2,920,364 | |||
| Taxes | $248,186 | $127,997 | NAP | U/W NOI DSCR: | 1.99x | |||
| Insurance | $0 | Springing | NAP | U/W NCF DSCR: | 1.80x | |||
| Replacement Reserves | $0 | $5,891 | NAP | U/W NOI Debt Yield: | 12.9% | |||
| TI/LC Reserve | $600,000 | $28,000 | $600,000 | U/W NCF Debt Yield: | 11.7% | |||
| Environmental Reserve | $304,375 | $0 | NAP | As-Is Appraised Value: | $47,000,000 | |||
| Rent Concession/TILC Reserve | $2,549,722 | $0 | NAP | As-Is Appraisal Valuation Date: | October 4, 2013 | |||
| Chuck E. Cheese Reserve | $1,710,000 | $0 | NAP | Cut-off Date LTV Ratio: | 53.2% | |||
| Staples/Big Lots/Marshalls Reserve | $0 | Springing | NAP | LTV Ratio at Maturity or ARD: | 43.8% | |||
| (1) | See “Escrows” section. |
| (2) | Current occupancy includes three tenants (17.7% of the net rentable area and 12.3% of the U/W Base Rent) that have executed leases, but are not in occupancy. One tenant (8.8% of the net rentable area and 5.1% of U/W Base Rent) is expected to open the first quarter of 2014, one tenant (3.8% of the net rentable area and 2.3% of U/W Base Rent) is expected to open the second quarter of 2014 and one tenant (5.0% of the net rentable area and 4.9% of U/W Base Rent) is expected to open by the fourth quarter of 2014. See “Escrows” section for reserves relating to tenants not in occupancy. Excluding these tenants, Current Occupancy is 78.0%. See “Historical Occupancy” section. |
| (3) | See “Cash Flow Analysis” section. |
The Mortgage Loan. The mortgage loan (the “Hudson Mall Mortgage Loan”) is evidenced by a single promissory note that is secured by a first mortgage encumbering an anchored retail center located in Jersey City, New Jersey (the “Hudson Mall Property”). The Hudson Mall Mortgage Loan was originated on November 15, 2013 by Wells Fargo Bank, National Association. The Hudson Mall Mortgage Loan had an original principal balance of $25,000,000, has an outstanding principal balance as of the Cut-off Date of $25,000,000 and accrues interest at an interest rate of 5.070% per annum. The Hudson Mall Mortgage Loan had an initial term of 120 months, has a remaining term of 120 months as of the Cut-off Date and requires payments of principal and interest based on a 30-year amortization schedule. The Hudson Mall Mortgage Loan matures on December 1, 2023.
Following the lockout period, the borrower has the right to defease the Hudson Mall Mortgage Loan in whole, but not in part, on any date before September 1, 2023. In addition, the Hudson Mall Mortgage Loan is prepayable without penalty on or after September 1, 2023.
THE INFORMATION IN THIS STRUCTURAL AND COLLATERAL TERM SHEET IS NOT COMPLETE AND MAY BE AMENDED PRIOR TO THE TIME OF SALE. THIS TERM SHEET IS NOT AN OFFER TO SELL THESE SECURITIES AND IT IS NOT A SOLICITATION OF AN OFFER TO BUY THESE SECURITIES IN ANY JURISDICTION WHERE THE OFFER OR SALE IS NOT PERMITTED.
98
| HUDSON MALL |
Sources and Uses
| Sources | Uses | |||||||
| Original loan amount | $25,000,000 | 100.0% | Loan payoff(1) | $14,151,295 | 56.6% | |||
| Reserves | 5,412,283 | 21.6 | ||||||
| Closing costs | 209,405 | 0.8 | ||||||
| Return of equity | 5,227,017 | 20.9 | ||||||
| Total Sources | $25,000,000 | 100.0% | Total Uses | $25,000,000 | 100.0% |
| (1) | The Hudson Mall Property was previously securitized in MSC 2004-T13. |
The Property. The Hudson Mall Property is an anchored retail center containing approximately 282,782 square feet, plus an additional 99,476 square feet of ground leased space located in Jersey City, New Jersey. Built in 1966, the Hudson Mall Property was enclosed in 1978 and expanded in 1985. In 2000, existing in-line space was reconfigured to create the Staples and Marshalls anchor spaces. Currently, the Hudson Mall Property comprises eight buildings and is anchored by Marshalls, Big Lots, Asian Food Market, Staples, Old Navy and Palace Theatre with a Toys R Us outparcel that is subject to a ground lease. The Hudson Mall Property is situated on a 31.9-acre parcel and provides approximately 1,782 surface parking spaces, resulting in a parking ratio of 6.3 spaces per 1,000 square feet of net rentable area. As of November 19, 2013, the Hudson Mall Property was 95.7% leased to 46 tenants.
The following table presents certain information relating to the tenancy at the Hudson Mall Property:
Major Tenants
| Tenant Name | Credit Rating (Fitch/ Moody’s/ S&P)(1) | Tenant NRSF | % of NRSF | Annual U/W Base Rent PSF | Annual U/W Base Rent | % of Total Annual U/W Base Rent | Sales PSF(2) | Occupancy Cost(2) | Lease Expiration Date | ||||||||||
| Major Tenants | |||||||||||||||||||
| Marshalls | NR/A3/A | 41,853 | 14.8% | $11.00 | $460,383 | 9.6% | $300 | 5.5% | 1/31/2020 | ||||||||||
Big Lots(3) | NR/NR/BBB- | 30,401 | 10.8% | $10.00 | $304,010 | 6.3% | NAV | NAV | 1/31/2022 | ||||||||||
| Staples | BBB/Baa2/BBB | 18,476 | 6.5% | $15.54 | $287,117 | 6.0% | NAV | NAV | 10/31/2021 | ||||||||||
| Pep Boys – Ground Lease | NR/B1/B | 0 | 0.0% | NAP | $283,435 | 5.9% | NAV | NAV | 10/31/2017 | ||||||||||
| Old Navy | BBB-/Baa3/BBB- | 18,253 | 6.5% | $15.00 | $273,795 | 5.7% | $371 | 4.2% | 2/28/2015 | ||||||||||
Asian Food Market(4) | NR/NR/NR | 25,000 | 8.8% | $9.88 | $247,073 | 5.1% | NAV | NAV | 4/30/2023 | ||||||||||
Chuck E. Cheese(5) | NR/NR/NR | 14,060 | 5.0% | $16.62 | $233,677 | 4.9% | NAV | NAV | 11/30/2023 | ||||||||||
| Retro Fitness | NR/NR/NR | 14,200 | 5.0% | $16.00 | $227,200 | 4.7% | NAV | NAV | 11/30/2022 | ||||||||||
| Total Major Tenants | 162,243 | 57.4% | $12.53(6) | $2,316,690 | 48.2% | ||||||||||||||
| Non-Major Tenants | 108,388 | 38.3% | $17.51(6) | $2,494,359 | 51.8% | ||||||||||||||
| Occupied Collateral Total | 270,631 | 95.7%(7) | $14.53(6) | $4,811,049 | 100.0% | ||||||||||||||
| Vacant Space | 12,151 | 4.3% | |||||||||||||||||
| Collateral Total | 282,782 | 100.0% | |||||||||||||||||
| (1) | Certain ratings are those of the parent company whether or not the parent guarantees the lease. |
| (2) | Sales PSF and Occupancy Costs are calculated based on trailing 12-month sales through December 31, 2012. Sales PSF and Occupancy Costs are not available for tenants who have not reported a full year of sales data. |
| (3) | Big Lots does not begin paying rent until May 2014. A reserve of $126,671 was collected at closing to account for the outstanding free rent. |
| (4) | Asian Food Market has signed a lease but is not in occupancy and has a 50% monthly rent abatement, capped at $450,000. The abatement is anticipated to expire in November 2016. Reserves of $407,124 and $289,520 were collected at closing to account for the outstanding rent abatement and leasing commissions, respectively. |
| (5) | Chuck E. Cheese has signed a lease but is not in occupancy or paying rent. A reserve of $903,823 was collected at closing to account for the outstanding leasing commissions and landlord work. Also, an additional collateral reserve of $1,710,000 was collected at closing and will be held until Chuck E. Cheese is open for business and paying full, unabated rent. Chuck E. Cheese is expected to be open for business in October 2014. |
| (6) | Annual U/W Base Rent for ground lease tenants is excluded from the Annual U/W Base Rent PSF calculations. Ground lease tenant U/W Base rent and expirations are as follows: $353,435 U/W Base Rent expiring in 2017; $128,720 U/W Base Rent expiring in 2018; $112,860 U/W Base Rent expiring in 2020; $284,740 U/W Base Rent expiring after 2023. |
| (7) | Current occupancy includes three tenants (17.7% of the net rentable area and 12.3% of the U/W Base Rent) that have executed leases, but are not in occupancy. One tenant (8.8% of the net rentable area and 5.1% of U/W Base Rent) is expected to open the first quarter of 2014, one tenant (3.8% of the net rentable area and 2.3% of U/W Base Rent) is expected to open the second quarter of 2014 and one tenant (5.0% of the net rentable area and 4.9% of U/W Base Rent) is expected to open by the fourth quarter of 2014. Excluding these tenants, Current Occupancy is 78.0%. |
THE INFORMATION IN THIS STRUCTURAL AND COLLATERAL TERM SHEET IS NOT COMPLETE AND MAY BE AMENDED PRIOR TO THE TIME OF SALE. THIS TERM SHEET IS NOT AN OFFER TO SELL THESE SECURITIES AND IT IS NOT A SOLICITATION OF AN OFFER TO BUY THESE SECURITIES IN ANY JURISDICTION WHERE THE OFFER OR SALE IS NOT PERMITTED.
99
| HUDSON MALL |
The following table presents certain information relating to the historical sales at the Hudson Mall Property:
Historical Sales (PSF)(1)
| Tenant Name | 2010 | 2011 | 2012 |
| Marshalls | $315 | $329 | $300 |
| Old Navy | $343 | $372 | $371 |
| (1) | Historical Sales (PSF) are based on historical statements provided by the borrower. |
The following table presents certain information relating to the lease rollover schedule at the Hudson Mall Property:
Lease Expiration Schedule(1)(2)
Year Ending December 31, | No. of Leases Expiring | Expiring NRSF | % of Total NRSF | Cumulative Expiring NRSF | Cumulative % of Total NRSF | Annual U/W Base Rent | Annual U/W Base Rent PSF(3)(4) | |||||||||||||
| MTM | 1 | 2,033 | 0.7% | 2,033 | 0.7% | $24,000 | $11.81 | |||||||||||||
| 2013 | 0 | 0 | 0.0% | 2,033 | 0.7% | $0 | $0.00 | |||||||||||||
| 2014 | 4 | 9,255 | 3.3% | 11,288 | 4.0% | $178,530 | $19.29 | |||||||||||||
| 2015 | 8 | 33,622 | 11.9% | 44,910 | 15.9% | $686,118 | $20.41 | |||||||||||||
| 2016 | 5 | 13,645 | 4.8% | 58,555 | 20.7% | $323,704 | $23.72 | |||||||||||||
| 2017 | 7 | 21,928 | 7.8% | 80,483 | 28.5% | $721,909 | $16.80 | |||||||||||||
| 2018 | 5 | 6,779 | 2.4% | 87,262 | 30.9% | $242,478 | $16.78 | |||||||||||||
| 2019 | 0 | 0 | 0.0% | 87,262 | 30.9% | $0 | $0.00 | |||||||||||||
| 2020 | 3 | 43,963 | 15.5% | 131,225 | 46.4% | $657,643 | $12.39 | |||||||||||||
| 2021 | 3 | 19,649 | 6.9% | 150,874 | 53.4% | $361,752 | $18.41 | |||||||||||||
| 2022 | 4 | 68,161 | 24.1% | 219,035 | 77.5% | $652,055 | $9.57 | |||||||||||||
| 2023 | 3 | 40,430 | 14.3% | 259,465 | 91.8% | $521,850 | $12.91 | |||||||||||||
| Thereafter | 4 | 11,166 | 3.9% | 270,631 | 95.7% | $441,010 | $14.00 | |||||||||||||
| Vacant | 0 | 12,151 | 4.3% | 282,782 | 100.0% | $0 | $0.00 | |||||||||||||
| Total/Weighted Average | 47 | 282,782 | 100.0% | $4,811,049 | $14.53 | |||||||||||||||
| (1) | Information obtained from the underwritten rent roll. |
| (2) | Certain tenants may have lease termination options that are exercisable prior to the originally stated expiration date of the subject lease and that are not considered in the Lease Expiration Schedule. |
| (3) | Weighted Average Annual U/W Base Rent PSF excludes vacant space. |
| (4) | Annual U/W Base Rent for ground lease tenants is excluded from the Annual U/W Base Rent PSF calculations. Ground lease tenant U/W Base rent and expirations are as follows: $353,435 U/W Base Rent expiring 2017; $128,720 U/W Base Rent expiring 2018; $112,860 U/W Base Rent expiring 2020; $284,740 U/W Base Rent expiring after 2023. |
The following table presents historical occupancy percentages at the Hudson Mall Property:
Historical Occupancy
12/31/2010(1) | 12/31/2011(1)(2) | 12/31/2012(1)(3) | 11/19/2013(4) | |||
| 90.0% | 76.5% | 63.9% | 95.7% |
| (1) | Information obtained from the borrower. |
| (2) | The 2011 decline in occupancy is due in part to 6th Avenue Electronics (25,000 square feet) vacating its space. |
| (3) | The 2012 decline in occupancy is due in part to Staples and Jenuine reducing their space (12,124 and 10,687 square foot reductions, respectively) and New York & Company (10,780 square feet) vacating its space. |
| (4) | Eight tenants had lease commencement dates in 2013 (87,257 square feet; 30.9% of net rentable area; 23.5% of U/W Base Rent); one tenant has a lease commencement date in 2014 (10,866 square feet; 3.8% of net rentable area; 2.3% of U/W Base Rent). |
THE INFORMATION IN THIS STRUCTURAL AND COLLATERAL TERM SHEET IS NOT COMPLETE AND MAY BE AMENDED PRIOR TO THE TIME OF SALE. THIS TERM SHEET IS NOT AN OFFER TO SELL THESE SECURITIES AND IT IS NOT A SOLICITATION OF AN OFFER TO BUY THESE SECURITIES IN ANY JURISDICTION WHERE THE OFFER OR SALE IS NOT PERMITTED.
100
| HUDSON MALL |
Operating History and Underwritten Net Cash Flow. The following table presents certain information relating to the historical operating performance and Underwritten Net Cash Flow at the Hudson Mall Property:
Cash Flow Analysis
| 2011 | 2012 | TTM 8/31/2013 | U/W(1) | U/W $ per SF | |||||||||||
| Base Rent | $3,892,128 | $3,631,291 | $3,602,812 | $4,811,049 | $17.01 | ||||||||||
| Grossed Up Vacant Space | 0 | 0 | 0 | 439,190 | 1.55 | ||||||||||
| Percentage Rent | 380,571 | 283,853 | 275,442 | 178,222 | 0.63 | ||||||||||
| Total Reimbursables | 1,907,887 | 1,702,863 | 1,673,519 | 1,886,600 | 6.67 | ||||||||||
| Other Income | 262,078 | 191,237 | 225,758 | 187,487 | 0.66 | ||||||||||
| Less Vacancy & Credit Loss | (367,418) | (50,852) | (65,040) | (439,190)(2) | (1.55) | ||||||||||
| Effective Gross Income | $6,075,246 | $5,758,392 | $5,712,491 | $7,063,359 | $24.98 | ||||||||||
| Total Operating Expenses | $3,591,898 | $3,702,316 | $3,805,168 | $3,837,346 | $13.57 | ||||||||||
| Net Operating Income | $2,483,348 | $2,056,076 | $1,907,323 | $3,226,012 | $11.41 | ||||||||||
| TI/LC | 0 | 0 | 0 | 234,952 | 0.83 | ||||||||||
| Capital Expenditures | 0 | 0 | 0 | 70,696 | 0.25 | ||||||||||
| Net Cash Flow | $2,483,348 | $2,056,076 | $1,907,323 | $2,920,364 | $10.33 | ||||||||||
| NOI DSCR | 1.53x | 1.27x | 1.17x | 1.99x | |||||||||||
| NCF DSCR | 1.53x | 1.27x | 1.17x | 1.80x | |||||||||||
| NOI DY | 9.9% | 8.2% | 7.6% | 12.9% | |||||||||||
| NCF DY | 9.9% | 8.2% | 7.6% | 11.7% | |||||||||||
| (1) | Underwritten NOI is higher than historicals due to nine tenant leases (eight leases with a commencement date in 2013, representing 23.5% of U/W Base Rent; one lease with a commencement date in 2014, representing 2.3% of U/W Base Rent). |
| (2) | The underwritten economic vacancy is 8.4%. The Hudson Mall Property was 95.7% leased and 78.0% physically occupied as of November 19, 2013. |
Appraisal. As of the appraisal valuation date of October 4, 2013, the Hudson Mall Property had an “as-is” appraised value of $47,000,000.
Environmental Matters. According to the Phase I Environmental Site Assessment (“ESA”) dated October 8, 2013, historical recognized environmental conditions and recognized environmental conditions were identified. Three spills occurred on the Hudson Mall Property between 1993 and 1995. The cases related to the three spills are closed and the ESA recommends no further action. The ESA identified a separate release in 2013 in connection with removal and replacement of two 20,000 gasoline gallon tanks and one 15,000 gasoline gallon tank at the gas station outparcel operated by Hess Oil and recommends further action based on the outcome of the New Jersey Department of Environmental Protection (“NJDEP”) file review. Hess Oil is the responsible party, and its lease requires it to remediate the subsurface release and achieve regulatory closure. In 1999 a release occurred related to the dry cleaning facility at the Hudson Mall Property. Groundwater and vapor intrusion remediation investigations and actions were performed between 1999 and 2013. The ESA recommends (i) continued groundwater remediation until the NJDEP approves closure of the issue; and (ii) long-term collection of indoor air samples and, depending on the results of the assessment, either long-term indoor air monitoring or the installation of a sub-slab depressurization system. See “Escrows” for further detail on the additional remediation.
Market Overview and Competition. The Hudson Mall Property is situated approximately 0.2 miles west of State Route 440, which provides direct access to the Lincoln Highway, New Jersey Turnpike and Interstate 78. An on-site private shuttle provides direct access from the Hudson Mall Property to several Port Authority Trans-Hudson system stations and the Hudson-Bergen Light Rail System stations. Jersey City, New Jersey is a port of entry, transportation hub and manufacturing center for the Port of New York and New Jersey and is located across from Lower Manhattan between the Hudson River and Upper New York Bay and the Hackensack River and Newark Bay.
According to the appraisal, the Hudson Mall Property’s trade area encompasses a three mile radius. As of 2012, the estimated population within a three-mile radius of the Hudson Mall Property was approximately 246,789 and average household income was $67,529. According to the appraisal, the Hudson Mall Property is located within the Hudson retail submarket, which has an estimated inventory of approximately 2.1 million square feet with a 7.1% vacancy rate as of the second quarter of 2013. For the Hudson Mall Property, the appraiser concluded an average overall market rent of $15.95 per square foot, triple net. The appraiser assumed market rent of $13.00 per square foot for anchor and theater space, $15.83 per square foot for in-line space and $20.00 per square foot for outparcels.
THE INFORMATION IN THIS STRUCTURAL AND COLLATERAL TERM SHEET IS NOT COMPLETE AND MAY BE AMENDED PRIOR TO THE TIME OF SALE. THIS TERM SHEET IS NOT AN OFFER TO SELL THESE SECURITIES AND IT IS NOT A SOLICITATION OF AN OFFER TO BUY THESE SECURITIES IN ANY JURISDICTION WHERE THE OFFER OR SALE IS NOT PERMITTED.
101
| HUDSON MALL |
The following table presents certain information relating to comparable retail properties for the Hudson Mall Property:
Competitive Set(1)
Hudson Mall (Subject) | Newport Centre Mall | The Outlet Collection | Jersey Gardens | |||
| Location | Jersey City, NJ | Jersey City, NJ | Elizabeth, NJ | ||
| Distance from Subject | -- | 2.0 miles | 9.5 miles | ||
| Property Type | Anchored Retail | Super Regional Mall | Super Regional Mall | ||
| Year Built/Renovated | 1966/2000 | 1987/2005 | 1999/2013 | ||
| Anchors | Big Lots, Marshalls, Old Navy, Staples | Sears, JC Penney, Kohl’s, Macy’s | Loews Theatres, Burlington Coat Factory, Forever 21 | ||
| Total GLA | 282,782 SF | 1,147,913 SF | 1,298,801 SF | ||
| Total Occupancy | 96% | 98% | 99% |
| (1) | Information obtained from the appraisal. |
The Borrower. The borrower is Hudson Associates Limited Partnership, a single purpose entity. Edward M. Snider, the loan sponsor, is the guarantor of certain nonrecourse carveouts under the Hudson Mall Mortgage Loan.
The Sponsor. The loan sponsor is Edward M. Snider, who is currently the chairman of Comcast-Spectacor. Comcast-Spectacor is a sports and entertainment firm that operates in 46 of the 50 United States. Prior to becoming chairman of Comcast-Spectacor, Mr. Snider founded the Philadelphia Flyers National Hockey League franchise and created Spectacor, which merged with Comcast Corporation to create Comcast-Spectacor in 1996. In 1999, the Hudson Mall Property was the subject of a discounted payoff. See “Description of the Mortgage Pool – Default History, Bankruptcy Issues and Other Proceedings” in the Free Writing Prospectus.
Escrows. The loan documents provide for upfront escrows in the amount of $248,186 for real estate taxes, $600,000 for future tenant improvements and leasing commissions, $2,549,722 for outstanding rent and tenant improvements and leasing commissions associated with tenants not yet in occupancy or paying rent ($644,250 is for outstanding abated rent) and $304,375 for certain environmental testing. The borrower must engage an environmental consultant to complete the required remediation related to the dry cleaning facility or obtain a “No Further Action Letter” from the NJDEP (see “Environmental Matters” section). The loan documents also provide for ongoing monthly escrow deposits of $127,997 for real estate taxes and $28,000 for ongoing tenant improvements and leasing commissions (capped at $600,000). The loan documents do not require monthly escrows for insurance provided (i) no event of default has occurred and is continuing; (ii) the insurance required to be maintained by the borrower is maintained pursuant to one or more blanket policies; and (iii) the borrower provides the lender with timely proof of payment of insurance premiums.
Beginning upon the occurrence of a Termination Event (as defined below), and on each subsequent monthly payment date, the borrower shall deposit an amount equal to one year of base rent for the Specified Tenant (as defined below), divided by the number of months prior to the lease expiration date, which will be used for tenant improvements and leasing commissions relating to the renewal or releasing of the Specified Tenant’s space.
A “Termination Event” shall mean either: (i) the earlier of (a) Staples failing to renew its lease on or before January 31, 2021; (b) Big Lots failing to renew its lease on or before September 30, 2021; and (c) Marshalls failing to renew its lease on or before January 31, 2019; or (ii) the earlier of (a) Staples, Big Lots or Marshalls (“Specified Tenants”) pursues lease termination; and (b) a Specified Tenant provides notice of its intent not to renew its lease.
In addition, the borrower deposited an amount equal to $1,710,000 into an additional collateral reserve account. These funds will be released to the borrower upon satisfaction of the following conditions: (i) no event of default; (ii) an estoppel stating that Chuck E. Cheese accepted its space; and (iii) Chuck E. Cheese is in place, open for business and paying full unabated rent.
Lockbox and Cash Management. Upon the occurrence of a Cash Trap Event Period (as defined below), the borrower is required to establish a lender-controlled lockbox account into which the borrower will direct the tenants to deposit all rents directly. During a Cash Trap Event Period, all excess funds on deposit in the lockbox account are swept to a lender-controlled cash flow subaccount.
A “Cash Trap Event Period” will commence upon the earlier of (i) the occurrence and continuance of an event of default; and (ii) the net cash flow debt service coverage ratio falling below 1.30x at the end of any calendar month. A Cash Trap Event Period will expire, with regard to the circumstances in clause (i), upon the cure of such event of default, or, with regard to the circumstances in clause (ii), the net cash flow debt service coverage ratio being equal to or greater than 1.45x for one calendar quarter or 1.40x for two consecutive calendar quarters.
Property Management. The Hudson Mall Property is managed by Preit-Rubin, Inc.
THE INFORMATION IN THIS STRUCTURAL AND COLLATERAL TERM SHEET IS NOT COMPLETE AND MAY BE AMENDED PRIOR TO THE TIME OF SALE. THIS TERM SHEET IS NOT AN OFFER TO SELL THESE SECURITIES AND IT IS NOT A SOLICITATION OF AN OFFER TO BUY THESE SECURITIES IN ANY JURISDICTION WHERE THE OFFER OR SALE IS NOT PERMITTED.
102
| HUDSON MALL |
Assumption. The borrower has the two-time right to transfer the Hudson Mall Property, provided that no event of default has occurred and is continuing and certain other conditions are satisfied, including, but not limited to the following: (i) the lender’s reasonable determination that the proposed transferee and guarantor satisfy lender’s credit review and underwriting standards, taking into consideration transferee experience, financial strength and general business standing; (ii) execution of a recourse guaranty and an environmental indemnity by an affiliate of the transferee; and (iii) if requested by the lender, rating agency confirmation from DBRS, Fitch and Moody’s that the transfer will not result in a downgrade, withdrawal or qualification of the respective ratings assigned to the Series 2013-C18 Certificates.
Partial Release. Not permitted.
Real Estate Substitution. Not permitted.
Subordinate and Mezzanine Indebtedness. Not permitted.
Ground Lease. None.
Terrorism Insurance. The loan documents require that the [“special form”] insurance policy required to be maintained by the borrower provides coverage for terrorism in an amount equal to the full replacement cost of the Hudson Mall Property. The loan documents also require business interruption insurance covering no less than the 12-month period following the occurrence of a casualty event, together with a six-month extended period of indemnity.
THE INFORMATION IN THIS STRUCTURAL AND COLLATERAL TERM SHEET IS NOT COMPLETE AND MAY BE AMENDED PRIOR TO THE TIME OF SALE. THIS TERM SHEET IS NOT AN OFFER TO SELL THESE SECURITIES AND IT IS NOT A SOLICITATION OF AN OFFER TO BUY THESE SECURITIES IN ANY JURISDICTION WHERE THE OFFER OR SALE IS NOT PERMITTED.
103
| CEDAR RAPIDS OFFICE PORTFOLIO |
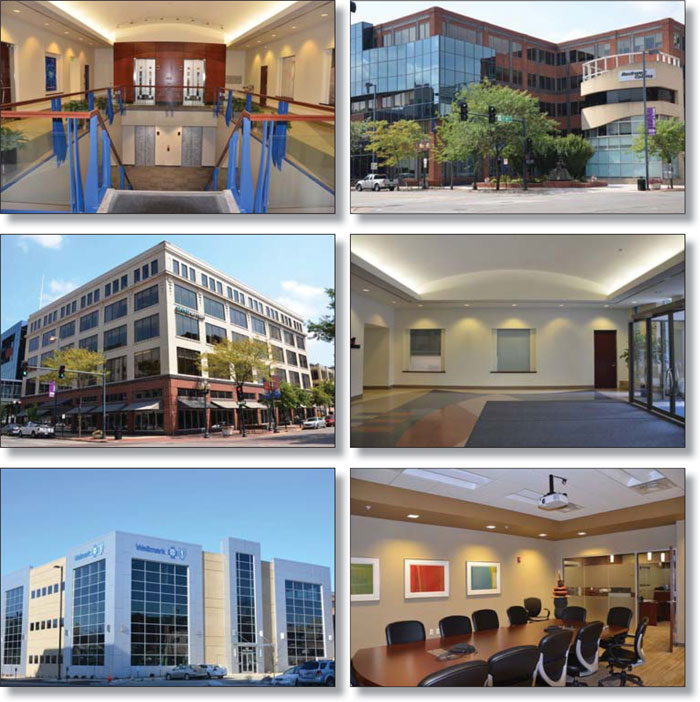
THE INFORMATION IN THIS STRUCTURAL AND COLLATERAL TERM SHEET IS NOT COMPLETE AND MAY BE AMENDED PRIOR TO THE TIME OF SALE. THIS TERM SHEET IS NOT AN OFFER TO SELL THESE SECURITIES AND IT IS NOT A SOLICITATION OF AN OFFER TO BUY THESE SECURITIES IN ANY JURISDICTION WHERE THE OFFER OR SALE IS NOT PERMITTED.
104
| CEDAR RAPIDS OFFICE PORTFOLIO |

THE INFORMATION IN THIS STRUCTURAL AND COLLATERAL TERM SHEET IS NOT COMPLETE AND MAY BE AMENDED PRIOR TO THE TIME OF SALE. THIS TERM SHEET IS NOT AN OFFER TO SELL THESE SECURITIES AND IT IS NOT A SOLICITATION OF AN OFFER TO BUY THESE SECURITIES IN ANY JURISDICTION WHERE THE OFFER OR SALE IS NOT PERMITTED.
105
| No. 9 – Cedar Rapids Office Portfolio | ||||||||||
| Loan Information | Property Information | |||||||||
| Mortgage Loan Seller: | Basis Real Estate Capital II, LLC | Single Asset/Portfolio: | Portfolio | |||||||
Credit Assessment (DBRS/Fitch/Moody’s): | NR/NR/NR | Property Type: | Office | |||||||
| Original Principal Balance: | $25,000,000 | Specific Property Type: | CBD | |||||||
| Cut-off Date Principal Balance: | $25,000,000 | Location: | Cedar Rapids, IA | |||||||
| % of Initial Pool Balance: | 2.4% | Size: | 227,195 SF | |||||||
| Loan Purpose: | Refinance | Cut-off Date Principal Balance Per SF: | $110.04 | |||||||
| Borrower Names: | Second Succession, LLC; Second Progression, LLC | Year Built/Renovated: | Various – See Table | |||||||
Sponsors: | Derek Roscoe, Steven Emerson, Jacob Danial and Lisa Roscoe | Title Vesting: | Various | |||||||
| Mortgage Rate: | 5.760% | Property Manager: | LOM Properties, LLC | |||||||
| Note Date: | December 6, 2013 | 3rd Most Recent Occupancy(2): | NAV | |||||||
| Anticipated Repayment Date: | NAP | 2nd Most Recent Occupancy(3): | 82.1% (12/31/2011) | |||||||
| Maturity Date: | January 1, 2024 | Most Recent Occupancy(3): | 92.8% (12/31/2012) | |||||||
| IO Period: | 1 month | Current Occupancy (As of)(4): | 94.6% (10/16/2013) | |||||||
| Loan Term (Original): | 121 months | |||||||||
| Seasoning: | 0 months | Underwriting and Financial Information: | ||||||||
| Amortization Term (Original): | 300 months | |||||||||
| Loan Amortization Type: | Interest Only, Amortizing Balloon | 3rd Most Recent NOI(3): | $1,953,309 (12/31/2011) | |||||||
| Interest Accrual Method: | Actual/360 | 2nd Most Recent NOI(3): | $2,434,392 (12/31/2012) | |||||||
| Call Protection: | L(24),D(95),O(2) | Most Recent NOI(5): | $3,220,893 (Various) | |||||||
| Lockbox Type: | Hard/Springing Cash Management | |||||||||
| Additional Debt: | None | |||||||||
| Additional Debt Type: | NAP | |||||||||
| U/W Revenues: | $4,249,281 | |||||||||
| U/W Expenses: | $1,425,660 | |||||||||
Escrows and Reserves(1): | U/W NOI: | $2,823,621 | ||||||||
| U/W NCF: | $2,421,049 | |||||||||
Type: | Initial | Monthly | Cap (If Any) | U/W NOI DSCR: | 1.49x | |||||
| Taxes | $201,453 | $40,291 | NAP | U/W NCF DSCR: | 1.28x | |||||
| Insurance | $45,760 | $15,253 | NAP | U/W NOI Debt Yield: | 11.3% | |||||
| Replacement Reserves | $0 | $3,787 | NAP | U/W NCF Debt Yield: | 9.7% | |||||
| TI/LC Reserve | $0 | $29,761 | $700,000 | As-Is Appraised Value: | $36,150,000 | |||||
| Rockwell Collins TI Reserve | $86,551 | $0 | NAP | As-Is Appraisal Valuation Date: | September 13, 2013 | |||||
| Deferred Maintenance | $4,125 | $0 | NAP | Cut-off Date LTV Ratio: | 69.2% | |||||
| Morgan Stanley TI Reserve | $141,300 | $0 | NAP | LTV Ratio at Maturity or ARD: | 53.1% | |||||
| (1) | See “Escrows” section. |
| (2) | Historical occupancy prior to 2011 is not available because the Town Center Office property was undergoing major renovations related to 2008 flood damage and other scheduled capital improvements, and the 600 Third Avenue property was not yet built. |
| (3) | The 2nd Most Recent Occupancy (12/31/2011), the Most Recent Occupancy (12/31/2012), the 2nd Most Recent NOI (12/31/2012) and the 3rd Most Recent NOI (12/31/2011) do not include the 600 Third Avenue property, which was not completed until late 2012. |
| (4) | Current occupancy includes one 3,000 square foot tenant, Citidal Partners, who has signed a lease and is expected to take occupancy in early January 2014. |
| (5) | Most Recent NOI is based on trailing 12 months as of September 2013 for the Town Center Office property and seven months annualized (March 2013 to September 2013) for the 600 Third Avenue property. |
The Mortgage Loan. The mortgage loan (the “Cedar Rapids Office Portfolio Mortgage Loan”) is evidenced by one promissory note that is secured by a first mortgage encumbering a portfolio comprised of two office buildings located in Cedar Rapids, Iowa (the “Cedar Rapids Office Portfolio Properties”). The Cedar Rapids Office Portfolio Mortgage Loan was originated on December 6, 2013 by Basis Real Estate Capital II, LLC. The Cedar Rapids Office Portfolio Mortgage Loan had an original principal balance of $25,000,000, has an outstanding principal balance as of the Cut-off Date of $25,000,000 and accrues interest at an interest rate of 5.760% per annum. The Cedar Rapids Office Portfolio Mortgage Loan had an initial term of 121 months, has a remaining term of 121 months as of the Cut-off Date and requires payments of principal and interest based on a 25-year amortization schedule through the maturity date. The Cedar Rapids Office Portfolio Mortgage Loan matures on January 1, 2024.
Following the lockout period, the borrower has the right to defease the Cedar Rapids Office Portfolio Mortgage Loan in whole, but not in part, on any date before December 1, 2023. In addition, the Cedar Rapids Office Portfolio Mortgage Loan is prepayable without penalty on or after December 1, 2023.
THE INFORMATION IN THIS STRUCTURAL AND COLLATERAL TERM SHEET IS NOT COMPLETE AND MAY BE AMENDED PRIOR TO THE TIME OF SALE. THIS TERM SHEET IS NOT AN OFFER TO SELL THESE SECURITIES AND IT IS NOT A SOLICITATION OF AN OFFER TO BUY THESE SECURITIES IN ANY JURISDICTION WHERE THE OFFER OR SALE IS NOT PERMITTED.
106
| CEDAR RAPIDS OFFICE PORTFOLIO |
Sources and Uses
| Sources | Uses | |||||||
| Original loan amount | $25,000,000 | 99.1% | Loan payoff | $23,465,575 | 93.0% | |||
| Borrower Equity Contribution | 220,221 | 0.9 | Outstanding leasing commissions | 493,974 | 2.0 | |||
| Reserves | 479,189 | 1.9 | ||||||
| Closing costs | 781,483 | 3.1 | ||||||
| Total Sources | $25,220,221 | 100.0% | Total Uses | $25,220,221 | 100.0% | |||
The Properties. The Cedar Rapids Office Portfolio Properties are comprised of two class A office buildings located in downtown Cedar Rapids, Iowa, the Town Center Office property and the 600 Third Avenue property. The Town Center Office property is a five-story office building consisting of 186,186 net rentable square feet on 1.7 acres. The Town Center Office property includes a four-story, 350-space parking garage (parking ratio of 1.88 to 1,000 net rentable square feet) and access to the downtown skywalk, which provides pedestrian access to other downtown office buildings. The Town Center Office property was built in three phases in 1913, 1965 and 1991. The borrower purchased the Town Center Office property in 2009 and spent approximately $7.8 million ($42 per square foot) in capital improvements from 2009 to 2012 as part of a major renovation. As of October 16, 2013, the Town Center Office property was 95.4% leased to 11 tenants. The 600 Third Avenue property is a three-story office building consisting of 41,009 net rentable square feet and 53 parking spaces (parking ratio of 1.29 to 1,000 net rentable square feet) situated on a 1.0 acre parcel. Approximately 60 new parking spaces are currently under construction at the 600 Third Avenue property. The sponsor completed construction of the 600 Third Avenue property in late 2012 at a total cost of approximately $13.3 million and leased the property up to 91.4% occupancy as of October 16, 2013.
The following table presents certain information relating to the Cedar Rapids Office Portfolio Properties:
| Property Name | Location | Allocated Cut- off Date Principal Balance | % of Portfolio Cut-off Date Principal Balance | Occupancy | Year Built/ Renovated | Net Rentable Area (SF) | As-Is Appraised Value |
| Town Center Office | Cedar Rapids, Iowa | $19,150,000 | 76.6% | 95.4% | 1913/2011 | 186,186 | $28,000,000 |
| 600 Third Avenue | Cedar Rapids, Iowa | $5,850,000 | 23.4% | 91.4%(1) | 2012/NAP | 41,009 | $8,150,000 |
| Total/Weighted Average | $25,000,000 | 100.0% | 94.6% | 227,195 | $36,150,000 |
| (1) | One tenant at the 600 Third Avenue property, Citidal Partners, representing 3,000 square feet (1.3% of the portfolio’s total square footage) has signed its lease but is not expected to take occupancy until early January, 2014. |
The following table presents certain information relating to the tenancy at the Cedar Rapids Office Portfolio Properties:
Major Tenants
| Tenant Name | Credit Rating (Fitch/Moody’s/ S&P) (1) | Tenant NRSF | % of NRSF | Annual U/W Base Rent PSF | Annual U/W Base Rent | % of Total Annual U/W Base Rent | Lease Expiration Date | |
| Major Tenants | ||||||||
| Rockwell Collins | A/A2/A | 73,139 | 32.2% | $11.37(2) | $831,555(2) | 30.0% | 4/30/2017 | |
| Shive Hattery | NR/NR/NR | 23,067 | 10.2% | $9.40 | $216,830 | 7.8% | 8/31/2015 | |
| McGladrey | NR/NR/NR | 21,246 | 9.4% | $14.00 | $297,444 | 10.7% | 10/31/2015 | |
| Bankers Trust | NR/NR/NR | 19,006 | 8.4% | $13.90 | $264,273 | 9.5% | 12/31/2016 | |
| Wellmark | NR/NR/A+ | 13,610 | 6.0% | $16.95 | $230,690 | 8.3% | 4/11/2017 | |
| Total Major Tenants | 150,068 | 66.1% | $12.27 | $1,840,791 | 66.5% | |||
| Non-Major Tenants | 64,968 | 28.6% | $14.26 | $926,480 | 33.5% | |||
Occupied Collateral Total(3) | 215,036 | 94.6% | $12.87 | $2,767,271 | 100.0% | |||
| Vacant Space | 12,159 | 5.4% | ||||||
| Collateral Total | 227,195 | 100.0% | ||||||
| (1) | Certain ratings are those of the parent company whether or not the parent guarantees the lease. |
| (2) | Rockwell Collin’s rent starts at $12.95 per square foot on December 1, 2013, decreases to $10.25 per square foot on May 1, 2014 and goes back up to $12.95 per square foot on May 1, 2016. The blended average rent of $11.37 per square foot has been underwritten, and is less than the current in-place rent and the appraiser’s market rent estimate for this space of $14.00 per square foot. |
| (3) | Occupied Collateral Total includes one 3,000 square foot tenant, Citidal Partners, (representing 1.3% of the portfolio net rentable square feet and 1.9% of the annual U/W base rent) that has signed a lease and is expected to take occupancy in early January, 2014. |
THE INFORMATION IN THIS STRUCTURAL AND COLLATERAL TERM SHEET IS NOT COMPLETE AND MAY BE AMENDED PRIOR TO THE TIME OF SALE. THIS TERM SHEET IS NOT AN OFFER TO SELL THESE SECURITIES AND IT IS NOT A SOLICITATION OF AN OFFER TO BUY THESE SECURITIES IN ANY JURISDICTION WHERE THE OFFER OR SALE IS NOT PERMITTED.
107
| CEDAR RAPIDS OFFICE PORTFOLIO |
The following table presents certain information relating to the lease rollover schedule at the Cedar Rapids Office Portfolio Properties:
Lease Expiration Schedule(1)(2)
Year Ending December 31, | No. of Leases Expiring | Expiring NRSF | % of Total NRSF | Cumulative Expiring NRSF | Cumulative % of Total NRSF | Annual U/W Base Rent | Annual U/W Base Rent PSF(3) | |
| MTM | 0 | 0 | 0.0% | 0 | 0.0% | $0 | $0.00 | |
| 2013 | 0 | 0 | 0.0% | 0 | 0.0% | $0 | $0.00 | |
| 2014 | 0 | 0 | 0.0% | 0 | 0.0% | $0 | $0.00 | |
| 2015 | 3 | 46,413 | 20.4% | 46,413 | 20.4% | $541,469 | $11.67 | |
| 2016 | 2 | 20,436 | 9.0% | 66,849 | 29.4% | $285,147 | $13.95 | |
| 2017 | 3 | 99,165 | 43.6% | 166,014 | 73.1% | $1,303,934 | $13.15 | |
| 2018 | 2 | 8,521 | 3.8% | 174,535 | 76.8% | $98,410 | $11.55 | |
| 2019 | 2 | 11,512 | 5.1% | 186,047 | 81.9% | $129,334 | $11.23 | |
| 2020 | 2 | 14,116 | 6.2% | 200,163 | 88.1% | $202,573 | $14.35 | |
| 2021 | 1 | 1,373 | 0.6% | 201,536 | 88.7% | $31,579 | $23.00 | |
| 2022 | 0 | 0 | 0.0% | 201,536 | 88.7% | $0 | $0.00 | |
| 2023 | 0 | 0 | 0.0% | 201,536 | 88.7% | $0 | $0.00 | |
| Thereafter | 1 | 13,500 | 5.9% | 215,036 | 94.6% | $174,825 | $12.95 | |
| Vacant | 0 | 12,159 | 5.4% | 227,195 | 100.0% | $0 | $0.00 | |
| Total/Weighted Average | 16 | 227,195 | 100.0% | $2,767,271 | $12.87 |
| (1) | Information obtained from the underwritten rent roll. |
| (2) | Certain tenants may have lease termination options that are exercisable prior to the originally stated expiration date of the subject lease and that are not considered in the Lease Expiration Schedule. |
| (3) | The Total/Weighted Average Annual U/W Base Rent PSF excludes vacant space. |
The following table presents historical occupancy percentages at the Cedar Rapids Office Portfolio Properties:
Historical Occupancy
12/31/2010(1) | 12/31/2011(2) | 12/31/2012(2) | 10/16/2013(3) | |||
| NAV | 82.1 % | 92.8 % | 94.6% |
| (1) | Historical occupancy prior to 2011 is not available because the Town Center Office property was undergoing major renovations related to 2008 flood damage, and the 600 Third Avenue property was not yet built. |
| (2) | Historical occupancy as of 12/31/2011 and as of 12/31/2012 does not include the square footage associated with the 600 Third Avenue property as it was built in late 2012. |
| (3) | Occupancy as of 10/16/2013 includes a 3,000 square foot tenant at the 600 Third Avenue property, Citidal Partners, which has signed a lease and is expected to take occupancy in early January 2014. |
THE INFORMATION IN THIS STRUCTURAL AND COLLATERAL TERM SHEET IS NOT COMPLETE AND MAY BE AMENDED PRIOR TO THE TIME OF SALE. THIS TERM SHEET IS NOT AN OFFER TO SELL THESE SECURITIES AND IT IS NOT A SOLICITATION OF AN OFFER TO BUY THESE SECURITIES IN ANY JURISDICTION WHERE THE OFFER OR SALE IS NOT PERMITTED.
108
| CEDAR RAPIDS OFFICE PORTFOLIO |
Operating History and Underwritten Net Cash Flow. The following table presents certain information relating to the historical operating performance and underwritten Net Cash Flow at the Cedar Rapids Office Portfolio Properties:
Cash Flow Analysis
2011(1) | 2012(1) | In Place (9/30/13)(2) | U/W | U/W $ per SF | |||||||
| Base Rent | $1,834,722 | $2,334,480 | $3,025,039 | $2,767,271 | $12.18 | ||||||
| Grossed Up Vacant Space | 0 | 0 | 0 | 183,396 | 0.81 | ||||||
| Parking Income | 197,775 | 196,685 | 243,360 | 335,760 | 1.48 | ||||||
| Other Income | 263 | 1,579 | 0 | 0 | 0.00 | ||||||
| Total Reimbursables | 869,324 | 881,253 | 1,032,959 | 1,307,390 | 5.75 | ||||||
| Less Vacancy & Credit Loss | 0 | 0 | 0 | (344,536)(3) | (1.52) | ||||||
| Effective Gross Income | $2,902,085 | $3,413,996 | $4,301,358 | $4,249,281 | $18.70 | ||||||
| Total Operating Expenses | $948,776 | $979,604 | $1,080,465 | $1,425,660 | $6.28 | ||||||
| Net Operating Income | $1,953,309 | $2,434,392 | $3,220,893 | $2,823,621 | $12.42 | ||||||
| TI/LC | 0 | 0 | 0 | 357,133 | 1.57 | ||||||
| Capital Expenditures | 0 | 0 | 0 | 45,439 | 0.20 | ||||||
| Net Cash Flow | $1,953,309 | $2,434,392 | $3,220,893 | $2,421,049 | $9.28 | ||||||
| NOI DSCR | 1.04x | 1.27x | 1.71x | 1.49x | |||||||
| NCF DSCR | 1.04x | 1.27x | 1.71x | 1.28x | |||||||
| NOI DY | 7.8% | 9.6% | 12.9% | 11.3% | |||||||
| NCF DY | 7.8% | 9.6% | 12.9% | 9.7% |
| (1) | The Cash Flow Analysis for 2011 and 2012 is based solely on the income and expenses at the Town Center Office property, because the 600 Third Avenue property was not completed until late 2012. |
| (2) | In Place is based on the trailing 12-month period ending September 2013 for the Town Center Office property and seven months annualized (March 2013 to September 2013) for the 600 Third Avenue property. |
| (3) | The underwritten economic vacancy is 7.5%. The Cedar Rapids Office Portfolio Properties were 93.3% physically occupied as of October 16, 2013 and will be 94.6% occupied once a 3,000 square foot tenant at the 600 Third Avenue building takes occupancy, which is expected to occur in early January 2014. |
Appraisal. As of the appraisal valuation date of September 13, the Cedar Rapids Office Portfolio Properties had an “as-is” appraised value of $36,150,000.
Environmental Matters. According to the Phase I environmental site assessment dated September 20, 2013, suspect asbestos containing materials (“ACMs”) were identified at the Town Center Office property. These ACMs were reported to be undamaged and in good condition at the time of assessment and an Asbestos-Containing Materials Operations & Maintenance Plan has been implemented.
According to the Phase I environmental site assessment dated September 20, 2013, there was no evidence of any recognized environmental condition at the 600 Third Avenue property.
Market Overview and Competition. The Cedar Rapids Office Portfolio Properties are located in downtown Cedar Rapids, Iowa. Cedar Rapids is the second largest city in Iowa and lies on both banks of the Cedar River. Cedar Rapids is situated 20 miles north of Iowa City (home of the University of Iowa which has approximately 21,974 undergraduate students, 9,091 postgraduate students, and 2,296 academic staff as of the Fall of 2013) and 100 miles east of Des Moines, the state capital and largest city in the state. The population of Cedar Rapids is 126,326 as of 2010 and the population of the metropolitan statistical area is 255,452. The Cedar Rapids Office Portfolio Properties are located in the Eastern Iowa Corridor Office Market. According to a third party research report, the total class A and class B inventory in the one-mile micro-market that comprises the majority of the downtown Cedar Rapids area where the Cedar Rapids Office Portfolio Properties are located is comprised of approximately 4.7 million square feet and has a current vacancy of 7.4% as of fourth quarter-to-date 2013. The total class A inventory is comprised of approximately 830,000 square feet and has a current vacancy of just 4.9% as of fourth quarter-to-date 2013. The Cedar Rapids Office Portfolio Properties are proximate to a number of cultural, business and social amenities in the downtown area, as well as the new convention and events complex/center (connected to a new Doubletree hotel), downtown river front amphitheater, Cedar Rapids Museum of Art, Theatre Cedar Rapids, new Cedar Rapids Public Library, new City Hall, new Federal Courthouse, and new Physicians Clinic of Iowa Medical Pavilion. The Town Center Office property is directly across the street from the Paramount Theatre, which serves as home to Orchestra Iowa, the Cedar Rapids Area Theater Organ Society, and a series of community concerts. The Paramount Theatre is included in the National Register of Historic Places. The new courthouse is located approximately three blocks from the Town Center Office property, which provides an amenity for a law firm (Elderkin and Pirine) at the Town Center Office property. This law firm renewed its lease at the Town Center Office property in July 2012. The new courthouse is located adjacent to the Great American Building which is also one of the premier office buildings in the downtown area. The Cedar Rapids Office Portfolio Properties are located a couple of blocks west (the Town Center Office Property) and a couple of blocks east (the 600 Third Avenue property) from Greene Square Park. The 600 Third Avenue property is located 0.5 miles northwest of the Medical Pavilion, which is an amenity for the subject’s Wellmark tenant, and directly across the street from the Century Link building.
THE INFORMATION IN THIS STRUCTURAL AND COLLATERAL TERM SHEET IS NOT COMPLETE AND MAY BE AMENDED PRIOR TO THE TIME OF SALE. THIS TERM SHEET IS NOT AN OFFER TO SELL THESE SECURITIES AND IT IS NOT A SOLICITATION OF AN OFFER TO BUY THESE SECURITIES IN ANY JURISDICTION WHERE THE OFFER OR SALE IS NOT PERMITTED.
109
| CEDAR RAPIDS OFFICE PORTFOLIO |
The following table presents certain information relating to comparable office properties to the Cedar Rapids Office Portfolio Properties:
Competitive Set(1)
Town Center Office (Subject) | 600 Third Avenue (Subject) | Great America Building | 118 2nd Ave | 500 1st Street | |
| Location | Cedar Rapids, IA | Cedar Rapids, IA | Cedar Rapids, IA | Cedar Rapids, IA | Cedar Rapids, IA |
| Distance from Town Center Office property | -- | 0.3 miles | 0.5 miles | 0.2 miles | 0.4 miles |
| Distance from 600 Third Avenue property | 0.3 miles | -- | 0.7 miles | 0.7 miles | 0.7 miles |
| Property Type | Office | Office | Office | Office | Office |
| Year Built/Renovated | 1913/2011 | 2012/NAP | 1998/NAP | 1923/NAP | 1983/NAP |
| Number of Stories | 5 | 3 | 8 | 4 | 2 |
| Total GLA | 186,186 SF | 41,009 SF | 140,483 SF | 82,144 SF | 75,000 SF |
| Total Occupancy | 95% | 91% | 83% | 100% | 100% |
| (1) | Information obtained from the underwritten rent roll and appraisal. |
The Borrowers. The borrowers are Second Succession, LLC (the Town Center Office property) and Second Progression, LLC (the 600 Third Avenue property), both Iowa limited liability companies with an independent director on the board of managers of each entity. Legal counsel to the borrower delivered a non-consolidation opinion in connection with the origination of the Cedar Rapids Office Portfolio Mortgage Loan. Jacob Danial and Lisa Roscoe are the guarantors of certain nonrecourse carveouts under the Cedar Rapids Office Portfolio Mortgage Loan. The borrowers and guarantors are also providing limited recourse to the Cedar Rapids Office Portfolio Mortgage Loan. See the “Recourse” section.
The Sponsors. The sponsors for the Cedar Rapids Office Portfolio are Derek Roscoe, Steven Emerson, Jacob Danial and Lisa Roscoe. Derek Roscoe, through Roscoe Holdings I, LLC, owns and operates over two million square feet of commercial real estate. In addition to the two subject properties, Steven Emerson owns a total of six other office/retail buildings in Cedar Rapids. Mr. Danial owns a portfolio of 17 properties located in Texas, Michigan, Kentucky, Florida, Iowa and Canada. Ms. Roscoe owns three commercial properties including the Cedar Rapids Office Portfolio properties. In 2009, an unrelated entity that completed the development and leasing of an office building where Mr. Danial was a passive investor filed bankruptcy. The matter was ultimately settled; for a more detailed description, see “Description of the Mortgage Pool—Default History, Bankruptcy Issues and Other Proceedings” in the Free Writing Prospectus. The loan documents require the guarantors to maintain a minimum net worth and liquidity of $20 million and $4 million, respectively, during the loan term.
Escrows. The loan documents provide for upfront escrows at closing in the amount of $201,453 for real estate taxes, $45,760 for insurance, $4,125 for deferred maintenance, $141,300 for unpaid tenant improvement allowance relating to the Morgan Stanley space and $86,551 for the Rockwell Collins Tenant Improvement Reserve. The loan documents also provide for ongoing monthly escrows in the amount of $40,291 for real estate taxes, $15,253 for insurance, $3,787 for replacement reserves and $29,761 for tenant improvements and leasing commissions (subject to a cap of $700,000).
Lockbox and Cash Management. The Cedar Rapids Office Portfolio Mortgage Loan requires a lender-controlled lockbox account, which is already in place, into which the tenants are directed to pay their rents directly. The loan documents also require that all cash revenues and all other monies received by the borrower or the property manager relating to the Cedar Rapids Office Portfolio Properties be deposited into the lockbox account within one business day of receipt. Prior to the occurrence of a Cash Management Period (as defined below), all funds on deposit in the lockbox account are swept into the borrower’s operating account on a daily basis. During a Cash Management Period, all funds on deposit in the lockbox account are swept on a daily basis to a cash management account under control of the lender.
A “Cash Management Period” will commence upon the earlier of: (i) the occurrence and continuance of an event of default; (ii) the debt service coverage ratio falling below 1.10x for two consecutive calendar quarters; or (iii) the occurrence of a Rockwell Collins Trigger Event (as defined below). A Cash Management Period will end with respect to the matters described in clause (i) above, when such event of default has been cured; with respect to the matters described in clause (ii) above, when a debt service coverage ratio of at least 1.15x has been achieved for two consecutive calendar quarters; or with respect to the matters described in clause (iii) above, when such Rockwell Collins Trigger Event has ended.
A “Rockwell Collins Trigger Event” means the occurrence of any one or more of the following events or date: (i) a bankruptcy action of Rockwell Collins; (ii) Rockwell Collins either provides notice of its intent to terminate its lease at the Town Center Office property or terminates its lease at the Town Center Office property prior to the expiration date; (iii) Rockwell Collins either provides notice of its intent to cease operations at the Town Center Office property or ceases its operations at the Town Center Office property; (iv) Rockwell Collins defaults (beyond applicable notice and cure periods expressly provided in its lease) in the performance of any of its obligations under the terms of its lease; (v) Rockwell Collins fails to provide timely notice of its intent to renew and extend its lease prior to the earlier of (x) 12 months prior to the scheduled lease renewal date or (y) the time period expressly set forth in the Rockwell Collins Lease.
THE INFORMATION IN THIS STRUCTURAL AND COLLATERAL TERM SHEET IS NOT COMPLETE AND MAY BE AMENDED PRIOR TO THE TIME OF SALE. THIS TERM SHEET IS NOT AN OFFER TO SELL THESE SECURITIES AND IT IS NOT A SOLICITATION OF AN OFFER TO BUY THESE SECURITIES IN ANY JURISDICTION WHERE THE OFFER OR SALE IS NOT PERMITTED.
110
| CEDAR RAPIDS OFFICE PORTFOLIO |
A Rockwell Collins Trigger Event will end once either the borrower or Sponsors deposit cash into the TI/LC reserve or delivers a letter of credit in the amount of $1,560,000.
Property Management. The Cedar Rapids Office Portfolio Properties are managed by an affiliate of the borrower.
Assumption. The borrower has the right to transfer the Cedar Rapids Office Portfolio Properties, in whole but not in part, subject to customary conditions set forth in the loan documents, including but not limited to: (i) no event of default has occurred and is continuing, (ii) the proposed transferee, the property manager and management agreement are satisfactory to the lender and applicable rating agencies; and (iii) rating agency confirmation from DBRS, Fitch and Moody’s that the transfer will not result in a downgrade, withdrawal or qualification of the respective ratings assigned to the Series 2013-C18 Certificates.
Partial Release. Not permitted.
Real Estate Substitution. Not permitted.
Subordinate and Mezzanine Indebtedness. Not permitted.
Ground Lease. The Town Center Office property is encumbered by three ground leases. All three ground leases are between the borrower, as lessee, and the City of Cedar Rapids (the “City”), as lessor.
The first ground lease dated May 27, 1964 gave the borrower a right of way over property owned by the City and the borrower constructed a parking ramp which permits access to a parking garage located at the Town Center Office property. The lease expires on October 31, 2033. Annual rent is $4,253 per year, which may be adjusted to fair market value every four years in accordance with the formula of the Cedar Rapids City Council.
The second ground lease, dated May 27, 1964 gave a right of way over property owned by the City and the borrower has connected certain skywalks for pedestrian access between buildings located on the Town Center Office property. The lease expires on October 31, 2033. Annual rent is $1,872 per year, which may be adjusted to fair market value every four years in accordance with the formula of the Cedar Rapids City Council.
The third ground lease dated September 18, 1991 gave a right of way over property owned by the City and the borrower has connected certain skywalks for pedestrian access between buildings located on the Town Center Office property. The lease expires on September 18, 2041. Annual rent is $1 with no adjustments.
Recourse. The borrower and sponsors provide recourse for a portion of the loan amount equal to the lesser of (x) $4,500,000; and (y) the outstanding principal balance, provided however, such recourse liability will be reduced to $3,000,000 upon satisfaction of the following conditions: (i) the borrower delivers written evidence acceptable to the lender in all respects, that Rockwell Collins has exercised its extension option pursuant to the express terms of its lease or the borrower has entered into a new lease acceptable to the lender in its reasonable discretion for the space presently occupied by Rockwell Collins and (ii) as of the date the Rockwell Collins lease is renewed or a replacement lease is approved, the lender has determined that the trailing 12-month DSCR shall be at least 1.30x.
Terrorism Insurance. The loan documents require that the “all risk” insurance policy required to be maintained by the borrower provides coverage from terrorism in an amount equal to the full replacement cost of the Cedar Rapids Office Portfolio Properties as well as business interruption insurance covering no less than the 12-month period following the occurrence of a casualty event, together with a six-month extended period of indemnity.
THE INFORMATION IN THIS STRUCTURAL AND COLLATERAL TERM SHEET IS NOT COMPLETE AND MAY BE AMENDED PRIOR TO THE TIME OF SALE. THIS TERM SHEET IS NOT AN OFFER TO SELL THESE SECURITIES AND IT IS NOT A SOLICITATION OF AN OFFER TO BUY THESE SECURITIES IN ANY JURISDICTION WHERE THE OFFER OR SALE IS NOT PERMITTED.
111
| HIE AT MAGNIFICENT MILE |

THE INFORMATION IN THIS STRUCTURAL AND COLLATERAL TERM SHEET IS NOT COMPLETE AND MAY BE AMENDED PRIOR TO THE TIME OF SALE. THIS TERM SHEET IS NOT AN OFFER TO SELL THESE SECURITIES AND IT IS NOT A SOLICITATION OF AN OFFER TO BUY THESE SECURITIES IN ANY JURISDICTION WHERE THE OFFER OR SALE IS NOT PERMITTED.
112
| HIE AT MAGNIFICENT MILE |
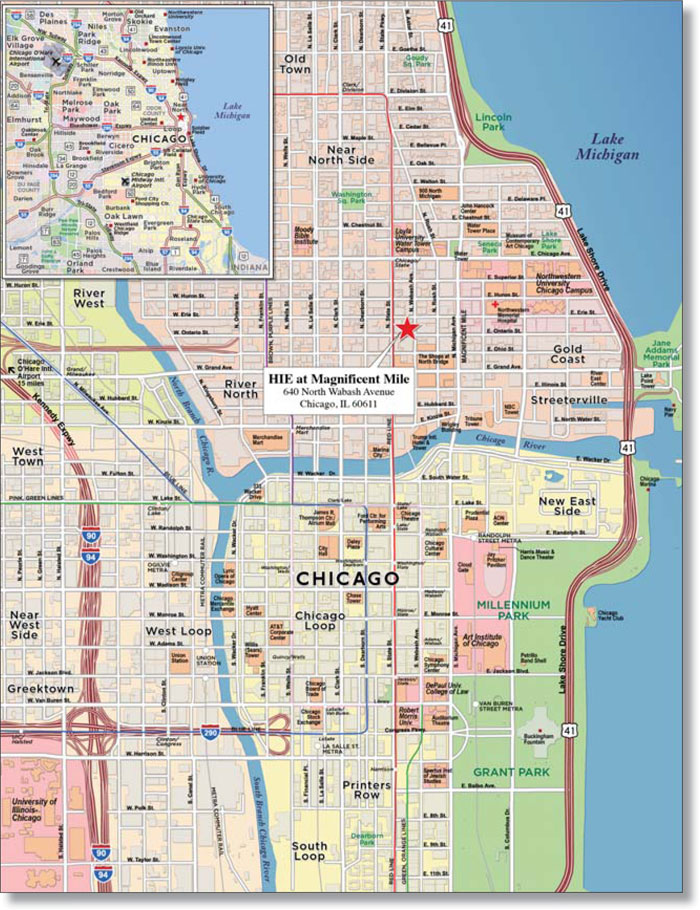
THE INFORMATION IN THIS STRUCTURAL AND COLLATERAL TERM SHEET IS NOT COMPLETE AND MAY BE AMENDED PRIOR TO THE TIME OF SALE. THIS TERM SHEET IS NOT AN OFFER TO SELL THESE SECURITIES AND IT IS NOT A SOLICITATION OF AN OFFER TO BUY THESE SECURITIES IN ANY JURISDICTION WHERE THE OFFER OR SALE IS NOT PERMITTED.
113
No. 10 – HIE at Magnificent Mile |
| Loan Information | Property Information | ||||||||
| Mortgage Loan Seller: | The Royal Bank of Scotland | Single Asset/Portfolio: | Single Asset | ||||||
Credit Assessment (DBRS/Fitch/Moody’s): | NR/NR/NR | Property Type: | Hospitality | ||||||
| Original Principal Balance: | $23,500,000 | Specific Property Type: | Limited Service | ||||||
| Cut-off Date Principal Balance: | $23,500,000 | Location: | Chicago, IL | ||||||
| % of Initial Pool Balance: | 2.3% | Size: | 174 rooms | ||||||
| Loan Purpose: | Refinance | Cut-off Date Principal Balance Per Room: | $135,057 | ||||||
| Borrower Name: | HCP Oxford OBG Cass Property Company, LLC | Year Built/Renovated: | 1927/2007 | ||||||
| Sponsor: | Oxford Capital Group, LLC | Title Vesting: | Fee | ||||||
| Mortgage Rate: | 5.257% | Property Manager: | Self-managed | ||||||
| Note Date: | December 5, 2013 | 3rd Most Recent Occupancy (As of): | 80.6% (12/31/2010) | ||||||
| Anticipated Repayment Date: | NAP | 2nd Most Recent Occupancy (As of): | 81.5% (12/31/2011) | ||||||
| Maturity Date: | January 1, 2024 | Most Recent Occupancy (As of): | 84.0% (12/31/2012) | ||||||
| IO Period: | 25 months | Current Occupancy (As of): | 86.1% (9/30/2013) | ||||||
| Loan Term (Original): | 121 months | ||||||||
| Seasoning: | 0 months | Underwriting and Financial Information: | |||||||
| Amortization Term (Original): | 360 months | ||||||||
| Loan Amortization Type: | Interest-only, Amortizing Balloon | 3rd Most Recent NOI (As of): | $1,789,888 (12/31/2011) | ||||||
| Interest Accrual Method: | Actual/360 | 2nd Most Recent NOI (As of): | $2,321,542(12/31/2012) | ||||||
| Call Protection: | L(24),D(94),O(3) | Most Recent NOI (As of): | $2,586,252 (TTM 9/30/2013) | ||||||
| Lockbox Type: | Hard/Springing Cash Management | ||||||||
Additional Debt(1): | Yes | U/W Revenues: | $8,365,744 | ||||||
Additional Debt Type(1): | Future Mezzanine | U/W Expenses: | $5,802,168 | ||||||
| U/W NOI: | $2,563,576 | ||||||||
| U/W NCF: | $2,228,946 | ||||||||
| U/W NOI DSCR: | 1.64x | ||||||||
| U/W NCF DSCR: | 1.43x | ||||||||
Escrows and Reserves(2): | U/W NOI Debt Yield: | 10.9% | |||||||
| U/W NCF Debt Yield: | 9.5% | ||||||||
Type: | Initial | Monthly | Cap (If Any) | As-Is Appraised Value: | $36,300,000 | ||||
| Taxes | $173,299 | $28,883 | NAP | As-Is Appraisal Valuation Date: | November 1, 2013 | ||||
| Insurance | $39,202 | $5,600 | NAP | Cut-off Date LTV Ratio: | 64.7% | ||||
| FF&E | $27,886 | $27,886 | NAP | LTV Ratio at Maturity or ARD: | 56.4% | ||||
| Deferred Maintenance | $5,625 | $0 | NAP | ||||||
| PIP | $390,185 | $0 | NAP | ||||||
| (1) | See “Subordinate and Mezzanine Indebtedness” section. |
| (2) | See “Escrows” section. |
The Mortgage Loan. The mortgage loan (the “HIE at Magnificent Mile Mortgage Loan”) is evidenced by a single promissory note that is secured by a first mortgage encumbering a limited service hotel located in Chicago, Illinois (the “HIE at Magnificent Mile Property”). The HIE at Magnificent Mile Mortgage Loan was originated on December 5, 2013 by The Royal Bank of Scotland. The HIE at Magnificent Mile Mortgage Loan had an original principal balance of $23,500,000, has an outstanding principal balance as of the Cut-off Date of $23,500,000 and accrues interest at an interest rate of 5.257% per annum. The HIE at Magnificent Mile Mortgage Loan had an initial term of 121 months, has a remaining term of 121 months as of the Cut-off Date and requires interest-only payments for the first 25 months following origination and, thereafter, requires payments of principal and interest based on a 30-year amortization schedule. The HIE at Magnificent Mile Mortgage Loan matures on January 1, 2024.
Following the lockout period, the borrower has the right to defease the HIE at Magnificent Mile Mortgage Loan in whole, but not in part, on any date before November 1, 2023. In addition, the HIE at Magnificent Mile Mortgage Loan is prepayable without penalty on or after November 1, 2023.
THE INFORMATION IN THIS STRUCTURAL AND COLLATERAL TERM SHEET IS NOT COMPLETE AND MAY BE AMENDED PRIOR TO THE TIME OF SALE. THIS TERM SHEET IS NOT AN OFFER TO SELL THESE SECURITIES AND IT IS NOT A SOLICITATION OF AN OFFER TO BUY THESE SECURITIES IN ANY JURISDICTION WHERE THE OFFER OR SALE IS NOT PERMITTED.
114
| HIE AT MAGNIFICENT MILE |
Sources and Uses
| Sources | Uses | |||||||
| Original loan amount | $23,500,000 | 100.0% | Loan payoff | $19,698,120 | 83.8% | |||
| Reserves | 636,197 | 2.7 | ||||||
| Closing costs | 318,472 | 1.4 | ||||||
| Return of equity | 2,847,211 | 12.1 | ||||||
| Total Sources | $23,500,000 | 100.0% | Total Uses | $23,500,000 | 100.0% |
The Property. The HIE at Magnificent Mile Property is a 174-room, 15-story limited service hotel located in downtown Chicago, Illinois. The HIE at Magnificent Mile Property was constructed in 1927 as the Hotel Cass, was subsequently renovated and rebranded to a Holiday Inn Express in 2007 and is currently undergoing a $2.2 million property improvement plan (“PIP”). Amenities at the HIE at Magnificent Mile Property include a business center, a breakfast dining area, vending areas, complimentary high speed internet access, fitness center and valet parking. The management agreement with M&M Building Management, Inc. expires in April, 2016, with no renewal options. The franchise agreement with Holiday Hospitality Franchising, Inc. expires in September, 2016.
Operating History and Underwritten Net Cash Flow. The following table presents certain information relating to the historical operating performance and the Underwritten Net Cash Flow at the HIE at Magnificent Mile Property:
Cash Flow Analysis
| 2011 | 2012 | TTM 9/30/2013 | U/W | U/W $ per Room | ||||||
| Occupancy | 81.5% | 84.0% | 86.1% | 84.0% | ||||||
| ADR | $128.60 | $141.87 | $147.61 | $147.61 | ||||||
| RevPAR | $104.81 | $119.17 | $127.09 | $123.99 | ||||||
| Total Revenue | $7,125,888 | $8,164,744 | $8,602,202 | $8,365,744 | $48,079 | |||||
| Total Department Expenses | 2,469,324 | 2,746,054 | 2,782,941 | 2,713,865 | 15,597 | |||||
| Gross Operating Profit | $4,656,564 | $5,418,690 | $5,819,261 | $5,651,879 | $32,482 | |||||
| Total Undistributed Expenses | 2,526,250 | 2,750,387 | 2,813,229 | 2,689,079 | 15,454 | |||||
| Profit Before Fixed Charges | $2,130,314 | $2,668,303 | $3,006,032 | $2,962,800 | $17,028 | |||||
Total Fixed Charges | 340,426 | 346,761 | 419,780 | 399,224 | 2,294 | |||||
| Net Operating Income | $1,789,888 | $2,321,542 | $2,586,252 | $2,563,576 | $14,733 | |||||
| FF&E | 0 | 0 | 0 | 334,630 | 1,923 | |||||
| Net Cash Flow | $1,789,888 | $2,321,542 | $2,586,252 | $2,228,946 | $12,810 | |||||
| NOI DSCR | 1.15x | 1.49x | 1.66x | 1.64x | ||||||
| NCF DSCR | 1.15x | 1.49x | 1.66x | 1.43x | ||||||
| NOI DY | 7.6% | 9.9% | 11.0% | 10.9% | ||||||
| NCF DY | 7.6% | 9.9% | 11.0% | 9.5% |
Appraisal. As of the appraisal valuation date of November 1, 2013, the HIE at Magnificent Mile Property had an “as-is” appraised value of $36,300,000.
Environmental Matters. According to the Phase I environmental site assessment dated November 10, 2013, there was no evidence of any recognized environmental conditions at the HIE at Magnificent Mile Property.
Market Overview and Competition. The HIE at Magnificent Mile Property is located in downtown Chicago, at the northwest quadrant of the intersection of East Ontario Street and North Wabash Avenue. The HIE at Magnificent Mile Property is located two blocks west of Michigan Avenue, also referred to as the Magnificent Mile, known for its mixture of upscale department stores, restaurants, high-end retailers and office buildings. The HIE at Magnificent Mile Property also benefits from Shedd Aquarium, Navy Pier, McCormick Place, Millennium Park, Pritzker Pavilion, the Chicago Children’s Museum, as well as two Major League Baseball Teams, the Cubs and White Sox. The HIE at Magnificent Mile is located less than 20 miles southeast of the O’Hare International Airport, off Interstate 90 and less than 15 miles northeast of Midway Airport, off Interstate 55. O’Hare International Airport and Midway Airport recorded more than 66.7 million and 19.5 million passengers in 2012, respectively.
THE INFORMATION IN THIS STRUCTURAL AND COLLATERAL TERM SHEET IS NOT COMPLETE AND MAY BE AMENDED PRIOR TO THE TIME OF SALE. THIS TERM SHEET IS NOT AN OFFER TO SELL THESE SECURITIES AND IT IS NOT A SOLICITATION OF AN OFFER TO BUY THESE SECURITIES IN ANY JURISDICTION WHERE THE OFFER OR SALE IS NOT PERMITTED.
115
| HIE AT MAGNIFICENT MILE |
The following table presents certain information relating to the HIE at Magnificent Mile Property’s competitive set:
Subject and Market Historical Occupancy, ADR and RevPAR(1)
Competitive Set | HIE at Magnificent Mile | Penetration Factor | |||||||||||||||
Year | Occupancy | ADR | RevPAR | Occupancy | ADR | RevPAR | Occupancy | ADR | RevPAR | ||||||||
| 9/30/2013 TTM | 85.2% | $169.89 | $144.79 | 86.4% | $148.35 | $128.11 | 101.3% | 87.3% | 88.5% | ||||||||
| 9/30/2012 TTM | 82.1% | $162.33 | $133.28 | 82.8% | $139.92 | $115.78 | 100.8% | 86.2% | 86.9% | ||||||||
| 9/30/2011 TTM | 78.6% | $154.52 | $121.41 | 79.7% | $130.09 | $103.70 | 101.5% | 84.2% | 85.4% | ||||||||
| (1) | Information obtained from a third party hospitality report dated October 17, 2013. According to such third party hospitality report, the competitive set includes the following hotels: ACME Hotel Company Chicago, Hampton Inn Suites Chicago Downtown, Hilton Garden Inn Chicago Downtown Magnificent Mile, Fairfield Inn & Suites Chicago Downtown, Courtyard Chicago Downtown Magnificent Mile and Four Points Chicago Downtown Magnificent Mile. |
The Borrower. The borrower is HCP Oxford OBG Cass Property Company, LLC, a Delaware limited liability company and a single purpose entity with two independent managers. Legal counsel to the borrower delivered a non-consolidation opinion in connection with the origination of the HIE at Magnificent Mile Mortgage Loan. Edward J. Doherty, John W. Rutledge, Roger G. Hill II and the John W. Rutledge Revocable Trust are the guarantors of certain nonrecourse carveouts under the HIE at Magnificent Mile Mortgage Loan, provided that the John W. Rutledge Revocable Trust shall have no obligations or liabilities under the guaranty unless and until the death of John W. Rutledge.
The Sponsor. The sponsor is Oxford Capital Group, LLC, which is headquartered in Chicago and has been run by John W. Rutledge since 1994. The sponsor has participated and developed approximately $2.5 billion of primarily hotel assets in over 12,000 rooms since its inception.
Escrows. The loan documents provide for upfront escrows at closing in the amount of $173,299 for real estate taxes, $39,202 for insurance, $27,886 for FF&E, $5,625 for deferred maintenance and $390,185 for completion of the work required under the PIP. The loan documents provide for ongoing monthly escrows in the amount of $28,883 for real estate taxes, $5,600 for insurance and $27,886 for FF&E.
Lockbox and Cash Management. The HIE at Magnificent Mile Mortgage Loan requires that a lender-controlled lockbox account be established at closing. All tenants of the HIE at Magnificent Mile Property and all credit card companies servicing the HIE at Magnificent Mile Property are directed to deposit income received from the HIE at Magnificent Mile Property directly into the lockbox account. Prior to the occurrence of a Cash Management Period (as defined below), all funds on deposit in the lockbox account are disbursed to the borrower. During a Cash Management Period, all funds on deposit in the lockbox are swept to a lender-controlled cash management account each business day.
A “Cash Management Period” will commence upon notice from the lender to the cash management bank of: (i) the maturity date, (ii) the occurrence and continuance of an event of default under the loan agreement, (iii) a debt service coverage ratio of less than 1.25x at the end of any calendar quarter or (iv) the commencement of a Franchise Agreement Sweep Period (as defined below). A Cash Management Period will end upon notice from the lender to the cash management bank that the sweeping of funds into the deposit account may cease, which notice the lender will only be required to give if (A) with respect to the matters described in clause (ii) above, such event of default has been cured and no other event of default has occurred and is continuing, (B) with respect to the matter described in clause (iii) above, the debt service coverage ratio being at least 1.25x for two consecutive calendar quarters or (C) with respect to the matter described in clause (iv) above, such Franchise Agreement Sweep Period has ended.
A “Franchise Agreement Sweep Period” will commence on the first due date following the date that is 12 months prior to the expiration of the franchise agreement, and will end upon the earlier to occur of (A) the date on which the borrower irrevocably exercises its renewal or extension option under the franchise agreement (or otherwise enters into an extension agreement acceptable to the lender with Holiday Hospitality Franchising, Inc.) or (B) the date on which the borrower re-franchises the hotel located at the HIE at Magnificent Mile Property pursuant to a replacement franchise agreement acceptable to the lender with a replacement franchisor.
Property Management. The HIE at Magnificent Mile Property is managed by an affiliate of the borrower.
Assumption. The borrower has the right to transfer the HIE at Magnificent Mile Property provided that certain conditions are satisfied, including (i) no event of default has occurred and is continuing; (ii) the lender reasonably determined that the proposed transferee and guarantor satisfy the lender’s credit review and underwriting standards, taking into consideration transferee experience, financial strength and general business standing; and (iii) the lender has received confirmation from DBRS, Fitch and Moody’s that such assumption will not result in a downgrade, withdrawal or qualification of the respective ratings assigned to the Series 2013-C18 Certificates.
Partial Release. Not permitted.
Real Estate Substitution. Not permitted.
Subordinate and Mezzanine Indebtedness. The borrower has the right to incur mezzanine financing subject to satisfaction of certain conditions, including: (i) no event of default has occurred and is continuing; (ii) the execution of an intercreditor agreement in form and substance reasonably acceptable to the lender; (iii) the loan-to-value ratio including all debt is not greater than 80%;
THE INFORMATION IN THIS STRUCTURAL AND COLLATERAL TERM SHEET IS NOT COMPLETE AND MAY BE AMENDED PRIOR TO THE TIME OF SALE. THIS TERM SHEET IS NOT AN OFFER TO SELL THESE SECURITIES AND IT IS NOT A SOLICITATION OF AN OFFER TO BUY THESE SECURITIES IN ANY JURISDICTION WHERE THE OFFER OR SALE IS NOT PERMITTED.
116
| HIE AT MAGNIFICENT MILE |
(iv) the amortizing debt service coverage ratio including all debt is not less than 1.20x; (v) the debt yield including all debt is not less than 8.5%; and (vi) receipt of rating agency confirmation from DBRS, Fitch and Moody’s that the mezzanine financing will not result in a downgrade, withdrawal or qualification of the respective ratings assigned to the Series 2013-C18 Certificates.
Ground Lease. None.
Terrorism Insurance. The loan documents require that the “all risk” insurance policy required to be maintained by the borrower provide coverage for terrorism in an amount equal to the full replacement cost of the HIE at Magnificent Mile Property, as well as business interruption insurance covering no less than the 18-month period following the occurrence of a casualty event, together with a six-month extended period of indemnity.
THE INFORMATION IN THIS STRUCTURAL AND COLLATERAL TERM SHEET IS NOT COMPLETE AND MAY BE AMENDED PRIOR TO THE TIME OF SALE. THIS TERM SHEET IS NOT AN OFFER TO SELL THESE SECURITIES AND IT IS NOT A SOLICITATION OF AN OFFER TO BUY THESE SECURITIES IN ANY JURISDICTION WHERE THE OFFER OR SALE IS NOT PERMITTED.
117
No. 11 – 200–400 West 45th Street |
| Loan Information | Property Information | |||||||
| Mortgage Loan Seller: | Liberty Island Group I LLC | Single Asset/Portfolio: | Single Asset | |||||
Credit Assessment (DBRS/Fitch/Moody’s): | NR/NR/NR | Property Type: | Office | |||||
| Original Principal Balance: | $19,050,000 | Specific Property Type: | Suburban | |||||
| Cut-off Date Principal Balance: | $19,050,000 | Location: | Fargo, ND | |||||
| % of Initial Pool Balance: | 1.8% | Size: | 216,719 SF | |||||
| Loan Purpose: | Refinance | Cut-off Date Principal Balance Per SF: | $87.90 | |||||
| Borrower Name: | West 45th Business Center, LLC | Year Built/Renovated: | 1998/2005 | |||||
| Sponsor: | Jim Roers | Title Vesting: | Fee | |||||
| Mortgage Rate: | 5.070% | Property Manager: | Roers Property Management LLC | |||||
| Note Date: | November 18, 2013 | 3rd Most Recent Occupancy (As of): | 92.1% (12/31/2010) | |||||
| Anticipated Repayment Date: | NAP | 2nd Most Recent Occupancy (As of): | 84.6% (12/31/2011) | |||||
| Maturity Date: | December 1, 2023 | Most Recent Occupancy (As of): | 100.0% (12/31/2012) | |||||
| IO Period: | None | Current Occupancy (As of): | 98.7% (11/1/2013) | |||||
| Loan Term (Original): | 120 months | |||||||
| Seasoning: | 0 months | Underwriting and Financial Information: | ||||||
| Amortization Term (Original): | 360 months | |||||||
| Loan Amortization Type: | Amortizing Balloon | 3rd Most Recent NOI (As of): | $1,927,990 (12/31/2011) | |||||
| Interest Accrual Method: | Actual/360 | 2nd Most Recent NOI (As of): | $2,196,768 (12/31/2012) | |||||
| Call Protection: | L(24),D(92),O(4) | Most Recent NOI (As of): | $2,256,334 (TTM 5/31/2013) | |||||
| Lockbox Type: | Hard/Springing Cash Management | |||||||
| Additional Debt: | None | |||||||
| Additional Debt Type: | NAP | U/W Revenues: | $2,846,621 | |||||
| U/W Expenses: | $978,839 | |||||||
| U/W NOI: | $1,867,782 | |||||||
| U/W NCF: | $1,654,289 | |||||||
Escrows and Reserves: | U/W NOI DSCR: | 1.51x | ||||||
| U/W NCF DSCR: | 1.34x | |||||||
Type: | Initial | Monthly | Cap (If Any) | U/W NOI Debt Yield: | 9.8% | |||
| Taxes | $407,336 | $33,945 | NAP | U/W NCF Debt Yield: | 8.7% | |||
| Insurance | $36,487 | $3,041 | NAP | As-Is Appraised Value: | $25,400,000 | |||
| Replacement Reserves | $3,720 | $3,720 | NAP | As-Is Appraisal Valuation Date: | July 24, 2013 | |||
TI/LC Reserve(1) | $4,167 | $4,167/Springing | $250,000(2) | Cut-off Date LTV Ratio: | 75.0% | |||
TI/LC Letter of Credit(1) | $250,000 | NAP | NAP | LTV Ratio at Maturity or ARD: | 61.8% | |||
| (1) | The loan documents require an upfront tenant improvement and leasing commissions reserve in the form of a letter of credit in the amount of $250,000. The borrower will reserve $4,167 monthly towards tenant improvement and leasing commissions, which may be used to reduce the letter of credit in an amount up to $50,000. In the event the total account (cash & LOC amounts) falls below $250,000, monthly collections of $13,500 will commence until its cap is subsequently reached. |
| (2) | The borrower will be required to post an additional $250,000 if either tenant, Wells Fargo or Sanford North gives notice that it is vacating any of its space. In the event either Wells Fargo or Sanford North gives notice a $450,000 cap will be in place with a floor of $250,000. |
The 200-400 West 45th Street mortgage loan is evidenced by a single promissory note that is secured by a first mortgage encumbering two adjacent office buildings, located in Fargo, North Dakota (the “200-400 West 45th Street Property”). The buildings were originally built in 1998, and renovated in 2005, with the sponsor converting the 200-400 West 45th Street Property from an industrial property to a mixed-use office property in 2007-2008. The 200-400 West 45th Street Property was built on 10.0 acres and contains 216,719 rentable square feet. The 200-400 West 45th Street Property contains 1,302 parking spaces reflecting a parking ratio of 6.0 spaces per 1,000 net rentable square feet. As of November 1, 2013, the 200-400 West 45th Street Property was 98.7% leased to nine tenants.
THE INFORMATION IN THIS STRUCTURAL AND COLLATERAL TERM SHEET IS NOT COMPLETE AND MAY BE AMENDED PRIOR TO THE TIME OF SALE. THIS TERM SHEET IS NOT AN OFFER TO SELL THESE SECURITIES AND IT IS NOT A SOLICITATION OF AN OFFER TO BUY THESE SECURITIES IN ANY JURISDICTION WHERE THE OFFER OR SALE IS NOT PERMITTED.
118
| 200 – 400 WEST 45TH STREET |
Sources and Uses
| Sources | Uses | |||||||
| Original loan amount | $19,050,000 | 100.0% | Loan payoff | $13,202,654 | 69.3% | |||
| Reserves | 451,710 | 2.4 | ||||||
| Closing costs | 488,997 | 2.6 | ||||||
| Return of equity | 4,906,640 | 25.8 | ||||||
| Total Sources | $19,050,000 | 100.0% | Total Uses | $19,050,000 | 100.0% | |||
The following table presents certain information relating to the tenancy at the 200-400 West 45th Street Property:
Major Tenants
| Tenant Name | Credit Rating (Fitch/ Moody’s/ S&P)(1) | Tenant NRSF | % of NRSF | Annual U/W Base Rent PSF | Annual U/W Base Rent | % of Total Annual U/W Base Rent | Lease Expiration Date | |||
| Major Tenants | ||||||||||
| Sanford North | NR/NR/NR | 78,683 | 36.2% | $10.35 | $814,306 | 38.1% | Various(2) | |||
| Wells Fargo | AA-/A2/A+ | 50,162 | 23.1% | $9.68 | $485,568 | 22.7% | 8/31/2018 | |||
| CBF Group | NR/NR/NR | 22,084 | 10.2% | $10.65 | $235,245 | 11.0% | 12/31/2014 | |||
| NAU/Ideal | NR/NR/NR | 21,165 | 9.7% | $10.50 | $222,233 | 10.4% | 6/30/2017 | |||
| Total Major Tenants | 172,094 | 79.2% | $10.21 | $1,757,352 | 82.2% | |||||
| Non-Major Tenants | 41,800 | 19.5% | $8.53 | $356,625 | 17.8% | |||||
| Occupied Collateral | 213,894 | 98.7% | $9.88 | $2,113,977 | 100.0% | |||||
| Vacant Space | 2,825 | 1.3% | ||||||||
| Collateral Total | 216,719 | 100.0% | ||||||||
| (1) | Certain ratings are those of the parent company whether or not the parent guarantees the lease. |
| (2) | Sanford North leases three spaces: 39,765 square feet with an Annual U/W Base Rent PSF of $10.11 and a lease expiration date of June 30, 2015; 35,636 square feet with an Annual U/W Base Rent PSF of $10.50 and a lease expiration date of March 31, 2021; and 3,282 square feet with an Annual U/W Base Rent PSF of $11.61 and a lease expiration date of June 30, 2015. |
The following table presents certain information relating to the lease rollover schedule at the 200-400 West 45th Street Property:
Lease Expiration Schedule(1)(2)
| Year Ending December 31, | No. of Leases Expiring | Expiring NRSF | % of Total NRSF | Cumulative of Total NRSF | Cumulative % of Total NRSF | Annual U/W Base Rent | Annual U/W Base Rent PSF(3) | |||||||
| MTM | 1 | 9,500 | 4.4% | 9,500 | 4.4% | $25,840 | $2.72 | |||||||
| 2013 | 0 | 0 | 0.0% | 9,500 | 4.4% | $0 | $0.00 | |||||||
| 2014 | 4 | 32,119 | 14.8% | 41,619 | 19.2% | $301,476 | $9.39 | |||||||
| 2015 | 3 | 44,600 | 20.6% | 86,219 | 39.8% | $456,435 | $10.23 | |||||||
| 2016 | 0 | 0 | 0.0% | 86,219 | 39.8% | $0 | $0.00 | |||||||
| 2017 | 2 | 24,293 | 11.2% | 110,512 | 51.0% | $255,077 | $10.50 | |||||||
| 2018 | 1 | 50,162 | 23.1% | 160,674 | 74.1% | $485,568 | $9.68 | |||||||
| 2019 | 0 | 0 | 0.0% | 160,674 | 74.1% | $0 | $0.00 | |||||||
| 2020 | 0 | 0 | 0.0% | 160,674 | 74.1% | $0 | $0.00 | |||||||
| 2021 | 1 | 35,636 | 16.4% | 196,310 | 90.6% | $374,178 | $10.50 | |||||||
| 2022 | 0 | 0 | 0.0% | 196,310 | 90.6% | $0 | $0.00 | |||||||
| 2023 | 0 | 0 | 0.0% | 196,310 | 90.6% | $0 | $0.00 | |||||||
| Thereafter | 1 | 17,584 | 8.1% | 213,894 | 98.7% | $215,404 | $12.25 | |||||||
| Vacant | 0 | 2,825 | 1.3% | 216,719 | 100.0% | $0 | $0.00 | |||||||
| Total/Weighted AverageAverage | 14 | 216,719 | 100.0% | $2,113,977 | $9.88 |
| (1) | Information obtained from the underwritten rent roll. |
| (2) | Certain tenants may have lease termination options that are exercisable prior to the stated expiration date of the subject lease and that are not considered in the Lease Expiration Schedule. |
| (3) | Weighted Average Annual U/W Base Rent PSF excludes vacant space. |
THE INFORMATION IN THIS STRUCTURAL AND COLLATERAL TERM SHEET IS NOT COMPLETE AND MAY BE AMENDED PRIOR TO THE TIME OF SALE. THIS TERM SHEET IS NOT AN OFFER TO SELL THESE SECURITIES AND IT IS NOT A SOLICITATION OF AN OFFER TO BUY THESE SECURITIES IN ANY JURISDICTION WHERE THE OFFER OR SALE IS NOT PERMITTED.
119
| 200 – 400 WEST 45TH STREET |
The following table presents historical occupancy percentages at the 200-400 West 45th Street Property:
Historical Occupancy(1)
12/31/2010 | 12/31/2011 | 12/31/2012 | 11/1/2013 | |||
| 92.1% | 84.6% | 100.0% | 98.7% |
| (1) | Information obtained from the borrower. |
Operating History and Underwritten Net Cash Flow. The following table presents certain information relating to the historical operating performance and Underwritten Net Cash Flow at the 200-400 West 45th Street Property:
Cash Flow Analysis
| 2011 | 2012 | TTM 5/31/2013 | U/W | U/W $ per SF | |||||||
| Base Rent | $1,895,705 | $2,071,564 | $2,106,305 | $2,113,977 | $9.75 | ||||||
| Grossed Up Vacant Space | 0 | 0 | 0 | 20,877 | 0.10 | ||||||
| Total Reimbursables | 841,194 | 884,115 | 898,692 | 968,301 | 4.47 | ||||||
| Other Income | 182,465 | 241,975 | 246,522 | 25,000(1) | 0.12 | ||||||
| Less Vacancy & Credit Loss | 0 | 0 | 0 | (281,534)(2) | (1.30) | ||||||
| Effective Gross Income | $2,919,364 | $3,197,654 | $3,251,519 | $2,846,621 | $13.14 | ||||||
| Total Operating Expenses | $991,374 | $1,000,886 | $995,185 | $978,839 | $4.52 | ||||||
| Net Operating Income | $1,927,990 | $2,196,768 | $2,256,334 | $1,867,782 | $8.62 | ||||||
| TI/LC | 0 | 0 | 0 | 170,149 | 0.79 | ||||||
| Capital Expenditures | 0 | 0 | 0 | 43,344 | 0.20 | ||||||
| Net Cash Flow | $1,927,990 | $2,196,768 | $2,256,334 | $1,654,290 | $7.63 | ||||||
| NOI DSCR | 1.56x | 1.78x | 1.82x | 1.51x | |||||||
| NCF DSCR | 1.56x | 1.78x | 1.82x | 1.34x | |||||||
| NOI DY | 10.1% | 11.5% | 11.8% | 9.8% | |||||||
| NCF DY | 10.1% | 11.5% | 11.8% | 8.7% |
| (1) | Historical Other Income consisted of reimbursed tenant improvements that were not considered in underwriting. |
| (2) | The underwritten economic vacancy is 9.0%. The 200-400 West 45th Street Property was 98.7% physically occupied as of November 1, 2013. |
THE INFORMATION IN THIS STRUCTURAL AND COLLATERAL TERM SHEET IS NOT COMPLETE AND MAY BE AMENDED PRIOR TO THE TIME OF SALE. THIS TERM SHEET IS NOT AN OFFER TO SELL THESE SECURITIES AND IT IS NOT A SOLICITATION OF AN OFFER TO BUY THESE SECURITIES IN ANY JURISDICTION WHERE THE OFFER OR SALE IS NOT PERMITTED.
120
(THIS PAGE INTENTIONALLY LEFT BLANK)
121
| No. 12 – Avilla Apartments |
| Loan Information | Property Information | ||||||
| Mortgage Loan Seller: | Wells Fargo Bank, National Association | Single Asset/Portfolio: | Single Asset | ||||
Credit Assessment (DBRS/Fitch/Moody’s): | NR/NR/NR | Property Type: | Multifamily | ||||
| Original Principal Balance: | $16,600,000 | Specific Property Type: | Garden | ||||
| Cut-off Date Principal Balance: | $16,600,000 | Location: | Marana, AZ | ||||
| % of Initial Pool Balance: | 1.6% | Size: | 166 units | ||||
| Loan Purpose: | Refinance | Cut-off Date Principal Balance Per Unit: | $100,000 | ||||
| Borrower Name: | Alta Vista Communities 4050 AD LLC | Year Built/Renovated: | 2013/NAP | ||||
Sponsors(1): | Roger Karber; Gurpreet S. Jaggi; Garry Brav | Title Vesting: | Fee | ||||
| Mortgage Rate: | 4.450% | Property Manager: | MEB Management Services | ||||
| Note Date: | November 27, 2013 | 3rd Most Recent Occupancy (As of)(2): | NAV | ||||
| Anticipated Repayment Date: | NAP | 2nd Most Recent Occupancy (As of)(2): | NAV | ||||
| Maturity Date: | December 1, 2018 | Most Recent Occupancy (As of)(2): | NAV | ||||
| IO Period: | 12 months | Current Occupancy (As of): | 92.8% (11/13/2013) | ||||
| Loan Term (Original): | 60 months | ||||||
| Seasoning: | 0 months | Underwriting and Financial Information: | |||||
| Amortization Term (Original): | 360 months | ||||||
| Loan Amortization Type: | Interest-only, Amortizing Balloon | 3rd Most Recent NOI (As of): | NAV | ||||
| Interest Accrual Method: | Actual/360 | 2nd Most Recent NOI (As of): | $647,885 (Annualized 9 9/30/2013) | ||||
| Call Protection: | L(24),D(32),O(4) | Most Recent NOI (As of): | $933,045 (Annualized 6 9/30/2013) | ||||
| Lockbox Type: | Soft/Springing Cash Management | ||||||
| Additional Debt: | None | U/W Revenues: | $2,016,501 | ||||
| Additional Debt Type: | NAP | U/W Expenses: | $650,147 | ||||
U/W NOI(3): | $1,366,355 | ||||||
| U/W NCF: | $1,324,855 | ||||||
| U/W NOI DSCR: | 1.36x | ||||||
Escrows and Reserves: | U/W NCF DSCR: | 1.32x | |||||
| U/W NOI Debt Yield: | 8.2% | ||||||
| Type: | Initial | Monthly | Cap (If Any) | U/W NCF Debt Yield: | 8.0% | ||
| Taxes | $24,500 | $12,250 | NAP | As-Is Appraised Value: | $24,250,000 | ||
| Insurance | $6,094 | $6,094 | NAP | As-Is Appraisal Valuation Date: | October 14, 2013 | ||
| Replacement Reserves | $0 | $3,458 | $83,000 | Cut-off Date LTV Ratio: | 68.5% | ||
| LTV Ratio at Maturity or ARD: | 63.9% | ||||||
| (1) | Certain affiliated companies of Gurpreet S. Jaggi filed Chapter 11 bankruptcy in August 2007. See “Description of the Mortgage Pool – Default History, Bankruptcy Issues and Other Proceedings” in the Free Writing Prospectus. |
| (2) | Historical occupancy is not available as the Avilla Apartments Property was constructed in 2013. |
| (3) | See “Cash Flow Analysis” section. |
The Avilla Apartments mortgage loan is evidenced by a single promissory note that is secured by a first mortgage encumbering a 166-unit property located in Marana, Arizona (the “Avilla Apartments Property”). The Avilla Apartments Property is situated on a 12.3-acre site and is located approximately eight miles northwest of the Tucson central business district. The Avilla Apartments Property has gated access and consists of 32 one bedroom/one bathroom units, 77 two bedroom/two bathroom units and 57 three bedroom/two bathroom units. Each unit has granite countertops, maple cabinetry, stainless steel appliances and washer and dryers. The Avilla Apartments Property provides 372 parking spaces, including 186 carports and 10 detached garages with 40 single car spaces, for a parking ratio of 2.2 spaces per unit. As of November 13, 2013, the Avilla Apartments Property was 92.8% occupied.
Sources and Uses
| Sources | Uses | |||||||
| Original loan amount | $16,600,000 | 100.0% | Loan payoff | $14,597,020 | 87.9% | |||
| Reserves | 30,594 | 0.2 | ||||||
| Closing costs | 544,179 | 3.3 | ||||||
| Return of equity | 1,428,207 | 8.6 | ||||||
| Total Sources | $16,600,000 | 100.0% | Total Uses | $16,600,000 | 100.0% |
THE INFORMATION IN THIS STRUCTURAL AND COLLATERAL TERM SHEET IS NOT COMPLETE AND MAY BE AMENDED PRIOR TO THE TIME OF SALE. THIS TERM SHEET IS NOT AN OFFER TO SELL THESE SECURITIES AND IT IS NOT A SOLICITATION OF AN OFFER TO BUY THESE SECURITIES IN ANY JURISDICTION WHERE THE OFFER OR SALE IS NOT PERMITTED.
122
| AVILLA APARTMENTS |
The following table presents certain information relating to the unit mix of the Avilla Apartments Property:
Unit Mix Summary(1)
| Unit Type | No. of Units | % of Total Units | Average Unit Size (SF) | Average Rent |
| 1 Bedroom/1 Bathroom | 32 | 19.3 | 635 | $824 |
| 2 Bedroom/2 Bathroom | 77 | 46.4 | 965 | 1,025 |
| 3 Bedroom/2 Bathroom | 57 | 34.3 | 1,244 | 1,206 |
| Total/Weighted Average | 166 | 100.0% | 997 | $1,050 |
| (1) | Information obtained from the borrower’s rent roll. |
The following table presents historical occupancy percentages at the Avilla Apartments Property:
Historical Occupancy Percentages
12/31/2010 | 12/31/2011 | 12/31/2012 | 11/13/2013 | |||
NAV(1) | NAV(1) | NAV(1) | 92.8% |
| (1) | Historical occupancy is not available as the Avilla Apartments Property was constructed in 2013. |
Operating History and Underwritten Net Cash Flow. The following table presents certain information relating to the historical operating performance and the Underwritten Net Cash Flow at the Avilla Apartments Property:
Cash Flow Analysis
| Annualized 9 9/30/2013 | Annualized 6 9/30/2013 | U/W(1) | U/W $ per Unit | |||||||
| Base Rent | $1,152,180 | $1,504,894 | $1,939,536 | $11,684 | ||||||
| Grossed Up Vacant Space | 923,924 | 574,750 | 153,216 | 923 | ||||||
| Less Concessions | (66,519) | (85,304) | (58,748) | (354) | ||||||
| Other Income | 114,216 | 143,222 | 139,714 | 842 | ||||||
| Less Vacancy & Credit Loss | (928,363) | (576,447) | (157,216)(2) | (947) | ||||||
| Effective Gross Income | $1,195,438 | $1,561,115 | $2,016,501 | $12,148 | ||||||
| Total Operating Expenses | 547,553 | 628,070 | 650,147 | 3,917 | ||||||
| Net Operating Income | $647,885 | $933,045 | $1,366,355 | $8,231 | ||||||
| Replacement Reserves | 0 | 0 | 41,500 | 250 | ||||||
| Net Cash Flow | $647,885 | $933,045 | $1,324,855 | $7,981 | ||||||
| NOI DSCR | 0.65x | 0.93x | 1.36x | |||||||
| NCF DSCR | 0.65x | 0.93x | 1.32x | |||||||
| NOI DY | 3.9% | 5.6% | 8.2% | |||||||
| NCF DY | 3.9% | 5.6% | 8.0% | |||||||
| (1) | Underwritten Net Operating Income is higher than historicals due to the Avilla Apartments Property being constructed in 2013. |
| (2) | The underwritten economic vacancy is 7.3%. The Avilla Apartments Property was 92.8% physically occupied as of November 13, 2013. |
THE INFORMATION IN THIS STRUCTURAL AND COLLATERAL TERM SHEET IS NOT COMPLETE AND MAY BE AMENDED PRIOR TO THE TIME OF SALE. THIS TERM SHEET IS NOT AN OFFER TO SELL THESE SECURITIES AND IT IS NOT A SOLICITATION OF AN OFFER TO BUY THESE SECURITIES IN ANY JURISDICTION WHERE THE OFFER OR SALE IS NOT PERMITTED.
123
| No. 13 – Desert Tree Apartments |
| Loan Information | Property Information | ||||||
| Mortgage Loan Seller: | Wells Fargo Bank, National Association | Single Asset/Portfolio: | Single Asset | ||||
Credit Assessment (DBRS/Fitch/Moody’s): | NR/NR/NR | Property Type: | Multifamily | ||||
| Original Principal Balance: | $14,975,000 | Specific Property Type: | Garden | ||||
| Cut-off Date Principal Balance: | $14,975,000 | Location: | El Paso, TX | ||||
| % of Initial Pool Balance: | 1.4% | Size: | 445 Units | ||||
| Loan Purpose: | Refinance | Cut-off Date Principal Balance Per Unit: | $33,652 | ||||
| Borrower Name: | EPT Desert Tree, LP | Year Built/Renovated: | 1983/NAP | ||||
Sponsors(1)(2): | Richard Aguilar; Randal Wechter | Title Vesting: | Fee | ||||
| Mortgage Rate: | 5.000% | Property Manager: | Self-managed | ||||
| Note Date: | December 2, 2013 | 3rd Most Recent Occupancy (As of)(4): | 99.0% (12/31/2010) | ||||
| Anticipated Repayment Date: | NAP | 2nd Most Recent Occupancy (As of)(4): | 94.6% (12/31/2011) | ||||
| Maturity Date: | January 1, 2024 | Most Recent Occupancy (As of)(4): | 90.4% (12/31/2012) | ||||
| IO Period: | 25 months | Current Occupancy (As of): | 93.5% (11/26/2013) | ||||
| Loan Term (Original): | 121 months | ||||||
| Seasoning: | 0 months | Underwriting and Financial Information: | |||||
| Amortization Term (Original): | 360 months | ||||||
| Loan Amortization Type: | Interest-only, Amortizing Balloon | 3rd Most Recent NOI (As of): | $1,905,228 (12/31/2011) | ||||
| Interest Accrual Method: | Actual/360 | 2nd Most Recent NOI (As of): | $1,833,803 (12/31/2012) | ||||
| Call Protection: | L(24),D(93),O(4) | Most Recent NOI (As of): | $1,628,101 (TTM 9/30/2013) | ||||
| Lockbox Type: | Springing (Without Established Account) | ||||||
| Additional Debt: | None | U/W Revenues: | $2,760,596 | ||||
| Additional Debt Type: | NAP | U/W Expenses: | $1,205,593 | ||||
| U/W NOI: | $1,555,003 | ||||||
| U/W NCF: | $1,437,968 | ||||||
| U/W NOI DSCR: | 1.61x | ||||||
Escrows and Reserves: | U/W NCF DSCR: | 1.49x | |||||
| U/W NOI Debt Yield: | 10.4% | ||||||
| Type: | Initial | Monthly | Cap (If Any) | U/W NCF Debt Yield: | 9.6% | ||
| Taxes | $31,810 | $15,905 | NAP | As-Is Appraised Value: | $19,970,000 | ||
Insurance(3) | $0 | Springing | NAP | As-Is Appraisal Valuation Date: | November 6, 2013 | ||
| Replacement Reserves | $0 | $9,753 | $351,105 | Cut-off Date LTV Ratio: | 75.0% | ||
| Deferred Maintenance | $13,500 | $0 | NAP | LTV Ratio at Maturity or ARD: | 64.9% | ||
| (1) | Since 2009, affiliates of the sponsors have been separately involved in Chapter 11 bankruptcy filings on behalf of three borrowing entities. See “Description of the Mortgage Pool – Default History, Bankruptcy Issues and Other Proceedings” in the Free Writing Prospectus. |
| (2) | Richard Aguilar also serves as a loan sponsor for the San Marcos Apartments mortgage loan, which has a Cut-off Date Principal Balance of $14,375,000 and is being contributed to the WFRBS 2013-C18 Trust. See “Description of the Mortgage Pool – Certain Characteristics of the Mortgage Pool – Multi-Property Mortgage Loans; Mortgage Loans with Affiliated Borrowers” in the Free Writing Prospectus. |
| (3) | Monthly insurance escrows are not required provided the following conditions are satisfied: (i) no event of default has occurred and is continuing; (ii) the Desert Tree Apartments Property is covered under a blanket insurance policy acceptable to the lender; and (iii) the borrower provides evidence of renewal of the policies and of timely proof of payment of insurance premiums. |
| (4) | Represents the average occupancy over the preceding 12-month period. |
The Desert Tree Apartments mortgage loan is evidenced by a single promissory note that is secured by a first mortgage encumbering a 445-unit class B multifamily property located in El Paso, Texas (the “Desert Tree Apartments Property”). The Desert Tree Apartments Property is situated on a 15.4-acre site and is located approximately eight miles east of downtown El Paso, six miles southeast of the Fort Bliss military base and less than one mile south of the El Paso International Airport. The Desert Tree Apartments Property consists of 144 studio units, 296 one bedroom/one bathroom units and five two bedroom/one bathroom units. The Desert Tree Apartments Property was built in 1983 and amenities include two leasing centers, an all-purpose building with fitness room, racquetball court and laundry facilities; picnic areas with gas and charcoal grills, pool with hot tub, playground, lighted volleyball and basketball courts, tennis courts and a jogging trail. The Desert Tree Apartments Property contains 810 parking spaces, resulting in a parking ratio of 1.8 spaces per unit. As of November 26, 2013, the Desert Tree Apartments Property was 93.5% occupied.
THE INFORMATION IN THIS STRUCTURAL AND COLLATERAL TERM SHEET IS NOT COMPLETE AND MAY BE AMENDED PRIOR TO THE TIME OF SALE. THIS TERM SHEET IS NOT AN OFFER TO SELL THESE SECURITIES AND IT IS NOT A SOLICITATION OF AN OFFER TO BUY THESE SECURITIES IN ANY JURISDICTION WHERE THE OFFER OR SALE IS NOT PERMITTED.
124
| DESERT TREE APARTMENTS |
Sources and Uses
| Sources | Uses | |||||||
| Original loan amount | $14,975,000 | 100.0% | Loan payoff(1) | $6,645,675 | 44.4% | |||
| Reserves | 45,310 | 0.3 | ||||||
| Closing costs | 248,228 | 1.7 | ||||||
| Return of equity | 8,035,787 | 53.7 | ||||||
| Total Sources | $14,975,000 | 100.0% | Total Uses | $14,975,000 | 100.0% |
| (1) | The Desert Tree Apartments Property was previously securitized in BACM 2003-2. |
The following table presents certain information relating to the unit mix of the Desert Tree Apartments Property:
Unit Mix Summary(1)
| Unit Type | No. of Units | % of Total Units | Average Unit Size (SF) | Average Monthly U/W Base Rent |
| Studio/1 Bathroom | 144 | 32.4% | 322 | $463 |
| 1 Bedroom/1 Bathroom | 296 | 66.5% | 418 | $504 |
| 2 Bedroom/1 Bathroom | 5 | 1.1% | 836 | $793 |
| Total/Weighted Average | 445 | 100.0% | 392 | $494 |
| (1) | Information obtained from the underwritten rent roll. |
The following table presents historical occupancy percentages at the Desert Tree Apartments Property:
Historical Occupancy Percentages
12/31/2010(1)(2) | 12/31/2011(1)(2) | 12/31/2012(1)(2) | 11/26/2013 | |||
| 99.0% | 94.6% | 90.4% | 93.5% |
| (1) | Information obtained from the borrower. |
| (2) | Represents the average occupancy over the preceding 12-month period. |
Operating History and Underwritten Net Cash Flow. The following table presents certain information relating to the historical operating performance and the Underwritten Net Cash Flow at the Desert Tree Apartments Property:
Cash Flow Analysis
| 2011 | 2012 | TTM 9/30/2013 | U/W | U/W $ per Unit | ||||||||
| Base Rent | $2,571,758 | $2,598,004 | $2,495,453 | $2,464,812 | $5,539 | |||||||
| Grossed Up Vacant Space | 0 | 0 | 0 | 172,152 | 387 | |||||||
| Less Concessions | (5,990) | (42,921) | (36,941) | (36,941) | (83) | |||||||
| Other Income | 416,010 | 388,947 | 365,318 | 365,318 | 821 | |||||||
| Less Vacancy & Credit Loss | (21,224) | (35,159) | (20,157) | (204,744)(1) | (460) | |||||||
| Effective Gross Income | $2,960,554 | $2,908,871 | $2,803,672 | $2,760,596 | $6,204 | |||||||
| Total Operating Expenses | $1,055,326 | $1,075,068 | $1,175,571 | $1,205,593 | $2,709 | |||||||
| Net Operating Income | $1,905,228 | $1,833,803 | $1,628,101 | $1,555,003 | $3,494 | |||||||
| Replacement Reserves | 0 | 0 | 0 | 117,035 | 263 | |||||||
| Net Cash Flow | $1,905,228 | $1,833,803 | $1,628,101 | $1,437,968 | $3,231 | |||||||
| NOI DSCR | 1.98x | 1.90x | 1.69x | 1.61x | ||||||||
| NCF DSCR | 1.98x | 1.90x | 1.69x | 1.49x | ||||||||
| NOI DY | 12.7% | 12.2% | 10.9% | 10.4% | ||||||||
| NCF DY | 12.7% | 12.2% | 10.9% | 9.6% | ||||||||
| (1) | The underwritten economic vacancy is 7.0%. The Desert Tree Apartments Property was 93.5% physically occupied as of November 26, 2013. |
THE INFORMATION IN THIS STRUCTURAL AND COLLATERAL TERM SHEET IS NOT COMPLETE AND MAY BE AMENDED PRIOR TO THE TIME OF SALE. THIS TERM SHEET IS NOT AN OFFER TO SELL THESE SECURITIES AND IT IS NOT A SOLICITATION OF AN OFFER TO BUY THESE SECURITIES IN ANY JURISDICTION WHERE THE OFFER OR SALE IS NOT PERMITTED.
125
| No. 14 – San Marcos Apartments | |||||||
| Loan Information | Property Information | ||||||
| Mortgage Loan Seller: | Wells Fargo Bank, National Association | Single Asset/Portfolio: | Single Asset | ||||
Credit Assessment (DBRS/Fitch/Moody’s): | NR/NR/NR | Property Type: | Multifamily | ||||
| Original Principal Balance: | $14,375,000 | Specific Property Type: | Garden | ||||
| Cut-off Date Principal Balance: | $14,375,000 | Location: | El Paso, TX | ||||
| % of Initial Pool Balance: | 1.4% | Size: | 468 Units | ||||
| Loan Purpose: | Refinance | Cut-off Date Principal Balance Per Unit: | $30,716 | ||||
| Borrower Name: | EPT San Marcos Apartments, LP | Year Built/Renovated: | 1979/NAP | ||||
Sponsor(1)(2): | Richard Aguilar | Title Vesting: | Fee | ||||
| Mortgage Rate: | 5.050% | Property Manager: | Self-managed | ||||
| Note Date: | December 2, 2013 | 3rd Most Recent Occupancy (As of)(4): | 97.6% (12/31/2010) | ||||
| Anticipated Repayment Date: | NAP | 2nd Most Recent Occupancy (As of)(4): | 94.7% (12/31/2011) | ||||
| Maturity Date: | January 1, 2024 | Most Recent Occupancy (As of)(4): | 90.4% (12/31/2012) | ||||
| IO Period: | 25 months | Current Occupancy (As of): | 87.6% (11/26/2013) | ||||
| Loan Term (Original): | 121 months | ||||||
| Seasoning: | 0 months | Underwriting and Financial Information: | |||||
| Amortization Term (Original): | 360 months | ||||||
| Loan Amortization Type: | Interest-only, Amortizing Balloon | 3rd Most Recent NOI (As of): | $1,810,938 (12/31/2011) | ||||
| Interest Accrual Method: | Actual/360 | 2nd Most Recent NOI (As of): | $1,702,833 (12/31/2012) | ||||
| Call Protection: | L(24),D(93),O(4) | Most Recent NOI (As of): | $1,487,626 (TTM 9/30/2013) | ||||
| Lockbox Type: | Springing (Without Established Account) | ||||||
| Additional Debt: | None | U/W Revenues: | $3,084,781 | ||||
| Additional Debt Type: | NAP | U/W Expenses: | $1,638,223 | ||||
| U/W NOI: | $1,446,558 | ||||||
| U/W NCF: | $1,314,582 | ||||||
| U/W NOI DSCR: | 1.55x | ||||||
Escrows and Reserves: | U/W NCF DSCR: | 1.41x | |||||
| U/W NOI Debt Yield: | 10.1% | ||||||
| Type: | Initial | Monthly | Cap (If Any) | U/W NCF Debt Yield: | 9.1% | ||
| Taxes | $62,444 | $31,222 | NAP | As-Is Appraised Value: | $20,160,000 | ||
Insurance(3) | $0 | Springing | NAP | As-Is Appraisal Valuation Date: | November 6, 2013 | ||
| Replacement Reserves | $0 | $10,998 | $395,928 | Cut-off Date LTV Ratio: | 71.3% | ||
| Deferred Maintenance | $10,745 | $0 | NAP | LTV Ratio at Maturity or ARD: | 61.8% | ||
| (1) | Since 2009, Richard Aguilar has been involved in Chapter 11 bankruptcy filings on behalf of three borrowing entities. See “Description of the Mortgage Pool – Default History, Bankruptcy Issues and Other Proceedings” in the Free Writing Prospectus. |
| (2) | Richard Aguilar also serves as a loan sponsor for the Desert Tree Apartments mortgage loan, which has a Cut-off Date Principal Balance of $14,975,000 and is being contributed to the WFRBS 2013-C18 Trust. See “Description of the Mortgage Pool – Certain Characteristics of the Mortgage Pool – Multi-Property Mortgage Loans; Mortgage Loans with Affiliated Borrowers” in the Free Writing Prospectus. |
| (3) | Monthly insurance escrows are not required provided the following conditions are satisfied: (i) no event of default has occurred and is continuing; (ii) the San Marcos Apartments Property is covered under a blanket insurance policy acceptable to the lender; and (iii) the borrower provides evidence of renewal of the policies and timely proof of payment of insurance premiums. |
| (4) | Represents the average occupancy over the preceding 12-month period. |
The San Marcos Apartments mortgage loan is evidenced by a single promissory note that is secured by a first mortgage encumbering a 468-unit multifamily property located in El Paso, Texas (“The San Marcos Apartments Property”). The San Marcos Apartments Property is situated on an 18.8-acre site and is located approximately 14 miles southeast of downtown El Paso, 14 miles southeast of Fort Bliss military base and less than 10 miles south of the El Paso International Airport. The San Marcos Apartments Property consists of 184 one bedroom/one bathroom units and 284 two bedroom/one bathroom units. The San Marcos Apartments Property was built in 1979 and amenities include a main clubhouse with leasing center, fitness room, party room and laundry facilities; additional clubhouse with party room and full kitchen, swimming pool, playground areas and sand volleyball court. The San Marcos Apartments Property contains 791 parking spaces, resulting in a parking ratio of 1.7 spaces per unit. As of November 26, 2013, the San Marcos Apartments Property was 87.6% occupied.
THE INFORMATION IN THIS STRUCTURAL AND COLLATERAL TERM SHEET IS NOT COMPLETE AND MAY BE AMENDED PRIOR TO THE TIME OF SALE. THIS TERM SHEET IS NOT AN OFFER TO SELL THESE SECURITIES AND IT IS NOT A SOLICITATION OF AN OFFER TO BUY THESE SECURITIES IN ANY JURISDICTION WHERE THE OFFER OR SALE IS NOT PERMITTED.
126
| SAN MARCOS APARTMENTS |
Sources and Uses
| Sources | Uses | |||||||
| Original loan amount | $14,375,000 | 100.0% | Loan payoff(1) | $6,540,262 | 45.5% | |||
| Reserves | 73,189 | 0.5 | ||||||
| Closing costs | 241,855 | 1.7 | ||||||
| Return of equity | 7,519,694 | 52.3 | ||||||
| Total Sources | $14,375,000 | 100.0% | Total Uses | $14,375,000 | 100.0% |
| (1) | The San Marcos Apartments Property was previously securitized in COMM 2004-LB2A. |
The following table presents certain information relating to the unit mix of the San Marcos Apartments Property:
Unit Mix Summary(1)
| Unit Type | No. of Units | % of Total Units | Average Unit Size (SF) | Average Monthly U/W Base Rent |
| 1 Bedroom/1 Bathroom | 184 | 39.3% | 525 | $510 |
| 2 Bedroom/1 Bathroom | 284 | 60.7% | 675 | $564 |
| Total/Weighted Average | 468 | 100.0% | 616 | $543 |
| (1) | Information obtained from the underwritten rent roll. |
The following table presents historical occupancy percentages at the San Marcos Apartments Property:
Historical Occupancy Percentages
12/31/2010(1)(2) | 12/31/2011(1)(2) | 12/31/2012(1)(2) | 11/26/2013 | |||
| 97.6% | 94.7% | 90.4% | 87.6% |
| (1) | Information obtained from the borrower. |
| (2) | Represents the average occupancy over the preceding 12-month period. |
Operating History and Underwritten Net Cash Flow. The following table presents certain information relating to the historical operating performance and the Underwritten Net Cash Flow at the San Marcos Apartments Property:
Cash Flow Analysis
| 2011 | 2012 | TTM 9/30/2013 | U/W | U/W $ per Unit | ||||||
| Base Rent | $2,828,532 | $2,822,561 | $2,788,627 | $2,669,256 | $5,704 | |||||
| Grossed Up Vacant Space | 0 | 0 | 0 | 377,880 | 807 | |||||
| Less Concessions | (946) | (13,697) | (15,907) | (15,907) | (34) | |||||
| Other Income | 441,756 | 403,563 | 407,058 | 407,058 | 870 | |||||
| Less Vacancy & Credit Loss | (55,167) | (63,785) | (60,981) | (353,506)(1) | (755) | |||||
| Effective Gross Income | $3,214,175 | $3,148,642 | $3,118,797 | $3,084,781 | $6,591 | |||||
| Total Operating Expenses | $1,403,237 | $1,445,809 | $1,631,171 | $1,638,223 | $3,500 | |||||
| Net Operating Income | $1,810,938 | $1,702,833 | $1,487,626 | $1,446,558 | $3,091 | |||||
| Replacement Reserves | 0 | 0 | 0 | 131,976 | 282 | |||||
| Net Cash Flow | $1,810,938 | $1,702,833 | $1,487,626 | $1,314,582 | $2,809 | |||||
| NOI DSCR | 1.94x | 1.83x | 1.60x | 1.55x | ||||||
| NCF DSCR | 1.94x | 1.83x | 1.60x | 1.41x | ||||||
| NOI DY | 12.6% | 11.8% | 10.3% | 10.1% | ||||||
| NCF DY | 12.6% | 11.8% | 10.3% | 9.1% | ||||||
| (1) | The underwritten economic vacancy is 9.6%. The San Marcos Apartments Property was 87.6% physically occupied as of November 26, 2013. |
THE INFORMATION IN THIS STRUCTURAL AND COLLATERAL TERM SHEET IS NOT COMPLETE AND MAY BE AMENDED PRIOR TO THE TIME OF SALE. THIS TERM SHEET IS NOT AN OFFER TO SELL THESE SECURITIES AND IT IS NOT A SOLICITATION OF AN OFFER TO BUY THESE SECURITIES IN ANY JURISDICTION WHERE THE OFFER OR SALE IS NOT PERMITTED.
127
| No. 15– Hawthorne Valley Shopping Center | ||||||||
| Loan Information | Property Information | |||||||
| Mortgage Loan Seller: | The Royal Bank of Scotland | Single Asset/Portfolio: | Single Asset | |||||
| Credit Assessment (DBRS/Fitch/Moody’s): | NR/NR/NR | Property Type: | Retail | |||||
| Original Principal Balance: | $14,0000,000 | Specific Property Type: | Anchored | |||||
| Cut-off Date Principal Balance: | $14,000,000 | Location: | Oakwood Village, OH | |||||
| % of Initial Pool Balance: | 1.3% | Size: | 319,341 SF | |||||
| Loan Purpose: | Refinance | Cut-off Date Principal Balance Per Unit/SF: | $43.84 | |||||
| Borrower Name: | First Interstate Hawthorne Limited Partnership | Year Built/Renovated: | 1991/NAP | |||||
| Sponsor: | First Interstate Properties, Ltd. | Title Vesting: | Fee | |||||
| Mortgage Rate: | 4.902% | Property Manager: | NAP | |||||
| Note Date: | November 22, 2013 | 3rd Most Recent Occupancy (As of): | 92.7% (12/31/2010) | |||||
| Anticipated Repayment Date: | NAP | 2nd Most Recent Occupancy (As of): | 93.3% (12/31/2011) | |||||
| Maturity Date: | December 1, 2023 | Most Recent Occupancy (As of): | 92.3% (12/31/2012) | |||||
| IO Period: | 0 months | Current Occupancy (As of): | 92.3% (10/10/2013) | |||||
| Loan Term (Original): | 120 months | |||||||
| Seasoning: | 0 months | Underwriting and Financial Information: | ||||||
| Amortization Term (Original): | 360 months | |||||||
| Loan Amortization Type: | Amortizing Balloon | 3rd Most Recent NOI (As of): | $1,802,101 (12/31/2011) | |||||
| Interest Accrual Method: | Actual/360 | 2nd Most Recent NOI (As of): | $1,925,402 (12/31/2012) | |||||
| Call Protection: | L(24),D(92),O(4) | Most Recent NOI (As of) (2): | $1,557,688 (TTM 9/30/2013) | |||||
| Lockbox Type: | Hard/Springing Cash Management | |||||||
Additional Debt(1): | Yes | U/W Revenues: | $2,552,999 | |||||
Additional Debt Type(1): | Future Mezzanine | U/W Expenses: | $784,830 | |||||
| U/W NOI: | $1,768,169 | |||||||
| U/W NCF: | $1,540,097 | |||||||
| Escrows and Reserves | U/W NOI DSCR : | 1.98x | ||||||
| U/W NCF DSCR: | 1.73x | |||||||
Type: | Initial | Monthly | Cap (If Any) | U/W NOI Debt Yield: | 12.6% | |||
| Taxes | $114,383 | 22,877 | NAP | U/W NCF Debt Yield: | 11.0% | |||
| Insurance | $0 | Springing | NAP | As-Is Appraised Value: | $21,000,000 | |||
| Deferred Maintenance | $7,500 | NAP | NAP | As-Is Appraisal Valuation Date: | October 14, 2013 | |||
| Replacement Reserve | $6,653 | $6,653 | $300,000 | Cut-off Date LTV Ratio: | 66.7% | |||
| TI/LC Reserve | $7,984 | $7,984 | $500,000 | LTV Ratio at Maturity or ARD: | 54.6% | |||
| (1) | Future mezzanine debt is permitted subject to the following conditions: (i) the combined loan-to-value ratio is no more than 66.7%; (ii) the combined amortizing debt service coverage ratio is not less than 1.73x; (iii) the execution of an intercreditor agreement acceptable to the lender; and (iv) the delivery of mezzanine loan documents that are reasonably acceptable to the lender and are acceptable to DBRS, Fitch and Moody’s. |
| (2) | See “Cash Flow Analysis” section. |
The Hawthorne Valley Shopping Center mortgage loan is evidenced by a single promissory note that is secured by a first mortgage encumbering a 319,341 square foot anchored retail property built in 1991 and located in Oakwood Village, Ohio (the “Hawthorne Valley Shopping Center Property”). The Hawthorne Valley Shopping Center Property is located 13 miles southeast of the Cleveland central business district, at the intersection of Interstate 271 and Broadway Avenue. The Hawthorne Valley Shopping Center Property is anchored by Sam’s Club and Levin Furniture, with other major tenants including Ollie’s Bargain Outlet and The Tile Shop. The Hawthorne Valley Shopping Center Property is situated on a 30.3-acre parcel and is located adjacent to Interstate 480. The Hawthorne Valley Shopping Center Property contains 1,400 surface parking spaces reflecting a parking ratio of 4.3 spaces per 1,000 square feet of net rentable area. As of October 10, 2013, the Hawthorne Valley Shopping Center Property was 91.6% leased to 11 tenants.
Sources and Uses
| Sources | Uses | |||||||
| Original loan amount | $14,000,000 | 100.0% | Loan payoff | $12,793,881 | 96.5% | |||
| Reserves | 136,520 | 1.0 | ||||||
| Closing costs | 323,548 | 2.4 | ||||||
| Return of equity | 746,051 | 5.6 | ||||||
| Total Sources | $14,000,000 | 100.0% | Total Uses | $14,000,000 | 100.0% |
THE INFORMATION IN THIS STRUCTURAL AND COLLATERAL TERM SHEET IS NOT COMPLETE AND MAY BE AMENDED PRIOR TO THE TIME OF SALE. THIS TERM SHEET IS NOT AN OFFER TO SELL THESE SECURITIES AND IT IS NOT A SOLICITATION OF AN OFFER TO BUY THESE SECURITIES IN ANY JURISDICTION WHERE THE OFFER OR SALE IS NOT PERMITTED.
128
| HAWTHORNE VALLEY SHOPPING CENTER |
The following table presents certain information relating to the tenancy at the Hawthorne Valley Shopping Center Property:
Major Tenants
| Tenant Name | Credit Rating (Fitch/ Moody’s/ S&P)(1) | Tenant NRSF | % of NRSF | Annual U/W Base Rent PSF | Annual U/W Base Rent | % of Total Annual U/W Base Rent | Sales PSF(2) | Occupancy Cost(2) | Lease Expiration Date | ||||||
| Anchor Tenants | |||||||||||||||
| Sam’s Club | AA/Aa2/AA | 136,914 | 42.9% | $7.14 | 978,173 | 50.6% | NAV | NAV | 10/31/2016(3) | ||||||
| Levin Furniture | NR/NR/NR | 89,723 | 28.1% | $4.60 | $412,726 | 21.3% | $136 | 5.6% | 11/30/2017(4) | ||||||
| Total Anchor Tenants | 226,637 | 71.0% | $6.14 | $1,390,899 | 71.9% | ||||||||||
| Major Tenants | |||||||||||||||
| Ollie’s Bargain Outlet | NR/NR/NR | 35,233 | 11.0% | $4.45 | $156,787 | 8.1% | NAV | NAV | 6/30/2018 | ||||||
| The Tile Shop | NR/NR/NR | 20,715 | 6.5% | $7.00 | $145,005 | 7.5% | NAV | NAV | 5/30/2017 | ||||||
| Woodcraft | NR/NR/NR | 7,883 | 2.5% | $7.75 | $61,093 | 3.2% | NAV | NAV | 10/31/2015 | ||||||
| Total Major Tenants | 63,831 | 20.0% | $5.69 | $362,885 | 18.8% | ||||||||||
| Non-Major Tenants | 4,389 | 1.4% | $40.99 | $179,926 | 9.3% | ||||||||||
| Occupied Collateral | 294,857 | 92.3% | $6.56 | $1,933,710 | 100.0% | ||||||||||
| Vacant Space | 24,484 | 7.7% | |||||||||||||
| Collateral Total | 319,341 | 100.0% | |||||||||||||
| (1) | Certain ratings are those of the parent company whether or not the parent guarantees the lease. |
| (2) | Sales and occupancy costs are for the trailing 12-month period ending September 30, 2013. |
| (3) | Sam’s Club has ten, 5-year extension options remaining. |
| (4) | Levin Furniture has two, 5-year extension options remaining. |
THE INFORMATION IN THIS STRUCTURAL AND COLLATERAL TERM SHEET IS NOT COMPLETE AND MAY BE AMENDED PRIOR TO THE TIME OF SALE. THIS TERM SHEET IS NOT AN OFFER TO SELL THESE SECURITIES AND IT IS NOT A SOLICITATION OF AN OFFER TO BUY THESE SECURITIES IN ANY JURISDICTION WHERE THE OFFER OR SALE IS NOT PERMITTED.
129
| HAWTHORNE VALLEY SHOPPING CENTER |
The following table presents certain information relating to the lease rollover schedule at the Hawthorne Valley Shopping Center Property:
Lease Expiration Schedule(1)(2)
Year Ending December 31, | No. of Leases Expiring | Expiring NRSF | % of Total NRSF | Cumulative Expiring NRSF | Cumulative % of Total NRSF | Annual U/W Base Rent | Annual U/W Base Rent PSF(3) | |||||
| MTM | 2 | 2,400 | 0.8% | 2,400 | 0.8% | $24,000 | $10.00 | |||||
| 2013 | 0 | 0 | 0.0% | 2,400 | 0.8% | $0 | $0.00 | |||||
| 2014 | 0 | 0 | 0.0% | 2,400 | 0.8% | $0 | $0.00 | |||||
| 2015 | 1 | 7,883 | 2.5% | 10,283 | 3.2% | $61,093 | $7.75 | |||||
| 2016 | 2 | 136,914 | 42.9% | 147,197 | 46.1% | $1,047,791 | $7.65 | |||||
| 2017 | 3 | 112,427 | 35.2% | 259,624 | 81.3% | $602,731 | $5.36 | |||||
| 2018 | 2 | 35,233 | 11.0% | 294,857 | 92.3% | $180,595 | $5.13 | |||||
| 2019 | 0 | 0 | 0.0% | 294,857 | 92.3% | $0 | $0.00 | |||||
| 2020 | 0 | 0 | 0.0% | 294,857 | 92.3% | $0 | $0.00 | |||||
| 2021 | 0 | 0 | 0.0% | 294,857 | 92.3% | $0 | $0.00 �� | |||||
| 2022 | 0 | 0 | 0.0% | 294,857 | 92.3% | $0 | $0.00 | |||||
| 2023 | 0 | 0 | 0.0% | 294,857 | 92.3% | $0 | $0.00 | |||||
| Thereafter | 1 | 0 | 0.0% | 294,857 | 92.3% | $17,500 | $0.00 | |||||
| Vacant | 0 | 24,484 | 7.7% | 319,341 | 100.0% | $0 | $0.00 | |||||
| Total/Weighted Average | 11 | 319,341 | 100.0% | $1,933,710 | $6.56 |
| (1) | Information was obtained from the underwritten rent roll. |
| (2) | Certain tenants may have lease termination options that are exercisable prior to the stated expiration date of the subject lease and that are not considered in the Lease Expiration Schedule. |
| (3) | Weighted Average Annual U/W Base Rent PSF excludes vacant space. |
The following table presents historical occupancy percentages at the Hawthorne Valley Shopping Center Property:
Historical Occupancy Percentages
12/31/2010(1) | 12/31/2011(1) | 12/31/2012(1) | 10/10/2013 | |||
| 92.7% | 93.3% | 92.3% | 92.3% |
| (1) | Information obtained from borrower rent rolls. |
Operating History and Underwritten Net Cash Flow. The following table presents certain information relating to the historical operating performance and the Underwritten Net Cash Flow at the Hawthorne Valley Shopping Center Property:
Cash Flow Analysis
| 2011 | 2012 | TTM 9/30/2013 | U/W | U/W $ per SF | ||||||
| Base Rent | $1,970,122 | $1,901,198 | $1,717,006 | $1,933,710(1) | $6.06 | |||||
| Grossed Up Vacant Space | 0 | 0 | 0 | 310,988 | 0.97 | |||||
| Total Reimbursables | 627,875 | 653,957 | 637,293 | 619,289 | 1.94 | |||||
| Other Income | 3,658 | 150,745 | 3,157 | 0 | 0.00 | |||||
| Less Vacancy & Credit Loss | 0 | 0 | 0 | (310,988)(1) | (0.97) | |||||
| Effective Gross Income | $2,601,655 | $2,705,900 | $2,357,456 | $2,552,999 | $7.99 | |||||
| Total Operating Expenses | $799,554 | $780,498 | $799,768 | $784,830 | $2.46 | |||||
| Net Operating Income | $1,802,101 | $1,925,402 | $1,557,688 | $1,768,169 | $5.54 | |||||
| TI/LC | 0 | 0 | 0 | 164,204 | 0.51 | |||||
| Capital Expenditures | 0 | 0 | 0 | 63,868 | 0.20 | |||||
| Net Cash Flow | $1,802,101 | $1,925,402 | $1,557,688 | $1,540,097 | $4.82 | |||||
| NOI DSCR | 2.02x | 2.16x | 1.75x | 1.98x | ||||||
| NCF DSCR | 2.02x | 2.16x | 1.75x | 1.73x | ||||||
| NOI DY | 12.9% | 13.8% | 11.1% | 12.6% | ||||||
| NCF DY | 12.9% | 13.8% | 11.1% | 11.0% | ||||||
| (1) | The underwritten economic vacancy is 10.9%. The Hawthorne Valley Shopping Center Property was 92.3% physically occupied as of October 10, 2013. |
| (2) | The TTM 9/30/2013 Base Rent decreased due to Levin Furniture receiving a six-month rent abatement from December 2012 through May 2013 as part of their lease renewal. |
THE INFORMATION IN THIS STRUCTURAL AND COLLATERAL TERM SHEET IS NOT COMPLETE AND MAY BE AMENDED PRIOR TO THE TIME OF SALE. THIS TERM SHEET IS NOT AN OFFER TO SELL THESE SECURITIES AND IT IS NOT A SOLICITATION OF AN OFFER TO BUY THESE SECURITIES IN ANY JURISDICTION WHERE THE OFFER OR SALE IS NOT PERMITTED.
130
(THIS PAGE INTENTIONALLY LEFT BLANK)
131
| WFRBS Commercial Mortgage Trust 2013-C18 | Transaction Contact Information |
VI. Transaction Contact Information
Questions regarding this Structural and Collateral Term Sheet may be directed to any of the following individuals:
| Wells Fargo Securities, LLC | RBS Securities Inc. | ||
| Brigid Mattingly | Tel. (312) 269-3062 | Todd Jaeger - Trading | Tel. (203) 897-2900 |
| Fax (312) 658-0140 | |||
| A.J. Sfarra | Tel. (212) 214-5613 | Adam Ansaldi | Tel. (203) 897-0881 |
| Fax (212) 214-8970 | Fax (203) 873-3542 | ||
| Alex Wong | Tel. (212) 214-5615 | Jim Barnard | Tel. (203) 897-4417 |
| Fax (212) 214-8970 | Fax (203) 873-4310 | ||
THE INFORMATION IN THIS STRUCTURAL AND COLLATERAL TERM SHEET IS NOT COMPLETE AND MAY BE AMENDED PRIOR TO THE TIME OF SALE. THIS TERM SHEET IS NOT AN OFFER TO SELL THESE SECURITIES AND IT IS NOT A SOLICITATION OF AN OFFER TO BUY THESE SECURITIES IN ANY JURISDICTION WHERE THE OFFER OR SALE IS NOT PERMITTED.
132