
Exhibit 99.2 Subordinated Notes Offering Presentation NASDAQ: RIVE September 2020Exhibit 99.2 Subordinated Notes Offering Presentation NASDAQ: RIVE September 2020

Notice to Recipients This confidential presentation (this “Presentation”) has been prepared solely for general informational purposes by Riverview Financial Corporation (the “Company,” the “holding company,” “we” or “our”), and is being furnished solely for use by prospective participants in considering participation in the proposed private offering (the “Offering”) of the Company’s subordinated notes (the “Securities”). No representation or warranty as to the accuracy, completeness, or fairness of such information is being made by the Company or any other person, and neither the Company nor any other person shall have any liability for any information contained herein, or for any omissions from this Presentation or any other written or oral communications transmitted to the recipient by the Company or any other person in the course of the recipient’s evaluation of the Offering. The Securities are not a deposit or bank account, and are not, and will not be, insured or guaranteed by the Federal Deposit Insurance Corporation (the “FDIC”) or any other federal or state government agency. Investment in the Securities has not been approved or disapproved by the Securities and Exchange Commission (the “SEC”), the FDIC, the Board of Governors of the Federal Reserve System or any other federal or state regulatory authority, nor has any authority passed upon or endorsed the merits of the Offering or the accuracy or adequacy of this Presentation. Any representation to the contrary is a criminal offense. The Company has authorized Performance Trust Capital Partners, LLC, to act as its sole placement agent in the Offering. The information contained herein is intended only as an outline that has been prepared to assist interested parties in making their own evaluations of the Company. It does not purport to be all-inclusive or to contain all of the information that a prospective participant may desire. Each recipient of the information and data contained herein should perform its own independent investigation and analysis of the Offering and the value of the Company. The information and data contained herein are not a substitute for a recipient’s independent evaluation and analysis. In making an investment decision, prospective participants must rely on their own examination of the Company, including the merits and risks involved. Prospective participants are urged to consult with their own legal, tax, investment and accounting advisers with respect to the consequences of an investment in the Company. In the event that any portion of this Presentation is inconsistent with or contrary to any of the terms of the form of a note purchase agreement (the “NPA”) or the final terms of the Securities, the NPA and the final terms of the Securities shall control. Except as otherwise indicated, this Presentation speaks as of the date hereof. The delivery of this Presentation shall not, under any circumstances, create any implication that there has been no change in the affairs of the Company after the date hereof. You will be given the opportunity to ask questions of and receive answers from Company representatives concerning the Company’s business and the terms and conditions of the Offering, and the Company may provide you with additional relevant information that you may reasonably request to the extent the Company possesses such information or can obtain it without unreasonable effort or expense. Except for information provided in response to such requests, the Company has not authorized any other person to give you information that is not found in this Presentation. If such unauthorized information is obtained or provided, the Company cannot and does not assume responsibility for its accuracy, credibility, or validity. The Company is not providing you with any legal, business, tax or other advice regarding an investment in the Securities. You should consult with your own advisors as needed to assist you in making your investment decision and to advise you whether you are legally permitted to purchase the Securities. 2Notice to Recipients This confidential presentation (this “Presentation”) has been prepared solely for general informational purposes by Riverview Financial Corporation (the “Company,” the “holding company,” “we” or “our”), and is being furnished solely for use by prospective participants in considering participation in the proposed private offering (the “Offering”) of the Company’s subordinated notes (the “Securities”). No representation or warranty as to the accuracy, completeness, or fairness of such information is being made by the Company or any other person, and neither the Company nor any other person shall have any liability for any information contained herein, or for any omissions from this Presentation or any other written or oral communications transmitted to the recipient by the Company or any other person in the course of the recipient’s evaluation of the Offering. The Securities are not a deposit or bank account, and are not, and will not be, insured or guaranteed by the Federal Deposit Insurance Corporation (the “FDIC”) or any other federal or state government agency. Investment in the Securities has not been approved or disapproved by the Securities and Exchange Commission (the “SEC”), the FDIC, the Board of Governors of the Federal Reserve System or any other federal or state regulatory authority, nor has any authority passed upon or endorsed the merits of the Offering or the accuracy or adequacy of this Presentation. Any representation to the contrary is a criminal offense. The Company has authorized Performance Trust Capital Partners, LLC, to act as its sole placement agent in the Offering. The information contained herein is intended only as an outline that has been prepared to assist interested parties in making their own evaluations of the Company. It does not purport to be all-inclusive or to contain all of the information that a prospective participant may desire. Each recipient of the information and data contained herein should perform its own independent investigation and analysis of the Offering and the value of the Company. The information and data contained herein are not a substitute for a recipient’s independent evaluation and analysis. In making an investment decision, prospective participants must rely on their own examination of the Company, including the merits and risks involved. Prospective participants are urged to consult with their own legal, tax, investment and accounting advisers with respect to the consequences of an investment in the Company. In the event that any portion of this Presentation is inconsistent with or contrary to any of the terms of the form of a note purchase agreement (the “NPA”) or the final terms of the Securities, the NPA and the final terms of the Securities shall control. Except as otherwise indicated, this Presentation speaks as of the date hereof. The delivery of this Presentation shall not, under any circumstances, create any implication that there has been no change in the affairs of the Company after the date hereof. You will be given the opportunity to ask questions of and receive answers from Company representatives concerning the Company’s business and the terms and conditions of the Offering, and the Company may provide you with additional relevant information that you may reasonably request to the extent the Company possesses such information or can obtain it without unreasonable effort or expense. Except for information provided in response to such requests, the Company has not authorized any other person to give you information that is not found in this Presentation. If such unauthorized information is obtained or provided, the Company cannot and does not assume responsibility for its accuracy, credibility, or validity. The Company is not providing you with any legal, business, tax or other advice regarding an investment in the Securities. You should consult with your own advisors as needed to assist you in making your investment decision and to advise you whether you are legally permitted to purchase the Securities. 2

Offering Disclaimer This Presentation has been prepared by the Company solely for informational purposes based on information regarding our operations, as well as information from public sources. This Presentation is for information purposes only and is being furnished on a confidential basis to a limited number of institutional accredited investors. The information in this Presentation is confidential and may not be reproduced or redistributed, passed on or divulged, directly or indirectly, to any other person. The Company reserves the right to request the return of this Presentation at any time. Any offering of the Securities may be made only by a purchase agreement and the information contained herein will be superseded in its entirety by such purchase agreement. This Presentation does not contain all of the information you should consider before investing in the Securities and should not be construed as investment, legal, regulatory or tax advice. Each potential investor should review the purchase agreement, make such investigation as it deems necessary to arrive at an independent evaluation of an investment in the Securities mentioned in this Presentation and should consult its own legal counsel and financial, accounting, regulatory and tax advisors to determine the consequences of such an investment prior to making an investment decision and should not rely on any information set forth in this Presentation. The Securities described in this Presentation will be subject to significant limitations on their liquidity. Only potential investors who can bear the risk of an unregistered illiquid investment should consider investment in the Securities described herein. The Securities referenced in this Presentation have not been registered under the Securities Act of 1933, as amended, or any state securities laws, and my not be offered or sold absent registration or an exemption from registration under applicable law. This Presentation and oral statements made from time to time by the Company’s representatives may contain “forward-looking statements within the meaning of the Private Securities Litigation Reform Act of 1995 that are subject to risks and uncertainties. You should not place undue reliance on those statements because they are subject to numerous risks and uncertainties relating to the Company’s operations and business environment, all of which are difficult to predict and may be beyond our control. Forward-looking statements include information concerning the Company’s future results and financial information, interest rates and the interest rate environment, expectations about new and existing programs and products, loan and deposit growth, loan performance, economic expectations, operations, employees and business strategy. These statements often include words such as may, believe, expect, anticipate, intend, “potential,” “opportunity,” “could,” “project,” “seek,” “should,” “will,” “would,” plan, estimate or other similar expressions or variations of such terms. Forward-looking statements are not a guarantee of future performance or results, are based on information available at the time the statements are made and involve known and unknown risks, uncertainties and other factors that could cause our actual results to differ materially from the information in the forward-looking statements and can change as a result of many possible events or factors, not all of which are known to us or in our control. These factors include but are not limited to: (i) prevailing local, regional, national, and international economic conditions and the impact they may have on us and our customers and our assessment of that impact; (ii) changes in interest rates, loan demand and real estate values, any of which can materially affect origination levels and gain on sale results in our business, as well as other aspects of our financial performance, including earnings on interest- bearing assets; (iii) the level of defaults, losses and prepayments on loans made by us, whether held in portfolio or sold in the whole loan secondary markets, which can materially affect charge-off levels and required credit loss reserve levels; (iv) changes in monetary and fiscal policies of the U.S. Government, including policies of the U.S. Treasury and the Board of Governors of the Federal Reserve System; (v) changes in the banking and other financial services regulatory environment; (vi) competition with national, regional and community financial institutions; (vii) failures of or interruptions in the communications and information systems on which we rely to conduct business; (viii) expected or potential impacts of public health crises (such as governmental, social and economic effects of the novel coronavirus (COVID-19) pandemic); (ix) levels of unemployment in the Company’s market area; (x) the impact of the COVID-19 pandemic on our business, including the impact of actions taken by governmental and regulatory authorities in response to such pandemic, such as the CARES Act and the programs established thereunder, and our participation in such programs, reductions in employment, an increase in business failures specifically among our clients, unanticipated loan delinquencies and other potential negative effects on our business caused by the COVID-19 pandemic; (xi) volatility and disruption in national and international financial markets; (xii) the effect of changes in accounting policies and practices as may be adopted by the regulatory agencies, as well as the Financial Accounting Standards Board, and other accounting standard setters; (xiii) the ability to redeem our existing indebtedness, which is subject to regulatory approval; (xiv) the impact of loan modifications or deferrals we are required or agree to as a result of client requests and/or government actions, including, but not limited to our potential inability to recover fully deferred payments from the borrower; (xv) the need to supplement debt or equity capital to maintain or exceed internal capital thresholds; (xvi) greater than expected technology related costs; (xvii) the inability to grow client deposits to keep pace with loan growth; (xviii) changes in consumer spending, borrowing and saving habits; and (xiv) our success at managing the risks involved in the foregoing factors. All statements in this Presentation, including forward-looking statements, speak only as of the date they are made. Although the Company believes that these forward-looking statements are based on reasonable assumptions, beliefs and expectations, if a change occurs or our beliefs, assumptions and expectations were incorrect, our business, financial condition, liquidity or results of operations may vary materially from those expressed in our forward-looking statements. New risks and uncertainties arise from time to time, and we cannot predict these events or how they may affect the Company. The Company has no duty to, and does not intend to, update or revise the forward-looking statements after the date on which they are made. In light of these risks and uncertainties, you should keep in mind that any forward-looking statement made in this Presentation or elsewhere might not reflect our actual results. 3Offering Disclaimer This Presentation has been prepared by the Company solely for informational purposes based on information regarding our operations, as well as information from public sources. This Presentation is for information purposes only and is being furnished on a confidential basis to a limited number of institutional accredited investors. The information in this Presentation is confidential and may not be reproduced or redistributed, passed on or divulged, directly or indirectly, to any other person. The Company reserves the right to request the return of this Presentation at any time. Any offering of the Securities may be made only by a purchase agreement and the information contained herein will be superseded in its entirety by such purchase agreement. This Presentation does not contain all of the information you should consider before investing in the Securities and should not be construed as investment, legal, regulatory or tax advice. Each potential investor should review the purchase agreement, make such investigation as it deems necessary to arrive at an independent evaluation of an investment in the Securities mentioned in this Presentation and should consult its own legal counsel and financial, accounting, regulatory and tax advisors to determine the consequences of such an investment prior to making an investment decision and should not rely on any information set forth in this Presentation. The Securities described in this Presentation will be subject to significant limitations on their liquidity. Only potential investors who can bear the risk of an unregistered illiquid investment should consider investment in the Securities described herein. The Securities referenced in this Presentation have not been registered under the Securities Act of 1933, as amended, or any state securities laws, and my not be offered or sold absent registration or an exemption from registration under applicable law. This Presentation and oral statements made from time to time by the Company’s representatives may contain “forward-looking statements within the meaning of the Private Securities Litigation Reform Act of 1995 that are subject to risks and uncertainties. You should not place undue reliance on those statements because they are subject to numerous risks and uncertainties relating to the Company’s operations and business environment, all of which are difficult to predict and may be beyond our control. Forward-looking statements include information concerning the Company’s future results and financial information, interest rates and the interest rate environment, expectations about new and existing programs and products, loan and deposit growth, loan performance, economic expectations, operations, employees and business strategy. These statements often include words such as may, believe, expect, anticipate, intend, “potential,” “opportunity,” “could,” “project,” “seek,” “should,” “will,” “would,” plan, estimate or other similar expressions or variations of such terms. Forward-looking statements are not a guarantee of future performance or results, are based on information available at the time the statements are made and involve known and unknown risks, uncertainties and other factors that could cause our actual results to differ materially from the information in the forward-looking statements and can change as a result of many possible events or factors, not all of which are known to us or in our control. These factors include but are not limited to: (i) prevailing local, regional, national, and international economic conditions and the impact they may have on us and our customers and our assessment of that impact; (ii) changes in interest rates, loan demand and real estate values, any of which can materially affect origination levels and gain on sale results in our business, as well as other aspects of our financial performance, including earnings on interest- bearing assets; (iii) the level of defaults, losses and prepayments on loans made by us, whether held in portfolio or sold in the whole loan secondary markets, which can materially affect charge-off levels and required credit loss reserve levels; (iv) changes in monetary and fiscal policies of the U.S. Government, including policies of the U.S. Treasury and the Board of Governors of the Federal Reserve System; (v) changes in the banking and other financial services regulatory environment; (vi) competition with national, regional and community financial institutions; (vii) failures of or interruptions in the communications and information systems on which we rely to conduct business; (viii) expected or potential impacts of public health crises (such as governmental, social and economic effects of the novel coronavirus (COVID-19) pandemic); (ix) levels of unemployment in the Company’s market area; (x) the impact of the COVID-19 pandemic on our business, including the impact of actions taken by governmental and regulatory authorities in response to such pandemic, such as the CARES Act and the programs established thereunder, and our participation in such programs, reductions in employment, an increase in business failures specifically among our clients, unanticipated loan delinquencies and other potential negative effects on our business caused by the COVID-19 pandemic; (xi) volatility and disruption in national and international financial markets; (xii) the effect of changes in accounting policies and practices as may be adopted by the regulatory agencies, as well as the Financial Accounting Standards Board, and other accounting standard setters; (xiii) the ability to redeem our existing indebtedness, which is subject to regulatory approval; (xiv) the impact of loan modifications or deferrals we are required or agree to as a result of client requests and/or government actions, including, but not limited to our potential inability to recover fully deferred payments from the borrower; (xv) the need to supplement debt or equity capital to maintain or exceed internal capital thresholds; (xvi) greater than expected technology related costs; (xvii) the inability to grow client deposits to keep pace with loan growth; (xviii) changes in consumer spending, borrowing and saving habits; and (xiv) our success at managing the risks involved in the foregoing factors. All statements in this Presentation, including forward-looking statements, speak only as of the date they are made. Although the Company believes that these forward-looking statements are based on reasonable assumptions, beliefs and expectations, if a change occurs or our beliefs, assumptions and expectations were incorrect, our business, financial condition, liquidity or results of operations may vary materially from those expressed in our forward-looking statements. New risks and uncertainties arise from time to time, and we cannot predict these events or how they may affect the Company. The Company has no duty to, and does not intend to, update or revise the forward-looking statements after the date on which they are made. In light of these risks and uncertainties, you should keep in mind that any forward-looking statement made in this Presentation or elsewhere might not reflect our actual results. 3

Offering Disclaimer (cont.) Certain of the information contained herein may be derived from information provided by industry sources. The Company believes that such information is accurate and that the sources from which it has been obtained are reliable. The Company cannot guarantee the accuracy of such information, however, and has not independently verified such information. The Company is not making any implied or express representation or warranty as to the accuracy or completeness of the information summarized herein or made available in connection with any further investigation of the Company. The Company expressly disclaims any and all liability which may be based on such information, errors therein or omissions therefrom. This Presentation contains supplemental financial information determined by methods other than in accordance with U.S. generally accepted accounting principles (“GAAP”) that management uses in its analysis of the Company’s performance. Management believes these non-GAAP financial measures provide information useful to investors in understanding the Company’s underlying operational performance and business and performance trends and facilitate comparisons with the performance of others in the financial services industry. These non-GAAP financial measures should not be considered in isolation or as a substitute for or superior to financial measures calculated in accordance with U.S. GAAP. These non-GAAP financial measures may also be calculated differently from similar measures disclosed by other companies. A reconciliation of the non-GAAP measures used in this Presentation to the most directly comparable GAAP measures is provided in the Appendix to this Presentation. 4Offering Disclaimer (cont.) Certain of the information contained herein may be derived from information provided by industry sources. The Company believes that such information is accurate and that the sources from which it has been obtained are reliable. The Company cannot guarantee the accuracy of such information, however, and has not independently verified such information. The Company is not making any implied or express representation or warranty as to the accuracy or completeness of the information summarized herein or made available in connection with any further investigation of the Company. The Company expressly disclaims any and all liability which may be based on such information, errors therein or omissions therefrom. This Presentation contains supplemental financial information determined by methods other than in accordance with U.S. generally accepted accounting principles (“GAAP”) that management uses in its analysis of the Company’s performance. Management believes these non-GAAP financial measures provide information useful to investors in understanding the Company’s underlying operational performance and business and performance trends and facilitate comparisons with the performance of others in the financial services industry. These non-GAAP financial measures should not be considered in isolation or as a substitute for or superior to financial measures calculated in accordance with U.S. GAAP. These non-GAAP financial measures may also be calculated differently from similar measures disclosed by other companies. A reconciliation of the non-GAAP measures used in this Presentation to the most directly comparable GAAP measures is provided in the Appendix to this Presentation. 4

Table of Contents I Executive Summary 6 II Management Team, Board & Ownership Information 16 III Assets Highlights 20 IV Liabilities Highlights 30 V Capital Highlights 34 VI Income Statement Highlights 37 VII Appendix 43 5Table of Contents I Executive Summary 6 II Management Team, Board & Ownership Information 16 III Assets Highlights 20 IV Liabilities Highlights 30 V Capital Highlights 34 VI Income Statement Highlights 37 VII Appendix 43 5

I. Executive Summary 6I. Executive Summary 6

Terms of the Offered Securities Riverview Financial Corporation (the “Company”), bank holding company of Riverview Bank Issuer: (the Bank ) Subordinated Debt Security: $25 million Principal Amount: 10-year, no-call 5-year Term: Fixed 5.75% for 5 years Coupon: Floating at SOFR + 5.63% thereafter Redeemable at par in whole or in part anytime after 5 years from date of issuance Optional Redemption: Unrated Credit Rating: Structured consistent with requirements for Tier 2 capital treatment at the holding company Regulatory Capital: Enhance the Company and Bank’s capital to support ongoing growth, general corporate Use of Proceeds: purposes and potential strategic opportunities October 2020 Expected Pricing Date: Performance Trust Capital Partners, LLC Sole Placement Agent: 7Terms of the Offered Securities Riverview Financial Corporation (the “Company”), bank holding company of Riverview Bank Issuer: (the Bank ) Subordinated Debt Security: $25 million Principal Amount: 10-year, no-call 5-year Term: Fixed 5.75% for 5 years Coupon: Floating at SOFR + 5.63% thereafter Redeemable at par in whole or in part anytime after 5 years from date of issuance Optional Redemption: Unrated Credit Rating: Structured consistent with requirements for Tier 2 capital treatment at the holding company Regulatory Capital: Enhance the Company and Bank’s capital to support ongoing growth, general corporate Use of Proceeds: purposes and potential strategic opportunities October 2020 Expected Pricing Date: Performance Trust Capital Partners, LLC Sole Placement Agent: 7

Company Overview Corporate Overview Branch Map • Founded in 1904 with establishment of Bank Holding Company in 2013 • Headquartered in Harrisburg, Pennsylvania • Operates 27 full-service locations and three LPOs located in 14 counties throughout Central Pennsylvania • Single bank holding company (Riverview Financial Riverview Bank (30) Corporation) is 100% owner of subsidiary Riverview Bank and its operating divisions Riverview Financial Corporation | Financial Highlights 2017 2018 2019 2020 Q2 (dollars shown in thousands) • Merged with CBT Financial Corp. in Q4 2017. The Total Assets $1,163,607 $1,137,603 $1,079,954 $1,346,800 merger of equals added approximately $382.5 Gross Loans HFI 955,971 893,184 852,109 1,165,453 million in loans and $438.8 million in deposits to Total Deposits 1,026,480 1,004,593 940,480 1,023,153 the consolidated Company Total Equity 106,256 113,910 118,110 94,452 (1) Loans / Deposits 93.1 88.9 90.6 113.9 • Castle Creek Capital LLC maintains a 20.1% NPAs / Assets 0.64 0.56 0.47 0.98 (2) (4) TCE / TA 6.80 7.72 8.61 6.85 stake in the Company (3) Risk Based Captial Ratio (%) 10.43 11.42 12.39 12.17 NIM 3.76 4.19 4.07 3.28 • Began trading on NASDAQ Global Market in (4) Core ROAA 0.19 0.98 0.54 0.14 August 2018 under the symbol “RIVE” (4) Core ROAE 2.05 10.17 5.22 1.55 Source: S&P Global Market Intelligence; Company provided document 8 Note: ROAA and ROAE metrics annualized where appropriate (1) 87.1% excluding PPP loans (2) 8.60% excluding PPP loans (3) Bank-level metric (4) See Slides 47-48 for non-GAAP reconciliation information Company Overview Corporate Overview Branch Map • Founded in 1904 with establishment of Bank Holding Company in 2013 • Headquartered in Harrisburg, Pennsylvania • Operates 27 full-service locations and three LPOs located in 14 counties throughout Central Pennsylvania • Single bank holding company (Riverview Financial Riverview Bank (30) Corporation) is 100% owner of subsidiary Riverview Bank and its operating divisions Riverview Financial Corporation | Financial Highlights 2017 2018 2019 2020 Q2 (dollars shown in thousands) • Merged with CBT Financial Corp. in Q4 2017. The Total Assets $1,163,607 $1,137,603 $1,079,954 $1,346,800 merger of equals added approximately $382.5 Gross Loans HFI 955,971 893,184 852,109 1,165,453 million in loans and $438.8 million in deposits to Total Deposits 1,026,480 1,004,593 940,480 1,023,153 the consolidated Company Total Equity 106,256 113,910 118,110 94,452 (1) Loans / Deposits 93.1 88.9 90.6 113.9 • Castle Creek Capital LLC maintains a 20.1% NPAs / Assets 0.64 0.56 0.47 0.98 (2) (4) TCE / TA 6.80 7.72 8.61 6.85 stake in the Company (3) Risk Based Captial Ratio (%) 10.43 11.42 12.39 12.17 NIM 3.76 4.19 4.07 3.28 • Began trading on NASDAQ Global Market in (4) Core ROAA 0.19 0.98 0.54 0.14 August 2018 under the symbol “RIVE” (4) Core ROAE 2.05 10.17 5.22 1.55 Source: S&P Global Market Intelligence; Company provided document 8 Note: ROAA and ROAE metrics annualized where appropriate (1) 87.1% excluding PPP loans (2) 8.60% excluding PPP loans (3) Bank-level metric (4) See Slides 47-48 for non-GAAP reconciliation information
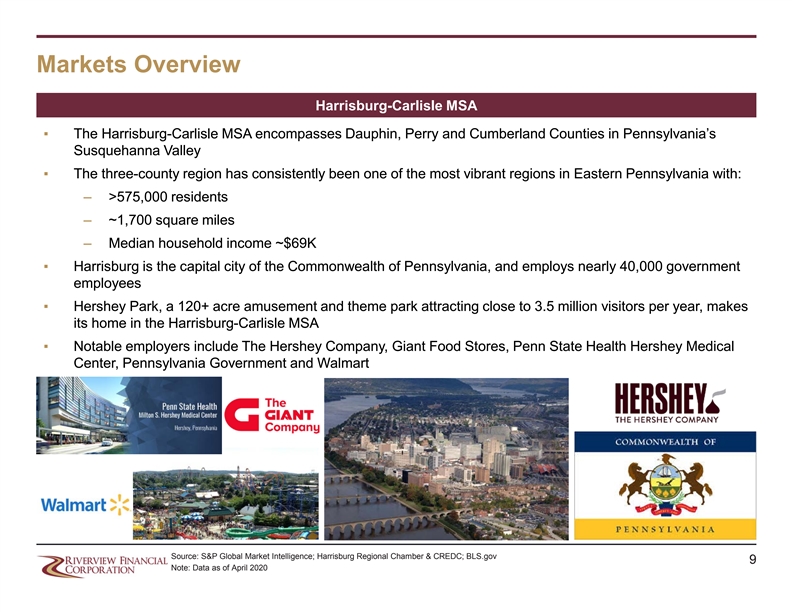
Markets Overview Harrisburg-Carlisle MSA ▪ The Harrisburg-Carlisle MSA encompasses Dauphin, Perry and Cumberland Counties in Pennsylvania’s Susquehanna Valley ▪ The three-county region has consistently been one of the most vibrant regions in Eastern Pennsylvania with: – >575,000 residents – ~1,700 square miles – Median household income ~$69K ▪ Harrisburg is the capital city of the Commonwealth of Pennsylvania, and employs nearly 40,000 government employees ▪ Hershey Park, a 120+ acre amusement and theme park attracting close to 3.5 million visitors per year, makes its home in the Harrisburg-Carlisle MSA ▪ Notable employers include The Hershey Company, Giant Food Stores, Penn State Health Hershey Medical Center, Pennsylvania Government and Walmart Source: S&P Global Market Intelligence; Harrisburg Regional Chamber & CREDC; BLS.gov 9 Note: Data as of April 2020Markets Overview Harrisburg-Carlisle MSA ▪ The Harrisburg-Carlisle MSA encompasses Dauphin, Perry and Cumberland Counties in Pennsylvania’s Susquehanna Valley ▪ The three-county region has consistently been one of the most vibrant regions in Eastern Pennsylvania with: – >575,000 residents – ~1,700 square miles – Median household income ~$69K ▪ Harrisburg is the capital city of the Commonwealth of Pennsylvania, and employs nearly 40,000 government employees ▪ Hershey Park, a 120+ acre amusement and theme park attracting close to 3.5 million visitors per year, makes its home in the Harrisburg-Carlisle MSA ▪ Notable employers include The Hershey Company, Giant Food Stores, Penn State Health Hershey Medical Center, Pennsylvania Government and Walmart Source: S&P Global Market Intelligence; Harrisburg Regional Chamber & CREDC; BLS.gov 9 Note: Data as of April 2020
Investment Highlights Experienced Management Team Backed by Leading Institutional Investor • Executive team has decades of experience in community banking with the CEO, CFO, and COO each having spent more than 25 years in the industry • Brett Fulk, CEO, was a market executive at much larger regional banks in the Northeast prior to joining Riverview in 2011 • Castle Creek Capital LLC and affiliated funds own 20.1% of the Company’s common stock Improving Performance with Pathway To Respectable ROA • Q2 2020 results impacted by $24.7 million goodwill impairment charge and outsized loan loss provision; normalized forward earnings are expected to result in significantly improved ROA and efficiency metrics. The goodwill impairment charge had no impact on tangible book value, regulatory capital, liquidity nor the Company’s cash balances • Since Q3 2019, the Company began implementing efficiency initiatives that have reduced salaries and benefits costs and projects to save approximately $3.4 million per year going forward due to additional reduction actions taken in Q3 2020 Strong Bank Capital Ratios • Subordinated debt raise is intended to provide optionality and further strengthen capital adequacy in light of economic impact of the COVID-19 pandemic, among other corporate and strategic purposes • Pro forma debt / equity below 30% and pro forma double leverage below 130% Diversified Loan Portfolio & Sound Asset Quality • Riverview’s loan portfolio is well-diversified among asset concentrations and is pro-actively monitored for signs of stress • NPAs / Assets (excluding performing TDRs) of just 0.32% at June 30, 2020 • Gateway Asset Management conducted a post-COVID independent loan review in June 2020 • Gateway reviewed 73.6% of the portfolio and its analysis forecasted in an extreme case a 30-month cumulative loss scenario a total NCO of $22.7 million or approximately 2.77% of total loans • ALL $9.736 million, 1.09% of Total Loans excluding PPP Loans, as of June 30, 2020 • Developed a de-risk policy over the past two years aimed at aggressively moving problem credits out of the Bank to improve its asset quality profile Steady Growth in Consistent Markets • Intentionally downsized the Bank from 2017 - 2019 in order to strategically de-risk the balance sheet • Moderate growth currently supported by reasonable economic trends within the Bank’s footprint • Implemented a major market repositioning strategy in 2019, closing six underperforming branch offices with deteriorating demographics and redeployed resources to three new offices in high-growth markets Balanced Risk Profile • Moderately asset sensitive interest rate profile (1) • PT Score™ of 247 (out of 500+) as of June 30, 2020 suggests low structural risk BEFORE the benefit of the new capital raise and improved earnings as a result of the efficiency initiative Source: S&P Global Market Intelligence; Company provided documents 10 (1) Performance Trust PT Score™. PT Score is described in further detail on page 14Investment Highlights Experienced Management Team Backed by Leading Institutional Investor • Executive team has decades of experience in community banking with the CEO, CFO, and COO each having spent more than 25 years in the industry • Brett Fulk, CEO, was a market executive at much larger regional banks in the Northeast prior to joining Riverview in 2011 • Castle Creek Capital LLC and affiliated funds own 20.1% of the Company’s common stock Improving Performance with Pathway To Respectable ROA • Q2 2020 results impacted by $24.7 million goodwill impairment charge and outsized loan loss provision; normalized forward earnings are expected to result in significantly improved ROA and efficiency metrics. The goodwill impairment charge had no impact on tangible book value, regulatory capital, liquidity nor the Company’s cash balances • Since Q3 2019, the Company began implementing efficiency initiatives that have reduced salaries and benefits costs and projects to save approximately $3.4 million per year going forward due to additional reduction actions taken in Q3 2020 Strong Bank Capital Ratios • Subordinated debt raise is intended to provide optionality and further strengthen capital adequacy in light of economic impact of the COVID-19 pandemic, among other corporate and strategic purposes • Pro forma debt / equity below 30% and pro forma double leverage below 130% Diversified Loan Portfolio & Sound Asset Quality • Riverview’s loan portfolio is well-diversified among asset concentrations and is pro-actively monitored for signs of stress • NPAs / Assets (excluding performing TDRs) of just 0.32% at June 30, 2020 • Gateway Asset Management conducted a post-COVID independent loan review in June 2020 • Gateway reviewed 73.6% of the portfolio and its analysis forecasted in an extreme case a 30-month cumulative loss scenario a total NCO of $22.7 million or approximately 2.77% of total loans • ALL $9.736 million, 1.09% of Total Loans excluding PPP Loans, as of June 30, 2020 • Developed a de-risk policy over the past two years aimed at aggressively moving problem credits out of the Bank to improve its asset quality profile Steady Growth in Consistent Markets • Intentionally downsized the Bank from 2017 - 2019 in order to strategically de-risk the balance sheet • Moderate growth currently supported by reasonable economic trends within the Bank’s footprint • Implemented a major market repositioning strategy in 2019, closing six underperforming branch offices with deteriorating demographics and redeployed resources to three new offices in high-growth markets Balanced Risk Profile • Moderately asset sensitive interest rate profile (1) • PT Score™ of 247 (out of 500+) as of June 30, 2020 suggests low structural risk BEFORE the benefit of the new capital raise and improved earnings as a result of the efficiency initiative Source: S&P Global Market Intelligence; Company provided documents 10 (1) Performance Trust PT Score™. PT Score is described in further detail on page 14
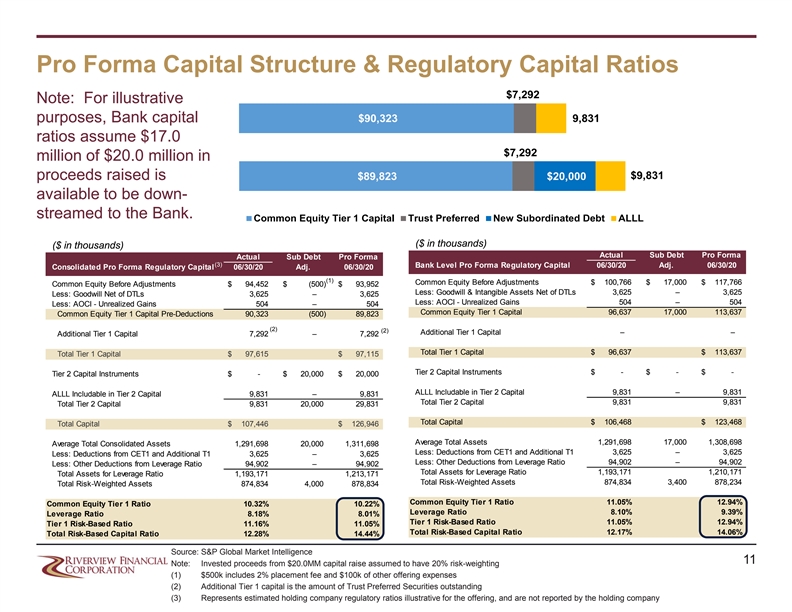
Pro Forma Capital Structure & Regulatory Capital Ratios $7,292 Note: For illustrative purposes, Bank capital $90,323 9,831 ratios assume $17.0 $7,292 million of $20.0 million in $9,831 proceeds raised is $89,823 $20,000 available to be down- streamed to the Bank. Common Equity Tier 1 Capital Trust Preferred New Subordinated Debt ALLL ($ in thousands) ($ in thousands) Actual Sub Debt Pro Forma Actual Sub Debt Pro Forma (3) Bank Level Pro Forma Regulatory Capital 06/30/20 Adj. 06/30/20 Consolidated Pro Forma Regulatory Capital 06/30/20 Adj. 06/30/20 (1) Common Equity Before Adjustments $ 100, 766 $ 17,000 $ 117, 766 Common Equity Before Adjustments $ 94,452 $ (500) $ 93,952 Less: Goodwill & Intangible Assets Net of DTLs 3,625 – 3,625 Less: Goodwill Net of DTLs 3,625 – 3,625 Less: AOCI - Unrealized Gains 504 – 504 Less: AOCI - Unrealized Gains 504 – 504 Common Equity Tier 1 Capital 96,637 17,000 113,637 Common Equity Tier 1 Capital Pre-Deductions 90,323 (500) 89,823 (2) (2) Additional Tier 1 Capital – – Additional Tier 1 Capital 7,292 – 7,292 Total Tier 1 Capital $ 96,637 $ 113, 637 Total Tier 1 Capital $ 97,615 $ 97,115 Tier 2 Capital Instruments $ - $ - $ - Tier 2 Capital Instruments $ - $ 20,000 $ 20,000 ALLL Includable in Tier 2 Capital 9,831 – 9,831 ALLL Includable in Tier 2 Capital 9,831 – 9,831 Total Tier 2 Capital 9,831 9,831 Total Tier 2 Capital 9,831 20,000 29,831 Total Capital $ 106, 468 $ 123, 468 Total Capital $ 107, 446 $ 126, 946 Average Total Assets 1,291,698 17,000 1,308,698 Average Total Consolidated Assets 1,291,698 20,000 1,311,698 Less: Deductions from CET1 and Additional T1 3,625 – 3,625 Less: Deductions from CET1 and Additional T1 3,625 – 3,625 Less: Other Deductions from Leverage Ratio 94,902 – 94,902 Less: Other Deductions from Leverage Ratio 94,902 – 94,902 Total Assets for Leverage Ratio 1,193,171 1,210,171 Total Assets for Leverage Ratio 1,193,171 1,213,171 Total Risk-Weighted Assets 874,834 3,400 878,234 Total Risk-Weighted Assets 874,834 4,000 878,834 Common Equity Tier 1 Ratio 11.05% 12.94% Common Equity Tier 1 Ratio 10.32% 10.22% Leverage Ratio 8.10% 9.39% Leverage Ratio 8.18% 8.01% Tier 1 Risk-Based Ratio 11.05% 12.94% Tier 1 Risk-Based Ratio 11.16% 11.05% Total Risk-Based Capital Ratio 12.17% 14.06% Total Risk-Based Capital Ratio 12.28% 14.44% Source: S&P Global Market Intelligence 11 Note: Invested proceeds from $20.0MM capital raise assumed to have 20% risk-weighting (1) $500k includes 2% placement fee and $100k of other offering expenses (2) Additional Tier 1 capital is the amount of Trust Preferred Securities outstanding (3) Represents estimated holding company regulatory ratios illustrative for the offering, and are not reported by the holding companyPro Forma Capital Structure & Regulatory Capital Ratios $7,292 Note: For illustrative purposes, Bank capital $90,323 9,831 ratios assume $17.0 $7,292 million of $20.0 million in $9,831 proceeds raised is $89,823 $20,000 available to be down- streamed to the Bank. Common Equity Tier 1 Capital Trust Preferred New Subordinated Debt ALLL ($ in thousands) ($ in thousands) Actual Sub Debt Pro Forma Actual Sub Debt Pro Forma (3) Bank Level Pro Forma Regulatory Capital 06/30/20 Adj. 06/30/20 Consolidated Pro Forma Regulatory Capital 06/30/20 Adj. 06/30/20 (1) Common Equity Before Adjustments $ 100, 766 $ 17,000 $ 117, 766 Common Equity Before Adjustments $ 94,452 $ (500) $ 93,952 Less: Goodwill & Intangible Assets Net of DTLs 3,625 – 3,625 Less: Goodwill Net of DTLs 3,625 – 3,625 Less: AOCI - Unrealized Gains 504 – 504 Less: AOCI - Unrealized Gains 504 – 504 Common Equity Tier 1 Capital 96,637 17,000 113,637 Common Equity Tier 1 Capital Pre-Deductions 90,323 (500) 89,823 (2) (2) Additional Tier 1 Capital – – Additional Tier 1 Capital 7,292 – 7,292 Total Tier 1 Capital $ 96,637 $ 113, 637 Total Tier 1 Capital $ 97,615 $ 97,115 Tier 2 Capital Instruments $ - $ - $ - Tier 2 Capital Instruments $ - $ 20,000 $ 20,000 ALLL Includable in Tier 2 Capital 9,831 – 9,831 ALLL Includable in Tier 2 Capital 9,831 – 9,831 Total Tier 2 Capital 9,831 9,831 Total Tier 2 Capital 9,831 20,000 29,831 Total Capital $ 106, 468 $ 123, 468 Total Capital $ 107, 446 $ 126, 946 Average Total Assets 1,291,698 17,000 1,308,698 Average Total Consolidated Assets 1,291,698 20,000 1,311,698 Less: Deductions from CET1 and Additional T1 3,625 – 3,625 Less: Deductions from CET1 and Additional T1 3,625 – 3,625 Less: Other Deductions from Leverage Ratio 94,902 – 94,902 Less: Other Deductions from Leverage Ratio 94,902 – 94,902 Total Assets for Leverage Ratio 1,193,171 1,210,171 Total Assets for Leverage Ratio 1,193,171 1,213,171 Total Risk-Weighted Assets 874,834 3,400 878,234 Total Risk-Weighted Assets 874,834 4,000 878,834 Common Equity Tier 1 Ratio 11.05% 12.94% Common Equity Tier 1 Ratio 10.32% 10.22% Leverage Ratio 8.10% 9.39% Leverage Ratio 8.18% 8.01% Tier 1 Risk-Based Ratio 11.05% 12.94% Tier 1 Risk-Based Ratio 11.16% 11.05% Total Risk-Based Capital Ratio 12.17% 14.06% Total Risk-Based Capital Ratio 12.28% 14.44% Source: S&P Global Market Intelligence 11 Note: Invested proceeds from $20.0MM capital raise assumed to have 20% risk-weighting (1) $500k includes 2% placement fee and $100k of other offering expenses (2) Additional Tier 1 capital is the amount of Trust Preferred Securities outstanding (3) Represents estimated holding company regulatory ratios illustrative for the offering, and are not reported by the holding company

Debt Service Coverage Ratio & Debt to Equity Summary ($ in thousands) (4) (4) Interest Coverage 2019 2021E PF 2022E PF Consolidated Pre-Tax Earnings Consolidated Pre-Tax Income $4,987 $2,500 $10,000 Trust Preferred Interest Expense 275 275 275 Balance Sheet Leverage Income Contribution - 1,197 1,197 A Pre-Tax Earnings Before BHC Debt Interest Expense $5,262 $3,972 $11,472 BHC Debt Interest Expense B Total Interest Expense - Sub Debt at 5.50% and existing TruPS Expense $1,375 $1,375 $1,375 C Total Interest Expense - Sub Debt at 5.75% and existing TruPS Expense 1,425 1,425 1,425 D Total Interest Expense - Sub Debt at 6.00% and existing TruPS Expense 1,475 1,475 1,475 Pro Forma Interest Coverage - A / B 3.8x 2.9x 8.3x Pro Forma Interest Coverage - A / C 3.7x 2.8x 8.1x Pro Forma Interest Coverage - A / D 3.6x 2.7x 7.8x (4) Pro Forma Debt / Equity and Double Leverage 06/30/20 A 12/31/20 PF Consolidated Equity (1) $94,452 $94,052 Trust Preferred (2) 7,292 7,292 Subordinated Debt - 20,000 Debt / Equity 7.7% 29.0% Debt / Equity (ex. AOCI) 7.8% 29.2% Bank Equity (3) $100,766 $117,766 Double Leverage Ratio 106.7% 125.2% Source: Company documents, S&P Global Market Intelligence (1) Consolidated equity as of June 30, 2020 12 (2) Trust preferred securities of $7.292MM as of June 30, 2020 (3) Assumes $17.0MM of proceeds from new sub debt issuance are down-streamed to the bank level as common equity (4) Future earnings projections and financial information are solely for illustration purposes. There can be no guarantee as to whether and to what extent these projections will be achieved. The Company undertakes no obligation to revise or release any revision or update to these forward-looking statements. Debt Service Coverage Ratio & Debt to Equity Summary ($ in thousands) (4) (4) Interest Coverage 2019 2021E PF 2022E PF Consolidated Pre-Tax Earnings Consolidated Pre-Tax Income $4,987 $2,500 $10,000 Trust Preferred Interest Expense 275 275 275 Balance Sheet Leverage Income Contribution - 1,197 1,197 A Pre-Tax Earnings Before BHC Debt Interest Expense $5,262 $3,972 $11,472 BHC Debt Interest Expense B Total Interest Expense - Sub Debt at 5.50% and existing TruPS Expense $1,375 $1,375 $1,375 C Total Interest Expense - Sub Debt at 5.75% and existing TruPS Expense 1,425 1,425 1,425 D Total Interest Expense - Sub Debt at 6.00% and existing TruPS Expense 1,475 1,475 1,475 Pro Forma Interest Coverage - A / B 3.8x 2.9x 8.3x Pro Forma Interest Coverage - A / C 3.7x 2.8x 8.1x Pro Forma Interest Coverage - A / D 3.6x 2.7x 7.8x (4) Pro Forma Debt / Equity and Double Leverage 06/30/20 A 12/31/20 PF Consolidated Equity (1) $94,452 $94,052 Trust Preferred (2) 7,292 7,292 Subordinated Debt - 20,000 Debt / Equity 7.7% 29.0% Debt / Equity (ex. AOCI) 7.8% 29.2% Bank Equity (3) $100,766 $117,766 Double Leverage Ratio 106.7% 125.2% Source: Company documents, S&P Global Market Intelligence (1) Consolidated equity as of June 30, 2020 12 (2) Trust preferred securities of $7.292MM as of June 30, 2020 (3) Assumes $17.0MM of proceeds from new sub debt issuance are down-streamed to the bank level as common equity (4) Future earnings projections and financial information are solely for illustration purposes. There can be no guarantee as to whether and to what extent these projections will be achieved. The Company undertakes no obligation to revise or release any revision or update to these forward-looking statements.
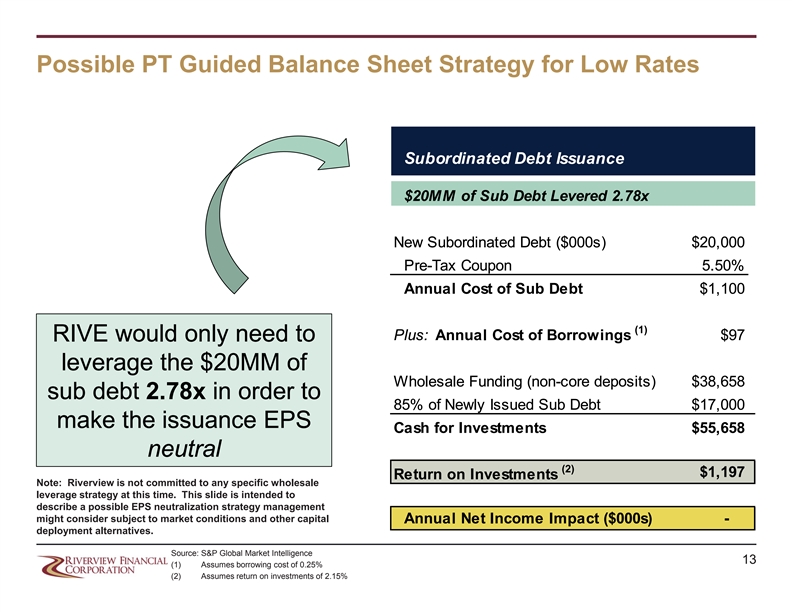
Possible PT Guided Balance Sheet Strategy for Low Rates Subordinated Debt Issuance $20MM of Sub Debt Levered 2.78x New Subordinated Debt ($000s) $20,000 Pre-Tax Coupon 5.50% Annual Cost of Sub Debt $1,100 (1) Plus: Annual Cost of Borrowings $97 RIVE would only need to leverage the $20MM of Wholesale Funding (non-core deposits) $38,658 sub debt 2.78x in order to 85% of Newly Issued Sub Debt $17,000 make the issuance EPS Cash for Investments $55,658 neutral (2) $1,197 Return on Investments Note: Riverview is not committed to any specific wholesale leverage strategy at this time. This slide is intended to describe a possible EPS neutralization strategy management might consider subject to market conditions and other capital Annual Net Income Impact ($000s) - deployment alternatives. Source: S&P Global Market Intelligence 13 (1) Assumes borrowing cost of 0.25% (2) Assumes return on investments of 2.15%Possible PT Guided Balance Sheet Strategy for Low Rates Subordinated Debt Issuance $20MM of Sub Debt Levered 2.78x New Subordinated Debt ($000s) $20,000 Pre-Tax Coupon 5.50% Annual Cost of Sub Debt $1,100 (1) Plus: Annual Cost of Borrowings $97 RIVE would only need to leverage the $20MM of Wholesale Funding (non-core deposits) $38,658 sub debt 2.78x in order to 85% of Newly Issued Sub Debt $17,000 make the issuance EPS Cash for Investments $55,658 neutral (2) $1,197 Return on Investments Note: Riverview is not committed to any specific wholesale leverage strategy at this time. This slide is intended to describe a possible EPS neutralization strategy management might consider subject to market conditions and other capital Annual Net Income Impact ($000s) - deployment alternatives. Source: S&P Global Market Intelligence 13 (1) Assumes borrowing cost of 0.25% (2) Assumes return on investments of 2.15%
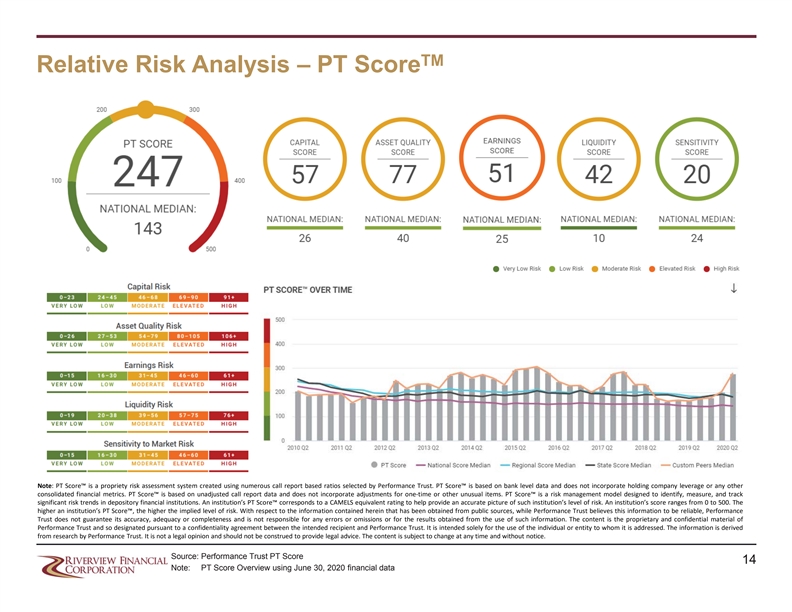
TM Relative Risk Analysis – PT Score Note: PT Score™ is a propriety risk assessment system created using numerous call report based ratios selected by Performance Trust. PT Score™ is based on bank level data and does not incorporate holding company leverage or any other consolidated financial metrics. PT Score™ is based on unadjusted call report data and does not incorporate adjustments for one-time or other unusual items. PT Score™ is a risk management model designed to identify, measure, and track significant risk trends in depository financial institutions. An institution’s PT Score™ corresponds to a CAMELS equivalent rating to help provide an accurate picture of such institution’s level of risk. An institution’s score ranges from 0 to 500. The higher an institution’s PT Score™, the higher the implied level of risk. With respect to the information contained herein that has been obtained from public sources, while Performance Trust believes this information to be reliable, Performance Trust does not guarantee its accuracy, adequacy or completeness and is not responsible for any errors or omissions or for the results obtained from the use of such information. The content is the proprietary and confidential material of Performance Trust and so designated pursuant to a confidentiality agreement between the intended recipient and Performance Trust. It is intended solely for the use of the individual or entity to whom it is addressed. The information is derived from research by Performance Trust. It is not a legal opinion and should not be construed to provide legal advice. The content is subject to change at any time and without notice. Source: Performance Trust PT Score 14 Note: PT Score Overview using June 30, 2020 financial dataTM Relative Risk Analysis – PT Score Note: PT Score™ is a propriety risk assessment system created using numerous call report based ratios selected by Performance Trust. PT Score™ is based on bank level data and does not incorporate holding company leverage or any other consolidated financial metrics. PT Score™ is based on unadjusted call report data and does not incorporate adjustments for one-time or other unusual items. PT Score™ is a risk management model designed to identify, measure, and track significant risk trends in depository financial institutions. An institution’s PT Score™ corresponds to a CAMELS equivalent rating to help provide an accurate picture of such institution’s level of risk. An institution’s score ranges from 0 to 500. The higher an institution’s PT Score™, the higher the implied level of risk. With respect to the information contained herein that has been obtained from public sources, while Performance Trust believes this information to be reliable, Performance Trust does not guarantee its accuracy, adequacy or completeness and is not responsible for any errors or omissions or for the results obtained from the use of such information. The content is the proprietary and confidential material of Performance Trust and so designated pursuant to a confidentiality agreement between the intended recipient and Performance Trust. It is intended solely for the use of the individual or entity to whom it is addressed. The information is derived from research by Performance Trust. It is not a legal opinion and should not be construed to provide legal advice. The content is subject to change at any time and without notice. Source: Performance Trust PT Score 14 Note: PT Score Overview using June 30, 2020 financial data
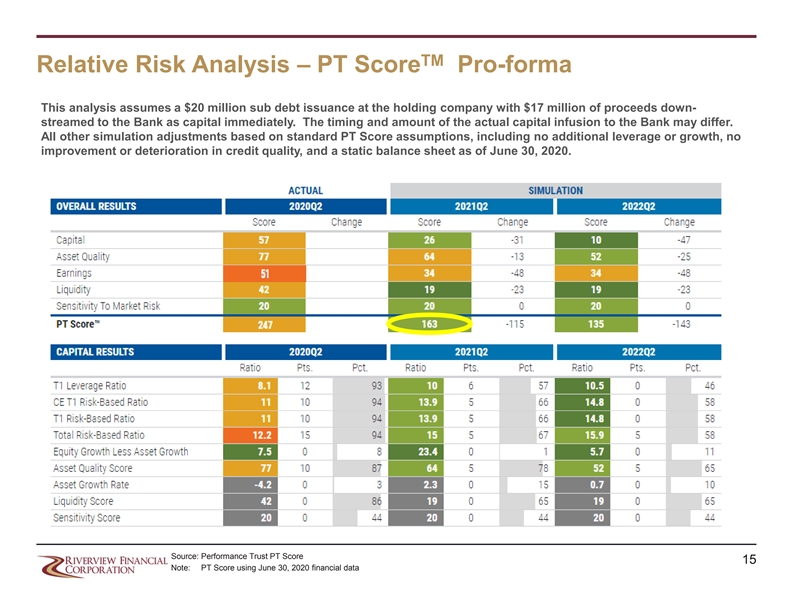
TM Relative Risk Analysis – PT Score Pro-forma This analysis assumes a $20 million sub debt issuance at the holding company with $17 million of proceeds down- streamed to the Bank as capital immediately. The timing and amount of the actual capital infusion to the Bank may differ. All other simulation adjustments based on standard PT Score assumptions, including no additional leverage or growth, no improvement or deterioration in credit quality, and a static balance sheet as of June 30, 2020. Source: Performance Trust PT Score 15 Note: PT Score using June 30, 2020 financial dataTM Relative Risk Analysis – PT Score Pro-forma This analysis assumes a $20 million sub debt issuance at the holding company with $17 million of proceeds down- streamed to the Bank as capital immediately. The timing and amount of the actual capital infusion to the Bank may differ. All other simulation adjustments based on standard PT Score assumptions, including no additional leverage or growth, no improvement or deterioration in credit quality, and a static balance sheet as of June 30, 2020. Source: Performance Trust PT Score 15 Note: PT Score using June 30, 2020 financial data

II. Management Team, Board & Ownership Information 16II. Management Team, Board & Ownership Information 16

Experienced Management Team Name Title Age Biography Brett D. Fulk is President, CEO and a Director of Riverview and Riverview Bank, and has been with the Bank since July 2011 with 28 President, CEO & years of banking experience. Formerly with Susquehanna Bank and Community Banks, where he held the positions of Regional Brett D. Fulk 52 Executive, Commercial Sales Manager and Managing Director of Commercial Services, PA Division. He graduated from Shippensburg Director University of PA with a Bachelors Degree in Finance and is a graduate of the Bucknell School of Commercial Banking. Scott A. Seasock has been the Chief Financial Officer and Senior Executive Vice President of Riverview and Riverview Bank since 2016 and has accumulated 39 years in the banking industry. Mr. Seasock previously worked at Peoples Financial Services Corp. (NASDAQ: Scott A. Chief Financial PFIS), where he previously served as its Chief Financial Officer and Executive Vice President, from January 2010 to April 2016. Prior to 63 Peoples Financial Services, he served as an Executive Vice President and Chief Financial Officer of Comm Bancorp. Inc. from 1987- Seasock Officer 2010. He is a graduate of Penn State University, with a bachelors degree in Finance, holds an MBA from the University of Scranton, and is a graduate of the School of Banking at the University of Wisconsin. Ginger G. Kunkel joined Riverview Bank in 2014 and now serves as Chief Operating Officer. She began her banking career at Pennsylvania National Bank in 1990 and during her 29-year banking career has held management roles in Deposit Operations, Retail, and Commercial Lending in banks ranging from $1 Billion to over $18 Billion in assets. The majority of her career was devoted to C&I Ginger G. Chief Operating Commercial Lending throughout several PA counties including Berks, Lehigh, Montgomery, Dauphin, and Schuylkill as well as 50 Kunkel Officer surrounding markets. Ms. Kunkel has extensive experience in merger integration and de novo branching. Ms. Kunkel is a graduate of the ABA Stonier Graduate School of Banking and the Wharton Leadership Program and has served on the boards of various community organizations. Steven A. Ehrlich is the Chief Strategy Officer and Senior Executive Vice President of Riverview and Riverview Bank with 34 years of experience in banking. Prior to joining Riverview in March 2019, Mr. Ehrlich was President and board member of First Priority Financial Steven A. Chief Strategy Corp. and First Priority Bank from February 2013 until the sale of the bank in July 2018. Prior to First Priority, Mr. Ehrlich founded 58 Affinity Bancorp, Inc. and Affinity Bank of Pennsylvania, Reading, PA in 2003 and served as its Chairman, President and CEO until Ehrlich Officer merging with First Priority in 2013. Prior to founding Affinity, Mr. Ehrlich was the EVP and Chief Lending /Credit Officer for Main Street Bancorp, Reading PA. Mr. Ehrlich received his B.A. degree from The College of Wooster, Wooster Ohio. Richard W. Ogden is the Chief Risk Office and Senior Executive Vice President of Riverview and Riverview Bank. Mr. Ogden joined Riverview through the merger of CBT Financial Corp. and CBT Bank, where he served as its Chief Financial Officer and Executive Vice Richard W. President, and brings with him more than 39 years of banking experience and expertise. He is a graduate of Penn State University, with Chief Risk Officer 61 Ogden a bachelors degree in Accounting, Graduate of the ABA Graduate School of Bank Investments and Funds Management and BAI School of Bank Controllership. Source: S&P Global Market Intelligence; Company provided biographies 17Experienced Management Team Name Title Age Biography Brett D. Fulk is President, CEO and a Director of Riverview and Riverview Bank, and has been with the Bank since July 2011 with 28 President, CEO & years of banking experience. Formerly with Susquehanna Bank and Community Banks, where he held the positions of Regional Brett D. Fulk 52 Executive, Commercial Sales Manager and Managing Director of Commercial Services, PA Division. He graduated from Shippensburg Director University of PA with a Bachelors Degree in Finance and is a graduate of the Bucknell School of Commercial Banking. Scott A. Seasock has been the Chief Financial Officer and Senior Executive Vice President of Riverview and Riverview Bank since 2016 and has accumulated 39 years in the banking industry. Mr. Seasock previously worked at Peoples Financial Services Corp. (NASDAQ: Scott A. Chief Financial PFIS), where he previously served as its Chief Financial Officer and Executive Vice President, from January 2010 to April 2016. Prior to 63 Peoples Financial Services, he served as an Executive Vice President and Chief Financial Officer of Comm Bancorp. Inc. from 1987- Seasock Officer 2010. He is a graduate of Penn State University, with a bachelors degree in Finance, holds an MBA from the University of Scranton, and is a graduate of the School of Banking at the University of Wisconsin. Ginger G. Kunkel joined Riverview Bank in 2014 and now serves as Chief Operating Officer. She began her banking career at Pennsylvania National Bank in 1990 and during her 29-year banking career has held management roles in Deposit Operations, Retail, and Commercial Lending in banks ranging from $1 Billion to over $18 Billion in assets. The majority of her career was devoted to C&I Ginger G. Chief Operating Commercial Lending throughout several PA counties including Berks, Lehigh, Montgomery, Dauphin, and Schuylkill as well as 50 Kunkel Officer surrounding markets. Ms. Kunkel has extensive experience in merger integration and de novo branching. Ms. Kunkel is a graduate of the ABA Stonier Graduate School of Banking and the Wharton Leadership Program and has served on the boards of various community organizations. Steven A. Ehrlich is the Chief Strategy Officer and Senior Executive Vice President of Riverview and Riverview Bank with 34 years of experience in banking. Prior to joining Riverview in March 2019, Mr. Ehrlich was President and board member of First Priority Financial Steven A. Chief Strategy Corp. and First Priority Bank from February 2013 until the sale of the bank in July 2018. Prior to First Priority, Mr. Ehrlich founded 58 Affinity Bancorp, Inc. and Affinity Bank of Pennsylvania, Reading, PA in 2003 and served as its Chairman, President and CEO until Ehrlich Officer merging with First Priority in 2013. Prior to founding Affinity, Mr. Ehrlich was the EVP and Chief Lending /Credit Officer for Main Street Bancorp, Reading PA. Mr. Ehrlich received his B.A. degree from The College of Wooster, Wooster Ohio. Richard W. Ogden is the Chief Risk Office and Senior Executive Vice President of Riverview and Riverview Bank. Mr. Ogden joined Riverview through the merger of CBT Financial Corp. and CBT Bank, where he served as its Chief Financial Officer and Executive Vice Richard W. President, and brings with him more than 39 years of banking experience and expertise. He is a graduate of Penn State University, with Chief Risk Officer 61 Ogden a bachelors degree in Accounting, Graduate of the ABA Graduate School of Bank Investments and Funds Management and BAI School of Bank Controllership. Source: S&P Global Market Intelligence; Company provided biographies 17
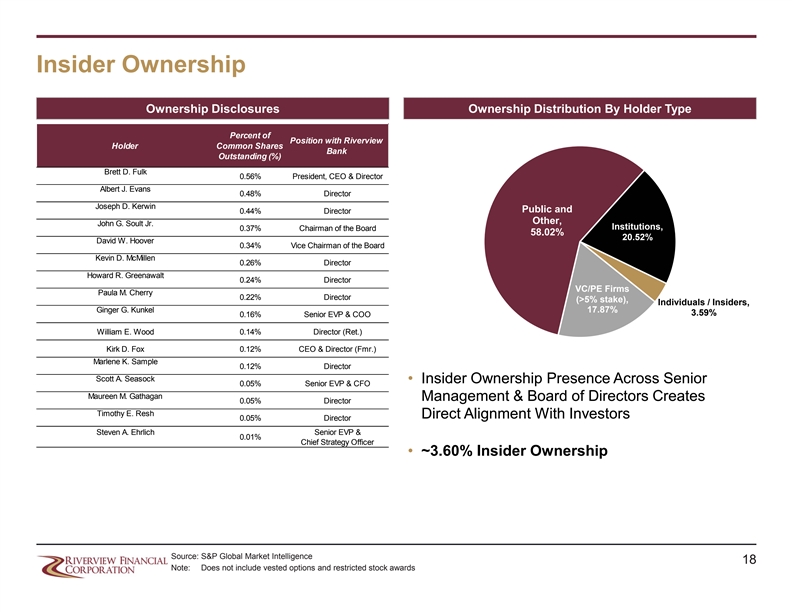
Insider Ownership Ownership Disclosures Ownership Distribution By Holder Type Percent of Position with Riverview Holder Common Shares Bank Outstanding (%) Brett D. Fulk 0.56% President, CEO & Director Albert J. Evans 0.48% Director Joseph D. Kerwin Public and 0.44% Director Other, John G. Soult Jr. Institutions, 0.37% Chairman of the Board 58.02% 20.52% David W. Hoover 0.34% Vice Chairman of the Board Kevin D. McMillen 0.26% Director Howard R. Greenawalt 0.24% Director VC/PE Firms Paula M. Cherry 0.22% Director (>5% stake), Individuals / Insiders, Ginger G. Kunkel 17.87% 3.59% 0.16% Senior EVP & COO William E. Wood 0.14% Director (Ret.) Kirk D. Fox 0.12% CEO & Director (Fmr.) Marlene K. Sample 0.12% Director Scott A. Seasock • Insider Ownership Presence Across Senior 0.05% Senior EVP & CFO Maureen M. Gathagan Management & Board of Directors Creates 0.05% Director Timothy E. Resh Direct Alignment With Investors 0.05% Director Steven A. Ehrlich Senior EVP & 0.01% Chief Strategy Officer • ~3.60% Insider Ownership Source: S&P Global Market Intelligence 18 Note: Does not include vested options and restricted stock awardsInsider Ownership Ownership Disclosures Ownership Distribution By Holder Type Percent of Position with Riverview Holder Common Shares Bank Outstanding (%) Brett D. Fulk 0.56% President, CEO & Director Albert J. Evans 0.48% Director Joseph D. Kerwin Public and 0.44% Director Other, John G. Soult Jr. Institutions, 0.37% Chairman of the Board 58.02% 20.52% David W. Hoover 0.34% Vice Chairman of the Board Kevin D. McMillen 0.26% Director Howard R. Greenawalt 0.24% Director VC/PE Firms Paula M. Cherry 0.22% Director (>5% stake), Individuals / Insiders, Ginger G. Kunkel 17.87% 3.59% 0.16% Senior EVP & COO William E. Wood 0.14% Director (Ret.) Kirk D. Fox 0.12% CEO & Director (Fmr.) Marlene K. Sample 0.12% Director Scott A. Seasock • Insider Ownership Presence Across Senior 0.05% Senior EVP & CFO Maureen M. Gathagan Management & Board of Directors Creates 0.05% Director Timothy E. Resh Direct Alignment With Investors 0.05% Director Steven A. Ehrlich Senior EVP & 0.01% Chief Strategy Officer • ~3.60% Insider Ownership Source: S&P Global Market Intelligence 18 Note: Does not include vested options and restricted stock awards

Strong Sponsorship Current Position Position Change Report Date Institutional Holder (Shares) Since Last Report % of Shares Out. As of Castle Creek Capital LLC 1,866,648 215,183 20.13 8/13/2020 Banc Funds Company, L.L.C. 492,634 62,342 5.32 6/30/2020 EJF Capital LLC 409,271 - 4.42 6/30/2020 Tontine Management LLC 233,369 - 2.52 6/30/2020 Vanguard Group Inc. 134,217 111,415 1.45 6/30/2020 Wellington Management Group LLP 102,551 (9,208) 1.11 6/30/2020 Southside Capital LLC 73,729 - 0.8 12/31/2019 Millennium Management LLC 65,849 1,717 0.71 6/30/2020 Minerva Advisors LLC 59,515 (393) 0.64 6/30/2020 Brett D. Fulk President, CEO & Director 52,191 9,562 0.56 5/22/2020 Albert J. Evans Independent Director 44,354 2,341 0.48 5/6/2020 Joseph D. Kerwin Independent Director 40,869 4,891 0.44 5/14/2020 CNB Bank 38,881 (2,860) 0.42 6/30/2020 John G. Soult Jr. Independent Chairman of the Board 34,435 8,377 0.37 4/15/2020 BHZ Capital Management LP 34,231 7,708 0.37 6/30/2020 David W. Hoover Independent Vice Chairman of the Board 31,284 560 0.34 4/15/2020 Kevin D. McMillen Independent Director 23,726 560 0.26 4/15/2020 Howard R. Greenawalt Independent Director 22,061 1,501 0.24 5/6/2020 Paula M. Cherry Independent Director 20,361 1,617 0.22 5/6/2020 Wharton Business Group LLC 20,160 - 0.22 6/30/2020 Commonwealth Equity Services LLC 16,909 218 0.18 6/30/2020 Glenmede Trust Co. NA 15,788 - 0.17 6/30/2020 BlackRock, Inc. 15,016 (582) 0.16 6/30/2020 Ginger G. Kunkel Senior EVP & COO 14,994 4,500 0.16 5/6/2020 Raymond James Financial Services Advisors Inc. 13,761 - 0.15 6/30/2020 Top 25 Ownership Holdings 3,876,804 419,449 41.84 Source: S&P Global Market Intelligence 19Strong Sponsorship Current Position Position Change Report Date Institutional Holder (Shares) Since Last Report % of Shares Out. As of Castle Creek Capital LLC 1,866,648 215,183 20.13 8/13/2020 Banc Funds Company, L.L.C. 492,634 62,342 5.32 6/30/2020 EJF Capital LLC 409,271 - 4.42 6/30/2020 Tontine Management LLC 233,369 - 2.52 6/30/2020 Vanguard Group Inc. 134,217 111,415 1.45 6/30/2020 Wellington Management Group LLP 102,551 (9,208) 1.11 6/30/2020 Southside Capital LLC 73,729 - 0.8 12/31/2019 Millennium Management LLC 65,849 1,717 0.71 6/30/2020 Minerva Advisors LLC 59,515 (393) 0.64 6/30/2020 Brett D. Fulk President, CEO & Director 52,191 9,562 0.56 5/22/2020 Albert J. Evans Independent Director 44,354 2,341 0.48 5/6/2020 Joseph D. Kerwin Independent Director 40,869 4,891 0.44 5/14/2020 CNB Bank 38,881 (2,860) 0.42 6/30/2020 John G. Soult Jr. Independent Chairman of the Board 34,435 8,377 0.37 4/15/2020 BHZ Capital Management LP 34,231 7,708 0.37 6/30/2020 David W. Hoover Independent Vice Chairman of the Board 31,284 560 0.34 4/15/2020 Kevin D. McMillen Independent Director 23,726 560 0.26 4/15/2020 Howard R. Greenawalt Independent Director 22,061 1,501 0.24 5/6/2020 Paula M. Cherry Independent Director 20,361 1,617 0.22 5/6/2020 Wharton Business Group LLC 20,160 - 0.22 6/30/2020 Commonwealth Equity Services LLC 16,909 218 0.18 6/30/2020 Glenmede Trust Co. NA 15,788 - 0.17 6/30/2020 BlackRock, Inc. 15,016 (582) 0.16 6/30/2020 Ginger G. Kunkel Senior EVP & COO 14,994 4,500 0.16 5/6/2020 Raymond James Financial Services Advisors Inc. 13,761 - 0.15 6/30/2020 Top 25 Ownership Holdings 3,876,804 419,449 41.84 Source: S&P Global Market Intelligence 19

III. Assets Highlights 20III. Assets Highlights 20
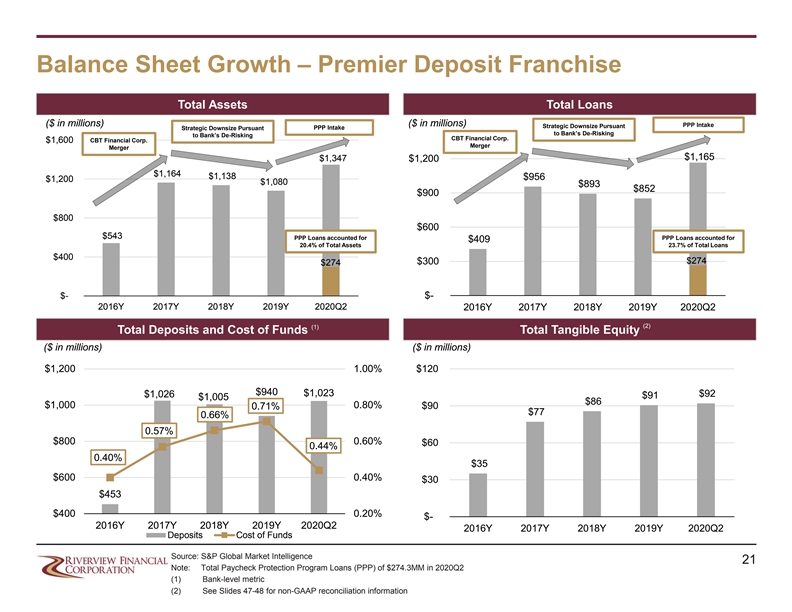
Balance Sheet Growth – Premier Deposit Franchise Total Assets Total Loans ($ in millions) ($ in millions) PPP Intake Strategic Downsize Pursuant Strategic Downsize Pursuant PPP Intake to Bank’s De-Risking to Bank’s De-Risking CBT Financial Corp. $1,600 CBT Financial Corp. Merger Merger $1,165 $1,347 $1,200 $1,164 $1,138 $956 $1,200 $1,080 $893 $852 $900 $800 $600 $543 PPP Loans accounted for PPP Loans accounted for $409 20.4% of Total Assets 23.7% of Total Loans $400 $274 $300 $274 $- $- 2016Y 2017Y 2018Y 2019Y 2020Q2 2016Y 2017Y 2018Y 2019Y 2020Q2 (2) (1) Total Deposits and Cost of Funds Total Tangible Equity ($ in millions) ($ in millions) $1,200 1.00% $120 $940 $1,023 $1,026 $92 $91 $1,005 $86 $1,000 0.80% $90 0.71% $77 0.66% 0.57% $800 0.60% $60 0.44% 0.40% $35 $600 0.40% $30 $453 $400 0.20% $- 2016Y 2017Y 2018Y 2019Y 2020Q2 2016Y 2017Y 2018Y 2019Y 2020Q2 Deposits Cost of Funds Source: S&P Global Market Intelligence 21 Note: Total Paycheck Protection Program Loans (PPP) of $274.3MM in 2020Q2 (1) Bank-level metric (2) See Slides 47-48 for non-GAAP reconciliation information Balance Sheet Growth – Premier Deposit Franchise Total Assets Total Loans ($ in millions) ($ in millions) PPP Intake Strategic Downsize Pursuant Strategic Downsize Pursuant PPP Intake to Bank’s De-Risking to Bank’s De-Risking CBT Financial Corp. $1,600 CBT Financial Corp. Merger Merger $1,165 $1,347 $1,200 $1,164 $1,138 $956 $1,200 $1,080 $893 $852 $900 $800 $600 $543 PPP Loans accounted for PPP Loans accounted for $409 20.4% of Total Assets 23.7% of Total Loans $400 $274 $300 $274 $- $- 2016Y 2017Y 2018Y 2019Y 2020Q2 2016Y 2017Y 2018Y 2019Y 2020Q2 (2) (1) Total Deposits and Cost of Funds Total Tangible Equity ($ in millions) ($ in millions) $1,200 1.00% $120 $940 $1,023 $1,026 $92 $91 $1,005 $86 $1,000 0.80% $90 0.71% $77 0.66% 0.57% $800 0.60% $60 0.44% 0.40% $35 $600 0.40% $30 $453 $400 0.20% $- 2016Y 2017Y 2018Y 2019Y 2020Q2 2016Y 2017Y 2018Y 2019Y 2020Q2 Deposits Cost of Funds Source: S&P Global Market Intelligence 21 Note: Total Paycheck Protection Program Loans (PPP) of $274.3MM in 2020Q2 (1) Bank-level metric (2) See Slides 47-48 for non-GAAP reconciliation information

Investment Portfolio Composition & Performance Asset Class Breakdown Portfolio Management Statistics • The securities portfolio, largely consisting of tax- Other Debt exempt and taxable municipal bonds and Securities 5% residential mortgage backed securities, has been managed with a focus on low credit risk, strong relative returns and supplementing the rest of the balance sheet. (1) • Historical investment portfolio total returns : State & RMBS Political nd • 1 year: 3.89%, 62 percentile 69% Subdiv Secs th 25% • 3 year: 3.43%, 78 percentile th • 5 year: 3.11%, 78 percentile Govt & (2) • Other portfolio information : Agency Secs • Average Life: 2.74 Years 1% • Effective Duration: 2.61 Years • Yield (FTE): 2.89% (1) Total return calculations based on Performance Trust Total Return calculations as of June 30, 2020. Past performance is not indicative of future returns. (2) Other portfolio information based on securities portfolio as of June 30, 2020. Source: S&P Global Market Intelligence, Performance Trust Capital Partners 22Investment Portfolio Composition & Performance Asset Class Breakdown Portfolio Management Statistics • The securities portfolio, largely consisting of tax- Other Debt exempt and taxable municipal bonds and Securities 5% residential mortgage backed securities, has been managed with a focus on low credit risk, strong relative returns and supplementing the rest of the balance sheet. (1) • Historical investment portfolio total returns : State & RMBS Political nd • 1 year: 3.89%, 62 percentile 69% Subdiv Secs th 25% • 3 year: 3.43%, 78 percentile th • 5 year: 3.11%, 78 percentile Govt & (2) • Other portfolio information : Agency Secs • Average Life: 2.74 Years 1% • Effective Duration: 2.61 Years • Yield (FTE): 2.89% (1) Total return calculations based on Performance Trust Total Return calculations as of June 30, 2020. Past performance is not indicative of future returns. (2) Other portfolio information based on securities portfolio as of June 30, 2020. Source: S&P Global Market Intelligence, Performance Trust Capital Partners 22
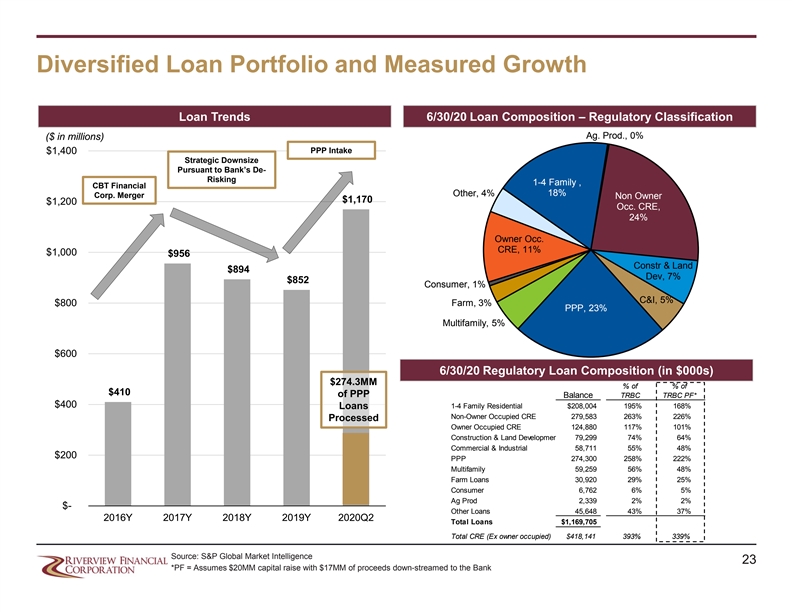
Diversified Loan Portfolio and Measured Growth Loan Trends 6/30/20 Loan Composition – Regulatory Classification Ag. Prod., 0% ($ in millions) PPP Intake $1,400 Strategic Downsize Pursuant to Bank’s De- Risking 1-4 Family , CBT Financial Other, 4% 18% Corp. Merger Non Owner $1,170 $1,200 Occ. CRE, 24% Owner Occ. CRE, 11% $1,000 $956 Constr & Land $894 Dev, 7% $852 Consumer, 1% C&I, 5% $800 Farm, 3% PPP, 23% Multifamily, 5% $600 6/30/20 Regulatory Loan Composition (in $000s) $274.3MM % of % of $410 of PPP Balance TRBC TRBC PF* $400 Loans 1-4 Family Residential $208,004 195% 168% Non-Owner Occupied CRE 279,583 263% 226% Processed Owner Occupied CRE 124,880 117% 101% Construction & Land Developmen 79,299 74% 64% Commercial & Industrial 58,711 55% 48% $200 PPP 274,300 258% 222% Multifamily 59,259 56% 48% Farm Loans 30,920 29% 25% Consumer 6,762 6% 5% Ag Prod 2,339 2% 2% $- Other Loans 45,648 43% 37% 2016Y 2017Y 2018Y 2019Y 2020Q2 Total Loans $1,169,705 Total CRE (Ex owner occupied) $418,141 393% 339% Source: S&P Global Market Intelligence 23 *PF = Assumes $20MM capital raise with $17MM of proceeds down-streamed to the BankDiversified Loan Portfolio and Measured Growth Loan Trends 6/30/20 Loan Composition – Regulatory Classification Ag. Prod., 0% ($ in millions) PPP Intake $1,400 Strategic Downsize Pursuant to Bank’s De- Risking 1-4 Family , CBT Financial Other, 4% 18% Corp. Merger Non Owner $1,170 $1,200 Occ. CRE, 24% Owner Occ. CRE, 11% $1,000 $956 Constr & Land $894 Dev, 7% $852 Consumer, 1% C&I, 5% $800 Farm, 3% PPP, 23% Multifamily, 5% $600 6/30/20 Regulatory Loan Composition (in $000s) $274.3MM % of % of $410 of PPP Balance TRBC TRBC PF* $400 Loans 1-4 Family Residential $208,004 195% 168% Non-Owner Occupied CRE 279,583 263% 226% Processed Owner Occupied CRE 124,880 117% 101% Construction & Land Developmen 79,299 74% 64% Commercial & Industrial 58,711 55% 48% $200 PPP 274,300 258% 222% Multifamily 59,259 56% 48% Farm Loans 30,920 29% 25% Consumer 6,762 6% 5% Ag Prod 2,339 2% 2% $- Other Loans 45,648 43% 37% 2016Y 2017Y 2018Y 2019Y 2020Q2 Total Loans $1,169,705 Total CRE (Ex owner occupied) $418,141 393% 339% Source: S&P Global Market Intelligence 23 *PF = Assumes $20MM capital raise with $17MM of proceeds down-streamed to the Bank
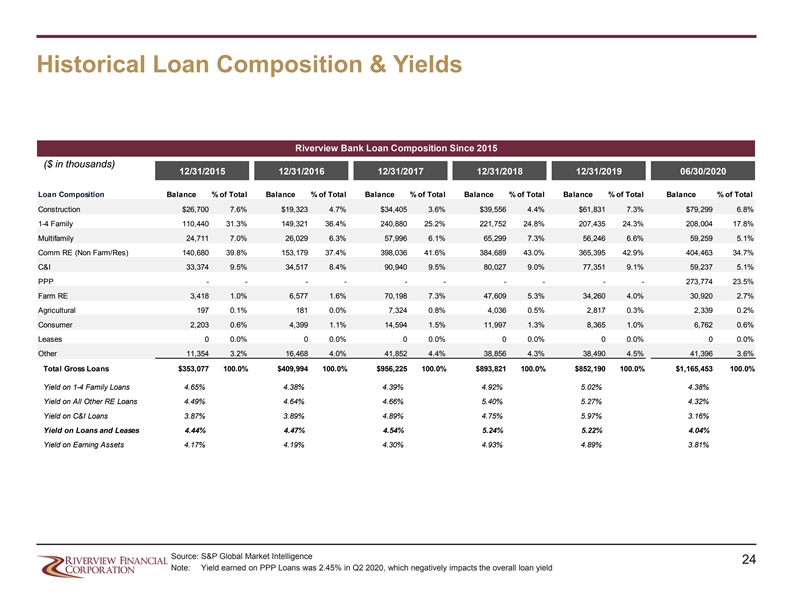
Historical Loan Composition & Yields Riverview Bank Loan Composition Since 2015 ($ in thousands) 12/31/2015 12/31/2016 12/31/2017 12/31/2018 12/31/2019 06/30/2020 Loan Composition Balance % of Total Balance % of Total Balance % of Total Balance % of Total Balance % of Total Balance % of Total Construction $26,700 7.6% $19,323 4.7% $34,405 3.6% $39,556 4.4% $61,831 7.3% $79,299 6.8% 1-4 Family 110,440 31.3% 149,321 36.4% 240,880 25.2% 221,752 24.8% 207,435 24.3% 208,004 17.8% Multifamily 24,711 7.0% 26,029 6.3% 57,996 6.1% 65,299 7.3% 56,246 6.6% 59,259 5.1% Comm RE (Non Farm/Res) 140,680 39.8% 153,179 37.4% 398,036 41.6% 384,689 43.0% 365,395 42.9% 404,463 34.7% C&I 33,374 9.5% 34,517 8.4% 90,940 9.5% 80,027 9.0% 77,351 9.1% 59,237 5.1% PPP - - - - - - - - - - 273,774 23.5% Farm RE 3,418 1.0% 6,577 1.6% 70,198 7.3% 47,609 5.3% 34,260 4.0% 30,920 2.7% Agricultural 197 0.1% 181 0.0% 7,324 0.8% 4,036 0.5% 2,817 0.3% 2,339 0.2% Consumer 2,203 0.6% 4,399 1.1% 14,594 1.5% 11,997 1.3% 8,365 1.0% 6,762 0.6% Leases 0 0.0% 0 0.0% 0 0.0% 0 0.0% 0 0.0% 0 0.0% Other 11,354 3.2% 16,468 4.0% 41,852 4.4% 38,856 4.3% 38,490 4.5% 41,396 3.6% Total Gross Loans $353,077 100.0% $409,994 100.0% $956,225 100.0% $893,821 100.0% $852,190 100.0% $1,165,453 100.0% Yield on 1-4 Family Loans 4.65% 4.38% 4.39% 4.92% 5.02% 4.38% Yield on All Other RE Loans 4.49% 4.64% 4.66% 5.40% 5.27% 4.32% Yield on C&I Loans 3.87% 3.89% 4.89% 4.75% 5.97% 3.16% Yield on Loans and Leases 4.44% 4.47% 4.54% 5.24% 5.22% 4.04% Yield on Earning Assets 4.17% 4.19% 4.30% 4.93% 4.89% 3.81% Source: S&P Global Market Intelligence 24 Note: Yield earned on PPP Loans was 2.45% in Q2 2020, which negatively impacts the overall loan yieldHistorical Loan Composition & Yields Riverview Bank Loan Composition Since 2015 ($ in thousands) 12/31/2015 12/31/2016 12/31/2017 12/31/2018 12/31/2019 06/30/2020 Loan Composition Balance % of Total Balance % of Total Balance % of Total Balance % of Total Balance % of Total Balance % of Total Construction $26,700 7.6% $19,323 4.7% $34,405 3.6% $39,556 4.4% $61,831 7.3% $79,299 6.8% 1-4 Family 110,440 31.3% 149,321 36.4% 240,880 25.2% 221,752 24.8% 207,435 24.3% 208,004 17.8% Multifamily 24,711 7.0% 26,029 6.3% 57,996 6.1% 65,299 7.3% 56,246 6.6% 59,259 5.1% Comm RE (Non Farm/Res) 140,680 39.8% 153,179 37.4% 398,036 41.6% 384,689 43.0% 365,395 42.9% 404,463 34.7% C&I 33,374 9.5% 34,517 8.4% 90,940 9.5% 80,027 9.0% 77,351 9.1% 59,237 5.1% PPP - - - - - - - - - - 273,774 23.5% Farm RE 3,418 1.0% 6,577 1.6% 70,198 7.3% 47,609 5.3% 34,260 4.0% 30,920 2.7% Agricultural 197 0.1% 181 0.0% 7,324 0.8% 4,036 0.5% 2,817 0.3% 2,339 0.2% Consumer 2,203 0.6% 4,399 1.1% 14,594 1.5% 11,997 1.3% 8,365 1.0% 6,762 0.6% Leases 0 0.0% 0 0.0% 0 0.0% 0 0.0% 0 0.0% 0 0.0% Other 11,354 3.2% 16,468 4.0% 41,852 4.4% 38,856 4.3% 38,490 4.5% 41,396 3.6% Total Gross Loans $353,077 100.0% $409,994 100.0% $956,225 100.0% $893,821 100.0% $852,190 100.0% $1,165,453 100.0% Yield on 1-4 Family Loans 4.65% 4.38% 4.39% 4.92% 5.02% 4.38% Yield on All Other RE Loans 4.49% 4.64% 4.66% 5.40% 5.27% 4.32% Yield on C&I Loans 3.87% 3.89% 4.89% 4.75% 5.97% 3.16% Yield on Loans and Leases 4.44% 4.47% 4.54% 5.24% 5.22% 4.04% Yield on Earning Assets 4.17% 4.19% 4.30% 4.93% 4.89% 3.81% Source: S&P Global Market Intelligence 24 Note: Yield earned on PPP Loans was 2.45% in Q2 2020, which negatively impacts the overall loan yield
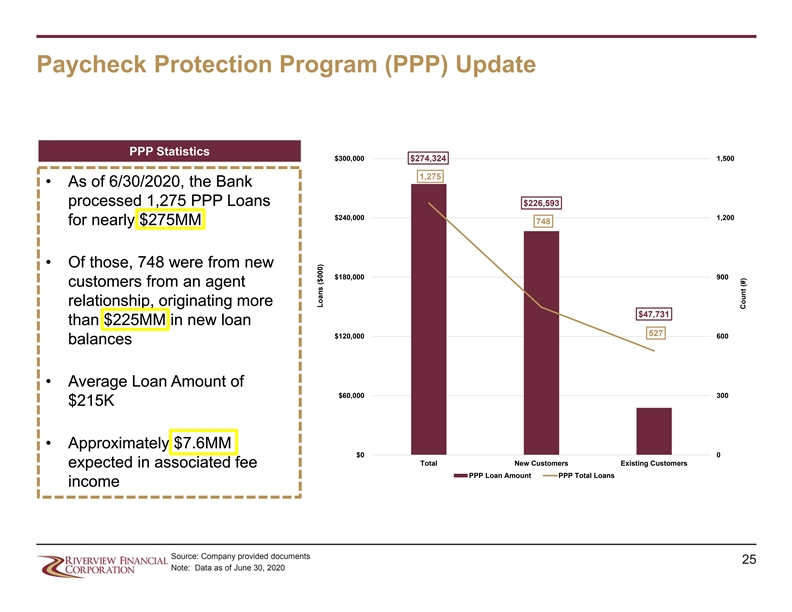
Paycheck Protection Program (PPP) Update PPP Statistics $300,000 $274,324 1,500 1,275 • As of 6/30/2020, the Bank processed 1,275 PPP Loans $226,593 $240,000 1,200 748 for nearly $275MM • Of those, 748 were from new $180,000 900 customers from an agent relationship, originating more $47,731 than $225MM in new loan 527 $120,000 600 balances • Average Loan Amount of $60,000 300 $215K • Approximately $7.6MM $0 0 Total New Customers Existing Customers expected in associated fee PPP Loan Amount PPP Total Loans income Source: Company provided documents 25 Note: Data as of June 30, 2020 Loans ($000) Count (#)Paycheck Protection Program (PPP) Update PPP Statistics $300,000 $274,324 1,500 1,275 • As of 6/30/2020, the Bank processed 1,275 PPP Loans $226,593 $240,000 1,200 748 for nearly $275MM • Of those, 748 were from new $180,000 900 customers from an agent relationship, originating more $47,731 than $225MM in new loan 527 $120,000 600 balances • Average Loan Amount of $60,000 300 $215K • Approximately $7.6MM $0 0 Total New Customers Existing Customers expected in associated fee PPP Loan Amount PPP Total Loans income Source: Company provided documents 25 Note: Data as of June 30, 2020 Loans ($000) Count (#)
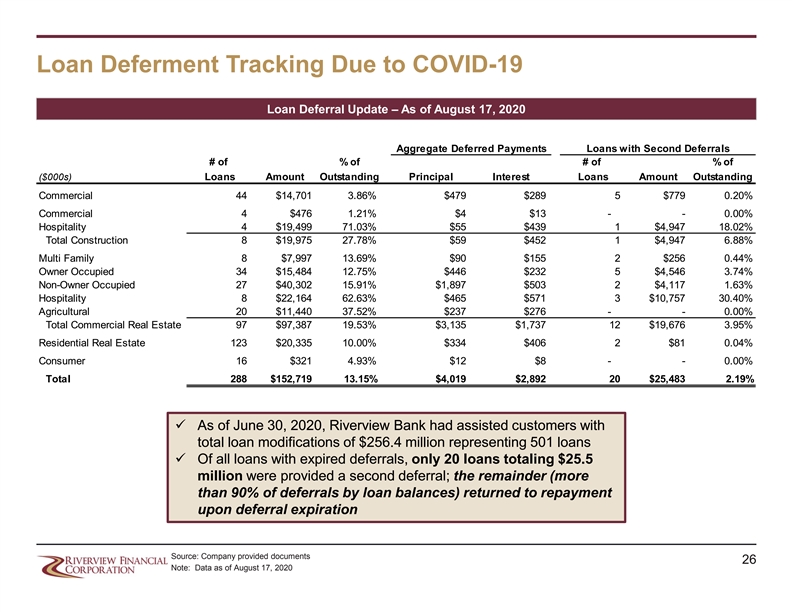
Loan Deferment Tracking Due to COVID-19 Loan Deferral Update – As of August 17, 2020 Aggregate Deferred Payments Loans with Second Deferrals # of % of # of % of ($000s) Loans Amount Outstanding Principal Interest Loans Amount Outstanding Commercial 44 $14,701 3.86% $479 $289 5 $779 0.20% Commercial 4 $476 1.21% $4 $13 - - 0.00% Hospitality 4 $19,499 71.03% $55 $439 1 $4,947 18.02% Total Construction 8 $19,975 27.78% $59 $452 1 $4,947 6.88% Multi Family 8 $7,997 13.69% $90 $155 2 $256 0.44% Owner Occupied 34 $15,484 12.75% $446 $232 5 $4,546 3.74% Non-Owner Occupied 27 $40,302 15.91% $1,897 $503 2 $4,117 1.63% Hospitality 8 $22,164 62.63% $465 $571 3 $10,757 30.40% Agricultural 20 $11,440 37.52% $237 $276 - - 0.00% Total Commercial Real Estate 97 $97,387 19.53% $3,135 $1,737 12 $19,676 3.95% Residential Real Estate 123 $20,335 10.00% $334 $406 2 $81 0.04% Consumer 16 $321 4.93% $12 $8 - - 0.00% Total 288 $152,719 13.15% $4,019 $2,892 20 $25,483 2.19% ü As of June 30, 2020, Riverview Bank had assisted customers with total loan modifications of $256.4 million representing 501 loans ü Of all loans with expired deferrals, only 20 loans totaling $25.5 million were provided a second deferral; the remainder (more than 90% of deferrals by loan balances) returned to repayment upon deferral expiration Source: Company provided documents 26 Note: Data as of August 17, 2020Loan Deferment Tracking Due to COVID-19 Loan Deferral Update – As of August 17, 2020 Aggregate Deferred Payments Loans with Second Deferrals # of % of # of % of ($000s) Loans Amount Outstanding Principal Interest Loans Amount Outstanding Commercial 44 $14,701 3.86% $479 $289 5 $779 0.20% Commercial 4 $476 1.21% $4 $13 - - 0.00% Hospitality 4 $19,499 71.03% $55 $439 1 $4,947 18.02% Total Construction 8 $19,975 27.78% $59 $452 1 $4,947 6.88% Multi Family 8 $7,997 13.69% $90 $155 2 $256 0.44% Owner Occupied 34 $15,484 12.75% $446 $232 5 $4,546 3.74% Non-Owner Occupied 27 $40,302 15.91% $1,897 $503 2 $4,117 1.63% Hospitality 8 $22,164 62.63% $465 $571 3 $10,757 30.40% Agricultural 20 $11,440 37.52% $237 $276 - - 0.00% Total Commercial Real Estate 97 $97,387 19.53% $3,135 $1,737 12 $19,676 3.95% Residential Real Estate 123 $20,335 10.00% $334 $406 2 $81 0.04% Consumer 16 $321 4.93% $12 $8 - - 0.00% Total 288 $152,719 13.15% $4,019 $2,892 20 $25,483 2.19% ü As of June 30, 2020, Riverview Bank had assisted customers with total loan modifications of $256.4 million representing 501 loans ü Of all loans with expired deferrals, only 20 loans totaling $25.5 million were provided a second deferral; the remainder (more than 90% of deferrals by loan balances) returned to repayment upon deferral expiration Source: Company provided documents 26 Note: Data as of August 17, 2020
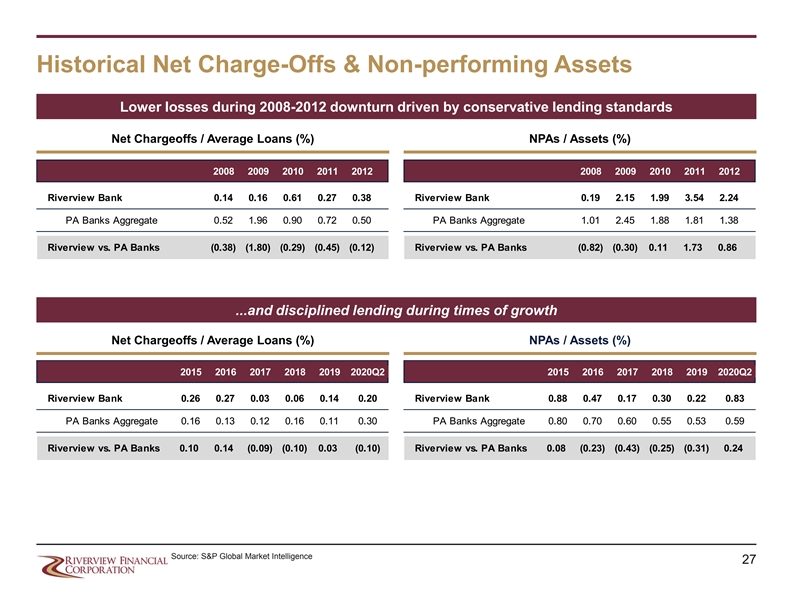
Historical Net Charge-Offs & Non-performing Assets Lower losses during 2008-2012 downturn driven by conservative lending standards Net Chargeoffs / Average Loans (%) NPAs / Assets (%) 2008 2009 2010 2011 2012 2008 2009 2010 2011 2012 Riverview Bank 0.14 0.16 0.61 0.27 0.38 Riverview Bank 0.19 2.15 1.99 3.54 2.24 PA Banks Aggregate 0.52 1.96 0.90 0.72 0.50 PA Banks Aggregate 1.01 2.45 1.88 1.81 1.38 Riverview vs. PA Banks (0.38) (1.80) (0.29) (0.45) (0.12) Riverview vs. PA Banks (0.82) (0.30) 0.11 1.73 0.86 ...and disciplined lending during times of growth Net Chargeoffs / Average Loans (%) NPAs / Assets (%) 2015 2016 2017 2018 2019 2020Q2 2015 2016 2017 2018 2019 2020Q2 Riverview Bank 0.26 0.27 0.03 0.06 0.14 0.20 Riverview Bank 0.88 0.47 0.17 0.30 0.22 0.83 PA Banks Aggregate 0.16 0.13 0.12 0.16 0.11 0.30 PA Banks Aggregate 0.80 0.70 0.60 0.55 0.53 0.59 Riverview vs. PA Banks 0.10 0.14 (0.09) (0.10) 0.03 (0.10) Riverview vs. PA Banks 0.08 (0.23) (0.43) (0.25) (0.31) 0.24 Source: S&P Global Market Intelligence 27Historical Net Charge-Offs & Non-performing Assets Lower losses during 2008-2012 downturn driven by conservative lending standards Net Chargeoffs / Average Loans (%) NPAs / Assets (%) 2008 2009 2010 2011 2012 2008 2009 2010 2011 2012 Riverview Bank 0.14 0.16 0.61 0.27 0.38 Riverview Bank 0.19 2.15 1.99 3.54 2.24 PA Banks Aggregate 0.52 1.96 0.90 0.72 0.50 PA Banks Aggregate 1.01 2.45 1.88 1.81 1.38 Riverview vs. PA Banks (0.38) (1.80) (0.29) (0.45) (0.12) Riverview vs. PA Banks (0.82) (0.30) 0.11 1.73 0.86 ...and disciplined lending during times of growth Net Chargeoffs / Average Loans (%) NPAs / Assets (%) 2015 2016 2017 2018 2019 2020Q2 2015 2016 2017 2018 2019 2020Q2 Riverview Bank 0.26 0.27 0.03 0.06 0.14 0.20 Riverview Bank 0.88 0.47 0.17 0.30 0.22 0.83 PA Banks Aggregate 0.16 0.13 0.12 0.16 0.11 0.30 PA Banks Aggregate 0.80 0.70 0.60 0.55 0.53 0.59 Riverview vs. PA Banks 0.10 0.14 (0.09) (0.10) 0.03 (0.10) Riverview vs. PA Banks 0.08 (0.23) (0.43) (0.25) (0.31) 0.24 Source: S&P Global Market Intelligence 27

Non-performing Assets Details Commentary Non-Accrual Loans by Type Multifamily, Owner Occ. CRE, • Since 2016 through June 30, 2020, Riverview Bank has never 2.1% 1.2% reported year-end NPAs excluding TDRs as a percentage of total assets greater than 0.50%, with a reported value of 0.27% as of June 30, 2020 Asset Quality Detail as of June 30, 2020: • Total non-accrual loans of $3.24mm 1-4 Family, Non-Owner Occ. CRE, 34.4% • Non-accrual loans to total assets of 0.24% 37.0% • Performing restructured loans (“TDRs”) of $9.59mm • Total Loans 90+ days past due of $183k • OREO to total assets of 0.03% Independent Loan Review Conducted June, 2020: C & I, 25.3% Farm, 0.0% • $604.1 million in loans reviewed or approximately 73.6% of Consumer, 0.0% the $821.1 million commercial loan portfolio Constr & Land Dev, 0.0% • More than 50% of loans selected in each loan category across C&I, C&D, CRE, Investment RE, Ag/Farm, and Other • Under scenario of highest level of stress followed by extended period of flat economic growth in which economy doesn’t recover during forecast horizon, $22.7mm of potential loss over 30-month timeframe Source: S&P Global Market Intelligence 28Non-performing Assets Details Commentary Non-Accrual Loans by Type Multifamily, Owner Occ. CRE, • Since 2016 through June 30, 2020, Riverview Bank has never 2.1% 1.2% reported year-end NPAs excluding TDRs as a percentage of total assets greater than 0.50%, with a reported value of 0.27% as of June 30, 2020 Asset Quality Detail as of June 30, 2020: • Total non-accrual loans of $3.24mm 1-4 Family, Non-Owner Occ. CRE, 34.4% • Non-accrual loans to total assets of 0.24% 37.0% • Performing restructured loans (“TDRs”) of $9.59mm • Total Loans 90+ days past due of $183k • OREO to total assets of 0.03% Independent Loan Review Conducted June, 2020: C & I, 25.3% Farm, 0.0% • $604.1 million in loans reviewed or approximately 73.6% of Consumer, 0.0% the $821.1 million commercial loan portfolio Constr & Land Dev, 0.0% • More than 50% of loans selected in each loan category across C&I, C&D, CRE, Investment RE, Ag/Farm, and Other • Under scenario of highest level of stress followed by extended period of flat economic growth in which economy doesn’t recover during forecast horizon, $22.7mm of potential loss over 30-month timeframe Source: S&P Global Market Intelligence 28
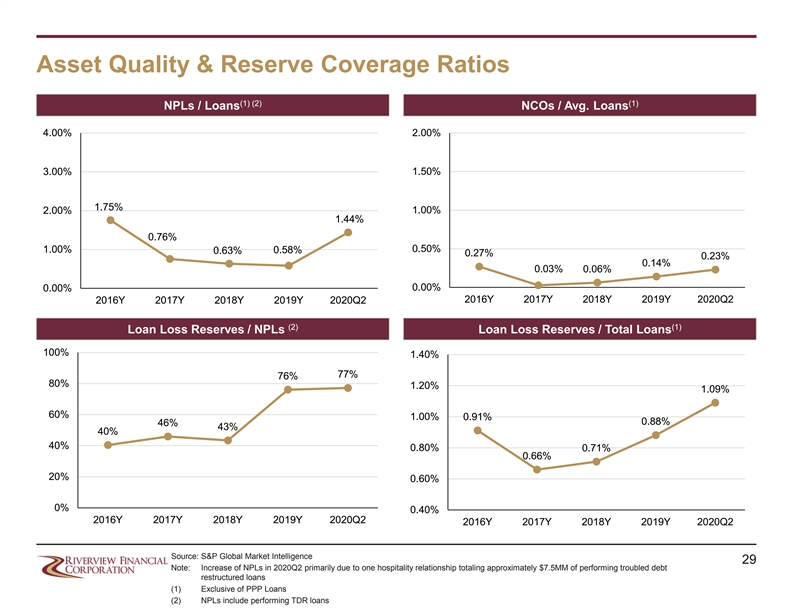
Asset Quality & Reserve Coverage Ratios (1) (2) (1) NPLs / Loans NCOs / Avg. Loans 4.00% 2.00% 3.00% 1.50% 1.75% 1.00% 2.00% 1.44% 0.76% 0.50% 1.00% 0.58% 0.63% 0.27% 0.23% 0.14% 0.03% 0.06% 0.00% 0.00% 2016Y 2017Y 2018Y 2019Y 2020Q2 2016Y 2017Y 2018Y 2019Y 2020Q2 (2) (1) Loan Loss Reserves / NPLs Loan Loss Reserves / Total Loans 100% 1.40% 77% 76% 80% 1.20% 1.09% 60% 1.00% 0.91% 0.88% 46% 43% 40% 40% 0.80% 0.71% 0.66% 20% 0.60% 0% 0.40% 2016Y 2017Y 2018Y 2019Y 2020Q2 2016Y 2017Y 2018Y 2019Y 2020Q2 Source: S&P Global Market Intelligence 29 Note: Increase of NPLs in 2020Q2 primarily due to one hospitality relationship totaling approximately $7.5MM of performing troubled debt restructured loans (1) Exclusive of PPP Loans (2) NPLs include performing TDR loansAsset Quality & Reserve Coverage Ratios (1) (2) (1) NPLs / Loans NCOs / Avg. Loans 4.00% 2.00% 3.00% 1.50% 1.75% 1.00% 2.00% 1.44% 0.76% 0.50% 1.00% 0.58% 0.63% 0.27% 0.23% 0.14% 0.03% 0.06% 0.00% 0.00% 2016Y 2017Y 2018Y 2019Y 2020Q2 2016Y 2017Y 2018Y 2019Y 2020Q2 (2) (1) Loan Loss Reserves / NPLs Loan Loss Reserves / Total Loans 100% 1.40% 77% 76% 80% 1.20% 1.09% 60% 1.00% 0.91% 0.88% 46% 43% 40% 40% 0.80% 0.71% 0.66% 20% 0.60% 0% 0.40% 2016Y 2017Y 2018Y 2019Y 2020Q2 2016Y 2017Y 2018Y 2019Y 2020Q2 Source: S&P Global Market Intelligence 29 Note: Increase of NPLs in 2020Q2 primarily due to one hospitality relationship totaling approximately $7.5MM of performing troubled debt restructured loans (1) Exclusive of PPP Loans (2) NPLs include performing TDR loans
IV. Liabilities Highlights 30IV. Liabilities Highlights 30
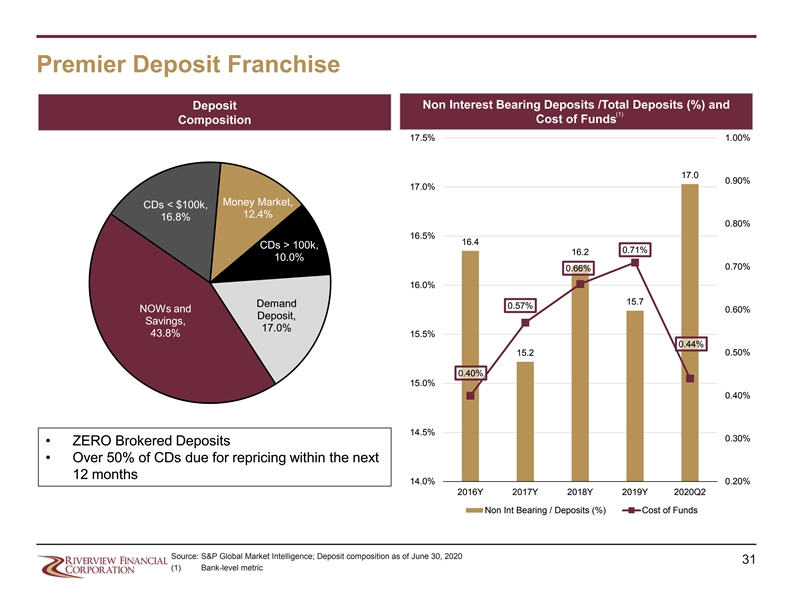
Premier Deposit Franchise Non Interest Bearing Deposits /Total Deposits (%) and Deposit (1) Cost of Funds Composition 17.5% 1.00% 17.0 0.90% 17.0% Money Market, CDs < $100k, 12.4% 16.8% 0.80% 16.5% 16.4 CDs > 100k, 0.71% 16.2 10.0% 0.70% 0.66% 16.0% 15.7 Demand 0.57% NOWs and 0.60% Deposit, Savings, 17.0% 43.8% 15.5% 0.44% 15.2 0.50% 0.40% 15.0% 0.40% 14.5% 0.30% • ZERO Brokered Deposits • Over 50% of CDs due for repricing within the next 12 months 14.0% 0.20% 2016Y 2017Y 2018Y 2019Y 2020Q2 Non Int Bearing / Deposits (%) Cost of Funds Source: S&P Global Market Intelligence; Deposit composition as of June 30, 2020 31 (1) Bank-level metricPremier Deposit Franchise Non Interest Bearing Deposits /Total Deposits (%) and Deposit (1) Cost of Funds Composition 17.5% 1.00% 17.0 0.90% 17.0% Money Market, CDs < $100k, 12.4% 16.8% 0.80% 16.5% 16.4 CDs > 100k, 0.71% 16.2 10.0% 0.70% 0.66% 16.0% 15.7 Demand 0.57% NOWs and 0.60% Deposit, Savings, 17.0% 43.8% 15.5% 0.44% 15.2 0.50% 0.40% 15.0% 0.40% 14.5% 0.30% • ZERO Brokered Deposits • Over 50% of CDs due for repricing within the next 12 months 14.0% 0.20% 2016Y 2017Y 2018Y 2019Y 2020Q2 Non Int Bearing / Deposits (%) Cost of Funds Source: S&P Global Market Intelligence; Deposit composition as of June 30, 2020 31 (1) Bank-level metric
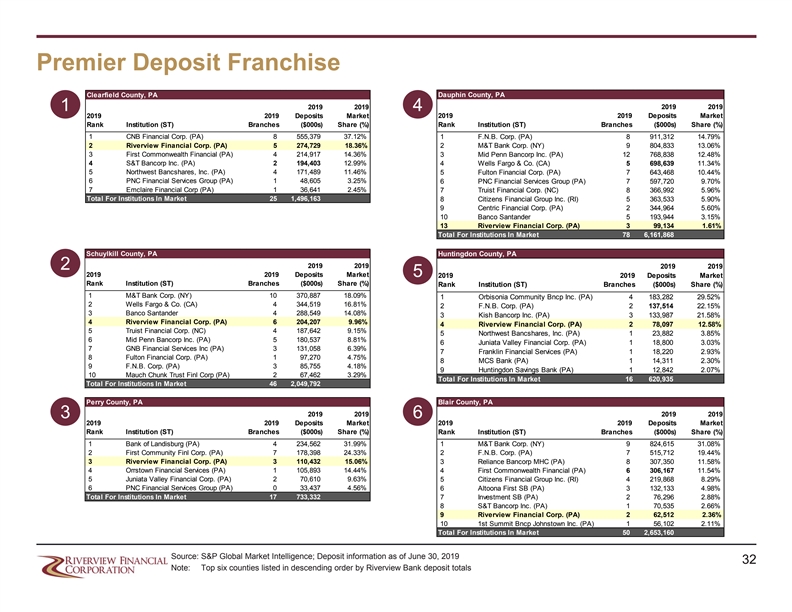
Premier Deposit Franchise Clearfield County, PA Dauphin County, PA 2019 2019 2019 2019 1 4 2019 2019 Deposits Market 2019 2019 Deposits Market Rank Institution (ST) Branches ($000s) Share (%) Rank Institution (ST) Branches ($000s) Share (%) 1 CNB Financial Corp. (PA) 8 555,379 37.12% 1 F.N.B. Corp. (PA) 8 911,312 14.79% 2 Riverview Financial Corp. (PA) 5 274,729 18.36% 2 M&T Bank Corp. (NY) 9 804,833 13.06% 3 First Commonwealth Financial (PA) 4 214,917 14.36% 3 Mid Penn Bancorp Inc. (PA) 12 768,838 12.48% 4 S&T Bancorp Inc. (PA) 2 194,403 12.99% 4 Wells Fargo & Co. (CA) 5 698,639 11.34% 5 Northwest Bancshares, Inc. (PA) 4 171,489 11.46% 5 Fulton Financial Corp. (PA) 7 643,468 10.44% 6 PNC Financial Services Group (PA) 1 48,605 3.25% 6 PNC Financial Services Group (PA) 7 597,720 9.70% 7 Emclaire Financial Corp (PA) 1 36,641 2.45% 7 Truist Financial Corp. (NC) 8 366,992 5.96% Total For Institutions In Market 25 1,496,163 8 Citizens Financial Group Inc. (RI) 5 363,533 5.90% 9 Centric Financial Corp. (PA) 2 344,964 5.60% 10 Banco Santander 5 193,944 3.15% 13 Riverview Financial Corp. (PA) 3 99,134 1.61% Total For Institutions In Market 78 6,161,868 Schuylkill County, PA Huntingdon County, PA 2019 2019 2019 2019 2 2019 2019 Deposits Market 5 2019 2019 Deposits Market Rank Institution (ST) Branches ($000s) Share (%) Rank Institution (ST) Branches ($000s) Share (%) 1 M&T Bank Corp. (NY) 10 370,887 18.09% 1 Orbisonia Community Bncp Inc. (PA) 4 183,282 29.52% 2 Wells Fargo & Co. (CA) 4 344,519 16.81% 2 F.N.B. Corp. (PA) 2 137,514 22.15% 3 Banco Santander 4 288,549 14.08% 3 Kish Bancorp Inc. (PA) 3 133,987 21.58% 4 Riverview Financial Corp. (PA) 6 204,207 9.96% 4 Riverview Financial Corp. (PA) 2 78,097 12.58% 5 Truist Financial Corp. (NC) 4 187,642 9.15% 5 Northwest Bancshares, Inc. (PA) 1 23,882 3.85% 6 Mid Penn Bancorp Inc. (PA) 5 180,537 8.81% 6 Juniata Valley Financial Corp. (PA) 1 18,800 3.03% 7 GNB Financial Services Inc (PA) 3 131,058 6.39% 7 Franklin Financial Services (PA) 1 18,220 2.93% 8 Fulton Financial Corp. (PA) 1 97,270 4.75% 8 MCS Bank (PA) 1 14,311 2.30% 9 F.N.B. Corp. (PA) 3 85,755 4.18% 9 Huntingdon Savings Bank (PA) 1 12,842 2.07% 10 Mauch Chunk Trust Finl Corp (PA) 2 67,462 3.29% Total For Institutions In Market 16 620,935 Total For Institutions In Market 46 2,049,792 Perry County, PA Blair County, PA 2019 2019 2019 2019 3 6 2019 2019 Deposits Market 2019 2019 Deposits Market Rank Institution (ST) Branches ($000s) Share (%) Rank Institution (ST) Branches ($000s) Share (%) 1 Bank of Landisburg (PA) 4 234,562 31.99% 1 M&T Bank Corp. (NY) 9 824,615 31.08% 2 First Community Finl Corp. (PA) 7 178,398 24.33% 2 F.N.B. Corp. (PA) 7 515,712 19.44% 3 Riverview Financial Corp. (PA) 3 110,432 15.06% 3 Reliance Bancorp MHC (PA) 8 307,350 11.58% 4 Orrstown Financial Services (PA) 1 105,893 14.44% 4 First Commonwealth Financial (PA) 6 306,167 11.54% 5 Juniata Valley Financial Corp. (PA) 2 70,610 9.63% 5 Citizens Financial Group Inc. (RI) 4 219,868 8.29% 6 PNC Financial Services Group (PA) 0 33,437 4.56% 6 Altoona First SB (PA) 3 132,133 4.98% Total For Institutions In Market 17 733,332 7 Investment SB (PA) 2 76,296 2.88% 8 S&T Bancorp Inc. (PA) 1 70,535 2.66% 9 Riverview Financial Corp. (PA) 2 62,512 2.36% 10 1st Summit Bncp Johnstown Inc. (PA) 1 56,102 2.11% Total For Institutions In Market 50 2,653,160 Source: S&P Global Market Intelligence; Deposit information as of June 30, 2019 32 Note: Top six counties listed in descending order by Riverview Bank deposit totalsPremier Deposit Franchise Clearfield County, PA Dauphin County, PA 2019 2019 2019 2019 1 4 2019 2019 Deposits Market 2019 2019 Deposits Market Rank Institution (ST) Branches ($000s) Share (%) Rank Institution (ST) Branches ($000s) Share (%) 1 CNB Financial Corp. (PA) 8 555,379 37.12% 1 F.N.B. Corp. (PA) 8 911,312 14.79% 2 Riverview Financial Corp. (PA) 5 274,729 18.36% 2 M&T Bank Corp. (NY) 9 804,833 13.06% 3 First Commonwealth Financial (PA) 4 214,917 14.36% 3 Mid Penn Bancorp Inc. (PA) 12 768,838 12.48% 4 S&T Bancorp Inc. (PA) 2 194,403 12.99% 4 Wells Fargo & Co. (CA) 5 698,639 11.34% 5 Northwest Bancshares, Inc. (PA) 4 171,489 11.46% 5 Fulton Financial Corp. (PA) 7 643,468 10.44% 6 PNC Financial Services Group (PA) 1 48,605 3.25% 6 PNC Financial Services Group (PA) 7 597,720 9.70% 7 Emclaire Financial Corp (PA) 1 36,641 2.45% 7 Truist Financial Corp. (NC) 8 366,992 5.96% Total For Institutions In Market 25 1,496,163 8 Citizens Financial Group Inc. (RI) 5 363,533 5.90% 9 Centric Financial Corp. (PA) 2 344,964 5.60% 10 Banco Santander 5 193,944 3.15% 13 Riverview Financial Corp. (PA) 3 99,134 1.61% Total For Institutions In Market 78 6,161,868 Schuylkill County, PA Huntingdon County, PA 2019 2019 2019 2019 2 2019 2019 Deposits Market 5 2019 2019 Deposits Market Rank Institution (ST) Branches ($000s) Share (%) Rank Institution (ST) Branches ($000s) Share (%) 1 M&T Bank Corp. (NY) 10 370,887 18.09% 1 Orbisonia Community Bncp Inc. (PA) 4 183,282 29.52% 2 Wells Fargo & Co. (CA) 4 344,519 16.81% 2 F.N.B. Corp. (PA) 2 137,514 22.15% 3 Banco Santander 4 288,549 14.08% 3 Kish Bancorp Inc. (PA) 3 133,987 21.58% 4 Riverview Financial Corp. (PA) 6 204,207 9.96% 4 Riverview Financial Corp. (PA) 2 78,097 12.58% 5 Truist Financial Corp. (NC) 4 187,642 9.15% 5 Northwest Bancshares, Inc. (PA) 1 23,882 3.85% 6 Mid Penn Bancorp Inc. (PA) 5 180,537 8.81% 6 Juniata Valley Financial Corp. (PA) 1 18,800 3.03% 7 GNB Financial Services Inc (PA) 3 131,058 6.39% 7 Franklin Financial Services (PA) 1 18,220 2.93% 8 Fulton Financial Corp. (PA) 1 97,270 4.75% 8 MCS Bank (PA) 1 14,311 2.30% 9 F.N.B. Corp. (PA) 3 85,755 4.18% 9 Huntingdon Savings Bank (PA) 1 12,842 2.07% 10 Mauch Chunk Trust Finl Corp (PA) 2 67,462 3.29% Total For Institutions In Market 16 620,935 Total For Institutions In Market 46 2,049,792 Perry County, PA Blair County, PA 2019 2019 2019 2019 3 6 2019 2019 Deposits Market 2019 2019 Deposits Market Rank Institution (ST) Branches ($000s) Share (%) Rank Institution (ST) Branches ($000s) Share (%) 1 Bank of Landisburg (PA) 4 234,562 31.99% 1 M&T Bank Corp. (NY) 9 824,615 31.08% 2 First Community Finl Corp. (PA) 7 178,398 24.33% 2 F.N.B. Corp. (PA) 7 515,712 19.44% 3 Riverview Financial Corp. (PA) 3 110,432 15.06% 3 Reliance Bancorp MHC (PA) 8 307,350 11.58% 4 Orrstown Financial Services (PA) 1 105,893 14.44% 4 First Commonwealth Financial (PA) 6 306,167 11.54% 5 Juniata Valley Financial Corp. (PA) 2 70,610 9.63% 5 Citizens Financial Group Inc. (RI) 4 219,868 8.29% 6 PNC Financial Services Group (PA) 0 33,437 4.56% 6 Altoona First SB (PA) 3 132,133 4.98% Total For Institutions In Market 17 733,332 7 Investment SB (PA) 2 76,296 2.88% 8 S&T Bancorp Inc. (PA) 1 70,535 2.66% 9 Riverview Financial Corp. (PA) 2 62,512 2.36% 10 1st Summit Bncp Johnstown Inc. (PA) 1 56,102 2.11% Total For Institutions In Market 50 2,653,160 Source: S&P Global Market Intelligence; Deposit information as of June 30, 2019 32 Note: Top six counties listed in descending order by Riverview Bank deposit totals
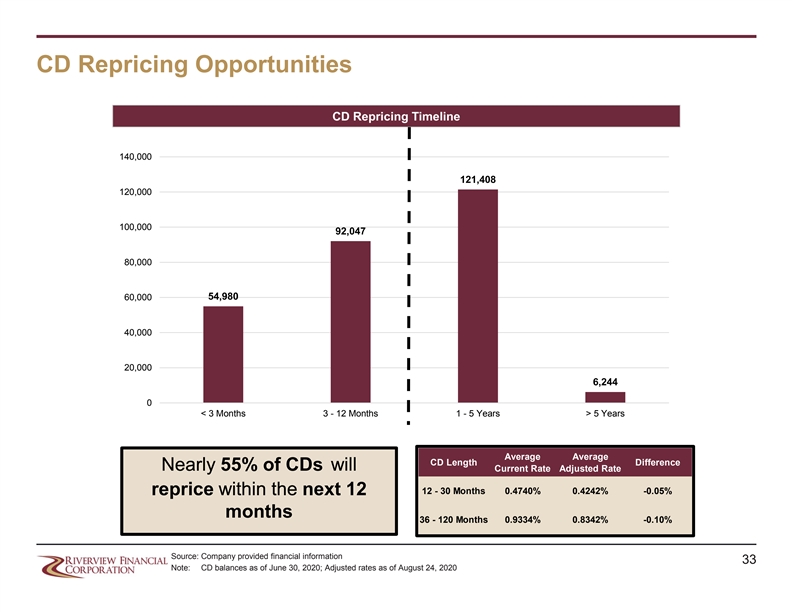
CD Repricing Opportunities CD Repricing Timeline 140,000 121,408 120,000 100,000 92,047 80,000 60,000 54,980 40,000 20,000 6,244 0 < 3 Months 3 - 12 Months 1 - 5 Years > 5 Years Average Average CD Length Difference Nearly 55% of CDs will Current Rate Adjusted Rate 12 - 30 Months 0.4740% 0.4242% -0.05% reprice within the next 12 months 36 - 120 Months 0.9334% 0.8342% -0.10% Source: Company provided financial information 33 Note: CD balances as of June 30, 2020; Adjusted rates as of August 24, 2020 CD Repricing Opportunities CD Repricing Timeline 140,000 121,408 120,000 100,000 92,047 80,000 60,000 54,980 40,000 20,000 6,244 0 < 3 Months 3 - 12 Months 1 - 5 Years > 5 Years Average Average CD Length Difference Nearly 55% of CDs will Current Rate Adjusted Rate 12 - 30 Months 0.4740% 0.4242% -0.05% reprice within the next 12 months 36 - 120 Months 0.9334% 0.8342% -0.10% Source: Company provided financial information 33 Note: CD balances as of June 30, 2020; Adjusted rates as of August 24, 2020

V. Capital Highlights 34V. Capital Highlights 34
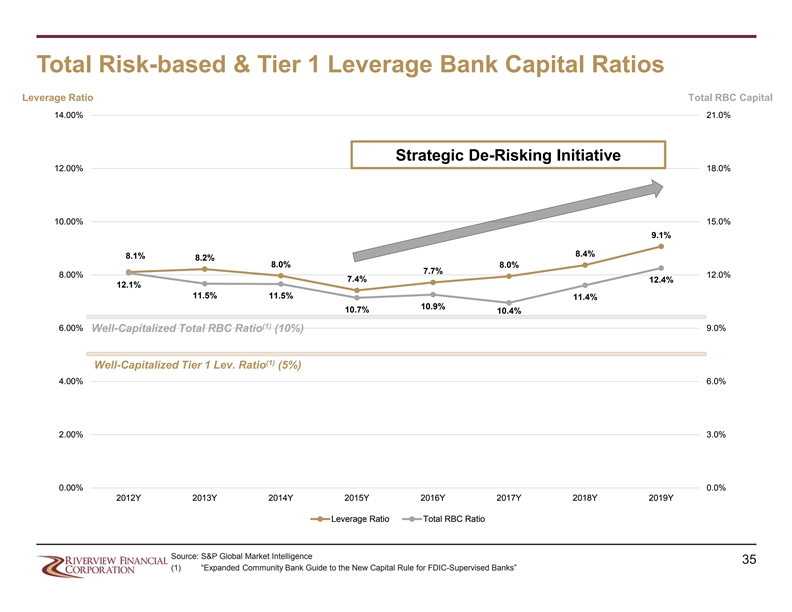
Total Risk-based & Tier 1 Leverage Bank Capital Ratios Leverage Ratio Total RBC Capital 14.00% 22.0% 14.00% 21.0% 20.0% Strategic De-Risking Initiative 12.00% 12.00% 18.0% 11.2% 18.0% 10.7% 10.6% 10.6% 10.4% 10.2% 10.0% 9.6% 9.7% 16.0% 9.6% 10.00% 10.00% 9.3% 15.0% 9.2% 9.2% 9.0% 9.0% 8.9% 8.8% 9.1% 15.2% 15.3% 15.0% 8.4% 8.5% 8.5% 14.0% 14.5% 14.5% 14.2% 8.4% 8.1% 8.2% 13.9% 13.7% 8.0% 8.0% 8.00% 7.7% 13.1% 13.0% 13.0% 8.00% 12.8% 12.0% 12.0% 7.4% 12.4% 12.3% 12.1% 12.1% 11.9% 12.0% 11.5% 11.5% 11.5% 11.4% 11.2% 11.2% 10.9% 10.9% 10.0% 10.7% 10.4% 6.00% (1) 6.00% 9.0% Well-Capitalized Total RBC Ratio (10%) 8.0% (1) Well-Capitalized Tier 1 Lev. Ratio (5%) 4.00% 6.0% 4.00% 6.0% 4.0% 2.00% 2.00% 3.0% 2.0% 0.00% 0.0% 2000Y 2001Y 2002Y 2003Y 2004Y 2005Y 2006Y 2007Y 2008Y 2009Y 2010Y 2011Y 2012Y 2013Y 2014Y 2015Y 2016Y 2017Y 2018Y 2019Y 0.00% 0.0% 2012Y 2013Y 2014Y 2015Y 2016Y 2017Y 2018Y 2019Y Leverage Ratio Total RBC Ratio Leverage Ratio Total RBC Ratio Source: S&P Global Market Intelligence 35 (1) “Expanded Community Bank Guide to the New Capital Rule for FDIC-Supervised Banks”Total Risk-based & Tier 1 Leverage Bank Capital Ratios Leverage Ratio Total RBC Capital 14.00% 22.0% 14.00% 21.0% 20.0% Strategic De-Risking Initiative 12.00% 12.00% 18.0% 11.2% 18.0% 10.7% 10.6% 10.6% 10.4% 10.2% 10.0% 9.6% 9.7% 16.0% 9.6% 10.00% 10.00% 9.3% 15.0% 9.2% 9.2% 9.0% 9.0% 8.9% 8.8% 9.1% 15.2% 15.3% 15.0% 8.4% 8.5% 8.5% 14.0% 14.5% 14.5% 14.2% 8.4% 8.1% 8.2% 13.9% 13.7% 8.0% 8.0% 8.00% 7.7% 13.1% 13.0% 13.0% 8.00% 12.8% 12.0% 12.0% 7.4% 12.4% 12.3% 12.1% 12.1% 11.9% 12.0% 11.5% 11.5% 11.5% 11.4% 11.2% 11.2% 10.9% 10.9% 10.0% 10.7% 10.4% 6.00% (1) 6.00% 9.0% Well-Capitalized Total RBC Ratio (10%) 8.0% (1) Well-Capitalized Tier 1 Lev. Ratio (5%) 4.00% 6.0% 4.00% 6.0% 4.0% 2.00% 2.00% 3.0% 2.0% 0.00% 0.0% 2000Y 2001Y 2002Y 2003Y 2004Y 2005Y 2006Y 2007Y 2008Y 2009Y 2010Y 2011Y 2012Y 2013Y 2014Y 2015Y 2016Y 2017Y 2018Y 2019Y 0.00% 0.0% 2012Y 2013Y 2014Y 2015Y 2016Y 2017Y 2018Y 2019Y Leverage Ratio Total RBC Ratio Leverage Ratio Total RBC Ratio Source: S&P Global Market Intelligence 35 (1) “Expanded Community Bank Guide to the New Capital Rule for FDIC-Supervised Banks”
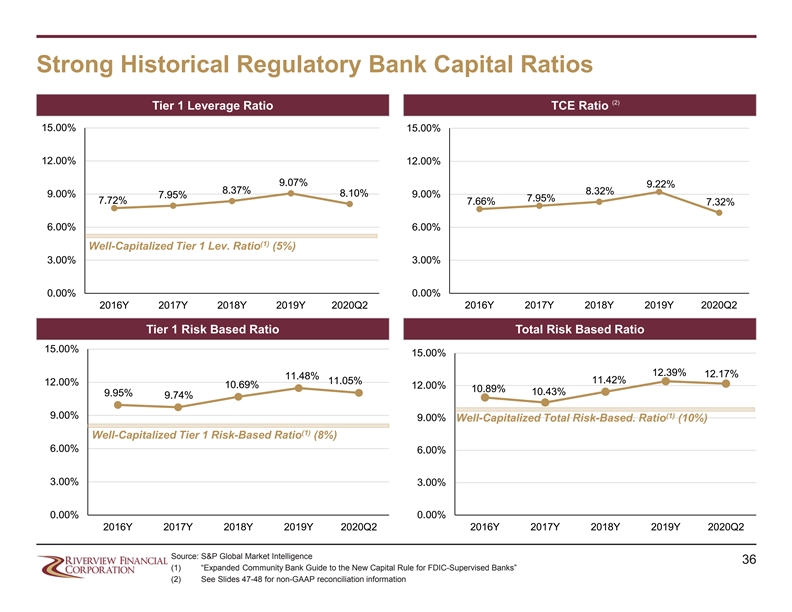
Strong Historical Regulatory Bank Capital Ratios (2) Tier 1 Leverage Ratio TCE Ratio 15.00% 15.00% 12.00% 12.00% 9.07% 9.22% 8.37% 8.32% 9.00% 8.10% 7.95% 9.00% 7.95% 7.72% 7.66% 7.32% 6.00% 6.00% (1) Well-Capitalized Tier 1 Lev. Ratio (5%) 3.00% 3.00% 0.00% 0.00% 2016Y 2017Y 2018Y 2019Y 2020Q2 2016Y 2017Y 2018Y 2019Y 2020Q2 Tier 1 Risk Based Ratio Total Risk Based Ratio 15.00% 15.00% 12.39% 12.17% 11.48% 11.42% 11.05% 12.00% 10.69% 12.00% 10.89% 10.43% 9.95% 9.74% (1) 9.00% 9.00% Well-Capitalized Total Risk-Based. Ratio (10%) (1) Well-Capitalized Tier 1 Risk-Based Ratio (8%) 6.00% 6.00% 3.00% 3.00% 0.00% 0.00% 2016Y 2017Y 2018Y 2019Y 2020Q2 2016Y 2017Y 2018Y 2019Y 2020Q2 Source: S&P Global Market Intelligence 36 (1) “Expanded Community Bank Guide to the New Capital Rule for FDIC-Supervised Banks” (2) See Slides 47-48 for non-GAAP reconciliation informationStrong Historical Regulatory Bank Capital Ratios (2) Tier 1 Leverage Ratio TCE Ratio 15.00% 15.00% 12.00% 12.00% 9.07% 9.22% 8.37% 8.32% 9.00% 8.10% 7.95% 9.00% 7.95% 7.72% 7.66% 7.32% 6.00% 6.00% (1) Well-Capitalized Tier 1 Lev. Ratio (5%) 3.00% 3.00% 0.00% 0.00% 2016Y 2017Y 2018Y 2019Y 2020Q2 2016Y 2017Y 2018Y 2019Y 2020Q2 Tier 1 Risk Based Ratio Total Risk Based Ratio 15.00% 15.00% 12.39% 12.17% 11.48% 11.42% 11.05% 12.00% 10.69% 12.00% 10.89% 10.43% 9.95% 9.74% (1) 9.00% 9.00% Well-Capitalized Total Risk-Based. Ratio (10%) (1) Well-Capitalized Tier 1 Risk-Based Ratio (8%) 6.00% 6.00% 3.00% 3.00% 0.00% 0.00% 2016Y 2017Y 2018Y 2019Y 2020Q2 2016Y 2017Y 2018Y 2019Y 2020Q2 Source: S&P Global Market Intelligence 36 (1) “Expanded Community Bank Guide to the New Capital Rule for FDIC-Supervised Banks” (2) See Slides 47-48 for non-GAAP reconciliation information
VI. Income Statement Highlights 37VI. Income Statement Highlights 37
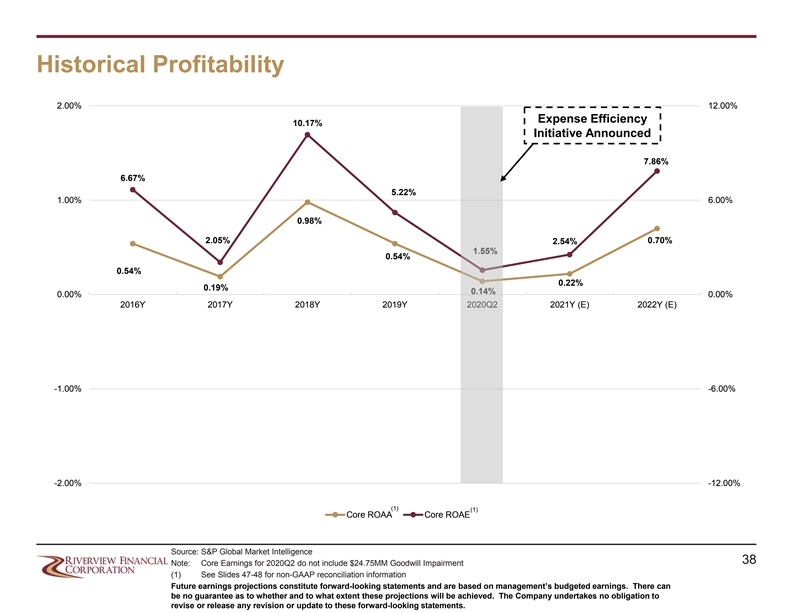
Historical Profitability 2.00% 12.00% Expense Efficiency 10.17% Initiative Announced 7.86% 6.67% 5.22% 1.00% 6.00% 0.98% 2.05% 0.70% 2.54% 1.55% 0.54% 0.54% 0.22% 0.19% 0.14% 0.00% 0.00% 2016Y 2017Y 2018Y 2019Y 2020Q2 2021Y (E) 2022Y (E) -1.00% -6.00% -2.00% -12.00% (1) (1) Core ROAA Core ROAE Source: S&P Global Market Intelligence 38 Note: Core Earnings for 2020Q2 do not include $24.75MM Goodwill Impairment (1) See Slides 47-48 for non-GAAP reconciliation information Future earnings projections constitute forward-looking statements and are based on management’s budgeted earnings. There can be no guarantee as to whether and to what extent these projections will be achieved. The Company undertakes no obligation to revise or release any revision or update to these forward-looking statements. Historical Profitability 2.00% 12.00% Expense Efficiency 10.17% Initiative Announced 7.86% 6.67% 5.22% 1.00% 6.00% 0.98% 2.05% 0.70% 2.54% 1.55% 0.54% 0.54% 0.22% 0.19% 0.14% 0.00% 0.00% 2016Y 2017Y 2018Y 2019Y 2020Q2 2021Y (E) 2022Y (E) -1.00% -6.00% -2.00% -12.00% (1) (1) Core ROAA Core ROAE Source: S&P Global Market Intelligence 38 Note: Core Earnings for 2020Q2 do not include $24.75MM Goodwill Impairment (1) See Slides 47-48 for non-GAAP reconciliation information Future earnings projections constitute forward-looking statements and are based on management’s budgeted earnings. There can be no guarantee as to whether and to what extent these projections will be achieved. The Company undertakes no obligation to revise or release any revision or update to these forward-looking statements.

Core Net Revenue Detail ($ in thousands) Net Interest Income Noninterest Expense Noninterest Income $45,000 $43,889 $40,947 $39,156 $40,000 $38,372 $35,000 $30,000 $25,473 $24,886 $25,000 $20,000 $18,412 $18,442 $18,164 $17,105 $15,000 $10,000 $8,840 $8,536 $5,000 $4,322 $4,116 $3,163 $- 2016Y 2017Y 2018Y 2019Y 2020 YTD Source: S&P Global Market Intelligence 39 Note: “2020 YTD” data as of June 30, 2020; 2020 YTD Noninterest Expense normalized exclusive of Goodwill ImpairmentCore Net Revenue Detail ($ in thousands) Net Interest Income Noninterest Expense Noninterest Income $45,000 $43,889 $40,947 $39,156 $40,000 $38,372 $35,000 $30,000 $25,473 $24,886 $25,000 $20,000 $18,412 $18,442 $18,164 $17,105 $15,000 $10,000 $8,840 $8,536 $5,000 $4,322 $4,116 $3,163 $- 2016Y 2017Y 2018Y 2019Y 2020 YTD Source: S&P Global Market Intelligence 39 Note: “2020 YTD” data as of June 30, 2020; 2020 YTD Noninterest Expense normalized exclusive of Goodwill Impairment

Net Interest Income & Net Interest Margin Net Interest Income (NII) and Net Interest Margin (NIM) Key Components of NII and NIM Loan Yield Securities Yield (FTE) Net Interest Income NIM Cost of Funds Cost of Int-bearing Deposits $50,000 6.50% 7.00% $45,000 $43,889 6.00% $40,947 6.00% $40,000 5.50% 5.24% 5.22% $35,000 5.00% 5.00% 4.54% 4.47% (2) 4.04% $30,000 4.50% 4.00% 4.19% $25,473 4.07% 3.35% $25,000 4.00% 3.17% 3.83% 3.76% 2.99% 2.89% 2.83% 3.00% $20,000 3.50% $18,164 (1) 3.28% $15,000 3.00% 2.00% $9,671 $10,000 2.50% 0.99% 0.83% 1.00% 0.70% 0.67% $5,000 2.00% 0.47% 0.71% 0.66% 0.57% 0.44% 0.40% $- 1.50% 0.00% 2016Y 2017Y 2018Y 2019Y 2020 Q2 2016Y 2017Y 2018Y 2019Y 2020Q2 Source: S&P Global Market Intelligence 40 Note: “2020 YTD” data as of June 30, 2020 (1) Excluding the impact of PPP Loans, NIM for Q2 2020 was 3.49% (2) Yield earned on PPP Loans was 2.45% in Q2 2020, which negatively impacts the overall loan yieldNet Interest Income & Net Interest Margin Net Interest Income (NII) and Net Interest Margin (NIM) Key Components of NII and NIM Loan Yield Securities Yield (FTE) Net Interest Income NIM Cost of Funds Cost of Int-bearing Deposits $50,000 6.50% 7.00% $45,000 $43,889 6.00% $40,947 6.00% $40,000 5.50% 5.24% 5.22% $35,000 5.00% 5.00% 4.54% 4.47% (2) 4.04% $30,000 4.50% 4.00% 4.19% $25,473 4.07% 3.35% $25,000 4.00% 3.17% 3.83% 3.76% 2.99% 2.89% 2.83% 3.00% $20,000 3.50% $18,164 (1) 3.28% $15,000 3.00% 2.00% $9,671 $10,000 2.50% 0.99% 0.83% 1.00% 0.70% 0.67% $5,000 2.00% 0.47% 0.71% 0.66% 0.57% 0.44% 0.40% $- 1.50% 0.00% 2016Y 2017Y 2018Y 2019Y 2020 Q2 2016Y 2017Y 2018Y 2019Y 2020Q2 Source: S&P Global Market Intelligence 40 Note: “2020 YTD” data as of June 30, 2020 (1) Excluding the impact of PPP Loans, NIM for Q2 2020 was 3.49% (2) Yield earned on PPP Loans was 2.45% in Q2 2020, which negatively impacts the overall loan yield
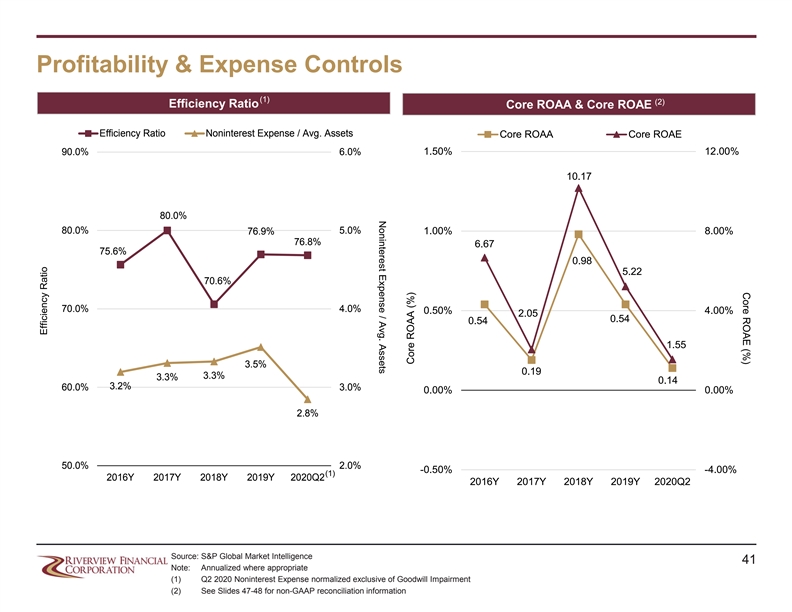
Core ROAE (%) Noninterest Expense / Avg. Assets Profitability & Expense Controls (1) (2) Efficiency Ratio Core ROAA & Core ROAE Efficiency Ratio Noninterest Expense / Avg. Assets Core ROAA Core ROAE 90.0% 6.0% 1.50% 12.00% 10.17 80.0% 80.0% 5.0% 1.00% 8.00% 76.9% 76.8% 6.67 75.6% 0.98 5.22 70.6% 70.0% 4.0% 0.50% 4.00% 2.05 0.54 0.54 1.55 3.5% 0.19 3.3% 3.3% 0.14 3.2% 60.0% 3.0% 0.00% 0.00% 2.8% 50.0% 2.0% -0.50% -4.00% (1) 2016Y 2017Y 2018Y 2019Y 2020Q2 2016Y 2017Y 2018Y 2019Y 2020Q2 Source: S&P Global Market Intelligence 41 Note: Annualized where appropriate (1) Q2 2020 Noninterest Expense normalized exclusive of Goodwill Impairment (2) See Slides 47-48 for non-GAAP reconciliation information Efficiency Ratio Core ROAA (%)Core ROAE (%) Noninterest Expense / Avg. Assets Profitability & Expense Controls (1) (2) Efficiency Ratio Core ROAA & Core ROAE Efficiency Ratio Noninterest Expense / Avg. Assets Core ROAA Core ROAE 90.0% 6.0% 1.50% 12.00% 10.17 80.0% 80.0% 5.0% 1.00% 8.00% 76.9% 76.8% 6.67 75.6% 0.98 5.22 70.6% 70.0% 4.0% 0.50% 4.00% 2.05 0.54 0.54 1.55 3.5% 0.19 3.3% 3.3% 0.14 3.2% 60.0% 3.0% 0.00% 0.00% 2.8% 50.0% 2.0% -0.50% -4.00% (1) 2016Y 2017Y 2018Y 2019Y 2020Q2 2016Y 2017Y 2018Y 2019Y 2020Q2 Source: S&P Global Market Intelligence 41 Note: Annualized where appropriate (1) Q2 2020 Noninterest Expense normalized exclusive of Goodwill Impairment (2) See Slides 47-48 for non-GAAP reconciliation information Efficiency Ratio Core ROAA (%)
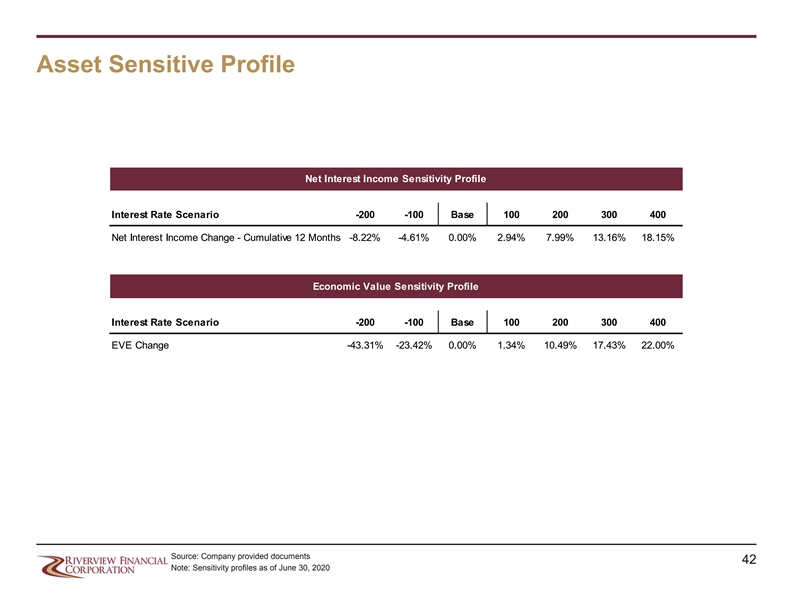
Asset Sensitive Profile Net Interest Income Sensitivity Profile Interest Rate Scenario -200 -100 Base 100 200 300 400 Net Interest Income Change - Cumulative 12 Months -8.22% -4.61% 0.00% 2.94% 7.99% 13.16% 18.15% Economic Value Sensitivity Profile Interest Rate Scenario -200 -100 Base 100 200 300 400 EVE Change -43.31% -23.42% 0.00% 1.34% 10.49% 17.43% 22.00% Source: Company provided documents 42 Note: Sensitivity profiles as of June 30, 2020Asset Sensitive Profile Net Interest Income Sensitivity Profile Interest Rate Scenario -200 -100 Base 100 200 300 400 Net Interest Income Change - Cumulative 12 Months -8.22% -4.61% 0.00% 2.94% 7.99% 13.16% 18.15% Economic Value Sensitivity Profile Interest Rate Scenario -200 -100 Base 100 200 300 400 EVE Change -43.31% -23.42% 0.00% 1.34% 10.49% 17.43% 22.00% Source: Company provided documents 42 Note: Sensitivity profiles as of June 30, 2020

VII. Appendix 43VII. Appendix 43

Financial Highlights 12/31/2016 At or for the Years Ended: At or for the Quarters Ended: 6/30/2020 12/31/2016 12/31/2017 12/31/2018 12/31/2019 9/30/2019 12/31/2019 3/31/2020 6/30/2020 CAGR Balance Sheet Total Assets ($000) 543,048 1,163,607 1,137,603 1,079,954 1,109,759 1,079,954 1,117,043 1,346,800 29.6% Total Net Loans ($000) 406,263 949,919 887,473 844,674 876,745 844,674 879,470 1,159,969 35.0% Total Deposits ($000) 452,560 1,026,480 1,004,593 940,480 969,583 940,480 958,503 1,023,153 26.2% Tangible Equity ($000) 35,107 77,126 85,647 90,620 89,574 90,620 91,121 92,055 31.7% Loans / Deposits (%) 90.5 93.1 88.9 90.6 91.1 90.6 92.6 113.9 (Cash + Securities)/ Assets (%) 17.3 10.3 14.0 13.2 12.4 13.2 12.8 8.8 (1) TCE / TA (%) 6.5 6.8 7.7 8.6 8.3 8.6 8.4 6.8 Total Risk-Based Capital Ratio (%) 10.9 10.4 11.4 12.4 11.8 12.4 12.1 12.2 Profitability Net Income ($000) 3,067 (4,911) 10,858 4,286 2,266 1,273 633 (24,122) (1) Core ROAA (%) 0.54 0.19 0.98 0.54 0.82 0.44 0.00 0.14 (1) Core ROAE (%) 6.67 2.05 10.17 5.22 7.76 4.09 (0.04) 1.55 (1) Core ROATE (%) 7.89 2.48 13.71 6.86 10.16 5.33 (0.05) 2.00 Net Interest Margin (%) 3.83 3.76 4.19 4.07 4.33 3.77 3.59 3.28 Efficiency Ratio (%) 75.6 80.0 70.6 76.9 69.2 78.0 82.6 76.8 Noninterest Inc/ Operating Rev (%) 14.8 14.5 16.8 17.3 15.2 21.6 19.4 17.1 3.2 3.3 3.3 3.5 3.4 3.5 3.4 10.5 Noninterest Exp./ AA (%) Asset Quality (%) NPLs / Loans (%) 1.8 0.8 0.6 0.6 0.6 0.6 0.5 1.1 NPAs / Assets (%) 1.4 0.6 0.6 0.5 0.5 0.5 0.5 1.0 Texas Ratio (%) 21.0 9.8 7.8 5.2 6.0 5.2 5.8 13.1 Reserves / Loans (%) 0.91 0.66 0.71 0.88 0.80 0.88 0.93 0.84 NCOs / Avg Loans (%) 0.27 0.03 0.06 0.14 0.43 (0.12) 0.49 0.20 Source: S&P Global Market Intelligence; Holding company financials 44 (1) See Slides 47-48 for non-GAAP reconciliation information Financial Highlights 12/31/2016 At or for the Years Ended: At or for the Quarters Ended: 6/30/2020 12/31/2016 12/31/2017 12/31/2018 12/31/2019 9/30/2019 12/31/2019 3/31/2020 6/30/2020 CAGR Balance Sheet Total Assets ($000) 543,048 1,163,607 1,137,603 1,079,954 1,109,759 1,079,954 1,117,043 1,346,800 29.6% Total Net Loans ($000) 406,263 949,919 887,473 844,674 876,745 844,674 879,470 1,159,969 35.0% Total Deposits ($000) 452,560 1,026,480 1,004,593 940,480 969,583 940,480 958,503 1,023,153 26.2% Tangible Equity ($000) 35,107 77,126 85,647 90,620 89,574 90,620 91,121 92,055 31.7% Loans / Deposits (%) 90.5 93.1 88.9 90.6 91.1 90.6 92.6 113.9 (Cash + Securities)/ Assets (%) 17.3 10.3 14.0 13.2 12.4 13.2 12.8 8.8 (1) TCE / TA (%) 6.5 6.8 7.7 8.6 8.3 8.6 8.4 6.8 Total Risk-Based Capital Ratio (%) 10.9 10.4 11.4 12.4 11.8 12.4 12.1 12.2 Profitability Net Income ($000) 3,067 (4,911) 10,858 4,286 2,266 1,273 633 (24,122) (1) Core ROAA (%) 0.54 0.19 0.98 0.54 0.82 0.44 0.00 0.14 (1) Core ROAE (%) 6.67 2.05 10.17 5.22 7.76 4.09 (0.04) 1.55 (1) Core ROATE (%) 7.89 2.48 13.71 6.86 10.16 5.33 (0.05) 2.00 Net Interest Margin (%) 3.83 3.76 4.19 4.07 4.33 3.77 3.59 3.28 Efficiency Ratio (%) 75.6 80.0 70.6 76.9 69.2 78.0 82.6 76.8 Noninterest Inc/ Operating Rev (%) 14.8 14.5 16.8 17.3 15.2 21.6 19.4 17.1 3.2 3.3 3.3 3.5 3.4 3.5 3.4 10.5 Noninterest Exp./ AA (%) Asset Quality (%) NPLs / Loans (%) 1.8 0.8 0.6 0.6 0.6 0.6 0.5 1.1 NPAs / Assets (%) 1.4 0.6 0.6 0.5 0.5 0.5 0.5 1.0 Texas Ratio (%) 21.0 9.8 7.8 5.2 6.0 5.2 5.8 13.1 Reserves / Loans (%) 0.91 0.66 0.71 0.88 0.80 0.88 0.93 0.84 NCOs / Avg Loans (%) 0.27 0.03 0.06 0.14 0.43 (0.12) 0.49 0.20 Source: S&P Global Market Intelligence; Holding company financials 44 (1) See Slides 47-48 for non-GAAP reconciliation information

Historical Balance Sheet At December 31, June 30, (dollars show n in thousands) 2016 2017 2018 2019 2020 Assets Cash & Bal. Due from Dep. Inst. $ 19,120 $ 25,786 $ 53,816 $ 50,348 $ 43,228 Fed Funds Sold & Reverse Repos $ - $ - $ - $ - $ - Securities $ 73,113 $ 93,201 $ 104,677 $ 91,247 $ 74,134 Cash and Cash Equivalents 92,233 118,987 158,493 141,595 117,362 Investment in Non-Consolidated Subs. - - - - - Gross Loans (HFI & HFS) 409,995 956,225 893,821 852,190 1,169,705 Loan Loss Reserve 3,732 6,306 6,348 7,516 9,736 Net Loans (HFI & HFS) 406,263 949,919 887,473 844,674 1,159,969 OREO 625 236 721 82 363 Intangible Assets 1,405 4,376 3,509 2,736 2,397 Premises & Fixed Assets 12,201 18,631 18,208 17,852 18,668 Other Assets 30,321 71,458 69,199 73,015 48,041 Total Assets 543,048 1,163,607 1,137,603 1,079,954 1,346,800 Liabilities Deposits $ 452,560 $ 1,026,480 $ 1,004,593 $ 940,480 $ 1,023,153 FHLB Borrowings 36,500 6,000 - - 189,719 Trust Preferred - 6,818 6,892 6,971 7,292 Other Borrowings 6,154 6,415 - - 19,999 Other Liabilites 5,914 11,638 12,208 14,393 12,185 Total Liabilities 501,128 1,057,351 1,023,693 961,844 1,252,348 Stockholders' Equity Preferred Stock & Surplus - - - - - Common Stock & Surplus 29,272 100,899 101,466 102,318 102,713 Retained Earnings 14,845 6,936 15,063 16,140 (8,735) AOCI ( 2,197) ( 1,579) ( 2,619) ( 348) 474 Total Stockholders' Equity 41,920 106,256 113,910 118,110 94,452 Total Liabilities and Stockholders' Equity $ 543,048 $ 1,163,607 $ 1,137,603 $ 1,079,954 $ 1,346,800 Source: S&P Global Market Intelligence; holding company financials 45Historical Balance Sheet At December 31, June 30, (dollars show n in thousands) 2016 2017 2018 2019 2020 Assets Cash & Bal. Due from Dep. Inst. $ 19,120 $ 25,786 $ 53,816 $ 50,348 $ 43,228 Fed Funds Sold & Reverse Repos $ - $ - $ - $ - $ - Securities $ 73,113 $ 93,201 $ 104,677 $ 91,247 $ 74,134 Cash and Cash Equivalents 92,233 118,987 158,493 141,595 117,362 Investment in Non-Consolidated Subs. - - - - - Gross Loans (HFI & HFS) 409,995 956,225 893,821 852,190 1,169,705 Loan Loss Reserve 3,732 6,306 6,348 7,516 9,736 Net Loans (HFI & HFS) 406,263 949,919 887,473 844,674 1,159,969 OREO 625 236 721 82 363 Intangible Assets 1,405 4,376 3,509 2,736 2,397 Premises & Fixed Assets 12,201 18,631 18,208 17,852 18,668 Other Assets 30,321 71,458 69,199 73,015 48,041 Total Assets 543,048 1,163,607 1,137,603 1,079,954 1,346,800 Liabilities Deposits $ 452,560 $ 1,026,480 $ 1,004,593 $ 940,480 $ 1,023,153 FHLB Borrowings 36,500 6,000 - - 189,719 Trust Preferred - 6,818 6,892 6,971 7,292 Other Borrowings 6,154 6,415 - - 19,999 Other Liabilites 5,914 11,638 12,208 14,393 12,185 Total Liabilities 501,128 1,057,351 1,023,693 961,844 1,252,348 Stockholders' Equity Preferred Stock & Surplus - - - - - Common Stock & Surplus 29,272 100,899 101,466 102,318 102,713 Retained Earnings 14,845 6,936 15,063 16,140 (8,735) AOCI ( 2,197) ( 1,579) ( 2,619) ( 348) 474 Total Stockholders' Equity 41,920 106,256 113,910 118,110 94,452 Total Liabilities and Stockholders' Equity $ 543,048 $ 1,163,607 $ 1,137,603 $ 1,079,954 $ 1,346,800 Source: S&P Global Market Intelligence; holding company financials 45
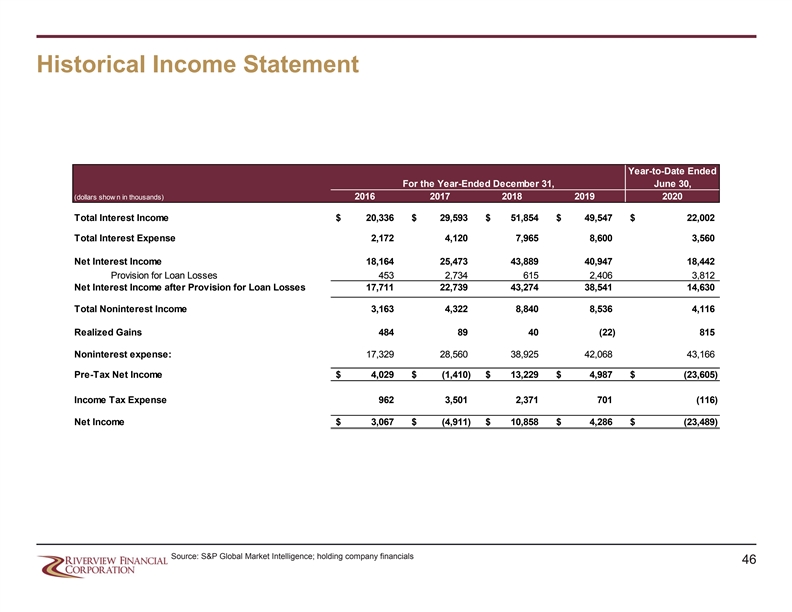
Historical Income Statement Year-to-Date Ended For the Year-Ended December 31, June 30, (dollars show n in thousands) 2016 2017 2018 2019 2020 Total Interest Income $ 20,336 $ 29,593 $ 51, 854 $ 49,547 $ 22,002 Total Interest Expense 2,172 4,120 7, 965 8,600 3,560 Net Interest Income 18,164 25,473 43,889 40,947 18,442 Provision for Loan Losses 453 2,734 615 2,406 3,812 Net Interest Income after Provision for Loan Losses 17, 711 22,739 43,274 38,541 14,630 Total Noninterest Income 3, 163 4,322 8, 840 8,536 4,116 Realized Gains 484 89 40 ( 22) 815 Noninterest expense: 17, 329 28,560 38, 925 42,068 43,166 Pre-Tax Net Income $ 4,029 $ ( 1,410) $ 13,229 $ 4,987 $ (23,605) Income Tax Expense 962 3,501 2, 371 701 (116) Net Income $ 3,067 $ ( 4,911) $ 10, 858 $ 4,286 $ (23,489) Source: S&P Global Market Intelligence; holding company financials 46Historical Income Statement Year-to-Date Ended For the Year-Ended December 31, June 30, (dollars show n in thousands) 2016 2017 2018 2019 2020 Total Interest Income $ 20,336 $ 29,593 $ 51, 854 $ 49,547 $ 22,002 Total Interest Expense 2,172 4,120 7, 965 8,600 3,560 Net Interest Income 18,164 25,473 43,889 40,947 18,442 Provision for Loan Losses 453 2,734 615 2,406 3,812 Net Interest Income after Provision for Loan Losses 17, 711 22,739 43,274 38,541 14,630 Total Noninterest Income 3, 163 4,322 8, 840 8,536 4,116 Realized Gains 484 89 40 ( 22) 815 Noninterest expense: 17, 329 28,560 38, 925 42,068 43,166 Pre-Tax Net Income $ 4,029 $ ( 1,410) $ 13,229 $ 4,987 $ (23,605) Income Tax Expense 962 3,501 2, 371 701 (116) Net Income $ 3,067 $ ( 4,911) $ 10, 858 $ 4,286 $ (23,489) Source: S&P Global Market Intelligence; holding company financials 46

Non-GAAP Financial Measures For the six- Core Return on For the year ended December 31, months ended Average Assets / Equity / Tangible Equity 2016 2017 2018 2019 2020 Net Income $3,067 ($4,807) $10,858 $4,286 ($23,489) Gains (Loss) on sale of investment securities, net of tax 319 58 32 (17) 644 Acquisition related expenses, net of tax 148 2,425 437 – – Tax Cuts and Jobs Act of 2017 tax expense – 3,888 – – – Executive separation expense, net of tax – – – 1,752 – Goodwill Impairment – – – – 24,581 Adjusted Net Income (Core) 2,896 1,448 11,263 6,055 448 Average Assets 535,449 751,927 1,152,876 1,114,383 1,189,086 Average Equity 43,417 70,476 110,735 116,054 119,309 Average Tangible Equity 36,690 58,460 82,153 88,277 92,128 ADJUSTED ROAA 0.54% 0.19% 0.98% 0.54% 0.08% ADJUSTED ROAE 6.67% 2.05% 10.17% 5.22% 0.76% ADJUSTED ROATE 7.89% 2.48% 13.71% 6.86% 0.98% At December 31, June 30, Consolidated Tangible Common Equity 2016 2017 2018 2019 2020 Total Common Equity $41,920 $106,256 $113,910 $118,110 $94,452 Total Intangible Assets 6,813 29,130 28,263 27,490 2,397 Tangible Common Equity 35,107 77,126 85,647 90,620 92,055 Total Assets $543,048 $1,163,607 $1,137,603 $1,079,954 $1,346,800 Total Intangible Assets 6,813 29,130 28,263 27,490 2,397 Tangible Assets 536,235 1,134,477 1,109,340 1,052,464 1,344,403 TCE / TA 6.55% 6.80% 7.72% 8.61% 6.85% 47Non-GAAP Financial Measures For the six- Core Return on For the year ended December 31, months ended Average Assets / Equity / Tangible Equity 2016 2017 2018 2019 2020 Net Income $3,067 ($4,807) $10,858 $4,286 ($23,489) Gains (Loss) on sale of investment securities, net of tax 319 58 32 (17) 644 Acquisition related expenses, net of tax 148 2,425 437 – – Tax Cuts and Jobs Act of 2017 tax expense – 3,888 – – – Executive separation expense, net of tax – – – 1,752 – Goodwill Impairment – – – – 24,581 Adjusted Net Income (Core) 2,896 1,448 11,263 6,055 448 Average Assets 535,449 751,927 1,152,876 1,114,383 1,189,086 Average Equity 43,417 70,476 110,735 116,054 119,309 Average Tangible Equity 36,690 58,460 82,153 88,277 92,128 ADJUSTED ROAA 0.54% 0.19% 0.98% 0.54% 0.08% ADJUSTED ROAE 6.67% 2.05% 10.17% 5.22% 0.76% ADJUSTED ROATE 7.89% 2.48% 13.71% 6.86% 0.98% At December 31, June 30, Consolidated Tangible Common Equity 2016 2017 2018 2019 2020 Total Common Equity $41,920 $106,256 $113,910 $118,110 $94,452 Total Intangible Assets 6,813 29,130 28,263 27,490 2,397 Tangible Common Equity 35,107 77,126 85,647 90,620 92,055 Total Assets $543,048 $1,163,607 $1,137,603 $1,079,954 $1,346,800 Total Intangible Assets 6,813 29,130 28,263 27,490 2,397 Tangible Assets 536,235 1,134,477 1,109,340 1,052,464 1,344,403 TCE / TA 6.55% 6.80% 7.72% 8.61% 6.85% 47
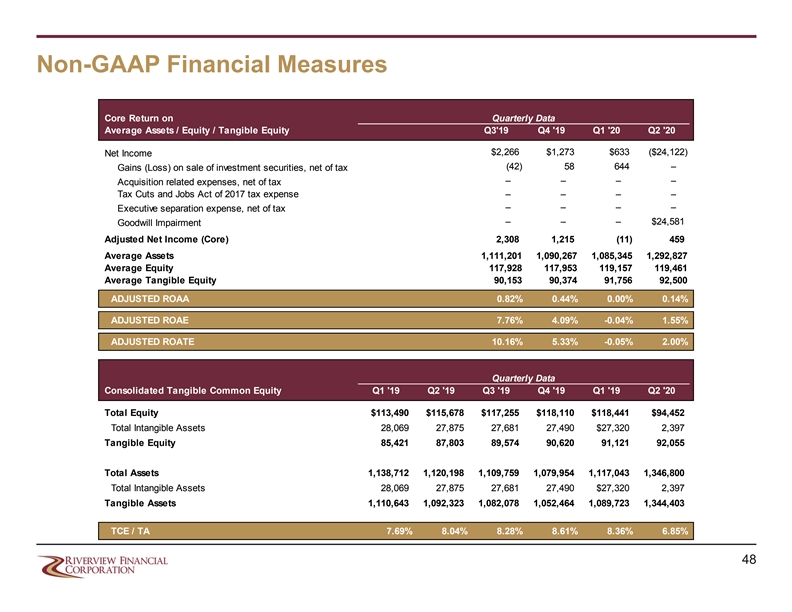
Non-GAAP Financial Measures Core Return on Quarterly Data Average Assets / Equity / Tangible Equity Q3'19 Q4 '19 Q1 '20 Q2 '20 $2,266 $1,273 $633 ($24,122) Net Income (42) 58 644 – Gains (Loss) on sale of investment securities, net of tax – – – – Acquisition related expenses, net of tax Tax Cuts and Jobs Act of 2017 tax expense – – – – – – – – Executive separation expense, net of tax – – – $24,581 Goodwill Impairment Adjusted Net Income (Core) 2,308 1,215 (11) 459 Average Assets 1,111,201 1,090,267 1,085,345 1,292,827 Average Equity 117,928 117,953 119,157 119,461 Average Tangible Equity 90,153 90,374 91,756 92,500 ADJUSTED ROAA 0.82% 0.44% 0.00% 0.14% ADJUSTED ROAE 7.76% 4.09% -0.04% 1.55% ADJUSTED ROATE 10.16% 5.33% -0.05% 2.00% Quarterly Data Consolidated Tangible Common Equity Q1 '19 Q2 '19 Q3 '19 Q4 '19 Q1 '19 Q2 '20 Total Equity $113,490 $115,678 $117,255 $118,110 $118,441 $94,452 Total Intangible Assets 28,069 27,875 27,681 27,490 $27,320 2,397 Tangible Equity 85,421 87,803 89,574 90,620 91,121 92,055 Total Assets 1,138,712 1,120,198 1,109,759 1,079,954 1,117,043 1,346,800 Total Intangible Assets 28,069 27,875 27,681 27,490 $27,320 2,397 Tangible Assets 1,110,643 1,092,323 1,082,078 1,052,464 1,089,723 1,344,403 TCE / TA 7.69% 8.04% 8.28% 8.61% 8.36% 6.85% 48Non-GAAP Financial Measures Core Return on Quarterly Data Average Assets / Equity / Tangible Equity Q3'19 Q4 '19 Q1 '20 Q2 '20 $2,266 $1,273 $633 ($24,122) Net Income (42) 58 644 – Gains (Loss) on sale of investment securities, net of tax – – – – Acquisition related expenses, net of tax Tax Cuts and Jobs Act of 2017 tax expense – – – – – – – – Executive separation expense, net of tax – – – $24,581 Goodwill Impairment Adjusted Net Income (Core) 2,308 1,215 (11) 459 Average Assets 1,111,201 1,090,267 1,085,345 1,292,827 Average Equity 117,928 117,953 119,157 119,461 Average Tangible Equity 90,153 90,374 91,756 92,500 ADJUSTED ROAA 0.82% 0.44% 0.00% 0.14% ADJUSTED ROAE 7.76% 4.09% -0.04% 1.55% ADJUSTED ROATE 10.16% 5.33% -0.05% 2.00% Quarterly Data Consolidated Tangible Common Equity Q1 '19 Q2 '19 Q3 '19 Q4 '19 Q1 '19 Q2 '20 Total Equity $113,490 $115,678 $117,255 $118,110 $118,441 $94,452 Total Intangible Assets 28,069 27,875 27,681 27,490 $27,320 2,397 Tangible Equity 85,421 87,803 89,574 90,620 91,121 92,055 Total Assets 1,138,712 1,120,198 1,109,759 1,079,954 1,117,043 1,346,800 Total Intangible Assets 28,069 27,875 27,681 27,490 $27,320 2,397 Tangible Assets 1,110,643 1,092,323 1,082,078 1,052,464 1,089,723 1,344,403 TCE / TA 7.69% 8.04% 8.28% 8.61% 8.36% 6.85% 48