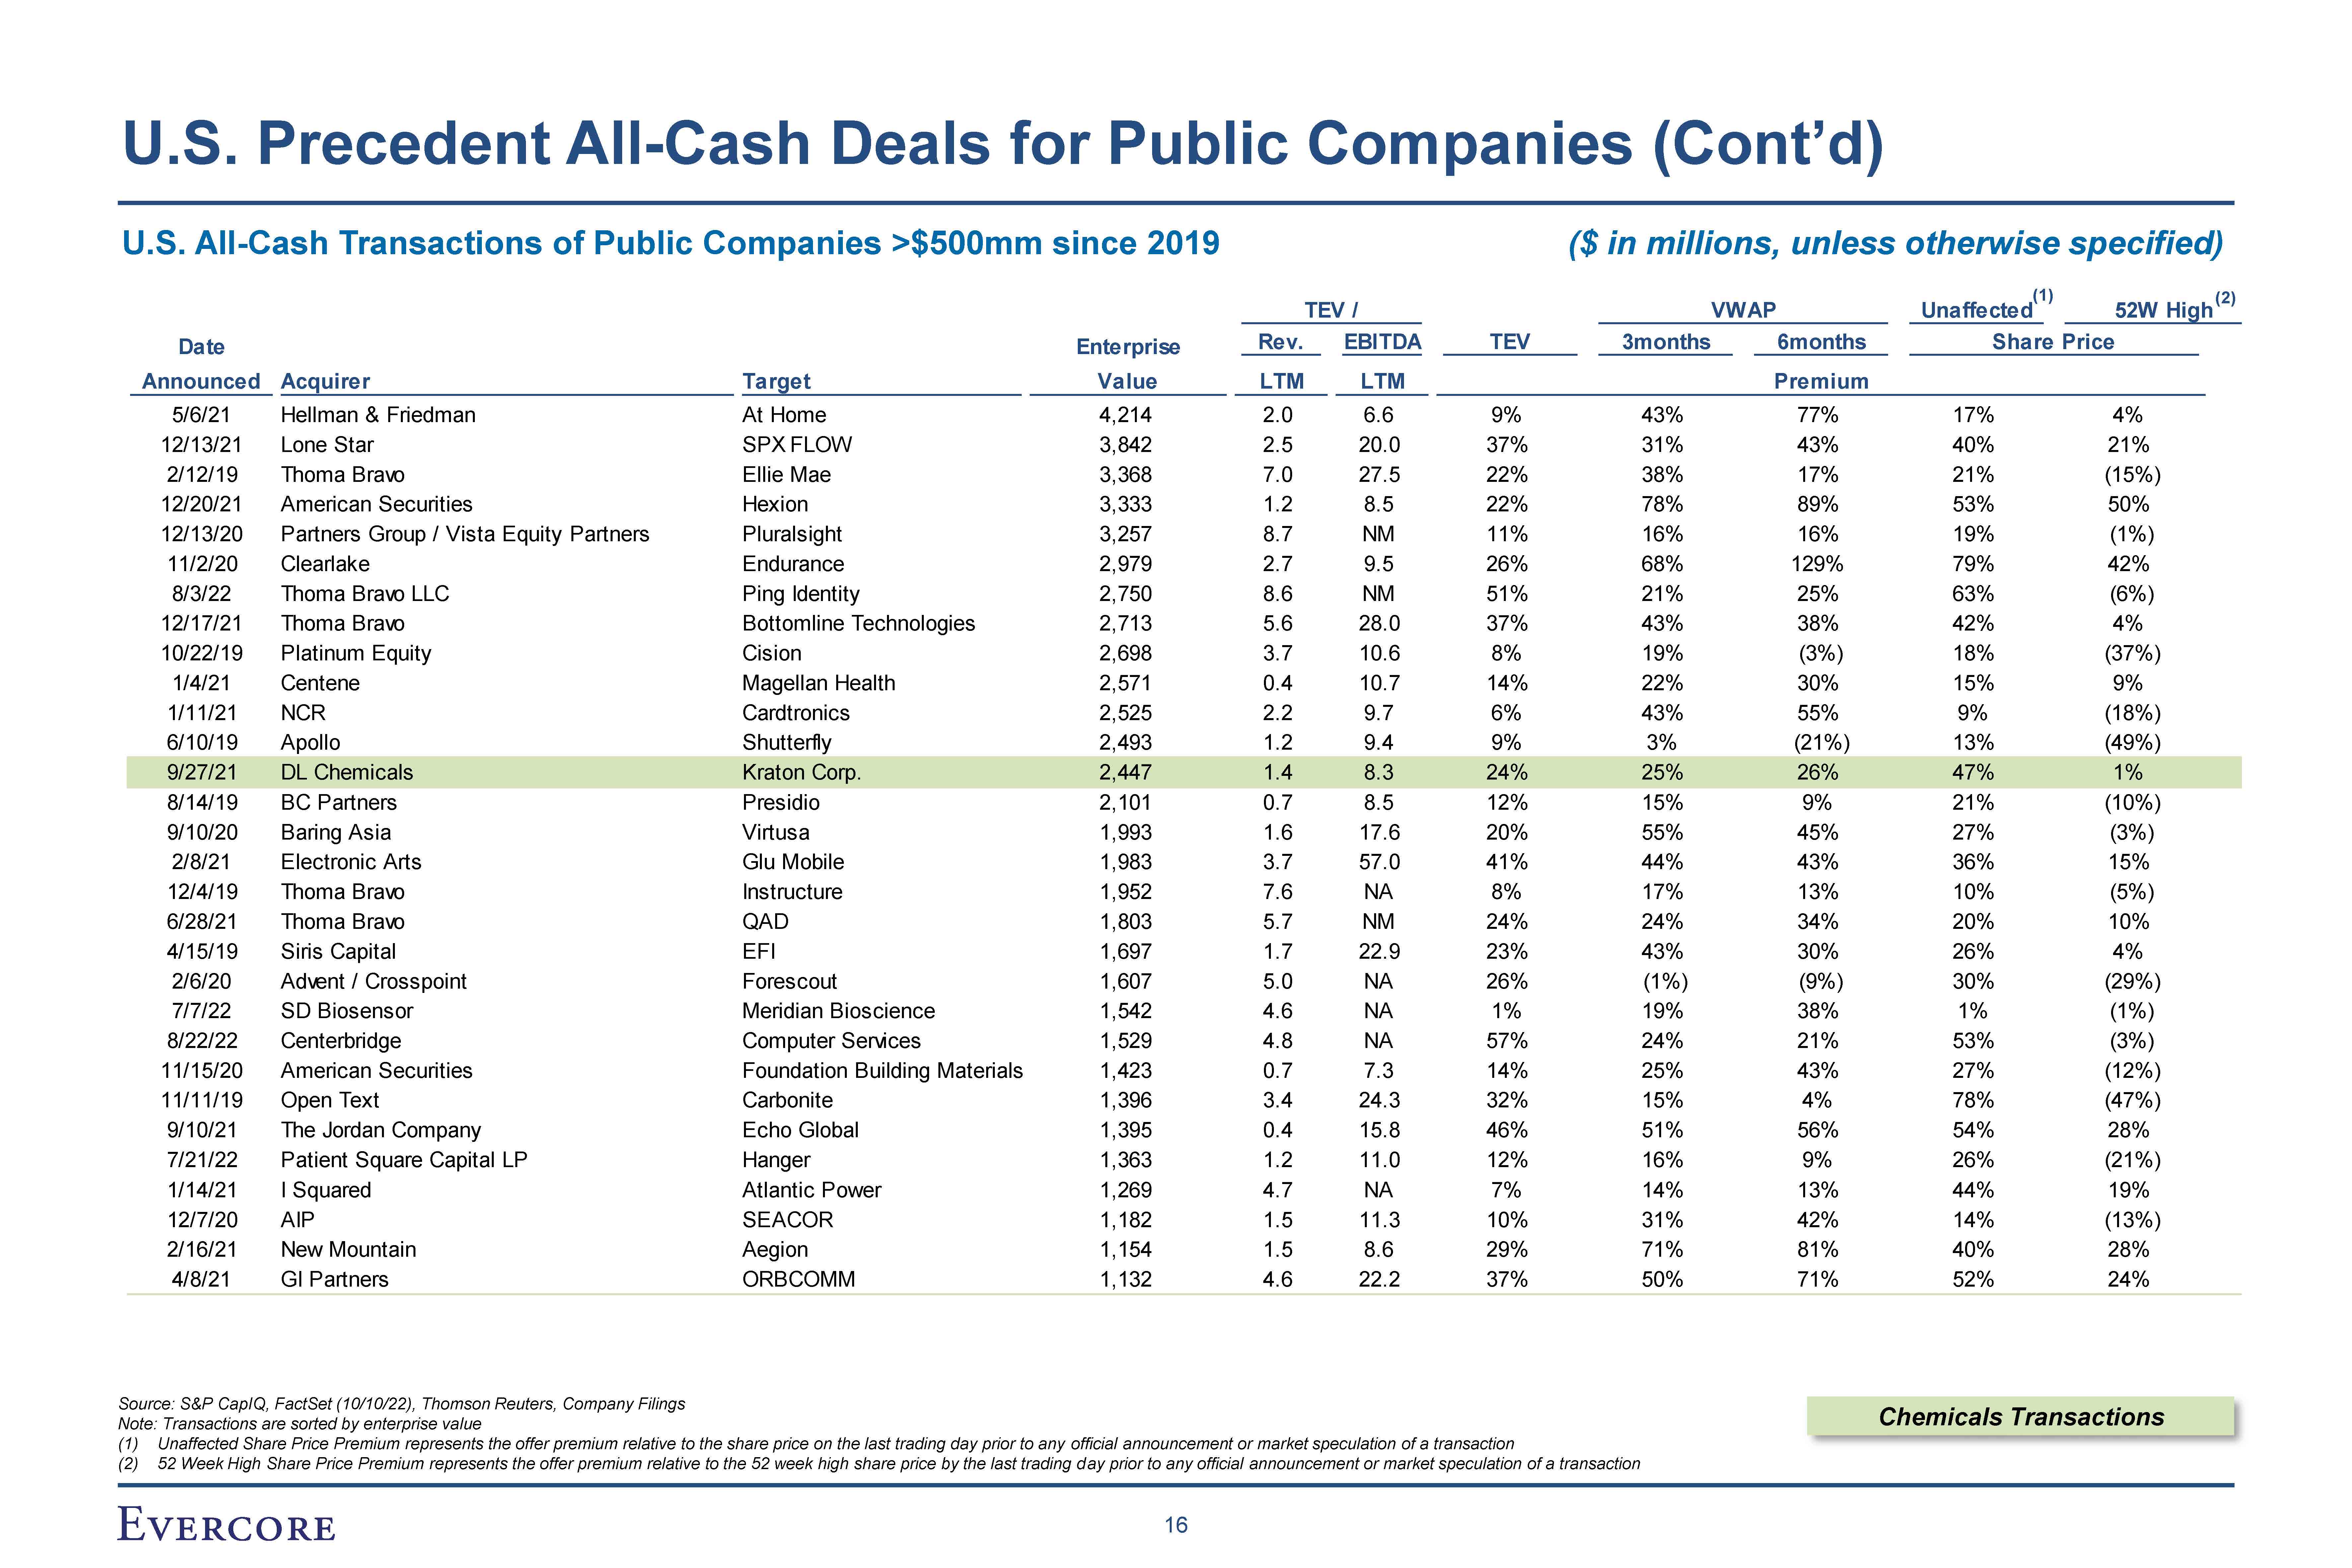
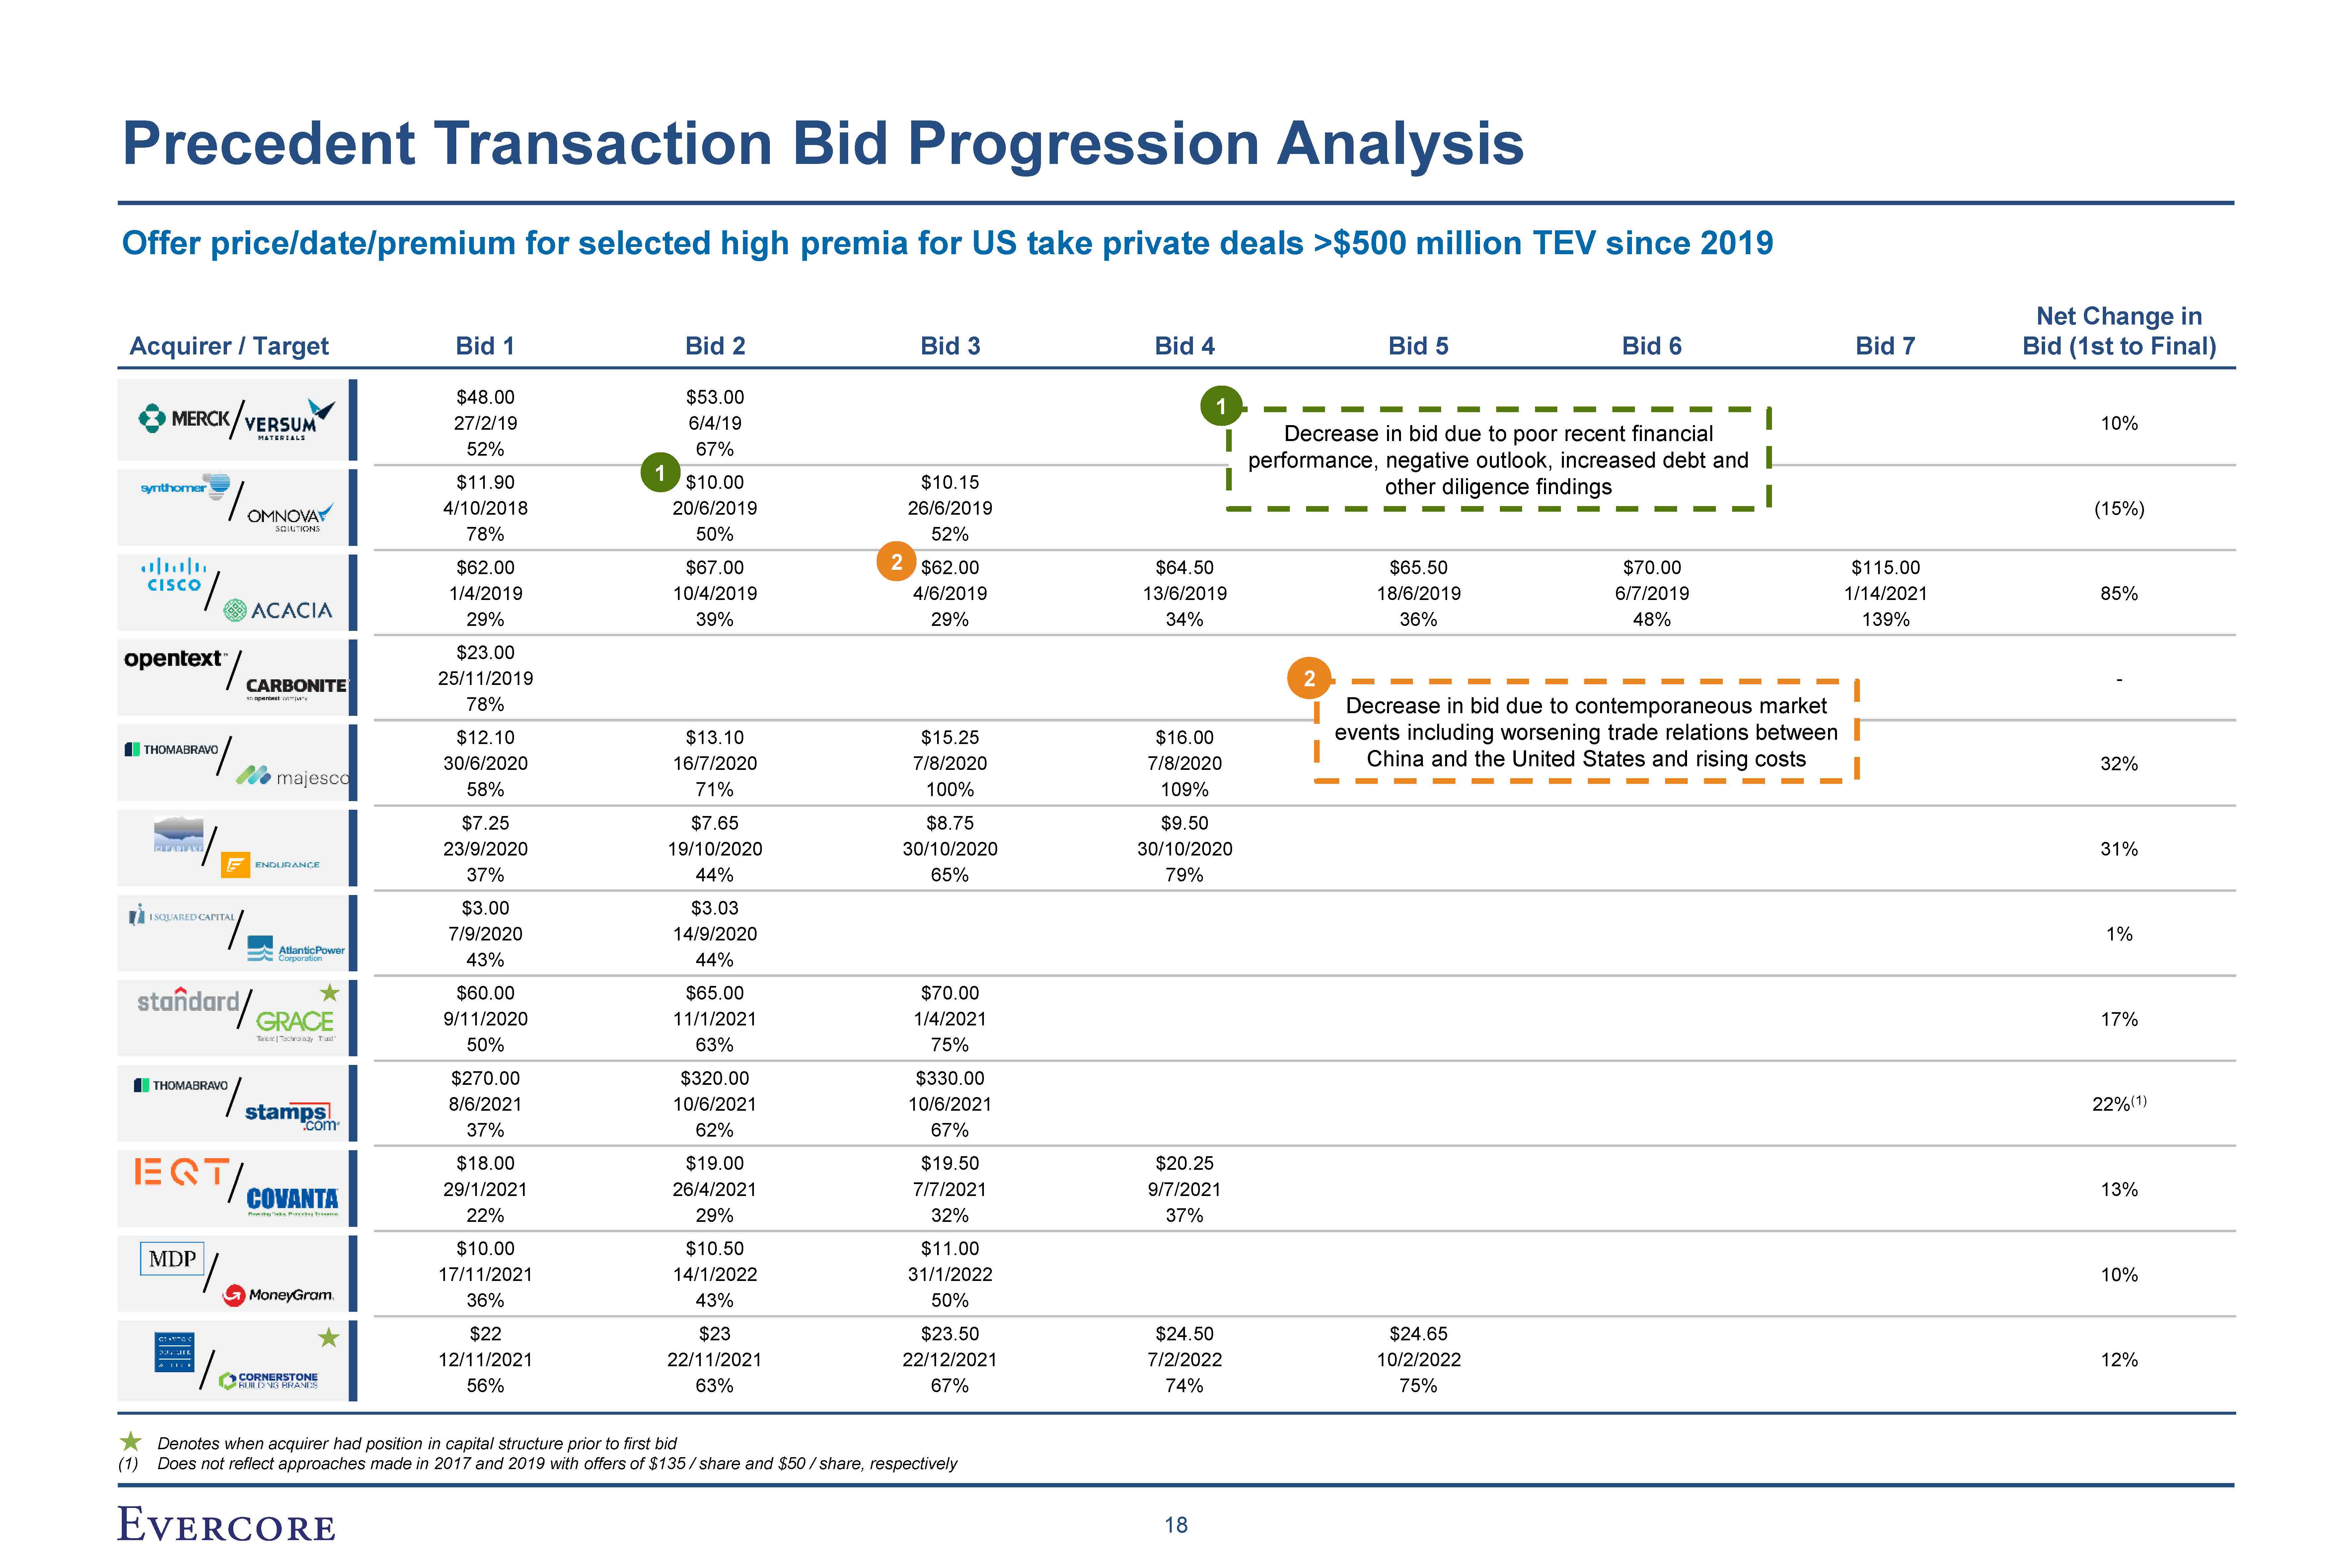
Announced Acquirer Target Value LTM LTM Premium 5/6/21 Hellman & Friedman At Home 4,214 2.0 6.6 9% 43% 77% 17% 4% 12/13/21 Lone Star SPX FLOW 3,842 2.5 20.0 37% 31% 43% 40% 21% 2/12/19 Thoma Bravo Ellie Mae 3,368 7.0 27.5 22% 38% 17% 21% (15%) 12/20/21 American Securities Hexion 3,333 1.2 8.5 22% 78% 89% 53% 50% 12/13/20 Partners Group / Vista Equity Partners Pluralsight 3,257 8.7 NM 11% 16% 16% 19% (1%) 11/2/20 Clearlake Endurance 2,979 2.7 9.5 26% 68% 129% 79% 42% 8/3/22 Thoma Bravo LLC Ping Identity 2,750 8.6 NM 51% 21% 25% 63% (6%) 12/17/21 Thoma Bravo Bottomline Technologies 2,713 5.6 28.0 37% 43% 38% 42% 4% 10/22/19 Platinum Equity Cision 2,698 3.7 10.6 8% 19% (3%) 18% (37%) 1/4/21 Centene Magellan Health 2,571 0.4 10.7 14% 22% 30% 15% 9% 1/11/21 NCR Cardtronics 2,525 2.2 9.7 6% 43% 55% 9% (18%) 6/10/19 Apollo Shutterfly 2,493 1.2 9.4 9% 3% (21%) 13% (49%) 9/27/21 DL Chemicals Kraton Corp. 2,447 1.4 8.3 24% 25% 26% 47% 1% 8/14/19 BC Partners Presidio 2,101 0.7 8.5 12% 15% 9% 21% (10%) 9/10/20 Baring Asia Virtusa 1,993 1.6 17.6 20% 55% 45% 27% (3%) 2/8/21 Electronic Arts Glu Mobile 1,983 3.7 57.0 41% 44% 43% 36% 15% 12/4/19 Thoma Bravo Instructure 1,952 7.6 NA 8% 17% 13% 10% (5%) 6/28/21 Thoma Bravo QAD 1,803 5.7 NM 24% 24% 34% 20% 10% 4/15/19 Siris Capital EFI 1,697 1.7 22.9 23% 43% 30% 26% 4% 2/6/20 Advent / Crosspoint Forescout 1,607 5.0 NA 26% (1%) (9%) 30% (29%) 7/7/22 SD Biosensor Meridian Bioscience 1,542 4.6 NA 1% 19% 38% 1% (1%) 8/22/22 Centerbridge Computer Services 1,529 4.8 NA 57% 24% 21% 53% (3%) 11/15/20 American Securities Foundation Building Materials 1,423 0.7 7.3 14% 25% 43% 27% (12%) 11/11/19 Open Text Carbonite 1,396 3.4 24.3 32% 15% 4% 78% (47%) 9/10/21 The Jordan Company Echo Global 1,395 0.4 15.8 46% 51% 56% 54% 28% 7/21/22 Patient Square Capital LP Hanger 1,363 1.2 11.0 12% 16% 9% 26% (21%) 1/14/21 I Squared Atlantic Power 1,269 4.7 NA 7% 14% 13% 44% 19% 12/7/20 AIP SEACOR 1,182 1.5 11.3 10% 31% 42% 14% (13%) 2/16/21 New Mountain Aegion 1,154 1.5 8.6 29% 71% 81% 40% 28% 4/8/21 GI Partners ORBCOMM 1,132 4.6 22.2 37% 50% 71% 52% 24% TEV / (1) (2) VWAP Unaffected 52W High Date Enterprise Rev. EBITDA TEV 3months 6months Share Price U.S. All-Cash Transactions of Public Companies >$500mm since 2019 ($ in millions, unless otherwise specified) U.S. Precedent All-Cash Deals for Public Companies (Cont’d) Source: S&P CapIQ, FactSet (10/10/22), Thomson Reuters, Company Filings Note: Transactions are sorted by enterprise value (1) Unaffected Share Price Premium represents the offer premium relative to the share price on the last trading day prior to any official announcement or market speculation of a transaction (2) 52 Week High Share Price Premium represents the offer premium relative to the 52 week high share price by the last trading day prior to any official announcement or market speculation of a transaction Chemicals Transactions 16
