Exhibit 99.1

env1va Enviva Partners, LP Business Overview Last Updated: March 2, 2020 (NYSE: EVA)

FORWARD-LOOKING AND CAUTIONARY STATEMENTS Forward-looking statements This presentation contains “forward-looking statements” within the meaning of the securities laws. All statements, other than statements of historical fact, included in this presentation that address activities, events or developments that Enviva Partners, LP (NYSE: EVA) (“Enviva,” the “Partnership,” “we,” or “us”) expects, believes or anticipates will or may occur in the future are forward-looking statements. The words “believe,” “expect,” “may,” “estimates,” “will,” “anticipate,” “plan,” “intend,” “foresee,” “should,” “would,” “could,” or other similar expressions are intended to identify forward-looking statements, which are generally not historical in nature. However, the absence of these words does not mean that the statements are not forward-looking. These statements are based on certain assumptions made by Enviva based on management’s expectations and perception of historical trends, current conditions, anticipated future developments, and other factors believed to be appropriate. Although Enviva believes that these assumptions were reasonable when made, because assumptions are inherently subject to significant uncertainties and contingencies that are difficult or impossible to predict and are beyond its control, Enviva cannot give assurance that it will achieve or accomplish these expectations, beliefs or intentions. A number of the assumptions on which these forward-looking statements are based are subject to risks and uncertainties, many of which are beyond the control of Enviva, and may cause actual results to differ materially from those implied or expressed by the forward-looking statements. These risks and uncertainties include the factors discussed or referenced in our filings with the Securities and Exchange Commission (the “SEC”), including the Annual Report on Form 10-K and the Quarterly Report on Form 10-Q most recently filed with the SEC, including those risks relating to financial performance and results, economic conditions and resulting capital restraints, availability of sufficient capital to execute Enviva’s business plan, the ability of Enviva to complete acquisitions and realize the anticipated benefits of such acquisitions, impact of compliance with legislation and regulations and other important factors that could cause actual results to differ materially from those projected. When considering the forward-looking statements, you should keep in mind the risk factors and other cautionary statements in such filings. You are cautioned not to place undue reliance on forward-looking statements, which speak only as of the date on which such statement is made, and Enviva undertakes no obligation to correct or update any forward-looking statement, whether as a result of new information, future events or otherwise, except as required by applicable law. All forward-looking statements attributable to Enviva are qualified in their entirety by this cautionary statement. Industry and market data This presentation has been prepared by Enviva and includes market data and other statistical information from third-party sources, including independent industry publications, government publications or other published independent sources. Although Enviva believes these third-party sources are reliable as of their respective dates, Enviva has not independently verified the accuracy or completeness of this information. Some data is also based on Enviva’s good faith estimates, which are derived from its review of internal sources as well as the third-party sources described above. 2

COMPANY HIGHLIGHTS: HIGH-GROWTH, “DROP-DOWN” MLP ▪ Strong fiber baskets deliver low-cost, growing natural resource, and stable pricing billion, respectively, if volumes held by our Sponsor and the Sponsor JV were included4 ▪ Our Sponsor and the Sponsor JV’s long-term contracts, with weighted-average remaining term of 16.8 years, and product sales backlog of $9.0 billion, MANAGEMENT 1) United Nations Intergovernmental Panel on Climate Change; 2) The International Renewable Energy Agency; 3) As of February 1, 2020, excluding firm and contingent contracts between our long-term off-take customers and Enviva Holdings, LP (our “Sponsor”) and Enviva JV Development Company, LLC (the “Sponsor JV”); 4) Includes contracts between our long-term off-take customers and the Partnership, our Sponsor, and the Sponsor JV. We expect to have the opportunity to acquire assets or completed development projects from our Sponsor or the Sponsor JV in the future; 5) On February 26, 2020, reaffirmed previously provided distribution guidance of 2.87 to $2.97 per common unit for full-year 2020; 6) Additional details are available as part of our press release as of February 26, 2020; 7) The Sponsor and the Sponsor JV are progressing development of wood pellet production plants and marine terminals, including constructing a deep-water marine terminal in Pascagoula, Mississippi (the “Pascagoula terminal”) and a wood pellet production plant in Lucedale, Mississippi (the “Lucedale plant”), investing incremental capital in a wood pellet production plant in Greenwood, South Carolina (the “Greenwood plant”), developing a potential wood pellet production plant in Epes, Alabama (the “Epes plant”), and evaluating additional sites 3 EXPERIENCED ▪ Management team led by industry founders and seasoned public company executives ▪ Demonstrated expertise acquiring, building, operating, and contracting / re-contracting platform assets ▪ Management rewarded for sustained growth in per-unit distributable cash flow ▪ Potential to more than double the Partnership’s 2019 adjusted EBITDA of ~$141.3 million in a few years with drop-downs, expansions, and 7-10% anticipated annual organic growth ▪ 18 consecutive distribution increases since the Partnership’s IPO in 2015. Expect aggregate per-unit distributions of between $2.87 and $2.97 for full-year 2020.5 Targeted distribution coverage ratio of at least 1.20 times for the full-year 2020, on a forward-looking annual basis6 ▪ Consistent track record of development of production plants and terminal assets by the Sponsor and subsequent drop-down into the Partnership underwrite the Greenwood plant, the Lucedale plant, and several additional plants7 ▪ Sales strategy is to fully contract our production capacity under long-term, take-or-pay, off-take contracts ▪ Contracts carry a weighted-average remaining term of 11.4 years and a product sales backlog of $10.6 billion,3 increasing to 13.8 years and $19.6 ▪ By 2025, combined portfolio expected to consist of ~6.7 million MTPY of off-take contracts, split approximately evenly between European and Asian utilities, major trading houses, and power generator customers4 ▪ Fully contracted, strategically located production plants exporting through multiple deep-water marine terminals ▪ Embedded low-cost to-port logistics and favorable long-term fixed-rate shipping contracts COMPELLING INDUSTRY FUNDAMENTALS ADVANTAGED ASSETS LONG-TERM OFF-TAKE CONTRACTS SUBSTANTIAL GROWTH OPPORTUNITIES ▪ Significant long-term demand for wood pellets driven by the global commitment to limit the impact of climate change, as evidenced by the 2030 renewable energy directive and 2050 “net-zero” emission targets across Europe and Asia, firm country-level coal phase-out mandates, and scientific conclusions by leading international organizations, such as UN IPCC1 and IRENA2, on the critical role of biomass in decarbonatization ▪ Critical supply chain partner for major power, heat or combined heat and power generators worldwide ▪ Supply not adequate for demand with few providers of scale WORLD’S LARGEST SUPPLIER OF UTILITY-GRADE WOOD PELLETS TO MAJOR POWER GENERATORS WITH 3.5 MILLION METRIC TONS PER YEAR (“MTPY”) OF FULLY CONTRACTED PRODUCTION CAPACITY

ENVIVA IMPROVES THE ENVIRONMENT BY DISPLACING COAL1 AND GROWING MORE TREES2 1) Increasing the share of biomass on the global grid system is critical to the global energy transition. International Renewable Energy Agency’s Global Energy Transformation: A Roadmap to 2050 (2019 Edition) report calls for the share of modern biomass for energy generation to increase from 5% in 2016 to 16% in 2050, and the share of coal for energy generation to decrease from 14% to 3% over the same period Landowners in the US South respond to strong markets for forest products by making investments in their forests and there is a clear positive relationship between rates of forest harvest and forest acreage, growth, and inventory. Based on FIA data for the US South covering the 70-year period since 1953, Forest2Market concluded that “Increased demand for wood … encouraged landowners to invest in productivity improvements that dramatically increased the amount of wood fiber, and therefore the amount of carbon, contained in the South’s forests.” Source: Forest2Market report, Historical Perspective on the Relationship between Demand and Forest Productivity in the US South, July 2017 Eurostat. Inland coal consumption in key European countries that Enviva serves Industrial wood pellet demand for Belgium, Denmark, Netherlands and United Kingdom. Hawkins Wright: The Outlook for Wood Pellets – Demand, Supply, Costs and Prices; 4th Quarter 2019 FIA Data. Enviva’s primary sourcing regions consist of the Chesapeake (NC, VA); Sampson (NC); Greenwood (SC, GA); and Gulf (AL, FL and GA) regions 2) 3) 4) 5) 4 Million MT Million MT Million MT Through 2019, wood pellets supplied by the Partnership and our Sponsor have effectively displaced 15 million MT of coal. With existing contracts running through 2044, the Partnership and our Sponsor are on track to displace another 86 million MT of coal Strong Forest Inventory Growth in Enviva’s Sourcing Regions5 2,400 2,350 2,300 2,250 2,200 2,150 2,100 2,050 2,000 1,950 2012201320142015201620172018 Wood Pellet Consumption More Than Doubled4 12 10 8 6 4 2 0 2012201320142015201620172018 Coal Consumption Declined by More than Half3 120 100 80 60 40 20 0 2012201320142015201620172018 BelgiumDenmarkNetherlandsUK
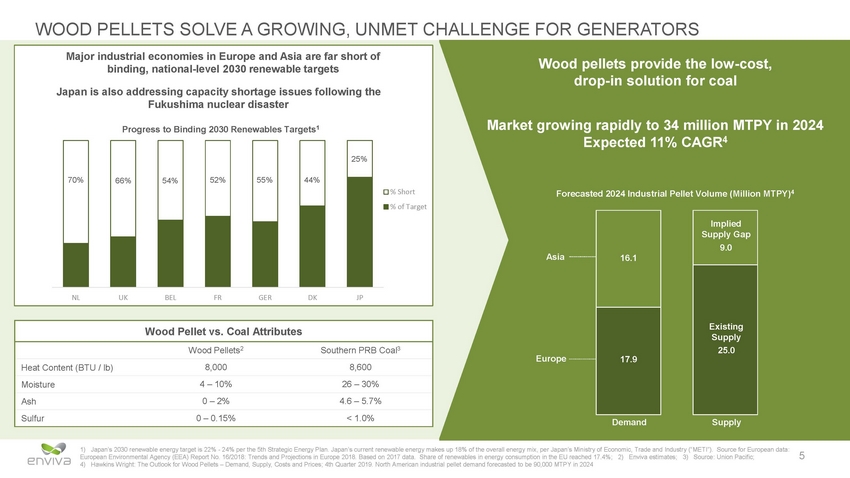
WOOD PELLETS SOLVE A GROWING, UNMET CHALLENGE FOR GENERATORS Wood pellets provide the low-cost, drop-in solution for coal growing rapidly to 34 million MTPY in 2024 Expected 11% CAGR4 Forecasted 2024 Industrial Pellet Volume (Million MTPY)4 Asia Europe Demand Supply 1) Japan’s 2030 renewable energy target is 22% - 24% per the 5th Strategic Energy Plan. Japan’s current renewable energy makes up 18% of the overall energy mix, per Japan’s Ministry of Economic, Trade and Industry (“METI”). Source for European data: European Environmental Agency (EEA) Report No. 16/2018: Trends and Projections in Europe 2018. Based on 2017 data. Share of renewables in energy consumption in the EU reached 17.4%; 2) Enviva estimates; 3) Source: Union Pacific; 4) Hawkins Wright: The Outlook for Wood Pellets – Demand, Supply, Costs and Prices; 4th Quarter 2019. North American industrial pellet demand forecasted to be 90,000 MTPY in 2024 5 Wood Pellet vs. Coal Attributes Wood Pellets2Southern PRB Coal3 Heat Content (BTU / lb)8,0008,600 Moisture4 – 10%26 – 30% Ash0 – 2%4.6 – 5.7% Sulfur0 – 0.15%< 1.0% 16.1 17.9 Implied Supply Gap 9.0 Existing Supply 25.0 Major industrial economies in Europe and Asia are far short of binding, national-level 2030 renewable targets Japan is also addressing capacity shortage issues following the Fukushima nuclear disaster Progress to Binding 2030 Renewables Targets1 % Short % of Target NLUKBELFRGERDKJP 70% 66% 54% 52% 55% 44% 25%

ENVIVA’S OPERATIONS: FAMILIAR MIDSTREAM ACTIVITIES WITH CONTRACTED CASH FLOWS 1) As of February 1, 2020, excluding volumes under the contracts between long-term off-take customers and our Sponsor and the Sponsor JV; 2) As of February 1, 2020, includes all volumes under the firm and contingent off-take contracts held by the Partnership, the Sponsor and the Sponsor JV. Although the Partnership expects to have the opportunity to acquire these contracts from our Sponsor and the Sponsor JV, there can be no guarantee that the Partnership acquires all or any of the contracts; 3) The Sponsor and the Sponsor JV are progressing development of wood pellet production plants and marine terminals, including constructing the Pascagoula terminal and the Lucedale plant, investing incremental capital in the Greenwood plant, developing the Epes plant, and evaluating additional sites. Although we expect to have the opportunity to acquire assets or completed development projects and associated contracts from our Sponsor or the Sponsor JV in the future, we cannot assure you that our Sponsor or the Sponsor JV will be successful in completing their development/improvement projects or that we will successfully negotiate an agreement with our Sponsor or the Sponsor JV to acquire such assets, projects, or associated contracts 6 Fiber Envi va’s Oper ati onsCustomers / Growth ENGIELynemouth RWESumitomo several additional production facilities and a terminal3 bunker fuel passthroughs and other margin protection Off-take Valero FractionatingVesselPBF Energy “Upstream�� “Midstream” “Downstream” RENEWABLE Gathering ProcessingTruck DryingStorageRail DensifyingVessel Off-take Contracts DraxMitsubishi ØrstedMarubeni MGTToyota Tsusho Robust Fiber Basket ▪ Southeast U.S. – structural cost of goods advantage and sustainable feedstock ▪ Stranded natural resource with very stable pricing ▪ Fragmented supply base – thousands of sellers, only a few buyers of low-grade fiber ▪ Strong growth to drain – more fiber grows every year than is harvested ▪ Actual cost of fiber (“stumpage”) is a small portion of our overall cost tower Portfolio of Production & Terminaling Assets ▪ Clusters of geographically dispersed, fully contracted fleet of production plants ▪ Strategically located portfolio of ports providing optimal to-port logistics ▪ Build & copy design – leverages common processes and operational knowledge ▪ Large scale optimizes fixed-cost absorption ▪ Long-term, fixed-rate shipping contracts matching off-take tenor and volume Long-term Contracts with Significant Growth ▪ Fully contracted through 2025; weighted-average remaining term of 11.4 years and backlog of $10.6 billion1 ▪ Including contracts held at our Sponsor, increases to 13.8 years and $19.6 billion,2 respectively, driving the need for ▪ Fixed price (with escalators), take-or-pay contracts with ▪ Diversified, creditworthy customer base ▪ Significant contract pipeline supported by global policies (UN IPCC, RED II, etc.), country-specific renewable & carbon-reduction mandates and elimination of coal ▪ Biomass power & heat generation is cost-competitive on an unsubsidized basis with natural gas and a cost-advantaged complement to intermittent renewables CONVENTIONALGathering Truck Processing Pipeline WashingStorageRail MPC ContractsPhillips 66

EVA TOTAL RETURNS1 130 EVA Alerian MLP Index MSCI USA IMI ESG S&P 500 1) As of February 28, 2020. Based on Bloomberg’s total return data, which assumes reinvestment of distributions/dividends. Normalized for comparison purposes 7 167% 250 220 190 16057% 40% 100 70 (44%) 40 Since IPO in 2015, EVA has outperformed the Alerian MLP Index by 210%

Enviva’s Port of Chesapeake Marine terminal Compelling Industry Fundamentals

ECONOMIC ADVANTAGE AND REGULATORY STABILITY DRIVE ORDERLY GROWTH and grid stability as regulators continue to phase out coal-fired power generation systems are placed under strain competition among renewables, where biomass can prevail emissions to net-zero by 2050, which the UK government’s advisory Committee on Climate Change in Japan in 2020 (US$ / MWh)2 supplied from the Southeastern U.S. 1)Aurora Energy Research – Biomass conversions & the system cost of renewables (November 2016). Total System Cost of Electricity (TSCE) is the per-megawatt hour cost of building and operating a generating plant over an assumed financial life including intermittency, security of supply, balancing, grid expansion, and heat adjustment (applicable for CHP only). Data is for Germany and may not be representative of all the markets in which we or our customers operate. CHP is Combined Heat & Power. Expansion costs are related to the electricity grid only. New build CCGT could require gas grid expansions, the cost of which is not included here 2)IHS Markit: Levelized Cost of Power Generation in Japan, May 8, 2017. Costs are presented in real terms, as of 2020. In contrast to TSCE, Levelized Cost of Electricity (LCOE) does not include the intermittency costs associated with wind and solar power. LCOE for Dedicated Biomass assumes biomass wood-burning power plants with 112 MW of capacity and 40% efficiency 9 Levelized Cost of Electricity GT s Co-Firing $0$50$100$150$200$250 Solar Wind Dedicated Biomass CC Biomas Policy Characteristics for Enviva’s Target Markets 1Biomass energy providing a compelling solution to the “trilemma” of energy cost, decarbonization, 2Baseload / dispatchable characteristics of biomass power seen as a major advantage as electricity 3Policy-makers focused on improving financial discipline on a “total cost” basis, leading to more 4In June 2019, the UK became the first major economy to pass a law to bring greenhouse gas estimated would require that 15% of the energy mix come from biomass, up from approximately 7% today 5Asian market maturing towards long-term supply contract structure, and can be cost-competitively 6In Japan, most nuclear reactors remain offline, creating capacity constraints due to lack of baseload generation. World’s highest feed-in tariff incenting renewable power generation 7Biomass co-firing of U.S. coal fleet can extend plant lives, preserve jobs, and benefit rural economies Total System Cost of Electricity in Germany (€ / MWh)1 Solar Wind Biomass C 0 €50 €100 €150 € Onshore onversion CCGT Biomass Conversion with CHP
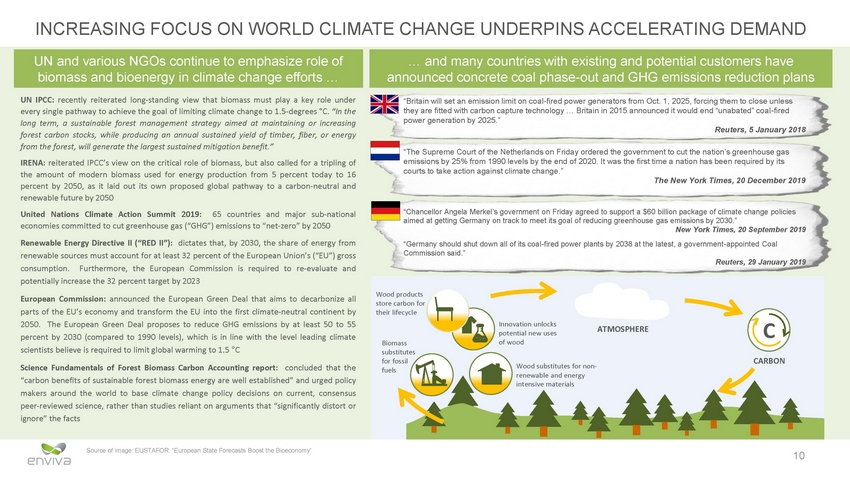
INCREASING FOCUS ON WORLD CLIMATE CHANGE UNDERPINS ACCELERATING DEMAND UN IPCC: recently reiterated long-standing view that biomass must play a key role under every single pathway to achieve the goal of limiting climate change to 1.5-degrees °C. “In the long term, a sustainable forest management strategy aimed at maintaining or increasing forest carbon stocks, while producing an annual sustained yield of timber, fiber, or energy from the forest, will generate the largest sustained mitigation benefit.” IRENA: reiterated IPCC’s view on the critical role of biomass, but also called for a tripling of the amount of modern biomass used for energy production from 5 percent today to 16 percent by 2050, as it laid out its own proposed global pathway to a carbon-neutral and renewable future by 2050 “Britain will set an emission limit on coal-fired power generators from Oct. 1, 2025, forcing them to close unless they are fitted with carbon capture technology … Britain in 2015 announced it would end “unabated” coal-fired power generation by 2025.” Reuters, 5 January 2018 “The Supreme Court of the Netherlands on Friday ordered the government to cut the nation’s greenhouse gas emissions by 25% from 1990 levels by the end of 2020. It was the first time a nation has been required by its courts to take action against climate change.” The New York Times, 20 December 2019 “Chancellor Angela Merkel’s government on Friday agreed to support a $60 billion package of climate change policies aimed at getting Germany on track to meet its goal of reducing greenhouse gas emissions by 2030.” New York Times, 20 September 2019 “Germany should shut down all of its coal-fired power plants by 2038 at the latest, a government-appointed Coal Commission said.” Reuters, 29 January 2019 United Nations Climate Action Summit 2019: 65 countries and major sub-national economies committed to cut greenhouse gas (“GHG”) emissions to “net-zero” by 2050 Renewable Energy Directive II (“RED II”): dictates that, by 2030, the share of energy from renewable sources must account for at least 32 percent of the European Union’s (“EU”) gross consumption. Furthermore, the European Commission is required to re-evaluate and potentially increase the 32 percent target by 2023 European Commission: announced the European Green Deal that aims to decarbonize all parts of the EU’s economy and transform the EU into the first climate-neutral continent by 2050. The European Green Deal proposes to reduce GHG emissions by at least 50 to 55 percent by 2030 (compared to 1990 levels), which is in line with the level leading climate scientists believe is required to limit global warming to 1.5 °C Science Fundamentals of Forest Biomass Carbon Accounting report: concluded that the “carbon benefits of sustainable forest biomass energy are well established” and urged policy makers around the world to base climate change policy decisions on current, consensus peer-reviewed science, rather than studies reliant on arguments that “significantly distort or ignore” the facts of wood Biomass renewable and energy Source of image: EUSTAFOR: “European State Forecasts Boost the Bioeconomy” 10 Wood products store carbon for their lifecycle potential new usesATMOSPHEREC Innovation unlocks substitutes for fossilCARBON fuelsWood substitutes for non-intensive materials … and many countries with existing and potential customers have announced concrete coal phase-out and GHG emissions reduction plans UN and various NGOs continue to emphasize role of biomass and bioenergy in climate change efforts …
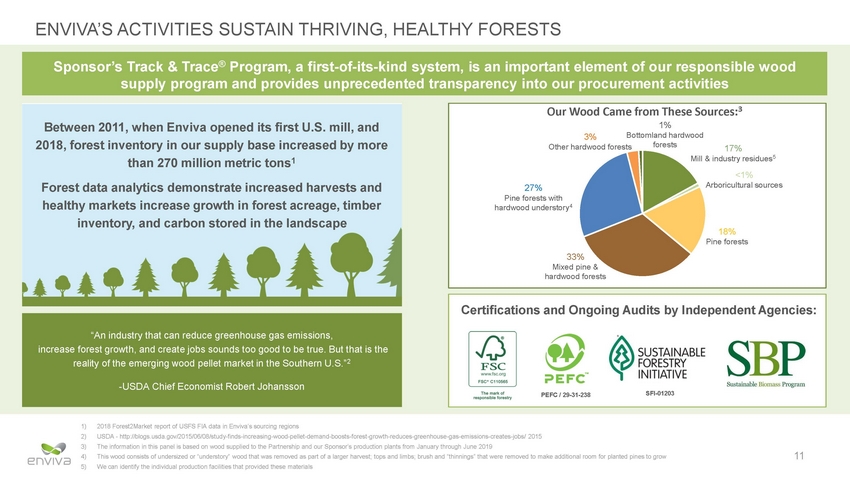
ENVIVA’S ACTIVITIES SUSTAIN THRIVING, HEALTHY FORESTS Between 2011, when Enviva opened its first U.S. mill, and 2018, forest inventory in our supply base increased by more than 270 million metric tons1 Forest data analytics demonstrate increased harvests and healthy markets increase growth in forest acreage, timber inventory, and carbon stored in the landscape 1) 2) 3) 4) 5) 2018 Forest2Market report of USFS FIA data in Enviva’s sourcing regions USDA - http://blogs.usda.gov/2015/06/08/study-finds-increasing-wood-pellet-demand-boosts-forest-growth-reduces-greenhouse-gas-emissions-creates-jobs/ 2015 The information in this panel is based on wood supplied to the Partnership and our Sponsor’s production plants from January through June 2019 This wood consists of undersized or “understory” wood that was removed as part of a larger harvest; tops and limbs; brush and “thinnings” that were removed to make additional room for planted pines to grow We can identify the individual production facilities that provided these materials 11 “An industry that can reduce greenhouse gas emissions, increase forest growth, and create jobs sounds too good to be true. But that is the reality of the emerging wood pellet market in the Southern U.S.”2 -USDA Chief Economist Robert Johansson Certifications and Ongoing Audits by Independent Agencies: PEFC / 29-31-238SFI-01203 Our Wood Came from These Sources:3 1% 3%Bottomland hardwood Other hardwood forestsforests17% Mill & industry residues5 <1% 27%Arboricultural sources Pine forests with hardwood understory4 18% Pine forests 33% Mixed pine & hardwood forests Sponsor’s Track & Trace® Program, a first-of-its-kind system, is an important element of our responsible wood supply program and provides unprecedented transparency into our procurement activities

SUPPLY GAP CREATED BY MULTIPLE HURDLES TO ENTRY Limited Supply Chain Infrastructure with reputable Fragmented Natural Resource Base term margin stability and Deep Process Capabilities Required Wood Aggregation Truck / Rail Loading Debarking & Chipping Size Reduction Wood Receiving & Storage Shipping Port Storage Drying Pelleting Commitment to Excellence in Safety, Sustainability & Reliability 12 Long-term, fixed-price shipping contracts logistics providers Off-take contract pricing escalators enable long-mitigate exposure to uncontrollable changes to cost position Plants strategically located in one of the most attractive wood fiber regions in the world Proximity to terminals results in low “to-port” transportation costs Cost-effective transportation due to ownership and/or control of ports

UNMATCHED GLOBAL SCALE PROVIDES DURABLE COMPETITIVE ADVANTAGES grade wood pellets in a highly fragmented operators Plants1 Enviva VERTICALLY-INTEGRATED source supplier for our customers 1)Enviva’s total production capacity and number of plants are based on nameplate capacities of our existing operating plants, planned capacity expansions at our Southampton and Northampton plants, and the estimated capacity of the Greenwood plant, the Lucedale plant, and the Epes plant. We expect to have the opportunity to acquire assets or completed development projects from our Sponsor or the Sponsor JV in the future. Production capacity and number of plants for other pellet producers are based on Hawkins Wright: The Outlook for Wood Pellets – Demand, Supply, Costs and Prices; 4th Quarter 2019 2)Although the Greenwood plant is included in the category of “under development / construction”, it is currently operational 13 Production Capacity1 (Thousand MTPY)05001,0001,5002,0002,5003,0003,5004,0004,5005,0005,5006,000# ofLocation 10U.S. GLOBAL ENTERPRISE SUPPLIERSGraanul Invest Pinnacle Renewable Energy 13Baltics 9Canada 3U.S. 1U.S. 1Vietnam 3U.S. As the world’s largest supplier of industrial1U.S. wood pellets, Enviva is frequently the sole-3Canada 1Brazil Current CapacityUnder development / construction or financed for completion by 20212 An Viet Phat FRAM Renewable Fuels SMALL & REGIONAL SUPPLIERSHighland Pellets Pacific Bioenergy Tanac SA Drax Biomass SUPPLIERSGeorgia Biomass (RWE) Enviva is the world’s largest publicly traded global enterprise supplier of utility-industry with numerous small, single-plant ▪A “build and copy” approach allows for highly efficient, large-scale production facilities and creates operating leverage ▪Multi-plant profile and global scale translate into superior reliability and opportunities for optimization ▪Access to robust fiber baskets allows for reliable raw material supply and a flat marginal cost curve for incremental production
Enviva’s Production Facility in Northampton, NC Advantaged Assets

STRATEGICALLY LOCATED PRODUCTION AND TERMINAL ASSETS ▪ Strategically located portfolio of ports by Enviva Storage: Dome storage with 90K metric by Enviva Location: Mobile, AL Plants Ports 1)Production capacities for the Northampton and Southampton plants do not include increased production capacity pursuant to ongoing expansion projects. We expect to commence the production ramp for the Northampton and Southampton plant expansions in the second and third quarters of 2020, respectively 2)The Partnership expects the Hamlet plant to reach its nameplate production capacity of approximately 600,000 MTPY by the end of 2020 15 Port of Panama City, FL Port of Mobile, AL Cottondale, FL Port of Wilmington, NC Sampson, NC Hamlet, NC Amory, MS Port of Chesapeake, VA Ahoskie, NC Wholly Owned Port of Chesapeake Location: Chesapeake, VA, wholly-owned Startup: November 2011 tons of capacity, and 2.5 million MTPY through-put capacity Port of Wilmington Location: Wilmington, NC, wholly-owned Startup: 2016 Storage: Dome storage with 90K metric tons of capacity, and 3 million MTPY through-put capacity Via 3rd-Party Agreements Port of Mobile Startup: 3rd Party Agreement Storage: Flex barge storage with 45K+ metric tons of capacity Port of Panama City Location: Panama City, FL Startup: 3rd Party Agreement Storage: Warehouse storage with 32K metric tons of capacity Amory Location: Amory, MS Startup: August 2010 (acquired) Annual Production: 120K MTPY Ahoskie Location: Ahoskie, NC Startup: November 2011 Annual Production: 415K MTPY Sampson Location: Sampson, NC Startup: November 2016 Annual Production: 555K MTPY, expected to increase to 600K MTPY during 2020 Cottondale Location: Cottondale, FL Startup: May 2008 (acquired) Annual Production: 760K MTPY Northampton1 Location: Northampton, NC Startup: April 2013 Annual Production: 550K MTPY Southampton1 Location: Southampton, VA Startup: October 2013 Annual Production: 545K MTPY Hamlet2 Location: Hamlet, NC Startup: June 2019 Annual Production expected to increase to 600K MTPY by the end of 2020 Northampton, NC ▪ Clusters of geographically dispersed, fully-contracted fleet of production plants providing optimal to-port logistics ▪ Build & copy design – leverages common processes and operational knowledge ▪ Large scale optimizes fixed-cost absorption Southampton, VA Storage and Terminaling Assets Production Plants – 3.5 million MTPY

STABLE FIBER COSTS AND STRUCTURAL FEEDSTOCK ADVANTAGE SOURCING 1) Source: All data except data for Brazil are from RISI World Timber Price Quarterly – July 2019 for the first quarter of 2019. The wood chip price for Latvia is based on CIF Sweden. Data for Brazil is from Forest2Market - the cost of delivered wood chips in Brazil is approximately US$41-$43 per green metric ton. The primary in-country market for these chips is the food production and crop industries, which use chips for heat and drying purposes. However, the average minimum FOB price in Brazil is around US$148 per dry metric ton due to the logistical and administrative costs related to exporting these chips; 2) Timber Mart South – North Carolina Q4 2019; 3) FIA Data (EVALIDator; 2017): in the last year where state forest inventory data is available, total wood fiber within the fiber sourcing area for the Partnership’s Northampton plant grew by approximately 29.6 million tons and total harvest removals were approximately 15.2 million tons, resulting in 14.4 million tons of excess fiber; 4) FIA Data 16 Million MT of Wood Inventory Million MT of Wood Inventory Million MT of Wood Inventory Million MT of Wood Inventory 430 640 620 REGION 600 560 15% 2010 2012 2014 2016 2018 REGION 530 14% 2010 2012 2014 2016 2018 1,050 REGION 900 800 $59$129 USJapan $50 2000 – 2019 North Carolina Pulpwood Fragmented, Natural Resource Supply Base ▪ 65,000+ private landowners ▪ 860 million+ tons of fiber ▪ 14 million+ tons net annual fiber excess3 ▪ 1 million tons annual facility demand ▪ Only a few buyers of low-grade fiber, which only cost-effectively Hardwood RoundwoodPine RoundwoodOpen / Farmlandtravels ~75 miles Net Fiber Growth After All Uses4 CHESAPEAKE 1,000 950 85020% 20102012201420162018 610 GULFWILMINGTON 590 SOURCINGSOURCING 570 550 580 510 540 Nor ampton mi. GREENWOOD SOURCING 420 REGION 410 400 390 9% 380 2010 2012 2014 2016 2018 Long-term, Stable Delivered Cost of Fiber2 US$ / green ton $40 $30 $20 $10 $0 '00 '01 '02 '03 '04 '05 '06 '07 '08 '09 '10 '11 '12 '13 '14 '15 '16 '17 '18 '19 '20 Structural Cost of Goods Sold Advantage1 Wood chip US$ / dry ton $119 Latvia $151 Germany Southern $148 Brazil
Barge-to-Ship Loading at Enviva’s Operations in Mobile, AL Contracted Position & Risk Mitigation

INCREASINGLY DIVERSE CUSTOMER BASE FURTHER ENHANCES STABILITY Lynemouth Drax Ichihara/Equis Marubeni Mitsubishi Engie 1)Includes base annual delivery quantity and excludes the impact of the Partnership, our Sponsor and the Sponsor JV’s option to increase or decrease the annual delivery quantity under the associated off-take contracts 2)As of February 1, 2020. Includes all volumes under the firm and contingent off-take contracts held by the Partnership, our Sponsor, and the Sponsor JV. Although the Partnership expects to have the opportunity to acquire these contracts from our Sponsor and the Sponsor JV, there can be no guarantee that we will acquire these, or any, contracts from our Sponsor or the Sponsor JV 18 2019 Off-Take Contract Mix2025 Off-Take Contract Mix1 Other Creditworthy Japanese Customers OtherToyota TsushoDrax Suzukawa Orsted Sumitomo Lynemouth MGT Engie Orsted ~3.6 million MTPY~6.7 million MTPY1 ~50% from Japanese customers with largest customer representing ~15% of the contract mix by 20251 13.8 Years2 weighted-average remaining term $19.6 Billion2 contracted revenue backlog

LONG-TERM, TAKE-OR-PAY OFF-TAKE CONTRACTS WITH PASSTHROUGH PROVISIONS RESULT IN PREDICTABLE CASH FLOWS $20 0 grade-rated trading houses pricing component $16 0 activities $12 0 $80 provides margin expansion $40 pricing matches al $0 Tradition al Pulpwo od 1)Note: off-take contract terms are examples of various provisions within our portfolio of contracts. No single contract in our portfolio contains every provision listed above 2)Not representative of all contracts with regard to stumpage and diesel passthroughs 19 Fixed, back to back shipping component with bunker fuel passthrough Fiber (“stumpage”) cost ~10% of sales price, driven by strong fiber basket in Southeast U.S. Shipping Indexed diesel mitigates fuel exposure from harvesting, inland transport, and processing Price escalators protect against erosion of underlying cost position and opportunity for Indexed stumpage underlying raw materi commodity cost to regional indices Diesel1 1 Base Price Stumpage1 Illustrative Passthroughs and Escalators2 Typical Contract Provisions1 Counterparty Major utilities and investment Term Up to 20 years Take-or-Pay Yes Termination Make-Whole Yes Margin Protection1 Price escalators Yes Fiber / diesel passthroughs Yes, in some contracts Shipping costs Fixed with matching long-term shipping contracts Bunker fuel passthrough Yes Changes in Law / Government Regulations Provisions designed to protect against changes in law / government regulations
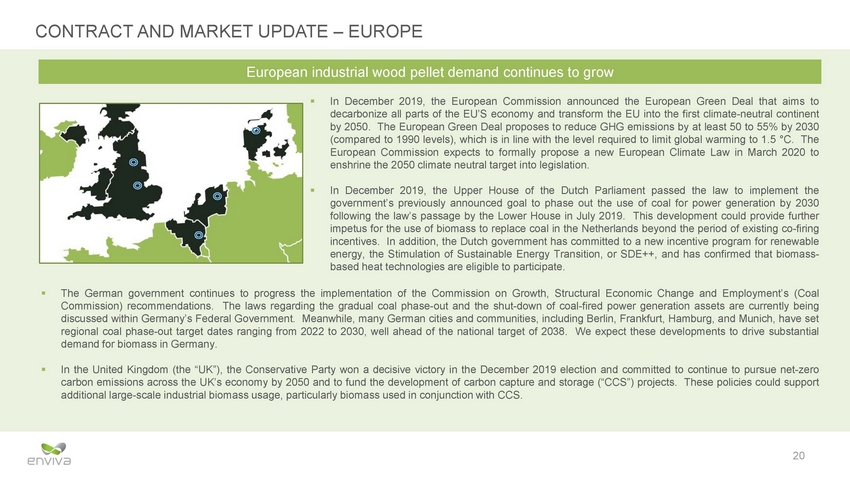
CONTRACT AND MARKET UPDATE – EUROPE ▪ In December 2019, the European Commission announced the European Green Deal that aims to decarbonize all parts of the EU’S economy and transform the EU into the first climate-neutral continent by 2050. The European Green Deal proposes to reduce GHG emissions by at least 50 to 55% by 2030 (compared to 1990 levels), which is in line with the level required to limit global warming to 1.5 °C. The European Commission expects to formally propose a new European Climate Law in March 2020 to enshrine the 2050 climate neutral target into legislation. ▪ In December 2019, the Upper House of the Dutch Parliament passed the law to implement the government’s previously announced goal to phase out the use of coal for power generation by 2030 following the law’s passage by the Lower House in July 2019. This development could provide further impetus for the use of biomass to replace coal in the Netherlands beyond the period of existing co-firing incentives. In addition, the Dutch government has committed to a new incentive program for renewable energy, the Stimulation of Sustainable Energy Transition, or SDE++, and has confirmed that biomass-based heat technologies are eligible to participate. ▪ The German government continues to progress the implementation of the Commission on Growth, Structural Economic Change and Employment’s (Coal Commission) recommendations. The laws regarding the gradual coal phase-out and the shut-down of coal-fired power generation assets are currently being discussed within Germany’s Federal Government. Meanwhile, many German cities and communities, including Berlin, Frankfurt, Hamburg, and Munich, have set regional coal phase-out target dates ranging from 2022 to 2030, well ahead of the national target of 2038. We expect these developments to drive substantial demand for biomass in Germany. ▪ In the United Kingdom (the “UK”), the Conservative Party won a decisive victory in the December 2019 election and committed to continue to pursue net-zero carbon emissions across the UK’s economy by 2050 and to fund the development of carbon capture and storage (“CCS”) projects. These policies could support additional large-scale industrial biomass usage, particularly biomass used in conjunction with CCS. 20 European industrial wood pellet demand continues to grow

CONTRACT AND MARKET UPDATE – ASIA AND REST OF WORLD ▪ On December 12, 2018, Japan’s METI announced that, as of June 2018, Japan’s operating biomass power generation capacity under its FiT scheme reached approximately 2.4 GWs. Coupled with additional FiT-approved biomass power generation capacity of 8.6 GWs, total biomass generation capacity under the FiT scheme reached 11.0 GWs. Although some approved capacity may be cancelled if developers fail to meet certain project development milestone requirements, the approved capacity is significantly above the country’s target of 6.0 to 7.5 GWs of biomass power by 2030. For reference, it would take at least 25.0 to 30.0 million metric tons of wood pellets annually to generate 10.0 GWs of biomass power. The Japanese government approved the country’s fifth Strategic Energy Plan prepared by METI. In addition to confirming renewable energy’s target share of 22 to 24 percent in Japan’s 2030 energy mix, the plan designated renewables, including biomass, as a main source of power generation, indicating a major shift in government policy that recognizes renewable energy’s role as a baseload power source. ▪ ▪ The Partnership and our Sponsor have now entered into firm and contingent long-term off-take contracts totaling over 3.4 million MTPY with major Japanese trading houses and energy companies. These include a 15-year, 180,000 MTPY contract between Mitsubishi Corporation and the Partnership, two 10-15 year contracts totaling 660,000 MTPY between Mitsubishi Corporation and our Sponsor, three 15-18 year contracts totaling 960,000 MTPY between Sumitomo Corporation and our Sponsor, two 10-15 year contracts totaling 280,000 MTPY between Marubeni Corporation and the Partnership, a 17-year contract between the Partnership and Toyota Tsusho Corporation with initial volumes of 100,000 MTPY for the first five years, increasing to 175,000 MTPY thereafter, a 17-year, 340,000 MTPY contract between Suzukawa Energy Center Ltd and our Sponsor, three 15-20 year contracts between major Japanese trading houses and energy companies and our Sponsor totaling 610,000 MTPY2, and a 20-year contract between Ichihara Yawatafuto Biomass Power GK and the Partnership totaling 270,000 MTPY2. All contracts are expected to commence between 2021 and 2024. The government of South Korea announced at the 2019 UN Climate Summit that it will shut down ten coal-fired power plants by 2022, which may drive a significant increase in biomass demand. ▪ 1)Hawkins Wright: The Outlook for Wood Pellets – Demand, Supply, Costs and Prices; 4th Quarter 2019. Wood pellet demand in Asia is expected to triple from 5.5 million MTPY in 2019 to 16.10 million MTPY in 2024 2)Subject to certain conditions precedent, which the Partnership expects to be met during the first half of 2020 21 Emerging demand in Asia expected to nearly triple to 16.1 million MTPY by 20241
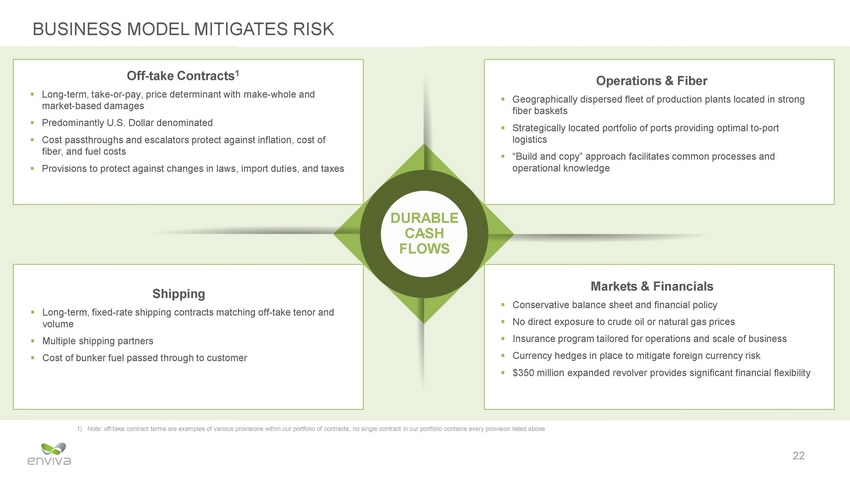
BUSINESS MODEL MITIGATES RISK Off-take Contracts1 Long-term, take-or-pay, price determinant with make-whole and market-based damages Predominantly U.S. Dollar denominated Cost passthroughs and escalators protect against inflation, cost of fiber, and fuel costs Provisions to protect against changes in laws, import duties, and taxes Operations & Fiber Geographically dispersed fleet of production plants located in strong fiber baskets Strategically located portfolio of ports providing optimal to-port logistics “Build and copy” approach facilitates common processes and operational knowledge ▪ ▪ ▪ ▪ ▪ ▪ ▪ DURABLE CASH FLOWS Markets & Financials Conservative balance sheet and financial policy No direct exposure to crude oil or natural gas prices Insurance program tailored for operations and scale of business Currency hedges in place to mitigate foreign currency risk $350 million expanded revolver provides significant financial flexibility Shipping Long-term, fixed-rate shipping contracts matching off-take tenor and volume Multiple shipping partners Cost of bunker fuel passed through to customer ▪ ▪ ▪ ▪ ▪ ▪ ▪ ▪ 1) Note: off-take contract terms are examples of various provisions within our portfolio of contracts; no single contract in our portfolio contains every provision listed above 22
env1va . ... Enviva's Port of Chesapeake terminal Substantial Growth Opportunities
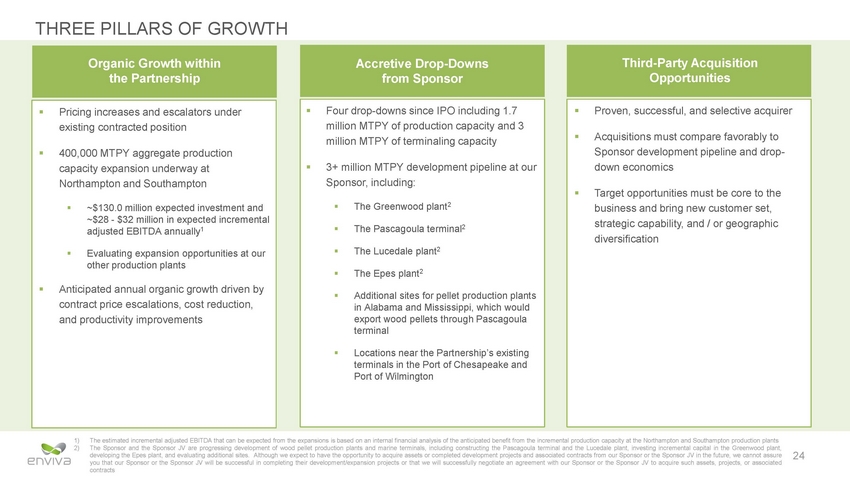
THREE PILLARS OF GROWTH in Alabama and Mississippi, which would 1)The estimated incremental adjusted EBITDA that can be expected from the expansions is based on an internal financial analysis of the anticipated benefit from the incremental production capacity at the Northampton and Southampton production plants 2)The Sponsor and the Sponsor JV are progressing development of wood pellet production plants and marine terminals, including constructing the Pascagoula terminal and the Lucedale plant, investing incremental capital in the Greenwood plant, developing the Epes plant, and evaluating additional sites. Although we expect to have the opportunity to acquire assets or completed development projects and associated contracts from our Sponsor or the Sponsor JV in the future, we cannot assure you that our Sponsor or the Sponsor JV will be successful in completing their development/expansion projects or that we will successfully negotiate an agreement with our Sponsor or the Sponsor JV to acquire such assets, projects, or associated contracts 24 Third-Party Acquisition Opportunities ▪Proven, successful, and selective acquirer ▪Acquisitions must compare favorably to Sponsor development pipeline and drop-down economics ▪Target opportunities must be core to the business and bring new customer set, strategic capability, and / or geographic diversification Accretive Drop-Downs from Sponsor ▪Four drop-downs since IPO including 1.7 million MTPY of production capacity and 3 million MTPY of terminaling capacity ▪3+ million MTPY development pipeline at our Sponsor, including: ▪The Greenwood plant2 ▪The Pascagoula terminal2 ▪The Lucedale plant2 ▪The Epes plant2 ▪Additional sites for pellet production plants export wood pellets through Pascagoula terminal ▪Locations near the Partnership’s existing terminals in the Port of Chesapeake and Port of Wilmington Organic Growth within the Partnership ▪Pricing increases and escalators under existing contracted position ▪400,000 MTPY aggregate production capacity expansion underway at Northampton and Southampton ▪~$130.0 million expected investment and ~$28 - $32 million in expected incremental adjusted EBITDA annually1 ▪Evaluating expansion opportunities at our other production plants ▪Anticipated annual organic growth driven by contract price escalations, cost reduction, and productivity improvements
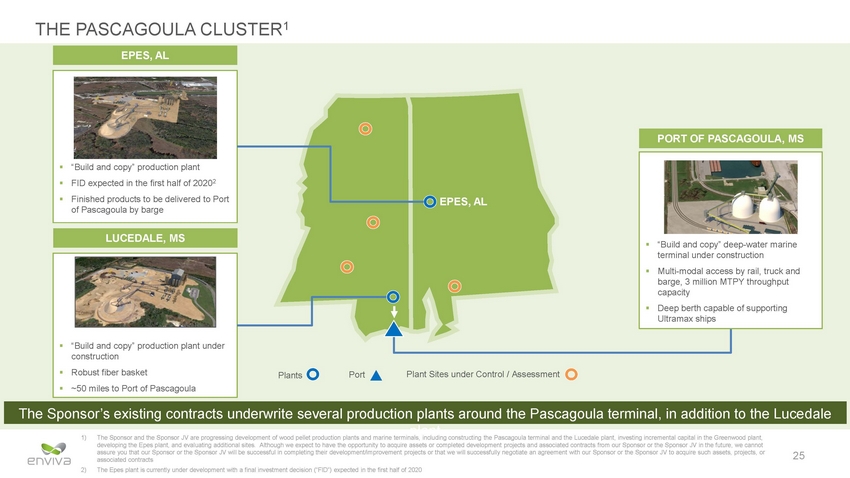
THE PASCAGOULA CLUSTER1 Plant Sites under Control / Assessment The Sponsor’s existing contracts underwrite several production plants around the Pascagoula terminal, in addition to the Lucedale 1)The Sponsor and the Sponsor JV are progressing development of wood pellet production plants and marine terminals, including constructing the Pascagoula terminal and the Lucedale plant, investing incremental capital in the Greenwood plant, developing the Epes plant, and evaluating additional sites. Although we expect to have the opportunity to acquire assets or completed development projects and associated contracts from our Sponsor or the Sponsor JV in the future, we cannot assure you that our Sponsor or the Sponsor JV will be successful in completing their development/improvement projects or that we will successfully negotiate an agreement with our Sponsor or the Sponsor JV to acquire such assets, projects, or associated contracts 2)The Epes plant is currently under development with a final investment decision (“FID”) expected in the first half of 2020 25 ▪ “Build and copy” production plant under construction ▪ Robust fiber basket ▪ ~50 miles to Port of Pascagoula PlantsPort LUCEDALE, MS EPES, AL ▪ “Build and copy” deep-water marine terminal under construction ▪ Multi-modal access by rail, truck and barge, 3 million MTPY throughput capacity ▪ Deep berth capable of supporting Ultramax ships PORT OF PASCAGOULA, MS ▪ “Build and copy” production plant ▪ FID expected in the first half of 20202 ▪ Finished products to be delivered to Port of Pascagoula by barge EPES, AL

PROSPECTIVE DROP-DOWNS GROWTH UNDERPINNED BY EXECUTED CONTRACTS AND POTENTIAL 1) This chart is for illustrative purposes and consists of estimates based on numerous assumptions made by us that are inherently uncertain and are subject to significant risks and uncertainties, which are difficult to predict and many of which are beyond our control. There can be no assurance that any of the estimates may prove to be correct. Actual results may differ materially; 2) As reported on February 26, 2020; 3) On February 26 2020, provided full-year 2020 guidance for net income to be in the range of 43.2 million to $53.2 million, adjusted EBITDA to be in the range of $165.0 million to $175.0 million, and distributable cash flow to be in the range of $119.0 million to $129.0 million, prior to any distributions attributable to incentive distribution rights paid to our general partner. Please see slide 41 for additional details on full-year guidance; 4) For an explanation of why we are unable to reconcile the estimated adjusted EBITDA for the Southampton / Northampton expansions to the most directly comparable GAAP financial measures, please see slide 42; 5) The estimated incremental adjusted EBITDA from a drop-down of a wood pellet production plant or a marine terminal represents the run-rate adjusted EBITDA that can be expected from such a facility, based on estimated production or terminaling capacity of such a facility upon achieving full run-rate and our Sponsor or the Sponsor JV’s existing contracts that may be associated with such a facility. The sequence of the drop-down transactions is for illustrative purposes only and subject to change. Although we expect to have the opportunity to acquire assets or completed development projects, including the Greenwood plant, the Lucedale plant, the Epes plant, and the Pascagoula terminal, from our Sponsor or the Sponsor JV in the future, we cannot assure you that our Sponsor or the Sponsor JV will be successful in completing their development / improvement projects or that we will successfully negotiate an agreement with our Sponsor or the Sponsor JV to acquire such assets or projects 26 Targeting annual organic growth in underlying base business even without drop-down acquisitions and plant expansions Illustrative Adj. EBITDA Growth1 Plant5 Plant 35 Greenwood orSponsor and the Sponsor JV contracts Greenwood or Southampton / Expansions4 under construction/expansion 2n d bar3rd b ar4th b ar5th b ar6th b ar7th b ar8th b ar9th b ar10th b ar 20192020 Fully contractedFuture Production potential to double 2019 adj. EBITDAPascagoula Cluster Epes Plant5 Pascagoula Terminal5 Plant Drop5 – Plant Drop5 -Lucedale Plantunderwrite several additional production plants $141.32 $165 - $1753 Lucedale Plant Northampton Two production facilities and a terminal ~$28 - $32 ~$20 - $30 ~$20 - $30 ~$10 - $15+ ~$25 - $35 ~$25 - $35 ~$25 - $35

DEVELOPMENT AND EXPANSION OPPORTUNITIES 1)Assets under control / assessment are shown at approximate locations 2)The estimated incremental adjusted EBITDA is based on an internal financial analysis of the anticipated benefit from the incremental production capacity at the Northampton and Southampton production plants. For an explanation of why we are unable to reconcile the estimated adjusted EBITDA for the expansions to the most directly comparable GAAP financial measures, please see slide 42 27 Production Capacity Expansion Underway at Southampton and Northampton Plants ▪ ~400,000 MTPY expected aggregate capacity expansion ▪ ~$28 - $32 million in expected incremental adjusted EBITDA annually2 ▪ ~$130 million expected investment in additional production assets and emissions control equipment ▪ Expanded production ramp for the Northampton and Southampton plants expected to begin in the second and third quarters of 2020, respectively Sponsor’s Development Pipeline – “Build and Copy” Approach Greenwood, SC Lucedale, MSPort of Jacksonville, FL Port of Pascagoula, MS Plants in the PartnershipPorts in or leased by the Partnership Plants under construction / expansionPorts under construction/expansion Plant sites under control / assessment1 Port sites under control / assessment1
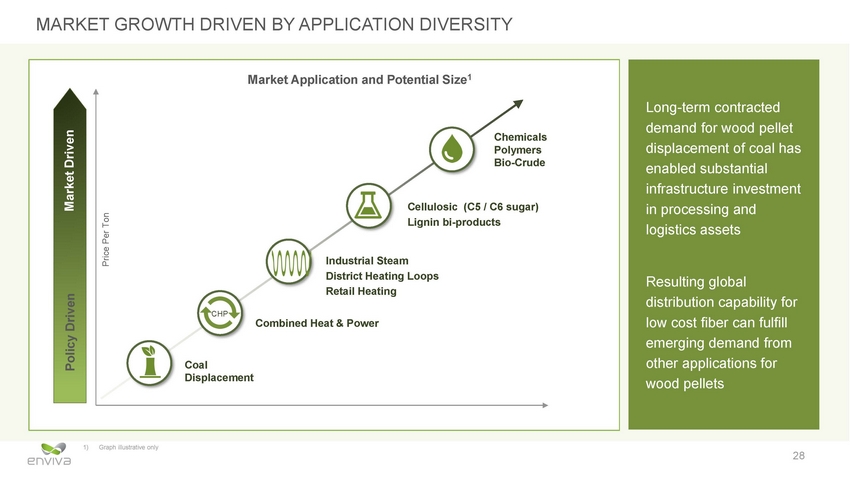
MARKET GROWTH DRIVEN BY APPLICATION DIVERSITY 1)Graph illustrative only 28 Market Driven Policy Driven Price Per Ton Long-term contracted demand for wood pellet displacement of coal has enabled substantial infrastructure investment in processing and logistics assets Resulting global distribution capability for low cost fiber can fulfill emerging demand from other applications for wood pellets Future Market Application and Potential Size1 Chemicals Polymers Bio-Crude Cellulosic (C5 / C6 sugar) Lignin bi-products Industrial Steam District Heating Loops Retail Heating CHP Combined Heat & Power Coal Displacement
Night Shift at Enviva Pellets Northampton Financial Highlights 29
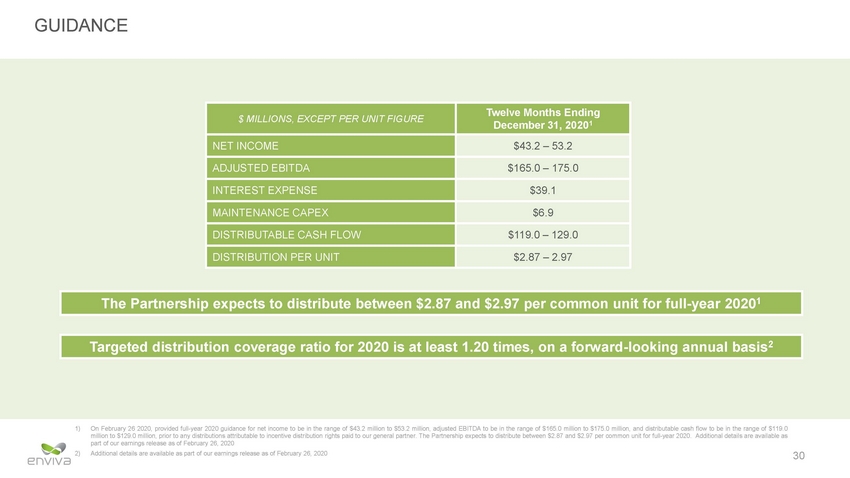
GUIDANCE December 31, 20201 1)On February 26 2020, provided full-year 2020 guidance for net income to be in the range of $43.2 million to $53.2 million, adjusted EBITDA to be in the range of $165.0 million to $175.0 million, and distributable cash flow to be in the range of $119.0 million to $129.0 million, prior to any distributions attributable to incentive distribution rights paid to our general partner. The Partnership expects to distribute between $2.87 and $2.97 per common unit for full-year 2020. Additional details are available as part of our earnings release as of February 26, 2020 2)Additional details are available as part of our earnings release as of February 26, 2020 30 Targeted distribution coverage ratio for 2020 is at least 1.20 times, on a forward-looking annual basis2 The Partnership expects to distribute between $2.87 and $2.97 per common unit for full-year 20201 $ MILLIONS, EXCEPT PER UNIT FIGURE Twelve Months Ending NET INCOME $43.2 – 53.2 ADJUSTED EBITDA $165.0 – 175.0 INTEREST EXPENSE $39.1 MAINTENANCE CAPEX $6.9 DISTRIBUTABLE CASH FLOW $119.0 – 129.0 DISTRIBUTION PER UNIT $2.87 – 2.97
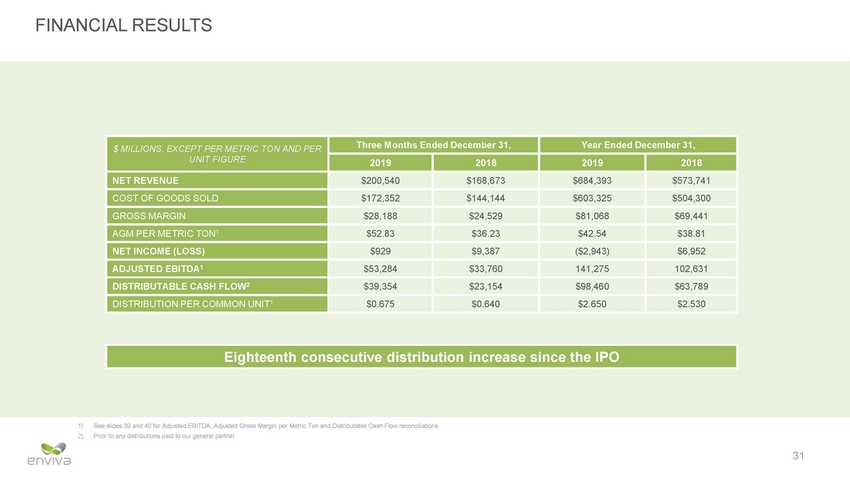
FINANCIAL RESULTS nded December 31, cember 31, 1)See slides 39 and 40 for Adjusted EBITDA, Adjusted Gross Margin per Metric Ton and Distributable Cash Flow reconciliations 2)Prior to any distributions paid to our general partner 31 Eighteenth consecutive distribution increase since the IPO $ MILLIONS, EXCEPT PER METRIC TON AND PER UNIT FIGURE Three Months E 2019 Year Ended De 2019 2018 2018 NET REVENUE $200,540 $168,673 $684,393 $573,741 COST OF GOODS SOLD $172,352 $144,144 $603,325 $504,300 GROSS MARGIN $28,188 $24,529 $81,068 $69,441 AGM PER METRIC TON1 $52.83 $36.23 $42.54 $38.81 NET INCOME (LOSS) $929 $9,387 ($2,943) $6,952 ADJUSTED EBITDA1 $53,284 $33,760 141,275 102,631 DISTRIBUTABLE CASH FLOW2 $39,354 $23,154 $98,460 $63,789 DISTRIBUTION PER COMMON UNIT1 $0.675 $0.640 $2.650 $2.530

Tool and Die Work at Enviva’s Production Plant in Ahoskie, NC Experienced Team
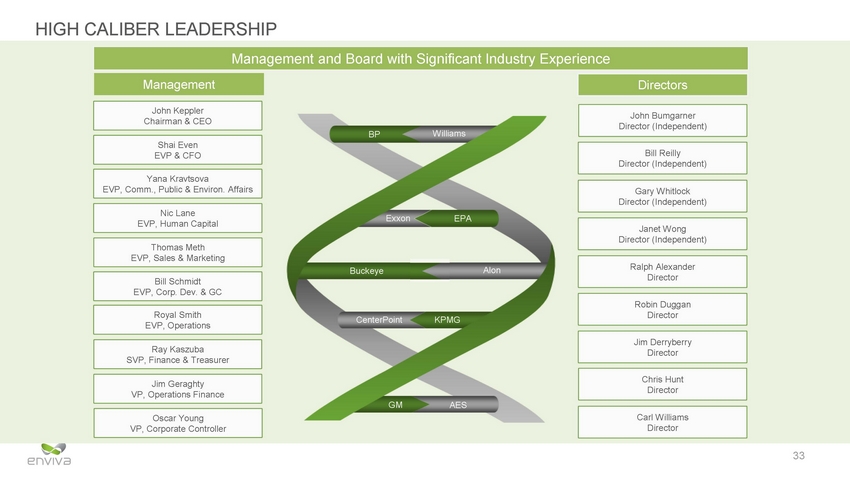
HIGH CALIBER LEADERSHIP John Keppler Chairman & CEO John Bumgarner Director (Independent) Williams BP Shai Even EVP & CFO Bill Reilly Director (Independent) Yana Kravtsova EVP, Comm., Public & Environ. Affairs Gary Whitlock Director (Independent) Nic Lane EVP, Human Capital Exxon EPA Janet Wong Director (Independent) Thomas Meth EVP, Sales & Marketing Ralph Alexander Director Buckeye Alon Bill Schmidt EVP, Corp. Dev. & GC Robin Duggan Director Royal Smith EVP, Operations CenterPoint KPMG Jim Derryberry Director Ray Kaszuba SVP, Finance & Treasurer Chris Hunt Director Jim Geraghty VP, Operations Finance GM AES Carl Williams Director Oscar Young VP, Corporate Controller 33 Management and Board with Significant Industry Experience Directors Management
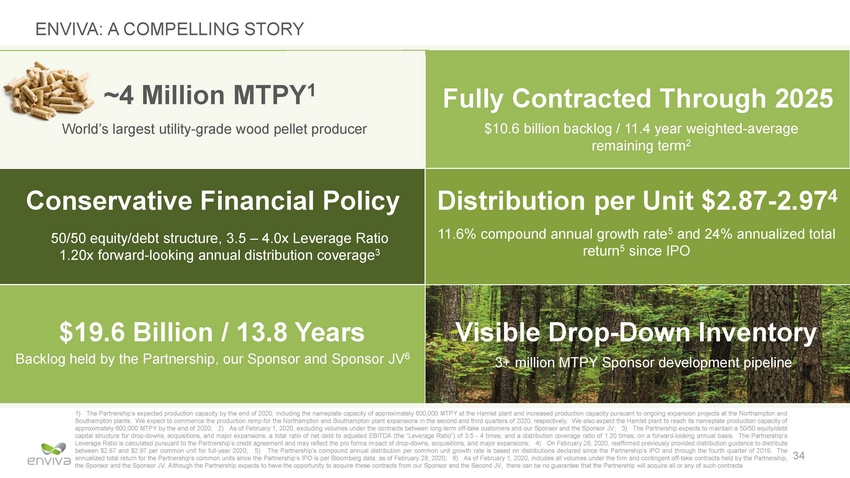
ENVIVA: A COMPELLING STORY return5 since IPO Southampton plants. We expect to commence the production ramp for the Northampton and Southampton
plant expansions in the second and third quarters of 2020, respectively. We also expect the Hamlet plant to reach its nameplate production capacity of approximately 600,000 MTPY by the end of 2020; 2) As of February 1, 2020, excluding volumes under the contracts between long-term off-take customers and our Sponsor and the Sponsor JV; 3) The Partnership expects to maintain a 50/50 equity/debt capital structure for drop-downs, acquisitions, and major expansions, a total ratio of net debt to adjusted EBITDA (the “Leverage Ratio”) of 3.5 - 4 times, and a distribution coverage ratio of 1.20 times, on a forward-looking annual basis. The Partnership’s Leverage Ratio is calculated pursuant to the Partnership’s credit agreement and may reflect the pro forma impact of drop-downs, acquisitions, and major expansions; 4) On February 26, 2020, reaffirmed previously provided distribution guidance to distribute between $2.87 and $2.97 per common unit for full-year 2020; 5) The Partnership’s compound annual distribution per common unit growth rate is based on distributions declared since the Partnership’s IPO and through the fourth quarter of 2019. The annualized total return for the Partnership’s common units since the Partnership’s IPO is per Bloomberg data, as of February 28, 2020; 6) As of February 1, 2020, includes all volumes under the firm and contingent off-take contracts held by the Partnership, the Sponsor and the Sponsor JV. Although the Partnership expects to have the opportunity to acquire these contracts from our Sponsor and the Second JV, there can be no guarantee that the Partnership will acquire all or any of such contracts 34 ~4 Million MTPY1 World’s largest utility-grade wood pellet producer Fully Contracted Through 2025 $10.6 billion backlog / 11.4 year weighted-average remaining term2 Conservative Financial Policy 50/50 equity/debt structure, 3.5 – 4.0x Leverage Ratio 1.20x forward-looking annual distribution coverage3 Distribution per Unit $2.87-2.974 11.6% compound annual growth rate5 and 24% annualized total $19.6 Billion / 13.8 Years Backlog held by the Partnership, our Sponsor and Sponsor JV6 1) The Partnership’s expected production capacity by the end of 2020, including the nameplate capacity of approximately 600 Visible Drop-Down Inventory 3+ million MTPY Sponsor development pipeline ,000 MTPY at the Hamlet plant and increased production capacity pursuant to ongoing expansion projects at the Northampton and

env1va WAY Financial Information & Reg G Reconciliations

NON-GAAP FINANCIAL MEASURES This presentation contains certain financial measures that are not presented in accordance with GAAP. Although they should not be considered alternatives to the GAAP presentation of the financial results of the Partnership, management views such non-GAAP measures as important to reflect the Partnership’s actual performance during the periods presented. Non-GAAP Financial Measures We use adjusted net income, adjusted gross margin per metric ton, adjusted EBITDA and distributable cash flow to measure our financial performance. Adjusted Net Income We define adjusted net income as net income excluding certain expenses incurred related to a fire that occurred at our Chesapeake terminal on February 27, 2018 (the “Chesapeake Incident”) and Hurricanes Florence and Michael (the “Hurricane Events”), which occurred during the second half of 2018, consisting of emergency response expenses, expenses related to the disposal of inventory, and asset disposal and repair costs, offset by insurance recoveries received, as well as employee compensation and other related costs allocated to us in respect of the Chesapeake Incident and Hurricane Events pursuant to our management services agreement with an affiliate of our sponsor for services that could otherwise have been dedicated to our ongoing operations, certain non-cash waivers of fees for management services provided to us by our sponsor (collectively, the “MSA Fee Waivers”), interest expense associated with incremental borrowings related to the Chesapeake Incident and Hurricane Events, and early retirement of debt obligation and including certain sales and marketing, scheduling, sustainability, consultation, shipping and risk management services (collectively, the “Commercial Services”). We believe that adjusted net income enhances investors’ ability to compare the past financial performance of our underlying operations with our current performance separate from certain items of gain or loss that we characterize as unrepresentative of our ongoing operations. 36

NON-GAAP FINANCIAL MEASURES (CONT.) Adjusted Gross Margin per Metric Ton We define adjusted gross margin per metric ton as gross margin per metric ton excluding asset disposals, depreciation and amortization, changes in unrealized derivative instruments related to hedged items included in gross margin, MSA Fee Waivers, certain items of income or loss that we characterize as unrepresentative of our ongoing operations, including certain expenses incurred related to the Chesapeake Incident and Hurricane Events, consisting of emergency response expenses, expenses related to the disposal of inventory, and asset disposal and repair costs, offset by insurance recoveries received, as well as employee compensation and other related costs allocated to us in respect of the Chesapeake Incident and the Hurricane Events pursuant to our management services agreement with an affiliate of our sponsor for services that could otherwise have been dedicated to our ongoing operations, and acquisition costs and including the Commercial Services. We believe adjusted gross margin per metric ton is a meaningful measure because it compares our revenue-generating activities to our operating costs for a view of profitability and performance on a per metric ton basis. Adjusted gross margin per metric ton will primarily be affected by our ability to meet targeted production volumes and to control direct and indirect costs associated with procurement and delivery of wood fiber to our production plants and the production and distribution of wood pellets. Adjusted EBITDA We define adjusted EBITDA as net (loss) income excluding depreciation and amortization, interest expense, income tax expense, early retirement of debt obligations, MSA Fee Waivers, non-cash unit compensation expense, asset impairments and disposals, changes in unrealized derivative instruments related to hedged items included in gross margin and other income and expense, certain items of income or loss that we characterize as unrepresentative of our ongoing operations, including certain expenses incurred related to the Chesapeake Incident and Hurricane Events, consisting of emergency response expenses, expenses related to the disposal of inventory, and asset disposal and repair costs, offset by insurance recoveries received, as well as employee compensation and other related costs allocated to us in respect of the Chesapeake Incident and Hurricane Events pursuant to our management services agreement with an affiliate of our sponsor for services that could otherwise have been dedicated to our ongoing operations, and acquisition costs and including the Commercial Services. Adjusted EBITDA is a supplemental measure used by our management and other users of our financial statements, such as investors, commercial banks and research analysts, to assess the financial performance of our assets without regard to financing methods or capital structure. 37

NON-GAAP FINANCIAL MEASURES (CONT.) Distributable Cash Flow We define distributable cash flow as adjusted EBITDA less maintenance capital expenditures and interest expense net of amortization of debt issuance costs, debt premium, original issue discounts, interest expense on the redemption of our 8.5% senior unsecured notes due 2021 and the impact from incremental borrowings related to the Chesapeake Incident and Hurricane Events. We use distributable cash flow as a performance metric to compare the cash-generating performance of the Partnership from period to period and to compare the cash-generating performance for specific periods to the cash distributions (if any) that are expected to be paid to our unitholders. We do not rely on distributable cash flow as a liquidity measure. Limitations of Non-GAAP Measures Adjusted net income, adjusted gross margin per metric ton, adjusted EBITDA and distributable cash flow are not financial measures presented in accordance with accounting principles generally accepted in the United States (“GAAP”). We believe that the presentation of these non-GAAP financial measures provides useful information to investors in assessing our financial condition and results of operations. Our non-GAAP financial measures should not be considered as alternatives to the most directly comparable GAAP financial measures. Each of these non-GAAP financial measures has important limitations as an analytical tool because they exclude some, but not all, items that affect the most directly comparable GAAP financial measures. You should not consider adjusted net income, adjusted gross margin per metric ton, adjusted EBITDA or distributable cash flow in isolation or as substitutes for analysis of our results as reported under GAAP. Our definitions of these non-GAAP financial measures may not be comparable to similarly titled measures of other companies, thereby diminishing their utility. 38

NON-GAAP FINANCIAL MEASURES RECONCILIATION The following table provides a reconciliation of distributable cash flow and adjusted EBITDA to net income (loss): See Note 1 of our financial statements, Description of Business and Basis of Presentation, to our Annual Report on the 10-K and slide 36 through 38 for basis of presentation. $929 $9,387 ($2,943) $6,952 $15,834 $10,643 $9,042 $3,851 $1,575 $2,541 $5,940 ($1,210) $11,505 $9,334 $751 $51,581 $39,344 $9,042 $22,600 $5,410 $3,103 $4,588 ($1,155) $5,566 $4,139 $141,275 $40,745 $36,471 $751 $625 $1,486 ($3,282} $3,952 $2 $6,229 $2,386 ($4,032} $12,951 $178 $4,139 $53,284 $33,760 $102,631 $4,579 $1,620 $6,922 $4,872 $9,351 $8,986 $35,893 $33,970 $39,354 $3,289 $36,065 $22,683 $23,154 $1,671 $21,483 $17,007 $98,460 $11,439 $87,021 $88,761 $63,789 $5,867 $57,922 $67,012 LESS: DISTRIBUTABLE CASH FLOW ATTRIBUTABLE TO INCENTIVE DISTRIBUTION RIGHTS 1) Includes a) $4.2 million of incremental costs incurred during the first quarter of 2019, which are unrepresentative of our ongoing operations, in connection with our evaluation of the potential purchase of a third-party wood pellet production plant (the "Potential Target"). When we commenced our review, the Potential Target had recently returned to operations following an extended shutdown during a bankruptcy proceeding with the intent of demonstrating favorable operations prior to conducting an auction sale process; however, the Potential Target had not yet established a logistics chain through a viable export terminal, given that the terminal through which the plant historically had exported was not operational at the time and was not reasonably certain to become operational in the future. Accordingly, as part of our diligence of the Potential Target, we developed an alternative logistics chain to bring the Potential Target's wood pellets to market and began purchasing the production of the Potential Target for a trial period. The incremental costs associated with the establishment and evaluation of this new logistics chain primarily consist of barge, freight, trucking, storage, and shiploading services. We have completed our evaluation of the alternative logistics chain and determined it is not viable; consequently, we do not expect to incur additional costs of this nature in the future; and b) $1. 2 million in costs incurred during the first and second quarters of 2019 related to the Partnership's acquisition of all of the Class B units of Enviva Wilmington Holdings, LLC, which owns the Hamlet plant, in April 2019 (the "Hamlet Drop-Down") 39 CASH DISTRIBUTIONS DECLARED ATTRIBUTABLE TO ENVIVA PARTNERS. LP LIMITED PARTNERS DISTRIBUTABLE CASH FLOW ATTRIBUTABLE TO ENVIVA PARTNERS,LP LIMITED PARTNERS MAINTENANCE CAPITAL EXPENDITURES INTEREST EXPENSE. NET OF AMORTIZATION OF DEBT ISSUANCE COSTS. DEBT PREMIUM COSTS. ORIGINAL ISSUE DISCOUNT, INTEREST EXPENSE ON THE REDEMPTION OF THE 2021 NOTES, AND IMPACT FROM INCREMENTAL BORROWINGS RELATED TO CHESAPEAKE INCIDENT AND HURRICANE EVENTS DISTRIBUTABLE CASH FLOW ATTRIBUTABLE TO ENVIVA PARTNERS,LP CHANGES IN FAIR VALUE OF DERIVATIVE INSTRUMENTS CHESAPEAKE INCIDENT AND HURRICANE EVENTS 1 ACQUISITION COSTS COMMERCIAL SERVICES ADJUSTED EBITDA LESS ASSET IMPAIRMENTS AND DISPOSALS NON-CASH UNIT COMPENSATION EXPENSE INTEREST EXPENSE EARLY RETIREMENT OF DEBT OBLIGATION MSA FEE WAIVERS DEPRECIATION AND AMORTIZATION ADD: NET INCOME (LOSS) 2018 2019 2018 2019 RECONCIUATION OF NET INCOME (LOSS) TO ADJUSTED EBITDA AND DISTRIBUTABLE CASH FLOW Year Ended December 31, Three Months Ended December 31,

NON-GAAP FINANCIAL MEASURES RECONCILIATION (CONT.) The following table provides a reconciliation of gross margin to adjusted gross margin per metric ton: See Note 1 of our financial statements, Description of Business and Basis of Presentation, to our Annual Report on the 10-K and slide 36 through 38 for basis of presentation. 40 RECONCILIATION OF GROSS MARGIN TO ADJUSTED GROSS MARGIN PER METRIC TON: (In thousands, except per metric ton) Three Months Ended December 31, Year Ended December 31, 2019 2018 2019 2018 GROSS MARGIN $28,188 $24,529 $81,068 $69,441 LOSS ON DISPOSAL OF ASSETS $2,541 $1,486 $3,103 $2,386 DEPRECIATION AND AMORTIZATION $15,409 $11,379 $50,521 $40,179 CHANGES IN THE FAIR VALUE OF DERIVATIVE INSTRUMENTS $5,940 ($3,282) $4,588 ($4,032) MSA FEE WAIVERS - - $5,000 - CHESAPEAKE INCIDENT AND HURRICANE EVENTS ($1,210) ($2,446) ($1,085) $7,799 ACQUISITION COSTS ($6) - $4,296 - COMMERCIAL SERVICES $4,139 - $4,139 - ADJUSTED GROSS MARGIN $55,001 $31,666 $151,630 $115,773 METRIC TONS SOLD 1,041 874 3,564 2,983 ADJUSTED GROSS MARGIN PER METRIC TON $52.83 $36.23 $42.54 $38.81

2020 GUIDANCE DECEMBER 31,2020 $43.2-53.2 $65.8 $40.8 $7.7 $3.0 $2.5 $2.0 $165.0 - 175.0 1 $39.1 $6.9 $119.0 - 129.0 1) Expected $2.5 million of MSA Fee Waivers during the first and second quarter of 2020, in connection with the Hamlet Drop-Down, where the sponsor agreed to waive such fees that otherwise
would be owed by the Partnership until June 30,2020 41 ESTIMATED DISTRIBUTABLE CASH FLOW MAINTENANCE CAPITAL EXPENDITURES INTEREST EXPENSE NET OF AMORTIZATION OF DEBT ISSUANCE COSTS, DEBT PREMIUM, AND ORIGINAL ISSUE DISCOUNT LESS: ESTIMATED ADJUSTED EBITDA OTHER NON-CASH EXPENSES ASSET IMPAIRMENTS AND DISPOSALS MSA FEE WAIVERS NON-CASH UNIT COMPENSATION EXPENSE INTEREST EXPENSE DEPRECIATION AND AMORTIZATION ADD: ESTIMATED NET INCOME TWELVE MONTHS ENDING
NON-GAAP FINANCIAL MEASURES RECONCILIATION This presentation contains an estimate of (i) the net income and adjusted EBITDA the Hamlet plant will generate once the plant reaches its full production capacity, (ii) the incremental adjusted EBITDA our Sponsor and the Sponsor JV’s wood pellet production plants and marine terminal currently under development will generate on a run-rate basis, incremental adjusted EBITDA that our Southampton and Northampton plants will generate from the planned expansions at Southampton and Northampton production plants (the “Mid-Atlantic Expansions”). Presentation of estimated net income and reconciliations of estimated incremental adjusted EBITDA for potential drop-downs of any wood pellet production plant or marine terminal from our Sponsor or the Sponsor JV to the closest GAAP financial measure, net income, are not provided because the estimate of net income to be generated by the potential drop-downs of such wood pellet production plants or marine terminal is not available without unreasonable effort, in part because the amount of estimated incremental interest expense related to the financing of such assets is not available at this time. In addition, a presentation of estimated net income and a reconciliation of the estimated incremental adjusted EBITDA expected to be generated by the Mid-Atlantic Expansions to the closest GAAP financial measure, net income, are not provided because estimate of net income expected to be generated by the expansions is not available without unreasonable effort, in part because the amount of estimated incremental interest expense related to the financing of the expansions and depreciation are not available at this time. Our estimates of net income and / or adjusted EBITDA for such assets and project are based on numerous assumptions that are inherently uncertain and subject to significant business, economic, financial, regulatory, and competitive risks and uncertainties that could cause actual results and amounts to differ materially from those estimates. For more information about such significant risks and uncertainties, please see the risk factors discussed or referenced in our filings with the Securities and Exchange Commission (the “SEC”), including the Annual Report on Form 10-K and the Quarterly Reports on Form 10-Q most recently filed with the SEC. 42
env1va Contact: Ray Kaszuba Senior Vice President,Finance and Treasurer +1240-482-3856 ir@envivapartners.com