UNITED STATES
SECURITIES AND EXCHANGE COMMISSION
Washington, D.C. 20549
FORM N-CSR
CERTIFIED SHAREHOLDER REPORT OF REGISTERED
MANAGEMENT INVESTMENT COMPANIES
Investment Company Act file number 811-22961
EA Series Trust
(Exact name of registrant as specified in charter)
19 E. Eagle Road
Havertown, PA 19083
(Address of principal executive offices) (Zip code)
19 E. Eagle Road
Havertown, PA 19083
(Name and address of agent for service)
215-882-9983
Registrant’s telephone number, including area code
Date of fiscal year end: September 30, 2023
Date of reporting period: September 30, 2023
Item 1. Reports to Stockholders.
Freedom 100 Emerging Markets ETF
Annual Report
September 30, 2023
FREEDOM 100 EMERGING MARKETS ETF
TABLE OF CONTENTS
i
FREEDOM 100 EMERGING MARKETS ETF
| | | | | | | | |
| LETTER TO SHAREHOLDERS |
| SEPTEMBER 30, 2023 |
Dear Freedom 100 Emerging Markets ETF Shareholders,
Thank you for your investment in the Freedom 100 Emerging Markets ETF (“FRDM” or the “Fund”). The information presented in this letter relates to the operations of the Fund for its fiscal year ending September 30, 2023 (“FY 2023”).
FRDM seeks to track the Freedom 100 Emerging Markets Index (‘FRDM index”). The index uses a freedom-weighting methodology to capture exposure to the freest emerging markets (EMs), based on third-party quantitative personal and economic freedom metrics.
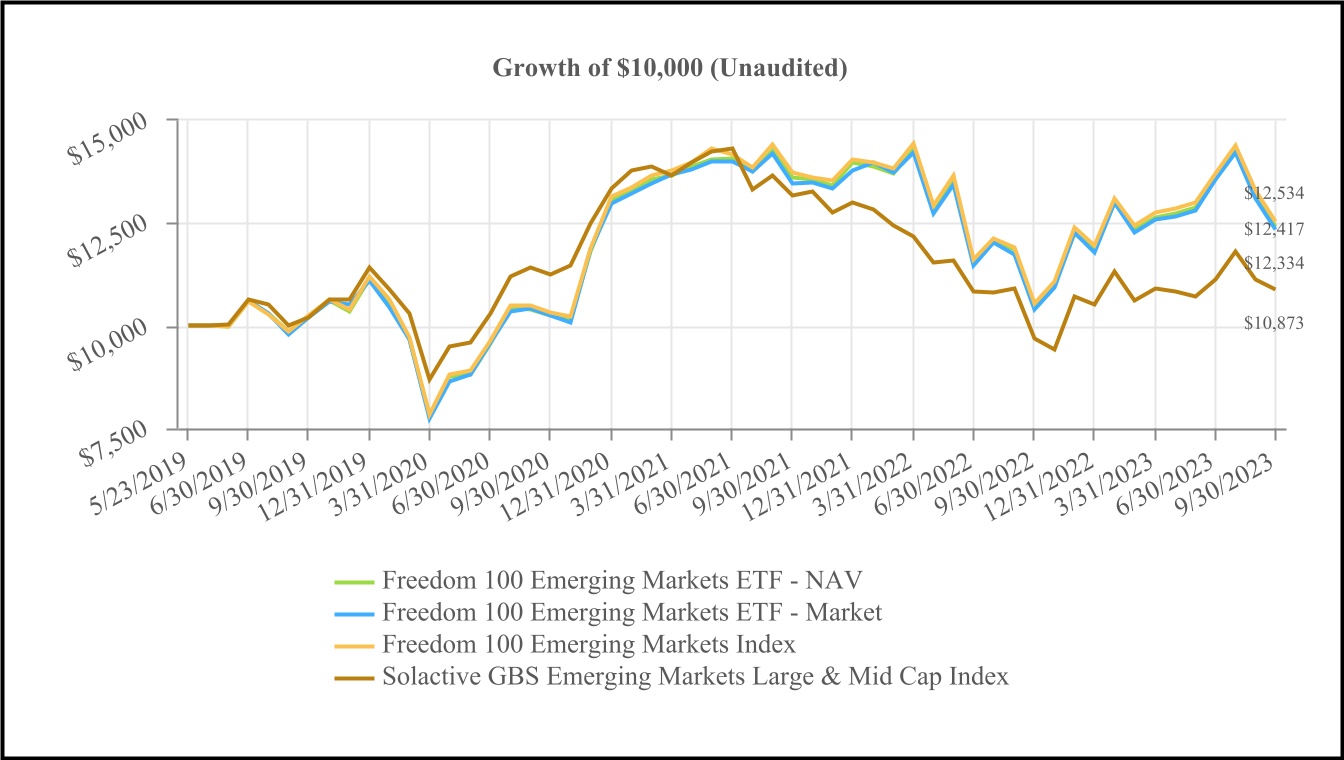
For FY 2023, FRDM was up 18.69% at its market price and up 18.42% at net asset value (NAV). The FRDM Index was up 18.98% for FY 2023. For FY 2023, FRDM outperformed the Solactive GBS Emerging Markets Large & Mid Cap Index, which was up 12.31%.
The best and worst performing securities based on their contribution to the Fund’s return over FY 2023 are listed below, taking into consideration both the performance and the weighting of each security.
For FY 2023, the security with the largest positive impact on the Fund’s performance (based on its weighted return) during the period was Bank Pekao Sa, which was up 97.72%. The second best performing security was Samsung Electronics Co Ltd., which was up 39.89% during the period. The third best performing security for the period was Taiwan Semiconductor-Sp Adr, which was up 29.31% during the period.
The worst performing security in the Fund’s portfolio during the period was Impala Platinum Holdings Ltd., which was down 42.14%. The second worst performing security was Quimica Y Minera Chil-Sp Adr, which was down 28.42% for the period. The third worst performing security was Nan Ya Plastics Corp., which was down 13.5% for the period.
Please note, returns of the best/worst performers cited above reflect the returns of the stocks during the time period held by the Fund, which was not necessary for the entire fiscal period.
FRDM distributed income to shareholders on an annual basis.
We appreciate your continued investment in the Fund.
Sincerely,
/s/ Patrick R. Cleary
Patrick R. Cleary
Chief Executive Officer
Empowered Funds, LLC dba EA Advisers
FREEDOM 100 EMERGING MARKETS ETF
| | | | | | | | |
| LETTER TO SHAREHOLDERS |
| SEPTEMBER 30, 2023 |
INDICES
The Freedom 100 Emerging Markets Index is a freedom-weighted emerging markets equity index. The Index is designed to track the performance of a portfolio of approximately 100 equity securities listed in emerging market countries. The index does not incur any management fees, transaction costs, or expenses. The index is unmanaged and one cannot invest directly in the index.
The Solactive GBS Emerging Markets Large & Mid Cap Index is part of the Solactive Global Benchmark Series. The index intends to track the performance of the large and mid-cap segment covering approximately the largest 85% of the free-float market capitalization in the Emerging Markets. It is calculated as a Net Total Return index in USD and weighted by free-float market capitalization.
Fund holdings and allocations are subject to change at any time and should not be considered a recommendation to buy, hold or sell any security. Please see the Schedule of Investments in this report for complete Fund holdings.
Shares are bought and sold at market price (not at net asset value, (“NAV”)), and are not individually redeemed from the Fund. Market price returns are based upon the midpoint of the bid/ask spread at the close of the exchange and does not represent the returns an investor would receive if shares were traded at other times. Brokerage commissions will reduce returns. NAVs are calculated using prices as of the close of regular trading on the exchange, normally 4:00 p.m. Eastern Time.
Opinions expressed are subject to change at any time, are not guaranteed and should not be considered investment advice.
Any offering must be preceded or accompanied by a prospectus.
RISKS
The performance data quoted represents past performance. Past performance does not guarantee future results. The investment return and principal value of an investment will fluctuate so that an investor's shares, when redeemed, may be worth more or less than their original cost and current performance may be lower or higher than the performance quoted. For the most recent month-end performance, please call (215) 882-9983 or visit the Fund's website at freedeometfs.com.
Investments involve risk. Principal loss is possible. Freedom 100 Emerging Markets ETF is subject to the same risks as the underlying securities.
Non-diversification Risk. Because the Fund is non-diversified, it may be more sensitive to economic, business, political or other changes affecting individual issuers or investments than a diversified fund, which may result in greater fluctuation in the value of the Fund’s Shares and greater risk of loss.
Freedom Style Risk. The Fund’s freedom style investment strategy limits the types and number of investment opportunities available and, as a result, may underperform other emerging markets funds that do not have a freedom focus. In addition, the Index Provider may be unsuccessful in creating an index composed only of companies in countries that benefit from significant personal and economic freedoms
Quantitative Management Risk. Investments utilizing quantitative methods may perform differently than the market as a result of characteristics and data used and changes in trends.
Foreign Security Risk. Investments in foreign securities involve political, economic and currency risks, greater volatility and differences in accounting methods. These risks are magnified for emerging markets.
Small- and Mid-Cap Company Risk. Investments in small- and mid-cap companies involve limited liquidity and greater volatility than larger companies.
FREEDOM 100 EMERGING MARKETS ETF
| | | | | | | | |
| LETTER TO SHAREHOLDERS (CONTINUED) |
| SEPTEMBER 30, 2023 |
Tracking Error Risk. As with all index funds, the performance of the Fund and its Index may differ from each other for a variety of reasons, including Fund operating expenses and portfolio transaction costs not incurred by an index and the Fund may not be fully invested in securities of its index or may hold securities not included in the index.
Distributed by Quasar Distributors, LLC.
FREEDOM 100 EMERGING MARKETS ETF
| | | | | | | | | | | | | | | | | | | | |
| | | | Average Annual Return* |
| | | | | | Since Inception |
| | | | 1 Year | 3 Year | (May 23, 2019) |
| Freedom 100 Emerging Markets ETF - NAV | | 18.42% | 6.65% | 5.09% |
| Freedom 100 Emerging Markets ETF - Market | | 18.69% | 6.44% | 5.09% |
| Freedom 100 Emerging Markets Index | 18.98% | 6.69% | 5.32% |
| Solactive GBS Emerging Markets Large & Mid Cap Index | 12.31% | -1.07% | 1.94% |
| | | | | | |
| See “Index Overview” section for a description of the Index. | | | |
| | | | | | |
*This chart assumes an initial gross investment of $10,000 made on May 23, 2019. Returns shown include the dividends. Past performance does not guarantee future results. The graph and table do not reflect the deduction of taxes that a shareholder would pay on Fund distributions or the redemption of Fund shares. Investment return and principal value will fluctuate, so that your shares, when redeemed, may be worth more or less than the original cost. |
|
|
|
FREEDOM 100 EMERGING MARKETS ETF
Tabular Presentation of Schedule of Investments
As of September 30, 2023 (Unaudited)
| | | | | | | | |
Sector1 | | % of Net Assets |
| Information Technology | | 28.1%² |
| Financials | | 25.1%² |
| Materials | | 12.0% |
| Consumer Staples | | 8.6% |
| Consumer Discretionary | | 7.3% |
| Communication Services | | 7.3% |
| Industrials | | 6.2% |
| Energy | | 2.7% |
| Health Care | | 0.9% |
| Utilities | | 0.8% |
| Real Estate | | 0.5% |
| Other³ | | 0.5% |
| Total | | 100.0% |
| | | | | |
| 1 | Sector designations may be different than the sector designations presented in other Fund materials. The sector designations may represent the investment adviser’s internal sector classifications. |
| 2 | For purposes of the Fund’s compliance with its concentration limits, the Fund uses various sub-classifications and none of the Fund’s holdings in the sub-classifications exceed 25% of the Fund’s total assets. |
| 3 | Cash, cash equivalents, short-term investments and other assets less liabilities. |
INDEX OVERVIEW
SEPTEMBER 30, 2023 (UNAUDITED)
Freedom 100 Emerging Markets Index
The Freedom 100 Emerging Markets Index is designed to track the performance of a portfolio of approximately 100 equity securities in emerging market countries. Country inclusion and weights are determined based on third-party quantified data covering 83 personal and economic freedom variables. Variables can be categorized into three main types of freedom metrics: civil freedom (such as absence of terrorism, human trafficking, torture, disappearances and detainments), political freedom (such as rule of law, due process, freedom of the press, freedom of expression, freedom of religion, and freedom of assembly), and economic freedom (such as marginal tax rates, access to international trade, business regulations, soundness of the money supply, and size of government).
Solactive GBS Emerging Markets Large & Mid Cap Index
Solactive GBS Emerging Markets Large & Mid Cap Index intends to track the performance of the large- and mid-cap segment covering approximately the largest 85% of the free-float market capitalization in the Emerging Markets.
| | |
| Freedom 100 Emerging Markets ETF |
| Schedule of Investments |
| September 30, 2023 |
| | | | | | | | | | | | | | |
| Shares | | | | Value |
| COMMON STOCKS - 98.4% | | |
| Brazil - 4.4% | | | | |
| 1,369,521 | | B3 S.A. - Brasil Bolsa Balcao | | $ | 3,343,053 | |
| 488,578 | | Banco Santander Brasil S.A. ADR (a) | | 2,506,405 | |
| 163,835 | | Localiza Rent a Car S.A. | | 1,913,263 | |
| 207,399 | | Rede D'Or Sao Luiz S.A. (b) | | 1,049,260 | |
| 185,773 | | Suzano S.A. | | 1,998,708 | |
| 990,183 | | Vale S.A. | | 13,294,894 | |
| 351,327 | | WEG S.A. | | 2,539,957 | |
| | | | 26,645,540 | |
| Chile - 17.4% | | | | |
| 206,817,389 | | Banco de Chile | | 21,059,929 | |
| 339,050 | | Banco de Credito e Inversiones S.A. | | 8,682,179 | |
| 5,640,670 | | Cencosud S.A. | | 10,695,469 | |
| 267,396 | | Cia Cervecerias Unidas S.A. ADR | | 3,369,190 | |
| 85,648,634 | | Cia Sud Americana de Vapores S.A. | | 5,137,087 | |
| 32,650,082 | | Colbun S.A. | | 4,445,687 | |
| 5,140,556 | | Empresas CMPC S.A. | | 9,464,315 | |
| 1,733,219 | | Empresas Copec S.A. | | 12,287,492 | |
| 4,568,797 | | Falabella S.A. | | 10,209,550 | |
| 350,946 | | Sociedad Quimica y Minera de Chile S.A. ADR (a) | | 20,940,948 | |
| | | | 106,291,846 | |
| Indonesia - 4.6% | | | |
| 7,124,630 | | Adaro Energy Indonesia Tbk PT | | 1,313,827 | |
| 29,416,285 | | Bank Central Asia Tbk PT | | 16,797,070 | |
| 14,765,790 | | Barito Pacific Tbk PT | | 1,242,027 | |
| 4,070,535 | | Charoen Pokphand Indonesia Tbk PT (c) | | 1,428,835 | |
| 8,096,934 | | Elang Mahkota Teknologi Tbk PT | | 306,484 | |
| 369,281,810 | | GoTo Gojek Tokopedia Tbk PT (c) | | 2,030,990 | |
| 10,777,758 | | Kalbe Farma Tbk PT | | 1,223,873 | |
| 6,717,220 | | Merdeka Copper Gold Tbk PT (c) | | 1,251,737 | |
| 12,139,255 | | Sarana Menara Nusantara Tbk PT | | 754,040 | |
| 9,706,198 | | Sumber Alfaria Trijaya Tbk PT | | 1,858,968 | |
| | | | 28,207,851 | |
| Malaysia - 4.6% | | | |
| 3,450,287 | | Axiata Group Bhd | | 1,829,767 | |
| 2,201,557 | | CelcomDigi Bhd | | 2,049,050 | |
| 421,291 | | Hong Leong Bank Bhd | | 1,749,678 | |
| 1,975,105 | | IOI Corp. Bhd | | 1,674,228 | |
| 358,902 | | Kuala Lumpur Kepong Bhd | | 1,635,803 | |
| 1,606,966 | | Maxis Bhd | | 1,382,704 | |
| 400,302 | | PPB Group Bhd | | 1,319,775 | |
| 2,623,596 | | Press Metal Aluminium Holdings Bhd | | 2,631,838 | |
|
| The accompanying notes are an integral part of these financial statements. |
| | |
| Freedom 100 Emerging Markets ETF |
| Schedule of Investments (Continued) |
| September 30, 2023 |
| | | | | | | | | | | | | | |
| Shares | | | | Value |
| 10,656,508 | | Public Bank Bhd | | $ | 9,214,722 | |
| 5,098,164 | | Sime Darby Plantation Bhd | | 4,647,280 | |
| | | | 28,134,845 | |
| Mexico - 3.5% | | | | |
| 3,242,006 | | America Movil S.A.B. de C.V. | | 2,799,724 | |
| 105,338 | | Arca Continental S.A.B. de C.V. | | 959,662 | |
| 376,781 | | Becle S.A.B. de C.V. | | 899,821 | |
| 22,747 | | Fomento Economico Mexicano S.A.B. de C.V. ADR | | 2,482,835 | |
| 4,142 | | Grupo Aeroportuario del Sureste S.A.B. de C.V. ADR | | 1,017,731 | |
| 324,664 | | Grupo Bimbo S.A.B. de C.V. - Class A | | 1,560,772 | |
| 13,400 | | Grupo Elektra S.A.B. de C.V. (c) | | 886,011 | |
| 727,721 | | Grupo Financiero Banorte S.A.B. de C.V. | | 6,099,452 | |
| 459,030 | | Grupo Financiero Inbursa S.A.B. de C.V. (c) | | 902,388 | |
| 724,554 | | Grupo Mexico S.A.B. de C.V. - Class B | | 3,424,144 | |
| | | | 21,032,540 | |
| Philippines - 2.2% | | |
| 90,894 | | ACEN Corp. | | 7,888 | |
| 90,679 | | Ayala Corp. | | 1,000,136 | |
| 2,389,739 | | Ayala Land, Inc. | | 1,243,952 | |
| 777,341 | | Bank of the Philippine Islands | | 1,538,854 | |
| 726,938 | | BDO Unibank, Inc. | | 1,823,255 | |
| 12,588 | | Globe Telecom, Inc. | | 398,937 | |
| 407,889 | | International Container Terminal Services, Inc. | | 1,493,824 | |
| 1,373,197 | | JG Summit Holdings, Inc. | | 924,753 | |
| 109,541 | | Manila Electric Co. | | 712,512 | |
| 187,382 | | SM Investments Corp. | | 2,793,706 | |
| 3,237,288 | | SM Prime Holdings, Inc. | | 1,733,771 | |
| | | | 13,671,588 | |
| Poland - 15.2% | | | | |
| 477,611 | | Alior Bank S.A. (c) | | 5,663,134 | |
| 1,144,185 | | Bank Polska Kasa Opieki S.A. | | 26,439,627 | |
| 213,700 | | CCC S.A. (c) | | 1,908,730 | |
| 345,705 | | CD Projekt S.A. | | 9,907,469 | |
| 910,162 | | Cyfrowy Polsat S.A. (c) | | 2,517,782 | |
| 244,043 | | Dino Polska S.A. (a)(c) | | 19,831,130 | |
| 89,560 | | KRUK S.A. | | 8,487,253 | |
| 5,938 | | LPP S.A. | | 17,669,990 | |
| | | | 92,425,115 | |
| Republic of Korea - 19.2% | | |
| 50,886 | | Hyundai Motor Co. | | 7,206,399 | |
| 101,027 | | Kakao Corp. | | 3,290,453 | |
| 88,159 | | Kia Corp. | | 5,318,025 | |
| 16,841 | | LG Chem Ltd. | | 6,196,500 | |
| 48,943 | | NAVER Corp. | | 7,308,444 | |
|
| The accompanying notes are an integral part of these financial statements. |
| | |
| Freedom 100 Emerging Markets ETF |
| Schedule of Investments (Continued) |
| September 30, 2023 |
| | | | | | | | | | | | | | |
| Shares | | | | Value |
| 98,131 | | POSCO Holdings, Inc. ADR (a) | | $ | 10,058,427 | |
| 6,610 | | Samsung Biologics Co., Ltd. (a)(c) | | 3,335,860 | |
| 1,016,830 | | Samsung Electronics Co., Ltd. | | 51,542,294 | |
| 17,765 | | Samsung SDI Co., Ltd. | | 6,740,537 | |
| 188,809 | | SK Hynix, Inc. | | 16,048,905 | |
| | | | 117,045,844 | |
| South Africa - 5.0% | | |
| 295,246 | | Absa Group Ltd. | | 2,726,235 | |
| 41,582 | | Capitec Bank Holdings Ltd. | | 3,769,377 | |
| 1,924,991 | | FirstRand Ltd. | | 6,492,635 | |
| 305,431 | | Gold Fields Ltd. ADR | | 3,316,981 | |
| 332,586 | | Impala Platinum Holdings Ltd. | | 1,736,553 | |
| 625,128 | | MTN Group Ltd. | | 3,725,923 | |
| 189,023 | | Sasol Ltd. ADR | | 2,583,944 | |
| 1,014,698 | | Sibanye Stillwater Ltd. | | 1,566,495 | |
| 477,139 | | Standard Bank Group Ltd. | | 4,629,826 | |
| | | | 30,547,969 | |
| Taiwan - 21.9% | | | | |
| 4,735,144 | | Cathay Financial Holding Co., Ltd. | | 6,534,926 | |
| 2,293,451 | | Chunghwa Telecom Co., Ltd. | | 8,241,518 | |
| 1,069,358 | | Delta Electronics, Inc. | | 10,749,730 | |
| 1,160,890 | | Formosa Petrochemical Corp. | | 2,898,584 | |
| 2,166,884 | | Formosa Plastics Corp. | | 5,356,712 | |
| 4,133,052 | | Fubon Financial Holding Co., Ltd. | | 7,771,758 | |
| 6,302,425 | | Hon Hai Precision Industry Co., Ltd. | | 20,304,896 | |
| 830,901 | | MediaTek, Inc. | | 18,918,921 | |
| 2,812,887 | | Nan Ya Plastics Corp. | | 5,803,450 | |
| 541,276 | | Taiwan Semiconductor Manufacturing Co., Ltd. ADR | | 47,036,884 | |
| | | | 133,617,379 | |
| United Kingdom - 0.4% | | |
| 140,976 | | Anglogold Ashanti PLC ADR | | 2,227,421 | |
| | TOTAL COMMON STOCKS (Cost $644,361,156) | | 599,847,938 | |
| | | | |
| PREFERRED STOCKS - 1.1% | | |
| Brazil - 1.1% | | | | |
| 818,667 | | Banco Bradesco S.A. ADR | | 2,333,201 | |
| 171,686 | | Gerdau S.A. ADR | | 818,942 | |
| 621,137 | | Itau Unibanco Holding S.A. ADR | | 3,335,506 | |
| | TOTAL PREFERRED STOCKS (Cost $6,670,501) | | 6,487,649 | |
| | | | |
| RIGHTS - 0.0% (d) | | |
| Brazil - 0.0% (d) | | | |
| 1,201 | | Localiza Rent a Car S.A. (c) | | 4,278 | |
|
| The accompanying notes are an integral part of these financial statements. |
| | |
| Freedom 100 Emerging Markets ETF |
| Schedule of Investments (Continued) |
| September 30, 2023 |
| | | | | | | | | | | | | | |
| Shares | | | | Value |
| Chile - 0.0% (d) | | | | |
| 49,942 | | Banco de Credito e Inversiones S.A. (c) | | $ | 41,786 | |
| | TOTAL RIGHTS (Cost $2,286) | | 46,064 | |
| | | | |
INVESTMENTS PURCHASED WITH PROCEEDS FROM SECURITIES LENDING - 2.2% | | |
| 13,135,705 | | First American Government Obligations Fund - Class X, 5.26% (e) | | 13,135,705 | |
| | TOTAL INVESTMENTS PURCHASED WITH PROCEEDS FROM SECURITIES LENDING (Cost $13,135,705) | | 13,135,705 | |
| | | | |
| MONEY MARKET FUNDS - 0.1% | | |
| 404,241 | | First American Government Obligations Fund - Class X, 5.26% (e) | | 404,241 | |
| | TOTAL MONEY MARKET FUNDS (Cost $404,241) | | 404,241 | |
| | | | |
| | TOTAL INVESTMENTS (Cost $664,573,889) - 101.8% | | 619,921,597 | |
| | Other Liabilities in Excess of Assets - (1.8%) | | (10,791,165) | |
| | TOTAL NET ASSETS - 100.0% | | $ | 609,130,432 | |
Percentages are stated as a percent of net assets.
ADR - American Depositary Receipt
PLC- Public Limited Company
| | | | | | | | |
| (a) | This security or a portion of this security was out on loan as of September 30, 2023. Total loaned securities had a market value of $12,979,059 or 2.1% of net assets as of September 30, 2023. |
| (b) | 144A restricted security. |
| (c) | Non-income producing security. |
| (d) | Represents less than 0.05% of net assets. |
| (e) | Rate shown is the 7-day effective yield. |
The accompanying notes are an integral part of these financial statements.
FREEDOM 100 EMERGING MARKETS ETF
STATEMENT OF ASSETS AND LIABILITIES
September 30, 2023
| | | | | | | | |
| | | |
| Assets: | | |
Investments in securities, at value (1) | | $ | 619,921,597 | |
| Foreign currencies, at value | | 1,502,786 | |
| Dividends and interest receivable | | 984,191 | |
| Cash | | 78,071 | |
| Securities lending income receivable (Note 4) | | 31,456 | |
| Total assets | | 622,518,101 | |
| Liabilities: | | |
| Due to securities lending agent (Note 4) | | 13,135,705 | |
| Accrued investment advisory fees | | 251,964 | |
| Total liabilities | | 13,387,669 | |
| Net Assets | | $ | 609,130,432 | |
| | | |
| Net Assets Consist of: | | |
| Paid-in capital | | $ | 665,904,937 | |
| Total distributable earnings (accumulated deficit) | | (56,774,505) | |
| Net Assets: | | $ | 609,130,432 | |
| | |
| Calculation of Net Asset Value Per Share: | | |
| Net Assets | | $ | 609,130,432 | |
| Shares Outstanding (unlimited shares of beneficial interest authorized, no par value) | | 21,550,000 | |
| Net Asset Value per Share | | $ | 28.27 | |
| | |
| Cost of Investments in Securities | | $ | 664,573,889 | |
| Cost of Foreign Currency | | $ | 1,474,928 | |
(1) Includes loaned securities with a value of | | $ | 12,979,059 | |
The accompanying notes are an integral part of these financial statements.
FREEDOM 100 EMERGING MARKETS ETF
STATEMENT OF OPERATIONS
For the Year Ended September 30, 2023
| | | | | | | | |
| | | |
| Investment Income: | | |
| Dividend income (net of foreign withholding tax of $4,044,373) | | $ | 15,415,171 | |
| Securities lending income, net (Note 4) | | 171,787 |
| Interest income | | 97,791 |
| Total investment income | | 15,684,749 |
| | |
| Expenses: | | |
| Investment advisory fees | | 2,095,168 |
| Overdraft fees expense | | 613 |
| Net expenses | | 2,095,781 | |
| | |
| Net Investment Income/(Loss) | | 13,588,968 | |
| | |
| Realized and Unrealized Gain/(Loss) on Investments: | | |
| Net realized gain/(loss) on: | | |
| Investments | | (6,608,244) | |
| Foreign currency | | (28,310) |
| | (6,636,554) | |
| Net change in unrealized appreciation/(depreciation) on: | | |
| Investments | | 17,369,440 | |
| Foreign currency | | (33,711) |
| | 17,335,729 | |
| Net realized and unrealized appreciation/(depreciation) on investments: | | 10,699,175 |
| Net Increase/(Decrease) in Net Assets Resulting from Operations | | 24,288,143 | |
The accompanying notes are an integral part of these financial statements.
FREEDOM 100 EMERGING MARKETS ETF
STATEMENT OF CHANGES IN NET ASSETS
| | | | | | | | | | | | | | |
| | Year Ended September 30, 2023 | | Year Ended September 30, 2022 |
| Increase (Decrease) in Net Assets from: | | | | |
| Operations: | | | | |
| Net investment income/(loss) | | $ | 13,588,968 | | | $ | 6,489,561 | |
| Net realized gain/(loss) on investments & foreign currency | | (6,636,554) | | 1,349,929 |
| Net change in unrealized appreciation/(depreciation) on investments & foreign currency | | 17,335,729 | | (63,941,088) |
| Net realized and unrealized gain/(loss) on investments: | | 24,288,143 | | (56,101,598) |
| | | | | |
| Distributions to Shareholders: | | | | |
| Distributable earnings | | (19,049,112) | | (1,623,628) |
| Total distributions to shareholders | | (19,049,112) | | (1,623,628) |
| | | | | |
| Capital Share Transactions: | | | | |
| Proceeds from shares sold | | 418,679,520 | | 171,834,400 |
| Payments for shares redeemed | | (22,228,200) | | (8,473,925) |
| Transaction fees (See Note 1) | | 857,045 | | 334,309 |
| Net increase in net assets derived from net change in capital share transactions | | 397,308,365 | | 163,694,784 |
| Net Increase in Net Assets | | 402,547,396 | | 105,969,558 |
| Net Assets: | | | | |
| Beginning of period | | 206,583,036 | | 100,613,478 |
| End of period | | $ | 609,130,432 | | | $ | 206,583,036 | |
| | | | |
| Changes in Shares Outstanding: | | | | |
| Shares outstanding, beginning of period | | 8,250,000 | | 3,050,000 |
| Shares sold | | 14,050,000 | | 5,450,000 |
| Shares repurchased | | (750,000) | | (250,000) |
| Shares outstanding, end of period | | 21,550,000 | | 8,250,000 |
The accompanying notes are an integral part of these financial statements.
FREEDOM 100 EMERGING MARKETS ETF
FINANCIAL HIGHLIGHTS
For the Year Ended September 30, 2023
| | | | | | | | | | | | | | | | | | | | | | | | | | | | | | | | | | | | | | | | | | | | |
| Net Asset Value, Beginning of Period | Net Investment Income(1) | Net Realized and Unrealized Gain (Loss) on Investments | Net Increase (Decrease) in Net Asset Value Resulting from Operations | Distributions from Net Investment Income | Distributions from Realized Gains | Total Distributions | Transaction Fees (See Note 1) | Net Asset Value, End of Period | Total Return(2) | Net Assets, End of Period (000's) | Net Expenses(3)(4) | Net Investment Income(3) | Portfolio Turnover Rate(5)(8) |
| Year Ended September 30, 2023 | $25.04 | 0.94 | 3.60 | 4.54 | (1.32) | (0.05) | (1.37) | 0.06 | $28.27 | 18.42% | $ | 609,130 | | 0.49% | 3.18% | 15% |
| Year Ended September 30, 2022 | $32.99 | 1.22 | (8.73) | (7.51) | (0.48) | (0.02) | (0.50) | 0.06 | $25.04 | (22.96%) | $ | 206,583 | | 0.49% | 3.99% | 8% |
| Year Ended September 30, 2021 | $25.07 | 0.82 | 7.33 | 8.15 | (0.35) | - | (0.35) | 0.12 | $32.99 | 32.97% | $ | 100,613 | | 0.49% | 2.49% | 22% |
| Year Ended September 30, 2020 | $25.33 | 0.34 | (0.31) | 0.03 | (0.31) | - | (0.31) | 0.02 | $25.07 | 0.25% | $ | 20,058 | | 0.49% | 1.40% | 19% |
May 23, 2019 (6) to September 30, 2019 | $25.00 | 0.31 | 0.19 | 0.50 | (0.20) | - | (0.20) | 0.03 | $25.33 | 2.11% | $ | 12,663 | | 0.49% | 3.42% | 0% (7) |
| | | | | | | | |
| (1) | Net investment income per share represents net investment income divided by the daily average shares of beneficial interest outstanding throughout the period. |
| (2) | All returns reflect reinvested dividends, if any, but do not reflect the impact of taxes. Total return for a period of less than one year is not annualized. |
| (3) | For periods of less than one year, these ratios are annualized. |
| (4) | Net expenses include effects of any reimbursement or recoupment. |
| (5) | Portfolio turnover is not annualized and is calculated without regard to short-term securities having a maturity of less than one year. |
| (6) | Commencement of operations. |
| (7) | Rounds to less than 0.05%. |
| (8) | Excludes impact of in-kind transactions. |
The accompanying Notes to the Financial Statements are an integral part of these Financial Statements.
FREEDOM 100 EMERGING MARKETS ETF
NOTES TO THE FINANCIAL STATEMENTS
SEPTEMBER 30, 2023
NOTE 1 – ORGANIZATION
Freedom 100 Emerging Markets ETF (the “Fund”) is a series of the EA Series Trust (the “Trust”), which was organized as a Delaware statutory trust on October 11, 2013. The Trust is registered with the Securities and Exchange Commission (“SEC”) under the Investment Company Act of 1940, as amended (the “1940 Act”), as an open-end management investment company and the offering of the Fund’s shares (“Shares”) is registered under the Securities Act of 1933, as amended (the “Securities Act”). The Fund is considered non-diversified under the 1940 Act. The Fund commenced operations on May 23, 2019. The Fund qualifies as an investment company as defined in the Financial Accounting Standards Codification Topic 946-Financial Services- Investment Companies. The Fund’s investment objective is to seek to track the total return performance, before fees and expenses, of the Freedom 100 Emerging Markets Index (the “Index”).
Shares of the Fund are listed and traded on Cboe BZX Exchange, Inc. (“Cboe”). Market prices for the shares may be different from their net asset value (“NAV”). The Fund issues and redeems shares on a continuous basis at NAV only in blocks of 50,000 shares, called “Creation Units.” Creation Units are issued and redeemed principally in-kind for securities included in a specified universe. Once created, shares generally trade in the secondary market at market prices that change throughout the day in share amounts less than a Creation Unit. Except when aggregated in Creation Units, shares are not redeemable securities of the Fund. Shares of the Fund may only be purchased or redeemed by certain financial institutions (“Authorized Participants”). An Authorized Participant is either (i) a broker-dealer or other participant in the clearing process through the Continuous Net Settlement System of the National Securities Clearing Corporation or (ii) a DTC participant and, in each case, must have executed a Participant Agreement with the Distributor. Most retail investors do not qualify as Authorized Participants nor have the resources to buy and sell whole Creation Units. Therefore, they are unable to purchase or redeem the shares directly from the Fund. Rather, most retail investors may purchase shares in the secondary market with the assistance of a broker and are subject to customary brokerage commissions or fees.
Authorized Participants may be required to pay a transaction fee to compensate the Trust or its custodian for costs incurred in connection with creation and redemption transactions. The standard transaction fee, which is payable to the Trust’s custodian, typically applies to in-kind purchases of the Fund effected through the clearing process on any business day, regardless of the number of Creation Units purchased or redeemed that day (“Standard Transaction Fees”). Variable fees are imposed to compensate the Fund for the transaction costs associated with the cash transactions fees. Certain fund deposits consisting of cash-in-lieu or cash value may be subject to a variable charge (“Variable Transaction Fees”), which is payable to the Fund, of up to 2.00% of the value of the order in addition to the Standard Transaction Fees. Variable Transaction Fees received by the Fund, if any, are displayed in the Capital Share Transactions sections of the Statements of Changes in Net Assets.
Because, among other things, the Fund imposes transaction fees on purchases and redemptions of Shares to cover the custodial and other costs incurred by the Fund in effecting trades, the Board determined that it is not necessary to adopt policies and procedures to detect and deter market timing of the Fund’s Shares.
FREEDOM 100 EMERGING MARKETS ETF
NOTES TO THE FINANCIAL STATEMENTS (CONTINUED)
NOTE 2 – SIGNIFICANT ACCOUNTING POLICIES
The following is a summary of significant accounting policies consistently followed by the Fund. These policies are in conformity with accounting principles generally accepted in the United States of America (“GAAP”).
| | | | | | | | |
| A. | Security Valuation. Equity securities that are traded on a national securities exchange, except those listed on the NASDAQ Global Market® (“NASDAQ”) are valued at the last reported sale price on the exchange on which the security is principally traded. Securities traded on NASDAQ will be valued at the NASDAQ Official Closing Price (“NOCP”). If, on a particular day, an exchange-traded or NASDAQ security does not trade, then the most recent quoted bid for exchange-traded or the mean between the most recent quoted bid for exchange-traded or the mean between the most recent quoted bid and ask price for NASDAQ securities will be used. Equity securities that are not traded on a listed exchange are generally valued at the last sale price in the over-the-counter market. If a non-exchange traded security does not trade on a particular day, then the mean between the last quoted closing bid and asked price will be used. Prices denominated in foreign currencies are converted to U.S. dollar equivalents at the current exchange rate, which approximates fair value. Redeemable securities issued by open-end investment companies are valued at the investment company’s applicable net asset value, with the exception of exchange-traded open-end investment companies which are priced as equity securities. |
Subject to its oversight, the Trust’s Board of Trustees (the “Board”) has delegated primary responsibility for determining or causing to be determined the value of the Fund’s investments to Empowered Funds, LLC d/b/a EA Advisers (the “Adviser”), pursuant to the Trust’s valuation policy and procedures, which have been adopted by the Trust and approved by the Board. In accordance with Rule 2a-5 under the 1940 Act, the Board designated the Adviser as the “valuation designee” of the Fund. If the Adviser, as valuation designee, determines that reliable market quotations are not readily available for an investment, the investment is valued at fair value as determined in good faith by the Adviser in accordance with the Trust’s fair valuation policy and procedures. The Adviser will provide the Board with periodic reports, no less frequently than quarterly, that discuss the functioning of the valuation process, if applicable, and that identify issues and valuation problems that have arisen, if any. As appropriate, the Adviser and the Board will review any securities valued by the Adviser in accordance with the Trust’s valuation policies during these periodic reports. The use of fair value pricing by the Fund may cause the net asset value of its shares to differ significantly from the net asset value that would be calculated without regard to such considerations. As of September 30, 2023, the Fund did not hold any securities that required fair valuation due to unobservable inputs.
As described above, the Fund may use various methods to measure the fair value of their investments on a recurring basis. GAAP establishes a hierarchy that prioritizes inputs to valuation methods. The three levels of inputs are:
Level 1 – Unadjusted quoted prices in active markets for identical assets or liabilities that the Fund has the ability to access.
Level 2 – Observable inputs other than quoted prices included in Level 1 that are observable for the asset or liability, either directly or indirectly. These inputs may include quoted prices for the identical instrument on an inactive market, prices for similar instruments, interest rates, prepayment speeds, credit risk, yield curves, default rates and similar data.
Level 3 – Unobservable inputs for the asset or liability, to the extent relevant observable inputs are not available; representing the Fund’s own assumptions about the assumptions a market participant would use in valuing the asset or liability and would be based on the best information available.
The availability of observable inputs can vary from security to security and is affected by a wide variety of factors, including, for example, the type of security, whether the security is new and not yet established in the marketplace, the liquidity of markets, and other characteristics particular to the security. To the extent that valuation is based on models or inputs that are less observable or unobservable in the market, the determination of fair value requires more judgment. Accordingly, the degree of judgment exercised in determining fair value is greatest for instruments categorized in Level 3.
The inputs used to measure fair value may fall into different levels of the fair value hierarchy. In such cases, for disclosure purposes, the level in the fair value hierarchy within which the fair value measurement falls in its entirety, is determined based on the lowest level input that is significant to the fair value measurement in its entirety.
FREEDOM 100 EMERGING MARKETS ETF
NOTES TO THE FINANCIAL STATEMENTS (CONTINUED)
The following is a summary of the fair value classification of the Fund’s investments as of September 30, 2023:
| | | | | | | | | | | | | | | | | | | | | | | | | | |
| DESCRIPTION | | LEVEL 1 | | LEVEL 2 | | LEVEL 3 | | TOTAL |
| Assets* | | | | | | | | |
| Common Stocks | | $ | 599,847,938 | | | $ | — | | | $ | — | | | $ | 599,847,938 | |
| Preferred Stocks | | 6,487,649 | | — | | | — | | | 6,487,649 |
| Rights | | 46,064 | | — | | | — | | | 46,064 |
| Investments Purchased with Proceeds from Securities Lending | | 13,135,705 | | — | | | — | | | 13,135,705 |
| Money Market Funds | | 404,241 | | — | | | — | | | 404,241 |
| Total Investments in Securities | | $ | 619,921,597 | | | $ | — | | | $ | — | | | $ | 619,921,597 | |
*For further detail on each asset class, see the Schedule of Investments
The following is a reconciliation of investments in which significant unobservable inputs (Level 3) were used in determining fair value: .
| | | | | |
| |
| Rights |
| Value, Beginning of Period | $ | 1,698 | |
| Purchases | — | |
| Proceeds from Sales | (3,065) | |
| Net Realized Gains (Losses) | (1,186) | |
| Corporate Action | 1,181 | |
| Change in Unrealized Appreciation (Depreciation) | 1,372 | |
| Transfers In/(Out) of Level 3 | — | |
| Value, End of Year | $ | — | |
| | | | | | | | |
| B. | Foreign Currency. Investment securities and other assets and liabilities denominated in foreign currencies are translated into U.S. dollar amounts using the spot rate of exchange at the date of valuation. Purchases and sales of investment securities and income and expense items denominated in foreign currencies are translated into U.S. dollar amounts on the respective dates of such transactions. |
The Fund isolates the portion of the results of operations resulting from changes in foreign exchange rates on investments from the fluctuations arising from changes in market prices of securities held. That portion of gains (losses) attributable to the changes in market prices and the portion of gains (losses) attributable to changes in foreign exchange rates are included on the “Statement of Operations” under “Net realized gain (loss) – Foreign currency” and “Change in Net Unrealized Appreciation (Depreciation) – Foreign Currency,” respectively.
The Fund reports net realized foreign exchange gains or losses that arise from sales of foreign currencies, currency gains or losses realized between the trade and settlement dates on securities transactions and the difference between the amounts of dividends, interest, and foreign withholding taxes recorded on the Fund’s books and the U.S. dollar equivalent of the amounts actually received or paid. Net unrealized foreign exchange gains and losses arise from changes in the fair values of assets and liabilities, other than investments in securities at fiscal period end, resulting from changes in exchange rates.
FREEDOM 100 EMERGING MARKETS ETF
NOTES TO THE FINANCIAL STATEMENTS (CONTINUED)
| | | | | | | | |
| C. | Federal Income Taxes. The Fund intends to continue to comply with the requirements of subchapter M of the Internal Revenue Code of 1986, as amended, as necessary to qualify as a regulated investment company and distribute substantially all net taxable investment income and net realized gains to shareholders in a manner which results in no tax cost to the Fund. Therefore, no federal income tax provision is required. As of and during the fiscal year ended September 30, 2023, the Fund did not have any tax positions that did not meet the “more-likely-than-not” threshold of being sustained by the applicable tax authority. As of and during the fiscal year ended September 30, 2023, the Fund did not have liabilities for any unrecognized tax benefits. The Fund would/will recognize interest and penalties, if any, related to unrecognized tax benefits on uncertain tax positions as income tax expense in the Fund’s Statement of Operations. During the fiscal year ended September 30, 2023, the Fund did not incur any interest or penalties. The Fund is subject to examination by U.S. taxing authorities for the tax periods since the Fund’s commencement of operations. |
The Fund may be subject to taxes imposed on realized and unrealized gains on securities of certain foreign countries in which the Fund invests. The foreign tax expense, if any, was recorded on an accrual basis and is included in “Net realized gain (loss) on investments” and “Net increase (decrease) in unrealized appreciation or depreciation on investments” on the accompanying Statements of Operations. The amount of foreign tax owed, if any, is included in “Payable for foreign taxes” on the accompanying Statements of Assets and Liabilities.
| | | | | | | | |
| D. | Security Transactions and Investment Income. Investment securities transactions are accounted for on the trade date. Gains and losses realized on sales of securities are determined on a specific identification basis. Dividend income is recorded on the ex-dividend date, net of any foreign taxes withheld at source. Interest income is recorded on an accrual basis. Withholding taxes on foreign dividends have been provided for in accordance with the Fund’s understanding of the applicable tax rules and regulations. |
Distributions received from a Funds’ investments in REITs and MLPs may be characterized as ordinary income, net capital gain, or return of capital. The proper characterization of such distributions is generally not known until after the end of each calendar year. As such, the Funds must use estimates in reporting the character of their income and distributions for financial statement purposes. Such estimates are based on historical information available from each MLP and other industry sources. The actual character of distributions to each Fund’s shareholders will be reflected on the Form 1099 received by shareholders after the end of the calendar year. Due to the nature of such investments, a portion of the distributions received by each Fund’s shareholders may represent a return of capital.
Distributions to shareholders from net investment income for the Fund are declared and paid on quarterly and from net realized gains on securities for the Fund are declared and paid on annually. Distributions are recorded on the ex-dividend date. The Fund may distribute more frequently, if necessary, for tax purposes.
| | | | | | | | |
| E. | Use of Estimates. The preparation of financial statements in conformity with GAAP requires management to make estimates and assumptions that affect the reported amounts of assets and liabilities at the date of the financial statements, as well as the reported amounts of increases and decreases in net assets from operations during the period. Actual results could differ from those estimates. |
| | | | | | | | |
| F. | Share Valuation. The NAV per share of the Fund is calculated by dividing the sum of the value of the securities held by the Fund, plus cash and other assets, minus all liabilities (including estimated accrued expenses) by the total number of shares outstanding for the Fund, rounded to the nearest cent. The Fund’s shares will not be priced on the days on which the New York Stock Exchange (“NYSE”) is closed for regular trading. The offering and redemption price per share for the Fund is equal to the Fund’s net asset value per share. |
| | | | | | | | |
| G. | Guarantees and Indemnifications. In the normal course of business, the Fund enters into contracts with service providers that contain general indemnification clauses. Additionally, as is customary, the Trust’s organizational documents permit the Trust to indemnify its officers and trustees against certain liabilities under certain circumstances. The Fund’s maximum exposure under these arrangements is unknown as this would involve future claims that may be against the Fund that have not yet occurred. As of the date of this Report, no claim has been made for indemnification pursuant to any such agreement of the Fund. |
FREEDOM 100 EMERGING MARKETS ETF
NOTES TO THE FINANCIAL STATEMENTS (CONTINUED)
| | | | | | | | |
| H. | Reclassification of Capital Accounts. GAAP requires that certain components of net assets relating to permanent differences be reclassified between financial and tax reporting. These reclassifications have no effect on net assets or net asset value per share. In addition, the Fund’s realized net capital gains resulting from in-kind redemptions, in which shareholders exchanged Fund shares for securities held by the Funds rather than for cash. Because such gains are not taxable to the Fund, and are not distributed to shareholders, they have been reclassified from distributable earnings to paid-in capital. For the fiscal year ended September 30, 2023 the following table shows the reclassifications made: |
| | | | | |
| Distributable Earnings | Paid in Capital |
| $ | (4,939,186) | | $ | 4,939,186 | |
NOTE 3 – RISKS
An investment in the Fund involves risk, including those described below. There is no assurance that the Fund will achieve its investment objective. An investor may lose money by investing in the Fund. An investment in the Fund is not a bank deposit and is not insured or guaranteed by the FDIC or any government agency.
Foreign Investment Risk. Returns on investments in foreign securities could be more volatile than, or trail the returns on, investments in U.S. securities. Investments in or exposures to foreign securities are subject to special risks, including risks associated with foreign securities generally, including differences in information available about issuers of securities and investor protection standards applicable in other jurisdictions; capital controls risks, including the risk of a foreign jurisdiction imposing restrictions on the ability to repatriate or transfer currency or other assets; currency risks; political, diplomatic and economic risks; regulatory risks; and foreign market and trading risks, including the costs of trading and risks of settlement in foreign jurisdictions.
Concentration Risk. The Fund may be susceptible to an increased risk of loss, including losses due to adverse occurrences affecting the Fund more than the market as a whole, to the extent that the Fund’s investments are concentrated in the securities of a particular issuer or issuers, country, group of countries, region, market, industry, group of industries, sector, or asset class.
Depositary Receipts Risk. The risks of investments in depositary receipts, including American Depositary Receipts (“ADRs”), European Depositary Receipts (“EDRs”), and Global Depositary Receipts (“GDRs”), are substantially similar to Foreign Investment Risk. In addition, depositary receipts may not track the price of the underlying foreign securities, and their value may change materially at times when the U.S. markets are not open for trading.
Emerging Markets Risk. The Fund may invest in companies organized in emerging market nations. Investments in securities and instruments traded in developing or emerging markets, or that provide exposure to such securities or markets, can involve additional risks relating to political, economic, or regulatory conditions not associated with investments in U.S. securities and instruments or investments in more developed international markets. Such conditions may impact the ability of the Fund to buy, sell or otherwise transfer securities, adversely affect the trading market and price for Fund shares and cause the Fund to decline in value.
Geographic Investment Risk. To the extent the Fund invests a significant portion of its assets in the securities of companies of a single country or region, it is more likely to be impacted by events or conditions affecting that country or region.
Taiwan Risk. The economy of Taiwan is heavily dependent on exports. Currency fluctuations, increasing
competition from Asia’s other emerge economies, and conditions that weaken demand for Taiwan’s export products worldwide could have a negative impact on the Taiwanese economy as a whole. Concerns over Taiwan’s history of political contention and its current relationship with China may also have a significant impact on the economy of Taiwan.
South Korea Risk. The Fund is susceptible to adverse market, political, regulatory and geographic events
affecting South Korea. The South Korean economy is dependent on the economies of other Asian countries, especially China and Southeast Asia, and the United States as key trading partners. Furthermore, South Korea’s economy may be significantly affected by currency fluctuations and increasing competition from Asia’s other low-cost emerging economies. Also, tensions with North Korea could escalate and lead to further uncertainty in the political and economic climate of South Korea.
Investing in Chile Risk. Investments in Chilean issuers involve risks that are specific to Chile, including
legal, regulatory, political, currency, environmental and economic risks. Among other things, the Chilean economy is heavily dependent on the export of certain commodities.
FREEDOM 100 EMERGING MARKETS ETF
NOTES TO THE FINANCIAL STATEMENTS (CONTINUED)
Investing in Poland Risk. Investments in Polish issuers may subject the Fund to legal, regulatory, political, currency and economic risk specific to Poland. Among other things, Poland’s economy is still relatively undeveloped and is heavily dependent on relationships with certain key trading partners, including Germany and other European Union (“the EU”) countries. As a result, Poland’s continued growth is dependent on the growth of these economies.
International Closed-Market Trading Risk. Because the Fund’s investments may be traded in markets that are closed when the U.S. markets are open, there are likely to be deviations between the current pricing of an underlying investment and stale investment pricing (i.e., the last quote from its closed foreign market), resulting in premiums or discounts to NAV that may be greater than those experienced by other ETFs.
Freedom Investment Strategy Risk. The Fund’s Freedom investment strategy limits the types and number of investment opportunities available to the Fund and, as a result, the Fund may underperform other emerging markets funds that do not have a freedom focus. In addition, the Index Provider may be unsuccessful in creating an index composed only of companies in countries that benefit from significant personal and economic freedoms.
Freedom Score Risk. The Index Provider relies upon the Fraser Institute, a global, independent think-tank partnership, to obtain the Freedom Score used in the Index. The Freedom Score is derived using quantified data derived from government organizations, non-governmental organizations (“NGO” or collectively “NGOs”), private sector actors, and other entities. This data is consolidated, analyzed, and disseminated by the Fraser Institute. Changes to the Freedom Score methodology or its data sources by the Fraser Institute are not controlled by the Index Provider, who relies exclusively upon the Freedom Score output for use in the Index. Should the Fraser Institute cease to provide the Freedom Score entirely, materially delay its reporting of the Freedom Score, or materially modify the calculation of the Freedom Score, the Index Provider will use its own patent-pending algorithm to produce the Freedom Score output internally using similar inputs and variables.
See the Fund’s Prospectus and Statement of Additional Information regarding the risks of investing in shares of the Fund.
NOTE 4 – COMMITMENTS AND OTHER RELATED PARTY TRANSACTIONS.
Empowered Funds, LLC dba EA Advisers (the “Adviser”) serves as the investment adviser to the Fund. Pursuant to an investment advisory agreement (the “Advisory Agreement”) between the Trust, on behalf of the Fund, and the Adviser, the Adviser provides investment advice to the Fund and oversees the day-to-day operations of the Fund, subject to the direction and control of the Board and the officers of the Trust. Under the Advisory Agreement, the Adviser is also responsible for arranging transfer agency, custody, fund administration and accounting, and other non-distribution related services necessary for the Fund to operate. The Adviser administers the Fund’s business affairs, provides office facilities and equipment and certain clerical, bookkeeping and administrative services. The Adviser agrees to pay all expenses incurred by the Fund except for the fee paid to the Adviser pursuant to the Advisory Agreement, payments under any distribution plan adopted pursuant to Rule 12b-1, brokerage expenses, acquired fund fees and expenses, taxes (including tax-related services), interest (including borrowing costs), litigation expense (including class action-related services) and other non-routine or extraordinary expenses.
U.S. Bancorp Fund Services, LLC (“Fund Services” or “Administrator”), doing business as U.S. Bank Global Fund Services, acts as the Fund’s Administrator and, in that capacity, performs various administrative and accounting services for the Fund. The Administrator prepares various federal and state regulatory filings, reports and returns for the Fund, including regulatory compliance monitoring and financial reporting; prepares reports and materials to be supplied to the trustees; monitors the activities of the Fund’s Custodian, transfer agent and fund accountant. Fund Services also serves as the transfer agent and fund accountant to the Fund. U.S. Bank N.A. (the “Custodian”), an affiliate of the Administrator, serves as the Fund’s Custodian.
The Custodian acts as the securities lending agent (the “Securities Lending Agent”) for the Fund.
At a Board meeting held on September 15, 2023, the Board of Trustees of the Trust (the “Trustees”) including each Trustee who is not an “interested person” of the Trust, as defined in the 1940 Act (the “Independent Trustees”), approved the Advisory Agreement. Per the Advisory Agreement, the Fund pays an annual rate of 0.49% to the Adviser monthly based on average daily net assets. A description of the Board’s consideration will be included in the Fund's Semi-Annual Report.
FREEDOM 100 EMERGING MARKETS ETF
NOTES TO THE FINANCIAL STATEMENTS (CONTINUED)
NOTE 5 – SECURITIES LENDING
The Fund may lend up to 331/3% of the value of the securities in its portfolio to brokers, dealers and financial institutions (but not individuals) under terms of participation in a securities lending program administered by the Securities Lending Agent. The securities lending agreement requires that loans are collateralized at all times in an amount equal to at least 102% of the value of any domestic loaned securities at the time of the loan, plus accrued interest. The use of loans of foreign securities, which are denominated and payable in U.S. dollars, shall be collateralized in an amount equal to 105% of the value of any loaned securities at the time of the loan plus accrued interest. The Fund receives compensation in the form of fees and earns interest on the cash collateral. The amount of fees depends on a number of factors including the type of security and length of the loan. The Fund continues to receive interest payments or dividends on the securities loaned during the borrowing period. Gain or loss on the value of securities loaned that may occur during the term of the loan will be for the account of the Fund. The Fund has the right under the terms of the securities lending agreement to recall the securities from the borrower on demand.
The securities lending agreement provides that, in the event of a borrower’s material default, the Securities Lending Agent shall take all actions the Securities Lending Agent deems appropriate to liquidate the collateral, purchase replacement securities at the Securities Lending Agent’s expense, or pay the Fund an amount equal to the market value of the loaned securities, subject to certain limitations which are set forth in detail in the securities lending agreement between the Fund and the Securities Lending Agent.
During the fiscal year, the Fund had loaned securities and received cash collateral for the loans. The cash collateral is invested by the Securities Lending Agent in accordance with the Trust approved investment guidelines. Those guidelines require the cash collateral to be invested in readily marketable, high quality, short-term obligations; however, such investments are subject to risk of payment delays or default on the part of the issuer or counterparty or otherwise may not generate sufficient interest to support the costs associated with securities lending. The Fund could also experience delays in recovering its securities and possible loss of income or value if the borrower fails to return the borrowed securities, although the Fund is indemnified from this risk by contract with the Securities Lending Agent.
As of the end of the fiscal year, the value of the securities on loan and payable for collateral due to broker were as follows:
| | | | | | | | |
| Value of Securities on Loan | | Payable for Collateral Received* |
| $ | 12,979,059 | | | $ | 13,135,705 | |
| | | | | |
| * | The cash collateral received was invested in the First American Money Market Government Obligations Fund as shown on the Schedule of Investments. The investment objective is to seek maximum current income to the extent consistent with the preservation of capital and maintenance of liquidity. |
The interest income earned by the Fund on the investment of cash collateral received from borrowers for the securities loaned to them (“Securities Lending Income, Net”) is reflected in the Fund’s Statement of Operations. Net securities lending income earned on collateral investments and recognized by the Fund during the fiscal year was $171,787.
Due to the absence of a master netting agreement related to the Fund's participation in securities lending, no
additional offsetting disclosures have been made on behalf of the Fund for the total borrowings listed above.
FREEDOM 100 EMERGING MARKETS ETF
NOTES TO THE FINANCIAL STATEMENTS (CONTINUED)
NOTE 6 – PURCHASES AND SALES OF SECURITIES
For the fiscal year ended September 30, 2023, purchases and sales of securities for the Fund, excluding short-term securities and in-kind transactions, were as follows:
| | | | | | | | | | | | | | |
| | Purchases | | Sales |
| | $ | 300,647,491 | | | $ | 64,774,755 | |
For the fiscal year ended September 30, 2023, in-kind transactions associated with creations and redemptions were as follows:
| | | | | | | | | | | | | | |
| | Purchases | | Sales |
| | $ | 176,848,982 | | | $ | 22,032,751 | |
For the fiscal year ended September 30, 2023, short-term and long-term gains on in-kind transactions were as follows:
| | | | | | | | | | | | | | |
| | Short Term | | Long Term |
| | $ | 2,586,995 | | | $ | 2,352,191 | |
There were no purchases or sales of U.S. Government securities during the fiscal year.
NOTE 7 – TAX INFORMATION
The components of tax basis cost of investments and net unrealized appreciation (depreciation) for federal income tax purposes at September 30, 2023 were as follows:
| | | | | |
| Tax cost of Investments | $ | 673,697,533 | |
| Gross tax unrealized appreciation | 27,255,559 |
| Gross tax unrealized depreciation | (81,000,683) |
| Net tax unrealized appreciation (depreciation) | (53,745,124) |
| Undistributed ordinary income | 1,711,736 |
| Undistributed long-term gain | - |
| Total distributable earnings | 1,711,736 |
| Other accumulated gain (loss) | (4,741,117) |
| Total accumulated gain (loss) | $ | (56,774,505) | |
Under tax law, certain capital and foreign currency losses realized after October 31 and within the taxable year are deemed to arise on the first business day of the Fund’s next taxable year.
For the fiscal year ended September 30, 2023, the Fund did not defer any qualified late year losses.
At September 30, 2023, the Fund had ($2,204,386) in unlimited short-term and ($2,536,731) in unlimited long-term capital loss carryforwards.
FREEDOM 100 EMERGING MARKETS ETF
NOTES TO THE FINANCIAL STATEMENTS (CONTINUED)
NOTE 8 – DISTRIBUTIONS TO SHAREHOLDERS
The tax character of distributions paid by the Fund during the fiscal periods ended September 30, 2023 and September 30, 2022, were as follows:
| | | | | | | | | | | | | | | | | | | | | | | | | | | | | | | | | | | | | | | | | | | | | | | |
| | Fiscal Year Ended
September 30, 2023 | | | Fiscal Year Ended
September 30, 2022 | |
| | Ordinary
Income | | | Realized
Gain | | | Ordinary
Income | | | Realized
Gain | |
| | $ | 18,598,841 | | | | $ | 450,271 | | | | $ | 1,572,895 | | | | $ | 50,733 | | |
FREEDOM 100 EMERGING MARKETS ETF
NOTES TO THE FINANCIAL STATEMENTS (CONTINUED)
NOTE 9 – CHANGE IN INDEPENDENT REGISTERED PUBLIC ACCOUNTING FIRM
On June 9, 2023, the Board of Trustees (“Board”) of the EA Series Trust (the “Trust”), including a majority of the Independent Trustees, upon the recommendation and approval of the Audit Committee of the Board, appointed Tait Weller & Baker, LLP (“Tait”) to serve as the Fund’s independent registered public accounting firm for the fiscal year ended September 30, 2023. Tait was approved as the auditor for all funds in the Trust. Tait replaces Spicer Jefferies, LLP (“Spicer”) in this role. Spicer did not resign and did not decline to stand for re-election.
The audit reports of Spicer on the financial statements of the Fund for the most fiscal periods ended September 30, 2019, September 30, 2020, September 30, 2021 and September 30, 2022, did not contain an adverse opinion or disclaimer of opinion, nor was the report qualified or modified as to uncertainty, audit scope, or accounting principles.
During the fiscal periods ended September 30, 2019, September 30, 2020, September 30, 2021, September 30, 2022 and for the interim period ended June 9, 2023 , there were no disagreements (as defined in Item 304(a)(1)(iv) of Regulation S-K and related instructions) with Spicer on any matter of accounting principles or practices, financial statement disclosure or auditing scope or procedure, which disagreements, if not resolved to the satisfaction of Spicer, would have caused it to make a reference in connection with its opinion to the subject matter of the disagreement.
During the fiscal periods ended September 30, 2019, September 30, 2020, September 30, 2021, September 30, 2022 and for the interim period ended June 9, 2023, neither the Fund, nor anyone on their behalf, consulted with Tait with respect to: (i) the application of accounting principles to a specified transaction, either completed or proposed, or the type of audit opinion that might have been rendered on the Fund’s financial statements, and no written report or oral advice was provided that Tait concluded was an important factor considered by the Fund in reaching a decision as to any accounting, auditing or financial reporting issue; or (ii) any matter that was either the subject of a “disagreement” (as defined in Item 304(a)(1)(iv) of Regulation S-K and related instructions) or a “reportable event” (as defined in Item 304(a)(1)(v) of Regulation S-K).
NOTE 10 – SUBSEQUENT EVENTS
In preparing these financial statements, management of the Fund has evaluated events and transactions for potential recognition or disclosure through date the financial statements were issued. There were no transactions that occurred during the period subsequent to September 30, 2023, that materially impacted the amounts or disclosures in the Fund’s financial statements.
REPORT OF INDEPENDENT REGISTERED PUBLIC ACCOUNTING FIRM
To the Shareholders of
Freedom 100 Emerging Markets ETF and
The Board of Trustees of
EA Series Trust
Opinion on the Financial Statements
We have audited the accompanying statement of assets and liabilities of Freedom 100 Emerging Markets ETF (the “Fund”), a series of EA Series Trust (the “Trust”), including the schedule of investments, as of September 30, 2023, the related statement of operations, the statement of changes in net assets, and the financial highlights for the year then ended, and the related notes (collectively referred to as the “financial statements”). In our opinion, the financial statements present fairly, in all material respects, the financial position of the Fund as of September 30, 2023, the results of its operations, the changes in its net assets and the financial highlights for the year then ended, in conformity with accounting principles generally accepted in the United States of America.
The statement of changes in net assets for the year ended September 30, 2022, and the financial highlights for each of the three years in the period then ended, and the period from May 23, 2019 (commencement of operations) to September 30, 2019, were audited by other auditors, whose report dated November 29, 2022, expressed an unqualified opinion on the financial statement and financial highlights.
Basis for Opinion
These financial statements are the responsibility of the Fund’s management. Our responsibility is to express an opinion on the Fund’s financial statements based on our audit. We are a public accounting firm registered with the Public Company Accounting Oversight Board (United States) (“PCAOB”) and are required to be independent with respect to the Fund in accordance with the U.S. federal securities laws and the applicable rules and regulations of the Securities and Exchange Commission and the PCAOB. We have served as the auditor of one or more of the funds in the Trust since 2023.
We conducted our audit in accordance with the standards of the PCAOB. Those standards require that we plan and perform the audit to obtain reasonable assurance about whether the financial statements are free of material misstatement, whether due to error or fraud. The Fund is not required to have, nor were we engaged to perform, an audit of its internal control over financial reporting. As part of our audit, we are required to obtain an understanding of internal control over financial reporting, but not for the purpose of expressing an opinion on the effectiveness of the Fund’s internal control over financial reporting. Accordingly, we express no such opinion.
Our audit included performing procedures to assess the risks of material misstatement of the financial statements, whether due to error or fraud, and performing procedures that respond to those risks. Such procedures included examining, on a test basis, evidence regarding the amounts and disclosures in the financial statements. Our audit also included evaluating the accounting principles used and significant estimates made by management, as well as evaluating the overall presentation of the financial statements. Our procedures included confirmation of securities owned as of September 30, 2023, by correspondence with the custodian. We believe that our audit provides a reasonable basis for our opinion.
TAIT, WELLER & BAKER LLP
Philadelphia, Pennsylvania
November 29, 2023
FREEDOM 100 EMERGING MARKETS ETF
| | |
EXPENSE EXAMPLE
SEPTEMBER 30, 2023 (UNAUDITED) |
As a shareholder of the Fund, you incur two types of costs: (1) transaction costs, including brokerage commissions on purchases and sales of Fund shares, and (2) ongoing costs, including management fees and other Fund expenses. This example is intended to help you understand your ongoing costs (in dollars) of investing in the Fund and to compare these costs with the ongoing costs of investing in other mutual funds.
The example is based on an investment of $1,000 invested at the beginning of the most recent six-month period and held the entire period (April 1, 2023 to September 30, 2023).
Actual Expenses
The first line of the table below provides information about actual account values and actual expenses. You may use the information in this line, together with the amount you invested, to estimate the expenses that you paid over the period. Simply divide your account value by $1,000 (for example, an $8,600 account value divided by $1,000 = 8.6), then multiply the result by the number in the first line under the heading entitled “Expenses Paid During the Period April 1, 2023 to September 30, 2023" to estimate the expenses you paid on your account during this period.
Hypothetical Example for Comparison Purposes
The second line of the table below provides information about hypothetical account values and hypothetical expenses based on the Fund’s actual expense ratio and an assumed rate of return of 5% per year before expenses, which is not the Fund’s actual return. The hypothetical account values and expenses may not be used to estimate the actual ending account balance or expenses you paid for the period. You may use this information to compare the ongoing costs of investing in the Fund’s and other funds. To do so, compare this 5% hypothetical example with the 5% hypothetical examples that appear in the shareholder reports of the other funds. Please note that the expenses shown in the table are meant to highlight your ongoing costs only and do not reflect any transactional costs, such as brokerage commissions paid on purchases and sales of Fund shares. Therefore, the second line of the table is useful in comparing ongoing costs only and will not help you determine the relative total costs of owning different funds. If these transactional costs were included, your costs would have been higher. The information assumes the reinvestment of all dividends and distributions.
| | | | | | | | | | | | | | | | | | | | | | | | | | |
| | Annualized Expense Ratio | | Beginning Account Value April 1, 2023 | | Ending Account Value September 30, 2023 | | Expenses Paid During Period April 1, 2023 to September 30, 20231 |
| | | | | | | | |
| Actual | | 0.49% | | $ 1,000.00 | | $ 983.40 | | $ 2.44 |
| Hypothetical (5% annual return before expenses) | | 0.49% | | 1,000.00 | | 1,022.61 | | 2.48 |
| | | | | |
| 1 | The dollar amounts shown as expenses paid during the period are equal to the annualized six-month expense ratio multiplied by the average account value during the period, multiplied by 183/365, to reflect the one-half year period. |
FREEDOM 100 EMERGING MARKETS ETF
| | |
| REVIEW OF LIQUIDITY RISK MANAGEMENT PROGRAM (UNAUDITED) |
Pursuant to Rule 22e-4 under the Investment Company Act of 1940, the Trust, on behalf of the series of the Trust covered by this shareholder report (each a “Fund”, and collectively, the “Funds”), has adopted a liquidity risk management program (“the Program”) to govern the Trust’s approach to managing liquidity risk. Rule 22e-4 seeks to promote effective liquidity risk management, thereby reducing the risk that a Fund will be unable to meet its redemption obligations and mitigating dilution of the interests of fund shareholders. The Trust’s liquidity risk management program is tailored to reflect each Fund’s particular risks, but not to eliminate all adverse impacts of liquidity risk, which would be incompatible with the nature of the Fund.
The Trust’s Board of Trustees has designated certain representatives of the Adviser as the Program Administrator, responsible for administering the Program and its policies and procedures.
At the June 9, 2023, meeting of the Board of Trustees of the Trust, the Program Administrator provided the Trustees with a report pertaining to the operation, adequacy, and effectiveness of implementation of the Program for the period ended March 31, 2023. The report concluded that the Program appeared effectively tailored to identify potential illiquid scenarios and to enable the Funds to deliver appropriate reporting. In addition, the report concluded that the Program is adequately operating, and its implementation has been effective. The report reflected that there were no liquidity events that impacted the Funds’ ability to timely meet redemptions without dilution to existing shareholders. The report further described material changes that were made to the Program since its implementation.
There can be no assurance that the Program will achieve its objectives in the future. Please refer to the prospectus for more information regarding the Funds’ exposure to liquidity risk and other principal risks to which an investment in the Funds may be subject.
FREEDOM 100 EMERGING MARKETS ETF
| | | | | | | | | | | | | | |
| FEDERAL TAX INFORMATION (UNAUDITED) |
For the fiscal year ended September 30, 2023, certain dividends paid by the Fund may be subject to a maximum tax rate of 23.8%, as provided for by the Tax Cuts and Jobs Act of 2017. The percentage of dividends declared from ordinary income designated as qualified dividend income for the Fund was 51.87%.
For corporate shareholders, the percent of ordinary income distributions qualifying for the corporate dividends received deduction for the fiscal year ended September 30, 2023 for the Fund was 0.00%.
The percentage of taxable ordinary income distributions that are designated as short-term capital gain distributions under the Internal Revenue Section 871 (k)(2)(C) for the Fund was 0.00%.
FREEDOM 100 EMERGING MARKETS ETF
| | | | | | | | | | | | | | |
| FOREIGN TAX CREDIT PASS THROUGH (UNAUDITED) |
Pursuant to Section 853 of the Internal Revenue code, the Fund designates the following amounts as foreign taxes paid for the year ended September 30, 2023. Foreign taxes paid for financial statement purposes of Section 853 may be less than actual foreign taxes paid for financial statement purposes.
| | | | | | | | |
| Creditable Foreign Tax Credit Paid | Per Share Amount | Portion of Ordinary Income Distribution Derived From Foreign Sourced Income |
| $4,070,129 | $0.188869 | 100% |
Foreign taxes paid or withheld should be included in taxable income with an offsetting deduction from gross income or as a credit for taxes paid to foreign governments.
Above figures may differ from those cited elsewhere in this report due to difference in the calculation of income and gains under GAAP purposes and Internal Revenue Service purposes.
Shareholders are strongly advised to consult their own tax advisers with respect to the tax consequences of their investments in the Fund.
FREEDOM 100 EMERGING MARKETS ETF
Trustees and Officers
The business and affairs of the Trust are managed by its officers under the oversight of its Board. The Board sets broad policies for the Trust and may appoint Trust officers. The Board oversees the performance of the Adviser, the Sub-Adviser, and the Trust’s other service providers. Each Trustee serves until his or her successor is duly elected or appointed and qualified.
The Board is comprised of four Trustees. One Trustee and certain of the officers of the Trust are directors, officers or employees of the Adviser. The other Trustees (the “Independent Trustees”) are not “interested persons” (as defined in Section 2(a)(19) of the Investment Company Act) of the Trust. The fund complex includes all funds advised by the Adviser (“Fund Complex”).
The Trustees, their age, term of office and length of time served, their principal business occupations during the past five years, the number of portfolios in the Fund Complex overseen and other directorships, if any, held by each Trustee, are shown below. The officers, their age, term of office and length of time served and their principal business occupations during the past five years are shown below. Unless noted otherwise, the address of each Trustee and each Officer is: c/o EA Series Trust, 19 East Eagle Road, Havertown, PA 19083.
| | | | | | | | | | | | | | | | | |
Name, Address, and Year of Birth | Position(s)
Held with
Trust | Term of Office and Length of Time Served | Principal Occupation During
Past 5 Years | Number of Funds in Fund Complex Overseen by Trustee | Other
Directorships
Held by
Trustee During
Past 5 Years |
| Independent Trustees |
Daniel Dorn Born: 1975 | Trustee | Since 2014 | Associate Professor of Finance, Drexel University, LeBow College of Business (2003 – present). | 46 | None |
Michael S. Pagano, Ph.D., CFA Born: 1962 | Trustee | Since 2014 | The Robert J. and Mary Ellen Darretta Endowed Chair in Finance, Villanova University (1999 – present); Co-Editor of The Financial Review (2023 – present); Founder, Michael S. Pagano, LLC (business consulting firm) (2008 – present). | 46 | Citadel Federal Credit Union (pro bono service for non-profit) |
Chukwuemeka (Emeka) O. Oguh Born: 1983 | Trustee | Since 2018 | o-founder and CEO, PeopleJoy (2016 – present). | 46 | None |
| Interested Trustee* |
Wesley R. Gray, Ph.D. Born: 1980 | Chairman and Trustee | Since 2014;
President 2014-2023 | Founder and Executive Managing Member, EA Advisers (2013 – present); Founder and Executive Managing Member, Empirical Finance, LLC d/b/a Alpha Architect (2010 – present). | 46 | None |
* Dr. Gray is an “interested person,” as defined by the Investment Company Act, because of his employment with and ownership interest in the Adviser.
Additional information about the Affiliated Trustee and Independent Trustee is available in the Statement of Additional Information (SAI)
FREEDOM 100 EMERGING MARKETS ETF
| | | | | | | | | | | | | | |
| MANAGEMENT OF THE FUND (CONTINUED) |
Officers
| | | | | | | | | | | |
Name, Address,
and Year of
Birth | Position(s)
Held with
Trust | Term of Office and Length of Time Served | Principal Occupation During
Past 5 Years |
Patrick R. Cleary Born: 1982 | President, and Chief Executive Officer; Secretary | Since 2023;
Since 2015 | Chief Operating Officer (2014 – 2022) and Managing Member (2014 – present), Alpha Architect, LLC; Chief Executive Officer of EA Advisers (2021 – present). |
Sean Hegarty Born: 1993 | Treasurer, Chief Financial Officer and Comptroller; Assistant Treasurer | Since 2023; 2022-2023 | Chief Operating Officer, EA Advisers (2022 – present); Assistant Vice President – Fund Administration, U.S. Bank Global Fund Services (2018 – 2022); Staff Accountant, Cohen & Company (2015 – 2018). |
Jessica D. Leighty Born: 1981 | Chief Compliance Officer | Since 2022 | Chief Compliance Officer Alpha Architect (2021 – present); Chief Compliance Officer, Snow Capital (2015 – 2021). |
Brian P. Massaro Born: 1997 | Assistant Treasurer | Since 2023 | Chief Data Officer, EA Advisers (2023 – present); Assistant Operating Officer, EA Advisers (2022 – 2023); Mutual Funds Administrator, U.S. Bank Global Fund Services (2019 – 2022). |
FREEDOM 100 EMERGING MARKETS ETF
| | |
| INFORMATION ABOUT PORTFOLIO HOLDINGS (UNAUDITED) |
The Fund files its complete schedule of portfolio holdings for its first and third fiscal quarters with the Securities and Exchange Commission (“SEC”) on Part F of Form N-PORT. The Fund’s Form N-PORT is available without charge, upon request, by calling (215) 882-9983. Furthermore, you may obtain the Form N-PORT on the SEC’s website at www.sec.gov. The Fund’s portfolio holdings are posted on its website at https://www.freedometfs.com/.
| | |
| INFORMATION ABOUT PROXY VOTING (UNAUDITED) |
A description of the policies and procedures the Fund uses to determine how to vote proxies relating to portfolio securities is provided in the Statement of Additional Information (“SAI”). The SAI is available without charge upon request by calling (215) 882-9983, by accessing the SEC’s website at www.sec.gov, or by accessing the Fund’s website at https://www.freedometfs.com/.
When available, information regarding how the Fund’s voted proxies relating to portfolio securities during the twelve months ending June 30 is (1) available by calling (215) 882-9983 and (2) the SEC’s website at www.sec.gov.
| | |
| FREQUENCY DISTRIBUTION OF PREMIUMS AND DISCOUNTS (UNAUDITED) |
Information regarding how often shares of the Fund trades on an exchange at a price above (i.e., at premium) or below (i.e., at a discount) the NAV of the Fund is available, without charge, on the Fund’s website at https://www.freedometfs.com/.
| | |
| PRIVACY POLICY (UNAUDITED) |
EA Series Trust (the “Trust”) is strongly committed to preserving and safeguarding the personal financial information of any customers of the Trust. Confidentiality is extremely important to us.
Regulation S-P requires, among others, each investment company to “adopt written policies and procedures that address administrative, technical, and physical safeguards for the protection of customer records and information.” However, Pursuant to Regulation S-P’s definition of “customer,” the Trust currently does not have, nor does it anticipate having in the future, any customers. In addition, the Trust does not collect any non-public personal information from any consumers.
Nonetheless, the Trust has instituted certain technical, administrative and physical safeguards through which the Trust would seek to protect personal financial information about any customers from unauthorized use and access. First, technical procedures are used in order to limit the accessibility and exposure of Trust-maintained information contained in electronic form. If customer information were obtained by the Trust, such technical procedures would cover such information.
Second, administrative procedures that are in place, would be used to control the number and type of employees, affiliated and non-affiliated persons, to whom customer information (if the Trust were to obtain any) would be accessible.
Third, physical safeguards have been established, which if customer information were obtained by the Trust, to prevent access to such information contained in hard-copy form.
As these procedures illustrate, the Trust realizes the importance of information confidentiality and security and emphasizes practices which are aimed at achieving those goals.
Adviser
Empowered Funds, LLC dba EA Advisers
19 East Eagle Road
Havertown, Pennsylvania 19083
Index Provider
Solactive AG
Platz der Einheit 1
Frankfurt, Germany 60327
Distributor
Quasar Distributors, LLC
111 East Kilbourn Ave, Suite 2200
Milwaukee, Wisconsin 53202
Custodian and Securities Lending Agent
U.S. Bank National Association
Custody Operations
1555 North River Center Drive, Suite 302
Milwaukee, Wisconsin 53212
Transfer Agent
U.S. Bancorp Fund Services, LLC
615 East Michigan Street
Milwaukee, Wisconsin 53202
Independent Registered Public Accounting Firm
Tait, Weller & Baker LLP
Two Liberty Place
50 South 16th Street, Suite 2900
Philadelphia, Pennsylvania 19102
Legal Counsel
Practus, LLP
11300 Tomahawk Creek Parkway, Suite 310
Leawood, Kansas 66211
Freedom 100 Emerging Markets ETF
Symbol – FRDM
CUSIP – 02072L607
Item 2. Code of Ethics.
The registrant has adopted a code of ethics that applies to the registrant’s principal executive officer and principal financial officer. The registrant has not made any amendments to its code of ethics during the period covered by this report. The registrant has not granted any waivers from any provisions of the code of ethics during the period covered by this report.
A copy of the registrant’s Code of Ethics is incorporated by reference.
Item 3. Audit Committee Financial Expert.
The registrant’s Board of Trustees of the Trust has determined that there is at least one audit committee financial expert serving on its audit committee. Dr. Michael Pagano is an “audit committee financial expert” and is considered to be “independent” as each term is defined in Item 3 of Form N-CSR.
Item 4. Principal Accountant Fees and Services.
The registrant has engaged its principal accountant to perform audit services, audit-related services, tax services and other services during the past fiscal year. “Audit services” refer to performing an audit of the registrant’s annual financial statements or services that are normally provided by the accountant in connection with statutory and regulatory filings or engagements for those fiscal years. “Audit-related services” refer to the assurance and related services by the principal accountant that are reasonably related to the performance of the audit. “Tax services” refer to professional services rendered by the principal accountant for tax compliance, tax advice, and tax planning, including review of the registrant’s tax returns and calculations of required income, capital gain and excise distributions. There were no “Other services” provided by the principal accountant. The following table details the aggregate fees billed or expected to be billed for the last fiscal year for audit fees, audit-related fees, tax fees and other fees by the principal accountant.
| | | | | | | | |
| | FYE 9/30/2023 | FYE 9/30/2022 |
| Audit Fees | $8,750 | $8,750 |
| Audit-Related Fees | N/A | N/A |
| Tax Fees | $2,250 | $2,250 |
| All Other Fees | N/A | N/A |
The audit committee has adopted pre-approval policies and procedures that require the audit committee to pre-approve all audit and non-audit services of the registrant, including services provided to any entity affiliated with the registrant.
The percentage of fees billed by the principal accountants applicable to non-audit services pursuant to waiver of pre-approval requirement were as follows:
| | | | | | | | |
| | FYE 9/30/2023 | FYE 9/30/2022 |
| Audit-Related Fees | 0% | 0% |
| Tax Fees | 0% | 0% |
| All Other Fees | 0% | 0% |
All of the principal accountant’s hours spent on auditing the registrant’s financial statements were attributed to work performed by full-time permanent employees of the principal accountant. (If more than 50 percent of the accountant’s hours were spent to audit the registrant’s financial statements for the most recent fiscal year, state how many hours were attributed to work performed by persons other than the principal accountant’s full-time, permanent employees.)
The following table indicates the non-audit fees billed or expected to be billed by the registrant’s accountant for services to the registrant and to the registrant’s investment adviser (and any other controlling entity, etc.—not sub-adviser) for the past year. The audit committee of the board of trustees/directors has considered whether the provision of non-audit services that were rendered to the registrant’s investment adviser is compatible with maintaining the principal accountant’s independence and has concluded that the provision of such non-audit services by the accountant has not compromised the accountant’s independence.
| | | | | | | | |
| Non-Audit Related Fees | FYE 9/30/2023 | FYE 9/30/2022 |
| Registrant | N/A | N/A |
| Registrant’s Investment Adviser | N/A | N/A |
Item 5. Audit Committee of Listed Registrants.
The registrant is an issuer as defined in Rule 10A-3 under the Securities Exchange Act of 1934, (the “Act”) and has a separately-designated standing audit committee established in accordance with Section 3(a)(58)(A) of the Act. The independent members of the committee are as follows: Daniel Dorn, Chukwuemeka (Emeka) Oguh, and Michael Pagano.
Item 6. Investments.
Schedule of Investments is included as part of the report to shareholders filed under Item 1 of this Form.
Item 7. Disclosure of Proxy Voting Policies and Procedures for Closed-End Management Investment Companies.
Not applicable to open-end investment companies.
Item 8. Portfolio Managers of Closed-End Management Investment Companies.
Not applicable to open-end investment companies.
Item 9. Purchases of Equity Securities by Closed-End Management Investment Company and Affiliated Purchasers.
Not applicable to open-end investment companies.
Item 10. Submission of Matters to a Vote of Security Holders.
There have been no material changes to the procedures by which shareholders may recommend nominees to the registrant’s board of trustees.
Item 11. Controls and Procedures.
| | | | | |
| (a) | The Registrant’s Principal Executive Officer and Treasurer have reviewed the Registrant’s disclosure controls and procedures (as defined in Rule 30a-3(c) under the Investment Company Act of 1940 (the “Act”)) as of a date within 90 days of the filing of this report, as required by Rule 30a-3(b) under the Act and Rules 13a-15(b) or 15d-15(b) under the Securities Exchange Act of 1934. Based on their review, such officers have concluded that the disclosure controls and procedures are effective in ensuring that information required to be disclosed in this report is appropriately recorded, processed, summarized and reported and made known to them by others within the Registrant and by the Registrant’s service provider. |
| | | | | |
| (b) | There were no changes in the Registrant’s internal control over financial reporting (as defined in Rule 30a-3(d) under the Act) that occurred during the fiscal period covered by this report that has materially affected, or is reasonably likely to materially affect, the Registrant’s internal control over financial reporting. |
Item 12. Disclosure of Securities Lending Activities for Closed-End Management Investment Companies
Not applicable to open-end investment companies.
Item 13. Exhibits.
(3) Any written solicitation to purchase securities under Rule 23c-1 under the Act sent or given during the period covered by the report by or on behalf of the registrant to 10 or more persons. Not applicable to open-end investment companies.
SIGNATURES
Pursuant to the requirements of the Securities Exchange Act of 1934 and the Investment Company Act of 1940, the registrant has duly caused this report to be signed on its behalf by the undersigned, thereunto duly authorized.
| | | | | | | | |
| (Registrant) | EA Series Trust | |
| | |
| By (Signature and Title) | /s/ Patrick Cleary | |
| | Patrick Cleary, President, Chief Executive Officer and Secretary | |
| | |
| Date: | December 4, 2023 | |
Pursuant to the requirements of the Securities Exchange Act of 1934 and the Investment Company Act of 1940, this report has been signed below by the following persons on behalf of the registrant and in the capacities and on the dates indicated.
| | | | | | | | |
| By (Signature and Title) | /s/ Patrick R. Cleary | |
| | Patrick Cleary, President, Chief Executive Officer and Secretary | |
| | | |
| Date: | December 4, 2023 | |
| | | |
| By (Signature and Title) | /s/ Sean R. Hegarty | |
| | Sean Hegarty, Treasurer, Chief Financial Officer and Comptroller | |
| | | |
| Date: | December 4, 2023 | |