UNITED STATES
SECURITIES AND EXCHANGE COMMISSION
Washington, D.C. 20549
FORM N-CSR
CERTIFIED SHAREHOLDER REPORT OF REGISTERED
MANAGEMENT INVESTMENT COMPANIES
Investment Company Act file number 811-22961
EA Series Trust
(Exact name of registrant as specified in charter)
19 E. Eagle Road
Havertown, PA 19083
(Address of principal executive offices) (Zip code)
19 E. Eagle Road
Havertown, PA 19083
(Name and address of agent for service)
215-882-9983
Registrant’s telephone number, including area code
Date of fiscal year end: September 30, 2023
Date of reporting period: September 30, 2023
Item 1. Reports to Stockholders.
Alpha Architect U.S. Quantitative Value ETF
Alpha Architect International Quantitative Value ETF
Alpha Architect U.S. Quantitative Momentum ETF
Alpha Architect International Quantitative Momentum ETF
Alpha Architect Value Momentum Trend ETF
Alpha Architect High Inflation and Deflation ETF
Alpha Architect Tail Risk ETF
Annual Report
September 30, 2023
ALPHA ARCHITECT ETFs
TABLE OF CONTENTS
| | | | | | | | |
| | | Page |
| | |
| Performance Summary and Portfolio Allocation | | |
| | |
| | |
| | |
| | |
| | |
| | |
| | |
| | |
| | |
| | |
| | |
| | |
| | |
| | |
| | |
| | |
ALPHA ARCHITECT ETFs
LETTER TO SHAREHOLDERS
Dear Alpha Architect Family of Funds Shareholders,
Thank you for your investment in the Alpha Architect U.S. Quantitative Value ETF (“QVAL”), Alpha Architect International Quantitative Value ETF (“IVAL”), Alpha Architect U.S. Quantitative Momentum ETF (“QMOM”), Alpha Architect International Quantitative Momentum ETF (“IMOM”), Alpha Architect Value Momentum Trend ETF (“VMOT”), Alpha Architect High Inflation and Deflation ETF ("HIDE”) and Alpha Architect Tail Risk ETF ("CAOS”), collectively referred to as the “Funds”. The information presented in this letter relates to the operations of the Funds for the fiscal year ended September 30, 2023 (“FY 2023”).
VMOT is structured as a “fund of funds” ETF that seeks to invest in value and momentum securities (using QVAL and IVAL ETFs for value investments, and QMOM and IMOM for momentum investments) as well as applying hedging rules to the U.S. (QVAL and QMOM) and International (IVAL and IMOM) allocations based on a monthly assessment. VMOT seeks to provide long term capital appreciation while attempting to minimize market drawdowns. .
The investment strategies and approaches used in managing the Funds generally remain the same, regardless of market conditions. QVAL seeks to identify cheap, high-quality stocks in the domestic (U.S.) market. IVAL seeks to identify cheap, high-quality stocks in international markets. QMOM seeks to identify stocks with the highest quality momentum in the domestic (U.S.) market. IMOM seeks to identify stocks with the highest quality momentum in international markets. HIDE seeks to deliver portfolio protection during high inflation or deflationary regimes. CAOS seeks to earn positive returns during significant market drawdowns. VMOT seeks to identify Value (QVAL and IVAL) and Momentum (QMOM and IMOM) securities in both the domestic (U.S.) market and international markets (through the fund-of-funds structure) while also applying hedging rules based on a monthly assessment. All Funds target mid and large cap equities, either directly (QVAL, IVAL, QMOM, IMOM) or indirectly (VMOT, which holds shares of QVAL, QMOM, IVAL, and IMOM). The standalone Funds (QVAL, QMOM, IVAL, and IMOM) generally hold 50 or fewer positions. QVAL, IVAL, QMOM, and IMOM are diversified funds. HIDE and VMOT hold shares of other ETFs and are considered diversified on a look-through basis. In addition, CAOS generally holds options on the S&P 500 Index and is considered diversified on a look-through basis.
The primary headline for FY 2023 was a shift in the market from being a growth-driven market to a value-driven market, much of which was tied to a dramatic change in inflation expectations and interest rates. Due to strong value tilts, two of the four Alpha Architect factor funds (QVAL and IVAL) experienced strong relative performance in the year versus their respective benchmarks.
Despite the volatility of financial markets in FY 2023, we continue to follow the quantitative methodologies behind each of the Funds. At times like these, we like to highlight that concentrated factor strategies focused on a specific style (e.g., value, growth, momentum, and so forth) can deviate greatly from traditional capitalization-weighted portfolios. This deviation from standard passive benchmarks is often more pronounced when factor style portfolios are more concentrated, which is the case for our factor funds, QVAL, IVAL, QMOM, IMOM, and VMOT.
The individual fund performance drivers during the most recent fiscal year/period are outlined below.
QVAL
For FY 2023, QVAL was up 30.11% at its market price and up 30.39% at net asset value (NAV). The best and worst securities listed below are based on their contribution to the fund’s return, taking into consideration the weighting of each security.
The best performing security in the Fund’s portfolio during the period was Alpha Metallurgical Resource, which was up 72.53%. The second best performing security was Consol Energy Inc, which was up 55.29% for the period. The third best performing security for the period was Pbf Energy Inc-Class A, which was up 55.13% for the period.
The worst performing security in the Fund’s portfolio during the period was Comstock Resources Inc., which was down 39.13%. The second worst performing security was Mosaic Co/The, which was down 26.74% for the period. The third worst performing security was Cf Industries Holdings Inc., which was down 24.38% for the period.
ALPHA ARCHITECT ETFs
LETTER TO SHAREHOLDERS
For FY 2023, QVAL outperformed the Solactive GBS United States 1000 NTR Index, which was up 20.60%.
QVAL distributed income to shareholders on a quarterly basis.
IVAL
For FY 2023, IVAL was up 30.73% at its market price and up 30.86% at NAV. The best and worst securities listed below are based on their contribution to the Fund’s return, taking into consideration the weighting of each security.
The best performing security in the Fund’s portfolio during the period was Aurubis Ag, which was up 92.99%. The second best performing security was Screen Holdings Co Ltd., which was up 91.37% for the period. The third best performing security for the period was Shinko Electric Industries, which was up 86.43% for the period.
The worst performing security in the Fund’s portfolio during the period was Harbour Energy Plc, which was down 39.57%. The second worst performing security was Icl Group Ltd., which was down 28.75% for the period. The third worst performing security was Boliden Ab, which was down 22.1% for the period.
For FY 2023, IVAL outperformed the Solactive GBS Developed Markets ex N.A. Large & Mid Cap NTR Index (USD), which was up 25.22%.
IVAL distributed income to shareholders on an quarterly basis.
QMOM
For FY 2023, QMOM was down 0.82% at its market price and down 0.71% at NAV. The best and worst securities listed below are based on their contribution to the Fund’s return, taking into consideration the weighting of each security.
The best performing security in the Fund’s portfolio during the period was Super Micro Computer Inc., which was up 202.97%. The second best performing security was Elf Beauty Inc., which was up 48.04% for the period. The third best performing security for the period was Sylvamo Corp., which was up 61.68% for the period.
The worst performing security in the Fund during the period was Sage Therapeutics Inc., which was down 59.06%. The second worst performing security was Impinj Inc., which was down 48.36% for the period. The third worst performing security was Texas Pacific Land Corp., which was down 47.88% for the period.
For FY 2023, QMOM underperformed the Solactive GBS United States 1000 NTR Index, which was up 20.60%.
QMOM distributed income to shareholders on an annual basis.
IMOM
For FY 2023, IMOM was up 13.88% at its market price and up 13.50% at NAV. The best and worst securities listed below are based on their contribution to the fund’s return, taking into consideration the weighting of each security.
The best performing security in the Fund’s portfolio during the period was Centrica Plc, which was up 91.89%. The second best performing security was Rheinmetall Ag, which was up 68.19% for the period. The third best performing security for the period was Commerzbank Ag, which was up 55.38% for the period.
The worst performing security in the Fund’s portfolio during the period was Sosei Group Corp., which was down 49.35%. The second worst performing security was Delek Group Ltd., which was down 37.9% for the period. The third worst performing security was Whitehaven Coal Ltd., which was down 31.42% for the period.
For FY 2023, IMOM underperformed the Solactive GBS Developed Markets ex N.A. Large & Mid Cap NTR Index (USD), which was up 25.22%.
ALPHA ARCHITECT ETFs
LETTER TO SHAREHOLDERS
IMOM distributed income to shareholders on an annual basis.
VMOT
For FY 2023, VMOT was down 7.68% at its market price and down 7.75% at NAV.
At times, VMOT will employ hedging when the trend-following signals are “triggered”. During FY 2023, these rules were triggered for much of the year in both domestic and international markets. These hedging signals prevented the portfolio from suffering the full extent of the broad market sell-off and lead to strong outperformance during FY 2023.
For FY 2023, VMOT outperformed a portfolio of 70% World Developed Stocks and 30% U.S. Treasury Bills[1], which was up 17.50%.
VMOT distributed income to shareholders on an annual basis.
[1] 35% Solactive GBS United States 1000 NTR Index, 35% Solactive GBS Developed Markets ex North America Large & Mid Cap NTR Index, 30% Solactive 1-3 month US T-Bill Index
HIDE
For FY 2023, HIDE was up 0.67% at its market price and up 0.69% at NAV. We are using the Since Inception (11/16/2023) performance because the fund is launched less than one year.
The best performing security in the Fund’s portfolio during the period was Schwab Intermediate-Term US, which was down 3.22%. The second best performing security was Vanguard Real Estate ETF, which was down 3.63% for the period. The third best performing security for the period was Graniteshares Bcom Broad Str, which was down 5.81% for the period.
The worst performing security in the Fund’s portfolio during the period was Graniteshares Bcom Broad Str, which was down 5.81% for the period. The second worst performing security was Vanguard Real Estate ETF, which was down 3.63% for the period. The third worst performing security was Schwab Intermediate-Term US, which was down 3.22% for the period.
For FY 2023, HIDE outperformed the Solactive US Aggregate Bond Index, which was down 1.13%.
HIDE distributed income to shareholders on an annual basis.
CAOS
For FY 2023, CAOS was up 7.31% at its market price and up 7.32% at NAV.
For FY 2023, CAOS underperformed the S&P 500 TR, which was up 9.04%.
CAOS distributed income to shareholders on an annual basis.
[1] 35% Solactive GBS United States 1000 NTR Index, 35% Solactive GBS Developed Markets ex North America Large & Mid Cap NTR Index, 30% Solactive 1-3 month US T-Bill Index
ALPHA ARCHITECT ETFs
LETTER TO SHAREHOLDERS
Please note, returns of the best/worst performers cited above reflect the returns of the stocks during the time period held by the Funds, not necessary for the entire fiscal year.
We appreciate your continued investment in the Funds.
Sincerely,
/s/ Patrick R. Cleary
Patrick R. Cleary
Chief Executive Officer
Empowered Funds, LLC dba EA Advisers
The performance data quoted represents past performance. Past performance does not guarantee future results. The investment return and principal value of an investment will fluctuate so that an investor's shares, when redeemed, may be worth more or less than their original cost and current performance may be lower or higher than the performance quoted. For the most recent month-end performance, please call (215) 882-9983 or visit the Funds’ website at etfsite.alphaarchitect.com.
Shares are bought and sold at market price (not at net asset value, (“NAV”)), and are not individually redeemed from the Funds. Market price returns are based upon the midpoint of the bid/ask spread at the close of the exchange and does not represent the returns an investor would receive if shares were traded at other times. Brokerage commissions will reduce returns. NAVs are calculated using prices as of the close of regular trading on the exchange, normally 4:00 p.m. Eastern Time.
Opinions expressed are subject to change at any time, are not guaranteed and should not be considered investment advice.
Any offering must be preceded or accompanied by a prospectus.
Fund holdings and allocations are subject to change at any time and should not be considered a recommendation to buy, hold or sell any security. Please see the Schedule of Investments in this report for complete Fund holdings.
RISKS
Investments involve risk. Principal loss is possible.
Non-diversification Risk. Because VMOT is non-diversified, it may be more sensitive to economic, business, political or other changes affecting individual issuers or investments than a diversified fund, which may result in greater fluctuation in the value of the Funds’ Shares and greater risk of loss.
Value Style Risk. Value investing is subject to the risk that intrinsic values of investments may not be recognized by the broad market or that their prices may decline.
Momentum Style Risk. Investing in or having exposure to securities with positive momentum entails investing in securities that have had above-average recent returns. These securities may be more volatile than a broad cross section of securities. Returns on securities that have previously exhibited momentum may be less than returns on other styles of investing or the overall stock market. Momentum can turn quickly and cause significant variation from other types of investments, and stocks that previously exhibited high momentum may not experience continued positive momentum. In addition, there may be periods when the momentum style is out of favor, and during which the investment performance of the Funds using a momentum strategy may suffer.
Quantitative Management Risk. Investments utilizing quantitative methods may perform differently than the market as a result of characteristics and data used and changes in trends.
ALPHA ARCHITECT ETFs
LETTER TO SHAREHOLDERS
Foreign Security Risk. Investments in foreign securities involve political, economic and currency risks, greater volatility and differences in accounting methods.
Small Company Risk. Investments in smaller companies involve limited liquidity and greater volatility than larger companies.
High Portfolio Turnover Rate Risk. High portfolio turnover could increase a Fund’s transactions costs, resulting in taxable distributions to shareholders and negatively impact performance.
Derivatives Risk. Derivatives can be volatile and involve various types of degrees of risks including hedging risks. The use of derivatives in connection with the VMOT index's hedging strategies may expose the index (and therefore the Fund) to losses (some of which may be sudden) that it would not have otherwise been exposed to if it had only invested directly in equity securities.
Fund of Funds Risk. VMOT primarily invests in the other Alpha Architect Funds and its performance largely depends on the investment performance of those underlying Alpha Architect Funds. An investor will indirectly bear the principal risks and its share of fees and expenses of the underlying funds.
INDICES
The Solactive GBS United States 1000 Index intends to track the performance of the largest 1000 companies from the US stock market and is based on the Solactive Global Benchmark Series. Constituents are selected based on company market capitalization and weighted by free float market capitalization. The index is calculated as a net total return index in USD and is reconstituted quarterly.
The Solactive GBS Developed Markets ex North America Large & Mid Cap USD Index (CA NTR) is part of the Solactive Global Benchmark Series which includes benchmark indices for developed and emerging market countries. The index tracks the performance of the large and mid cap segment covering approximately the largest 85% of the free-float market capitalization in the Developed Markets excluding North America. It is calculated as a Net Total Return index in CAD and weighted by free-float market capitalization.
The Solactive 1-3 month US T-Bill Index is a rules-based, market value weighted index engineered for the short-term T-Bill market denominated in USD. The index is comprised of USD denominated T-Bills with a time to maturity of 1 to 3 months.
The Alpha Architect Value Momentum Trend Index will be composed primarily of the other Funds included in this report which invest in either domestic or international equity securities and employ either a “momentum” or “value” investment strategy. In addition, the Index may, from time to time, use hedging strategies.
The Solactive US Aggregate Bond Index aims to track the performance of the USD denominated bond market. The INDEX COMPONENTS are weighted with the aim to replicate the distribution of the weights of the entire market.
S&P500: It is an unmanaged index of 500 common stocks primarily traded on the New York Stock Exchange, weighted by market capitalization. Index performance includes the reinvestment of dividends and capital gains.
Indices do not incur any management fees, transaction costs, or expenses. Indices are unmanaged and one cannot invest directly in an index.
*Alpha is defined as the excess return of the fund relative to the return of the benchmark index.
The Funds are distributed by Quasar Distributors, LLC. The Funds’ investment advisor is Empowered Funds, LLC, which is doing business as EA Advisers.
| | | | | | | | | | | | | | | | | | | | |
| | | | Average Annual Return* |
| | | | | | Since Inception |
| | | | 1 Year | 5 Year | (October 21, 2014) |
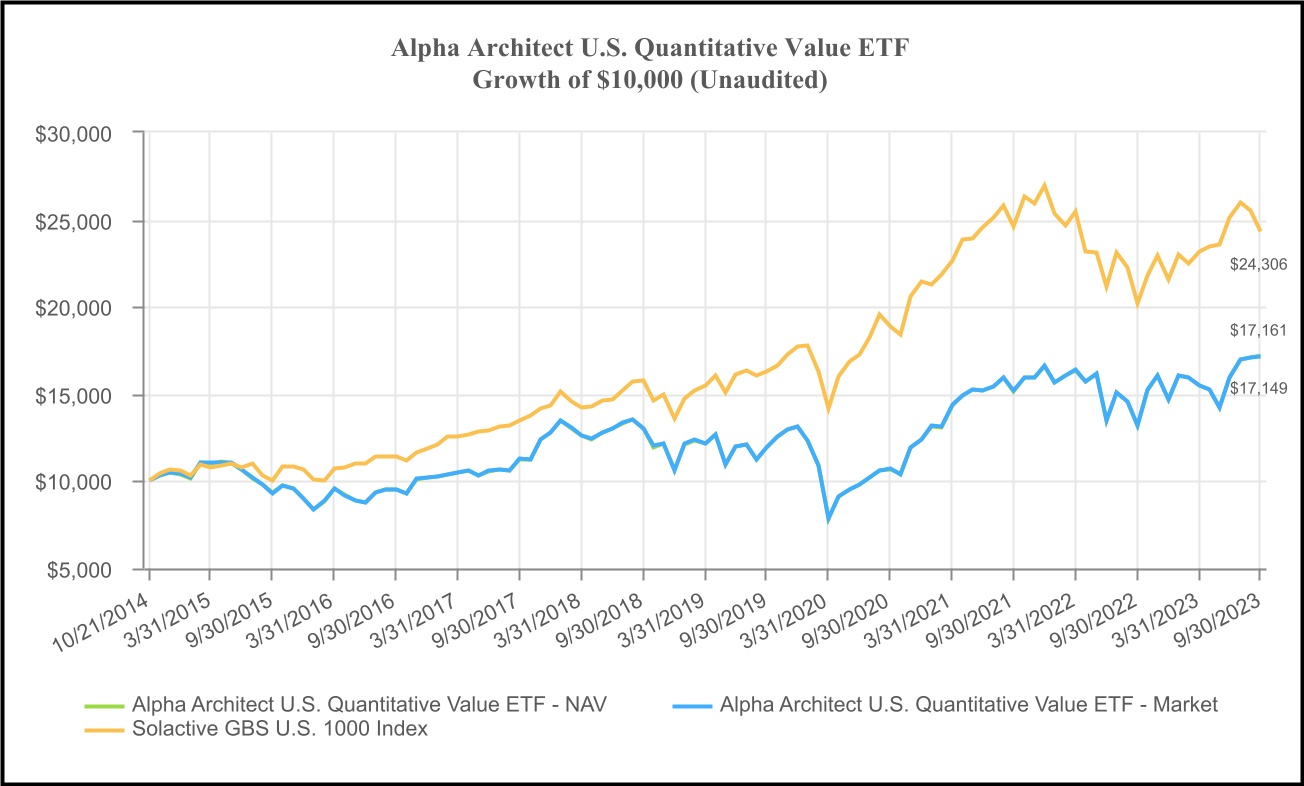
| Alpha Architect U.S. Quantitative Value ETF - NAV | | 30.39% | 5.69% | 6.23% |
| Alpha Architect U.S. Quantitative Value ETF - Market | 30.11% | 5.69% | 6.22% |
| Solactive GBS U.S. 1000 Index | 20.60% | 9.07% | 10.44% |
| | | | | | |
| See “Index Overview” section for a description of the Index. | | | |
| | | | | | |
*This chart assumes an initial gross investment of $10,000 made on October 21, 2014. Returns shown include the dividends. Past performance does not guarantee future results. The graph and table do not reflect the deduction of taxes that a shareholder would pay on Fund distributions or the redemption of Fund shares. Investment return and principal value will fluctuate, so that your shares, when redeemed, may be worth more or less than the original cost. |
|
|
|
Tabular Presentation of Schedule of Investments
As of September 30, 2023
Alpha Architect U.S. Quantitative Value ETF
| | | | | | | | |
Sector1 | | % Net Assets |
| Energy | | 38.7%² |
| Consumer Discretionary | | 27.2%² |
| Industrials | | 17.8% |
| Materials | | 4.1% |
| Information Technology | | 4.0% |
| Communication Services | | 3.8% |
| Health Care | | 2.1% |
| Consumer Staples | | 2.1% |
Other3 | | 0.2% |
| Total | | 100.0% |
1 Sector designations may be different than the sector designations presented in other Fund materials. The sector designations may represent the investment adviser's internal sector classifications.
2 For purposes of the Fund's compliance with its concentration limits, the Fund uses various sub-classifications and none of the Fund's holdings in the sub-classifications exceed 25% of the Fund's total assets.
3 Cash, cash equivalents, short-term investments and other assets less liabilities.
| | | | | | | | | | | | | | | | | | | | |
| | | | Average Annual Return* |
| | | | | | Since Inception |
| | | | 1 Year | 5 Year | (December 16, 2014) |
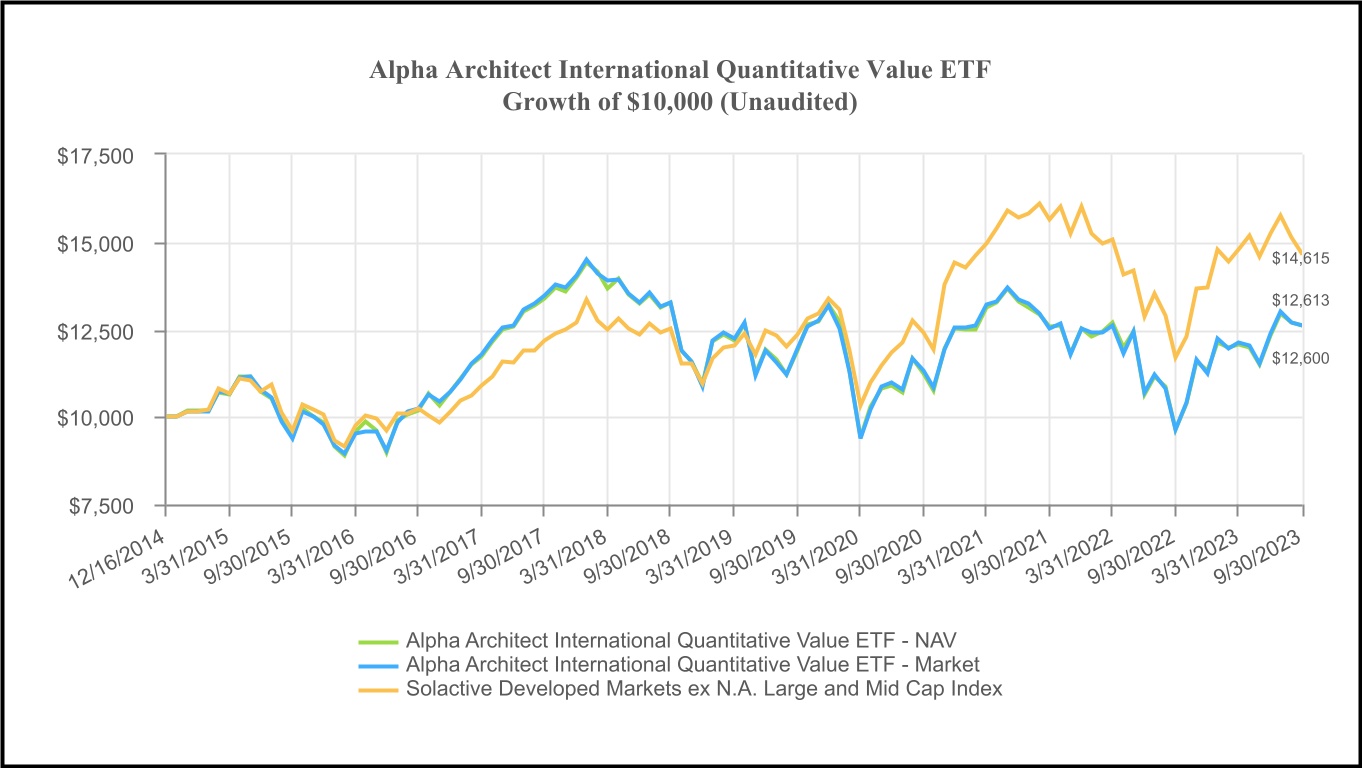
| Alpha Architect International Quantitative Value ETF - NAV | 30.86% | -1.00% | 2.68% |
| Alpha Architect International Quantitative Value ETF - Market | 30.73% | -1.00% | 2.66% |
| Solactive Developed Markets ex N.A. Large and Mid Cap Index | 25.22% | 3.16% | 4.41% |
| | | | | | |
| See “Index Overview” section for a description of the Index. | | | |
| | | | | | |
*This chart assumes an initial gross investment of $10,000 made on December 16, 2014. Returns shown include the dividends. Past performance does not guarantee future results. The graph and table do not reflect the deduction of taxes that a shareholder would pay on Fund distributions or the redemption of Fund shares. Investment return and principal value will fluctuate, so that your shares, when redeemed, may be worth more or less than the original cost. |
|
|
|
Tabular Presentation of Schedule of Investments
As of September 30, 2023
Alpha Architect International Quantitative Value ETF
| | | | | | | | |
Sector1 | | % Net Assets |
| Consumer Discretionary | | 32.4%² |
| Energy | | 22.7% |
| Industrials | | 18.4% |
| Materials | | 13.4% |
| Utilities | | 5.9% |
| Information Technology | | 4.1% |
| Consumer Staples | | 1.9% |
Other3 | | 1.2% |
| Total | | 100.0% |
1 Sector designations may be different than the sector designations presented in other Fund materials. The sector designations may represent the investment adviser's internal sector classifications.
2 For purposes of the Fund's compliance with its concentration limits, the Fund uses various sub-classifications and none of the Fund's holdings in the sub-classifications exceed 25% of the Fund's total assets.
3 Cash, cash equivalents, short-term investments and other assets less liabilities.
| | | | | | | | | | | | | | | | | | | | |
| | | | Average Annual Return* |
| | | | | | Since Inception |
| | | | 1 Year | 5 Year | (December 1, 2015) |
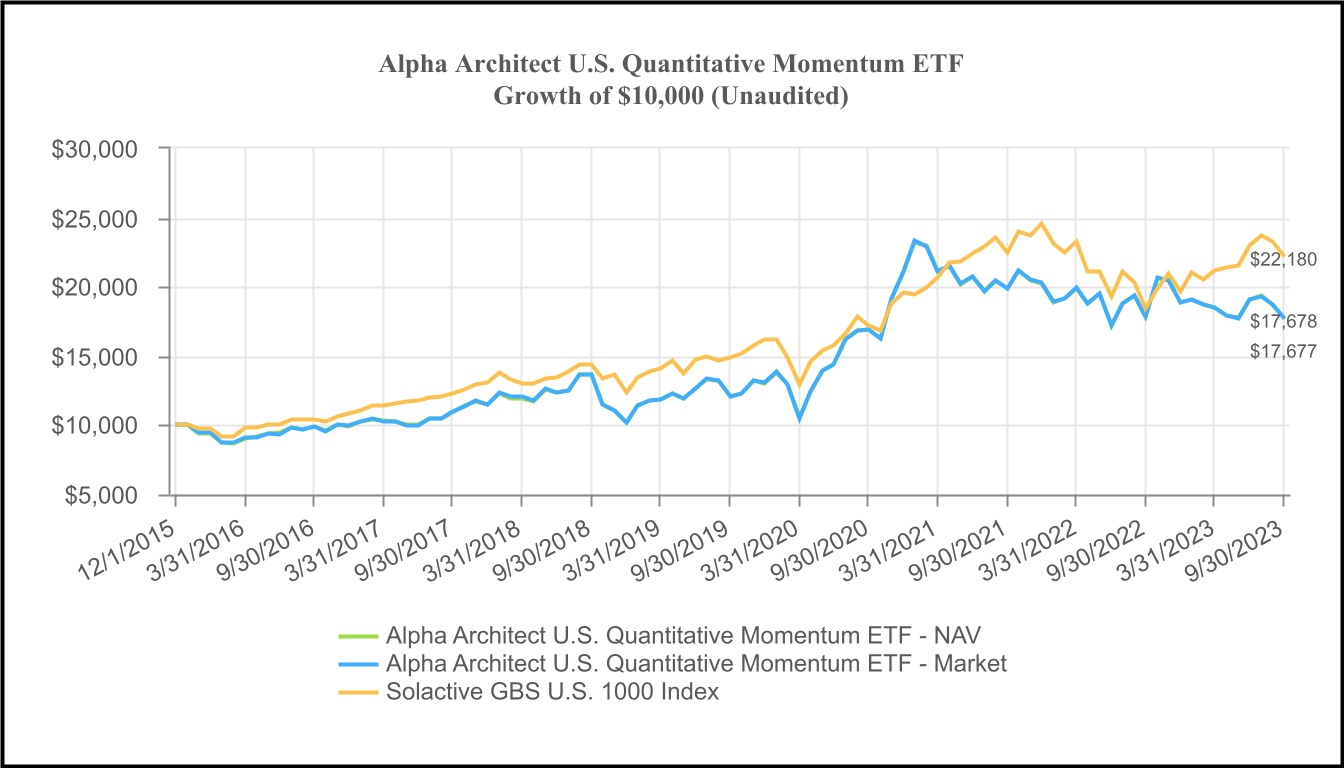
| Alpha Architect U.S. Quantitative Momentum ETF - NAV | -0.71% | 5.28% | 7.54% |
| Alpha Architect U.S. Quantitative Momentum ETF - Market | -0.82% | 5.28% | 7.54% |
| Solactive GBS U.S. 1000 Index | 20.60% | 9.07% | 10.71% |
| | | | | | |
| See “Index Overview” section for a description of the Index. | | | |
| | | | | | |
*This chart assumes an initial gross investment of $10,000 made on December 1, 2015. Returns shown include the dividends. Past performance does not guarantee future results. The graph and table do not reflect the deduction of taxes that a shareholder would pay on Fund distributions or the redemption of Fund shares. Investment return and principal value will fluctuate, so that your shares, when redeemed, may be worth more or less than the original cost. |
|
|
|
Tabular Presentation of Schedule of Investments
As of September 30, 2023
Alpha Architect U.S. Quantitative Momentum ETF
| | | | | | | | |
Sector1 | | % Net Assets |
| Consumer Discretionary | | 29.6%² |
| Industrials | | 27.7%² |
| Information Technology | | 16.0% |
| Energy | | 8.6% |
| Financials | | 6.5% |
| Health Care | | 6.0% |
| Materials | | 2.0% |
| Communication Services | | 1.8% |
| Consumer Staples | | 1.7% |
Other3 | | 0.1% |
| Total | | 100.0% |
1 Sector designations may be different than the sector designations presented in other Fund materials. The sector designations may represent the investment adviser's internal sector classifications.
2 For purposes of the Fund's compliance with its concentration limits, the Fund uses various sub-classifications and none of the Fund's holdings in the sub-classifications exceed 25% of the Fund's total assets.
3 Cash, cash equivalents, short-term investments and other assets less liabilities.
| | | | | | | | | | | | | | | | | | | | |
| | | | Average Annual Return* |
| | | | | | Since Inception |
| | | | 1 Year | 5 Year | (December 22, 2015) |
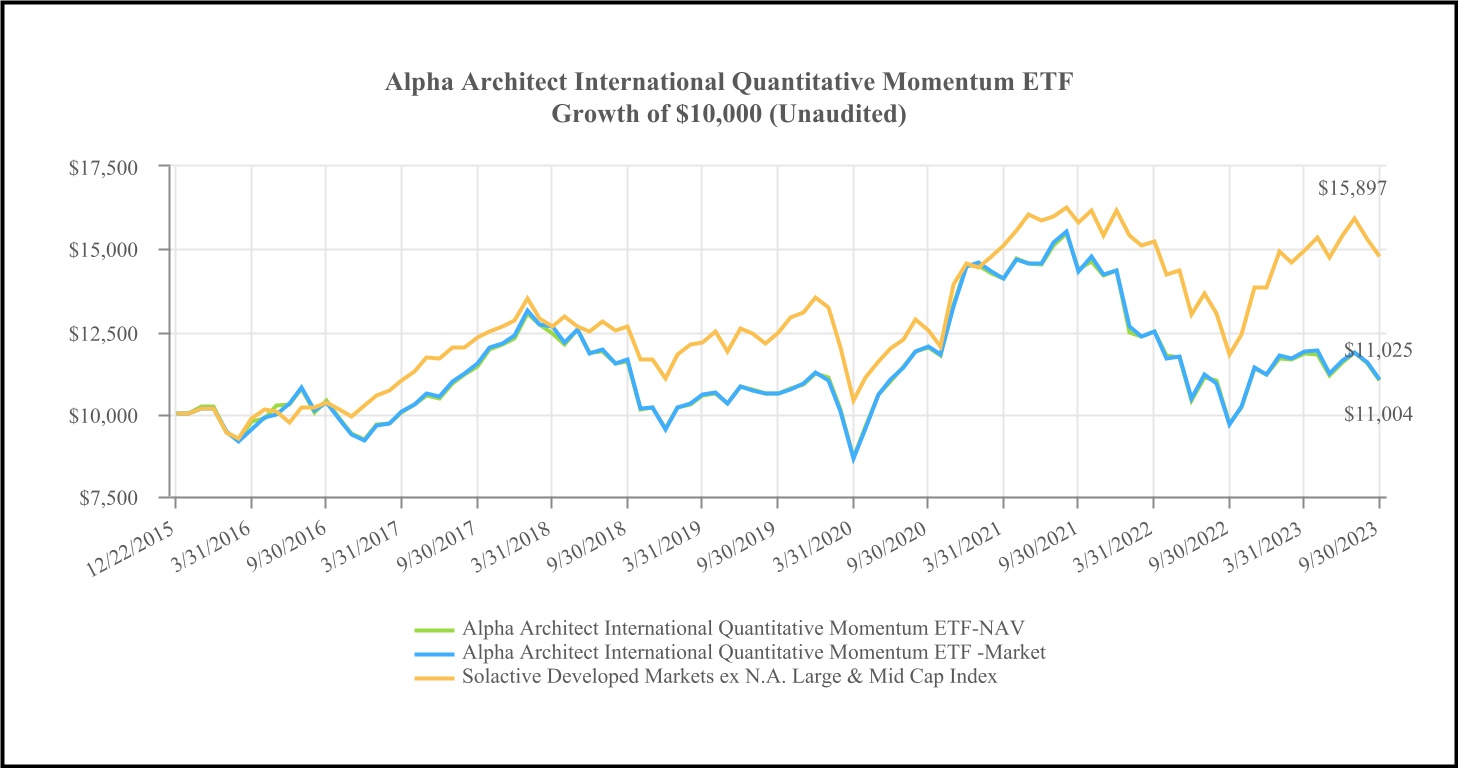
| Alpha Architect International Quantitative Momentum ETF - NAV | 13.50% | -1.03% | 1.24% |
| Alpha Architect International Quantitative Momentum ETF - Market | 13.88% | -1.09% | 1.26% |
| Solactive Developed Markets ex N.A. Large & Mid Cap Index | 25.22% | 3.16% | 5.14% |
| | | | | | |
| See “Index Overview” section for a description of the Index. | | | |
| | | | | | |
*This chart assumes an initial gross investment of $10,000 made on December 22, 2015. Returns shown include the dividends. Past performance does not guarantee future results. The graph and table do not reflect the deduction of taxes that a shareholder would pay on Fund distributions or the redemption of Fund shares. Investment return and principal value will fluctuate, so that your shares, when redeemed, may be worth more or less than the original cost. |
|
|
|
Tabular Presentation of Schedule of Investments
As of September 30, 2023
Alpha Architect International Quantitative Momentum ETF
| | | | | | | | |
Sector1 | | % Net Assets |
| Financials | | 33.1%² |
| Consumer Discretionary | | 21.5% |
| Information Technology | | 13.7% |
| Materials | | 11.7% |
| Industrials | | 5.9% |
| Utilities | | 5.9% |
| Communication Services | | 4.0% |
| Health Care | | 3.6% |
| Other³ | | 0.6% |
| Total | | 100.0% |
1 Sector designations may be different than the sector designations presented in other Fund materials. The sector designations may represent the investment adviser's internal sector classifications.
2 For purposes of the Fund's compliance with its concentration limits, the Fund uses various sub-classifications and none of the Fund's holdings in the sub-classifications exceed 25% of the Fund's total assets.
3 Cash, cash equivalents, short-term investments and other assets less liabilities.
| | | | | | | | | | | | | | | | | | | | |
| | | | Average Annual Return* |
| | | | | | Since Inception |
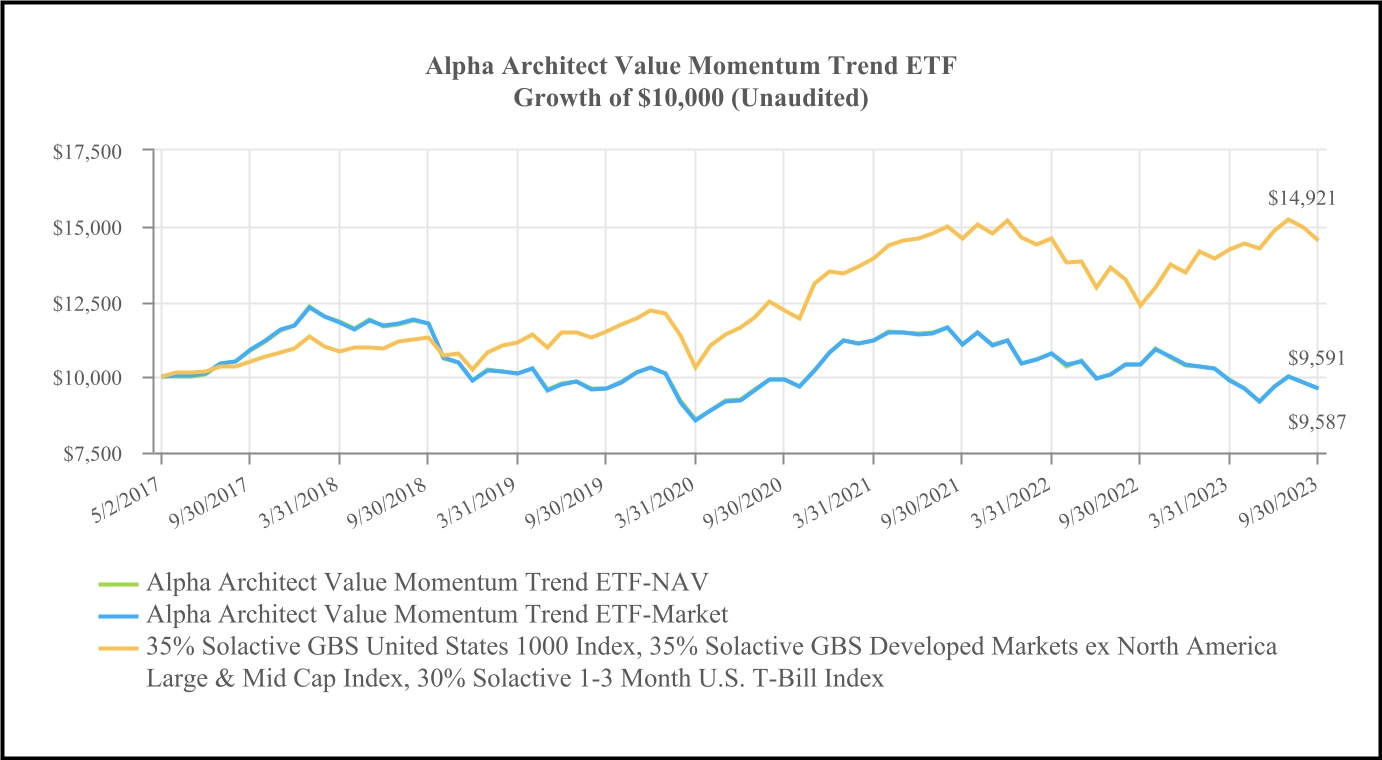
| | | | 1 Year | 5 Year | (May 2, 2017) |
| Alpha Architect Value Momentum Trend ETF - NAV | -7.75% | -4.00% | -0.65% |
| Alpha Architect Value Momentum Trend ETF - Market | -7.68% | -4.00% | -0.66% |
| 35% Solactive GBS United States 1000 Index, 35% Solactive GBS Developed Markets ex North America Large & Mid Cap Index, 30% Solactive 1-3 Month U.S. T-Bill Index | 17.50% | 5.18% | 5.99% |
| | | | | | |
| See “Index Overview” section for a description of the Index. | | | |
| | | | | | |
*This chart assumes an initial gross investment of $10,000 made on May 2, 2017. Returns shown include the dividends. Past performance does not guarantee future results. The graph and table do not reflect the deduction of taxes that a shareholder would pay on Fund distributions or the redemption of Fund shares. Investment return and principal value will fluctuate, so that your shares, when redeemed, may be worth more or less than the original cost. |
|
|
|
Tabular Presentation of Schedule of Investments
As of September 30, 2023
Alpha Architect Value Momentum Trend ETF
| | | | | | | | |
Sector1 | | % Net Assets |
| Investment Companies | | 98.7% |
Other2 | | 1.3% |
| Total | | 100.0% |
1 Sector designations may be different than the sector designations presented in other Fund materials. The sector designations may represent the investment adviser's internal sector classifications.
2 Cash, cash equivalents, short-term investments and other assets less liabilities.
| | | | | | | | | | | | | | | | | |
| | | | Cumulative Return |
| | | | Since Inception |
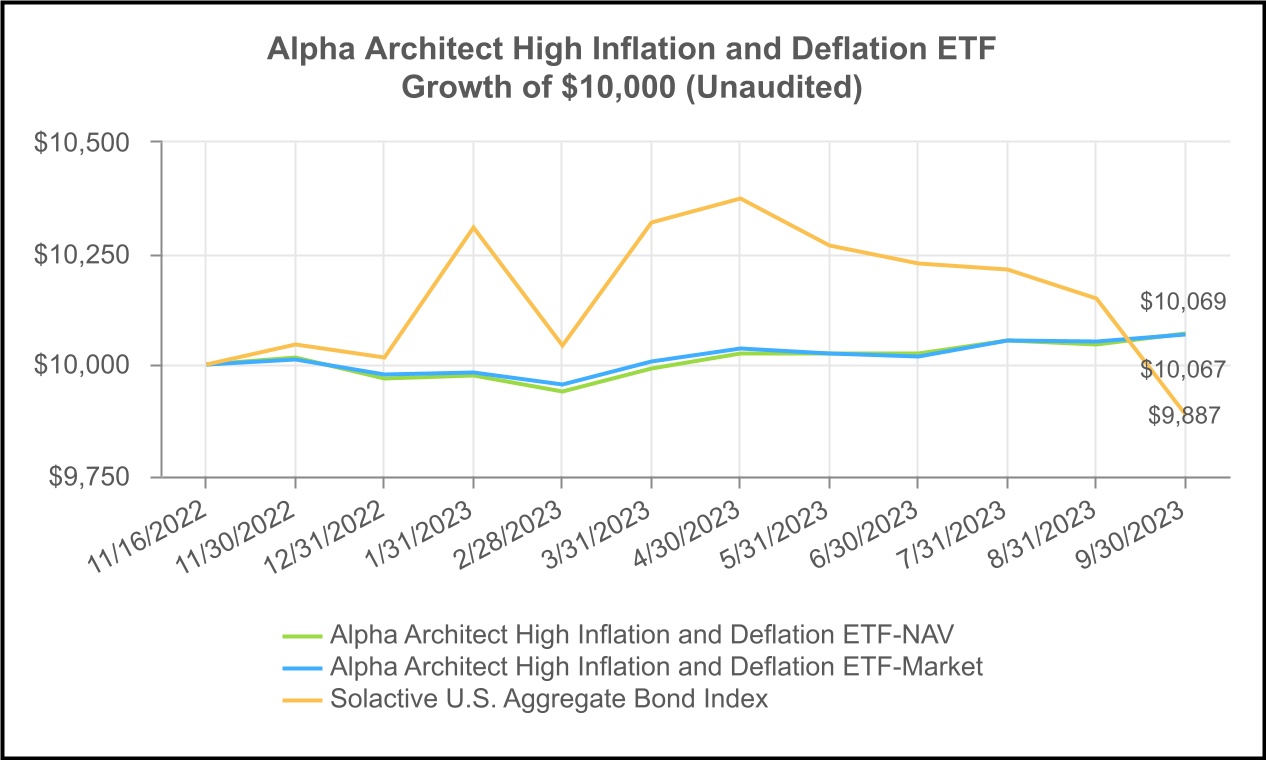
| | | | (November 16, 2022) |
| Alpha Architect High Inflation and Deflation ETF - NAV | 0.69% |
| Alpha Architect High Inflation and Deflation ETF - Market | 0.67% |
| Solactive U.S. Aggregate Bond Index | -1.13% |
| | | | | |
| See “Index Overview” section for a description of the Index. | |
| | | | | |
*This chart assumes an initial gross investment of $10,000 made on November 16, 2022. Returns shown include the dividends. Past performance does not guarantee future results. The graph and table do not reflect the deduction of taxes that a shareholder would pay on Fund distributions or the redemption of Fund shares. Investment return and principal value will fluctuate, so that your shares, when redeemed, may be worth more or less than the original cost. |
|
|
|
Tabular Presentation of Schedule of Investments
As of September 30, 2023
Alpha Architect High Inflation and Deflation ETF
| | | | | | | | |
Sector1 | | % Net Assets |
| U.S. Treasury Bills | | 87.1% |
| Investment Companies | | 12.4% |
| Other² | | 0.5% |
| Total | | 100.0% |
1 Sector designations may be different than the sector designations presented in other Fund materials. The sector designations may represent the investment adviser's internal sector classifications.
2 Cash, cash equivalents, short-term investments and other assets less liabilities.
| | | | | | | | | | | | | | | | | | | | | | | |
| | | | Average Annual Return* |
| | | Since Conversion | | | | Since Inception |
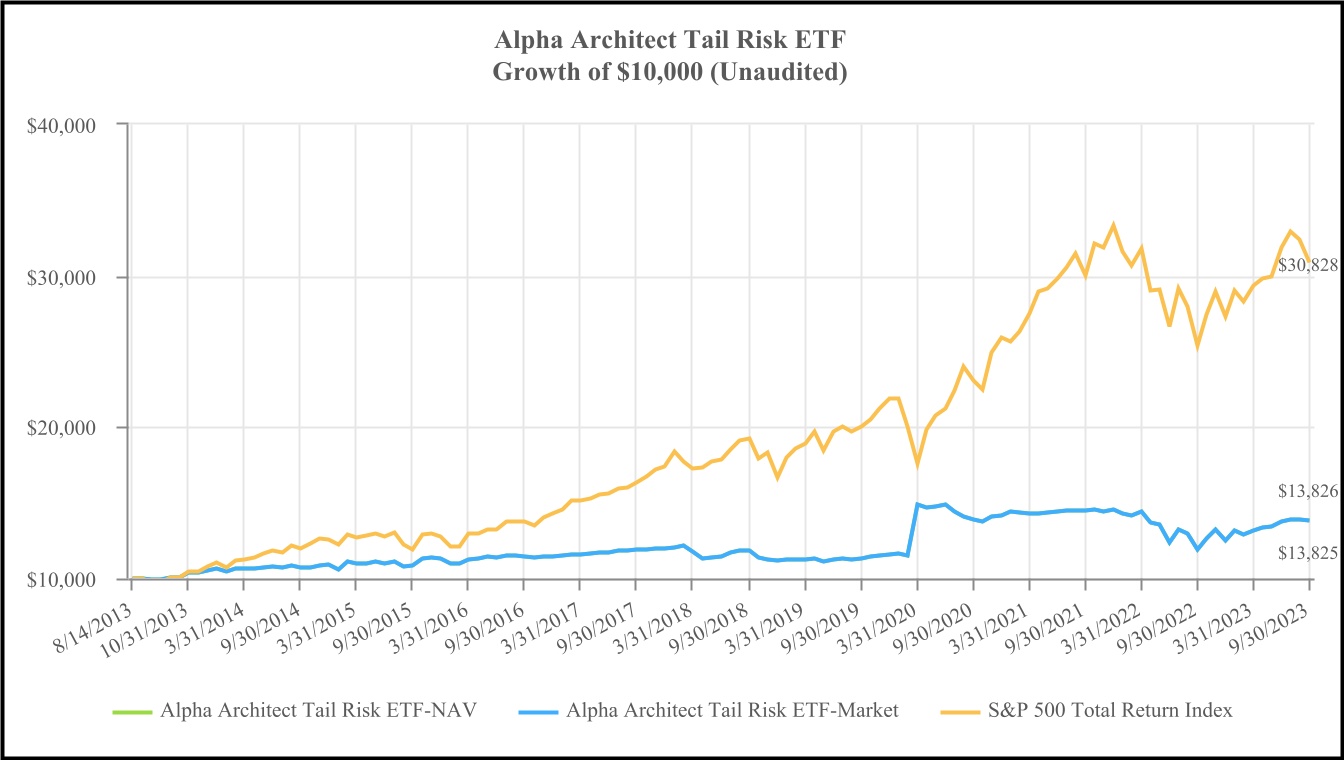
| | 7 Months | (March 6, 2023) | 1 Year | 5 Year | 10 Year | (August 14, 2013) |
| Alpha Architect Tail Risk ETF - NAV | 7.32% | 5.61% | 16.18% | 3.19% | 3.24% | 3.25% |
| Alpha Architect Tail Risk ETF - Market | 7.31% | 5.62% | 16.17% | 3.19% | 3.24% | 3.25% |
| S&P 500 Total Return Index | 9.04% | 6.90% | 21.62% | 9.92% | 11.91% | 11.76% |
| | | | | | | |
| See “Index Overview” section for a description of the Index. | |
| | | | | | | |
*This chart assumes an initial gross investment of $10,000 made on August 14, 2013. Returns shown include the dividends. Past performance does not guarantee future results. The graph and table do not reflect the deduction of taxes that a shareholder would pay on Fund distributions or the redemption of Fund shares. Investment return and principal value will fluctuate, so that your shares, when redeemed, may be worth more or less than the original cost. The Fund converted from a mutual fund to an ETF on March 6, 2023. The Fund has adopted the mutual fund’s prior performance for the periods before the conversion. |
|
|
|
Tabular Presentation of Schedule of Investments
As of September 30, 2023
Alpha Architect Tail Risk ETF
| | | | | | | | |
Sector1 | | % Net Assets |
| Purchased Options | | 82.5% |
| Affiliated Investment Companies | | 65.2% |
| Other² | | (47.7%) |
| Total | | 100.0% |
1 Sector designations may be different than the sector designations presented in other Fund materials. The sector designations may represent the investment adviser's internal sector classifications.
2 Cash, cash equivalents, short-term investments and other assets less liabilities.
ALPHA ARCHITECT ETFs
INDEX OVERVIEW
SEPTEMBER 30, 2023 (UNAUDITED)
Solactive GBS U.S. 1000 Index
The Solactive GBS U.S. 1000 Index intends to track the performance of the largest 1000 companies from the US stock market and is based on the Solactive Global Benchmark Series. Constituents are selected based on company market capitalization and weighted by free float market capitalization. The index is calculated as a net total return index in USD and is reconstituted quarterly.
Solactive Developed Markets ex N.A. Large and Mid Cap Index
The Solactive Developed Markets ex N.A. Large and Mid Cap Index is part of the Solactive Global Benchmark Series which includes benchmark indices for developed and emerging market countries. The index tracks the performance of the large and mid-cap segment covering approximately the largest 85% of the free-float market capitalization in the Developed Markets excluding North America. It is calculated as a Net Total Return index in CAD and weighted by free-float market capitalization.
Solactive 1-3 Month U.S. T-Bill Index
The Solactive 1-3 Month U.S. T-Bill Index is a rules-based, market value weighted index engineered for the short-term T-Bill market denominated in USD. The index is comprised of USD denominated T-Bills with a time to maturity of 1 to 3 months.
Solactive Aggregate U.S. Bond Index
The Solactive Aggregate U.S. Bond Index aims to track the performance of the USD denominated bond market.
S&P 500 Total Return Index
The S&P 500 Total Return Index is a stock market index tracking the performance of 500 large companies listed on stock exchanges in the United States.
| | |
| Alpha Architect U.S. Quantitative Value ETF |
| Schedule of Investments |
| September 30, 2023 |
| | | | | | | | | | | |
| Shares | | | Value |
| COMMON STOCKS - 99.8% | | |
| Agricultural & Farm Machinery - 1.9% | | |
| 45,624 | AGCO Corp. | | $ | 5,396,406 | |
| Air Freight & Logistics - 2.0% | | |
| 69,490 | Hub Group, Inc. - Class A (a) | | 5,457,745 | |
| Automotive Retail - 2.1% | | |
| 21,405 | Group 1 Automotive, Inc. | | 5,751,738 | |
| Biotechnology - 2.1% | | |
| 25,483 | United Therapeutics Corp. (a) | | 5,755,845 | |
| Broadcasting - 3.8% | | |
| 175,210 | Fox Corp. - Class A | | 5,466,552 | |
| 348,722 | TEGNA, Inc. | | 5,080,880 | |
| | | 10,547,432 | |
| Broadline Retail - 2.1% | | |
| 500,347 | Macy's, Inc. | | 5,809,029 | |
| Building Products - 4.0% | | |
| 41,160 | Owens Corning | | 5,614,636 | |
| 54,666 | UFP Industries, Inc. | | 5,597,798 | |
| | | 11,212,434 | |
| Coal & Consumable Fuels - 4.3% | | |
| 57,012 | CONSOL Energy, Inc. | | 5,981,129 | |
| 230,887 | Peabody Energy Corp. | | 6,000,753 | |
| | | 11,981,882 | |
| Construction Machinery & Heavy Transportation Equipment - 2.0% | | |
| 93,946 | Terex Corp. | | 5,413,169 | |
| Electrical Components & Equipment - 2.0% | | |
| 37,918 | Atkore, Inc. (a) | | 5,656,986 | |
| Electronic Components - 2.0% | | |
| 224,441 | Vishay Intertechnology, Inc. | | 5,548,182 | |
| Homebuilding - 19.2% | | |
| 20,240 | Cavco Industries, Inc. (a) | | 5,376,958 | |
| 49,993 | D.R. Horton, Inc. | | 5,372,748 | |
| 117,380 | KB Home | | 5,432,346 | |
| 47,796 | Lennar Corp. - Class A | | 5,364,145 | |
| 43,935 | Meritage Homes Corp. | | 5,377,205 | |
| 73,608 | PulteGroup, Inc. | | 5,450,672 | |
| 80,607 | Skyline Champion Corp. (a) | | 5,136,278 | |
| 124,793 | Taylor Morrison Home Corp. (a) | | 5,317,430 | |
| 71,497 | Toll Brothers, Inc. | | 5,287,918 | |
| 194,883 | Tri Pointe Homes, Inc. (a) | | 5,330,050 | |
| | | 53,445,750 | |
| Industrial Machinery & Supplies & Components - 2.1% | | |
| 76,047 | Mueller Industries, Inc. | | 5,715,693 | |
The accompanying notes are an integral part of these financial statements.
21
| | |
| Alpha Architect U.S. Quantitative Value ETF |
| Schedule of Investments (Continued) |
| September 30, 2023 |
| | | | | | | | | | | |
| Shares | | | Value |
| Integrated Oil & Gas - 2.0% | | |
| 47,865 | Exxon Mobil Corp. | | $ | 5,627,967 | |
| Oil & Gas Equipment & Services - 2.0% | | |
| 305,124 | Liberty Energy, Inc. | | 5,650,896 | |
| Oil & Gas Exploration & Production - 14.1% | | |
| 147,076 | Callon Petroleum Co. (a) | | 5,753,613 | |
| 35,257 | Chord Energy Corp. | | 5,714,102 | |
| 42,516 | EOG Resources, Inc. | | 5,389,328 | |
| 134,271 | EQT Corp. | | 5,448,717 | |
| 123,073 | Murphy Oil Corp. | | 5,581,361 | |
| 174,529 | Range Resources Corp. | | 5,656,485 | |
| 142,488 | SM Energy Co. | | 5,649,649 | |
| | | 39,193,255 | |
| Oil & Gas Refining & Marketing - 10.1% | | |
| 162,862 | CVR Energy, Inc. | | 5,542,194 | |
| 36,410 | Marathon Petroleum Corp. | | 5,510,289 | |
| 164,969 | Par Pacific Holdings, Inc. (a) | | 5,928,986 | |
| 103,633 | PBF Energy, Inc. - Class A | | 5,547,474 | |
| 39,034 | Valero Energy Corp. | | 5,531,508 | |
| | | 28,060,451 | |
| Oil & Gas Storage & Transportation - 6.2% | | |
| 33,867 | Cheniere Energy, Inc. | | 5,620,567 | |
| 131,116 | International Seaways, Inc. ADR (b) | | 5,900,220 | |
| 103,859 | Scorpio Tankers, Inc. ADR (b) | | 5,620,849 | |
| | | 17,141,636 | |
| Other Specialty Retail - 3.8% | | |
| 111,690 | Academy Sports & Outdoors, Inc. | | 5,279,586 | |
| 73,204 | Signet Jewelers Ltd. ADR (b) | | 5,256,779 | |
| | | 10,536,365 | |
| Packaged Foods & Meats - 2.1% | | |
| 121,264 | Cal-Maine Foods, Inc. | | 5,871,603 | |
| Passenger Airlines - 3.8% | | |
| 420,481 | American Airlines Group, Inc. (a) | | 5,386,362 | |
| 122,471 | United Airlines Holdings, Inc. (a) | | 5,180,523 | |
| | | 10,566,885 | |
| Steel - 4.1% | | | |
| 108,029 | Commercial Metals Co. | | 5,337,713 | |
| 56,489 | Steel Dynamics, Inc. | | 6,056,751 | |
| | | 11,394,464 | |
| Technology Distributors - 2.0% | | |
| 44,278 | Arrow Electronics, Inc. (a) | | 5,545,377 | |
| TOTAL COMMON STOCKS (Cost $259,648,789) | | 277,281,190 | |
| | | |
The accompanying notes are an integral part of these financial statements.
22
| | |
| Alpha Architect U.S. Quantitative Value ETF |
| Schedule of Investments (Continued) |
| September 30, 2023 |
| | | | | | | | | | | |
| Shares | | | Value |
| MONEY MARKET FUNDS - 0.2% | | |
| 506,480 | First American Government Obligations Fund - Class X, 5.26% (c) | | $ | 506,480 | |
| TOTAL MONEY MARKET FUNDS (Cost $506,480) | | 506,480 | |
| | | |
| TOTAL INVESTMENTS (Cost $260,155,269) - 100.0% | | 277,787,670 | |
| Other Assets in Excess of Liabilities - 0.0% (d) | | 65,184 | |
| TOTAL NET ASSETS - 100.0% | | $ | 277,852,854 | |
Percentages are stated as a percent of net assets.
| | | | | | | | |
| ADR - American Depositary Receipt | |
| | |
| (a) Non-income producing security. |
| (b) Foreign issued security. |
| (c) Rate shown is the 7-day effective yield. |
| (d) Represents less than 0.05% of net assets. |
The Global Industry Classification Standard (GICS®) was developed by and/or is the exclusive property of MSCI, Inc. and Standard & Poor Financial Services LLC (“S&P”). GICS is a service mark of MSCI and S&P and has been licensed for use by U.S. Bancorp Fund Services, LLC.
The accompanying notes are an integral part of these financial statements.
23
| | |
| Alpha Architect International Quantitative Value ETF |
| Schedule of Investments |
| September 30, 2023 |
| | | | | | | | | | | |
| Shares | | | Value |
| COMMON STOCKS - 98.8% | | |
| Australia - 14.0% | | |
| 245,939 | Fortescue Metals Group Ltd. | | $ | 3,308,009 | |
| 101,551 | JB Hi-Fi Ltd. | | 2,965,575 | |
| 803,961 | New Hope Corp. Ltd. | | 3,282,361 | |
| 1,029,572 | Pilbara Minerals Ltd. | | 2,846,444 | |
| 792,236 | Qantas Airways Ltd. (a) | | 2,638,528 | |
| 710,895 | Whitehaven Coal Ltd. | | 3,249,769 | |
| 124,303 | Woodside Energy Group Ltd. | | 2,916,305 | |
| | | 21,206,991 | |
| Austria - 5.7% | | |
| 63,800 | OMV AG | | 3,056,950 | |
| 101,853 | voestalpine AG | | 2,782,557 | |
| 110,996 | Wienerberger AG | | 2,821,107 | |
| | | 8,660,614 | |
| Bermuda - 2.1% | | |
| 509,028 | Hafnia Ltd. | | 3,166,955 | |
| | | |
| France - 7.4% | | |
| 200,854 | Air France-KLM (a) | | 2,526,575 | |
| 97,206 | Cie Generale des Etablissements Michelin SCA | | 2,987,555 | |
| 130,673 | Rexel S.A. | | 2,942,681 | |
| 224,549 | Vallourec SACA (a) | | 2,744,395 | |
| | | 11,201,206 | |
| Italy - 1.8% | | |
| 102,377 | Buzzi S.p.A. | | 2,805,531 | |
| | | |
| Japan - 44.1% | | |
| 285,911 | Amada Co., Ltd. | | 2,878,433 | |
| 60,864 | Ebara Corp. | | 2,854,629 | |
| 366,615 | Fujikura Ltd. | | 2,947,590 | |
| 58,364 | Horiba Ltd. | | 3,161,123 | |
| 211,521 | Inpex Corp. | | 3,193,197 | |
| 236,746 | Isuzu Motors Ltd. | | 2,979,128 | |
| 90,249 | Japan Petroleum Exploration Co., Ltd. | | 3,400,039 | |
| 66,027 | Macnica Holdings, Inc. | | 3,106,061 | |
| 290,039 | Mazda Motor Corp. | | 3,292,634 | |
| 786,702 | Mitsubishi Motors Corp. | | 3,429,187 | |
| 130,535 | Niterra Co., Ltd. | | 2,955,905 | |
| 88,410 | Open House Group Co., Ltd. | | 3,001,822 | |
| 68,550 | Sankyo Co., Ltd. | | 3,144,016 | |
| 197,026 | Sanwa Holdings Corp. | | 2,621,036 | |
| 95,648 | Shin-Etsu Chemical Co., Ltd. | | 2,779,706 | |
| 158,397 | Subaru Corp. | | 3,080,177 | |
| 120,066 | Sumitomo Heavy Industries Ltd. | | 3,046,643 | |
The accompanying notes are an integral part of these financial statements.
24
| | |
| Alpha Architect International Quantitative Value ETF |
| Schedule of Investments (Continued) |
| September 30, 2023 |
| | | | | | | | | | | |
| Shares | | | Value |
| 77,012 | Suzuki Motor Corp. | | $ | 3,100,269 | |
| 130,185 | Tokyo Gas Co., Ltd. | | 2,954,077 | |
| 266,263 | Tokyo Steel Manufacturing Co., Ltd. | | 3,002,229 | |
| 161,822 | Toyota Boshoku Corp. | | 2,951,865 | |
| 116,569 | Yamaha Motor Co., Ltd. | | 3,066,333 | |
| | | 66,946,099 | |
| Luxembourg - 1.9% | | |
| 185,899 | Tenaris S.A. | | 2,945,178 | |
| Netherlands - 5.7% | | |
| 215,578 | CNH Industrial N.V. ADR | | 2,608,494 | |
| 308,592 | Iveco Group N.V. (a) | | 2,891,307 | |
| 163,556 | Stellantis N.V. ADR (b) | | 3,128,826 | |
| | | 8,628,627 | |
| Spain - 4.1% | | |
| 147,582 | Endesa S.A. | | 3,007,499 | |
| 191,728 | Repsol S.A. | | 3,156,108 | |
| | | 6,163,607 | |
| United Kingdom - 11.9% | | |
| 538,432 | Barratt Developments PLC | | 2,897,784 | |
| 59,984 | Berkeley Group Holdings PLC | | 3,005,787 | |
| 489,791 | BP PLC | | 3,175,634 | |
| 92,855 | British American Tobacco PLC | | 2,919,562 | |
| 1,597,544 | Centrica PLC | | 3,010,501 | |
| 2,133,983 | Taylor Wimpey PLC | | 3,054,126 | |
| | | 18,063,394 | |
| TOTAL COMMON STOCKS (Cost $145,604,439) | | 149,788,202 | |
| | | |
| INVESTMENTS PURCHASED WITH PROCEEDS FROM SECURITIES LENDING - 0.5% | | |
| 790,000 | First American Government Obligations Fund - Class X, 5.26% (c) | | 790,000 | |
| TOTAL INVESTMENTS PURCHASED WITH PROCEEDS FROM SECURITIES LENDING (Cost $790,000) | | 790,000 | |
| | | |
| SHORT-TERM INVESTMENTS - 0.3% | | |
| MONEY MARKET FUNDS - 0.3% | | |
| 440,434 | First American Government Obligations Fund - Class X, 5.26% (c) | | 440,434 | |
| TOTAL MONEY MARKET FUNDS (Cost $440,434) | | 440,434 | |
| | | |
| TOTAL INVESTMENTS (Cost $146,834,873) - 99.6% | | 151,018,636 | |
| Other Assets in Excess of Liabilities - 0.4% | | 659,070 | |
| TOTAL NET ASSETS - 100.0% | | $ | 151,677,706 | |
The accompanying notes are an integral part of these financial statements.
25
| | |
| Alpha Architect International Quantitative Value ETF |
| Schedule of Investments (Continued) |
| September 30, 2023 |
Percentages are stated as a percent of net assets.
| | |
| ADR - American Depositary Receipt |
| PLC - Public Limited Company |
|
| (a) Non-income producing security. |
| (b) This security or a portion of this security was out on loan as of September 30, 2023. Total loaned securities had a market value of $765,200 as of September 30, 2023. |
| (c) Rate shown is the 7-day effective yield. |
The accompanying notes are an integral part of these financial statements.
26
| | |
| Alpha Architect U.S. Quantitative Momentum ETF |
| Schedule of Investments |
| September 30, 2023 |
| | | | | | | | | | | | | | |
| Shares | | | | Value |
| COMMON STOCKS - 99.9% | | |
| Apparel Retail - 4.4% | | |
| 57,886 | | Abercrombie & Fitch Co. - Class A (a) | | $ | 3,263,035 | |
| 94,309 | | Urban Outfitters, Inc. (a) | | 3,082,962 | |
| | | | 6,345,997 | |
| Application Software - 3.8% | | |
| 15,942 | | Appfolio, Inc. - Class A (a) | | 2,911,487 | |
| 91,392 | | DoubleVerify Holdings, Inc. (a) | | 2,554,406 | |
| | | | 5,465,893 | |
| Automotive Parts & Equipment - 2.0% | | |
| 63,416 | | Modine Manufacturing Co. (a) | | 2,901,282 | |
| Biotechnology - 4.1% | | |
| 24,227 | | Krystal Biotech, Inc. (a) | | 2,810,332 | |
| 264,187 | | Roivant Sciences Ltd. ADR (a)(b) | | 3,085,704 | |
| | | | 5,896,036 | |
| Building Products - 3.8% | | |
| 21,407 | | Builders FirstSource, Inc. (a) | | 2,664,957 | |
| 21,355 | | Owens Corning | | 2,913,036 | |
| | | | 5,577,993 | |
| Cargo Ground Transportation - 2.0% | | |
| 7,242 | | Saia, Inc. (a) | | 2,887,023 | |
| Casinos & Gaming - 3.9% | | |
| 96,307 | | International Game Technology PLC (b) | | 2,920,028 | |
| 30,455 | | Wynn Resorts Ltd. | | 2,814,347 | |
| | | | 5,734,375 | |
| Communications Equipment - 1.9% | | |
| 112,639 | | Extreme Networks, Inc. (a) | | 2,726,990 | |
| Construction & Engineering - 5.8% | | |
| 16,586 | | Comfort Systems USA, Inc. | | 2,826,420 | |
| 13,688 | | EMCOR Group, Inc. | | 2,879,818 | |
| 37,314 | | Sterling Infrastructure, Inc. (a) | | 2,741,833 | |
| | | | 8,448,071 | |
| Construction Machinery & Heavy Transportation Equipment - 4.1% | | |
| 50,915 | | Allison Transmission Holdings, Inc. | | 3,007,040 | |
| 50,141 | | Terex Corp. | | 2,889,124 | |
| | | | 5,896,164 | |
| Copper - 2.0% | | | | |
| 38,032 | | Southern Copper Corp. | | 2,863,429 | |
| Diversified Banks - 2.2% | | |
| 448,157 | | NU Holdings Ltd. - Class A ADR (a)(b) | | 3,249,138 | |
| Electrical Components & Equipment - 6.0% | | |
| 20,103 | | Atkore, Inc. (a) | | 2,999,167 | |
| 29,393 | | EnerSys | | 2,782,635 | |
| 54,277 | | nVent Electric PLC ADR (b) | | 2,876,138 | |
| | | | 8,657,940 | |
The accompanying notes are an integral part of these financial statements.
27
| | |
| Alpha Architect U.S. Quantitative Momentum ETF |
| Schedule of Investments (Continued) |
| September 30, 2023 |
| | | | | | | | | | | | | | |
| Shares | | | | Value |
| Electronic Equipment & Instruments - 2.0% | | |
| 51,470 | | Crane NXT Co. | | $ | 2,860,188 | |
| Electronic Manufacturing Services - 2.3% | | |
| 26,694 | | Jabil, Inc. | | 3,387,202 | |
| Footwear - 2.0% | | |
| 5,837 | | Deckers Outdoor Corp. (a) | | 3,000,743 | |
| Health Care Equipment - 1.9% | | |
| 11,467 | | Penumbra, Inc. (a) | | 2,773,982 | |
| Homebuilding - 15.3% | | |
| 25,891 | | D.R. Horton, Inc. | | 2,782,506 | |
| 60,723 | | KB Home | | 2,810,260 | |
| 25,756 | | Lennar Corp. - Class A | | 2,890,596 | |
| 31,545 | | M/I Homes, Inc. (a) | | 2,651,042 | |
| 22,199 | | Meritage Homes Corp. | | 2,716,936 | |
| 37,568 | | PulteGroup, Inc. | | 2,781,910 | |
| 65,245 | | Taylor Morrison Home Corp. (a) | | 2,780,089 | |
| 37,650 | | Toll Brothers, Inc. | | 2,784,594 | |
| | | | 22,197,933 | |
| Hotels, Resorts & Cruise Lines - 2.0% | | |
| 31,029 | | Royal Caribbean Cruises Ltd. ADR (a)(b) | | 2,859,012 | |
| Industrial Conglomerates - 2.0% | | |
| 26,852 | | General Electric Co. | | 2,968,489 | |
| Movies & Entertainment - 1.8% | | |
| 7,081 | | Netflix, Inc. (a) | | 2,673,786 | |
| Oil & Gas Drilling - 2.0% | | |
| 57,390 | | Noble Corp. PLC ADR (b) | | 2,906,804 | |
| Oil & Gas Equipment & Services - 6.6% | | |
| 162,986 | | TechnipFMC PLC ADR (b) | | 3,315,135 | |
| 45,862 | | Tidewater, Inc. (a) | | 3,259,412 | |
| 34,159 | | Weatherford International PLC ADR (a)(b) | | 3,085,582 | |
| | | | 9,660,129 | |
| Personal Care Products - 1.7% | | |
| 22,078 | | elf Beauty, Inc. (a) | | 2,424,827 | |
| Property & Casualty Insurance - 2.2% | | |
| 39,796 | | Arch Capital Group Ltd. ADR (a)(b) | | 3,172,139 | |
| Semiconductor Materials & Equipment - 1.8% | | |
| 16,037 | | Axcelis Technologies, Inc. (a) | | 2,614,833 | |
| Semiconductors - 2.1% | | |
| 53,938 | | Rambus, Inc. (a) | | 3,009,201 | |
| Technology Hardware, Storage & Peripherals - 2.1% | | |
| 11,189 | | Super Micro Computer, Inc. (a) | | 3,068,248 | |
| Trading Companies & Distributors - 4.0% | | |
| 28,207 | | Boise Cascade Co. | | 2,906,449 | |
| 82,832 | | FTAI Aviation Ltd. ADR (b) | | 2,944,678 | |
| | | | 5,851,127 | |
The accompanying notes are an integral part of these financial statements.
28
| | |
| Alpha Architect U.S. Quantitative Momentum ETF |
| Schedule of Investments (Continued) |
| September 30, 2023 |
| | | | | | | | | | | | | | |
| Shares | | | | Value |
| Transaction & Payment Processing Services - 2.1% | | |
| 122,915 | | Remitly Global, Inc. (a) | | $ | 3,099,916 | |
| | TOTAL COMMON STOCKS (Cost $145,609,014) | | 145,178,890 | |
| | | | |
| MONEY MARKET FUNDS - 0.1% | | |
| 182,039 | | First American Government Obligations Fund - Class X, 5.26% (c) | | 182,039 | |
| | TOTAL MONEY MARKET FUNDS (Cost $182,039) | | 182,039 | |
| | | | |
| | TOTAL INVESTMENTS (Cost $145,791,053) - 100.0% | | 145,360,929 | |
| | Liabilities in Excess of Other Assets - (0.0%) (d) | | (39,930) | |
| | TOTAL NET ASSETS - 100.0% | | $ | 145,320,999 | |
Percentages are stated as a percent of net assets.
ADR - American Depositary Receipt
PLC - Public Limited Company
| | | | | |
| (a) | Non-income producing security. |
| (b) | Foreign issued security. |
| (c) | Rate shown is the 7-day effective yield. |
| (d) | Represents less than 0.05% of net assets. |
The Global Industry Classification Standard (GICS®) was developed by and/or is the exclusive property of MSCI, Inc. and Standard & Poor Financial Services LLC (“S&P”). GICS is a service mark of MSCI and S&P and has been licensed for use by U.S. Bancorp Fund Services, LLC.
The accompanying notes are an integral part of these financial statements.
29
| | |
| Alpha Architect International Quantitative Momentum ETF |
| Schedule of Investments |
| September 30, 2023 |
| | | | | | | | | | | | | | |
| Shares | | | | Value |
| COMMON STOCKS - 99.4% | | |
| Cayman Islands - 1.9% | | |
| 140,037 | | Melco Resorts & Entertainment Ltd. ADR (a) | | $ | 1,384,966 | |
| Denmark - 2.1% | | |
| 14,687 | | Pandora A/S | | 1,523,153 | |
| France - 11.5% | | |
| 42,507 | | Accor S.A. | | 1,435,401 | |
| 743 | | Hermes International SCA | | 1,358,822 | |
| 19,356 | | Publicis Groupe S.A. | | 1,468,506 | |
| 65,420 | | Rexel S.A. | | 1,473,221 | |
| 48,964 | | SCOR SE | | 1,525,579 | |
| 32,083 | | Verallia S.A. (b) | | 1,264,529 | |
| | | | 8,526,058 | |
| Germany - 19.4% | | |
| 40,342 | | AIXTRON SE | | 1,485,128 | |
| 138,845 | | Commerzbank AG | | 1,583,906 | |
| 172,110 | | Deutsche Lufthansa AG (a) | | 1,365,817 | |
| 12,102 | | Gerresheimer AG | | 1,272,447 | |
| 18,883 | | Heidelberg Materials AG | | 1,467,757 | |
| 42,745 | | Infineon Technologies AG | | 1,417,000 | |
| 3,941 | | Muenchener Rueckversicherungs-Gesellschaft AG in Muenchen | | 1,537,900 | |
| 10,948 | | SAP SE | | 1,421,614 | |
| 22,894 | | Talanx AG | | 1,452,281 | |
| 82,649 | | TeamViewer SE (a)(b) | | 1,394,595 | |
| | | | 14,398,445 | |
| Ireland - 6.0% | | |
| 334,536 | | AIB Group PLC | | 1,506,712 | |
| 154,270 | | Bank of Ireland Group PLC | | 1,515,217 | |
| 26,758 | | CRH PLC | | 1,424,114 | |
| | | | 4,446,043 | |
| Italy - 14.0% | | | | |
| 802,422 | | A2A S.p.A. | | 1,430,336 | |
| 167,507 | | Banca Mediolanum S.p.A. | | 1,434,838 | |
| 324,270 | | Banco BPM S.p.A. | | 1,554,754 | |
| 511,671 | | BPER Banca | | 1,567,173 | |
| 50,691 | | Buzzi S.p.A. | | 1,389,132 | |
| 576,691 | | Intesa Sanpaolo S.p.A. | | 1,487,684 | |
| 63,475 | | UniCredit S.p.A. | | 1,525,387 | |
| | | | 10,389,304 | |
| Japan - 16.3% | | |
| 7,852 | | Disco Corp. | | 1,449,131 | |
| 124,125 | | Kobe Steel Ltd. | | 1,618,841 | |
| 111,553 | | NOK Corp. | | 1,482,123 | |
| 33,654 | | Sumitomo Mitsui Financial Group, Inc. | | 1,654,550 | |
| 95,956 | | T&D Holdings, Inc. | | 1,584,712 | |
The accompanying notes are an integral part of these financial statements.
30
| | |
| Alpha Architect International Quantitative Momentum ETF |
| Schedule of Investments |
| September 30, 2023 |
| | | | | | | | | | | | | | |
| Shares | | | | Value |
| 88,204 | | TBS Holdings, Inc. | | $ | 1,484,134 | |
| 27,704 | | Tokyo Seimitsu Co., Ltd. | | 1,388,537 | |
| 32,145 | | Zensho Holdings Co., Ltd. | | 1,397,740 | |
| | | | 12,059,768 | |
| Luxembourg - 2.1% | | |
| 212,239 | | B&M European Value Retail S.A. | | 1,518,508 | |
| Netherlands - 3.8% | | |
| 4,785 | | Ferrari N.V. ADR | | 1,414,159 | |
| 107,391 | | ING Groep N.V. | | 1,424,916 | |
| | | | 2,839,075 | |
| Singapore - 1.9% | | |
| 380,678 | | Sembcorp Industries Ltd. | | 1,417,448 | |
| Spain - 8.4% | | | | |
| 43,449 | | ACS Actividades de Construccion y Servicios S.A. | | 1,565,055 | |
| 195,259 | | Banco Bilbao Vizcaya Argentaria S.A. | | 1,591,634 | |
| 107,647 | | Indra Sistemas S.A. | | 1,559,194 | |
| 39,703 | | Industria de Diseno Textil S.A. | | 1,481,333 | |
| | | | 6,197,216 | |
| Sweden - 2.0% | | |
| 102,686 | | H & M Hennes & Mauritz AB | | 1,461,122 | |
| Switzerland - 2.0% | | |
| 23,196 | | Holcim AG | | 1,489,551 | |
| United Kingdom - 8.0% | | |
| 61,154 | | 3i Group PLC | | 1,546,758 | |
| 808,409 | | Centrica PLC | | 1,523,411 | |
| 11,291 | | Games Workshop Group PLC | | 1,456,148 | |
| 55,593 | | Hikma Pharmaceuticals PLC | | 1,416,279 | |
| | | | 5,942,596 | |
| | TOTAL COMMON STOCKS (Cost $75,407,678) | | 73,593,253 | |
| | | | |
| MONEY MARKET FUNDS - 0.2% | | |
| 145,636 | | First American Government Obligations Fund - Class X, 5.26% (c) | | 145,636 | |
| | TOTAL MONEY MARKET FUNDS (Cost $145,636) | | 145,636 | |
| | | | |
| | TOTAL INVESTMENTS (Cost $75,553,314) - 99.6% | | 73,738,889 | |
| | Other Assets in Excess of Liabilities - 0.4% | | 285,071 | |
| | TOTAL NET ASSETS - 100.0% | | $ | 74,023,960 | |
Percentages are stated as a percent of net assets.
ADR - American Depositary Receipt
PLC - Public Limited Company
| | | | | |
| (a) | Non-income producing security. |
| (b) | 144A restricted security. |
| (c) | Rate shown is the 7-day effective yield. |
The accompanying notes are an integral part of these financial statements.
31
| | |
| Alpha Architect Value Momentum Trend ETF |
| Schedule of Investments |
| September 30, 2023 |
| | | | | | | | | | | | | | |
| Shares | | | | Value |
| INVESTMENT COMPANIES - 98.7% | | |
| International Developed Equity - 54.2% | | |
| 281,078 | | Alpha Architect International Quantitative Momentum ETF (a) | | $ | 6,892,369 | |
| 513,468 | | Alpha Architect International Quantitative Value ETF (a)(b) | | 12,112,351 | |
| | | | 19,004,720 | |
| U.S. Equity - 44.5% | | |
| 116,054 | | Alpha Architect U.S. Quantitative Momentum ETF (a) | | 5,004,121 | |
| 285,252 | | Alpha Architect U.S. Quantitative Value ETF (a) | | 10,585,702 | |
| | | | 15,589,823 | |
| | TOTAL INVESTMENT COMPANIES (Cost $34,307,918) | | 34,594,543 | |
| | | | |
| INVESTMENTS PURCHASED WITH PROCEEDS FROM SECURITIES LENDING - 0.0% | | |
| 2,450 | | First American Government Obligations Fund - Class X, 5.26% (c)(d) | | 2,450 | |
| | TOTAL INVESTMENTS PURCHASED WITH PROCEEDS FROM SECURITIES LENDING (Cost $2,450) | | 2,450 | |
| | | | |
| MONEY MARKET FUNDS - 0.9% | | |
| 328,886 | | First American Government Obligations Fund - Class X, 5.26% (c) | | 328,886 | |
| | TOTAL MONEY MARKET FUNDS (Cost $328,886) | | 328,886 | |
| | | | |
| | TOTAL INVESTMENTS (Cost $34,639,254) - 99.6% | | 34,925,879 | |
| | Other Assets in Excess of Liabilities - 0.4% | | 147,282 | |
| | TOTAL NET ASSETS - 100.0% | | $ | 35,073,161 | |
Percentages are stated as a percent of net assets.
| | | | | |
| (a) | Affiliated fund. |
| (b) | This security or a portion of this security was out on loan as of September 30, 2023. Total loaned securities had a market value of $2,359 as of September 30, 2023. |
| (c) | Rate shown is the 7-day effective yield. |
| (d) | Represents less than 0.05% of Net Assets |
The accompanying notes are an integral part of these financial statements.
32
| | |
| Alpha Architect High Inflation and Deflation ETF |
| Schedule of Investments |
| September 30, 2023 |
| | | | | | | | | | | | | | | | | | | | | | | | | | |
| Shares | | | | | | | | Value |
| INVESTMENT COMPANIES - 12.4% | | | | | | |
| 94,947 | | GraniteShares Bloomberg Commodity Broad Str No K-1 | | | | | | $ | 2,049,906 | |
| | TOTAL INVESTMENT COMPANIES (Cost $2,076,623) | | | | | | 2,049,906 | |
| | | | | | | | |
| Principal Amount | | | | Effective Yield | | Maturity Date | | |
| SHORT TERM INVESTMENTS - 87.6% | | | | | | |
| U.S. Treasury Bills - 87.1% | | | | | | |
| 3,892,000 | | United States Treasury Bill (a) | | 4.21% | | 10/05/2023 | | 3,889,772 | |
| 480,000 | | United States Treasury Bill (a) | | 5.16% | | 11/02/2023 | | 477,790 | |
| 179,000 | | United States Treasury Bill (a) | | 5.23% | | 11/09/2023 | | 177,990 | |
| 1,869,000 | | United States Treasury Bill (a) | | 5.33% | | 12/07/2023 | | 1,850,814 | |
| 3,385,000 | | United States Treasury Bill (a) | | 5.34% | | 12/14/2023 | | 3,348,591 | |
| 393,000 | | United States Treasury Bill (a) | | 5.34% | | 12/19/2023 | | 388,489 | |
| 416,000 | | United States Treasury Bill (a) | | 5.37% | | 12/21/2023 | | 411,097 | |
| 3,929,000 | | United States Treasury Bill (a) | | 5.37% | | 12/28/2023 | | 3,878,629 | |
| | | | | | | | 14,423,172 | |
| | | | | | | | |
| Money Market Deposit Account - 0.5% | | | | | | |
| 78,261 | | U.S. Bank Money Market Deposit Account, 5.20% (b) | | | | | | 78,261 | |
| | TOTAL SHORT TERM INVESTMENTS (Cost $14,501,165) | | | | | | 14,501,433 | |
| | | | | | | | |
| | TOTAL INVESTMENTS (Cost $16,577,788) - 100.0% | | | | | | 16,551,339 | |
| | Liabilities in Excess of Other Assets - (0.0%) (c) | | | | | | (1,040) | |
| | TOTAL NET ASSETS - 100.0% | | | | | | $ | 16,550,299 | |
| | | | | | | | | | | | | | | | | | | | | | | | | | | | | |
| Percentages are stated as a percent of net assets. | | | | | | | | |
| | | | | | | | | |
| (a) | Zero coupon bond. | | | | | | | | |
| (b) | The U.S. Bank Money Market Deposit Account (the “MMDA”) is a short-term investment vehicle in which the Fund holds cash balances. The MMDA will bear interest at a variable rate that is determined based on conditions and may change daily and by any amount. The rate shown is as of September 30, 2023. | | | | | | | | |
| (c) | Represents less than 0.05% of net assets. | | | | | | | | |
The accompanying notes are an integral part of these financial statements.
33
| | |
| Alpha Architect Tail Risk ETF |
| Schedule of Investments |
| September 30, 2023 |
| | | | | | | | | | | | | | | | | | | | |
| Shares | | | | | Value |
| AFFILIATED INVESTMENT COMPANIES - 65.2% | | | |
| 1,035,000 | | | Alpha Architect 1-3 Month Box ETF (a) | | $ | 107,308,800 | |
| | | | TOTAL INVESTMENT COMPANIES (Cost $104,646,575) | | | 107,308,800 | |
| | | | | | | | | | | | | | | | | | | | | | | | | | | | | | | | |
| Contracts | | | | | Notional
Amount | | | |
| PURCHASED OPTIONS - 82.5% (b)(c)(d) | | | | | | | |
| CALL OPTIONS - 12.5% | | | | | | | |
| | | | S&P 500® Index | | | | | | | |
| 4 | | | Expiration: 12/15/2023, Strike Price $4,000 | | $ | 1,715,220 | | | | | 145,300 | |
| 321 | | | Expiration: 01/19/2024, Strike Price $4,000 | | | 137,646,405 | | | | | 12,766,812 | |
| | | | | | | | | | | 12,912,112 | |
| | | MercadoLibre, Inc. | | | | | | | |
| 3,000 | | | Expiration: 10/27/2023, Strike Price $1,331 (e) | | | 380,364,000 | | | | | 7,666,650 | |
| | | | | | | | | | 7,666,650 | |
| PUT OPTIONS - 70.0% | | | | | | | |
| | | | S&P 500® Index | | | | | | | |
| 402 | | | Expiration: 10/13/2023, Strike Price $4,250 | | | 172,379,610 | | | | | 1,368,810 | |
| 1,596 | | | Expiration: 10/20/2023, Strike Price $1,900 | | | 684,372,780 | | | | | 7,980 | |
| 672 | | | Expiration: 11/17/2023, Strike Price $1,900 | | | 288,156,960 | | | | | 10,080 | |
| 960 | | | Expiration: 11/17/2023, Strike Price $1,900 | | | 411,652,800 | | | | | 12,000 | |
| 2,188 | | | Expiration: 12/15/2023, Strike Price $2,200 | | | 938,225,340 | | | | | 158,630 | |
| 4 | | | Expiration: 12/15/2023, Strike Price $5,000 | | | 1,715,220 | | | | | 266,543 | |
| 220 | | | Expiration: 12/15/2023, Strike Price $7,300 | | | 94,337,100 | | | | | 64,575,500 | |
| 200 | | | Expiration: 01/19/2024, Strike Price $2,200 | | | 85,761,000 | | | | | 33,500 | |
| 321 | | | Expiration: 01/19/2024, Strike Price $5,000 | | | 137,646,405 | | | | | 20,648,729 | |
| | | | | | | | | | 87,081,772 | |
| | | MercadoLibre, Inc. | | | | | | | |
| 3,000 | | | Expiration: 10/27/2023, Strike Price $1,346 (e) | | | 380,364,000 | | | | | 28,089,120 | |
| | | | | | | | | | | 28,089,120 | |
| | | | TOTAL PURCHASED OPTIONS (Cost $145,963,158) | | | | | | | 135,749,654 | |
| Shares | | | | | | | | | |
| MONEY MARKET FUNDS - 0.1% | | | | | | | |
| 216,904 | | | First American Government Obligations Fund - Class X, 5.26% (f) | | | | | | | 216,904 | |
| | | | TOTAL MONEY MARKET FUNDS (Cost $216,904) | | | | | | | 216,904 | |
| | | | | | | | | | | |
| | | | TOTAL INVESTMENTS (Cost $250,826,637) - 147.8% | | | | | | | 243,275,358 | |
| | | | Liabilities in Excess of Other Assets - (47.8%) | | | | | | | (78,685,310) | |
| | | | TOTAL NET ASSETS - 100.0% | | | | | | $ | 164,590,048 | |
The accompanying notes are an integral part of these financial statements.
34
| | | | | | | | |
| Percentages are stated as a percent of net assets. |
| | |
| (a) | Affiliated fund. |
| (b) | Exchange-Traded. |
| (c) | Purchased option contracts are held in connection with corresponding written option contracts. See the Schedule of Written Options for further information. |
| (d) | Each contract equals 100 shares. |
| (e) | Flexible Exchange® Options. |
| (f) | Rate shown is the 7-day effective yield. |
The accompanying notes are an integral part of these financial statements.
35
| | |
| Alpha Architect Tail Risk ETF |
| Schedule of Written Options |
| September 30, 2023 |
| | | | | | | | | | | | | | | | | | | | | | | | | | | | | | | | |
| Contracts | | | | | Notional
Amount | | | Value |
| WRITTEN OPTIONS - (47.8%) (a)(b) | | | | | | | |
| CALL OPTIONS - (3.9%) | | | | | | | |
| | | | S&P 500® Index | | | | | | | |
| 4 | | | Expiration: 12/15/2023, Strike Price $5,000.00 | | $ | (1,715,220) | | | | $ | (310) | |
| 321 | | | Expiration: 01/19/2024, Strike Price $5,000.00 | | | (137,646,405) | | | | | (66,386) |
| | | | | | | | | | | (66,696) |
| | | MercadoLibre, Inc. | | | | | | | |
| 3,000 | | | Expiration: 10/27/2023, Strike Price $1,346.00 (c) | | | (380,364,000) | | | | | (6,365,310) |
| | | | | | | | | | (6,365,310) |
| PUT OPTIONS - (43.9%) | | | | | | | |
| | | | S&P 500® Index | | | | | | | |
| 402 | | | Expiration: 10/13/2023, Strike Price $4,150.00 | | | (172,379,610) | | | | | (538,680) |
| 402 | | | Expiration: 10/13/2023, Strike Price $4,300.00 | | | (172,379,610) | | | | | (2,100,450) |
| 4 | | | Expiration: 12/15/2023, Strike Price $4,000.00 | | | (1,715,220) | | | | | (16,307) |
| 220 | | | Expiration: 12/15/2023, Strike Price $6,300.00 | | | (94,337,100) | | | | | (42,834,000) |
| 321 | | | Expiration: 01/19/2024, Strike Price $4,000.00 | | | (137,646,405) | | | | | (1,806,671) |
| | | | | | | | | | (47,296,108) |
| | | MercadoLibre, Inc. | | | | | | | |
| 3,000 | | | Expiration: 10/27/2023, Strike Price $1,331.00 (c) | | | (380,364,000) | | | | | (24,909,930) |
| | | | TOTAL WRITTEN OPTIONS (Premiums Received $71,323,659) | | | | | | $ | (78,638,044) | |
| | | | | | | | |
| Percentages are stated as a percent of net assets. |
| | |
| (a) | Exchange-Traded. |
| (b) | Each contract equals 100 shares. |
| (c) | Flexible Exchange® Options. |
The accompanying notes are an integral part of these financial statements.
36
STATEMENT OF ASSETS AND LIABILITIES
September 30, 2023
| | | | | | | | | | | |
| Alpha Architect U.S. Quantitative Value ETF | | Alpha Architect International Quantitative Value ETF |
| Assets: | | | |
Investments in securities, at value (1) | $ | 277,787,670 | | | $ | 151,018,636 | |
| Foreign currency, at value | — | | | 13,290 | |
| Receivable for investments sold | 8,107,690 | | | — | |
| Receivable for fund shares sold | — | | | 3,541,140 | |
| Dividends and interest receivable | 221,865 | | | 1,450,465 | |
| Securities lending income receivable (Note 5) | 2 | | | 57 | |
| Total assets | 286,117,227 | | | 156,023,588 | |
| | | |
| Liabilities: | | | |
| Payable for fund shares redeemed | 8,172,142 | | | — | |
| Payable for investment securities purchased | — | | | 3,494,263 | |
| Due to securities lending agent (Note 5) | — | | | 790,000 | |
| Accrued investment advisory fees | 92,231 | | | 61,619 | |
| Total liabilities | 8,264,373 | | | 4,345,882 | |
| Net Assets | $ | 277,852,854 | | | $ | 151,677,706 | |
| | | |
| Net Assets Consist of: | | | |
| Paid-in capital | 390,800,657 | | | 247,619,284 | |
| Total distributable earnings (accumulated deficit) | (112,947,803) | | | (95,941,578) | |
| Net Assets: | $ | 277,852,854 | | | $ | 151,677,706 | |
| | | |
| Calculation of Net Asset Value Per Share: | | | |
| Net Assets | $ | 277,852,854 | | | $ | 151,677,706 | |
| Shares Outstanding (unlimited shares of beneficial interest authorized, no par value) | 7,480,000 | | | 6,425,000 | |
| Net Asset Value per Share | $ | 37.15 | | | $ | 23.61 | |
| | | |
| Cost of Investments in Securities | $ | 260,155,269 | | | $ | 146,834,873 | |
| Cost of Foreign Currency | $ | — | | | $ | 13,235 | |
(1) Includes loaned securities with a value of | $ | — | | | $ | 765,200 | |
The accompanying notes are an integral part of these financial statements.
37
STATEMENT OF ASSETS AND LIABILITIES
| | | | | | | | | | | |
| Alpha Architect U.S. Quantitative Momentum ETF | | Alpha Architect International Quantitative Momentum ETF |
| Assets: | | | |
| Investments in securities, at value | $ | 145,360,929 | | | $ | 73,738,889 | |
| Dividends and interest receivable | 9,370 | | | 335,374 | |
| Total assets | 145,370,299 | | | 74,074,263 | |
| | | |
| Liabilities: | | | |
| Due to custodian | — | | | 19,101 | |
| Accrued investment advisory fees | 49,300 | | | 31,202 | |
| Total liabilities | 49,300 | | | 50,303 | |
| Net Assets | $ | 145,320,999 | | | $ | 74,023,960 | |
| | | |
| Net Assets Consist of: | | | |
| Paid-in capital | $ | 247,629,147 | | | $ | 157,875,620 | |
| Total distributable earnings (accumulated deficit) | (102,308,148) | | | (83,851,660) | |
| Net Assets: | $ | 145,320,999 | | | $ | 74,023,960 | |
| | | |
| Calculation of Net Asset Value Per Share: | | | |
| Net Assets | $ | 145,320,999 | | | $ | 74,023,960 | |
| Shares Outstanding (unlimited shares of beneficial interest authorized, no par value) | 3,370,000 | | | 3,025,000 | |
| Net Asset Value per Share | $ | 43.12 | | | $ | 24.47 | |
| | | |
| Cost of Investments in Securities | $ | 145,791,053 | | | $ | 75,553,314 | |
The accompanying notes are an integral part of these financial statements.
38
STATEMENT OF ASSETS AND LIABILITIES
September 30, 2023
| | | | | | | | | | | |
| Alpha Architect Value Momentum Trend ETF | | Alpha Architect High Inflation and Deflation ETF |
| Assets: | | | |
Investments in affiliates, at value (1) | $ | 34,594,543 | | | $ | — | |
| Non-affiliated investments, at value | 331,336 | | | 16,551,339 | |
| Total Investments, at value | 34,925,879 | | | 16,551,339 | |
| Cash | 161,720 | | | — | |
| Securities lending income receivable (Note 5) | 756 | | | — | |
| Dividends and interest receivable | 527 | | | 2,700 | |
| Total assets | 35,088,882 | | | 16,554,039 | |
| | | |
| Liabilities: | | | |
| Due to broker for securities sold short | 7,709 | | | — | |
| Accrued investment advisory fees | 5,562 | | | 3,740 | |
| Due to securities lending agent (Note 5) | 2,450 | | | — | |
| Total liabilities | 15,721 | | | 3,740 | |
| Net Assets | $ | 35,073,161 | | | $ | 16,550,299 | |
| | | |
| Net Assets Consist of: | | | |
| Paid-in capital | $ | 58,956,581 | | | $ | 16,688,082 | |
| Total distributable earnings (accumulated deficit) | (23,883,420) | | | (137,783) | |
| Net Assets: | $ | 35,073,161 | | | $ | 16,550,299 | |
| | | |
| Calculation of Net Asset Value Per Share: | | | |
| Net Assets | $ | 35,073,161 | | | $ | 16,550,299 | |
| Shares Outstanding (unlimited shares of beneficial interest authorized, no par value) | 1,560,000 | | | 700,000 | |
| Net Asset Value per Share | $ | 22.48 | | | $ | 23.64 | |
| | | |
| Cost of Investments in Affiliates | $ | 34,307,918 | | | $ | — | |
| Cost of Non-Affiliated Investments | $ | 331,336 | | | $ | 16,577,788 | |
(1) Includes loaned securities with a value of | $ | 2,359 | | | $ | — | |
The accompanying notes are an integral part of these financial statements.
39
STATEMENT OF ASSETS AND LIABILITIES
September 30, 2023
| | | | | | | | | | | |
| | | | Alpha Architect Tail Risk ETF |
| Assets: | | | |
| Non-affiliated investments, at value | | | $ | 135,966,558 | |
| Investments in affiliates, at value | | | 107,308,800 | |
| Total Investments, at value | | | 243,275,358 | |
| Receivable for investments sold | | | 3,313,959 | |
| Deposit at broker for options | | | 124,419 | |
| Dividends and interest receivable | | | 523 | |
| Broker interest and fees receivable | | | 112 | |
| Total assets | | | 246,714,371 | |
| Liabilities: | | | |
| Options written, at value | | | 78,638,044 | |
| Payable to custodian | | | 2,010,368 | |
| Payable for investment securities purchased | | | 1,413,932 | |
| Accrued investment advisory fees | | | 61,979 | |
| Total liabilities | | | 82,124,323 | |
| Net Assets | | | $ | 164,590,048 | |
| | | | |
| Net Assets Consist of: | | | |
| Paid-in capital | | | $ | 232,347,335 | |
| Total distributable earnings (accumulated deficit) | | | (67,757,287) | |
| Net Assets: | | | $ | 164,590,048 | |
| | | | |
| Calculation of Net Asset Value Per Share: | | | |
| Net Assets | | | $ | 164,590,048 | |
| Shares Outstanding (unlimited shares of beneficial interest authorized, no par value) | | | 2,023,847 | |
| Net Asset Value per Share | | | $ | 81.33 | |
| | | | |
| Cost of Non-Affiliated Investments | | | $ | 146,180,062 | |
| Cost of Investments in Affiliates | | | $ | 104,646,575 | |
| Premiums Received from Options Written | | | $ | 71,323,659 | |
The accompanying notes are an integral part of these financial statements.
40
STATEMENT OF OPERATIONS
September 30, 2023
| | | | | | | | | | | |
| Alpha Architect U.S. Quantitative Value ETF | | Alpha Architect International Quantitative Value ETF |
| Investment Income: | | | |
| Dividend income (net of foreign withholding tax of $0 and $810,043, respectively) | $ | 6,456,536 | | | $ | 7,866,222 | |
| Interest income | 36,612 | | | 23,429 | |
| Securities lending income, net (See Note 5) | 1,751 | | | 59 | |
| Total investment income | 6,494,899 | | | 7,889,710 | |
| | | |
| Expenses: | | | |
| Investment advisory fees | 1,018,002 | | | 698,963 | |
| Net expenses | 1,018,002 | | | 698,963 | |
| | | |
| Net Investment Income/(Loss) | 5,476,897 | | | 7,190,747 | |
| | | |
| Realized and Unrealized Gain (Loss) on Investments: | | | |
| Net realized gain (loss) on: | | | |
| Investments | 18,716,123 | | | (3,533,266) | |
| Foreign currency | — | | | (370,422) | |
| 18,716,123 | | | (3,903,688) | |
| Net change in unrealized appreciation/(depreciation) on: | | | |
| Investments | 33,513,536 | | | 22,569,617 | |
| Foreign currency | — | | | 7,120,420 | |
| 33,513,536 | | | 29,690,037 | |
| Net realized and unrealized gain (loss) on investments: | 52,229,659 | | | 25,786,349 | |
| Net Increase/ (Decrease) in Net Assets Resulting from Operations | $ | 57,706,556 | | | $ | 32,977,096 | |
The accompanying notes are an integral part of these financial statements.
41
STATEMENT OF OPERATIONS (CONTINUED)
For the Year Ended September 30, 2023
| | | | | | | | | | | |
| Alpha Architect U.S. Quantitative Momentum ETF | | Alpha Architect International Quantitative Momentum ETF |
| Investment Income: | | | |
| Dividend income (net of foreign withholding tax of $0 and $281,583, respectively) | $ | 2,472,907 | | | $ | 2,943,416 | |
| Interest income | 19,009 | | | 12,216 | |
| Securities lending income, net (See Note 5) | 85 | | | 4,095 | |
| Total investment income | 2,492,001 | | | 2,959,727 | |
| | | |
| Expenses: | | | |
| Investment advisory fees | 579,497 | | | 362,815 | |
| Overdraft fees expense | — | | | 1,356 | |
| Net expenses | 579,497 | | | 364,171 | |
| | | |
| Net Investment Income/(Loss) | 1,912,504 | | | 2,595,556 | |
| | | |
| Realized and Unrealized Gain (Loss) on Investments: | | | |
| Net realized gain (loss) on: | | | |
| Investments | (13,661,716) | | | (859,499) | |
| Foreign currency | — | | | (232,798) | |
| (13,661,716) | | | (1,092,297) | |
| Net change in unrealized appreciation/(depreciation) on: | | | |
| Investments | 4,866,116 | | | 2,616,359 | |
| Foreign currency | — | | | 2,886,171 | |
| 4,866,116 | | | 5,502,530 | |
| Net realized and unrealized gain (loss) on investments: | (8,795,600) | | | 4,410,233 | |
| Net Increase (Decrease) in Net Assets Resulting from Operations | $ | (6,883,096) | | | $ | 7,005,789 | |
The accompanying notes are an integral part of these financial statements.
42
STATEMENT OF OPERATIONS (CONTINUED)
For the Period Ended September 30, 2023
| | | | | | | | | | | |
| Alpha Architect Value Momentum Trend ETF | | Alpha Architect High Inflation and Deflation ETF⁽¹⁾ |
| Investment Income: | | | |
| Dividend income from affiliates | $ | 1,808,032 | | | $ | — | |
| Dividend income from non-affiliates | — | | | 312,681 | |
| Interest income | 612,409 | | | 448,474 | |
| Securities lending income, net (See Note 5) | 27,323 | | | — | |
| Total investment income | 2,447,764 | | | 761,155 | |
| | | |
| Expenses: | | | |
| Dividend expense | 264,762 | | | — | |
| Investment advisory fees | 172,558 | | | 32,667 | |
| Other expenses | 186 | | | — | |
| Total expenses | 437,506 | | | 32,667 | |
| Less: Reimbursement of expenses from Advisor (Note 4) | (74,113) | | | (2,129) | |
| Net expenses | 363,393 | | | 30,538 | |
| | | |
| Net Investment Income | 2,084,371 | | | 730,617 | |
| | | |
| Realized and Unrealized Gain (Loss) on Investments: | | | |
| Net realized gain (loss) on: | | | |
| Investments in affiliates | (1,840,712) | | | — | |
| Investments in non-affiliates | (594) | | | (550,547) | |
| Securities sold short | (1,250,891) | | | — | |
| (3,092,197) | | | (550,547) | |
| Net change in unrealized appreciation (depreciation) on: | | | |
| Investments in affiliates | 5,591,687 | | | — | |
| Investments in non-affiliates | — | | | (26,450) | |
| Securities sold short | (7,585,247) | | | — | |
| (1,993,560) | | | (26,450) | |
| Net realized and unrealized gain (loss) on investments: | (5,085,757) | | | (576,997) | |
| Net Increase (Decrease) in Net Assets Resulting from Operations | $ | (3,001,386) | | | $ | 153,620 | |
(1) The Fund commenced operations on November 17, 2022
The accompanying notes are an integral part of these financial statements.
43
STATEMENT OF OPERATIONS
For the Period Ended September 30, 2023
| | | | | | | | | | | | | | | | | | | | | | | |
| | Alpha Architect Tail Risk ETF⁽¹⁾ |
| | | For the Period Ended September 30, 2023⁽¹⁾ | | | Year Ended February 28, 2023 |
| Investment Income: | | | | | | | |
| Interest Income | | | $ | 47,791 | | | | | $ | 50,046 | |
| Total investment income | | | 47,791 | | | | | 50,046 | |
| | | | | | | | |
| Expenses: | | | | | | | |
| Investment advisory fees | | | 571,945 | | | | | 669,864 | |
| Other expenses | | | 2,783 | | | | | 399,782 | |
| Total expenses | | | 574,728 | | | | | 1,069,646 | |
| Less: Reimbursement of expenses from Advisor (Note 4) | | | (107,700) | | | | | — | |
| Net expenses | | | 467,028 | | | | | 1,069,646 | |
| | | | | | | | |
| Net Investment Income/(Loss) | | | (419,237) | | | | | (1,019,600) | |
| | | | | | | | |
| Realized and Unrealized Gain (Loss) on Investments: | | | | | | | |
| Net realized gain (loss) on: | | | | | | | |
| Non-affiliated investments | | | 939,255 | | | | | — | |
| Investments | | | — | | | | | 419,995 | |
| Investments in affiliates | | | 34,863 | | | | | — | |
| Securities sold short | | | — | | | | | (4,365) | |
| Options written | | | 22,763,221 | | | | | (16,858,776) | |
| | | | 23,737,339 | | | | | (16,443,146) | |
| Net change in unrealized appreciation (depreciation) on: | | | | | | | |
| Non-Affiliated Investments | | | (11,804,439) | | | | | 1,594,589 | |
| Investments in affiliates | | | 2,662,225 | | | | | — | |
| Options written | | | (3,470,692) | | | | | (3,883,872) | |
| | | | (12,612,906) | | | | | (2,289,283) | |
| Net realized and unrealized gain (loss) on investments: | | | 11,124,433 | | | | | (18,732,429) | |
| Net Increase/(Decrease) in Net Assets Resulting from Operations | | $ | 10,705,196 | | | | $ | (19,752,029) | |
| | | | | | | | |
| (1) | The Fund acquired all of the assets and liabilities of the Arin Large Cap Theta Fund (“Predecessor Fund”) in a reorganization on March 6, 2023. The Predecessor Fund’s Institutional Class Shares’ performance and financial history have been adopted by the Fund and will be used going forward. As a result, the information prior to March 6, 2023, reflects that of the Predecessor Fund’s Institutional Class Shares. |
The accompanying notes are an integral part of these financial statements.
44
| | |
| STATEMENT OF CHANGES IN NET ASSETS |
| | | | | | | | | | | | | | | | | | | | | | | |
| Alpha Architect U.S. Quantitative Value ETF | | Alpha Architect International Quantitative Value ETF |
| For the Year Ended September 30, 2023 | | Year Ended September 30, 2022 | | For the Year Ended September 30, 2023 | | Year Ended September 30, 2022 |
| Increase (Decrease) in Net Assets from: | | | | | | | |
| Operations: | | | | | | | |
| Net investment income (loss) | $ | 5,476,897 | | | $ | 3,796,980 | | | $ | 7,190,747 | | | $ | 8,130,478 | |
| Net realized gain (loss) on investments | 18,716,123 | | | (10,894,253) | | | (3,903,688) | | | (18,921,372) | |
| Net change in unrealized appreciation (depreciation) on investments | 33,513,536 | | | (21,218,750) | | | 29,690,037 | | | (21,232,378) | |
| Net Increase (Decrease) in Net Assets Resulting from Operations | 57,706,556 | | | (28,316,023) | | | 32,977,096 | | | (32,023,272) | |
| | | | | | | |
| Distributions to Shareholders: | | | | | | | |
| Distributable earnings | (5,720,298) | | | (4,085,319) | | | (15,398,314) | | | (3,473,344) | |
| Total distributions to shareholders | (5,720,298) | | | (4,085,319) | | | (15,398,314) | | | (3,473,344) | |
| | | | | | | |
| Capital Share Transactions: | | | | | | | |
| Proceeds from shares sold | 289,669,681 | | | 224,045,024 | | | 166,148,095 | | | 116,021,338 | |
| Payments for shares redeemed | (251,704,860) | | | (217,509,671) | | | (137,521,678) | | | (108,685,788) | |
| Transaction Fees (See Note 1) | 1 | | | — | | | 500 | | | 142 | |
| Net increase (decrease) in net assets derived from net change in capital share transactions | 37,964,822 | | | 6,535,353 | | | 28,626,917 | | | 7,335,692 | |
| | | | | | | |
| Net Increase (Decrease) in Net Assets | 89,951,080 | | | (25,865,989) | | | 46,205,699 | | | (28,160,924) | |
| | | | | | | |
| Net Assets: | | | | | | | |
| Beginning of year | 187,901,774 | | | 213,767,763 | | | 105,472,007 | | | 133,632,931 | |
| End of year | $ | 277,852,854 | | | $ | 187,901,774 | | | $ | 151,677,706 | | | $ | 105,472,007 | |
| | | | | | | |
| Changes in Shares Outstanding: | | | | | | | |
| Shares outstanding, beginning of year | 6,440,000 | | | 6,260,000 | | | 5,200,000 | | | 4,925,000 | |
| Shares sold | 8,340,000 | | | 6,520,000 | | | 7,025,000 | | | 4,575,000 | |
| Shares repurchased | (7,300,000) | | | (6,340,000) | | | (5,800,000) | | | (4,300,000) | |
| Shares outstanding, end of year | 7,480,000 | | | 6,440,000 | | | 6,425,000 | | | 5,200,000 | |
The accompanying notes are an integral part of these financial statements.
45
| | |
| STATEMENT OF CHANGES IN NET ASSETS (CONTINUED) |
| | | | | | | | | | | | | | | | | | | | | | | |
| Alpha Architect U.S. Quantitative Momentum ETF | | Alpha Architect International Quantitative Momentum ETF |
| For the Year Ended September 30, 2023 | | Year Ended September 30, 2022 | | For the Year Ended September 30, 2023 | | Year Ended September 30, 2022 |
| Increase (Decrease) in Net Assets from: | | | | | | | |
| Operations: | | | | | | | |
| Net investment income (loss) | $ | 1,912,504 | | | $ | 1,563,346 | | | $ | 2,595,556 | | | $ | 3,282,266 | |
| Net realized gain (loss) on investments | (13,661,716) | | | (8,272,171) | | | (1,092,297) | | | (20,331,684) | |
| Net change in unrealized appreciation (depreciation) on investments | 4,866,116 | | | (3,198,110) | | | 5,502,530 | | | (8,225,382) | |
| Net Increase (Decrease) in Net Assets Resulting from Operations | (6,883,096) | | | (9,906,935) | | | 7,005,789 | | | (25,274,800) | |
| | | | | | | |
| Distributions to Shareholders: | | | | | | | |
| Distributable earnings | (2,115,259) | | | (112,054) | | | (3,768,945) | | | (789,442) | |
| Total distributions to shareholders | (2,115,259) | | | (112,054) | | | (3,768,945) | | | (789,442) | |
| | | | | | | |
| Capital Share Transactions: | | | | | | | |
| Proceeds from shares sold | 220,184,121 | | | 122,692,058 | | | 112,964,493 | | | 62,275,898 | |
| Payments for shares redeemed | (157,210,632) | | | (106,448,351) | | | (97,628,132) | | | (52,667,736) | |
| Transaction Fees (See Note 1) | 7,116 | | | — | | | 52 | | | 28 | |
| Net increase (decrease) in net assets derived from net change in capital share transactions | 62,980,605 | | | 16,243,707 | | | 15,336,413 | | | 9,608,190 | |
| | | | | | | |
| Net Increase (Decrease) in Net Assets | 53,982,250 | | | 6,224,718 | | | 18,573,257 | | | (16,456,052) | |
| | | | | | | |
| Net Assets: | | | | | | | |
| Beginning of period | 91,338,749 | | | 85,114,031 | | | 55,450,703 | | | 71,906,755 | |
| End of period | $ | 145,320,999 | | | $ | 91,338,749 | | | $ | 74,023,960 | | | $ | 55,450,703 | |
| | | | | | | |
| Changes in Shares Outstanding: | | | | | | | |
| Shares outstanding, beginning of period | 2,070,000 | | | 1,730,000 | | | 2,425,000 | | | 2,100,000 | |
| Shares sold | 4,700,000 | | | 2,550,000 | | | 4,400,000 | | | 2,100,000 | |
| Shares repurchased | (3,400,000) | | | (2,210,000) | | | (3,800,000) | | | (1,775,000) | |
| Shares outstanding, end of period | 3,370,000 | | | 2,070,000 | | | 3,025,000 | | | 2,425,000 | |
The accompanying notes are an integral part of these financial statements.
46
| | |
| STATEMENT OF CHANGES IN NET ASSETS (CONTINUED) |
| | | | | | | | | | | | | | | | | |
| Alpha Architect Value Momentum Trend ETF | | Alpha Architect High Inflation and Deflation ETF |
| For the Year Ended September 30, 2023 | | Year Ended September 30, 2022 | | For the Period Ended September 30, 2023⁽¹⁾ |
| Increase (Decrease) in Net Assets from: | | | | | |
| Operations: | | | | | |
| Net investment income (loss) | $ | 2,084,371 | | | (102,613) | | | $ | 730,617 | |
| Net realized gain (loss) on investments | (3,092,197) | | | (1,632,941) | | | (550,547) | |
| Net change in unrealized appreciation (depreciation) on investments | (1,993,560) | | | (918,398) | | | (26,450) | |
| Net realized and unrealized gain (loss) on investments: | (3,001,386) | | | (2,653,952) | | | 153,620 | |
| | | | | |
| Distributions to Shareholders: | | | | | |
| Distributable earnings | (877,779) | | | (331,835) | | | (292,778) | |
| Total distributions to shareholders | (877,779) | | | (331,835) | | | (292,778) | |
| | | | | |
| Capital Share Transactions: | | | | | |
| Proceeds from shares sold | 1,415,122 | | | 2,547,901 | | | 18,377,775 | |
| Payments for shares redeemed | (3,828,931) | | | (3,834,427) | | | (1,690,136) | |
| Transaction Fees (See Note 1) | — | | | — | | | 1,818 | |
| Net increase (decrease) in net assets derived from net change in capital share transactions | (2,413,809) | | | (1,286,526) | | | 16,689,457 | |
| | | | | |
| Net Increase in Net Assets | (6,292,974) | | | (4,272,313) | | | 16,550,299 | |
| | | | | |
| Net Assets: | | | | | |
| Beginning of year/period | 41,366,135 | | | 45,638,448 | | | — | |
| End of year/period | $ | 35,073,161 | | | $ | 41,366,135 | | | $ | 16,550,299 | |
| | | | | |
| Changes in Shares Outstanding: | | | | | |
| Shares outstanding, beginning of year | 1,660,000 | | | 1,710,000 | | | — | |
| Shares sold | 60,000 | | | 100,000 | | | 770,000 | |
| Shares repurchased | (160,000) | | | (150,000) | | | (70,000) | |
| Shares outstanding, end of year | 1,560,000 | | | 1,660,000 | | | 700,000 | |
(1) The Fund commenced operations on November 17, 2022.
The accompanying notes are an integral part of these financial statements.
47
| | | | | | | | | | | | | | |
| STATEMENT OF CHANGES IN NET ASSETS (CONTINUED) |
| | | | | | | | | | | |
| | Alpha Architect Tail Risk ETF |
| | For the Period Ended September 30, 2023⁽¹⁾(2) | Year Ended February 28, 2023(4) | Year Ended February 28, 2022(4) |
| Increase (Decrease) in Net Assets from: | | | |
| Operations: | | | |
| Net investment income (loss) | $ | (419,237) | | $ | (1,019,600) | | $ | (1,152,516) | |
| Net realized gain (loss) on non-affiliated investments | 23,737,339 | | (16,443,146) | | (3,290,885) | |
| Net change in unrealized appreciation (depreciation) on non-affiliated investments | (12,612,906) | | (2,289,283) | | 1,697,139 | |
| Net increase (decrease) in net assets resulting from operations | 10,705,196 | | (19,752,029) | | (2,746,262) | |
| | | | |
| Distributions to Shareholders: | | | |
| Distributable earnings | — | | — | | (11,059,993) | |
| Total distributions to shareholders | — | | — | | (11,059,993) | |
| | | | |
Capital Share Transactions : | | | |
| Proceeds from shares sold | 36,099,474 | | 68,236,684 | | 66,469,948 | |
| Reinvestment of distributions | — | | — | | 10,002,032 | |
| Payments for shares redeemed | (6,532,109) | | (113,157,924) | | (40,621,230) | |
| Transaction Fees (See Note 1) | 4,387 | | — | | — | |
| Net increase (decrease) in net assets derived from net change in capital share transactions | 29,571,752 | | (44,921,240) | | 35,850,750 | |
| Net Increase (Decrease) in Net Assets | 40,276,948 | | (64,673,269) | | 22,044,495 | |
| Net Assets: | | | |
| Beginning of period | 124,313,100 | | 188,986,369 | | 166,941,874 | |
| End of period | $ | 164,590,048 | | $ | 124,313,100 | | $ | 188,986,369 | |
| | | | |
Changes in Shares Outstanding (3): | | | |
| Shares outstanding, beginning of period | 1,640,927 | | 2,272,177 | | 1,846,374 | |
| Shares sold | 463,303 | | 875,194 | | 756,493 | |
| Shares reinvested | — | | — | | 117,393 | |
| Shares repurchased | (80,383) | | (1,506,444) | | (448,083) | |
| Shares outstanding, end of period | 2,023,847 | | 1,640,927 | | 2,272,177 | |
| | | | | | | | |
| (1) | The Fund acquired all of the assets and liabilities of the Arin Large Cap Theta Fund (“Predecessor Fund”) in a reorganization on March 6, 2023. The Predecessor Fund’s Institutional Class Shares’ performance and financial history have been adopted by the Fund and will be used going forward. As a result, the information prior to March 6, 2023, reflects that of the Predecessor Fund’s Institutional Class Shares. |
| | | | | | | | |
| (2) | Reflects reorganization from the Predecessor Fund on March 6, 2023. See Note 1. |
| | | | | | | | |
| (3) | Effective March 22, 2023, the Alpha Architect Tail Risk ETF had a 1:8 reverse stock split. Share amounts for all periods have been adjusted to give effect to the 1:8 stock split. |
| | | | | | | | |
| (4) | Reflects historical information of Predecessor Fund. |
The accompanying notes are an integral part of these financial statements.
48
ALPHA ARCHITECT ETFs
FINANCIAL HIGHLIGHTS
| | |
| For the Year Ended September 30, 2023 |
| | | | | | | | | | | | | | | | | | | | | | | | | | | | | | | | | | | | | | | | | | | | |
| Net Asset Value, Beginning
of Period | Net Investment Income (Loss)(1) | Net Realized and Unrealized Gain (Loss) on Investments | Net Increase (Decrease) in Net Asset Value Resulting from Operations | Distributions from Net Investment Income | Return of Capital Distribution | Total Distributions | Net Asset Value, End of Period | Total Return(2) | Net Assets, End of Period (000's) | Net Expenses(3)(4) | Gross Expenses(3) | Net Investment Income(3) | Portfolio Turnover Rate(5)(14) |
| Alpha Architect U.S. Quantitative Value ETF | | | | | | | | | | | |
| Year Ended September 30, 2023 | $29.18 | 0.78 | 8.00 | 8.78 | (0.81) | - | (0.81) | $37.15 | 30.39% | $ | 277,853 | | 0.42% | 0.42% | 2.27% | 101% |
| Year Ended September 30, 2022 | $34.15 | 0.60 | (4.94) | (4.34) | (0.63) | - | (0.63) | $29.18 | -12.99% | $ | 187,902 | | 0.49% | 0.49% | 1.73% | 89% |
| Year Ended September 30, 2021 | $24.44 | 0.42 | 9.74 | 10.16 | (0.45) | - | (0.45) | $34.15 | 41.82% | $ | 213,768 | | 0.49% | 0.49% | 1.33% | 44% |
| Year Ended September 30, 2020 | $27.86 | 0.59 | (3.51) | (2.92) | (0.50) | - | (0.50) | $24.44 | -10.52% | $ | 113,653 | | 0.49% | 0.49% | 2.36% | 78% |
| Year Ended September 30, 2019 | $31.04 | 0.51 | (3.32) | (2.81) | (0.37) | - | (0.37) | $27.86 | -8.43% | $ | 91,941 | | 0.59% | 0.59% | 1.83% | 77% |
| Alpha Architect International Quantitative Value ETF | | | | | | | | | | | |
| Year Ended September 30, 2023 | $20.28 | 1.25 | 4.79 | 6.04 | (2.71) | - | (2.71) | $23.61 | 30.86% | $ | 151,678 | | 0.52% | 0.52% | 5.36% | 74% |
| Year Ended September 30, 2022 | $27.13 | 1.54 | (7.72) | (6.18) | (0.67) | - | (0.67) | $20.28 | -23.33% | $ | 105,472 | | 0.59% | 0.59% | 6.14% | 124% |
| Year Ended September 30, 2021 | $24.69 | 0.78 | 2.19 | 2.97 | (0.53) | - | (0.53) | $27.13 | 12.00% | $ | 133,633 | | 0.60% | 0.60% | 2.78% | 103% |
| Year Ended September 30, 2020 | $26.76 | 0.58 | (2.05) | (1.47) | (0.60) | - | (0.60) | $24.69 | -5.47% | $ | 92,569 | | 0.59% | 0.59% | 2.26% | 76% |
| Year Ended September 30, 2019 | $30.78 | 0.73 | (3.99) | (3.26) | (0.76) | - | (0.76) | $26.76 | -10.46% | $ | 80,294 | | 0.66% | 0.66% | 2.70% | 76% |
| Alpha Architect U.S. Quantitative Momentum ETF | | | | | | | | | | | |
| Year Ended September 30, 2023 | $44.12 | 0.64 | (0.91) | (0.27) | (0.73) | - | (0.73) | $43.12 | -0.71% | $ | 145,321 | | 0.42% | 0.42% | 1.39% | 193% |
| Year Ended September 30, 2022 | $49.20 | 0.82 | (5.84) | (5.02) | (0.06) | - | (0.06) | $44.12 | -10.20% | $ | 91,339 | | 0.49% | 0.49% | 1.72% | 125% |
| Year Ended September 30, 2021 | $41.89 | (0.07) | 7.38 | 7.31 | - | - | - | $49.20 | 17.45% | $ | 85,114 | | 0.49% | 0.49% | (0.13%) | 120% |
| Year Ended September 30, 2020 | $30.02 | 0.06 | 11.85 | 11.91 | (0.02) | (0.02) | (0.04) | $41.89 | 39.79% | $ | 73,308 | | 0.49% | 0.49% | 0.18% | 84% |
| Year Ended September 30, 2019 | $33.99 | (0.00)(6) | (3.96) | (3.96) | (0.01) | - | (0.01) | $30.02 | -11.63% | $ | 55,544 | | 0.59% | 0.59% | (0.01%) | 115% |
| Alpha Architect International Quantitative Momentum ETF | | | | | | | | | | | |
| Year Ended September 30, 2023 | $22.87 | 0.95 | 2.16 | 3.11 | (1.51) | - | (1.51) | $24.47 | 13.50% | $ | 74,024 | | 0.52% | 0.52% | 3.72% | 140% |
| Year Ended September 30, 2022 | $34.24 | 1.41 | (12.42) | (11.01) | (0.36) | - | (0.36) | $22.87 | -32.52% | $ | 55,451 | | 0.59% | 0.59% | 4.86% | 187% |
| Year Ended September 30, 2021 | $28.63 | 0.28 | 5.40 | 5.68 | (0.07) | - | (0.07) | $34.24 | 19.83% | $ | 71,907 | | 0.60% | 0.60% | 0.84% | 99% |
| Year Ended September 30, 2020 | $25.63 | 0.29 | 2.97 | 3.26 | (0.26) | - | (0.26) | $28.63 | 13.00% | $ | 83,024 | | 0.59% | 0.59% | 1.13% | 158% |
| Year Ended September 30, 2019 | $28.39 | 0.28 | (2.69) | (2.41) | (0.35) | - | (0.35) | $25.63 | -8.45% | $ | 56,388 | | 0.66% | 0.66% | 1.09% | 135% |
The accompanying notes are an integral part of these financial statements.
49
ALPHA ARCHITECT ETFs
FINANCIAL HIGHLIGHTS
| | |
| For the Year Ended September 30, 2023 |
| | | | | | | | | | | | | | | | | | | | | | | | | | | | | | | | | | | | | | | | | | | | |
Alpha Architect Value Momentum Trend ETF(7) | | | | | | | | | | | |
| Year Ended September 30, 2023 | $24.92 | 1.29 | (3.18) | (1.89) | (0.55) | - | (0.55) | $22.48 | -7.75% | $ | 35,073 | | 0.95% | 1.14% | 5.44% | 49% |
| Year Ended September 30, 2022 | $26.69 | (0.06) | (1.51) | (1.57) | (0.20) | - | (0.20) | $24.92 | -5.95% | $ | 41,366 | | 2.12% | 2.31% | (0.24%) | 39% |
| Year Ended September 30, 2021 | $23.91 | 0.15 | 2.65 | 2.80 | (0.02) | - | (0.02) | $26.69 | 11.73% | $ | 45,639 | | 0.28% | 0.49% | 0.57% | 3% |
| Year Ended September 30, 2020 | $23.52 | 0.03 | 0.72 | 0.75 | (0.36) | - | (0.36) | $23.91 | 3.10% | $ | 49,609 | | 1.18% | 1.40% | 0.14% | 20% |
| Year Ended September 30, 2019 | $28.98 | 0.09 | (5.43) | (5.34) | (0.12) | - | (0.12) | $23.52 | -18.43% | $ | 81,154 | | 1.84% | 2.14% | 0.37% | 155% |
| Alpha Architect High Inflation and Deflation ETF | | | | | | | | | | | |
November 16, 2022(8) to September 30, 2023 | $24.95 | 1.35 | (1.20) | 0.15 | (1.46) | - | (1.46) | $23.64 | 0.69% | $ | 16,550 | | 0.27% | 0.29% | 6.54% | 402% |
Alpha Architect Tail Risk ETF(9) | | | | | | | | | | |
March 1, 2023 to September 30, 2023 (10)(11) | $75.76 | (0.14) | 5.71 | 5.57 | - | - | - | $81.33 | 7.32% | $ | 164,590 | | 0.51%(13) | 0.63%(13) | (0.46%) | 0% |
| Year Ended February 28, 2023 | $83.12 | (0.48) | (6.88) | (7.36) | - | - | - | $75.76 | -8.85% | $ | 124,313 | | 0.64%(13) | 0.64%(13) | (0.61%) | 0% |
Year Ended February 28, 2022(11) | $90.40 | (0.56) | (0.64) | (1.20) | - | (6.08) | (6.08) | $83.12 | -1.47% | $ | 188,926 | | 0.63%(13) | 0.63%(13) | (0.63%) | 0% |
Year Ended February 28, 2021(11) | $76.32 | (0.56) | 19.52 | 18.96 | (0.08) | (4.80) | (4.88) | $90.40 | 24.94% | $ | 166,869 | | 0.65%(13) | 0.65%(13) | (0.59%) | 0% |
Year Ended February 29, 2020(11) | $76.00 | 0.88 | 1.04 | 1.92 | (1.60) | - | (1.60) | $76.32 | 2.55% | $ | 96,449 | | 0.71%(13) | 0.71%(13) | 1.11% | 457% (12) |
Year Ended February 28, 2019(11) | $84.00 | 0.96 | (7.52) | (6.56) | (0.80) | (0.64) | (1.44) | $76.00 | -7.80% | $ | 105,671 | | 0.83%(13) | 0.83%(13) | 1.18%(13) | 326% |
| | | | | |
| (1) | Net investment income per share represents net investment income divided by the daily average shares of beneficial interest outstanding throughout the period. |
| (2) | All returns reflect reinvested dividends, if any, but do not reflect the impact of taxes. Total return for a period of less than one year is not annualized. |
| (3) | For periods of less than one year, these ratios are annualized. |
| (4) | Net expenses include effects of any reimbursement or recoupment. |
| (5) | Portfolio turnover is not annualized and is calculated without regard to short-term securities having a maturity of less than one year. Excludes the impact of in-kind transactions. |
| (6) | Rounds to less than $0.005. |
| (7) | Net and gross expenses do not include expenses of the investment companies in which the Fund invests. |
| (8) | Commencement of operations. |
| (9) | Effective March 22, 2023, the Alpha Architect Tail Risk ETF had a 1:8 reverse stock split. Share amounts for all periods have been adjusted to give effect to the 1:8 stock split |
| (10) | Alpha Architect Tail Risk ETF (the “Fund”) acquired all of the assets and liabilities of the Arin Large Cap Theta Fund (“Predecessor Fund”) in a reorganization on March 6, 2023. Market price returns are calculated using the official closing price of the Fund on the listing exchange as of the time that the Fund’s NAV is calculated. Prior to the Fund’s listing on March 6, 2023, the NAV performance of the Institutional Class Shares of the Predecessor Fund are used as proxy market price returns. |
| (11) | Includes adjustments in accordance with accounting principles generally accepted in the United States and, consequently, the net asset values for financial reporting purposes and the returns based upon those net asset values may differ from the net asset values and returns for shareholder transactions. |
| (12) | Portfolio turnover was calculated using the total long-term purchase amount of $27,391. All securities considered short-term were excluded from the calculation according to prescribed rules. |
| (13) | Includes less than 0.01%, less than 0.01%, less than 0.01%, less than 0.01%, 0.03% & 0.15% of average net assets in interest expense, respectively. |
| (14) | Excludes impact of in-kind transactions. |
The accompanying notes are an integral part of these financial statements.
50
ALPHA ARCHITECT ETFs
| | | | | | | | |
| NOTES TO THE FINANCIAL STATEMENTS | |
| SEPTEMBER 30, 2023 | | |
NOTE 1 – ORGANIZATION
Alpha Architect U.S. Quantitative Value ETF, Alpha Architect International Quantitative Value ETF, Alpha Architect U.S. Quantitative Momentum ETF, Alpha Architect International Quantitative Momentum ETF, Alpha Architect Value Momentum Trend ETF, Alpha Architect High Inflation and Deflation ETF and Alpha Architect Tail Risk ETF (individually, a “Fund” or collectively the “Funds”) each are a series of the EA Series Trust (the “Trust”), which was organized as a Delaware statutory trust on October 11, 2013. The Trust is registered with the Securities and Exchange Commission (“SEC”) under the Investment Company Act of 1940, as amended (the “1940 Act”), as an open-end management investment company and the offering of the Funds’ shares (“Shares”) is registered under the Securities Act of 1933, as amended (the “Securities Act”). Each Fund is considered diversified under the 1940 Act. Each Fund qualifies as an investment company as defined in the Financial Accounting Standards Codification Topic 946-Financial Services-Investment Companies. Below is the investment objective along with a brief description of the respective investment strategy for each Fund.
Alpha Architect US Quantitative Value ETF. The investment objective is to seek long-term capital appreciation.
Alpha Architect International Quantitative Value ETF. The investment objective is to seek long-term capital appreciation.
Alpha Architect U.S. Quantitative Momentum ETF. The investment objective is to seek long-term capital appreciation.
Alpha Architect International Quantitative Momentum ETF. The investment objective is to seek long-term capital appreciation.
Alpha Architect Value Momentum Trend ETF. The investment objective is to seek long-term capital appreciation while attempting to minimize market drawdown.
Alpha Architect High Inflation and Deflation ETF. The investment objective is to seek long-term total return.
Alpha Architect Tail Risk ETF. The investment objective is to seek maximum total return through a combination of capital appreciation and current income.
Alpha Architect Tail Risk ETF converted from an open-end mutual fund to an exchange-traded fund (“ETF”) on March 6, 2023. The Fund is the successor to the Arin Large Cap Theta Fund (the “Predecessor Fund”), a series of the Starboard Investment Trust, which had the same investment objective as the Fund. Arin Risk Advisors, LLC, was also the adviser to the Predecessor Fund. Effective March 6, 2023, the assets and liabilities of the Predecessor Fund were transferred to the Fund in exchange for shares of the Fund. For financial reporting purposes, assets received and shares issued by the Fund were recorded at fair value; however, for tax purposes the cost basis of the investments received from the Predecessor Fund was carried forward to align ongoing reporting of the Fund’s realized and unrealized gains and losses with amounts distributable to shareholders for tax purposes. Costs incurred by the Fund in connection with the reorganization were paid by the Sub-Adviser.
The fiscal year end of the Predecessor Fund was February 28; after conversion, the Fund changed its fiscal year end to September 30. The reporting period covered by this report for the Fund is March 1, 2023 through September 30, 2023. Operations prior to March 6, 2023 were for the Predecessor Fund. As of March 6, 2023, the net assets of the Predecessor Fund were $126,488,085, including $2,569,806 of net unrealized appreciation of investments, all of which were transferred into the Fund at the closing of the reorganization. The transfer of net assets resulted in the creation of 13,152,191 shares of the Fund and an initial NAV per share of $9.62 at the closing of the reorganization.
The primary purpose of the reorganization into the Trust was to provide shareholders the continued benefit of a stable and highly regulated investment vehicle in addition to the benefits of tax efficiency.
The reorganization was accomplished by a tax-free exchange of shares. Fees and expenses incurred to affect the reorganizations were borne by the Sub-Advisor. The reorganization did not result in a material change to the Predecessor Fund’s investment portfolios as compared to that of the Fund. There are no material differences in accounting policies of the Predecessor Fund as compared to that of the Fund.
The Fund did not purchase or sell securities following the reorganization for purposes of realigning its investment portfolio. Accordingly, the acquisition of the Predecessor Fund did not affect the Fund’s portfolio turnover ratio for the year ended September 30, 2023.
On March 22, 2023, shares of the Alpha Architect Tail Risk ETF were adjusted to reflect a reverse stock split. The effect of the reverse stock split was to decrease the number of shares outstanding and increase the net asset
ALPHA ARCHITECT ETFs
| | | | | | | | |
| NOTES TO THE FINANCIAL STATEMENTS (CONTINUED) | |
| SEPTEMBER 30, 2023 | | |
value. The reverse stock split has no impact on the net assets of the Fund or the value of a shareholder’s investment in the Fund. A summary of the reverse stock split is as follows:
| | | | | | | | | | | | | | | | | | | | | | | | | | | | | | | | | | | |
| | Effective
Date | | Rate | | Net Asset
Value
Before
Split | | Net Asset
Value
After
Split | | Shares
Outstanding
Before Split | | Shares
Outstanding
After Split |
| | 3/22/2023 | | 1:8 | | $9.56 | | $76.51 | | 13,150,783 | | 1,643,847 |
Shares of the Funds are listed and traded on Cboe BZX Exchange, Inc. (“Cboe”). Market prices for the shares may be different from their net asset value (“NAV”). Each Fund issues and redeems shares on a continuous basis at NAV only in blocks of shares, called “Creation Units.” For Alpha Architect U.S. Quantitative Value ETF, Alpha Architect U.S. Quantitative Momentum ETF, Alpha Architect Value Momentum Trend ETF, Alpha Architect High Inflation and Deflation ETF and Alpha Architect Tail Risk ETF, a creation unit consists of 10,000 shares. For Alpha Architect International Quantitative Value ETF and Alpha Architect International Quantitative Momentum ETF a Creation Unit consists of 25,000 shares. Creation Units are issued and redeemed principally in-kind for securities included in a specified universe. Once created, shares generally trade in the secondary market at market prices that change throughout the day in share amounts less than a Creation Unit. Except when aggregated in Creation Units, shares are not redeemable securities of a Fund. Shares of a Fund may only be purchased or redeemed by certain financial institutions (“Authorized Participants”). An Authorized Participant is either (i) a broker-dealer or other participant in the clearing process through the Continuous Net Settlement System of the National Securities Clearing Corporation or (ii) a DTC participant and, in each case, must have executed a Participant Agreement with the Distributor. Most retail investors do not qualify as Authorized Participants nor have the resources to buy and sell whole Creation Units. Therefore, they are unable to purchase or redeem the shares directly from a Fund. Rather, most retail investors may purchase shares in the secondary market with the assistance of a broker and are subject to customary brokerage commissions or fees.
Authorized Participants may be required to pay a transaction fee to compensate the Trust or its custodian for costs incurred in connection with creation and redemption transactions. The standard transaction fee, which is payable to the Trust’s custodian, typically applies to in-kind purchases of a Fund effected through the clearing process on any business day, regardless of the number of Creation Units purchased or redeemed that day (“Standard Transaction Fees”). Variable fees are imposed to compensate the Funds for the transaction costs associated with the cash transactions fees. Certain fund deposits consisting of cash-in-lieu or cash value may be subject to a variable charge (“Variable Transaction Fees”), which is payable to the Funds, of up to 2.00% of the value of the order in addition to the Standard Transaction Fee. Variable Transaction Fees received by each Fund, if any, are displayed in the Capital Share Transactions sections of the Statements of Changes in Net Assets.
Because, among other things, the Funds impose transaction fees on purchases and redemptions of Shares to cover the custodial and other costs incurred by a Fund in effecting trades, the Board determined that it is not necessary to adopt policies and procedures to detect and deter market timing of the Funds’ Shares.
ALPHA ARCHITECT ETFs
| | | | | | | | |
| NOTES TO THE FINANCIAL STATEMENTS (CONTINUED) | |
| SEPTEMBER 30, 2023 | | |
NOTE 2 – SIGNIFICANT ACCOUNTING POLICIES
The following is a summary of significant accounting policies consistently followed by the Funds. These policies are in conformity with accounting principles generally accepted in the United States of America (“GAAP”).
| | | | | |
| A. | Security Valuation. Equity securities that are traded on a national securities exchange, except those listed on the NASDAQ Global Market® (“NASDAQ”) are valued at the last reported sale price on the exchange on which the security is principally traded. Securities traded on NASDAQ will be valued at the NASDAQ Official Closing Price (“NOCP”). If, on a particular day, an exchange-traded or NASDAQ security does not trade, then the most recent quoted bid for exchange-traded or the mean between the most recent quoted bid for exchange-traded or the mean between the most recent quoted bid and ask price for NASDAQ securities will be used. Equity securities that are not traded on a listed exchange are generally valued at the last sale price in the over-the-counter market. If a non-exchange traded security does not trade on a particular day, then the mean between the last quoted closing bid and asked price will be used. Prices denominated in foreign currencies are converted to U.S. dollar equivalents at the current exchange rate, which approximates fair value. Redeemable securities issued by open-end investment companies are valued at the investment company’s applicable net asset value, with the exception of exchange-traded open-end investment companies which are priced as equity securities. |
Exchange-traded options (other than FLEX Options) are valued at the mean of the last quoted bid and ask prices at 4:00 p.m. eastern time as provided by a third-party pricing service from the primary exchange or the board of trade on which such options are traded. Exchange-traded options will be valued on the basis of prices provided by pricing services when such prices are reasonably believed to reflect the market value of such options and may include the use of composite or National Best Bid and Offer (“NBBO”) pricing information provided by the pricing services.
FLEX Options will typically be valued at a model-based price provided by the exchange at the official close of that exchange’s trading day. However, when a FLEX Option has a same-day market trading price at the official close of that exchange’s trading day, this same-day market trading price will be used for the FLEX Option value instead of the exchange’s model-based price.
Any options which share all the same contractual terms or are only different due to a de minimis difference in such options strike price shall share the same valuation (a “Substantially Similar Option”). A de minimis difference shall mean a difference in the strike price of Substantially Similar Options which is $0.01 or less. When two or more Substantially Similar Options are determined to share the same valuation pursuant to this paragraph the value determined for the Substantially Similar Option which is a FLEX Option shall be used to value each such Substantially Similar Option. Any in the money Substantially Similar Options shall share the same value except they may be adjusted by up to $0.01 to reflect the difference of the amount of moneyness of each Substantially Similar Option.
No option prices adjusted per the policies above shall fall outside the last quoted bid and ask prices at 4:00 p.m. eastern time. Notwithstanding anything to the contrary above, any expired cash settled option shall be valued at its intrinsic value.
An option may be fair valued when: (i) the option does not trade on the valuation date and a reliable last quoted bid and ask price at the valuation time is not readily available or (ii) the Fund’s Adviser, Discretionary Sub-Adviser (if applicable), or Fund management does not believe the prices provided by the pricing services or exchange reflect the current market value of such option.
Subject to its oversight, the Trust’s Board of Trustees (the “Board”) has delegated primary responsibility for determining or causing to be determined the value of the Fund’s investments to Empowered Funds, LLC d/b/a EA Advisers (the “Adviser”), pursuant to the Trust’s valuation policy and procedures, which have been adopted by the Trust and approved by the Board. In accordance with Rule 2a-5 under the 1940 Act, the Board designated the Adviser as the “valuation designee” of the Fund. If the Adviser, as valuation designee, determines that reliable market quotations are not readily available for an investment, the investment is valued at fair value as determined in good faith by the Adviser in accordance with the Trust’s fair valuation policy and procedures. The Adviser will provide the Board with periodic reports, no less frequently than quarterly, that discuss the functioning of the valuation process, if applicable, and that identify issues and valuation problems that have arisen, if any. As appropriate, the Adviser and the Board will review any securities valued by the Adviser in accordance with the Trust’s valuation policies during these periodic reports. The use of fair value pricing by the Fund may cause the net asset value of its shares to differ significantly from the net asset value that would be
ALPHA ARCHITECT ETFs
| | | | | | | | |
| NOTES TO THE FINANCIAL STATEMENTS (CONTINUED) | |
| SEPTEMBER 30, 2023 | | |
calculated without regard to such considerations. As of September 30, 2023, the Fund did not hold any securities valued by an investment committee.
As described above, the Funds may use various methods to measure the fair value of their investments on a recurring basis. GAAP establishes a hierarchy that prioritizes inputs to valuation methods. The three levels of inputs are:
Level 1 – Unadjusted quoted prices in active markets for identical assets or liabilities that the Funds have the ability to access.
Level 2 – Observable inputs other than quoted prices included in Level 1 that are observable for the asset or liability, either directly or indirectly. These inputs may include quoted prices for the identical instrument on an inactive market, prices for similar instruments, interest rates, prepayment speeds, credit risk, yield curves, default rates and similar data.
Level 3 – Unobservable inputs for the asset or liability, to the extent relevant observable inputs are not available; representing the Funds’ own assumptions about the assumptions a market participant would use in valuing the asset or liability and would be based on the best information available.
The availability of observable inputs can vary from security to security and is affected by a wide variety of factors, including, for example, the type of security, whether the security is new and not yet established in the marketplace, the liquidity of markets, and other characteristics particular to the security. To the extent that valuation is based on models or inputs that are less observable or unobservable in the market, the determination of fair value requires more judgment. Accordingly, the degree of judgment exercised in determining fair value is greatest for instruments categorized in Level 3.
The inputs used to measure fair value may fall into different levels of the fair value hierarchy. In such cases, for disclosure purposes, the level in the fair value hierarchy within which the fair value measurement falls in its entirety, is determined based on the lowest level input that is significant to the fair value measurement in its entirety.
The following is a summary of the fair value classification of each Fund’s investments as of September 30, 2023:
| | | | | | | | | | | | | | | | | | | | | | | | | | |
| DESCRIPTION | | LEVEL 1 | | LEVEL 2 | | LEVEL 3 | | TOTAL |
| | | | | | | | |
| Alpha Architect U.S. Quantitative Value ETF | | | | | | |
| Assets* | | | | | | | | |
| Common Stocks | | $ | 277,281,190 | | | $ | — | | | $ | — | | | $ | 277,281,190 | |
| Short Term Investments | | 506,480 | | | — | | | — | | | 506,480 | |
| Total Investments in Securities | | $ | 277,787,670 | | | $ | — | | | $ | — | | | $ | 277,787,670 | |
| | | | | | | | |
| Alpha Architect International Quantitative Value ETF | | |
| Assets* | | | | | | | | |
| Common Stocks | | $ | 149,788,202 | | | $ | — | | | $ | — | | | $ | 149,788,202 | |
| Investments Purchased with Proceeds from Securities Lending | | 790,000 | | | — | | | — | | | 790,000 | |
| Short Term Investments | | 440,434 | | | — | | | — | | | 440,434 | |
| Total Investments in Securities | | $ | 151,018,636 | | | $ | — | | | $ | — | | | $ | 151,018,636 | |
| | | | | | | | |
ALPHA ARCHITECT ETFs
| | | | | | | | |
| NOTES TO THE FINANCIAL STATEMENTS (CONTINUED) | |
| SEPTEMBER 30, 2023 | | |
| | | | | | | | | | | | | | | | | | | | | | | | | | |
| Alpha Architect U.S. Quantitative Momentum ETF | | | | |
| Assets* | | | | | | | | |
| Common Stocks | | $ | 145,178,890 | | | $ | — | | | $ | — | | | $ | 145,178,890 | |
| Short Term Investments | | 182,039 | | | — | | | — | | | 182,039 | |
| Total Investments in Securities | | $ | 145,360,929 | | | $ | — | | | $ | — | | | $ | 145,360,929 | |
| | | | | | | | |
| Alpha Architect International Quantitative Momentum ETF | | |
| Assets* | | | | | | | | |
| Common Stocks | | $ | 73,593,253 | | | $ | — | | | $ | — | | | $ | 73,593,253 | |
| | | | | | | | |
| Short Term Investments | | 145,636 | | | — | | | — | | | 145,636 | |
| Total Investments in Securities | | $ | 73,738,889 | | | $ | — | | | $ | — | | | $ | 73,738,889 | |
| | | | | | | | |
| Alpha Architect Value Momentum Trend ETF | | |
| Assets* | | | | | | | | |
| Investment Companies | | $ | 34,594,543 | | | $ | — | | | $ | — | | | $ | 34,594,543 | |
| Investments Purchased with Proceeds from Securities Lending | | 2,450 | | | — | | | — | | | 2,450 | |
| Short Term Investments | | 328,886 | | | — | | | — | | | 328,886 | |
| Total Investments in Securities | | $ | 34,925,879 | | | $ | — | | | $ | — | | | $ | 34,925,879 | |
| | | | | | | | |
| Alpha Architect High Inflation and Deflation ETF |
| Assets* | | | | | | | | |
| Investment Companies | | $ | 2,049,906 | | | $ | — | | | $ | — | | | $ | 2,049,906 | |
| U.S. Treasury Bills | | — | | | 14,423,172 | | | — | | | 14,423,172 | |
| Short Term Investments | | 78,261 | | | — | | | — | | | 78,261 | |
| Total Investments in Securities | | $ | 2,128,167 | | | $ | 14,423,172 | | | $ | — | | | $ | 16,551,339 | |
| | | | | | | | |
| Alpha Architect Tail Risk ETF | | |
| Assets* | | | | | | | | |
| Investment Companies | | $ | 107,308,800 | | | $ | — | | | $ | — | | | $ | 107,308,800 | |
| Purchased Options | | — | | | 135,749,654 | | | — | | | 135,749,654 | |
| Short Term Investments | | 216,904 | | | — | | | — | | | 216,904 | |
| Total Investments in Securities | | $ | 107,525,704 | | | $ | 135,749,654 | | | $ | — | | | $ | 243,275,358 | |
| Liabilities* | | | | | | | | |
| Written Options | | $ | — | | | $ | (78,638,044) | | | $ | — | | | $ | (78,638,044) | |
| Total Investments in Securities | | $ | — | | | $ | (78,638,044) | | | $ | — | | | $ | (78,638,044) | |
| | | | | | | | |
| * | For further detail on each asset class, see the Schedule of Investments. |
During the fiscal year ended September 30, 2023, the Funds did not invest in any Level 3 investments and recognized no transfers to/from Level 3. Transfers between levels are recognized at the end of the reporting period.
B. Options Contracts.In general, an option contract is an agreement between a buyer and seller that gives the purchaser of the option the right to buy or sell a particular asset at a specified future date at an agreed upon price (commonly known as the “strike price”). Alpha Architect Tail Risk ETF’s portfolio includes several types of FLEX Options, including both purchased and written put and call options (as further described below). The FLEX Options are all European style options, which means that they are exercisable at the strike price only on the FLEX Option expiration date. FLEX Options are customized option contracts available through national securities exchanges that are guaranteed for settlement by the Options Clearing Corporation (“OCC”), a market
ALPHA ARCHITECT ETFs
| | | | | | | | |
| NOTES TO THE FINANCIAL STATEMENTS (CONTINUED) | |
| SEPTEMBER 30, 2023 | | |
clearinghouse. FLEX Options provide investors with the ability to customize terms of an option, including exercise prices, exercise styles (European style versus American style options which are exercisable any time prior to the expiration date) and expiration dates, while achieving price discovery in competitive, transparent auctions markets and avoiding the counterparty exposure of the over-the-counter option positions.
Each FLEX Option contract entitles the holder thereof (i.e., the purchaser of the FLEX Option) the option to purchase (for the call options) or sell (for the put options) the cash value of the reference asset as of the close of the market on the FLEX Option expiration date at the strike price. The Fund intends to be structured so that any amount owed by the Fund on the written FLEX Options will be covered by payouts at expiration from the purchased FLEX Options. As a result, the FLEX Options will be fully covered, and no additional collateral will be necessary during the life of the Fund. The Fund receives premiums in exchange for the written FLEX Options and pays premiums in exchange for the purchased FLEX Options. The OCC and securities exchange that the FLEX Options are listed on do not charge ongoing fees to writers or purchasers of the FLEX Options during their life for continuing to hold the option contracts. In general, put options give the holder (i.e., the buyer) the right to sell an asset (or deliver the cash value of the index, in case of an index put option) and the seller (i.e., the writer) of the put has the obligation to buy the asset (or receive cash value of the index, in case of an index put option) at a certain defined price. Call options give the holder (i.e., the buyer) the right to buy an asset (or receive cash value of the index, in case of an index call option) and the seller (i.e., the writer) the obligation to sell the asset (or deliver cash value of the index, in case of an index call option) at a certain defined price.
When the Funds purchase an option, an amount equal to the premium paid by the Funds are recorded as an investment and is subsequently adjusted to the current value of the option purchased. If an option expires on the stipulated expiration date or if the Funds enter into a closing sale transaction, a gain or loss is realized. If a call option is exercised, the cost of the security acquired is increased by the premium paid for the call. If a put option is exercised, a gain or loss is realized from the sale of the underlying security, and the proceeds from such sale are decreased by the premium originally paid. Purchased options are non-income producing securities. When the Funds write an option, an amount equal to the premium received by the Funds are recorded as a liability and is subsequently adjusted to the current value of the option written. Premiums received from writing options that expire unexercised are treated by the Funds on the expiration date as realized gain from written options. The difference between the premium and the amount paid on effecting a closing purchase transaction, including brokerage commissions, is also treated as a realized gain, or if the premium is less than the amount paid for the closing purchase transaction, as a realized loss. If a call option is exercised, the premium is added to the proceeds from the sale of the underlying security in determining whether the Funds have realized a gain or loss. If a put option is exercised, the premium reduces the cost basis of the securities purchased by the Funds. The Funds, as writers of an option, bear the market risk of an unfavorable change in the price of the security underlying the written option.
The OCC guarantees performance by each of the counterparties to FLEX Options, becoming the “buyer for every seller and the seller for every buyer,” protecting clearing members and options traders from counterparty risk. Subject to determination by the Securities Committee of the OCC, adjustments may be made to the FLEX Options for certain events (collectively, “Corporate Actions”) specified in the OCC’s by-laws and rules: certain stock dividends or distributions, stock splits, reverse stock splits, rights offerings, distributions, reorganizations, recapitalizations, or reclassifications with respect to an underlying security, or a merger, consolidation, dissolution or liquidation of the issuer of the underlying security. According to the OCC’s by-laws, the nature and extent of any such adjustment is to be determined by the OCC’s Securities Committee, in light of the circumstances known to it at the time such determination is made, based on its judgment as to what is appropriate for the protection of investors and the public interest, taking into account such factors as fairness to holders and writers (or purchasers and sellers) of the affected options, the maintenance of a fair and orderly market in the affected options, consistency of interpretation and practice, efficiency of exercise settlement procedures, and the coordination with other clearing agencies of the clearance and settlement of transactions in the underlying interest.
ALPHA ARCHITECT ETFs
| | | | | | | | |
| NOTES TO THE FINANCIAL STATEMENTS (CONTINUED) | |
| SEPTEMBER 30, 2023 | | |
The value of derivative instruments on the Statements of Assets and Liabilities for the Alpha Architect Tail Risk ETF as of September 30, 2023, is as follows:
| | | | | | | | | | | | | | | | | | | | | | | | | | |
| | | Equity Risk - Call and Put
Options not Accounted for as
Hedging Instruments | |
| | | Asset
Derivatives | | | Liability
Derivatives | |
| | | Investments,
at Value | | | Written
Options,
at Value | |
| | | $135,749,654 | | | $78,638,044 | |
The effect of derivative instruments on the Statement of Operations for the period ended September 30, 2023 is as follows:
| | | | | | | | | | | | | | | | | | | | | | | | | | | | | | | | | | | | | | | | | | | | | | | |
| | Equity Risk - Call and Put Options not
Accounted for as Hedging Instruments | |
| | Amount of Realized Gain/(Loss) on
Derivatives Recognized in Income | |
| | Investments | | | Investments
in-kind | | | Written
Options | | | Written
Options
in-kind | |
| | $(19,097,663) | | | | $ | 20,030,090 | | | | $ | (11,578,309) | | | | | $ | 34,341,530 | | |
| | | | | | | | | | | | | | | | | | | | | | | | | |
| | Equity Risk - Call and Put
Options not Accounted for as
Hedging Instruments | |
| | Amount of Unrealized Appreciation/(Depreciation)
on Derivatives Recognized
in Income | |
| | Investments | | | Written
Options | |
| | | $(11,804,439) | | | $(3,470,692) | |
The average volume of derivative activity for the period ended September 30, 2023 is as follows:
| | | | | | | | | | | | | | | | | | | | |
| | Purchased Options | | | Written Options |
| | Average
Monthly
Market Value | | | Average
Monthly
Market Value |
| | $96,646,833 | | | $(40,016,697) |
| | | | | |
| C. | Foreign Currency. Investment securities and other assets and liabilities denominated in foreign currencies are translated into U.S. dollar amounts using the spot rate of exchange at the date of valuation. Purchases and sales of investment securities and income and expense items denominated in foreign currencies are translated into U.S. dollar amounts on the respective dates of such transactions. |
The Funds isolate the portion of the results of operations resulting from changes in foreign exchange rates on investments from the fluctuations arising from changes in market prices of securities held. That portion of gains (losses) attributable to the changes in market prices and the portion of gains (losses) attributable to changes in foreign exchange rates are included on the “Statement of Operations” under “Net realized gain (loss) – Foreign currency” and “Change in Net Unrealized Appreciation (Depreciation) – Foreign Currency,” respectively.
ALPHA ARCHITECT ETFs
| | | | | | | | |
| NOTES TO THE FINANCIAL STATEMENTS (CONTINUED) | |
| SEPTEMBER 30, 2023 | | |
Each Fund reports net realized foreign exchange gains or losses that arise from sales of foreign currencies, currency gains or losses realized between the trade and settlement dates on securities transactions, and the difference between the amounts of dividends, interest, and foreign withholding taxes recorded on the Fund’s books and the U.S. dollar equivalent of the amounts actually received or paid. Net unrealized foreign exchange gains and losses arise from changes in the fair values of assets and liabilities, other than investments in securities at fiscal year-end, resulting from changes in exchange rates.
| | | | | |
| D. | Federal Income Taxes. Each Fund intends to continue to comply with the requirements of subchapter M of the Internal Revenue Code of 1986, as amended, as necessary to qualify as a regulated investment company and distribute substantially all net taxable investment income and net realized gains to shareholders in a manner which results in no tax cost to a Fund. Therefore, no federal income tax provision is required. As of and during the fiscal period ended September 30, 2023, the Funds did not have any tax positions that did not meet the “more-likely-than-not” threshold of being sustained by the applicable tax authority. As of and during the fiscal period ended September 30, 2023, the Funds did not have liabilities for any unrecognized tax benefits. A Fund would/will recognize interest and penalties, if any, related to unrecognized tax benefits on uncertain tax positions as income tax expense in the Statement of Operations. During the fiscal period ended September 30, 2023, the Funds did not incur any interest or penalties. Each Fund is subject to examination by U.S. taxing authorities for the tax periods since each Fund’s commencement of operations. |
Each Fund may be subject to taxes imposed on realized and unrealized gains on securities of certain foreign countries in which the Fund invests. The foreign tax expense, if any, was recorded on an accrual basis and is included in “Net realized gain (loss) on investments” and “Net increase (decrease) in unrealized appreciation or depreciation on investments” on the accompanying Statements of Operations. The amount of foreign tax owed, if any, is included in “Payable for foreign taxes” on the accompanying Statements of Assets and Liabilities and is comprised of withholding taxes on foreign dividends and taxes on unrealized gains.
| | | | | |
| E. | Security Transactions and Investment Income. Investment securities transactions are accounted for on the trade date. Gains and losses realized on sales of securities are determined on a specific identification basis. Dividend income is recorded on the ex-dividend date, net of any foreign taxes withheld at source. Interest income is recorded on an accrual basis. Withholding taxes on foreign dividends have been provided for in accordance with the Funds’ understanding of the applicable tax rules and regulations. |
Distributions received from a Funds’ investments in REITs and MLPs may be characterized as ordinary income, net capital gain, or return of capital. The proper characterization of such distributions is generally not known until after the end of each calendar year. As such, the Funds must use estimates in reporting the character of their income and distributions for financial statement purposes. Such estimates are based on historical information available from each MLP and other industry sources. The actual character of distributions to each Fund’s shareholders will be reflected on the Form 1099 received by shareholders after the end of the calendar year. Due to the nature of such investments, a portion of the distributions received by each Fund’s shareholders may represent a return of capital.
Distributions to shareholders from net investment income for Alpha Architect U.S. Quantitative Value ETF and Alpha Architect International Quantitative Value ETF are declared and paid on a quarterly basis. Distributions to shareholders from net investment income for Alpha Architect U.S. Quantitative Momentum ETF, Alpha Architect International Quantitative Momentum ETF, Alpha Architect Value Momentum Trend ETF, Alpha Architect High Inflation and Deflation ETF and Alpha Architect Tail Risk ETF are declared and paid on an annual basis. Distributions to shareholders from net realized gains on securities normally are declared and paid on an annual basis. Distributions are recorded on the ex-dividend date. Each Fund may distribute more frequently, if necessary, for tax purposes.
ALPHA ARCHITECT ETFs
| | | | | | | | |
| NOTES TO THE FINANCIAL STATEMENTS (CONTINUED) | |
| SEPTEMBER 30, 2023 | | |
| | | | | |
| F. | Use of Estimates. The preparation of financial statements in conformity with GAAP requires management to make estimates and assumptions that affect the reported amounts of assets and liabilities at the date of the financial statements, as well as the reported amounts of increases and decreases in net assets from operations during the period. Actual results could differ from those estimates. |
| | |
| G. | Share Valuation. The NAV per share of each Fund is calculated by dividing the sum of the value of the securities held by the Fund, plus cash and other assets, minus all liabilities (including estimated accrued expenses) by the total number of shares outstanding for the Fund, rounded to the nearest cent. The Funds’ shares will not be priced on the days on which the New York Stock Exchange (“NYSE”) is closed for regular trading. The offering and redemption price per share for each Fund is equal to the Fund’s net asset value per share. |
| | |
| H. | Guarantees and Indemnifications. In the normal course of business, the Funds enter into contracts with service providers that contain general indemnification clauses. Additionally, as is customary, the Trust’s organizational documents permit the Trust to indemnify its officers and trustees against certain liabilities under certain circumstances. Each Fund’s maximum exposure under these arrangements is unknown as this would involve future claims that may be against the Fund that have not yet occurred. As of the date of this Report, no claim has been made for indemnification pursuant to any such agreement of the Funds. |
| | |
| I. | Reclassification of Capital Accounts. GAAP requires that certain components of net assets relating to permanent differences be reclassified between financial and tax reporting. These reclassifications have no effect on net assets or net asset value per share. In addition, the Funds realized net capital gains resulting from in-kind redemptions, in which shareholders exchanged Fund shares for securities held by the Funds rather than for cash. Because such gains are not taxable to the Funds, and are not distributed to shareholders, they have been reclassified from distributable earnings to paid-in capital. For the fiscal year ended September 30, 2023 the following table shows the reclassifications made: |
| | | | | | | | | | | | | | | | | | | | | | | | |
| | | | | | | |
|
| | Distributable Earnings | | | | Paid in
Capital |
| Alpha Architect U.S. Quantitative Value ETF | | $ | (39,920,646) | | | | | $ | 39,920,646 | |
| Alpha Architect International Quantitative Value ETF | | (13,786,170) | | | | | 13,786,170 | |
| Alpha Architect U.S. Quantitative Momentum ETF | | (19,823,117) | | | | | 19,823,117 | |
| Alpha Architect International Quantitative Momentum ETF | | (10,885,650) | | | | | 10,885,650 | |
| Alpha Architect Value Momentum Trend ETF | | (613,584) | | | | | 613,584 | |
| Alpha Architect High Inflation and Deflation ETF | | 1,375 | | | | | (1,375) | |
| Alpha Architect Tail Risk ETF | | (53,897,123) | | | | | 53,897,123 | |
ALPHA ARCHITECT ETFs
| | | | | | | | |
| NOTES TO THE FINANCIAL STATEMENTS (CONTINUED) | |
| SEPTEMBER 30, 2023 | | |
NOTE 3 – RISKS
Markets may perform poorly and the returns from the securities in which a Fund invests may underperform returns from the general securities markets. Securities markets may experience periods of high volatility and reduced liquidity in response to governmental actions or intervention, economic or market developments, or other external factors. The value of a company’s securities may rise or fall in response to company, market, economic or other news.
Foreign securities may underperform U.S. securities and may be more volatile than U.S. securities. Risks relating to investments in foreign securities (including, but not limited to, depositary receipts and participation certificates) and to securities of issuers with significant exposure to foreign markets include: currency exchange rate fluctuation; less available public information about the issuers of securities; less stringent regulatory standards; lack of uniform accounting, auditing and financial reporting standards; and country risks including less liquidity, high inflation rates, unfavorable economic practices, political instability and expropriation and nationalization risks.
The risks of foreign securities typically are greater in emerging and less developed markets. For example, in addition to the risks associated with investments in any foreign country, political, legal and economic structures in these less developed countries may be new and changing rapidly, which may cause instability and greater risk of loss. These securities markets may be less developed and securities in those markets are generally more volatile and less liquid than those in developed markets. Investing in emerging market countries may involve substantial risk due to, among other reasons, limited information; higher brokerage costs; different accounting, auditing and financial reporting standards; less developed legal systems and thinner trading markets as compared to those in developed countries; different clearing and settlement procedures and custodial services; and currency blockages or transfer restrictions. Emerging market countries also are more likely to experience high levels of inflation, deflation or currency devaluations, which could hurt their economies and securities markets. Certain emerging markets also may face other significant internal or external risks, including a heightened risk of war and ethnic, religious and racial conflicts. In addition, governments in many emerging market countries participate to a significant degree in their economies and securities markets, which may impair investment and economic growth of companies in those markets. Such markets may also be heavily reliant on foreign capital and, therefore, vulnerable to capital flight.
For Alpha Architect Value Momentum Trend ETF, the risks of hedging include hedging activity sometimes being ineffective due to unexpected changes in the market. Hedging also involves the risk that changes in the value of the related security or basket of securities will not match those of the instruments being hedged as expected, in which case any losses on the instruments being hedged may not be reduced.
Non-diversification Risk. Because Alpha Architect Value Momentum Trend ETF is non-diversified, it may be more sensitive to economic, business, political or other changes affecting individual issuers or investments than a diversified fund, which may result in greater fluctuation in the value of the Funds’ Shares and greater risk of loss.
Value Style Risk. Value investing is subject to the risk that intrinsic values of investments may not be recognized by the broad market or that their prices may decline.
Momentum Style Risk. Investing in or having exposure to securities with positive momentum entails investing in securities that have had above-average recent returns. These securities may be more volatile than a broad cross section of securities. Returns on securities that have previously exhibited momentum may be less than returns on other styles of investing or the overall stock market. Momentum can turn quickly and cause significant variation from other types of investments, and stocks that previously exhibited high momentum may not experience continued positive momentum. In addition, there may be periods when the momentum style is out of favor, and during which the investment performance of the Funds using a momentum strategy may suffer.
Quantitative Management Risk. Investments utilizing quantitative methods may perform differently than the market as a result of characteristics and data used and changes in trends.
Foreign Security Risk. Investments in foreign securities involve political, economic and currency risks, greater volatility and differences in accounting methods.
Small Company Risk. Investments in smaller companies involve limited liquidity and greater volatility than larger companies.
High Portfolio Turnover Rate Risk. High portfolio turnover could increase a Fund’s transactions costs, resulting in taxable distributions to shareholders and negatively impact performance.
ALPHA ARCHITECT ETFs
| | | | | | | | |
| NOTES TO THE FINANCIAL STATEMENTS (CONTINUED) | |
| SEPTEMBER 30, 2023 | | |
Options Risk.
•Selling or Writing Options. Writing option contracts can result in losses that exceed the seller’s initial investment and may lead to additional turnover and higher tax liability. The risk involved in writing a call option is that there could be an increase in the market value of the underlying or reference asset. An underlying or reference asset may be an index, equity security, or ETF. If this occurs, the call option could be exercised and the underlying asset would then be sold at a lower price than its current market value. In the case of cash settled call options such as SPX options, the call seller would be required to purchase the call option at a price that is higher than the original sales price for such call option. Similarly, while writing call options can reduce the risk of owning the underlying asset, such a strategy limits the opportunity to profit from an increase in the market value of the underlying asset in exchange for up-front cash at the time of selling the call option. The risk involved in writing a put option is that there could be a decrease in the market value of the underlying asset. If this occurs, the put option could be exercised and the underlying asset would then be sold at a higher price than its current market value. In the case of cash settled put options, the put seller would be required to purchase the put option at a price that is higher than the original sales price for such put option.
•Buying or Purchasing Options. If a call or put option is not sold when it has remaining value and if the market price of the underlying asset, in the case of a call option, remains less than or equal to the exercise price, or, in the case of a put option, remains equal to or greater than the exercise price, the buyer will lose its entire investment in the call or put option. Since many factors influence the value of an option, including the price of the underlying asset, the exercise price, the time to expiration, the interest rate, and the dividend rate of the underlying asset, the buyer’s success in implementing an option buying strategy may depend on an ability to predict movements in the prices of individual assets, fluctuations in markets, and movements in interest rates. There is no assurance that a liquid market will exist when the buyer seeks to close out any option position. When an option is purchased to hedge against price movements in an underlying asset, the price of the option may move more or less than the price of the underlying asset.
•Box Spread Risk. A Box Spread is a synthetic bond created by combining different options trades that have offsetting spreads (e.g., purchases and sales on the same underlying instrument, such as an index or an ETF, but with different strike prices). If one or more of these individual option positions are modified or closed separately prior to the option contract’s expiration, then the Box Spread may no longer effectively eliminate risk tied to the underlying asset’s price movement. Furthermore, the Box Spread’s value is derived in the market and is in part, based on the time until the options comprising the Box Spread expire and the prevailing market interest rates. If the Fund (or an underlying ETF) sells a Box Spread prior to its expiration, then the Fund may incur a loss. The Fund’s ability to profit from Box Spreads is dependent on the availability and willingness of other market participants to sell Box Spreads to the Fund (or the underlying ETF) at competitive prices.
•FLEX Options Risk. FLEX Options are exchange-traded options contracts with uniquely customizable terms like exercise price, style, and expiration date. Due to their customization and potentially unique terms, FLEX Options may be less liquid than other securities, such as standard exchange listed options. In less liquid markets for the FLEX Options, the Fund may have difficulty closing out certain FLEX Options positions at desired times and prices. The value of FLEX Options will be affected by, among others, changes in the underlying share or equity index price, changes in actual and implied interest rates, changes in the actual and implied volatility of the underlying shares or equity index and the remaining time to until the FLEX Options expire. The value of the FLEX Options will be determined based upon market quotations or using other recognized pricing methods. During periods of reduced market liquidity or in the absence of readily available market quotations for the holdings of the Fund, the ability of the Fund to value the FLEX Options becomes more difficult and the judgment of the Fund’s Sub-Adviser (employing the fair value procedures adopted by the Board of Trustees of the Trust) may play a greater role in the valuation of the Fund’s holdings due to reduced availability of reliable objective pricing data.
Counterparty Risk. Counterparty risk is the risk that a counterparty to a financial instrument held by the Fund may become insolvent or otherwise fail to perform its obligations, and the Fund may obtain no or limited recovery of its investment, and any recovery may be significantly delayed. Exchange listed options, including FLEX Options, are issued and guaranteed for settlement by the Options Clearing Corporation (“OCC”). The Fund’s investments are at risk that the OCC will be unable or unwilling to perform its obligations under the option contract terms. In the unlikely event that the OCC becomes insolvent or is otherwise unable to meet its settlement obligations, the Fund could suffer significant losses.
ALPHA ARCHITECT ETFs
| | | | | | | | |
| NOTES TO THE FINANCIAL STATEMENTS (CONTINUED) | |
| SEPTEMBER 30, 2023 | | |
Derivatives Risk. Derivatives can be volatile and involve various types of degrees of risks including hedging risks. The use of derivatives in connection with the Alpha Architect Value Momentum Trend ETF index’s hedging strategies may expose the index (and therefore the Fund) to losses (some of which may be sudden) that it would not have otherwise been exposed to if it had only invested directly in equity securities.
ETF Investing Risk. The Fund’s investment in other ETFs, including the Alpha Architect 1-3 Month Box ETF, may subject the Fund to additional risks than if the Fund would have invested directly in the ETF’s underlying securities. These risks include the possibility that an ETF may experience a lack of liquidity that can result in greater volatility than its underlying securities, an ETF may trade at a premium or discount to its net asset value, or an ETF may not replicate exactly the performance of the benchmark index it seeks to track. In addition, investing in an ETF may also be costlier than if the Fund had owned the underlying securities directly. The Fund and, indirectly, shareholders of the Fund, bear a proportionate share of an ETF’s expenses, which include management and advisory fees and other expenses. In addition, the Fund will pay brokerage commissions in connection with the purchase and sale of any ETFs in its portfolio.
Fund of Funds Risk. Alpha Architect Value Momentum Trend ETF primarily invests in the other Alpha Architect Funds and its performance largely depends on the investment performance of those underlying Alpha Architect Funds. Alpha Architect High Inflation and Deflation ETF investment performance will largely depend on the investment performance of the selected underlying funds. An investor will indirectly bear the principal risks and its share of fees and expenses of the underlying funds.
Low Short-Term Interest Rates Risk. During market conditions in which short-term interest rates are at low levels, the Fund’s yield can be very low, and the Fund may have a negative yield (i.e., it may lose money on an operating basis). During these conditions, it is possible that the Fund will generate an insufficient amount of income to pay its expenses. In addition, it is possible that during these conditions the Fund may experience difficulties purchasing and/or selling securities with respect to scheduled rebalances, and may, as a result, maintain a portion of its assets in cash, on which it may earn little, if any, income
Risk of U.S. Treasury Bills. Direct obligations of the U.S. Treasury have historically involved little risk of loss of principal if held to maturity. However, due to fluctuations in interest rates, the market value of such securities may vary.
Valuation Risk. Some portfolio holdings, potentially a large portion of the Fund’s investment portfolio, may be valued on the basis of factors other than market quotations. This may occur more often in times of market turmoil or reduced liquidity.There are multiple methods that can be used to value a portfolio holding when market quotations are not readily available. The value established for any portfolio holding at a point in time might differ from what would be produced using a different methodology or if it had been priced using market quotations.Portfolio holdings that are valued using techniques other than market quotations, including “fair valued” securities, may be subject to greater fluctuation in their valuations from one day to the next than if market quotations were used. In addition, there is no assurance that the Fund could sell or close out a portfolio position for the value established for it at any time, and it is possible that the Fund would incur a loss because a portfolio position is sold or closed out at a discount to the valuation established by the Fund at that time.
See the Funds’ Prospectus and Statement of Additional Information regarding the risks of investing in shares of the Funds.
NOTE 4 – COMMITMENTS AND OTHER RELATED PARTY TRANSACTIONS
Empowered Funds, LLC dba EA Advisers (the “Adviser”) serves as the investment adviser to the Funds. Pursuant to investment advisory agreements (the “Advisory Agreements”) between the Trust, on behalf of the Funds, and the Adviser, the Adviser provides investment advice to the Funds and oversees the day-to-day operations of the Funds, subject to the direction and control of the Board and the officers of the Trust. Under the Advisory Agreements, the Adviser is also responsible for arranging transfer agency, custody, fund administration and accounting, and other non-distribution related services necessary for the Funds to operate. The Adviser administers the Funds’ business affairs, provides office facilities and equipment and certain clerical, bookkeeping and administrative services. The Adviser agrees to pay all expenses incurred by the Funds except for the fee paid to the Adviser pursuant to the Advisory Agreement, payments under any distribution plan adopted pursuant to Rule 12b-1, brokerage expenses, acquired fund fees and expenses, taxes, interest (including borrowing costs), litigation expense (including class action-related services) and other non-routine or extraordinary expenses.
ALPHA ARCHITECT ETFs
| | | | | | | | |
| NOTES TO THE FINANCIAL STATEMENTS (CONTINUED) | |
| SEPTEMBER 30, 2023 | | |
The table below represents the annual rate (after fee waivers) based on average daily net assets that each Fund pays the Adviser monthly:
| | | | | | | | | | | | | | |
| Alpha Architect U.S. Quantitative Value ETF | | | 0.39 | % |
| Alpha Architect International Quantitative Value ETF | | | 0.49 | % |
| Alpha Architect U.S. Quantitative Momentum ETF | | | 0.39 | % |
| Alpha Architect International Quantitative Momentum ETF | | | 0.49 | % |
| Alpha Architect Value Momentum Trend ETF | | | 0.45 | % |
| Alpha Architect High Inflation and Deflation ETF | | | 0.29 | % |
| Alpha Architect Tail Risk ETF | | | 0.63 | % |
Effective January 31, 2023, the Adviser reduced its management fee for the Alpha Architect U.S. Quantitative Value ETF, Alpha Architect International Quantitative Value ETF, Alpha Architect U.S. Quantitative Momentum ETF and Alpha Architect International Quantitative Momentum ETF from an annual rate based on average daily net assets from 0.49% to 0.39%, 0.59% to 0.49%, 0.49% to 0.39%, and 0.59% to 0.49%, respectively.
The Adviser has contractually agreed to waive all or a portion of its management fee for the Alpha Architect Value Momentum Trend ETF until at least January 31, 2025 to the extent necessary to prevent (i) management fees paid to the investment adviser for the Fund plus (ii) the aggregate amount of management fees paid to the Adviser for management of the Alpha Architect ETFs that are directly attributable to the Fund’s ownership of shares of the Alpha Architect ETFs, from exceeding 0.69% of the Fund’s daily net assets. This waiver agreement may be terminated only by agreement of the investment adviser and the Fund’s Board of Trustees. The fee waived is not subject to recoupment.
The Adviser has contractually agreed to waive receipt of its management fees and/or assume expenses of the Alpha Architect High Inflation and Deflation ETF to the extent necessary to offset AFFE so that the total annual operating expenses of the Fund (excluding payments under the Fund’s Rule 12b-1 distribution and service plan (if any), brokerage expenses, taxes (including tax-related services), interest (including borrowing costs), litigation expense (including class action-related services) and other non-routine or extraordinary expenses) do not exceed 0.29% of the Fund’s average daily net assets. This agreement is in effect until November 15, 2025, and it may be terminated before that date only by a majority vote of the “non-interested” trustees. The fee waived is not subject to recoupment.
The Adviser has contractually agreed to waive receipt of its management fees and/or assume expenses of the
Alpha Architect Tail Risk ETF, including any acquired fund fees or expenses (“AFFE”) related to the Fund’s investment in the Alpha Architect 1-3 Month Box ETF so that the total annual operating expenses of the Fund (excluding payments under the Fund’s Rule 12b-1 distribution and service plan (if any), brokerage expenses, taxes (including tax-related services), interest (including borrowing costs), litigation expense (including class action-related services) and other non-routine or extraordinary expenses) do not exceed 0.63% of the Fund’s average daily net assets. Any AFFE associated with Fund investments in any other acquired funds are not included in the fee waiver. This agreement may only be changed or terminated by a vote of the holders of a majority of the Fund's outstanding voting securities.
Alpha Architect, LLC, serves as a discretionary investment sub-adviser to the Alpha Architect High Inflation and Deflation ETF. Pursuant to an investment sub-advisory agreement (the “Alpha Sub-Advisory Agreement”) among the Trust, the Adviser and the Sub-Adviser, the Sub-Adviser is responsible for determining the investment exposures for the Fund, subject to the overall supervision and oversight of the Adviser and the Board.
Arin Risk Advisors, LLC, serves as a discretionary investment sub-adviser to the Alpha Architect Tail Risk ETF. Pursuant to an investment sub-advisory agreement (the “Arin Sub-Advisory Agreement”) among the Trust, the Adviser and the Sub-Adviser, the Sub-Adviser is responsible for determining the investment exposures for the Fund, subject to the overall supervision and oversight of the Adviser and the Board.
U.S. Bancorp Fund Services, LLC (“Fund Services” or “Administrator”), doing business as U.S. Bank Global Fund Services, acts as the Funds’ Administrator and, in that capacity, performs various administrative and accounting services for the Funds. The Administrator prepares various federal and state regulatory filings, reports and returns for the Funds, including regulatory compliance monitoring and financial reporting; prepares reports and materials to be supplied to the trustees; monitors the activities of the Funds’ Custodian, transfer agent and fund accountant. Fund Services also serves as the transfer agent and fund accountant to the Funds. U.S. Bank N.A. (the “Custodian”), an affiliate of the Administrator, serves as the Funds’ Custodian.
ALPHA ARCHITECT ETFs
| | | | | | | | |
| NOTES TO THE FINANCIAL STATEMENTS (CONTINUED) | |
| SEPTEMBER 30, 2023 | | |
The Custodian acts as the securities lending agent (the “Securities Lending Agent”) for the Funds.
NOTE 5 – SECURITIES LENDING
Each Fund may lend up to 331/3% of the value of the securities in their portfolios to brokers, dealers and financial institutions (but not individuals) under terms of participation in a securities lending program administered by the Securities Lending Agent. The securities lending agreement requires that loans are collateralized at all times in an amount equal to at least 102% of the value of any domestic loaned securities at the time of the loan, plus accrued interest. The use of loans of foreign securities, which are denominated and payable in U.S. dollars, shall be collateralized in an amount equal to 105% of the value of any loaned securities at the time of the loan plus accrued interest. The Funds receive compensation in the form of fees and earn interest on the cash collateral. The amount of fees depends on a number of factors including the type of security and length of the loan. The Funds continue to receive interest payments or dividends on the securities loaned during the borrowing period. Gain or loss on the value of securities loaned that may occur during the term of the loan will be for the account of the Funds. The Funds have the right under the terms of the securities lending agreement to recall the securities from the borrower on demand.
The securities lending agreement provides that, in the event of a borrower’s material default, the Securities Lending Agent shall take all actions the Securities Lending Agent deems appropriate to liquidate the collateral, purchase replacement securities at the Securities Lending Agent’s expense, or pay the Fund an amount equal to the market value of the loaned securities, subject to certain limitations which are set forth in detail in the securities lending agreement between the Fund and the Securities Lending Agent.
As of the end of the current fiscal period, certain Funds had loaned securities and received cash collateral for the loans. The cash collateral is invested by the Securities Lending Agent in accordance with the Trust-approved investment guidelines. Those guidelines require the cash collateral to be invested in readily marketable, high quality, short-term obligations; however, such investments are subject to risk of payment delays or default on the part of the issuer or counterparty or otherwise may not generate sufficient interest to support the costs associated with securities lending. The Funds could also experience delays in recovering their securities and possible loss of income or value if the borrower fails to return the borrowed securities, although the Funds are indemnified from this risk by contract with the Securities Lending Agent.
As of the end of the current fiscal year, the values of the securities on loan and payable for collateral due to broker for the Funds were as follows:
| | | | | | | | | | | | | | | | | | | | |
| | Value of Securities on Loan | | Payable for Collateral Received* | | Percentage of Net Assets of Securities On Loan |
| Alpha Architect U.S. Quantitative Value ETF | | $ | — | | | $ | — | | | 0.00% |
| Alpha Architect International Quantitative Value ETF | | 765,200 | | | 790,000 | | | 0.50% |
| Alpha Architect U.S. Quantitative Momentum ETF | | — | | | — | | | 0.00% |
| Alpha Architect International Quantitative Momentum ETF | | — | | | — | | | 0.00% |
| Alpha Architect Value Momentum Trend ETF | | 2,359 | | | 2,450 | | | 0.01% |
| Alpha Architect High Inflation and Deflation ETF | | — | | | — | | | 0.00% |
| Alpha Architect Tail Risk ETF | | — | | | — | | | 0.00% |
* The cash collateral received was invested in the First American Money Market Government Obligations Fund as shown on the Schedule of Investments. The investment objective is to seek maximum current income to the extent consistent with the preservation of capital and maintenance of liquidity.
The interest income earned by the Funds on the investment of cash collateral received from borrowers for the securities loaned to them (“Securities Lending Income, Net”) is reflected in the Funds’ Statements of Operations. Net securities lending income earned on collateral investments and recognized by the Funds during the current fiscal period was as follows:
| | | | | | | | |
| Alpha Architect U.S. Quantitative Value ETF | | $ | 1,751 | |
ALPHA ARCHITECT ETFs
| | | | | | | | |
| NOTES TO THE FINANCIAL STATEMENTS (CONTINUED) | |
| SEPTEMBER 30, 2023 | | |
| | | | | | | | |
| Alpha Architect International Quantitative Value ETF | | 59 | |
| Alpha Architect U.S. Quantitative Momentum ETF | | 85 | |
| Alpha Architect International Quantitative Momentum ETF | | 4,095 | |
| Alpha Architect Value Momentum Trend ETF | | 27,323 | |
| Alpha Architect High Inflation and Deflation ETF | | — | |
| Alpha Architect Tail Risk ETF | | — | |
Due to the absence of a master netting agreement related to the Funds’ participation in securities lending, no additional offsetting disclosures have been made on behalf of the Funds for the total borrowings listed above.
NOTE 6 – PURCHASES AND SALES OF SECURITIES
For the fiscal year ended September 30, 2023, purchases and sales of securities for the Funds, excluding short-term securities and in-kind transactions, were as follows:
| | | | | | | | | | | | | | |
| | Purchases | | Sales |
| Alpha Architect U.S. Quantitative Value ETF | | $ | 369,427,480 | | | $ | 242,102,524 | |
| Alpha Architect International Quantitative Value ETF | | 226,680,271 | | | 98,324,990 | |
| Alpha Architect U.S. Quantitative Momentum ETF | | 344,302,412 | | | 268,147,748 | |
| Alpha Architect International Quantitative Momentum ETF | | 185,861,528 | | | 97,239,139 | |
| Alpha Architect Value Momentum Trend ETF | | 18,737,686 | | | 23,011,096 | |
| Alpha Architect High Inflation and Deflation ETF | | 7,910,390 | | | 7,780,527 | |
| Alpha Architect Tail Risk ETF | | 82,765,338 | | | — | |
For the fiscal year ended September 30, 2023, in-kind transactions associated with creations and redemptions were as follows:
| | | | | | | | | | | |
| Purchases | | Sales |
| Alpha Architect U.S. Quantitative Value ETF | $ | 159,363,973 | | | $ | 248,785,940 | |
| Alpha Architect International Quantitative Value ETF | 28,237,155 | | | 136,635,001 | |
| Alpha Architect U.S. Quantitative Momentum ETF | 143,169,616 | | | 156,296,622 | |
| Alpha Architect International Quantitative Momentum ETF | 22,513,044 | | | 96,574,986 | |
| Alpha Architect Value Momentum Trend ETF | 1,424,366 | | | 3,891,938 | |
| Alpha Architect High Inflation and Deflation ETF | 2,827,278 | | | 331,499 | |
| Alpha Architect Tail Risk ETF | 23,393,687 | | | 1,547,400 | |
For the fiscal year ended September 30, 2023, short term and long-term gains/losses on in-kind transactions were as follows:
| | | | | | | | | | | | | | |
| | Short Term | | Long Term |
| Alpha Architect U.S. Quantitative Value ETF | | $ | 33,974,654 | | | $ | 5,970,285 | |
| Alpha Architect International Quantitative Value ETF | | 11,102,192 | | | 2,683,978 | |
| Alpha Architect U.S. Quantitative Momentum ETF | | 18,250,249 | | | 1,572,868 | |
| Alpha Architect International Quantitative Momentum ETF | | 10,288,348 | | | 597,302 | |
| Alpha Architect Value Momentum Trend ETF | | 59,284 | | | 554,300 | |
| Alpha Architect High Inflation and Deflation ETF | | (1,375) | | | — | |
| Alpha Architect Tail Risk ETF | | 54,406,570 | | (1) | — | |
(1) Includes short-term gains on in-kind transactions for options which are considered short-term securities. |
There were no purchases or sales of U.S. Government securities during the fiscal
ALPHA ARCHITECT ETFs
| | | | | | | | |
| NOTES TO THE FINANCIAL STATEMENTS (CONTINUED) | |
| SEPTEMBER 30, 2023 | | |
NOTE 7 – TRANSACTIONS WITH AFFILIATES
The Alpha Architect Value Momentum Trend ETF’s (the “Fund”) transactions with affiliates represent holdings for which the Fund and the underlying Alpha Architect ETFs have the same investment adviser. The Alpha Architect Value Momentum Trend ETF had the following transactions with such affiliated Alpha Architect ETFs during the fiscal year ended September 30, 2023:
| | | | | | | | | | | | | | | | | | | | | | | | | | | | | | | | |
| | Alpha Architect U.S. Quantitative Value ETF | | Alpha Architect International Quantitative Value ETF | | Alpha Architect U.S. Quantitative Momentum ETF | | Alpha Architect International Quantitative Momentum ETF | | Total |
| Value, Beginning of Period | | $ | 11,182,578 | | | $ | 7,427,252 | | | $ | 13,466,228 | | | $ | 5,508,491 | | | $ | 37,584,549 | |
| Purchases | | 6,621,901 | | | 5,466,117 | | | 1,041,435 | | | 7,032,600 | | | 20,162,053 | |
| Proceeds from Sales | | (8,875,899) | | | (2,133,596) | | | (9,769,017) | | | (6,124,522) | | | (26,903,034) | |
| Net Realized Gains (Losses) | | (640,823) | | | (376,988) | | | 183,683 | | | (1,006,584) | | | (1,840,712) | |
| Change in Unrealized Appreciation (Depreciation) | | 2,297,945 | | | 1,729,566 | | | 81,792 | | | 1,482,384 | | | 5,591,687 | |
| Value, End of Period | | $ | 10,585,702 | | | $ | 12,112,351 | | | $ | 5,004,121 | | | $ | 6,892,369 | | | $ | 34,594,543 | |
| Dividend Income | | $ | 258,224 | | | $ | 1,031,957 | | | $ | 176,519 | | | $ | 341,332 | | | $ | 1,808,032 | |
| | | | | | | | | | | | | | | | | | | | | | | | | | |
| | Alpha Architect U.S. Quantitative Value ETF | | Alpha Architect International Quantitative Value ETF | | Alpha Architect U.S. Quantitative Momentum ETF | | Alpha Architect International Quantitative Momentum ETF |
| Shares, Beginning of Period | | 382,965 | | | 366,416 | | | 304,852 | | | 241,283 | |
| Number of Shares Purchased | | 179,403 | | | 236,111 | | | 22,799 | | | 279,382 | |
| Number of Shares Sold | | (277,116) | | | (89,059) | | | (211,597) | | | (239,587) | |
| Shares, End of Period | | 285,252 | | | 513,468 | | | 116,054 | | | 281,078 | |
The Alpha Architect Tail Risk ETF’s (the “Fund”) transactions with affiliates represent holdings for which the Fund and the underlying Alpha Architect ETFs have the same investment adviser. The Alpha Architect Value Momentum Trend ETF had the following transactions with such affiliated Alpha Architect ETFs during the fiscal year ended September 30, 2023:
| | | | | | | | | | | | | | |
| | Alpha Architect 1-3 Month Box ETF | | Total |
| Value, Beginning of Period | | $ | — | | | $ | — | |
| Purchases | | 105,901,403 | | | 105,901,403 | |
| Proceeds from Sales | | (1,289,691) | | | (1,289,691) | |
| Net Realized Gains (Losses) | | 34,863 | | | 34,863 | |
| Change in Unrealized Appreciation (Depreciation) | | 2,662,225 | | | 2,662,225 | |
| Value, End of Period | | $ | 107,308,800 | | | $ | 107,308,800 | |
| Dividend Income | | - | | - |
| | | | | |
| Alpha Architect 1-3 Month Box ETF |
| Shares, Beginning of Period | — | |
| Number of Shares Purchased | 1,047,500 | |
| Number of Shares Sold | (12,500) | |
| Shares, End of Period | 1,035,000 | |
ALPHA ARCHITECT ETFs
| | | | | | | | |
| NOTES TO THE FINANCIAL STATEMENTS (CONTINUED) | |
| SEPTEMBER 30, 2023 | | |
NOTE 8 – TAX INFORMATION
The components of tax basis cost of investments and net unrealized appreciation (depreciation) for federal income tax purposes at September 30, 2023 were as follows:
| | | | | | | | | | | | | | |
| | Alpha
Architect
U.S. Quantitative Value
ETF | Alpha
Architect International Quantitative Value
ETF | Alpha
Architect
U.S. Quantitative Momentum
ETF | Alpha
Architect International Quantitative Momentum
ETF |
| Tax cost of Investments | $ | 261,008,540 | | $ | 147,508,694 | | $ | 145,897,893 | | $ | 75,603,023 | |
| Gross tax unrealized appreciation | $ | 23,340,868 | | $ | 9,708,119 | | $ | 7,389,090 | | $ | 1,661,235 | |
| Gross tax unrealized depreciation | (6,561,738) | (6,196,645) | (7,926,054) | (3,525,326) |
| Net tax unrealized appreciation (depreciation) | $16,779,130 | $3,511,474 | $(536,964) | $(1,864,091) |
| Undistributed ordinary income | - | 1,705,958 | 1,176,104 | 2,068,798 |
| Undistributed long-term gain | - | - | - | - |
| Total distributable earnings | - | 1,705,958 | 1,176,104 | 2,068,798 |
| Other accumulated gain (loss) | (129,726,933) | (101,159,010) | (102,947,288) | (84,056,367) |
| Total accumulated gain (loss) | $ | (112,947,803) | | $ | (95,941,578) | | $ | (102,308,148) | | $ | (83,851,660) | |
| | | | | | | | | | | |
| | Alpha
Architect
Value Momentum Trend
ETF | Alpha Architect High Inflation and Deflation ETF | Alpha Architect Tail Risk ETF |
| Tax cost of Investments | $ | 34,973,928 | | $ | 16,577,788 | | $ | 179,612,288 | |
| Gross tax unrealized appreciation | $ | 2,853,738 | | $ | 267 | | $ | 19,616,284 | |
| Gross tax unrealized depreciation | (2,901,787) | (26,717) | (34,591,258) | |
| Net tax unrealized appreciation (depreciation) | (48,049) | | (26,450) | | (14,974,974) | |
| Undistributed ordinary income | 843,297 | 437,839 | — | |
| Undistributed long-term gain | - | - | — | |
| Total distributable earnings | 843,297 | 437,839 | — | |
| Other accumulated gain (loss) | (24,678,668) | (549,172) | (52,782,313) | |
| Total accumulated gain (loss) | $ | (23,883,420) | | $ | (137,783) | | $ | (67,757,287) | |
Under tax law, certain capital and foreign currency losses realized after October 31 and within the taxable year are deemed to arise on the first business day of each Fund’s next taxable year.
For the fiscal year ended September 30, 2023, the Funds did not defer any qualified late year losses, post-October losses or post-October capital losses.
ALPHA ARCHITECT ETFs
| | | | | | | | |
| NOTES TO THE FINANCIAL STATEMENTS (CONTINUED) | |
| SEPTEMBER 30, 2023 | | |
At September 30, 2023, the Funds had the following capital loss carryforwards:
| | | | | | | | | | | | | | | | | | | | | | | |
| | | Unlimited
Short-Term | | | Unlimited
Long-Term |
| Alpha Architect U.S. Quantitative Value ETF | | $ | (109,966,522) | | | | $ | (19,760,411) |
| Alpha Architect International Quantitative Value ETF | | | (76,553,792) | | | | (24,605,218) |
| Alpha Architect U.S. Quantitative Momentum ETF | | | (102,210,027) | | | | (737,261) |
| Alpha Architect International Quantitative Momentum ETF | | | (83,631,991) | | | | (424,376) |
| Alpha Architect Value Momentum Trend ETF | | | (21,795,645) | | | | (2,883,023) |
| Alpha Architect High Inflation and Deflation ETF | | | (549,172) | | | | - |
| Alpha Architect Tail Risk ETF | | | (42,406,935) | | | | (10,375,378) |
NOTE 9 – DISTRIBUTIONS TO SHAREHOLDERS
The tax character of distributions paid by the Funds during the fiscal year ended September 30, 2023 and fiscal year ended September 30, 2022, were as follows:
| | | | | | | | | | | | | | | | | | | | | | | | | | |
| | | Fiscal Year Ended
September 30,
2023 | | | Fiscal Year Ended
September 30,
2022 | |
| | | Ordinary Income | | | Ordinary Income | |
| Alpha Architect U.S. Quantitative Value ETF | | $ | 5,720,298 | | | | $ | 4,085,319 | | |
| Alpha Architect International Quantitative Value ETF | | | 15,398,314 | | | | 3,473,344 | |
| Alpha Architect U.S. Quantitative Momentum ETF | | | 2,115,259 | | | | 112,054 | |
| Alpha Architect International Quantitative Momentum ETF | | | 3,768,945 | | | | 789,442 | |
| Alpha Architect Value Momentum Trend ETF | | | 877,779 | | | | 331,835 | |
| Alpha Architect High Inflation and Deflation ETF | | | 292,778 | | | | - | 1 |
| Alpha Architect Tail Risk ETF | | | - | | | | - | 2 |
1 The Fund commenced operations after September 30, 2022.
2 See Note 1.
NOTE 10 – CHANGE IN INDEPENDENT REGISTERED PUBLIC ACCOUNTING FIRM
Alpha Architect U.S. Quantitative Value ETF, Alpha Architect International Quantitative Value ETF, Alpha Architect U.S. Quantitative Momentum ETF, Alpha Architect International Quantitative Momentum ETF, Alpha Architect Value Momentum Trend ETF, Alpha Architect High Inflation and Deflation ETF
On June 9, 2023, the Board of Trustees (“Board”) of the EA Series Trust (the “Trust”), including a majority of the Independent Trustees, upon the recommendation and approval of the Audit Committee of the Board, appointed Tait Weller & Baker, LLP (“Tait”) to serve as each Fund’s independent registered public accounting firm for the Fund for the fiscal year ended September 30, 2023. Tait was approved as the auditor for all funds in the Trust. Tait replaces Spicer Jefferies, LLP (“Spicer”) in this role. Spicer did not resign and did not decline to stand for re-election.
The audit reports of Spicer on the financial statements of Alpha Architect U.S. Quantitative Value ETF, Alpha Architect International Quantitative Value ETF, Alpha Architect U.S. Quantitative Momentum ETF, Alpha Architect International Quantitative Momentum ETF, Alpha Architect Value Momentum Trend ETF, Alpha Architect High Inflation and Deflation ETF for the most recent fiscal periods ended September 30, 2019, September 30, 2020, September 30, 2021 and September 30, 2022 only, did not contain an adverse opinion or disclaimer of opinion, nor was the report qualified or modified as to uncertainty, audit scope, or accounting principles.
ALPHA ARCHITECT ETFs
| | | | | | | | |
| NOTES TO THE FINANCIAL STATEMENTS (CONTINUED) | |
| SEPTEMBER 30, 2023 | | |
During the fiscal periods ended September 30, 2019, September 30, 2020, September 30, 2021, September 30, 2022 and for the interim period ended June 9, 2023 , there were no disagreements (as defined in Item 304(a)(1)(iv) of Regulation S-K and related instructions) with Spicer on any matter of accounting principles or practices, financial statement disclosure or auditing scope or procedure, which disagreements, if not resolved to the satisfaction of Spicer, would have caused it to make a reference in connection with its opinion to the subject matter of the disagreement.
During the fiscal periods ended September 30, 2019, September 30, 2020, September 30, 2021, September 30, 2022 and for the interim period ended June 9, 2023, neither the Funds, nor anyone on their behalf, consulted with Tait with respect to: (i) the application of accounting principles to a specified transaction, either completed or proposed, or the type of audit opinion that might have been rendered on each Fund’s financial statements, and no written report or oral advice was provided that Tait concluded was an important factor considered by the Fund in reaching a decision as to any accounting, auditing or financial reporting issue; or (ii) any matter that was either the subject of a “disagreement” (as defined in Item 304(a)(1)(iv) of Regulation S-K and related instructions) or a “reportable event” (as defined in Item 304(a)(1)(v) of Regulation S-K).
Alpha Architect Tail Risk ETF
On June 9, 2023, the Board of Trustees (“Board”) of the EA Series Trust (the “Trust”), including a majority of the Independent Trustees, upon the recommendation and approval of the Audit Committee of the Board, appointed Tait Weller & Baker, LLP (“Tait”) to serve as each Fund’s independent registered public accounting firm for the Fund for the fiscal year ended September 30, 2023. Tait was approved as the auditor for all funds in the Trust. Tait replaces Cohen & Company, Ltd. ("Cohen") in this role. Cohen did not resign and did not decline to stand for re-election.
The audit reports of on the financial statements of Arin Large Cap Theta Fund (the “Predecessor Fund”), a series of the Starboard Investment Trust for the fiscal periods ended February 28, 2022 and February 28, 2023, did not contain an adverse opinion or disclaimer of opinion, nor was the report qualified or modified as to uncertainty, audit scope, or accounting principles.
During the fiscal period ended February 28, 2023 and for the interim period ended June 9, 2023 , there were no disagreements (as defined in Item 304(a)(1)(iv) of Regulation S-K and related instructions) with Cohen on any matter of accounting principles or practices, financial statement disclosure or auditing scope or procedure, which disagreements, if not resolved to the satisfaction of Cohen, would have caused it to make a reference in connection with its opinion to the subject matter of the disagreement.
During the fiscal periods ended February 28, 2022, February 28, 2023 and for the interim period ended June 9, 2023, neither the Fund, nor anyone on their behalf, consulted with Tait with respect to: (i) the application of accounting principles to a specified transaction, either completed or proposed, or the type of audit opinion that might have been rendered on each Fund’s financial statements, and no written report or oral advice was provided that Tait concluded was an important factor considered by the Fund in reaching a decision as to any accounting, auditing or financial reporting issue; or (ii) any matter that was either the subject of a “disagreement” (as defined in Item 304(a)(1)(iv) of Regulation S-K and related instructions) or a “reportable event” (as defined in Item 304(a)(1)(v) of Regulation S-K).
NOTE 11 – SUBSEQUENT EVENTS
In preparing these financial statements, management of the Funds have evaluated events and transactions for potential recognition or disclosure through date the financial statements were issued. Except as noted below, there were no transactions that occurred during the year subsequent to September 30, 2023, that materially impacted the amounts or disclosures in the Funds’ financial statements.
Effective on November 21, 2023, Alpha Architect U.S. Quantitative Value ETF, Alpha Architect International Quantitative Value ETF, Alpha Architect U.S. Quantitative Momentum ETF, Alpha Architect International Quantitative Momentum ETF, Alpha Architect Value Momentum Trend ETF, and Alpha Architect High Inflation and Deflation ETF transferred its primary listing to the The Nasdaq Stock Market, LLC and no longer is listed on CBOE BZX Exchange, Inc.
REPORT OF INDEPENDENT REGISTERED PUBLIC ACCOUNTING FIRM
To the Shareholders of
Alpha Architect ETFs and
The Board of Trustees of
EA Series Trust
Opinion on the Financial Statements
We have audited the accompanying statements of assets and liabilities of Alpha Architect U.S. Quantitative Value ETF, Alpha Architect International Quantitative Value ETF, Alpha Architect U.S. Quantitative Momentum ETF, Alpha Architect International Quantitative Momentum ETF, Alpha Architect Value Momentum Trend ETF, Alpha Architect High Inflation and Deflation ETF and Alpha Architect Tail Risk ETF (formerly known as Arin Large Cap Theta Fund), (the “Funds”), each a series of EA Series Trust (the “Trust”), including the schedules of investments, as of September 30, 2023, the related statements of operations, statements of changes in net assets, and the financial highlights for each of the periods indicated in the table below, and the related notes (collectively referred to as the “financial statements”). In our opinion, the financial statements present fairly, in all material respects, the financial position of the Funds as of September 30, 2023, the results of their operations, the changes in their net assets, and their financial highlights for each of the periods indicated in the table below, in conformity with accounting principles generally accepted in the United States of America.
| | | | | | | | | | | |
| Individual Funds Constituting EA Series Trust | Statement of Operations | Statements of Changes In Net Assets | Financial Highlights |
| Alpha Architect U.S. Quantitative Value ETF, Alpha Architect International Quantitative Value ETF, Alpha Architect U.S. Quantitative Momentum ETF, Alpha Architect International Quantitative Momentum ETF, and Alpha Architect Value Momentum ETF | For the year ended September 30, 2023 | For the year ended September 30, 2023 | For the year ended September 30, 2023 |
| Alpha Architect High Inflation and Deflation ETF | For the period November 17, 2022 (commencement of operations) to September 30, 2023 | For the period November 17, 2022 (commencement of operations) to September 30, 2023 | For the period November 17, 2022 (commencement of operations) to September 30, 2023 |
| Alpha Architect Tail Risk ETF | For the period March 1, 2023 to September 30, 2023 | For the period March 1, 2023 to September 30, 2023 | For the period March 1, 2023 to September 30, 2023 |
The statements of changes in net assets for the year ended September 30, 2022 and the financial highlights for each of the four years in the period then ended, for Alpha Architect U.S. Quantitative Value ETF, Alpha Architect International Quantitative Value ETF, Alpha Architect U.S. Quantitative Momentum ETF, Alpha Architect International Quantitative Momentum ETF, and Alpha Architect Value Momentum Trend ETF, were audited by other auditors, whose report dated November 29, 2022 expressed an unqualified opinion on such financial statements and financial highlights. The statement of operations for the year ended February 28, 2023, the statements of changes in net assets for each of the two years in the period then ended, and the financial highlights for each of the five years in the period then ended before the effects of the adjustments to retrospectively apply the reverse stock split for Alpha Architect Tail Risk ETF, formerly known as Arin Large Cap Theta Fund, were audited by other auditors, whose reports dated April 28, 2023 and April 27, 2022, expressed an unqualified opinion on those financial statements and financial highlights.
We also have audited the adjustments to the statements of changes and the financial highlights of Alpha Architect Tail Risk ETF (formerly known as Arin Large Cap Theta Fund) for the years ended February 28, 2023, 2022, 2021, 2020 and 2019 to reflect the reverse stock split, as described in Note 1. In our opinion, such adjustments are appropriate and have been properly applied. We were not engaged to audit, review, or apply
REPORT OF INDEPENDENT REGISTERED PUBLIC ACCOUNTING FIRM (CONTINUED)
any procedures to the February 28, 2023, 2022, 2021, 2020 and 2019 financial statements and financial highlights of the Fund other than with respect to the adjustments and, accordingly, we do not express an opinion or any other form of assurance on the February 28, 2023, 2022, 2021, 2020 and 2019 financial statements and financial highlights taken as a whole.
Basis for Opinion
These financial statements are the responsibility of the Funds’ management. Our responsibility is to express an opinion on the Funds’ financial statements based on our audits. We are a public accounting firm registered with the Public Company Accounting Oversight Board (United States) (“PCAOB”) and are required to be independent with respect to the Funds in accordance with the U.S. federal securities laws and the applicable rules and regulations of the Securities and Exchange Commission and the PCAOB. We have served as the auditor of one or more of the funds in the Trust since 2023.
We conducted our audits in accordance with the standards of the PCAOB. Those standards require that we plan and perform the audits to obtain reasonable assurance about whether the financial statements are free of material misstatement, whether due to error or fraud. The Funds are not required to have, nor were we engaged to perform, an audit of the Funds’ internal control over financial reporting. As part of our audits we are required to obtain an understanding of internal control over financial reporting, but not for the purpose of expressing an opinion on the effectiveness of the Funds’ internal control over financial reporting. Accordingly, we express no such opinion.
Our audits included performing procedures to assess the risks of material misstatement of the financial statements, whether due to error or fraud, and performing procedures that respond to those risks. Such procedures included examining, on a test basis, evidence regarding the amounts and disclosures in the financial statements. Our audits also included evaluating the accounting principles used and significant estimates made by management, as well as evaluating the overall presentation of the financial statements. Our procedures included confirmation of securities owned as of September 30, 2023 by correspondence with the custodian and brokers; when replies were not received from brokers, we performed other auditing procedures. We believe that our audits provide a reasonable basis for our opinion.
TAIT, WELLER & BAKER LLP
Philadelphia, Pennsylvania
November 29, 2023
ALPHA ARCHITECT ETFs
EXPENSE EXAMPLE
| | |
| SEPTEMBER 30, 2023 (UNAUDITED) |
As a shareholder of each Fund you incur two types of costs: (1) transaction costs, including brokerage commissions on purchases and sales of Fund shares, and (2) ongoing costs, including management fees and other Fund expenses. This example is intended to help you understand your ongoing costs (in dollars) of investing in each Fund and to compare these costs with the ongoing costs of investing in other mutual funds.
The example is based on an investment of $1,000 invested at the beginning of the most recent six-month period and held the entire period (April 1, 2023 to September 30, 2023).
Actual Expenses
The first line of the table below provides information about actual account values and actual expenses. You may use the information in this line, together with the amount you invested, to estimate the expenses that you paid over the period. Simply divide your account value by $1,000 (for example, an $8,600 account value divided by $1,000 = 8.6), then multiply the result by the number in the first line under the heading entitled “Expenses Paid During the Period April 1, 2023 to September 30, 2023” to estimate the expenses you paid on your account during this period.
Hypothetical Example for Comparison Purposes
The second line of each table below provides information about hypothetical account values and hypothetical expenses based on each of the fund’s actual expense ratios and an assumed rate of return of 5% per year before expenses, which is not each Fund’s actual return. The hypothetical account values and expenses may not be used to estimate the actual ending account balance or expenses you paid for the period. You may use this information to compare the ongoing costs of investing in each Fund compared to other funds. To do so, compare this 5% hypothetical example with the 5% hypothetical examples that appear in the shareholder reports of the other funds. Please note that the expenses shown in the table are meant to highlight your ongoing costs only and do not reflect any transactional costs, such as brokerage commissions paid on purchases and sales of each Fund shares. Therefore, the second line of each table is useful in comparing ongoing costs only and will not help you determine the relative total costs of owning different funds. If these transactional costs were included, your costs would have been higher. The expenses for the Alpha Architect Value Momentum Trend ETF shown in the table reflect fee waivers in effect. Also, the information assumes the reinvestment of all dividends and distributions.
| | | | | | | | | | | | | | | | | | | | | | | | | | |
| | Annualized Expense Ratio | | Beginning Account Value April 1, 2023 | | Ending Account Value September 30, 2023 | | Expenses Paid During the Period1 |
| | | | | | | | |
| Alpha Architect U.S. Quantitative Value ETF | | | | | | | | |
| Actual | | 0.39% | | $ 1,000.00 | | $ 1,108.00 | | 2.06 |
| Hypothetical (5% annual return before expenses) | | 0.39% | | 1,000.00 | | 1,023.11 | | 1.98 |
| | | | | | | | |
| Alpha Architect International Quantitative Value ETF | | | | | | | | |
| Actual | | 0.49% | | $ 1,000.00 | | $ 1,046.80 | | 2.51 |
| Hypothetical (5% annual return before expenses) | | 0.49% | | 1,000.00 | | 1,022.61 | | 2.48 |
| | | | | | | | |
| Alpha Architect U.S. Quantitative Momentum ETF | | | | | | | | |
| Actual | | 0.39% | | $ 1,000.00 | | $ 956.00 | | 1.91 |
| Hypothetical (5% annual return before expenses) | | 0.39% | | 1,000.00 | | 1,023.11 | | 1.98 |
| | | | | | | | |
| Alpha Architect International Quantitative Momentum ETF | | | | | | |
| Actual | | 0.61% | | $ 1,000.00 | | $ 931.30 | | 2.95 |
| Hypothetical (5% annual return before expenses) | | 0.61% | | 1,000.00 | | 1,022.01 | | 3.09 |
| Alpha Architect Value Momentum Trend ETF² | | | | | | | | |
| Actual | | 0.38% | | $ 1,000.00 | | $ 969.90 | | 1.88 |
| Hypothetical (5% annual return before expenses) | | 0.38% | | 1,000.00 | | 1,023.16 | | 1.93 |
| | | | | | | | |
ALPHA ARCHITECT ETFs
EXPENSE EXAMPLE
| | |
| SEPTEMBER 30, 2023 (UNAUDITED) |
| | | | | | | | | | | | | | | | | | | | | | | | | | |
| | Annualized Expense Ratio | | Beginning Account Value April 1, 2023 | | Ending Account Value September 30, 2023 | | Expenses Paid During the Period1 |
| Alpha Architect High Inflation and Deflation ETF | | | | | | | | |
| Actual | | 0.28% | | $ 1,000.00 | | $ 1,007.70 | | 1.41 |
| Hypothetical (5% annual return before expenses) | | 0.28% | | 1,000.00 | | 1,023.66 | | 1.42 |
| | | | | | | | |
| Alpha Architect Tail Risk ETF | | | | | | | | |
| Actual | | 0.52% | | $ 1,000.00 | | $ 1,050.70 | | 2.67 |
| Hypothetical (5% annual return before expenses) | | 0.52% | | 1,000.00 | | 1,022.46 | | 2.64 |
| | | | | |
| 1 | The dollar amounts shown as expenses paid during the period are equal to the annualized six-month expense ratio multiplied by the average account value during the period, multiplied by 183/365, to reflect the one-half year period. |
| | |
| 2 | The Advisor has waived fees incurred by the Fund that are directly attributable to the Fund’s ownership of shares of the Alpha Architect ETFs, to prevent management fees from exceeding 0.79% of the Fund’s daily net assets. |
ALPHA ARCHITECT ETFs
| | |
| REVIEW OF LIQUIDITY RISK MANAGEMENT PROGRAM (UNAUDITED) |
Pursuant to Rule 22e-4 under the Investment Company Act of 1940, the Trust, on behalf of the series of the Trust covered by this shareholder report (each a “Fund”, and collectively, the “Funds”), has adopted a liquidity risk management program (“the Program”) to govern the Trust’s approach to managing liquidity risk. Rule 22e-4 seeks to promote effective liquidity risk management, thereby reducing the risk that a Fund will be unable to meet its redemption obligations and mitigating dilution of the interests of fund shareholders. The Trust’s liquidity risk management program is tailored to reflect each Fund’s particular risks, but not to eliminate all adverse impacts of liquidity risk, which would be incompatible with the nature of the Fund.
The Trust’s Board of Trustees has designated certain representatives of the Adviser as the Program Administrator, responsible for administering the Program and its policies and procedures.
At the June 9, 2023, meeting of the Board of Trustees of the Trust, the Program Administrator provided the Trustees with a report pertaining to the operation, adequacy, and effectiveness of implementation of the Program for the period ended March 31, 2023. The report concluded that the Program appeared effectively tailored to identify potential illiquid scenarios and to enable the Funds to deliver appropriate reporting. In addition, the report concluded that the Program is adequately operating, and its implementation has been effective. The report reflected that there were no liquidity events that impacted the Funds’ ability to timely meet redemptions without dilution to existing shareholders. The report further described material changes that were made to the Program since its implementation.
There can be no assurance that the Program will achieve its objectives in the future. Please refer to the prospectus for more information regarding the Funds’ exposure to liquidity risk and other principal risks to which an investment in the Funds may be subject.
ALPHA ARCHITECT ETFs
| | |
| FEDERAL TAX INFORMATION (UNAUDITED) |
For the fiscal year ended September 30, 2023, certain dividends paid by each Fund may be subject to a maximum tax rate of 23.8%, as provided for by the Tax Cuts and Jobs Act of 2017. The percentage of dividends declared from ordinary income designated as qualified dividend income for each Fund was:
| | | | | |
| |
| Alpha Architect U.S. Quantitative Value ETF | 100.00 | % |
| Alpha Architect International Quantitative Value ETF | 84.23 | % |
| Alpha Architect U.S. Quantitative Momentum ETF | 100.00 | % |
| Alpha Architect International Quantitative Momentum ETF | 99.35 | % |
| Alpha Architect Value Momentum Trend ETF | 96.16 | % |
| Alpha Architect High Inflation and Deflation ETF | 5.85 | % |
| Alpha Architect Tail Risk ETF | 0.00 | % |
For corporate shareholders, the percent of ordinary income distributions qualifying for the corporate dividends received deduction for the fiscal year ended September 30, 2023 for each Fund was:
| | | | | |
| |
| Alpha Architect U.S. Quantitative Value ETF | 0.00 | % |
| Alpha Architect International Quantitative Value ETF | 100.00 | % |
| Alpha Architect U.S. Quantitative Momentum ETF | 25.26 | % |
| Alpha Architect International Quantitative Momentum ETF | 0.00 | % |
| Alpha Architect Value Momentum Trend ETF | 23.56 | % |
| Alpha Architect High Inflation and Deflation ETF | 100.00 | % |
| Alpha Architect Tail Risk ETF | 0.83 | % |
The percentage of taxable ordinary income distributions that are designated as short-term capital gain distributions under the Internal Revenue Section 871 (k)(2)(C) for each Fund was 0.00%.
ALPHA ARCHITECT ETFs
| | |
| FOREIGN TAX CREDIT PASS THROUGH (UNAUDITED) |
Pursuant to Section 853 of the Internal Revenue code, the Fund designates the following amounts as foreign taxes paid for the year ended September 30, 2023. Foreign taxes paid for financial statement purposes of Section 853 may be less than actual foreign taxes paid for financial statement purposes.
| | | | | | | | | | | |
| Creditable Foreign Tax Credit Paid | Per Share Amount | Portion of Ordinary Income Distribution Derived From Foreign Sourced Income |
| Alpha Architect U.S. Quantitative Value ETF | $ | — | | $ | — | | — |
| Alpha Architect International Quantitative Value ETF | 823,876 | 0.12823 | 100.00 | % |
| Alpha Architect U.S. Quantitative Momentum ETF | 235,577 | 0.07788 | 95.18 | % |
| Alpha Architect International Quantitative Momentum ETF | — | | — | | — |
| Alpha Architect Value Momentum Trend ETF | — | | — | | — |
| Alpha Architect High Inflation and Deflation ETF | — | | — | | — |
| Alpha Architect Tail Risk ETF | — | | — | | — |
Foreign taxes paid or withheld should be included in taxable income with an offsetting deduction from gross income or as a credit for taxes paid to foreign governments.
Above figures may differ from those cited elsewhere in this report due to difference in the calculation of income and gains under GAAP purposes and Internal Revenue Service purposes.
Shareholders are strongly advised to consult their own tax advisers with respect to the tax consequences of their investments in the Fund.
Trustees and Officers
The business and affairs of the Trust are managed by its officers under the oversight of its Board. The Board sets broad policies for the Trust and may appoint Trust officers. The Board oversees the performance of the Adviser, the Sub-Adviser, and the Trust’s other service providers. Each Trustee serves until his or her successor is duly elected or appointed and qualified.
The Board is comprised of four Trustees. One Trustee and certain of the officers of the Trust are directors, officers or employees of the Adviser. The other Trustees (the “Independent Trustees”) are not “interested persons” (as defined in Section 2(a)(19) of the Investment Company Act) of the Trust. The fund complex includes all funds advised by the Adviser (“Fund Complex”).
The Trustees, their age, term of office and length of time served, their principal business occupations during the past five years, the number of portfolios in the Fund Complex overseen and other directorships, if any, held by each Trustee, are shown below. The officers, their age, term of office and length of time served and their principal business occupations during the past five years are shown below. Unless noted otherwise, the address of each Trustee and each Officer is: c/o EA Series Trust, 19 East Eagle Road, Havertown, PA 19083.
| | | | | | | | | | | | | | | | | |
Name, Address, and Year of Birth | Position(s)
Held with
Trust | Term of Office and Length of Time Served | Principal Occupation During
Past 5 Years | Number of Funds in Fund Complex Overseen by Trustee | Other
Directorships
Held by
Trustee During
Past 5 Years |
| Independent Trustees |
Daniel Dorn Born: 1975 | Trustee | Since 2014 | Associate Professor of Finance, Drexel University, LeBow College of Business (2003 – present). | 46 | None |
Michael S. Pagano, Ph.D., CFA Born: 1962 | Trustee | Since 2014 | The Robert J. and Mary Ellen Darretta Endowed Chair in Finance, Villanova University (1999 – present); Co-Editor of The Financial Review (2023 – present); Founder, Michael S. Pagano, LLC (business consulting firm) (2008 – present). | 46 | Citadel Federal Credit Union (pro bono service for non-profit) |
Chukwuemeka (Emeka) O. Oguh Born: 1983 | Trustee | Since 2018 | o-founder and CEO, PeopleJoy (2016 – present). | 46 | None |
| Interested Trustee* |
Wesley R. Gray, Ph.D. Born: 1980 | Chairman and Trustee | Since 2014;
President 2014-2023 | Founder and Executive Managing Member, EA Advisers (2013 – present); Founder and Executive Managing Member, Empirical Finance, LLC d/b/a Alpha Architect (2010 – present). | 46 | None |
* Dr. Gray is an “interested person,” as defined by the Investment Company Act, because of his employment with and ownership interest in the Adviser.
Additional information about the Affiliated Trustee and Independent Trustees is available in the Statement of Additional Information (SAI).
Officers
| | | | | | | | | | | |
Name,
Address, and
Year of Birth | Position(s)
Held with
Trust | Term of
Office and
Length
of Time
Served | Principal Occupation During
Past 5 Years |
Patrick R. Cleary Born: 1982 | President and Chief Executive Officer; Secretary | Since 2023; Since 2015 | Chief Operating Officer (2014 – 2022) and Managing Member (2014 – present), Alpha Architect, LLC; Chief Executive Officer of EA Advisers (2021 – present). |
Alyssa M. Bernard Born: 1988 | Secretary | Since October 2023 | General Counsel, EA Advisers (October 2023 – present); Vice President—Regulatory Administration, U.S. Bank Global Fund Services (2021 – 2023); Assistant Vice President—Regulatory Administration, U.S. Bank Global Fund Services (2018 – 2021). |
Sean Hegarty Born: 1993 | Treasurer, Chief Financial Officer and Comptroller; Assistant Treasurer | Since 2023;
2022-2023 | Chief Operating Officer, EA Advisers (2022 – present); Assistant Vice President – Fund Administration, U.S. Bank Global Fund Services (2018 – 2022); Staff Accountant, Cohen & Company (2015 – 2018). |
Jessica Leighty Born: 1982 | Chief Compliance Officer | Since 2022 | Chief Compliance Officer Alpha Architect (2021 – present); Chief Compliance Officer, Snow Capital (2015 – 2021). |
Brian P. Massaro Born: 1997 | Assistant Treasurer | Since 2023 | Chief Data Officer, EA Advisers (2023 – present); Assistant Operating Officer, EA Advisers (2022 – 2023); Mutual Funds Administrator, U.S. Bank Global Fund Services (2019 – 2022). |
ALPHA ARCHITECT ETFs
| | |
| INFORMATION ABOUT PORTFOLIO HOLDINGS (UNAUDITED) |
The Funds file their complete schedules of portfolio holdings for their first and third fiscal quarters with the Securities and Exchange Commission (“SEC”) on Part F of Form N-PORT. The Funds’ Form N-PORT is available without charge, upon request, by calling (215) 882-9983. Furthermore, you may obtain the Form N-PORT on the SEC’s website at www.sec.gov. Each Funds’ portfolio holdings are posted on their website daily at https://etfsite.alphaarchitect.com/.
| | |
| INFORMATION ABOUT PROXY VOTING (UNAUDITED) |
A description of the policies and procedures the Funds use to determine how to vote proxies relating to portfolio securities is provided in the Statement of Additional Information (“SAI”). The SAI is available without charge upon request by calling (215) 882-9983, by accessing the SEC’s website at www.sec.gov, or by accessing the Funds’ website at https://etfsite.alphaarchitect.com/.
When available, information regarding how the Funds voted proxies relating to portfolio securities during the twelve months ending June 30 is (1) available by calling (215) 882-9983 and (2) the SEC’s website at www.sec.gov.
| | |
| FREQUENCY DISTRIBUTION OF PREMIUMS AND DISCOUNTS (UNAUDITED) |
Information regarding how often shares of each Fund trade on an exchange at a price above (i.e., at premium) or below (i.e., at a discount) the NAV of each Fund is available, without charge, on the Funds’ website at https://etfsite.alphaarchitect.com/.
| | |
| PRIVACY POLICY (UNAUDITED) |
EA Series Trust (the “Trust”) is strongly committed to preserving and safeguarding the personal financial information of any customers of the Trust. Confidentiality is extremely important to us.
Regulation S-P requires, among others, each investment company to “adopt written policies and procedures that address administrative, technical, and physical safeguards for the protection of customer records and information.” However, Pursuant to Regulation S-P’s definition of “customer,” the Trust currently does not have, nor does it anticipate having in the future, any customers. In addition, the Trust does not collect any non-public personal information from any consumers.
Nonetheless, the Trust has instituted certain technical, administrative and physical safeguards through which the Trust would seek to protect personal financial information about any customers from unauthorized use and access. First, technical procedures are used in order to limit the accessibility and exposure of Trust-maintained information contained in electronic form. If customer information were obtained by the Trust, such technical procedures would cover such information.
Second, administrative procedures that are in place, would be used to control the number and type of employees, affiliated and nonaffiliated persons, to whom customer information (if the Trust were to obtain any) would be accessible.
Third, physical safeguards have been established, which if customer information were obtained by the Trust, to prevent access to such information contained in hard-copy form.
As these procedures illustrate, the Trust realizes the importance of information confidentiality and security and emphasizes practices which are aimed at achieving those goals.
Adviser
Empowered Funds, LLC dba EA Advisers
19 East Eagle Road
Havertown, Pennsylvania 19083
Sub-Advisers
Alpha Architect, LLC
19 East Eagle Road
Havertown, Pennsylvania 19083
Arin Risk Advisors, LLC
1100 East Hector Street, Suite 215,
Conshohocken, Pennsylvania 19428
Distributor
Quasar Distributors, LLC
111 East Kilbourn Avenue, Suite 2200
Milwaukee, Wisconsin 53202
Custodian and Securities Lending Agent
U.S. Bank National Association
Custody Operations
1555 North River Center Drive, Suite 302
Milwaukee, Wisconsin 53212
Transfer Agent
U.S. Bank Global Fund Services, LLC
615 East Michigan Street
Milwaukee, Wisconsin 53202
Independent Registered Public Accounting Firm
Tait, Weller & Baker LLP
Two Liberty Place
50 South 16th Street, Suite 2900
Philadelphia, Pennsylvania 19102
Legal Counsel
Practus, LLP
11300 Tomahawk Creek Parkway, Suite 310
Leawood, Kansas 66211
Alpha Architect U.S. Quantitative Value ETF
Symbol – QVAL
CUSIP – 02072L102
Alpha Architect International Quantitative Value ETF
Symbol – IVAL
CUSIP – 02072L201
Alpha Architect U.S. Quantitative Momentum ETF
Symbol – QMOM
CUSIP – 02072L409
Alpha Architect International Quantitative Momentum ETF
Symbol – IMOM
CUSIP – 02072L300
Alpha Architect Value Momentum Trend ETF
Symbol – VMOT
CUSIP – 02072L508
Alpha Architect High Inflation and Deflation ETF
Symbol – HIDE
CUSIP – 02072L631
Alpha Architect Tail Risk ETF
Symbol – CAOS
CUSIP – 02072L540
Item 2. Code of Ethics.
The registrant has adopted a code of ethics that applies to the registrant’s principal executive officer and principal financial officer. The registrant has not made any amendments to its code of ethics during the period covered by this report. The registrant has not granted any waivers from any provisions of the code of ethics during the period covered by this report.
A copy of the registrant’s Code of Ethics is incorporated by reference.
Item 3. Audit Committee Financial Expert.
The registrant’s Board of Trustees of the Trust has determined that there is at least one audit committee financial expert serving on its audit committee. Mr. Michael Pagano is an “audit committee financial expert” and is considered to be “independent” as each term is defined in Item 3 of Form N-CSR.
Item 4. Principal Accountant Fees and Services.
The registrant has engaged its principal accountant to perform audit services, audit-related services, tax services and other services during the past fiscal year. “Audit services” refer to performing an audit of the registrant’s annual financial statements or services that are normally provided by the accountant in connection with statutory and regulatory filings or engagements for those fiscal years. “Audit-related services” refer to the assurance and related services by the principal accountant that are reasonably related to the performance of the audit. “Tax services” refer to professional services rendered by the principal accountant for tax compliance, tax advice, and tax planning, including review of the registrant’s tax returns and calculations of required income, capital gain and excise distributions. There were no “Other services” provided by the principal accountant. The following tables detail the aggregate fees billed or expected to be billed for the last fiscal year for audit fees, audit-related fees, tax fees and other fees by the principal accountant.
| | | | | | | | | | | | | | | | | | | | |
| Alpha Architect U.S. Quantitative Value ETF | Alpha Architect International Quantitative Value ETF | Alpha Architect U.S. Quantitative Momentum ETF |
| FYE 9/30/2023 | FYE 9/30/2022 | FYE 9/30/2023 | FYE 9/30/2022 | FYE 9/30/2023 | FYE 9/30/2022 |
| Audit Fees | $8,750 | $8,750 | $8,750 | $8,750 | $8,750 | $8,750 |
| Audit-Related Fees | N/A | N/A | N/A | N/A | N/A | N/A |
| Tax Fees | $2,250 | $2,250 | $2,250 | $2,250 | $2,250 | $2,250 |
| All Other Fees | N/A | N/A | N/A | N/A | N/A | N/A |
| | | | | | | | | | | | | | | | | | | | |
| Alpha Architect International Quantitative Momentum ETF | Alpha Architect Value Momentum Trend ETF | Alpha Architect High Inflation and Deflation ETF |
| FYE 9/30/2023 | FYE 9/30/2022 | FYE 9/30/2023 | FYE 9/30/2022 | FYE 9/30/2023 | FYE 9/30/2022 |
| Audit Fees | $8,750 | $8,750 | $8,750 | $6,750 | $8,750 | N/A |
| Audit-Related Fees | N/A | N/A | N/A | N/A | N/A | N/A |
| Tax Fees | $2,250 | $2,250 | $2,250 | $2,250 | $2,250 | N/A |
| All Other Fees | N/A | N/A | N/A | N/A | N/A | N/A |
| | | | | | | | |
| Alpha Architect Tail Risk ETF |
| FYE 9/30/2023 | FYE 2/28/23 |
| Audit Fees | $8,750 | $12,250 |
| Audit-Related Fees | N/A | N/A |
| Tax Fees | $2,250 | $3,000 |
| All Other Fees | N/A | N/A |
The audit committee has adopted pre-approval policies and procedures that require the audit committee to pre-approve all audit and non-audit services of the registrant, including services provided to any entity affiliated with the registrant.
The percentage of fees billed by the principal accountants applicable to non-audit services pursuant to waiver of pre-approval requirement were as follows:
| | | | | | | | | | | | | | | | | | | | |
| Alpha Architect U.S. Quantitative Value ETF | Alpha Architect International Quantitative Value ETF | Alpha Architect U.S. Quantitative Momentum ETF |
| FYE 9/30/2023 | FYE 9/30/2022 | FYE 9/30/2023 | FYE 9/30/2022 | FYE 9/30/2023 | FYE 9/30/2022 |
| Audit Fees | 0% | 0% | 0% | 0% | 0% | 0% |
| Tax Fees | 0% | 0% | 0% | 0% | 0% | 0% |
| All Other Fees | 0% | 0% | 0% | 0% | 0% | 0% |
| | | | | | | | | | | | | | | | | | | | |
| Alpha Architect International Quantitative Momentum ETF | Alpha Architect Value Momentum Trend ETF | Alpha Architect High Inflation and Deflation ETF |
| FYE 9/30/2023 | FYE 9/30/2022 | FYE 9/30/2023 | FYE 9/30/2022 | FYE 9/30/2023 | FYE 9/30/2022 |
| Audit Fees | 0% | 0% | 0% | 0% | 0% | 0% |
| Tax Fees | 0% | 0% | 0% | 0% | 0% | 0% |
| All Other Fees | 0% | 0% | 0% | 0% | 0% | 0% |
| | | | | | | | |
| Alpha Architect Tail Risk ETF |
| FYE 9/30/2023 | FYE 2/28/23 |
| Audit Fees | 0% | 0% |
| Tax Fees | 0% | 0% |
| All Other Fees | 0% | 0% |
All of the principal accountant’s hours spent on auditing the registrant’s financial statements were attributed to work performed by full-time permanent employees of the principal accountant. (If more than 50 percent of the accountant’s hours were spent to audit the registrant’s financial statements for the most recent fiscal year, state how many hours were attributed to work performed by persons other than the principal accountant’s full-time, permanent employees.)
The following table indicates the non-audit fees billed or expected to be billed by the registrant’s accountant for services to the registrant and to the registrant’s investment adviser (and any other controlling entity, etc.—not sub-adviser) for the past year. The audit committee of the board of trustees/directors has considered whether the provision of non-audit services that were rendered to the registrant’s investment adviser is compatible with maintaining the principal accountant’s independence and has concluded that the provision of such non-audit services by the accountant has not compromised the accountant’s independence.
| | | | | | | | | | | | | | | | | | | | |
| Non-Audit Related Fees | Alpha Architect U.S. Quantitative Value ETF | Alpha Architect International Quantitative Value ETF | Alpha Architect U.S. Quantitative Momentum ETF |
| FYE 9/30/2023 | FYE 9/30/2022 | FYE 9/30/2023 | FYE 9/30/2022 | FYE 9/30/2023 | FYE 9/30/2022 |
| Registrant | N/A | N/A | N/A | N/A | N/A | N/A |
| Registrant’s Investment Adviser | N/A | N/A | N/A | N/A | N/A | N/A |
| | | | | | | | | | | | | | | | | | | | |
| Non-Audit Related Fees | Alpha Architect International Quantitative Momentum ETF | Alpha Architect Value Momentum Trend ETF | Alpha Architect High Inflation and Deflation ETF |
| FYE 9/30/2023 | FYE 9/30/2022 | FYE 9/30/2023 | FYE 9/30/2022 | FYE 9/30/2023 | FYE 9/30/2022 |
| Registrant | N/A | N/A | N/A | N/A | N/A | N/A |
| Registrant’s Investment Adviser | N/A | N/A | N/A | N/A | N/A | N/A |
| | | | | | | | |
| Non-Audit Related Fees | Alpha Architect Tail Risk ETF |
| FYE 9/30/2023 | FYE 2/28/23 |
| Registrant | N/A | N/A |
| Registrant’s Investment Adviser | N/A | N/A |
Item 5. Audit Committee of Listed Registrants.
The registrant is an issuer as defined in Rule 10A-3 under the Securities Exchange Act of 1934, (the “Act”) and has a separately-designated standing audit committee established in accordance with Section 3(a)(58)(A) of the Act. The independent members of the committee are as follows: Daniel Dorn, Chukwuemeka (Emeka) Oguh, and Michael Pagano.
Item 6. Investments.
Schedule of Investments is included as part of the report to shareholders filed under Item 1 of this Form.
Item 7. Disclosure of Proxy Voting Policies and Procedures for Closed-End Management Investment Companies.
Not applicable to open-end investment companies.
Item 8. Portfolio Managers of Closed-End Management Investment Companies.
Not applicable to open-end investment companies.
Item 9. Purchases of Equity Securities by Closed-End Management Investment Company and Affiliated Purchasers.
Not applicable to open-end investment companies.
Item 10. Submission of Matters to a Vote of Security Holders.
There have been no material changes to the procedures by which shareholders may recommend nominees to the registrant’s board of trustees.
Item 11. Controls and Procedures.
| | | | | |
| (a) | The Registrant’s President/Principal Executive Officer and Treasurer/Principal Financial Officer have reviewed the Registrant's disclosure controls and procedures (as defined in Rule 30a-3(c) under the Investment Company Act of 1940 (the “Act”)) as of a date within 90 days of the filing of this report, as required by Rule 30a-3(b) under the Act and Rules 13a-15(b) or 15d-15(b) under the Securities Exchange Act of 1934. Based on their review, such officers have concluded that the disclosure controls and procedures are effective in ensuring that information required to be disclosed in this report is appropriately recorded, processed, summarized and reported and made known to them by others within the Registrant and by the Registrant’s service provider. |
| | | | | |
| (b) | There were no changes in the Registrant’s internal control over financial reporting (as defined in Rule 30a-3(d) under the Act) that occurred during the fiscal period covered by this report that has materially affected, or is reasonably likely to materially affect, the Registrant’s internal control over financial reporting. |
Item 12. Disclosure of Securities Lending Activities for Closed-End Management Investment Companies
Not applicable to open-end investment companies.
Item 13. Exhibits.
(3) Any written solicitation to purchase securities under Rule 23c-1 under the Act sent or given during the period covered by the report by or on behalf of the registrant to 10 or more persons. Not applicable to open-end investment companies.
SIGNATURES
Pursuant to the requirements of the Securities Exchange Act of 1934 and the Investment Company Act of 1940, the registrant has duly caused this report to be signed on its behalf by the undersigned, thereunto duly authorized.
| | | | | | | | |
| (Registrant) | EA Series Trust | |
| | |
| By (Signature and Title) | /s/ Patrick Cleary | |
| | Patrick Cleary, President, Chief Executive Officer and Secretary | |
| | |
| Date: | March 19, 2024 | |
Pursuant to the requirements of the Securities Exchange Act of 1934 and the Investment Company Act of 1940, this report has been signed below by the following persons on behalf of the registrant and in the capacities and on the dates indicated.
| | | | | | | | |
| By (Signature and Title) | /s/ Patrick Cleary | |
| | Patrick Cleary, President, Chief Executive Officer and Secretary | |
| | | |
| Date: | March 19, 2024 | |
| | | |
| By (Signature and Title) | /s/ Sean Hegarty | |
| | Sean Hegarty, Treasurer, Chief Financial Officer and Comptroller | |
| | | |
| Date: | March 19, 2024 | |