Exhibit 99.2
Management Presentation June 2022 Confidential Subject to Confidentiality Agreement Cleansing Material Subject to FRE 408 & State Law Equivalents Preliminary and Subject to Material Change endo.com
Disclaimer This document has been prepared by Endo International plc (“Endo” or the “Company”) and its advisors from information provided by Company management and other sources, and is subject in all respects to the confidentiality agreement you have executed with the Company. All communications or inquiries relating to Endo or its affiliates should be directed to its advisors. No personnel of Endo or its affiliates should be contacted under any circumstances. This document is “as is” and is based, in part, on information obtained from other sources. We have assumed and relied upon the accuracy and completeness of such information for purposes of this document and have not independently verified any such information. Neither we nor any of our affiliates or agents, makes any representation or warranty, express or implied, in relation to the accuracy or completeness of the information contained in this document or any oral information provided in connection herewith, or any data it generates and expressly disclaim any and all liability (whether direct or indirect, in contract, tort or otherwise) in relation to any of such information or any errors or omissions therein. Any views or terms contained herein are preliminary, and are based on financial, economic, market and other conditions prevailing as of the date of this document and are subject to change. We undertake no obligations or responsibility to update any of the information contained in this document. Past performance does not guarantee or predict future performance. This document does not constitute an offer to sell or the solicitation of an offer to buy any security, nor does it constitute an offer or commitment to lend, syndicate or arrange a financing, underwrite or purchase or act as an agent or advisor or in any other capacity with respect to any transaction, or commit capital, or to participate in any trading strategies, and does not constitute legal, regulatory, accounting or tax advice to the recipient. This document does not constitute and should not be considered as any form of financial opinion or recommendation by us or any of our affiliates. This document is not a research report and should not be construed as such. This document is for informational purposes only and does not purport to contain all of the information that may be required to evaluate a possible decision with respect to a transaction involving the Company or any of its indebtedness. The Company and all of its respective affiliates, directors, officers, employees and advisers do not make any representation or warranty, express or implied, as to the accuracy or completeness of the information contained in this document or any other written, oral or other communications transmitted or otherwise made publicly available. This document is not intended to be all-inclusive or to contain all the information that a person may desire in considering a transaction and is not intended to form the basis for entering into such a transaction. You should consult your own legal, regulatory, tax, business, financial and accounting advisors to the extent you deem necessary and must make your own decision and perform your own independent investigation and analysis of the information and topics covered in this document. The information contained in this document is preliminary in nature and is subject to change, and any such changes may be material. Except as otherwise expressly noted herein, this document speaks as of the date noted on the title page. The delivery of this document does not create any implication that there has been no change in the business and affairs of Endo or its affiliates since such date. Neither Endo, its advisors, nor any of their respective affiliates or representatives undertake any obligation to update any of the information contained herein or to correct any inaccuracies or omissions that may become apparent. This document (i) has been prepared at the direction of the Company, (ii) from materials and information supplied by the Company and from other sources, (ii) contains confidential information, (iii) is being delivered for informational purposes only on a confidential basis and (iv) does not purport to contain all of the information that may be required or relevant to your evaluation of any potential transaction. You are responsible for conducting your own investigation and analysis and should consult your own professional advisors. By accepting this document, you agree that (i) neither you nor your agents, representatives, directors or employees will copy, reproduce or distribute to others this document, in whole or in part, at any time; (ii) you will keep confidential all information contained herein; and (iii) you will not use this document for any purpose, other than deciding whether to proceed with a further investigation of the Company or any transaction involving the Company or any of its indebtedness. Certain statements in this document may constitute “forward-looking statements” within the meaning of the federal securities laws. The Company’s actual results may differ from its expectations, estimates and projections and consequently, you should not rely on these forward-looking statements as predictions of future events. Forward-looking statements include, but are not limited to, statements regarding the Company or expectations, hopes, beliefs, intentions or strategies regarding the future. In addition, any statements that refer to projections, forecasts or other characterizations of future events or circumstances, including any underlying assumptions, are forward-looking statements. The words “anticipate,” “believe,” “budget,” “forecast,” “continue,” “could,” “estimate,” “expect,” “intend,” “may,” “might,” “plan,” “possible,” “potential,” “predict,” “project,” “should,” “could,” “strive,” “will,” “would” and similar expressions may identify forward-looking statements, but the absence of these words does not mean that a statement is not forward-looking. These forward-looking statements involve significant risks and uncertainties that could cause the actual results to differ materially from the expected results. You should carefully consider the risks and uncertainties described in the “Risk Factors” section of the Company’s annual report filed with the Securities and Exchange Commission (the “SEC”) and other documents filed by the Company from time to time with the SEC. These filings identify and address other important risks and uncertainties that could cause actual events and results to differ materially from those contained in the forward-looking statements. Most of these factors are outside the Company’s control and are difficult to predict. Forward-looking statements are predictions, projections and other statements about future events that are based on current expectations and assumptions and, as a result, are subject to risks and uncertainties. Readers are cautioned not to put undue reliance on forward-looking statements, and no person assumes any obligation and no person intends to update or revise these forward-looking statements, whether as a result of new information, future events, or otherwise. No assurance is given that the Company will achieve its expectations.
Table of Contents â–º Strategy and Priorities â–º Business Segment Overview â–º Reinvent How We Work â–º Financial Projections
Strategy and Priorities
Vision, Mission and Strategic Priorities Our Vision Helping everyone we serve live their best life. Our Mission We develop and deliver life-enhancing products through focused execution. Expand & Enhance Our Portfolio We are investing to build a more differentiated and durable portfolio that benefits our customers and creates sustainable long-term value. Reinvent How We Work We are embracing the future by accelerating new ways of working to better serve our customers, promote innovation and improve productivity. Be A Force For Good We are committed to the adoption of more sustainable practices that positively impact our stakeholders, including the promotion of diversity & inclusion in all we do.
We are investing to Expand & Enhance Our Portfolio by focusing our capital deployment to our core areas of growth Characteristic Medical Therapeutics Sterile Injectables Medical Aesthetics â–ªï€ Large markets in focus ($6B-$9B) â–ªï€ Large injectables market (~$12B) â–ªï€ Market size (~$2B-$3B) â–ªï€ Strong growth with areas of rapid â–ªï€ Moderate projected market growth â–ªï€ Robust projected growth expansion â–ªï€ Competition has intensified for non- â–ªï€ Market dominated by 3 large players Market â–ªï€ Pockets of unmet need creates differentiated & differentiated â–ªï€ Market will be unaffected by attractiveness opportunities for innovative non- products potential USG policy reforms surgical treatments â–ªï€ Reimbursable market will likely remain attractive â–ªï€ Endo commercial infrastructure (e.g., â–ªï€ Ready-to use and more complex â–ªï€ Innovative product offerings in large footprint, marketing capability, etc.) products offer potential opportunity markets with high unmet need (e.g. Value creation within focus could offer potential for value creation first injectable treatment for cellulite) opportunities synergies & competitive advantages â–ªï€ Sustainable growth will require differentiated capabilities across the value chain â–ªï€ Xiaflex Maximization Plan (i.e. on- â–ªï€ Execute Sterile 2.0 Initiative – â–ªï€ Optimize QWO product launch market, clinical stage, and pre-clinical develop enhanced pipeline of execute Accelerated Solutions R&D Current stage indications) differentiated opportunities leading to led initiative including APHRODITE- Investment â–ªï€ Diversify Portfolio with new product a steady flow of annual new product 1 clinical study evaluating different Priorities opportunities in orthopedics (i.e. launches post Vasostrict LOE interventions to reduce bruising TLC599) and men’s health/urology associated with the use of QWO
Investments in our core areas of growth are expected to drive revenue growth and margin expansion resulting in solid EBITDA growth post 2023 2023-26 revenue growth is expected to be driven by investments in our core areas of growth… …while we continue to take actions to deliver efficiencies while re-investing in the portfolio… …which is expected to result in solid margin expansion and EBITDA growth post 2023. Note: 2022 OPEX and EBITDA includes upfront and milestone payments to Nevakar and TLC that will be expensed as IPR&D.
Business Segments Overview
We have a diversified product portfolio that will be driven by growth in Branded and Sterile Injectables Branded â–º Operates through three business units: Medical Therapeutics(1), Medical Aesthetics and Established Brands. â–º Medical Therapeutics anchored by Xiaflex®, a long-dated biologic with accelerated mid-lifecycle growth and sustainable growth profile through commercial execution and LCM. â–º Aesthetics includes Qwo®, the first and only approved injectable treatment for cellulite. Sterile Injectables â–º Markets a diverse portfolio spanning a broad range of indications. â–º Well-scaled player with an extensive pipeline of differentiated assets. â–º Pipeline portfolio targeting attractive ready-to-use, long-acting injectables and drug / device combination products. â–º Differentiated compliance track record vs. competition. Generics â–º Broad portfolio of commercial products across multiple dosage forms â–º Unparalleled track record of high quality and regulatory compliance â–º Limited reinvestment in portfolio over past 4yrs based on capital allocation priorities â–º Focus on manufacturing and OPEX cost reduction initiatives to help mitigate margin compression. International â–º Highly scalable, asset-light business model â–º Broad portfolio across multiple therapeutic areas â–º Portfolio is transitioning from a set of highly profitable mature brands subject to recent competitive pressures to a set of new product launches Note: Financial information is risk-adjusted. (1) Specialty areas include orthopedics and men’s health / urology.
Branded
The Branded segment consists of three distinct portfolios Medical Therapeutics â–º Differentiated and durable portfolio led by Xiaflex®, first and only FDA-approved non-surgical treatment for Dupuytren’s Contracture and Peyronie’s Disease â–º Ongoing commercial and R&D investment expected to drive future growth â–º Strong capabilities and extensive specialty pharmacy distribution network Medical Aesthetics â–º Current portfolio consists of Qwo®, first and only injectable treatment for moderate-to-severe cellulite â–º Launched in 1Q 2021, significant growth is expected over the next ~5-7 years â–º Expansion opportunities exist in adjacent and complementary cash-pay markets Established Brands â–º Diverse range of ~20 products across multiple therapeutic areas â–º Largest products by revenue are Percocet and Testopel â–º Minimal promotional spend and other direct costs support strong free cash flow Core Areas of Growth
Medical Therapeutics represents a very attractive growth area The Medical Therapeutics (MT) portfolio, which consists of Xiaflex (XPD and XDC), Supprelin LA, TLC599 and other smaller brands is expected to achieve nearly $1.0B of revenue in 2026. Ongoing commercial and R&D investments are expected to drive future growth in the Xiaflex franchise and promising new orthopedic indications exist in the current pipeline to expand Xiaflex and introduce a new CCH-XTEND product — Xiaflex: Adhesive Capsulitis (AC), Plantar Fibromatosis (PFI), and Chronic/Treatment Recalcitrant Plantar (PFA) — CCH XTEND: Arthrofibrosis post-total knee replacement (TKR) targeted as initial indications with others to follow TLC599 enables earlier move into lower extremity orthopedics with initial OAK pain indication and multiple life-cycle opportunities including other OA joints (e.g., hand, hip, shoulder) and other conditions (e.g., interdigital neuroma) New early-stage urology opportunity with intravesical pentosan polysulfate sodium (iPPS), a urology in-office administered treatment to address high-unmet need in treating interstitial cystitis; additional potential LCM combo products for IC. Proven commercial capabilities are well-aligned with the targeted HCP universe, including market access, patient support hub, and specialty distribution through exclusive distribution partnerships (i.e., buy and bill; specialty pharmacy). Enhanced clinical development, evidence generation, and regulatory strategy capabilities, as well as evolving manufacturing capabilities, will also be leveraged to support the portfolio. Existing capabilities are scalable and can readily accommodate existing pipeline opportunities (i.e., Orthopedics commercial footprint can expand into lower extremity foot and ankle & podiatry specialists in support of future Xiaflex indications and TLC599)
We have an integrated strategy to position the Medical Therapeutics portfolio for sustained future growth LEVERAGE XIAFLEX®/CCH PLATFORM • New Indications – Collagen-Based Diseases – Prioritize & Sequence New Indications Evaluation Prioritized Marketed De-Prioritized DEVELOP ENABLING TECHNOLOGIES New Formulations – CCH XTEND – iPPS (Intravesical Pentosan Polysulfate Sodium) Drug-Device Combinations – Reconstitution & Delivery (e.g., dual-chamber syringe) – Atraumatic Needle Digital Solutions – Peyronie’s Self-Diagnostic App INTERNALIZE COMPLEMENTARY ASSETS • Key Attributes for BD&L Assets – ‘Pipeline in a Product’ – Synergies with Endo Capabilities – Strengthen / Expand Presence in Orthopedics & Urology / Men’s Health Strengthened IP serves as a foundation for the Medical Therapeutics Strategy
Continued investment in XIAFLEX® R&D will provide an opportunity to potentially address new indications Concept Tendon / Human Muscle Lipoma Contractures Herniated Dupuytren’s Disc Nodules Cyclops Syndrome Elbow / Hip / Spine Arthrofibrosis Collagen-Based Diseases Preclinical Clinical Marketed Post-TKR Plantar Adhesive Plantar Dupuytren’s Peyronie’s Arthrofibrosis Fasciitis Capsulitis Fibromatosis Contracture Disease Opportunity identification and evaluation process is being enhanced and accelerated via our cross-functional MT Portfolio Strategy & Life-Cycle Planning Team and our R&D Translational Science Group
The orthopedics footprint can be leveraged and expanded with the launch of new XIAFLEX®, CCH XTEND and TLC-599 indications Desired Future State Approval TBD Approval 2027 Approval 2026 Hand & upper extremity orthopedics Approval 2026 Shoulder orthopedics Hip & knee orthopedics Approval 2024-25 Arthrofibrosis Foot & ankle orthopedics Today Plantar â–º Hip & knee General orthopedics Plantar Fasciitis orthopedics Fibromatosis Podiatrists Hand & upper Adhesive â–º Podiatrists â–º Knee extremity Capsulitis â–º Podiatrists replacement orthopedics Knee â–º Foot & ankle specialists â–º Shoulder â–º Foot & ankle orthopedics (CCH XTEND) Osteoarthritis orthopedics orthopedics ® Hip ® (XIAFLEX ) â–º & knee (XIAFLEX ) (XIAFLEX®) orthopedics TLC599 (TLC-599) Dupuytren’s CCH XTEND contracture Indications in pipeline Indications under evaluation BD Target (clinical stage) (preclinical stage)
Beyond catalyzing expansion to the desired future orthopedic footprint, TLC599 provides a ‘pipeline in a product’ itself Knee OA is the catalyst to capitalize on a “pipeline in a product’ asset that is highly complimentary with current Endo capabilities (i.e. Xiaflex DC) Indication Expansion Initial Launch 2025 Knee OA Opportunity for broad portfolio of joint applications: ïµ Other OA joints ïµ Establish Endo – small joints, in lower hip, shoulder, extremity / knee Highly other “reputable for ïµ Solidify ïµ Intralesional hand joint commitment to injection (e.g., care; known delivering non-interdigital surgical by ortho neuroma) innovation in community“ ortho The non-“ surgical joint care company with solutions from shoulder to foot “ Expansion Opportunities – Add’l OA Joints Shoulder, Spine, 12 Other: ~3M 16 Hip: ~5M 22 Hand: ~6-7M 50 Knee: ~12-16M % OA Prevalence (US) Sources: Various, # represents procedures
The current Medical Therapeutics pipeline is robust Phase Pipeline / Expansion Indications Asset Disease Description & MOA Hypothesis Preclinical Ph 1 Ph 2 Ph 3 • Inflammation, pain and stiffness in knee joint Osteoarthritis of the Knee TLC599 caused by erosion of articular cartilage • Long-acting steroid (Anti-inflammatory MOA) Orthopedics • A loss of the ability to move the shoulder that often Adhesive Capsulitis Xiaflex causes stiffness and pain • Target thickening of the joint capsule • Painful condition of the plantar surface of the foot Plantar Fibromatosis Xiaflex limiting function (AKA – Dupuytren’s of the foot) Marketed • Target nodules causing pressure & pain Chronic / Tx Recalcitrant • Trauma and potential thickening of plantar fascia Dupuytren’s Xiaflex causing heel pain and loss of mobility Q4 2022* Plantar Fasciitis • Enable remodeling in the plantar fascia Contracture • Limited mobility post knee replacement due to Post-TKR Arthrofibrosis CCH collagen build-up (XTEND) • Dissolve fibrotic tissue to increase ROM in joint Urology / Men’s Health Peyronie’s Disease • Ventral curvature in Peyronie’s (Plaques involving Xiaflex urethra â†’ï€ Contraindicated) (Ventral Curve) • Targets collagenous plaques causing curvature • A complex of noninfectious lower urinary tract Marketed Interstitial Cystitis iPPS symptoms (AKA – Painful bladder syndrome) • GAG layer analog supports bladder epithelium Peyronie’s Disease Indications in pipeline Indications evaluated recently BD Target 16 AKA=Also Known As; ROM=Range of Motion; MOA=Mechanism of Action; iPPS= Intravesical Pentosan Polysulfate Sodium; *Study start depends on pre-IND Meeting/IND Filing
Medical Therapeutics portfolio growth is expected to be driven by Xiaflex on-market indications and new product launches Medical Therapeutics Revenue by Key Product $ million. 2023-26 CAGR 11% 2% NM NM 5% 10% [a] 17 [a] Includes Supprelin, Nascobal and Aveed Highlights/Commentary â–ªï€ Strong XPD and stable XDC demand growth is expected over the forecast period driven by improving market conditions post COVID disruption and continued targeted investments to drive steady increases in diagnosis and treatment rates. CAGR—Demand CAGR—Revenue Indication 2016-21 2021-26 2016-21 2021-26 XPD 15% 10% 23% 11% XDC 4% 4% 11% 5% XPD+XDC 11% 8% 18% 9% â–ªï€ TLC599 is expected to launch in 2025 and AC and PF are expected to launch in 2026 (pipeline revenue is risk adjusted). â–ªï€ All Other products as a group are expected to experience low single-digit growth as the products and markets are relatively mature.
The Medical Aesthetics vision is to build a unique portfolio through opportunistic investment in differentiated and disruptive innovations Establish Qwo® as the cornerstone cellulite treatment First and only FDA-approved injectable for treating moderate-to-severe cellulite in women Build and leverage existing capabilities for long term success Expert Medical Affairs support with real-world experience Experienced and well-trained Sales force Leverage and expand consumer activation capabilities HCP practice and business building capabilities Optimal manufacturing and supply chain Build a portfolio overtime complementary to Qwo® with differentiated opportunities Body Confidence Body Injectables/ Contouring Fillers Cash pay products
Qwo® has a large addressable market opportunity ~8.5 million U.S women are potential candidates U.S. Women Aged 25-54(1) 65 million Target BMI 18.5-29.9(2) 41 million Have some discretionary income (overall)(2)(3) 28 million Self-identify as having cellulite(2) (anywhere on the body) 12 million Self-identify as having cellulite and bothered by it(2)(4) 10 million Open to spending on aesthetic treatment(2)(5) 8.5 million Potential Consumers Source: Third party research. (1) US Census 2021 Projected Population. (2) Endo Cellulite Consumer Segmentation Research 2018. (3) Survey Question #7. Includes respondents that answered “I have some discretionary income, but I really have to prioritize how I use it” or “I have enough discretionary income to spend as I like without making hard trade-offs.” (4) Survey Question #13. Includes respondents that answered “Somewhat Bothered”, “Very Bothered” and “Extremely Bothered”. (5) Survey Question #9. How open are you to getting an aesthetic treatment. Includes respondents that answered “Very Open”, “Extremely Open” and has spent $1 or more on aesthetic treatments in the past 12 months (Survey Question #D2).
Qwo® is facing an unexpected barrier to adoption; executing a comprehensive plan to re-establish a foundation for future success Situation Analysis • Market perceptions of the unpredictable occurrence of skin discoloration occasionally experienced with the use of QWO are deeply entrenched presenting a meaningful barrier to broad-based adoption Comprehensive Plan • R&D led Accelerated Solutions initiative to prevent and/or mitigate skin discoloration initiated in 4Q21 leading to multiple actions including the launch of APHRODITE-1 clinical study in 2Q22 designed to evaluate commercially viable interventions to address skin discoloration and bruising • Commercial led Focus on Success initiative implemented in May 2022 resulting in a realignment of our Medical Aesthetics commercial operating model and right-sizing of our marketing spend; • Portion of commercial saving re-allocated to fund APHRODITE-1 study Future Decision Framework / Timing • Decision point on optimal path forward with QWO no later than the end of 2Q23 following APHRODITE-1 clinical study read out
The Aphrodite-1 study will help to identify a potential solution â–ªï€ A Phase 2 study of different interventions to reduce bruising following Qwo® treatment for cellulite What of the buttocks in women â–ªï€ Multi-cohort study will test different interventions to assess their potential impact on reduction of bruising How â–ªï€ 7 cohorts with 30 patients in each cohort are initially planned â–ªï€ The flexibility to add cohorts in order to test additional interventions over time is possible â–ªï€ The study was initiated in June with full results expected by mid-2023 When â–ªï€ A cohort can be stopped early depending on results (i.e., if intervention does not show meaningful impact) Cost â–ªï€ ~ $12M (~$8M in 2022) to fund 7 cohorts with 30 subjects in each cohort
Qwo has the potential to provide meaningful long-term growth Medical Aesthetics Revenue $ million. 2023-26 CAGR = 107% Highlights/Commentary â–ªï€ Near-term revenue is expected to be limited as a large % of the customer base is not expected to broadly utilize Qwo until they perceived adverse event profile (i.e., discoloration) is addressed. â–ªï€ The APRHODITE-1 clinical study was initiated in June 2022 with final data in 2Q23. â–ªï€ The re-aligned Aesthetics commercial operating model is focused on high priority markets and accounts and is highly scalable.
The Branded portfolio is expected to deliver solid and sustainable revenue and EBITDA growth 2023-26 $ million 2020A 2021A 2022E 2023E 2024E 2025E 2026E CAGR Medical Therapeutics $ 497 $ 629 $ 675 $ 715 $ 768 $ 842 $ 967 11% Medical Aesthestics—4 4 15 49 94 137 107% Established Brands 285 260 224 209 195 190 187 -4% Revenue $ 782 $ 894 $ 903 $ 939 $ 1,012 $ 1,127 $ 1,291 11% YoY % Δ -9% 14% 1% 4% 8% 11% 15% Gross Profit $ 660 $ 775 $ 786 $ 833 $ 883 $ 971 $ 1,106 10% GM% 84% 87% 87% 89% 87% 86% 86% OPEX $ 282 $ 391 $ 406 $ 375 $ 365 $ 393 $ 399 2% OPEX% 36% 44% 45% 40% 36% 35% 31% EBITDA $ 389 $ 392 $ 385 $ 468 $ 528 $ 588 $ 717 15% EBITDA% 50% 44% 43% 50% 52% 52% 56% Memo: Revenue ex. Qwo $ 782 $ 894 $ 903 $ 924 $ 963 $ 1,032 $ 1,154 8% Memo: EBITDA ex. Qwo $ 389 $ 392 $ 385 $ 518 $ 564 $ 599 $ 697 10% Highlights/Commentary â–ªï€ Revenue growth is expected to be driven by continued growth in Medical Therapeutics (i.e., Xiaflex on-market and pipeline indications, as well as the launch of TLC599) and Qwo and will be offset by continued erosion of the Established Brands portfolio mainly due to price pressure. â–ªï€ GM% remains relatively flat as higher margin Medical Therapeutics is offset by erosion of Established brands. â–ªï€ OPEX reflects continued investment in Xiaflex on-market indications growth, development of new Xiaflex indications, the expected launch of TLC599 in 2025 and XAC and XPF in 2026; however, OPEX as % to sales expected to significantly decline over the forecast period. â–ªï€ 2022 OPEX excludes 1x payments expenses as IPR&D in connection with the license of TLC599. Note: PF impact starts in 2023 in Memo lines
Sterile Injectables
We are investing in differentiated products that build on existing capabilities to increase the value of the Sterile Injectables segment Current pipeline • Develop and successfully launch products in the current pipeline New opportunities • Identify and evaluate new project opportunities that can provide sustainable growth with modest investment Expand capabilities • Expand internal capabilities for differentiated SI products Represents 6 product candidates licensed from Nevakar in 3Q18; Nevakar is responsible for development Ready-to-use products Long-acting injectables Represents 6 product candidates acquired from Nevakar in 2Q22; Endo is responsible for development
Expanding into more durable and differentiated products, while leveraging existing commercial capabilities is expected to lead to sustainable growth Developing R&D and mfg. capabilities for RTUs and other differentiated products… Drug / RTUs(1) LAIs(2) Device Differentiation …while leveraging our hospital-focused commercial and sales capabilities… Home 12% Health/Other Clinics 23% Hospitals 65% … is expected to expand the portfolio and return the portfolio to growth post Vasostrict LOE impact. Ready-to-use products. Long-acting injectables.
>35 new Sterile product candidates, of which > 50% are RTU products, are in development and expected to launch over the next 5 years Est. Number of SI Pipeline Candidates by Expected year of Launch Highlights/Commentary â–ªï€ Projects typically require 3-5 years from initiation to launch. â–ªï€ A robust process exists to continuously identify, screen and evaluate potential new opportunities to add to the development funnel. â–ªï€ ~10 additional product candidates are in development (including 5 from Nevakar) that have expected launch dates beyond 2026. â–ªï€ Future business development can be used to supplement internal development efforts (e.g., Nevakar portfolio acquisition); however, future business development is not currently reflected in the forecast $ Represents the cumulative revenue (in $ million) from 2022-26 product launches reflected in the LTP Note1: 2022, 2023 and 2024 include 1, 4 and 1 RTU products, respectively, that were licensed from Nevakar; Nevakar responsible for development Note2: 2025 includes 1 RTU product acquired from Nevakar; Endo responsible for development
The Sterile Injectables portfolio has the potential to deliver solid growth post the Vasostrict LOE $ million 2020A 2021A 2022E 2023E 2024E 2025E 2026E CAGR Vasostrict $ 786 $ 902 $ 230 $ 52 $ 21 $ 14 $ 10 -42% Adrenalin 152 125 112 82 80 77 74 -3% Other On-Market 301 239 227 207 188 183 177 -5% Pipeline — 12 58 110 253 289 70% Revenue $ 1,239 $ 1,266 $ 581 $ 399 $ 400 $ 528 $ 551 11% YoY % Δ 17% 2% -54% -31% 0% 32% 4% Gross Profit $ 1,022 $ 1,068 $ 404 $ 233 $ 234 $ 319 $ 332 13% GM% 83% 84% 70% 58% 58% 61% 60% OPEX $ 72 $ 70 $ 79 $ 99 $ 108 $ 105 $ 100 0% OPEX% 6% 6% 14% 25% 27% 20% 18% EBITDA $ 972 $ 1,018 $ 346 $ 163 $ 150 $ 241 $ 261 17% EBITDA% 78% 80% 60% 41% 37% 46% 47% Highlights/Commentary â–ªï€ Sterile Injectables decline through 2023 is primarily driven by the decline in Vasostrict; however, 2023-26 growth is expected from the launch of ready-to-use and other differentiated pipeline products (e.g., Nevakar) that are in development. â–ªï€ Gross profit and GM% decreases as Vasostrict decreases and then begins to grow and expand as new products launch. â–ªï€ OPEX is expected to remain relatively constant as commercial capabilities can be leveraged across expanding portfolio while continuous R&D investment will be necessary to sustain the new product development and revenue growth. â–ªï€ 2022 OPEX excludes the 1x payment of $35M expensed as IPR&D for the acquisition of 6 products from Nevakar.
Generics and International
The Generics and International business Generics Generics segment consists of ~150 product families, across various therapeutic areas, with demonstrated expertise in controlled release formulations. Limited reinvestment based on enterprise capital allocation priorities leads to a declining long-term financial profile Ongoing optimization of manufacturing network and operating costs expected to help minimize margin compression resulting from continued competitive and pricing pressures. International International segment consists of ~70 products across various dosage forms, including solid oral dose and topicals, with revenues of >$80MM in 2022E Paladin is a commercial focused company that has established relationships with supply chain and CMO partners, and top Canadian pharmacy chains Demonstrated capabilities across the product lifecycle (business development and licensing, market access, medical affairs, etc.)
Varenicline has the potential for upside assuming no competition Product Overview â–ªï€ $1B US Chantix Brand Market â–ªï€ Endo is the only FDA approved Gx product Market (launched in Sept 2021) Overview â–ªï€ Nearly 50% of US market demand currently being supplied â–ªï€ Endo has ~87% of the total market volume [a] â–ªï€ Endo able to supply ~100% of the market Manufacturing â–ªï€ Internally manufactured; vertically integrated â–ªï€ Chennai, India; Indore, India [b] Competition â–ªï€ Teva, Mylan and Apotex all have FTF status Estimated Annual Sales ($M) $ million • May 2022 YTD actual net sales are ~$118M • Current forecast assumes multiple competitors enter in 2H22; however, no other filer has been approved to date. IQVIA, week ending June 3, 2022 Generics manufacturing projected to come online at Indore in 2022E.
Generics revenue and EBITDA is expected to decline as a result of limited growth investment in the portfolio $ million 2020A 2021A 2022E 2023E 2024E 2025E 2026E CAGR Varenacline $—$ 60 $ 197 $ 62 $ 41 $ 31 $ 23 -42% Lubiprostone—108 103 17 16 14 13 -3% All Others 783 573 365 448 404 365 315 -5% Revenue $ 783 $ 741 $ 665 $ 527 $ 461 $ 411 $ 352 -13% YoY % Δ -11% -5% -10% -21% -12% -11% -14% Gross Profit $ 200 $ 256 $ 297 $ 201 $ 168 $ 131 $ 95 -22% GM% 26% 35% 45% 38% 36% 32% 27% OPEX $ 113 $ 96 $ 82 $ 71 $ 67 $ 64 $ 55 -8% OPEX% 14% 13% 12% 14% 14% 16% 16% EBITDA $ 129 $ 191 $ 231 $ 150 $ 125 $ 92 $ 66 -24% EBITDA% 16% 26% 35% 29% 27% 23% 19% Highlights/Commentary â–ªï€ Generics revenue is expected to decline as existing key products (Lubiprostone and Varenicline) lose exclusivity/face competition. â–ªï€ Varenicline could potentially provide meaningful upside depending on timing of competitive entry which is currently uncertain. â–ªï€ Limited additional opportunities exist within the current generic pipeline to offset expected continued erosion from competitive and pricing pressures. â–ªï€ Gross profit/margin reflects impact of manufacturing optimization which is being offset by continued price erosion. â–ªï€ OPEX is expected to decline primarily due to a reduction in R&D as the current pipeline approaches approval and further investment is not expected.
The International portfolio is not expected to be a meaningful contributor to revenue or EBITDA 2023-26 $ million 2020A 2021A 2022E 2023E 2024E 2025E 2026E CAGR Revenue $ 99 $ 93 $ 81 $ 72 $ 68 $ 67 $ 71 -1% YoY % Δ -14% -6% -13% -11% -5% -2% 6% Gross Profit $ 63 $ 56 $ 42 $ 39 $ 37 $ 33 $ 35 -4% GM% 64% 60% 52% 55% 54% 50% 49% OPEX $ 22 $ 26 $ 30 $ 26 $ 26 $ 26 $ 26 1% OPEX% 22% 28% 37% 36% 38% 39% 37% EBITDA $ 44 $ 32 $ 12 $ 17 $ 14 $ 10 $ 11 -12% EBITDA% 44% 35% 15% 23% 20% 16% 16% Highlights/Commentary â–ªï€ International revenue expected to remain relatively flat starting in 2023 as limited new product launches are offset by continued competitive pressure on base portfolio. â–ªï€ OPEX is expected to remain relatively flat and consistent with the trend in revenue.
Reinvent How We Work
Simplifying our ways of working and driving efficiencies to invest back into the business has been a strategic priority over the past few years 2020 Program ~$90M of annual run-rate savings; ~500 positions eliminated â–ªï€ Transformed Gx manufacturing cost basis by shifting production to India resulting in closure of Chestnut Ridge, NY and Irvine, CA plants â–ªï€ Simplified leadership structures for Executive leadership as well as for Commercial, R&D, and Operations leadership. â–ªï€ Implemented new global commercial organization and integrated global R&D organization. â–ªï€ Moved to a fully integrated business unit leader model and right size medical therapeutics salesforce. â–ªï€ Outsourced majority of Finance and PVRM transaction processing activities. 2022 Program ~$60M of annual run-rate savings; ~125 positions eliminated â–ªï€ Aligned Medical Aesthetics commercial resources with the revised QWO profile. â–ªï€ Aligned QWO mfg capacity with revised opportunity â–ªï€ Reduced medical therapeutics sales force and further simplified commercial leadership structure. â–ªï€ Aligned non-commercial enabling function resources (G&A, R&D, etc.) with updated commercial operating model. â–ªï€ Assessed IT operating model and support strategy for opportunity to increase efficiency and improve/maintain quality of services. â–ªï€ Determined optimal US home office footprint resulting in planned sale of site and eventual reduction in leased space.
We have simplified our integrated global manufacturing footprint All internally produced Generic Segment products are produced in India Rye, NY ~10 EEs; Bx Rochester, MI ~420 EEs; SI, Bx Horsham, PA ~110 EEs: Bx Cranbury, NJ ~30 EEs; Bx Indore, India (2022) ~300 EEs; SI, Gx, Mumbai, India ~70 EEs; Bx, SI, Gx Chennai, India (Par Actives) ~190 EEs; Gx API(1) Chennai, India (Par Formulations) ~480 EEs; Gx Proven Track Record of Operational Excellence 0 major observations from the FDA since 2017; Indore OSD facility approved in April 2022 Note: Excludes office locations in Malvern, PA (US HQ), Dublin, Ireland (Global HQ) and Montreal, Canada (Paladin HQ)
The size and composition of the global team has evolved as a result of our transformation initiatives Number of Filled Positions 4Q20A—1Q22PF 4Q20A 4Q21A 1Q22A 1Q22PF [a] Diff % Δ USA 1,901 1,607 1,445 1,332 (569) -30% % Total 57% 50% 47% 46% India 1,263 1,457 1,462 1,387 124 10% % Total 38% 45% 47% 48% Canada 93 100 101 101 8 9% % Total 3% 3% 3% 3% Other [b] 78 74 79 69 (9) -12% % Total 2% 2% 3% 2% Total 3,336 3,239 3,088 2,890 (446) -13% Highlights/Commentary â–ªï€ The size of the global workforce has been reduced by almost 500 net positions or 13% on a PF basis over the last 2 years. â–ªï€ A significant portion of the net reduction in US positions reflects the impact of divesting our US Gx facilities (i.e., Chestnut Ridge, NY and Irvine, CA) and transferring the majority of our Gx production to our India facilities. â–ªï€ The net reduction in US positions also reflects other cost optimization initiatives, including shifting significant activities to lower cost BPO providers, that is partially offset by the net increase in positions to support the Aesthetics business. â–ªï€ The net increase in the number of positions in India reflects the additional investments in R&D and manufacturing capabilities in Mumbai and Indore. Includes the estimated pro forma impact of the 2022 initiatives plus the planned closure of Par Biosciences (clinical studies site) Primarily represents Ireland
Financial Projections
There are several key assumptions underpinning our Long-Term Plan â–ªï€ Xiaflex revenue will continue to grow driven by an expected recovery in office-based procedures beginning in 2H22 coupled with a strong response to planned advertising and promotion investment in on-market indications and the launch of new indications (Plantar Fibromatosis, Adhesive Capsulitis) in 2026. â–ªï€ Qwo revenue growth assumes a solution for bruising and discoloration is identified through the Aphrodite-1 study. â–ªï€ TLC599 is expected to launch in 2025 and will be supported by planned commercial investment. â–ªï€ Vasostrict franchise revenue declines as a result of price erosion and market share loss; pre-mix bottle market share gains partially offset vial market share losses. â–ªï€ Continued investment in the SI pipeline is expected to drive meaningful growth from new product launches starting in 2023 following the significant decline in revenue from the full impact from the Vasotrict LOE. â–ªï€ Varenicline revenue is expected to decline due to potential competition assumed in 2H22; however, meaningful upside may be possible if competition is not approved. â–ªï€ Lubiprostone revenue will decline in 2023 following expiration of exclusive contract period. â–ªï€ Gross margin and GM% are expected to expand starting in 2024 as a result of shift in product mix and reflects annual COGS savings of ~$65-70M beginning in 2024 â–ªï€ OPEX and OPEX % expected to decline starting in 2023 and reflects annual OPEX run rate savings of ~$75-90M[a] reached by early 2024. â–ªï€ 1x payments excludes mesh and opioid litigation and settlement payments and other potential payments for contingent liabilities/settlements. [a] Includes $20-25M plus $55-65M of savings resulting from initiatives announced in Nov 2020 and 2Q22, respectively.
Revenue growth is expected to be driven by Xiaflex, Qwo and expected new Sterile Injectable product launches 2023-26 $ million 2020A 2021A 2022E 2023E 2024E 2025E 2026E CAGR Xiaflex $ 316 $ 432 $ 486 $ 530 $ 579 $ 627 $ 701 10% All Others 181 196 188 185 189 216 266 13% Medical Therapeutics $ 497 $ 629 $ 675 $ 715 $ 768 $ 842 $ 967 11% Medical Aesthestics $—$ 4 $ 4 $ 15 $ 49 $ 94 $ 137 107% Established Brands $ 285 $ 260 $ 224 $ 209 $ 195 $ 190 $ 187 -4% Branded $ 782 $ 894 $ 903 $ 939 $ 1,012 $ 1,127 $ 1,291 11% Vasostrict $ 786 $ 902 $ 230 $ 52 $ 21 $ 14 $ 10 -42% Adrenalin 152 125 112 82 80 77 74 -3% Other On-Market 301 239 227 207 188 183 177 -5% Pipeline — 12 58 110 253 289 70% Sterile $ 1,239 $ 1,266 $ 581 $ 399 $ 400 $ 528 $ 551 11% Varenacline $—$ 60 $ 197 $ 62 $ 41 $ 31 $ 23 -28% Lubiprostone—108 103 17 16 14 13 -9% All Others 783 573 365 448 404 365 315 -11% Generics $ 783 $ 741 $ 665 $ 527 $ 461 $ 411 $ 352 -13% International $ 99 $ 93 $ 81 $ 72 $ 68 $ 67 $ 71 -1% Total $ 2,903 $ 2,993 $ 2,230 $ 1,937 $ 1,941 $ 2,131 $ 2,264 5% YoY % Δ 0% 3% -26% -13% 0% 10% 6% Highlights/Commentary â–ªï€ Medical Therapeutics growth is expected to be driven by continued growth in Xiaflex on market indications as well as the launch of new indications and TLC599. â–ªï€ Medical Aesthetics growth is expected to be driven by increased adoption of Qwo. â–ªï€ Sterile Injectables growth following Vasostrict LOE impact through ‘23 is expected to driven by a significant number of new product launches beginning in ‘23. â–ªï€ Established Brands, Generics and International declines are expected as a result of continued competitive pressures and limited new product launches.
Gross margin expansion beginning in 2024 is expected to be due to product mix and cost savings initiatives 2023-26 $ million 2020A 2021A 2022E 2023E 2024E 2025E 2026E CAGR Branded $ 660 $ 775 $ 786 $ 833 $ 883 $ 971 $ 1,106 10% GM% 84% 87% 87% 89% 87% 86% 86% Sterile $ 1,022 $ 1,068 $ 404 $ 233 $ 234 $ 319 $ 332 13% GM% 83% 84% 70% 58% 58% 61% 60% Generics $ 200 $ 256 $ 297 $ 201 $ 168 $ 131 $ 95 -22% GM% 26% 35% 45% 38% 36% 32% 27% International $ 63 $ 56 $ 42 $ 39 $ 37 $ 33 $ 35 -4% GM% 64% 60% 52% 55% 54% 50% 49% Gross Profit $ 1,945 $ 2,155 $ 1,529 $ 1,306 $ 1,322 $ 1,455 $ 1,567 6% GM% 67% 72% 69% 67% 68% 68% 69% Highlights/Commentary â–ªï€ Branded GM% remains relatively flat as higher margin Medical Therapeutics is offset by erosion of Established brands. â–ªï€ Sterile GM% decreases as Vasostrict decreases and then begins to grow as new products launch. â–ªï€ Generic and International GM% declines as a result of continued competitive pressures and limited new product launches. â–ªï€ The savings from the Gx manufacturing network optimization initiatives ($65-70M) are expected to be fully realized in 2024 which will mitigate impact of competition.
EBITDA and unlevered FCF are expected to grow faster than revenue over the next 5 years 2023-26 $ million 2020A 2021A 2022E 2023E 2024E 2025E 2026E CAGR Revenue $ 2,903 $ 2,993 $ 2,230 $ 1,937 $ 1,941 $ 2,131 $ 2,264 5% YoY % Δ 0% 3% -26% -13% 0% 10% 6% Gross Profit $ 1,945 $ 2,155 $ 1,529 $ 1,306 $ 1,322 $ 1,455 $ 1,567 6% GM% 67% 72% 69% 67% 68% 68% 69% SG&A 534 642 640 601 608 624 621 1% R&D 120 122 236 153 139 137 128 -6% OPEX $ 654 $ 763 $ 877 $ 754 $ 747 $ 762 $ 749 0% OPEX% 23% 26% 39% 39% 38% 36% 33% EBITDA $ 1,396 $ 1,481 $ 718 $ 633 $ 654 $ 776 $ 905 13% EBITDA% 48% 49% 32% 33% 34% 36% 40% (-) CAPEX (73) (81) (98) (53) (51) (51) (51) -1% (-) Δ NWC & OA/OL (180) (167) 8 (49) (78) (78) (94) 24% (-) 1x Payments [a] (46) (47) 1 (18) (2) (2) (7) -27% Pre-tax unlevered FCF $ 1,096 $ 1,187 $ 629 $ 514 $ 522 $ 645 $ 753 14% [a] Excludes mesh and opioid litigation and settlement payments and other contingent liabilities/settlements. Note: Unlevered FCF excludes cash taxes which are expected to increase over time based on jurisdictional mix of pre-tax income and potential tax reform (i.e., Ireland) that may limit certain deductions. Highlights/Commentary â–ªï€ Revenue growth is primarily driven by Xiaflex, Qwo and the SI pipeline. â–ªï€ Gross margin expansion reflects a shift in product mix and efficiencies through optimization of the manufacturing network. â–ªï€ The SG&A decline in 2023 corresponds with initiatives taken in 2022 to realign resources and simplify operations. â–ªï€ The increase in R&D in 2022 includes certain 1x payments to Nevakar and TLC. â–ªï€ The Δ NWC & OA/OL is driven by the change in the mix of revenue and includes milestone payments for licensed products. â–ªï€ CAPEX reflects investments in Indore, India, Rochester, MI and Horsham, PA. â–ªï€ 1x payments include severance and employee retention associated with transformation initiatives.
Revenue and EBITDA growth is expected to be driven by the Branded and Sterile segments 2023-26 $ million 2020A 2021A 2022E 2023E 2024E 2025E 2026E CAGR Branded $ 782 $ 894 $ 903 $ 939 $ 1,012 $ 1,127 $ 1,291 11% Sterile 1,239 1,266 581 399 400 528 551 11% Generic 783 741 665 527 461 411 352 -13% International 99 93 81 72 68 67 71 -1% Total Revenue $ 2,903 $ 2,993 $ 2,230 $ 1,937 $ 1,941 $ 2,131 $ 2,264 5% YoY % Δ 0% 3% -26% -13% 0% 10% 6% Branded $ 389 $ 392 $ 385 $ 468 $ 528 $ 588 $ 717 15% Sterile 972 1,018 346 163 150 241 261 17% Generic 129 191 231 150 125 92 66 -24% International 44 32 12 17 14 10 11 -12% Corporate (137) (153) (256) (164) (163) (155) (151) -3% Total EBITDA $ 1,396 $ 1,481 $ 718 $ 633 $ 654 $ 776 $ 905 13% EBITDA % 48% 49% 32% 33% 34% 36% 40% Highlights/Commentary â–ªï€ Branded growth is expected to be driven by growth in Xiaflex on-market indications (PD and DC), launch of new indications (AC and PF); increased adoption of Qwo and the launch of TLC599. â–ªï€ Sterile Injectables growth in 2024 is expected to be driven by a significant number of new product launches beginning in 2023. â–ªï€ Generics and International declines are expected as a result of continued competitive pressures and limited new product launches. â–ªï€ Corporate EBITDA reflects corporate OPEX and includes payments to Nevakar and TLC expensed as IPR&D in 2022. â–ªï€ EBITDA margin expansion is expected to be driven by mix of business coupled with prudent management of OPEX.
The LTP reflects uncertainties related to several opportunities and risks Area Key Opportunity Key Risk Qwo â–ªï€ Faster adoption and uptake â–ªï€ No commercially viable solution for bruising/discoloration â–ªï€ Delayed competition 6 to 24 months â–ªï€ Accelerated competition (i.e.,. number and timing of new Varenicline â–ªï€ US market volumes fully return to Chantix levels entrants) â–ªï€ Potential ex-US opportunity Vasostrict â–ªï€ Slower vial price erosion; higher bottle conversion â–ªï€ Vial and bottle price erodes faster than expected Xiaflex PD+DC â–ªï€ Faster than expected near term rate of demand growth â–ªï€ Slower than expected rate of growth â–ªï€ Faster approvals / launches â–ªï€ Delays in approvals/launches SI+Gx Launches â–ªï€ Higher than expected performance from new launches â–ªï€ Lower than expected performance from new launches (higher price / market share) (lower price / market share) Adrenalin â–ªï€ Slower erosion; delayed comp on 30mL vial â–ªï€ Accelerated competition on 30ml and /or 1mL vial â–ªï€ Additional mfg. cost optimization (SI+OSD) â–ªï€ Additional costs related to attracting and retaining team â–ªï€ Enhanced Xiaflex and QWO production yields (i.e., members (i.e., due to overall job market and Endo specific COGS+OPEX Horsham) considerations). â–ªï€ Further SG&A efficiencies The key opportunities and risks listed are not intended to be mutually exclusive nor collectively exhaustive of all potential opportunities and risks that may exist now or in the future.
Appendix
Historical and Projected XPD+XDC Revenue CAGR Indication 2016A 2017A 2018A 2019A 2020A 2021A 2022E 2023E 2024E 2025E 2026E 2016-21 2021-26 2023-26 XPD $ 104 $ 121 $ 161 $ 207 $ 210 $ 290 $ 334 $ 374 $ 414 $ 454 $ 492 23% 11% 10% YoY % Δ 16% 33% 29% 1% 38% 15% 12% 11% 10% 8% XDC $ 86 $ 93 $ 104 $ 121 $ 106 $ 142 $ 152 $ 156 $ 165 $ 173 $ 178 11% 5% 5% YoY % Δ 8% 12% 16% -12% 34% 7% 2% 6% 4% 3% Total $ 190 $ 213 $ 265 $ 328 $ 316 $ 432 $ 486 $ 530 $ 579 $ 627 $ 671 18% 9% 8% YoY % Δ 12% 24% 24% -3% 37% 13% 9% 9% 8% 7%
Annex 1 – Tax Disclosure
Tax Disclosure In connection with undertaking a preliminary analysis related to the tax consequences of a sale of its assets, the Company has identified (i) its preliminary view as to the allocation of aggregate consideration across certain material jurisdictions assuming a credit bid of all of the Prepetition First Lien Indebtedness (an “Allocation”) and (ii) certain key relevant tax attributes of its subsidiaries as of December 31, 2021. With respect to Endo Global Biologics Limited, the Company’s preliminary Allocation is 19.0% and the Company has identified aggregate tax basis in its assets of approximately USD$1.452 billion. With respect to Endo Ventures Limited, the Company’s preliminary Allocation is 20.8% and the Company has identified aggregate tax basis in its assets of approximately USD$0.437 billion. With respect to Endo Aesthetics Limited, the Company’s preliminary Allocation is 0.1%. Based on a preliminary analysis of potential transactions, the Company believes that the sale of its Irish assets in certain cases could result in Irish stamp tax liabilities of up to approximately USD$0.045 billion. With respect to the Company’s U.S. branded business, the Company’s preliminary Allocation is 15.8% and the Company has identified approximately USD$1.599 billion of available gross U.S. federal excess interest expense carryforward, approximately USD$0.108 billion of gross U.S. federal net operating losses that are not subject to limitation, and approximately USD$0.133 billion of U.S. federal research and development and orphan drug tax credits. With respect to the Company’s U.S. generics business, the Company’s preliminary Allocation is 21.7% and believes that, based on such Allocation, the U.S. generics business has sufficient U.S. federal income tax attributes (including aggregate tax basis in its assets of approximately USD$3.195 billion) to mitigate substantially all U.S. federal income tax consequences resulting from a sale of its assets. With respect to the Company’s U.S. operations, the Company believes that the sale of its assets in such a case would result in U.S. state tax liabilities of approximately USD$0.044 billion and U.S. withholding taxes of approximately USD$0.013 billion. With respect to the Company’s operations in India, the Company’s preliminary Allocation is 1.4%. With respect to the Company’s operations in Canada, the Company’s preliminary Allocation is 0.3%. With respect to the Company’s operations in Luxembourg, the Company’s preliminary value allocation is 20.9%, which such value is derived from intellectual property held by Endo Global Biologics Limited, and the Company believes that, based on such Allocation, the Company’s operations in Luxembourg have sufficient Luxembourg tax attributes to mitigate substantially all Luxembourg tax consequences resulting from a sale of its assets. The foregoing summary of the Company’s preliminary Allocation and identified tax attributes does not purport to be complete nor does it purport to represent the considerations, Allocation, or tax attributes relevant to any particular transaction the Company may ultimately undertake.
Annex 2 – Organizational Chart
Confidential Subject to Confidentiality Agreement Cleansing Material ENDO INTERNATIONAL PLC Subject to FRE 408 and State Law Equivalents Preliminary and Subject to Material Change (NASDAQ: ENDP) Domicile: Ireland EFFECTIVE 4-5-22 All subsidiary companies 100% owned Endo DAC unless otherwise indicated by the footnote. (Ireland) Endo Finance IV Unlimited Company (Ireland) Endo Management Limited (Ireland) Endo Procurement Endo TopFin Limited Endo Global Endo Ventures Operations Limited (Ireland) Development Limited Aesthetics Limited (Ireland) (Ireland) (Ireland) Endo Ventures Cyprus Endo Ventures Limited Limited (Ireland) (Cyprus) Generics International Endo Global Ventures Endo Global Endo Global Endo Luxembourg Endo Ventures Ventures Enterprises (Bermuda) Biologics Limited Aesthetics Limited Holding Company S.a r.l. Bermuda Limited LLC (1) (Ireland) (Ireland) (2) (PA) Endo Luxembourg Finance Company I S.a r.l. Par Pharmaceutical Endo Global Endo Finco Paladin Labs Canadian Endo LLC Endo Ireland Finance Holdings, Inc. Finance LLC Inc. Holding Inc. (DE) II Limited (DE) (DE) (DE) (Canada) Par Pharmaceutical Companies, Inc. Endo Finance Endo Eurofin (DE) Paladin Labs Inc. Endo Bermuda (SEE ATTACHED CHART) Operations LLC Unlimited Company (Canada) Finance Limited (DE) (Ireland) Luxembourg Endo Specialty (1) Endo DAC owns 45% of Common Shares and Pharmaceuticals Endo U.S. Inc. and 100% Non-Qualified Preferred Shares and Endo Ventures Cyprus Holding I S.a r. l (DE) Limited owns 55% Common Shares (SEE ATTACHED CHART) (2) Endo Ventures Limited owns 98.99% Endo Bermuda Ventures Limited owns 1.01%
Confidential Subject to Confidentiality Agreement Cleansing Material Endo U.S. Inc. Subject to FRE 408 and State Law Equivalents (DE) Preliminary and Subject to Material Change Endo US Holdings Endo Health Luxembourg Solutions Inc. I S.a r.l. (DE) Endo Aesthetics Hawk Acquisition Endo Luxembourg Bermuda Acquisition LLC Ireland Limited International Financing Management Limited (DE) S.a r.l. Endo Generics Holdings, Inc. (DE) Kali Par Laboratories 2 , Inc. Pharmaceutical 2, Inc. (DE) (DE) Branded Operations Endo Holdings, Inc. Pharmaceuticals Inc. (DE) (DE) Endo Generics Astora Women’s Astora Women’s Endo Pharmaceuticals International (US) Health, LLC Health Ireland Pharmaceuticals Solutions Inc. 2, Inc. (DE) Limited Finance LLC (DE) (DE) (DE) Astora Women’s Astora Women’s Health Endo Auxilium Health Bermuda CPEC LLC Technologies Pharmaceuticals Pharmaceuticals, LLC ULC (DE) (Ireland) Valera Inc. (DE) (1) (DE) (SEE ATTACHED CHART) Endo Innovation Valera, LLC (NY) (1) Unaffiliated Party (ARCA Biopharma, Inc.) owns a 35% Membership Interest
Confidential Subject to Confidentiality Agreement Par Pharmaceutical Cleansing Material Companies, Inc. Subject to FRE 408 and State Law Equivalents Preliminary and Subject to Material Change (DE) Par Pharmaceutical, Inc. (NY) Par Laboratories Generics Kali Endo Par BioSpecifics Par Formulations Anchen JHP Group Endo Finance Europe, Ltd. Innoteq, Inc. International (US), Laboratories, Innovation Par, LLC Technologies LLC Private Limited (1) Incorporated Holdings, LLC (England and (DE) Inc. LLC Company, LLC (DE) LLC (DE) (India) (NY) (DE) Wales) (NY) (NJ) (DE) (DE) Anchen JHP Acquisition, Par Biosciences Pharmaceuticals, LLC Moores Mill Vintage Private Limited (2) Inc. (DE) Pharmaceuticals, (India) Properties L.L.C. DAVA (DE) (DE) LLC Pharmaceuticals, LLC Par Sterile (DE) (DE) Par Active Products, LLC Technologies (DE) Private Limited (3) 50% DAVA (India) Generics Bidco I, Quartz Specialty International, LLC LLC Pharmaceuticals, (DE) (DE) LLC (DE) 50% (1) Par, LLC owns 0.001% (2) Par Pharmaceutical, Inc. owns 0.001% (3) Par Biosciences Private Limited owns 0.001%
Confidential Subject to Confidentiality Agreement Cleansing Material Subject to FRE 408 and State Law Equivalents Preliminary and Subject to Material Change Auxilium Pharmaceuticals, LLC (DE) Auxilium Auxilium International Actient US Holdings, LLC Holdings, LLC Pharmaceuticals LLC (DE) (DE) (DE) Slate Actient Therapeutics, 70 Maple Timm Medical Pharmaceuticals, LLC LLC (1) Avenue, LLC Holdings, LLC (DE) (DE) (DE) (DE) (1) Actient Pharmaceuticals LLC owns 95% Common Shares Slate Pharmaceuticals, LLC owns 5% Common Shares and 100% of Preferred Shares
Annex 3 – Wind-Down Budget
Project Zed Wind-Down Budget (USD in $000s, unless otherwise indicated) Preliminary Wind-Down Budget [1] Monthly Total Run Rate Costs PRE-EMERGENCE WIND-DOWN PERIOD (6 MONTHS) Wind-Down Costs 2 [2] Personnel Costs (via TSA) 3 [3] Information Technology Costs $100 $600 4 [4] TSA Costs 5 [5] Governance - US Board Fees/Insurance 50 300 6 [6] Governance - Foreign Director Fees/Insurance 241 1,443 7 [7] 503(b)(9) and Other Administrative Claims 11,167 67,000 8 [8] Other Costs 150 900 Total Wind-Down Costs $11,707 $70,243 Professional Fees 9 [9] Legal Counsel - Primary $2,000 $12,000 # [10] Legal Counsel SDNY (Efficiency/Conflicts Counsel) 200 1,200 # [11] Financial Advisor - Primary 1,167 7,000 # [12] Financial Advisor - Data Retention # [13] Financial Advisor - Tax 733 4,400 # [14] Other Liquidation Proceeding - FA/Counsel 842 5,300 # [15] Official Opioid Committee - FA/Counsel TBD TBD # [16] Future Claims Rep - FA/Counsel TBD TBD # [17] Unsecured Creditors Committee - FA/Counsel TBD TBD # [18] Bar Date Noticing and Claims Processing TBD TBD # [19] UST Quarterly Fees 100 600 # Total Professional Fees $5,042 $30,500 Contingency 2,850 17,100 Total Pre-Emergence Wind-Down Costs $19,599 $117,843 POST-EMERGENCE WIND-DOWN PERIOD (3 MONTHS) Professional Fees # Legal Counsel - Primary $500 $1,500 # Legal Counsel - SDNY (Local) 50 150 # Financial Advisor - Primary 292 875 # Financial Advisor - Data Retention # Financial Advisor - Tax 183 550 # Other Liquidation Proceeding - FA/Counsel 84 253 Total Professional Fees $1,109 $3,328 Contingency 300 900 Total Post-Emergence Wind-Down Costs $1,409 $4,228 Grand Total $122,071 Pre-Emergence Wind-Down Timeframe 6 Months Post-Emergence Wind-Down Timeframe 3 Months
Project Zed FOOTNOTES General: 1. The key assumptions underlying the wind-down budget include: a. Sale: All debtor assets are sold and equity of non-debtor entities are sold to a purchaser (“Purchaser”). All (x) administrative claims arising prior to the sale closing, (y) litigation claims reserves and (z) other reserves contemplated by the Restructuring Support Agreement and sale term sheet are assumed to be satisfied as part of the sale closing and are not included in the sizing of the wind-down budget b. Liquidation: Chapter 11 liquidating plan c. Claims Administration: At sale closing, the debtors will decide whether to proceed with issuing a bar date notice to all general unsecured creditors and undertake related claims processing, taking into account the anticipated recovery to general unsecured creditors and the cost of such notice and processing d. Timeline: 6-month timeframe for wind-down (i.e., plan of liquidation process) from the date of the sale-closing, followed by a 3-month post-emergence wind-down period e. Remaining Entities: All entities, other than the Indian entities, assumed to remain after the asset sale closing and are part of the wind-down process being contemplated in these materials under a Ch 11 liquidating plan (collectively, the “Remaining Entities”) f. Regulatory Approvals: This budget assumes that all necessary regulatory requirements are achieved within the 6-month wind-down period. Any incremental regulatory timing delays will result in incremental costs which are not included in this wind-down budget g. Remaining Operations / Business: None; all assumed to be part of the sale h. Remaining Claims: Certain derivative claims, unencumbered assets, and avoidance causes of action are acquired by Purchaser and are not pursued post-closing i. Taxes Arising in Connection with Sale: All non-US taxes arising directly or indirectly from the transaction will be paid pursuant to the Purchase and Sale Agreement (“PSA”) j. Priority Claims: The Debtors, after consultation with the Ad Hoc First Lien Group, reserve the right to use a portion of the funds under the wind-down budget to settle priority claims k. Professional Fees: Assumes all accrued and unpaid professional fees prior to the sale-closing date are paid in full in cash pursuant to the terms under the PSA l. Return of Funds: Debtors proposed wind-down budget would provide that any excess cash remaining after dissolution of the Remaining Entities would revert to the Purchaser m. Domicile: The location of the Debtors’ businesses, including their tax domiciles, remain the same
Wind-Down Costs: 2. Personnel Costs (via TSA): Reflects finance, IT and legal personnel who are providing services via the Transition Services Agreement (“TSA”) to assist with wind-down workstreams. Wind-down budget assumes these to be provided by the Purchaser at no cost. 3. Information Technology Costs: Includes services from an outsourced IT service provider, license and subscription costs. Wind-down budget assumes these to be provided by the Purchaser at no cost. 4. TSA Costs: TSA costs for accessing historical records and IT systems. Wind-down budget assumes these to be provided by the Purchaser at no cost. TSA income for services provided by the Remaining Entities to the Purchaser are assumed to be zero for purposes of the wind-down budget 5. Governance — US Board Fees/Insurance: Assumes the US board of directors is replaced by two independent directors ($75k/quarter) 6. Governance — Foreign Director Fees/Insurance: Includes lower of (i) current payroll cost; or (ii) $75k/quarter for existing directors at Canadian, Ireland, Luxembourg, UK and Bermuda 7. 503(b)(9) and Other Administrative Claims: Assumes that most of the 503(b)(9) claims and operating costs incurred immediately prior to the sale-closing date that have been incurred but not yet paid are either paid prior to the sale-closing date or are covered separately under the PSA. In the event that the debtors propose to settle any administrative claims arising from the sale transaction, such settlement amount must be funded first from this line and then must be limited to amounts available in the contingency line, unless otherwise agreed to by the Ad Hoc First Lien Group 8. Other Costs: Other filing and regulatory fees Professional Fees: 9. Legal Counsel — Primary: Reflects costs for US legal counsel to pursue liquidating chapter 11 plan and satisfy all related Bankruptcy Code requirements for the same, wind-down related activities, coordinate non-U.S. based insolvency proceedings, other bankruptcy court requirements, tax, and regulatory workstreams 10. Legal Counsel — SDNY (Efficiency/Conflicts Counsel): Reflects costs for US conflicts and efficiency counsel in SDNY for remaining bankruptcy-related wind-down work, court filings, monthly operating report reviews court hearings required for the wind-down of the entities, and matters requiring conflicts counsel 11. Financial Advisor — Primary: Includes costs for monthly operating reports, TSA cost tracking, wind-down budget reporting, priority, administrative and 503(b)(9) claims reconciliation, overseeing personnel, IT and liquidity management 12. Financial Advisor — Data Retention: No costs are estimated as this assumes that the Purchaser adheres to data retention requirements and provides access to all necessary IT systems in order to facilitate the wind-down process
13. Financial Advisor — Tax: Reflects all-in global tax advisory fees to complete the relevant forms, preparing supporting calculations and handling associated interactions with global, fed and state taxing authorities. This assumes that the wind-down period does not straddle two tax years, which would otherwise require an incremental $2.4 million per annum 14. Other Liquidation Proceeding — FA/Counsel): Includes Canada, Ireland, Bermuda, Luxembourg, England, and Cyprus 15. Official Opioid Committee — FA/Counsel: In the event there is an OOC, a reasonable budget will be agreed to by the parties, or ordered by the court if agreement is not reached, and included in the wind-down budget. 16. Future Claims Rep — FA/Counsel: In the event there is an FCR, a reasonable budget will be agreed to by the parties, or ordered by the court if agreement is not reached, and included in the wind-down budget. 17. Unsecured Creditors Committee — FA/Counsel: In the event there is an UCC, a reasonable budget will be agreed to by the parties, or ordered by the court if agreement is not reached, and included in the wind-down budget. 18. Bar Date Noticing and Claims Processing: Ballot and bar date noticing and POC administration associated costs. In the event it is determined that there is a recovery available for general unsecured creditors, a reasonable budget will be agreed to by the parties taking into account the foregoing costs, or ordered by the court if agreement is not reached, and included in the wind-down budget. 19. UST Quarterly Fees: Assumes quarterly fees of (i) 1% of total wind-down budget disbursements (max cap is intentionally ignored to account for multiple entities making disbursements); and (ii) $325 filing fee for [150] legal entities
Annex 4 – Counterparty Dispute
Counterparty Update August 14, 2022 Highly Confidential Cleansing Material Subject to FRE 408 & State Law Equivalents Preliminary and Subject to Material Change endo.com
Disclaimer This document has been prepared by Endo International plc (“Endo” or the “Company”) and its advisors from information provided by Company management and other sources, and is subject in all respects to the confidentiality agreement you have executed with the Company. All communications or inquiries relating to Endo or its affiliates should be directed to its advisors. No personnel of Endo or its affiliates should be contacted under any circumstances. This document is “as is” and is based, in part, on information obtained from other sources. We have assumed and relied upon the accuracy and completeness of such information for purposes of this document and have not independently verified any such information. Neither we nor any of our affiliates or agents, makes any representation or warranty, express or implied, in relation to the accuracy or completeness of the information contained in this document or any oral information provided in connection herewith, or any data it generates and expressly disclaim any and all liability (whether direct or indirect, in contract, tort or otherwise) in relation to any of such information or any errors or omissions therein. Any views or terms contained herein are preliminary, and are based on financial, economic, market and other conditions prevailing as of the date of this document and are subject to change. We undertake no obligations or responsibility to update any of the information contained in this document. Past performance does not guarantee or predict future performance. This document does not constitute an offer to sell or the solicitation of an offer to buy any security, nor does it constitute an offer or commitment to lend, syndicate or arrange a financing, underwrite or purchase or act as an agent or advisor or in any other capacity with respect to any transaction, or commit capital, or to participate in any trading strategies, and does not constitute legal, regulatory, accounting or tax advice to the recipient. This document does not constitute and should not be considered as any form of financial opinion or recommendation by us or any of our affiliates. This document is not a research report and should not be construed as such. This document is for informational purposes only and does not purport to contain all of the information that may be required to evaluate a possible decision with respect to a transaction involving the Company or any of its indebtedness. The Company and all of its respective affiliates, directors, officers, employees and advisers do not make any representation or warranty, express or implied, as to the accuracy or completeness of the information contained in this document or any other written, oral or other communications transmitted or otherwise made publicly available. This document is not intended to be all-inclusive or to contain all the information that a person may desire in considering a transaction and is not intended to form the basis for entering into such a transaction. You should consult your own legal, regulatory, tax, business, financial and accounting advisors to the extent you deem necessary and must make your own decision and perform your own independent investigation and analysis of the information and topics covered in this document. The information contained in this document is preliminary in nature and is subject to change, and any such changes may be material. Except as otherwise expressly noted herein, this document speaks as of the date noted on the title page. The delivery of this document does not create any implication that there has been no change in the business and affairs of Endo or its affiliates since such date. Neither Endo, its advisors, nor any of their respective affiliates or representatives undertake any obligation to update any of the information contained herein or to correct any inaccuracies or omissions that may become apparent. This document (i) has been prepared at the direction of the Company, (ii) from materials and information supplied by the Company and from other sources, (ii) contains confidential information, (iii) is being delivered for informational purposes only on a confidential basis and (iv) does not purport to contain all of the information that may be required or relevant to your evaluation of any potential transaction. You are responsible for conducting your own investigation and analysis and should consult your own professional advisors. By accepting this document, you agree that (i) neither you nor your agents, representatives, directors or employees will copy, reproduce or distribute to others this document, in whole or in part, at any time; (ii) you will keep confidential all information contained herein; and (iii) you will not use this document for any purpose, other than deciding whether to proceed with a further investigation of the Company or any transaction involving the Company or any of its indebtedness. Certain statements in this document may constitute “forward-looking statements” within the meaning of the federal securities laws. The Company’s actual results may differ from its expectations, estimates and projections and consequently, you should not rely on these forward-looking statements as predictions of future events. Forward-looking statements include, but are not limited to, statements regarding the Company or expectations, hopes, beliefs, intentions or strategies regarding the future. In addition, any statements that refer to projections, forecasts or other characterizations of future events or circumstances, including any underlying assumptions, are forward-looking statements. The words “anticipate,” “believe,” “budget,” “forecast,” “continue,” “could,” “estimate,” “expect,” “intend,” “may,” “might,” “plan,” “possible,” “potential,” “predict,” “project,” “should,” “could,” “strive,” “will,” “would” and similar expressions may identify forward-looking statements, but the absence of these words does not mean that a statement is not forward-looking. These forward-looking statements involve significant risks and uncertainties that could cause the actual results to differ materially from the expected results. You should carefully consider the risks and uncertainties described in the “Risk Factors” section of the Company’s annual report filed with the Securities and Exchange Commission (the “SEC”) and other documents filed by the Company from time to time with the SEC. These filings identify and address other important risks and uncertainties that could cause actual events and results to differ materially from those contained in the forward-looking statements. Most of these factors are outside the Company’s control and are difficult to predict. Forward-looking statements are predictions, projections and other statements about future events that are based on current expectations and assumptions and, as a result, are subject to risks and uncertainties. Readers are cautioned not to put undue reliance on forward-looking statements, and no person assumes any obligation and no person intends to update or revise these forward-looking statements, whether as a result of new information, future events, or otherwise. No assurance is given that the Company will achieve its expectations.
Overview â–º On August 12, without warning, Endo received a Termination Notice (Notice) from a contract counterparty (Counterparty) alleging incurable, material breaches by Endo of the parties’ agreement (Agreement). â–º The Agreement provides for termination upon a material breach following a cure period (which can be extended if the issue is being resolved), or immediately upon an “incurable” material breach. â–º The Notice alleges Endo failed to launch a product within the requisite timeframe following regulatory approval and, more generally, alleges failure by Endo to use commercially reasonable efforts to fulfill its obligations under the Agreement. Counterparty immediately canceled all scheduled joint meetings between the parties. â–º Endo believes the Notice is baseless and constitutes an anticipatory repudiation (breach) of the Agreement. â–º Endo notified Counterparty that it rejected the Notice and would allow Counterparty until August 15 to withdraw and continue to perform under the Agreement. â–º If Counterparty fails to do so, Endo will prepare to file a lawsuit seeking a declaratory judgment, damages and potentially other relief.
Potential Economic Impact â–º The products subject to the Agreement are forecast to generate gross profit of approximately: – $1M in 2022 – $20M in 2023 – $40M in 2024 – $55M in 2025 – $50M in 2026 â–º The Company has already paid the Counterparty approximately $40M in upfront and milestone payments. The Counterparty is potentially entitled to receive up to an additional $5M of milestone payments over the next several years.
Annex 5 – Q2 2022 Flash Results
Preliminary 2Q22A and FY22E Financial Results (DRAFT) July 31, 2022 Confidential Subject to Confidentiality Agreement Cleansing Material Subject to FRE 408 & State Law Equivalents Preliminary and Subject to Material Change endo.com
Disclaimer This document has been prepared by Endo International plc (“Endo” or the “Company”) and its advisors from information provided by Company management and other sources, and is subject in all respects to the confidentiality agreement you have executed with the Company. All communications or inquiries relating to Endo or its affiliates should be directed to its advisors. No personnel of Endo or its affiliates should be contacted under any circumstances. This document is “as is” and is based, in part, on information obtained from other sources. We have assumed and relied upon the accuracy and completeness of such information for purposes of this document and have not independently verified any such information. Neither we nor any of our affiliates or agents, makes any representation or warranty, express or implied, in relation to the accuracy or completeness of the information contained in this document or any oral information provided in connection herewith, or any data it generates and expressly disclaim any and all liability (whether direct or indirect, in contract, tort or otherwise) in relation to any of such information or any errors or omissions therein. Any views or terms contained herein are preliminary, and are based on financial, economic, market and other conditions prevailing as of the date of this document and are subject to change. We undertake no obligations or responsibility to update any of the information contained in this document. Past performance does not guarantee or predict future performance. This document does not constitute an offer to sell or the solicitation of an offer to buy any security, nor does it constitute an offer or commitment to lend, syndicate or arrange a financing, underwrite or purchase or act as an agent or advisor or in any other capacity with respect to any transaction, or commit capital, or to participate in any trading strategies, and does not constitute legal, regulatory, accounting or tax advice to the recipient. This document does not constitute and should not be considered as any form of financial opinion or recommendation by us or any of our affiliates. This document is not a research report and should not be construed as such. This document is for informational purposes only and does not purport to contain all of the information that may be required to evaluate a possible decision with respect to a transaction involving the Company or any of its indebtedness. The Company and all of its respective affiliates, directors, officers, employees and advisers do not make any representation or warranty, express or implied, as to the accuracy or completeness of the information contained in this document or any other written, oral or other communications transmitted or otherwise made publicly available. This document is not intended to be all-inclusive or to contain all the information that a person may desire in considering a transaction and is not intended to form the basis for entering into such a transaction. You should consult your own legal, regulatory, tax, business, financial and accounting advisors to the extent you deem necessary and must make your own decision and perform your own independent investigation and analysis of the information and topics covered in this document. The information contained in this document is preliminary in nature and is subject to change, and any such changes may be material. Except as otherwise expressly noted herein, this document speaks as of the date noted on the title page. The delivery of this document does not create any implication that there has been no change in the business and affairs of Endo or its affiliates since such date. Neither Endo, its advisors, nor any of their respective affiliates or representatives undertake any obligation to update any of the information contained herein or to correct any inaccuracies or omissions that may become apparent. This document (i) has been prepared at the direction of the Company, (ii) from materials and information supplied by the Company and from other sources, (ii) contains confidential information, (iii) is being delivered for informational purposes only on a confidential basis and (iv) does not purport to contain all of the information that may be required or relevant to your evaluation of any potential transaction. You are responsible for conducting your own investigation and analysis and should consult your own professional advisors. By accepting this document, you agree that (i) neither you nor your agents, representatives, directors or employees will copy, reproduce or distribute to others this document, in whole or in part, at any time; (ii) you will keep confidential all information contained herein; and (iii) you will not use this document for any purpose, other than deciding whether to proceed with a further investigation of the Company or any transaction involving the Company or any of its indebtedness. Certain statements in this document may constitute “forward-looking statements” within the meaning of the federal securities laws. The Company’s actual results may differ from its expectations, estimates and projections and consequently, you should not rely on these forward-looking statements as predictions of future events. Forward-looking statements include, but are not limited to, statements regarding the Company or expectations, hopes, beliefs, intentions or strategies regarding the future. In addition, any statements that refer to projections, forecasts or other characterizations of future events or circumstances, including any underlying assumptions, are forward-looking statements. The words “anticipate,” “believe,” “budget,” “forecast,” “continue,” “could,” “estimate,” “expect,” “intend,” “may,” “might,” “plan,” “possible,” “potential,” “predict,” “project,” “should,” “could,” “strive,” “will,” “would” and similar expressions may identify forward-looking statements, but the absence of these words does not mean that a statement is not forward-looking. These forward-looking statements involve significant risks and uncertainties that could cause the actual results to differ materially from the expected results. You should carefully consider the risks and uncertainties described in the “Risk Factors” section of the Company’s annual report filed with the Securities and Exchange Commission (the “SEC”) and other documents filed by the Company from time to time with the SEC. These filings identify and address other important risks and uncertainties that could cause actual events and results to differ materially from those contained in the forward-looking statements. Most of these factors are outside the Company’s control and are difficult to predict. Forward-looking statements are predictions, projections and other statements about future events that are based on current expectations and assumptions and, as a result, are subject to risks and uncertainties. Readers are cautioned not to put undue reliance on forward-looking statements, and no person assumes any obligation and no person intends to update or revise these forward-looking statements, whether as a result of new information, future events, or otherwise. No assurance is given that the Company will achieve its expectations.
2Q22A and FY22E Pre-tax unlevered FCF are favorable to the MayLTP Preliminary Subject 2Q22 FY2022 to Material Change $ million MayLTP JulLBE Δ MayLTP JulLBE Δ Branded $ 209 $ 219 $ 10 $ 903 $ 908 $ 5 Sterile Injectable 114 123 9 581 580 (1) Generics 180 203 23 665 700 34 International 20 24 3 81 82 1 Revenue $ 524 $ 569 $ 45 $ 2,230 $ 2,269 $ 40 YoY % Δ -27% -20% 6% -26% -24% 1% Gross Profit $ 352 $ 398 $ 46 $ 1,529 $ 1,576 $ 47 GM% 67% 70% 3% 69% 69% 1% OPEX $ 274 $ 253 $ (22) $ 877 $ 868 $ (9) OPEX% 52% 44% -8% 39% 38% -1% EBITDA $ 94 $ 160 $ 66 $ 718 $ 772 $ 54 EBITDA% 18% 28% 10% 32% 34% 2% EBITDA ex. IPRD $ 161 $ 225 $ 64 $ 810 $ 865 $ 55 EBITDA% 31% 40% 9% 36% 38% 2% (-) CAPEX (23) (18) 5 (98) (93) 4 (-) Δ NWC & OA/OL 27 (26) (53) 8 (13) (21) 1x (Pmts)proceeds [a] 20 42 22 1 (12) (13) Pre-tax uFCF $ 117 $ 157 $ 40 $ 629 $ 654 $ 25 2Q22A revenue favorability was due to higher Xiaflex price and higher XDC volumes, better-than-expected Vasotrict share retention and delayed competition on Varenicline. The 2Q22A Xiaflex favorability will be partially offset by slightly lower XPD demand volumes in 2H22 based on 2Q22A trends. The 2Q22A Vasostrict favorability is expected to be offset by higher-than-expected price erosion in 2H22 resulting from more aggressive pricing by post day 181 competitor entrants. The 2Q22A Varenicline favorability and the benefit of delayed competition in 3Q22 are reflected in FY22E. 2Q22A and FY22E Gross Margin and GM% favorability is primarily driven by better-than-expected net sales and product mix across all segments. 2Q22A OPEX favorability was primarily driven by lower A&P and sales force costs ($7M), lower G&A ($8M) and R&D costs ($5M) due to timing. A portion of the 2Q22A G&A and R&D favorability is expected to pull through to FY22E. 2Q22A ΔNWC & OA/OL unfavorability was primarily due to AR being a use of cash versus a source of cash due to higher-than-expected 2Q22A sales. The 2Q22A unfavorability is expected to reverse in 2H22 as AR is projected to be a source of cash with the decline in Varenicline sales resulting from expected competition in 2H22. FY22 favorability in OA/OL is expected to offset unplanned insider compensation prepayments and a D&O insurance tail payment in 3Q22. 2Q22A 1x Proceeds favorability was due to the receipt of a confidential settlement payment in 2Q22 vs.3Q22. The FY22E 1x Payments unfavorability is due to the unplanned 3Q22 PCC funding ($40M), partially offset by proceeds from the unplanned 3Q22 sale of the Chestnut Ridge NY building ($18M). [a] Excludes mesh and opioid litigation and settlement payments and other contingent liabilities/settlements Note: 2Q22 JulLBE represents actual results
2Q22A ending cash is favorable to the MayLTP Preliminary Subject 2Q22 to Material Change $ million MayLTP JulLBE Δ Pre-tax uFCF $ 117 $ 157 $ 40 (-) Cash Taxes (3) (4) (1) (-) TLC Escrow—(85) (85) (-) Litigation/Advisors (202) (129) 74 SQ uFCF $ (88) $ (61) $ 27 (-) Interest/fin pmts (194) (156) 39 (-) Debt pmts (5) (5) 0 SQ Levered FCF $ (287) $ (221) $ 67 SQ Begining Cash $ 1,413 $ 1,413 $—SQ Ending Cash $ 1,126 $ 1,192 $ 67 â–ª 2Q22A cash tax unfavorability was due to higher-than-expected pre-tax income. â–ª 2Q22A TLC escrow unfavorability represents an unplanned payment into an escrow account in connection with the 2Q22 licensing agreement with TLC. The TLC escrow payment will be released back to the Company upon satisfaction of certain conditions. â–ª 2Q22A Litigation/Advisors favorability was due to lower-than-expected mesh payments ($17M) and opioid legal expenses/settlements ($70M) offset by higher than expected advisory fees/expenses ($12M). â–ª 2Q22A interest payment favorability was primarily due to the deferral of the scheduled June 30 unsecured interest payment (the interest was subsequently paid in July 2022). Note: 2Q22 JulLBE represents actual results
Annex 6 – Approved Budget
Project Zed Approved Budget 1 Weekly Cash Flow – Debtor Monthly View (USD in $ millions, unless otherwise indicated) Debtor 13 8/15 - 8/31 Month Aug-22 Sep-22 Oct-22 Nov-22 Dec-22 Jan-23 Feb-23 Mar-23 Apr-23 May-23 Jun-23 Jul-23 Total Operating Receipts Product Sales Receipts $54 $368 $260 $201 $247 $223 $204 $222 $184 $188 $208 $197 $2,555 Other Receipts – 18 0 0 0 0 0 0 0 0 0 0 23 Total Operating Receipts $54 $386 $260 $201 $247 $224 $205 $222 $184 $189 $209 $197 $2,578 Operating Disbursements Payroll & Payroll Related ($13) ($33) ($26) ($18) ($18) ($18) ($18) ($59) ($23) ($18) ($18) ($18) ($284) Materials & Freight (16) (63) (32) (22) (22) (22) (22) (22) (22) (22) (22) (22) (309) R&D, Marketing & Royalties (4) (31) (68) (24) (25) (22) (48) (26) (48) (26) (22) (48) (390) Rebates (16) (85) (68) (33) (80) (38) (22) (67) (29) (34) (37) (26) (533) G&A and Other (6) (67) (59) (23) (23) (23) (23) (23) (23) (23) (23) (23) (343) Total Operating Disbursements ($55) ($279) ($252) ($120) ($169) ($124) ($134) ($197) ($145) ($124) ($123) ($137) ($1,859) Net Cash Flow From Operations ($2) $107 $8 $81 $78 $100 $71 $25 $39 $65 $86 $60 $719 Intercompany to Non-Debtors – From / (To) – – – – ($17) ($15) ($15) ($15) ($15) ($15) ($15) ($15) ($122) Non-Operating Debt Service2 ($135) ($45) ($47) ($45) ($45) ($48) ($43) ($48) ($43) ($51) ($46) ($48) ($645) Other Non-Operating (0) (25) – – – – – – – – – – (26) Total Non-Operating ($135) ($70) ($47) ($45) ($45) ($48) ($43) ($48) ($43) ($51) ($46) ($48) ($671) Restructuring Costs Professional Fees ($8) ($14) ($18) ($47) ($25) ($25) ($25) ($25) ($25) ($25) ($25) ($25) ($288) Utility Deposit (0) – – – – – – – – – – – (0) Total Restructuring Costs ($9) ($14) ($18) ($47) ($25) ($25) ($25) ($25) ($25) ($25) ($25) ($25) ($288) Net Cash Flow ($146) $23 ($57) ($12) ($9) $12 ($12) ($63) ($45) ($26) ($0) ($28) ($361) Cash Balance3 Beginning Cash Balance - Book $1,032 $886 $910 $853 $841 $832 $844 $832 $769 $724 $698 $698 $1,032 Net Cash Flow (146) 23 (57) (12) (9) 12 (12) (63) (45) (26) (0) (28) (361) Ending Cash Balance - Book $886 $910 $853 $841 $832 $844 $832 $769 $724 $698 $698 $671 $671 ( +/- ) Outstanding Checks 9 9 9 9 9 9 9 9 9 9 9 9 9 Ending Cash Balance - Bank $895 $918 $861 $849 $841 $853 $840 $777 $733 $707 $707 $679 $679 Notes: (1) Forecast assumes a preliminary injunction is in place in connection with the opioid litigation. Litigation costs would be significantly higher in the event an injunction is not granted. (2) For the post-petition period, interest is calculated using ABR (with Prime Rate constant at 5.5%), plus adequate protection payments pursuant to the proposed Cash Collateral order (3) Includes $85 million of funds pledged under the TLC agreement
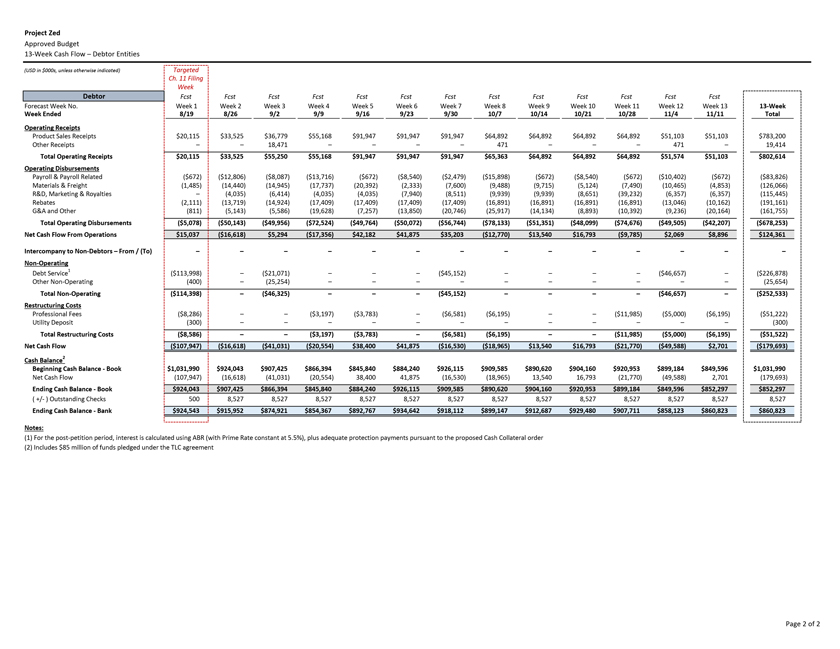
Project Zed Approved Budget 13-Week Cash Flow – Debtor Entities (USD in $000s, unless otherwise indicated) Targeted Ch. 11 Filing Week Debtor Fcst Fcst Fcst Fcst Fcst Fcst Fcst Fcst Fcst Fcst Fcst Fcst Fcst 13 Forecast Week No. Week 1 Week 2 Week 3 Week 4 Week 5 Week 6 Week 7 Week 8 Week 9 Week 10 Week 11 Week 12 Week 13 13-Week Week Ended 8/19 8/26 9/2 9/9 9/16 9/23 9/30 10/7 10/14 10/21 10/28 11/4 11/11 Total Operating Receipts Product Sales Receipts $20,115 $33,525 $36,779 $55,168 $91,947 $91,947 $91,947 $64,892 $64,892 $64,892 $64,892 $51,103 $51,103 $783,200 Other Receipts – – 18,471 – – – – 471 – – – 471 – 19,414 Total Operating Receipts $20,115 $33,525 $55,250 $55,168 $91,947 $91,947 $91,947 $65,363 $64,892 $64,892 $64,892 $51,574 $51,103 $802,614 Operating Disbursements Payroll & Payroll Related ($672) ($12,806) ($8,087) ($13,716) ($672) ($8,540) ($2,479) ($15,898) ($672) ($8,540) ($672) ($10,402) ($672) ($83,826) Materials & Freight (1,485) (14,440) (14,945) (17,737) (20,392) (2,333) (7,600) (9,488) (9,715) (5,124) (7,490) (10,465) (4,853) (126,066) R&D, Marketing & Royalties – (4,035) (6,414) (4,035) (4,035) (7,940) (8,511) (9,939) (9,939) (8,651) (39,232) (6,357) (6,357) (115,445) Rebates (2,111) (13,719) (14,924) (17,409) (17,409) (17,409) (17,409) (16,891) (16,891) (16,891) (16,891) (13,046) (10,162) (191,161) G&A and Other (811) (5,143) (5,586) (19,628) (7,257) (13,850) (20,746) (25,917) (14,134) (8,893) (10,392) (9,236) (20,164) (161,755) Total Operating Disbursements ($5,078) ($50,143) ($49,956) ($72,524) ($49,764) ($50,072) ($56,744) ($78,133) ($51,351) ($48,099) ($74,676) ($49,505) ($42,207) ($678,253) Net Cash Flow From Operations $15,037 ($16,618) $5,294 ($17,356) $42,182 $41,875 $35,203 ($12,770) $13,540 $16,793 ($9,785) $2,069 $8,896 $124,361 Intercompany to Non-Debtors – From / (To) – – – – – – – – – – – – – – Non-Operating Debt Service1 ($113,998) – ($21,071) – – – ($45,152) – – – – ($46,657) – ($226,878) Other Non-Operating (400) – (25,254) – – – – – – – – – – (25,654) Total Non-Operating ($114,398) – ($46,325) – – – ($45,152) – – – – ($46,657) – ($252,533) Restructuring Costs Professional Fees ($8,286) – – ($3,197) ($3,783) – ($6,581) ($6,195) – – ($11,985) ($5,000) ($6,195) ($51,222) Utility Deposit (300) – – – – – – – – – – – – (300) Total Restructuring Costs ($8,586) – – ($3,197) ($3,783) – ($6,581) ($6,195) – – ($11,985) ($5,000) ($6,195) ($51,522) Net Cash Flow ($107,947) ($16,618) ($41,031) ($20,554) $38,400 $41,875 ($16,530) ($18,965) $13,540 $16,793 ($21,770) ($49,588) $2,701 ($179,693) Cash Balance2 Beginning Cash Balance - Book $1,031,990 $924,043 $907,425 $866,394 $845,840 $884,240 $926,115 $909,585 $890,620 $904,160 $920,953 $899,184 $849,596 $1,031,990 Net Cash Flow (107,947) (16,618) (41,031) (20,554) 38,400 41,875 (16,530) (18,965) 13,540 16,793 (21,770) (49,588) 2,701 (179,693) Ending Cash Balance - Book $924,043 $907,425 $866,394 $845,840 $884,240 $926,115 $909,585 $890,620 $904,160 $920,953 $899,184 $849,596 $852,297 $852,297 ( +/- ) Outstanding Checks 500 8,527 8,527 8,527 8,527 8,527 8,527 8,527 8,527 8,527 8,527 8,527 8,527 8,527 Ending Cash Balance - Bank $924,543 $915,952 $874,921 $854,367 $892,767 $934,642 $918,112 $899,147 $912,687 $929,480 $907,711 $858,123 $860,823 $860,823 Notes: (1) For the post-petition period, interest is calculated using ABR (with Prime Rate constant at 5.5%), plus adequate protection payments pursuant to the proposed Cash Collateral order (2) Includes $85 million of funds pledged under the TLC agreement