
Hamilton Insurance Group, Ltd. Supplementary Financial Information June 30, 2024 Investor Contact Investor.Relations@hamiltongroup.com
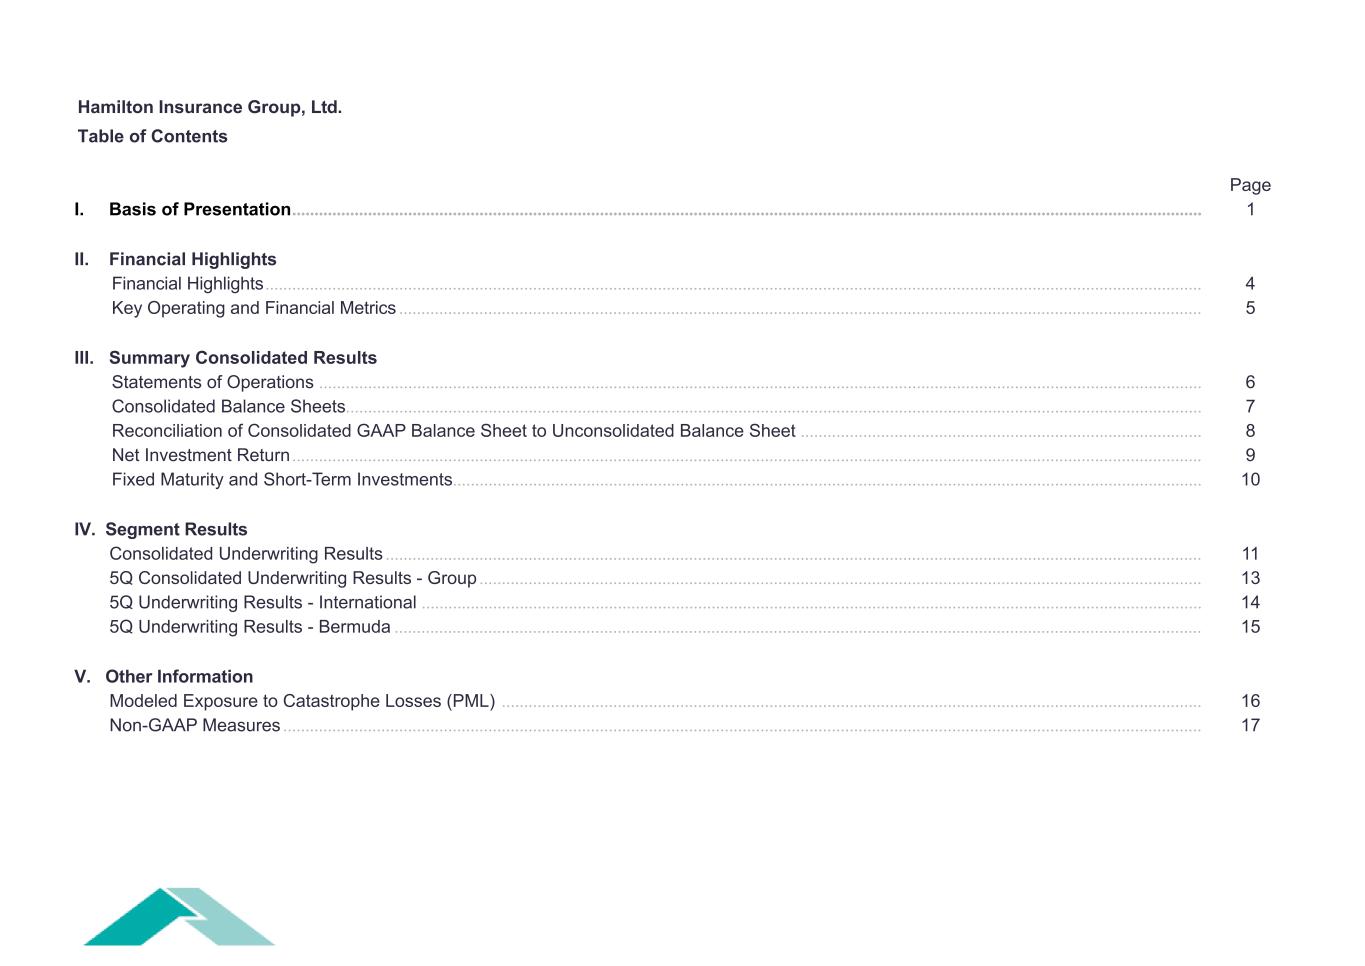
Hamilton Insurance Group, Ltd. Table of Contents Page I. Basis of Presentation ............................................................................................................................................................................................................ 1 II. Financial Highlights Financial Highlights .................................................................................................................................................................................................................. 4 Key Operating and Financial Metrics .................................................................................................................................................................................... 5 III. Summary Consolidated Results Statements of Operations ...................................................................................................................................................................................................... 6 Consolidated Balance Sheets ................................................................................................................................................................................................ 7 Reconciliation of Consolidated GAAP Balance Sheet to Unconsolidated Balance Sheet .......................................................................................... 8 Net Investment Return ............................................................................................................................................................................................................ 9 Fixed Maturity and Short-Term Investments ........................................................................................................................................................................ 10 IV. Segment Results Consolidated Underwriting Results ....................................................................................................................................................................................... 11 5Q Consolidated Underwriting Results - Group .................................................................................................................................................................. 13 5Q Underwriting Results - International ............................................................................................................................................................................... 14 5Q Underwriting Results - Bermuda ..................................................................................................................................................................................... 15 V. Other Information Modeled Exposure to Catastrophe Losses (PML) ............................................................................................................................................................. 16 Non-GAAP Measures .............................................................................................................................................................................................................. 17
1 Basis of Presentation All financial information contained herein is unaudited, however, certain information relating to the consolidated balance sheet at the most recent year end is derived from or agrees to audited financial information. Unless otherwise noted, all data is in thousands, except for share and per share amounts and ratio information. This information is being provided for informational purposes only. It should be read in conjunction with the documents filed by Hamilton Insurance Group, Inc. ("Hamilton") with the U.S Securities and Exchange Commission, including its Form 10-Q. Special Note Regarding Forward-Looking Statements This information includes “forward looking statements” pursuant to the safe harbor provisions of the U.S. Private Securities Litigation Reform Act of 1995. Forward-looking statements can be identified by the use of terms such as “believes,” “expects,” “may,” “will,” “target,” “should,” “could,” “would,” “seeks,” “intends,” “plans,” “contemplates,” “estimates,” or “anticipates,” or similar expressions which concern our strategy, plans, projections or intentions. These forward-looking statements appear in a number of places throughout and relate to matters such as our industry, growth strategy, goals and expectations concerning our market position, future operations, margins, profitability, capital expenditures, liquidity and capital resources and other financial and operating information. By their nature, forward-looking statements: speak only as of the date they are made; are not statements of historical fact or guarantees of future performance; and are subject to risks, uncertainties, assumptions, or changes in circumstances that are difficult to predict or quantify. Our expectations, beliefs, and projections are expressed in good faith and we believe there is a reasonable basis for them. However, there can be no assurance that management’s expectations, beliefs and projections will be achieved and actual results may vary materially from what is expressed in or indicated by the forward-looking statements. There are a number of risks, uncertainties, and other important factors that could cause our actual results to differ materially from the forward-looking statements contained herein. Such risks, uncertainties, and other important factors include, among others, the risks, uncertainties and factors set forth in “Risk Factors” and “Management’s Discussion and Analysis of Financial Condition and Results of Operations” included in the Company’s Annual Report on Form 10-K for the year ended December 31, 2023 (the “Form 10-K”) and other subsequent periodic reports filed with the Securities and Exchange Commission and the following: • our results of operations and financial condition could be adversely affected by unpredictable catastrophic events, global climate change or emerging claim and coverage issues; • our business could be materially adversely affected if we do not accurately assess our underwriting risk, our reserves are inadequate to cover our actual losses, our models or assessments and pricing of risks are incorrect or we lose important broker relationships; • the insurance and reinsurance business is historically cyclical and the pricing and terms for our products may decline, which would affect our profitability and ability to maintain or grow premiums; • we have significant foreign operations that expose us to certain additional risks, including foreign currency risks and political risk; • we do not control the allocations to and/or the performance of the Two Sigma Hamilton Fund, LLC ("TS Hamilton Fund")’s investment portfolio, and its performance depends on the ability of its investment manager, Two Sigma Investments, LP (“Two Sigma”), to select and manage appropriate investments and we have a limited ability to withdraw our capital accounts; • Two Sigma Principals, LLC, Two Sigma and their respective affiliates have potential conflicts of interest that could adversely affect us; • the historical performance of Two Sigma is not necessarily indicative of the future results of the TS Hamilton Fund’s investment portfolio or of our future results;
2 Basis of Presentation (continued) Special Note Regarding Forward-Looking Statements (continued) • our ability to manage risks associated with macroeconomic conditions resulting from geopolitical and global economic events, including public health crises, current or anticipated military conflicts, terrorism, sanctions, rising energy prices, inflation and interest rates and other global events; • our ability to compete successfully with more established competitors and risks relating to consolidation in the reinsurance and insurance industries; • downgrades, potential downgrades or other negative actions by rating agencies; • our dependence on key executives, including the potential loss of Bermudian personnel as a result of Bermuda employment restrictions, and the inability to attract qualified personnel, particularly in very competitive hiring conditions; • our dependence on letter of credit facilities that may not be available on commercially acceptable terms; • our potential need for additional capital in the future and the potential unavailability of such capital to us on favorable terms or at all; • the suspension or revocation of our subsidiaries’ insurance licenses; • risks associated with our investment strategy, including such risks being greater than those faced by competitors; • changes in the regulatory environment and the potential for greater regulatory scrutiny of the Company going forward; • a cyclical downturn of the reinsurance industry; • operational failures, failure of information systems or failure to protect the confidentiality of customer information, including by service providers, or losses due to defaults, errors or omissions by third parties or our affiliates; • we are a holding company with no direct operations, and our insurance and reinsurance subsidiaries’ ability to pay dividends and other distributions to us is restricted by law; • risks relating to our ability to identify and execute opportunities for growth or our ability to complete transactions as planned or realize the anticipated benefits of our acquisitions or other investments; • our potentially becoming subject to U.S. federal income taxation, Bermuda taxation or other taxes as a result of a change of tax laws or otherwise; • the potential characterization of us and/or any of our subsidiaries as a passive foreign investment company, or PFIC; • our potentially becoming subject to U.S. withholding and information reporting requirements under the U.S. Foreign Account Tax Compliance Act, or FATCA, provisions; • our costs will increase as a result of operating as a public company, and our management will be required to devote substantial time to complying with public company regulations; • if we were to identify a material weakness and were unable to remediate such material weakness, or fail to achieve and maintain effective internal controls, our operating results and financial condition could be impacted and the market price of our Class B common shares may be negatively affected; • the lack of a prior public market for our Class B common shares means our share price may be volatile and anti-takeover provisions contained in our organizational documents could delay management changes; • the potential that the market price of our Class B common shares could decline due to future sales of shares by our existing shareholders; • applicable insurance laws, which could make it difficult to effect a change of control of our company; and • investors may have difficulties in serving process or enforcing judgments against us in the United States. There may be other factors that could cause our actual results to differ materially from the forward-looking statements, including factors disclosed under the sections entitled “Risk Factors” and “Management’s Discussion and Analysis of Financial Condition and Results of Operations” in the Form 10-K and other subsequent periodic reports filed with the Securities and Exchange Commission. You should evaluate all forward-looking statements made herein in the context of these risks and uncertainties.
3 Basis of Presentation (continued) Special Note Regarding Forward-Looking Statements (continued) You should read this information completely and with the understanding that actual future results may be materially different from expectations. We caution you that the risks, uncertainties, and other factors referenced above may not contain all of the risks, uncertainties and other factors that are important to you. In addition, we cannot assure you that we will realize the results, benefits, or developments that we expect or anticipate or, even if substantially realized, that they will result in the consequences or affect us or our business in the way expected. All forward-looking statements contained herein apply only as of the date hereof and are expressly qualified in their entirety by these cautionary statements. We undertake no obligation to publicly update or revise any forward-looking statements to reflect subsequent events or circumstances.
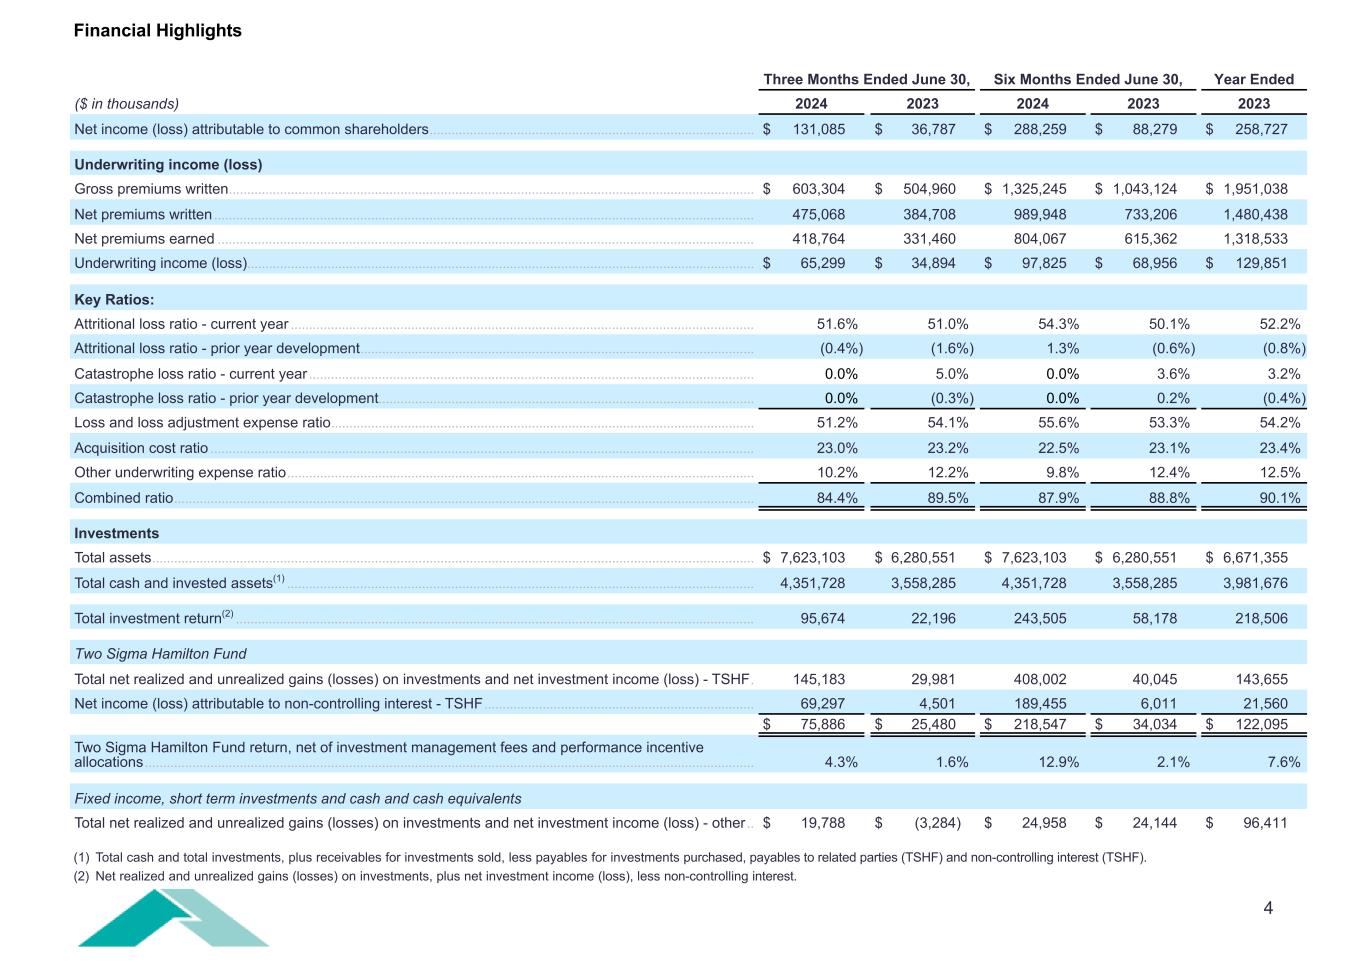
4 Financial Highlights Three Months Ended June 30, Six Months Ended June 30, Year Ended ($ in thousands) 2024 2023 2024 2023 2023 Net income (loss) attributable to common shareholders ......................................................................................... $ 131,085 $ 36,787 $ 288,259 $ 88,279 $ 258,727 Underwriting income (loss) Gross premiums written ................................................................................................................................................ $ 603,304 $ 504,960 $ 1,325,245 $ 1,043,124 $ 1,951,038 Net premiums written .................................................................................................................................................... 475,068 384,708 989,948 733,206 1,480,438 Net premiums earned ................................................................................................................................................... 418,764 331,460 804,067 615,362 1,318,533 Underwriting income (loss) ........................................................................................................................................... $ 65,299 $ 34,894 $ 97,825 $ 68,956 $ 129,851 Key Ratios: Attritional loss ratio - current year ............................................................................................................................... 51.6% 51.0% 54.3% 50.1% 52.2% Attritional loss ratio - prior year development ............................................................................................................ (0.4%) (1.6%) 1.3% (0.6%) (0.8%) Catastrophe loss ratio - current year .......................................................................................................................... 0.0% 5.0% 0.0% 3.6% 3.2% Catastrophe loss ratio - prior year development ....................................................................................................... 0.0% (0.3%) 0.0% 0.2% (0.4%) Loss and loss adjustment expense ratio .................................................................................................................... 51.2% 54.1% 55.6% 53.3% 54.2% Acquisition cost ratio ..................................................................................................................................................... 23.0% 23.2% 22.5% 23.1% 23.4% Other underwriting expense ratio ................................................................................................................................ 10.2% 12.2% 9.8% 12.4% 12.5% Combined ratio ............................................................................................................................................................... 84.4% 89.5% 87.9% 88.8% 90.1% Investments Total assets ..................................................................................................................................................................... $ 7,623,103 $ 6,280,551 $ 7,623,103 $ 6,280,551 $ 6,671,355 Total cash and invested assets(1) ................................................................................................................................ 4,351,728 3,558,285 4,351,728 3,558,285 3,981,676 Total investment return(2) .............................................................................................................................................. 95,674 22,196 243,505 58,178 218,506 Two Sigma Hamilton Fund Total net realized and unrealized gains (losses) on investments and net investment income (loss) - TSHF . 145,183 29,981 408,002 40,045 143,655 Net income (loss) attributable to non-controlling interest - TSHF .......................................................................... 69,297 4,501 189,455 6,011 21,560 $ 75,886 $ 25,480 $ 218,547 $ 34,034 $ 122,095 Two Sigma Hamilton Fund return, net of investment management fees and performance incentive allocations ....................................................................................................................................................................... 4.3% 1.6% 12.9% 2.1% 7.6% Fixed income, short term investments and cash and cash equivalents Total net realized and unrealized gains (losses) on investments and net investment income (loss) - other .. $ 19,788 $ (3,284) $ 24,958 $ 24,144 $ 96,411 (1) Total cash and total investments, plus receivables for investments sold, less payables for investments purchased, payables to related parties (TSHF) and non-controlling interest (TSHF). (2) Net realized and unrealized gains (losses) on investments, plus net investment income (loss), less non-controlling interest.
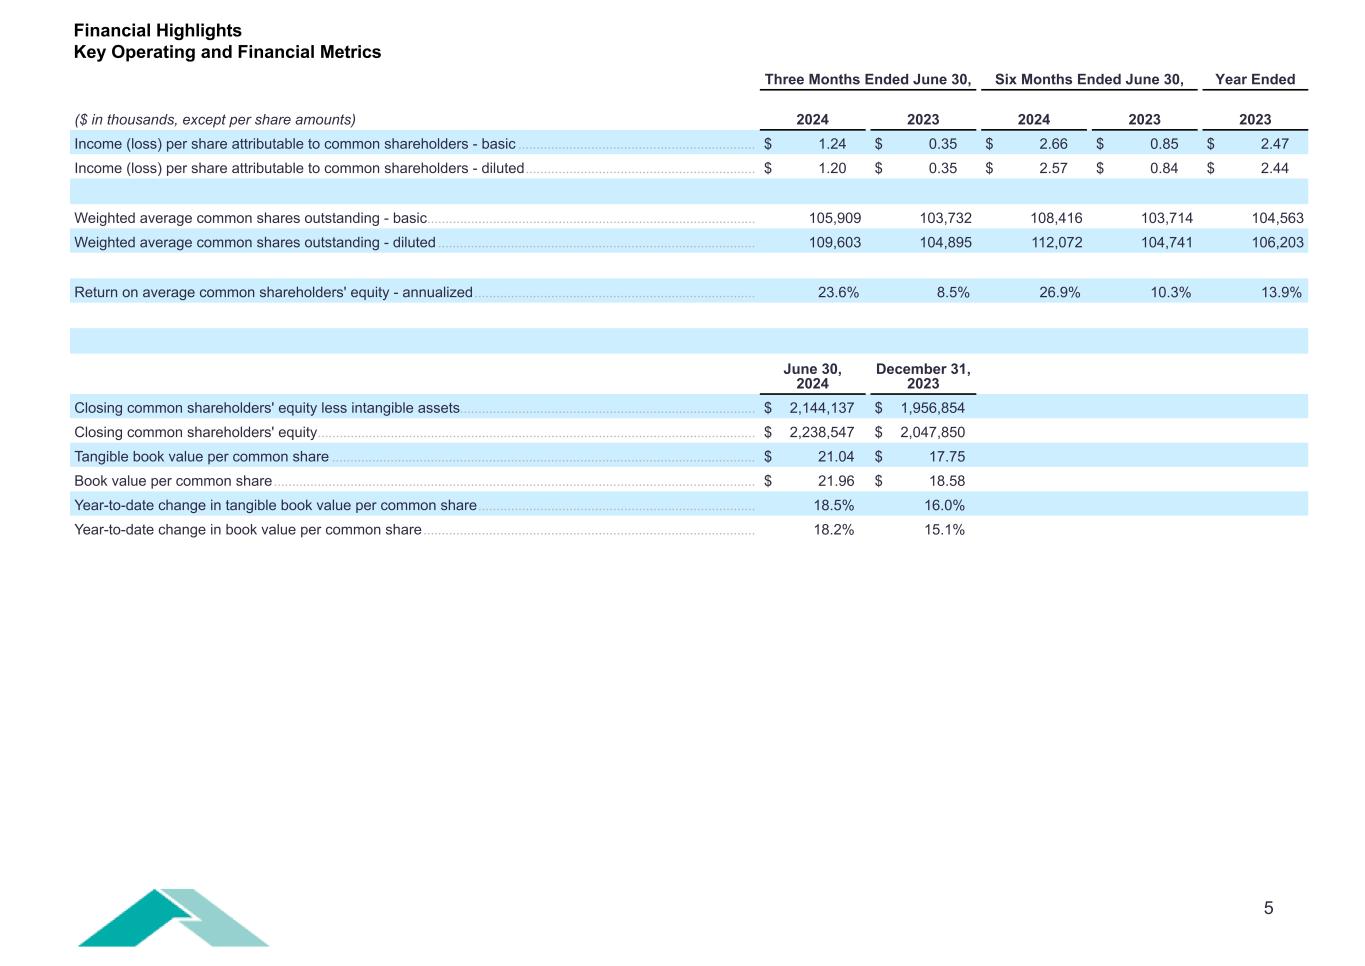
5 Three Months Ended June 30, Six Months Ended June 30, Year Ended ($ in thousands, except per share amounts) 2024 2023 2024 2023 2023 Income (loss) per share attributable to common shareholders - basic ................................................................. $ 1.24 $ 0.35 $ 2.66 $ 0.85 $ 2.47 Income (loss) per share attributable to common shareholders - diluted ............................................................... $ 1.20 $ 0.35 $ 2.57 $ 0.84 $ 2.44 Weighted average common shares outstanding - basic .......................................................................................... 105,909 103,732 108,416 103,714 104,563 Weighted average common shares outstanding - diluted ....................................................................................... 109,603 104,895 112,072 104,741 106,203 Return on average common shareholders' equity - annualized ............................................................................. 23.6% 8.5% 26.9% 10.3% 13.9% June 30, 2024 December 31, 2023 Closing common shareholders' equity less intangible assets ................................................................................. $ 2,144,137 $ 1,956,854 Closing common shareholders' equity ........................................................................................................................ $ 2,238,547 $ 2,047,850 Tangible book value per common share .................................................................................................................... $ 21.04 $ 17.75 Book value per common share .................................................................................................................................... $ 21.96 $ 18.58 Year-to-date change in tangible book value per common share ............................................................................ 18.5% 16.0% Year-to-date change in book value per common share ........................................................................................... 18.2% 15.1% Financial Highlights Key Operating and Financial Metrics
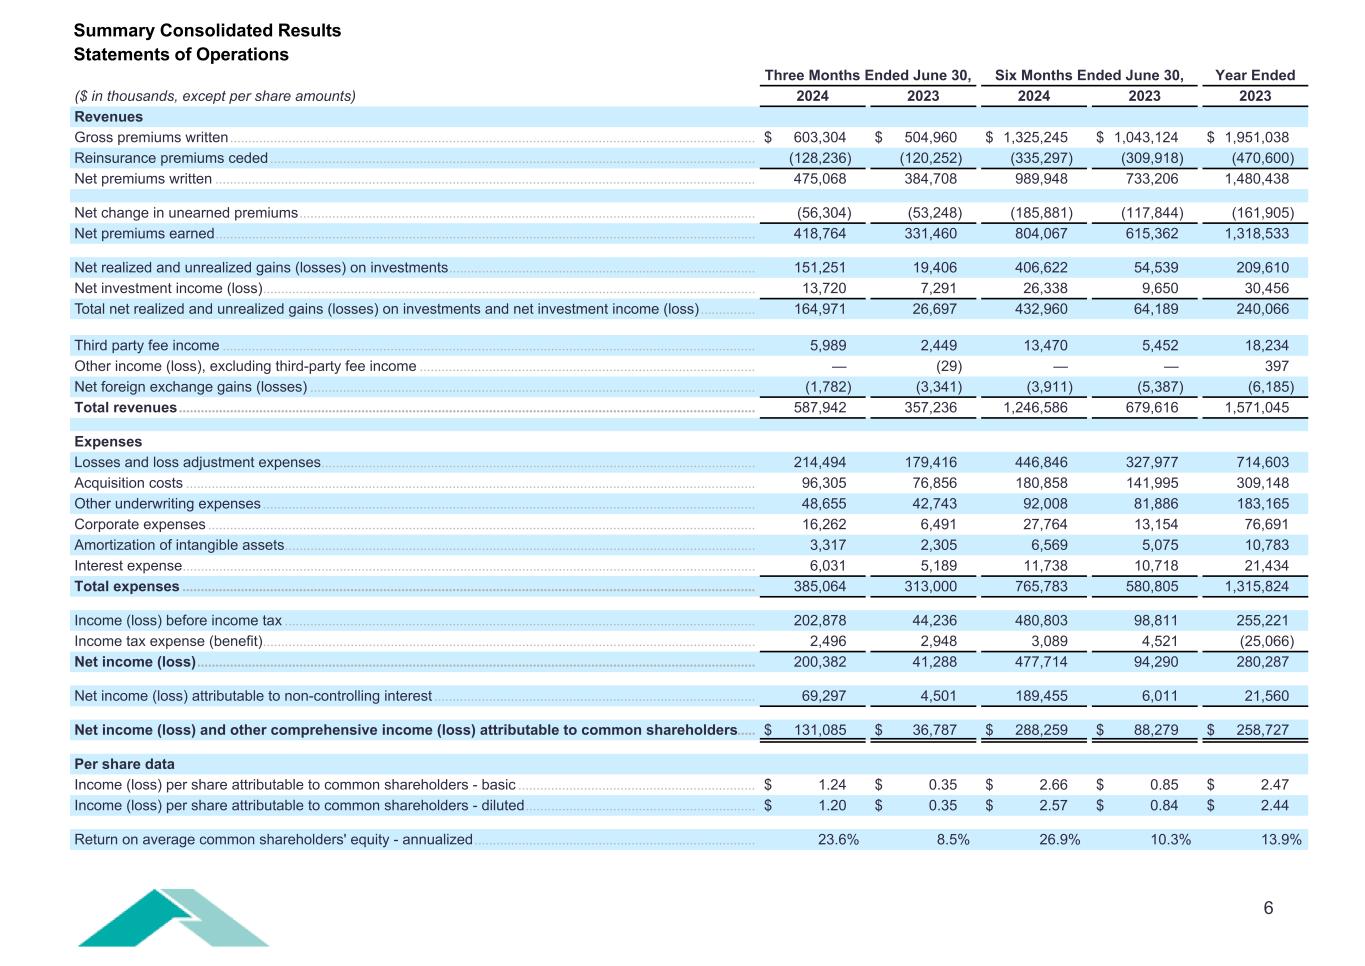
6 Three Months Ended June 30, Six Months Ended June 30, Year Ended ($ in thousands, except per share amounts) 2024 2023 2024 2023 2023 Revenues Gross premiums written ................................................................................................................................................ $ 603,304 $ 504,960 $ 1,325,245 $ 1,043,124 $ 1,951,038 Reinsurance premiums ceded ..................................................................................................................................... (128,236) (120,252) (335,297) (309,918) (470,600) Net premiums written .................................................................................................................................................... 475,068 384,708 989,948 733,206 1,480,438 Net change in unearned premiums ............................................................................................................................. (56,304) (53,248) (185,881) (117,844) (161,905) Net premiums earned .................................................................................................................................................... 418,764 331,460 804,067 615,362 1,318,533 Net realized and unrealized gains (losses) on investments .................................................................................... 151,251 19,406 406,622 54,539 209,610 Net investment income (loss) ....................................................................................................................................... 13,720 7,291 26,338 9,650 30,456 Total net realized and unrealized gains (losses) on investments and net investment income (loss) ............... 164,971 26,697 432,960 64,189 240,066 Third party fee income .................................................................................................................................................. 5,989 2,449 13,470 5,452 18,234 Other income (loss), excluding third-party fee income ............................................................................................ — (29) — — 397 Net foreign exchange gains (losses) .......................................................................................................................... (1,782) (3,341) (3,911) (5,387) (6,185) Total revenues .............................................................................................................................................................. 587,942 357,236 1,246,586 679,616 1,571,045 Expenses Losses and loss adjustment expenses ....................................................................................................................... 214,494 179,416 446,846 327,977 714,603 Acquisition costs ............................................................................................................................................................ 96,305 76,856 180,858 141,995 309,148 Other underwriting expenses ....................................................................................................................................... 48,655 42,743 92,008 81,886 183,165 Corporate expenses ...................................................................................................................................................... 16,262 6,491 27,764 13,154 76,691 Amortization of intangible assets ................................................................................................................................. 3,317 2,305 6,569 5,075 10,783 Interest expense ............................................................................................................................................................. 6,031 5,189 11,738 10,718 21,434 Total expenses ............................................................................................................................................................. 385,064 313,000 765,783 580,805 1,315,824 Income (loss) before income tax ................................................................................................................................. 202,878 44,236 480,803 98,811 255,221 Income tax expense (benefit) ....................................................................................................................................... 2,496 2,948 3,089 4,521 (25,066) Net income (loss) ......................................................................................................................................................... 200,382 41,288 477,714 94,290 280,287 Net income (loss) attributable to non-controlling interest ........................................................................................ 69,297 4,501 189,455 6,011 21,560 Net income (loss) and other comprehensive income (loss) attributable to common shareholders ..... $ 131,085 $ 36,787 $ 288,259 $ 88,279 $ 258,727 Per share data Income (loss) per share attributable to common shareholders - basic ................................................................. $ 1.24 $ 0.35 $ 2.66 $ 0.85 $ 2.47 Income (loss) per share attributable to common shareholders - diluted ............................................................... $ 1.20 $ 0.35 $ 2.57 $ 0.84 $ 2.44 Return on average common shareholders' equity - annualized ............................................................................. 23.6% 8.5% 26.9% 10.3% 13.9% Summary Consolidated Results Statements of Operations
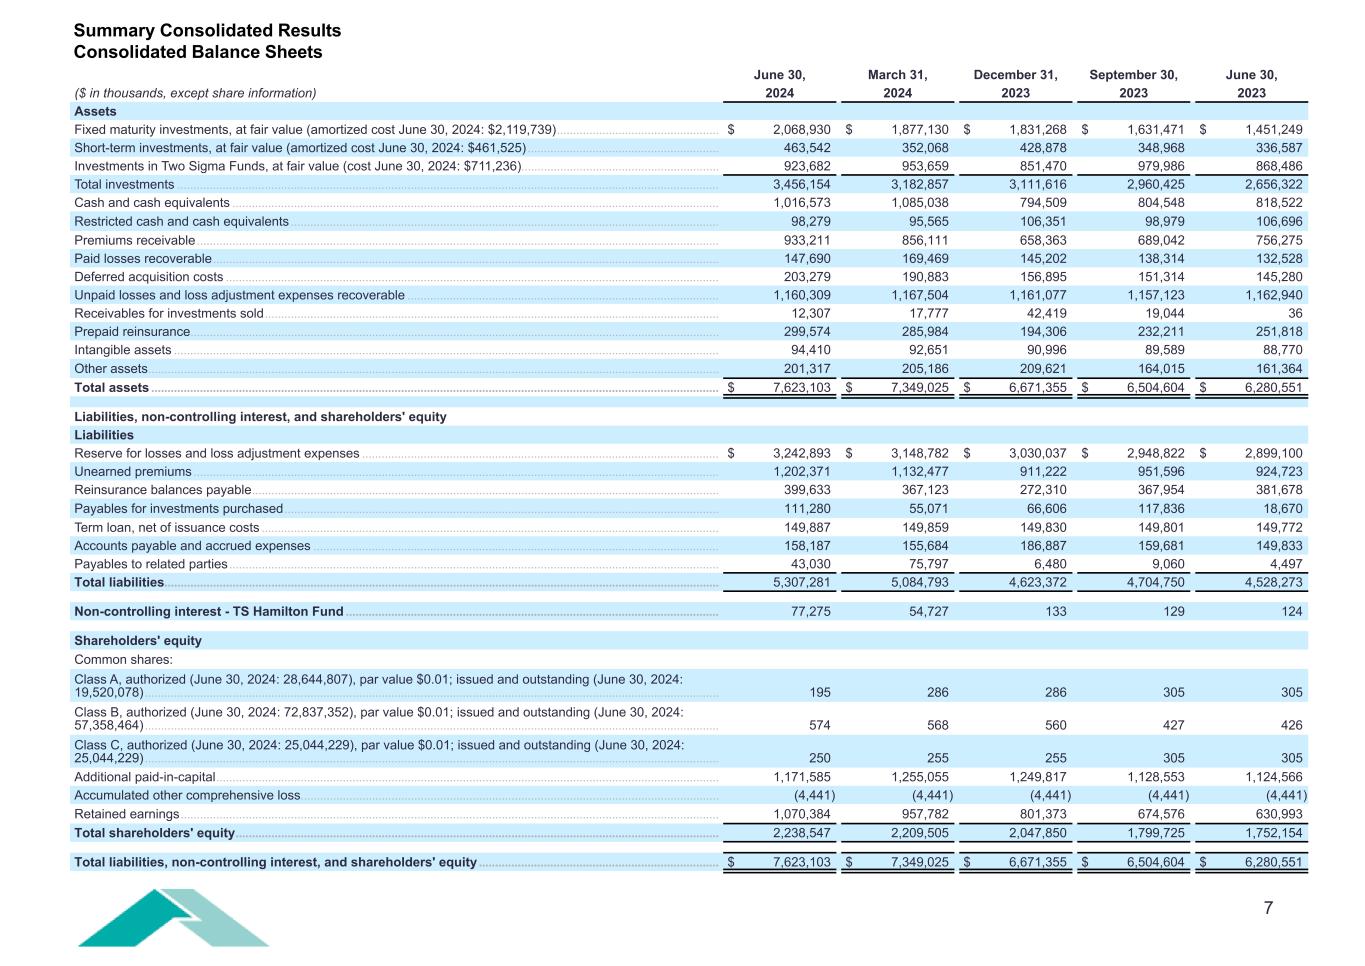
7 June 30, March 31, December 31, September 30, June 30, ($ in thousands, except share information) 2024 2024 2023 2023 2023 Assets Fixed maturity investments, at fair value (amortized cost June 30, 2024: $2,119,739) .................................................. $ 2,068,930 $ 1,877,130 $ 1,831,268 $ 1,631,471 $ 1,451,249 Short-term investments, at fair value (amortized cost June 30, 2024: $461,525) ........................................................... 463,542 352,068 428,878 348,968 336,587 Investments in Two Sigma Funds, at fair value (cost June 30, 2024: $711,236) ............................................................. 923,682 953,659 851,470 979,986 868,486 Total investments ....................................................................................................................................................................... 3,456,154 3,182,857 3,111,616 2,960,425 2,656,322 Cash and cash equivalents ...................................................................................................................................................... 1,016,573 1,085,038 794,509 804,548 818,522 Restricted cash and cash equivalents .................................................................................................................................... 98,279 95,565 106,351 98,979 106,696 Premiums receivable ................................................................................................................................................................. 933,211 856,111 658,363 689,042 756,275 Paid losses recoverable ............................................................................................................................................................ 147,690 169,469 145,202 138,314 132,528 Deferred acquisition costs ........................................................................................................................................................ 203,279 190,883 156,895 151,314 145,280 Unpaid losses and loss adjustment expenses recoverable ................................................................................................ 1,160,309 1,167,504 1,161,077 1,157,123 1,162,940 Receivables for investments sold ............................................................................................................................................ 12,307 17,777 42,419 19,044 36 Prepaid reinsurance ................................................................................................................................................................... 299,574 285,984 194,306 232,211 251,818 Intangible assets ........................................................................................................................................................................ 94,410 92,651 90,996 89,589 88,770 Other assets ................................................................................................................................................................................ 201,317 205,186 209,621 164,015 161,364 Total assets ............................................................................................................................................................................... $ 7,623,103 $ 7,349,025 $ 6,671,355 $ 6,504,604 $ 6,280,551 Liabilities, non-controlling interest, and shareholders' equity Liabilities Reserve for losses and loss adjustment expenses .............................................................................................................. $ 3,242,893 $ 3,148,782 $ 3,030,037 $ 2,948,822 $ 2,899,100 Unearned premiums .................................................................................................................................................................. 1,202,371 1,132,477 911,222 951,596 924,723 Reinsurance balances payable ................................................................................................................................................ 399,633 367,123 272,310 367,954 381,678 Payables for investments purchased ...................................................................................................................................... 111,280 55,071 66,606 117,836 18,670 Term loan, net of issuance costs ............................................................................................................................................. 149,887 149,859 149,830 149,801 149,772 Accounts payable and accrued expenses ............................................................................................................................. 158,187 155,684 186,887 159,681 149,833 Payables to related parties ....................................................................................................................................................... 43,030 75,797 6,480 9,060 4,497 Total liabilities ........................................................................................................................................................................... 5,307,281 5,084,793 4,623,372 4,704,750 4,528,273 Non-controlling interest - TS Hamilton Fund ................................................................................................................... 77,275 54,727 133 129 124 Shareholders' equity Common shares: Class A, authorized (June 30, 2024: 28,644,807), par value $0.01; issued and outstanding (June 30, 2024: 19,520,078) ................................................................................................................................................................................. 195 286 286 305 305 Class B, authorized (June 30, 2024: 72,837,352), par value $0.01; issued and outstanding (June 30, 2024: 57,358,464) ................................................................................................................................................................................. 574 568 560 427 426 Class C, authorized (June 30, 2024: 25,044,229), par value $0.01; issued and outstanding (June 30, 2024: 25,044,229) ................................................................................................................................................................................. 250 255 255 305 305 Additional paid-in-capital ........................................................................................................................................................... 1,171,585 1,255,055 1,249,817 1,128,553 1,124,566 Accumulated other comprehensive loss ................................................................................................................................. (4,441) (4,441) (4,441) (4,441) (4,441) Retained earnings ...................................................................................................................................................................... 1,070,384 957,782 801,373 674,576 630,993 Total shareholders' equity ..................................................................................................................................................... 2,238,547 2,209,505 2,047,850 1,799,725 1,752,154 Total liabilities, non-controlling interest, and shareholders' equity .......................................................................... $ 7,623,103 $ 7,349,025 $ 6,671,355 $ 6,504,604 $ 6,280,551 Summary Consolidated Results Consolidated Balance Sheets
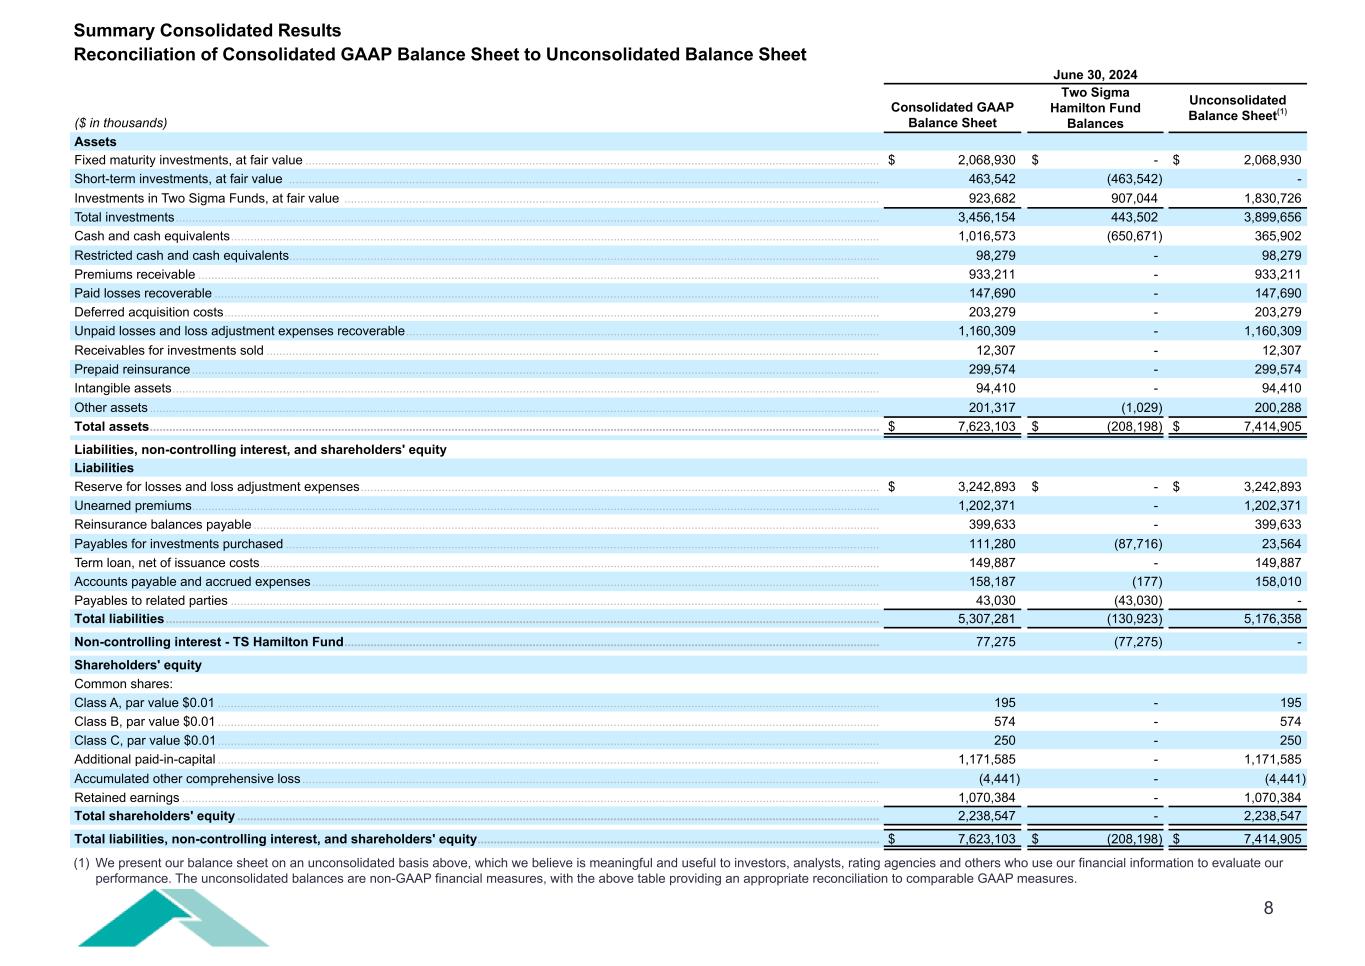
8 June 30, 2024 ($ in thousands) Consolidated GAAP Balance Sheet Two Sigma Hamilton Fund Balances Unconsolidated Balance Sheet(1) Assets Fixed maturity investments, at fair value ................................................................................................................................................................................. $ 2,068,930 $ - $ 2,068,930 Short-term investments, at fair value ...................................................................................................................................................................................... 463,542 (463,542) - Investments in Two Sigma Funds, at fair value ..................................................................................................................................................................... 923,682 907,044 1,830,726 Total investments ......................................................................................................................................................................................................................... 3,456,154 443,502 3,899,656 Cash and cash equivalents ........................................................................................................................................................................................................ 1,016,573 (650,671) 365,902 Restricted cash and cash equivalents ...................................................................................................................................................................................... 98,279 - 98,279 Premiums receivable .................................................................................................................................................................................................................. 933,211 - 933,211 Paid losses recoverable ............................................................................................................................................................................................................. 147,690 - 147,690 Deferred acquisition costs .......................................................................................................................................................................................................... 203,279 - 203,279 Unpaid losses and loss adjustment expenses recoverable .................................................................................................................................................. 1,160,309 - 1,160,309 Receivables for investments sold ............................................................................................................................................................................................. 12,307 - 12,307 Prepaid reinsurance .................................................................................................................................................................................................................... 299,574 - 299,574 Intangible assets .......................................................................................................................................................................................................................... 94,410 - 94,410 Other assets ................................................................................................................................................................................................................................. 201,317 (1,029) 200,288 Total assets ................................................................................................................................................................................................................................. $ 7,623,103 $ (208,198) $ 7,414,905 Liabilities, non-controlling interest, and shareholders' equity Liabilities Reserve for losses and loss adjustment expenses ................................................................................................................................................................ $ 3,242,893 $ - $ 3,242,893 Unearned premiums .................................................................................................................................................................................................................... 1,202,371 - 1,202,371 Reinsurance balances payable ................................................................................................................................................................................................. 399,633 - 399,633 Payables for investments purchased ....................................................................................................................................................................................... 111,280 (87,716) 23,564 Term loan, net of issuance costs ............................................................................................................................................................................................... 149,887 - 149,887 Accounts payable and accrued expenses ............................................................................................................................................................................... 158,187 (177) 158,010 Payables to related parties ........................................................................................................................................................................................................ 43,030 (43,030) - Total liabilities ............................................................................................................................................................................................................................ 5,307,281 (130,923) 5,176,358 Non-controlling interest - TS Hamilton Fund ..................................................................................................................................................................... 77,275 (77,275) - Shareholders' equity Common shares: Class A, par value $0.01 ............................................................................................................................................................................................................ 195 - 195 Class B, par value $0.01 ............................................................................................................................................................................................................ 574 - 574 Class C, par value $0.01 ............................................................................................................................................................................................................ 250 - 250 Additional paid-in-capital ............................................................................................................................................................................................................ 1,171,585 - 1,171,585 Accumulated other comprehensive loss .................................................................................................................................................................................. (4,441) - (4,441) Retained earnings ....................................................................................................................................................................................................................... 1,070,384 - 1,070,384 Total shareholders' equity ...................................................................................................................................................................................................... 2,238,547 - 2,238,547 Total liabilities, non-controlling interest, and shareholders' equity ............................................................................................................................ $ 7,623,103 $ (208,198) $ 7,414,905 Summary Consolidated Results Reconciliation of Consolidated GAAP Balance Sheet to Unconsolidated Balance Sheet (1) We present our balance sheet on an unconsolidated basis above, which we believe is meaningful and useful to investors, analysts, rating agencies and others who use our financial information to evaluate our performance. The unconsolidated balances are non-GAAP financial measures, with the above table providing an appropriate reconciliation to comparable GAAP measures.
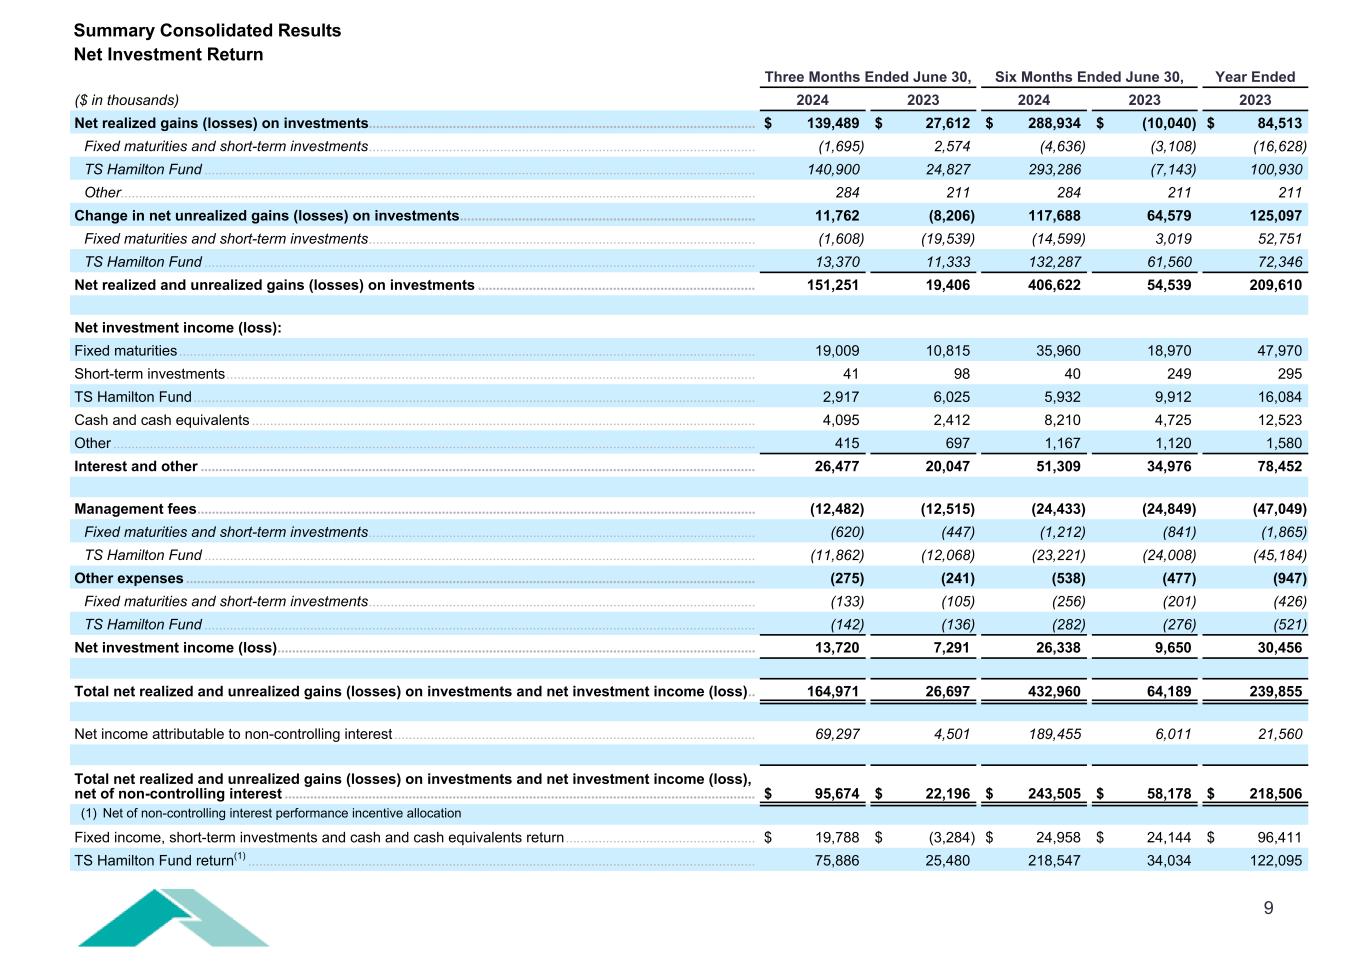
9 Three Months Ended June 30, Six Months Ended June 30, Year Ended ($ in thousands) 2024 2023 2024 2023 2023 Net realized gains (losses) on investments .......................................................................................................... $ 139,489 $ 27,612 $ 288,934 $ (10,040) $ 84,513 Fixed maturities and short-term investments .......................................................................................................... (1,695) 2,574 (4,636) (3,108) (16,628) TS Hamilton Fund ....................................................................................................................................................... 140,900 24,827 293,286 (7,143) 100,930 Other.............................................................................................................................................................................. 284 211 284 211 211 Change in net unrealized gains (losses) on investments ................................................................................. 11,762 (8,206) 117,688 64,579 125,097 Fixed maturities and short-term investments .......................................................................................................... (1,608) (19,539) (14,599) 3,019 52,751 TS Hamilton Fund ....................................................................................................................................................... 13,370 11,333 132,287 61,560 72,346 Net realized and unrealized gains (losses) on investments ............................................................................ 151,251 19,406 406,622 54,539 209,610 Net investment income (loss): Fixed maturities .............................................................................................................................................................. 19,009 10,815 35,960 18,970 47,970 Short-term investments ................................................................................................................................................. 41 98 40 249 295 TS Hamilton Fund .......................................................................................................................................................... 2,917 6,025 5,932 9,912 16,084 Cash and cash equivalents .......................................................................................................................................... 4,095 2,412 8,210 4,725 12,523 Other ................................................................................................................................................................................ 415 697 1,167 1,120 1,580 Interest and other ........................................................................................................................................................ 26,477 20,047 51,309 34,976 78,452 Management fees ......................................................................................................................................................... (12,482) (12,515) (24,433) (24,849) (47,049) Fixed maturities and short-term investments .......................................................................................................... (620) (447) (1,212) (841) (1,865) TS Hamilton Fund ....................................................................................................................................................... (11,862) (12,068) (23,221) (24,008) (45,184) Other expenses ............................................................................................................................................................ (275) (241) (538) (477) (947) Fixed maturities and short-term investments .......................................................................................................... (133) (105) (256) (201) (426) TS Hamilton Fund ....................................................................................................................................................... (142) (136) (282) (276) (521) Net investment income (loss) ................................................................................................................................... 13,720 7,291 26,338 9,650 30,456 Total net realized and unrealized gains (losses) on investments and net investment income (loss) .. 164,971 26,697 432,960 64,189 239,855 Net income attributable to non-controlling interest ................................................................................................... 69,297 4,501 189,455 6,011 21,560 Total net realized and unrealized gains (losses) on investments and net investment income (loss), net of non-controlling interest ................................................................................................................................. $ 95,674 $ 22,196 $ 243,505 $ 58,178 $ 218,506 Fixed income, short-term investments and cash and cash equivalents return .................................................... $ 19,788 $ (3,284) $ 24,958 $ 24,144 $ 96,411 TS Hamilton Fund return(1) ........................................................................................................................................... 75,886 25,480 218,547 34,034 122,095 Summary Consolidated Results Net Investment Return (1) Net of non-controlling interest performance incentive allocation
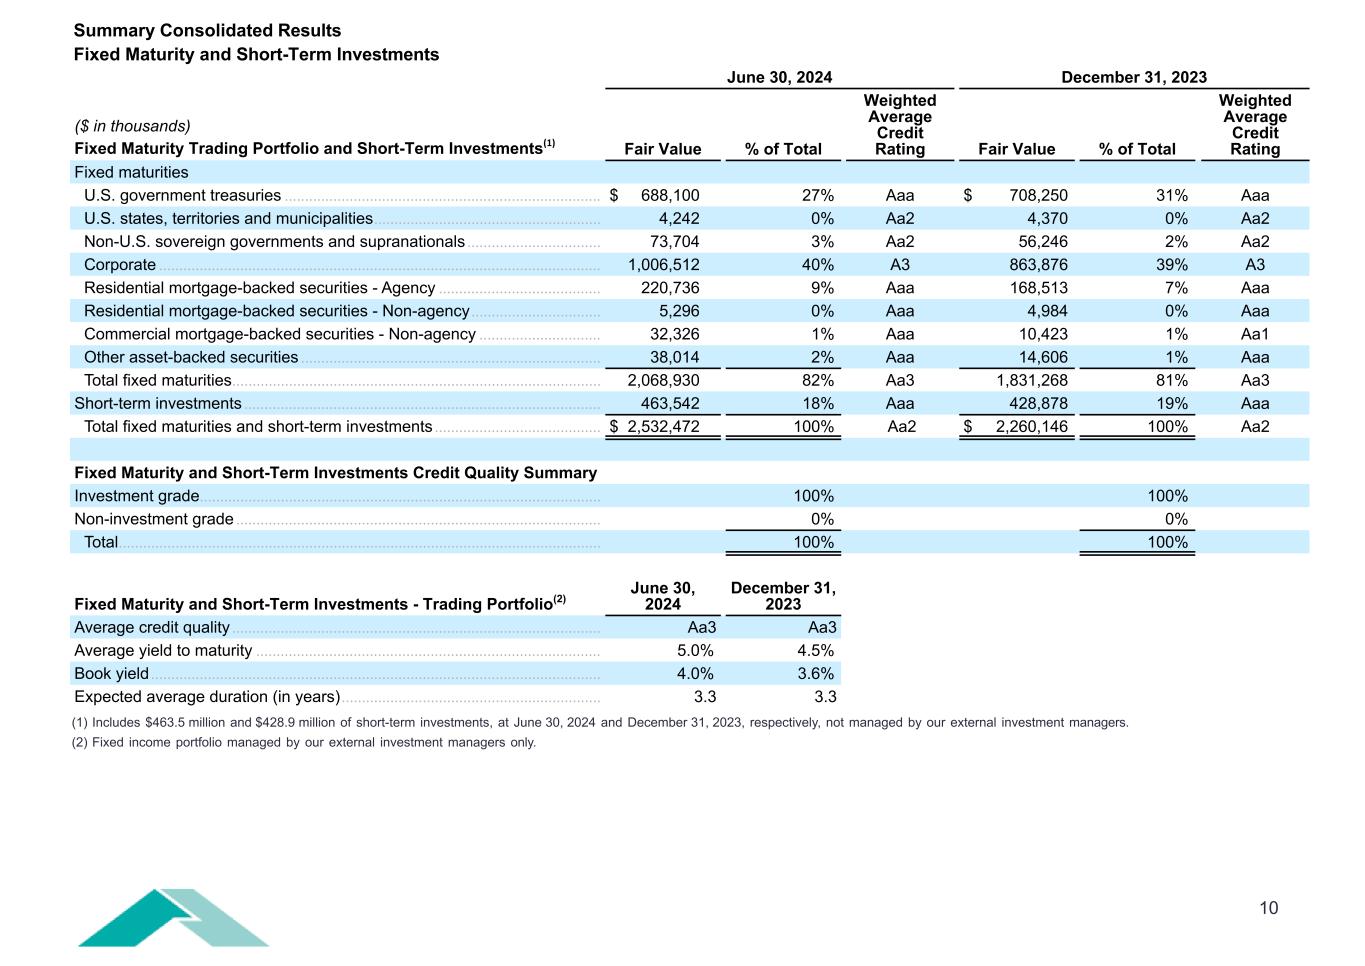
10 June 30, 2024 December 31, 2023 ($ in thousands) Fair Value % of Total Weighted Average Credit Rating Fair Value % of Total Weighted Average Credit RatingFixed Maturity Trading Portfolio and Short-Term Investments(1) Fixed maturities U.S. government treasuries .............................................................................. $ 688,100 27% Aaa $ 708,250 31% Aaa U.S. states, territories and municipalities ........................................................ 4,242 0% Aa2 4,370 0% Aa2 Non-U.S. sovereign governments and supranationals ................................. 73,704 3% Aa2 56,246 2% Aa2 Corporate ............................................................................................................. 1,006,512 40% A3 863,876 39% A3 Residential mortgage-backed securities - Agency ........................................ 220,736 9% Aaa 168,513 7% Aaa Residential mortgage-backed securities - Non-agency ................................ 5,296 0% Aaa 4,984 0% Aaa Commercial mortgage-backed securities - Non-agency .............................. 32,326 1% Aaa 10,423 1% Aa1 Other asset-backed securities .......................................................................... 38,014 2% Aaa 14,606 1% Aaa Total fixed maturities ........................................................................................... 2,068,930 82% Aa3 1,831,268 81% Aa3 Short-term investments ........................................................................................ 463,542 18% Aaa 428,878 19% Aaa Total fixed maturities and short-term investments ......................................... $ 2,532,472 100% Aa2 $ 2,260,146 100% Aa2 Fixed Maturity and Short-Term Investments Credit Quality Summary Investment grade ................................................................................................... 100% 100% Non-investment grade .......................................................................................... 0% 0% Total ....................................................................................................................... 100% 100% Fixed Maturity and Short-Term Investments - Trading Portfolio(2) June 30, 2024 December 31, 2023 Average credit quality ........................................................................................... Aa3 Aa3 Average yield to maturity ..................................................................................... 5.0% 4.5% Book yield ............................................................................................................... 4.0% 3.6% Expected average duration (in years) ................................................................ 3.3 3.3 (1) Includes $463.5 million and $428.9 million of short-term investments, at June 30, 2024 and December 31, 2023, respectively, not managed by our external investment managers. (2) Fixed income portfolio managed by our external investment managers only. Summary Consolidated Results Fixed Maturity and Short-Term Investments
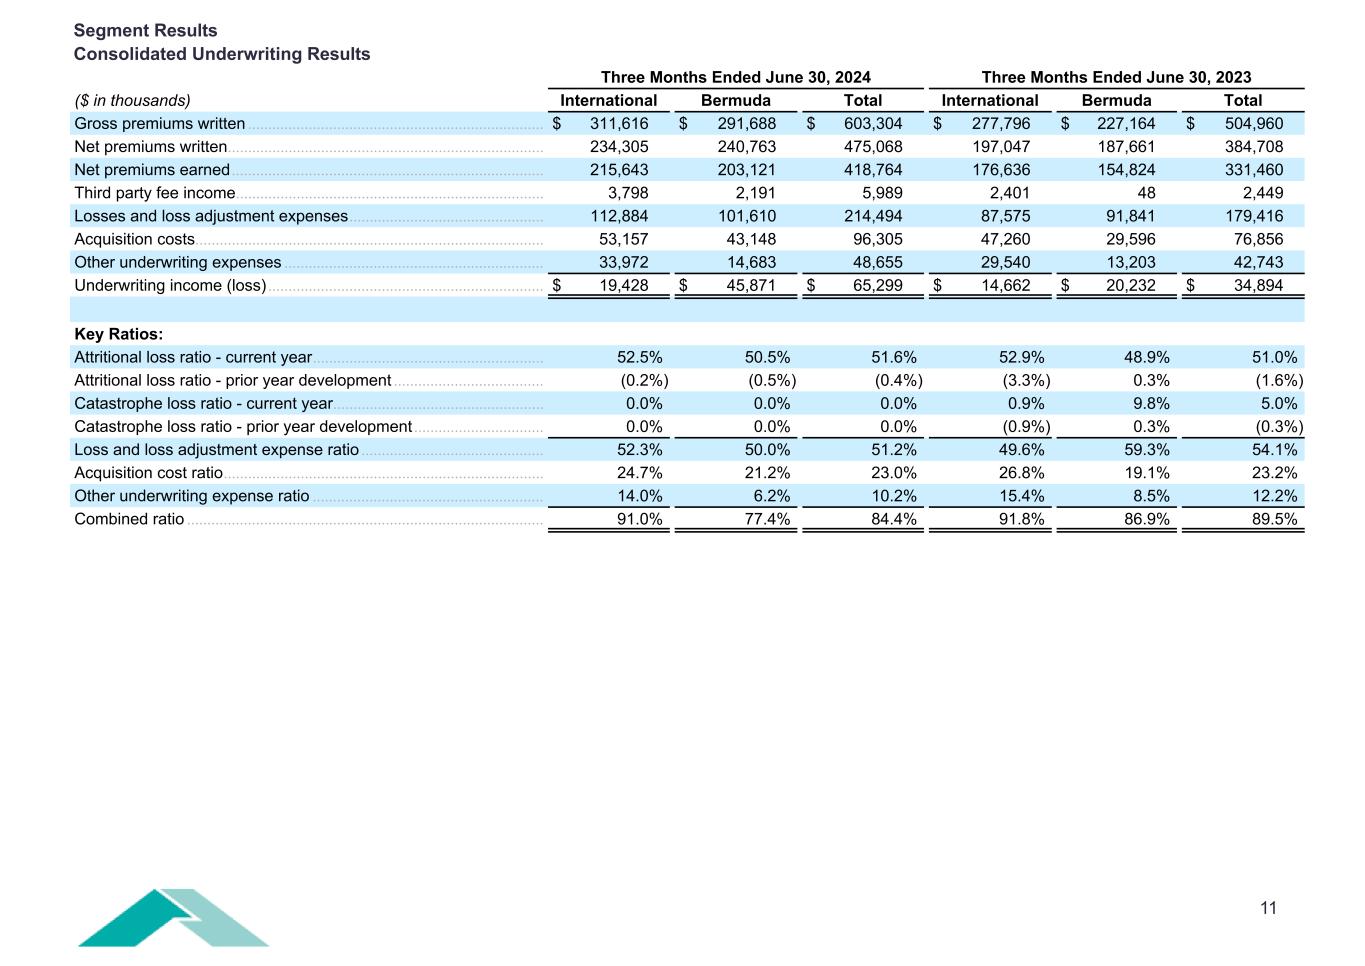
11 Three Months Ended June 30, 2024 Three Months Ended June 30, 2023 ($ in thousands) International Bermuda Total International Bermuda Total Gross premiums written ......................................................................... $ 311,616 $ 291,688 $ 603,304 $ 277,796 $ 227,164 $ 504,960 Net premiums written .............................................................................. 234,305 240,763 475,068 197,047 187,661 384,708 Net premiums earned ............................................................................. 215,643 203,121 418,764 176,636 154,824 331,460 Third party fee income ............................................................................ 3,798 2,191 5,989 2,401 48 2,449 Losses and loss adjustment expenses ................................................ 112,884 101,610 214,494 87,575 91,841 179,416 Acquisition costs ...................................................................................... 53,157 43,148 96,305 47,260 29,596 76,856 Other underwriting expenses ................................................................ 33,972 14,683 48,655 29,540 13,203 42,743 Underwriting income (loss) .................................................................... $ 19,428 $ 45,871 $ 65,299 $ 14,662 $ 20,232 $ 34,894 Key Ratios: Attritional loss ratio - current year ......................................................... 52.5% 50.5% 51.6% 52.9% 48.9% 51.0% Attritional loss ratio - prior year development ..................................... (0.2%) (0.5%) (0.4%) (3.3%) 0.3% (1.6%) Catastrophe loss ratio - current year .................................................... 0.0% 0.0% 0.0% 0.9% 9.8% 5.0% Catastrophe loss ratio - prior year development ................................ 0.0% 0.0% 0.0% (0.9%) 0.3% (0.3%) Loss and loss adjustment expense ratio ............................................. 52.3% 50.0% 51.2% 49.6% 59.3% 54.1% Acquisition cost ratio ............................................................................... 24.7% 21.2% 23.0% 26.8% 19.1% 23.2% Other underwriting expense ratio ......................................................... 14.0% 6.2% 10.2% 15.4% 8.5% 12.2% Combined ratio ........................................................................................ 91.0% 77.4% 84.4% 91.8% 86.9% 89.5% Segment Results Consolidated Underwriting Results
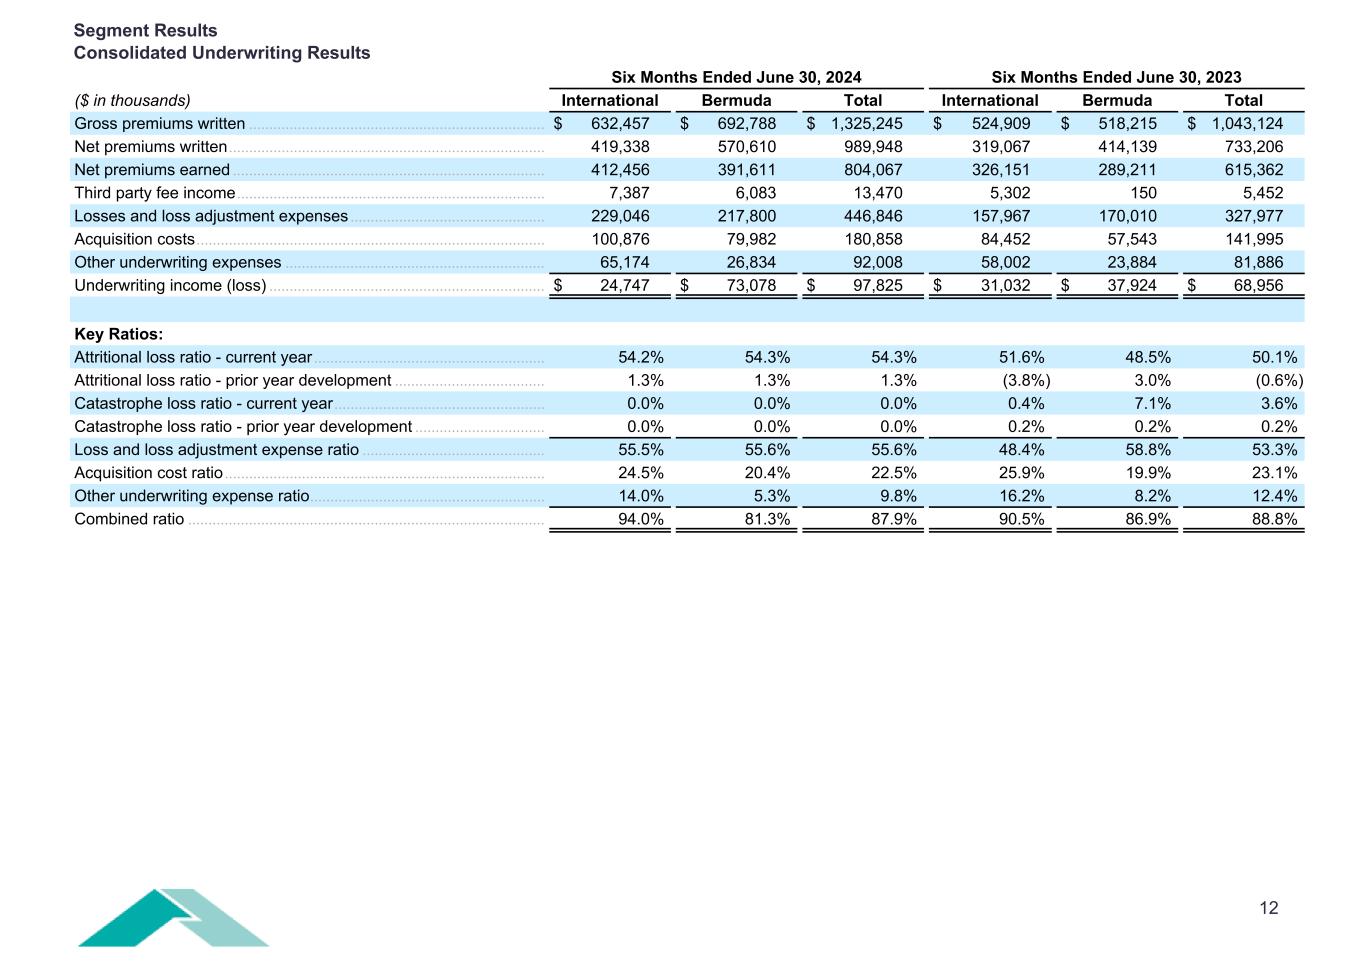
12 Six Months Ended June 30, 2024 Six Months Ended June 30, 2023 ($ in thousands) International Bermuda Total International Bermuda Total Gross premiums written ......................................................................... $ 632,457 $ 692,788 $ 1,325,245 $ 524,909 $ 518,215 $ 1,043,124 Net premiums written .............................................................................. 419,338 570,610 989,948 319,067 414,139 733,206 Net premiums earned ............................................................................. 412,456 391,611 804,067 326,151 289,211 615,362 Third party fee income ............................................................................ 7,387 6,083 13,470 5,302 150 5,452 Losses and loss adjustment expenses ................................................ 229,046 217,800 446,846 157,967 170,010 327,977 Acquisition costs ...................................................................................... 100,876 79,982 180,858 84,452 57,543 141,995 Other underwriting expenses ................................................................ 65,174 26,834 92,008 58,002 23,884 81,886 Underwriting income (loss) .................................................................... $ 24,747 $ 73,078 $ 97,825 $ 31,032 $ 37,924 $ 68,956 Key Ratios: Attritional loss ratio - current year ......................................................... 54.2% 54.3% 54.3% 51.6% 48.5% 50.1% Attritional loss ratio - prior year development ..................................... 1.3% 1.3% 1.3% (3.8%) 3.0% (0.6%) Catastrophe loss ratio - current year .................................................... 0.0% 0.0% 0.0% 0.4% 7.1% 3.6% Catastrophe loss ratio - prior year development ................................ 0.0% 0.0% 0.0% 0.2% 0.2% 0.2% Loss and loss adjustment expense ratio ............................................. 55.5% 55.6% 55.6% 48.4% 58.8% 53.3% Acquisition cost ratio ............................................................................... 24.5% 20.4% 22.5% 25.9% 19.9% 23.1% Other underwriting expense ratio .......................................................... 14.0% 5.3% 9.8% 16.2% 8.2% 12.4% Combined ratio ........................................................................................ 94.0% 81.3% 87.9% 90.5% 86.9% 88.8% Segment Results Consolidated Underwriting Results
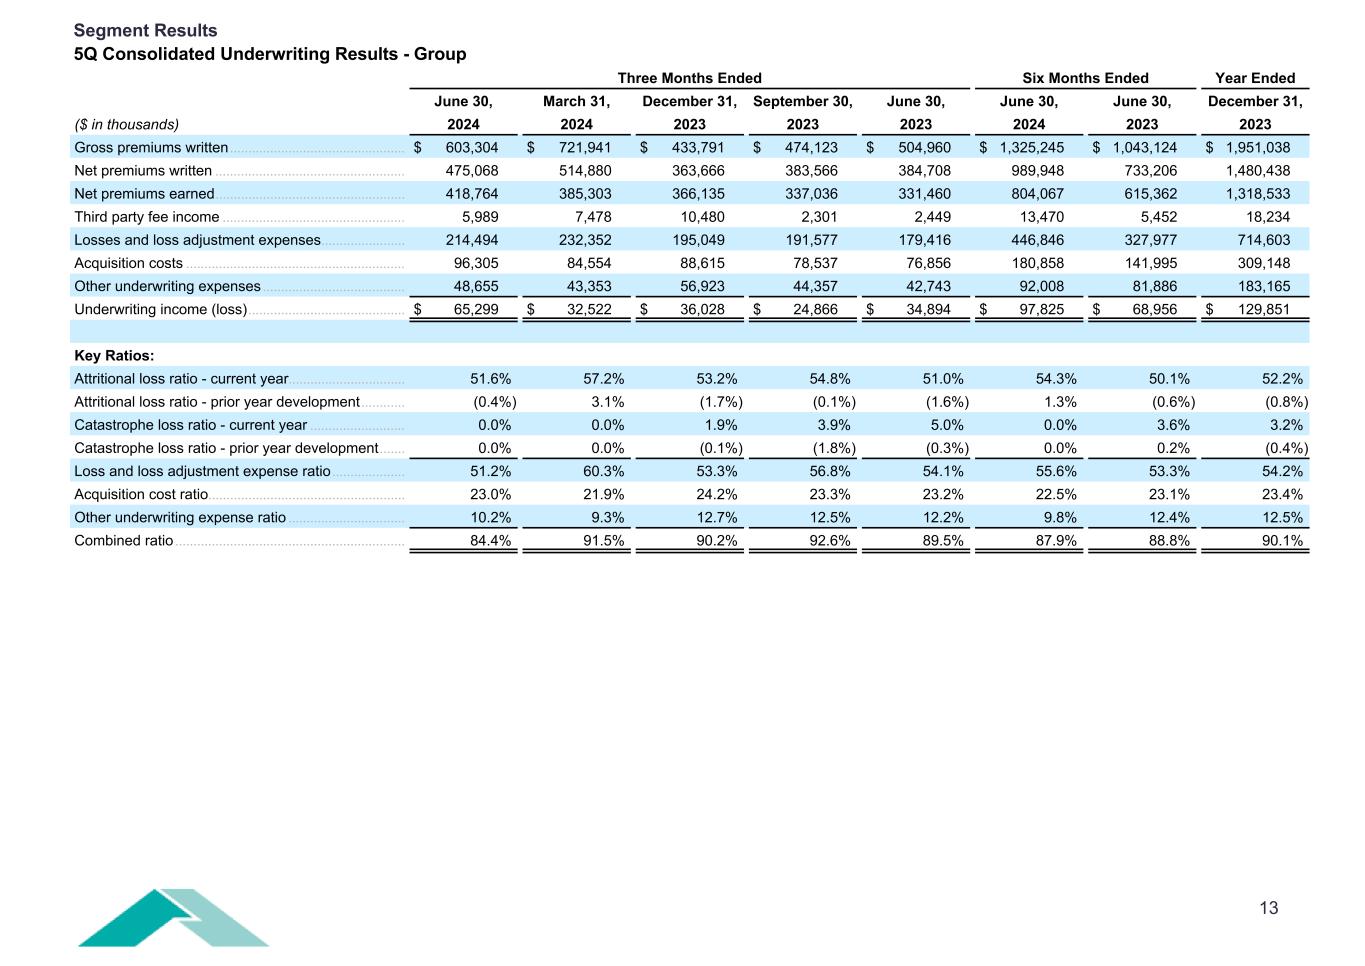
13 Three Months Ended Six Months Ended Year Ended June 30, March 31, December 31, September 30, June 30, June 30, June 30, December 31, ($ in thousands) 2024 2024 2023 2023 2023 2024 2023 2023 Gross premiums written ................................................ $ 603,304 $ 721,941 $ 433,791 $ 474,123 $ 504,960 $ 1,325,245 $ 1,043,124 $ 1,951,038 Net premiums written .................................................... 475,068 514,880 363,666 383,566 384,708 989,948 733,206 1,480,438 Net premiums earned .................................................... 418,764 385,303 366,135 337,036 331,460 804,067 615,362 1,318,533 Third party fee income .................................................. 5,989 7,478 10,480 2,301 2,449 13,470 5,452 18,234 Losses and loss adjustment expenses ....................... 214,494 232,352 195,049 191,577 179,416 446,846 327,977 714,603 Acquisition costs ............................................................ 96,305 84,554 88,615 78,537 76,856 180,858 141,995 309,148 Other underwriting expenses ....................................... 48,655 43,353 56,923 44,357 42,743 92,008 81,886 183,165 Underwriting income (loss) ........................................... $ 65,299 $ 32,522 $ 36,028 $ 24,866 $ 34,894 $ 97,825 $ 68,956 $ 129,851 Key Ratios: Attritional loss ratio - current year ................................ 51.6% 57.2% 53.2% 54.8% 51.0% 54.3% 50.1% 52.2% Attritional loss ratio - prior year development ............ (0.4%) 3.1% (1.7%) (0.1%) (1.6%) 1.3% (0.6%) (0.8%) Catastrophe loss ratio - current year .......................... 0.0% 0.0% 1.9% 3.9% 5.0% 0.0% 3.6% 3.2% Catastrophe loss ratio - prior year development ....... 0.0% 0.0% (0.1%) (1.8%) (0.3%) 0.0% 0.2% (0.4%) Loss and loss adjustment expense ratio .................... 51.2% 60.3% 53.3% 56.8% 54.1% 55.6% 53.3% 54.2% Acquisition cost ratio ...................................................... 23.0% 21.9% 24.2% 23.3% 23.2% 22.5% 23.1% 23.4% Other underwriting expense ratio ................................ 10.2% 9.3% 12.7% 12.5% 12.2% 9.8% 12.4% 12.5% Combined ratio ............................................................... 84.4% 91.5% 90.2% 92.6% 89.5% 87.9% 88.8% 90.1% Segment Results 5Q Consolidated Underwriting Results - Group
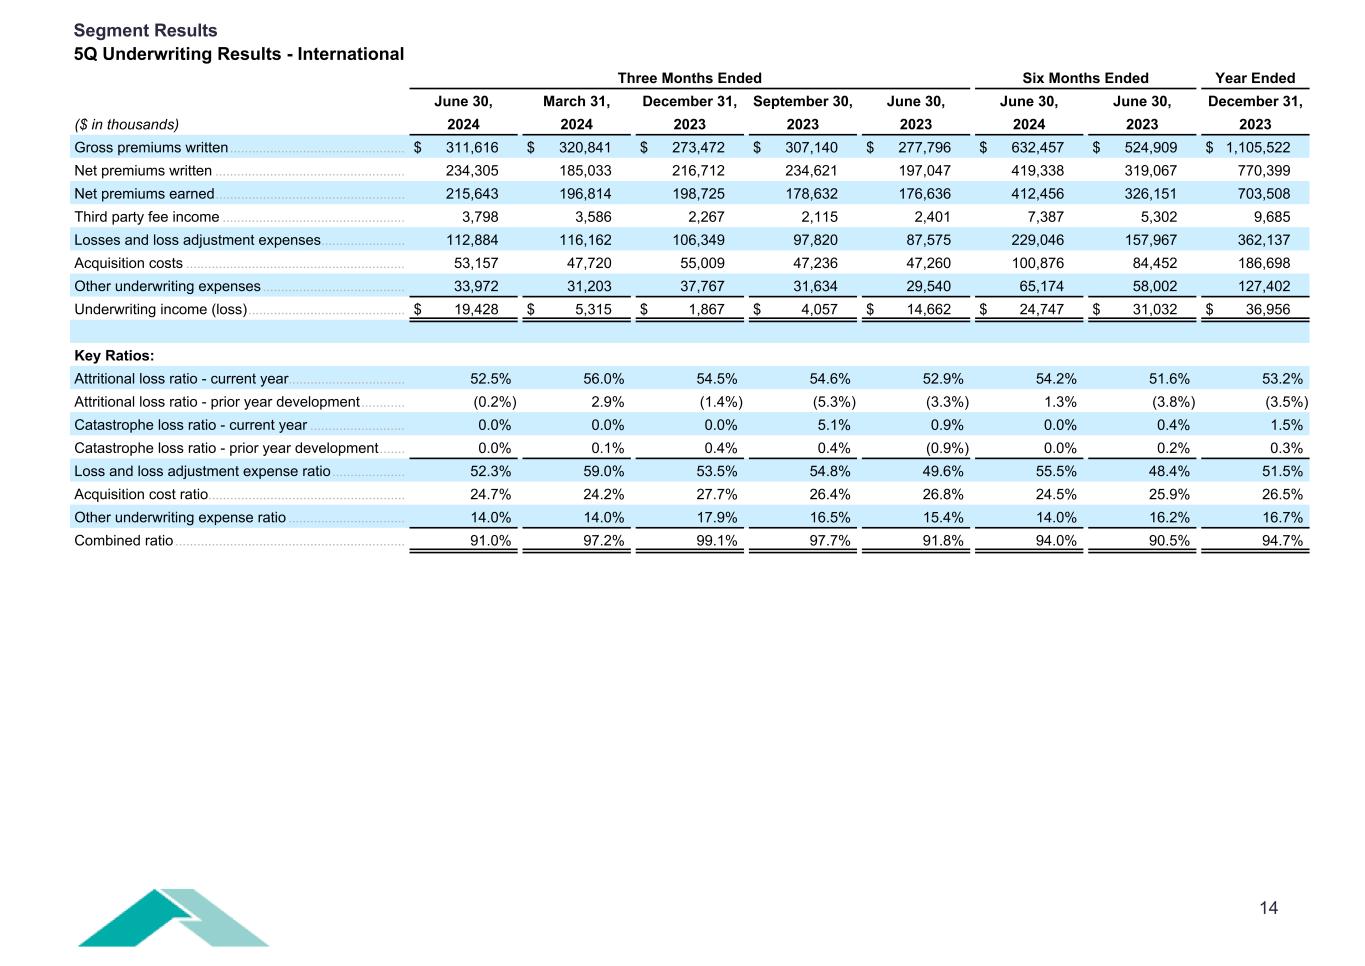
14 Three Months Ended Six Months Ended Year Ended June 30, March 31, December 31, September 30, June 30, June 30, June 30, December 31, ($ in thousands) 2024 2024 2023 2023 2023 2024 2023 2023 Gross premiums written ................................................ $ 311,616 $ 320,841 $ 273,472 $ 307,140 $ 277,796 $ 632,457 $ 524,909 $ 1,105,522 Net premiums written .................................................... 234,305 185,033 216,712 234,621 197,047 419,338 319,067 770,399 Net premiums earned .................................................... 215,643 196,814 198,725 178,632 176,636 412,456 326,151 703,508 Third party fee income .................................................. 3,798 3,586 2,267 2,115 2,401 7,387 5,302 9,685 Losses and loss adjustment expenses ....................... 112,884 116,162 106,349 97,820 87,575 229,046 157,967 362,137 Acquisition costs ............................................................ 53,157 47,720 55,009 47,236 47,260 100,876 84,452 186,698 Other underwriting expenses ....................................... 33,972 31,203 37,767 31,634 29,540 65,174 58,002 127,402 Underwriting income (loss) ........................................... $ 19,428 $ 5,315 $ 1,867 $ 4,057 $ 14,662 $ 24,747 $ 31,032 $ 36,956 Key Ratios: Attritional loss ratio - current year ................................ 52.5% 56.0% 54.5% 54.6% 52.9% 54.2% 51.6% 53.2% Attritional loss ratio - prior year development ............ (0.2%) 2.9% (1.4%) (5.3%) (3.3%) 1.3% (3.8%) (3.5%) Catastrophe loss ratio - current year .......................... 0.0% 0.0% 0.0% 5.1% 0.9% 0.0% 0.4% 1.5% Catastrophe loss ratio - prior year development ....... 0.0% 0.1% 0.4% 0.4% (0.9%) 0.0% 0.2% 0.3% Loss and loss adjustment expense ratio .................... 52.3% 59.0% 53.5% 54.8% 49.6% 55.5% 48.4% 51.5% Acquisition cost ratio ...................................................... 24.7% 24.2% 27.7% 26.4% 26.8% 24.5% 25.9% 26.5% Other underwriting expense ratio ................................ 14.0% 14.0% 17.9% 16.5% 15.4% 14.0% 16.2% 16.7% Combined ratio ............................................................... 91.0% 97.2% 99.1% 97.7% 91.8% 94.0% 90.5% 94.7% Segment Results 5Q Underwriting Results - International
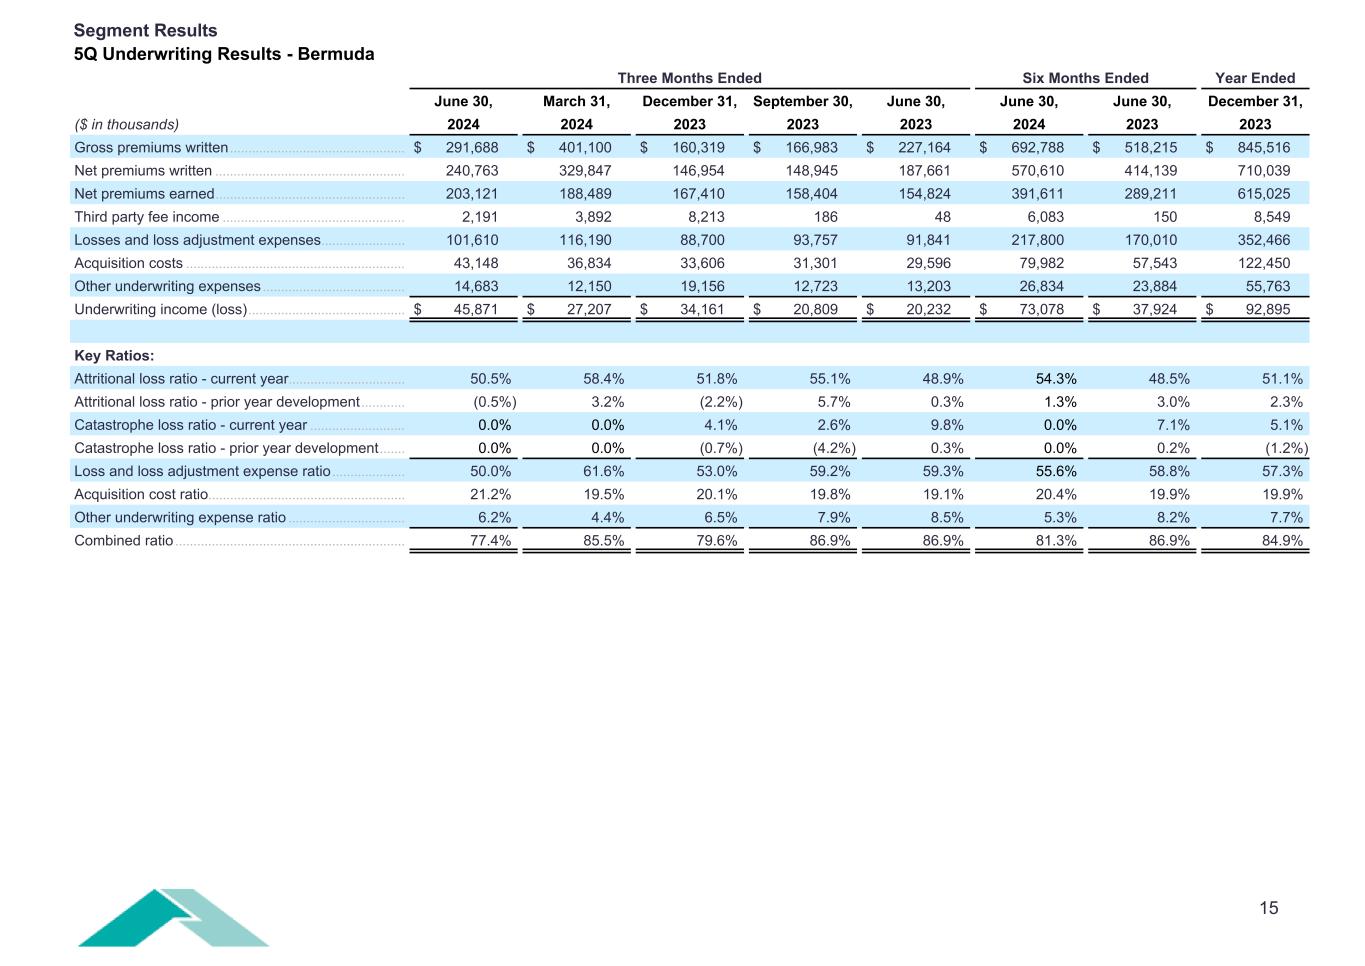
15 Three Months Ended Six Months Ended Year Ended June 30, March 31, December 31, September 30, June 30, June 30, June 30, December 31, ($ in thousands) 2024 2024 2023 2023 2023 2024 2023 2023 Gross premiums written ................................................ $ 291,688 $ 401,100 $ 160,319 $ 166,983 $ 227,164 $ 692,788 $ 518,215 $ 845,516 Net premiums written .................................................... 240,763 329,847 146,954 148,945 187,661 570,610 414,139 710,039 Net premiums earned .................................................... 203,121 188,489 167,410 158,404 154,824 391,611 289,211 615,025 Third party fee income .................................................. 2,191 3,892 8,213 186 48 6,083 150 8,549 Losses and loss adjustment expenses ....................... 101,610 116,190 88,700 93,757 91,841 217,800 170,010 352,466 Acquisition costs ............................................................ 43,148 36,834 33,606 31,301 29,596 79,982 57,543 122,450 Other underwriting expenses ....................................... 14,683 12,150 19,156 12,723 13,203 26,834 23,884 55,763 Underwriting income (loss) ........................................... $ 45,871 $ 27,207 $ 34,161 $ 20,809 $ 20,232 $ 73,078 $ 37,924 $ 92,895 Key Ratios: Attritional loss ratio - current year ................................ 50.5% 58.4% 51.8% 55.1% 48.9% 54.3% 48.5% 51.1% Attritional loss ratio - prior year development ............ (0.5%) 3.2% (2.2%) 5.7% 0.3% 1.3% 3.0% 2.3% Catastrophe loss ratio - current year .......................... 0.0% 0.0% 4.1% 2.6% 9.8% 0.0% 7.1% 5.1% Catastrophe loss ratio - prior year development ....... 0.0% 0.0% (0.7%) (4.2%) 0.3% 0.0% 0.2% (1.2%) Loss and loss adjustment expense ratio .................... 50.0% 61.6% 53.0% 59.2% 59.3% 55.6% 58.8% 57.3% Acquisition cost ratio ...................................................... 21.2% 19.5% 20.1% 19.8% 19.1% 20.4% 19.9% 19.9% Other underwriting expense ratio ................................ 6.2% 4.4% 6.5% 7.9% 8.5% 5.3% 8.2% 7.7% Combined ratio ............................................................... 77.4% 85.5% 79.6% 86.9% 86.9% 81.3% 86.9% 84.9% Segment Results 5Q Underwriting Results - Bermuda
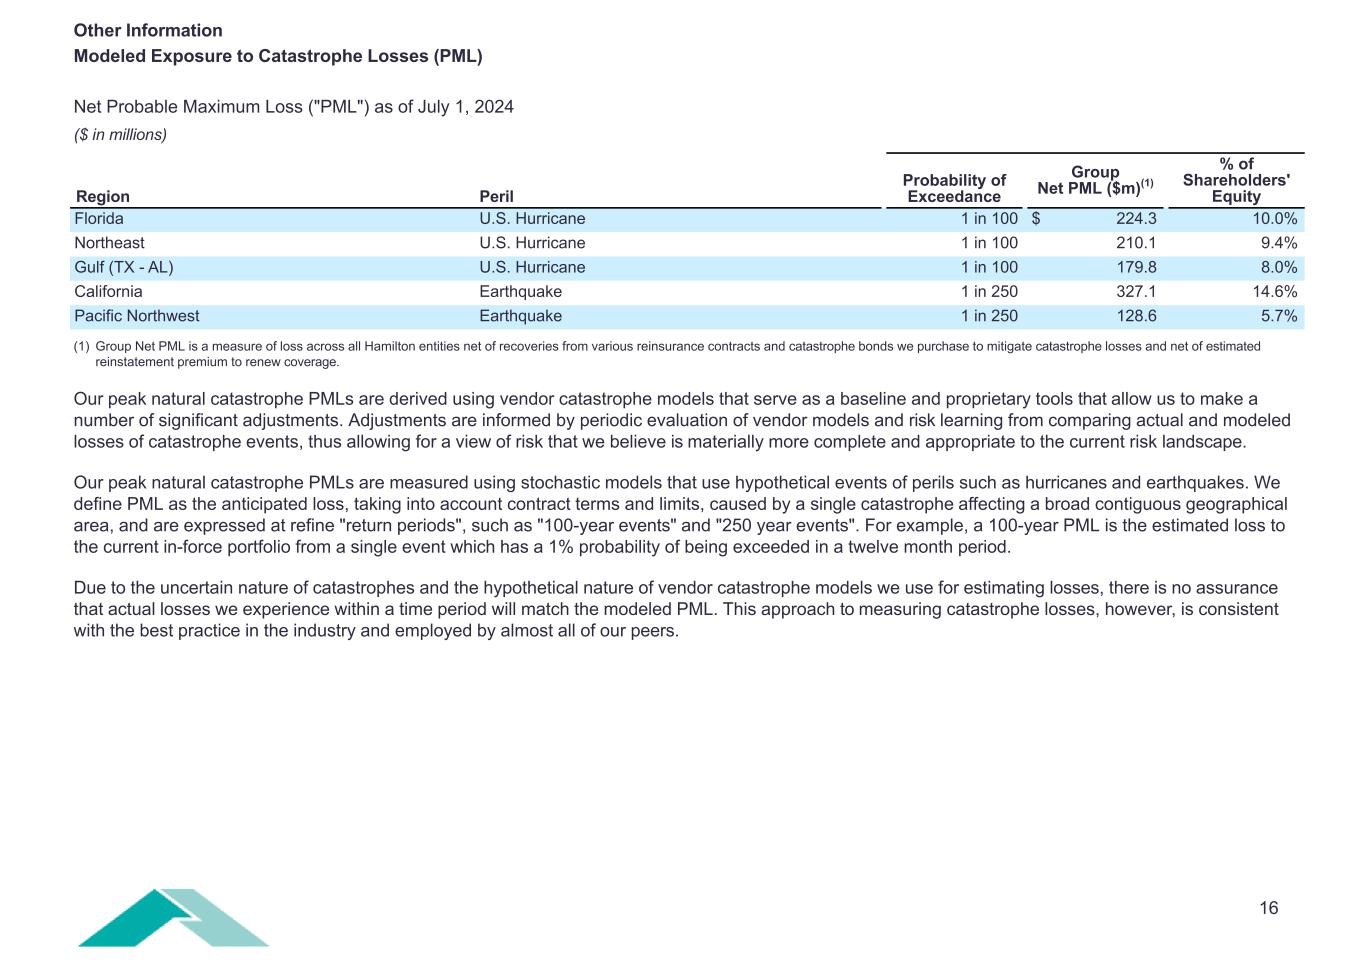
16 Region Peril Probability of Exceedance Group Net PML ($m)(1) % of Shareholders' Equity Florida U.S. Hurricane 1 in 100 $ 224.3 10.0% Northeast U.S. Hurricane 1 in 100 210.1 9.4% Gulf (TX - AL) U.S. Hurricane 1 in 100 179.8 8.0% California Earthquake 1 in 250 327.1 14.6% Pacific Northwest Earthquake 1 in 250 128.6 5.7% (1) Group Net PML is a measure of loss across all Hamilton entities net of recoveries from various reinsurance contracts and catastrophe bonds we purchase to mitigate catastrophe losses and net of estimated reinstatement premium to renew coverage. Our peak natural catastrophe PMLs are derived using vendor catastrophe models that serve as a baseline and proprietary tools that allow us to make a number of significant adjustments. Adjustments are informed by periodic evaluation of vendor models and risk learning from comparing actual and modeled losses of catastrophe events, thus allowing for a view of risk that we believe is materially more complete and appropriate to the current risk landscape. Our peak natural catastrophe PMLs are measured using stochastic models that use hypothetical events of perils such as hurricanes and earthquakes. We define PML as the anticipated loss, taking into account contract terms and limits, caused by a single catastrophe affecting a broad contiguous geographical area, and are expressed at refine "return periods", such as "100-year events" and "250 year events". For example, a 100-year PML is the estimated loss to the current in-force portfolio from a single event which has a 1% probability of being exceeded in a twelve month period. Due to the uncertain nature of catastrophes and the hypothetical nature of vendor catastrophe models we use for estimating losses, there is no assurance that actual losses we experience within a time period will match the modeled PML. This approach to measuring catastrophe losses, however, is consistent with the best practice in the industry and employed by almost all of our peers. Other Information Modeled Exposure to Catastrophe Losses (PML) Net Probable Maximum Loss ("PML") as of July 1, 2024 ($ in millions)
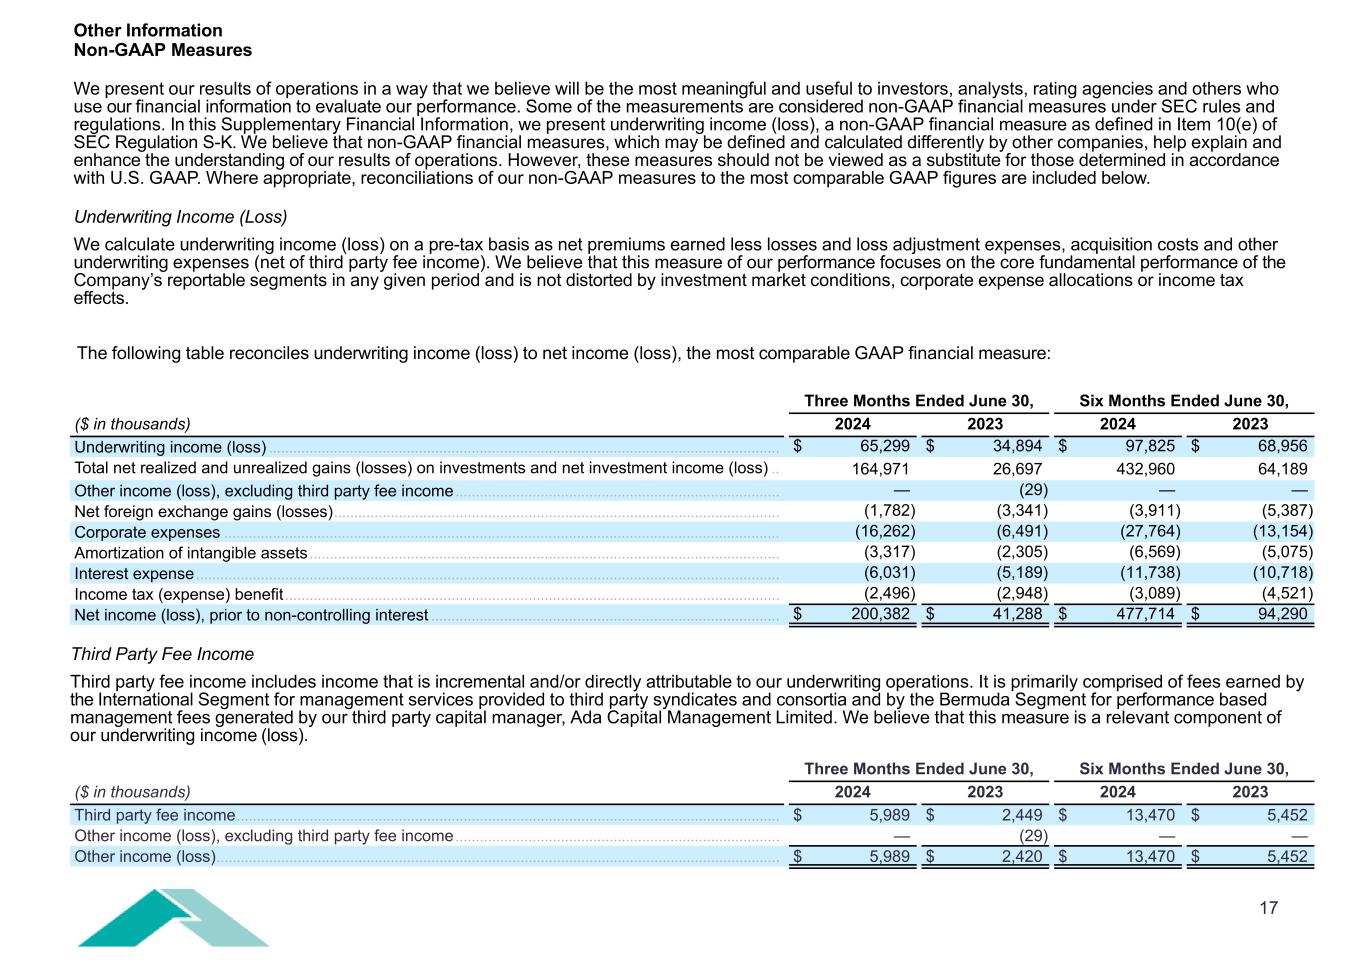
17 Other Information Non-GAAP Measures We present our results of operations in a way that we believe will be the most meaningful and useful to investors, analysts, rating agencies and others who use our financial information to evaluate our performance. Some of the measurements are considered non-GAAP financial measures under SEC rules and regulations. In this Supplementary Financial Information, we present underwriting income (loss), a non-GAAP financial measure as defined in Item 10(e) of SEC Regulation S-K. We believe that non-GAAP financial measures, which may be defined and calculated differently by other companies, help explain and enhance the understanding of our results of operations. However, these measures should not be viewed as a substitute for those determined in accordance with U.S. GAAP. Where appropriate, reconciliations of our non-GAAP measures to the most comparable GAAP figures are included below. Underwriting Income (Loss) We calculate underwriting income (loss) on a pre-tax basis as net premiums earned less losses and loss adjustment expenses, acquisition costs and other underwriting expenses (net of third party fee income). We believe that this measure of our performance focuses on the core fundamental performance of the Company’s reportable segments in any given period and is not distorted by investment market conditions, corporate expense allocations or income tax effects. The following table reconciles underwriting income (loss) to net income (loss), the most comparable GAAP financial measure: Three Months Ended June 30, Six Months Ended June 30, ($ in thousands) 2024 2023 2024 2023 Underwriting income (loss) .............................................................................................................................. $ 65,299 $ 34,894 $ 97,825 $ 68,956 Total net realized and unrealized gains (losses) on investments and net investment income (loss) .. 164,971 26,697 432,960 64,189 Other income (loss), excluding third party fee income ................................................................................ — (29) — — Net foreign exchange gains (losses) .............................................................................................................. (1,782) (3,341) (3,911) (5,387) Corporate expenses ......................................................................................................................................... (16,262) (6,491) (27,764) (13,154) Amortization of intangible assets .................................................................................................................... (3,317) (2,305) (6,569) (5,075) Interest expense ................................................................................................................................................ (6,031) (5,189) (11,738) (10,718) Income tax (expense) benefit .......................................................................................................................... (2,496) (2,948) (3,089) (4,521) Net income (loss), prior to non-controlling interest ...................................................................................... $ 200,382 $ 41,288 $ 477,714 $ 94,290 Three Months Ended June 30, Six Months Ended June 30, ($ in thousands) 2024 2023 2024 2023 Third party fee income ...................................................................................................................................... $ 5,989 $ 2,449 $ 13,470 $ 5,452 Other income (loss), excluding third party fee income ................................................................................ — (29) — — Other income (loss) ........................................................................................................................................... $ 5,989 $ 2,420 $ 13,470 $ 5,452 Third Party Fee Income Third party fee income includes income that is incremental and/or directly attributable to our underwriting operations. It is primarily comprised of fees earned by the International Segment for management services provided to third party syndicates and consortia and by the Bermuda Segment for performance based management fees generated by our third party capital manager, Ada Capital Management Limited. We believe that this measure is a relevant component of our underwriting income (loss).
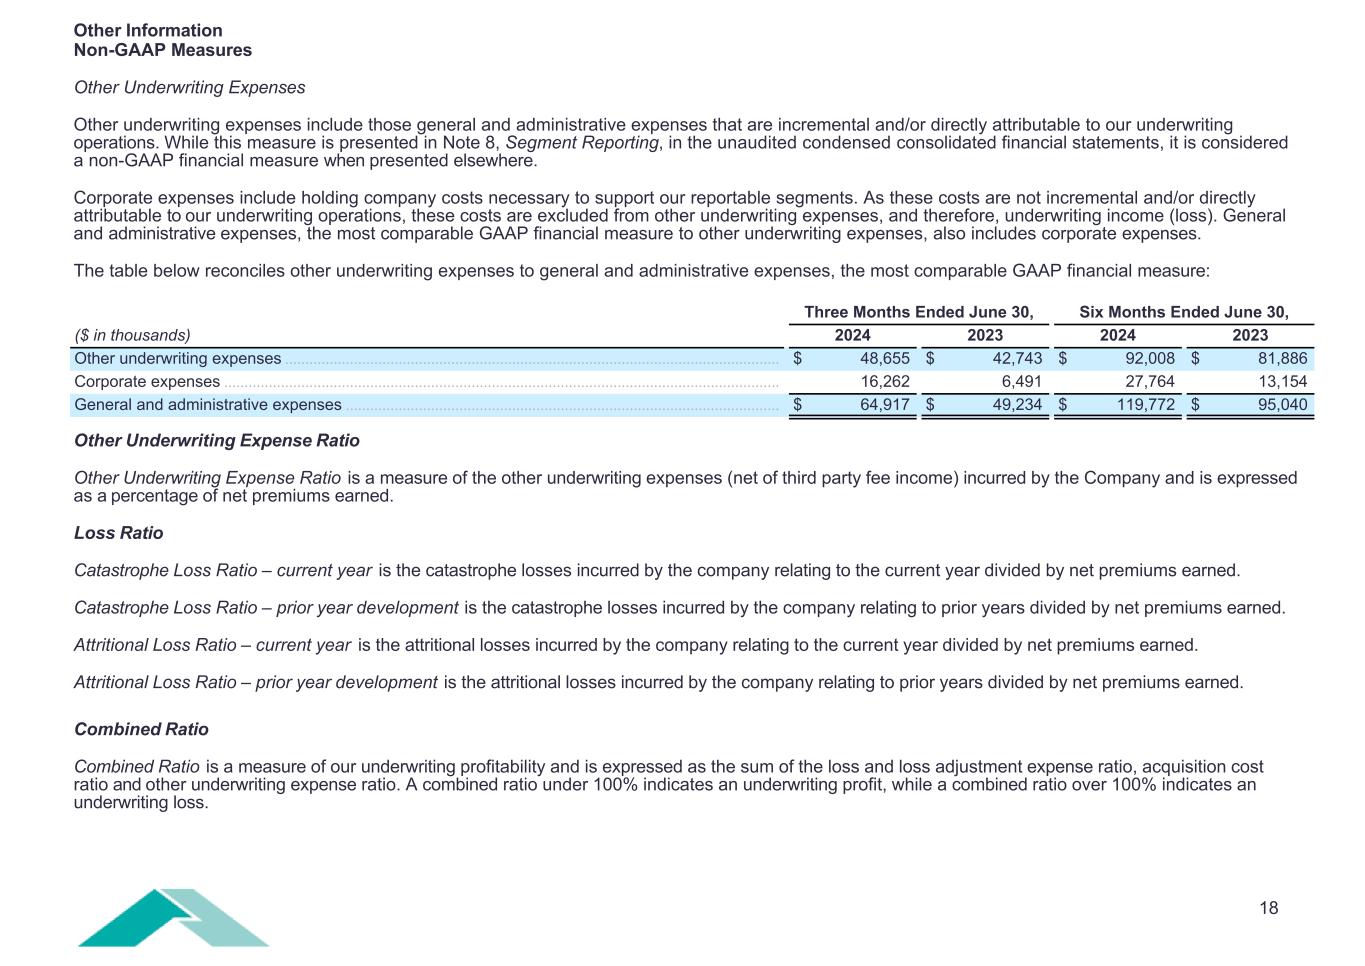
18 Three Months Ended June 30, Six Months Ended June 30, ($ in thousands) 2024 2023 2024 2023 Other underwriting expenses .......................................................................................................................... $ 48,655 $ 42,743 $ 92,008 $ 81,886 Corporate expenses ......................................................................................................................................... 16,262 6,491 27,764 13,154 General and administrative expenses ........................................................................................................... $ 64,917 $ 49,234 $ 119,772 $ 95,040 Other Information Non-GAAP Measures Other Underwriting Expenses Other underwriting expenses include those general and administrative expenses that are incremental and/or directly attributable to our underwriting operations. While this measure is presented in Note 8, Segment Reporting, in the unaudited condensed consolidated financial statements, it is considered a non-GAAP financial measure when presented elsewhere. Corporate expenses include holding company costs necessary to support our reportable segments. As these costs are not incremental and/or directly attributable to our underwriting operations, these costs are excluded from other underwriting expenses, and therefore, underwriting income (loss). General and administrative expenses, the most comparable GAAP financial measure to other underwriting expenses, also includes corporate expenses. The table below reconciles other underwriting expenses to general and administrative expenses, the most comparable GAAP financial measure: Other Underwriting Expense Ratio Other Underwriting Expense Ratio is a measure of the other underwriting expenses (net of third party fee income) incurred by the Company and is expressed as a percentage of net premiums earned. Loss Ratio Catastrophe Loss Ratio – current year is the catastrophe losses incurred by the company relating to the current year divided by net premiums earned. Catastrophe Loss Ratio – prior year development is the catastrophe losses incurred by the company relating to prior years divided by net premiums earned. Attritional Loss Ratio – current year is the attritional losses incurred by the company relating to the current year divided by net premiums earned. Attritional Loss Ratio – prior year development is the attritional losses incurred by the company relating to prior years divided by net premiums earned. Combined Ratio Combined Ratio is a measure of our underwriting profitability and is expressed as the sum of the loss and loss adjustment expense ratio, acquisition cost ratio and other underwriting expense ratio. A combined ratio under 100% indicates an underwriting profit, while a combined ratio over 100% indicates an underwriting loss.


