UNITED STATES
SECURITIES AND EXCHANGE COMMISSION
Washington, D.C. 20549
SCHEDULE 14A
PROXY STATEMENT PURSUANT TO SECTION 14(a) OF THE SECURITIES EXCHANGE ACT OF 1934
| Filed by the registrant ☒ | Filed by a party other than the registrant ☐ |
Check the appropriate box:
| ☐ | Preliminary Proxy Statement |
| ☐ | Confidential, For Use of the Commission Only (as permitted by Rule 14a-6(e) (2)) |
| ☒ | Definitive Proxy Statement |
| ☐ | Definitive Additional Materials |
| ☐ | Soliciting Material Pursuant to Section 240.14a-1 |
Navient Corporation
(Name of Registrant as Specified in Its Charter)
(Name of Person(s) Filing Proxy Statement if Other Than the Registrant)
| Payment of filing fee (check the appropriate box): | ||
| ☒ | No fee required. | |
| ☐ | Fee computed on table below per Exchange Act Rules 14a-6(i)(1) and 0-11 | |
| (1) | Title of each class of securities to which transaction applies: | |
| (2) | Aggregate number of securities to which transaction applies: | |
| (3) | Per unit price or other underlying value of transaction computed pursuant to Exchange Act Rule 0-11 (set forth the amount on which the filing fee is calculated and state how it was determined): | |
| (4) | Proposed maximum aggregate value of transaction: | |
| (5) | Total fee paid: | |
| ☐ | Fee paid previously with preliminary materials. | |
| ☐ | Check box if any part of the fee is offset as provided by Exchange Act Rule 0-11(a)(2) and identify the filing for which the offsetting fee was paid previously. Identify the previous filing by registration statement number, or the form or schedule and the date of its filing. | |
| (1) | Amount Previously Paid: | |
| (2) | Form, Schedule or Registration Statement No.: | |
| (3) | Filing Party: | |
| (4) | Date Filed: | |
123 Justison Street
Wilmington, Delaware 19801
April 9, 2020
Dear Fellow Shareholders:
As we write this letter to invite you to the 2020 Annual Meeting of Shareholders of Navient Corporation, the world is gripped by uncertainty created by COVID-19. We understand that these are challenging times for everyone and want to assure our stockholders that we are focused on the health and safety of our teammates while safely continuing to meet the needs of our customers and clients. We are also focused on ensuring that we are prepared to fully engage in growing our business when appropriate.
To protect the safety, health and well-being of our team, customers and communities, we rapidly and successfully implemented several preventative measures including a broad work from home policy. We aggressively deployed technology and training to enable team members to perform high-quality customer service, accurate processing and other tasks previously undertaken in the office. For the small number of our employees supporting essential business functions whose job cannot be done from home, we implemented aggressive “social distancing” and best-practice hygiene measures in our facilities.
For the millions of student loan borrowers we serve, we swiftly implemented unprecedented relief programs initiated by the White House and Congress for Department of Education borrowers, and we created or deployed options to suspend payments to support FFELP and private credit borrowers. We also created a comprehensive webpage dedicated to providing information needed to access these programs during this crisis. The webpage is www.navient.com/Covid-19/.
Navient continued to support its communities in this time of need and has donated thousands of N95 respirator masks to medical facilities in 19 communities.
The company’s transformation was possible because of our careful business continuity planning and preparation. Our detailed plans allowed for quick action, creativity and flexibility in who and where we worked, to how we continuously met the needs of our customers and clients.
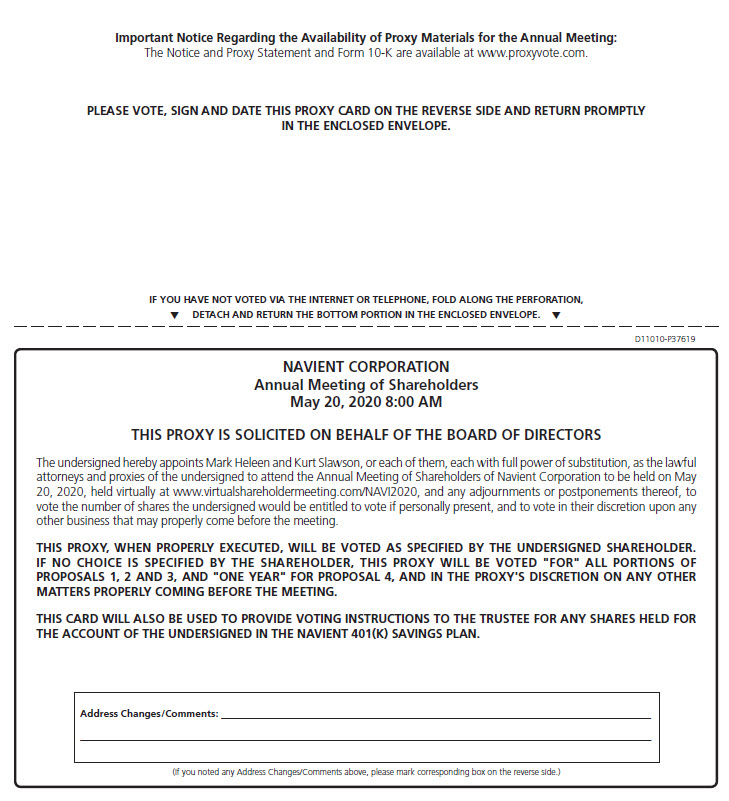
Navient’s 2020 Annual Meeting of Shareholders will be held virtually via the Internet on Wednesday, May 20, 2020 at 8:00
a.m. Eastern Daylight Time, to protect the safety and well-being of our shareholders and employees in light of the COVID- 19 outbreak.
At our Annual Meeting, we will consider the matters described in this proxy statement. We also look forward to reviewing with you significant developments since last year’s meeting—including substantial progress in improving customer experience and efficiency, and working to accelerate future growth. 2019 was an excellent year on many fronts and we are working across the entire company to do our best in 2020 as we face new challenges together.
We are again making our proxy materials available to you electronically. We hope that this continues to offer you a convenient way to review the materials while allowing us to reduce our environmental footprint and expense.
The proxy statement contains important information and you should read it carefully. Your vote is important, and we strongly encourage you to vote your shares using one of the voting methods described in the proxy statement.
We wish you good health and safety.
 |  |
John (Jack) F. Remondi President and Chief Executive Officer | Linda A. Mills Chair of the Board of Directors |

123 Justison Street
Wilmington, Delaware 19801
April 9, 2020
NOTICE OF 2020 ANNUAL MEETING OF SHAREHOLDERS OF
NAVIENT CORPORATION
To Our Shareholders:
Navient Corporation (“Navient” or the “Company”) will hold its 2020 Annual Meeting of Shareholders (the “Annual Meeting”) as follows:
| Date: | Wednesday, May 20, 2020 | |
| Time: | 8:00 a.m., Eastern Daylight Time | |
| Access: | Meeting Live via the Internet Please visit www.virtualshareholdermeeting.com/NAVI2020 | |
Items of Business: | ||
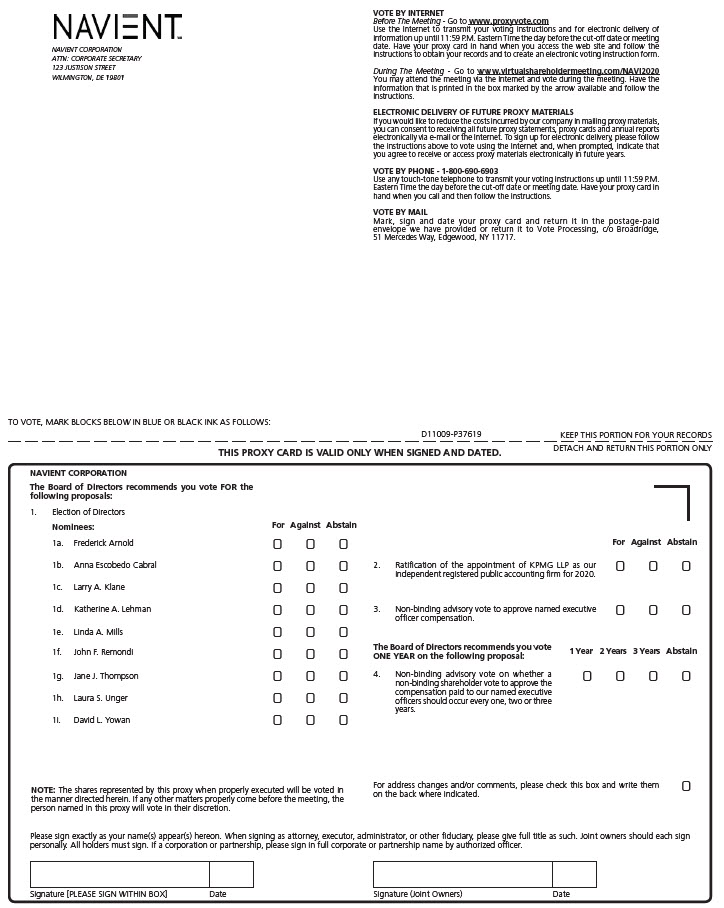
| (1) | Elect the 9 nominees named in the proxy statement to serve as directors for one-year terms or until their successors have been duly elected and qualified; | |
| (2) | Ratify the appointment of KPMG LLP as Navient’s independent registered public accounting firm for 2020; | |
| (3) | Approve, in a non-binding advisory vote, the compensation paid to Navient’s named executive officers; | |
| (4) | To hold a non-binding advisory vote on whether a shareholder vote to approve the compensation paid to our named executive officers should occur every one, two or three years; | |
| (5) | Act on such other business as may properly come before the Annual Meeting or any adjournment or postponement of the meeting. |
Record Date:
You may vote if you were a shareholder of record as of the close of business on March 23, 2020.
In the interest of the health and well-being of our shareholders and our employees, and taking into account the protocols of federal, state and local governments, we have determined that the 2020 Annual Meeting will be held in a virtual meeting format only, via the Internet, with no physical in-person meeting. If you plan to participate in the virtual meeting, please refer to instructions on page 6 of this proxy statement.
Your participation in the Annual Meeting is important. You can vote by telephone, Internet or, if you request that proxy materials be mailed to you, by completing and signing the proxy card enclosed with those materials and returning it in the envelope provided. If you wish to attend and participate in the virtual meeting, you must provide evidence of your ownership as of March 23, 2020, or a valid proxy showing that you are representing a shareholder who owned shares as of that date.
Thank you for your interest in Navient.
| By Order of the Board of Directors, | |
 | |
Mark L. Heleen Secretary |
Important Notice Regarding the Availability of Proxy Materials for the Annual Meeting of Shareholders to be Held on May 20, 2020.
This notice and proxy statement and our Annual Report on Form 10-K for the year ended December 31, 2019 (the “ Form 10-K”) are available free of charge at https://www.navient.com/about/investors/stockholderinfo and http://materials.proxyvote.com.
You may also obtain these materials at the Securities and Exchange Commission (“SEC”) website at www.sec.gov or by contacting the Office of the Corporate Secretary, 123 Justison Street, Wilmington, Delaware 19801. Navient will provide a copy of the 2019 Form 10-K without charge to any shareholder upon written request.
Except to the extent specifically referenced herein, information contained or referenced on our
website is not incorporated by reference into and does not form a part of this proxy statement.
CAUTIONARY STATEMENT REGARDING FORWARD-LOOKING STATEMENTS
Our shareholder letter and this proxy statement contain forward-looking statements, within the meaning of the Federal securities laws, about our business and prospects. These forward-looking statements are subject to risks and uncertainties and are based on the beliefs and assumptions of our management based on information currently available. Use of words such as “believes,” “expects,” “anticipates,” “intends,” “plans,” “should,” “may,” “could,” “likely” or similar expressions are intended to identify forward-looking statements, although not all forward-looking statements contain these words. Our future results may differ materially from our past results and from those projected in the forward-looking statements due to various uncertainties and risks, including, but not limited to, those described in Item 1A of Part I (Risk Factors) of our 2019 Form 10-K and our Form 10-Q for the quarter ending March 31, 2020. We disclaim any obligation to update any forward-looking statements contained herein after the date of this proxy statement.
Table of Contents
| PROXY SUMMARY | 1 | |
Annual Meeting of Shareholders | 1 | |
Meeting Agenda Voting Matters | 1 | |
Board and Governance Practices | 2 | |
Board of Directors Composition | 3 | |
Our Director Nominees | 4 | |
| GENERAL INFORMATION | 5 | |
QUESTIONS AND ANSWERS ABOUT THE ANNUAL MEETING AND VOTING | 6 | |
| OVERVIEW OF PROPOSALS | 11 | |
PROPOSAL 1 — ELECTION OF DIRECTORS | 12 | |
| CORPORATE GOVERNANCE | 20 | |
Role and Responsibilities of the Board of Directors | 20 | |
| Board Governance Guidelines | 20 | |
Board Leadership Structure | 21 | |
Board Succession Planning | 21 | |
Management Succession Planning | 21 | |
Director Independence | 22 | |
Board of Directors Meetings and Attendance at Annual Meeting | 22 | |
Committee Membership | 22 | |
Compensation Consultant and Independence | 25 | |
Compensation Committee Interlocks and Insider Participation | 25 | |
The Board of Directors’ Role in Risk Oversight | 26 | |
| Risk Assessment of Compensation Policies | 28 | |
Nominations Process | 28 | |
Proxy Access | 29 | |
| Director Orientation and Continuing Education | 30 | |
Shareholder Engagement and Communications with the Board | 30 | |
Policy on Political Contributions, Disclosure and Oversight | 31 | |
Code of Business Conduct | 31 | |
Policy on Review and Approval of Transactions with Related Parties | 31 | |
DIRECTOR COMPENSATION | 32 | |
| Director Compensation Elements | 32 | |
Share Ownership Guidelines | 32 | |
Anti-Hedging and Pledging Policy | 33 | |
Policy on Rule 10b5-1 Trading Plans | 33 | |
Other Compensation | 33 | |
Deferred Compensation Plan for Directors | 33 | |
| Director Compensation Table | 34 | |
PROPOSAL 2 — RATIFICATION OF THE APPOINTMENT OF THE INDEPENDENT REGISTERED PUBLIC ACCOUNTING FIRM | 36 | |
INDEPENDENT REGISTERED PUBLIC ACCOUNTING FIRM | 37 | |
Fees Paid to Independent Registered Public Accounting Firms for 2019 and 2018 | 37 | |
Pre-approval Policies and Procedures | 37 | |
REPORT OF THE AUDIT COMMITTEE | 38 | |
| OWNERSHIP OF COMMON STOCK | 39 | |
OWNERSHIP OF COMMON STOCK BY DIRECTORS AND EXECUTIVE OFFICERS | 40 | |
EXECUTIVE OFFICERS | 42 | |
PROPOSAL 3 — ADVISORY VOTE ON EXECUTIVE COMPENSATION | 43 | |
PROPOSAL 4 — ADVISORY VOTE ON SAY-ON-PAY FREQUENCY | 44 | |
EXECUTIVE COMPENSATION | 45 | |
Compensation and Personnel Committee Report | 45 | |
Compensation Discussion and Analysis | 46 | |
Summary Compensation Table | 66 | |
Grants of Plan-Based Awards | 67 | |
Outstanding Equity Awards at Fiscal Year End | 68 | |
Option Exercises and Stock Vested | 70 | |
Pension Benefits | 70 | |
| Non-Qualified Deferred Compensation | 70 | |
| Arrangements with Named Executive Officers | 71 | |
Potential Payments upon Termination or Change in Control | 72 | |
Actual Payments Upon Termination | 74 | |
CEO Pay Ratio | 74 | |
OTHER MATTERS | 75 | |
Certain Relationships and Related Transactions | 75 | |
Other Matters for the 2020 Annual Meeting | 75 | |
| Shareholder Proposals for the 2021 Annual Meeting | 75 | |
Proxy Access Procedures | 76 | |
Solicitation Costs | 76 | |
Householding | 76 | |
Proxy Summary
This summary is intended as an overview of the information found elsewhere in this proxy statement. Because this is only a summary, you should read the entire proxy statement before voting.
Annual Meeting of Shareholders
| DATE AND TIME: | LOCATION: | RECORD DATE: |
May 20, 2020 8:00 a.m. local time | Virtual Meeting Only Live via the Internet Please Visit www.virtualshareholdermeeting.com/NAVI2020 | March 23, 2020 |
Meeting Agenda Voting Matters
This year, there are four Company-sponsored proposals on the agenda.
Election of a director nominee pursuant to Proposal 1 will require the vote of a majority of the votes cast with respect to that director nominee’s election, meaning that the number of votes cast for such director nominee’s election must exceed the number of votes cast against that nominee’s election (with abstentions and broker non-votes not counted as votes cast either for or against the nominee’s election).
Approval of Proposals 2 and 3 at the Annual Meeting will require an affirmative vote of at least a majority of the votes present, represented and entitled to be voted on the matter, and voting affirmatively or negatively. With respect to Proposal 4, the frequency of the non-binding advisory vote on compensation paid to our named executive officers (namely, every one, two or three years) receiving the greatest number of votes will be considered the frequency recommended by shareholders.
Proposals | Board Voting Recommendations | Page | |
| 1. | Election of each director nominee | FOR EACH NOMINEE | 12 |
| 2. | Ratification of the appointment of KPMG as Navient’s independent registered public accounting firm for 2020 | FOR | 36 |
| 3. | Non-binding advisory shareholder vote to approve the compensation paid to our named executive officers | FOR | 43 |
| 4. | Non-binding advisory shareholder vote on whether a non-binding advisory shareholder vote to approve the compensation paid to our named executive officers should occur every one, two or three years | ONE YEAR | 44 |
 | 2020 Proxy Statement |  | 1 |
Board and Governance Practices
We believe our corporate governance policies reflect best practices.
In addition to executive compensation practices that strongly link pay and performance, Navient’s Code of Business Conduct and Board of Directors governance policies help to ensure that we meet high standards of ethical behavior, corporate governance and business conduct. The following chart highlights key Board information and governance practices in place on December 31, 2019.
| Separate Chair and CEO | Yes | |
| Average Age of Directors | 60 | |
| Number of Independent Directors | 9 | |
| Annual Elections of Directors | Yes | |
| Majority Voting for Directors (uncontested elections) | Yes | |
| Board Meetings Held in 2019 (average director attendance 94.8%) | 32 | |
| Annual Self-Evaluation of the Board and Each Committee | Yes | |
| Annual Equity Grant to Directors | Yes | |
| Director Stock Ownership Guidelines | Yes | |
| Independent Directors Meet without Management Present | Yes | |
| Mandatory Retirement Age for Directors | Yes | |
| Tenure Limit for Directors | Yes | |
| Proxy Access | Yes | |
| Anti-Hedging and Anti-Pledging Policy | Yes | |
| Code of Business Conduct for Directors and Officers | Yes | |
| Enhanced Compensation Recovery/Clawback Policy | Yes | |
| Annual Advisory Approval of Executive Compensation | 94% | |
| Independent Compensation Consultant | Yes | |
| Double-Trigger Change in Control | Yes | |
| Active Board and Management Succession and Planning | Yes | |
| Executive Stock Ownership Guidelines | Yes | |
| No Employment Agreements for Executives | Yes | |
| No Excessive Perquisites | Yes | |
| No Above-Market Earnings on Deferred Compensation | Yes |
For more information about our governance programs and our Board of Directors, see Proposal 1 beginning on page 12.
| 2020 Proxy Statement | | 2 |
Board of Directors Composition
The composition of our Board reflects a breadth and variety of skills, business experiences and backgrounds.
The composition of our Board reflects the great wealth of experience and skills of our directors. The following table highlights each director’s specific skills, knowledge and experiences that he or she brings to the Board. A particular director may possess additional skills, knowledge or experience even though they are not indicated below.
Frederick Arnold | Marjorie L. Bowen (1) | Anna Escobedo Cabral | Larry A. Klane (1) | Katherine A. Lehman | Linda A. Mills | John (Jack) F. Remondi | Jane J. Thompson | Laura S. Unger | David L. Yowan | ||
| Skills and Experience | |||||||||||
| Board of Directors Experience | X | X | X | X | X | X | X | X | X | X | |
Industry Experience (2) | X | X | X | X | X | X | X | ||||
| Executive Leadership | X | X | X | X | X | X | X | X | X | X | |
| Business Operations | X | X | X | X | X | X | X | X | |||
| Finance/Capital Allocation | X | X | X | X | X | X | X | X | X | ||
Financially Literate (3) | X | X | X | X | X | X | X | X | X | X | |
Audit Committee Financial Expert (4) | X | X | X | X | X | X | |||||
| Regulatory/Policy/Legal | X | X | X | X | X | X | X | ||||
| Mergers/Acquisitions | X | X | X | X | X | X | X | X | X | ||
| Higher Education | X | X | X | X | |||||||
| Human Capital Management/Compensation | X | X | X | X | X | X | X | X | |||
| Corporate Governance | X | X | X | X | X | X | X | X | X | X | |
| Technology/Systems | X | X | X |
| Board Gender Diversity | Director Age Distribution | Director Tenure |
 |  |  |
| (1) | Ms. Bowen and Mr. Klane joined the Board on May 1, 2019. Ms. Bowen is not being nominated by the Board for reelection, and her tenure as a director will end when her current term expires at our 2020 Annual Meeting. |
| (2) | Directors with professional experience in the financial services, consumer lending or business processing services industries. |
| (3) | Directors who are able to read and understand financial statements. |
| (4) | Directors determined by the Board to be audit committee financial experts, as that term is defined under rules promulgated by the SEC. |
| 2020 Proxy Statement | | 3 |
Our Director Nominees
| Director | Standing Committee Memberships(3) | Other Public | ||||||||
| Name | Age(1) | Since(2) | Occupation and Experience | Independent | EC | AC | CC | NGC | FOC | Boards |
| Frederick Arnold | 66 | 2018 | Financial Executive | Yes | M | M | 1 | |||
| Anna Escobedo Cabral | 60 | 2014 | Partner, Cabral Group, LLC | Yes | M | C | M | 0 | ||
| Larry A. Klane | 59 | 2019 | Co-Founding Principal, Pivot Investment Partners LLC | Yes | M | M | 0 | |||
| Katherine A. Lehman | 45 | 2014 | Managing Partner, Hilltop Private Capital, Private Equity Investor | Yes | M | M | C | 1 | ||
| Linda A. Mills | 70 | 2014 | President, Cadore Group LLC | Yes | C | 1 | ||||
| John (Jack) F. Remondi | 57 | 2013 | President and Chief Executive Officer, Navient | No | M | 1 | ||||
| Jane J. Thompson | 68 | 2014 | CEO, Jane J. Thompson Financial Services | Yes | M | C | M | 2 | ||
| Laura S. Unger | 59 | 2014 | President, Unger, Inc. | Yes | M | M | C | 2 | ||
| David L Yowan | 63 | 2017 | EVP and Corporate Treasurer American Express Company | Yes | M | M | 0 | |||
| (1) | Ages are as of April 9, 2020. |
| (2) | For purposes of this chart and the director tenure chart on the immediately preceding page, we are considering a Director’s prior service with SLM Corporation and its publicly held predecessors prior to our separation transaction in 2014. |
| (3) | Membership as of December 31, 2019. |
| EC | Executive Committee | NGC | Nominations and Governance Committee | C | Chair |
| AC | Audit Committee | FOC | Finance and Operations Committee | M | Member |
| CC | Compensation and Personnel Committee |
Additional information about our director nominees, including summaries of their business and leadership experience, skills and qualifications, can be found in the director biographies that begin on page 13 of this proxy statement.
| 2020 Proxy Statement | | 4 |
General Information
Navient Corporation (“Navient,” the “Company,” “we,” “our” or “us”) is furnishing this proxy statement to solicit proxies on behalf of the Board of Directors (the “Board of Directors” or “Board”) for use at our 2020 Annual Meeting of Shareholders (the “Annual Meeting”). Due to the ongoing public health impact of the novel coronavirus outbreak (COVID-19), this year’s Annual Meeting will be a virtual meeting conducted solely via live webcast. You will be able to attend the Annual Meeting, vote your shares electronically, and submit questions during the meeting by visiting a special website established for this purpose: www.virtualshareholdermeeting.com/NAVI2020. You will not be able to attend the Annual Meeting in person. A copy of the Notice of 2020 Annual Meeting of Shareholders accompanies this proxy statement. This proxy statement is being sent or made available, as applicable, to our shareholders beginning on or about April 9, 2020.
| 2020 Proxy Statement | | 5 |
Questions and Answers about the Annual Meeting and Voting
Why is this year’s Annual Meeting being held as a virtual only meeting?
This year’s Annual Meeting is being held as a virtual only meeting due to the ongoing public health impact of the coronavirus outbreak (COVID-19) and to support the health and well-being of our stockholders, employees and community members. Holding the Annual Meeting as a virtual only meeting allows us to reach the broadest number of stockholders while maintaining our commitment to health and safety.
Who is entitled to attend and vote at the Annual Meeting?
Only shareholders who owned shares of Navient’s Common Stock, par value $0.01 per share (“Common Stock”), at the close of business on March 23, 2020, the record date for the Annual Meeting, are entitled to notice of, and to vote at, the Annual Meeting. Navient’s Common Stock is listed on the Nasdaq Stock Market (“Nasdaq”) under the symbol “NAVI.” On March 23, 2020, 193,814,038 shares of Common Stock were outstanding and eligible to be voted. Each share of Common Stock is entitled to one vote with respect to each matter on which holders of Common Stock are entitled to vote.
How do I attend the Annual Meeting?
This year’s Annual Meeting will be a virtual only meeting conducted solely via live webcast.
To participate in the Annual Meeting, visit www.virtualshareholdermeeting.com/NAVI2020 and enter the sixteen-digit control number included on your Notice of Internet Availability of Proxy Materials or your proxy card. The live webcast will begin at 8:00 a.m. EDT on Wednesday, May 20, 2020. We encourage you to access the virtual meeting platform at least 15 minutes prior to the start time. If you do not have a sixteen-digit control number, you will still be able to access the webcast as a guest, but will not be able to vote your shares or ask a question during the meeting.
The virtual meeting platform is fully supported across browsers (Internet Explorer, Firefox, Chrome and Safari) and devices (desktops, laptops, tablets and mobile phones) running the most updated version of applicable software and plugins. Participants should ensure they have a strong WiFi connection wherever they intend to participate in the meeting. Further instructions on how to attend and participate in the Annual Meeting, including how to demonstrate proof of stock ownership, will be posted on the virtual meeting website.
We will have technicians ready to assist you with any technical difficulties you may have accessing the virtual meeting. Technical support will be available on the virtual meeting platform beginning at 7:00 a.m. EDT on the day of the meeting and will remain available until thirty minutes after the meeting has finished.
Why did I receive a “Notice Regarding the Availability of Proxy Materials”?
Navient furnishes proxy materials to its shareholders primarily via the Internet, instead of mailing printed copies of those materials to each shareholder. By doing so, we save money and reduce our environmental impact. On or about April 9, 2020, Navient will mail a Notice of Internet Availability of Proxy Materials (“Notice of Internet Availability”) to certain of the Company’s shareholders. The Notice of Internet Availability contains instructions on how to access Navient’s proxy materials and vote online or vote by telephone. The Notice of Internet Availability also contains a 16-digit control number that you will need to vote your shares. If you previously chose to receive Navient’s proxy materials electronically, you will continue to receive access to these materials via an e-mail that provides electronic links to these documents unless you elect otherwise.
| 2020 Proxy Statement | 6 |
How do I request paper copies of the proxy materials?
You may request paper copies of the proxy materials for the Annual Meeting by following the instructions included on your Notice of Internet Availability or listed at www.proxyvote.com, by telephoning 1-800-579-1639, or by sending an e-mail to sendmaterial@proxyvote.com.
What is the difference between holding shares as a beneficial owner in street name and as a shareholder of record?
If your shares are held in street name through a broker, bank, trustee or other nominee, you are considered the beneficial owner of those shares. As the beneficial owner, you have the right to direct your broker, bank, trustee or other nominee how to vote your shares. Without your voting instructions, your broker, bank, trustee or other nominee may only vote your shares on proposals considered to be routine matters. The only routine matter being considered at the Annual Meeting is Proposal 2 (relating to the ratification of the independent registered public accounting firm). Proposals 1, 3 and 4 are considered non- routine matters. For non-routine matters, your shares will not be voted without your specific voting instructions. We encourage you to vote your shares.
If your shares are registered directly in your name with Navient’s transfer agent, Computershare, you are considered to be a shareholder of record with respect to those shares. As a shareholder of record, you have the right to grant your voting proxy directly to Navient’s Board of Directors or to a third party, or to vote at the Annual Meeting.
What if I hold my shares in street name and I do not provide my broker, bank, trustee or other nominee with instructions about how to vote my shares?
You may instruct your broker, bank, trustee or other nominee on how to vote your shares using any of the methods described above. If you do not provide them with instructions on how to vote your shares prior to the Annual Meeting, they will have discretionary authority to vote your shares only with respect to routine matters. Only Proposal 2 (relating to the ratification of the independent registered public accounting firm) is considered to be a routine matter, and your broker, bank, trustee or other nominee will not have discretion to vote your shares with respect to Proposals 1, 3 or 4. If you do not give your instructions on how to vote your shares on Proposals 1, 3 or 4, your shares will then be referred to as “broker non-votes” and will not be counted in determining whether any of Proposals 1, 3 or 4 is approved. Please participate in the election of directors and vote on all the proposals by returning your voting instructions to your broker, bank, trustee or other nominee.
How do I vote shares of Common Stock held in my 401(k) Plan?
If you participate in the Navient 401(k) Savings Plan, you may vote the number of shares equivalent to your interest in the plan’s company stock fund, if any, as credited to your account on the record date. You will need to instruct the 401(k) Savings Plan trustee by telephone, internet or by mail on how to vote your shares. Voting instructions must be received no later than 5:00 p.m., Eastern Daylight Time, on May 15, 2020. If you own shares through the Navient 401(k) Savings Plan and do not provide voting instructions with respect to your plan shares, the trustee will vote your plan shares on each proposal in the same proportion as other plan shares are being voted.
| 2020 Proxy Statement | 7 |
How do I vote?
Navient encourages shareholders to vote in advance of the Annual Meeting, even if you plan to attend the Annual Meeting. You may vote in one of the following ways:
| VOTE BY INTERNET BEFORE THE MEETING |  | Vote your shares at www.proxyvote.com. Votes submitted via the Internet must be received by 11:59 p.m., Eastern Daylight Time, on May 19, 2020. Please have your Notice of Internet Availability or proxy card available when you log on. |  | If you hold shares directly in your name as a shareholder of record, you may either vote or be represented by another person at the Annual Meeting by executing a legal proxy designating that person as your proxy to vote your shares. If you hold your shares in street name, you must obtain a legal proxy from your broker, bank, trustee or other nominee and present it to the inspector of elections with your ballot to be able to vote at the Annual Meeting. To request a legal proxy, please follow the instructions at www.proxyvote.com | |||
| VOTE BY PHONE |  | Call the toll-free number (1-800-690-6903). You may call this toll-free telephone number, which is available 24-hours a day, and follow the pre-recorded instructions. Please have your Notice of Internet Availability or proxy card available when you call. If you hold your shares in street name, your broker, bank, trustee or other nominee may provide you additional instructions regarding voting your shares by telephone. Votes submitted telephonically must be received by 11:59 p.m., Eastern Daylight Time, on May 19, 2020. | |||||
| VOTE BY MAIL |  | If you hold your shares in a street name through a broker, bank, trustee or other nominee and want to vote by mail, you must request paper copies of the proxy materials. Once you receive your paper copies, you will need to complete, sign and date the voting instruction form and return it in the prepaid return envelope provided. Your voting instruction form must be received no later than the close of business on May 19, 2020. | |||||
| VOTE BY INTERNET DURING THE MEETING |  | Go to www.virtualshareholdermeeting.com/NAVI2020. | |||||
| Vote must be submitted by the close of polls during the Annual Meeting. | |||||||
| 2020 Proxy Statement | 8 |
How do proxies work?
Navient’s Board of Directors is requesting your proxy. Giving your proxy means that you authorize the persons named as proxies therein to vote your shares at the Annual Meeting in the manner you specify in your proxy (or to exercise their discretion as described herein). If you hold your shares as a record holder and sign and return a proxy card but do not specify how to vote on a proposal, the persons named as proxies will vote your shares in accordance with the Board of Directors’ recommendations. The Board of Directors has recommended that shareholders vote:
| • | “FOR” the election of each of the director nominees named in Proposal 1; |
| • | “FOR” ratification of the appointment of Navient’s independent registered public accounting firm, as set forth in Proposal 2; |
| • | “FOR” approval, on a non-binding advisory basis, of the compensation paid to our named executive officers as set forth in this proxy statement as Proposal 3; and |
| • | “ONE YEAR” on a non-binding advisory basis as to whether a non-binding advisory shareholder vote to approve the compensation paid to our named executive officers should occur every one, two or three years. |
Giving your proxy also means that you authorize the persons named as proxies to vote on any other matter properly presented at the Annual Meeting in the manner they determine is appropriate. Navient does not know of any other matters to be presented at the Annual Meeting as of the date of this proxy statement.
Can I change my vote?
Yes. If you hold your shares as a record holder, you may revoke your proxy or change your vote at any time prior to the final tallying of votes by:
| • | Delivering a written notice of revocation to Navient’s Corporate Secretary at the Office of the Corporate Secretary, 123 Justison Street, Wilmington, Delaware 19801; |
| • | Submitting another timely vote via the Internet, by telephone or by mailing a new proxy (following the instructions listed under the “How do I vote?” section above); or |
| • | If you are eligible to vote during the Annual Meeting, you also can revoke your proxy or voting instructions and change your vote during the Annual Meeting by logging into the website at www.virtualshareholdermeeting.com/NAVI2020 and following the voting instructions. |
If your shares are held in street name, you need to contact your broker, bank, trustee or nominee for instructions on how to revoke or change your voting instructions. Virtual attendance at the Annual Meeting constitutes presence in person for purposes of quorum at the Annual Meeting.
What constitutes a quorum?
A quorum of shareholders is necessary to transact business at the Annual Meeting. A quorum will exist when the holders of a majority of the shares of Common Stock entitled to vote are deemed present or represented by proxy, including proxies on which abstentions (withholding authority to vote) are indicated. Abstentions and broker non-votes will be counted in determining whether a quorum exists.
| 2020 Proxy Statement | 9 |
What vote is necessary to approve each matter to be voted on at the Annual Meeting?
The following table provides a summary of the voting criteria for the Board’s voting recommendations for the matters on the agenda for the 2020 Annual Meeting:
| Proposal | Voting Options | Vote Required for Approval | Abstentions | Broker Non-Votes | Broker Discretionary Vote Permitted | Board's Voting Recommendation | |
| 1. | Election of Directors | "FOR" or "AGAINST" | Affirmative vote of the holders of a majority of the votes cast. | NOT COUNTED | NOT COUNTED | NO | FOR the election of each of the director nominees |
| 2. | Ratify the appointment of KPMG LLP as Navient’s independent registered public accounting firm for 2020 | "FOR" or "AGAINST" or "ABSTAIN" from voting | Affirmative vote of the holders of a majority of shares deemed present or represented by proxy and entitled to vote on the proposal. | COUNTED as votes Against | NOT COUNTED | YES | FOR |
| 3. | Approve, in a non- binding advisory vote, the compensation paid to Navient’s named executive officers | "FOR" or AGAINST" or ABSTAIN" from voting | Affirmative vote of the " holders of a majority " of shares deemed present or represented by proxy and entitled to vote on the proposal. | COUNTED as votes Against | NOT COUNTED | NO | FOR |
| 4. | Non-binding advisory vote as to whether a non-binding advisory vote to approve the compensation paid to our named executive officers should occur every one, two or three years | “ONE YEAR” or “TWO YEARS” or “THREE YEARS” or “ABSTAIN” from voting | Affirmative vote of the holders of a plurality of shares deemed present or represented by proxy and entitled to vote on the proposal. | NOT COUNTED | NOT COUNTED | NO | ONE YEAR |
Who will count the vote?
Votes will be tabulated by an independent inspector of elections.
Who can attend the Annual Meeting?
Only shareholders as of the record date, March 23, 2020, or their duly appointed proxies, may attend. No guests will be allowed to attend the Annual Meeting.
| 2020 Proxy Statement | 10 |
Overview of Proposals
This proxy statement contains four proposals requiring shareholder action, each of which is discussed in more detail below.
| • | Proposal 1 requests the election of the director nominees named in this proxy statement to the Board of Directors. |
| • | Proposal 2 requests ratification of the appointment of KPMG LLP as Navient’s independent registered public accounting firm for the fiscal year ending December 31, 2020. |
| • | Proposal 3 requests the approval, in a non-binding advisory vote, of the compensation paid to our named executive officers as set forth in this proxy statement. |
| • | Proposal 4 requests a recommendation, in a non-binding advisory vote, as to whether a non-binding advisory vote to approve the compensation paid to our named executive officers should occur every one, two or three years. |
| 2020 Proxy Statement | 11 |
Proposal 1 — Election of Directors
Under the Navient Bylaws (the “Bylaws”), the Board of Directors has the authority to determine the size of the Board of Directors and to fill any vacancies that may arise prior to the next annual shareholder meeting. Although the Board has the authority to change its size at any time, the Board set the size of our Board at 9 on April 6, 2020.
On April 6, 2020, the Nominations and Governance Committee recommended and the Board of Directors nominated the following directors for election at the Annual Meeting:
Frederick Arnold
Anna Escobedo Cabral
Larry A. Klane
Katherine A. Lehman
Linda A. Mills
John (Jack) F. Remondi
Jane J. Thompson
Laura S. Unger
David L. Yowan
Biographical information and qualifications and experience for each nominee appears beginning on the next page.
In addition to fulfilling the general criteria for director nominees described in the section titled “Nominations Process,” each nominee possesses experience, skills, attributes and other qualifications that the Board of Directors has determined support its oversight of Navient’s business, operations and structure. These qualifications are discussed beginning on the next page along with biographical information regarding each member of the Board of Directors being nominated, including each individual’s age, principal occupation and business experience during the past five years. Information concerning each director is based in part on information received from him or her and in part from Navient’s records.
All nominees listed above have consented to being named in this proxy statement and to serve if elected. Should any nominee subsequently decline or be unable to accept such nomination to serve as a director, an event that the Board of Directors does not now expect, the Board of Directors may designate a substitute nominee or the persons voting the shares represented by proxies solicited hereby may vote those shares for a reduced number of nominees. If the Board of Directors designates a substitute nominee, persons named as proxies will vote “FOR” that substitute nominee.
Navient’s Bylaws generally provide that the election of a director nominee will be by a majority of the votes cast and voting affirmatively or negatively with respect to the nominee at a meeting for the election of directors at which a quorum is present. Accordingly, a director nominee will be elected to the Board of Directors if the number of shares voted “FOR” the nominee exceeds the number of votes cast “AGAINST” the nominee’s election, without regard to abstentions or broker non-votes. Shares that are not voted affirmatively or negatively in the election of directors, including abstentions and broker non-votes, have no direct effect in the election of directors. Those shares, however, are taken into account in determining whether a sufficient number of shares are present to establish a quorum.
If any director nominee fails to receive a majority of the votes cast “FOR” in an uncontested election, that nominee has agreed to automatically tender his or her resignation upon certification of the election results. If such an event were to occur, Navient’s Nominations and Governance Committee will make a recommendation to the Board of Directors on whether to accept or reject such nominee’s resignation. The Board of Directors will act on the recommendation of the Nominations and Governance Committee and publicly disclose its decision and the rationale behind it within 90 days from the date of certification of the election results.
| 2020 Proxy Statement | 12 |
NOMINEES FOR ELECTION TO THE BOARD OF DIRECTORS
Name and Age Service as a Director | Position, Principal Occupation, Business Experience and Directorships |
 Jack Remondi, 57 Director since May 2013 | President and Chief Executive Officer Navient Corporation Directorships of Other Public Companies: CubeSmart Real Estate Investment Trust (NYSE: CUBE) — 2009 to present Former Directorships of Other Public Companies: SLM Corporation Other Professional and Leadership Experience: Chairman, Reading is Fundamental Trustee, Nellie Mae Education Foundation Skills, Experience and Qualifications: Mr. Remondi has been the Company’s President and Chief Executive Officer since April 2014. He was SLM Corporation’s President and Chief Executive Officer from May 2013 to April 2014, President and Chief Operating Officer from January 2011 to May 2013 and its Vice Chairman and Chief Financial Officer from January 2008 to January 2011. Mr. Remondi has a nearly 30-year history in the student loan and business services industry with Navient and its predecessors, in a variety of leadership roles, including as chief executive officer, chief operating officer and chief financial officer. He has the in-depth knowledge of our industry, customers, investors and competitors, as well as the relationships, to lead our company. Mr. Remondi brings to our Board of Directors a unique historical perspective of Navient, its operations and the evolution of the student loan industry, and he provides valuable insights to our Board in the areas of finance, accounting, portfolio management, business operations and student/consumer lending. |
| 2020 Proxy Statement | 13 |
Name and Age Service as a Director | Position, Principal Occupation, Business Experience and Directorships |
 Linda Mills, 70 Chair of the Board since June 2019 Director since May 2014 | President Cadore Group LLC Business Experience: President, Cadore Group LLC, a management and IT consulting company — 2015 to present Corporate Vice President, Operations, Northrop Grumman — 2013 to 2015 Corporate Vice President & President, Information Systems and Information Technology Sectors, Northrop Grumman — 2008 to 2012 Directorships of Other Public Companies: American International Group, Inc. (NYSE: AIG) — 2015 to present Other Professional and Leadership Experience: Board Member, Smithsonian National Air & Space Museum Senior Advisory Group and Former Board Member, Northern Virginia Technology Council Former Board Member, Wolf Trap Foundation for the Performing Arts Skills, Experience and Qualifications: Ms. Mills’ extensive experience in leading businesses and operations for large, complex multinational companies brings a valuable perspective to our Board of Directors in the areas of operations, financial management, strategic re-positioning, risk management, technology, federal, state and local government contracting, and cybersecurity risk. Through insights gained as a director on the board of another large, publicly traded corporation in a highly regulated industry, as well as her service on many nonprofit boards, Ms. Mills brings a unique and wide range of valuable strategic and operational perspectives to our Board. |
| 2020 Proxy Statement | 14 |
Name and Age Service as a Director | Position, Principal Occupation, Business Experience and Directorships |
 Frederick Arnold, 66 Director since August 2018 | Financial Executive Business Experience: Chief Financial Officer, Convergex Group, LLC — July 2015 to May 2017 Executive Vice President and Chief Financial Officer, Capmark Financial Group, Inc. — September 2009 to January 2011 Executive Vice President of Finance, Masonite Corporation — February 2006 to September 2007 Executive Vice President, Strategy and Development, Willis North America — 2001 to 2003 Chief Administrative Officer, Willis Group Holdings Ltd. — 2000 to 2001 Chief Financial and Administrative Officer, Willis North America — 2000 Directorships of Other Public Companies: Valaris plc (NYSE: VAL) — 2019 to Present Former Directorships of Other Public Companies: Syncora Holdings Ltd. FS KKR Capital Corp. Corporate Capital Trust CIFC Corp. Other Professional and Leadership Experience: Current Chairman of the Board, Lehman Brothers Holdings Inc. Director, Lehman Commercial Paper Inc. Skills, Experience and Qualifications: Mr. Arnold spent 20 years as an investment banker primarily at Lehman Brothers and Smith Barney, where he served as managing director and head of European corporate finance. His experience originating and executing mergers and acquisitions and equity financings across a wide variety of industries and geographies, as well as his other board experience, brings a valuable perspective to our Board of Directors. Subsequent to his employment at Lehman Brothers and Smith Barney, Mr. Arnold spent 15 years in various senior financial positions at a number of private equity-owned portfolio companies. |
| 2020 Proxy Statement | 15 |
Name and Age Service as a Director | Position, Principal Occupation, Business Experience and Directorships |
 Anna Escobedo Cabral, 60 Director since December 2014 | Partner Cabral Group, LLC Business Experience: Partner, Cabral Group — 2018 to present Senior Advisor, Inter-American Development Bank — 2009 to 2018 Treasurer of the United States, U.S. Department of the Treasury — 2004 to 2009 Director, Smithsonian Institution’s Center for Latino Initiatives — 2003 to 2004 CEO, Hispanic Association on Corporate Responsibility — 1999 to 2003 Staff Director & Chief Clerk, U.S. Senate Committee on the Judiciary — 1993 to 1999 Executive Staff Director, U.S. Senate Task Force on Hispanic Affairs — 1991 to 1999 Other Professional and Leadership Experience: Vice Chair, Hispanic Diversity Advisory Committee, Comcast NBCU Trustee, Jessie Ball duPont Fund Chair, BBVA Microfinance Foundation Board Former Member, NatureBridge Regional Advisory Committee Former Member, NatureBridge Board of Directors Former Chair, Financial Services Roundtable Retirement Security Council Former Member, Providence Hospital Foundation Board Former Member, American Red Cross Board of Directors Former Member, Sewall Belmont House Board of Directors Former Member, Martha’s Table Board of Directors Skills, Experience and Qualifications: Through her extensive experience in public policy, government, public affairs, corporate social responsibility, international development, and financial literacy, as well as her experience as a chief operating officer in the nonprofit sector, Ms. Cabral provides our Board with insights and judgment regarding regulatory policy and the political and legislative process. |
 Larry A. Klane, 59 Director since May 2019 | Co-Founding Principal Pivot Investment Partners LLC Business Experience: Global Financial Institutions Leader, Cerberus Capital Management — 2012 to 2013 Chair, Korea Exchange Bank — 2010 to 2012 CEO, Korea Exchange Bank — 2009 to 2012 President of Global Financial Services, Capital One — 2000 to 2008 Managing Director, Bankers Trust/Deutsche Bank — 1994 to 2000 Former Directorships of Other Public Companies: VeriFone Systems, Inc. Aozora Bank Ltd. Other Professional and Leadership Experience: Director, Goldman Sachs Bank USA Former Director, Nexi Group S.p.A. Former Director, Ethoca Limited Skills, Experience and Qualifications: Mr. Klane brings an important strategic and operational perspective to our Board given his extensive background in financial services and payment services, including his service in various leadership positions in the financial services industry. |
| 2020 Proxy Statement | 16 |
Name and Age Service as a Director | Position, Principal Occupation, Business Experience and Directorships |
 Katherine A. Lehman, 45 Director since November 2014 | Private Equity Investor Business Experience: Managing Partner, Hilltop Private Capital — 2016 to Present Managing Director and Deal Team Leader, Lincolnshire Management — 2009 to 2016 Other Investment Roles, Lincolnshire Management — 2001 to 2009 Directorships of Other Public Companies: Stella-Jones (TSX: SJ) — 2016 to present Chair of the Board Other Professional and Leadership Experience: Director, American Track Services Director, Spiral Holding Former Board Member, The Robert Toigo Foundation Former Board Member, True Temper Sports Former Board Member, Gruppo Fabbri Former Board Member, PADI Holding Company Former Board Member, Bankruptcy Management Solutions Skills, Experience and Qualifications: Ms. Lehman’s experience in private equity and financial services, along with her investment evaluation, portfolio oversight and board experience enable her to provide strategic and operational expertise in the areas of finance, review and analysis of investments, mergers and acquisitions, integration and operations, accounting and business, which assist our Board of Directors in evaluating our business and growth plans. |
| 2020 Proxy Statement | 17 |
Name and Age Service as a Director | Position, Principal Occupation, Business Experience and Directorships |
 Jane J. Thompson, 68 Director since March 2014 | Chief Executive Officer Jane J. Thompson Financial Services LLC Business Experience: Chief Executive Officer, Jane J. Thompson Financial Services LLC, a management consulting firm — 2011 to present President, Financial Services, Walmart Stores, Inc. — 2002 to 2011 Executive Vice President, Credit, Home Services, Online and Corporate Planning, Sears, Roebuck and Co. — 1988 to 1999 Consultant/Partner, McKinsey & Company — 1978 to 1988 Directorship of Other Public Companies: OnDeck Capital, Inc. (NYSE: ONDK) — 2014 to present Chair of Nominating Committee Mitek Systems, Inc. (Nasdaq: MITK) — 2017 to present Former Directorships of Other Public Companies: Blackhawk Network Holdings, Inc. VeriFone Systems, Inc. The Fresh Market Other Professional and Leadership Experience: Chair, Pangea Universal Holdings, Inc. Member, Commercial Club of Chicago Former Member and Chair, The Chicago Network Former Member and Board Member, The Economic Club of Chicago Former Member, Center for Financial Services Innovation Board Former Member, CFPB Consumer Advisory Board Former Member and Chair, Boys & Girls Clubs of Chicago Board Former Member, Lurie Children’s Hospital of Chicago Board of Trustees Former Trustee, Bucknell University Former Member, Corporate Advisory Board, Darden Graduate School of Business, University of Virginia Former Member, Corporate Advisory Board, Walton Graduate School of Business, University of Arkansas Skills, Experience and Qualifications: Ms. Thompson brings a unique depth and breadth of expertise to our Board of Directors in the areas of consumer behavior, financial services, consumer lending, finance and financial services regulation. She has extensive experience in consumer lending, as well as management experience with large, publicly traded businesses. Combined with other leadership roles in business—including service as a director of several public companies and as a member of various audit, compensation, risk management and governance committees—Ms. Thompson brings valuable insights to our Board in a variety of areas. |
| 2020 Proxy Statement | 18 |
Name and Age Service as a Director | Position, Principal Occupation, Business Experience and Directorships |
 Laura S. Unger, 59 Director since November 2014 | President Unger, Inc. Business Experience: President, Unger, Inc., a financial services consulting firm — 2018 to present Special Advisor, Promontory Financial Group — 2010 to 2014 Independent Consultant to JPMorgan — 2003 to 2009 Commissioner, U.S. Securities and Exchange Commission — 1997 to 2002 (including six months as Acting Chairman) Counsel, U.S. Senate Committee on Banking, Housing & Urban Affairs — 1990 to 1997 Directorships of Other Public Companies: CIT Group (NYSE: CIT) — 2010 to present Nomura Holdings, Inc. (NYSE: NMR) — 2018 to present Former Directorships of Other Public Companies: CA Technologies Ambac Financial Group, Inc. Other Professional and Leadership Experience: Board Member, Children’s National Medical Center Director, Nomura Securities, Inc. Director, Nomura Global Financial Products Skills, Experience and Qualifications: Ms. Unger has significant corporate governance expertise as a member or chair of boards and board committees of public companies and her service at the U.S. Securities and Exchange Commission. Her government, public policy and legal and regulatory experience, together with her extensive leadership experience at government agencies, provides our Board of Directors with perspectives into regulatory policy and the political and legislative process. |
 David L. Yowan, 63 Director since March 2017 | Consumer Financial Services Executive American Express Company Business Experience: Executive Vice President and Treasurer, American Express Company — 2006 to present Senior Treasury Management, American Express Company — 1999 to 2006 Senior Vice President, North American Consumer Bank Treasury, Citigroup — 1987 to 1998 Skills, Experience and Qualifications: Mr. Yowan’s extensive experience in consumer financial services including his long tenure with the world’s largest payment card issuer makes him a valuable addition to Navient’s Board of Directors. His insight and experience in risk management, balance sheet management, asset securitization and strategy make him ideally suited to assist our Board in overseeing financial, operational and credit risk management. |
Board Recommendation
THE BOARD OF DIRECTORS RECOMMENDS A VOTE “FOR” THE ELECTION OF EACH OF THE NOMINEES NAMED ABOVE.
| 2020 Proxy Statement | 19 |
Corporate Governance
Role and Responsibilities of the Board of Directors
The Board of Directors believes strong corporate governance is critical to achieving Navient’s performance goals, enhancing shareholder value and maintaining the trust and confidence of investors, employees, regulatory agencies and other stakeholders.
The primary responsibilities of the Board of Directors are to:
| • | Review Navient’s long-term strategies and set long-term performance metrics; |
| • | Review and approve Navient’s annual business plan and multi-year strategic plan, regularly review performance against such plans and ensure alignment between the Company’s actions and its longer- term strategic objectives; |
| • | Review risks affecting Navient and its processes for managing those risks, and oversee management performance with regard to various aspects of risk management, compliance and governance; |
| • | Select, evaluate and compensate the Chief Executive Officer; |
| • | Plan for succession of the Chief Executive Officer and members of the executive management team; |
| • | Review and approve major transactions; |
| • | Through its Audit Committee, select and oversee Navient’s independent registered public accounting firm; |
| • | Oversee financial matters, including financial reporting, financial controls and capital allocation; |
| • | Recommend director candidates for election by shareholders and plan for the succession of directors; and |
| • | Evaluate the Board’s composition, succession, and effectiveness. |
Board Governance Guidelines
The Board of Directors’ Governance Guidelines (the “Guidelines”) are reviewed, at least annually, by the Nominations and Governance Committee. The Guidelines can be found at www.navient.com under “Investors, Corporate Governance” and a written copy may be obtained by contacting the Corporate Secretary at corporatesecretary@navient.com. The Guidelines, along with Navient’s Bylaws, embody the following governance practices, among others:
| • | A majority of the members of the Board of Directors must be independent directors and all members of the Audit, Compensation and Personnel, and Nominations and Governance Committees must be independent. |
| • | All directors stand for re-election each year and must be elected by a majority of the votes cast in uncontested elections. |
| • | No individual is eligible for nomination to the Board after the earlier of (i) their 75th birthday or (ii) after having served in the aggregate more than 20 years on the Board. |
| • | The Board of Directors has separated the roles of Chair of the Board and CEO, and an independent, non-executive director serves as Chair. |
| 2020 Proxy Statement | 20 |
| • | Independent members of the Board of Directors and its committees meet in executive session, outside the presence of management or the CEO at several times during each Board meeting as well as at the end of each Board and committee meeting. The Chair of the Board (or the applicable committee chair) presides over these sessions. |
| • | Navient maintains stock ownership and retention guidelines for directors and executive officers and has a policy prohibiting the hedging or pledging of its stock. |
| • | The Board of Directors and each committee conduct performance reviews annually through a combination of online questionnaires and individual director interviews. |
| • | The Board of Directors and its committees may engage their own advisors. |
The Nominations and Governance Committee routinely conducts an assessment of director skillsets in light of the Company’s present and future businesses to ensure Board effectiveness.
Board Leadership Structure
The Board of Directors has separated the roles of Chair of the Board of Directors and Chief Executive Officer, and the Board continues to believe that this structure properly balances the Board’s management and governance responsibilities. The Board of Directors also believes that its leadership structure has created an environment of open, transparent communication between the Board and management, enabling the Board to maintain an active, informed role in oversight by being able to monitor those matters that may present significant risks to Navient.
While it is the opinion of the Board of Directors that its leadership structure is appropriately balanced between promoting Navient’s strategic development with the Board’s management oversight function, in the future, when the Board contemplates either CEO succession or Board Chair succession, it may choose to change this governance structure at any time.
Board Succession Planning
Our Board Governance Guidelines provide that no individual is eligible for nomination to the Board after the earlier to occur of (i) their 75th birthday or, (ii) after they have served more than 20 years on the Board.1 During 2019, in connection with the approval of the Company’s slate of nominees for the 2019 Annual Meeting and the Canyon Agreement, William M. Diefenderfer, III notified the Board that he would not to stand for re-election at the 2019 Annual Meeting. Additionally, pursuant to the Canyon Agreement, Barry L. Williams retired from the Board effective August 9, 2019. For additional information pertaining to the Canyon Agreement, please refer to “Shareholder Engagement and Communications with the Board” below.
The Board continues to actively engage in succession planning and director recruiting to ensure that the size of the Board and the skills of the directors align with our business strategy and the environment in which we operate.
Management Succession Planning
We have succession plans and talent management programs in place for our Chief Executive Officer and for our team of senior executives. Our senior management succession planning process is an organization-wide practice designed to proactively identify, develop and retain the leadership talent that is critical for future business success.
1 | Our Board Governance Guidelines state: “…individuals will not be nominated for election to the Board after the earlier to occur of (i) their 75th birthday or, (ii) after they have served more than 20 years on the Board.” |
| 2020 Proxy Statement |  | 21 |
The succession plan for our Chief Executive Officer is reviewed regularly by the Compensation and Personnel Committee and the other independent directors. The plan identifies a “readiness” level for each internal candidate and also incorporates the flexibility to define an external hire as a succession option. Formal succession planning for the rest of our senior leaders is also an ongoing process, which includes identifying a readiness level for each potential internal candidate and strategically planning for external hires for positions where gaps, if any, are identified.
Our emergency CEO succession plan is intended to respond to an immediate and unexpected position vacancy, including resulting from a major catastrophe. The plan allows the Company to continue safe and sound operation and minimizes potential disruption or loss of continuity to business and operations.
Director Independence
For a director to be considered independent, the Board of Directors must determine that the director does not have any direct or indirect material relationship with Navient that would interfere with the director’s exercise of independent judgment or that would render the director incapable of making a decision with only the best interests of the Company in mind. The Board of Directors has adopted the Guidelines, which include the standards for determining director independence. In addition to Delaware law requirements, the Guidelines conform to the independence requirements of Rule 10A-3 of the Securities Exchange Act of 1934 (the “Exchange Act”) and the Nasdaq listing standards. The Guidelines can be found at www.navient.com under “Investors, Corporate Governance” and a written copy may be obtained by contacting the Corporate Secretary at corporatesecretary@navient.com.
At the end of 2019, the Board of Directors was comprised of 10 members, 9 of whom were affirmatively determined to be independent. The independent members of the Board of Directors at the end of fiscal 2019 were: Frederick Arnold; Marjorie
L. Bowen; Anna Escobedo Cabral; Larry A. Klane; Katherine A. Lehman; Linda A. Mills; Jane J. Thompson; Laura S. Unger; and David L. Yowan. During 2019, and again in 2020, the Board of Directors determined that each of these individuals met the Nasdaq listing standards and Navient’s own director independence standards. In addition, the Board of Directors considered transactions and relationships between each director and any member of his or her immediate family on one hand, and Navient, on the other, to confirm that there were no transactions or relationships that would impair such director’s independence. Only Mr. Remondi was determined not to be independent.
Each member of the Board of Directors’ Audit, Compensation and Personnel, and Nominations and Governance Committees is independent within the meaning of the Nasdaq listing standards, Rule 10A-3 of the Exchange Act and Navient’s own director independence standards.
Board of Directors Meetings and Attendance at Annual Meeting
The full Board of Directors met 32 times in 2019. Each of our directors attended at least 79 percent of the total number of Board and committee meetings during his or her tenure on the Board and applicable committees, with the average attendance across all our directors being 94.8% in 2019. All directors other than Mr. Diefenderfer, who notified the Board that he would not to stand for re-election, attended the Company’s 2019 annual meeting of shareholders.
Committee Membership
The Board of Directors has established the following standing committees to assist in its oversight responsibilities: an Audit Committee, a Compensation and Personnel Committee, a Nominations and Governance Committee, a Finance and Operations Committee, and an Executive Committee. The Board has directed the Nominations and Governance Committee to establish a Risk Committee in 2020 to replace the Finance and Operations Committee. The Risk Committee will focus primarily on oversight of the Company’s enterprise risk management infrastructure. In the coming months, the Nominations and Governance Committee will work with the Board’s other standing committees to shift certain risk oversight responsibilities to this new committee, with other oversight responsibilities moving to the full Board.
| 2020 Proxy Statement | | 22 |
Each standing committee is governed by a Board-approved written charter, which is evaluated annually, and which sets forth the respective committee’s functions and responsibilities. Membership of each of the committees is also changed as part of a regular rotation. Investors may find the current membership of the Board’s standing committees at http://www.navient.com/about/investors/corp_governance/.
For 2019, an 18-month work-plan was created from the charters of the Audit, Compensation and Personnel, Nominations and Governance, and Finance and Operations Committees so that the responsibilities of each committee would be addressed at appropriate times throughout the year. These work-plans will be reviewed and revised as a matter of course in 2020. Agendas for committee meetings are developed based on each committee’s work-plan together with other current matters the Board chair, the committee chair or management believes should be addressed at the meeting. The chair of each committee provides regular reports to the Board of Directors regarding the subject of the committee’s meetings and any committee actions.
In addition to the Board’s five standing committees, in 2019 the Board also formed a Special Committee of independent directors to facilitate communications and recommend strategic considerations to the Board in connection with the Company’s engagement with Canyon Capital Advisors LLC (“Canyon”). For additional information pertaining to Canyon, please refer to “Shareholder Engagement and Communications with the Board” below. The Special Committee is comprised of Katherine A. Lehman, David L. Yowan and Laura S. Unger. William M. Diefenderfer, III served as an ex officio member until he departed the Board, at which time Linda A. Mills joined the committee as an ex officio member.
The following table sets forth the membership and number of meetings held for each committee of the Board of Directors during 2019. This table reflects the membership of each committee as of December 31, 2019.2 It is the practice of the Board to hold its regular committee meetings in conjunction with the regular meetings of the Board. Given the Audit Committee’s responsibilities relating to our financial statements and financial reporting, it is expected that the Audit Committee will meet more often than the other committees.
Audit Committee | Compensation and Personnel Committee | Executive Committee | Finance and Operations Committee | Nominations and Governance Committee | Special Committee | |
| Frederick Arnold | X | X | ||||
Marjorie L. Bowen (1) | X | X | ||||
| Anna Escobedo Cabral | CHAIR | X | X | |||
Larry A. Klane (2) | X | X | ||||
| Katherine A. Lehman | X | X | CHAIR | X | ||
Linda A. Mills (3) | CHAIR | X | ||||
| John F. Remondi | X | |||||
Jane J. Thompson (4) | CHAIR | X | X | |||
| Laura S. Unger | X | X | CHAIR | X | ||
David L. Yowan (5) | X | X | X | |||
| Number of Meetings in 2019 | 10 | 7 | 4 | 10 | 13 | 15 |
Chair = Committee Chair
X = Committee Member
| (1) | Ms. Bowen was appointed to the Board on May 1, 2019. Ms. Bowen is not being nominated by the Board for reelection, and her tenure as a director will end when her current term expires at our 2020 Annual Meeting. |
| (2) | Mr. Klane was appointed to the Board on May 1, 2019. |
| (3) | Ms. Mills served as a member of the Finance and Operations Committee and the Compensation and Personnel Committee until her appointment as Chair of the Board on June 6, 2019. For the remainder 2019, she served as Chair of the Executive Committee and as an ex officio member of the Special Committee. |
| (4) | Ms. Thompson served on the Finance and Operations Committee until June 6, 2019, when she became a member of the Nominations and Governance Committee. |
| (5) | Mr. Yowan served on the Audit Committee until June 6, 2019, when he became a member of the Compensation and Personnel Committee. |
2 | In connection with the Canyon Agreement, the terms of which are discussed on page 30 of this proxy statement, William M. Diefenderfer, III elected not to stand for re-election to the Board at the 2019 Annual Meeting. Before his departure, Mr. Diefenderfer served as Chairman of the Board and Chair of the Executive Committee. Barry L. Williams agreed to retire from the Board of Directors in connection with the Canyon Agreement. Mr. Williams served as a member of the Compensation and Personnel Committee, the Nomination and Governance Committee, and the Finance and Operations Committee at various times during 2019 until his retirement from the Board effective August 9, 2019. |
| 2020 Proxy Statement | | 23 |
Audit Committee
The Audit Committee has been established in accordance with Section 3(a)(58)(A) of the Exchange Act. During 2019, the Audit Committee, as set forth in its charter, assisted the Board of Directors in fulfilling its responsibilities by providing oversight relating to: (1) the integrity of Navient’s financial statements; (2) the Company’s system of internal controls; (3) the qualifications, performance and independence of Navient’s independent registered accounting firm; (4) the performance of the Company’s internal audit function; (5) risks related to Navient’s compliance, legal and regulatory matters; and (6) the review of related party transactions. In addition, the Audit Committee reviews the Company’s procedures for the receipt, retention and handling of confidential, anonymous complaints pertaining to accounting, internal accounting controls and auditing matters, including procedures for the periodic review of violations or waivers of compliance with the Company’s Code of Business Conduct, and prepares the report of the Audit Committee for Navient’s annual proxy statement, as required by the SEC. The Board of Directors has determined that one member of the Audit Committee—Frederick Arnold— qualifies as audit committee financial experts, as that term is defined under the rules promulgated by the SEC. During 2019, no member of the Audit Committee served on the audit committee of more than three public companies.
Compensation and Personnel Committee
Pursuant to the provisions of its charter, which can be found on our website in full, the primary responsibilities of the Compensation and Personnel Committee (also referred to herein as the “Compensation Committee”) during 2019 were to:
(1) approve or recommend, as appropriate, compensation, benefits and employment arrangements for Navient’s Chief Executive Officer and other executive officers who report to the CEO (collectively “Executive Management”), and independent members of the Board of Directors; (2) review and approve compensation plans, incentive plans and benefit plans applicable to Executive Management; (3) review, approve and administer all equity-based plans of the Company;
(4) supervise the administration of employee benefit plans of Navient as required by law or the plan terms or as otherwise appropriate; (5) receive periodic reports regarding the Company’s compensation programs as they relate to all employees;
(6) review Navient’s management development and recommend to the Board of Directors succession plans applicable to Executive Management; (7) review and consider current and developing compensation and personnel related topics as appropriate, including performance management, leadership development, turnover and retention, diversity, and employee engagement; and (8) prepare the report of the Compensation Committee for inclusion in this proxy statement, as required. The Compensation Committee, in coordination with the Audit Committee, also reviews the report of management on the potential risks arising from Navient’s compensation policies and practices to determine whether such policies and practices are reasonably likely to have a material adverse effect on the Company.
The Compensation Committee considers executive officer and director compensation on an annual basis. In January or February of each year, after consultation with the independent chair and other independent directors, as well as its independent consultant, if one has been retained, the Compensation Committee approves the compensation of the Chief Executive Officer and Executive Management. At that time, the Compensation Committee also makes a recommendation to the Board of Directors regarding director compensation. The Compensation Committee reviews executive compensation as described in the “Compensation Discussion and Analysis” section of this proxy statement. In addition, throughout the year, the Compensation Committee considers executive compensation consistent with its responsibilities, as warranted by any personnel changes.
Executive Committee
Since its creation, membership of the Executive Committee has included the committee chairs, the Chief Executive Officer and the Board chair. Under its charter, the Executive Committee has authority to act on behalf of the Board of Directors when the full Board of Directors is not available, and oversees the allocation of risk oversight responsibilities among Board committees. In conjunction with the Audit Committee, it also reviews with management the Company’s quarterly earnings and press releases.
Finance and Operations Committee
During 2019, the Finance and Operations Committee assisted the Board of Directors, as required by its charter, by providing oversight with respect to: (1) material corporate finance matters, including investments, mergers and acquisitions, capital management, financing and funding strategy; (2) technology and operations; (3) marketing and product development; (4) the Company’s lending programs; and (5) the Company’s information security program and cybersecurity. The Finance and Operations Committee also reviewed the financial risk profile of Navient, including capital market access, credit, interest rate, currency and programmatic/contractual risks and reviewed with management steps to manage those risks.
| 2020 Proxy Statement | | 24 |
Nominations and Governance Committee
In accordance with its charter, the Nominations and Governance Committee assists the Board of Directors in establishing appropriate standards for the governance of Navient, the operations of the Board of Directors generally and the qualifications of directors. It recommends to the Board of Directors the director nominees for the annual meeting of shareholders, oversees the orientation of new directors and the ongoing education of the Board, recommends director assignments to the Board’s standing committees, oversees the Company’s reputational and political risks, supervises the Board’s self-evaluation and succession process and reviews and recommends changes to the Board’s Governance Guidelines. Additionally, the Nominations and Governance Committee routinely benchmarks the Company’s governance practices against industry best practices and makes appropriate changes when necessary.
Each of the Committees’ charters is available at www.navient.com under “Investors, Corporate Governance.” Shareholders may obtain a written copy of a committee charter by contacting the Corporate Secretary at corporatesecretary@navient.com or Navient Corporation, 123 Justison Street, Wilmington, Delaware 19801.
Compensation Consultant and Independence
During 2019, the Compensation Committee retained Pearl Meyer as its independent compensation consultant (the “Compensation Consultant”).
The Compensation Consultant reported directly to the Compensation Committee, and the Compensation Committee retained authority to replace the Compensation Consultant or hire additional consultants at any time. A representative from the Compensation Consultant participated in meetings of the Compensation Committee and met with the committee without the presence of management, as requested, and directly communicated with the Chair of the Compensation Committee between meetings. However, the Compensation Committee made all decisions regarding the compensation paid to Navient’s named executive officers.
The Compensation Consultant provided various executive compensation services to the Compensation Committee pursuant to a written consulting agreement with the Compensation Committee. Generally, these services included advising the Compensation Committee on the principal aspects of Navient’s executive and director compensation programs, assisting in the selection of the compensation peer group, providing market information and analysis regarding the competitiveness of our compensation program design, reviewing Navient’s executive compensation disclosures, and informing the Committee about emerging compensation-related regulatory and industry issues.
During 2019, and again in 2020, the Compensation Committee considered the independence of the Compensation Consultant in light of SEC rules and Nasdaq listing standards. The Compensation Committee received a written statement of independence from the Compensation Consultant, which addressed the following factors: (1) other services provided to Navient by the Compensation Consultant; (2) fees paid by the Company as a percentage of the Compensation Consultant’s total revenues; (3) policies or procedures maintained by the Compensation Consultant that are designed to prevent a conflict of interest; (4) any business or personal relationships between the individual consultants involved in the engagement and any member of the Compensation Committee; (5) any Navient Common Stock owned by the individual consultants involved in the engagement; and (6) any business or personal relationships between our executive officers and the Compensation Consultant or the individual consultants involved in the engagement. The Compensation Committee discussed these considerations and concluded that the work of the Compensation Consultant did not raise any conflicts of interest. For more information on the Compensation Committee and the Compensation Consultant, please see the “Compensation Discussion and Analysis” section in this proxy statement.
Compensation Committee Interlocks and Insider Participation
Ms. Thompson, Mr. Klane, Ms. Lehman, and Mr. Yowan were members of the Compensation Committee during fiscal year 2019.3 All members of the Compensation Committee were independent directors, and no member was an employee or
3 | Mr. Williams served on the Compensation Committee until his retirement in August 2019. Ms. Mills also served on the Compensation Committee until her appointment to Chair of the Board on June 6, 2019. |
| 2020 Proxy Statement | | 25 |
former employee of Navient or its affiliates. During fiscal year 2019, none of Navient’s executive officers served on a compensation committee (or its equivalent) or board of directors of another entity whose executive officer served on the Compensation Committee.
The Board of Directors’ Role in Risk Oversight
Our Board of Directors has the ultimate responsibility for risk oversight for Navient’s Enterprise Risk Management (“ERM”) philosophy and framework. In carrying out this critical responsibility, the Board has designated the Audit Committee as having primary responsibility to assist the Board in the development, maintenance and governance of the company’s ERM policy, standards and program. Other standing committees of the Board are charged with overseeing specific enterprise risks, as described below. The Board and its standing committees are responsible for ensuring we adhere to established risk tolerances and parameters that form a cornerstone of the company’s ERM framework.
The Board has delegated day-to-day responsibility for risk oversight to our Chief Executive Officer and senior management team, who in turn have established the following management committees to implement this directive: Enterprise Risk and Compliance Committee, Credit and Loan Loss Committee, Asset and Liability Committee, and Incentive Compensation Plan Committee. These internal management committees, described in more detail below, provide regular reports to the Board and its standing committees—either directly or through one or more senior executives. The overall risk governance structure is illustrated below:
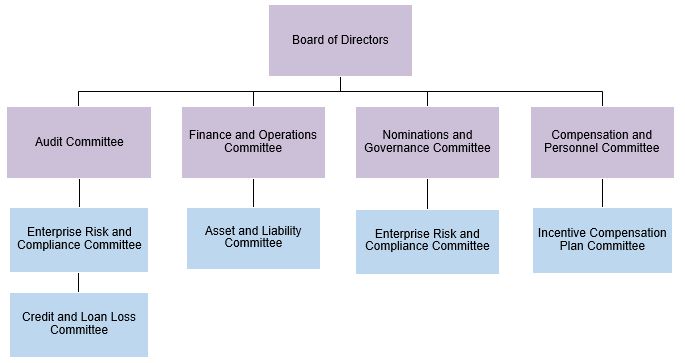
The Nominations and Governance Committee regularly reviews the composition and membership of each standing committee of the Board and makes recommendations to the Board. Outside of the SEC and Nasdaq requirements for eligibility to serve on certain committees, such as the Audit Committee and the Compensation and Personnel Committee, the Nominations and Governance Committee actively considers each committee’s responsibilities, as outlined in its charter, as well as individual director skillsets when deciding which directors will serve on specific standing committees.
The Board has directed the Nominations and Governance Committee to establish a Risk Committee in 2020 to replace the Finance and Operations Committee. The Risk Committee will focus primarily on oversight of the Company’s enterprise risk management infrastructure. In the coming months, the Nominations and Governance Committee will work with the Board’s other standing committees to shift certain risk oversight responsibilities to this new committee, with other oversight responsibilities moving to the full Board.
| 2020 Proxy Statement | | 26 |
Risk Appetite Framework
Navient employs a Risk Appetite Framework to identify the most significant risks that could impact our business and provides the process for evaluating and quantifying those risks. The Risk Appetite Framework defines the type and degree of risk Navient is able and willing to assume, given its business objectives, contractual and other legal requirements, and obligations to stakeholders. As noted below, our Risk Appetite Framework segments enterprise risk into nine enterprise risk domains.
Enterprise Risk Domains
Our Risk Appetite Framework segments Navient’s enterprise risks across nine enterprise risk domains: (1) Credit; (2) Market; (3) Funding and Liquidity; (4) Compliance; (5) Legal; (6) Operational; (7) Reputational and Political; (8) Governance; and (9) Strategy. These risk domains are disclosed in our Form 10-K and proxy statements filed with the SEC. As noted above, our Board of Directors has the ultimate responsibility for risk oversight for Navient’s ERM framework.
The Board has assigned oversight responsibility for each risk domain to one or more of its standing committees. These risk oversight responsibilities are spelled out in each standing committee’s charter. Investors can find the charter of each committee on our website at https://www.navient.com/about/investors/corp_governance/board_charters/.
Each of the enterprise risk domains is described below, along with the standing committee(s) responsible for risk oversight.
| Enterprise Risk Domain | Board Committee | Risk Description | |
| Credit | Finance and Operations Committee | Risk resulting from an obligor's failure to meet the terms of any contract with the Company or otherwise fail to perform as agreed. | |
| Market | Finance and Operations Committee | Risk resulting from changes in market conditions, such as interest rates, spreads, commodity prices or volatilities. | |
| Funding and Liquidity | Finance and Operations Committee | Risk arising from the Company's inability to meet its obligations when they come due without incurring unacceptable losses. | |
| Compliance | Audit Committee Finance and Operations Committee | Risk arising from violations of, or non-conformance with, laws, rules, regulations, prescribed practices, internal policies, and procedures, or ethical standards. | |
| Legal | Audit Committee Finance and Operations Committee | Risk manifested by claims made through the legal system, including litigation brought against the Company. Legal risk may arise from a product, a transaction, a business relationship, property (real, personal, or intellectual), employee conduct, or a change in law or regulation. | |
| Operational | Finance and Operations Committee Compensation and Personnel Committee | Risk resulting from inadequate or failed internal processes, personnel and systems, inadequate product design and testing, or from external events. | |
| Reputational and Political | Nominations and Governance Committee | Risk from stakeholder perceptions regarding actual or alleged violations of law, our internal code of conduct or other employee misconduct. | |
| Governance | Nominations and Governance Committee | Risk of not establishing and maintaining a control environment that aligns with stakeholder and regulatory expectations, including tone at the top and board performance. | |
| Strategic | Executive Committee | Risk from adverse business decisions or improper implementation of business strategies. |
| 2020 Proxy Statement | | 27 |
Cybersecurity Risk Oversight
The Board of Directors, through the Finance and Operations Committee, plays an important role in overseeing the Company’s cybersecurity risk management. The Finance and Operations Committee receives regular briefings from the Company’s Chief Information Security Officer relating to the most recent developments in cybersecurity prevention, detection, response and recovery as well as updates on breaches and exploitations, both successful and unsuccessful, at other companies.
Additional Risk Oversight Information
Additional information about how we actively managing risk for our stakeholders, including our customers, clients, employees, and shareholders, can be found on our website at https://navient.com/assets/about/investors/corp- governance/Navient-Board-Risk-Oversight.pdf.
Risk Assessment of Compensation Policies
Navient maintains an internal Incentive Compensation Plan Committee (the “ICP Committee”) that conducts an annual risk review and assessment of the various incentive compensation plans covering our employees—including plans that cover our named executive officers—to ensure that our employees are not incented to take inappropriate risks which could impact our financial position and controls, reputation and operations. Our Chief Risk and Compliance Officer, Chief Legal Officer, Chief Audit Officer and Chief Human Resources Officer serve on the ICP Committee, along with other senior business leaders. The ICP Committee presented its annual findings to the Compensation Committee and the Audit Committee in early 2020, and the Compensation Committee determined that the Company’s incentive compensation programs do not encourage or create unnecessary risk-taking, and that the risks arising from the programs are not reasonably likely to have a material adverse effect on the Company. The ICP Committee will continue to monitor our incentive compensation plans, as well as the plan governance structure put in place to mitigate risks associated with the plans, to ensure that our incentive compensation practices properly incent our employees and reflect industry best practices.
Nominations Process
The Nominations and Governance Committee considers director candidates recommended by shareholders and also receives suggestions for candidates from Board members or third parties. The Nominations and Governance Committee has, from time to time, engaged and may continue, in the future, to engage third-party search firms to assist in identifying director candidates.
Candidates are evaluated based on the needs of the Board of Directors and Navient at that time, given the then-current mix of Board members, their individual skills and experiences relative to the Company’s business strategy, and the Nominations and Governance Committee’s desire to bring additional skills or experiences to the Board. While Navient does not have a formal Board diversity policy, the Board of Directors actively seeks representation that reflects gender, ethnic, age and geographic diversity as reflected in the Guidelines. The Nominations and Governance Committee, through its charter, is charged with reviewing the composition, skills and diversity of the Board of Directors, and as part of the process, the Nominations and Governance Committee incorporates into the Board of Directors’ annual evaluation process, the opportunity for each Board member to provide input regarding the current and desired composition of the Board of Directors and desired attributes of Board members. The minimum qualifications and attributes that the Nominations and Governance Committee believes a director nominee must possess include:
| • | Knowledge of Navient’s business; |
| • | Proven record of accomplishment; |
| • | Willingness to commit the time necessary for Board of Director service; |
| • | Integrity and sound judgment; |
| 2020 Proxy Statement | | 28 |
| • | Willingness to represent the best interests of all shareholders and effectively oversee management performance; |
| • | Ability to challenge and stimulate management; and |
| • | Independence. |
In addition, the Nominations and Governance Committee believes the Board of Directors collectively should encompass a mix of skills and expertise in the following areas:
| • | Finance, including capital allocation; |
| • | Accounting/audit; |
| • | Corporate governance; |
| • | Executive leadership; |
| • | Information security and cybersecurity; |
| • | Financial services, including financial technology and innovation; |
| • | Capital markets; |
| • | Business operations and operating efficiency; |
| • | Mergers and acquisitions; |
| • | Higher education; |
| • | Consumer credit; |
| • | Business processing solutions and outsourcing; |
| • | Consumer marketing and product development, including customer experience; |
| • | Government/Regulatory; and |
| • | Legal. |
The Nominations and Governance Committee considers and evaluates candidates recommended by shareholders in the same manner that it considers and evaluates all other director candidates. To recommend a candidate, shareholders should send, in writing, the candidate’s name, credentials, contact information, and his or her consent to be considered as a candidate to the Chair of the Nominations and Governance Committee at corporatesecretary@navient.com or c/o Corporate Secretary, Navient Corporation, 123 Justison Street, Wilmington, Delaware 19801. The shareholder should also include his or her contact information and a statement of his or her share ownership. A shareholder wishing to nominate a candidate must comply with the notice and other requirements described under “Shareholder Proposals for the 2021 Annual Meeting” in this proxy statement.
Proxy Access
The Company will include in its proxy statement and on its form of proxy card, the name of a director nominee submitted by an “Eligible Holder” who provides the information and satisfies the other provisions of the Company’s bylaws. To qualify as an “Eligible Holder,” a shareholder or a group of no more than 20 shareholders must have continuously owned at least three percent (3%) of the outstanding shares of the Company’s Common Stock entitled to vote in the election of directors for a period of at least three years and thereafter continue to own the shares through the Company’s annual meeting. There are no proxy access board nominees for the 2020 annual meeting. A complete version of the Company’s Second Amended and Restated Bylaws can be found on the Corporate Governance page of our website at the following location: https://navient.com/about/investors/corp_governance/.
| 2020 Proxy Statement | | 29 |
Director Orientation and Continuing Education
The Nominations and Governance Committee oversees the orientation of new directors and the ongoing education of the Board. As part of Navient’s director orientation program, new directors participate in one-on-one introductory meetings with Navient business and functional leaders and are given presentations by members of senior management on Navient’s strategic plans, financial statements and key issues, policies and practices. In addition, directors receive education on governance and director fiduciary duties and expectations. Directors may enroll in director continuing education programs on corporate governance and critical issues associated with a director’s service on a public company board. Navient makes an annual stipend available to each director towards the expenses of these programs. Our senior management meets regularly with the Board and meets annually to review with the Board the operating plan of the Company and each of our strategic business groups. The Board also regularly participates in full Board educational programs and visits to Navient operation centers.
Shareholder Engagement and Communications with the Board
Our CEO, Chief Financial Officer, and Vice President of Investor Relations, together with other members of management, meet periodically with investors to discuss Navient’s strategy and financial and business performance, and to update investors on key developments. During 2019 and into 2020, Navient participated in at least 100 meetings with investors and potential investors. In addition, we routinely seek our shareholders’ views on governance and compensation matters.
At various times prior to December of 2017, representatives of the Company met with representatives of Canyon Capital Advisors LLC (“Canyon”) as a part of the Company’s engagement strategy that focuses on regularly meeting with its shareholders, bond holders and investors in the asset-backed securities it sponsors. In May 2019, the Company became aware that Canyon had accumulated a beneficial interest in approximately 9.6% of the Company’s outstanding common stock.4 In August 2018, at the request of Canyon, the Board agreed to appoint Frederick Arnold to the Board. On May 2, 2019, we entered into a cooperation agreement with Canyon (the “Canyon Agreement”) whereby the Board agreed, among other things, to appoint Marjorie Bowen and Larry Klane as directors of the Company, subject to the satisfaction of certain customary conditions, and to nominate and recommend Ms. Bowen and Mr. Klane for election to the Board at the Company’s 2019 Annual Meeting of Shareholders. The appointments of Mr. Arnold, Ms. Bowen and Mr. Klane were approved by our shareholders in June 2019. On January 27, 2020, the Company entered into a Stock Repurchase Agreement with Canyon to repurchase its remaining interest in the Company’s common stock. During this time, various representatives of Canyon met or held discussions with various members of management, the Special Committee and other members of the Board.
The foregoing description does not purport to be complete and is qualified in its entirety by reference to the Canyon Agreement, included as Exhibit 10.01 to the Company’s Form 8-K that was filed with the SEC on May 3, 20195, the Company’s Definitive Proxy Statement filed with the SEC on Form DEF 14A on April 30, 20196, and its Amended Definitive Proxy Statement on Form DEF 14A filed with the SEC on May 8, 20197, all of which are furnished herewith.
Shareholders and other interested parties may submit communications to the Board of Directors, the non-management directors as a group, the Chair or any other individual member of the Board of Directors by contacting the Chair of the Board in writing at corporatesecretary@navient.com or c/o Corporate Secretary, Navient Corporation, 123 Justison Street, Wilmington, Delaware 19801.
Except as discussed below or otherwise directed, the Corporate Secretary forwards all such communications to the Board Chair. The Chair in turn determines whether the communications should be forwarded to other members of the Board and, if so, forwards them accordingly. However, for communications addressed to a particular member of the Board, the Chair
4 | On May 4, 2019, Canyon reported on Form 13D/A filed with the SEC that it beneficially owned 25,435,480 or 9.6% of the Company’s outstanding shares. |
5 | Form 8-K filed with the SEC on May 3, 2019 is available at https://www.sec.gov/Archives/edgar/data/1593538/000119312519136955/0001193125-19-136955-index.htm. |
6 | Form DEF 14A filed on April 30, 2019 is available at https://www.sec.gov/Archives/edgar/data/1593538/000119312519126546/0001193125-19-126546-index.htm. |
7 | Form DEF 14A filed on May 8, 2019 is available at https://www.sec.gov/Archives/edgar/data/1593538/000119312519141633/0001193125-19-141633-index.htm. |
| 2020 Proxy Statement | | 30 |
of a particular Board committee or the non-employee directors as a group, the Corporate Secretary forwards those communications directly to those individuals.
The directors have requested that communications that do not directly relate to their duties and responsibilities as our directors be excluded from distribution. Such excluded items include “spam,” advertisements, mass mailings, form letters and email campaigns that involve unduly large numbers of similar communications, solicitations for goods, services, employment or contributions, surveys and individual product inquiries or complaints. Additionally, communications that appear to be unduly hostile, intimidating, threatening, illegal or similarly inappropriate will be screened for omission. Any omitted or deleted communications will be made available to any director upon request.
Policy on Political Contributions, Disclosure and Oversight
We did not make any political contributions using corporate funds in 2019, and we have no intention of making such political contributions in 2020. The Company's Government Relations personnel are responsible for the development and implementation of policies pertaining to the Company’s political activities. They report annually to the Nominations and Governance Committee of the Board on major lobbying priorities and principles. Government Relations also provides the Committee with a report on any payments made to trade associations, political expenditures, contributions made to other tax-exempt political organizations, as well as contributions by the Company's Political Action Committee. Navient also maintains numerous compliance processes structured to ensure that the Company and its employees conduct all their activities in accordance with our Code of Business Conduct and with all relevant laws governing political contributions and lobbying activities.
Since 2016, we have disclosed our political activity and contributions through the publication of our Transparency in Policy Engagement and Political Participation Report. In 2018, the Company was recognized as a “Trendsetter” in the CPA-Zicklin Index for political transparency. The Report provides an overview of the Company’s legislative and political priorities and also provides details pertaining to Navient’s contributions to members of Congress, trade associations, 527 political organizations and other political organizations. The Nominations and Governance Committee has instructed the Company to update the report on a semi-annual basis. The current Report is available on the Company’s website at https://www.navient.com/about/who-we-are/transparency/.
Code of Business Conduct
The Company has a Code of Business Conduct that applies to Board members and all employees, including the chief executive officer, the chief financial officer and the chief accounting officer. The Code of Business Conduct is available on the Company’s corporate governance website at https://navient.com/about/investors/corp_governance/ and a written copy is available from the Corporate Secretary. The Company intends to post amendments to or waivers of the Code of Business Conduct (to the extent applicable to the Company’s chief executive officer, chief financial officer or chief accounting officer or any director) at this location on its website. There were no waivers during 2019.
Policy on Review and Approval of Transactions with Related Parties
The Company has adopted a Policy on Related Party Transactions to ensure that all Interested Transactions with Related Parties, as those terms are defined in the policy, will be at arm’s length and on terms generally available to an unaffiliated third-party under the same or similar circumstances. The policy states that, except for the limited exceptions specifically stated in the policy, Interested Transactions with Related Parties that will exceed $120,000 in any calendar year must be reviewed by the Audit Committee and receive approval of the Board of Directors prior to the Corporation entering into the Interested Transaction. A copy of the policy can be found on the Company’s Corporate Governance website at https://www.navient.com/about/investors/corp_governance/. For additional information pertaining to Related Party Transactions, please refer to “Certain Relationships and Related Transactions” below.
| 2020 Proxy Statement | | 31 |
Director Compensation
Our director compensation program is designed to reasonably compensate our non-employee directors for work required for a company of our size, complexity and risk, and to align the interests of our directors with those of our shareholders. The Compensation Committee reviews the compensation of our non-employee directors on an annual basis and makes recommendations to the Board.
In late 2018, the Compensation Committee reviewed our director compensation with the assistance of the Compensation Consultant and concluded that the existing program should remain unchanged for 2019. The Compensation Committee again reviewed director compensation in 2019 and will keep the existing program unchanged for 2020, with the exception of changes to the form of annual equity awards described below.
Our 2019 director compensation program is detailed below.
| Director Compensation Elements |
The following table highlights the material elements of our 2019 director compensation program:
| 2019 Compensation Elements | Compensation Value |
| Annual Cash Retainer | $100,000 |
| Additional Cash Retainer for Independent Board Chair | 50,000 |
| Additional Cash Retainer for Audit Committee Chair | 30,000 |
| Additional Cash Retainer for Compensation and Personnel Committee Chair | 25,000 |
| Additional Cash Retainer for Other Committee Chairs | 20,000 |
| Annual Equity Award | 130,000 |
| Additional Equity Award for Independent Board Chair | 65,000 |
Annual cash retainers are paid in quarterly installments in or around June, September, December and March. Annual equity awards typically are granted in February each year in the form of restricted stock.
Restricted stock granted to our non-employee directors in February 2019 was structured to vest only upon the recipient’s election to the Board at the Company’s next following annual meeting of shareholders (or, if earlier, upon death, disability, or a change in control). Beginning in 2020, the Board modified the vesting provisions incorporated in these equity awards to address the potential for partial-year Board service. Restricted stock granted to our non-employee directors in February 2020 will vest in quarterly increments beginning on the grant date and thereafter on May 1st, August 1st and November 1st, provided the director remains on the Board through each vesting date (with immediate vesting, if earlier, upon death, disability, or a change in control).
We also reimburse each non-employee director for any out-of-pocket expenses incurred in connection with their service as a director. As described below, our non-employee directors may elect to defer all or a portion of their annual compensation under the Navient Corporation Deferred Compensation Plan for Directors.
Share Ownership Guidelines
We maintain share ownership guidelines for our non-employee directors. Under these share ownership guidelines, each director is expected, within five years of his or her initial election to the Board of Directors, to own Navient Common Stock with a value equivalent to at least four times his or her annual cash retainer. Currently, that minimum ownership amount is
$400,000. The following shares and share units count towards the ownership guidelines: shares held in brokerage accounts; notional shares credited to deferred compensation accounts; restricted stock and restricted stock units (“RSUs”) that vest solely upon the passage of time; and vested stock options, to the extent that they are “in-the-money.”
All non-employee directors are in compliance with the share ownership guidelines as of the date of this proxy statement due to their share ownership amount or because the five-year period from their initial election has not ended.
| 2020 Proxy Statement | | 32 |
Anti-Hedging and Pledging Policy
Navient’s Securities Trading Policy prohibits directors and officers (as defined by Rule 16a-1(f) of the Exchange Act and referred to as “Section 16 Officers”) from selling Navient stock short, holding Navient securities in a margin account, or pledging Navient securities as collateral for a loan or otherwise. Additionally, no director, Section 16 Officer or any other officer of the Company who is subject to the Company’s Stock Ownership Guidelines is permitted to enter into derivative or speculative transactions involving Navient securities (including prepaid variable forward contracts, equity swaps, collars, credit default swaps and exchange funds) that are designed to hedge or offset any decrease in the market value of Navient securities. All directors and named executive officers were in compliance with this policy throughout 2019 and remain in compliance as of the date of this proxy statement.
Policy on Rule 10b5-1 Trading Plans
The Company’s Securities Trading Policy governs the circumstances under which Navient directors and Section 16 Officers may enter into trading plans pursuant to SEC Rule 10b5-1. Rule 10b5-1 trading plans are pre-established trading plans for sales of our Common Stock. We believe our Rule 10b5-1 policy is effective in ensuring compliance with legal requirements. Under the policy:
| • | All Rule 10b5-1 trading plans must be pre-cleared by the Company’s Securities Trading Compliance Officer. |
| • | A trading plan may be entered into, modified or terminated only during an open trading window and while not in possession of material non-public information. |
| • | Once adopted, the person must not exercise any influence over the amount of securities to be traded, the price at which they are to be traded or the date of the trade. |
Other Compensation
We provide non-employee directors with company-paid group life insurance, accidental death and disability and business travel accident insurance. We also provide current non-employee directors the opportunity to participate in the Company’s medical and dental plans. If a director elects to participate in these plans, the director pays the full cost of medical and dental coverage (which for an employee is shared by the Company and the employee). After retirement from the Board, a former non-employee director may continue medical coverage for up to 18 months under the Consolidated Omnibus Budget Reconciliation Act (COBRA) at his/her own expense.
Deferred Compensation Plan for Directors
Navient sponsors a deferred compensation plan for its non-employee directors. Under the Navient Corporation Deferred Compensation Plan for Directors (“Director Deferred Compensation Plan”), our non-employee directors may elect annually to defer receipt of all or a percentage of their annual cash retainer. In addition, directors may elect to receive a credit under the Director Deferred Compensation Plan in lieu of their annual equity retainer. Provided this election is made before the beginning of the year, the director’s plan account will be credited with a dollar amount equivalent to the annual equity retainer and automatically invested in a notional Company stock fund. Notional stock units remain subject to the same vesting schedule applicable to the annual equity retainer.
Deferrals are credited with earnings based on the performance of certain investment funds selected by the participant. The plan does not pay above-market or preferential earnings on amounts deferred. Deferrals invested in the notional Company stock fund are payable in shares of Navient Common Stock. All other deferrals are payable in cash (in a single lump sum or in installments at the election of the director) upon termination of the director’s service on the Board or after a minimum
| 2020 Proxy Statement | | 33 |
number of years (except for hardship withdrawals in limited circumstances). As noted below, Ms. Bowen, Mr. Diefenderfer, Ms. Thompson and Ms. Unger each elected to defer all or a portion of his/her 2019 compensation under the Director Deferred Compensation Plan.
Director Compensation Table
The tables below present information regarding the compensation and stock awards that we have paid or granted to the non-employee directors for the year ended December 31, 2019.
Fees Earned or Paid in Cash(1) | Stock Awards(2) | All Other Compensation(3) | Total | |
| Name | ($) | ($) | ($) | ($) |
| Frederick Arnold | 100,000 | 129,992 | 58 | 230,050 |
Marjorie L. Bowen(4) | 81,666 | 100,082 | 34 | 181,782 |
| Anna Escobedo Cabral | 130,000 | 129,992 | 58 | 260,050 |
William M. Diefenderfer, III(5) | 37,500 | 195,000 | 29 | 232,529 |
Larry A. Klane(6) | 81,666 | 100,071 | 34 | 181,771 |
| Katherine A. Lehman | 120,000 | 129,992 | 58 | 250,050 |
Linda A. Mills(7) | 137,500 | 173,618 | 58 | 311,176 |
Jane J. Thompson(8) | 125,000 | 130,000 | 58 | 255,058 |
Laura S. Unger(9) | 120,000 | 130,000 | 58 | 250,058 |
Barry L. Williams(10) | 50,000 | 129,992 | 39 | 180,031 |
| David L. Yowan | 100,000 | 129,992 | 58 | 230,050 |
| (1) | This table includes all fees earned or paid in fiscal year 2019. Unless timely deferred under the Director Deferred Compensation Plan, annual cash retainers are paid in quarterly installments beginning shortly after the Company’s annual meeting of shareholders in May each year. Thus, the amounts paid (or deferred) in 2019 include the fourth and final quarterly payment for the period from May 2018 to May 2019, and three quarterly payments for the period from May 2019 to May 2020. |
| (2) | The grant date fair market value for each share of restricted stock granted in 2019 to directors is based on the closing market price of the Company’s Common Stock on the grant date. Additional details on accounting for stock-based compensation can be found in “Note 2–Significant Accounting Policies” and “Note 11–Stock-Based Compensation Plans and Arrangements” to the audited consolidated financial statements included in the 2019 Annual Report on Form 10-K. Stock awards are rounded down to the nearest whole share to avoid the issuance of fractional shares. As noted in the footnotes below, certain directors timely elected to receive a credit under the Director Deferred Compensation Plan in lieu of their 2019 annual equity retainer. Plan credits are automatically invested in a notional Company stock fund and are not subject to rounding for fractional shares. |
| (3) | All Other Compensation is detailed in a table on the following page. |
| (4) | Ms. Bowen joined the Board on May 1, 2019, and her compensation for 2019 was pro-rated accordingly. Ms. Bowen timely elected to receive a credit under the Director Deferred Compensation Plan in lieu of her 2019 annual equity retainer, with the credit being automatically invested in a notional Company stock fund. |
| (5) | Mr. Diefenderfer elected not to stand for reelection to the Board in June 2019, and his cash compensation for 2019 was pro-rated accordingly. Mr. Diefenderfer timely elected to receive a credit under the Director Deferred Compensation Plan in lieu of his 2019 annual equity retainer, with the credit being automatically invested in a notional Company stock fund. Because Mr. Diefenderfer elected not to stand for reelection to the Board in June 2019, he forfeited this credit when he departed the Board. |
| (6) | Mr. Klane joined the Board on May 1, 2019, and his compensation for 2019 was pro-rated accordingly. |
| (7) | Ms. Mills was elected as Chair of the Board effective June 6, 2019, and her annual cash retainer was adjusted accordingly. She also received an additional stock award at the time she became Chair of the Board. |
| (8) | Ms. Thompson timely elected to receive a credit under the Director Deferred Compensation Plan in lieu of her 2019 annual equity retainer, with the credit being automatically invested in a notional Company stock fund. |
| (9) | Ms. Unger timely elected to receive a credit under the Director Deferred Compensation Plan in lieu of her 2019 annual equity retainer, with the credit being automatically invested in a notional Company stock fund. Ms. Unger also elected to defer her annual cash retainer under the Director Deferred Compensation Plan. |
| (10) | Mr. Williams retired from the Board effective August 9, 2019, and his cash compensation for 2019 was pro-rated accordingly. |
| 2020 Proxy Statement | | 34 |
All Other Director Compensation:
Life Insurance Premiums(A) | Total | |
| Name | ($) | ($) |
| Frederick Arnold | 58 | 58 |
| Marjorie L. Bowen | 34 | 34 |
| Anna Escobedo Cabral | 58 | 58 |
| William M. Diefenderfer III | 29 | 29 |
| Larry A. Klane | 34 | 34 |
| Katherine A. Lehman | 58 | 58 |
| Linda A. Mills | 58 | 58 |
| Jane J. Thompson | 58 | 58 |
| Laura S. Unger | 58 | 58 |
| Barry L. Williams | 39 | 39 |
| David L. Yowan | 58 | 58 |
| (A) | The amount reported is the annual premium paid by Navient to provide a life insurance benefit of up to $100,000. |
| 2020 Proxy Statement | | 35 |
Proposal 2 — Ratification of the Appointment of the Independent Registered Public Accounting Firm
Navient’s independent registered public accounting firm, KPMG LLP (“KPMG”), is selected by the Audit Committee. On February 21, 2020, the Audit Committee engaged KPMG as Navient’s independent registered public accounting firm for the fiscal year ending December 31, 2020. Representatives of KPMG are expected to be present at the Annual Meeting and they will have the opportunity to respond to appropriate questions from shareholders and to make a statement if they desire to do so.
This proposal is put before the shareholders because the Board of Directors believes it is a good corporate governance practice to ask shareholders to ratify the selection of the independent registered public accounting firm.
For ratification, this proposal requires the affirmative vote of the holders of a majority of the Common Stock present, represented and entitled to vote, and voting affirmatively or negatively at the Annual Meeting. Accordingly, shares that are not voted affirmatively or negatively with respect to this proposal, including abstentions and broker non-votes, will not be relevant to the outcome. If the appointment of KPMG is not ratified, the Audit Committee will evaluate the basis for the shareholders’ vote when determining whether to continue the firm’s engagement. Even if the selection of Navient’s independent registered public accounting firm is ratified, the Audit Committee may direct the appointment of a different independent registered public accounting firm at any time during 2020 if, in its discretion, it determines that such a change would be in the Company’s best interests.
Board Recommendation
THE BOARD OF DIRECTORS RECOMMENDS A VOTE “FOR” RATIFICATION OF THE APPOINTMENT OF KPMG AS NAVIENT’S INDEPENDENT REGISTERED PUBLIC ACCOUNTING FIRM FOR 2020.
| 2020 Proxy Statement | | 36 |
Independent Registered Public Accounting Firm
Fees Paid to Independent Registered Public Accounting Firms for 2019 and 2018
Aggregate fees billed for services performed for Navient by its independent accountant, KPMG, for the fiscal years ended December 31, 2019, and 2018, are set forth below.
| 2019 | 2018 | |
| Audit Fees | $4,132,351 | $3,353,617 |
| Audit-Related Fees | $1,021,909 | $1,017,232 |
| Tax Fees | $378,881 | $822,374 |
| All Other Fees | - | - |
| Total | $5,533,141 | $5,193,223 |
Audit Fees. Audit fees include fees for professional services rendered for the audits of the consolidated financial statements of Navient and statutory and subsidiary audits, issuance of comfort letters, consents, income tax provision procedures, and assistance with review of documents filed with the SEC.
Audit-Related Fees. Audit-related fees include fees for assurance and other services related to service provider compliance reports, trust servicing and administration reports, internal control reviews, and attest services that are not required by statute or regulation.
Tax Fees. Tax fees include fees for federal and state tax compliance, and tax consultation services.
Pre-approval Policies and Procedures
The Audit Committee has a policy that addresses the approval of audit and non-audit services to be provided by the independent registered public accounting firm to the Company. The policy requires that all services to be provided by the Company’s independent registered public accounting firm be pre-approved by the Audit Committee or its Chair. Each approval of the Audit Committee or the Chair of the Audit Committee must describe the services provided and set a dollar limit for the services. The Audit Committee, or its Chair, pre-approved all audit and non-audit services provided by KPMG during 2019. Reporting is provided to the Audit Committee regarding services that the Chair of the Audit Committee pre- approved between committee meetings. The Audit Committee receives regular reports from management regarding the actual provision of all services by KPMG. No services provided by our independent registered public accounting firm were approved by the Audit Committee pursuant to the “de minimis” exception to the pre-approval requirement set forth in paragraph (c)(7)(i)(C) of Rule 2-01 of Regulation S-X.
| 2020 Proxy Statement | | 37 |
Report of the Audit Committee
The following report shall not be deemed incorporated by reference in any filing under the federal securities laws by virtue of any general incorporation of this proxy statement by reference and shall not otherwise be treated as filed under the federal securities laws.
The Audit Committee is responsible for monitoring our financial reporting processes and system of internal controls, supervising our internal auditors and overseeing the independence and performance of the independent auditors. In carrying out these responsibilities, the Audit Committee meets, on a regular basis, with our internal auditors and our independent auditors to review the overall scope and plans for their respective audits of our financial statements. The Audit Committee also meets privately (and in separate meetings) with members of management, our independent auditors and our internal auditors as may otherwise be needed. The Audit Committee meets with management and with the independent auditors each quarter to review and discuss the Company’s quarterly reports on Form 10-Q prior to their being filed with the SEC and annually to review and discuss the Company’s Annual Report on Form 10-K. The Committee also meets with management and our independent auditors to review and discuss the Company’s quarterly earnings prior to review by the Executive Committee and public release.
The Audit Committee’s responsibility is to monitor and oversee the audit and financial reporting processes. However, the members of the Audit Committee are not practicing certified public accountants or professional auditors and rely, without independent verification, on the information provided to them and on the representations made by management, and the report issued by the independent registered public accounting firm. While the Audit Committee and the Board monitor the Company’s financial record-keeping and controls, management is ultimately responsible for the Company’s financial reporting process, including its system of internal controls, disclosure control procedures and the preparation of the financial statements. The independent auditors support the financial reporting process by performing an audit of the Company’s financial statements and issuing a report thereon.
The Audit Committee has reviewed and discussed with management and Navient’s independent registered accounting firm, KPMG LLP, the Company’s audited financial statements as of and for the year ended December 31, 2019. The Audit Committee also discussed with KPMG LLP the matters under Public Company Accounting Oversight Board (“PCAOB”) standards, including among other things, those relating to the audit of our financial statements.
The Audit Committee received, reviewed and discussed with KPMG LLP the written disclosures and letter (as required by applicable requirements of the PCAOB) regarding the independent accountant’s communications with the Audit Committee about the firm’s independence.
Based on these reviews and discussions, the Audit Committee recommended to the Board of Directors that the financial statements referred to above be included in the 2019 Annual Report on Form 10-K for the year ended December 31, 2019, for filing with the Securities and Exchange Commission.
Audit Committee
Anna Escobedo Cabral, Chair
Frederick Arnold
Marjorie L. Bowen
Laura S. Unger
| 2020 Proxy Statement | | 38 |
Ownership of Common Stock
The following table provides information, as of March 10, 2020, about each shareholder known to Navient to beneficially own more than five percent of the outstanding shares of our Common Stock, based solely on the information filed by each such shareholder on Schedules 13D or 13G with the SEC on the dates indicated in the footnotes to this table (percentages are calculated assuming continuous beneficial ownership at March 23, 2020).
| Name and Address of Beneficial Owner | Shares | Percent |
The Vanguard Group, Inc. (1) | 27,510,806 | 12.44% |
| 100 Vanguard Blvd. | ||
| Malvern, PA 19355 | ||
BlackRock Inc. (2) | 19,358,945 | 10% |
| 40 East 52nd Street | ||
| New York, NY 10022 | ||
Dimensional Fund Advisors LP (3) | 14,752,125 | 6.67% |
| Building One | ||
| 6300 Bee Cave Road | ||
| Austin, Texas 78746 | ||
| (1) | This information is based on the Schedule 13G/A filed with the SEC by The Vanguard Group, Inc., on February 11, 2020. The Vanguard Group, Inc., directly and through its subsidiaries, has sole power to vote or direct the voting of 101,258 shares of Common Stock, shared voting power of 40,510 shares, sole power to dispose of or direct the disposition of 27,396,166 shares of Common Stock, and shared power to dispose of or direct the disposition of 114,640 shares of Common Stock. According to this Schedule 13G/A, Vanguard Fiduciary Trust Company, a wholly owned subsidiary of The Vanguard Group, Inc., beneficially owns 74,130 shares of Common Stock; and Vanguard Investments Australia, Ltd., a wholly owned subsidiary of The Vanguard Group, Inc., beneficially owns 67,638 shares of Common Stock. |
| (2) | This information is based on the Schedule 13G/A filed with the SEC by BlackRock, Inc. on March 9, 2020. BlackRock, Inc. has sole power to vote or direct the voting of 18,451,823 shares of Common Stock and has sole power to dispose of or direct the disposition of for 19,358,945 shares of Common Stock. |
| (3) | This information is based on the Schedule 13G filed with the SEC by Dimensional Fund Advisors LP on February 12, 2020. Dimensional Fund Advisors LP, an investment adviser registered under Section 203 of the Investment Advisors Act of 1940, furnishes investment advice to four investment companies registered under the Investment Company Act of 1940, and serves as investment manager or sub-adviser to certain other commingled funds, group trusts and separate accounts (such investment companies, trusts and accounts, collectively referred to as the “Funds”). The Funds directly have sole power to vote or direct the voting of 14,374,107 shares of Common Stock, and sole power to dispose of or direct the disposition of 14,752,125 shares of Common Stock. |
| 2020 Proxy Statement | | 39 |
Ownership of Common Stock by Directors and Executive Officers
The following table sets forth information concerning the beneficial ownership of Navient’s Common Stock by: (i) our current directors and director nominees; (ii) the named executive officers listed in the Summary Compensation Table; and (iii) all of the Company’s current directors and executive officers as a group. Under SEC rules, beneficial ownership for purposes of this table takes into account stock as to which the individual has or shares voting and/or investment power as well as stock that may be acquired within 60 days (such as by exercising vested stock options). Information is provided as of March 3, 2020. The beneficial owners listed have sole voting and investment power with respect to stock beneficially owned, except as to the interests of spouses or as otherwise indicated. As of March 3, 2020, there were 194,143,990 shares of our Common Stock issued, outstanding and entitled to vote.
Director Nominees | Shares (1) | Vested Options (2) | Total Beneficial Ownership (3) | Percent of Class |
| Frederick Arnold | 28,551 | - | 28,551 | * |
Marjorie L. Bowen(4) | 12,218 | - | 12,218 | * |
Anna Escobedo Cabral(5) | 56,348 | - | 56,348 | * |
Larry A. Klane(6) | 11,952 | - | 11,952 | * |
| Katherine A. Lehman | 59,565 | - | 59,565 | * |
| Linda A. Mills | 76,002 | - | 76,002 | * |
Jane J. Thompson(7) | 62,162 | - | 62,162 | * |
Laura S. Unger(8) | 58,909 | - | 58,909 | * |
David L. Yowan(9) | 40,039 | - | 40,039 | * |
| Named Executive Officers | ||||
Jack Remondi(10) | 2,590,375 | 111,358 | 2,701,733 | 1.38% |
Christian Lown(11) | 316,849 | - | 316,849 | * |
John Kane(12) | 464,527 | 36,553 | 501,080 | * |
Mark Heleen(13) | 286,085 | - | 286,085 | * |
Steve Hauber(14) | 144,510 | 19,529 | 164,039 | * |
| Directors and Current Officers as a Group | 4,208,092 | 167,440 | 4,375,532 | 2.24% |
| (14 Persons) | ||||
| * | Less than one percent |
| (1) | Shares of Common Stock and stock units held directly or indirectly, including vested deferred stock units and unvested deferred stock units that may vest within 60 days of March 3, 2020, credited to Company-sponsored retirement and deferred compensation plans. Totals for named executive officers include (i) restricted stock units (“RSUs”) that vest and are converted into shares only upon the passage of time, (ii) performance stock units (“PSUs”) that vest and are converted into shares upon the satisfaction of pre-established performance conditions, and (iii) associated dividend equivalent units (“DEUs”) issued on outstanding RSUs and PSUs. The individuals holding such RSUs, PSUs and DEUs have no voting or investment power over these units. |
| (2) | Shares that may be acquired within 60 days of March 3, 2020, through the exercise of stock options. The stock options held by our officers are net- settled pursuant to their terms (i.e., shares are withheld upon exercise to cover the aggregate exercise price, and the net resulting shares are delivered to the option holder). Net-settled stock options therefore are shown on a “spread basis,” with out-of-the-money options shown as 0. |
| (3) | Total of columns 1 and 2. Except as otherwise indicated and subject to community property laws, each owner has sole voting and sole investment power with respect to the shares listed. |
| (4) | For Ms. Bowen, 12,218 shares are deferred stock units credited to a Company-sponsored deferred compensation plan account. Ms. Bowen is not being nominated by the Board for reelection, and her tenure as a director will end when her current term expires at our 2020 Annual Meeting. |
| (5) | For Ms. Cabral, 38,122 shares are deferred stock units credited to a Company-sponsored deferred compensation plan account. |
| (6) | For Mr. Klane, 4,610 shares are deferred stock units credited to a Company-sponsored deferred compensation plan account. |
| (7) | For Ms. Thompson, 55,901 shares are deferred stock units credited to a Company-sponsored deferred compensation plan account. |
| (8) | For Ms. Unger, 18,011 shares are deferred stock units credited to a Company-sponsored deferred compensation plan account. |
| 2020 Proxy Statement | | 40 |
| (9) | For Mr. Yowan, 10,564 shares are deferred stock units credited to a Company-sponsored deferred compensation plan account. |
| (10) | Mr. Remondi’s share ownership includes 250 shares held as custodian for his child. 930,530 of the shares reported in this column are RSUs, PSUs or DEUs over which Mr. Remondi has no voting or dispositive control. |
| (11) | 259,418 of the shares reported in this column are RSUs, PSUs, or DEUs over which Mr. Lown has no voting or dispositive control. |
| (12) | 207,265 of the shares reported in this column are RSUs, PSUs or DEUs over which Mr. Kane has no voting or dispositive control. 1,250 shares are deferred stock units credited to a Company-sponsored deferred compensation plan account. |
| (13) | 144,125 of the shares reported in this column are RSUs, PSUs or DEUs over which Mr. Heleen has no voting or dispositive control. |
| (14) | 96,724 of the shares reported in this column are RSUs, PSUs or DEUs over which Mr. Hauber has no voting or dispositive control. |
| 2020 Proxy Statement | | 41 |
Executive Officers
Our executive officers are appointed annually by the Board of Directors. The following sets forth biographical information concerning Navient’s executive officers who are not directors. Biographical information for Mr. Remondi is included in Proposal 1 — Election of Directors.
| Name and Age | Position and Business Experience |
Christian Lown 50 | • Chief Financial Officer, Navient — March 2017 to present • Managing Director and Co-Head, Global Financial Technology Group, North America Banks and Diversified Finance, Morgan Stanley — 2006 to March 2017 • Vice President, Financial Institutions Group — UBS AG — 2003 to 2006 • Associate, Financial Institutions Group, Credit Suisse First Boston — 2001 to 2003 |
John Kane 51 | • Group President, Business Processing Solutions, Navient — June 2015 to present • Chief Operating Officer, Navient — April 2014 to June 2015 • Senior Vice President — Enterprise Project Management, SLM Corporation — March 2013 to April 2014 • Senior Vice President — Credit, SLM Corporation — August 2011 to March 2013 • Senior Vice President — Collections, SLM Corporation — 2008 to 2011 • Senior Vice President — Consumer Credit Operations, MBNA/Bank of America — 1990 to 2008 |
Mark L. Heleen 57 | • Chief Legal Officer and Secretary, Navient — February 2015 to present • Senior Vice President and Senior Deputy General Counsel, Navient — June 2014 to February 2015 • Senior Attorney, Cadwalader Wickersham & Taft LLP — August 2013 to June 2014 • Independent Consultant — January 2011 to August 2013 • Executive Vice President and General Counsel, SLM Corporation — February 2009 to December 2010 • Various roles in the Office of the General Counsel, SLM Corporation — July 1998 to February 2009 |
Steve Hauber 45 | • Chief Risk and Compliance Officer, Navient — June 2017 to present • Chief Audit Officer, Navient — April 2014 to June 2017 • Chief Audit Officer, SLM Corporation — January 2011 to April 2014 |
| 2020 Proxy Statement | | 42 |
Proposal 3 — Advisory Vote on Executive Compensation
Navient is asking shareholders to approve an advisory resolution (commonly referred to as a “say-on-pay” resolution) on the Company’s executive compensation as reported in this proxy statement. Navient urges shareholders to read the “Compensation Discussion and Analysis” section of this proxy statement, which describes how the Company’s executive compensation policies and procedures operate and are designed, as well as the Summary Compensation Table and other related compensation tables and narrative, which provide detailed information on the compensation paid to our named executive officers (“NEOs”).
This proposal gives you, as a shareholder, the opportunity to express your views on our NEOs’ compensation. Your vote is not intended to address any specific item of our compensation program, but rather to address our overall approach to and objectives of the compensation paid to our NEOs as described in this proxy statement. In accordance with Section 14A of the Securities Exchange Act of 1934, as amended (the “Exchange Act”), Navient is asking shareholders to approve the following advisory resolution at the Annual Meeting:
“Resolved, that Navient’s shareholders approve, on an advisory basis, the compensation paid to the Company’s named executive officers, as disclosed in the Compensation Discussion and Analysis and the related compensation tables and narrative disclosure in this proxy statement.”
The Company conducted a similar advisory vote at our last annual meeting of shareholders. At that time, shareholders expressed support for the 2018 compensation of our NEOs, with approximately 94% of the votes present in person or represented by proxy at the meeting and entitled to vote on the matter approving the 2018 compensation of our NEOs.
The Board of Directors believes that the Company’s 2019 executive compensation program strongly aligned pay to actual performance. Shareholders are encouraged to read the “Compensation Discussion and Analysis” section, which describes Navient’s executive compensation program in detail, including how it is designed to achieve the Company’s compensation objectives and how the Company’s performance in 2019 was reflected in the compensation of our NEOs.
This proposal to approve the resolution regarding the compensation paid to Navient’s NEOs requires the affirmative vote of the holders of a majority of the Common Stock present, represented and entitled to vote, and voting affirmatively or negatively at the Annual Meeting. Accordingly, shares that are not voted affirmatively or negatively with respect to this proposal, including abstentions and broker non-votes, will not be relevant to the outcome.
As an advisory vote, the “say-on-pay” resolution is not binding on Navient. The Board of Directors, however, values the opinions of our shareholders as expressed through their votes. Accordingly, the Board of Directors as well as the Compensation Committee will review and consider the results of the “say-on-pay” vote, the opinions of our shareholders, and other relevant factors in making future decisions regarding our executive compensation program.
Board Recommendation
THE BOARD OF DIRECTORS RECOMMENDS A VOTE “FOR” THE APPROVAL, ON AN ADVISORY BASIS, OF THE COMPENSATION PAID TO OUR NAMED EXECUTIVE OFFICERS, AS DISCLOSED IN THE COMPENSATION DISCUSSION AND ANALYSIS AND THE RELATED COMPENSATION TABLES AND NARRATIVE DISCLOSURE IN THIS PROXY STATEMENT.
| 2020 Proxy Statement | | 43 |
Proposal 4 — Advisory Vote on Say-on-Pay Frequency
Section 14A of the Exchange Act requires that we provide our shareholders with the opportunity to vote, on a non- binding advisory basis, regarding whether the non-binding advisory shareholder vote on compensation paid to our named executive officers should occur every one, two, or three years. This non-binding advisory vote is commonly referred to as “Say-on-Frequency.” In 2015, the Company conducted an advisory vote on Say-on-Frequency. At that time, our shareholders indicated their preference for future advisory votes to be held annually, and consistent with the shareholders’ vote, the Board adopted a policy providing for annual advisory votes to approve the Company’s executive compensation. This year, we are again conducting an advisory vote on Say-on-Frequency.
After careful consideration of the various arguments supporting each frequency level, the Board of Directors has determined that holding a non-binding advisory vote on executive compensation annually remains the most appropriate frequency for Navient. Although our executive compensation programs are designed to promote a long-term correlation between pay and performance, the Board of Directors recognizes that executive compensation decisions are an ongoing process. We believe that holding an annual advisory vote on executive compensation will provide us with shareholder feedback on our compensation practices and policies on a regular, frequent basis and is consistent with our objective of further engaging with our shareholders on executive compensation and corporate governance matters. Accordingly, the Board recommends that you vote for ONE YEAR (i.e., once every year) as the frequency of future advisory votes on executive compensation. Because this proposal is advisory, it will not be binding on Navient. However, the Board of Directors values our shareholders’ opinions, and will consider the outcome of the result of the vote on this proposal when determining the frequency of future non-binding advisory votes on compensation paid to our named executive officers.
With respect to this proposal, the frequency of the non-binding advisory vote on compensation paid to our named executive officers (namely, every one, two or three years) receiving the greatest number of votes will be considered the frequency recommended by our shareholders. Accordingly, shares that are not voted for a specific frequency with respect to this proposal, including abstentions and broker non-votes, will not be relevant to the outcome.
Board Recommendation
THE BOARD OF DIRECTORS RECOMMENDS THAT YOU SELECT ONE YEAR AS THE FREQUENCY OF NON- BINDING ADVISORY VOTES ON COMPENSATION PAID TO OUR NAMED EXECUTIVE OFFICERS
| 2020 Proxy Statement | | 44 |
Executive Compensation
Compensation and Personnel Committee Report
The following report shall not be deemed incorporated by reference in any filing under the federal securities laws by virtue of any general incorporation of this proxy statement by reference and shall not otherwise be treated as filed under the federal securities laws.
The Compensation and Personnel Committee of the Board of Directors has reviewed the Compensation Discussion and Analysis required by Item 402(b) of Regulation S-K and discussed it with the Company’s management, and based on its review and discussions with management, the Compensation and Personnel Committee recommended to the Board of Directors that the Compensation Discussion and Analysis be included in the Annual Report on Form 10-K for the fiscal year ended December 31, 2019, and this proxy statement.
Compensation and Personnel Committee
Jane J. Thompson, Chair
Larry A. Klane
Katherine A. Lehman
David L. Yowan
| 2020 Proxy Statement | | 45 |
Compensation Discussion and Analysis
Introduction
This Compensation Discussion and Analysis (“CD&A”) provides information regarding our executive compensation guiding principles, the elements of our executive compensation program, the factors that were considered in making compensation decisions for our “named executive officers” or “NEOs” in 2019, and how we have modified our programs to meet Navient’s needs in the future.
Navient’s Compensation and Personnel Committee (the “Compensation Committee” or simply the “Committee”) is responsible for establishing and overseeing our executive compensation program, including the program’s underlying philosophy, objectives and related policies. The Committee is composed of Ms. Thompson (Chair), Mr. Klane, Ms. Lehman and Mr. Yowan.
This CD&A presents information for the following Navient NEOs:
| • | Jack Remondi, President and Chief Executive Officer |
| • | Christian Lown, Chief Financial Officer |
| • | John Kane, Group President, Business Processing Solutions |
| • | Mark Heleen, Chief Legal Officer and Secretary |
| • | Steve Hauber, Chief Risk and Compliance Officer |
Executive Summary
Navient’s executive compensation program emphasizes the link between pay and performance, aligning the compensation of our executives with the interests of our shareholders. Our executive compensation program balances annual and long- term performance measures, including a mix of financial, operational and strategic goals that promote effective management of our legacy loan portfolio, improvements and growth in our private education loan portfolio and non-education fee revenues, profitable growth in our business services segment and expense control. Individual performance goals also are established for each of our NEOs. This section summarizes Navient’s performance in 2019 and the impact of that performance on the compensation paid to our NEOs.
Navient’s 2019 Performance
Navient’s 2019 results reflect successful and disciplined management across our businesses. Our 2019 results included key successes such as strong EPS performance, continued growth in our consumer lending business, improved loan portfolio performance, continued financing actions to maximize the net interest margin for our loan portfolios and minimize interest expense and improved EBITDA in our business processing segment. Our strong performance in 2019 results from using our expertise, systems and data-driven strategies to create shareholder value by maximizing cash flows, originating high-quality loans at attractive risk-adjusted returns, growing our fee revenue, and improving operating efficiency.
The chart on the following page illustrates our key achievements in 2019 and the link between those achievements and our executive compensation program:
| 2020 Proxy Statement | | 46 |
Navient’s 2019 Performance | |||
Provide Consistent Return to Shareholders | Successfully Manage Our Liquidity Needs | Pursue Loan Portfolio Acquisitions | |
2019 Performance Highlights | • Returned $587 million to our shareholders through dividends and share repurchases, representing a 97% payout ratio • Adjusted Diluted “Core Earnings” Per Share of $2.64, beating the target in our 2019 annual incentive plan by 36% | • Issued $2.7 billion in FFELP loan asset-backed securities (“ABS”) and $4.1 billion in private education loan ABS • Retired $2 billion of senior unsecured debt • Reduced the interest expense we otherwise would have incurred in 2019 by over $90 million | • Acquired $20 billion in education loans during 2017-19, which added to our consistent and predictable cash flows |
Annual Incentive Measures | • Adjusted Diluted “Core Earnings” Per Share8 • Adjusted “Core Earnings” Operating Expenses9 | • Adjusted Diluted “Core Earnings” Per Share • Adjusted “Core Earnings” Operating Expenses | • Adjusted Diluted “Core Earnings” Per Share • Adjusted “Core Earnings” Operating Expenses |
Long-term Incentive Measures | • Grow Intrinsic Value of Company • Cumulative Net Student Loan Cash Flows10 | • Grow Intrinsic Value of Company • Cumulative Net Student Loan Cash Flows | • Pursue Opportunistic Loan Portfolio Acquisitions • Cumulative Net Student Loan Cash Flows |
| Increase Business Processing EBITDA | Grow Our Consumer Lending Business | Improve Performance of Our Private Eduation Loan Portfolio | |
2019 Performance Highlights | • Increased Business Processing EBITDA by 11% from 2018 but fell below the target in our 2019 annual incentive plan | • Originated $4.9 billion in private education refinance loans, significantly above the $3.65 billion target in our 2019 annual incentive plan | • Reduced private education loan delinquency rate 22% from 2018 • Due to improved laon performance, we were able to reduce our private education loan provision by $73 million from 2018 |
Annual Incentive Measures | • Business Processing EBITDA11 | • Consumer Lending New Loan Volume • Adjusted Diluted “Core Earnings” Per Share | • Private Education Loan Gross Defaults • Adjusted Diluted “Core Earnings” Per Share |
Long-term Incentive Measures | • Revenue from Growth Businesses • Improve Margins in Fee Businesses | • Grow Intrinsic Value of Company • Cumulative Net Student Loan Cash Flows | • Grow Intrinsic Value of Company |
8 | Adjusted Diluted “Core Earnings” Per Share excludes net restructuring and regulatory-related charges, as well as certain extraordinary items such as strategic corporate transactions or other unusual or unplanned events. Adjusted Diluted “Core Earnings” Per Share is a non-GAAP financial measure that does not represent a comprehensive basis of accounting. For more information on the definition of Adjusted Diluted “Core Earnings” Per Share please refer to page 30 of our 2019 Annual Report filed on Form 10-K on February 27, 2020. For a reconciliation of our non-GAAP financial measures with GAAP results, please refer to the discussion on pages 37–52 of our 2019 Annual Report, or refer to the Investor Relations section of our website located at http://www.navient.com/about/investors/. |
9 | Adjusted “Core Earnings” Operating Expenses excludes net restructuring and regulatory-related charges, as well as certain extraordinary items such as strategic corporate transactions or other unusual or unplanned events. Adjusted “Core Earnings” Operating Expenses is a non-GAAP financial measure that does not represent a comprehensive basis of accounting. For more information on the definition of Adjusted “Core Earnings” Operating Expenses and for a reconciliation of non-GAAP financial measures with GAAP results, please refer to our Investor Presentation for Fourth Quarter and Full Year 2019 on the Investor Relations section of our website located at http://www.navient.com/about/investors/. |
10 | “Cumulative Net Student Loan Cash Flows” is a non-GAAP financial measure that does not represent a comprehensive basis of accounting. For more information on the definition of cumulative net student loan cash flows, please refer to the definition at footnote 16. |
11 | Earnings Before Interest, Taxes, Depreciation and Amortization Expense (“EBITDA”) is a non-GAAP financial measure that does not represent a comprehensive basis of accounting. For more information on the definition of EBITDA and for a reconciliation of non-GAAP financial measures with GAAP results, please refer to the discussion on page 45 of our 2019 Annual Report filed on Form 10-K on February 27, 2020, or refer to the Investor Relations section of our website located at http://www.navient.com/about/investors/. |
| 2020 Proxy Statement | | 47 |
Pay for Performance in 2019
Because our executive compensation program directly links pay to performance, the Company’s strong performance in 2019 is reflected in the 2019 incentive compensation earned by our executives, which is summarized in the sections below.
Annual Incentives. Our annual incentive plan—known as the Management Incentive Plan (“MIP”)—is designed to drive short-term performance and shareholder value by focusing on key performance measures tied to our annual operating plan. The 2019 MIP incorporated the following performance metrics designed to drive critical pieces of our 2019 operating plan:
| 2019 MIP Performance Metric | Weight | Rationale |
Adjusted Diluted “Core Earnings” Per Share12 | 35% | • Measures overall management effectiveness |
• Promotes shareholder value | ||
• Key financial metric for investors | ||
| Consumer Lending New Loan Volume | 20% | • Emphasizes growth in strategic businesses |
• Offers refinance opportunities to our existing customers, which helps retain and grow our customer base | ||
• Loan volume is a key focus in order to scale this growing business | ||
• All loan volume is subject to the Company’s Board-approved risk and return guidelines (e.g., regarding consumer credit quality, cost-to-acquire, net interest margin) | ||
Business Processing EBITDA13 | 20% | • Emphasizes profitable growth in strategic businesses |
• Growth helps to offset company-wide expenses as our legacy loan portfolio amortizes | ||
Adjusted “Core Earnings” Operating Expenses14 | 15% | • Focuses management attention on expense reduction as our legacy loan portfolio amortizes |
• Key financial metric for investors, which is also critical to the achievement of our Adjusted Diluted “Core Earnings” Per Share goal | ||
| Private Education Loan Gross Defaults | 10% | • Enhances the profitability of our private education loan portfolio |
• Aids our private education student loan customers | ||
• Key financial metric for investors |
Performance against three of the five MIP goals in 2019 was notably strong, with each resulting in a payout factor at or near the maximum of 150%. Performance against the remaining two MIP goals was below target thereby reducing the overall performance score. The following chart summarizes Navient’s performance in 2019 relative to goals established for these performance metrics, which resulted in above-target payments under the 2019 MIP.
| 2019 Management Incentive Plan | ||||||||
| 2019 Performance Metric | Performance Target | 2019 Actual Performance | Payout Factor | Weighting | Performance Score | |||
| Adjusted Diluted “Core Earnings” Per Share | $ | 1.94 | $ | 2.64 | 150.0% | 35% | 52.5% | |
| Consumer Lending New Loan Volume (millions) | $ | 3,651 | $ | 4,903 | 150.0% | 20% | 30.0% | |
| Business Processing EBITDA (millions) | $ | 60 | $ | 49 | 55.0% | 20% | 11.0% | |
Adjusted “Core Earnings” Operating Expenses15 (millions) | $ | 949 | $ | 965 | 82.7% | 15% | 12.4% | |
| Private Education Loan Gross Defaults (millions) | $ | 459 | $ | 428 | 130.5% | 10% | 13.1% | |
| Overall Performance Score: | 119.0% | |||||||
Our 2019 Management Incentive Plan is described in greater detail beginning on page 57.
12 | See footnote 8 above. |
13 | See footnote 11 above. |
14 | See footnote 9 above. |
15 | Excludes $6 million in regulatory-related expenses, $6 million in restructuring expenses and $12.5 million in expenses relating to the Canyon Agreement. For additional information pertaining to the Canyon Agreement, please refer to “Shareholder Engagement and Communications with the Board” above. |
| 2020 Proxy Statement |  | 48 |
Long-term Incentives. Our long-term incentive program is designed to drive longer-term performance and shareholder value by delivering a significant portion of NEO compensation through equity awards, including performance stock units (“PSUs”). Fiscal year 2019 marked the final year of a three-year performance period associated with PSUs granted to our executive team in early 2017 as part of our long-term incentive program.
These 2017-19 PSUs were designed to vest in early 2020 based on performance through the end of 2019, with a potential payout ranging from 0% to 150% of the target number of units, determined by cumulative performance over the 2017-19 performance period. The following performance metrics were selected in early 2017 to focus management on specific long- term business objectives:
| 2017-19 PSU Performance Metric | Weight | Rationale |
| Cumulative Net Student Loan Cash Flows | 50% | • Promotes successful management of our loan portfolios |
• Critical driver of shareholder value, supporting dividends, share repurchases and debt payments | ||
• Supports growth of strategic businesses, including consumer lending | ||
| Cumulative Revenue from Growth Businesses | 30% | • Emphasizes strategic growth as our legacy loan portfolio amortizes |
• Offsets Company-wide expenses as our legacy loan portfolio amortizes | ||
| Strategic Objectives | 20% | • Focuses management on critical, long-term strategic goals |
The following chart summarizes the Company’s cumulative performance over the 2017-19 performance period relative to the targets established for each of these metrics. Our continued strong performance during this three-year period resulted in the 2017-19 PSUs vesting at 109% of the target number of units.
| 2017-19 Performance Stock Units | ||||||||
| 2017-19 Performance Metric | Performance Target | 2017-19 Actual Performance | Payout Factor | Weight | Performance Score | |||
Cumulative Net Student Loan Cash Flows16 (millions) | $ | 7,850 | $ | 8,818 | 135% | 50% | 67% | |
Cumulative Revenue from Growth Businesses17 (millions) | $ | 995 | $ | 839 | 65% | 30% | 20% | |
| Strategic Objectives | 110% | 20% | 22% | |||||
• Pursue Opportunistic Loan Portfolio Acquisitions • Capture Operating Efficiencies in Asset Servicing • Improve Margins in Fee Businesses • Build Strong Relationships with State and Federal Regulators • Grow Intrinsic Value of Company | ||||||||
| Overall Performance Score: | 109% |
The Committee considered management’s key achievements during the 2017-19 performance period when assessing the Company’s performance relative to the strategic goals established at the beginning of that period. These key achievements are set forth in the table on the following page.
16 | Cumulative Net Student Loan Cash Flows is a non-GAAP financial measure that does not represent a comprehensive basis of accounting. Cumulative Net Student Loan Cash Flows include aggregate cash flows net of secured borrowings from student loans realized for the fiscal years 2017, 2018 and 2019, including student loan cash flows realized from new acquisitions, but excluding the impact of cash flows for fiscal years beyond 2019 that are accelerated through securitizing or pledging unencumbered student loans or through loan sales. |
17 | Cumulative Revenue from Growth Businesses includes that portion of the Company’s aggregate revenue for fiscal years 2017-19 from non-federal-loan-related businesses. |
| 2020 Proxy Statement | | 49 |
| 2017-19 Performance Stock Units | |
| 2017-19 Strategic Objectives | Achievements |
| Pursue Opportunistic Loan Portfolio Acquisitions | • Acquired $20 billion in student loans between 2017-19, significantly enhancing cash flows from our amortizing loan portfolio |
• Exceeded acquisition targets by 100% | |
| Capture Operating Efficiencies in Asset Servicing | • Reduced direct servicing unit cost between 2017-19 while improving customer satisfaction |
• Continued to implement automation and system enhancements, as well as program and procedural improvements, that have driven down expenses and improved efficiency | |
| Improve Margins in Fee Businesses | • Business Processing EBITDA margins significantly improved over three-year period. |
| • Implemented operational improvements to improve efficiency and increase revenue, including robotic process automations and call optimization efforts | |
| • Secured several large-scale healthcare revenue cycle management engagements | |
| Build Strong Relationships with State and Federal Regulators | • Established or reestablished dialogue with various regulatory bodies |
• Received positive examinations from key federal and state regulators | |
| • Continued to execute on strategy to provide fact-based responses to ongoing litigation | |
| Grow Intrinsic Value of Company | • Private education loan delinquencies reached historic lows |
| • Reduced the interest expense we otherwise would have incurred through a variety of financing initiatives | |
• Value delivered to shareholders through dividends and share repurchases | |
| • Maintained stable ratings with all three credit rating agencies | |
These strategic goals were established at the beginning of the three-year period to be challenging but achievable. In evaluating management’s performance over the entire performance period, the Committee considered the business environment during the performance period and its impact on the difficulty of achieving the strategic goals. Based on its evaluation of the strategic goal achievements individually and overall, the Committee determined that management’s accomplishments relative to these strategic goals warranted a payout factor of 110% out of a maximum payout factor of 150%.
| 2020 Proxy Statement | | 50 |
CEO Realizable Pay
Our pay-for-performance approach over the past five years is highlighted in the chart below, which shows the alignment between the Company’s performance (as measured by cumulative total shareholder return (“TSR”)) and the annual Realizable Pay (as defined below) of our CEO over the past five fiscal years.
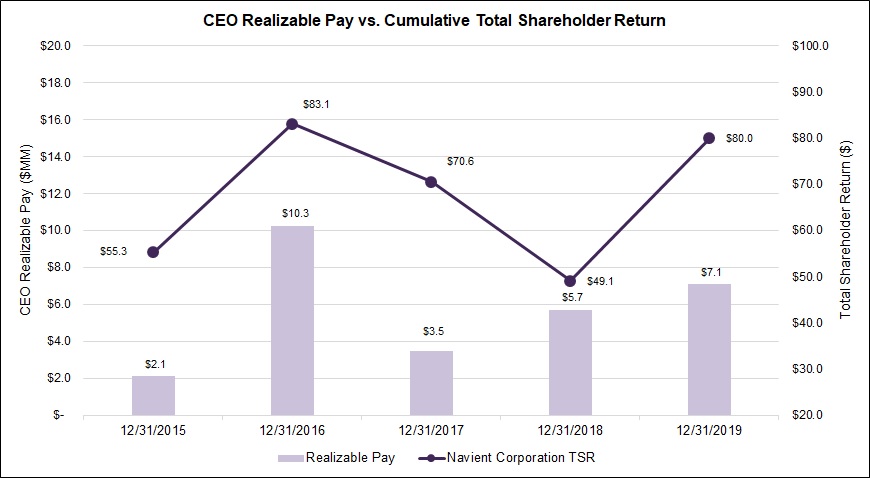
The Committee believes that analysis of Realizable Pay allows a more complete understanding of the pay-for-performance relationship than sole reliance on amounts shown in the Summary Compensation Table, which reflects the grant date value of various equity awards. The table below compares the components of Mr. Remondi’s Realizable Pay for 2019, 2018, 2017, 2016 and 2015.
| Year | Base Salary ($) | Annual Incentive Compensation ($) | PSUs ($) | RSUs ($) | Stock Options ($) | Total ($) | ||
| 2019 | 1,000,000 | 1,785,000 | 1,926,497 | 2,391,606 | 0 | 7,103,103 | ||
| 2018 | 1,000,000 | 1,896,000 | 2,309,255 | 517,094 | 0 | 5,722,349 | ||
| CEO Realizable Pay | 2017 | 1,000,000 | 1,444,500 | 0 | 1,032,553 | 0 | 3,477,053 | |
| 2016 | 1,000,000 | 1,666,500 | - | 2,067,157 | 5,527,226 | 10,260,883 | ||
| 2015 | 1,000,000 | 735,000 | - | 370,201 | 0 | 2,105,201 |
Realizable Pay for each of the applicable fiscal years is the sum of base salary paid, annual incentive award earned, the year-end value of RSUs and stock options granted under the Company’s long-term incentive program in that year, and the value of any PSUs with a performance period ending in that fiscal year. Stock awards are valued as of the end of each fiscal year and include the “in-the-money” value of stock options,18 RSUs and PSUs (excluding accrued dividend equivalent units on RSUs and PSUs).
Because the Company typically grants equity awards in February each year, the year-end value of these equity awards may be significantly greater or less than the grant-date value depending on whether the price of our common stock has increased or decreased by the end of the year. For example, the year-end value of stock options and RSUs granted in early
18 | For 2019, the Committee decided to discontinue the prior practice of granting stock options as part of the Company’s long-term incentive program. Our 2019 long-term incentive program is described in greater detail beginning on page 60. |
| 2020 Proxy Statement | | 51 |
2016 was substantially greater than the value of these awards upon grant, as the price of our common stock increased between the February 2016 grant date and December 31, 2016, while the opposite was true for RSUs granted in early 2019.
PSUs typically vest based on cumulative performance over three fiscal years. For example, PSUs granted in early 2015 were designed to vest at the end of 2017 based on cumulative performance over the 2015-17 fiscal years. Due to the Company’s performance during that three-year period, the value at the end of the fiscal 2017 was zero as none of the PSUs were earned. PSUs granted in early 2016 vested at 125% of the target number of units based on the Company’s performance over the applicable 2016-18 performance period, while PSUs granted in early 2017 vested at 109% of the target number of units based on the Company’s performance over the applicable 2017-19 performance period.
Cumulative TSR assumes a base investment of $100 at December 31, 2014 and reinvestment of dividends through December 31, 2019.
Navient’s Compensation Philosophy and Objectives
We provide each of our NEOs with a compensation package that is tied to performance and aligned with the interests of our shareholders. The Compensation Committee utilizes the following guiding principles to design, implement, and monitor our executive compensation program:
| • | Align Compensation with Shareholder Interests. For 2019, 87% of the total direct compensation opportunity provided to our CEO was at-risk and aligned with shareholder value, including incentive awards that depend upon the attainment of specific performance objectives, the value of Navient’s Common Stock or both. This feature of our executive compensation program is highlighted in the charts below. |
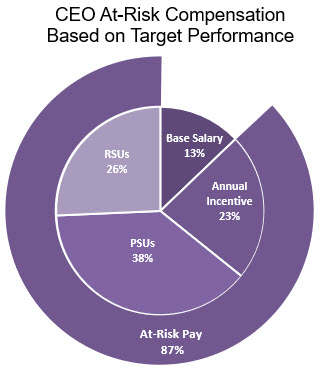 | 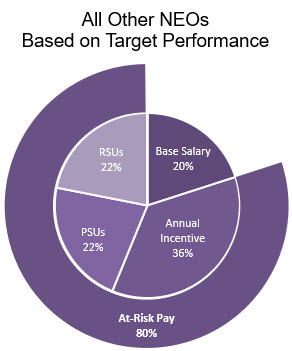 |
For 2019, the Compensation Committee decided to discontinue the prior practice of granting stock options as part of our long-term incentive program, which is described in greater detail beginning on page 60.
| • | Pay for Performance. As illustrated above, more than 50% of the full-year total compensation at target for our NEOs is delivered through annual incentives and PSUs that are earned based on achievement of enterprise-wide goals that impact shareholder value. |
| • | Reward Annual Performance. The annual incentive award component of our NEOs’ total compensation is designed to reward achievement of key annual goals that are aligned with the Company’s annual business plan, and conversely to be lower or zero in periods in which those key annual goals are only partially achieved or not achieved at all. |
| • | Reward Long-term Growth. The total compensation paid to our NEOs is weighted toward long-term equity-based incentives. These awards align pay with sustained performance and shareholder value creation. |
| 2020 Proxy Statement | | 52 |
| • | Retention of Top Executives. Our NEOs have base salaries and benefits that are competitive and not excessive, therefore permitting Navient to attract, motivate and retain executives who can drive and lead our success. |
The compensation packages we provide to our NEOs are designed to be competitive when compared to companies that compete with us for executive talent. In setting the compensation opportunity for our NEOs, we generally target the median total direct compensation provided to similarly situated executives by our peer group companies.
We also believe that strong governance practices and policies are aligned with shareholder interests. Our policies prohibit hedging, pledging or short-sales of any Company stock held by our NEOs and provide for the clawback of compensation in certain situations. See “Other Arrangements, Policies and Practices Related to Our Executive Compensation Programs” below.
How Compensation Decisions Are Made
In establishing competitive total compensation packages for our NEOs, the Compensation Committee relies on an analysis of market data on the executive compensation packages offered by Navient’s peer group companies, which are described below. While the Committee generally targets the median total compensation opportunity provided by our peer group companies to similarly-situated executives, market data is only one of several factors considered in establishing the compensation opportunity levels of our NEOs. Navient’s annual strategic business plan also factors heavily in determining certain elements of total compensation, such as our Annual Incentive and Long-term Incentive Programs, which are described in more detail below. Past pay practices and internal employee pay equity, as well as the skills and experience that each NEO brings to Navient, are all important factors considered by the Committee. The Committee also considers an assessment of each NEO’s success in achieving pre-determined business as well as individual objectives, an assessment that is prepared by the CEO and presented to the Committee at a minimum of once each year.
Role of the Compensation Consultant
The Compensation Committee is advised by its Compensation Consultant. See “Compensation Consultant and Independence” earlier in this proxy statement for more information on the Compensation Consultant’s role as an independent advisor to the Compensation Committee.
Use of Peer Groups
Navient seeks to provide its NEOs with competitive compensation relative to a peer group of companies. The Compensation Committee reviews the composition of the peer group annually with the assistance of the Compensation Consultant, making adjustments as needed to address changes in Navient’s business or changes in the peer group companies due to mergers or other transactions.
| 2020 Proxy Statement | | 53 |
Based on its review, the Committee decided the 2019 peer group should remain unchanged from 2018. The Compensation Committee believes that asset size is the most relevant comparator when identifying other companies of similar size and complexity. Our 2019 peer group, which the Committee used as context when setting target pay levels at the start of 2019, consists of the following companies:
| 2019 Navient Peer Group | |||||
| Company | Total Assets(1) | Net Income(2) | Market Cap(1) | ||
| Customer Account Management | |||||
| Alliance Data Systems Corporation | $26,495 | $278 | $5,168 | ||
Automatic Data Processing, Inc. (3) | 49,059 | 2,463 | 73,775 | ||
DST Systems, Inc. (4) | 3,079 | 267 | 4,982 | ||
Total System Services, Inc. (5) | 7,707 | 617 | 23,586 | ||
| The Western Union Company | 8,759 | 1,058 | 11,228 | ||
| Asset and Risk Management | |||||
| The Charles Schwab Corporation | 294,005 | 3,704 | 61,095 | ||
| Comerica Incorporated | 73,402 | 1,198 | 10,343 | ||
| Fifth Third Bancorp | 169,369 | 2,512 | 21,815 | ||
| Lincoln National Corporation | 334,761 | 886 | 11,703 | ||
| Voya Financial, Inc. | 169,051 | -351 | 8,220 | ||
| High Volume Operations | |||||
| Discover Financial Services | 113,996 | 2,957 | 26,588 | ||
| Fiserv, Inc. | 77,539 | 893 | 78,616 | ||
| Global Payments Inc. | 44,480 | 431 | 54,868 | ||
Paychex, Inc. (6) | 8,702 | 1,078 | 30,484 | ||
Worldpay, Inc. (7) | 27,097 | 293 | 41,981 | ||
25th Percentile | $17,627 | $362 | $10,785 | ||
| Median | 49,059 | 893 | 23,586 | ||
75th Percentile | 141,524 | 1m831 | 48,425 | ||
| Navient Corporation | $94,903 | $597 | $3,024 | ||
| Rank | 6 of 16 | 11 of 16 | 16 of 16 | ||
| Percentile | 67 | 34 | 0 | ||
| (1) | Total assets and market capitalization reflect each company’s most recent fiscal year end except for Automatic Data Processing, Inc., DST Systems, Inc., Total System Services, Inc., Paychex, Inc. and Worldpay, Inc. Please see footnotes (3), (4), (5), (6) and (7) for more information. |
| (2) | Net income (in millions in accordance with GAAP) for each company’s most-recently-ended fiscal year, as reflected in each company’s Annual Report on Form 10-K filed with the SEC. Except as otherwise noted below, each company’s most recent fiscal year ended December 31, 2019. |
| (3) | Automatic Data Processing's most recent fiscal year end is June 30, 2019. Total assets reflect the most-recent fiscal quarter end and net income reflects 12-month trailing as of December 31, 2019. Market capitalization reflects common shares outstanding at December 31, 2019, multiplied by the per share closing price of the company’s common stock on December 31, 2019, the last trading date of the year. |
| (4) | DST Systems, Inc. was acquired by SS&C Technologies Holdings, Inc. on April 16, 2018. Market capitalization reflects common shares outstanding at April 16, 2018, multiplied by the per share closing price of the company’s common stock on April 16, 2018, the company's last day of trading. All other metrics are as of March 31, 2018, the most recent quarter end with publicly disclosed financial data. |
| (5) | Total System Services, Inc. was acquired by Global Payments Inc. on September 17, 2019. Market capitalization reflects common shares outstanding at September 17, 2019, multiplied by the per share closing price of the company’s common stock on September 17, 2019, the company's last day of trading. All other metrics are as of June 30, 2019, the most recent quarter end with publicly disclosed financial data. |
| (6) | Paychex's most recent fiscal year end is May 31, 2019. Total assets reflect the most-recent fiscal quarter end and net income reflects 12-month trailing as of November 30, 2019. Market capitalization reflects common shares outstanding at December 31, 2019, multiplied by the per share closing price of the company’s common stock on December 31, 2019, the last trading date of the year. |
| (7) | Worldpay, Inc. was acquired by Fidelity National Information Services, Inc. on July 31, 2019. Market capitalization reflects common shares outstanding at July 31, 2019, multiplied by the per share closing price of the company’s common stock on July 31, 2019, the company's last day of trading. All other metrics are as of June 30, 2019, the most recent quarter end with publicly disclosed financial data. |
| 2020 Proxy Statement | | 54 |
In August 2019, the Compensation Committee adopted a new peer group for 2020 to better reflect the Company’s current mix of businesses, including the continued growth and evolution of the Company’s business processing and consumer lending businesses. The Committee continues to believe that asset size is the most relevant comparator when identifying other companies of similar size and complexity, although it also took into account factors such as market capitalization when selecting the 2020 peer group. Our 2020 peer group, which the Committee used to set target pay levels at the start of 2020, consists of the following companies:
| 2020 Navient Peer Group | |||||
| Company | Total Assets(1) | Net Income(2) | Market Cap(1) | ||
| Alliance Data Systems Corporation | $26.495 | $278 | $5,168 | ||
| Ally Financial Inc. | 180,644 | 1,715 | 11,615 | ||
| Comerica Incorporated | 73,402 | 1,198 | 10,343 | ||
| Conduent Incorporated | 4,514 | -1,934 | 1,311 | ||
| Discover Financial Services, Inc. | 113,996 | 2,957 | 26,588 | ||
| Fifth Third Bancorp | 169,369 | 2,512 | 21,815 | ||
| KeyCorp | 144,988 | 1,717 | 19,936 | ||
MAXIMUS, Inc. (3) | 1,990 | 244 | 4,759 | ||
Paychex, Inc. (4) | 8,702 | 1,078 | 30,484 | ||
| Regions Financial Corporation | 126,240 | 1,582 | 16,553 | ||
| Santander Consumer USA Holdings, Inc. | 48,934 | 994 | 7,944 | ||
| SLM Corporation | 32,686 | 578 | 3,762 | ||
| Synchrony Financial | 104,826 | 3,747 | 23,269 | ||
| The Western Union Company | 8,759 | 1,058 | 11,228 | ||
25th Percentile | $13,193 | $682 | $5,862 | ||
| Median | 61,168 | 1,138 | 11,421 | ||
75th Percentile | 123,179 | 1,717 | 21,345 | ||
| Navient Corporation | $94,9903 | $597 | $3,024 | ||
| Rank | 7 of 15 | 11 of 15 | 14 of 15 | ||
| Percentile | 59 | 23 | 5 | ||
| (1) | Total assets and market capitalization reflect each company’s most recent fiscal year end except for MAXIMUS, Inc. and Paychex Inc. Please see footnotes (3) and (4) for more information. |
| (2) | Net income (in millions in accordance with GAAP) for each company’s most-recently-ended fiscal year, as reflected in each company’s Annual Report on Form 10-K filed with the SEC. Except as otherwise noted below, each company’s most recent fiscal year ended December 31, 2019. |
| (3) | MAXIMUS' most recent fiscal year end is September 30, 2019. Total assets reflect the most-recent fiscal quarter end and net income reflects 12-month trailing as of December 31, 2019. Market capitalization reflects common shares outstanding at December 31, 2019, multiplied by the per share closing price of the company’s common stock on December 31, 2019, the last trading date of the year. |
| (4) | Paychex's most recent fiscal year end is May 31, 2019. Total assets reflect the most-recent fiscal quarter end and net income reflects 12- month trailing as of November 30, 2019. Market capitalization reflects common shares outstanding at December 31, 2019, multiplied by the per share closing price of the company’s common stock on December 31, 2019, the last trading date of the year. |
Consideration of Say-on-Pay Vote Results
At our most recent annual meeting of shareholders, held on June 6, 2019, the Company conducted an advisory vote to approve its executive compensation for the fiscal year ended December 31, 2018. As in prior years, shareholders expressed overwhelming support for the compensation of our NEOs, with approximately 94.1% of the votes present in person (or represented by proxy at the meeting) and entitled to vote on the matter cast to approve our 2018 executive compensation. The Committee took into account the results of this advisory vote when making compensation decisions for 2019.
In 2015, the Company conducted an advisory vote on the frequency of future advisory votes to approve its executive compensation, commonly known as “Say-on-Frequency.” Our shareholders indicated their preference for future advisory votes to be held annually. Consistent with the shareholders’ vote on this matter, the Board adopted a policy providing for annual advisory votes to approve the Company’s executive compensation. This year we are again conducting an advisory vote on Say-on-Frequency. See “Proposal 4 — Advisory Vote on Say-on-Pay Frequency” in this proxy statement.
| 2020 Proxy Statement | | 55 |
2019 Executive Compensation Program
Primary Elements of Compensation
The compensation program for our NEOs consists of three primary elements:
| Compensation Element | Objective | Type of Compensation | |
| Base Salary | To provide a base level of cash compensation consistent with the executive’s level of responsibility. | Fixed cash compensation. Reviewed annually and adjusted as appropriate. | |
| Annual Incentives | To encourage and reward our NEOs for achieving annual corporate and individual performance goals. | Variable compensation. Performance-based. Payable in cash. | |
| Long-term Incentives | To motivate and retain senior executives by aligning their interests with those of shareholders through sustained performance and growth. | Multi-year variable compensation. Generally payable in performance stock units (“PSUs”) and/or restricted stock units (“RSUs”). PSUs are subject to performance vesting based on cumulative three-year performance, with each award being settled in stock at the end of the performance period to the degree that goals are met. RSUs are subject to time-based vesting, with each award vesting in 1/3 increments over a three-year period. For 2019, total long-term incentive value was provided 60% in PSUs and 40% in RSUs for our CEO and split equally between PSUs and RSUs for our other NEOs. |
The Compensation Committee makes decisions regarding each primary element of compensation described above.
In addition to the three primary compensation elements discussed above, our NEOs have an opportunity to participate in the Navient Deferred Compensation Plan. The Deferred Compensation Plan offers a variety of investment choices, none of which represents an “above-market return.” We also provide our NEOs with the same standard health, welfare and retirement benefits provided to our employees, as well as limited perquisites. Each of our NEOs also participates in severance plans for our senior executives.
| 2020 Proxy Statement | | 56 |
Total Direct Compensation Mix
These primary compensation elements—Base Salary, Annual Incentives and Long-term Incentives—together form Total Direct Compensation for each of our NEOs. Consistent with Navient’s pay-for-performance culture, 87% of the 2019 Total Direct Compensation of our CEO was at-risk and dependent upon the attainment of specific performance objectives, as well as the value of Navient’s Common Stock. The charts below provide the at-risk percentages of the 2019 Total Direct Compensation of our NEOs and the percentage of their compensation that is at-risk, with Annual Incentives and PSUs shown at target levels of performance for the full year.
| |
Base Salary
The Compensation Committee reviews base salary levels for the NEOs on an annual basis but may make changes less frequently. Based on a market analysis of the 2019 Navient peer group, the Compensation Committee (in consultation with the other independent members of the Board) determined that Mr. Remondi’s 2019 base salary should remain unchanged at $1,000,000, consistent with peer group benchmarking.
The 2019 base salaries of Messrs. Lown, Kane, Heleen and Hauber were established by the Compensation Committee, taking into account recommendations made by Mr. Remondi, as well as a review of benchmarking data from the 2019 Navient peer group. The Committee concluded that the base salary for each of our NEOs should remain unchanged for 2019, with the exception of Mr. Hauber, who received a market-based adjustment for 2019. In the case of each NEO, including the CEO, the Committee reached its final determinations in consultation with the Compensation Consultant. In 2020, the Committee again determined to keep the base salary unchanged for each NEO. The following chart lists the base salary for each of our NEOs as of December 31, 2019, December 31, 2018, and December 31, 2017 respectively.
Navient NEOs | 2019 Base Salary | 2018 Base Salary | 2017 Base Salary | |||||
| Mr. Remondi | $ | 1,000,000 | $ | 1,000,000 | $ | 1,000,000 | ||
| Mr. Lown | $ | 400,000 | $ | 400,000 | $ | 400,000 | ||
| Mr. Kane | $ | 460,000 | $ | 460,000 | $ | 460,000 | ||
| Mr. Heleen | $ | 385,000 | $ | 385,000 | $ | 385,000 | ||
| Mr. Hauber* | $ | 350,000 | $ | 310,000 | $ | - | ||
| * | Mr. Hauber was not a named executive officer of the Company in 2017. |
Annual Incentive Awards: The 2019 Management Incentive Plan
As part of Navient’s annual strategic planning process, management developed an operating plan for the Company’s 2019 fiscal year. The Compensation Committee and management then discussed specific corporate performance metrics and goals for Navient to be set forth in a 2019 annual incentive program—known as the Management Incentive Plan (“MIP”)— with the express purpose of focusing executives on achieving the operating plan.
| 2020 Proxy Statement | | 57 |
For the 2019 MIP, the Committee continued its focus on Adjusted Diluted “Core Earnings” Per Share as the plan’s key financial metric. Three other financial metrics were carried forward from the 2018 plan—Consumer Lending New Loan Volume, Private Education Loan Gross Defaults, and Adjusted “Core Earnings” Operating Expenses—although the weight placed on operating expenses was increased because of the importance of aggressively managing expenses. As in prior years, all Consumer Lending New Loan Volume is subject to the Company’s Board-approved risk and return guidelines (e.g., regarding consumer credit quality, cost-to-acquire, net interest margin). The Committee also substituted EBITDA for revenue in measuring the performance of our business processing solutions group to focus management on ensuring profitable growth as those business lines continue to scale up.
The following table details the specific performance metrics utilized in our 2019 Management Incentive Plan, as well as the weight assigned to each metric:
| 2019 MIP Performance Metric | Weight | Rationale |
Adjusted Diluted “Core Earnings” Per Share19 | 35% | • Measures overall management effectiveness |
• Promotes shareholder value | ||
• Key financial metric for investors | ||
| Consumer Lending New Loan Volume | 20% | • Emphasizes growth in strategic businesses |
• Offers refinance opportunities to our existing customers, which helps retain and grow our customer base | ||
• Loan volume is a key focus in order to scale this growing business | ||
• All loan volume is subject to the Company’s Board-approved risk and return guidelines (e.g., regarding consumer credit quality, cost-to-acquire, net interest margin) | ||
Business Processing EBITDA20 | 20% | • Emphasizes profitable growth in strategic businesses |
• Growth helps to offset company-wide expenses as our legacy loan portfolio amortizes | ||
Adjusted “Core Earnings” Operating Expenses21 | 15% | • Focuses management attention on expense reduction as our legacy loan portfolio amortizes |
• Key financial metric for investors, which is also critical to the achievement of our Core Earnings Per Share goal | ||
| Private Education Loan Gross Defaults | 10% | • Enhances the profitability of our private education loan portfolio |
• Aids our private education student loan customers | ||
• Key financial metric for investors |
The Committee established a scale of “payout factors” to assess the Company’s performance relative to the target established for each of these performance metrics. These payout factors range from 50% based on a threshold level of performance, to 150% based on a maximum level of performance, with performance below threshold resulting in a payout factor of 0%. For each metric, the Committee also established a payout curve for performance between threshold-target and target-maximum.
19 | Adjusted Diluted “Core Earnings” Per Share excludes net restructuring and regulatory-related charges, as well as certain extraordinary items such as strategic corporate transactions or other unusual or unplanned events. Adjusted Diluted “Core Earnings” Per Share is a non-GAAP financial measure that does not represent a comprehensive basis of accounting. For more information on the definition of Adjusted Diluted Core Earnings Per Share please refer to page 30 of our 2019 Annual Report filed on Form 10-K on February 27, 2020. For a reconciliation of our non-GAAP financial measures with GAAP results, please refer to the discussion on pages 37–52 of our 2019 Annual Report, or refer to the Investor Relations section of our website located at http://www.navient.com/about/investors/. |
20 | Earnings Before Interest, Taxes, Depreciation and Amortization Expense (“EBITDA”) is a non-GAAP financial measure that does not represent a comprehensive basis of accounting. For more information on the definition of EBITDA and for a reconciliation of non-GAAP financial measures with GAAP results, please refer to the discussion on pages 45 of our 2019 Annual Report filed on Form 10-K on February 27, 2020, or refer to the Investor Relations section of our website located at http://www.navient.com/about/investors/. |
21 | Adjusted “Core Earnings” Operating Expenses excludes net restructuring and regulatory-related charges, as well as certain extraordinary items such as strategic corporate transactions or other unusual or unplanned events. Adjusted “Core Earnings” Operating Expenses is a non-GAAP financial measure that does not represent a comprehensive basis of accounting. For more information on the definition of Adjusted “Core Earnings” Operating Expenses and for a reconciliation of non-GAAP financial measures with GAAP results, please refer to our Investor Presentation for Fourth Quarter and Full Year 2019 on the Investor Relations section of our website located at http://www.navient.com/about/investors/. |
 | 2020 Proxy Statement |  | 58 |
The chart below sets forth the performance threshold, target, and maximum, and the payout factors for each performance metric:
| 2019 MIP Payout Factors | ||||
2019 Performance Metric | Below Performance Threshold(Payout Factor = 0%) | Performance Threshold | Performance Target(Payout Factor = 100%) | Performance Maximum(Payout Factor= 150%) |
| Adjusted Diluted “Core Earnings” Per Share | <$1.73 | $1.73 | $1.94 | >= $2.14 |
| Consumer Lending New Loan Volume (millions) | <$2,860 | $2,860 | $3,651 | >=$4,650 |
| Business Processing EBITDA (millions) | <$48 | $48 | $60 | >= $71 |
| Adjusted “Core Earnings” Operating Expenses (millions) | >$994 | $994 | $949 | <=$915 |
| Private Education Loan Gross Defaults (millions) | >$508 | $508 | $459 | <= $408 |
Performance against three of the five MIP goals in 2019 was notably strong. The Executive Summary of this Compensation Discussion and Analysis, beginning on page 46, details a number of our key achievements in 2019. The chart below sets forth (i) each performance metric, (ii) the performance target approved by the Compensation Committee for each metric, (iii) the 2019 actual performance of the Company for each metric, (iv) the payout factor for each metric based on the Company’s level of achievement relative to target, (v) the relative weighting of each performance metric, and (vi) the performance score attributable to each metric, as well as the overall performance score.
2019 MIP Performance Results | |||||||
2019 Performance Metric (i) | Performance Target (ii) | 2019 Actual Performance (iii) | Payout Factor (iv) | Weighting (v) | Performance Score (vi) | ||
Adjusted Diluted “Core Earnings” Per Share22 | $ | 1.94 | $ | 2.64 | 150.0% | 35% | 52.5% |
| Consumer Lending New Loan Volume (millions) | $ | 3,651 | $ | 4,903 | 150.0% | 20% | 30.0% |
Business Processing EBITDA23 (millions) | $ | 60 | $ | 49 | 55.0% | 20% | 11.0% |
Adjusted “Core Earnings” Operating Expenses24 (millions) | $ | 949 | $ | 965 | 82.7% | 15% | 12.4% |
| Private Education Loan Gross Defaults (millions) | $ | 459 | $ | 428 | 130.5% | 10% | 13.1% |
| Overall Performance Score: | 119.0% | ||||||
These performance results were reviewed and certified by the Compensation Committee in January 2020. In determining the incentive award amounts to be paid to each of our NEOs under the 2019 MIP, the Committee also considered the individual performance of each NEO, as reflected in an annual performance assessment prepared by our CEO and presented to the Committee. The incentive award amounts for our NEOs under the 2019 MIP, which were paid in cash in February 2020, are set forth in the following table.
| 2019 MIP Payouts | |||
| Navient NEOs | Target % of Base Salary | 2019 Target Incentive Amount ($) | 2019 MIP Incentive Award Amount ($) |
| Mr. Remondi | 150% | 1,500,000 | 1,785,000 |
| M. Lown | 150% | 600,000 | 714,000 |
| Mr. Kane | 150% | 690,000 | 821,100 |
| Mr. Heleen | 150% | 577,500 | 687,225 |
| Mr. Hauber | 150% | 525,000 | 624,750 |
22 | See footnote 19 above for additional information regarding Adjusted Diluted “Core Earnings” Per Share. |
23 | See footnote 20 above for additional information regarding EBITDA. |
24 | See footnote 21 above for additional information regarding Adjusted “Core Earnings” Operating Expenses, which for 2019 excludes $6 million in regulatory-related expenses, $6 million in restructuring expenses and $12.5 million in expenses relating to the Canyon Agreement. For additional information pertaining to the Canyon Agreement, please refer to “Shareholder Engagement and Communications with the Board” above. |
| 2020 Proxy Statement | | 59 |
2019 Long-term Incentive Program
Our long-term incentive program is designed to drive long-term performance and shareholder value by delivering a significant portion of NEO compensation through a mix of equity awards. For 2019, the Committee decided to discontinue the prior practice of granting stock options as part of the Company’s long-term incentive program. The Committee made this determination to update the mix of equity awards based on its review of equity grant practices among peer companies, general industry market trends and the Company’s historical grant practices. Each of our NEOs (other than Mr. Remondi) received long-term incentive awards split equally between restricted stock units (“RSUs”) and performance stock units (“PSUs”) in terms of grant date value.
Recognizing Mr. Remondi’s significant contributions to the Company, the Committee increased the grant date value of his 2019 long-term incentive award by 25% from the prior year, with this increase being delivered entirely in PSUs. Sixty percent of the grant date value of Mr. Remondi’s 2019 long-term incentive awards were delivered in the form of PSUs, with the remaining forty percent delivered in the form of RSUs. This increase brings Mr. Remondi’s 2019 long-term incentive award value in line with peer group median levels.
Based upon the recommendation of our CEO and on a market analysis of the 2019 Navient peer group performed by the Committee’s independent consultant, the Compensation Committee approved 2019 long-term incentive awards for our other NEOs in early 2019 in the following amounts: Mr. Lown ($1,200,000); Mr. Kane ($1,000,000); Mr. Heleen ($750,000); and Mr. Hauber ($500,000).
The chart below details the 2019 long-term incentive awards for our NEOs:
| Navient NEOs | Performance Stock Units(1) (#) | Restricted Stock Units(2) (#) | Total Award Value(3) ($) |
| Mr. Remondi | 262,237 | 174,825 | 5,000,000 |
| Mr. Lown | 52,447 | 52,447 | 1,200,000 |
| Mr. Kane | 43,706 | 43,706 | 1,000,000 |
| Mr. Heleen | 32,779 | 32,779 | 750,000 |
| Mr. Hauber | 21,853 | 21,853 | 500,000 |
| (1) | This column represents the target PSUs granted to each of the NEOs on February 5, 2019, with the target number of PSUs equal to 50% (60% for Mr. Remondi) of the 2019 long-term incentive award amount approved by the Compensation Committee divided by the closing price of Navient Common Stock on the grant date. Each PSU is subject to performance-based vesting over a three-year performance period beginning on January 1, 2019 and ending on December 31, 2021. The vesting provisions of these PSUs are described below. |
| (2) | This column represents the RSUs granted to each of the NEOs on February 5, 2019, with the number of RSUs equal to 50% (40% for Mr. Remondi) of the 2019 long-term incentive award amount approved by the Compensation Committee divided by the closing price of Navient Common Stock on the grant date. These RSUs are scheduled to vest in one-third increments on each of the first, second and third anniversaries of the grant date, subject to certain terms and conditions. |
| (3) | Total award value differs slightly from the grant date fair value, as reflected in the “Summary Compensation Table” and “Grants of Plan-Based Awards” table, as the number of units/options is rounded down to the nearest whole unit or option to avoid the issuance of fractional units or shares. |
2019-21 Performance Stock Units
PSUs granted in 2019 as part of our 2019 long-term incentive program are designed to vest at the end of 2021, with a potential payout ranging from 0% to 150% of the target number of units, based on cumulative performance over the 2019- 21 performance period.
The Committee approved newly designed PSUs for each of our NEOs in 2019. Recognizing net student loan cash flows as a primary driver of the Company’s value, the Committee increased the weight assigned to this three-year cumulative performance measure from 50% to 70%. Additionally, the Committee added return on equity (“ROE”) as a new measure of company-wide success with a weight of 30%.
Maintaining (or improving) ROE requires a disciplined approach to managing, allocating and investing capital to achieve the best return for shareholders. As a “standard” financial metric, it also permits comparability across peer groups and industry- wide benchmarks. Given the impact of accounting rules on certain businesses—as well as general uncertainty regarding the impact of the new accounting standard governing current expected credit losses (“CECL”)—separate annual ROE targets will be established by the Committee for each year in the 2019-21 PSU performance cycle, with targets set at the beginning of each year. Each annual ROE target will have 10% weight and earned awards will not be paid until after the end of the 2019-21 performance period.
| 2020 Proxy Statement | | 60 |
These performance metrics for the 2019-21 PSUs are summarized below:
| 2019-21 Performance Stock Units |
| 2019-21 PSU Performance Metric | Weight | Rationale |
Cumulative Net Student Loan Cash Flows25 | 70% | • Promotes successful management of our loan portfolios |
• Critical driver of shareholder value, supporting dividends, share repurchases and debt payments | ||
• Supports growth of strategic businesses, including consumer lending | ||
Core Earnings” Return on Equity26 | 10% / 10% / 10% | • Requires focus on managing, allocating and investing capital to achieve the best return for shareholders |
• Standard financial metric that permits comparability across peer groups and industry-wide benchmarks. |
The chart below shows the potential for vesting as a percentage of the target number of PSUs:
2019-21 Performance Stock Units | ||||||
| Performance Metric | Weight | Percentage of 2019-21 PSUs Vesting* | ||||
| 0% | 50% | 100% | 150% | |||
| Cumulative Net Student Loan Cash Flows | 70% | Less than $8.20 billion | $8.20 billion | $9.10 billion | $9.90 billion or greater | |
2019 “Core Earnings” Return on Equity | 10% | Less than 11.2% | 11.2% | 12.7% | 14.2% | |
| 2020 “Core Earnings” Return on Equity | 10% | Less than 18.6% | 18.6% | 20.6% | 22.6% | |
2021 “Core Earnings” Return on Equity27 | 10% | - | - | - | - | |
*For points between each performance level, the vesting percentages will be interpolated. That is, vesting will be interpolated between threshold performance (50% vesting) and target performance (100% vesting), as well as between target performance and maximum performance (150% vesting).
Regarding the performance targets established for each metric, the Compensation Committee believes that these targets are set at challenging but achievable levels in light of the uncertain regulatory, rating agency and financial environment the Company faces. The Committee considers these environmental factors and the resulting degree of difficulty that management faces in achieving the Company’s long-term growth and performance goals when establishing appropriate levels for threshold, target and maximum performance levels and payout curves.
Deferred Compensation
We provide our NEOs with the opportunity to defer a portion of their compensation under the Navient Deferred Compensation Plan (the “Deferred Compensation Plan”). The Deferred Compensation Plan is designed to provide all of our senior employees, including our NEOs, with the opportunity to save for retirement and other personal expenses on a tax-
25 | Cumulative Net Student Loan Cash Flows is a non-GAAP financial measure that does not represent a comprehensive basis of accounting. Cumulative Net Student Loan Cash Flows are the aggregate cash flows net of secured borrowings from all student loans (including private credit refinance loans) realized for the fiscal years 2019, 2020 and 2021, including student loan cash flows realized from new acquisitions, but excluding the impact of cash flows for fiscal years beyond 2021 that are accelerated through securitizing or pledging unencumbered student loans or through loan sales. |
26 | Annual “Core Earnings” Return on Equity targets and range are established by the Committee at the beginning of each respective year, with each year’s performance counting 1/3 towards the total 30% weight. “Core Earnings” Return on Equity is a non-GAAP financial measure that does not represent a comprehensive basis of accounting. “Core Earnings” Return on Equity is a percentage equal to the Company’s “core earnings” net income for each of fiscal years 2019, 2020 and 2021, divided by average stockholder’s equity for each such year (determined using the average balance of stockholder’s equity on a “core earnings” basis for each quarter in a given year), using yearly “core earnings” net income as shown in the segment reporting footnote in the Company’s audited financial statements as published in the Company’s annual report on Form 10-K, excluding the impact of any regulatory and restructuring costs. |
27 | “Core Earnings” Return on Equity targets and range for 2021 will be established by the Committee at the beginning of calendar year 2021. |
| 2020 Proxy Statement | | 61 |
advantaged basis. Each participating employee may elect to defer a portion of his or her eligible compensation under the Deferred Compensation Plan, and amounts deferred are credited to bookkeeping accounts. The Company amended the Deferred Compensation Plan in 2018 to eliminate Company contributions effective January 1, 2019. Amounts in each participant’s account are indexed to one or more investment alternatives chosen by each participant from a range of market- based alternatives. The Deferred Compensation Plan does not pay above-market or preferential earnings on compensation deferred under or contributed to the plan. Additional details for our NEOs who participate can be found below under the “Non-Qualified Deferred Compensation” table.
Health, Welfare and Retirement Benefits
Our NEOs are eligible to participate in the same broad-based employee benefit programs that we offer to our other employees, such as group health benefits and tax-qualified retirement benefits.
Perquisites
Perquisites are limited and are not a significant portion of our compensation program. In 2019, we did not provide relocation allowances to any NEO. We provided transportation allowances to our CEO as described in the Summary Compensation Table below.
Severance Benefits
Navient has adopted an executive severance plan and a change in control severance plan, which are described in greater detail under the heading “Arrangements with Named Executive Officers” below. We generally utilize plans (as opposed to individual agreements) to provide severance and change in control payments and benefits for several reasons. First, a “plan” approach provides us with the flexibility to change the terms of severance benefits from time to time. In addition, this approach is more transparent, both internally and externally, which eliminates the need to negotiate severance or other employment separation benefits on a case-by-case basis and assures each of the executives that his or her severance benefits are comparable to those of other executives with similar levels of responsibility and tenure.
Under the executive severance plan, our NEOs are eligible for severance payments in the event of an involuntary termination of employment without “cause.” In addition, they are eligible for “double trigger” severance payments under the change in control severance plan in the event of an involuntary termination of employment without “cause” or a termination of employment with “good reason” in connection with a change in control of Navient. All plan participants, including our NEOs, are entitled to certain limited “single trigger” benefits upon a change in control, including equity acceleration, only when equity awards are not honored, assumed, or replaced by a successor employer of Navient. Such equity acceleration provides NEOs with the benefit of these outstanding awards granted in prior years. They also may be able to exercise the awards and possibly participate in the change in control transaction for the consideration received.
Other Arrangements, Policies and Practices Related to Our Executive Compensation Program
Share Ownership Guidelines
Navient has adopted share ownership guidelines applicable to its senior executives, including our NEOs. These ownership guidelines, which are required to be achieved over a five-year period, are as follows:
| • | Chief Executive Officer — Lesser of 1 million shares or $5 million in value |
| • | Executive Vice President — Lesser of 200,000 shares or $1 million in value |
| • | Senior Vice President — Lesser of 70,000 shares or $350,000 in value |
Each of our NEOs other than Mr. Remondi holds the title of Executive Vice President.
The guidelines encourage continued ownership of a significant amount of Navient’s Common stock acquired through equity awards and help align the interests of our senior executives with the interests of our shareholders. A senior executive must hold Navient Common Stock acquired through equity grants until the applicable thresholds are met, and a senior executive will not be eligible to receive equity grants during the following year if he or she sells this stock (whether before or after such guidelines are met), if such sale resulted in a decrease below the thresholds established by the guidelines.
The following shares and share units count towards the ownership guidelines: shares held in brokerage accounts; vested shares credited to deferred compensation accounts; shares credited to qualified retirement plan accounts; vested
| 2020 Proxy Statement | | 62 |
performance stock; restricted stock and RSUs that vest solely upon the passage of time, on an after-tax basis, and vested stock options, to the extent that they are “in-the-money” on an after-tax basis.
All of Navient’s NEOs are in compliance with the share ownership guidelines as of the date of this proxy statement either through their stock ownership levels or due to the five-year initial period not being finished.
Hedging/Pledging Prohibition
Navient policy prohibits directors and senior management from engaging in hedging, pledging and certain other transactions involving Navient Common Stock. See “Director Compensation” above for additional details.
Policy on Rule 10b5-1 Trading Plans
The Company has a policy governing the use by directors and executive officers of pre-established trading plans for sales of our Common Stock. See “Director Compensation” above for additional details.
Clawback
Awards made to senior officers, including our NEOs, under the Navient Corporation 2014 Omnibus Incentive Plan (as amended and restated) are subject to clawback in the event of a material misstatement of Navient’s financial results and other qualifying events. Navient enhanced its clawback policy in 2017 following an extensive review and consideration of the Company’s then-existing clawback policy by the Compensation Committee. The enhanced clawback policy grants the Board discretion to recoup incentive compensation both in the event of a financial restatement and in the case of the executive’s misconduct involving a material violation of Navient policy or commission of fraud or other misconduct involving Navient. Following engagement with its shareholders, the Board further enhanced the clawback policy in March 2018 to add a clawback trigger in the event of misconduct committed by persons under a senior officer’s supervision.
Navient Compensation Committee Process for Approving Long-term Awards
The Compensation Committee approves long-term awards on an annual basis at a regularly scheduled committee meeting. The Committee has delegated authority to a sub-committee consisting of the Compensation Committee Chair and the CEO (the “Sub-Committee”) to approve long-term awards for new employees and promotions below the executive officer level. These awards generally are effective on the day on which the Sub-Committee approves the awards. The Compensation Committee approves any awards to newly hired or promoted executive officers. The grant date for these awards generally is the applicable meeting date of the Committee at which the awards are approved. Under the terms of the Navient Corporation 2014 Omnibus Incentive Plan, as amended and restated, stock options are required to be priced at the closing market price of Navient’s Common Stock on the Nasdaq on the date of grant.
Tax Deductibility of Compensation Over $1 Million
Section 162(m) of the Internal Revenue Code (“Section 162(m)”) generally disallows a federal income tax deduction for annual compensation over $1 million paid to our chief executive officer, chief financial officer, three other most highly compensated officers and anyone who has served as one of our covered officers after 2016, other than pursuant to certain grandfathered compensation arrangements described below. The Compensation Committee retains the flexibility to award compensation to the NEOs that is not deductible for U.S. federal income tax purposes.
Prior to 2018, the Section 162(m) limitations applied to the chief executive officer and the three other highest-paid NEOs (excluding the chief financial officer) who were serving as of the last day of Navient’s fiscal year (“covered employees”), subject to a “performance-based compensation” exception for compensation paid pursuant to shareholder-approved plans. Certain plans and arrangements in effect as of November 2, 2017 (“Grandfathered Plans”) remain eligible for the performance-based compensation exception, provided that those plans are not materially modified. For PSUs granted in connection with our 2017 long-term incentive program, which cover the three-year performance period from 2017 to 2019, the Committee established a separate 162(m) performance target which requires that the Company achieve positive Cumulative Core Net Income for the applicable three-year performance period. If this target is achieved, each executive subject to Section 162(m) becomes eligible for the maximum level of vesting available (i.e., 150%). However, the Committee retained (and exercised, with respect to the 2017 PSUs) “negative discretion” to reduce the level of vesting using the same criteria established for all other PSU recipients who are not subject to Section 162(m).
Under guidance from the U.S. Department of the Treasury regarding the scope of these rules, our ability to deduct executive compensation payments made under Grandfathered Plans to certain of our NEOs in 2019 and beyond may be limited under Section 162(m).
| 2020 Proxy Statement | | 63 |
Certain Executive Compensation Payments in 2019
Deferred Signing Bonus
In March 2017, the Company agreed to pay Mr. Lown a deferred signing bonus of $1,400,000, less applicable withholding taxes (“Deferred Signing Bonus”), to compensate him for a portion of the long-term equity and deferred compensation with his former employer that he forfeited by joining Navient. This Deferred Signing Bonus was paid in cash in two equal installments on March 17, 2018 and March 17, 2019.
2017-19 Performance Stock Units
Fiscal year 2019 marked the final year of a three-year performance period associated with PSUs granted to our executive team in early 2017. These long-term equity awards were designed to vest at the end of 2019, with a potential payout ranging from 0% to 150% of the target number of units. The following chart summarizes the performance results under these PSUs:
| 2017-19 Performance Metric | Performance Target | 2017-19 Actual Performance | Payout Factor | Weight | Performance Score |
Cumulative Net Student Loan Cash Flows28 (millions) | $ 7,850 | $ 8,818 | 135% | 50% | 67% |
Cumulative Revenue from Growth Businesses29 (millions) | $ 995 | $ 839 | 65% | 30% | 20% |
Strategic Objectives | 110% | 20% | 22% | ||
• Pursue Opportunistic Loan Portfolio Acquisitions • Capture Operating Efficiencies in Asset Servicing • Improve Margins in Fee Businesses • Build Strong Relationships with State and Federal Regulators • Grow Intrinsic Value of Company | |||||
| Overall Performance Score: | 109% | ||||
The Executive Summary of this Compensation Discussion and Analysis, beginning on page 46, provides additional details regarding our key achievements during the 2017-19 performance period, which the Committee considered when assessing the Company’s performance relative to the strategic goals established at the beginning that period.
28 | Cumulative Net Student Loan Cash Flows is a non-GAAP financial measure that does not represent a comprehensive basis of accounting. Cumulative Net Student Loan Cash Flows include aggregate cash flows net of secured borrowings from student loans realized for the fiscal years 2017, 2018 and 2019, including student loan cash flows realized from new acquisitions, but excluding the impact of cash flows for fiscal years beyond 2019 that are accelerated through securitizing or pledging unencumbered student loans or through loan sales. |
29 | Cumulative Revenue from Growth Businesses includes that portion of the Company’s aggregate revenue for fiscal years 2017-19 from non-federal-loan-related businesses. |
| 2020 Proxy Statement | | 64 |
Changes to Our Executive Compensation Program for 2020
The Compensation Committee made changes to our annual Management Incentive Program (“MIP”) for 2020. The resulting refinements are structured to drive the growth and profitability in 2020. These changes are described below. The target salaries and bonuses of our NEOs will remain unchanged for 2020, as will the structure of our long-term incentive program.
2020 Annual Incentive Program
The Committee continued its focus on Adjusted Diluted “Core Earnings” Per Share as the key financial metric in the annual Management Incentive Plan (“MIP”) for 2020. Three other financial metrics are carried forward from the 2019 MIP— Adjusted “Core Earnings” Operating Expenses, Business Processing EBITDA, and Private Education Loan Gross Defaults. Based on feedback from our shareholders, the Committee decided to eliminate the financial metric for Consumer Lending New Volume. Although all Consumer Lending New Loan Volume is subject to the Company’s Board-approved risk and return guidelines (e.g., regarding consumer credit quality, cost-to-acquire, net interest margin), some shareholders expressed the view that this financial metric was not sufficiently tied to profitability. The Committee reallocated the weighting assigned to each of the remaining financial metrics for 2020 as follows: Adjusted Diluted “Core Earnings” Per Share (50%); Adjusted “Core Earnings” Operating Expenses (20%); Business Processing EBITDA (15%); and Private Education Loan Gross Defaults (15%). The Company’s performance in the Consumer Lending market will continue to be included as part of the calculation for three of these measures (Business Processing EBITDA does not include performance in this market as part of its calculation).
| 2020 Proxy Statement | | 65 |
Summary Compensation Table
The table below summarizes compensation paid, awarded to or earned by each of our named executive officers (“NEOs”) for the fiscal years ended December 31, 2019, December 31, 2018, and December 31, 2017.
NAME AND PRINCIPAL POSITION(1) | YEAR | SALARY ($) | BONUS(2) ($) | STOCK AWARDS(3) ($) | OPTION AWARDS(3) ($) | NON-EQUITY INCENTIVE PLAN COMPENSATION(4) ($) | CHANGE IN PENSION VALUE AND NONQUALIFIED DEFERRED COMPENSATION EARNINGS(5) ($) | ALL OTHER COMPENSATION(6) ($) | TOTAL ($) |
| Jack Remondi | 2019 | 1,000,000 | 0 | 4,999,989 | 0 | 1,785,000 | - | 8,332 | 7,793,321 |
| President and Chief | 2018 | 1,000,000 | 0 | 2,799,997 | 1,199,998 | 1,896,000 | - | 8,110 | 6,904,105 |
| Executive Officer | 2017 | 1,000,000 | 0 | 3,199,979 | 799,997 | 1,444,500 | - | 12,260 | 6,456,736 |
| Christian Lown | 2019 | 400,004 | 700,000 | 1,199,987 | 0 | 714,000 | - | 14,000 | 3,027,991 |
| Chief Financial | 2018 | 400,004 | 700,000 | 839,989 | 359,999 | 758,400 | - | 38,750 | 3,097,142 |
| Officer | 2017 | 292,310 | 0 | 999,992 | 0 | 577,800 | - | 3,000 | 1,873,102 |
| John Kane | 2019 | 460,000 | 0 | 999,993 | 0 | 821,100 | - | 14,000 | 2,295,093 |
| Group President, Business | 2018 | 460,000 | 0 | 909,979 | 389,999 | 690,000 | - | 38,750 | 2,488,728 |
| Processing Solutions | 2017 | 458,461 | 0 | 1,159,978 | 289,998 | 664,470 | - | 40,327 | 2,613,234 |
| Mark Heleen | 2019 | 384,999 | 0 | 749,983 | 0 | 687,225 | - | 14,000 | 1,836,207 |
| Chief Legal Officer | 2018 | 384,999 | 0 | 524,986 | 224,998 | 729,960 | - | 13,750 | 1,878,693 |
| and Secretary | 2017 | 382,692 | 0 | 599,973 | 149,999 | 556,133 | - | 19,498 | 1,708,295 |
| Steve Hauber | 2019 | 345,384 | 0 | 499,996 | 0 | 624,750 | - | 14,000 | 1,484,130 |
| Chief Risk and | 2018 | 310,000 | 0 | 349,977 | 149,999 | 489,800 | - | 34,158 | 1,333,934 |
| Compliance Officer |
| (1) | Reflects the position held by each NEO as of December 31, 2019. Mr. Hauber was not a NEO in 2017. |
| (2) | Mr. Lown became eligible to receive a one-time deferred signing bonus of $1,400,000, less applicable withholding taxes, to compensate him for a portion of the long-term equity and deferred compensation with his former employer that he forfeited by joining Navient in March 2017. This Deferred Signing Bonus was payable in cash in two equal installments on March 17, 2018 and March 17, 2019. |
| (3) | Amounts shown are the grant date fair values of the various stock-based awards granted during 2017, 2018 and 2019 computed in accordance with the Financial Accounting Standards Board’s (FASB) Accounting Standards Codification (ASC) Topic 718. Additional details on accounting for stock-based compensation can be found in “Note 2—Significant Accounting Policies” and “Note 11—Stock-Based Compensation Plans and Arrangements” to the audited consolidated financial statements included in the 2019 Annual Report on Form 10-K. Performance stock units (“PSUs”) granted in 2017, 2018 and 2019 are shown at their grant date fair values for each of these years. |
The grant-date fair value of PSUs awarded during each fiscal year is shown based on the probable performance (target) value of the awards. The maximum grant-date fair value of the PSU awards for 2019 assuming all performance goals were achieved at their maximum levels would be as follows: for Mr. Remondi, $4,499,981; for Mr. Lown, $899,984; for Mr. Kane, $749,994; for Mr. Heleen, $562,481; and for Mr. Hauber, $374,991.
| (4) | Annual incentive awards were paid to NEOs under the Management Incentive Plan in cash. |
| (5) | Navient’s non-qualified deferred compensation plan does not provide for above-market or preferential earnings on compensation deferred under the plan. |
| (6) | For 2019, the components of “All Other Compensation” were as follows: |
| NAME | EMPLOYER CONTRIBUTIONSPLAN (A) ($) | TRANSPORTATION ALLOWANCE (B) | TOTAL ($) |
| Remondi | 7,692 | 640 | 8,332 |
| Lown | 14,000 | 0 | 14,000 |
| Kane | 14,000 | 0 | 14,000 |
| Heleen | 14,000 | 0 | 14,000 |
| Hauber | 14,000 | 0 | 14,000 |
| (A) | Amounts credited to Navient’s tax-qualified defined contribution plan. |
| (B) | Automobile allowance benefit calculated based on the annual lease method. |
| 2020 Proxy Statement | | 66 |
Grants of Plan-Based Awards
NAME | GRANT DATE | ESTIMATED POSSIBLE PAYOUTS UNDER NON-EQUITY INCENTIVE PLAN AWARDS(1) | ESTIMATED FUTURE PAYOUTS UNDER EQUITY INCENTIVE PLAN AWARDS(2) | ALL OTHER STOCK AWARDS: NUMBER OF SHARES OF STOCK OR UNITS(3) (#) | ALL OTHER OPTION AWARDS: NUMBER OF SECURITIES UNDERLYING OPTIONS(4) (#) | EXERCISE OR BASE PRICE OF OPTION AWARDS ($/SHARE) | GRANT DATE FAIR VALUE OF STOCK AND OPTION AWARDS(5) ($) | ||||
Threshold ($) | Target ($) | Maximum ($) | Threshold (#) | Target (#) | Maximum (#) | ||||||
| Remondi | Management Incentive Plan | - | 1,500,000 | 2,250,000 | |||||||
| 2/5/2019 | 131,118 | 262,237 | 393,355 | 2,999,991 | |||||||
| 2/5/2019 | 174,825 | 1,999,998 | |||||||||
| Lown | Management Incentive Plan | - | 600,000 | 900,000 | |||||||
| 2/5/2019 | 26,223 | 52,447 | 78,670 | 599,993 | |||||||
| 2/5/2019 | 52,447 | 599,993 | |||||||||
| Kane | Management Incentive Plan | - | 690,000 | 1,035,000 | |||||||
| 2/5/2019 | 21,853 | 43,706 | 65,559 | 499,996 | |||||||
| 2/5/2019 | 43,706 | 499,996 | |||||||||
| Heleen | Management Incentive Plan | - | 577,500 | 866,250 | |||||||
| 2/5/2019 | 16,389 | 32,779 | 49,168 | 374,991 | |||||||
| 2/5/2019 | 32,779 | 374,991 | |||||||||
| Hauber | Management Incentive Plan | - | 525,000 | 787,500 | |||||||
| 2/5/2019 | 10,926 | 21,853 | 32,779 | 249,998 | |||||||
| 2/5/2019 | 21,853 | 249,998 | |||||||||
| (1) | Represents the possible total payouts for each Navient Named Executive Officer (“NEO”) under the Navient 2019 Management Incentive Plan (“MIP”). The actual amounts earned under the 2019 MIP and paid in February 2020 are set forth below: |
Target 2019 MIP Payout ($) | Actual 2019 MIP Payout ($) | |
| Mr. Remondi | 1,500,000 | 1,785,000 |
| Mr. Lown | 600,000 | 714,000 |
| Mr. Kane | 690,000 | 821,100 |
| Mr. Heleen | 577,500 | 687,225 |
| Mr. Hauber | 525,000 | 624,750 |
| (2) | Represents the range of performance stock units (“PSUs”), granted on February 5, 2019, that may vest based on various performance metrics for the three-year performance period from January 1, 2019, through December 31, 2021. See “Long-term Incentive Program” in the Compensation Discussion and Analysis above for additional details regarding the performance metrics associated with these PSUs. |
| (3) | Stock awards granted on February 5, 2019, to Messrs. Remondi, Lown, Kane, Heleen and Hauber represent restricted stock units (“RSUs”) that have vested or will vest and convert into shares of Common Stock in one-third increments on February 5, 2020, February 5, 2021 and February 5, 2022. |
| (4) | Navient discontinued the practice of granting stock options as part of the Company’s long-term incentive program in 2019. |
| (5) | Amounts disclosed for awards granted in 2019 represent the grant date fair value computed in accordance with FASB ASC Topic 718. Additional details on accounting for stock-based compensation can found in “Note 2—Significant Accounting Policies” and “Note 11—Stock-Based Compensation Plans and Arrangements” to the audited consolidated financial statements included in the 2019 Annual Report on Form 10-K. |
| 2020 Proxy Statement | | 67 |
Outstanding Equity Awards at Fiscal Year End
The table below sets forth information regarding Navient equity awards that were outstanding as of December 31, 2019.
| OPTION AWARDS | STOCK AWARDS | |||||||||
| NAME | GRANT DATE(1) | NUMBER OF SECURITIES | NUMBER OF SECURITIES | OPTION EXERCISE | OPTION EXPIRATION | NUMBER OF | MARKET VALUE OF SHARES ORVESTED(4) ($) | EQUITY INCENTIVE PLAN AWARDS: | EQUITY INCENTIVE PLAN AWARDS: MARKET OR PAYOUT VALUE OF UNEARNED SHARES, UNITS, OR OTHER RIGHTS THAT HAVE NOT VESTED(4) ($) | |
| Remondi | 1/27/2011 | 80,000 | - | 9.3771 | 1/27/2021 | - | - | - | - | |
| 2/18/2015 | 468,750 | - | 21.6500 | 2/18/2020 | - | - | - | - | ||
| 2/3/2016 | 762,376 | - | 9.1800 | 2/3/2021 | - | - | - | - | ||
| 2/6/2017 | 198,265 | 99,132 | 15.4800 | 2/6/2022 | - | - | - | - | ||
| 2/5/2018 | 154,440 | 308,880 | 13.6300 | 2/5/2023 | - | - | - | - | ||
| 2/6/2017 | - | - | - | - | 28,660 | 392,068 | - | - | ||
| 2/6/2017 | - | - | - | - | 163,057 | 2,230,619 | ||||
| 2/5/2018 | - | - | - | - | 41,518 | 567,966 | - | - | ||
| 2/5/2018 | - | - | - | - | - | - | 162,531 | 2,223,424 | ||
| 2/5/2019 | - | - | - | - | 175,920 | 2,406,585 | - | - | ||
| 2/5/2019 | - | - | - | - | - | - | 275,324 | 3,766,432 | ||
| Lown | 2/5/2018 | 46,332 | 92,664 | 13.6300 | 2/5/2023 | - | - | - | - | |
| 3/27/2017 | - | - | - | - | 27,277 | 373,149 | - | - | ||
| 2/5/2018 | - | - | - | - | 13,003 | 177,881 | - | - | ||
| 2/5/2018 | - | - | - | - | - | - | 48,759 | 667,023 | ||
| 2/5/2019 | - | - | - | - | 55,064 | 753,275 | - | - | ||
| 2/5/2019 | - | - | - | - | - | - | 55,064 | 753,275 | ||
| Kane | 1/27/2011 | 13,333 | - | 9.3771 | 1/27/2021 | - | - | - | - | |
| 2/18/2015 | 157,366 | - | 21.6500 | 2/18/2020 | - | - | - | - | ||
| 2/3/2016 | 261,386 | - | 9.1800 | 2/3/2021 | - | - | - | - | ||
| 2/6/2017 | 71,871 | 35,935 | 15.4800 | 2/6/2022 | - | - | - | - | ||
| 2/5/2018 | 50,193 | 100,386 | 13.6300 | 2/5/2023 | - | - | - | - | ||
| 2/6/2017 | - | - | - | - | 10,846 | 148,373 | - | - | ||
| 2/6/2017 | - | - | - | - | 59,107 | 808,583 | ||||
| 2/5/2018 | - | - | - | - | 14,086 | 192,696 | - | - | ||
| 2/5/2018 | - | - | - | - | - | - | 52,821 | 722,591 | ||
| 2/5/2019 | - | - | - | - | 45,887 | 627,734 | - | - | ||
| 2/5/2019 | - | - | - | - | - | - | 45,887 | 627,734 | ||
| Heleen | 2/18/2015 | 73,660 | - | 21.6500 | 2/18/2020 | - | - | - | - | |
| 2/3/2016 | 79,868 | - | 9.1800 | 2/3/2021 | - | - | - | - | ||
| 2/6/2017 | 37,175 | 18,587 | 15.4800 | 2/6/2022 | - | - | - | - | ||
| 2/5/2018 | 28,957 | 57,915 | 13.6300 | 2/5/2023 | - | - | - | - | ||
| 2/6/2017 | - | - | - | - | 5,610 | 76,744 | - | - | ||
| 2/6/2017 | - | - | - | - | 30,572 | 418,224 | ||||
| 2/5/2018 | - | - | - | - | 8,127 | 111,177 | - | - | ||
| 2/5/2018 | - | - | - | - | - | - | 30,473 | 416,870 | ||
| 2/5/2019 | - | - | - | - | 32,972 | 451,056 | - | - | ||
| 2/5/2019 | - | - | - | - | - | - | 34,414 | 470,783 | ||
| 2020 Proxy Statement | | 68 |
| OPTION AWARDS | STOCK AWARDS | |||||||||||
NAME | GRANT DATE(1) | NUMBER OF SECURITIES UNDERLYING UNEXERCISED OPTIONS EXERCISABLE (#) | NUMBER OF SECURITIES UNDERLYING UNEXERCISED OPTIONS UNEXERCISABLE(2) (#) | OPTION EXERCISE PRICE ($) | OPTION EXPIRATION DATE | NUMBER OF SHARES OR UNITS OF STOCK THAT HAVE NOT VESTED(3) (#) | MARKET VALUE OF SHARES OR UNITS OF STOCK THAT HAVE NOT VESTED(4) ($) | EQUITY INCENTIVE PLAN AWARDS: NUMBER OF UNEARNED SHARES, UNITS OR OTHER RIGHTS THAT HAVE NOT VESTED(5) (#) | EQUITY INCENTIVE PLAN AWARDS: MARKET OR PAYOUT VALUE OF UNEARNED SHARES, UNITS, OR OTHER RIGHTS THAT HAVE NOT VESTED(4) ($) | |||
| Hauber | 1/27/2011 | 8,333 | - | 9.3771 | 1/27/2021 | - | - | - | - | |||
| 2/18/2015 | 46,666 | - | 21.6500 | 2/18/2020 | - | - | - | - | ||||
| 2/3/2016 | 138,613 | - | 9.1800 | 2/3/2021 | - | - | - | - | ||||
| 2/6/2017 | 26,022 | 13,011 | 15.4800 | 2/6/2022 | - | - | - | - | ||||
| 2/5/2018 | 19,305 | 38,610 | 13.6300 | 2/5/2023 | - | - | - | - | ||||
| 2/6/2017 | - | - | - | - | 1,745 | 23,871 | - | - | ||||
| 2/6/2017 | - | - | - | - | 14,266 | 195,158 | ||||||
| 2/5/2018 | - | - | - | - | 5,418 | 74,118 | - | - | ||||
| 2/5/2018 | - | - | - | - | - | - | 20,315 | 277,909 | ||||
| 2/5/2019 | - | - | - | - | 22,943 | 313,860 | - | - | ||||
| 2/5/2019 | - | - | - | - | - | - | 22,943 | 313,860 | ||||
| (1) | Navient was spun-off from the company now known as SLM Corporation (“SLM”) and became an independent public company effective April 30, 2014. Immediately prior to the Spin-Off, each of our NEOs (other than Messrs. Lown and Heleen) was employed by the company previously known as SLM Corporation (“Former SLM”). Former SLM equity awards outstanding on April 30, 2014, were adjusted and converted into Navient awards and SLM awards. In general, the adjusted and converted equity awards are subject to substantially the same terms and conditions as the original Former SLM equity awards, including the original vesting schedule. The continuous service of each NEO with Former SLM (pre-Spin-Off) and Navient (post-Spin-Off) has been taken into account for vesting purposes. Additional details regarding the adjustment and conversion of Former SLM equity awards can be found in Navient’s Registration Statement filed on Form 10 with the SEC on April 10, 2014. This table reflects only Navient equity awards that were outstanding as of December 31, 2019. |
| (2) | Stock options granted in 2017 vested in one-third increments on February 6, 2018, February 6, 2019, and February 6, 2020. Stock options granted in 2018 have vested or will vest in one-third increments on February 5, 2019, February 5, 2020, and February 5, 2021. |
| (3) | Restricted stock units (“RSUs”) granted in 2017 to NEOs other than Mr. Lown vested in one-third increments on February 6, 2018, February 6, 2019 and February 6, 2020. RSUs granted in 2017 to Mr. Lown vested in one-third increments on March 27, 2018, March 27, 2019 and March 27, 2020. RSUs granted in 2018 have vested or will vest in one-third increments on February 5, 2019, February 5, 2020 and February 5, 2021. RSUs granted in 2019 have vested or will vest in one-third increments on February 5, 2020, February 5, 2021 and February 5, 2022. |
PSUs granted in 2017 vest after a three-year performance period (2017-19), with the potential payout ranging from 0% to 150% of the target number of units. Based on the Company’s actual performance during the three-year performance period relative to pre-established performance goals, these PSUs vested at 109% of the target number of units and were settled in shares of the Company’s common stock on March 2, 2020. These 2017 PSUs are shown above as outstanding on December 31, 2019 based on the final vested amount (i.e., 109% of the target number of units). See “2017-19 Performance Stock Units” in the Compensation Discussion and Analysis above for additional details regarding these PSUs.
Amounts include all accrued and unvested whole share dividend equivalent units (“DEUs”) that vest only to the extent and at the same time the underlying award on which they are issued vest.
| (4) | Market value of shares or units is calculated based on the closing market price of $13.68 for Navient Common Stock on December 31, 2019. |
| (5) | PSUs granted in 2018 will vest after a three-year performance period (2018-2020), with the potential payout ranging from 0% to 150% of the target number of units based on a combination of (i) aggregate cash flows net of secured borrowings from all student loans (including private credit finance loans) over the performance period; (ii) cumulative revenue derived from business processing products and services over the performance period; and (iii) the attainment of certain strategic objectives intended to highlight a limited number of critical, non-formulaic goals that management is focusing on over the three-year period. Assuming the Company meets or exceeds these performance levels, the PSUs will vest on the second business day after the Company files with the SEC its annual report on Form 10-K for the fiscal year 2020, and in no event later than March 15, 2021. Amounts include all accrued and unvested whole share DEUs that vest only to the extent and at the same time that the underlying award on which they are issued vest. The number of units and payout value reported is based on achieving target performance goals. |
PSUs granted in 2019 will vest after a three-year performance period (2019-21), with the potential payout ranging from 0% to 150% of the target number of units based on a combination of (i) aggregate cash flows net of secured borrowings from all student loans (including private credit finance loans) over the performance period; and (ii) annual “Core Earnings” Return on Equity for each year in the performance period. “Core Earnings” Return on Equity is a non-GAAP financial measure that does not represent a comprehensive basis of accounting. “Core Earnings” Return on Equity is a
| 2020 Proxy Statement | | 69 |
percentage equal to the Company’s “core earnings” net income for each of fiscal years 2019, 2020 and 2021, divided by average stockholder’s equity for each such year (determined using the average balance of stockholder’s equity on a “core earnings” basis for each quarter in a given year), using yearly “core earnings” net income as shown in the segment reporting footnote in the Company’s audited financial statements as published in the Company’s annual report on Form 10-K, excluding the impact of any regulatory and restructuring costs. Assuming the Company meets or exceeds these performance levels, the PSUs will vest on the second business day after the Company files with the SEC its annual report on Form 10-K for the fiscal year 2021, and in no event later than March 15, 2022. Amounts include all accrued and unvested whole share DEUs that vest only to the extent and at the same time that the underlying award on which they are issued vest. The number of units and payout value reported is based on achieving target performance goals. See “2019 Long-term Incentive Program” in the Compensation Discussion and Analysis above for additional details regarding the performance metrics associated with these PSUs.
Option Exercises and Stock Vested
| Option Awards | Stock Awards | |||||||
| NAME | NUMBER OF SHARES ACQUIRED ON EXERCISE (1) (#) | VALUE REALIZED ON EXERCISE (2) ($) | NUMBER OF SHARES ACQUIRED ON VESTING (3) (#) | VALUE REALIZED ON VESTING (4) ($) | ||||
| Remondi | 1,000,000 | 2,677,000 | 406,284 | 4,901,690 | ||||
| Lown | 0 | 0 | 32,517 | 375,153 | ||||
| Kane | 0 | 0 | 137,580 | 1,654,769 | ||||
| Heleen | 0 | 0 | 65,902 | 794,361 | ||||
| Hauber | 0 | 0 | 34,734 | 418,815 | ||||
| (1) | Mr. Remondi exercised 1,000,000 net-settled stock options on January 3, 2019, with a strike price of $6.5230 and a market price of $9.20, receiving 171,422 net shares. These options were set to expire on January 8, 2019. |
| (2) | The value realized upon exercise is the number of net-settled stock options exercised multiplied by the difference between the market price of Navient Common Stock at exercise and the strike price on the net-settled options. |
| (3) | Represents shares acquired upon the vesting of restricted stock units (“RSUs”), the associated dividend equivalent units (“DEUs”) and any fractional share settlement. |
| (4) | The value realized on vesting is the number of shares vested multiplied by the closing market price of Navient Common Stock on the vesting date. |
Pension Benefits
The Company has no tax-qualified pension plans and no non-qualified supplemental pension plans.
Non-Qualified Deferred Compensation
Under the Navient Corporation Deferred Compensation Plan (the “Deferred Compensation Plan”), eligible employees, including our NEOs, may elect to defer up to 80 percent of their annual cash-based compensation. The Company amended the Deferred Compensation Plan in 2018 to eliminate Company contributions effective January 1, 2019.
All participant deferrals are credited to bookkeeping accounts. Amounts in each participant’s account are indexed to one or more investment alternatives chosen by the participant from a range of market-based alternatives. The Deferred Compensation Plan does not pay above-market or preferential earnings. Participants elect the time and form of payment of their accounts. Accounts generally are paid no sooner than the first day of the seventh month following the participant’s termination of employment, although certain in-service distributions are permitted. Immediate distributions upon the death or disability of the participant also are permitted. Accounts generally may be distributed either in a single lump sum or in up to ten (10) annual installments.
| 2020 Proxy Statement | | 70 |
The following table provides information regarding contributions and earnings under the Deferred Compensation Plan in 2019, as well as year-end account balances, for each of our NEOs.
EXECUTIVE CONTRIBUTIONS IN 2019 (1) | REGISTRANT CONTRIBUTIONS IN 2019 (2) | AGGREGATE EARNINGS IN 2019 | AGGREGATE WITHDRAWALS / DISTRIBUTIONS IN 2019 | AGGREGATE BALANCE AT 12/31/2019 (3) | ||||||
| NAME | ($) | ($) | ($) | ($) | ($) | |||||
| Remondi | 0 | 0 | 295,793 | 0 | 1,277,674 | |||||
| Lown | 0 | 0 | 12,349 | 0 | 60,804 | |||||
| Kane | 57,500 | 0 | 90,224 | 0 | 501,970 | |||||
| Heleen | 0 | 0 | 0 | 0 | 0 | |||||
| Hauber | 0 | 0 | 60,247 | 0 | 257,937 | |||||
| (1) | Executive contributions are withheld from the executive’s salary and/or non-equity incentive compensation for the relevant fiscal year and are reflected in the relevant column in the Summary Compensation Table for that year. |
| (2) | The Company amended the Deferred Compensation Plan in 2018 to eliminate Company contributions effective January 1, 2019. |
| (3) | The aggregate balance at fiscal year-end reflects current and prior fiscal year executive and registrant contributions previously reported in the Summary Compensation Table for those years for executives who were named executive officers in those years. |
Arrangements with Named Executive Officers
Navient has not entered into an employment agreement with any of its NEOs. However, our NEOs participate in the Company’s severance plans for senior officers, and each of our NEOs is entitled to certain severance payments pursuant to the terms and conditions of those plans, which are described below.
Executive Severance Plan
Under Navient’s Executive Severance Plan for Senior Officers, eligible officers will receive a lump sum cash payment equal to (i) a multiple of base salary and an average annual incentive award (determined over the last 24 months), plus (ii) pro- rated target annual incentive award for the year of termination, upon the following events: (a) resignation from employment for good reason (as defined in the plan); (b) the Company’s decision to terminate an eligible officer’s employment for any reason other than for cause (as defined in the plan), death or disability; or (c) upon mutual agreement of the Company and the eligible officer. The multiplier for each eligible officer position is as follows: CEO-2x; Executive Vice President-1x. Each of our NEOs other than Mr. Remondi holds the title of Executive Vice President. Under the plan, in no event will a severance payment exceed a multiple of three times an officer’s base salary and annual incentive award.
In addition to the cash severance payment, eligible officers will receive subsidized medical benefits and outplacement services for 18 months (24 months for the CEO). Treatment of outstanding equity awards upon severance is governed by the terms of the applicable equity award agreement and not the severance plan.
Change in Control Severance Plan
Under Navient’s Change in Control Severance Plan for Senior Officers, if a termination of employment for reasons defined in the plan occurs within 24 months following a change in control of the Company, the participant is entitled to receive a lump sum cash payment equal to two times the sum of his or her base salary and average annual incentive award (based on the prior two years). A participant will also be entitled to receive a pro-rated portion of his or her target annual incentive award for the year in which the termination occurs, as well as continuation of medical benefits for a two-year period. Treatment of outstanding equity awards upon a change in control is governed by the terms of the applicable equity award agreement and not the severance plan. Under the equity award agreements, outstanding equity awards become vested and non-forfeitable in connection with a change in control only if (i) the participant’s employment is terminated, or (ii) the acquiring or surviving entity does not assume the equity awards. The plan does not allow for tax gross-ups.
| 2020 Proxy Statement | | 71 |
Potential Payments upon Termination or Change in Control
The tables below reflect the amount of compensation that would have been payable to each of our NEOs who were employed as executive officers of Navient on December 31, 2019, under various scenarios including if such individual’s employment had terminated and/or a change in control had occurred on December 31, 2019, given the individual’s compensation and service levels as of December 31, 2019, and based on Navient’s closing stock price of $13.68 per share on December 31, 2019, the last trading date of the year. The amounts disclosed in the tables below are in addition to:
(i) compensation and benefits available prior to the occurrence of a termination of employment, such as vested stock options, and (ii) compensation and benefits available generally to all employees, such as distributions under Navient’s defined contribution retirement program, disability plans and accrued vacation pay.
The following severance arrangements were effective for our NEOs who were employed as executive officers of Navient on December 31, 2019: (i) the Navient Corporation Executive Severance Plan for Senior Officers, (ii) the Navient Corporation Change in Control Severance Plan for Senior Officers, as amended and restated, and (iii) the Navient Corporation 2014 Omnibus Incentive Plan, as amended and restated.
Change in Control Without Termination
| Name | Equity Vesting(1) ($) | Cash Severance ($) | Medical Insurance / Outplacement ($) | Total ($) |
| Remondi | - | - | - | - |
| Lown | - | - | - | - |
| Kane | - | - | - | - |
| Heleen | - | - | - | - |
| Hauber | - | - | - | - |
| (1) | Under the equity award agreements, outstanding equity awards become vested and non-forfeitable in connection with a change in control only if (i) the participant’s employment is terminated, or (ii) the acquiring or surviving entity does not assume the equity awards. For purposes of this table, we have assumed that neither of these conditions is satisfied. |
Change in Control and (i) Termination without Cause, or (ii) Termination for Good Reason
| Name | Equity Vesting(2) ($) | Cash Severance ($) | Medical Insurance / Outplacement(3) ($) | Total ($) | ||||
| Remondi | 8,607,605 | 7,181,000 | 26,374 | 15,814,979 | ||||
| Lown | 2,019,081 | 2,872,400 | 26,374 | 4,917,855 | ||||
| Kane | 2,457,556 | 3,121,100 | 14,797 | 5,593,453 | ||||
| Heleen | 1,503,920 | 2,764,685 | 26,374 | 4,294,979 | ||||
| Hauber | 904,810 | 2,339,550 | 26,505 | 3,270,865 | ||||
| (2) | For stock and stock unit awards, the amounts shown reflect the closing market price of Navient Common Stock on December 31, 2019 ($13.68). For stock options where the December 31, 2019 closing market price of Navient Common Stock was higher than the option exercise price, the amounts reflect the intrinsic value of the options as if they had been exercised on December 31, 2019. PSUs granted in 2017 vested at 109% of the target number of units based on Company Performance over a three-year performance period (2017-19) and were settled on March 2, 2020. See “2017-19 Performance Stock Units” in the Compensation Discussion and Analysis above for additional details. These 2017 PSUs are valued based on the number of PSUs actually earned for the three-year performance period ending on December 31, 2019. |
| (3) | Includes Navient’s estimated portion of the cost of health care benefits for 24 months. |
| 2020 Proxy Statement | | 72 |
Termination without Cause or Termination for Good Reason
| Name | Equity Vesting(5) ($) | Cash Severance ($) | Medical Insurance / Outplacement(6) ($) | Total ($) | |
| Remondi | - | 7,181,000 | 41,374 | 7,222,374 | |
| Lown | - | 1,736,200 | 34,780 | 1,770,980 | |
| Kane | - | 1,905,550 | 26,097 | 1,931,647 | |
| Heleen | - | 1,671,092 | 34,780 | 1,705,872 | |
| Hauber | - | 1,432,275 | 34,879 | 1,467,154 |
| (5) | By their terms, in the event of a termination without cause or a termination for good reason, outstanding Navient equity awards generally continue to vest pursuant to the vesting schedule set forth in each applicable award agreement as if the NEO remains employed by Navient through the pre- established vesting date. |
| (6) | As President and Chief Executive Officer of Navient, Mr. Remondi is entitled to Navient’s estimated portion of the cost of health care benefits for a period of 24 months plus $15,000 of outplacement services. Amounts for Messrs. Lown, Kane, Heleen, and Hauber include Navient’s estimated portion of the cost of health care benefits for 18 months, plus $15,000 of outplacement services. |
Termination for Cause
| Name | Equity Vesting(7) ($) | Cash Severance ($) | Medical Insurance / Outplacement ($) | Total ($) |
| Remondi | - | - | - | - |
| Lown | - | - | - | - |
| Kane | - | - | - | - |
| Heleen | - | - | - | - |
| Hauber | - | - | - | - |
| (7) | Vested and unvested equity awards are forfeited upon Termination for Cause (as defined in the Navient Corporation 2014 Omnibus Incentive Plan, as amended and restated). |
Termination upon Retirement
| Name | Equity Vesting(8) ($) | Cash Severance ($) | Medical Insurance / Outplacement ($) | Total ($) |
| Remondi | - | - | - | - |
| Lown | - | - | - | - |
| Kane | - | - | - | - |
| Heleen | - | - | - | - |
| Hauber | - | - | - | - |
| (8) | Mr. Remondi is eligible for retirement vesting of his outstanding equity awards pursuant to their terms and the Company’s retirement policy. Similarly, Mr. Heleen is eligible for retirement vesting of a portion of his outstanding equity awards. Outstanding equity awards generally continue to vest pursuant to the vesting schedule set forth in each applicable award agreement as if the NEO remains employed by Navient through the pre- established vesting date, provided that the NEO satisfies certain age and/or service conditions set forth in the Company’s retirement policy. For equity awards originally granted by Former SLM prior to 2013, the award recipient must be age 60 or older upon retirement, or the award recipient must have attained a combination of age and years of service totaling at least 70 years, to be eligible for retirement vesting. For equity awards originally granted by Former SLM in 2013 or 2014, and for all Navient equity awards, the award recipient must be age 65 or older upon retirement, or the award recipient must have attained a combination of age and years of service totaling at least 75 years, to be eligible for retirement vesting. Service with both Former SLM and Navient is counted for these purposes. |
| 2020 Proxy Statement | | 73 |
Termination by Death or Disability
| Name | Equity Vesting(9) ($) | Cash Severance ($) | Medical Insurance / Outplacement ($) | Total ($) | ||
| Remondi | 8,607,605 | - | - | 8,607,605 | ||
| Lown | 2,019,081 | - | - | 2,019,081 | ||
| Kane | 2,457,556 | - | - | 2,457,556 | ||
| Heleen | 1,503,920 | - | - | 1,503,920 | ||
| Hauber | 904,810 | - | - | 904,810 | ||
| (9) | The vesting of all outstanding equity awards will accelerate upon termination of employment due to death or disability. For stock and stock unit awards, the amounts shown reflect the closing market price of Navient Common Stock on December 31, 2019 ($13.68). For stock options where the December 31, 2019, closing market price of Navient Common Stock was higher than the option exercise price, the amounts reflect the intrinsic value of the options as if they had been exercised on December 31, 2019. PSUs granted in 2019 vested at 109% of the target number of units based on Company Performance over a three-year performance period (2017-19) and were settled on March 2, 2020. See “2017-19 Performance Stock Units” in the Compensation Discussion and Analysis above for additional details. These 2017 PSUs are valued based on the number of PSUs actually earned for the three-year performance period ending on December 31, 2019. |
Actual Payments Upon Termination
Each of our NEOs remained employed by Navient as an executive officer on December 31, 2019.
CEO Pay Ratio
Pursuant to the Dodd-Frank Wall Street Reform and Consumer Protection Act (the “Dodd-Frank Act”), the SEC adopted a rule requiring Navient to disclose annually: (i) the annual total compensation of the median employee identified by Navient (as described below), (ii) the annual total compensation of Navient’s principal or chief executive officer (“CEO”), and (iii) the estimated ratio of these two amounts.
To identify our median employee, we reviewed the annual compensation of all full-time, part-time, seasonal and temporary employees of Navient and its affiliated companies as of December 31, 2019. As permitted under SEC rules, we treated an employee’s 2019 “annual compensation” for this purpose as equal to the sum of his or her gross income, as reported on payroll records, plus all employer contributions to Navient’s qualified retirement plan made on the employee’s behalf. In identifying the median employee, we excluded the CEO. As of December 31, 2019, Navient and its affiliated companies had approximately 5,800 employees, all of whom reside in the United States or a U.S. territory.
Navient’s CEO is Mr. Remondi. His annual total compensation for 2019 was $7,793,321, as reflected in the Summary Compensation Table. The 2019 annual total compensation of the median employee identified by Navient, calculated in accordance with SEC rules regarding the Summary Compensation Table, was $46,126. Accordingly, Navient’s estimated 2019 pay ratio was 1 to 168.
SEC rules for identifying the median employee and calculating the pay ratio based on that employee’s annual total compensation allow companies to adopt a variety of methodologies, to apply certain exclusions, and to make reasonable estimates and assumptions that reflect their employee populations and compensation practices. As a result, the pay ratio reported by other companies may not be comparable to the Navient pay ratio reported above, as other companies have different employee populations and compensation practices and may utilize different methodologies, exclusions, estimates and assumptions in calculating their own pay ratios. In addition, the median employee’s annual total compensation is unique to that individual and therefore is not an indicator of the annual total compensation of any other individual or group of employees.
| 2020 Proxy Statement | | 74 |
Other Matters
Certain Relationships and Related Transactions
Navient maintains a written policy regarding review and approval of transactions with related parties. Transactions covered by the policy include any transaction involving Navient and an amount in excess of $120,000 in any year in which any director, nominee, executive officer, greater-than-five percent beneficial owner of the Company, or any of their respective immediate family members, has or had a direct or indirect material interest, other than as a director or less-than-ten percent owner of an entity involved in the transaction (a “Related Party Transaction”). Certain loans made in the ordinary course of Navient’s business to executive officers, directors and their family members are considered Related Party Transactions and may be required to be disclosed in the proxy statement but are pre-approved under the policy if they meet specified requirements. As of the date of this proxy statement, no such loans are outstanding.
From the beginning of 2019 until the present, there have been no (and there are no currently proposed) transactions involving an amount in excess of $120,000 in which Navient was (or is to be) a participant and any executive officer, director, five percent beneficial owner of our Common Stock or member of the immediate family of any of the foregoing persons had (or will have) a direct or indirect material interest, except the compensation arrangements described in this proxy statement for our named executive officers and directors and the following transaction:
On January 27, 2020, the Board of Directors, upon the recommendation of the Audit Committee, approved the repurchase of 20,346,464 shares of our common stock from certain subsidiaries and affiliates of Canyon Capital Advisors LLC and certain of its subsidiaries for an aggregate purchase price of $300,517,273.28 and per-share purchase price of $14.77.
Other Matters for the 2020 Annual Meeting
As of the date of this proxy statement, there are no matters that the Board of Directors intends to present for a vote at the Annual Meeting other than the business items discussed in this proxy statement. In addition, Navient has not been notified of any other business that is proposed to be presented at the Annual Meeting. If other matters now unknown to the Board of Directors come before the Annual Meeting, the proxy given by a shareholder electronically, telephonically or on a proxy card gives discretionary authority to the persons named by Navient to serve as proxies to vote such shareholder’s shares on any such matters in accordance with their best judgment.
Shareholder Proposals for the 2021 Annual Meeting
A shareholder who intends to introduce a proposal for consideration at Navient’s 2021 Annual Meeting may seek to have that proposal and a statement in support of the proposal included in the Company’s 2021 proxy statement if the proposal relates to a subject that is permitted under SEC Rule 14a-8. To be considered for inclusion, the proposal and supporting statement must be received by the Company no later than December 10, 2020, and must satisfy the other requirements of Rule 14a-8. The submission of a shareholder proposal does not guarantee that it will be included in Navient’s proxy statement.
Navient’s Bylaws provide that a shareholder may otherwise propose business for consideration or nominate persons for election to the Board of Directors, in compliance with federal proxy rules, applicable state law and other legal requirements and without seeking to have the proposal included in the Company’s proxy statement pursuant to Rule 14a-8. Navient’s Bylaws provide that any such proposals or nominations for the Company’s 2021 Annual Meeting must be received by it on or after January 20, 2021, and on or before February 19, 2021. Any such notice must satisfy the other requirements in Navient’s Bylaws applicable to such proposals and nominations. If a shareholder fails to meet these deadlines or fails to comply with the requirements of SEC Rule 14a-4(c), Navient may exercise discretionary voting authority under proxies it solicits to vote on any such proposal.
| 2020 Proxy Statement | | 75 |
Proxy Access Procedures
The Company's Second Amended and Restated Bylaws generally permit a shareholder, or group of up to 20 shareholders, owning at least 3% of our outstanding shares for at least three years to nominate, and include in the Company's proxy materials, director nominees constituting up to the greater of two or 20% of the Company's Board, provided that the shareholder(s) and nominee(s) satisfy the requirements in our bylaws. Written notice of proxy access director nominees must be received no later than the close of business on the 120th day, nor earlier than the close of business on the 150th day, prior to the first anniversary of the date our definitive proxy statement was first sent to stockholders in connection with the preceding year's annual meeting. With respect to the 2021 annual meeting, this notice must be received between November 10, 2020 and December 10, 2020, assuming the date of the 2021 annual meeting is not changed by more than 30 days before or after the first anniversary of the 2020 annual meeting. Any notices should be addressed to Chief Legal Officer and Secretary, Navient Corporation, 123 Justison Street, Wilmington, Delaware 19801.
Solicitation Costs
All expenses in connection with the solicitation of proxies for the Annual Meeting will be paid by Navient. We have engaged MacKenzie to solicit proxies for an estimated fee of $17,500 plus reimbursement for out-of-pocket costs. In addition, officers, directors, certain employees or other agents of Navient may solicit proxies in person, by telephone, telefax, personal calls, or other electronic means. Navient will request banks, brokers, custodians and other nominees in whose names shares are registered to furnish to the beneficial owners of Navient’s Common Stock Notices of Availability of the materials related to the Annual Meeting, and including, if so requested by the beneficial owners, paper copies of our 2019 Annual Report on Form 10-K, this proxy statement and the proxy card and, upon request, the Company will reimburse such registered holders for their out-of-pocket and reasonable expenses in connection therewith.
Householding
To reduce the expense and reduce environmental effects of printing and delivering duplicate proxy materials to shareholders who may have more than one account holding Navient stock but share the same address, Navient has adopted a procedure approved by the SEC called “householding.” Under this procedure, registered shareholders who have the same address and last name, and who do not participate in electronic delivery of proxy materials, will receive one copy of the Notice of Internet Availability and, as applicable, any additional proxy materials that are delivered until such time as one or more of these shareholders notifies us that they want to receive separate copies. Shareholders who participate in householding will continue to have access to and utilize separate proxy voting instructions.
If you are a registered shareholder and would like to have separate copies of the Notice of Internet Availability or proxy materials mailed to you in the future, or you would like to have a single copy of the Notice of Internet Availability or proxy materials mailed to you in the future, you must submit a request in writing to Broadridge Financial Solutions, Inc., Householding Department, 51 Mercedes Way, Edgewood, New York 11717 or call at 1-800-542-1061. If you are a beneficial shareholder, please contact your bank or broker to opt in or out of householding.
However, please note that if you are a registered shareholder and wish to receive a separate proxy card or vote instruction form or other proxy materials for purposes of this year’s Annual Meeting, you should follow the instructions included in the Notice of Internet Availability that was sent to you and we will deliver promptly upon written or oral request, separate copies of the proxy materials for this year’s Annual Meeting.
| 2020 Proxy Statement | | 76 |